

Page 1

User Manual
TDS 520 & 540
Digitizing Oscilloscopes
070-8317-01
This document supports Version 2 firmware.
Please check for change information at the rear
of this manual.
First Printing: March 1992
Last Revised: November 1992
Page 2

Copyright E Tektronix, Inc. 1991, 1992. All rights reserved.
T ektronix products are covered by U.S. and foreign patents, issued and pending. Information in this publication supercedes
that in all previously published material. Specifications and price change privileges reserved.
Printed in the U.S.A.
T ektronix, Inc., P.O. Box 1000, Wilsonville, OR 97070–1000
TEKTRONIX and TEK are registered trademarks of T ektronix, Inc.
Microsoft is a registered trademark of Microsoft Corporation
IBM is a registered trademark of International Business Machines
GPIB-PCII and GPIB-PCIIA are registered trademarks of National Instruments Corporation
Epson is a registered trademark of Epson America, Inc.
Interleaf is a trademark of Interleaf, Inc.
PostScript is a registered trademark of Adobe Systems Incorporated
Page 3

WARRANTY
T ektronix warrants that the products that it manufactures and sells will be free from defects in materials and
workmanship for a period of three (3) years from the date of shipment. If a product proves defective during this
warranty period, T ektronix, at its option, either will repair the defective product without charge for parts and labor,
or will provide a replacement in exchange for the defective product.
In order to obtain service under this warranty, Customer must notify Tektronix of the defect before the expiration
of the warranty period and make suitable arrangements for the performance of service. Customer shall be
responsible for packaging and shipping the defective product to the service center designated by T ektronix, with
shipping charges prepaid. Tektronix shall pay for the return of the product to Customer if the shipment is to a
location within the country in which the T ektronix service center is located. Customer shall be responsible for
paying all shipping charges, duties, taxes, and any other charges for products returned to any other locations.
This warranty shall not apply to any defect, failure or damage caused by improper use or improper or inadequate
maintenance and care. T ektronix shall not be obligated to furnish service under this warranty a) to repair damage
resulting from attempts by personnel other than T ektronix representatives to install, repair or service the product;
b) to repair damage resulting from improper use or connection to incompatible equipment; c) to repair any
damage or malfunction caused by the use of non-T ektronix supplies; or d) to service a product that has been
modified or integrated with other products when the effect of such modification or integration increases the time
or difficulty of servicing the product.
THIS WARRANTY IS GIVEN BY TEKTRONIX IN LIEU OF ANY OTHER WARRANTIES, EXPRESS
OR IMPLIED. TEKTRONIX AND ITS VENDORS DISCLAIM ANY IMPLIED WARRANTIES OF
MERCHANTABILITY OR FITNESS FOR A PARTICULAR PURPOSE. TEKTRONIX’
RESPONSIBILITY TO REPAIR OR REPLACE DEFECTIVE PRODUCTS IS THE SOLE AND
EXCLUSIVE REMEDY PROVIDED TO THE CUST OMER FOR BREACH OF THIS WARRANTY.
TEKTRONIX AND ITS VENDORS WILL NOT BE LIABLE FOR ANY INDIRECT , SPECIAL,
INCIDENTAL, OR CONSEQUENTIAL DAMAGES IRRESPECTIVE OF WHETHER TEKTRONIX OR
THE VENDOR HAS ADVANCE NOTICE OF THE POSSIBILITY OF SUCH DAMAGES.
Page 4

This apparatus has been designed and tested in accordance with IEC Publication 348, Safety Requirements for
Electronic Measuring Apparatus, and has been supplied in a safe condition. This manual contains some
information and warnings which have to be followed by the user to ensure safe operation and to retain the
apparatus in safe condition.
The apparatus has been designed for indoor use. It may occasionally be subjected to temperatures between +5_ C
and –10_ C without degradation of its safety.
Page 5
Welcome
This is the User Manual for the TDS 520 and TDS 540 Digitizing Oscilloscopes.
Related Manuals
If you are a new user, try the
operation of your digitizing oscilloscope.
Concepts
The
scope. These articles help you understand why your instrument works the
way it does.
Use the
for a complete list of tasks covered in that section.
Appendices
The
tion, and other useful information.
The following documents are related to the use or service of the digitizing
oscilloscope.
H
The
070-8318-03) describes using a computer to control the digitizing oscilloscope through the GPIB interface.
H
The
gives you a quick overview of how to operate your digitizing oscilloscope.
H
The
070-8582-00) describes use of the Advanced DSP Math option (for TDS
oscilloscopes equipped with that option only).
section covers basic principles of the operation of the oscillo-
In Detail
TDS Family Programmer Manual
TDS 520 & 540 Reference
TDS Family Option 2F Instruction Manual
section to learn how to perform specific tasks. See page 3-1
provide an option and accessories listing, product specifica-
Tutorial
section to become familiar with the
(Tektronix part number
(Tektronix part number 070-8316-01)
(Tektronix part number
TDS 520 & TDS 540 User Manual
H
H
H
TDS Family Option 13 Instruction Manual
The
070-8567-00) describes using the optional Centronicsr and RS-232
interfaces for obtaining hardcopy (for TDS oscilloscopes equipped with
that option only).
TDS 520
The
070-8603-00) tells how to verify the performance of the digitizing oscilloscope.
TDS 520 Service Manual
The
TDS 540 Service Manual
the
maintaining and servicing your digitizing oscilloscope to the module level.
&
TDS 540 Performance Verification
(Tektronix part number 070-8312-01) and
(070-8314-01) provide information for
(Tektronix part number
(Tektronix part number
i
Page 6

Conventions
In the
Tutorial
contain steps of instructions for you to perform. To keep those instructions
clear and consistent, this manual uses the following conventions:
H
Names of front panel controls and menu labels appear in boldface print.
H
Names also appear in the same case (initial capitals, all uppercase, etc.)
in the manual as is used on the oscilloscope front panel and menus. Front
panel names are all upper case letters, for example, VERTICAL MENU,
CH 1, etc.
H
Instruction steps are numbered. The number is omitted if there is only
one step.
H
When steps require that you make a sequence of selections using front
panel controls and menu buttons, an arrow ( ➞
between a front panel button and a menu, or between menus. Also,
whether a name is a main menu or side menu item is clearly indicated:
Press VERTICAL MENU ➞ Coupling (main) ➞ DC (side) ➞ Band-
width (main) ➞ 100 MHz (side).
Using the convention just described results in instructions that are graphically intuitive and simplifies procedures. For example, the instruction just
given replaces these five steps:
1. Press the front panel button VERTICAL MENU.
and
In Detail
sections, you will find various procedures which
) marks each transition
2. Press the main menu button Coupling.
3. Press the side-menu button DC.
4. Press the main menu button Bandwidth
5. Press the side menu button 100 MHz
H
Sometimes you may have to make a selection from a popup menu: Press
TRIGGER MENU ➞ Type (main) ➞ Edge (popup). In this example, you
repeatedly press the main menu button Type until Edge is highlighted in
the pop-up menu.
ii
Welcome
Page 7

T utorial
Contents
Product Description v. . . . . . . . . . . . . . . . . . . . . . . . . . . . . . . . . . . . . . . . .
Safety vi. . . . . . . . . . . . . . . . . . . . . . . . . . . . . . . . . . . . . . . . . . . . . . . . . . . . . .
Start Up viii. . . . . . . . . . . . . . . . . . . . . . . . . . . . . . . . . . . . . . . . . . . . . . . . . . . .
Overview 1-1. . . . . . . . . . . . . . . . . . . . . . . . . . . . . . . . . . . . . . . . . . . . . . . . . . .
Example 1: Displaying a Waveform 1-2. . . . . . . . . . . . . . . . . . . . . . . . . . .
Example 2: Multiple Waveforms 1-8. . . . . . . . . . . . . . . . . . . . . . . . . . . . . .
Example 3: Automated Measurements 1-12. . . . . . . . . . . . . . . . . . . . . . . .
Example 4: Saving Setups 1-18. . . . . . . . . . . . . . . . . . . . . . . . . . . . . . . . . . .
Concepts
In Detail
Overview 2-1. . . . . . . . . . . . . . . . . . . . . . . . . . . . . . . . . . . . . . . . . . . . . . . . . . .
Triggering 2-2. . . . . . . . . . . . . . . . . . . . . . . . . . . . . . . . . . . . . . . . . . . . . . . . . .
Acquisition 2-7. . . . . . . . . . . . . . . . . . . . . . . . . . . . . . . . . . . . . . . . . . . . . . . . .
Scaling and Positioning Waveforms 2-13. . . . . . . . . . . . . . . . . . . . . . . . . .
Measurements 2-17. . . . . . . . . . . . . . . . . . . . . . . . . . . . . . . . . . . . . . . . . . . . . .
Overview 3-1. . . . . . . . . . . . . . . . . . . . . . . . . . . . . . . . . . . . . . . . . . . . . . . . . . .
At a Glance 3-2. . . . . . . . . . . . . . . . . . . . . . . . . . . . . . . . . . . . . . . . . . . . . . . . .
Acquisition Modes 3-11. . . . . . . . . . . . . . . . . . . . . . . . . . . . . . . . . . . . . . . . . .
Autoset 3-18. . . . . . . . . . . . . . . . . . . . . . . . . . . . . . . . . . . . . . . . . . . . . . . . . . . . .
Cursor Measurements 3-20. . . . . . . . . . . . . . . . . . . . . . . . . . . . . . . . . . . . . . .
Delayed Triggering 3-25. . . . . . . . . . . . . . . . . . . . . . . . . . . . . . . . . . . . . . . . . .
Display Modes 3-31. . . . . . . . . . . . . . . . . . . . . . . . . . . . . . . . . . . . . . . . . . . . . .
TDS 520 & TDS 540 User Manual
Edge Triggering 3-36. . . . . . . . . . . . . . . . . . . . . . . . . . . . . . . . . . . . . . . . . . . . .
Hardcopy 3-40. . . . . . . . . . . . . . . . . . . . . . . . . . . . . . . . . . . . . . . . . . . . . . . . . . .
iii
Page 8

Help 3-48. . . . . . . . . . . . . . . . . . . . . . . . . . . . . . . . . . . . . . . . . . . . . . . . . . . . . . . .
Horizontal Control 3-49. . . . . . . . . . . . . . . . . . . . . . . . . . . . . . . . . . . . . . . . . . .
Limit Testing 3-53. . . . . . . . . . . . . . . . . . . . . . . . . . . . . . . . . . . . . . . . . . . . . . . .
Logic Triggering 3-58. . . . . . . . . . . . . . . . . . . . . . . . . . . . . . . . . . . . . . . . . . . . .
Measurement System 3-66. . . . . . . . . . . . . . . . . . . . . . . . . . . . . . . . . . . . . . . .
Probe Accessories 3-77. . . . . . . . . . . . . . . . . . . . . . . . . . . . . . . . . . . . . . . . . .
Probe Cal 3-84. . . . . . . . . . . . . . . . . . . . . . . . . . . . . . . . . . . . . . . . . . . . . . . . . . .
Probe Compensation 3-90. . . . . . . . . . . . . . . . . . . . . . . . . . . . . . . . . . . . . . . .
Probe Selection 3-92. . . . . . . . . . . . . . . . . . . . . . . . . . . . . . . . . . . . . . . . . . . . .
Pulse Triggering 3-99. . . . . . . . . . . . . . . . . . . . . . . . . . . . . . . . . . . . . . . . . . . . .
Remote Communication 3-106. . . . . . . . . . . . . . . . . . . . . . . . . . . . . . . . . . . . .
Saving and Recalling Setups 3-110. . . . . . . . . . . . . . . . . . . . . . . . . . . . . . . . .
Saving and Recalling Waveforms 3-112. . . . . . . . . . . . . . . . . . . . . . . . . . . . .
Selecting Channels 3-115. . . . . . . . . . . . . . . . . . . . . . . . . . . . . . . . . . . . . . . . . .
Signal Path Compensation 3-117. . . . . . . . . . . . . . . . . . . . . . . . . . . . . . . . . . .
Appendices
Glossary & Index
Status 3-119. . . . . . . . . . . . . . . . . . . . . . . . . . . . . . . . . . . . . . . . . . . . . . . . . . . . . .
Triggering 3-120. . . . . . . . . . . . . . . . . . . . . . . . . . . . . . . . . . . . . . . . . . . . . . . . . .
Vertical Control 3-124. . . . . . . . . . . . . . . . . . . . . . . . . . . . . . . . . . . . . . . . . . . . .
Waveform Math 3-127. . . . . . . . . . . . . . . . . . . . . . . . . . . . . . . . . . . . . . . . . . . . .
Zoom 3-130. . . . . . . . . . . . . . . . . . . . . . . . . . . . . . . . . . . . . . . . . . . . . . . . . . . . . . .
Appendix A: Options and Accessories A-1. . . . . . . . . . . . . . . . . . . . . . . .
Appendix B: Specification A-9. . . . . . . . . . . . . . . . . . . . . . . . . . . . . . . . . . .
Appendix C: Algorithms A-25. . . . . . . . . . . . . . . . . . . . . . . . . . . . . . . . . . . . .
Appendix D: Packaging for Shipment A-39. . . . . . . . . . . . . . . . . . . . . . . . .
Appendix E: Factory Initialization Settings A-41. . . . . . . . . . . . . . . . . . . .
Change Information
i
Contents
Page 9
Product Description
Your Tektronix digitizing oscilloscope is a superb tool for acquiring, displaying,
and measuring waveforms. Its performance addresses the needs of both
benchtop lab and portable applications with the following features:
H
500 MHz maximum analog bandwidth.
H
1 Gigasample/second maximum digitizing rate (TDS 540);
500 Megasamples/second maximum digitizing rate (TDS 520).
H
Four-channel acquisition—the TDS 540 offers four full-featured channels;
the TDS 520 offers two full-featured channels and two channels with
limited vertical scale selections: 100 mV, 1 V, and 10 V.
H
Waveform Math—Invert a single waveform and add, subtract, and multiply
two waveforms. On instruments equipped with option 2F, integrate or
differentiate a single waveform or perform an FFT (fast fourier transform)
on a waveform to display its magnitude or phase versus its frequency.
H
Eight-bit digitizers.
H
Up to 15,000-point record length per channel (50,000-point optional).
H
Full GPIB software programmability. GPIB hardcopy output. On instruments equipped with option 13, hardcopy output using the RS-232 or
Centronics ports.
H
Complete measurement and documentation capability.
H
Intuitive graphic icon operation blended with the familiarity of traditional
horizontal and vertical knobs.
H
On-line help at the touch of a button.
TDS 520 & TDS 540 User Manual
v
Page 10
Safety
Please take a moment to review these safety precautions. They are provided
for your protection and to prevent damage to the digitizing oscilloscope. This
safety information applies to all operators and service personnel.
Symbols and Terms
These two terms appear in manuals:
H
statements identify conditions or practices that could result in
damage to the equipment or other property.
H
statements identify conditions or practices that could result in
personal injury or loss of life.
These two terms appear on equipment:
CAUTION
H
indicates a personal injury hazard not immediately accessible
as one reads the marking or a hazard to property including the equipment
itself.
H
DANGER
indicates a personal injury hazard immediately accessible as
one reads the marking.
This symbol appears in manuals:
vi
Static-Sensitive Devices
These symbols appear on equipment:
DANGER
High Voltage
Protective
ground (earth)
terminal
ATTENTION
Refer to
manual
Safety
Page 11

Safety
Specific Precautions
Observe all of these precautions to ensure your personal safety and to prevent damage to either the digitizing oscilloscope or equipment connected to it.
Power Source
The digitizing oscilloscope is intended to operate from a power source that will
not apply more than 250 V
either supply conductor and ground. A protective ground connection, through
the grounding conductor in the power cord, is essential for safe system
operation.
between the supply conductors or between
rms
Grounding the Digitizing Oscilloscope
The digitizing oscilloscope is grounded through the power cord. To avoid
electric shock, plug the power cord into a properly wired receptacle where
earth ground has been verified by a qualified service person. Do this before
making connections to the input or output terminals of the digitizing oscilloscope.
Without the protective ground connection, all parts of the digitizing oscilloscope are potential shock hazards. This includes knobs and controls that may
appear to be insulators.
Use the Proper Power Cord
Use only the power cord and connector specified for your product. Use only a
power cord that is in good condition.
Use the Proper Fuse
To avoid fire hazard, use only the fuse specified in the parts list for your
product, matched by type, voltage rating, and current rating.
Do Not Remove Covers or Panels
To avoid personal injury, do not operate the digitizing oscilloscope without the
panels or covers.
Electric Overload
Never apply a voltage to a connector on the digitizing oscilloscope that is
outside the voltage range specified for that connector.
Do Not Operate in Explosive Atmospheres
The digitizing oscilloscope provides no explosion protection from static discharges or arcing components. Do not operate the digitizing oscilloscope in
an atmosphere of explosive gases.
TDS 520 & TDS 540 User Manual
vii
Page 12

Start Up
Before you use the digitizing oscilloscope, ensure that it is properly installed
and powered on.
Operation
To properly install and power on the digitizing oscilloscope, do the following:
Installation
1. Be sure you have the appropriate operating environment. Specifications
for temperature, relative humidity, altitude, vibrations, and emissions are
included in
2. Leave space for cooling. Do this by verifying that the air intake and exhaust holes on the sides of the cabinet (where the fan operates) are free
of any airflow obstructions. Leave at least 2 inches (5.1 cm) free on each
side.
Appendix B: Specification
WARNING
To avoid electrical shock, be sure that the power cord is disconnected before checking the fuse.
3. Check the fuse to be sure it is the proper type and rating (Figure i). You
can use either of two fuses. Each fuse requires its own cap (see Table i).
The digitizing oscilloscope is shipped with the UL approved fuse installed.
at the rear of this manual.
viii
4. Check that you have the proper electrical connections. The digitizing
oscilloscope requires 90 to 250 VAC
63 Hz, and may require up to 300 W.
5. Connect the proper power cord from the rear-panel power connector
(Figure i) to the power system.
, continuous range, 47 Hz to
rms
Start Up
Page 13
Power Connector
Principal Power Switch
Fuse
Start Up
Figure i: Rear Panel Controls Used in Start Up
Table i: Fuse and Fuse Cap Part Numbers
Fuse
.25 inch 1.25 inch (UL 198.6, 3AG):
Fuse Part
Number
Fuse Cap Part
Number
159–0013–00 200–2264–00
6 A FAST, 250 V.
5 mm 20 mm (IEC 127): 5 A (T),
159–0210–00 200–2265–00
250 V.
Power On
1. Check that the rear-panel principal power switch is on (Figure i). The
principal power switch controls all AC power to the instrument.
2. If the oscilloscope is not powered on (the screen is blank), push the
front-panel ON/STBY button to toggle it on (Figure ii).
The ON/STBY button controls power to most of the instrument circuits.
Power continues to go to certain parts even when this switch is set to
STBY.
Once the digitizing oscilloscope is installed, you can leave the principal
power switch on and use the ON/STBY button as the power switch.
TDS 520 & TDS 540 User Manual
ix
Page 14
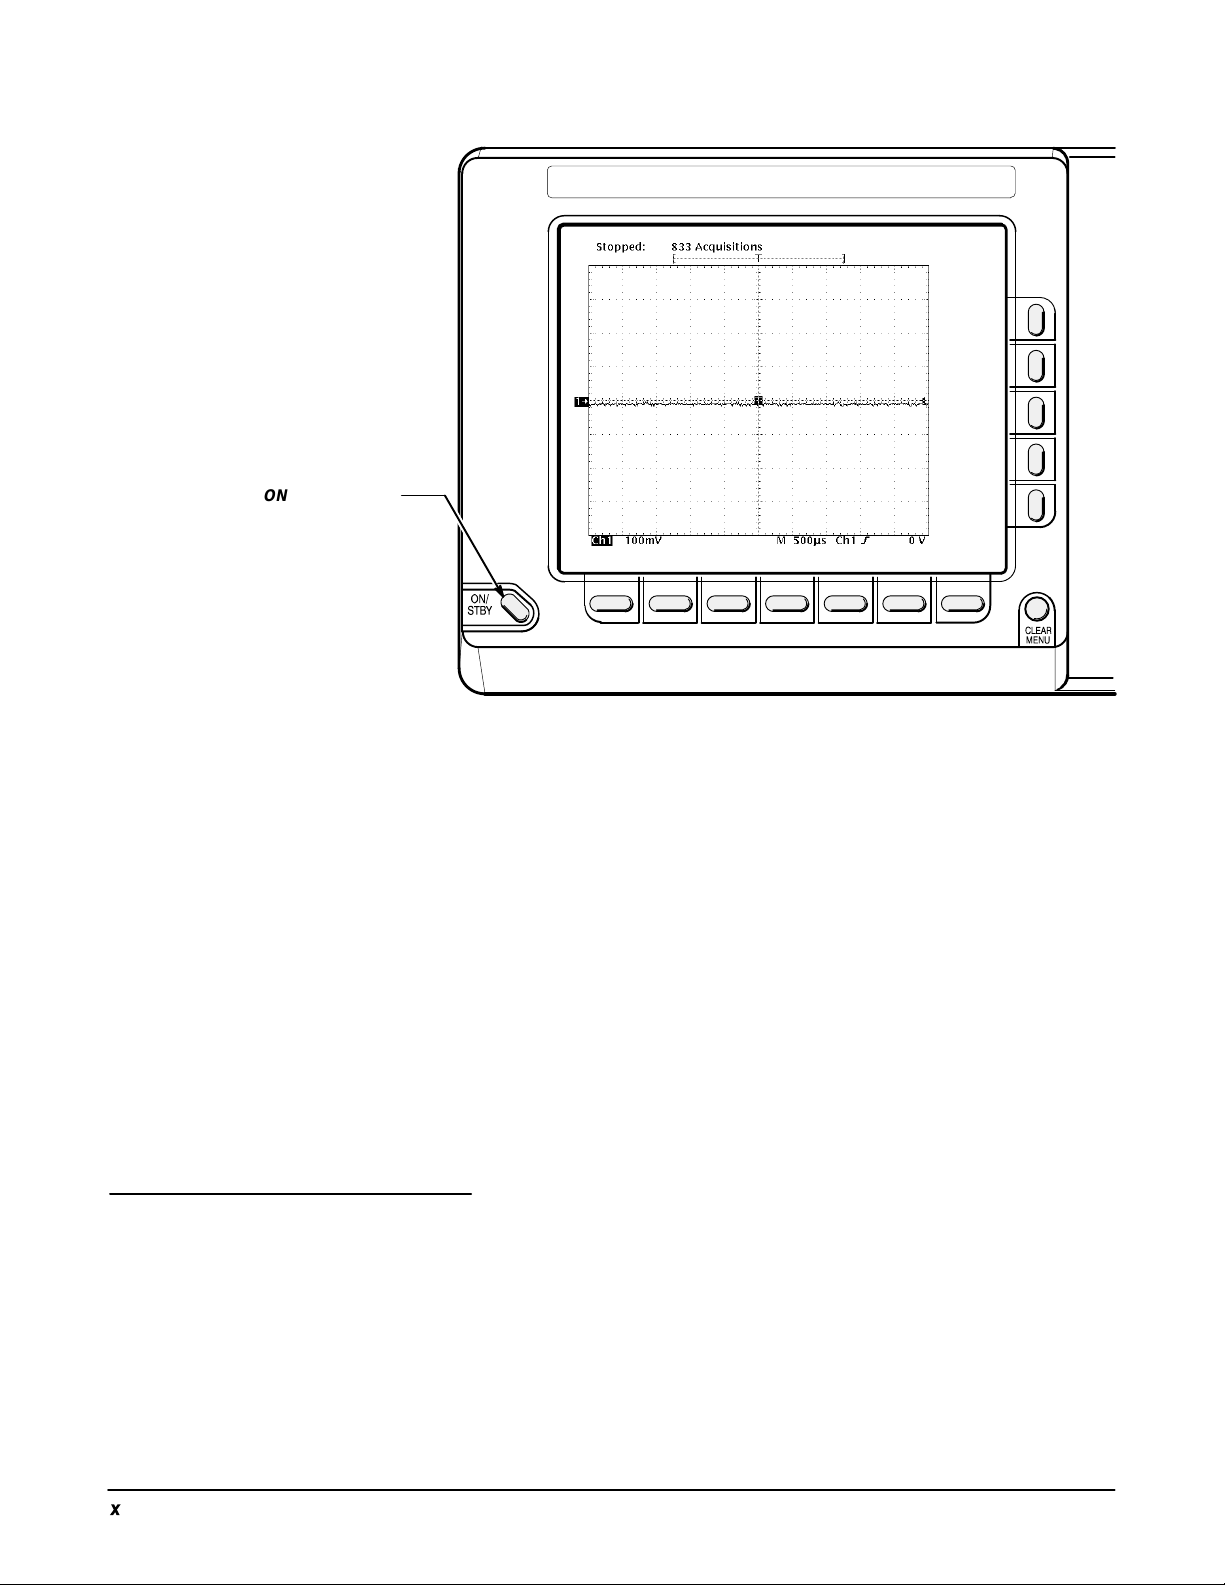
ON/STBY Button
Figure ii: ON/STBY Button
Self Test
The digitizing oscilloscope automatically performs power-on tests each time it
is turned on. It will come up with a display screen that states whether or not it
passed self test. (If the self test passed, the status display screen will be
removed after a few seconds.)
Check the self test results.
If the self test fails, call your local Tektronix Service Center. Depending on the
type of failure, you may still be able to use the oscilloscope before it is serviced.
Before You Begin
x
Power Off
Press the ON/STBY switch to turn off the oscilloscope.
Now that you have set up your oscilloscope for operation, you should know
about two features that help to ensure maximum accuracy for your most
critical measurements,
Signal Path Compensation (SPC)
the current ambient temperature, helping to ensure maximum possible accuracy for your most critical measurements. See
page 3-117 for a description of and operating information on this key feature.
Signal Path Compensation
lets you compensate your oscilloscope for
and
Probe Cal.
Signal Path Compensation
Start Up
on
Page 15

Start Up
Probe Cal
lets you compensate any channel of your oscilloscope for the effect
of the probe on gain accuracy and offset accuracy. Like SPC, Probe Cal helps
ensure maximum possible accuracy for your most critical measurements. See
Probe Cal
on page 3-84 for a description of and operating information on this
feature.
TDS 520 & TDS 540 User Manual
xi
Page 16

xii
Start Up
Page 17

Tutorial
Page 18

Page 19
Overview
This section contains four examples that show you how to operate the basic
functions of the digitizing oscilloscope. Use the
on page 3-2) to help you locate the correct knobs, buttons, and menus.
At a Glance
section (starting
Setting Up for the
Examples
Example 1
H
and adjust waveforms, and use the autoset function.
Example 2
H
Example 3
H
Example 4
H
setups.
Before you perform these examples, read
decide to skip this tutorial, use the
about the digitizing oscilloscope arrangement and specific functions.
All the examples use the same setup. Once you perform this setup, you do
not have to change the signal connections for any of the other examples.
Remove all probes and signal inputs from the input BNC connectors along the
lower right of the front panel. Then, using one of the probes supplied with the
digitizing oscilloscope, connect from the CH 1 connector to the PROBE
COMPENSATION connectors (Figure 1-1).
teaches you how to reset the digitizing oscilloscope, display
explains how to add, control, and delete multiple waveforms.
introduces you to the automated measurement system.
discusses saving and recalling the digitizing oscilloscope
Conventions
Concepts
and
on page ii. If you
In Detail
sections to learn
TDS 620 & 640 User Manual
Figure 1-1: Connecting a Probe for the Examples
1Ć1
Page 20
Example 1: Displaying a Waveform
In this first example you learn about resetting the digitizing oscilloscope,
displaying and adjusting a waveform, and using the autoset function.
Resetting the
Digitizing
Oscilloscope
SETUP Button
All examples in the tutorial begin by resetting the digitizing oscilloscope to a
known factory default state. Reset the oscilloscope when you begin a new
task and need to “start fresh” with known default settings.
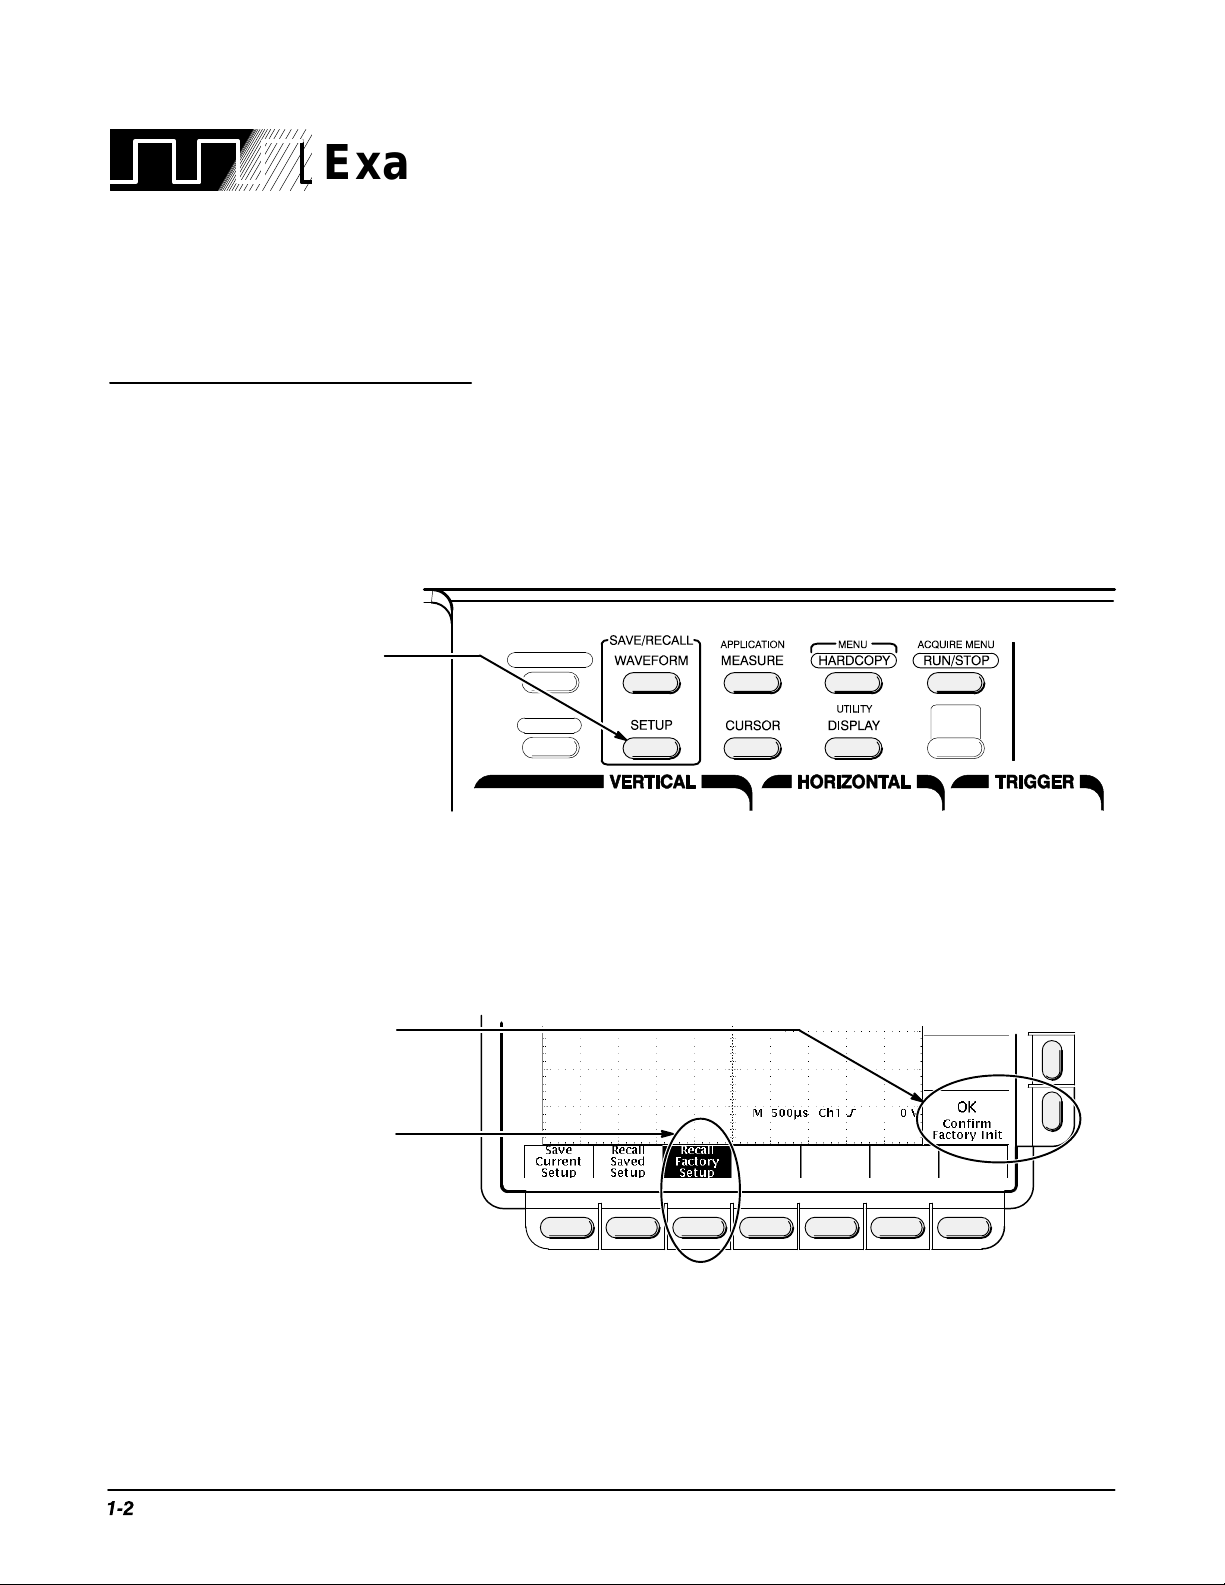
1. Press the save/recall SETUP button to display the Setup menu (Fig-
ure 1-2).
Figure 1-2: SETUP Button Location
The digitizing oscilloscope displays
screen. Figure 1-3 shows the Setup main menu.
main menus
along the bottom of the
1Ć2
OK Confirm Factory Init
Menu Item and Button
Recall Factory Setup
Menu Item and Button
Figure 1-3: The Displayed Setup Menu
Section Name (Nm:Sect)
Page 21

Example 1: Displaying a Waveform
2. Press the button directly below the Recall Factory Setup menu item.
The display shows
side menus
along the right side of the screen. The
buttons to select these side menu items are to the right of the side menu.
Because an accidental instrument reset could destroy a setup that took a
long time to create, the digitizing oscilloscope asks you to verify the
Recall Factory Setup selection (see Figure 1-3).
3. Press the button to the right of the OK Confirm Factory Init side menu
item.
NOTE
This manual uses the following notation to represent the sequence
of selections you made in steps 1, 2 and 3:
UP ➞ Recall Factory Setup (main) ➞ OK Confirm Factory Init
(side).
Note that a clock icon appears on screen. The oscilloscope displays this
icon when performing operations that take longer than several seconds.
4. Press SET LEVEL TO 50% (see Figure 1-4) to be sure the oscilloscope
triggers on the input signal.
Press save/recall SET-
TDS 620 & 640 User Manual
SET LEVEL TO 50% Button
Figure 1-4: Trigger Controls
1Ć3
Page 22
Example 1: Displaying a Waveform
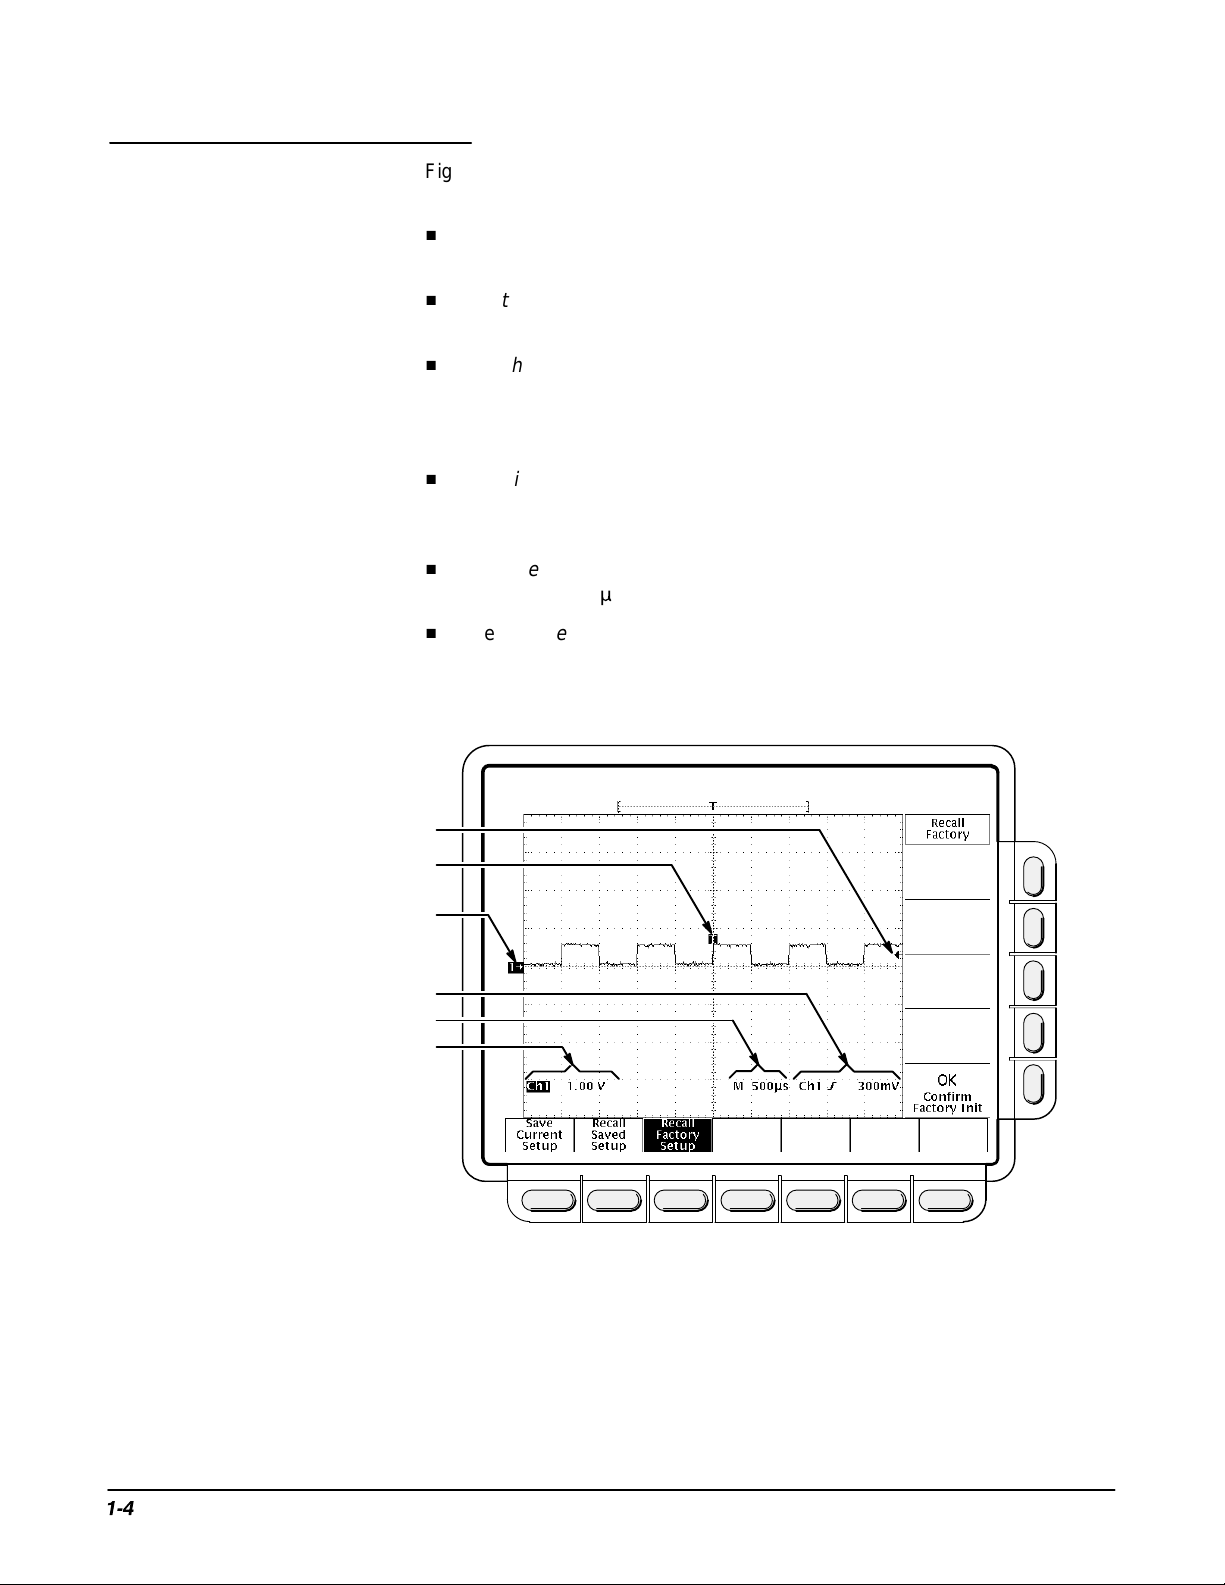
Display Elements
Figure 1-5 shows the display that results from the instrument reset. There are
several important points to observe:
H
trigger level bar
The
shows that the waveform is triggered at a level near
50% of its amplitude (from step 4).
H
trigger position indicator
The
shows that the trigger position of the wave-
form is located at the horizontal center of the graticule.
H
channel reference indicator
The
shows the vertical position of channel 1
with no input signal. This indicator points to the ground level for the
channel when its vertical offset is set to 0 V in the vertical menu; when
not
vertical offset is
H
trigger readout
The
set to 0 V, it points to the vertical offset level.
shows that the digitizing oscilloscope is triggering on
channel 1 (Ch1) on a rising edge, and that the trigger level is about
200-300 mV.
H
time base readout
The
shows that the main time base is set to a horizon-
tal scale of 500ms/div.
H
channel readout
The
indicates that channel 1 (Ch1) is displayed with DC
coupling. (In AC coupling, ~ appears after the volts/div readout.) The
digitizing oscilloscope always displays channel 1 at reset.
Trigger Level
Bar
Trigger Position
Indicator
Channel Reference
Indicator
Trigger Readout
Time Base Readout
Channel Readout
Running: 100kS/s Sample
Figure 1-5: The Display After Factory Initialization
Right now, the channel, time base, and trigger readouts appear in the graticule area because a menu is displayed. You can press the CLEAR MENU
button at any time to remove any menus and to move the readouts below the
graticule.
1Ć4
Section Name (Nm:Sect)
Page 23
Example 1: Displaying a Waveform
Adjusting the
Waveform Display
The display shows the probe compensation signal. It is a 1 kHz square wave
of approximately 0.5 V amplitude. You can adjust the size and placement of
the waveform using the front-panel knobs.
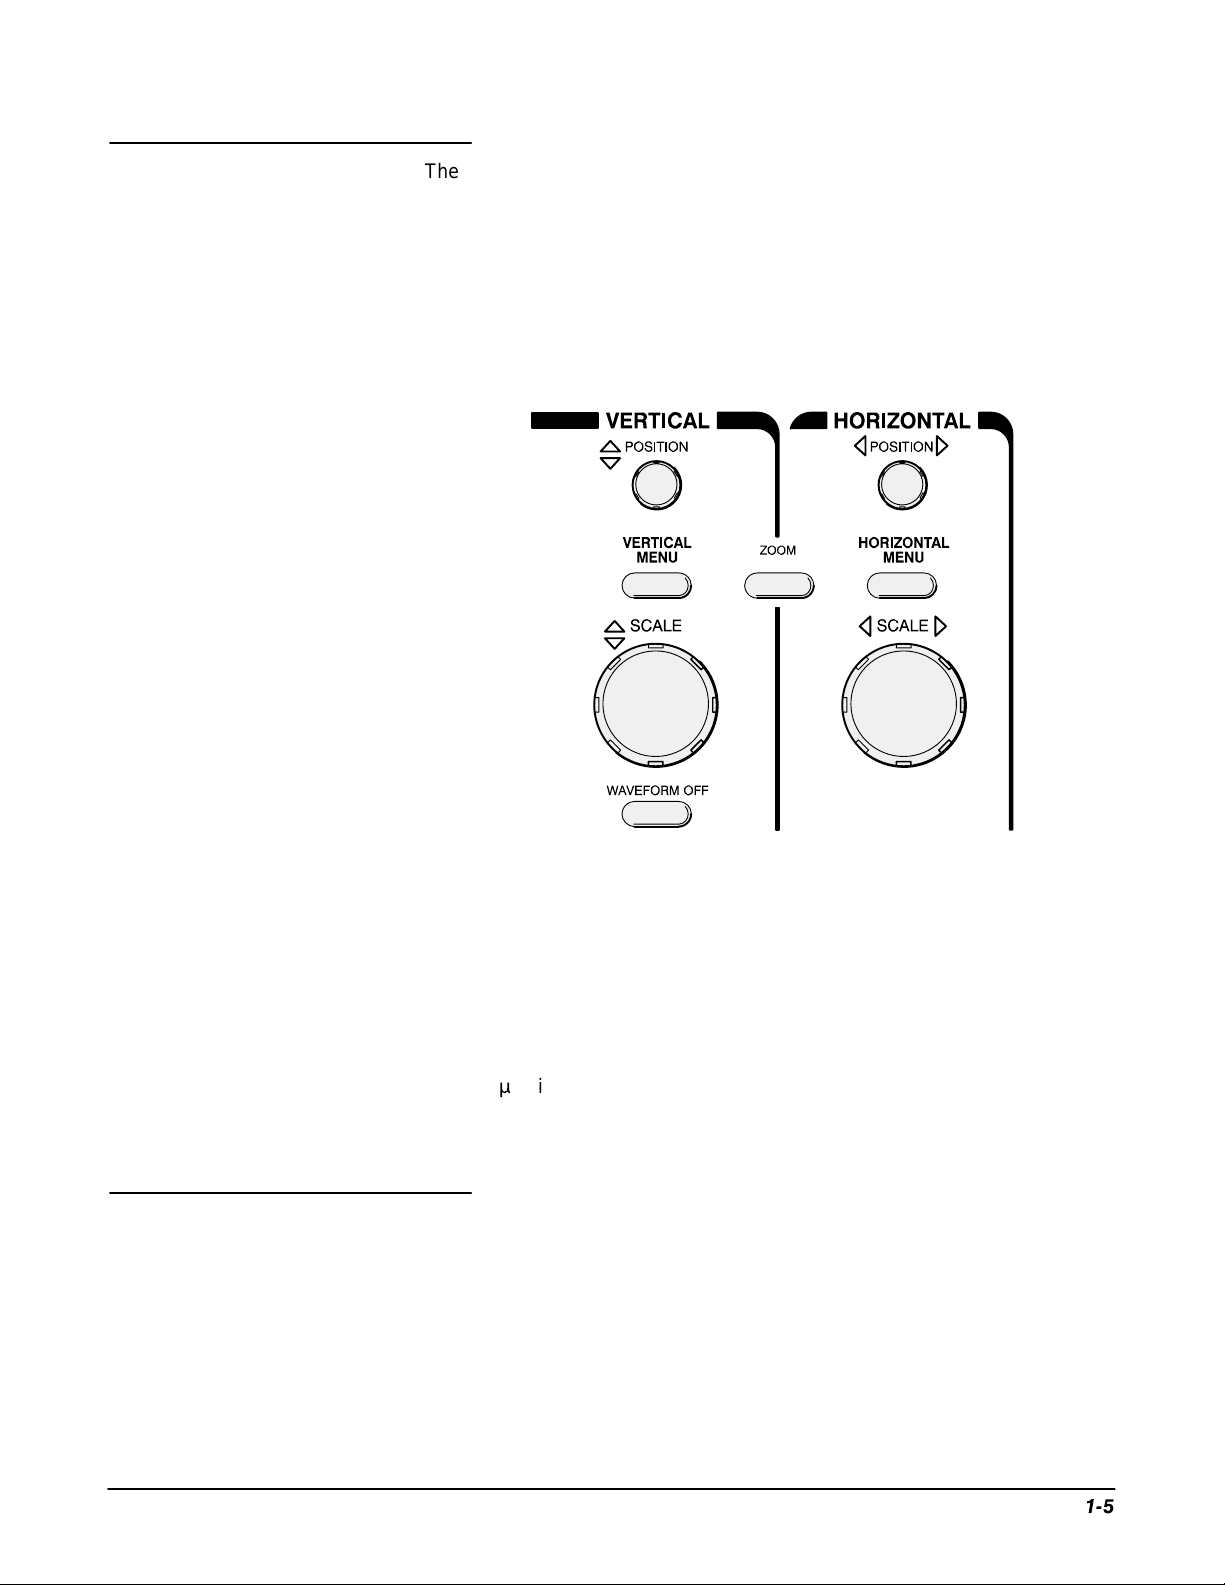
Figure 1-6 shows the main VERTICAL and HORIZONTAL sections of the
front panel. Each has SCALE and POSITION knobs.
1. Turn the vertical SCALE knob clockwise. Observe the change in the
displayed waveform and the channel readout at the bottom of the display.
Using Autoset
Figure 1-6: The VERTICAL and HORIZONT AL Controls
2. Turn the vertical POSITION knob first one direction, then the other.
Observe the change in the displayed waveform. Then return the waveform to the center of the graticule.
3. Turn the horizontal SCALE knob one click clockwise. Observe the time
base readout at the bottom of the display. The time base should be set to
200ms/div now, and you should see two complete waveform cycles on
the display.
When you first connect a signal to a channel and display it, the signal displayed may not be scaled and triggered correctly. Use the autoset function
and you should quickly get a meaningful display.
When you reset the digitizing oscilloscope, you see a clear, stable display of
the probe compensation waveform. That is because the probe compensation
signal happens to display well at the default settings of the digitizing oscilloscope.
TDS 620 & 640 User Manual
1Ć5
Page 24
Example 1: Displaying a Waveform
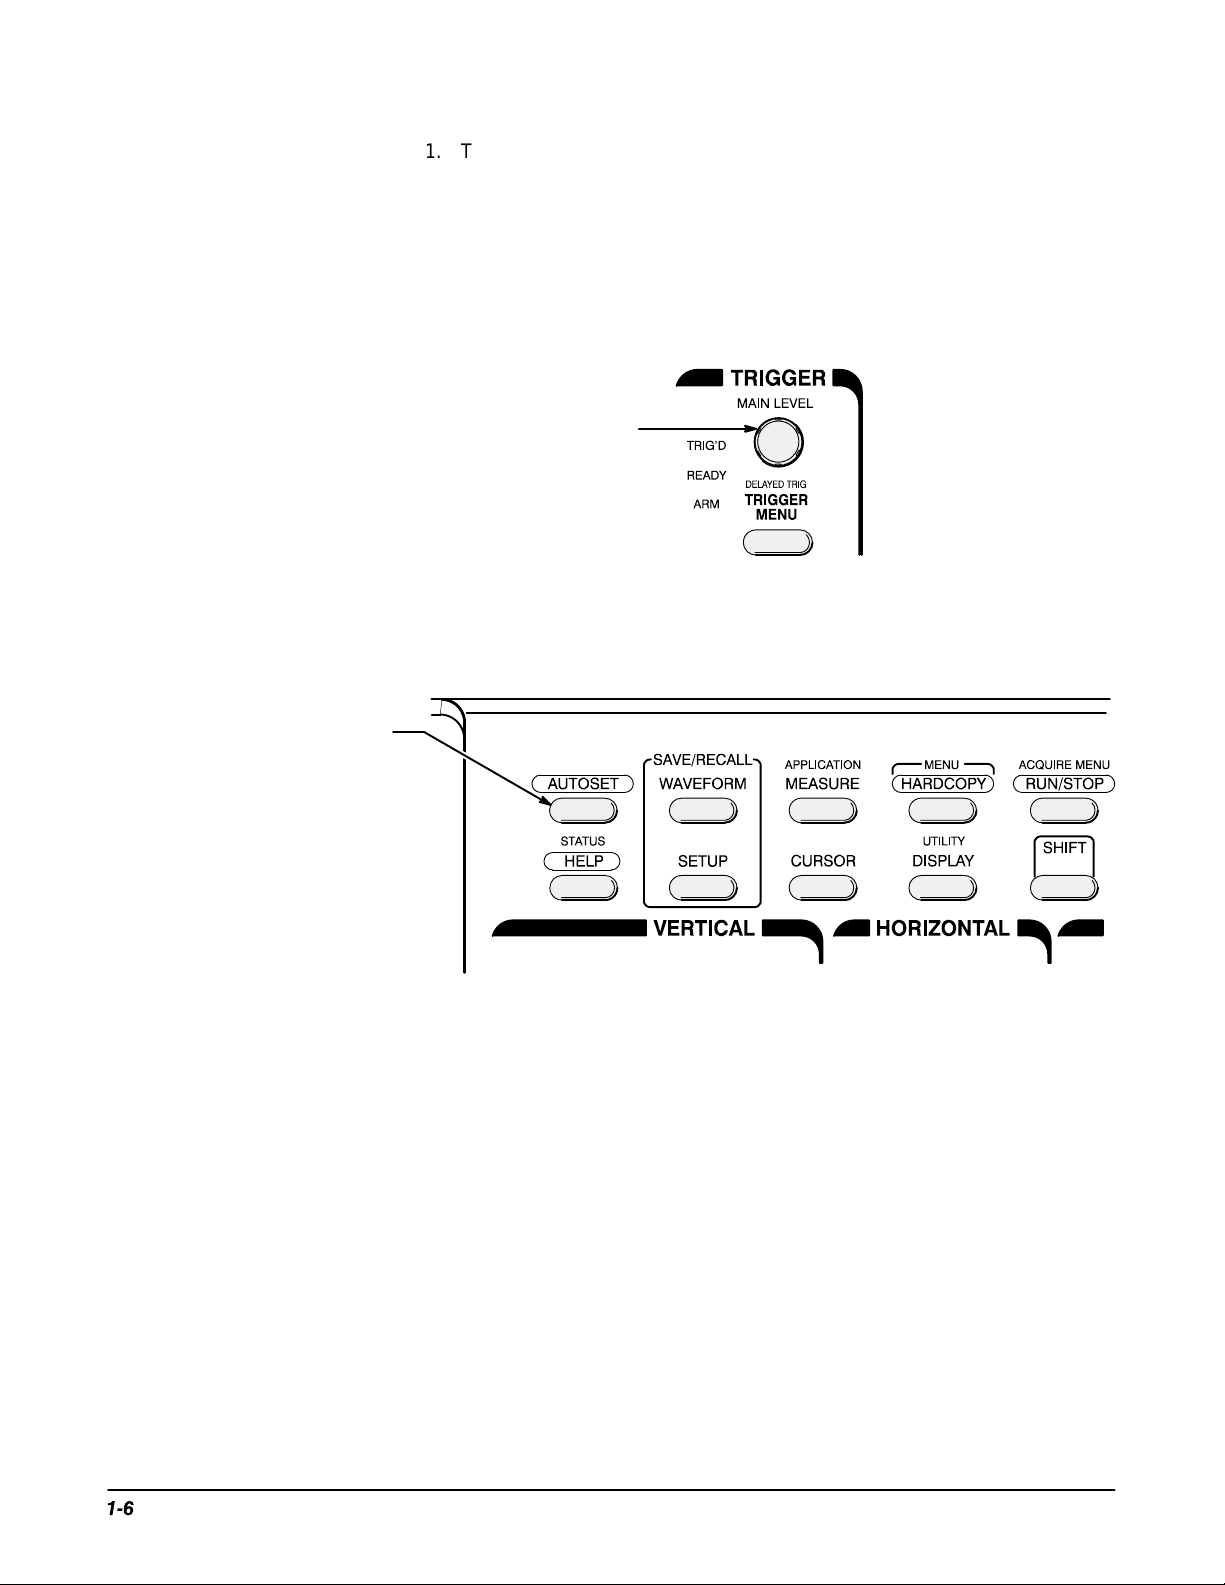
1. To create an unstable display, slowly turn the trigger MAIN LEVEL knob
(see Figure 1-7) first one direction, then the other. Observe what happens
when you move the trigger level above the highest part of the displayed
waveform. Leave the trigger level in that untriggered state.
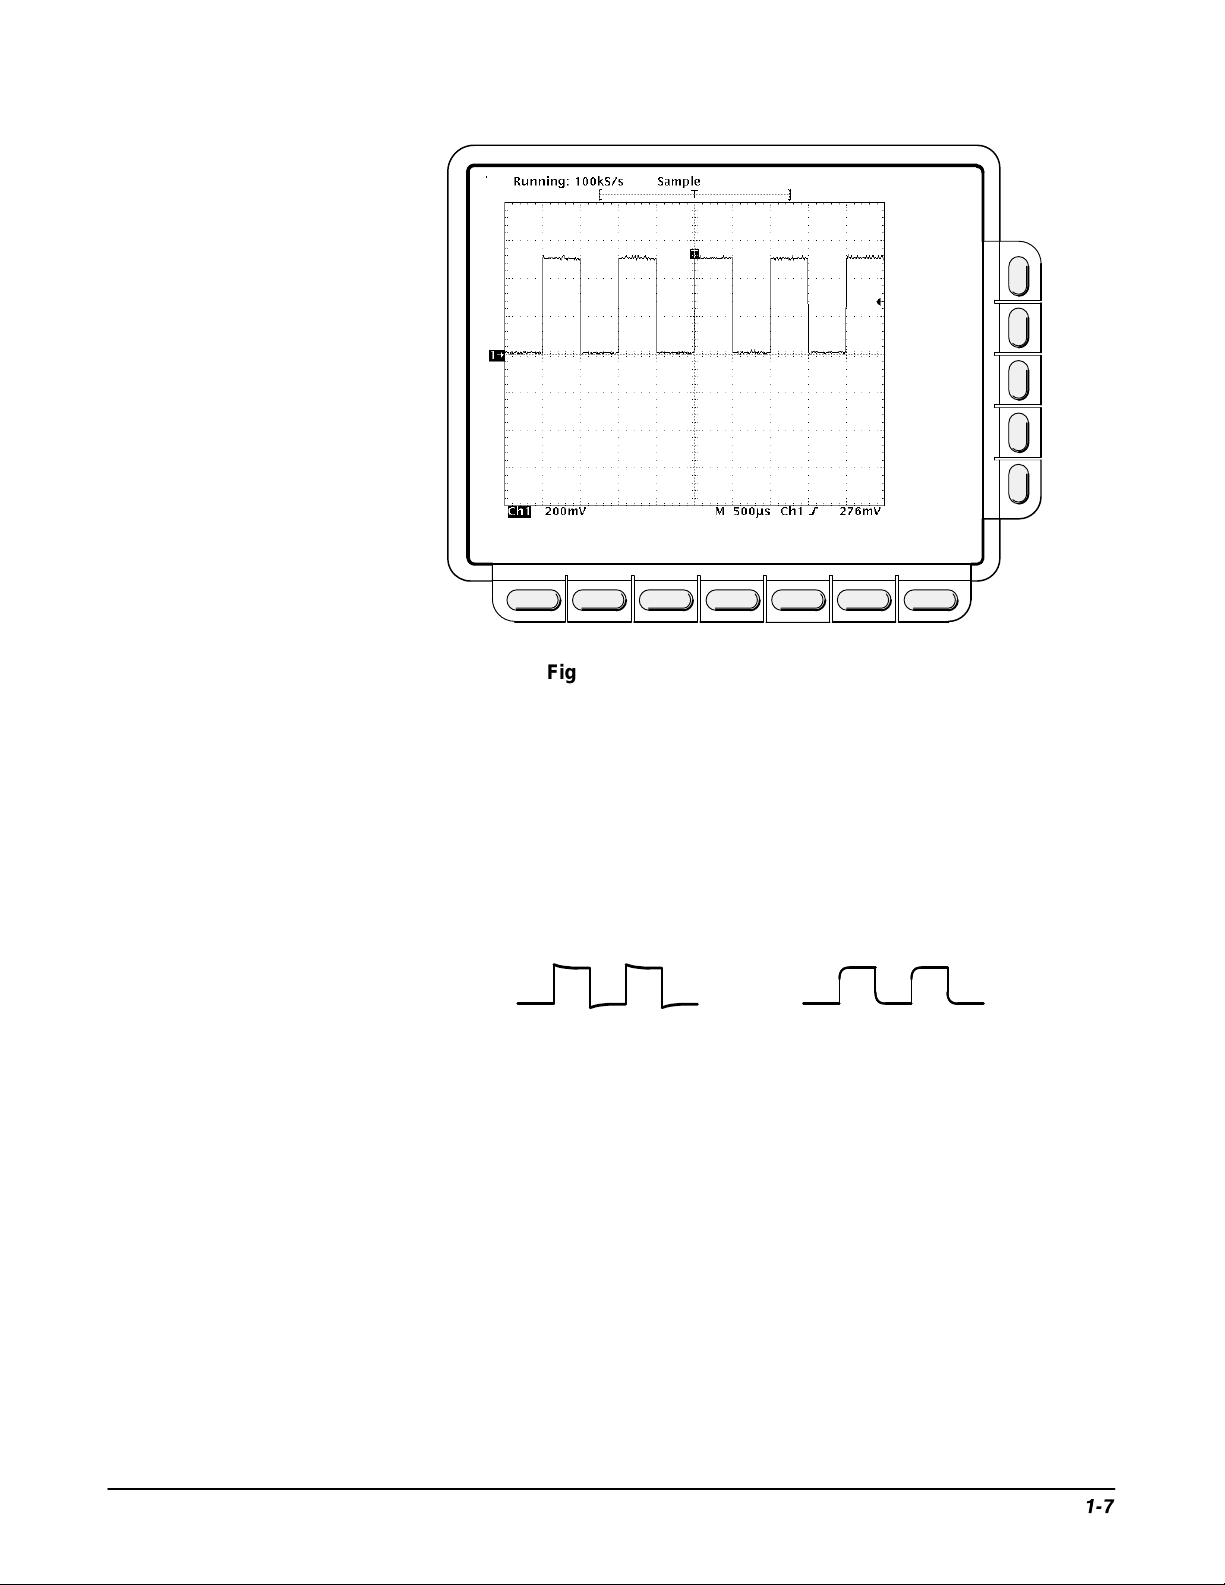
2. Press AUTOSET (see Figure 1-8) and observe the stable waveform
display.
MAIN LEVEL Knob
Figure 1-7: TRIGGER Controls
AUTOSET Button
Figure 1-8: AUTOSET Button Location
Figure 1-9 shows the display after pressing AUTOSET. If necessary, you can
adjust the waveform now by using the knobs discussed earlier in this example.
1Ć6
Section Name (Nm:Sect)
Page 25
Example 1: Displaying a Waveform
Figure 1-9: The Display After Pressing Autoset
NOTE
If the corners on your displayed signal look rounded or pointed (see
Figure 1-10), then you may need to compensate your probe. The
Probe Compensation
Figure 1-10: Display Signals Requiring Probe Compensation
section on page 3-90 explains how to do that.
TDS 620 & 640 User Manual
1Ć7
Page 26
Example 2: Multiple Waveforms
In this example you learn how to display and control more than one waveform
at a time.
Adding a Waveform
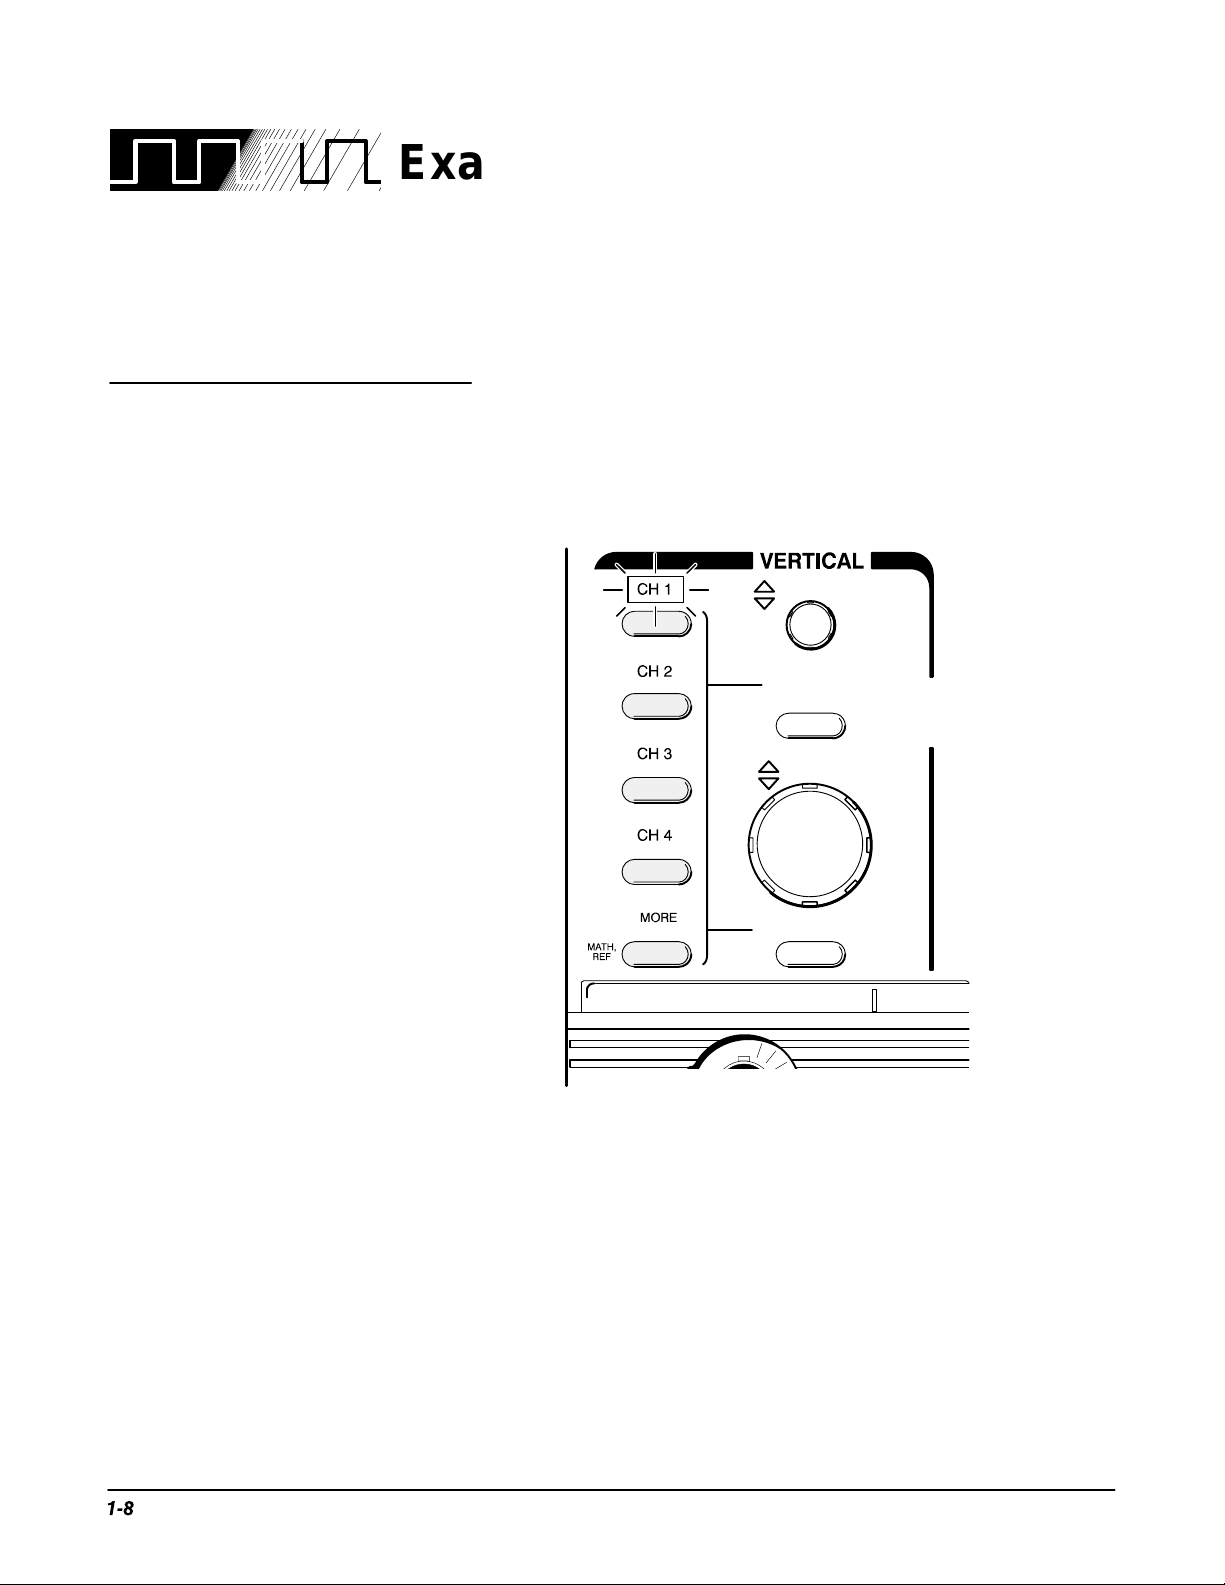
The VERTICAL section of the front panel contains the channel selection
buttons. On the TDS 640 Digitizing Oscilloscope, these are CH 1, CH 2,
CH 3, CH 4, and MORE (Figure 1-11); on the TDS 620, they are CH 1, CH 2,
AUX 1, AUX 2, and MORE.
1Ć8
Figure 1-11: The Channel Buttons and Lights (TDS 540 Shown)
Each of the channel (CH) buttons has a light above its label. Right now, the
CH 1 light is on. That light indicates that the vertical controls are set to adjust
channel 1.
The following steps adds a waveform to the display.
1. If you are not continuing from the previous example, follow the instructions on page 1-1 under the heading “Setting Up for the Examples.”
Section Name (Nm:Sect)
Page 27
Example 2: Multiple Waveforms
2. Press SETUP ➞ Recall Factory Setup (main) ➞ OK Confirm Factory
Init (side).
3. Press AUTOSET.
4. Press CH 2.
The display shows a second waveform, which represents the signal on
channel 2. Since there is nothing connected to the CH 2 input connector,
this waveform is a flat line.
There are several other important things to observe:
H
The channel readout on the display now shows the settings for both
Ch1 and Ch2.
H
There are two channel indicators at the left edge of the graticule.
Right now, they overlap.
H
The light next to the CH 2 button is now on, and the CH 1 light is off.
Because the knobs control only one channel at a time, the vertical
controls are now set to adjust channel 2.
H
The trigger readout still indicates that the trigger is detecting trigger
events on Ch1. The trigger source is not changed simply by adding a
channel. (You can change the trigger source by using the TRIGGER
MENU button to display the trigger menu.)
5. Turn the vertical POSITION knob clockwise to move the channel 2 wave-
form up on the graticule. You will notice that the channel reference indicator for channel 2 moves with the waveform.
6. Press VERTICAL MENU ➞ Coupling (main).
The VERTICAL MENU button displays a menu that gives you control
over many vertical channel parameters (Figure 1-12). Although there can
be more than one channel displayed, the vertical menu and buttons only
adjust the selected channel.
Each menu item in the Vertical menu displays a side menu. Right now,
the Coupling item in the main menu is highlighted, which means that the
side menu shows the coupling choices. At the top of the side menu, the
menu title shows the channel affected by the menu choices. That always
matches the lighted channel button.
7. Press W (side) to toggle the selection to 50 W. That changes the input
coupling of channel 2 from 1 MW to 50 W. The channel readout for channel 2 (near the bottom of the graticule) now shows an W indicator.
TDS 620 & 640 User Manual
1Ć9
Page 28
Example 2: Multiple Waveforms
Ch2 Reference Indicator
Side Menu Title
Running: 100kS/s Sample
Changing Controls
to Another Channel
Figure 1-12: The Vertical Main Menu and Coupling Side Menu
Pressing a channel (CH) button sets the vertical controls to that channel. It
also adds the channel to the display if that waveform is not already displayed.
1. Press CH 1.
Observe that now the side menu title shows Ch1 (Figure 1-13), and that
the light above CH 1 is lighted. The highlighted menu item in the side
menu has changed from the 50W channel 2 setting to the 1MW impedance setting of channel 1.
2. Press CH 2 ➞ W (side) to toggle the selection to 1MW. That returns the
coupling impedance of channel 2 to its initial state.
1Ć10
Section Name (Nm:Sect)
Page 29
Side Menu Title
Example 2: Multiple Waveforms
Running: 100kS/s Sample
Removing a
Waveform
Figure 1-13: The Menus After Changing Channels
Pressing the WAVEFORM OFF button removes the waveform for the current-
ly selected channel. If the waveform you want to remove is not already selected, select that channel using the channel (CH) button.
1. Press W AVEFORM OFF (under the vertical SCALE knob).
Since the CH 2 light was on when you pressed the WAVEFORM OFF
button, the channel 2 waveform was removed.
The channel (CH) lights now indicate channel 1. Channel 1 has become
the selected channel. When you remove the last waveform, all the CH
lights are turned off.
2. Press W AVEFORM OFF again to remove the channel 1 waveform.
TDS 620 & 640 User Manual
1Ć11
Page 30
Example 3: Automated Measurements
In this example you learn how to use the automated measurement system to
get numeric readouts of important waveform characteristics.
Displaying
Automated
Measurements
To use the automated measurement system, you must have a stable display
of your signal. Also, the waveform must have all the segments necessary for
the measurement you want. For example, a rise time measurement requires
at least one rising edge, and a frequency measurement needs at least one
complete cycle.
1. If you are not continuing from the previous example, follow the instructions on page 1-1 under the heading “Setting Up for the Examples.”
2. Press SETUP ➞ Recall Factory Setup (main) ➞ OK Confirm Factory
Init (side).
3. Press AUTOSET.
4. Press MEASURE to display the Measure main menu (see Figure 1-14).
1Ć12
Figure 1-14: Measure Main Menu and Select Measurement Side Menu
Section Name (Nm:Sect)
Page 31

Example 3: Automated Measurements
5. If it is not already selected, press Select Measrmnt (main). The readout
for that menu item indicates which channel the measurement will be
taken from. All automated measurements are made on the selected
channel.
The Select Measurement side menu lists some of the measurements that
can be taken on waveforms. There are many different measurements
available; up to four can be taken and displayed at any one time. Pressing the button next to the –more– menu item brings up the other measurement selections.
6. Press Frequency (side). If the Frequency menu item is not visible, press
–more– (side) repeatedly until the Frequency item appears. Then press
Frequency (side).
Observe that the frequency measurement appears within the right side of
the graticule area. The measurement readout includes the notation Ch1,
meaning that that measurement is taken on the channel 1 waveform. (To
take a measurement on another channel, select that channel, and then
select the measurement.)
7. Press Positive Width (side) ➞ –more– (side) ➞ Rise Time (side) ➞
Positive Duty Cycle (side).
All four measurements are displayed. Right now, they cover a part of the
graticule area, including the displayed waveforms.
8. To move the measurement readouts outside the graticule area, press
CLEAR MENU (see Figure 1-15).
TDS 620 & 640 User Manual
1Ć13
Page 32

Example 3: Automated Measurements
Running: 100kS/s Sample
Press here to
remove menus
from screen.
Removing
Measurement
Readouts
Changing the
Measurement
Reference Levels
Figure 1-15: Four Simultaneous Measurement Readouts
The Measure menu lets you remove measurements you no longer want
displayed. You can remove any one measurement, or you can remove them
all with a single menu item.
Press MEASURE ➞ Remove Measrmnt (main) ➞ Measurement 1, Mea-
surement 2, and Measurement 4 (side) to remove those measurements.
Leave the rise time measurement displayed.
By default, the measurement system will use the 10% and 90% levels of the
waveform for taking the rise time measurement. You can change these values
to other percentages or change them to absolute voltage levels.
To examine the current values, press Reference Levels (main) ➞ High Ref
(side).
The General Purpose Knob
1Ć14
The general purpose knob, the large knob with the indentation, is now set to
adjust the high reference level (Figure 1-16).
Section Name (Nm:Sect)
Page 33

General Purpose Knob
Setting and Readout
General Purpose
Knob Icon
Highlighted Menu Item with
Boxed Readout Value
Example 3: Automated Measurements
Figure 1-16: General Purpose Knob Indicators
There are several important things to observe on the screen:
H
The knob icon appears at the top of the screen. That indicates that the
general purpose knob has just been set to adjust a parameter.
H
The upper right corner of the screen shows the readout High Ref: 90%.
H
The High Ref side menu item is highlighted, and a box appears around
the 90% readout in the High Ref menu item. The box indicates that the
general purpose knob is currently set to adjust that parameter.
Turn the general purpose knob left and right, and then use it to adjust the high
level to 80%. That sets the high measurement reference to 80%.
Hint: To make large changes quickly with the general purpose knob, press the
SHIFT button before turning the knob. When the light above the SHIFT button
is lit and the display says
Coarse Knobs
in the upper-right corner, the gener-
al purpose knob speeds up significantly.
The Numeric Keypad
Any time the general purpose knob is set to adjust a numeric parameter, you
can enter the value as a number using the keypad instead of using the knob.
Always end the entry of a number by pressing the ENTER (
).
TDS 620 & 640 User Manual
The numeric keypad also provides multipliers for engineering exponents, such
as m for milli, M for mega, and m for micro. To enter these multiplier values,
press the SHIFT button, then press the multiplier.
1Ć15
Page 34

Example 3: Automated Measurements
1. Press Low Ref (side).
Displaying a
Snapshot of
Automated
Measurements
2. On the numeric keypad, press the 2, the 0, and the ENTER (
tons, which sets the low measurement reference to 20%. Observe that
the rise-time value has changed.
3. Press Remove Measrmnt (main) ➞ All Measurements (side). That
returns the display to its original state.
You have seen how to display up to four individual automated measurements
on screen. You can also pop up a display of almost all of the automated
measurements available in the Select Measrmnts side menus. This snapshot of measurements is taken on the waveform currently selected using the
channel selection buttons.
As when displaying individual measurements, you must have a stable display
of your signal, and that signal must have all the segments necessary for the
measurement you want.
1. Press Snapshot (main) to pop up a snapshot of all available single
waveform measurements. (See Figure 1-17).
) but-
1Ć16
Figure 1-17: Snapshot of Channel 1
The snapshot display includes the notation Ch 1, meaning that the measurements displayed are taken on the channel 1 waveform. You take a
snapshot of a waveform in another channel by first selecting that channel
using the channel selection buttons.
Section Name (Nm:Sect)
Page 35

Example 3: Automated Measurements
The snapshot measurements do not continuously update. Snapshot
executes a one-time capture of all measurements and does not update
those measurements unless it is performed again.
2. Press Again (side) to do another snapshot and update the snapshot
measurements.
3. Press Remove Measrmnt (main) to remove the snapshot display. (You
can also press CLEAR MENU, but a new snapshot will be executed the
next time you display the Measure menu.)
TDS 620 & 640 User Manual
1Ć17
Page 36

Example 4: Saving Setups
This example shows you how to save all the settings of the digitizing oscilloscope and how to recall the setup later to quickly re-establish the previously
saved state. The oscilloscope provides several storage locations where you
can save the setups.
Besides being able to save several complete setups, the digitizing oscilloscope remembers all the parameter settings when you power it off. That
feature lets you power on and continue where you left off without having to
reconstruct the state of the digitizing oscilloscope.
Saving a Setup
First, you need to create an instrument setup you want to save. The next
several steps establish a two-waveform display with a measurement on one
waveform. The setup created is complex enough that you might prefer not to
go through all these steps each time you want that display.
1. If you are not continuing from the previous example, follow the instructions on page 1-1 under the heading “Setting Up for the Examples.”
2. Press SETUP ➞ Recall Factory Setup (main) ➞ OK Confirm Factory
Init (side).
3. Press ➞ AUTOSET.
4. Press MEASURE ➞ Select Measrmnt (main) ➞ Frequency (side).
(Press the –more– side menu item if the Frequency selection does not
appear in the side menu.)
5. Press CH 2 ➞ CLEAR MENU.
6. Press SETUP ➞ Save Current Setup (main) to display the Setup main
menu (see Figure 1-18).
Note that the setup locations shown in the side menu are labeled
user
or
either
labeled
there. If you work in a laboratory environment where several people
share the digitizing oscilloscope, check with the other users before
you overwrite their setup. Setup locations labeled
factory setup stored as a default and can be used to store current
setups without disturbing previously stored setups.
factory.
user
, you will overwrite the user setup previously stored
If you save your current setup in a location
factory
have the
1Ć18
Section Name (Nm:Sect)
Page 37

Example 4: Saving Setups
Recalling a Setup
Figure 1-18: Save/Recall Setup Menu
7. Press one of the To Setup side menu buttons to store the current instru-
ment settings into that setup location. Remember which setup location
you selected for use later.
There are more setup locations than can be listed at one time in the side
menu. The –more– side menu item gives you access to all the setup
locations.
Once you have saved a particular setup, you can change the settings as
you wish, knowing that you can come back to that setup at any time.
8. Press MEASURE ➞ Positive Width (side) to add that measurement to
the display.
To recall the setup, Press SETUP ➞ Recall Saved Setup (main) ➞ Recall
Setup (side) for the setup location you used in the last exercise. The positive
width measurement is now removed from the display because you selected it
after you saved the setup.
This completes the tutorial. You can restore the default settings by pressing
SETUP ➞ Recall Factory Setup (main) ➞ OK Confirm Factory Init (side).
TDS 620 & 640 User Manual
1Ć19
Page 38

Example 4: Saving Setups
1Ć20
Section Name (Nm:Sect)
Page 39

Concepts
Page 40

Page 41

Overview
Understanding the basic concepts of your digitizing oscilloscope will help you
use it effectively. This section explains the following concepts:
H
The triggering system, which establishes conditions for acquiring signals. Properly set, triggers can convert displays from unstable jumbles or
blank screens into meaningful waveforms. See
H
The acquisition system, which converts analog data into digital form.
Acquisition
See
H
The waveform scaling and positioning system, which changes the
dimensions of the waveform display. Scaling waveforms involves increasing or decreasing their displayed size. Positioning means moving them
up, down, right, or left on the display. See
on page 2-13.
forms
H
The measurement system, which provides numeric information on the
displayed waveforms. You can use graticule, cursor and automated
measurements. See
on page 2-7.
Measurements
on page 2-17.
Triggering
Scaling and Positioning Wave-
on page 2-2.
At the end of each topic,
more information can be found.
To explore these topics in more depth and to read about topics not covered in
this section, see
In Detail.
For More Information
Page 3-1 lists the topics covered.
will point you to sources where
TDS 520 & TDS 540 User Manual
2Ć1
Page 42

Triggering
This section describes the edge trigger of the main trigger system and explores, in a general sense, the topic of triggering. This oscilloscope also has
logic and pulse triggers in the main trigger system and a delayed trigger
system. They are described in Section 3.
Triggers determine when the digitizing oscilloscope starts acquiring and
displaying a waveform. They help create meaningful waveforms from unstable jumbles or blank screens (see Figure 2-1).
Triggered Waveform Untriggered Waveforms
Trigger Sources
Figure 2-1: Triggered Versus Untriggered Displays
The trigger event establishes the time-zero point in the waveform record, and
all points in the record are located in time with respect to that point. The
digitizing oscilloscope continuously acquires and retains enough sample
points to fill the pretrigger portion of the waveform record (that part of the
waveform that is displayed
screen).
When a trigger event occurs, the digitizing oscilloscope starts acquiring
samples to build the posttriger portion the waveform record (displayed
or to the right of, the trigger event). Once a trigger is recognized, the digitizing
oscilloscope will not accept another trigger until the acquisition is complete.
The basic trigger is the edge trigger. An edge trigger event occurs when the
source
trigger
specified voltage
You can derive your trigger from various sources.
H
Input channels—the most commonly used trigger source is any one of
the four input channels. The channel you select as a trigger source will
function whether it is displayed or not.
(the signal that the trigger circuit monitors) passes through a
level
before,
in a specified direction (the trigger
or to the left of, the triggering event on
after,
slope
).
2Ć2
Concepts
Page 43

H
AC Line Voltage—this trigger source is useful when you are looking at
signals related to the power line frequency. Examples include devices
such as lighting equipment and power supplies. Because the digitizing
oscilloscope generates the trigger, you do not have to input a signal to
create it.
H
Auxiliary Trigger—this trigger source is useful in digital design and
repair. For example, you might want to trigger with an external clock or
with a signal from another part of the circuit. To use the auxiliary trigger,
connect the external triggering signal to the Auxiliary Trigger input connector on the oscilloscope rear panel (TDS 540 only).
Triggering
Types
Trigger Modes
The digitizing oscilloscope provides three types of triggers for the main trigger
system: edge, pulse, and logic. These triggers are described in individual
articles found in the section
H
Edge—the “basic” trigger. You can use it with both analog and digital test
circuits. An edge trigger event occurs when the trigger
the trigger circuit is monitoring) passes through a specified voltage
in the specified direction (the trigger
H
Pulse—special trigger primarily used on digital circuits. Three classes of
pulse triggers are
the main trigger only.
H
Logic—special trigger primarily used on digital logic circuits. You select
Boolean operators for the trigger sources. Triggering occurs when the
Boolean conditions are satisfied. There are two kinds of logic triggers,
state
and
pattern.
only.)
The trigger mode determines how the oscilloscope behaves in the absence of
a trigger event. The digitizing oscilloscope provides two different trigger
modes,
normal
and
automatic
In Detail.
width, runt,
(Logic triggers are available the main trigger system
.
A brief definition of each type follows:
source
slope
).
and
glitch
. Pulse triggering is available on
(the signal
level
TDS 520 & TDS 540 User Manual
H
Normal—this trigger mode lets the oscilloscope acquire a waveform only
when it is triggered. If no trigger occurs, the oscilloscope will not acquire a
waveform. (You can push FORCE TRIGGER to force the oscilloscope to
make a single acquisition.)
H
Automatic—this trigger mode (auto mode) lets the oscilloscope acquire a
waveform even if a trigger does not occur. Auto mode uses a timer that
starts after a trigger event occurs. If another trigger event is not detected
before the timer times out, the oscilloscope forces a trigger anyway. The
length of time it waits for a trigger event depends on the time base setting.
2Ć3
Page 44

Triggering
Be aware that auto mode, when forcing triggers in the absence of valid triggering events, does not sync the waveform on the display. In other words,
successive acquisitions will not be triggered at the same point on the waveform; therefore, the waveform will appear to roll across the screen. Of course,
if valid triggers occur the display will become stable on screen.
Since auto mode will force a trigger in the absence of one, it is useful in
observing signals where you are only concerned with monitoring amplitude
level. Although the unsynced waveform may “roll” across the display, it will not
disappear as it would in normal trigger mode. Monitoring of a power supply
output is an example of such an application.
Holdoff
Trigger Points
Trigger Level
When a trigger event is recognized, the oscilloscope disables the trigger
system until acquisition is complete. In addition, the trigger system remains
disabled during the holdoff period that follows each acquisition. You can set
holdoff time to help ensure a stable display.
For example, the trigger signal can be a complex waveform with many possible trigger points on it. Though the waveform is repetitive, a simple trigger
might get you a series of patterns on the screen instead of the same pattern
each time.
Digital pulse trains are good examples (see Figure 2-2). Each pulse looks like
any other, so many possible trigger points exist. Not all of these will result in
the same display. The holdoff period allows the digitizing oscilloscope to
trigger on the correct edge, resulting in a stable display.
Acquisition
Interval
Acquisition
Interval
2Ć4
Holdoff Holdoff
Triggers are Not Recognized During Holdoff Time
Holdoff
Figure 2-2: Trigger Holdoff Time Ensures Valid Triggering
Concepts
Page 45

Triggering
Holdoff is settable from 0% (minimum holdoff available) to 100% (maximum
available). To see how to set holdoff, see
minimum and maximum holdoff varies with the horizontal scale. See
Variable, Main Trigger
and maximum values.
on page A-23 of Appendix B for the typical minimum
Mode & Holdoff
on page 3-39. The
Holdoff,
Coupling
Trigger coupling determines what part of the signal is passed to the trigger
circuit. Available coupling types include AC, DC, Low Frequency Rejection,
High Frequency Rejection, and Noise Rejection:
DC coupling
H
AC and DC components to the trigger circuit.
AC coupling
H
(AC components above 10 Hz are passed if the source channel is in
1 MW coupling; above 200 kHz are passed in 50 W coupling.) It removes
the DC components from the trigger signal.
High frequency rejection
H
gering signal. That allows only the low frequency components to pass on
to the triggering system to start an acquisition. High frequency rejection
attenuates signals above 30 kHz.
Low frequency rejection
H
Low frequency rejection attenuates signals below 80 kHz.
Noise Rejection
H
amplitude for stable triggering, reducing the chance of falsely triggering
on noise.
passes all of the input signal. In other words, it passes both
passes only the alternating components of an input signal.
removes the high frequency portion of the trig-
does the opposite of high frequency rejection.
lowers trigger sensitivity. It requires additional signal
Trigger Position
TDS 520 & TDS 540 User Manual
The adjustable
trigger occurs. It lets you properly align and measure data within records. The
part of the record that occurs
part that occurs
To help you visualize the trigger position setting, the top part of the display
has an icon indicating where the trigger occurs in the waveform record.You
select in the Horizontal menu what percentage of the waveform record will
contain pretrigger information.
Many users find displaying pretrigger information a valuable troubleshooting
technique. For example, if you are trying to find the cause of an unwanted
glitch in your test circuit, it may prove valuable to trigger on the glitch and
make the pretrigger period large enough to capture data before the glitch. By
analyzing what happened before the glitch, you may uncover clues about the
source of it.
trigger position
after
the trigger is the posttrigger portion.
defines where on the waveform record the
before
the trigger is the pretrigger portion. The
2Ć5
Page 46

Triggering
Slope and Level
Trigger Level Can be
Adjusted Vertically
The slope control determines whether the oscilloscope finds the trigger point
on the rising or the falling edge of a signal (see Figure 2-3).
You set trigger slope by selecting Slope in the Main Trigger menu and then
selecting from the rising or falling slope icons in the side menu that appears.
The level control determines where on that edge the trigger point occurs (see
Figure 2-3).
Positive-Going Edge Negative-Going Edge
Trigger Slope Can be Positive or Negative
Figure 2-3: Slope and Level Controls Help Define the Trigger
Delayed Trigger
For More
Information
The digitizing oscilloscope lets you set the main trigger level with the trigger
MAIN LEVEL knob.
As mentioned earlier in this section there is also a delayed trigger system that
provides an edge trigger (no pulse or logic triggers). When using the delayed
time base, you can also delay the acquisition of a waveform for a user-specified time or a user-specified number of delayed trigger events (or both) after a
main trigger event.
Delayed Triggering
See
See
Edge Triggering
Horizontal Controls
See
Logic Triggering
See
Pulse Triggering
See
Triggering
See
, on page 3-120.
, on page 3-25.
, on page 3-36.
, on page 3-49.
, on page 3-58.
, on page 3-99.
2Ć6
Concepts
Page 47

Acquisition
Acquisition is the process of sampling the analog input signal, converting it
into digital data, and assembling it into waveform record. The oscilloscope
creates a digital representation of the input signal by sampling the voltage
level of the signal at regular time intervals (Figure 2-4).
Sampling and
Digitizing
+5.0 V
0 V 0 V 0 V 0 V
Input Signal Sampled
Points
–5.0 V
Digital
Values
+5.0 V
–5.0 V
Figure 2-4: Acquisition: Input Analog Signal, Sample, and Digitize
The sampled points are stored in memory along with corresponding timing
information. You can use this digital representation of the signal for display,
measurements, or further processing.
You specify how the digitizing oscilloscope acquires data points and assembles them into the waveform record.
The trigger point marks time zero in a waveform record. All record points
before the trigger event make up the pretrigger portion of the the waveform
record. Every record point after the trigger event is part of the posttrigger
portion. All timing measurements in the waveform record are made relative to
that trigger event.
TDS 520 & TDS 540 User Manual
Each time it takes a sample, the oscilloscope digitizer produces a numeric
representation of the signal. The number of samples may be larger than the
number of points in your waveform record. In fact, the oscilloscope may take
several samples for each record point (Figure 2-5).
Interval for One Waveform Record Point
Samples For a
Record Point
Figure 2-5: Several Points May be Acquired for Each Point Used
2Ć7
Page 48

Acquisition
The digitizer can use the extra samples to perform additional processing,
such as averaging or looking for minimum and maximum values.
The digitizing oscilloscope creates a waveform record containing a user-specified number of data points. Each record point represents a certain voltage
level that occurs a determined amount of time from the trigger event.
Record Length
The number of points that make up the waveform record is defined by the
record length. You can set the record length in the Horizontal menu. The
digitizing oscilloscope provides record lengths of 500, 1,000, 2,500, 5,000,
and 15,000 points.
You can order option 1M that provides a maximum record length of 50,000
points. That option is available only at the time of original purchase; it cannot
be installed later.
Sampling Methods
Sampling is the process of converting the analog input signal to digital data
for display and processing. The two general methods of sampling are
and
time
equivalent-time
.
real-
Real-Time Sampling—In real-time sampling, the oscilloscope digitizes all
the points it acquires after one trigger event (see Figure 2-6). Use real-time
sampling to capture single-shot or transient events.
Record Points
Sampling Rate
Figure 2-6: Real-Time Sampling
Two factors that affect real-time sampling on the digitizing oscilloscope are
interleaving
Interleaving
digitizing speeds by combining the efforts of several digitizers. For example, if
you want to digitize on all channels at one time (four on the TDS 540 and two
on the TDS 520), each of those channels can digitize at a maximum real-time
speed of 250 Megasamples/second (per channel).
If you use two channels, the TDS 540 oscilloscope can combine the efforts of
two digitizers to each channel and acquire at 500 Megasamples/second (per
channel).
and
interpolation
.
refers to the ability of the digitizing oscilloscope to attain higher
2Ć8
REV MAY 1992
Concepts
Page 49

Acquisition
If you focus on only one channel at the maximum possible real-time rate, the
TDS 520 oscilloscope can acquire at 500 Megasamples/second using both its
digitizers, while the TDS 540 oscilloscope can combine all four digitizers and
acquire at 1 Gigasample/second.
Depending on how many channels you are using and the speed of the time
base, at some point the digitizing oscilloscope
samples to create a waveform record. (See the discussion on page 2-10 for
more details about when that happens.) At that point, the digitizing oscilloscope will create the waveform record in one of two ways depending on
whether you have limited the oscilloscope to real-time sampling or enabled
equivalent-time sampling (you make that choice in the Acquisition menu).
If you have restricted it to real-time sampling, the digitizing oscilloscope uses
a process called interpolation to create the intervening points in the waveform
record. There are two options for interpolation: linear or sin(x)/x.
will not be able to get enough
Linear interpolation
by using a straight line fit. It assumes all the interpolated points fall in their
appropriate point in time on that straight line. Linear interpolation is useful for
many waveforms such as pulse trains.
Sin(x)/x interpolation
actual values acquired. It assumes all the interpolated points fall along that
curve. That is particularly useful when acquiring more rounded waveforms
such as sine waves. Actually, it is appropriate for general use, although it may
introduce some overshoot or undershoot in signals with fast rise times.
computes record points between actual acquired samples
computes record points using a curve fit between the
NOTE
When using either type of interpolation, you may wish to set the
display style so that the real samples are displayed intensified
relative to the interpolated samples. The instructions under
on page 3-31 explain how to turn on intensified samples.
Style
Display
Equivalent-Time Sampling—The digitizing oscilloscope only uses equiva-
lent-time sampling if you have enabled the equivalent-time option in the
Acquisition menu
which to create a waveform record.
and the oscilloscope is not able to get enough samples with
TDS 520 & TDS 540 User Manual
In equivalent-time (ET) sampling the oscilloscope acquires samples over
many repetitions of the event (Figure 2-7). It should only be used on repetitive
signals.
2Ć9
Page 50

Acquisition
Record Points
1st Acquisition Cycle
2nd Acquisition Cycle
3rd Acquisition Cycle
nth Acquisition Cycle
Figure 2-7: Equivalent-Time Sampling
The oscilloscope takes a few samples with each trigger event and eventually
constructs a waveform record using the samples from multiple acquisitions.
That feature lets you accurately acquire signals with frequencies much higher
than the digitizing oscilloscope real-time bandwidth.
Selecting Sampling
Mode
The digitizing oscilloscope uses a type of equivalent-time sampling called
random equivalent-time sampling
. Although the samples are taken sequentially in time, they are random with respect to the trigger. That is because the
oscilloscope sample clock runs asynchronously with respect to the input
signal and the signal trigger. The oscilloscope takes samples independent of
the trigger position and displays them based on the time difference between
the sample and the trigger.
The sampling speeds and the number of channels you choose affect the
mode the digitizing oscilloscope uses to sample waveforms. Basically, if the
time base is 200 ns or slower, the digitizing oscilloscope uses real-time sampling for creating waveform records.
When the time base is faster than 50 ns, the digitizing oscilloscope creates
waveform records using equivalent-time sampling or interpolation. For speeds
between 200 ns and 20 ns, the digitizing oscilloscope creates waveform
records differently depending on the number of input channels and type of
oscilloscope you are using (see Table 2-1).
2Ć10
Concepts
Page 51

Table 2-1: Sampling Mode Selection —
100 ns/Div to 50 ns/Div
Acquisition
Acquisition Modes
Instrument and
Number of Channels
TDS 540,
any 1 channel
TDS 540,
any 2 channels
TDS 540,
3 or more channels
TDS 520,
any 1 channel
TDS 520, any 2 channels
The digitizing oscilloscope supports five acquisition modes.
Sample
H
H
Peak Detect
H
Hi Res
100 ns/Div 50 ns/Div
Real-time Real-time
Real-time Equivalent-time or
interpolated real-time
Equivalent-time or
interpolated real-time
Real-time Equivalent-time or
Equivalent-time or
interpolated real-time
Equivalent-time or
interpolated real-time
interpolated real-time
Equivalent-time or
interpolated real-time
Bandwidth
Coupling
H
Envelope
H
Average
Sample acquisition mode, which acquires in real time, is the mode most
commonly used. You can read about Sample and the other acquisition modes
Acquisition Modes,
in
Bandwidth
and display accurately (that is, with less than 3 dB attenuation).
You can set different bandwidths with the digitizing oscilloscope. Lower band-
width settings let you eliminate the higher frequency components of a signal.
The TDS 500 offers Full (500 MHz), 100 MHz, and 20 MHz bandwidth settings.
You can couple your input signal to the digitizing oscilloscope three ways. You
can choose between AC, DC, or Ground (GND). You also can set the input
impedance.
H
H
refers to the range of frequencies that an oscilloscope can acquire
DC coupling shows both the AC and DC components of an input signal.
AC coupling shows only the alternating components of an input signal.
beginning on page 3-11.
TDS 520 & TDS 540 User Manual
2Ć11
Page 52

Acquisition
For More
Information
H
Ground (GND) coupling disconnects the input signal from the acquisition.
H
Input impedance lets you select either 1 MW or 50 W impedance.
NOTE
If you select 50 Wimpedance with AC coupling, the digitizing oscilloscope will not accurately display frequencies under 200 kHz.
See
Scaling and Positioning Waveforms
Acquisition Modes
See
, on page 3-11.
, on page 2-13.
2Ć12
Concepts
Page 53

Scaling and Positioning Waveforms
Record View
Channel Reference Icon
Scaling and positioning waveforms means increasing or decreasing their
displayed size and moving them up, down, right, and left on the display.
Two display icons, the channel reference indicator and the record view, help
you quickly see the position of the waveform in the display (see Figure 2-8).
The channel reference icon points to the ground of the waveform record when
offset is set to 0 V. This is the point about which the waveform contracts or
expands when the vertical scale is changed. The record view, at the top of the
display, indicates where the trigger occurs and what part of the waveform
record is displayed.
Original Position Positioned Vertically Positioned Horizontally
Original Scale Scaled Horizontally
Figure 2-8: Scaling and Positioning
Scaled
Vertically
TDS 520 & TDS 540 User Manual
2Ć13
Page 54

Scaling and Positioning Waveforms
Vertical System
You can adjust the vertical position of the selected waveform by moving it up
or down on the display. For example, when trying to compare multiple waveforms, you can put one above another and compare them, or you can overlay
the two waveforms on top of each other. To move the selected waveform turn
the vertical POSITION knob.
You can also alter the vertical scale. The digitizing oscilloscope shows the
scale (in volts per division) for each active channel toward the bottom left of
the display. As you turn the vertical SCALE knob clockwise, the value decreases resulting in higher resolution because you see a smaller part of the
waveform. As you turn it counter-clockwise the scale increases allowing you
to see more of the waveform but with lower resolution.
Besides using the position and scale knobs, you can set the vertical scale and
position with exact numbers. You do that with the Vertical menu Fine Scale
and Position selections and the general purpose knob and/or the keypad.
Offset
Vertical offset changes where the channel reference indicator is shown with
respect to the graticule. Offset adds a voltage to the reference indicator
without changing the scale. That feature allows you to move the waveform up
and down over a large area without decreasing the resolution.
Offset is useful in cases where a waveform has a DC bias. One example is
looking at a small ripple on a power supply output. You may be trying to look
at a 100 mV ripple on top of a 15 V supply. The range available with offset
can prove valuable as you try to move and scale the ripple to meet your
needs.
Horizontal System
2Ć14
Adjusting the horizontal position of waveforms moves them right or left on the
display. That is useful when the record length of the waveform is so large
(greater than 500 points) that the digitizing oscilloscope cannot display the
entire waveform record at one time. You can also adjust the scale of the
waveform. For example, you might want to see just one cycle of a waveform
to measure the overshoot on its rising edge.
You adjust the horizontal scale of the displayed waveform records using the
horizontal SCALE knob and the horizontal position using the horizontal
POSITION knob.
The digitizing oscilloscope shows the actual scale in the bottom right of the
display. The scale readout shows the time per division used. Since all live
waveforms use the same time base, the digitizing oscilloscope only displays
one value for all the active channels.
Concepts
Page 55

Actual High-Frequency Waveform
Apparent Low-Frequency
Waveform Due to Aliasing
Sampled Points
Scaling and Positioning Waveforms
Aliasing
When
aliasing
actual waveform being input or a waveform is not stable even though the light
next to TRIG’D is lit. Aliasing occurs because the oscilloscope cannot sample
the signal fast enough to construct an accurate waveform record (Figure 2-9).
happens, you see a waveform with a frequency lower than the
Figure 2-9: Aliasing
One simple way to check for aliasing is to slowly change the horizontal scale
(time per division setting). If the shape of the displayed waveform changes
drastically, you may have aliasing.
In order to represent a signal accurately and avoid aliasing, you must sample
the signal more than twice as fast as the highest frequency component. For
example, a signal with frequency components of 500 MHz would need to be
sampled at a rate faster than 1 Gigasamples/second.
There are various ways to prevent aliasing. Try adjusting the horizontal scale,
or simply press the AUTOSET button. You can also counteract some aliasing
by changing the acquisition mode in the Acquisition menu. For example, if
you are using the sample mode and suspect aliasing, you may want to
change to the peak detect mode. Since the peak detect mode searches for
samples with the highest and lowest values, it can detect faster signal components over time.
Delayed Time Base
You can set a main time base and a delayed time base. Each time base has
its own trigger. There are two types of delayed time base acquisitions, with
each based on its triggering relationship to the main time base. These are
delayed runs after main and delay triggerable (after time, events, or both)
acquisitions.
TDS 520 & TDS 540 User Manual
The delayed time base is useful in catching events that follow other events.
See
Triggering
on page 2-2 for more information on the delayed trigger.
2Ć15
Page 56

Scaling and Positioning Waveforms
Zoom
Autoset
You can use zoom to see more detail without changing the acquired signal.
When you press the ZOOM button, a portion of the waveform record can be
expanded or compressed on the display, but the record points stay the same.
Zoom is very useful when you wish to temporarily expand a waveform to
inspect small feature(s) on that waveform. For example, you might use zoom
to temporarily expand the front corner of a pulse to inspect its aberrations.
Use zoom to expand it horizontally and vertically. After you are finished, you
can return to your original horizontal scale setting by pressing one menu
button. (The zoom feature is also handy if you have acquired a waveform
while using the fastest time per division and want to further expand horizontally.)
Autoset lets you quickly obtain a stable waveform display. It automatically
adjusts a wide variety of settings including vertical and horizontal scaling.
Other settings affected include trigger coupling, type, position, slope, mode,
and display intensities.
does.
Autoset
on page 3-18 describes in detail what autoset
For More
Information
Autoset
See
Delayed Triggering
See
Horizontal Control
See
Vertical Control
See
Zoom
See
, on page 3-18.
, on page 3-130.
, on page 3-25.
, on page 3-49.
, on page 3-124.
2Ć16
Concepts
Page 57

Measurements
The digitizing oscilloscope not only displays graphs of voltage versus time, it
also can help you measure the displayed information (see Figure 2-10).
Measurement
Sources
Automated
Measurements
Ch 1
Frequency
100 MHz
Ch 1 Period
10 ns
Graticule
Cursors
Cursor
Readouts
Figure 2-10: Graticule, Cursor and Automated Measurements
The oscilloscope provides three measurement classes. They are: graticules,
cursors, and automated measurements.
TDS 520 & TDS 540 User Manual
Graticule Measurements
Graticule measurements provide you with quick, visual estimates. For example, you might look at a waveform amplitude and say “it is a little more than
100 mV.”
You can perform simple measurements by counting the number of major and
minor graticule divisions involved and multiplying by the scale factor.
For example, if you counted five major vertical graticule divisions between a
minimum and maximum values of a waveform and knew you had a scale
factor of 100 mV/division, then you could easily calculate your peak-to-peak
voltage:
5 divisions
100 mV/division = 500 mV.
2Ć17
Page 58

Measurements
Cursor Measurements
Cursors are fast and easy-to-understand measurements. You take measurements by moving the cursors and reading their numeric values from the on
screen readouts, which update as you adjust their positions.
active
Cursors appear in pairs. One part of the pair is
and the other
You move the active cursor (the solid line) using the general purpose knob.
The TOGGLE button lets you select (toggle) which cursor bar is active or
inactive. The inactive cursor is a dashed line on the display.
To get the cursor menu, press the CURSOR button. There are three kinds of
cursors available in that menu:
inactive
.
Horizontal bar cursors
H
Vertical bar cursors
H
measure vertical parameters (typically volts).
measure horizontal parameters (typically time or
frequency).
Paired cursors
H
measure both vertical parameters (typically volts) and
horizontal parameters (typically time or frequency).
There are also two modes for cursor operation available in the cursor menu—
independent
and
tracking
Independent Mode
Tracking Mode
. (See Figure 2-11.)
Only Selected Cursor
Moves
2Ć18
Both Cursors Move
in Tandem
Figure 2-11: Cursor Modes
Independent mode
H
one
move
cursor at a time (the active cursor) using the general purpose
cursors operate as was earlier described; that is, you
knob, and you use the TOGGLE button to toggle which cursor bar is
active.
Concepts
Page 59

Measurements
H
Tracking mode
same time using the general purpose knob. To adjust the solid cursor
relative to the dashed cursor, you push the TOGGLE button to suspend
cursor tracking and use the general purpose knob make the adjustment.
A second push toggles the cursors back to tracking.
cursors operate in tandem: you move
both
cursors at the
You can read more detailed information about how to use cursors in
Measurements
beginning on page 3-20.
Cursor
Automated Measurements
You make automated measurements merely by pressing a few buttons. The
digitizing oscilloscope does all the calculating for you. Because these measurements use the waveform record points, they are more accurate than
cursor or graticule measurements.
Press the MEASURE button for the automated measurement menus. These
menus let you make
(typically in seconds or hertz), and
can select and display up to four measurements at a time. (See Table 3-5 on
page 3-66 for a list of all the automatic measurements and their definitions.)
You can make automated measurements on the entire waveform record or
just on a specific part. The gating selection in the Measurement menu lets
you use the vertical cursors to limit the measurement to a section of the
waveform record.
The snapshot selection in the Measurement menu lets you display almost all
of the measurements at once. You can read about snapshot under
of Measurements
amplitude
on page 3-75.
(typically in volts; sometimes in %),
area
(in volt-seconds) measurements. You
time
Snapshot
For More
Information
Automated measurements use readouts to show measurement status. These
readouts are updated as the oscilloscope acquires new data or if you change
settings.
Appendix C: Algorithms
See
oscilloscope calculates each automatic measurement.
Cursor Measurements
See
measurements.
Measurement System
See
measurements.
See the
equipped with that option) for using cursors to measure Fast Fourier Transformed, integrated, or differentiated math waveforms.
See
See
waveforms.
TDS Family Option 2F Instruction Manual
Tutorial Example 3: Automated Measurements
Waveform Math
, on page 3-127, for using cursors to measure math
, on page A-25, for details on how the digitizing
, on page 3-20, for more information on cursor
, on page 3-66, for more information on automatic
(if your oscilloscope is
, on page 1-12.
TDS 520 & TDS 540 User Manual
2Ć19
Page 60

Measurements
2Ć20
Concepts
Page 61

In Detail
Page 62

Page 63

Overview
This section describes the details of operating the digitizing oscilloscope.
The first part,
gives some general operating instructions. It also contains an overview of all
the main menus. This part includes the following illustrations:
At a Glance
Map, Rear Panel Map, Display Map, Basic Menu Operation,
The second part contains an alphabetical list of tasks you can perform with
the digitizing oscilloscope. Use this section to answer specific questions about
instrument operation. The following tasks are included.
H
Acquisition Modes
H
Autoset
H
Cursor Measurements
H
Delayed Triggering
H
Display Modes
H
Edge Triggering
H
Hardcopy
H
Help
H
Horizontal Control
H
Limit Testing
H
Logic Triggering
H
Measurement System
H
Probe Accessories
H
Probe Cal
, shows you how the oscilloscope is organized and
Front Panel
and
Menu Map.
H
Probe Compensation
H
Pulse Triggering
H
Probe Selection
H
Remote Communication
H
Saving and Recalling Setups
H
Saving and Recalling Waveforms
H
Selecting Channels
H
Signal Path Compensation
H
Status
H
Triggering
H
Vertical Control
H
Waveform Math
H
Zoom
TDS 520 & TDS 540 User Manual
Many of these tasks list steps you perform to accomplish the task. You should
Conventions
read
on page ii of
Welcome
before reading about these tasks.
3Ć1
Page 64

Front Panel Map—
Left Side
At a Glance
The
At a Glance
panels, and the menu system. These will help you understand and operate
the digitizing oscilloscope. This section also contains a visual guide to using
the menu system.
section contains illustrations of the display, the front and rear
ON/STBY Switch,
page viii
Main Menu Buttons,
page 3-6
Side Menu Buttons,
page 3-6
CLEAR MENU
Removes Menus
from the Display
3Ć2
In Detail
Page 65

Front Panel Map —
Right Side
Cursor Measurements, page 3-20
Saving and Recalling
Waveforms, page
Saving and Recalling Setups
page 3-110
Autoset, page 3-18
Help, page 3-48
Status, page 3-119
3-112
At a Glance
Measurement System,
page 3-66
Display Modes, page 3-31
Remote Communication, page 3-106
Hardcopy,
page 3-40
Acquisition Modes,
page 3-11
Cursor Measurements,
page 3-20
Selecting Channels,
page 3-115
Waveform Math,
page 3-127
Vertical Control,
page 3-124
Zoom,
page
3-130
Horizontal Control,
page 3-49
Ground
Probe Compensation,
page 3-90
Triggering, page 3-120
Delay Triggering, page 3-25
Edge Triggering, page 3-36
Logic Triggering, page 3-58
Pulse Triggering, page 3-99
TDS 520 & TDS 540 User Manual
3Ć3
Page 66

At a Glance
Rear Panel Map
Principal Power Switch,
page viii
Fuse,
page viii
Power connector,
page viii
GPIB
Connector
page 3-106
Serial Number
Rear Panel
Connectors
SIGNAL OUT –
(Provides analog signal output)
AUX TRIGGER INPUT –
(Provides auxiliary trigger signal input)
MAIN TRIGGER OUTPUT –
(Provides main trigger (TTL) output)
DELAYED TRIGGER OUTPUT –
(Provides delayed trigger (TTL) output)
Security
Bracket
3Ć4
In Detail
Page 67

Display Map
At a Glance
The value entered with
The acquisition
status, page 3-11
Shows what part of the waveform record is displayed, page 3-49
Trigger position (T),
page 3-120
Indicates position of
vertical bar cursors in
the waveform record,
page 3-124
the general purpose
knob or keypad
When present, the general
purpose knob makes coarse
adjustments; when absent,
fine adjustments
The waveform
record icon
Trigger level on
waveform (may be
an arrow at right
side of screen
instead of a bar)
Channel level
and waveform
source
Each channel’s
vertical scale,
page 3-124
The main menu with
choices of major
actions
Cursor
measurements,
page 3-20
The side menu
with choices of
specific actions
Trigger
parameters,
page 3-122
Horizontal scale
and time base
type, page 3-49
TDS 520 & TDS 540 User Manual
3Ć5
Page 68

At a Glance
To Operate a Menu
1. Press front-panel menu button.
(Press SHIFT first if button
label is blue.)
2. Press one of these buttons to
3. Press one of these buttons to
select from main menu.
select from side menu (if
displayed).
4. If side menu item has an adjustable value (shown in re-
verse video), adjust it with the
general purpose knob or
keypad.
3Ć6
In Detail
Page 69

To Operate a Pop-Up
Menu
At a Glance
Press
to display pop-ups.
Press it again
to make selection.
A pop-up selection changes the
other main menu titles.
Press here to
remove menus
from screen.
TDS 520 & TDS 540 User Manual
3Ć7
Page 70

At a Glance
Menu Map
Acquire Menu
see page 3-11)
(
Application Menu
(see the Programmer
manual for more details
)
Cursor Menu
see page 3-20)
(
Delayed Trigger Menu
(see page 3-25)
Press these buttons:
To bring up these menus:
Display Menu
see page 3-31 )
(
Hardcopy Menu
(see page 3-40)
Horizontal Menu
(see page 3-49)
3Ć8
In Detail
Page 71

At a Glance
Main Trigger Menu – Edge
(see page 3-36)
Main Trigger Menu – Logic
(see page 3-58)
Main Trigger Menu –Pulse
(see page 3-99)
Measure Menu
(see page 3-66)
Press these buttons:
To bring up these menus:
More Menu
(see page 3-127)
Save/Recall Setup Menu
(see page 3-110)
Save/Recall Waveform Menu
(see page 3-112)
Status Menu
(see page 3-119)
TDS 520 & TDS 540 User Manual
3Ć9
Page 72

At a Glance
Utility Menu – Calibration
see page 3-117)
(
Utility Menu – Config
see pages 3-1 11 and 3-43)
(
Utility Menu – Diagnostics
see the Service manual)
(
Utility Menu – I/O
(see page 3-106)
Press these buttons:
To bring up these menus:
Vertical Channel Menu
see page 3-124)
(
Zoom Menu
see page 3-130)
(
3Ć10
In Detail
Page 73

Acquisition Modes
The acquisition system has several options for converting analog data into
digital form. The Acquisition menu lets you determine the acquisition mode,
whether or not to permit equivalent time sampling, and how to start and stop
acquisitions.
Description of Modes
The digitizing oscilloscope supports five acquisition modes.
Sample
H
H
Peak Detect
H
Hi Res
H
Envelope
H
Average
The Sample, Peak Detect, and Hi Res modes operate in real-time on a single
trigger event, provided the digitizing oscilloscope can acquire enough samples
for each trigger event. Envelope and Average modes operate on multiple
acquisitions. The digitizing oscilloscope averages or envelopes several waveforms on a point-by-point basis.
Figure 3-1 illustrates the different modes and lists the benefits of each. It will
help you select the appropriate mode for your application.
Sample Mode
In Sample mode, the oscilloscope creates a record point by saving the first
sample (of perhaps many) during each acquisition interval. (An acquisition
interval is the time covered by the waveform record divided by the record
length.) This is the default mode.
TDS 520 & TDS 540 User Manual
Peak Detect Mode
Peak Detect mode alternates between saving the highest sample in one
acquisition interval and lowest sample in the next acquisition interval. That
mode only works with real-time, non-interpolated sampling.
If you set the time base so fast that it requires real-time interpolation or
equivalent-time sampling, the mode automatically changes from Peak Detect
to Sample, although the menu selection will not change.
3Ć11
Page 74

Acquisition Modes
Single Waveform Acquisition
Samples Acquired in Four
Acquisition Intervals
Interval 1 2 3 4
Use to reveal aliasing and for glitch detection.
Provides the benefits of enveloping with the
Provides the benefits of averaging
with the speed of a single acquisition.
Acquisition
Mode
Sample
Uses first sample
in interval
Use for fastest acquisition rate.
This is the default mode.
Peak Detect
Uses highest and lowest
samples in two intervals
speed of a single acquisition.
Hi Res
Calculates average of all
samples in interval
Use to reduce apparent noise.
Displayed
Record Points
Waveform
Drawn on CRT
Three Acquisitions from One Source
Acquisition
1
Uses Peak Detect Mode for Each Acquisition
Uses Sample Mode for Each Acquisition
23
Figure 3-1: How the Acquisition Modes Work
Multiple Waveform Acquisitions
Acquisition
Mode
Envelope
Finds highest and
lowest record points over
many acquisitions
Use to reveal variations
in the signal across time.
Average
Calculates average value for
each record point over many
acquisitions
Use to reduce apparent noise
in a repetitive signal.
Waveform
Drawn on CRT
3Ć12
In Detail
Page 75

Acquisition Modes
Hi Res Mode
In Hi Res mode, the digitizing oscilloscope averages all samples taken during
an acquisition interval to create a record point. That average results in a
higher-resolution, lower-bandwidth waveform.
This mode only works with real-time, non-interpolated sampling. If you set the
time base so fast that it requires real-time interpolation or equivalent-time
sampling, the mode automatically becomes Sample, although the menu
selection will not change.
A key advantage of Hi Res is its potential for increasing resolution regardless
of the input signal. Table 3-1 and the equations shown below illustrate how
you can obtain up to 15 significant bits with Hi res mode. Note that the resolution improvements are limited to speeds slower than 400 ns/div. Also, resolutions above 15 bits are not allowed by internal hardware and computation
limitations.
Si = Sampling Interval for TDS 500 = 4ns
ą
D
t = Sample Interval
=
TimeńDiv
Number Of Points/Div
Nd = Number of points per decimation interval
Resolution Enhancement (bits) =
Table 3-1: Additional Resolution Bits
Time Base Speed
400 ns and faster 8 bits
1 ms to 2 ms 9 bits
5 ms to 10 ms 10 bits
20 ms to 50 ms 11 bits
100 ms to 200 ms 12 bits
500 ms 13 bits
1 ms to 2 ms 14 bits
5 ms and slower 15 bits
0.5 LOG2(Nd)
Bits of Resolution
5 msńDiv
=
50 PointsńDiv
D
t
=
= 25
Si
2 extra bits
= 100
ns
TDS 520 & TDS 540 User Manual
Envelope Mode
Envelope mode lets you acquire and display a waveform record that shows
the extremes in variation over several acquisitions. You specify the number of
acquisitions over which to accumulate the data. The oscilloscope saves the
highest and lowest values in two adjacent intervals similar to the Peak Detect
mode. But Envelope mode, unlike Peak Detect, gathers peaks over many
trigger events.
3Ć13
Page 76

Acquisition Modes
After each trigger event, the oscilloscope acquires data and then compares
the min/max values from the current acquisition with those stored from previous acquisitions. The final display shows the most extreme values for all the
acquisitions for each point in the waveform record.
Average Mode
Average mode lets you acquire and display a waveform record that is the
averaged result of several acquisitions. This mode reduces random noise.
The oscilloscope acquires data after each trigger event using Sample mode.
It then averages the record point from the current acquisition with those
stored from previous acquisitions.
Acquisition Readout
Acquisition Readout
The acquisition readout at the top of the display (Figure 3-2) shows the state
of the acquisition system (running or stopped). The “running” state shows the
sample rate and acquisition mode. The “stopped” state shows the number of
acquisitions acquired since the last stop or major change.
Operation
3Ć14
Figure 3-2: Acquisition Menu and Readout
To bring up the acquisition menu (Figure 3-2) press SHIFT ACQUIRE MENU.
In Detail
Page 77

Acquisition Modes
Acquisition Mode
To choose how the digitizing oscilloscope will create points in the waveform
record:
Press SHIFT ACQUIRE MENU ➞ Mode (main) ➞ Sample, Peak Detect, Hi
Res, Envelope, or Average (side).
When you select Envelope or Average, you can enter the number of waveform records to be enveloped or averaged using the keypad or the general
purpose knob.
NOTE
If you selected the longest record length available in the Horizontal
menu, then you cannot select Hi Res as your acquisition mode. This
is because Hi Res mode uses twice the acquisition memory that the
other acquisition modes use. If Hi Res and the longest horizontal
record length were allowed to be selected at the same time, the
oscilloscope would run out of memory.
Repetitive Signal
To limit the digitizing oscilloscope to real-time sampling or let it choose between real-time or equivalent-time sampling:
Press SHIFT ACQUIRE MENU ➞ Repetitive Signal (main) ➞ ON or OFF
(side).
H
OFF (Real Time Only) uses both the real time and the equivalent time
features of the digitizing oscilloscope.
H
OFF (Real Time Only) limits the digitizing oscilloscope to real time
sampling. If the digitizing oscilloscope cannot accurately get enough
samples for a complete waveform, the oscilloscope will use the interpolation method selected in the display menu to fill in the missing record
points. That is, it will use either the linear or sin(x)/x interpolation algorithm.
See
Acquisition
on page 2-7 for details about sampling.
Stop After
You can choose to acquire exactly one waveform sequence or to acquire
waveforms continuously under manual control.
Press SHIFT ACQUIRE MENU ➞ Stop After (main) ➞ RUN/STOP button
only, Single Acquisition Sequence, or Limit Test Condition Met (side)
(see Figure 3-3).
TDS 520 & TDS 540 User Manual
3Ć15
Page 78

Acquisition Modes
Figure 3-3: Acquire Menu—Stop After
H
RUN/STOP button only (side) lets you start or stop acquisitions by
toggling the RUN/STOP button. Pressing the RUN/STOP button once will
stop the acquisitions. The upper left hand corner in the display will say
Stopped and show the number of acquisitions. If you press the button
again, the digitizing oscilloscope will resume taking acquisitions.
H
Press Single Acquisition Sequence (side). That selection lets you run a
single sequence of acquisitions by pressing the RUN/STOP button. In
Sample, Peak Detect, or Hi Res mode, the instrument will acquire a
waveform record with the first valid trigger event and stop.
In Envelope or Average mode, the digitizing oscilloscope will make the
specified number of acquisitions to complete the averaging or enveloping
task.
If the oscilloscope is in equivalent-time mode and you press Single
Acquisition Sequence (side), it will continue to recognize trigger events
and acquire samples until the waveform record is filled.
Hint: To quickly select Single Acquisition Sequence without displaying the
Acquire and Stop After menus, press SHIFT FORCE TRIG. Now the
RUN/STOP button operates as just described. (You still must display the
Acquire menu and then the Stop After menu to leave Single Acquisition
Sequence operation.)
3Ć16
In Detail
Page 79

Acquisition Modes
H
Limit Test Condition Met (side) lets you acquire waveforms until wave-
form data exceeds the limits specified in the limit test. Then acquisition
stops. At that point, you can also specify other actions for the oscillo-
scope to take, using the selections available in the Limit Test Setup
main menu.
NOTE
For More
Information
In order for the
test conditions have been met, limit testing must be turned
using the
Setting up limit testing requires several more steps. You can create the
template waveform against which to compare incoming waveforms, using
the Create Limit Test Template main menu item. You can then specify
that the comparison is to be made, and the channel to compare against
the template, using the Limit Test Sources main menu item.
Acquisition
See
See
Limit Testing
digitizing oscilloscope
Limit Test Setup
, on page 2-7.
, on page 3-53.
to stop acquisition when limit
main menu.
ON
,
TDS 520 & TDS 540 User Manual
3Ć17
Page 80

Autoset
The autoset function lets you quickly obtain and display a stable waveform of
usable size. Autoset automatically sets up the front panel controls based on
the characteristics of the input signal. It is much faster and easier than a
manual control-by-control setup.
Autoset makes adjustments in these areas:
H
Acquisition
H
Display
H
Horizontal
H
Trigger
H
Vertical
NOTE
Autoset may change vertical position in order to position the waveform appropriately. It always sets vertical offset to 0 V.
Operation
Autoset Defaults
1. Press the Channel Selection button (such as CH 1) corresponding to your
input channel to make it active.
2. Press AUTOSET.
If you use autoset when one or more channels are displayed, the digitizing
oscilloscope selects the lowest numbered channel for horizontal scaling and
triggering. Vertically, all channels in use are individually scaled.
If you use autoset when no channels are displayed, the digitizing oscilloscope
will turn on channel one (CH 1) and scale it.
Table 3-2 on the following page lists the autoset defaults.
3Ć18
In Detail
Page 81

Table 3-2: Autoset Defaults
Autoset
Control
Changed by Autoset to
Selected channel Numerically lowest of the displayed
channels
Acquire Mode Sample
Acquire Repetitive Signal On
Acquire Stop After RUN/STOP button only
Display Style Vectors
Display Intensity—Overall If less than 50%, set to 75%
Display Format YT
Horizontal Position Centered within the graticule window
Horizontal Scale As determined by the signal frequency
Horizontal Time Base Main Only
Horizontal Record Length Unchanged
Limit Test Off
Trigger Position Unchanged
Trigger Type Edge
Trigger Source Numerically lowest of the displayed
channels (the selected channel)
Trigger Level Midpoint of data for the trigger source
Trigger Slope Positive
Trigger Coupling DC
Trigger Holdoff 0
Vertical Scale As determined by the signal level
Vertical Coupling DC unless AC was previously set.
AC remains unchanged.
Vertical Bandwidth Full
Vertical Offset 0 volts
Zoom Off
TDS 520 & TDS 540 User Manual
3Ć19
Page 82

Cursor Measurements
Use the cursors to measure the difference (either in time or voltage) between
two locations in a waveform record.
Description
Horizontal Bar Cursors Vertical Bar Cursors
Cursors are made up of two markers that you position with the general purpose knob. You move one cursor independently or both cursors in tandem,
depending on the cursor mode. As you position the cursors, readouts on the
display report measurement information.
There are three cursor types:
ure 3-4).
Horizontal bar cursors
Vertical bar cursors
cy).
Figure 3-4: Cursor Types
horizontal bar, vertical bar,
measure vertical parameters (typically volts).
measure horizontal parameters (typically time or frequen-
and
paired
Paired Cursors
(Fig-
3Ć20
Paired cursors
tal parameters (typically time) simultaneously.
Look at Figure 3-4. Note that each of the two paired cursors has a long
vertical bar paired with a short horizontal bar. The short horizontal bars measure vertical parameters (typically volts); the long vertical bars measure
horizontal parameters (typically time or frequency). (See
page 3-21 for more information.)
measure both vertical parameters (typically volts) and horizon-
Cursor Readouts
on
In Detail
Page 83

Cursor Measurements
NOTE
When cursors measure certain math waveforms, the measurement
may not be of time, frequency, or voltage. Cursor measurement of
those math waveforms that are not of time, frequency or voltage is
described in Waveform Math, which begins on page 3-127. For
those oscilloscopes equipped with Option 2F, the advanced DSP
math option, the instruction manual shipped with the option describes the use of cursors to measure such waveforms and the
measurement units that result.
Independent Mode
There are two cursor modes:
Only Selected Cursor
Moves
In independent mode you move only one cursor at a time using the general
purpose knob. The active, or selected, cursor is a solid line. Press TOGGLE
to change which cursor is selected.
In tracking mode you normally move both cursors in tandem using the general
purpose knob. The two cursors remain a fixed distance (time or voltage) from
each other. Press TOGGLE to temporarily suspend cursor tracking. Y ou can
then use the general purpose knob to adjust the distance of the solid cursor
relative to the dashed cursor. A second push toggles the cursors back to
tracking.
independent
Tracking Mode
Figure 3-5: Cursor Modes
and
tracking
.
Both Cursors Move
in Tandem
Cursor Readouts
TDS 520 & TDS 540 User Manual
The cursor readout shows the absolute location of the selected cursor and the
difference between the selected and non-selected cursor. The readouts differ
depending on whether you are using H Bars or V Bars.
H
H Bars:
the value after D shows the voltage difference between the
cursors. The value after @ shows the voltage of the selected cursor
relative to ground (see Figure 3-6).
H
V Bars:
the value after
D shows the time (or frequency) difference be-
tween the cursors. The value after @ shows the time (frequency) of the
selected cursor relative to the trigger point.
3Ć21
Page 84

Cursor Measurements
Cursor Readout (H Bars)
Non-selected Cursor
(Dashed Line)
Selected Cursor
(Solid Line)
H
Paired: the value after one D shows the voltage difference between the
the two short horizontal bars; the other
shows the time (or frequency)
D
difference between the two long vertical bars. The value after @ shows
the voltage at the short horizontal bar of the selected cursor relative to
ground (see Figure 3-7).
Operation
Figure 3-6: H Bars Cursor Menu and Readouts
Paired cursors can only show voltage differences when they remain on
screen. If the paired cursors are moved off screen horizontally, Edge will
replace the voltage values in the cursor readout.
To take cursor measurements, press CURSOR to display the Cursor menu
(Figure 3-6).
Function
Select the type of cursors you want using the Function menu item:
Press CURSOR ➞ Function (main) ➞ H Bars, V Bars, Paired, or Off (side).
3Ć22
In Detail
Page 85

Position of Vertical Bar Cursors
(Useful for Locating Cursors
Outside the Display)
Cursor Readout (Paired)
Selected Cursor
(Solid Vertical Bar;
Solid Horizontal Bar)
Non-selected Cursor
(Dashed Vertical Bar;
Solid Horizontal Bar)
Cursor Measurements
Figure 3-7: Paired Cursor Menu and Readouts
Mode
Select the cursor mode you want using the Mode menu item.
1. Press CURSOR ➞ Mode (main) ➞ Independent or Tracking (side):
H
Independent makes each cursor positionable without regard to the
position of the other cursor.
H
Tracking makes both cursors positionable in tandem; that is, both
cursors move in unison and maintain a fixed horizontal or vertical
distance between each other.
2. Use the general purpose knob to move the selected (active) cursor if
Independent was selected in step 1. Press TOGGLE to change which
cursor is active and moves. A solid line indicates the active cursor and a
dashed line the inactive cursor.
or
Use the general purpose knob to move both cursors in tandem if Track-
ing was selected in step 1. Press TOGGLE to temporarily suspend
cursor tracking; then use the general purpose knob to adjust the distance
of the solid cursor relative to the dashed cursor. Press TOGGLE again to
resume tracking. A solid line indicates the adjustable cursor and a dashed
line the fixed cursor.
TDS 520 & TDS 540 User Manual
3Ć23
Page 86

Cursor Measurements
Time Units
You can choose to display vertical bar cursor results in units of time or frequency.
Press CURSOR ➞ Time Units (main) ➞ seconds or 1/seconds (Hz) (side).
Cursor Speed
You can change the cursors speed by pressing SHIFT before turning the
general purpose knob. The cursor moves faster when the SHIFT button is
lighted and the display reads
Coarse Knobs
in the upper right corner.
For More
Information
Measurements
See
Waveform Math
See
multiplied waveforms.
See the
equipped with the advanced DSP math option, for information on cursor units
with integrated, differentiated, and FFT waveforms.
TDS Family Option 2F Instruction Manual,
, on page 2-17.
, on page 3-127, for information on cursor units with
if your oscilloscope is
3Ć24
In Detail
Page 87

Delayed Triggering
The TDS 500 Series oscilloscopes provide a main time base and a delayed
time base. The delayed time base, like the main time base, requires a trigger
signal and an input source dedicated to that signal. You can only use delay
with the edge trigger and certain classes of pulse triggers.
Delayed Triggerable
After Time
There are two different ways to delay the acquisition of waveforms:
runs after main
and
delayed triggerable
. Only delayed triggerable uses the
delayed trigger system.
Delayed runs after main
looks for a main trigger, then waits a user-defined
time, and then starts acquiring (see Figure 3-8).
Wait for
Main
Trigger
Wait
User-Specified
Time
Acquire
Data
Figure 3-8: Delayed Runs After Main
Delayed triggerable
looks for a main trigger and then, depending on the type
of delayed trigger selected, makes one of the three types of delayed triggerable mode acquisitions listed below (see Figure 3-9).
Wait for
Main
Trigger
Wait
User-Specified
Time
Wait for
Delayed
Trigger
Event
delayed
Acquire
Data
Delayed Triggerable
After Events
Delayed Triggerable
After Events/Time
TDS 520 & TDS 540 User Manual
Wait the
User-Specified
Number of Delayed
Trigger Events
Wait the
User-Specified
Number of Delayed
Trigger Events
Figure 3-9: Delayed Triggerable
Wait
User-Specified
Time
3Ć25
Page 88

Delayed Triggering
H
After Time
trigger event, then acquires.
waits the user-specified time, then waits for the next delayed
After Events
H
then acquires.
After Events/Time
H
events, then waits the user-specified time, then acquires.
The digitizing oscilloscope is always acquiring samples to fill the pretrigger
part of the waveform record. When and if delay criteria are met, it takes
enough posttrigger samples to complete the delayed waveform record and
then displays it. Refer to Figure 3-10 for a more detailed look at how delayed
records are placed in time relative to the main trigger.
waits for the specified number of delayed trigger events and
waits for the specified number of delayed trigger
NOTE
When using the delayed triggerable mode, the
provides a conventional edge trigger for the delayed time
scope
base. The delayed time base will not trigger if the main trigger type
(as defined in the Main Trigger menu) is logic, if the main trigger
type is edge with its source set to auxiliary (TDS 540), or if the main
trigger type is pulse with the runt trigger class selected.
digitizing oscillo-
Operation
You use the Horizontal menu to select and define either delayed runs after
main or delayed triggerable. Delayed triggerable, however, requires further
selections in the Delayed Trigger menu.
Delayed Runs After Main
1. Press HORIZONTAL MENU ➞ Time Base (main) ➞ Delayed Only
(side) ➞ Delayed Runs After Main (side). Use the general purpose knob
or the keypad to set the delay time.
If you press Intensified (side), you display an intensified zone on the
main timebase record that shows where the delayed timebase record
occurs relative to the main trigger. For Delayed Runs After Main mode,
the start of the intensified zone corresponds to the start of the delayed
timebase record. The end of the zone corresponds to the end of the
delayed record.
To learn how to define the intensity level of the normal and intensified
waveform, see
Display Modes
on page 3-31.
3Ć26
In Detail
Page 89

Delayed Triggering
Pretrigger Record
Delayed Runs After Main
Main Trigger Point
Main
Trigger
Source
Delayed Triggerable By Events
Main Trigger Point
Main
Trigger
Source
Delayed
Trigger
Source
Delayed Triggerable By Time
Time Delay
(From Horiz Menu)
Waiting for nth Event
(Where n=5)
Posttrigger Record
Delayed Trigger Waveform Record
Start Posttrigger Acquisition
Delayed Trigger Waveform Record
Start Posttrigger
Acquisition (Trigger on nth
Delayed Trigger Event)
Main Trigger Point
Main
Trigger
Source
Delayed
Trigger
Source
Delayed Triggerable By Events/Time
Main Trigger Point
Main
Trigger
Source
Delayed
Trigger
Source
Waiting for nth Event
(Where n=4)
Time Delay
Time Delay
(From Delay Trig Menu)
(From Delay Trig Menu)
Time Delay
(From Delay Trig Menu)
Delayed Trigger Waveform Record
Start Posttrigger Acquisition
(First Trigger After Delay)
Delayed Trigger Waveform Record
Start Posttrigger Acquisition
TDS 520 & TDS 540 User Manual
Figure 3-10: How the Delayed Triggers Work
3Ć27
Page 90

Delayed Triggering
Delayed Triggerable
You must make sure that the Main Trigger menu settings are compatible with
Delayed Triggerable.
1. Press TRIGGER MENU.
2. If Type is set to Logic, press Type (main) to toggle it to either Edge or
Pulse as fits on your application. Logic type is incompatible with Delayed
Triggerable.
3. If Source is set to Auxiliary (applies to TDS 540 models only), press
Source (main). Select any source other than Auxiliary from the side
menu according to your application.
4. Press HORIZONTAL MENU ➞ Time Base (main) ➞ Delayed Only
(side) ➞ Delayed Triggerable (side).
NOTE
The Delayed Triggerable menu item is not selectable unless incompatible Main Trigger menu settings are eliminated. (See the steps at
the beginning of this procedure.) If such is the case, the Delayed
Triggerable menu item is dimmer than other items in the menu.
By pressing Intensified (side), you can display an intensified zone that
shows where the delayed timebase record
trigger event must be received) relative to the main trigger on the main
timebase. For Delayed Triggerable After mode, the start of the intensified
zone corresponds to the possible start point of the delayed timebase
record. The end of the zone continues to the end of main timebase, since
a delayed time base record may be triggered at any point after the delay
time elapses.
To learn how to define the intensity level of the normal and intensified
waveform, see
Now you need to bring up the Delayed Trigger menu so you can define
the delayed trigger event.
5. Press SHIFT DELAYED TRIG ➞ Delay by (main) ➞ Triggerable After
Time, Events, or Events/Time (side) (Figure 3-11).
6. Enter the delay time or events using the general purpose knob or the
keypad. If you selected Events/Time, use Time (side) and Events (side)
to switch between setting the time and the number of events.
Hint: You can go directly to the Delayed Trigger menu (see step 5). By
selecting one of Triggerable After Time, Events, or Events/Time, the
oscilloscope automatically switches to Delayed Triggerable in the Horizontal menu. You will still need to display the Horizontal menu if you wish
to leave Delayed Triggerable.
Display Modes
on page 3-31.
may
occur (a valid delay
3Ć28
In Detail
Page 91

Delayed Triggering
The Source menu lets you select which input will be the delayed trigger
source.
7. Press Source (main) ➞ Ch1, Ch2, Ch3 (Ax1 on the TDS 520), Ch4 (Ax2
on the TDS 520), or Auxiliary (TDS 540 only) (side).
Figure 3-11: Delayed Trigger Menu
8. Press Coupling (main) ➞ DC, AC, HF Rej, LF Rej, or Noise Rej (side)
to define how the input signal will be coupled to the delayed trigger. For
descriptions of these coupling types, see
Triggering
on page 2-2.
9. Press Slope (main) to select the slope that the delayed trigger will occur
on. Choose between the rising edge and falling edge slopes.
When using Delayed Triggerable mode to acquire waveforms, two trigger
bars are displayed. One trigger bar indicates the level set by the main
trigger system; the other indicates the level set by the delayed trigger
system.
10. Press Level (main) ➞ Level, Set to TTL, Set to ECL, or Set to 50%
(side).
H
Level lets you enter the delayed trigger level using the general purpose knob or the keypad.
H
Set to TTL fixes the trigger level at +1.4 V.
H
Set to ECL fixes the trigger level at –1.3 V.
TDS 520 & TDS 540 User Manual
3Ć29
Page 92

Delayed Triggering
NOTE
When you set the Vertical SCALE smaller than 200 mV, the oscilloscope reduces the Set to TTL or Set to ECL trigger levels below
standard TTL and ECL levels. That happens because the trigger
level range is fixed at
next smaller setting after 200 mV) the trigger range is
is smaller than the typical TTL (+1.4 V) or ECL (–1.3 V) level.
H
Set to 50% fixes the delayed trigger level to 50% of the peak-to-peak
value of the delayed trigger source signal.
center. At 100 mV (the
V which
For More
Information
Triggering
See
Triggering
See
, on page 2-2.
, on page 3-120.
3Ć30
In Detail
Page 93

Display Modes
The digitizing oscilloscope can display waveform records in different ways.
The Display menu lets you adjust the oscilloscope display style, intensity
level, graticule, and format.
Operation
Press DISPLAY to show the Display menu.
TDS 520 & TDS 540 User Manual
Figure 3-12: Display Menu—Style
Display Style
Press DISPLAY ➞ Style (main) ➞ Vectors, Intensified Samples, Dots,
Infinite Persistence, or Variable Persistence (side) (Figure 3-12).
H
Vectors has the display draw vectors (lines) between the record points.
H
Dots display waveform record points as dots.
H
Intensified Samples also displays waveform record points as dots.
However, the points actually sampled are displayed intensified relative to
the interpolated points. (The contrast between real and interpolated points
is set to a fixed value.)
3Ć31
Page 94

Display Modes
In addition to choosing Intensified Samples in the side menu, the oscilloscope
must be interpolating (equivalent time must be off) or Zoom must be on with
its horizontal expansion greater that 1X. See interpolation on page 2-9; see
Zoom beginning on page 3-130.
H
Variable Persistence lets the record points accumulate on screen over
many acquisitions and remain displayed only for a specific time interval.
In that mode, the display behaves like that of an analog oscilloscope. You
enter the time for that option with the keypad or the general purpose
knob.
H
Infinite Persistence lets
some control (such as scale factor) causing the display to be erased.
the record points accumulate until you change
Intensity
Intensity lets you set overall, text/graticule, and waveform intensity (brightness) levels. To set the contrast intensity of the delay portion of a waveform:
Press DISPLAY ➞ Intensity (main) ➞ Overall, Text/Grat, Waveform, or
Contrast (side). Enter the intensity percentage values with the keypad or the
general purpose knob.
All intensity adjustments operate over a range from 20% (close to fully off) to
100% (fully bright).
Contrast operates over a range from 100% (no contrast) to 250% (intensified
portion at full brightness).
NOTE
The Intensified setting for Timebase in the horizontal menu causes
a zone on the waveform to be intensified relative to the rest of the
waveform. If the contrast is set to 100%, you won’t be able to
distinguish the intensified portion from the rest of the waveform
because both are the same brightness.
3Ć32
Display Readout
Readout options control whether the trigger indicator, trigger level bar, and
current date and time appear on the display. The options also control what
style trigger level bar, long or short, is displayed.
1. Press DISPLAY ➞ Readout (main).
2. Toggle Display ‘T’ @ Trigger Point (side) to select whether or not to
display ‘T’ indicating the trigger point. You can select ON or OFF. (The
trigger point indicates the position of the trigger in the waveform record.)
In Detail
Page 95

Display Modes
3. Toggle Trigger Bar Style (side) to select either the short or the long
trigger bar or to turn the trigger bar off. (See Figure 3-13. Note that both
styles are shown for illustrating purposes, but you can only display one
style at a time.)
The trigger bar is only displayed if the trigger source is an active, displayed waveform. Also, two trigger bars are displayed when delay triggerable acquisitions are displayed—one for the main and one for the delayed
timebase. The trigger bar is a visual indicator of the trigger level.
Sometimes, especially when using the hardcopy feature, you may wish to
display the current date and time on screen. For more information about
displaying and setting date and time, see
Hardcopy
on page 3-43.)
Date/Time Stamping Y our
4. Press Display Date/Time (side) to turn it on or off. Push Clear Menu to
see the current date and time. (Note that if the date and time have not
been set since the oscilloscope was last powered on, a message will be
displayed with instructions for setting date and time.)
Trigger Point Indicator
Trigger Bar—Long Style
–or–
Trigger Bar—Short
Style
Figure 3-13: Trigger Point and Level Indicators
Filter Type
The display filter types are sin(x)/x interpolation and linear interpolation. For
more information see the
Concepts
section, page 2-9.
TDS 520 & TDS 540 User Manual
Press DISPLAY ➞ Filter (main) ➞ Sin(x)/x Interpolation or Linear Interpolation (side).
3Ć33
Page 96

Display Modes
NOTE
When the horizontal scale is set to rates faster than 50 ns/div, or
when using the ZOOM feature to expand waveforms horizontally,
interpolation occurs. (The filter type, linear or sin(x)/(x), depends on
which is set in the Display menu.) Otherwise, interpolation is not
needed. See
Concepts
for a discussion of sampling including interpolation
Sampling and Digitizing
on page 2-7 in the section
.
Graticule Type
To change the graticule:
Press DISPLAY ➞ Graticule (main) ➞ Full, Grid, Cross Hair, or Frame
(side).
H
Full provides a grid, cross hairs and a frame.
H
Grid displays a frame and a grid.
H
Cross Hair provides cross hairs and a frame.
H
Frame displays just a frame.
Format
There are two kinds of format: YT and XY.
YT is the conventional oscilloscope display format. It shows a signal voltage
(the vertical axis) as it varies over time (the horizontal axis).
XY format compares the voltage levels of two waveform records point by
point. That is, the digitizing oscilloscope displays a graph of the voltage of one
waveform record against the voltage of another waveform record. This mode
is particularly useful for studying phase relationships.
To set the display axis format:
Press DISPLAY ➞ Format (main) ➞ XY or YT (side).
When you choose the XY mode, the input you have selected is assigned to
the X-axis and the digitizing oscilloscope automatically chooses the Y-axis
input (see Table 3-3).
3Ć34
In Detail
Page 97

Table 3-3: XY Format Pairs
Display Modes
X-Axis Channel
(User Selectable)
Ch 1 Ch 2
Ch 3 (TDS 540)
(Aux 1 on the TDS 520)
Ref 1 Ref 2
Ref 3 Ref 4
For example, if you press the CH 1 button, the digitizing oscilloscope will
display a graph of the channel 1 voltage levels on the X-axis against the
channel 2 voltage levels on the Y-axis. That will occur whether or not you are
displaying the channel 2 waveform in YT format. If you later press the WAVE-
FORM OFF button for either channel 1 or 2, the digitizing oscilloscope will
delete the XY graph of channel 1 versus channel 2.
Since selecting YT or XY affects only the display, the horizontal and vertical
scale and position knobs and menus control the same parameters regardless
of the mode selected. Specifically, in XY mode, the horizontal scale will
continue to control the time base and the horizontal position will continue to
control which portion of the waveforms are displayed.
XY format is a dot-only display, although it can have persistence. The Vector
style selection has no effect when you select XY format.
Y-Axis Channel
(Fixed)
Ch 4 (TDS 540)
(Aux 2 on the TDS 520)
For More
Information
You cannot display Math waveforms in XY format. They will disappear from
the display when you select XY.
Acquisition
See
on page 2-7.
TDS 520 & TDS 540 User Manual
3Ć35
Page 98

Edge Triggering
An
edge trigger
specified voltage level in a specified direction (the trigger slope). You will likely
use edge triggering for most of your measurements.
You can select the edge source, coupling, slope, level, and mode (auto or
normal).
event occurs when the trigger source passes through a
Edge Trigger
Readouts
Operation
The Trigger readout shows some key trigger parameters (Figure 3-14).
Main Time Base Time/Div
Main Time Base
Figure 3-14: Edge Trigger Readouts
The Edge Trigger menu lets you select the source, coupling, slope, trigger
level, mode, and holdoff.
Main Trigger
Source = Ch 1
Main Trigger
Slope = Rising Edge
Main Trigger
Level
3Ć36
To bring up the Edge Trigger menu:
Press TRIGGER MENU ➞ Type (main) ➞ Edge (pop-up) (see Figure 3-15).
Source
To select which source you want for the trigger:
Press TRIGGER MENU ➞ Type (main) ➞ Edge (pop-up) ➞
Source (main) ➞ Ch1, Ch2, Ch3 (Ax1 on the TDS 520), Ch4 (Ax2 on the
TDS 520), AC Line, or Auxiliary (side).
In Detail
Page 99

Edge Triggering
Figure 3-15: Main Trigger Menu—Edge Type
Coupling
To select the coupling you want:
Press TRIGGER MENU ➞ Type (main) ➞ Edge (pop-up) ➞ Cou-
pling (main) ➞ DC, AC, HF Rej, LF Rej, or Noise Rej (side).
H
H
H
H
H
passes all of the input signal. In other words, it passes both AC and
DC
DC components to the trigger circuit.
passes only the alternating components of an input signal (above
AC
30 Hz). It removes the DC component from the trigger signal.
HF Rej removes the high frequency portion of the triggering signal. That
allows only the low frequency components to pass on to the triggering
system to start an acquisition. High frequency rejection attenuates signals
above 30 kHz.
LF Rej does the opposite of high frequency rejection. Low frequency
rejection attenuates signals below 80 kHz.
Noise Rej provides lower sensitivity. It requires additional signal amplitude for stable triggering, reducing the chance of falsely triggering on
noise.
TDS 520 & TDS 540 User Manual
3Ć37
Page 100

Edge Triggering
Slope
To select the slope that the edge trigger will occur on:
1. Press the TRIGGER MENU ➞ Type (main) ➞ Edge (pop-up) ➞
Slope (main) to select the slope that the edge trigger will have.
2. Alternatives for slope are the rising and falling edges.
Level
Press the TRIGGER MENU ➞ Type (main) ➞ Edge (pop-up) ➞
Level (main) ➞ Level, Set to TTL, Set to ECL, or Set to 50% (side).
H
Level lets you enter the trigger level using the general purpose knob or
the keypad.
H
Set to TTL fixes the trigger level at +1.4 V.
H
Set to ECL fixes the trigger level at –1.3 V.
NOTE
When you set the volts/div smaller than 200 mV, the oscilloscope
reduces the Set to TTL or Set to ECL trigger levels below standard
TTL and ECL levels. That happens because the trigger level range
is fixed at
er setting after 200 mV) the trigger range is
than the typical TTL (+1.4 V) or ECL (–1.3 V) level.
H
Set to 50% fixes the trigger level to approximately 50% of the peak-topeak value of the trigger source signal.
center. At 100 mV (the next small-
V, which is smaller
3Ć38
In Detail
 Loading...