

Tektronix Sentry, Sentry Assure, Sentry Verify 10G, Sentry ABR, Sentry Edge I User Manual
...Page 1

xx
Sentry Series
ZZZ
Video Quality Monitors
User Manual
*P077320202*
077-3202-02
Page 2

Page 3
Sentry Series Video Quality Monitor
User Manual
Supports software version 10.0
Page 4

Sentry User Manual
Sentry User Manual
March 2017
Page 5

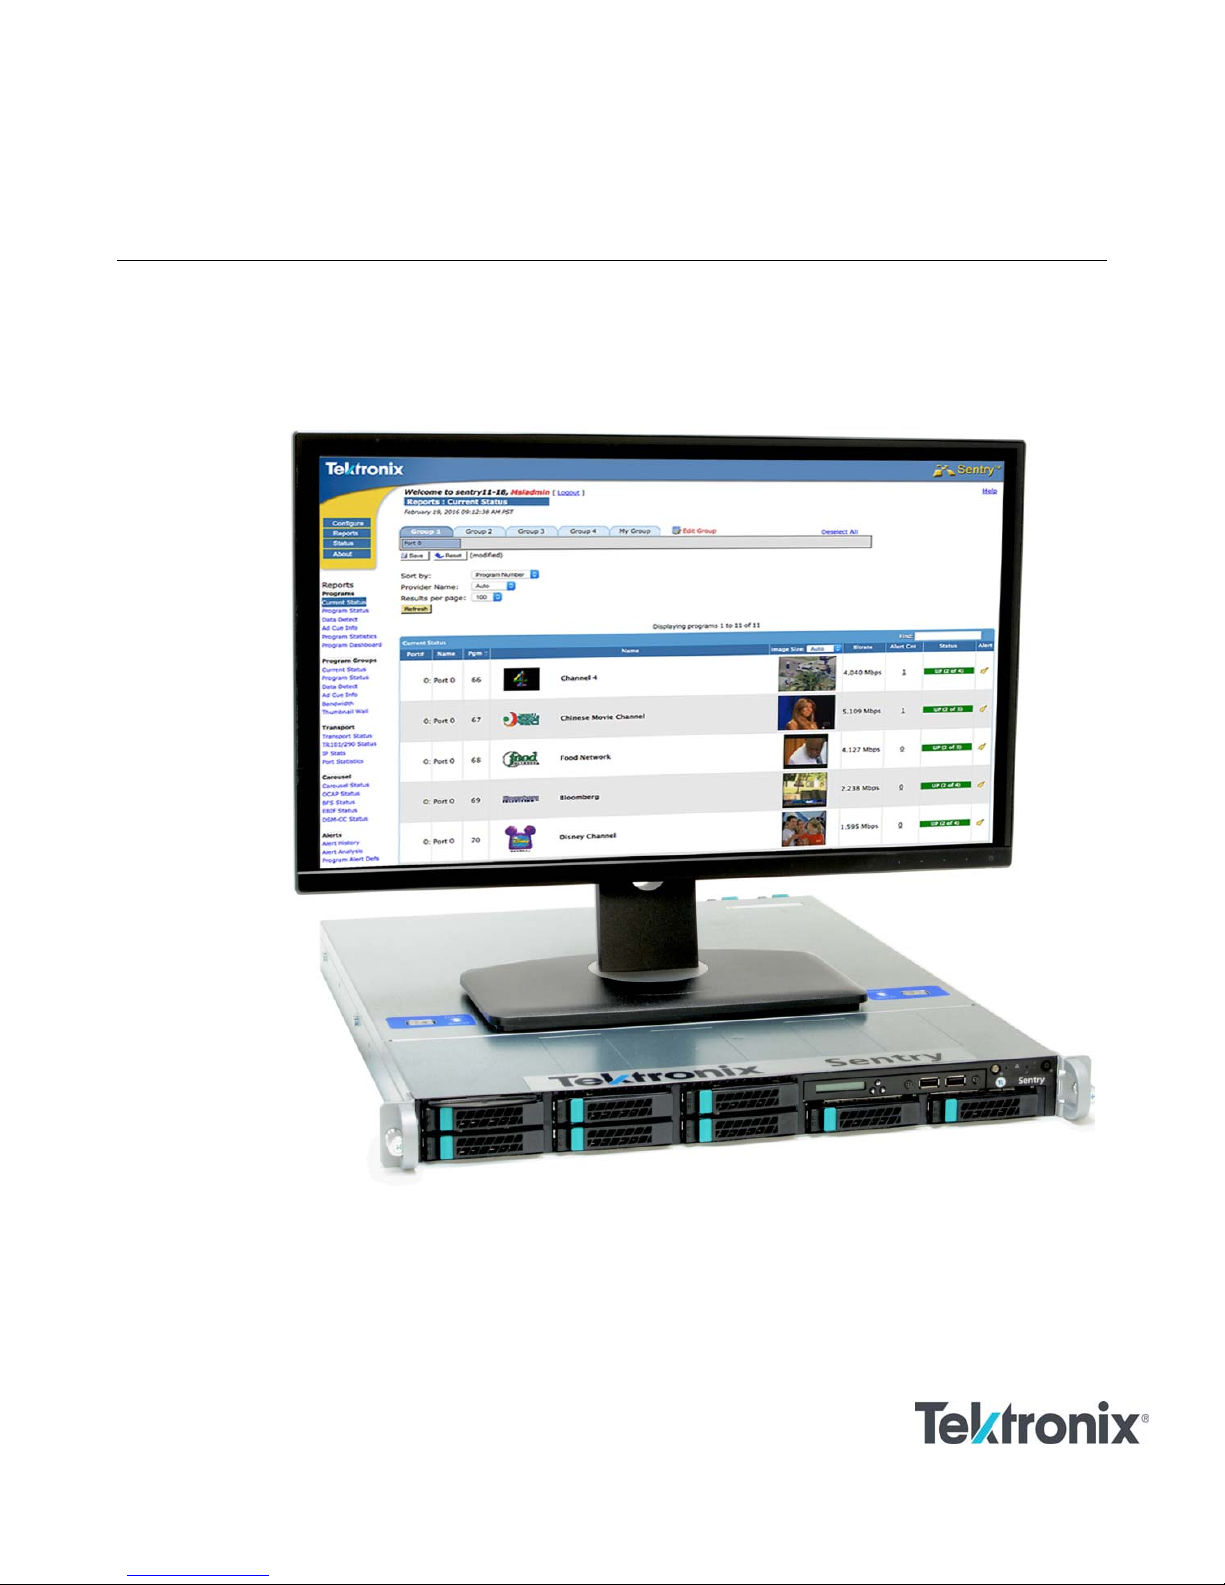
SENTRY SERIES VIDEO QUALITY MONITOR
User Manual: Cable Operations
© 2004-2017 Tektronix, Inc.
All rights reserved.
Printed in U.S.A.
Tektronix, Inc.
14150 SW Karl Braun Drive
P.O. Box 500
Beaverton, OR 97077
USA
Federal copyright law protects this publication. No part of this publication may be copied or distributed, transmitted,
transcribed, stored in a retrieval system, or translated into any human or computer language in any form or by any means
(electronic, mechanical, magnetic, manual, or otherwise); or disclosed to third parties without the express written
permission of Tektronix, Inc.
Tektronix makes no representation or warranties with respect to the contents hereof and specifically disclaims any
warranties, merchantability, or fitness for any particular purpose. Furthermore, Tektronix reserves the right to revise this
publication and to make changes from time to time in the contents hereof without obligat i on o f Te kt r onix to notify any
person of such revisions or changes.
Sentry User Manual 1
March 2017
Page 6

Sentry User Manual
Trademarks
Tektronix, the Tektronix logo, and Sentry are trademarks of Tektronix, Inc.
Contacting Tektronix
Tektronix, Inc.
14150 SW Karl Braun Drive
P.O. Box 500
Beaverton, OR 97077
USA
For technical support:
Sentry Technical support is available on Business Days from 6:00 AM to 5:00 PM Pacific Time and 9:00 AM
to 5:00 PM Indian Standard Time on the following numbers:
US/Canada toll-free 1-844-219-5329
India toll-free 1800-3000 4835
Russia toll-free 810800-22554411
United Kingdom 44 1344 39 2541
Europe* toll-free 00800-22554411
*Austria, Belgium, France, Germany, Ireland, Italy, Netherlands, Spain, Sweden, Switzerland, UK
Worldwide, please email videosupport@tektronix.com
About This Document
Audience
This user manual is intended for service providers who use Tektronix Sentry, Sentry Verify, Sentry Assure or
Sentry ABR for monitoring, historical reporting, and alerting from MPEG-2, H.264 AVC, MPEG-4 part 10,
and VC-1 transport streams. We assume that you understand the concepts and tools used in a head-end
environment. We assume that you are familiar with basic computer operations such as click, drag and drop, and
that you are also familiar with the operation of an internet browser.
Purpose
The Tektronix Sentry Series User Manual introduces you to the Sentry, Sentry Verify, Sentry Assure and
Sentry ABR Video Quality Monitors, and describes in detail Sentry's features.
This user manual shows you how to configure, control and use Sentry, Sentry Verify, Sentry Assure and Sentry
ABR. Please note that some of the features and applications described in this manual may not apply to all
products. Refer to the Sentry Family Product Matrix for more information.
Screen Shot Note
While all screen shots in this document are accurate and truthful representations of the product, some may have
been edited to remove information that could pose a security risk.
Sentry User Manual
March 2017
Page 7

Sentry User Manual
Table of Contents
Sentry Family Product Matrix .......................................................................................................................................... 11
Preface ................................................................................................................................................................................. 13
Who Should Use This Manual ........................................................................................................................................... 13
How to Get Help ................................................................................................................................................................ 13
Introduction ........................................................................................................................................................................ 15
What is Tektronix Sentry? ................................................................................................................................................. 15
The Engine ..................................................................................................................................................................... 15
Internal database ......................................................................................................................................................... 15
What does Tektronix Sentry do? ........................................................................................................................................ 17
Monitoring ..................................................................................................................................................................... 17
Reporting ....................................................................................................................................................................... 17
Alerting .......................................................................................................................................................................... 18
Getting Started ................................................................................................................................................................... 19
Front Panel Functions (2016 to present models only) ...................................................................................................... 19
IP address on the front panel .......................................................................................................................................... 19
Navigation buttons ......................................................................................................................................................... 20
USB ports ....................................................................................................................................................................... 20
Status LEDs ................................................................................................................................................................... 20
Power-off procedure ...................................................................................................................................................... 21
Front Panel Functions (2009 to 2016 models only) .......................................................................................................... 21
IP address on the front panel .......................................................................................................................................... 22
Manual power down from front panel............................................................................................................................ 22
LED Brightness .............................................................................................................................................................. 22
Interface Components ....................................................................................................................................................... 23
Main Page Menu ............................................................................................................................................................ 23
Login Info ...................................................................................................................................................................... 23
Page Title Bar ................................................................................................................................................................ 24
Thumbnails .................................................................................................................................................................... 24
Group Tabs and Input Ports ........................................................................................................................................... 24
Change a Port Assignment ............................................................................................................................................. 26
ASI Port tab ................................................................................................................................................................ 26
Basic Operations ............................................................................................................................................................... 27
Bitrate Violation ................................................................................................................................................................ 28
Reports ................................................................................................................................................................................ 29
Programs ........................................................................................................................................................................... 30
Current Status ................................................................................................................................................................. 30
To Filter the Ports on the Report .................................................................................................................................... 32
Filter Sentrys licensed with VLAN support ................................................................................................................ 33
Program Status ............................................................................................................................................................... 34
Sentry User Manual
March 2017
3
Page 8

Sentry User Manual
ASI Models ................................................................................................................................................................. 37
Program Search and display ........................................................................................................................................ 38
Column Sort By arrows .............................................................................................................................................. 39
Bell Icon for Alert creation ......................................................................................................................................... 39
Configure Report History ........................................................................................................................................... 40
Configure Provider Name ........................................................................................................................................... 42
Other Configurable Items ........................................................................................................................................... 43
Program Bandwidth Graph ............................................................................................................................................... 44
Program Details Screen .................................................................................................................................................. 44
Access Program Details .............................................................................................................................................. 44
Color Key .................................................................................................................................................................... 45
Error Seconds .............................................................................................................................................................. 46
PID Type descriptor .................................................................................................................................................... 46
Refresh Thumbnail ..................................................................................................................................................... 47
Capture button ............................................................................................................................................................ 47
Stream button .............................................................................................................................................................. 47
Detailed Graph View .................................................................................................................................................. 50
Other Program information ......................................................................................................................................... 51
Quality of Experience Details ..................................................................................................................................... 52
Access the QoE Details ............................................................................................................................................... 52
Average Video QoE from the Program Status Page ................................................................................................... 53
Scoring QoE ................................................................................................................................................................ 54
Reason Codes Definitions ........................................................................................................................................... 56
Perceptual Video Quality (eMOS) ................................................................................................................................. 57
Over-compression Artifacts ........................................................................................................................................... 58
Group of Pictures (GOP) Length Reporting (Group of Pictures) ............................................................................... 59
Audio Volume Level Details ......................................................................................................................................... 60
Functionality ............................................................................................................................................................... 60
Access Audio Level Details ........................................................................................................................................ 60
Graphing ..................................................................................................................................................................... 61
Thumbnail Timeline ....................................................................................................................................................... 62
Discontinuity Details...................................................................................................................................................... 63
Alert Details ................................................................................................................................................................... 64
PCR Details .................................................................................................................................................................... 65
Data Detect ....................................................................................................................................................................... 67
Report Types .................................................................................................................................................................. 67
Copy Generation Management System (CGMS) ........................................................................................................ 67
Closed Caption Data ................................................................................................................................................... 68
Other Data ................................................................................................................................................................... 69
Generate a Report .......................................................................................................................................................... 70
Ad Cue Info (Digital Ad Insertion) .................................................................................................................................... 72
Access Ad Cue Info ....................................................................................................................................................... 72
Reading the Ad Cue Info report ..................................................................................................................................... 74
Ad Splice Command Types ........................................................................................................................................ 77
Drill down/Zoom In .................................................................................................................................................... 78
Blackout Detection ..................................................................................................................................................... 78
Repeated commands ................................................................................................................................................... 79
Audio Level Graph ..................................................................................................................................................... 79
Program Statistics (Report and Export) ............................................................................................................................ 80
Access Program Statistics: .......................................................................................................................................... 80
Tab View ........................................................................................................................................................................ 80
Sentry User Manual
March 2017
Page 9

Sentry User Manual
Create a Program Statistics Report ............................................................................................................................. 81
History tab .................................................................................................................................................................. 84
Port Statistics .................................................................................................................................................................... 85
Summary tab .................................................................................................................................................................. 85
Create a Port Statistics Report ........................................................................................................................................ 86
Program Groups ............................................................................................................................................................... 88
Using Program Groups ................................................................................................................................................... 88
Program Groups Bandwidth ........................................................................................................................................... 90
Access Program Groups Bandwidth ........................................................................................................................... 91
Dynamic Program Groups ............................................................................................................................................. 93
Thumbnail Wall View ........................................................................................................................................................ 97
Transport ........................................................................................................................................................................... 98
Transport Status ............................................................................................................................................................. 98
Transport Bitrate History .......................................................................................................................................... 100
PSIP .......................................................................................................................................................................... 102
TR101/290 Status ......................................................................................................................................................... 105
Access TR101/290 Status ......................................................................................................................................... 105
Show TR101/290 Priorities ....................................................................................................................................... 107
IP Stats ......................................................................................................................................................................... 108
Functionality ............................................................................................................................................................. 108
The Leaky Bucket Buffer Analogy ........................................................................................................................... 108
Access IP Stats .......................................................................................................................................................... 110
IP Stats Welcome Page ............................................................................................................................................. 111
Graphing Ports .......................................................................................................................................................... 112
Zoom in on a Graph .................................................................................................................................................. 113
Create IP Stats Alerts for Arrival Interval................................................................................................................. 113
Create Alerts for Delay Factor .................................................................................................................................. 116
IP Stats Monitoring Notes ......................................................................................................................................... 116
Port Failover History ...................................................................................................................................................... 117
Carousel Status ............................................................................................................................................................... 118
OCAP Carousel ............................................................................................................................................................ 118
Access OCAP Carousel ............................................................................................................................................ 119
OCAP Summary tab ................................................................................................................................................. 120
OCAP Files tab ......................................................................................................................................................... 121
Files tab ..................................................................................................................................................................... 123
Applications tab ........................................................................................................................................................ 126
Events tab .................................................................................................................................................................. 127
Set Alerts in OCAP Status ........................................................................................................................................ 129
Review OCAP Alerts in Alert History ...................................................................................................................... 131
BFS Status .................................................................................................................................................................... 133
Monitoring the S-A Broadcast File System (BFS) ................................................................................................... 133
BFS Overview .............................................................................................................................................................. 133
BFS Mapping ............................................................................................................................................................ 133
Access BFS Status .................................................................................................................................................... 135
Summary tab ............................................................................................................................................................. 136
Detail tab ................................................................................................................................................................... 137
Drill Down to BFS Detail View ................................................................................................................................ 139
EBIF Status .................................................................................................................................................................. 141
Access EBIF Status ................................................................................................................................................... 141
Summary tab ............................................................................................................................................................. 141
Sentry User Manual
March 2017
5
Page 10

Sentry User Manual
Detail tab ................................................................................................................................................................... 142
Viewing Program Detail from EBIF Status .............................................................................................................. 143
Applications tab ........................................................................................................................................................ 145
Events tab .................................................................................................................................................................. 147
Alerts ............................................................................................................................................................................... 148
Alert History ................................................................................................................................................................ 148
Report Export ............................................................................................................................................................ 150
Alert Analysis .............................................................................................................................................................. 153
Access Alerts Analysis ............................................................................................................................................. 153
Alert Analysis Summary Screen ............................................................................................................................... 154
Report Navigation tabs and New Report icons ......................................................................................................... 155
Counts tab ................................................................................................................................................................. 155
Trends tab ................................................................................................................................................................. 159
Trend Details tab ....................................................................................................................................................... 160
Distributions tab ........................................................................................................................................................ 162
History tab ................................................................................................................................................................ 163
Program Alert Definitions Report ................................................................................................................................ 164
Create/Edit tab .......................................................................................................................................................... 165
History tab ................................................................................................................................................................ 168
Configure........................................................................................................................................................................... 170
Configure Alerts .............................................................................................................................................................. 171
How Sentry Handles Alerts .......................................................................................................................................... 171
Create an Alert ............................................................................................................................................................. 172
Create Alerts Step by Step ........................................................................................................................................ 175
View Created Alerts .................................................................................................................................................. 179
Delete Alert ............................................................................................................................................................... 179
Modify an Alert ........................................................................................................................................................ 179
Access Alerts Summary ............................................................................................................................................... 180
Scrambled Alerts .......................................................................................................................................................... 182
Transport tab ................................................................................................................................................................ 184
Types of Transport Alerts ......................................................................................................................................... 185
PID Alerts ................................................................................................................................................................. 187
Any PID on a Port ..................................................................................................................................................... 187
Table on a Port .......................................................................................................................................................... 188
Table on a PID .......................................................................................................................................................... 188
PMT .......................................................................................................................................................................... 188
DSM-CC on a Port .................................................................................................................................................... 188
DSM-CC ................................................................................................................................................................... 190
Port Alerts ................................................................................................................................................................. 190
Sample Transport Alerts .............................................................................................................................................. 191
Create Audio Level Alerts ........................................................................................................................................ 191
Create a Transport NULL PID Bitrate Alert ................................................................................................................ 195
Create Mean Audio Level Alerts ................................................................................................................................. 196
Create Audio Dialnorm Alert ....................................................................................................................................... 197
Buffer overrun/underrun detection ............................................................................................................................... 198
Configure Buffer overrun/underrun detection .......................................................................................................... 199
BFS tab ..................................................................................................................................................................... 201
Types of BFS Alerts ..................................................................................................................................................... 202
BFS Source ............................................................................................................................................................... 202
BFS Carousel ............................................................................................................................................................ 202
BFS File .................................................................................................................................................................... 202
Sentry User Manual
March 2017
Page 11

Sentry User Manual
Types of OCAP Alerts ................................................................................................................................................. 203
File Alerts ................................................................................................................................................................. 203
Folder Alerts ............................................................................................................................................................. 203
Extension Alerts ........................................................................................................................................................ 203
Configure Program Availability Definitions ................................................................................................................ 204
Create Program Template Alerts .................................................................................................................................. 207
Template Alerts ............................................................................................................................................................ 207
Create an alert from a Template using a Program Alert ............................................................................................... 212
Create an alert template without a Program Group ...................................................................................................... 215
Program Groups ............................................................................................................................................................. 217
Create Program Groups ................................................................................................................................................ 217
Access Program Groups ............................................................................................................................................ 217
Groups Summary tab ................................................................................................................................................ 218
Add unlisted programs .............................................................................................................................................. 221
Configure Program Mappings ........................................................................................................................................ 223
Add a New Mapping .................................................................................................................................................... 223
Delete a Mapping ......................................................................................................................................................... 226
Modify a Mapping ....................................................................................................................................................... 226
Configure Port Names ..................................................................................................................................................... 227
Configure BFS Settings ................................................................................................................................................... 228
Configure Triggered Stream Captures ............................................................................................................................ 229
Access Alert Stream Captures .................................................................................................................................. 229
Create Alert Stream Captures (When none currently exist) ...................................................................................... 230
Deactivate or Delete a Stream Capture (when one previously exists) ...................................................................... 237
Retrieve Captured Files ............................................................................................................................................ 238
Delete Captured Files ................................................................................................................................................ 238
Defaults tab ............................................................................................................................................................... 239
Configure Triggered Stream Captures(via Nexidia Comply™) ...................................................................................... 240
Configure the Nexidia Server....................................................................................................................................... 240
Create a Nexidia Comply Profile .............................................................................................................................. 241
Create Caption Profile .................................................................................................................................................. 242
Choose a Program to Verify ......................................................................................................................................... 242
Review Job History ...................................................................................................................................................... 244
Review Closed Caption Verification Results ............................................................................................................... 246
Configure Schedules ........................................................................................................................................................ 249
Create a Daily schedule ................................................................................................................................................ 249
Create a Weekly Schedule ........................................................................................................................................... 252
Dashboard Graphs .......................................................................................................................................................... 254
Create a Dashboard Graph ........................................................................................................................................... 255
Configure MPEG Input Settings...................................................................................................................................... 256
IGMP v3 SSM Support ................................................................................................................................................ 256
Access MPEG Input System Settings ....................................................................................................................... 256
Set SSM ....................................................................................................................................................................... 258
Backup Multicast Settings ........................................................................................................................................... 259
Multicast Stream Collision Errors (Multiple Sources Detected on Input Ports) ....................................................... 261
Sentry with 2nd MPEG Input Option Installed ............................................................................................................. 262
Sentry with VLAN Support Enabled ........................................................................................................................... 263
Configure VLAN monitoring option ........................................................................................................................ 263
Sentry User Manual
March 2017
7
Page 12

Sentry User Manual
Assign/Configure Ports on a VLAN ......................................................................................................................... 265
Move a Port between VLANs ................................................................................................................................... 265
Reviewing Port/VLAN Assignments and VLAN Status .......................................................................................... 266
Configure System Preferences ........................................................................................................................................ 267
Configure TR101/290 Settings ........................................................................................................................................ 269
Configure System Settings ............................................................................................................................................... 270
Network settings .......................................................................................................................................................... 271
Set the Time ................................................................................................................................................................. 272
Set the Locale ............................................................................................................................................................... 273
Maintenance Mode ....................................................................................................................................................... 274
SSL Settings ..................................................................................................................................................................... 275
System Diagnostics .......................................................................................................................................................... 277
Email Diagnostics ........................................................................................................................................................ 277
Network connectivity ................................................................................................................................................... 277
System Communication ............................................................................................................................................... 278
SNMP Trap .................................................................................................................................................................. 278
Health Check ................................................................................................................................................................ 279
Configure Import/Export Settings ................................................................................................................................... 280
Export tab options ........................................................................................................................................................ 282
Import tab options ........................................................................................................................................................ 284
Configure Users .............................................................................................................................................................. 285
API Access ................................................................................................................................................................... 285
Add a User ................................................................................................................................................................... 285
Delete a User ................................................................................................................................................................ 287
Modify a User .............................................................................................................................................................. 288
Configure System Upgrades ............................................................................................................................................ 289
Upgrade Procedure ....................................................................................................................................................... 289
Upgrade Errors ............................................................................................................................................................. 292
Recoverable error ...................................................................................................................................................... 292
Error Requiring a Patch ............................................................................................................................................ 292
Uploading the Error Patch File .................................................................................................................................... 293
Upgrade History ........................................................................................................................................................... 293
Configure Power Off and Restart Capability .................................................................................................................. 294
Accessing Remote Restart and Power Off ................................................................................................................... 294
Power Off a unit: .......................................................................................................................................................... 294
Restart a unit ................................................................................................................................................................ 295
Status ................................................................................................................................................................................. 297
ASI Status page ............................................................................................................................................................ 298
System Status for Sentry with Second MPEG Input Option I nstalled ......................................................................... 298
About ................................................................................................................................................................................. 299
Appendix A: Sentry ABR ............................................................................................................................................... 301
Configure: Alerts Summary ............................................................................................................................................ 301
Manifest Alerts ............................................................................................................................................................. 301
Create a Manifest Alert ................................................................................................................................................ 302
Sentry User Manual
March 2017
Page 13

Sentry User Manual
Representation Alerts ...................................................................................................................................................... 304
Representation Alerts Definitions ................................................................................................................................ 304
Create Representation Alerts........................................................................................................................................ 305
Dynamic Program Groups .............................................................................................................................................. 307
Creating a Static Program Group from Dynamic ......................................................................................................... 309
Configure MPEG Input Settings...................................................................................................................................... 310
Administrator Set up Notes .......................................................................................................................................... 310
Reports ............................................................................................................................................................................ 312
Program Statistics: ABR Stats ..................................................................................................................................... 312
Create/Edit tab .......................................................................................................................................................... 312
History tab .................................................................................................................................................................... 314
Port Statistics .................................................................................................................................................................. 315
Summary tab ................................................................................................................................................................ 315
Create a Port Statistics Report ...................................................................................................................................... 316
Media Set Status Report .................................................................................................................................................. 319
Media Set Details ......................................................................................................................................................... 321
HTTP Status Codes ................................................................................................................................................... 321
Representations Statistics.......................................................................................................................................... 321
Fragment Load Headroom ........................................................................................................................................ 322
Fragment Load Time ................................................................................................................................................ 323
Fragment Load Latency ............................................................................................................................................ 323
Fragment Load Bitrate .............................................................................................................................................. 324
Fragment Size ........................................................................................................................................................... 324
System Status ................................................................................................................................................................... 325
Appendix B: Sentry Edge, Edge II, Edge III-S, and Edge III-T ................................................................................. 327
Preface ............................................................................................................................................................................ 327
Getting
started
................................................................................................................................................................ 328
Product description ...................................................................................................................................................... 328
Sentry Edge RF Monitoring Products ....................................................................................................................... 330
Sentry Edge Family Features and benefits ................................................................................................................ 330
Sentry Applications ................................................................................................................................................... 330
Sentry Edge I Features and benefits .......................................................................................................................... 330
Sentry Edge II Features and benefits ........................................................................................................................ 331
Sentry Edge III-S Features and Benefits ................................................................................................................... 331
Sentry Edge III-T Features and Benefits ................................................................................................................... 331
Standard and optional
accessories
.......................................................................................................................... 332
Power cord options ................................................................................................................................................... 332
Configuration ............................................................................................................................................................... 333
Recommended steps ................................................................................................................................................. 333
Configure the RF Stats Alerts ...................................................................................................................................... 334
Configure the MPEG settings ...................................................................................................................................... 335
Activate an RF input connection ............................................................................................................................... 336
To define/edit import settings for an RF configuration. ............................................................................................ 336
Filter
options
................................................................................................................................................................ 338
Update the schedule/import schedule information .................................................................................................... 339
Import a configuration from a CSV file .................................................................................................................... 340
To sc hedule an import ............................................................................................................................................... 341
View/edit RF configuration details ........................................................................................................................... 342
Sentry User Manual
March 2017
9
Page 14

Sentry User Manual
Change t he schedule .................................................................................................................................................. 342
Configure port names for a channel .......................................................................................................................... 343
Configure
schedule summary
.................................................................................................................................... 344
Create a new schedule. .............................................................................................................................................. 345
Operating basics ............................................................................................................................................................. 347
Reports ......................................................................................................................................................................... 347
Current Status report ................................................................................................................................................. 347
Port / channel numbers ............................................................................................................................................. 347
Program Detail report : Tuning information ............................................................................................................. 348
Program graph options .............................................................................................................................................. 349
RF Stats ........................................................................................................................................................................ 350
Constellation Diagram .............................................................................................................................................. 351
Frequency Domain Graphs .......................................................................................................................................... 353
Status ............................................................................................................................................................................ 356
Park a tuner for a set amount of time ....................................................................................................................... 357
To park a
tuner
(alternate
method)
.......................................................................................................................... 359
To park a tuner for a set amount of time: ................................................................................................................. 360
Appendix C: Acronyms .................................................................................................................................................... 361
Appendix D: Examples .................................................................................................................................................... 363
Notices ............................................................................................................................................................................... 367
Trademarks ..................................................................................................................................................................... 367
Sentry User Manual
March 2017
Page 15
Sentry User Manual
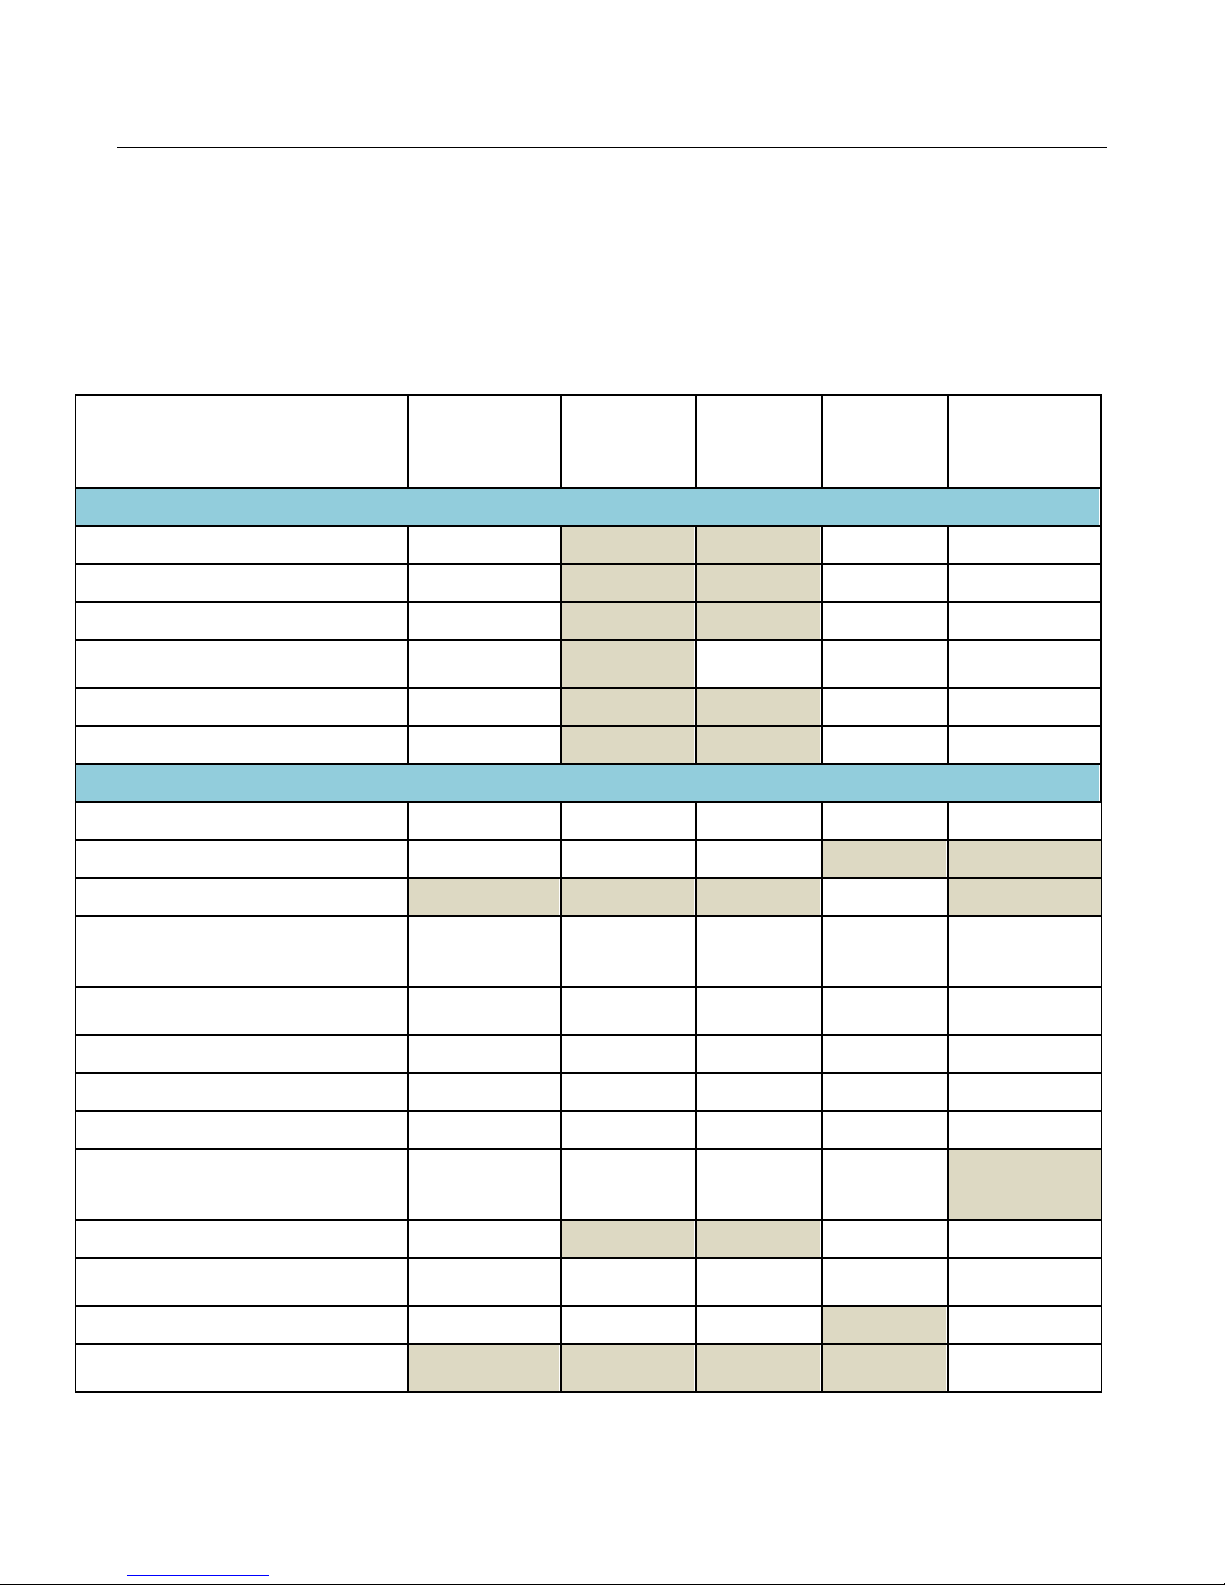
Sentry Family Product Matrix
This Sentry product manual contains technical information on the Sentry family of video quality monitors.
Information for the Sentry Edge products can be found in Appendix B of this manual.
Some of the features and purchasable options described in this manual are not supported on all of the products.
For a breakdown of features and options by product, please refer to the table below.
Sentry
Service
(ASI, GigE,
10G)
Comprehensive MPEG Quality of Experience (QoE) Monitoring
Sentry
Verify,
Verify 10G
Sentry
Assure
Sentry ABR
Sentry Edge
(I - III)
Video QoE real time monitoring
Video eMOS/PVQ real time monitoring
Audio QoE real-time monitoring
Audio loudness & AC-3 Dialnorm
(ITU-R BS.1770) monitoring
Video freeze detection
Audio Silence detection
Optional
Comprehensive MPEG Quality of Service (QoS) Monitoring
Transport Stream QoS Monitoring
IP (UDP) statistics
HTTP Statistics
Closed captioning (708, 608,
SCTE-20), DVB Subtitle,
Teletext reporting
Error Seconds and Program
Availability Reporting
GOP length reporting
Video and Audio PID metadata
Optional Optional
Optional Optional
Optional Optional
Optional
Optional Optional
Optional Optional
Optional
Optional
Optional
Optional
Optional
Optional
Program/PID discontinuity
Program/PID/Transport
Stream/Program Group bandwidth
graphing
PCR interval & jitter
MPEG-PSI, DVB-SI, ATSC-PSIP table
detect, bit rate, cycle time
TR101/290 (priority 1, 2, 3) repo rt i ng
Scalable RF Monitoring (16/64/256
QAM A, B, or C)
Sentry User Manual
March 2017
ASI Only
Optional
Optional
Optional
Optional
11
Page 16
Sentry User Manual
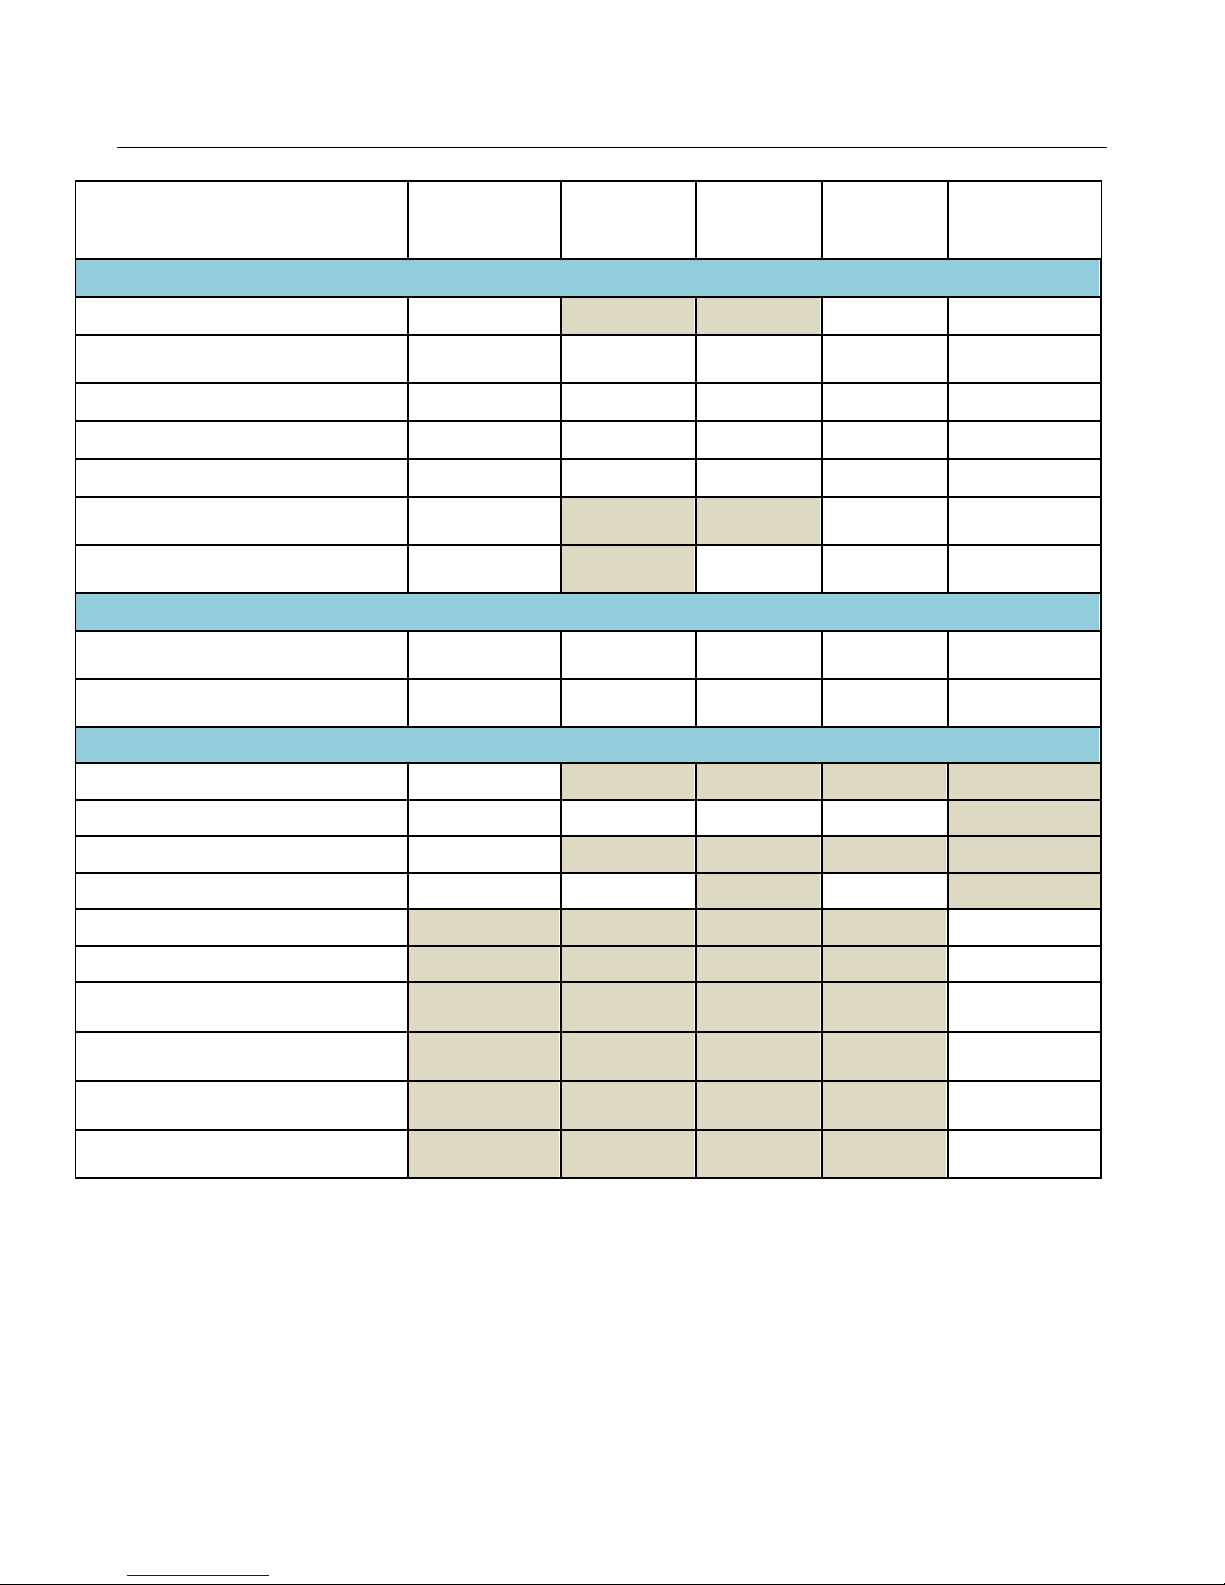
Service
Purchasable Software Options
QoE Monitoring
Carousel monitoring (tru2way / OCAP /
MHP / DSM-CC)
Ad Insertion/Digital Program Insertion
EBIF Monitoring
SA-BFS Monitoring
Perceptual Video Quality (eMOS) on
MPEG-2 & H.264
Audio Loudness Monitoring (includes
CALM Compliance)
Video & Audio
Video: HD, SD, MPEG-2, MPEG-4
AVC (H.264), VC1
Audio: Dolby AC-3, MPEG-1 Layer II,
AAC, HE-AAC, and HE-AAC v2
Interfaces
Sentry
(ASI, GigE,
10G)
Optional Optional Optional Optional
Optional Optional
Optional Optional Optional Optional
Optional Optional Optional Optional
Optional
Sentry
Verify,
Verify 10G
Sentry
Assure
Sentry ABR
Optional Optional
Optional
Optional
Optional
Optional
Optional
Sentry Edge
(I - III)
Optional
Optional
Optional
Optional
Optional
Optional
ASI
GigE
Dual GigE
Single-Mode or Multi-Mode LC SFP+
8VSB & QAM-B
QAM A, B, or C
DVB-S2 receiver supports two
channels in QPSK / 8-PSK mode
Single-channel DVB-T2 receiver for
VHF/UHF
RF Measurements: Level, MER, CNR,
Pre-RS BER, Post-FEC Erred Packets
RF Measurements: EVM, Carrier
Offset
ASI Only
GigE Only
10G Only 10G Only
10G Only
Edge II Only
Edge II and
Edge II Only
Edge Only
Edge III-S
Only
Edge III-T
Only
Edge III Only
Sentry User Manual
March 2017
Page 17

Sentry User Manual
Preface
This user manual describes the Sentry family of video quality monitors and the web browser-based interface.
This manual introduces the components and features, so you can begin using the device.
Who Should Use This Manual
This manual is intended for service providers who use Tektronix Sentry products for monitoring, reporting and
alerting from MPEG transport streams. You should understand the concepts and tools used in a headend
environment. You should also be familiar with basic computer operations such as click, drag and drop, as well
as the operation of a web browser.
How to Get Help
If you purchased a service contract for your Tektronix Sentry products from a distributor or authorized reseller,
contact the technical support staff for that distributor or reseller for assistance.
If you purchased a Tektronix service program, contact Tektronix technical support:
For technical support:
Sentry Technical support is available on Business Days from 6:00 AM to 5:00 PM Pacific Time and 9:00 AM
to 5:00 PM Indian Standard Time on the following numbers:
US/Canada toll-free 1-844-219-5329
India toll-free 1800-3000 4835
Russia toll-free 810800-22554411
United Kingdom 44 1344 39 2541
Europe* toll-free 00800-22554411
*Austria, Belgium, France, Germany, Ireland, Italy, Netherlands, Spain, Sweden, Switzerland, UK
Worldwide, please email videosupport@tektronix.com
Additional information about the Tektronix Sentry family of video quality monitors is available at the
following URL: http://www.tek.com/video_quality_monitors/
Sentry User Manual
March 2017
13
Page 18

Sentry User Manual
Sentry User Manual
March 2017
Page 19

Sentry User Manual
Introduction
What is Tektronix Sentry?
Tektronix Sentry is an MPEG transport stream monitoring device that supports next generation digital services
and traditional program monitoring. Sentry supports MPEG-2, H.264 AVC, MPEG-4 part 10, and VC-1 video
compression standards. The components of Sentry are:
The Engine
Internal database
Sentry supports real-time monitoring through single- and 4-port ASI and Gigabit Ethernet (GigE) input of all
MPEG source streams within the headend or hubs.
Sentry digs deep into the complex and private data residing within the stream, allowing video service providers
to gain insight and solve problems in their digital networks. Sentry’s extensive feature list includes:
• Audio and Video Quality of Experience Scoring System
• Audio Silence and Audio-level Issue Detection
• Detect Black Video, Frozen Video, Tiling/Macroblocking
• Perceptual Video Quality (eMOS)
• Live Thumbnails
• User Triggered and Alert Triggered Stream Captures
• Stream to View
• Historical Reporting and Graphing
• Transport Stream Bandwidth Graphing
• Program Group Bandwidth Graphing
• Carousel Monitoring (SA-BFS, DSM-CC, tru2way™)
• Digital Program Insertion
• 24/7 Real-time QoE Monitoring of Entire Channel Lineup
• Detect Intermittent Problems
• Alert Notification and Historical Reporting
• Error Second and Program Availability Reporting
Sentry's video quality monitoring solutions provide unique flexibility to enable you to implement any
combination of monitoring components for any digital application, using the same Sentry hardware.
Sentry User Manual
March 2017
15
Page 20
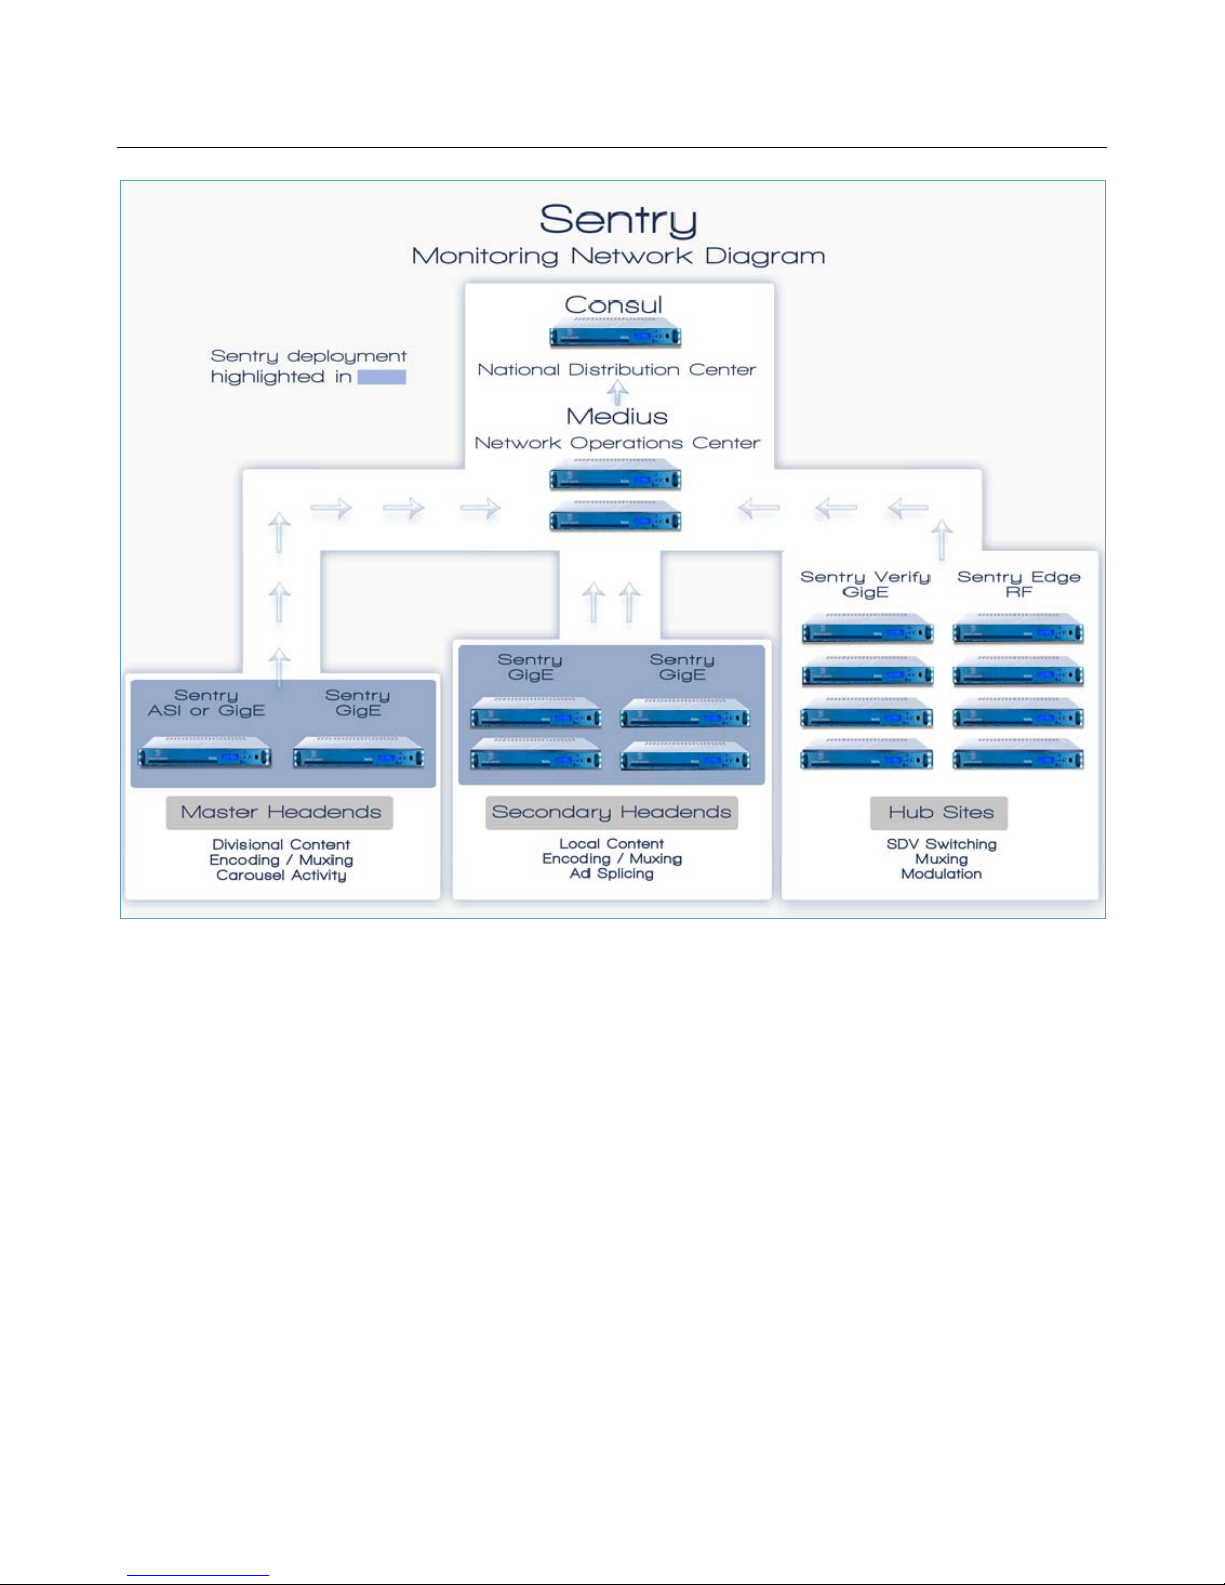
Sentry User Manual
Figure 1: Sentry Network Diagram
Sentry User Manual
March 2017
Page 21

Sentry User Manual
What does Tektronix Sentry do?
Functioning completely within the digital domain, Sentry receives MPEG transport streams and monitors them
for normal and unusual activity.
The primary features of Sentry are:
Monitoring
Reporting
Alerting
Monitoring
Sentry tracks, and fully dissects the content of the digital media stream as it leaves the headend, including:
Application data decode and verification
Closed captioning compliance
Bandwidth utilization
Broadcast data decode and verification
Carousel monitoring
BFS monitoring
OCAP monitoring
Ad insertion auditing
Tagged verification
PSI/SI/PSIP/PMT decode
Bitrate monitoring
Reporting
The Sentry web interface allows you to configure parameters and view the output of the Sentry engine
historically and in real-time. In addition to standard reports accessible from the menus on the displays, detail
views (e.g., program detail, BFS detail, ad cue detail) are available by clicking on various elements in the
displays.
Standard Sentry reports include:
Current Status
An overview of the current state of the programs
Program Status
Provides a configurable history of all MPEG programs and their PID contents
Data Detect Report
Identifies specific program content
Ad Cue Info
Displays composite and component ad cues inserted into the stream.
Transport Status
Dissects the transport packets
Sentry User Manual
March 2017
17
Page 22

Sentry User Manual
TR101/290 Status
TR101/290 is a DVB standard for measurement and analysis of MPEG transport streams. Refer to the
section on TR101/290 for a more in-depth discussion of this report and its features.
IP Stats
Displays information relating to IP packet arrival interval and delay factor.
OCAP Status
Displays the status of OCAP streams.
EBIF Status
Displays monitoring information EBIF Status
BFS Status
Displays the status of the Broadcast File System. Refer to Scientific-Atlanta Broadcast File System for
a more in-depth discussion of this report and its features
Alert History
Lists alerts detected by the system. Refer to the section on Reports for a more in-depth discussion of
this report and the section on Configure: Alerts for a discussion of creating alerts.
Alert Analysis
Provides an easy to use graphic analysis to visually represent alerts
Alerting
Sentry enables real-time alerts to indicate if content within a stream is invalid, a stream goes down, or user
thresholds are exceeded. Alerts are visible within the web user interface (Alert History) and can be sent via
email and SNMP trap. There are three major alert types:
Thresholds
Alert when a given bandwidth level or cycle time has exceeded or falls below on a PID, program, table,
DSM-CC, or BFS. Alert when a program’s PCR arrival interval or PCR jitter has exceeded or falls
below a given level.
Thresholds with Frequency
Alert when a given threshold condition is met and it has occurred twice or more in a given time period.
Content
Alert when a selective piece of content has been received or transmitted correctly or incorrectly. Alert
when a given PID or program is active or not-active. Alert if a PID, program, table, DSM-CC, or BFS
drops. Alert if audio silences or video freezes.
Refer to the Configuring Alerts section for more information.
Sentry User Manual
March 2017
Page 23
Sentry User Manual
Getting Started
Front Panel Functions (2016 to present models only)
The following applies only to units made in 2016 to present.
These models are able to provide the following functions:
IP address readout on LCD display
Manual Reboot option from front panel
Hard drive installation or replacement
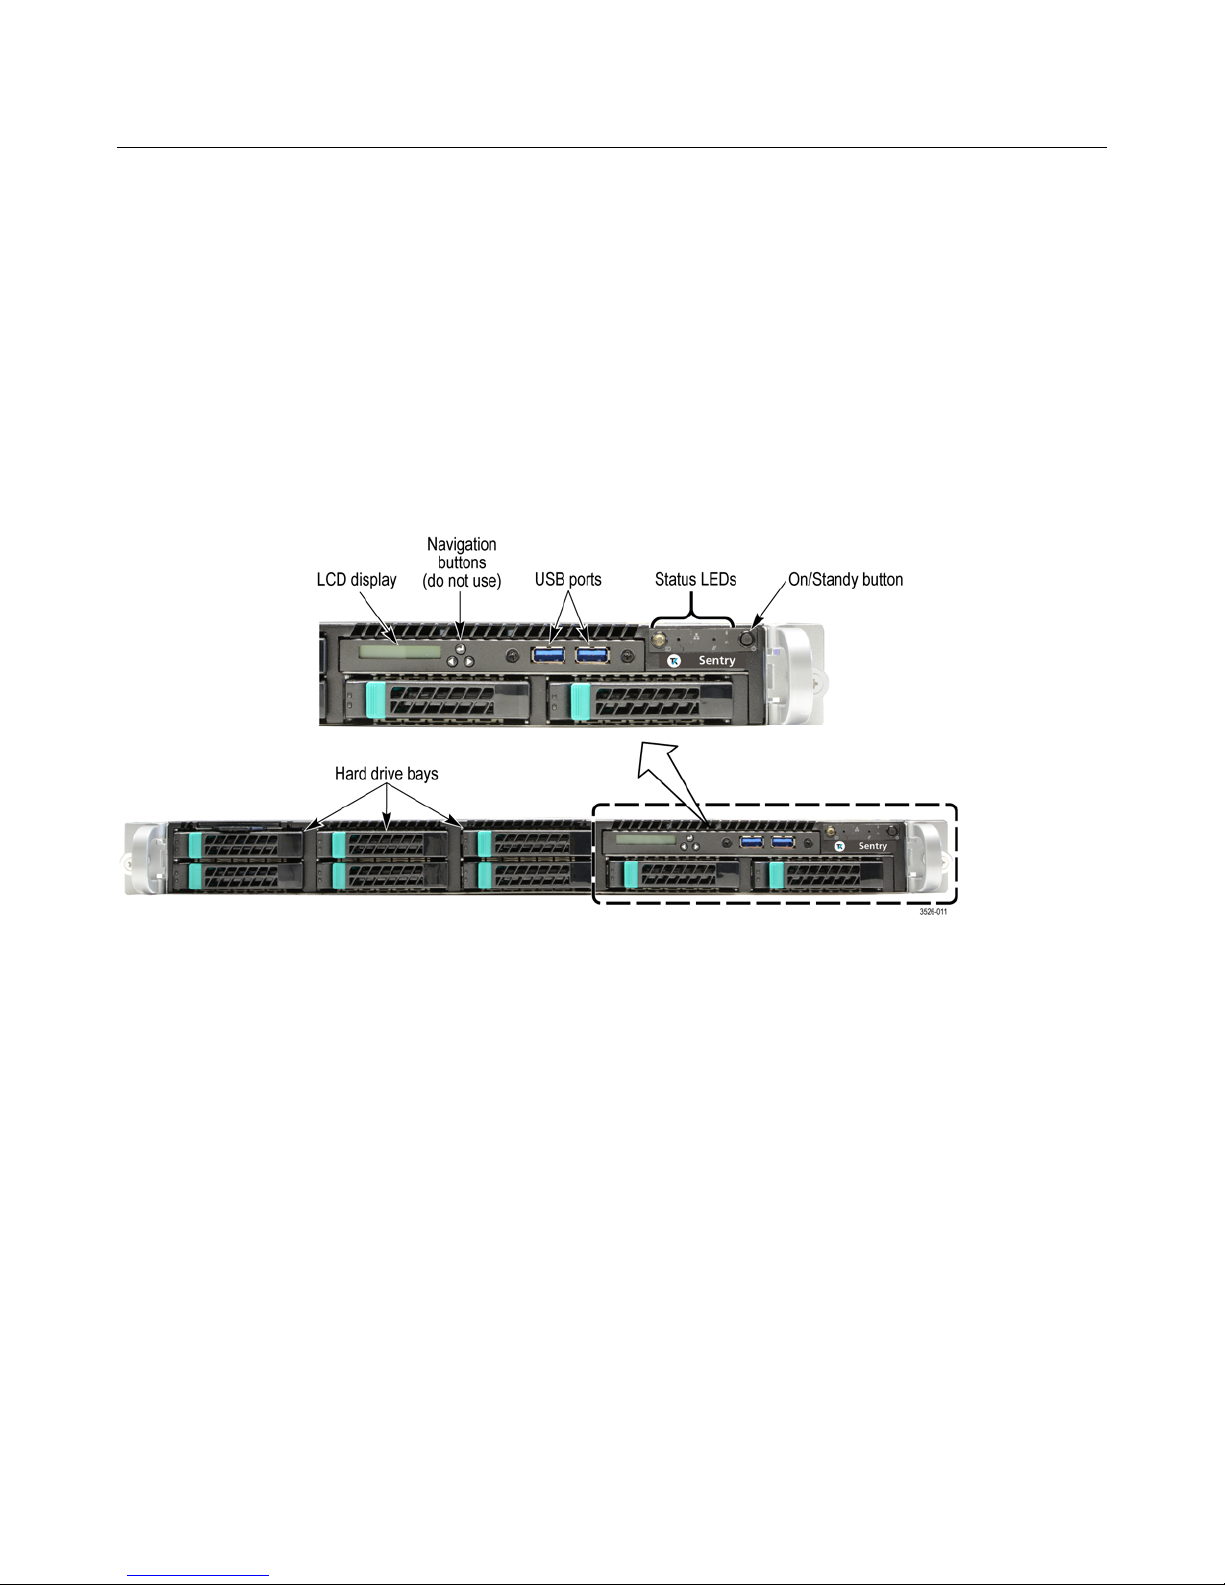
Figure 2: Sentry front panel (2016 to present models only)
IP address on the front panel
The LCD (Local Control Display) is a 16-character, one-line display with two backlight colors:
Green. The LCD backlight is green under normal operating conditions.
Amber. If a hardware problem is detected with the server, the LCD backlight turns amber. When the
problem is cleared, the backlight returns to green.
Under normal operation, the readout will display the IP address of the Management Port in the form “Tektronix
Sentry IP: xxx.xxx.xxx.xxx.” The factory default IP address is 10.0.10.200.
Depending on the status of the instrument, you may see additional status messages such as Rebooting,
Shutdown, Stopped, etc. When errors are encountered, associated error messages may be displayed.
Sentry User Manual
March 2017
19
Page 24
Sentry User Manual
Navigation buttons
Do not use the navigation buttons. The navigation buttons can be used to access and navigate an internal menu
system provided by the manufacturer of the Sentry chassis.
CAUTION: To prevent operational problems with the instrument, do not attempt to make any changes to
the menu settings.
USB ports
Use the two USB 2.0 ports to connect external USB devices to the instrument.
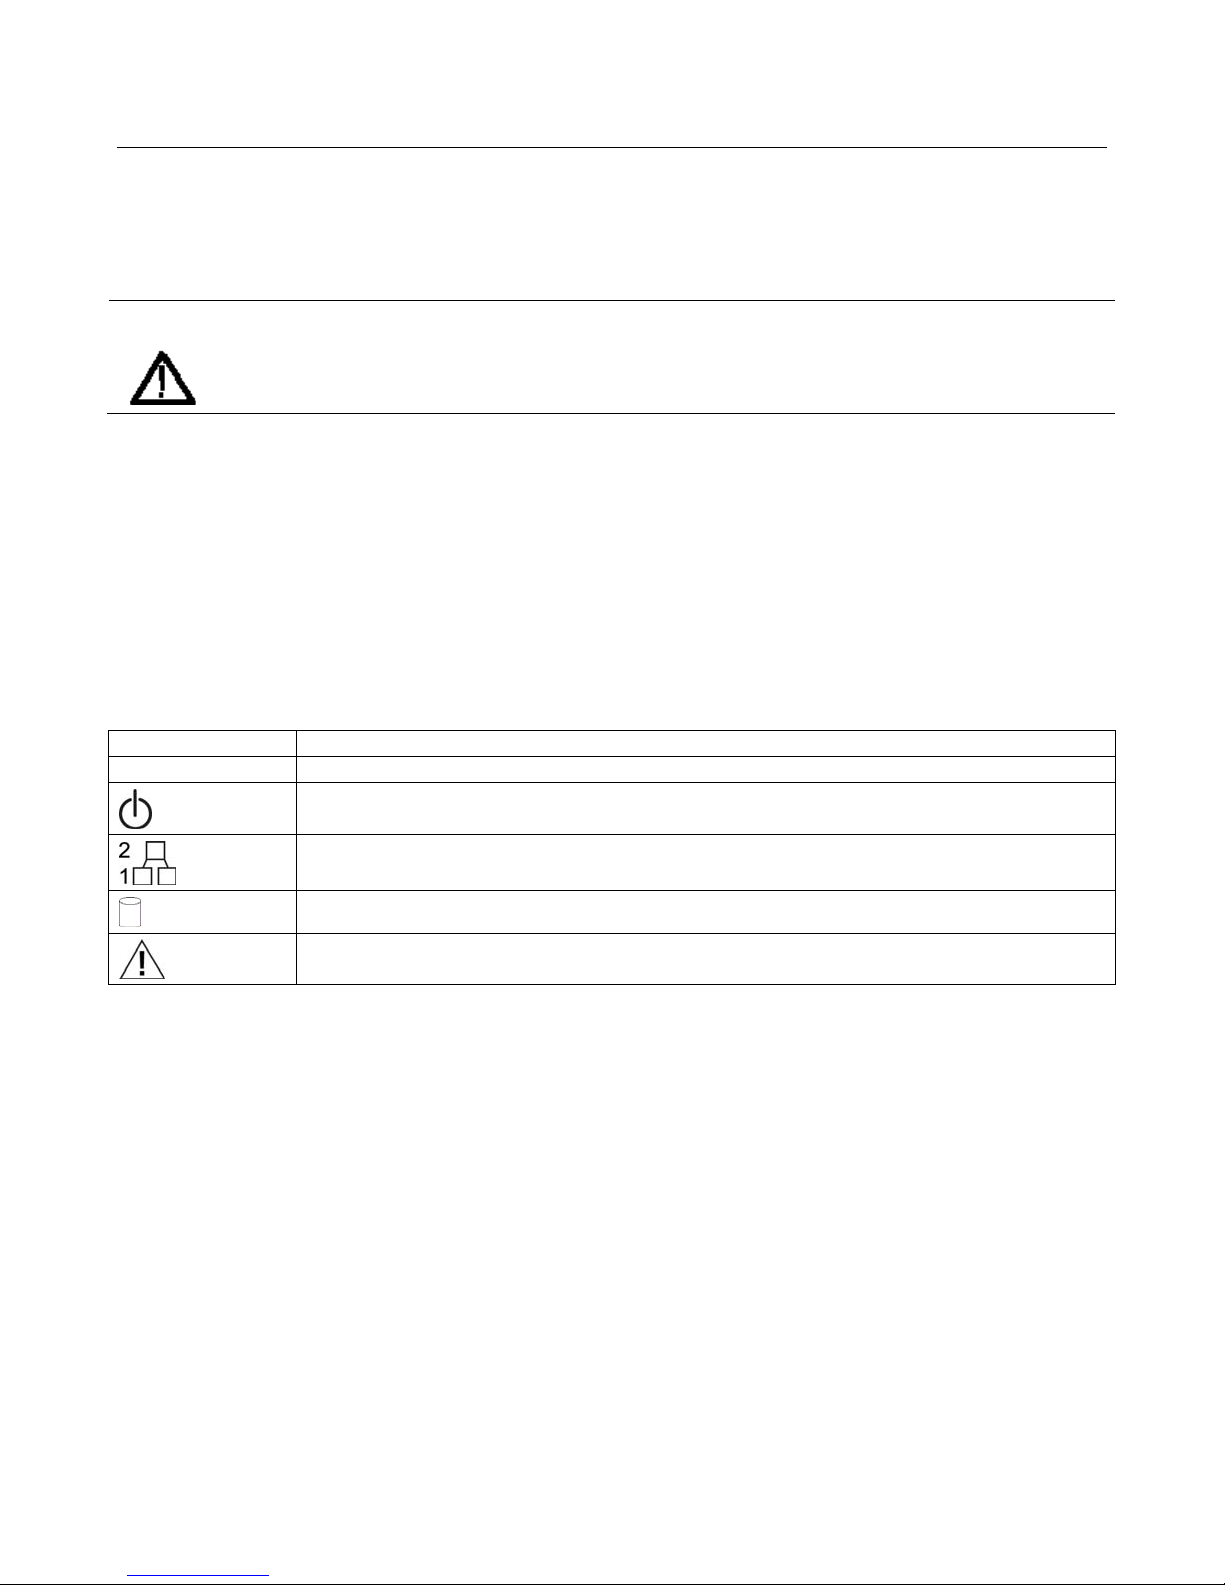
Status LEDs
The status LEDs indicate the following information about the state of the instrument:
Item Description
ID System ID button with LED
On/Standby button illuminates when the instrument is powered on
Illuminates when activity occurs on the Management Port (1) and on the IP Video port (2)
Illuminates when there is drive activity
System status LED
Sentry User Manual
March 2017
Page 25
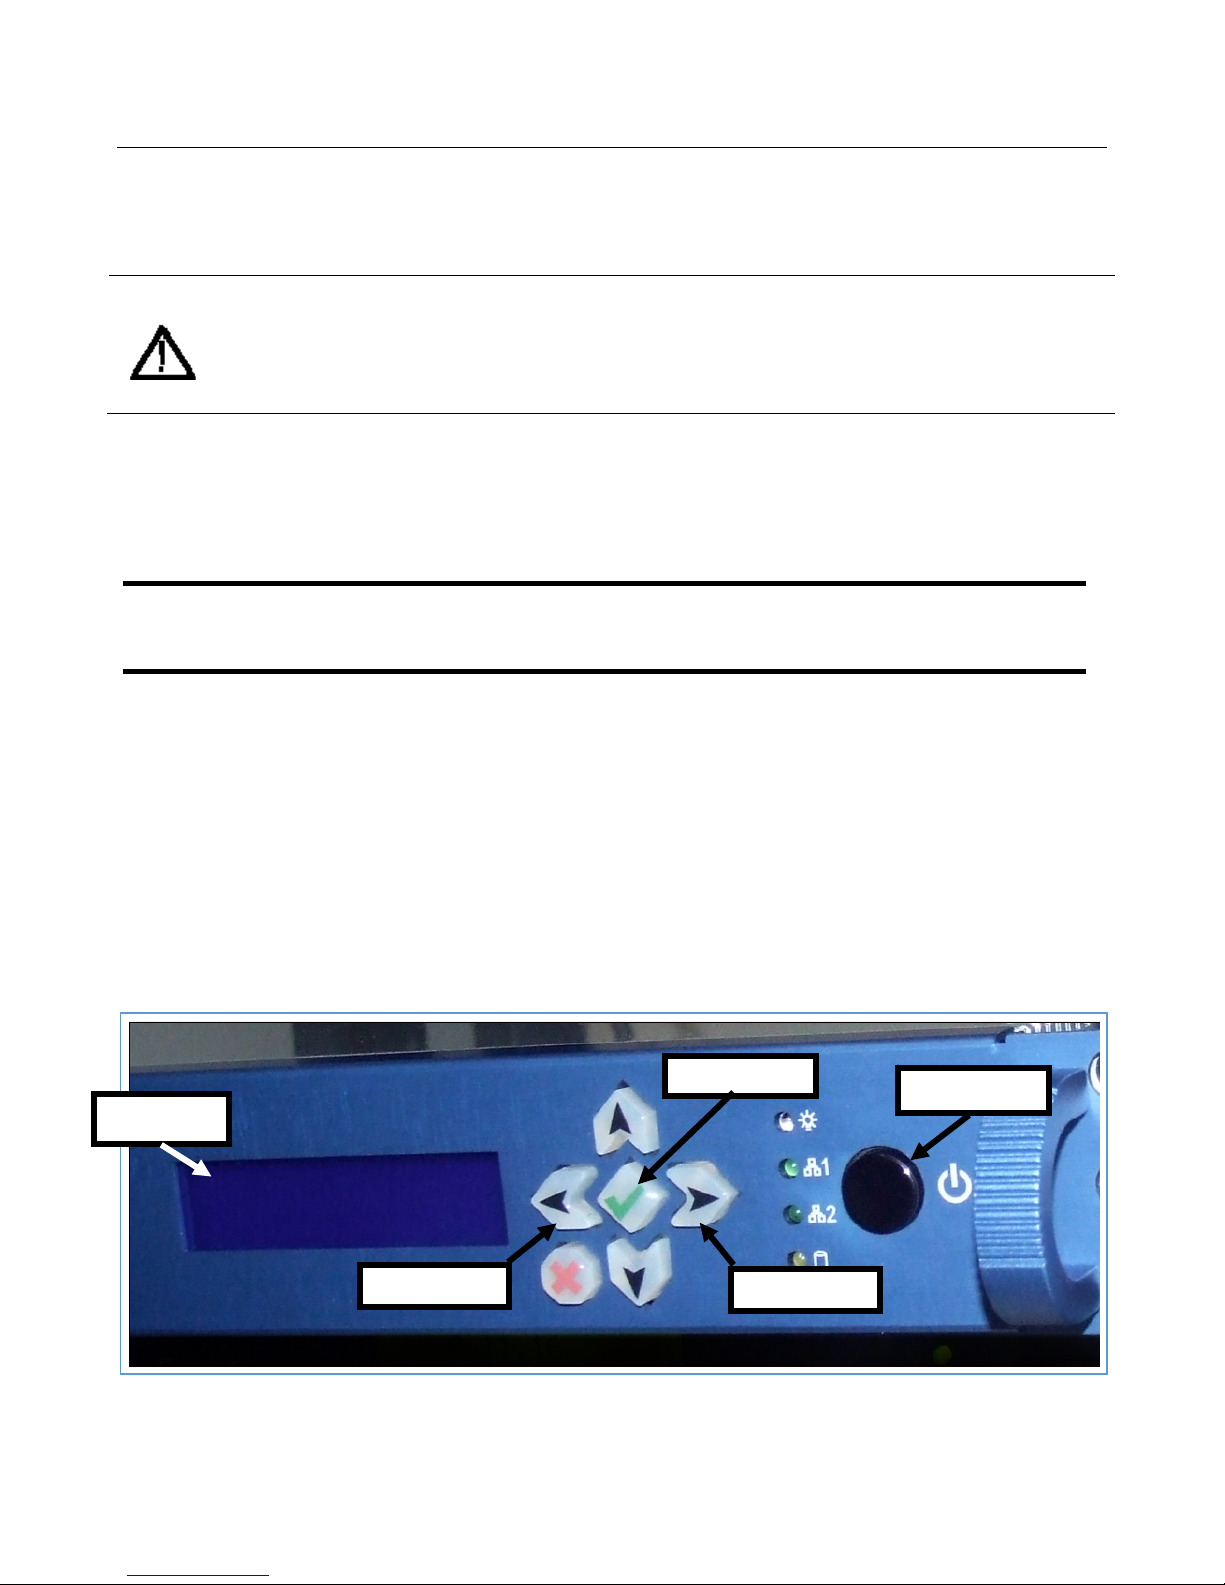
Sentry User Manual
Power-off procedure
The preferred method for rebooting or powering off a Sentry is through the web interface.
WARNING: When moving a Sentry, it is very important to properly power off the Sentry via the web
interface.
Never unplug a Sentry without performing the Power-off procedure. Improper shutdown may
cause file corruption and failure of the Sentry.
Perform the following steps to power-off the instrument:
1. Use the Configure > Power Off menu option from the user interface to start the power-off process.
2. In the event that you cannot access the user interface, press the front panel On/Standby button once to
power off the instrument.
NOTE: The LCD display does not indicate that the instrument has begun a Safe Power
Off process. Please wait more than 30 seconds for the instrument to visibly start to
power-off.
3. To completely remove power from the instrument after a safe power-off, disconnect both power cords
from the rear of the instrument.
Front Panel Functions (2009 to 2016 models only)
The following applies only to units made in 2009 to 2016 and that have a blue LED backlit display.
These models are able to provide the following functions:
IP address display on LED
Manual Reboot option from front panel
LED Brightness control
Enter button
LCD Display
Power button
Left button
Figure 3: Sentry front panel (2009 to 2016 models only)
Sentry User Manual
March 2017
Right button
21
Page 26

Sentry User Manual
IP address on the front panel
To see a display of the IP addresses of both of the system network interfaces on the front panel LCD display:
1. Press and hold Enter (green check mark) on the front panel.
2. The address displayed on the top line of the display corresponds to the Management interface and the
lower line corresponds to the MPEG/IP input.
Manual power down from front panel
NOTE: The preferred method for rebooting or powering off a Sentry is through the web interface. Please
see the Remote Power Off and Restart Capability section of this manual for more detail.
WARNING: When moving a Sentry, it is very important to properly power off the Sentry via the web
interface.
Never unplug a Sentry without performing the Power Off procedure. Improper shutdown may
cause file corruption and failure of the Sentry.
In addition to powering down through the Sentry interface, you may also use the front panel button.
4. Start the power down of the unit by pressing the front panel power button two times quickly within 2
seconds.
5. Within moments, the LCD display will indicate that the unit has begun the Safe Power Off process,
and several seconds following, the unit will power down completely.
LED Brightness
1. The brightness of the LCD display backlight can be changed by selecting either the left arrow or right
arrow buttons on the front panel. The left button will dim the display while the right will brighten it.
2. Changes to the brightness level persist until the unit is rebooted or powered down.
Sentry User Manual
March 2017
Page 27
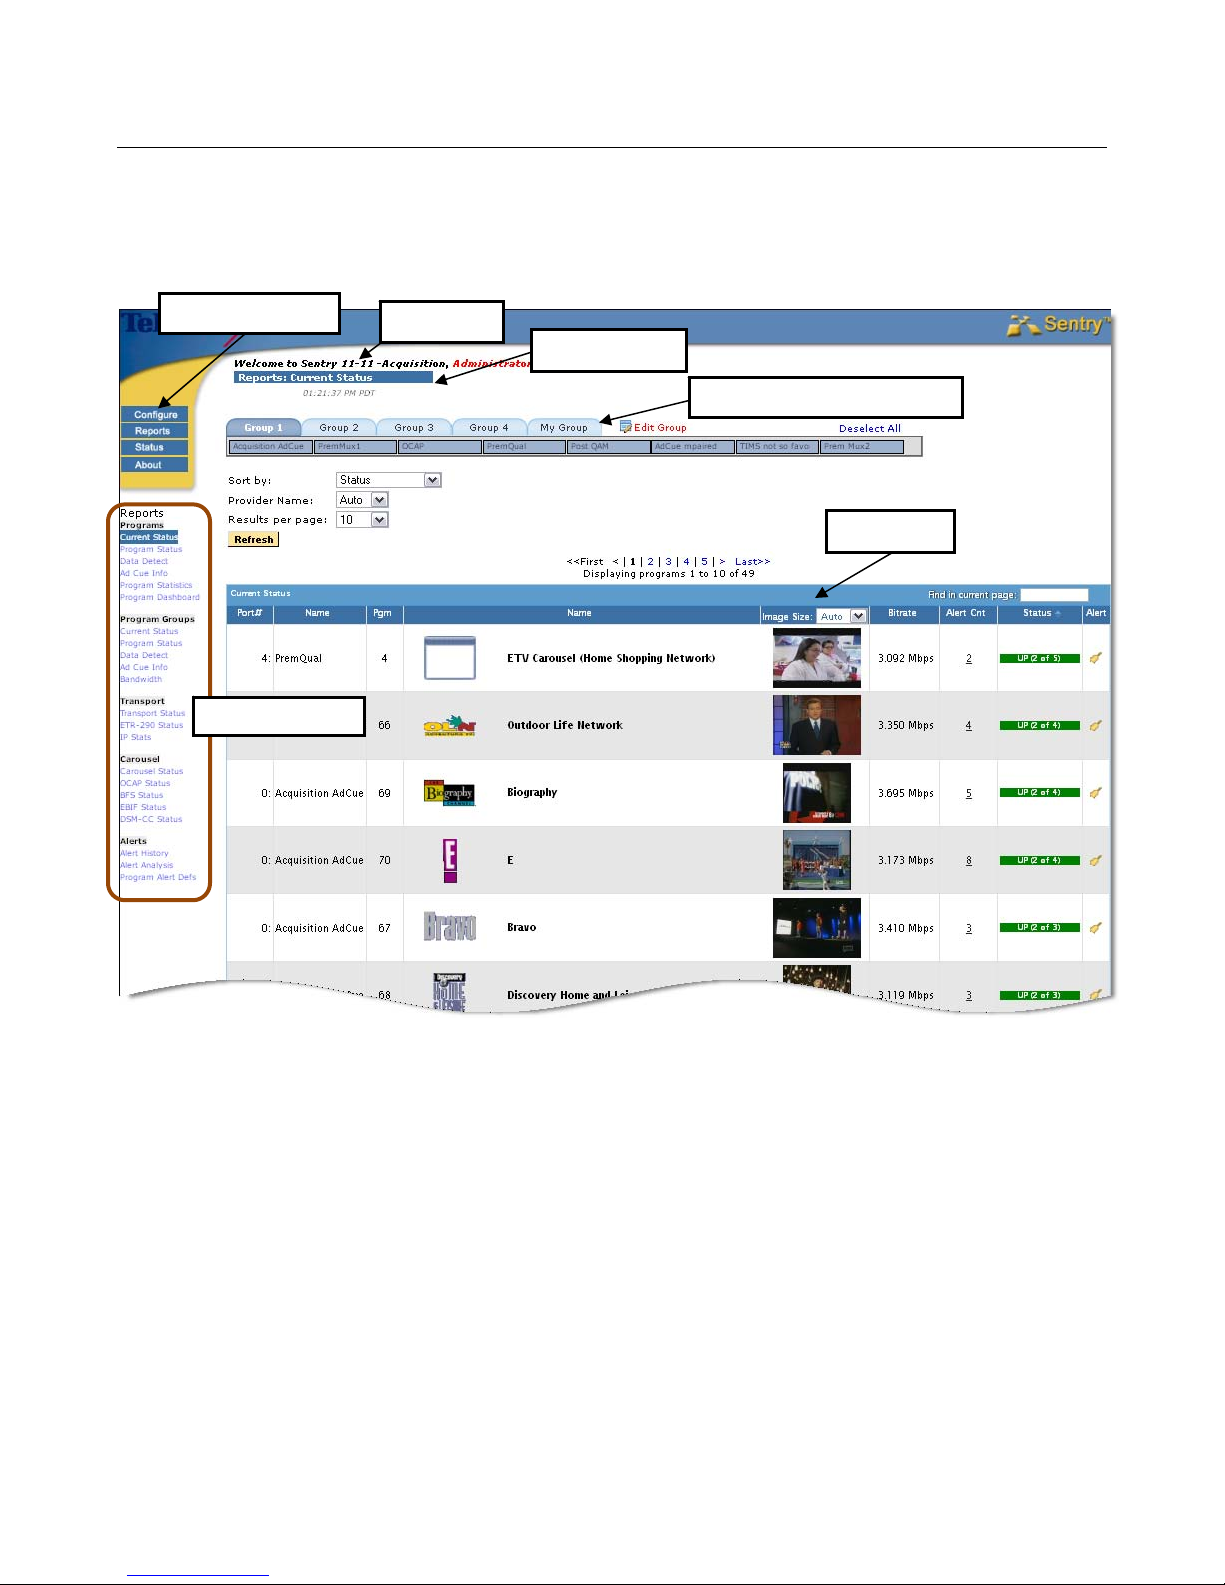
Sentry User Manual
Interface Components
The Sentry interface consists of the following areas:
Main Page Menu
Login Info
Page Title Bar
Group Tabs and Input Ports
Thumbnails
Sub-Page Menu
Figure 4: Sentry Interface Components
Main Page Menu
The buttons in this area (Configure, Reports, Status, and About) are the main categories of pages available
for collecting information, reporting, and configuring the system. Configure and Reports contain sub-pages,
accessible through drop-down menus.
Login Info
This area displays the username of the logged on user and provides a link to log out of Sentry.
Click Logout to log out of the system. The date and time of the most recent refresh of the screen is also shown.
Click Refresh to refresh the screen; otherwise the screen will refresh automatically at a periodic rate (~ every
300 sec.).
Sentry User Manual
March 2017
23
Page 28
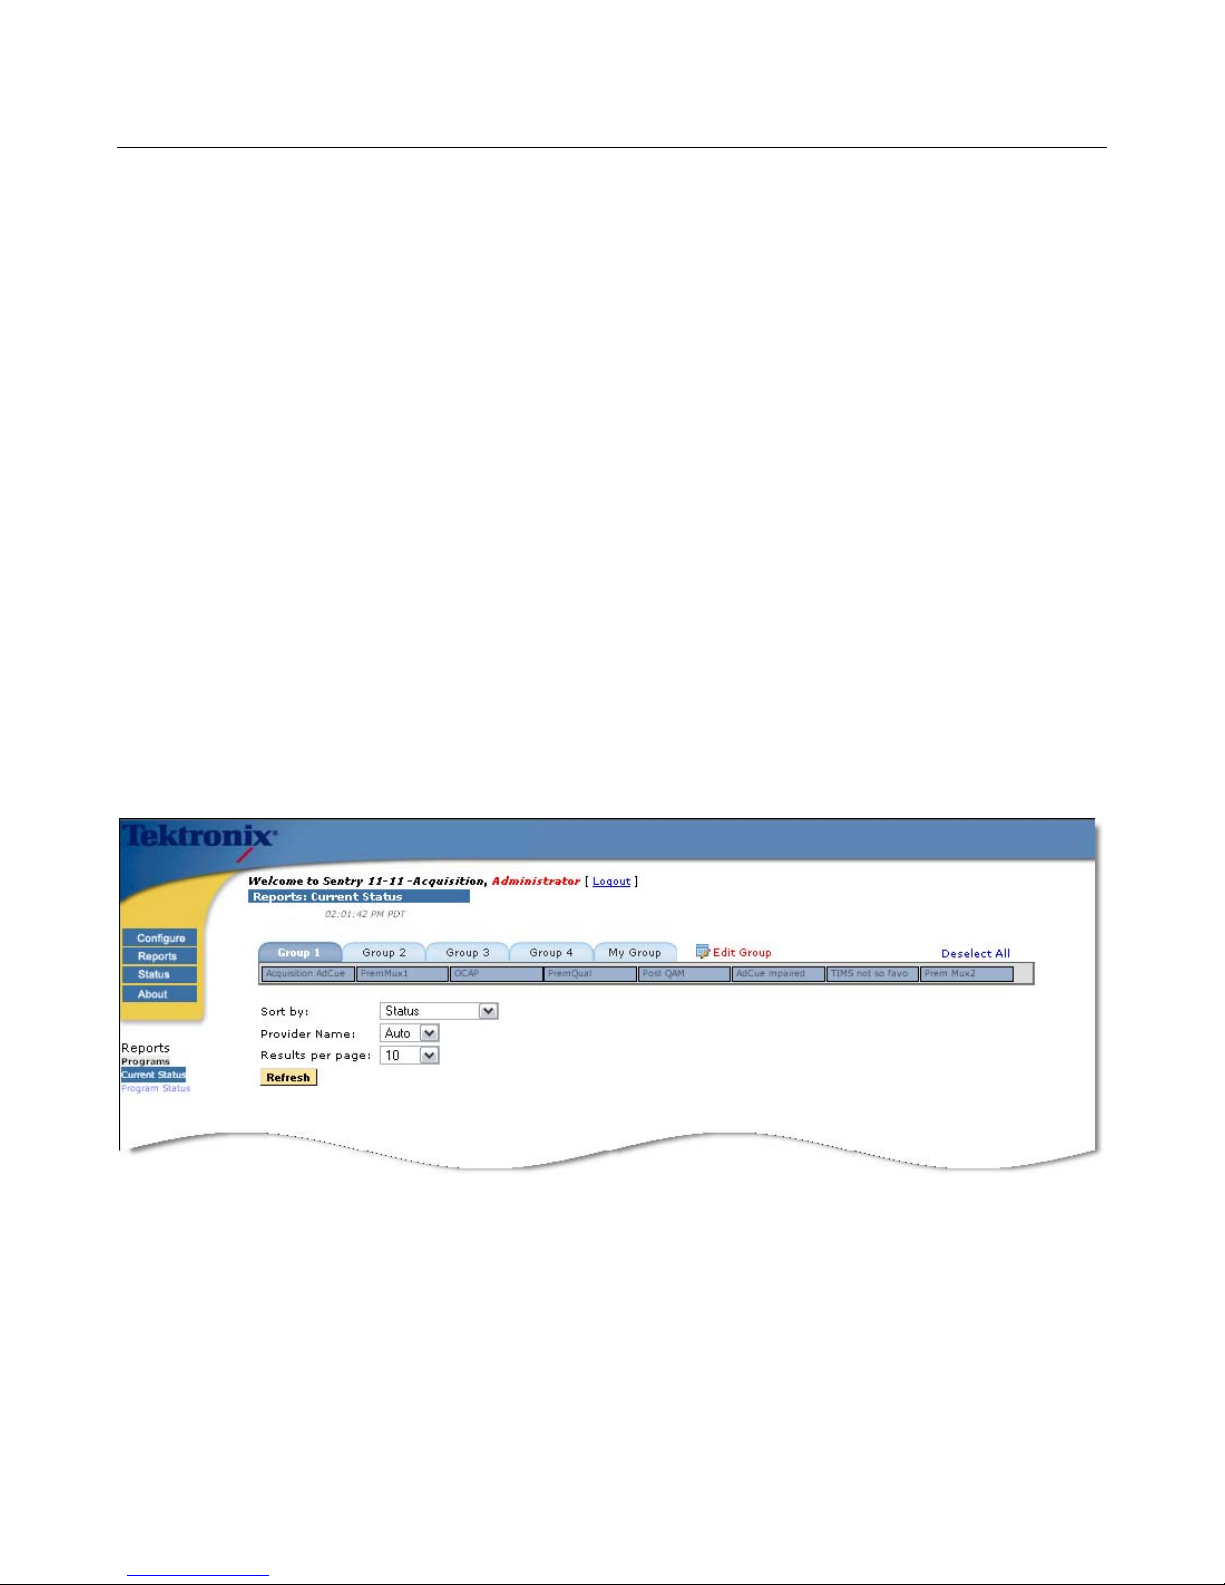
Sentry User Manual
Page Title Bar
The title bar identifies the name of the page currently in view.
Thumbnails
Current Status also features thumbnail visual confirmation of the content of each program or service. You
can control the size of the thumbnail at the top of the column. You can also refresh the thumbnail manually or
it will refresh automatically every 5 minutes. Settings for thumbnails can be found in System Preferences.
Group Tabs and Input Ports
Input ports indicate the sources of transport stream input, which can be either ASI (one or four ports) or GigE
(MPEG over IP unicast IP port or up to 30 multicast groups, each consisting of a Group ID and an IP Port).
Sentry allows you to organize input ports into system and user groups. You must have Administrator privilege
to create and modify system groups.
If the number of input ports is greater than one, then default system groups will be automatically created (two
groups for a four port Sentry and four groups for Sentrys with more than four ports). Settings that the user has
specifically saved are retained as they navigate from page to page.
For example, the figure below shows the groups and ports of a GigE Sentry. The Group 3 tab is selected
showing that Ports 16 through 23 are in Group 3. Selecting a group will report only on the data from the ports
in that group. Ports can also be renamed.
Figure 5: Groups and Ports of a GigE Sentry
Sentry User Manual
March 2017
Page 29
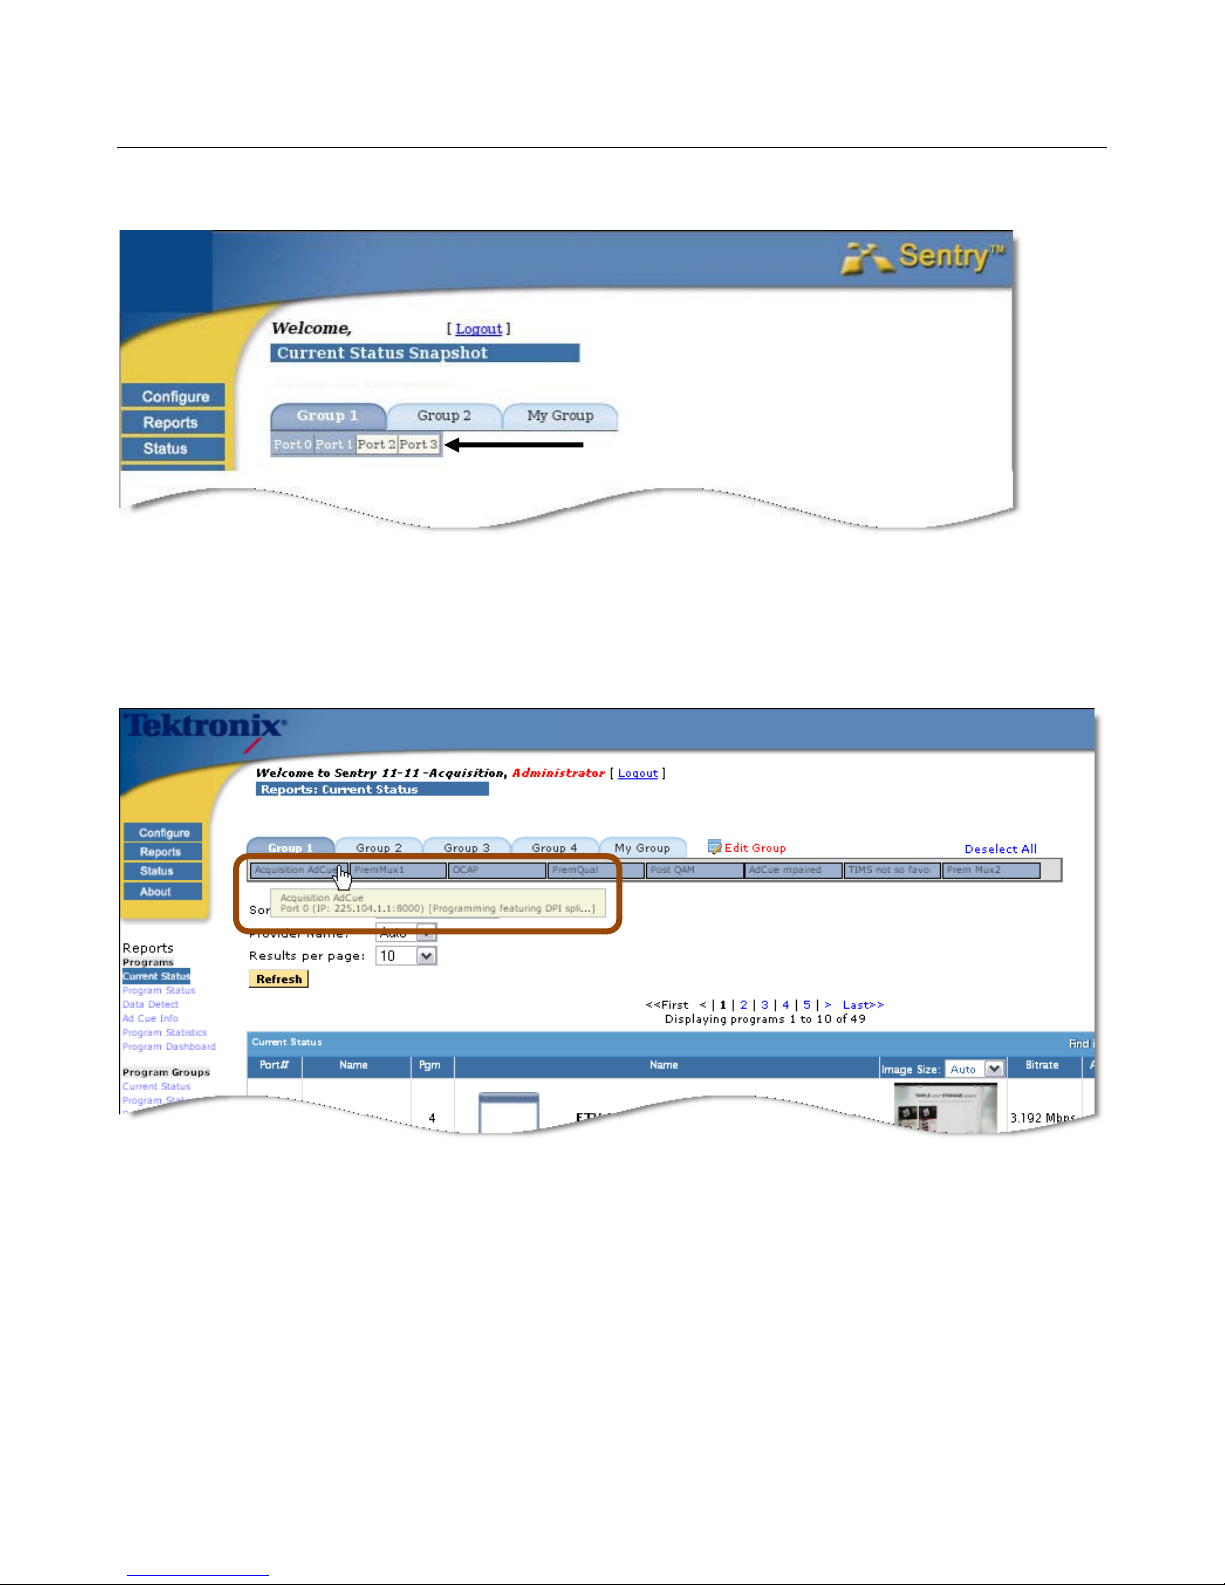
Sentry User Manual
Below are groups and ports of a four port ASI Sentry.
Figure 6: Groups and Ports of a 4 Port ASI Sentry (0, 1, 2, 3)
In the case of ASI models, the port is known from the hardware. For MPEG over IP models, the port is known
from the configuration (refer to Configuring MPEG Input Settings.
Mouse over an input port to see a popup showing the input source.
Figure 7: Group 1 Acquisition AdCue port popup message showing the input source
Ports that are not configured are displayed as a light gray.
Ports that are configured and assigned to a group are shown as dark gray.
Ports that are configured but not assigned to a group are shown as white.
The user can change the group assignments by clicking on ports, which toggle as assigned (dark gray)
and unassigned (white).
Sentry User Manual
March 2017
25
Page 30
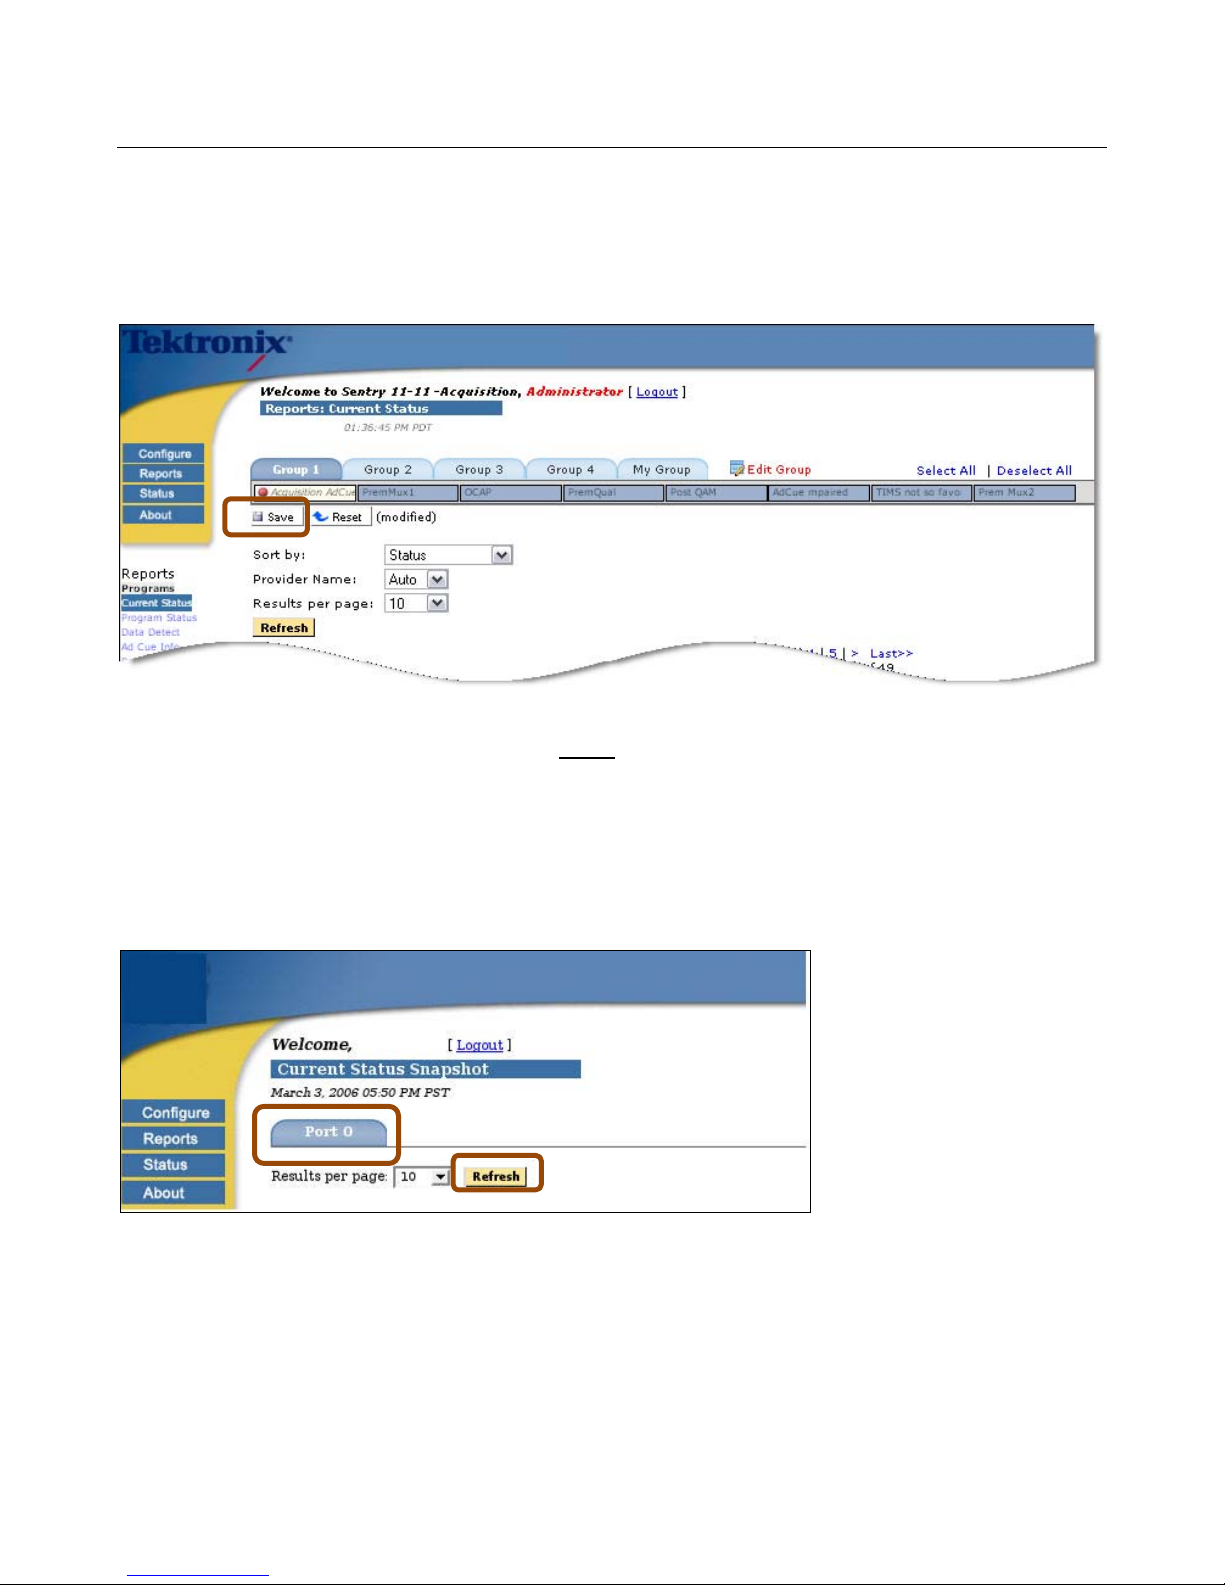
Sentry User Manual
Change a Port Assignment
1. Click on the port you wish to change.
2. Click Save to save the assignments. Click on the Reset button to reset the assignments.
Figure 8: Save Button indicating Changed Port to Group Assignments
3. Selecting the Refresh button on the page before the assignments are saved will result in a note that
assignments have been modified. A Reset button to reinstate the original settings will also be
displayed.
ASI Port tab
A single port ASI Sentry has only one port tab and therefore has no need for a group tab.
Figure 9: Port 0 of a Single Port ASI Sentry
Sentry User Manual
March 2017
Page 31

Sentry User Manual
Basic Operations
The web-based interface allows the user to administer Sentry in the following manner:
Select from a series of pages and sub-pages, and modify fields to create the desired configuration.
Submit the changes on any given page using the appropriate update or refresh buttons. If the user selects a new
page or end the session without submitting the information, the changes are lost.
NOTE 1: To access the full functionality of the web interface, you must log in as a user with Administrator
privileges.
NOTE 2: If multiple Sentry administrators apply changes to the same set of parameters concurrently, the
latest applied changes take precedence. Up to ten simultaneous browser connections are allowed.
Sentry User Manual
March 2017
27
Page 32

Sentry User Manual
Bitrate Violation
If Sentry exceeds the combined bitrate for which it was licensed, a bitrate violation occurs. A violation warning
is displayed on the opened page. Clicking on the More info… link in the violation warning provides more
detail about the licensed bitrate and the violation.
Figure 10: Bitrate Violation Notice
Processing will pause while the condition persists and the last known state is displayed.
Figure 11: Bitrate Violation additional information
Sentry User Manual
March 2017
Page 33

Sentry User Manual
Reports
Reports are configurable to give you a real-time or historical view of transport activity. There are five main
categories of reports, and all reports offer the capability to drill down to view additional detail:
Programs
• Current Status
• Program Status
• Data Detect
• Ad Cue Info
• Program Statistics
• Program Dashboard
Program Groups
• Current Status
• Program Status
• Data Detect
• Ad Cue Info
• Bandwidth
Transport
• Transport Status
• TR101/290 Status
• IP Stats
Carousel
• Carousel Status
• OCAP Status
• BFS Status
• EBIF Status
• DSM-CC Status
Alerts
• Alert History
• Alert Analysis
• Program Alert Defs
Sentry User Manual
March 2017
29
Page 34

Sentry User Manual
Programs
Programs provide an overview of the contents of the MPEG transport stream, and consist of four types:
Current Status, Program Status, Data Detect and Ad Cue Info. Current Status and Program Status
reports are MPEG program centric in the sense that all data and PIDs are grouped according to the programs
with which they are associated.
Current Status
Figure 12: Current Status Snapshot Report
The main components of the Current Status report are:
Port # and Name
The number and name of the input port receiving the data
Pgm (Program Number)
The program number that was derived from monitoring the transport stream.
Name
Refers to the program provider icon and name, derived according to the Provider Name selection
(refer to Configuring the Provider Name). If Sentry cannot determine the provider, a placeholder will
be inserted, e.g., Not Available. The user can also manually associate a network name and icon with a
Sentry User Manual
March 2017
Page 35

Sentry User Manual
program using Sentry’s Configuring Mappings. XDS data consisting of the show name and rating is
also displayed if it exists.
Thumbnails
Provides a current image of the selected program. Thumbnail size may be adjusted using the settings
located directly in the column header.
Current Bitrate
The current (last minute) bitrate of the program.
Alert Count
Shows the number of active alerts for each program.
Status
Shows UP (GGrreeeenn) if all PIDs in the program are getting data. If some but not all PIDs are getting data,
the Status displays UP along with the number of up PIDs out of all PIDs, e.g., 2 of 4.
The Status will display DOWN (RReedd) if the bitrate for all PIDs is zero.
If there is no bandwidth information, Current Bitrate shows no bitrate data and the Status is DOWN.
NOTE: The only time that Sentry will not receive bandwidth data is when there is a Bandwidth Violation.
Figure 13: Status Column in Current Status
Alert Icon
When selected will automatically display and configure the Creating Program Alerts page for the
selected program (See: Alerts).
Sentry User Manual
March 2017
31
Page 36

Sentry User Manual
To Filter the Ports on the Report
To narrow down the group of ports returned in the non-program group report, click Edit Group. The Edit
Group display provides the following options:
Show All Ports
Show all port available to system
Show Active Port Only
Show only the ports that are actively monitoring input.
Filter on Selected VLANs
For Ethernet boxes licensed for VLAN support, filter on ports configured on a specific VLAN.
Select All
Select all only configured ports on this page only.
Remove All
Remove all selected ports
Cancel
Cancel action and go back to last page
Apply and Exit
Apply changes and go back to last page
Save
Save changes and stay on this page
1. Select Edit Group.
Figure 14: Editing a group
2. Select Ports as needed.
Figure 15: Editing a group (ports selected)
3. Select Apply and Exit when done.
Sentry User Manual
March 2017
Page 37

Sentry User Manual
Filter Sentrys licensed with VLAN support
To filter on specific VLANs, select Filter on Selected VLANs and check the desired VLANs.
Figure 16: Editing a group
Sentry User Manual
March 2017
33
Page 38

Sentry User Manual
Program Status
The Program Status report gives a configurable history of all MPEG programs and their PID contents.
Trend Details
Graph
Figure 17: Program Status Report Overview
In addition to the same components seen in the Current Status Snapshot report (i.e., Alert, Port#: Name,
Pgm, Name, XDS data), the Program Status report has the following additional components:
TSID:
The Transport Stream ID derived from monitoring the stream.
Name:
Program Availability and Error Seconds for the selected time range is added to the Name field in
Program Status. Program Availability is the number of non error seconds over total number of
seconds for a specified time period. It is expressed as a percentage. Error Seconds is the number of
seconds a program was unavailable as defined by the program availability definitions.
• Green indicates no errors
• Yellow indicates there was an error for some time
• Red indicates there was an error for the whole block
Avg. Bitrate
The program bitrate averaged over the time range shown in the Current View.
Sentry User Manual
March 2017
Page 39

Sentry User Manual
Bitrate History
The PID data in the stream over the selected time range, shown as color-coded discrete blocks.
• Gray indicates no data
•
w indicates PID out for some time
YYeelllloow
• Red indicates PID out for whole block
•
n indicates no outages
GGrreeeen
Alert Count
Shows the amount of alerts that are open over a given period. Selecting the Trend Detail Graph will
take you to Alert Trends if there are alerts for this program.
Status
Shows you if the program is up or down and if it is missing any PIDs.
Video and Audio QoE
Shows the average and minimum scores for the specified time period.
PVQ (eMOS)
Shows the average and minimum scores for the specified time period.
PCR PID Arrival Interval
Tells which PID is carrying PCR as well as the average arrival interval for a given time period.
Program PID Detail
Shows each PID associated with the program: the PID number, type, data content, PID average bitrate
and an indication whether and discontinuities, i.e., breaks in the sequence of MPEG transport packets
detected by Sentry’s continuity counter, have occurred.
Discontinuity
The presence of discontinuities; the absence of any indication means no discontinuities.
• Three types of PID indicators will be drawn for Video, Audio and Data PIDs. An indication
of Copy Generation Management System (CGMS), Closed Caption (CC), or scrambled
(Scrambled) data follows the PID type if applicable and you can click on a data type to
display the Data Detect Report for the program and the data type.
Sentry User Manual
March 2017
35
Page 40

Sentry User Manual
Figure 18: PID Types with details in bold
The PID Type descriptor displays the following:
Video
Video resolution
Refresh rate
Audio
Audio Mode (2.0 = stereo . 1.0= mono, 5.1 = surround sound)
Sample rate
Language version
Sentry User Manual
March 2017
Page 41

Sentry User Manual
ASI Models
The ASI model Sentrys will display PCR arrival interval and minimum, average, and maximum jitter over the
time range.
Figure 19: Program Status on an ASI Sentry
Sentry User Manual
March 2017
37
Page 42

Sentry User Manual
Program Search and display
You may search any Current Status or Program Status page in Sentry using the search box located in the
upper right corner of the table.
Figure 20: Program Search field. A search with “di” yields Discovery Home
The program search will search the current page based on what you enter into the field. You may enter either
the program name, or the service name.
The program search will only search for what is currently displayed. For example, if you have 100 programs on
the screen, but there are 137 programs overall, it will only search on the displayed 100 programs.
To conduct a search:
Program Search is a live search entry field meaning you only have to type your request and the search will
begin immediately. There is no need to hit return.
Sentry User Manual
March 2017
Page 43

Sentry User Manual
Column Sort By arrows
All primary column headers in the Program Status Report data include a Sort by arrow that allows for easy
sorting.
To activate, click on the desired column header once and the resulting screen will return the same page with the
available arrows in the column header.
Figure 21: Column header Sort By arrows
Bell Icon for Alert creation
When selected, the Bell Icon provides a drop-down menu of types of alerts that may be created for this
program.
Figure 22: Alert Types drop-down menu
Sentry User Manual
March 2017
39
Page 44

Sentry User Manual
Configure Report History
For historical reporting, the user is able to configure the time range of the report, either by choosing a Current
View as in the Program Status report or by specifying a range of time as in Program Detail.
Figure 23: Selecting a Current View
To specify the exact date and time you want the report to start and exactly when you want it to stop:
1. Select From:/To:
2. To display the calendar, click on the calendar icon adjacent to the From and To boxes.
3. Select the date that you wish to start or stop on and type it in the appropriate field.
4. Illegal dates such as From > To or future dates are prohibited and will be automatically reset to a legal
state.
5. The exception to this rule is the Ad Cue Info report where dates up to two weeks in the future are
allowed.
Figure 24: Report Calendar Option
To pick a specific time, either type in the time or click on the clock icon to bring up a clock entry dialog.
The minimum From/To interval is one minute. Entering an end time such that the time interval is less than one
minute will reset the begin time to one minute before the end time.
Sentry User Manual
March 2017
Page 45

Sentry User Manual
Figure 25: Report Clock Option
The pages that offer the From:/To: option also offer a drop-down option consisting of Most Recent and
Standard selections.
1. Select the (or) radio button and click on the desired setting.
For example, if you would like to see all activity for the last hour, you would select this menu item to
display 1 Hour. The default time period is 1 hour.
Figure 26: Report Option to Select Most Recent Time Range
2. Click the Refresh button to generate the report with the new configuration. You may see the message:
Generating Report.
3. For reports based on a most recent time period, real-time activity is included in the time period and will
continually update as time passes.
4. A time range set for a page will be preserved when the same page is selected again.
Sentry User Manual
March 2017
41
Page 46

Sentry User Manual
Configure Provider Name
The Current Status and Program Status reports allow you to select the source of the program provider, using
the Provider Name drop-down list. The list contains: Auto, XDS, SDT (if the data exists) and Mapping.
If Auto is selected (the default), then the provider name and icon are determined by the following logic:
If a Program-Provider mapping exists, display the mapping. (see Configure Mappings).
If any PID on the program has a BFS source, display the BFS name and icon.
If the program has XDS data, use the XDS provider name (or show name if there is no provider name)
to compare with mappings defined in the system.
If there is an exact match, display the XDS provider name and icon.
If there is a partial match, display the XDS provider icon only.
If there is no XDS data and SDT data exists, then use the SDT service name to determine the provider
name according to the above logic for XDS data.
If XDS or SDT is selected from the drop-down Provider Name list, then only the XDS or SDT, data is
used to determine the provider. SDT will appear in the list only if there is SDT data.
Figure 27: Auto Provider Name Selected (Default)
The Mapping method will ignore XDS and SDT data and just show any name mapped on the Program
Mappings page.
Sentry User Manual
March 2017
Page 47

Sentry User Manual
Other Configurable Items
Other configurable items include the ability to sort and to select the number of results displayed per page.
1. Select the sorting options from the Sort by drop-down menu. There are a number of different items to
sort from including Video and Audio QoE, PVQ, Bitrate, Availability or Error Seconds.
Figure 28: Options for Sorting
2. Select the results displayed per page from the Results per page drop-down menu.
3. Click Refresh to activate the selection.
Figure 29: Selecting Results per Page
A report can also be sorted by clicking on a column header. A report that has a Sort by drop-down menu will
sort ascending only.
A page that supports sorting by clicking on a column header only will toggle between ascending and
descending.
Sentry User Manual
March 2017
43
Page 48

Sentry User Manual
Program Bandwidth Graph
The Program Bandwidth Graph is a function of Sentry available through the Program Details screen.
Within this window, users may monitor specific details for a selected program and may create a detailed graph
in order to view the following areas:
Bandwidth Details
Shows the bitrates over a period of time for the selected service
Discontinuity Details
Shows the discontinuities for the selected service as well as PID counts
Alert Details
Shows the results of any previously set alerts
Program Details Screen
Access Program Details
From the Sentry welcome screen, choose the program you wish to view Program Details for by selecting its
logo or program name from the Displaying Programs list. For this example, we selected the logo for Outdoor
Life Network.
Figure 30: Selecting a program
Sentry User Manual
March 2017
Page 49

Sentry User Manual
From the Program Details screen, the user may view many of the details that:
a. Assist in assessing the health of the selected program
b. Assist in basic troubleshooting
The Program Details screen starts with information about the Port and PID at the top and allows for viewing
details for Bitrate, Quality of Experience, Audio Volume Level, Discontinuity and Alerts at the bottom of
the page.
Starting at the Date/Time selection field, select the time frame you wish to view.
From this point, the user may view the information regarding discontinuities on the port.
NOTE: The History graph is color coded using the Color Code Key in the upper right hand section of the
screen.
In the example below, the yellow graph indicates that the PID has been out for some time.
Refresh,
Stream and
Capture
buttons
Figure 31: Program Details screen
Color Key
Shows the color legend for screen
Error Seconds
PID Type
Descriptor
Color Code
A PID outage
Sentry User Manual
March 2017
45
Page 50

Sentry User Manual
Error Seconds
Error Seconds is a user customizable set of parameters used to define when a given program is available or
not.
Once set, whenever these parameters are exceeded a clock is started for that program and that amount of time is
represented as Error Seconds. It is calculated and displayed as an Availability percentage.
Figure 32: Error Seconds from the Program Detail screen
Figure 33: Error Seconds in all other locations
PID Type descriptor
Displays the following (if available):
Video:
• Video resolution
• Refresh rate
Audio
• Audio Mode (1.0 = mono . 2.0= stereo,, 5.1 = surround sound)
• Sample rate
• Language descriptor
o The Sentry will display the language descriptor exactly as described in the stream.
Sentry User Manual
March 2017
Page 51

Sentry User Manual
In the next table, the user can see the specifics of each PID on the given port. In the example, the MPEG 2
video and one channel of the Dolby AC3 audio were in good shape (GGrreeeenn) while the Ad Cue info and second
Dolby channel where out for the whole block (RReedd).
To view a graph for the bitrate over a given amount of time for the PID, select the Graph Selected PIDs button
located below the Port and PID information.
Figure 34: Graph Selected PIDs
The resulting graph will look similar to the one below.
Figure 35: Bitrate Graph
Refresh Thumbnail
Manually refreshes current thumbnail.
Capture button
Captures stream. Collects same information as Triggered By User button. (See Configure Stream Captures).
Stream button
The Stream button opens a separate dialog box that allows you to configure where to send the UDP unicast.
The network path has to allow UDP unicasts from the Sentry and the receiving computer/device. You may also
have to open the specified port in your computer’s firewall.
Sentry User Manual
March 2017
47
Page 52

Sentry User Manual
Configure VLC to receive stream to view content
For an additional viewing option Video LAN Client (VLC) is a free player for files and streaming protocols.
Installing VLC on a computer allows you to receive the Stream to View. This is an optional viewing utility.
1. Download and install VLC.
2. Open VLC.
3. Browse to Media> Open Network Stream.
4. Enter the following into the address box for the network URL:
Udp://@:<port to stream to> where <port to stream to is a number between 1024 and 65535>.
In the example below, 8000 is used
Figure 36: VLC Install
5. Click Play.
6. From the Program Detail Report, click on the Stream button.
7. Enter in your computer’s IP address and desired UDP port (such as 8000) in the IP address field.
8. Choose the duration of stream.
Sentry User Manual
March 2017
Page 53

Sentry User Manual
Figure 37: Stream to View parameters
9. Click Start
10. You should now see the stream appear in VLC.
Sentry User Manual
March 2017
49
Page 54

Sentry User Manual
Detailed Graph View
To see more detail on the graph, click on the graph itself and draw a box around the area you wish to view.
The graph will then reload and display a more detailed view of selected time frame. In the example below, we
selected a Time Range between 10:07 AM and 10:17 AM and the resulting graph went from a span of activity
covering a 15 minute span to a graph showing activity for every 10 seconds.
Figure 38: Selecting a section for a detailed view
NOTE: To return to the original graph, select Reset View from the top right of the screen.
Sentry User Manual
March 2017
Page 55

Sentry User Manual
Figure 39: Reset the graph to its original view
Other Program information
Program Availability
Program Availability is the number of non error seconds over total number of seconds for a specified time
period. It is expressed as a percentage.
Other Program Information
• PCR Program Clock Reference,
• PMT programs Map Table
• IDR Instantaneous Decoder Refresh
• EBP Encoder Boundary Point
• SDT Service Description Table
• XDS Extended Data Services
Figure 40: Program Availability and Other Program Information
To configure Program Availability definitions, please see the Configuring Program Availability Definitions
section of this manual.
Sentry User Manual
March 2017
51
Page 56

Sentry User Manual
Quality of Experience Details
The Quality of Experience (QoE) details allow the user the unique option to assess a smart approximation of
the frustration level of an average viewer. This approximation pretends that an average viewer is watching a
certain channel while holding a dial that indicates how much he likes or dislikes the quality of the picture he is
watching (with 100 being the best score and 0 being the worst). When the quality of the picture is good, he will
leave the dial alone at the 100 setting.
However, should an event such as tiling, freezing, macro-blocking, etc, affect the quality of his viewing
experience, he will turn down the dial. The fictional viewer will keep the dial turned down for a short time past
when the picture recovers until his confidence starts to recover. As his confidence returns, he will slowly return
the dial to the top setting.
The QoE score is decided by:
Analyzing where on the screen the picture degraded
How large of a problem it is
How frequently it occurs
The event is noted, analyzed and reported on the Quality of Experience Details screen.
Figure 41: Examples of Major tiling/long duration . . . and Minor Tiling/short duration
Access the QoE Details
1. Select the logo/name of the desired program from any Sentry page.
2. This will take you directly to the Program Details screen.
3. Expand the Quality of Experience Details region by clicking on the appropriate arrow.
Figure 42: Expanding the QoE region
Sentry User Manual
March 2017
Page 57

Sentry User Manual
The graph is shown in real-time, though it does not represent regular intervals.
NOTE: Colors that appear at the beginning of a graph will remain that particular color throughout.
For example a video PID that has a blue label on detail section will also appear as blue in the
subsequent detailed graphs. A red labeled PID would stay red.
Color Codes Key
Drops in confidence
Figure 43: Expanded Quality of Details Region Graphing a blue coded 272 PID
Average Video QoE from the Program Status Page
The Average QoE score may also viewed from the Program Status page. The score in the parenthesis is the
minimum for the time frame specified at the top of the report.
Figure 44: Average Video QoE column
Sentry User Manual
March 2017
53
Page 58

Sentry User Manual
Scoring QoE
The Minimum and Average Quality Numbers indicate a particular time frame the user is looking at.
The Average Video and Audio QoE scores can also be found on the Program Status report.
In this example, the graph shows three incidences of a Quality of Experience drop.
Initial drops in confidence
Figure 45: Quality of Experience Graph showing the initial drops in confidence
In this example, you can see the initial drop in the video QoE score followed by a flat spot. The flat spot
represents the lowered confidence that the customer is experiencing due to the initial drop. These flat sections
are not necessarily a continuing issue but rather represent a confidence drop for the average viewer.
Once the initial impacting event has cleared and the customer’s confidence is restored, the QoE score will
slowly increase.
Lingering Confidence drops after initial drop
Figure 46: Lingering confidence drops, not necessarily a continuing issue
In addition to displaying the QOE scores, Sentry also reports the reason(s) why the QOE scores went down.
The QoE reason codes are shown directly below the QoE graph and correspond to the beginning of the QoE
drop.
For example, if the QoE score is 0 for a period of 1 minute and the reason code is Video Syntax Error, the
reason code is shown as a bar at the beginning of the 1 minute period.
Sentry User Manual
March 2017
Page 59

Sentry User Manual
Reason Codes
QoE drop
Reason Codes
Figure 47: QoE drops with codes
Reason codes are also added to the SNMP QOE alert notifications.
Sentry User Manual
March 2017
QoE drop
55
Page 60

Sentry User Manual
Reason Codes Definitions
Reason Code Definition
Audio Buffer
Overrun
Audio Buffer
Underrun
Audio Packet Loss
Audio PID Dropout
Audio Syntax Error
eMOS(PVQ)
Missing Video Slice
Port dropout
Unexpected Video
Header
Video Packet Loss
Video Buffer
Overrun
Video Buffer
Underrun
Video PID Dropout
Video Syntax Error
Buffer timing violation causing buffer overrun and is greater than or
equal to 100ms.
Buffer timing violation causing buffer underrun is equal to 0 seconds,
meaning that the buffer is empty.
When there are CC errors or incomplete audio frames are received, but
the dropout is small (less than 200 msec)
When there is a dropout (may or may not be accompanied by a CC error)
and dropout duration greater than 200 msec.
When there are no CC errors but there is an error in audio frame decode.
Generates an alert when the PVQ drop more than 20% in 5 seconds.
This is not coupled with any particular QOE event or alert.
Slice start code missing.
When there is a transport dropout of at least 5 seconds.
The video header was an unexpected value.
There are CC errors but the dropout is small (i.e., duration of dropout is
less than 200 msec.)
A video frame's DTS value was > 3 seconds for MPEG-2 or > 5 seconds
for H.264 behind the current PCR resulting in a decode buffer overrun.
A video frame's DTS value was >= the current PCR resulting in a
(decode) buffer underrun.
When there is a dropout (may or may not be accompanied by a CC error)
and the dropout duration is longer than greater than 200 msec.
A CC error is not the only indication of a dropout. There can also be start
code errors in video or incomplete audio frames due to dropout. If the
duration of dropout is long, it qualifies for the PID dropout reason code.
An unexpected state occurred while decoding video slice data.
NOTE: A CC error will never generate a reason code of Syntax Error because cc errors clearly indicate
data loss. It will generate either Packet Loss or PID Dropout reason codes.
Sentry User Manual
March 2017
Page 61

Sentry User Manual
Perceptual Video Quality (eMOS)
Sentry offers PVQ (or effective eMOS) and Video QoE as two separate alerting and reporting systems. This
gives you the ability to evaluate compression artifacts separately from video errors. In this case, independent to
the configuration to include or to exclude eMOS contribution in video QoE, the user can always evaluate
eMOS as a distinct metric and as one of the key performance and quality indicators.
Figure 48: Perceptual Value Quality(eMOS) drops
There are two primary uses for video quality monitoring:
Real time alerting:
Use combined video QoE + eMOS to generate real time alerts when the score drops to a certain level
for a period of time (e.g., below 75 for more than 10 seconds) or for a certain number of times in a
duration (e.g., below 75 for 5 times in one minute), so operators can fix the problem before a large
number of viewers are impacted.
Generate comprehensive KPI reports for uptime and quality levels over time
Use Sentry Program Statistics (non-alert based) report for quantitative analysis. Use Sentry Alert
Analysis (user sets alerts) for qualitative analysis.
Sentry User Manual
March 2017
57
Page 62

Sentry User Manual
Over-compression Artifacts
Unlike macro-blocking, which is caused by errors, over-compression artifacts can take place when the video
has no errors in the payload and the picture can be structured correctly for the screen. However, the picture
quality seems degraded to the viewers.
This often takes place in clips involving high motion and complex scenes when there are not enough bits
available in the compressed video to clearly present necessary details needed to deliver a high quality picture.
Sentry can accurately detect these non-error-related video artifacts and score them as PVQ (or eMOS), which
ranks video quality in a similar way as a Mean Opinion Score (MOS). eMOS can be used (in the case when
there are no technical errors in the transport stream) to measure perceptual video quality in the compressed
stream.
Figure 49: GOP, Picture, Slice, and Macroblock
Figure 50: Picture on the left shows compression ar tifac ts in the back gro und and the picture on the right shows
clear of compression artifacts.
Sentry User Manual
March 2017
Page 63

Sentry User Manual
Group of Pictures (GOP) Length Reporting (Group of Pictures)
The GOP (Group of Pictures) Size table displays the Average, Maximum, and Minimum GOP size for the
specified time period.
Figure 51: GOP display
Sentry User Manual
March 2017
59
Page 64

Sentry User Manual
Audio Volume Level Details
Audio Volume Level Details allows you to track problems within the actual audio stream, or audio PID. This
monitoring and report feature allows the user to address the common problem that exists with varying volume
levels on different channels (evident when the viewer changes channels) or during commercial inserts. Sentry
will monitor and report this problem so it can be adjusted by the operator.
This function differs from Sentry’s Audio Quality of Experience in that each one measures different qualities.
Functionality
Sentry decodes and analyzes the audio stream in order to determine the true energy level so it can detect issues
such as low perceived level. Sentry also reads the Dialnorm that has been encoded in the metadata. The
resulting graph is a good representation of how the human ear will perceive the audio with respect to where the
Dialnorm is set to.
NOTE: The value of the Dialnorm in a bit stream should indicate the level of the average spoken
conversation within the encoded audio program.
Audio loudness measurement is supported on the following audio codecs:
• AC3
• E-AC3 (Dolby Digital Plus)
• AAC
• HE-AAC v1 and v2
• MPEG-2
Access Audio Level Details
1. Select the logo/name of the desired program from any Sentry page.
2. This will take you directly to the Program Details screen.
3. Expand the Audio Volume Level Details region by clicking on the appropriate arrow.
Figure 52: Expanding the Audio Volume Level Details region
Sentry User Manual
March 2017
Page 65

Sentry User Manual
Graphing
A graph of the primary PID will be generated by default, although either PID can be selected for graphing.
Dynamic Range
Primary PID
Dialnorm
Zoom Scale
Figure 53: Audio Levels
Dashed line
Represents the Dialnorm level that is specified in this audio stream.
Solid line
Represents the weighted average audio level.
Shaded area
While the audio is measured on a continuous basis, the minimum and maximum points are not
continuously displayed. This makes the graph clearer and easier to read.
The shaded areas are not markers of time, but rather markers of the minimum and maximum audio
levels.
In the example below, the average audio level is much lower than the specified Dialnorm for this stream. To
the audience, the audio would be perceived to be quieter than it should be.
Maximum level
Minimum level
Figure 54: Audio Levels with poor volume
Sentry User Manual
March 2017
61
Page 66

Sentry User Manual
Thumbnail Timeline
Thumbnail Timeline captures thumbnail images to help visually confirm the relative location of audio issues
(i.e., during programming or commercials). This function supports both MPEG-2 and H.264 thumbnails.
Figure 555: Thumbnail Timeline
Sentry User Manual
March 2017
Page 67

Sentry User Manual
Discontinuity Details
Discontinuity is defined by a missing or out of sequence MPEG packet. Discontinuities can result in various
levels of audio and video problems depending on the number and frequency of occurrence.
The Discontinuity Detail graph allows you to view the number of discontinuities over time. You can use this
information to troubleshoot or look for large patterns or spikes of discontinuities.
Figure 56: Discontinuity Graph and table
Sentry User Manual
March 2017
63
Page 68

Sentry User Manual
Alert Details
Alert Details has two different views that the user may select from the drop-down menu: open alerts and all
alerts triggered in a time frame.
Open alerts shows the user the current active alerts for this program.
In this example, a No alerts have been triggered message is returned.
Figure 57: Alert Details with no triggered alerts
To see all alerts instead of just the open alerts, select all alerts triggered in time frame from the drop-down
menu. This view shows you all of the alerts, either active or cleared, in the time frame specified at the top of
the page.
Figure 58: Alert Details expanded
Sentry User Manual
March 2017
Page 69

Sentry User Manual
PCR Details
To access detailed information about a program’s PCR PID, click on the PCR link on the program detail
report.
Figure 59: Program Detail report
The PCR Details page will show summary values and detailed graph for the following PCR statistics:
PCR Drift
PCR Frequency Offset
PCR Jitter
PCR Cycletime
Figure 60: PCR Details page
As with all graphs, you can zoom in on any graph to narrow your time range. Just click on the graph where you
want to start, hold the mouse down, drag to where you want to end and release the mouse.
Sentry User Manual
March 2017
65
Page 70

Sentry User Manual
Other helpful operations:
• Click the Zoom In link to look at a shorter time window.
• Click the Reset View link to return to the report’s original timeframe.
• Click the Link link to modify the report URL to show the current timeframe that you are
viewing. When zooming in on the graph the report URL does not change, so this option is
helpful if you want to copy and paste the URL into a message or an email.
• Click the Zoom Out link to look at a longer time window.
Sentry User Manual
March 2017
Page 71

Sentry User Manual
Data Detect
The Data Detect report is a detailed report on specific content within the MPEG transport stream.
Figure 61: Data Detect Report Types
Report Types
Copy Generation Management System (CGMS)
Check one or more of the boxes to see if CGMS embedded data is or is not present in the video PID. As
defined in EIA/CEA-608-B, CGMS provides a mechanism for content creators to inform a consumer electronic
device, such as a personal video recorder (PVR), advanced set top receiver, etc., as to whether the content may
be stored or copied. There are three different modes for this data type.
No Restriction
Any video stream can be copied to any device. In the case of a VCR connected to the output of a PVR
or TiVo device, any stored video files can be copied to a VCR tape.
No Copy
No video stream can be copied to any device. In the case of a VCR connected to the output of a PVR or
TiVo device, no stored video files can be copied to a VCR tape.
1 Copy
A video stream be copied to any device only once. In the case of a VCR connected to the output of a
PVR or TiVo device, any stored video files can be copied only once to a VCR tape.
Sentry User Manual
March 2017
67
Page 72

Sentry User Manual
Closed Caption Data
From this report, you can select CEA-608, CEA-708, and SCTE-20 Closed Captioning reporting, in addition
to the existing Closed Captioning options. You can also configure new Program Alerts to monitor and report
occupancy and error rates for these standards.
608
Refers to the specification EIA/CEA-608-B for encoding data into NTSC video on video line 21. This
is the traditional location for closed captioning, XDS (e.g., program names, v-chip), and analog
interactive television triggers.
708
Refers to the specification CEA-708 “Digital Television DTV Closed Captioning”, also known as
ATSC/53 captioning. Most DTV/ (including HDTV) programming that includes closed captioning
uses this standard. Many programs that are converted from NTSC to HDTV have both 608 and 708
data embedded simultaneously.
SCTE-20
Refers to the specification ANSI/SCTE-20 for carriage or embedding of Vertical Blanking Interval
(VBI) services into MPEG compliant bitstreams. This method is favored by North American cable
operators to encode traditional VBI line-21 (EIA-608) closed captioning into digital cable MPEG
bitstreams.
To view the Closed Captioning errors, hover your mouse pointer over any orange or red block for more
information.
Figure 62: Hover your pointer over any orange or red block to see the closed caption errors
Sentry User Manual
March 2017
Page 73

Sentry User Manual
Other Data
Scrambled
Indicates the presence of scrambled (i.e., encrypted) MPEG transport packets as described in ISO/IEC
13818-1. There are multiple indicators within a transport stream that instruct down-stream equipment
to scramble the stream; however, this indicator reflects whether the transport packets actually are
scrambled or not.
Discontinuity
Indicates a break in the sequence of MPEG transport packets for a particular PID. Dropped packets or
a hard splice will generally result in discontinuities being indicated. Dropped packets can sometimes
result in poor video or audio quality.
Teletext
Refers to a television information retrieval service developed in the United Kingdom. It offers a range
of text-based information, typically including national, international and sporting news, weather and
TV schedules.
Subtitles
Refers to closed-captioning data that is transmitted in the teletext signal.
Sentry User Manual
March 2017
69
Page 74

Sentry User Manual
Generate a Report
The Data Detect report displays a status key to display the detection of Closed Captioning errors, in addition
to the current tiles indicating the detection of Closed Caption data. It also supports reporting the percentage of
invalid and partially invalid Closed Captioning data.
1. After choosing the report type, select Generate Report to view the report based on the criteria you
have selected.
Figure 63: Data Detect Report
2. From screen you can see the status key and the closed captioning status.
Figure 64: Data Detect Report
3. From the Data Detect report you can click on a Program number a view the Program Detail View.
Sentry User Manual
March 2017
Page 75

Sentry User Manual
Figure 65: Program Detail from the Data Detect Repor t
4. A Data Detect Report can also be generated for one program only from the Program Status page or
the Program Detail page by clicking on a link that represents one of the Data Detect report types, i.e.,
CC, CGMS, and Discontinuity.
5. The Data Detect report is automatically generated for the selected program and the selected report
type. Other report types can be generated for the selected program by choosing the report type and
clicking Generate Report.
Sentry User Manual
March 2017
71
Page 76

Sentry User Manual
Ad Cue Info (Digital Ad Insertion)
With the advent of digital ad insertion, it has become difficult for both cable operators and the vendors of
digital ad insertion equipment to verify that specific ads have actually run as contracted.
Ad insertion systems separate splicing commands from the input transport stream, switch between the network
feed and the local ad server, and provide signaling and coordination. Using the SCTE 35 splice format
identifier values, Sentry is able to monitor the commands that are being sent to the ad insertion device. These
values include:
Splice insert
Splice null
Splice schedule
Time signal
Bandwidth reservation
Reserved
Private commands
Access Ad Cue Info
1. To view the commands that Sentry monitors, select Reports and then Programs: Ad Cue Info from
the main page menu.
Figure 66: Ad cue Info menu
2. Next, select the time range of interest.
Sentry User Manual
March 2017
Page 77

Sentry User Manual
Figure 67: Ad Cue Info Welcome
3. Select the Program Group and Sort By options as needed
4. Select Refresh to see the Ad Cue Info results.
NOTE: The Ad Cue Info report allows a time range up to two weeks in the future. This is the only
report that allows future times!
Sentry User Manual
March 2017
73
Page 78

Sentry User Manual
Reading the Ad Cue Info report
Sentry monitors the Event IDs for the ads that are sent to the ad insertion device. Matching the Event IDs
with the ad log of the ad insertion device will verify that the ad was received but there is no guarantee that the
ad actually ran.
If Sentry reporting shows that the video and audio in the transport had no problems at the time of the ad, then it
is likely that the ad ran.
The Ad Cue Info reports displays the in points and the out points of the ad cue message that are used to signal
the start and end of an insert and the Event IDs of the insert messages.
To drill down on the graph, select a portion with your mouse. Select Reset View to go back to the original
graph.
Figure 68: Ad Cue Info Report
Sentry User Manual
March 2017
Page 79

Sentry User Manual
Click on a program link in the Pgm column to view the details for the ads of the selected programs.
Figure 69: Ad Cue Info Detail Report
Type
The radio buttons directly above Type allow you to choose whether you want to see all command types, Splice
Insert Only, or Non-Splice Insert Only.
Event ID
Hover your mouse over the graphical display of an ad insertion point and a popup window will show up with the
Event ID, the direction of the splice message, and the time that it occurred.
Event Source
The Event Source indicates how the ad cue was inserted into the stream. It is only relevant for Splice Insert
Event. Such events will be one of the following:
Original: Cue embedded in original source material
Automation: Cue created by automation system switching
Live: Cue created by live event trigger system
Local: Cue created by local content replacement system
Sentry User Manual
March 2017
75
Page 80

Sentry User Manual
Direction
Indicates if the splice message is running In or Out.
Event Type
Ads are either component (PID Event) or composite (Program Event).
A composite ad interrupts the program’s audio and video ( Event Type = Program Event).
A component ad interrupts one or more but not all of the PIDs in a program (Event Type = PID
Event).
Status
The Status of an ad cue splice insert is either Active, indicating that it was valid when it ran, or Obsolete,
indicating that it was replaced by another event before it ran.
Pre-roll
For splice insert events, the amount of time between the sending of the event and the actual running of the ad.
Descriptor
Each ad splice command might contain additional descriptor information that carries additional data about the
specific command. When descriptor information is present for a command, the Descriptor column will have a
View link. Hover over that link to see the descriptor for that command.
Sentry User Manual
March 2017
Page 81

Sentry User Manual
Ad Splice Command Types
The Ad Splice Command Types graph displays all of the command types that were sent.
Each command may also contain descriptor information.
To view the descriptor information for a command type, hover over the appropriate bar on the graph.
Figure 70: Hover over bar graph for Descriptor Information
The resulting pop up is the Descriptor information for that command.
If there is more than one command of a given type shown by the bar, the descriptors for the first two commands
will be displayed.
Sentry User Manual
March 2017
77
Page 82

Sentry User Manual
Drill down/Zoom In
To drill down on the graph, select the desired portion of the graph with your mouse by right clicking and
dragging left to right. This will enable you to see the Descriptor information for any command.
You can also select which command types you would like to show on the graph by clicking the checkboxes on
the legend.
Figure 71: Ad Splice Command Types
Pre-roll
The number of commands by type runs up and down on the graph and the number of days scrolls left to right.
If the blue bar represents more than two commands, the descriptor for ONLY the first 2 commands will be
shown.
To see the Descriptors for the rest of the commands, you will need to zoom in on the graph.
The Ad Splice Command Types graph shows all commands as they were detected. For splice insert
commands, this will generally be before the associated splice insert event (as indicated by the pre-roll time).
Viewing the two graphs together allows a visual display of the pre-roll time, in addition to commands that were
subsequently overwritten by other commands.
Blackout Detection
If an Ad Splice command contains one or more blackout periods, a horizontal black bar will be displayed at the
bottom of the graph for each blackout period.
You can see details of the command containing the blackout information by reviewing the command
descriptors for the command at the start of the blackout period.
Hover for Command
Figure 72: Blackout period and Command Descriptors
Sentry User Manual
March 2017
Blackout Period
Page 83

Sentry User Manual
Repeated commands
There are times during normal operation when the same Ad splice command is repeated over and over (as
frequently as every second). Rather than cluttering the graph and overloading the system with each such
occurrence, you will see a red * (asterisk) underneath a bar on the Ad Splice Command Types graph.
Figure 73: Asterisk showing there are multiple occurrences of the same command
Hover over the vertical bar to review the descriptor information for that command. You will see the count of
commands that Sentry is grouping into that single bar.
Figure 74: Descriptor information showing 12 occurrences of a c om mand.
For repeated commands, the event count will also be displayed on the detailed table at the bottom of the report.
Figure 75: Multiple commands as shown in the report
Audio Level Graph
The Audio Level graph can be used to see how the audio level changed during ad cue insertion.
Figure 76: Audio Level Graph
Sentry User Manual
March 2017
79
Page 84

Sentry User Manual
Program Statistics (Report and Export)
The Program Statistics report gives you non-alert based statistical data from your programs. You can use this
information to observe trends over time for such items as audio volume levels, bit-rates, QoE scores, etc.
The Program Statistics page simplifies access to summary program data by providing a set of navigational
tabs:
Summary
Summary of saved reports.
Create/Edit
Create and/or edit a report.
History
Access Program Statistics:
Select Reports and then Program Statistics.
Provides a history of the emails for scheduled reports.
Figure 77: Summary, Create/Edit and History tabs
Tab View
Summary tab
Displays which reports have been created and saved.
Private reports are only viewable from your login.
Public reports are viewable to anyone who can log in.
Sentry User Manual
March 2017
Page 85

Sentry User Manual
Create/Edit tab
Allows you to generate the following data when creating or editing a report:
Maximum and minimum and averages of video QOE, audio QOE and volume levels
Totals for bitrate and discontinuities
Maximum and minimum and averages of GOP length
Maximum and minimum and averages of PVQ
Create a Program Statistics Report
1. Select the Create/Edit tab.
Figure 78: Generating a Statistics Report set up
2. Select your time frame.
a. You can further restrict the time range by selecting Further Limit This Time Range.
b. Select your desired schedule from the drop down menu. In this example we selected
Weeknight Primetime.
c. Select the Search Glass
information on how to create schedules.
Schedule Search Glass
to see the selected schedule. See Configure Schedules for
Figure 79: Weeknight Primetime schedule
3. Select the Statistics you want to view.
4. Sort and limit as desired.
Sentry User Manual
March 2017
81
Page 86

Sentry User Manual
5. Select Generate Report.
6. The Displaying Program box appears.
7. Review all data.
a. Select column header to sort data.
7a
9a
8
Figure 80: Exporting as CSV
8. Selecting the Export as CSV button allows user to export visible data as a CSV (Comma Separated
Value) file that you can put into a spreadsheet application for further analysis.
9. When you are satisfied with the report output:
a. Select Save Report. The screen will reload to show the save options.
b. Name your Report.
9b
9c
9d
Figure 81: Saving the Report
Sentry User Manual
March 2017
Page 87

Sentry User Manual
c. Choose Private use only or Share with others.
d. Select Save.
10. Once you have saved the report, you can schedule it to run and automatically email you the results.
a. Select Schedule Report and follow steps as per Scheduling Email portions of this manual.
Figure 82: Scheduling the report
Figure 83: Scheduling steps
Sentry User Manual
March 2017
83
Page 88

Sentry User Manual
11. For Step 3, select who you want to email
12. Schedule how long you want the report to run.
13. Select Update Schedule when complete.
History tab
The History tab shows you the history of the email for scheduled program statistic reports.
NOTE: The program stats CSV export includes the selected stop and start times (for the time period the
user selected).
Sentry User Manual
March 2017
Page 89

Sentry User Manual
Port Statistics
Port Statisitics provides non-alert data on a port level that allows you to see information on the transport
bitrate and other releveant statistics.
Summary tab
The Summary tab shows the list of Public and Private saved reports.
Figure 84: Port Statisitics
Sentry User Manual
March 2017
85
Page 90

Sentry User Manual
Create a Port Statistics Report
1. Select the Create/Edit tab.
2. Choose date/time frame for your report.
3. Select Statistics.
Figure 85: Setting the date or time range
4. Choose any Statisitics you to include.
5. Select Accept.
Figure 86: Secting the statistics to include
6. Select any other filter filters you wish to apply.
Sentry User Manual
March 2017
Page 91

Sentry User Manual
7. Select Generate Report.
Figure 87: Generate the report
Figure 88: Port Statisitics displayed
Sentry User Manual
March 2017
87
Page 92

Sentry User Manual
Program Groups
Program Groups allows you to customize any programs on Sentry as a group for convenient alert template
application and for problem isolation. For example you can create Program Groups by their content type
(music program group, HD program group) for applying the most appropriate type of alert. If Sentry is set up
to monitor the same programs at different locations (e.g., acquisition vs. post multiplexing), you can create two
program group respectively by different location for comparison and for problem isolation.
For more info on the Program Status, Data Detect and Ad Cue Info reports, see the respective sections in
Programs.
Using Program Groups
Program Groups have several additional functions once they have been created. Our example below,
Current Status, is just one of the many reports that can be used.
1. From the Reports toolbar, select Current Status under the Program Groups header.
Figure 89: The Current Status Welcome page
Sentry User Manual
March 2017
Page 93

Sentry User Manual
2. Select a Program Group and then click the Refresh button.
Figure 90: Selecting a Program Group
3. The programs that were in the selected group and its current status will populate in the bottom display.
NOTE: You are not choosing a PORT at this point, you are choosing a PROGRAM.
Figure 91: Displaying the Program group
4. Repeat the steps as needed to use Program Status, Data Detect or Ad Cue Info.
Sentry User Manual
March 2017
89
Page 94

Sentry User Manual
Program Groups Bandwidth
Program Groups Bandwidth provides a per program stacked bandwidth graph for a defined program group.
This report provides a visual understanding of overall transport bandwidth as well each individual program’s
bandwidth.
Examples for use would include:
Planning for transports
Examining existing transports
Figure 92: Program Group Bandwidth
Sentry User Manual
March 2017
Page 95

Sentry User Manual
Access Program Groups Bandwidth
1. Select Bandwidth from the Reports menu.
Figure 93: Accessing Program Group Bandwidth
2. Choose your time frame
3. Choose program group
4. Select Refresh.
Figure 94: Selecting time frame and Program Group
Sentry User Manual
March 2017
91
Page 96

Sentry User Manual
In this example the transport streams bandwidth was graphed for one hour. You can see that some programs
take more bandwidth than others.
The pink line (Program 75) is using more bandwidth than the olive green line (program 73).
Figure 95: Program Group Bandwidth result
Sentry User Manual
March 2017
Page 97

Sentry User Manual
Dynamic Program Groups
Dynamic Program Groups allow you to define a program group based on dynamic program attributes instead
of just listing the program numbers.
Select Configure and Dynamic Program Groups from the main menu.
The resulting page will be a list of all of the existing Dynamic Program Groups.
Figure 96: Dynamic Program Groups
Sentry User Manual
March 2017
93
Page 98

Sentry User Manual
Create a New Program Group
Scroll down to Program Group Configuration and either select a current filter (or filters) or create a new one.
Example 1: Create a new Dynamic Program Group that uses new Program Group Configuration
criteria
1. Select Show more filters types…
Figure 97: Program Group Configuration
2. Choose the criteria section and click Add next to the name.
Figure 98: Selecting the criteria
Sentry User Manual
March 2017
Page 99

Sentry User Manual
3. In this example, we want to create an Audio Channel Count filter that only shows services that
contain 2 audio channels.
Figure 99: Setting the Audio Channel Count part 1
4. Enter in the filter criteria and a name for the filter. Click Save.
Figure 100: Setting the Audio Channel Count part 2
5. You will now see the filter that we just created.
Figure 101: Named Audio Channel Count
Sentry User Manual
March 2017
95
Page 100

Sentry User Manual
6. Now that you have created the filter criteria the next step is to create the Dynamic Program Group.
7. Enter a name for the Dynamic Program Group in the Short Name dialog box.
a. Continuing our previous example, call it Audio PID Count = 2.
b. Next click on the filter criteria that was just created. It will turn green and the Criteria dialog
box will list the criteria.
Short Name Dialog box
Figure 102 Entering the Short Name and selecting the Filer Critera box
8. Click Save. Now we can use this Dynamic Program Group anywhere that Program Groups are
used.
Example 2. Create a new Dynamic Program Group that has more than one filter criteria
Figure 103: Multiple filter critera
Sentry User Manual
March 2017
 Loading...