

Page 1

RT-EyeR Serial Compliance and Analysis
Quick Start User Manual
www.tektronix.com
071-1769-00
Page 2

Copyright © Tektronix, Inc. All rights reserved. Licensed software products are owned by Tektronix or its suppliers and are protected by
United States copyright laws and international treaty provisions.
Use, duplication, or disclosure by the Government is subject to restrictions as set forth in subparagraph (c)(1)(ii) of the Rights in Technical
Data and Computer Software clause at DFARS 252.227-7013, or subparagraphs (c)(1) and (2) of the Commercial Computer Software −
Restricted Rights clause at FAR 52.227-19, as applicable.
Tektronix products are covered by U.S. and foreign patents, issued and pending. Information in this publication supercedes that in all
previously published material. Specifications and price change privileges reserved.
TEKTRONIX and TEK are registered trademarks of Tektronix, Inc.
RT-Eye is a registered trademark of Tektronix, Inc.
Contacting Tektronix
Tektronix, Inc.
14200 SW Karl Braun Drive or P.O. Box 500
Beaverton, OR 97077 USA
For product information, sales, service, and technical support:
H In North America, call 1-800-833-9200.
H Worldwide, visit www.tektronix.com to find contacts in your area.
Page 3

Warranty 9(b)
Tektronix warrants that the media on which this software product is furnished and the encoding of the programs on the media will be free
from defects in materials and workmanship for a period of three (3) months from the date of shipment. If any such medium or encoding
proves defective during the warranty period, Tektronix will provide a replacement in exchange for the defective medium. Except as to the
media on which this software product is furnished, this software product is provided as is" without warranty of any kind, either express or
implied. Tektronix does not warrant that the functions contained in this software product will meet Customer’s requirements or that the
operation of the programs will be uninterrupted or error-free.
In order to obtain service under this warranty, Customer must notify Tektronix of the defect before the expiration of the warranty period. If
Tektronix is unable to provide a replacement that is free from defects in materials and workmanship within a reasonable time thereafter,
Customer may terminate the license for this software product and return this software product and any associated materials for credit or
refund.
THIS WARRANTY IS GIVEN BY TEKTRONIX WITH RESPECT TO THE PRODUCT IN LIEU OF ANY OTHER WARRANTIES,
EXPRESS OR IMPLIED. TEKTRONIX AND ITS VENDORS DISCLAIM ANY IMPLIED WARRANTIES OF MERCHANTABILITY OR
FITNESS FOR A PARTICULAR PURPOSE. TEKTRONIX’ RESPONSIBILITY TO REPLACE DEFECTIVE MEDIA OR REFUND
CUSTOMER’S PAYMENT IS THE SOLE AND EXCLUSIVE REMEDY PROVIDED TO THE CUSTOMER FOR BREACH OF THIS
WARRANTY. TEKTRONIX AND ITS VENDORS WILL NOT BE LIABLE FOR ANY INDIRECT, SPECIAL, INCIDENTAL, OR
CONSEQUENTIAL DAMAGES IRRESPECTIVE OF WHETHER TEKTRONIX OR THE VENDOR HAS ADVANCE NOTICE OF THE
POSSIBILITY OF SUCH DAMAGES.
Page 4

Page 5

Table of Contents
General Safety Summary iii. . . . . . . . . . . . . . . . . . . . . . . . . . . . . . . . . . . . . . . . . . . . . . . . . . . . . . . . . . . . . . . . . . . . .
Preface v. . . . . . . . . . . . . . . . . . . . . . . . . . . . . . . . . . . . . . . . . . . . . . . . . . . . . . . . . . . . . . . . . . . . . . . . . . . . . . . . . .
Getting Started
Key Features 1. . . . . . . . . . . . . . . . . . . . . . . . . . . . . . . . . . . . . . . . . . . . . . . . . . . . . . . . . . . . . . . . . . . . . . . . . .
Using Compliance Modules 2. . . . . . . . . . . . . . . . . . . . . . . . . . . . . . . . . . . . . . . . . . . . . . . . . . . . . . . . . . . . . . . .
Ensuring Compatibility 2. . . . . . . . . . . . . . . . . . . . . . . . . . . . . . . . . . . . . . . . . . . . . . . . . . . . . . . . . . . . . . . . . . .
Minimum Required System Configuration 3. . . . . . . . . . . . . . . . . . . . . . . . . . . . . . . . . . . . . . . . . . . . . . . . . .
Other Requirements and Restrictions 5. . . . . . . . . . . . . . . . . . . . . . . . . . . . . . . . . . . . . . . . . . . . . . . . . . . . .
Using Accessories 5. . . . . . . . . . . . . . . . . . . . . . . . . . . . . . . . . . . . . . . . . . . . . . . . . . . . . . . . . . . . . . . . . . . . . .
Installing the Application 5. . . . . . . . . . . . . . . . . . . . . . . . . . . . . . . . . . . . . . . . . . . . . . . . . . . . . . . . . . . . . . . . . .
Connecting to the Device Under Test 6. . . . . . . . . . . . . . . . . . . . . . . . . . . . . . . . . . . . . . . . . . . . . . . . . . . . . . . . .
Typical Probing Configurations 6. . . . . . . . . . . . . . . . . . . . . . . . . . . . . . . . . . . . . . . . . . . . . . . . . . . . . . . . . .
Calibrating the Oscilloscope and Probes 8. . . . . . . . . . . . . . . . . . . . . . . . . . . . . . . . . . . . . . . . . . . . . . . . . . . . . . .
Operating Basics
Starting the RT-Eye Application 11. . . . . . . . . . . . . . . . . . . . . . . . . . . . . . . . . . . . . . . . . . . . . . . . . . . . . . . . . . . . .
Defining Preferences 12. . . . . . . . . . . . . . . . . . . . . . . . . . . . . . . . . . . . . . . . . . . . . . . . . . . . . . . . . . . . . . . . . . . . .
Hiding and Returning the RT-Eye Application 13. . . . . . . . . . . . . . . . . . . . . . . . . . . . . . . . . . . . . . . . . . . . . . . . . . .
Minimizing and Maximizing the RT-Eye Application 14. . . . . . . . . . . . . . . . . . . . . . . . . . . . . . . . . . . . . . . . . . . . . . .
Docking and Undocking the RT-Eye Application 15. . . . . . . . . . . . . . . . . . . . . . . . . . . . . . . . . . . . . . . . . . . . . . . . .
Using the Sequencing Controls 16. . . . . . . . . . . . . . . . . . . . . . . . . . . . . . . . . . . . . . . . . . . . . . . . . . . . . . . . . . . . .
Exiting the RT-Eye Application 17. . . . . . . . . . . . . . . . . . . . . . . . . . . . . . . . . . . . . . . . . . . . . . . . . . . . . . . . . . . . . .
RT-Eye Application User Interface and Menu Structure 18. . . . . . . . . . . . . . . . . . . . . . . . . . . . . . . . . . . . . . . . . . . .
Locating the Application Directories 19. . . . . . . . . . . . . . . . . . . . . . . . . . . . . . . . . . . . . . . . . . . . . . . . . . . . . . . . . .
Using the RT-Eye Software
Setting Up the Application 21. . . . . . . . . . . . . . . . . . . . . . . . . . . . . . . . . . . . . . . . . . . . . . . . . . . . . . . . . . . . . . . . .
Using the Wizard 22. . . . . . . . . . . . . . . . . . . . . . . . . . . . . . . . . . . . . . . . . . . . . . . . . . . . . . . . . . . . . . . . . . . .
Viewing Plot Summaries 24. . . . . . . . . . . . . . . . . . . . . . . . . . . . . . . . . . . . . . . . . . . . . . . . . . . . . . . . . . . . . . . . . .
Viewing Plot Details 26. . . . . . . . . . . . . . . . . . . . . . . . . . . . . . . . . . . . . . . . . . . . . . . . . . . . . . . . . . . . . . . . . . . . .
Using Zoom 26. . . . . . . . . . . . . . . . . . . . . . . . . . . . . . . . . . . . . . . . . . . . . . . . . . . . . . . . . . . . . . . . . . . . . . .
Using Cursors 28. . . . . . . . . . . . . . . . . . . . . . . . . . . . . . . . . . . . . . . . . . . . . . . . . . . . . . . . . . . . . . . . . . . . . .
Using a Grid 29. . . . . . . . . . . . . . . . . . . . . . . . . . . . . . . . . . . . . . . . . . . . . . . . . . . . . . . . . . . . . . . . . . . . . . .
Exporting Plots to Files 30. . . . . . . . . . . . . . . . . . . . . . . . . . . . . . . . . . . . . . . . . . . . . . . . . . . . . . . . . . . . . . . . . . .
Printing Plots 31. . . . . . . . . . . . . . . . . . . . . . . . . . . . . . . . . . . . . . . . . . . . . . . . . . . . . . . . . . . . . . . . . . . . . . . . . .
Viewing Results 32. . . . . . . . . . . . . . . . . . . . . . . . . . . . . . . . . . . . . . . . . . . . . . . . . . . . . . . . . . . . . . . . . . . . . . . .
Creating a New Report 34. . . . . . . . . . . . . . . . . . . . . . . . . . . . . . . . . . . . . . . . . . . . . . . . . . . . . . . . . . . . . . . . . . .
Generating a Report 34. . . . . . . . . . . . . . . . . . . . . . . . . . . . . . . . . . . . . . . . . . . . . . . . . . . . . . . . . . . . . . . . .
Printing a Report 35. . . . . . . . . . . . . . . . . . . . . . . . . . . . . . . . . . . . . . . . . . . . . . . . . . . . . . . . . . . . . . . . . . . .
Saving a Report 36. . . . . . . . . . . . . . . . . . . . . . . . . . . . . . . . . . . . . . . . . . . . . . . . . . . . . . . . . . . . . . . . . . . . .
Viewing or Printing a Saved Report 36. . . . . . . . . . . . . . . . . . . . . . . . . . . . . . . . . . . . . . . . . . . . . . . . . . . . . . . . . .
Viewing a Saved Report 36. . . . . . . . . . . . . . . . . . . . . . . . . . . . . . . . . . . . . . . . . . . . . . . . . . . . . . . . . . . . . . .
Printing a Saved Report without Viewing 38. . . . . . . . . . . . . . . . . . . . . . . . . . . . . . . . . . . . . . . . . . . . . . . . . . .
Logging Worst Case Waveforms 39. . . . . . . . . . . . . . . . . . . . . . . . . . . . . . . . . . . . . . . . . . . . . . . . . . . . . . . . . . . .
Using MyTest 41. . . . . . . . . . . . . . . . . . . . . . . . . . . . . . . . . . . . . . . . . . . . . . . . . . . . . . . . . . . . . . . . . . . . . . . . . .
Saving MyTest 41. . . . . . . . . . . . . . . . . . . . . . . . . . . . . . . . . . . . . . . . . . . . . . . . . . . . . . . . . . . . . . . . . . . . . .
Running MyTest 42. . . . . . . . . . . . . . . . . . . . . . . . . . . . . . . . . . . . . . . . . . . . . . . . . . . . . . . . . . . . . . . . . . . . .
Selecting Measurements and Using Autoset 42. . . . . . . . . . . . . . . . . . . . . . . . . . . . . . . . . . . . . . . . . . . . . . . . . . . .
Selecting Plots 43. . . . . . . . . . . . . . . . . . . . . . . . . . . . . . . . . . . . . . . . . . . . . . . . . . . . . . . . . . . . . . . . . . . . . . . . .
Configuring Plots 44. . . . . . . . . . . . . . . . . . . . . . . . . . . . . . . . . . . . . . . . . . . . . . . . . . . . . . . . . . . . . . . . . . . . . . .
Reconfiguring Plots and Using the Bit Error Locator 46. . . . . . . . . . . . . . . . . . . . . . . . . . . . . . . . . . . . . . . . . . .
Configuring Measurements 49. . . . . . . . . . . . . . . . . . . . . . . . . . . . . . . . . . . . . . . . . . . . . . . . . . . . . . . . . . . . . . . .
Table of Contents
RT-Eye Quick Start User Manual
i
Page 6

Table of Contents
Choosing Probe Types and Measurement Sources 49. . . . . . . . . . . . . . . . . . . . . . . . . . . . . . . . . . . . . . . . . . . .
Source 49. . . . . . . . . . . . . . . . . . . . . . . . . . . . . . . . . . . . . . . . . . . . . . . . . . . . . . . . . . . . . . . . . . . . . . . . . . .
Ref Levels 52. . . . . . . . . . . . . . . . . . . . . . . . . . . . . . . . . . . . . . . . . . . . . . . . . . . . . . . . . . . . . . . . . . . . . . . . .
Smart Gating 53. . . . . . . . . . . . . . . . . . . . . . . . . . . . . . . . . . . . . . . . . . . . . . . . . . . . . . . . . . . . . . . . . . . . . . .
Clock Recovery 56. . . . . . . . . . . . . . . . . . . . . . . . . . . . . . . . . . . . . . . . . . . . . . . . . . . . . . . . . . . . . . . . . . . . .
Jitter 58. . . . . . . . . . . . . . . . . . . . . . . . . . . . . . . . . . . . . . . . . . . . . . . . . . . . . . . . . . . . . . . . . . . . . . . . . . . . .
Population 59. . . . . . . . . . . . . . . . . . . . . . . . . . . . . . . . . . . . . . . . . . . . . . . . . . . . . . . . . . . . . . . . . . . . . . . . .
General Config 59. . . . . . . . . . . . . . . . . . . . . . . . . . . . . . . . . . . . . . . . . . . . . . . . . . . . . . . . . . . . . . . . . . . . .
Setting Limits 60. . . . . . . . . . . . . . . . . . . . . . . . . . . . . . . . . . . . . . . . . . . . . . . . . . . . . . . . . . . . . . . . . . . . . . . . . .
Viewing the Current Limits 60. . . . . . . . . . . . . . . . . . . . . . . . . . . . . . . . . . . . . . . . . . . . . . . . . . . . . . . . . . . . .
Editing the Currently Displayed Limit File 61. . . . . . . . . . . . . . . . . . . . . . . . . . . . . . . . . . . . . . . . . . . . . . . . . . .
Viewing a Summary of the Limits 62. . . . . . . . . . . . . . . . . . . . . . . . . . . . . . . . . . . . . . . . . . . . . . . . . . . . . . . .
Saving the Limits File 63. . . . . . . . . . . . . . . . . . . . . . . . . . . . . . . . . . . . . . . . . . . . . . . . . . . . . . . . . . . . . . . . .
Using Limits 63. . . . . . . . . . . . . . . . . . . . . . . . . . . . . . . . . . . . . . . . . . . . . . . . . . . . . . . . . . . . . . . . . . . . . . .
Application Examples
Creating a Custom Compliance Module with Pass/Fail Limits 64. . . . . . . . . . . . . . . . . . . . . . . . . . . . . . . . . . . . . . . .
Starting the RT-EyeApplication 64. . . . . . . . . . . . . . . . . . . . . . . . . . . . . . . . . . . . . . . . . . . . . . . . . . . . . . . . . .
Running the Setup Wizard 65. . . . . . . . . . . . . . . . . . . . . . . . . . . . . . . . . . . . . . . . . . . . . . . . . . . . . . . . . . . . .
Viewing the Results 66. . . . . . . . . . . . . . . . . . . . . . . . . . . . . . . . . . . . . . . . . . . . . . . . . . . . . . . . . . . . . . . . . .
Summary of Displayed Results 67. . . . . . . . . . . . . . . . . . . . . . . . . . . . . . . . . . . . . . . . . . . . . . . . . . . . . . . . . .
Using a Mask 68. . . . . . . . . . . . . . . . . . . . . . . . . . . . . . . . . . . . . . . . . . . . . . . . . . . . . . . . . . . . . . . . . . . . . .
Defining a Limits Module 70. . . . . . . . . . . . . . . . . . . . . . . . . . . . . . . . . . . . . . . . . . . . . . . . . . . . . . . . . . . . . .
Creating a Compliance Report 74. . . . . . . . . . . . . . . . . . . . . . . . . . . . . . . . . . . . . . . . . . . . . . . . . . . . . . . . . .
Using MyTest 75. . . . . . . . . . . . . . . . . . . . . . . . . . . . . . . . . . . . . . . . . . . . . . . . . . . . . . . . . . . . . . . . . . . . . .
Index
ii
RT-Eye Quick Start User Manual
Page 7

General Safety Summary
Review the following safety precautions to avoid injury and prevent damage to this product or any products connected to it.
To avoid potential hazards, use this product only as specified.
Only qualified personnel should perform service procedures.
While using this product, you may need to access other parts of the system. Read the General Safety Summary in other
system manuals for warnings and cautions related to operating the system.
To Avoid Fire or Personal Injury
Connect and Disconnect Properly. Do not connect or disconnect probes or test leads while they are connected to a
voltage source.
Do Not Operate With Suspected Failures. If you suspect there is damage to this product, have it inspected by
qualified service personnel.
Symbols and Terms
Terms in this Manual. These terms may appear in this manual:
General Safety Summary
WARNING. Warning statements identify conditions or practices that could result in injury or loss of life.
CAUTION. Caution statements identify conditions or practices that could result in damage to this product or other property.
Terms on the Product. These terms may appear on the product:
DANGER indicates an injury hazard immediately accessible as you read the marking.
WARNING indicates an injury hazard not immediately accessible as you read the marking.
CAUTION indicates a hazard to property including the product.
Symbols on the Product. The following symbol may appear on the product:
CAUTION
Refer to Help
RT-Eye Quick Start User Manual
iii
Page 8

General Safety Summary
iv
RT-Eye Quick Start User Manual
Page 9

Preface
This manual describes how to set up and use the RT-Eye Serial Data Compliance and Analysis Application. Only basic
operations, presented as task-oriented procedures, are covered. For more detailed information, such as theory, concepts,
or algorithms, refer to the RT-Eye online help. For information about using specific, industry-standard modules, refer to the
documentation provided with the module. See Documentation below for additional, related information.
Documentation
To read about Use these documents
Preface
Installation, enabling an application,
software warranty and license agreement,
5 times free trial, downloading files from
the Tektronix site, available applications
and compatibility
Basic operations of the RT-Eye application
In-depth operation, user interface help,
GPIB commands, and measurement
algorithms
Other related documentation, such as
Method of Implementation (MOI) documents and help files for specific compliance modules, Report Generator help,
and so on
*
To access the documentation that is installed on your instrument, click Start in the taskbar and select Programs > TekApplications.
Relevant Web Sites
Read the Optional Applications Software on a WindowsBased Oscilloscope Installation Manual.
Read the RT-Eye Serial Data Compliance and Analysis
Quick Start User Manual (this manual) provided in PDF
format on the Optional Applications Software on a
Windows-Based Oscilloscope CD.
Access the online help from the Help menu in the RT-Eye
application.
Read the relevant documents, provided in PDF files, on the
Optional Applications Software on a Windows-Based
Oscilloscope CD.
*
*
You may also find useful information about serial data standards on the following Web sites:
H www.Infinibandta.org
H www.pcisig.com
H www.T11.org
H www.tektronix.com/serial_data
RT-Eye Quick Start User Manual
v
Page 10

Preface
Conventions Used in this Manual
The following icon is used throughout this manual:
Sequence
Step
1
The following conventions are used throughout the text of this manual:
H The terms RT-Eye application" or application" refer to the RT-Eye Serial Compliance and Analysis Application.
H The term oscilloscope" refers to any product on which this application runs.
H The term select" is a generic term that applies to the two mechanical methods of choosing an option: with a mouse or
with the Touch Screen.
H The term Compliance Module" refers to optional plug-in applications" from Tektronix used for compliance testing to
specific serial data standards.
H The term Limits Module" refers to a formatted text file used to specify user limits on mask geometry and measurement
boundary conditions for Pass/Fail testing.
H The term channel" is context dependent. It can refer to the transmit channel of the device under test or to an
oscilloscope channel.
H The term DUT" is an acronym for Device Under Test.
H User interface screen graphics are from a TDS6000 series oscilloscope; there may be minor differences in the displays
on other types of oscilloscopes.
H When steps require a sequence of selections using the application interface, the >" delimiter marks each transition
between a menu and an option.
vi
RT-Eye Quick Start User Manual
Page 11

Getting Started
This section contains information on key features, compliance modules, compatibility issues, installation, probing
configurations, and calibration.
Key Features
The RT-Eye Serial Compliance and Analysis Application is a software product that enhances the basic capabilities of some
Tektronix oscilloscopes that use Microsoft Windows operating systems. The RT-Eye application is a general analysis tool
that you can use to test, debug, and verify serial-data based designs.
You can use this application to do the following tasks:
H Select and configure many amplitude and timing measurements on serial data signals
H Quickly set up and take measurements using the Setup Wizard
H Select MyTest to execute a previously saved customized set of test conditions
H Conduct RT-Eye rendering and mask testing, Time Interval Error analysis, Rj/Dj (random jitter and deterministic jitter)
analysis, and display results as a Bathtub plot
Getting Started
H Display the results as eye diagram, histogram, spectrum, or bathtub curve plots
H Use the bit error locator feature to find mask failures on the waveform
H Perform Pass or Fail limits testing based on waveform masks and based on measurements that use Limits Modules
H Perform "plug-fest" level compliance tests for available compliance modules that test against a specific standard
H Save the statistical results to a file
H Save the worst case waveforms to files
H Generate reports
RT-Eye Quick Start User Manual
1
Page 12

Getting Started
Using Compliance Modules
You can purchase separate compliance
modules for the RT-Eye application, such
as Infiniband, PCI Express, FB-DIMM,
and SAS. These are specific tools that
you can use to ensure that device designs
comply with specific serial data standards.
The compliance modules available to you
are listed in the Modules menu.
This manual only discusses the operation
of the Serial Analysis module. However,
the compliance modules may include
specific help files and PDF files of
Methods of Implementation (MOI) that
explain how to use the compliance
module.
Ensuring Compatibility
For information on oscilloscope and RT-Eye application compatibility, refer to the Optional Applications Software on
Windows Based Oscilloscopes Installation Manual, Tektronix part number 071-1078-xx, that shipped with your application.
2
RT-Eye Quick Start User Manual
Page 13

Minimum Required System Configuration
To check whether you system meets the
minimum required system configuration,
do the following procedure:
1. Select File > Minimize to minimize the
TekScope application.
2. Select Start > Programs > TekAp-
plications > tdsRT-Eye > Readme,
note the minimum firmware version
that is required, and close the Readme
file.
Getting Started
1
3. Click TekScope.
2
3
RT-Eye Quick Start User Manual
3
Page 14
Getting Started
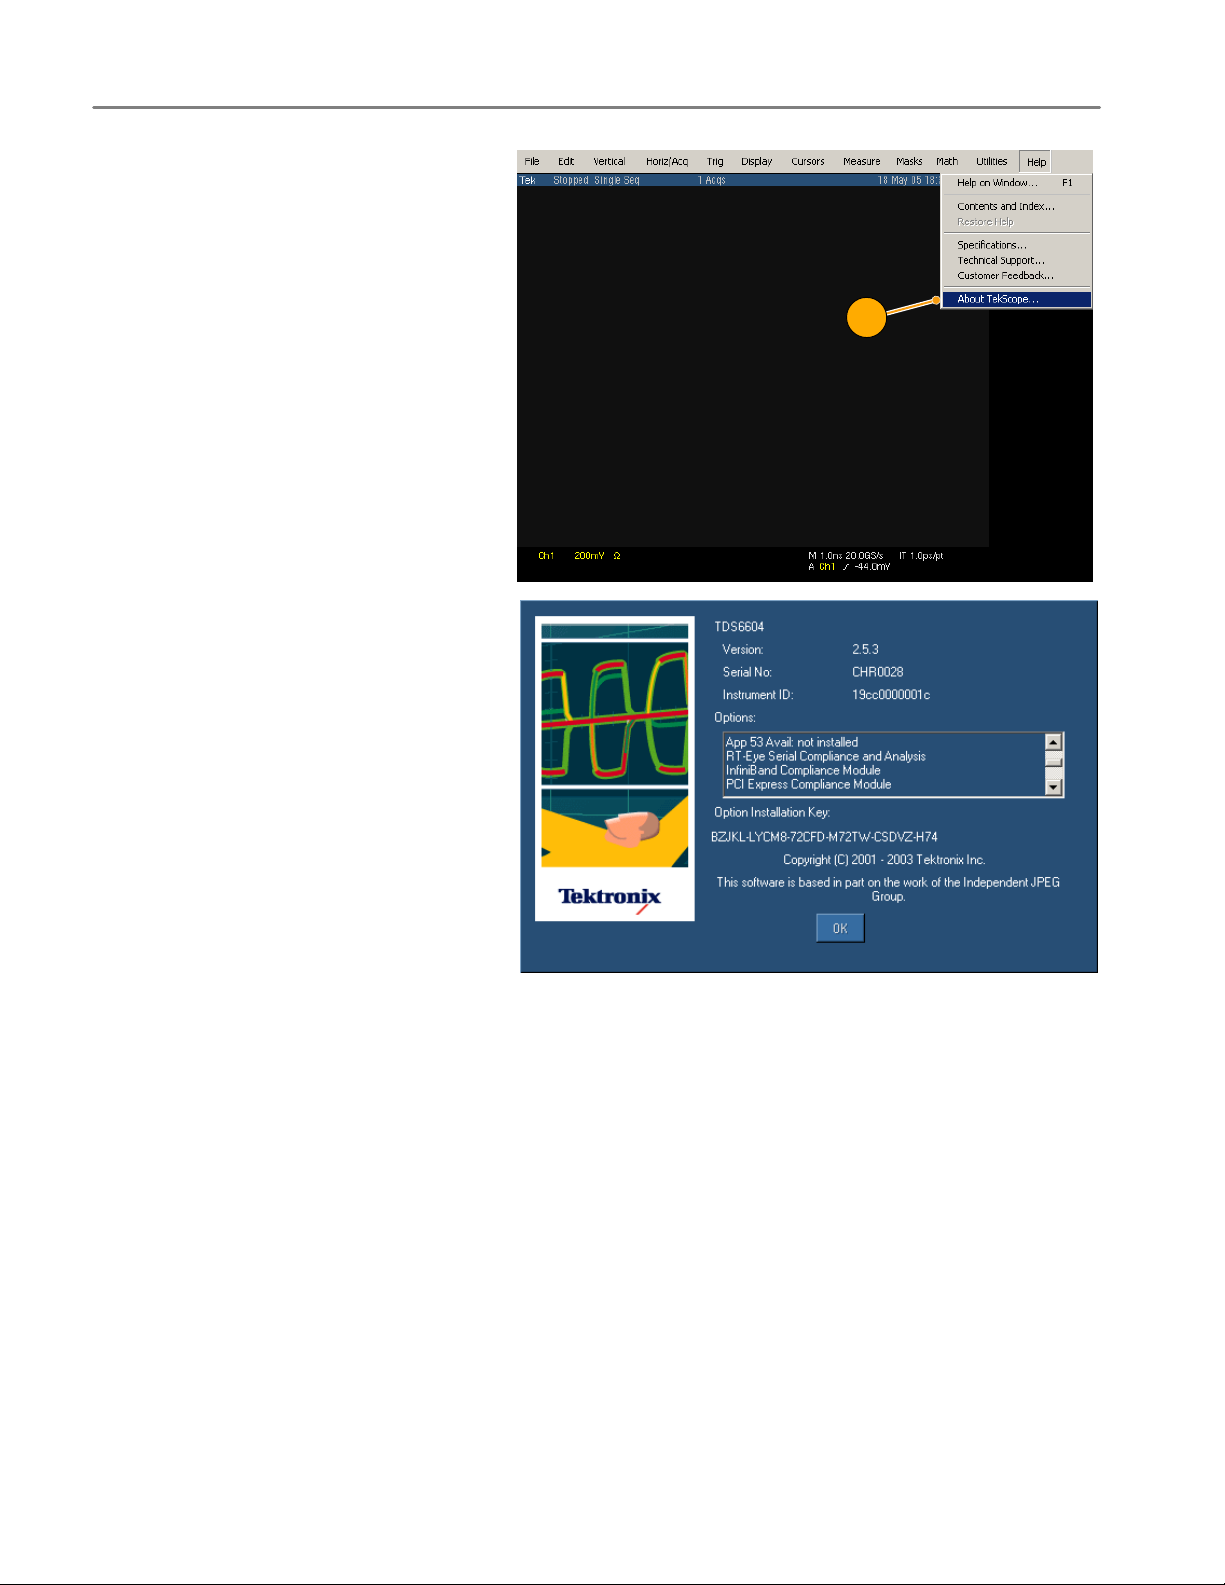
4. Select Help > About TekScope0 in
the oscilloscope menu bar.
5. Verify that the firmware version is the
same or greater than that noted in
step 2.
4
Other minimum requirements are:
H Windows 2000 or Windows XP
operating system
H 850 MHz Processor
H 512 MB SDRAM
4
RT-Eye Quick Start User Manual
Page 15

Getting Started
Other Requirements and Restrictions
MATLAB
The RT-Eye installer also installs the Sun Java Run-Time Environment (JRE) and the Mathworks MATLAB Run-Time
Server. The MATLAB server is dedicated to the RT-Eye application and cannot be used for other purposes.
Do not close the MATLAB Server icon in
the oscilloscope task bar. The application
will close the MATLAB sever when you
exit the application.
Oscilloscope
A maximum sampling rate with interpolation is often necessary to ensure accurate results. Be sure to consider the
following differences in sampling rates before taking measurements:
H The TDS6604 oscilloscopes sample at 20 GS/s on two channels and at 10 GS/s on four channels.
H The TDS6000B oscilloscopes sample at 20 GS/s on two and four channels.
H The TDS6000C oscilloscopes sample at 40 GS/s on two channels and 20 GS/s on four channels.
H The TDS7404 oscilloscopes sample at 20 GS/s on one channel and at 10 GS/s on two channels.
H The TDS7000B oscilloscopes sample at 20 GS/s on one channel, 10 GS/s on two channels, and 5 GS/s on four
channels.
When the Record Length of the oscilloscope is set to 4 M or less, the application can take all measurements. The RT-Eye
application can take a TIE measurement on a record length up to 20 M.
Keyboard
You will need to use a keyboard to enter new names for some file save operations.
Using Accessories
There are no standard accessories for this product.
Installing the Application
For information on how to install the RT-Eye application, refer to the Optional Applications Software on Windows Based
Oscilloscopes Installation Manual that shipped with your application. This manual contains the following information:
H Checking for available applications, compatible oscilloscopes, and relevant software and firmware version numbers
H Using the five-time free trials for applications
H Applying labels for a newly authorized option installation keys
H Installing application software
H Enabling applications
H Downloading updates from the Tektronix Web site
RT-Eye Quick Start User Manual
5
Page 16

Getting Started
Connecting to the Device Under Test
You can use any compatible probes to connect between the device under test (DUT) and oscilloscope.
WARNING. To avoid electrical shock and equipment damage, refer to the General Safety Summary at the beginning of
this manual and the safety summaries in your oscilloscope and probe user manuals.
Power off the device under test before you attach probes. Do not touch exposed conductors except with the properly rated
probe tips. Refer to your probe manual for proper use.
To ensure that the bandwidth is adequate
for rise time measurements, your probe
and oscilloscope combination must have
a system bandwidth greater than 1.5
times the bit rate that you are measuring.
This ensures that the bandwidth is
adequate for most measurements, since
most of the energy in high-speed serial
data signals is contained in the first and
third harmonics. To ensure accurate
risetime measurements, 2.5 times the bit
rate (5th harmonic) is required.
Typical Probing Configurations
There are four typical probing configurations for serial data links: two for pseudo differential waveforms and two for true
differential waveforms. The method that you use to set up your measurement channel(s) depends on your application and
what you want to measure.
H Two TCA-to-SMA adapters (single
ended)
6
RT-Eye Quick Start User Manual
Page 17

H One P73XX SMA differential probe
H Two P72XX single-ended or P73XX
differential probes
Getting Started
H One P73XX differential probe
NOTE. You must deskew the probes when using two channels to perform pseudo-differential measurements. Use the
proper deskew fixture and procedure as described in the user manual or online help of your oscilloscope.
The RT-Eye application relies on upsampled, deskewed data from the oscilloscope to conduct math operations for
differential and common mode waveform measurements. Upsampling prior to deskew is required to ensure accurate
measurements.
For more information about probes, refer to Choosing the Probe Configuration in the RT-Eye Serial Compliance and
Analysis Online Help.
RT-Eye Quick Start User Manual
7
Page 18

Getting Started
Calibrating the Oscilloscope and Probes
NOTE. To ensure accurate results, calibrate the oscilloscope and probes before you run tests. Refer to your oscilloscope
and probe documentation for additional information.
1. Click Utilities > Instrument Calibration to begin calibrating the oscillo-
scope for signal path compensation.
2. Click Calibrate.
1
2
3. After the SPC compensation finishes
(verify that the Status is Pass), select
Vertical > Probe Cal0.
4. Connect the probe calibration signal to
the probe.
3
8
RT-Eye Quick Start User Manual
Page 19

5. Click Calibrate Probe.
Getting Started
5
RT-Eye Quick Start User Manual
9
Page 20

Getting Started
10
RT-Eye Quick Start User Manual
Page 21

Operating Basics
Starting the RT-Eye Application
1. Start the application:
H For non-B or non-C model
oscilloscopes, select File > Run
Application > RT-Eye Serial
Compliance and Analysis.
H For B and C model oscilloscopes,
select App > RT-Eye Serial
Compliance and Analysis.
Operating Basics
1
1
The RT-Eye application displays in the
lower half of the screen.
2. If the RT-Eye Welcome dialog box dis-
plays, click Cancel.
2
RT-Eye Quick Start User Manual
11
Page 22

Operating Basics
Defining Preferences
You can set some preferences that will
help you use the application more
efficiently. To set the preferences:
1. Select File > Preferences0.
The Preferences dialog window
displays.
2. Check the preferences to:
H Display a Welcome dialog window
each time that you start the
application that allows you to run
either MyTest or the Wizard
H Display the Autoset Summary
dialog window each time you
select Autoset.
H Enable high-performance eye
rendering. When selected, only
segments of the waveform
surrounding the worst-case eye
violations are rendered. The
resulting eye typically contains
10,000 to 12,000 unit intervals
(UIs) for statistical validity but
results in faster display of the eye
diagrams. If this selection is not
checked, then all the UIs in the
record are rendered, resulting in
increased fidelity of the eye
diagram, but reduced
measurement throughput.
1
2
3
12
3. Click:
H Apply to apply your selections
and leave the dialog window open
H Cancel to discard your changes
and close the dialog window
H OK to accept your changes and
close the dialog window
RT-Eye Quick Start User Manual
Page 23

Hiding and Returning the RT-Eye Application
Operating Basics
1. Click the Hide icon to minimize the
RT-Eye application and maximize the
oscilloscope display.
2. To display the RT-Eye application
again:
H For non-B or non-C model
oscilloscopes, click the App
button.
H For B and C model oscilloscopes,
select App > Restore
Application.
1
2
2
RT-Eye Quick Start User Manual
13
Page 24

Operating Basics
Minimizing and Maximizing the RT-Eye Application
1. To minimize the application, select File
> Minimize.
1
2. To maximize the application, click the
RT-Eye icon in the task bar.
If you expanded the TekScope application
full screen after minimizing the RT-Eye
application, you can maximize the RT-Eye
application by performing the following
step:
3. To maximize the RT-Eye application
again:
H For non-B or non-C model
oscilloscopes, click the App
button.
H For B and C model oscilloscopes,
select App > Restore
Application.
2
3
3
14
RT-Eye Quick Start User Manual
Page 25

Docking and Undocking the RT-Eye Application
1. To undock the RT-Eye application, se-
lect File > Undock.
2. Click and drag the RT-Eye title bar to
position the application anywhere on
screen or on a second monitor, if used.
Operating Basics
1
2
3. To dock the RT-Eye application, select
File > Dock.
3
RT-Eye Quick Start User Manual
15
Page 26

Operating Basics
Using the Sequencing Controls
Sequencing is the steps to acquire waveform information, determine if the information is usable for the measurement, take
the measurement, and display the results. (Before starting sequencing, you must set up the application properly.)
There are three sequencing modes:
H Single RunProcesses a single waveform, and then halts. If the waveform source is a live channel, a new waveform
is acquired using the current trigger settings of the oscilloscope
H Single No AcqProcesses a single waveform, and then halts. If the waveform source is a live channel, the
measurements are performed on the currently displayed waveform without retriggering
H Free RunContinuously acquires waveforms and sequences until you select the Stop command button; results and
any plots are updated one or more times per measurement cycle
The sequencing controls consist of the
following:
1. Clear ResultsClears previously taken
measurements.
2. ModeSelects one of three modes:
Single Run, Single No Acq, or Free
Run.
4
3
1
3. StartBegins the sequencing steps.
4. StopStops the sequencing.
For example, if you selected Free Run
as the mode, you can click Stop to end
the sequencing. If you selected Single
Run or Single No Acq, it is not necessary to click Stop.
2
16
RT-Eye Quick Start User Manual
Page 27

Exiting the RT-Eye Application
1. Select File > Exit or click the Close
icon.
The Exit RT-Eye dialog box opens.
Operating Basics
1
2. Check Save MyTest if you want to
save your last test configuration so that
it can be recalled the next time you
open the RT-Eye application.
3. Click:
H Yes to exit the RT-Eye application
and restore your oscilloscope
settings to their state prior to
starting RT-Eye.
H No to exit without restoring the
oscilloscope settings.
H Cancel to return to the RT-Eye
application.
2
3
RT-Eye Quick Start User Manual
17
Page 28

Operating Basics
RT-Eye Application User Interface and Menu Structure
18
RT-Eye Quick Start User Manual
Page 29

Locating the Application Directories
During installation, the RT-Eye application
sets up directories for various functions,
such as to save setup files, masks, and
waveforms.
The default directory structure is shown.
Operating Basics
RT-Eye Quick Start User Manual
19
Page 30

Operating Basics
20
RT-Eye Quick Start User Manual
Page 31

Using the RT-Eye Software
Setting Up the Application
You must set up the RT-Eye application
for serial data analysis. The general steps
that you do are shown in the diagram.
After taking measurements, you can do
the following tasks:
H View the results as statistics
H Save statistics to a .csv file
H View results as a plot
H Use the zoom function to examine
details of a plot
H Use the Cursor functions in a plot
H Save a plot file
Using the RT−Eye Software
H Print a plot
H Save the worst-case waveforms as
.wfm files
H Generate a report file
RT-Eye Quick Start User Manual
21
Page 32

Using the RT−Eye Software
Using the Wizard
This version of the RT-Eye Application has a Setup Wizard to enable you to quickly set up and take some key measurements. Before starting the Wizard, you must have your probe(s) connected to an applicable signal. In these procedures, a
2.5 Gb/s, 127 bit, PRBS repeating pattern signal is used. The positive and negative outputs of the signal are connected via
phase-matched SMA cables to a Tektronix P7380SMA differential probe, which is connected to CH 1 of the oscilloscope.
(See page 6, Connecting to the Device Under Test.)
To use the wizard, perform the following
steps:
1. Start the application:
H For older oscilloscopes (typically non-B
models), select File > Run
Application > RT-Eye Serial
Compliance and Analysis.
H For newer oscilloscopes (typically B
models), select App > RT-Eye Serial
Compliance and Analysis.
2. If the RT-Eye Welcome dialog box dis-
plays, click Run Wizard. Go to step 4.
3. If the RT-Eye Welcome dialog box
does not display, select Measurements > Wizard0.
(You can use the File > Preferences
menu selection to set the RT-Eye
Welcome dialog box to open when you
start the application.)
1
1
2
3
22
RT-Eye Quick Start User Manual
Page 33

The Setup Wizard dialog window
opens with step 1, Probe Type,
highlighted. The selections for step 1
appear in the right hand area of the
window.
4. Select Probe Type from the drop-down
list (in this procedure, Differential), and
click Next.
Using the RT−Eye Software
The choice that you made for step 1 is
displayed in yellow text.
5. Repeat the above procedure for each
step, making the selections that you
want.
After making your selections for step 7,
Plots, the display should look similar to
this.
6. Click Run.
5
4
RT-Eye Quick Start User Manual
6
23
Page 34

Using the RT−Eye Software
A display similar to this with the plot
summary window in the upper half of
the screen appears.
Viewing Plot Summaries
The RT-Eye Plot Summary window has
the following toolbar controls for controlling the plot views.
1. Click this icon to display the plot summary in the lower half of the screen.
1
24
RT-Eye Quick Start User Manual
Page 35

2. Click this icon to return the plot sum-
mary to the upper half of the screen.
3. Click this icon to display the plot sum-
mary full screen.
Using the RT−Eye Software
2
3
4. Click one of these icons to display the
plot summary at half screen again.
RT-Eye Quick Start User Manual
4
25
Page 36

Using the RT−Eye Software
Viewing Plot Details
To view details of a plot, click the details
icon associated with one of the four
possible plots. For example, to display
details of the upper left plot:
1. Click this icon.
H The RT-Eye Plot Details window
displays for the selected plot.
H The toolbar controls change.
1
Using Zoom
The toolbar for the Plot Details window
has four icons that control the zoom
function.
1. Click this icon to select the zoom-in
tool.
2. Click an area of the waveform to zoom
in by a factor of two, centered around
the point that you clicked.
Note: An alternative zoom function is
to click and drag a box around the area
that you want to zoom; the selected
area is expanded to fill the display
area.
1
2
26
RT-Eye Quick Start User Manual
Page 37

3. Click a portion of the zoomed wave-
form to further zoom in (or click and
drag a box around the area).
4. Click this icon to select the zoom out
tool.
5. Click the waveform to zoom out.
If you zoomed in more than once on
the waveform, clicking the waveform
will zoom out in equal steps.
Using the RT−Eye Software
3
4
6. Click this icon to select the zoom hori-
zontal axis tool.
7. Click an area of the waveform to zoom
the horizontal axis by a factor of two
(centered around the area clicked), but
retain the scale of the vertical axis.
Note: An alternative zoom function is
to click and drag a box around the area
that you want to zoom; the selected
area is expanded to fill the display
area, but still maintain the vertical
scale.
5
6
7
RT-Eye Quick Start User Manual
27
Page 38

Using the RT−Eye Software
8. Click a portion of the zoomed waveform to further zoom in (or click and
drag a box around the area).
9. Click the horizontal zoom icon to turn
off the zoom function.
8
10. Click the 100% icon to return the wa-
veform to its original size.
Clicking this icon always returns the
waveform directly to its original size
without any intermediate zoom steps.
Using Cursors
Use plot cursors to quickly take accurate
measurements of two cursor positions on
a waveform and the difference (∆) value
between the cursors. Note that cursors
are on by default when viewing plot
details.
Make sure that all zoom functions are off
before using cursors.
1. Click and drag each cursor to position
it where you want.
2. Read the V1, V2, and ∆V values for the
horizontal cursors and the t1, t2, and ∆t
values for the vertical cursors.
9
10
Cursor icons
1
28
3. To reset the cursors,click this icon.
Resetting the cursors is a quick
method of locating cursors that may be
positioned outside of the display.
4. To turn cursors off, click the associated
icon (horizontal and/or vertical).
2
3
4
RT-Eye Quick Start User Manual
Page 39

5. To return to the plot summary window,
click this icon.
The plot summary window displays.
Using a Grid
1. Click this icon to display the details of
the upper right plot (in this example,
the TIE Jitter Spectrum plot).
Using the RT−Eye Software
5
2. To display a grid on the plot, click this
icon.
3. To turn the grid off, click the grid icon.
You cannot display a grid on an eye
diagram plot.
1
2
RT-Eye Quick Start User Manual
29
Page 40

Using the RT−Eye Software
Exporting Plots to Files
You can export your plot data to two types
of files:
H Graphic files in any format available on
the Save as type drop-down list
H Data files in binary .fig file format
1. Set up the plot window as you want to
export it.
Graphic Data
2. Click the Graphics or Data icon to select the type file that you want to export.
3. Browse to the directory in which you
want to save the file.
4. Enter a file name.
5. Select the type of file format that you
want to export.
6. Click Save.
2
3
6
4
5
30
RT-Eye Quick Start User Manual
Page 41

Printing Plots
You can print your plots to a printer if you
have configured Microsoft Windows on
your oscilloscope for a printer. To print a
plot, perform the following steps:
1. Set up the plot window as you want it
to print (zoom, cursors, and so on).
2. Click the print figure icon.
Using the RT−Eye Software
2
3. To print the plot as it appears, click
Print0.
The Print dialog box for your printer
opens.
3
RT-Eye Quick Start User Manual
31
Page 42

Using the RT−Eye Software
4. To print the plot, choose the printer settings that you want, and click OK.
Viewing Results
4
You can view the statistics for your
measurements in two ways:
H Summary view shows the current data
for all the measurements that you
selected.
H Detail view shows the following
statistics for each measurement:
population, mean, standard deviation,
maximum, minimum, and
peak-to-peak.
1. To view the summary statistics for your
current measurements, select
Results > Summary.
The Result Summary window displays
listing all the selected measurements
and their general statistics.
1
32
RT-Eye Quick Start User Manual
Page 43

2. Use the scroll bar to view all the mea-
surements.
3. Click Export To CSV to export the
measurement data to a comma separated data file that can be used in other
applications.
4. Click the Time Units drop-down box
and select Unit Interval (cycle duration
of the recovered clock) or Seconds.
5. To view details of a specific measure-
ment, click Details.
The Results Details window displays.
Using the RT−Eye Software
2
4
3
5
6. From the Select Measurement drop-
down list, select the measurement for
which you want details.
7. Read the details of your measurement
in the window.
6
7
RT-Eye Quick Start User Manual
33
Page 44

Using the RT−Eye Software
Creating a New Report
Use the Report Generator utility to
generate a compliance report. The report
is a .rpt file that can only be viewed or
printed from the Report Generator.
You can customize the contents and
layout of the report using the advanced
features of the Report Generator. Refer to
the RT-Eye online help and the Report
Generator online help for details.
By default, the report files are saved to
the Reports directory as shown.
Generating a Report
To generate a report, perform the following steps:
1. Select Utilities > Reports.
2. Click Generate.
Wait until the report generator is
finished.
1
2
34
RT-Eye Quick Start User Manual
Page 45

When completed, the report displays.
(Use the Alt+Tab key combination to
bring the report to the front, if necessary.)
Printing a Report
Using the RT−Eye Software
3. To print the report, click the printer icon
in the Report Viewer toolbar.
4. Select a printer from the drop-down
list.
5. Make any adjustments that you want,
and click OK. (The Print dialog box
may differ slightly, depending on the
printer your are using.)
3
4
5
RT-Eye Quick Start User Manual
35
Page 46

Using the RT−Eye Software
Saving a Report
1. To save a report, click the save icon in
the Report Viewer toolbar.
The Save As window opens.
2. Select the directory in which you want
to save the report (the default directory
is Reports).
1
3. Enter the filename.
4. Click Save.
5. Close the Report Viewer window.
Viewing or Printing a Saved Report
Viewing a Saved Report
To view a saved report, perform the
following steps:
1. Select Utilities > Reports.
2
3
4
1
36
2. Click Browse.
The Open window displays the default
directory, Layouts.
2
RT-Eye Quick Start User Manual
Page 47

3. Click the Up One Level icon, and then
double-click the Reports folder to open
the Reports directory.
4. Browse to locate the file that you want
to view, and click the file name to select it.
5. Click Open.
Using the RT−Eye Software
3
4
6. Click View.
5
6
RT-Eye Quick Start User Manual
37
Page 48

Using the RT−Eye Software
The report that you selected is displayed.
You can print the viewed report. (See
page 35, Printing a Report.)
7. Click the Close icon to close the Report Viewer.
Printing a Saved Report without Viewing
7
1. To print a saved report without viewing
it in the Report Viewer, perform steps 1
through 5 of the preceding procedure,
and then click Print.
The Report Viewer window opens and
a Report Viewer print dialog box
displays. After the print job is sent,
both windows close.
Note that the instrument does not
display a Print setup dialog box when
the report is printed using this method.
1
7
8
38
RT-Eye Quick Start User Manual
Page 49

Logging Worst Case Waveforms
You can save the acquired waveforms to
a set of .wfm files whenever a selected
measurement exceeds the highest or
lowest prior value.
To log worst case waveforms, perform the
following procedure:
1. Select Log > Worst Case > Config-
ure.
The Worst Case Waveforms window
displays.
2. Click ON in the Log section.
3. Click Browse to open a browse win-
dow.
Using the RT−Eye Software
1
3
4. Browse to the directory in which you
want to save the set of worst case
files.
5. Click Open.
2
4
5
RT-Eye Quick Start User Manual
39
Page 50

Using the RT−Eye Software
6. If you want to clear existing waveform
and .csv files from the selected directory, click Purge.
7. Click Start to take your selected measurements.
The measurement results display in
the Results Summary window.
8. Select Log > Worst Case > File
Names.
7
6
The File Names window displays the
names of the measurements, sources,
and worst case file names.
9. To turn off logging, click Config.
10. Click Off.
8
9
10
40
RT-Eye Quick Start User Manual
Page 51

Using MyTest
You can use the MyTest feature to save and recall your current settings. This allows you to recall your customized setup at
any time and display a Result Summary window with a single click of a button.
Saving MyTest
To save your settings at any time, perform
the following procedure:
1. Select Measurements > Save
MyTest.
Your current set up is saved as MyTest.
To save your settings when exiting the
RT-Eye application, perform the following
procedure:
Using the RT−Eye Software
1
1. Select File > Exit.
The Exit RT-Eye dialogue window
displays.
2. Check Save MyTest.
3. Click:
H Yes to restore the oscilloscope
settings when you exit the
application
H No to exit without restoring
oscilloscope settings
H Cancel to cancel the exit (your
current setup will not be saved)
1
2
3
RT-Eye Quick Start User Manual
41
Page 52

Using the RT−Eye Software
Running MyTest
To run MyTest at anytime, perform the
following procedure:
1. Select Measurements > Run MyTest.
The application restores the saved
configuration, takes the measurements, and displays the results in the
Result Summary window.
To run MyTest from the RT-Eye Welcome
dialogue box, which displays when you
start the RT-Eye application, perform the
following procedure:
1. Start the RT-Eye application.
The RT-Eye Welcome dialogue box
displays.
1
2
2. Click Run MyTest.
The application takes the measurements and displays the results in the
Result Summary window.
Selecting Measurements and Using Autoset
You may want to take measurements
other than those set up by the wizard. To
select specific measurements, perform
the following procedures:
1. Select Measurements > Select.
The Measurements window displays.
1
42
RT-Eye Quick Start User Manual
Page 53

2. Select your probe type from the Probe
Type drop-down list box. The probe
type affects the available measurements. (When you select Single Ended, measurements for Differential
Skew, CM Voltage, and AC CM Voltage are added.)
3. Click the measurement buttons to turn
the measurements on or off, or click
Select All to turn on all measurements.
Using the RT−Eye Software
2
3
4. Click Autoset, which performs a Verti-
cal, Horizontal, and Reference Level
autoset to ensure accurate measurement results.
Note: You can set these levels manually. (See page 52, Ref Levels.)
Selecting Plots
You can display up to four plots (depending on your measurement selections). To
select the plots for display, perform the
following procedure:
1. Click Select Plots (or select Plots >
Select).
4
1
2. Click Select, if the tab is not active.
RT-Eye Quick Start User Manual
2
43
Page 54

Using the RT−Eye Software
3. In the Measurement drop-down boxes,
select up to four measurements that
you want plotted.
4. In the Plot Type drop-down boxes, select the plot type for each measurement that you selected. (Note that it is
possible to select a measurement for
which there is no plot.)
Configuring Plots
3
4
After you have selected the Measurement
and associated plot type, you can further
configure each of these. To configure a
plot, perform the following procedure:
1. Click Configure.
The controls in the Configure section
vary, depending on the type of measurements and plots that you previously selected in the Select window.
2. In this example, click 1 to display the
Configure controls for an Eye Diagram
plot.
3. Click the Bit Type drop-down box, and
select the bit type that you want.
4. Click On or Off to toggle the display of
masks.
5. Click Browse.
1
2
3
4
5
44
The Masks window opens.
RT-Eye Quick Start User Manual
Page 55

6. Select the mask file that you want to
use, and then click Open.
Selecting and opening a mask toggles
Mask on. Once selected, you can
toggle the mask off or on.
For additional information on using
masks, refer to the RT-Eye online help.
7. In this example, click 2 to display the
Configure controls for a Spectrum plot.
8. Click Linear or Log for the vertical axis
scale.
9. Click Linear or Log for the horizontal
axis scale.
Using the RT−Eye Software
6
7
8
9
10. In this example, click 3 to display the
Configure controls for a Histogram
plot.
11. Click Linear or Log for the vertical axis
scale.
12. Click the Bin Resolution control to se-
lect the number of bins.
13. In this example, click 4 to display the
Configure controls for a Bathtub Curve.
14. Click Linear or Log to set the scale for
both axes.
11
12
10
14
13
RT-Eye Quick Start User Manual
45
Page 56

Using the RT−Eye Software
15. After you select and configure the plots
that you want, click Start to take your
measurements.
When sequencing is complete, the Plot
Summary window displays up to four
plots.
15
16
Reconfiguring Plots and Using the Bit Error Locator
In the following steps, you will:
H Make changes to display two plots: an eye diagram plot with a PCIExpress NTbit mask and the associated waveform
plot.
H Use the Plots Refresh button to reconfigure the plots without sequencing again.
H View the mask hits in the eye diagram plot.
H Use the Bit Error Locator function to see the mask hits (sample points) in red on the waveform.
16. Select Plots > Select.
16
46
RT-Eye Quick Start User Manual
Page 57

17. Make the following changes:
H Change the second measurement
to Eye Width.
Using the RT−Eye Software
H Change the Plot Type to
Waveform.
H Change third and fourth
measurements to None.
18. Click Configure.
19. Click 1.
20. Click Browse.
21. Locate and select the PCI Express Di-
rectory in the Masks directory.
22. Click Open.
19
17
18
20
21
23. Select PCETxNTbit.msk.
24. Click Open.
The mask file is opened and Mask is
toggled to On (if it was Off).
22
23
24
RT-Eye Quick Start User Manual
47
Page 58

Using the RT−Eye Software
25. Click Select.
26. Click Refresh.
The reconfigured plots are displayed.
27. Click the Eye Diagram Details icon.
The details of the eye diagram are
displayed.
28. Note the mask hits.
29. Click the Plot Summary Icon to display
both plots again.
27
26
25
29
30. Click the Waveform Details icon.
Note that the Bit Error Locator displays
the waveform with the mask hits
highlighted in red.
31. Click the Zoom in X icon.
32. Click the mask hits that you want to
see in detail (you may want to click
multiple times to zoom in on the waveform).
28
30
31
32
48
RT-Eye Quick Start User Manual
Page 59

33. Note the mask hits (sample hits), indi-
cated in red, on zoomed waveform.
Configuring Measurements
This topic contains information about advanced features of the RT-Eye application. Refer to the RT-Eye Serial Compliance
and Analysis Online Help for additional information, if needed.
Choosing Probe Types and Measurement Sources
When started, the RT-Eye application is configured with a default probe type and source for the measurements. You can
choose a different probe type and source, either manually or by using the Wizard. This section discusses how to manually
choose a probe type and source.
Using the RT−Eye Software
33
You can set the probe type to Single Ended or Differential. To use a single-ended probe type, you must choose two source
waveforms, nominally representing the V
V
waveforms may be two live waveforms, two reference waveforms, or two .csv files.
When you choose a Differential probe type, you must choose a single-source waveform. This waveform represents the
output of a differential amplifier external to the oscilloscope, such as that contained in a differential probe. Again, the
source may be a live channel, a reference waveform, or a .csv file.
negative
from V
to create a composite waveform on which the measurements are performed. The two source
positive
positive
and V
inputs to a differential amplifier. The application subtracts
negative
Source
Use the Source window to configure the source of your measurements. The controls displayed in the window differ,
depending on the probe type and source type that you select.
The following procedure configures the
sources for a single ended probe type.
1. Select Measurements > Select.
The Select window displays.
1
RT-Eye Quick Start User Manual
49
Page 60

Using the RT−Eye Software
2. Select Single Ended from the Probe
Type drop-down box.
3. Select Measurements > Configure >
Source.
4. Select the source type. For this exam-
ple, select Live.
2
3
4
5. Select your sources from the D+. D−
drop-down box.
The Autoset controls in the following
steps are available only when the
source type is Live.
6. Click Vertical Scale to autoset the waveforms to display full screen vertically
based on the amplitude of the sources.
7. Click Horizontal Resolution to autoset the time base to the necessary horizontal resolution and record length to
ensure accurate measurements.
8. Click Vertical & Horizontal to autoset
both the vertical scale and the horizontal resolution.
The following procedure configures the
source for a differential probe type.
1. Select Measurements > Select.
The Select window displays.
5
6
7 8
1
50
RT-Eye Quick Start User Manual
Page 61

2. Select Differential from the Probe
Type drop-down box.
3. Select Measurements > Configure >
Source.
The Source window displays. This
display is for a differential probe type
with Live/Ref selected.
Using the RT−Eye Software
2
3
4. In the Differential drop-down box, se-
lect the source of the waveform on
which you want to take measurements.
5. Click Vertical Scale to autoset the wa-
veform to display full screen vertically
based on the amplitude of the source.
6. Click Horizontal Resolution to auto-
set the time base to the horizontal resolution and record length necessary for
accurate measurements.
7. Click Vertical & Horizontal to autoset
both the vertical scale and the horizontal resolution.
8. Click Select to display the Select Mea-
surements window.
4
5 6
7
8
RT-Eye Quick Start User Manual
51
Page 62

Using the RT−Eye Software
Ref Levels
Use the Ref Levels window to set the high, middle and low reference voltages. The timing instants used by the
measurements are precisely determined by when these voltage thresholds are crossed by the source waveform(s).
You can set any of the reference levels manually, or you can choose Ref Level Autoset so that the application automatically determines appropriate levels. If you do not set the reference levels either manually or using Autoset, the application will
use default values which may cause unexpected measurement results.
Note that the Autoset button in the Measurements > Select window performs an autoset on the horizontal scale, vertical
scale, and reference level. (See page 42, Selecting Measurements and Using Autoset.)
To set the reference level values automatically, which is the preferred method,
perform the following procedure:
1. Click Ref Levels.
The Ref Level Autoset Setup window
displays.
2. Click Run.
1
2
52
RT-Eye Quick Start User Manual
Page 63

Using the RT−Eye Software
Smart Gating
Use gating to narrow the analysis to an area of the waveform specified by a gated region, filtering out unnecessary
information. The Smart Gating window has controls for two types of gating. You can gate the region using vertical cursors,
or you can use smart gating. If you use smart gating, you must set up a clock recovery window and an analysis window
within the specified clock recovery window.
Using Cursors to Set a Gated Region. To set a gated region using cursors, perform the following procedure:
1. In the instrument menu bar, select
Cursors > Cursors On. Then select
Cursors > Cursor Type > V-bars.
1
2. In the application menu bar, select
Measurements > Configure > Smart
Gating.
The Smart Gating window displays.
2
RT-Eye Quick Start User Manual
53
Page 64

Using the RT−Eye Software
3. Click Cursors.
4. Use the multipurpose knobs on the in-
strument to position the cursors, defining the area of the waveform in which
measurements will be taken.
5. Click Start to take measurements on
the waveform between the cursors.
4
5
3
Using Smart Gating to Set Up a Gated Region. To set a gated region using smart gating, you must set up a Clock
Recovery Window, and then define your gated region by setting up an Analysis Window within the Clock Recovery
Window.
Setting Up the Clock Recovery Window. Perform the following procedure:
1. Click Measurements > Configure >
Smart Gating.
1
2. Click Smart Gating.
3. Click the Gating Units drop-down box,
and select the type of units that you
want to use.
4. Click Start in the Clock Recovery Window, and enter the unit interval or edge
within the record where the clock recovery starts.
5. Click Length in the Clock Recovery
Window, and enter the length in unit
intervals or edges of the window over
which the application recovers the
clock.
6. Note the unit interval or edge on which
the clock recovery will stop.
3
2
4
5
6
54
RT-Eye Quick Start User Manual
Page 65

Using the RT−Eye Software
You can take measurements on multiple
clock recovery windows within the
waveform. To use multiple windows,
perform these additional steps:
7. Check Enable Scan.
8. Click Scan Incr, and enter the number
of unit intervals or edges by which you
want to each scan to be offset from the
prior one.
9. Click #Scans, and enter the number of
scans that you want to make, or, if you
want to scan the entire record, check
Scan to End of Record.
Setting Up the Analysis Window. After setting up the Clock Recovery Window, you must set up the Analysis Window.
There are three ways to set up the Analysis Window:
H The same as the Clock Recovery Window
H A smaller region centered within the Clock Recovery Window
H A user-defined region positioned anywhere within the Clock Recovery Window
9
7
8
To set up the Analysis Window, perform the one of the following procedures.
Setting the Analysis Window the same
as the Clock Recovery Window.
1. Check Same as Clock Recovery Win-
dow. Your Analysis Window is now set
up.
1
RT-Eye Quick Start User Manual
55
Page 66

Using the RT−Eye Software
Setting the Analysis Window Centered
within the Clock Recovery Window.
1. Clear the Same as Clock Recovery
Window check box.
2. Select Centered from the Alignment
drop-down box.
3
3. Click Length, and set the size of the
window in unit intervals or edges. Your
Analysis Window is now set up.
Setting a User-Defined Analysis
Window within the Clock Recovery
Window.
1. To specify the absolute position of the
Analysis Window within the Clock Recovery Window, select User Defined
from the Alignment drop-down box.
2. Click Start, and enter the unit interval
or edge that you want the Analysis
Window to start.
3. Click Length, and set the size of the
window in unit intervals or edges. Your
Analysis Window is now set up.
Clock Recovery
Use the following procedures to set up
clock recovery using different clock
recovery methods.
2
1
2
3
1
56
To set up clock recovery as a phaselocked loop with the bandwidth based on
an industry standard method, perform the
following procedure:
1. Click Clock Recovery.
The Clock Recovery window displays.
2. Click the Method drop-down box and
select PLL:Standard BW.
1
2
RT-Eye Quick Start User Manual
Page 67

3. Select the standard to which you want
to test from the Standard : b/s dropdown box.
4. Click the PLL Order drop-down box,
and select between a first-order or second-order loop.
5. If you select Second for the PLL Order,
click the Damping control, and enter a
value for the damping ratio of the PLL.
6. Normally, the clock recovery software
automatically determines the bit rate of
the waveform. To explicitly guide the
clock recovery software, click On for
the Nominal Data rate.
Using the RT−Eye Software
3
6
7
5
4
7. Click the Bit Rate control, and enter
the nominal bit rate in bits per second.
To set up the Clock Recovery at a PLL
with a user-defined bandwidth, perform
the following procedure:
1. Click the the Method drop-down box,
and select PLL: User BW.
2. Click the User BW control, and input
the bandwidth.
3. To use the other controls in this win-
dow, follow the instructions in the industry standard procedure (starting
with step 4).
To set up the Clock Recovery to use the
constant clock mean or the constant clock
median method, perform the following
procedure:
1. Click the Method drop-down box and
select Const Clk Mean or Const Clk
Median.
2
1
1
2. To explicitly guide the bit rate used by
the clock recovery software, do steps 6
and 7 in the industry standard procedure.
RT-Eye Quick Start User Manual
57
Page 68

Using the RT−Eye Software
Jitter
Use the controls in the Jitter window to
set up for Jitter@BER measurements.
These controls are not required for a TIE
jitter measurement.
If your waveform has a cyclically-repeating pattern and you know the pattern
length in unit intervals, perform the
following procedure:
1. Click Jitter.
2. Select Repeating in the Type drop-
down box.
3. Select from one of the industrystandard bit patterns in the Pattern
drop-down box. If your pattern is not
listed, choose Custom.
4. If you selected Custom as the pattern,
then enter the pattern length.
1
2
3
4 5
5. Click the BER control, and enter the bit
error ratio. The eye opening and total
jitter at this BER is extrapolated.
If your waveform does not have a
repeating pattern, or has a repeating
pattern for which you do not know the
length, perform the following procedure:
1. Click Jitter.
2. Select Arbitrary in the Type drop-down
box.
3. Click the Window Length control to
set the number of history bits used to
calculate data-dependent jitter for each
edge in the waveform (typically 5 to 10
bits).
4. Click the Population control to set the
minimum population that each bit pattern must be observed before it is used
as a basis for data-dependent jitter calculations (typically 100 to greater than
1000).
2
1
3 4
5
58
5. Click the BER control, and enter the bit
error rate. The measurement will extrapolate the eye opening and total jitter at this BER.
RT-Eye Quick Start User Manual
Page 69

Population
Use the controls in the Population window
to set the maximum population on which
the selected measurements are taken. In
Free Run mode, sequencing will automatically halt when the specified population is
reached on all measurements.
1. Click Population.
2. Click On.
3. Select Measurement or Acquisitions
in the Limit By drop-down box.
4. Click the Limit control, and specify the
number of measurements or acquisitions that you want to set as the limit.
General Config
Using the RT−Eye Software
1
2
4
3
Use the controls in the General Config
window to set whether rise, fall, and
amplitude measurements are limited to
transition bits or all bits. You can also
enable worst-case logging in the scan
mode.
1. Click General Config.
2. Click to toggle the features.
1
2
RT-Eye Quick Start User Manual
59
Page 70

Using the RT−Eye Software
Setting Limits
The Serial Analysis module provides a Limits file that includes combinations of all measurements and statistical
characteristics and an appropriate range of values for each combination. The application can use the Limits file and a
mask file to determine the Pass or Fail status for compliance tests. You can view and edit existing files or create new limit
files that meet your test needs.
Viewing the Current Limits
To view the current limits, perform the
following procedure:
1. Select Measurements > Limits.
The Limits window displays.
1
2. Click Off.
3. Click Browse to find the Limits file that
you want to display.
4. Click Current.
The RT-Eye Limits Editor Editor opens
and displays the values in the currently
selected Limits file.
2
4
3
60
RT-Eye Quick Start User Manual
Page 71

Editing the Currently Displayed Limit File
To edit the currently displayed Limit file,
perform the following procedure:
5. Using the drop-down boxes and con-
trols, edit any measurement, statistic,
lower limit, or upper limit that you
want.
6. To add a new measurement, click + in
the toolbar. A new line is added with
None selected as the measurement to
the end of the list. Set up this measurement as you want.
7. To remove a measurement, select
None as the measurement, and click
Compact. Compact removes all mea-
surements that are set to None.
8. Click Validate to verify that the limits
for each measurement are valid and
that there are no duplicate measurements.
Using the RT−Eye Software
6
5
8
7
RT-Eye Quick Start User Manual
61
Page 72

Using the RT−Eye Software
Viewing a Summary of the Limits
9. To view a summary of the currently dis-
played file, select File > Show Summary.
The Summary window displays.
The summary table displays all the
measurements, statistics, lower limits,
and upper limits that you have set up.
10. Click OK.
9
62
10
RT-Eye Quick Start User Manual
Page 73

Saving the Limits File
11. Click Cancel to close the editor with-
out saving any of your changes.
12. Click Save As to save your file. Be
sure to save the file with a different
name, unless you want to overwrite the
current file.
13. Close the RT-Eye Limits Editor.
Using Limits
14. After you select the Limits file that you
want to use, click On.
15. Click Start.
The Result Summary window displays.
14
Using the RT−Eye Software
12
11
15
16. Check the Status column for PASS/
FAIL results for the measurements on
which you set limits.
16
RT-Eye Quick Start User Manual
63
Page 74

Application Examples
Application Examples
Creating a Custom Compliance Module with Pass/Fail Limits
This application example shows you how to perform jitter analysis compliant with T11.2 MJSQ methodology using the
spectrum approach. You will use the Setup Wizard to quickly set up and take your measurements and display plots, select
an appropriate mask for the eye diagram, define a limits module, create a compliance report, and save your test so that
you can run it when you start up the application again (or at any other time).
The signal used for this example is a 127 bit, PRBS repeating pattern. A Tektronix P7380SMA differential probe with
phase-matched SMA cables is connected to the positive and negative outputs of a 2.5 Gb/s signal source. The differential
probe is then connected to Channel 1 of the instrument.
The RT-Eye Serial Data Compliance and Analysis Application must be installed and enabled on your instrument.
Starting the RT-EyeApplication
1. Press AUTOSET on the front panel of
the instrument to view the differential
signal.
64
2. Start the application:
H For non-B and non-C model
oscilloscopes, select File > Run
Application > RT-Eye Serial
Compliance and Analysis.
2
RT-Eye Quick Start User Manual
Page 75

H For B and C model oscilloscopes,
select App > RT-Eye Serial
Compliance and Analysis.
The RT-Eye application displays in the
lower half of the screen.
Application Examples
2
Running the Setup Wizard
3. If the RT-Eye Welcome dialog box dis-
plays, click Run Wizard.
4. If the RT-Eye Welcome dialog box
does not display, select Measurements > Wizard0.
3
4
RT-Eye Quick Start User Manual
65
Page 76

Application Examples
5. Make the following selections in the
Setup Wizard:
Step 1Differential
Step 2Ch1
Step 3PCIE : 2.5G
Step 4Timing, Amplitude, TIE
Jitter, Jitter@BER, Repeating, 127 UI
Step 5Yes
Step 6Yes
Step 7Eye Diagram, Spectrum,
Bathtub Curve, Jitter Histogram
6. Click Run.
Viewing the Results
7. View the results.
The Plot Summary window displays
the plots that you selected and the
Results Summary window displays the
measurements.
5
6
8. Click Details.
7
8
66
RT-Eye Quick Start User Manual
Page 77

9. Select Jitter @ BER from the Select
Measurement drop-down box.
10. View the details of the Jitter @ BER
measurement.
Summary of Displayed Results
Application Examples
9
10
The three plots of jitter and the corresponding measurements represent a typical method of taking jitter measurements
using the Spectrum Method of Rj/Dj separation.
The TIE histogram (lower left-hand plot) is the traditional method of measuring jitter on an oscilloscope. This method is
limited by the amount of statistical certainty that can be achieved in a reasonable amount of time. More advanced DSP
methods are used to determine the jitter eye opening, total jitter, random jitter, and deterministic Jitter.
The TIE measurements are transformed into the frequency domain by performing an FFT on the raw TIE data, creating the
jitter spectrum shown in the upper right-hand plot. The spikes in the frequency domain represent deterministic jitter. Further
analysis can be done to determine which spikes are Duty Cycle Distortion (DCD), which are Data Dependent Jitter (DDJ),
and which are Periodic Jitter (PJ). Once these values are removed (DJ), then what is left is a noise floor which represents
the Random Jitter (RJ).
These transformed values are used to create the Cumulative Distribution Function (CDF), commonly known as the
Bathtub Curve, shown in the lower right−hand plot. The magenta line at 10 −12 BER represents the jitter eye opening
measurement. As can be seen by the measurement results, the following equation applies:
Eye Opening @ BER = [1 UI − Total Jitter @ BER]
For more information about the spectrum approach to jitter measurements, refer to the MJSQ (Methodologies in Jitter and
Signal Quality) PDF file at:
http://www.t11.org/ftp/t11/pub/fc/mjsq/04−101v4.pdf
RT-Eye Quick Start User Manual
67
Page 78

Application Examples
Using a Mask
You have taken your measurements and
viewed the associated plots. Now, you will
display a custom or industry-standard
mask on the Eye Diagram plot.
11. Select Plots > Config.
12. Click 1.
13. Click Browse.
11
12
The browse window opens.
14. Locate and select the PCI Express
folder in the Masks directory.
15. Click Open.
13
14
15
68
RT-Eye Quick Start User Manual
Page 79

16. Select PCETxNTbit.msk.
17. Click Open.
The mask file is opened and Mask is
toggled to On (if it was Off).
18. Note that Mask automatically toggled
On when you opened the mask file.
Application Examples
16
17
19. Click Select.
20. Click Refresh.
The plots are recalculated using the
measurements taken previously, and
the Eye diagram is displayed with the
mask that you selected.
21. Note that mask hits,if any, are dis-
played as white dots.
19
18
20
RT-Eye Quick Start User Manual
21
69
Page 80

Application Examples
Defining a Limits Module
You have taken measurements, viewed
plots, and added an industry-standard
mask to your eye diagram, Now, you will
create a limits module to apply a limit to
the TIE Jitter measurement taken
previously.
22. Select Measurements > Limits.
23. Click New.
The RT-Eye Limits Editor window
opens.
22
24. Select TIE Jitter from the Measure-
ment drop-down box.
23
24
70
RT-Eye Quick Start User Manual
Page 81

25. Select Min from the Statistic drop-
down box.
26. Enter −60ps in the Lower Lim box.
Application Examples
27. Click + to add another measurement.
28. Select TIE Jitter from the Measure-
ment drop-down box.
29. Select Max from the Statistic drop-
down box.
30. Enter 60ps in the Upper Lim box.
31. Click Save As.
The Save window displays.
27
28
25
29
26
30
RT-Eye Quick Start User Manual
31
71
Page 82

Application Examples
32. Enter Jitter.lim as the file name.
33. Click Save.
The Save window closes.
34. Close the RT-Eye Limits Editior window.
32
33
34
72
35. Click Browse.
35
RT-Eye Quick Start User Manual
Page 83

36. Select Jitter.lim as the limits file.
37. Click Open.
Application Examples
The Limits browse window closes.
38. Click On.
39. Select Results > Details.
40. Click Clear Results.
36
37
38
41. Click Start.
42. Select TIE Jitter.
43. Note the PASS/FAIL status of the mea-
surement limits that you set up in the
Limits file.
3339
41
40
42
43
RT-Eye Quick Start User Manual
73
Page 84

Application Examples
Creating a Compliance Report
You have taken measurements, viewed
plots, added an industry-standard mask to
your eye diagram, and created a Tie Jitter
limits file. Now you will generate a
compliance report. Perform the following
steps:
44. Select Utilities > Reports.
45. Click Generate.
Wait until the report generator is
finished.
44
45
When completed, the report displays.
(Use the Alt+Tab key combination to
bring the report to the front, if necessary.)
74
RT-Eye Quick Start User Manual
Page 85

Using MyTest
You have created a custom compliance
test module. Now you will use MyTest to
save your test and run it automatically
when you start the application (or
whenever you want).
To save your settings as a MyTest file,
perform the following procedure:
46. Select Measurements > Save
MyTest.
Your current setup is saved as MyTest.
47. Select File > Exit.
The Exit RT-Eye dialogue window
displays.
Application Examples
46
48. Click No to exit without restoring oscil-
loscope settings.
47
48
RT-Eye Quick Start User Manual
75
Page 86

Application Examples
To run MyTest from the RT-Eye Welcome
dialogue box, which displays when you
start the RT-Eye application, perform the
following procedure:
49. Start the application:
H For non-B and non-C model
oscilloscopes, select File > Run
Application > RT-Eye Serial
Compliance and Analysis.
The RT-Eye Welcome dialogue box
displays.
H For B and C model oscilloscopes,
select App > RT-Eye Serial
Compliance and Analysis.
49
The RT-Eye Welcome dialogue box
displays.
50. Click Run MyTest.
The application takes the measurements and displays the results in the
Result Summary window.
51. If the RT-Eye Welcome window did not
appear, then select Measurements >
Run MyTest.
The application takes the measurements and displays the results in the
Result Summary window.
49
50
51
76
RT-Eye Quick Start User Manual
Page 87

Index
Index
A
Accessories, standard, 5
Application directories, location, 19
Application Examples, 64
Application installation, 5
Application set up, 21
Autoset Summary dialog window, 12
B
Bandwidth, system, 6
Bit Error Locator, 46
C
Calibration of oscilloscope and probes, 8
Clock Recovery, 56
See also Configuring Measure-
ments
Closing the application, 17
Compatibility, 2
Compliance modules, 2
Configurations, probing. See Probing
configurations, typical
Configuring Measurements, 49
Clock Recovery
Bit Rate, 57
Const Clk Mean, 57
Const Clk Median, 57
Damping, 57
Industry standard method, 56
Nominal Data Rate, 57
PLL Order, 57
PLL: Standard BW, 56
PLL: User BW, 57
Standard: b/s, 57
User BW, 57
User−defined method, 57
General Config, 59
Enable worst−case logging, 59
General Config Window, dis-
playing the , 59
Limit Amplitude measure-
ments, 59
Limit Rise/Fall measurements,
59
Jitter, 58
Arbitrary pattern, 58
BER, 58
Jitter window, displaying, 58
Length, 58
Pattern, 58
Population, 58
Repeating pattern, 58
Type, 58
Window Length, 58
Population
Limit by Acquisitions, 59
Limit by Measurements, 59
Limit value, 59
Population Limit, toggling, 59
Population Window, displaying,
59
Ref Levels, Autoset
Accessing Ref Levels window,
52
Setup, 52
Smart Gating, 53
#Scans (Clock Recovery), 55
Accessing Smart Gating win-
dow, 53, 54
Analysis Window, setting up,
55
Button, Smart Gating, 54
Centered (Analysis), 56
Clock Recovery, setting up, 54
Cursors, 54
Enable Scan (Clock Recovery),
55
Gating Units, 54
Length (Analysis), 56
Length (Clock Recovery), 54
Same as Clock Recovery Win-
dow (Analysis), 55, 56
Scan Incr (Clock Recovery), 55
Scan to End of Record (Clock
Recovery), 55
Start (Analysis), 56
Start (Clock Recovery), 54
Stop (Clock Recovery), 54
User−defined (Analysis), 56
Source, 49
Accessing Source window, 50
Autoset, 50
Differential Probe, 50
Horizontal Resolution, 50, 51
Single Ended Probe, 49
Source Type, 50
Source, inputs, 50, 51
Vertical & Horizontal, 50, 51
Vertical Scale, 50, 51
Configuring Plots, 44
Bathtub Curve, 45
Scale, 45
Eye Diagram, 44
Bit Type, 44
Toggling masks, 44
Histogram, 45
Bin resolution, 45
Vertical axis, selecting, 45
Spectrum
Horizontal scale, selecting, 45
Toggling masks, 45
Vertical scale, selecting, 45
Connection to device under test, 6
Conventions used in this manual, vi
CSV file, exporting to, 33
Cursors
Positioning, 28
Readouts, 28
Resetting, 28
Turning off, 28
Using, 28
D
Defining preferences
Autoset Summary dialog window,
12
High−performance eye rendering,
12
Welcome window, 12
Deskew, probe, 7
Details, viewing plot summary, 26
Device under test, connections to, 6
Docking the application, 15
Documentation, v
E
Examples, application, 64
Exiting the application, 17
Exporting plots
Data file, 30
Graphics file, 30
F
Features, key, 1
G
General Config. See Confiiguring Mea-
surements
General Safety Summary, iii
RT-Eye Quick Start User Manual
77
Page 88

Index
H
Hiding the application, 13
High−performance eye rendering, 12
I
Installation, 5
Interface, user, 18
J
Jitter. See Configuring Measurements
Jitter, configuring for, 58
K
Key features, 1
Keyboard, 5
L
Limits, 60
Compacting a Limits File, 61
Limits File Editor, 60
Limits File, browsing for a, 60
Limits File, editing, 61
Limits File, saving a, 63
Limits Window, displaying, 60
Setting, 60
Summary of limits, 62
Summary table, example of, 62
Toggling on or off, 60
PASS?FAIL, 63
Using, 63
Validating a Limits File, 61
Viewing , 60
Location of application directories, 19
Logging worst case waveforms, 39
M
Manual conventions, vi
MATLAB, 5
Measurements
Additional for Single Ended, 43
Autoset, using, 42, 43
Configuring. See Configuring Mea-
surements
Detail View, 33
Displaying the measurement win-
dow, 42
Exporting to CSV file, 33
Selecting, 42
Selecting all, 43
Selecting Probe Type, 43
Turning off or on, 43
Menu structure, 18
Minimizing and maximizing the applica-
tion, 14
Minimum requirements, 3
Modules, compliance, 2
MyTest, 41
Running, 42
Running from the menu, 42
Running from the Welcome window,
42, 76
Saving from the menu, 41, 75
Saving when exiting, 41
O
Oscilloscope, 5
Oscilloscope calibration, 8
P
Preferences, defining, High−performance
eye rendering, 12
Plot Summaries
Cursor functions. See Cursors
Display full screen, 25
Display in lower half of screen, 24
Display in upper half of screen, 25
Grid display, 29
Viewing, 24
Viewing details, 26
Zoom function. See Zoom
Plots
Configuring. See Configuring Plots
Exporting, 30
Printing, 31
Reconfiguring. See Configuring
Plots
Selecting, 43
From menu, 43
Measurement to be plotted, 44
Plot type, 44
Using button, 43
Population, configuring, 59
See also Configuring Measure-
ments
Preferences, defining, 12
Autoset Summary dialog window,
12
Welcome window, 12
Probe calibration, 8
Probe deskew, 7
Probe type, Selecting in Wizard, 23
Probing configurations, typical, 6
One P73XX differential probe, 7
One P73XX SMA differential probe,
7
Two P72XX single−ended or P73XX
differential probes, 7
Two TCA−to−SMA adapters, 6
R
Ref Levels, 52
Configuring. See Configuring Mea-
surements
Related documentation, v
Relevant Web Sites, v
Reports
Accessing the Report Generator,
34, 74
Compliance, 34
Creating new, 34
Directory, 34
Example of , 35, 74
File formats, 34
Generate button, 34, 74
Generating, 34
Moving the Report window to the
front, 35, 74
Printer icon, 35
Printing, 35
Printing a saved report, 36, 38
Report generator utility, 34
Saving, 36
Selecting a printer, 35
Viewing a saved report, 36
Requirements
keyboard, 5
MATLAB, 5
minimum, 3
oscilloscope, 5
Results
Accessing the Detail View, 33
Accessing the Summary View, 32
Detail view, 32
Detail window example, 33
Exporting to CSV file, 33
Measurement selection for details,
33
Summary view, 32
Time Units, selecting, 33
78
RT-Eye Quick Start User Manual
Page 89

Index
S
Safety Summary, General, iii
Save MyTest check box, 17
Sequencing Controls, 16
Modes
Free Run, 16
Single No Acq, 16
Single Run, 16
Stop, 16
Setup Wizard
Access from menu, 22, 65
Access from Welcome window, 22
Example display, 23
Probe type,selecting, 23
Running the, 23
Selections, making, 23
Summary windows example, 24
Using the, 22
Setup, saving a, 41
Smart Gating
See also Configuring Measure-
ments
Types, 53
Source, Configuring. See Configuring
Measurements
Standard accessories, 5
Starting the application
Newer instruments, 11, 22
Older instruments, 11, 22
Structure, menu, 18
System bandwidth, 6
T
Time units, selecting, 33
U
Undocking the application, 15
User interface, 18
V
Viewing Results, 32
W
Waveforms
Accessing the Config controls, 39
Browsing to a log file, 39
File names, 40
Logging worst case, 39
Opening a worst case file, 39
Purging worst case files, 40
Turning off logging, 40
Turning on logging, 39
Web sites, relevant, v
Welcome window, 12
Wizard, Setup. See Setup Wizard
Z
Zoom, 26
100% icon, 28
Horizontal, 27
Horizontal, multiple times, 28
In, 26
In, multiple times, 27
Out, 27
Out, multiple times, 27
RT-Eye Quick Start User Manual
79
Page 90

Index
80
RT-Eye Quick Start User Manual
 Loading...