

Page 1
Real-Time Spectrum Analyzer Software
RSAVu Data Sheet
Analog Demodulation Analysis including Baseband, AM, FM, PM
measurements
Audio Distortion Analysis of Baseband, AM and FM with Rea l-time
and Graphical Display of Harmonics and Spurious. Wide
ssing Analysis
urement Results through GPIB/LAN
Features & Benefits
Real-Time Spectrum Analyzer Software for RTSAs, Oscilloscopes,
and L ogic Analyzers
Offline Si
gnal Analysis
Multidomain Analysis Enables Fast, Complete Signal Analysis in
Frequency, Time, Code, and Modulation Domains
Complete Analysis for Acquisition Rates as F ast as 50 GS/s with
Oscilloscopes
Pulse Measurements including Pulse Width, PRI, Pulse-to-Pulse
Phase, P
General Purpose Digital Modulation Analysis for a Wide Variety of
Modulation Types
RFID Interrogator and Response Analysis
Signal Source Analysis Simplifies Phase Noise, Jitter, and Frequency
Settling Measurements
Easy Ana
C4FM modulation analysis for Project 25 Compliance
Measurements*
3G Measurement Versatility with W-CDMA, cdma2000, 1x EVDO,
HSUPA, HSDPA, RF and Modulation Analysis
802.11a/b/g/n Measurement Suite
ulse power
lysis of IEEE 802.15.4 (ZigBee) Measurements
1
Spectrogram
Choices of Low-pass Filters, High-pass Filters, Band-pass Filters,
and De-emphasis Settings.
Import User-defined and Reference Filters for Customer Modulation
Types
Save Captured Waveforms in .mat or .csv Formats for
Post-proce
Programmatic Interface (With RSAVu on an External PC)
Integrate with Test Executive for Automated Compliance and Stress
Testi n g
Access Meas
Batch Process Data Files Without Being Connected to Acquisition
Hardware
Applications
Very Wideband Signal Analysis Using Oscilloscope Acquisitions
Field Tactical Radio
P25 (C4FM signal analysis)
Radar
Digital Modulation Analysis
RFID
Phase Noise
Jitter
GSM/EDGE
W-CDMA
HSUPA
HSDPA
CDMA2000 1x
CDMA2000 1xEV-DO
IEEE 802.11 a/b/g/n WLAN with MIMO
IEEE 802.15.4 OQPSK (ZigBee)
Audio Distortion Analysis
*1Typical or representative performance. See individual data sheets for more complete specifications.
Memory depth refers to available acquisition-instrument memory. RSAVu can accept waveforms as large
as the available instrument memory. RSAVu analysis length maximum is 64 M Samples.
Page 2
Data Sheet
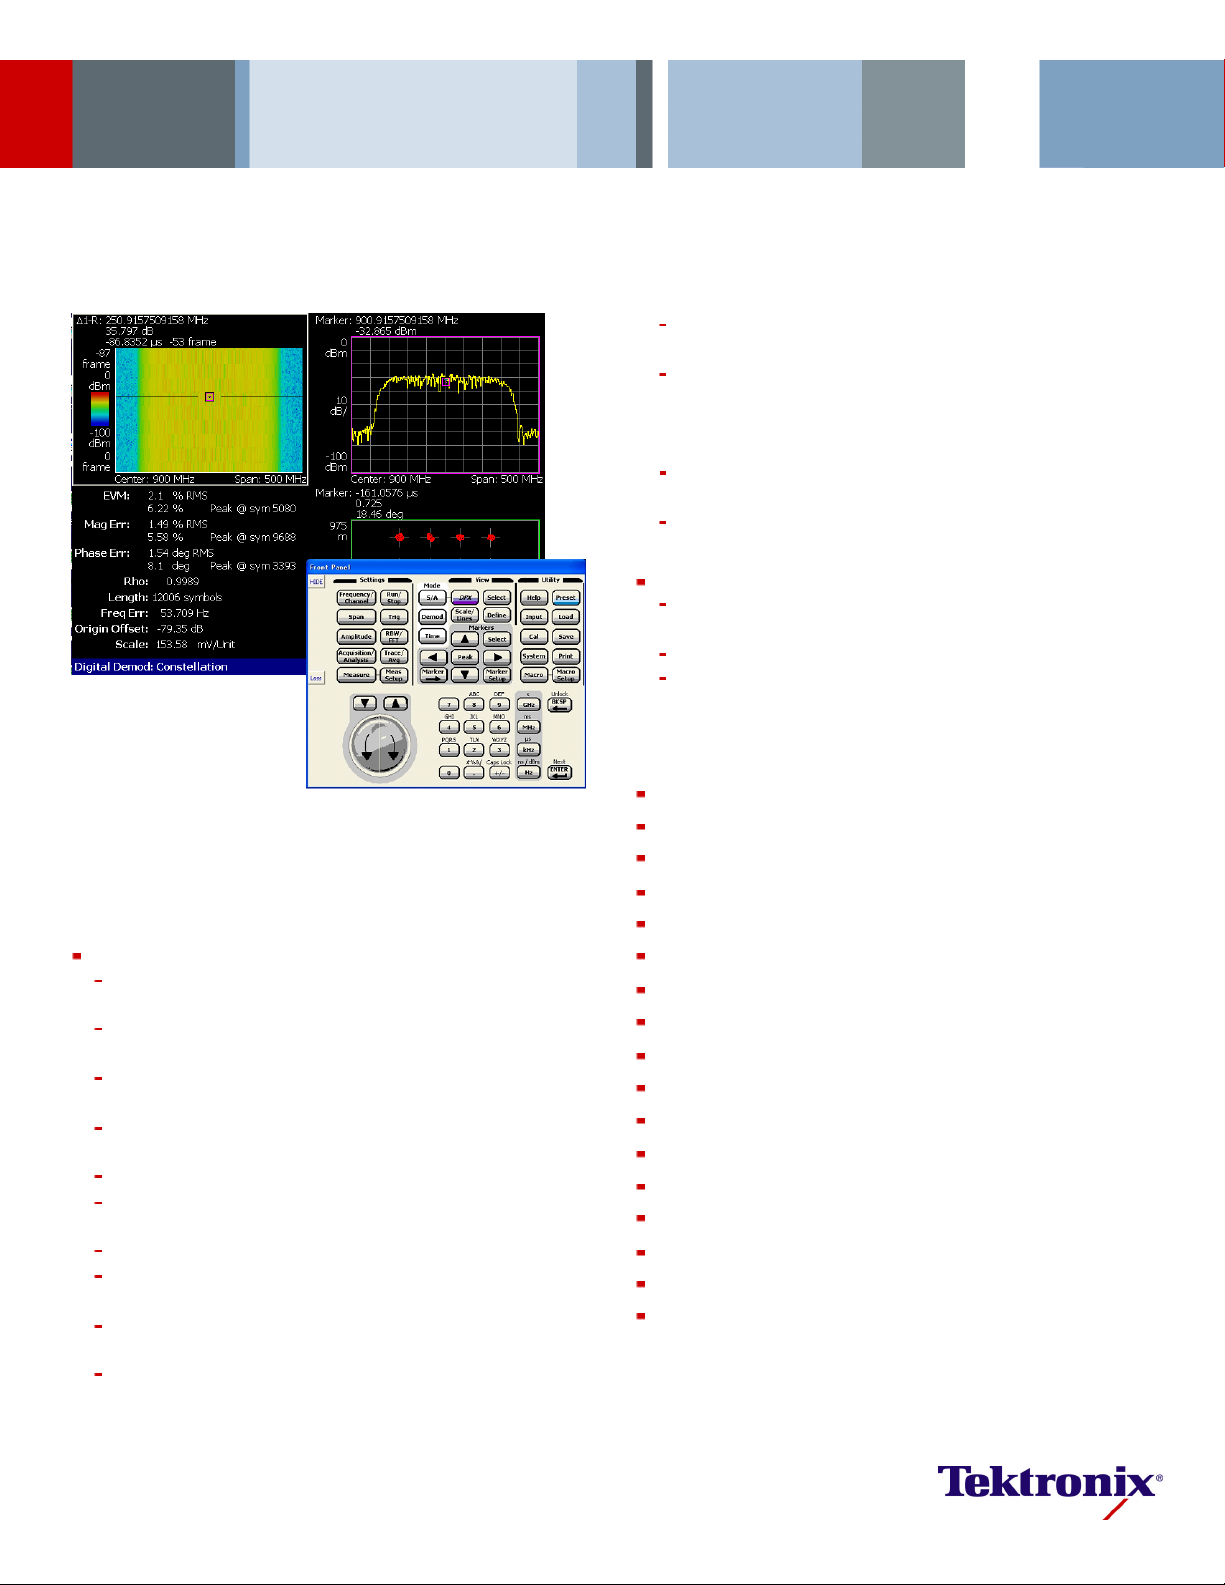
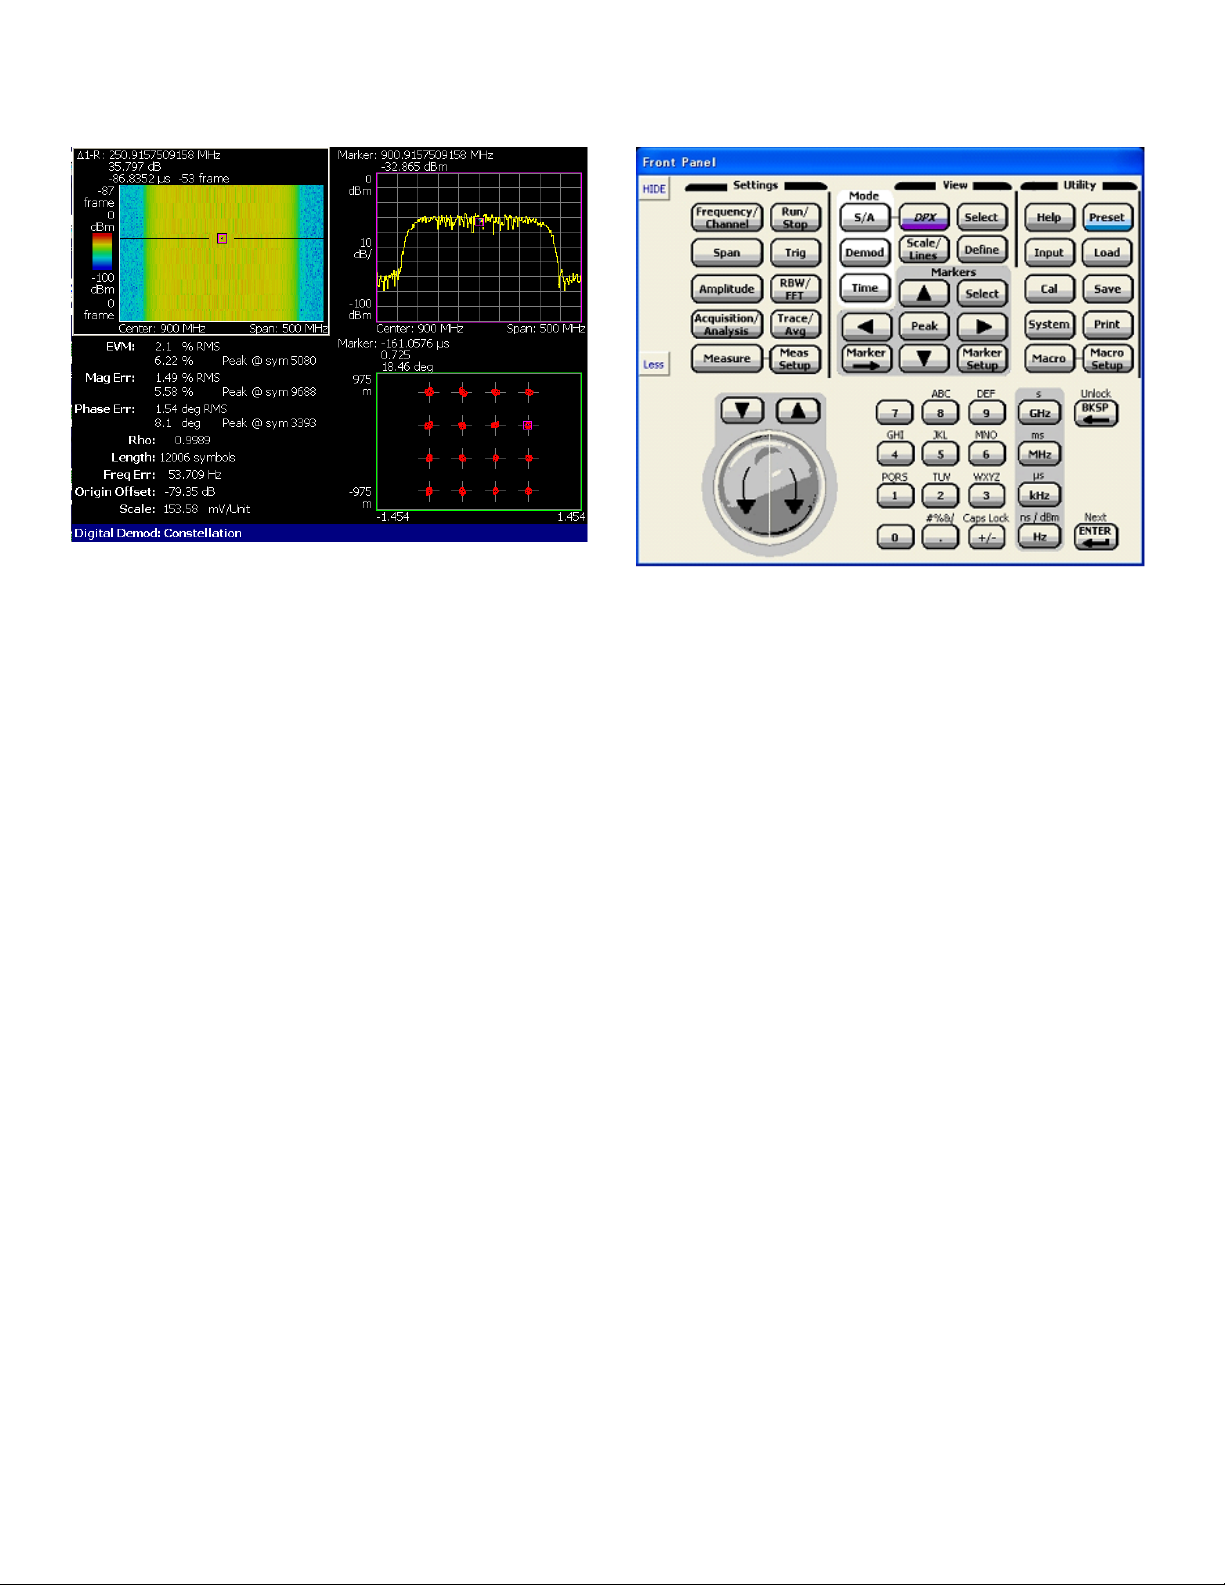
Oscilloscope capture of 312.5 MSymbols/sec 16 QAM signal, analyzed with RSAVu
Real-Tim
RTSAs, O
e Spectrum Analyzer Software for
scilloscopes, and Logic Analyzers
RSAVu (RSA6000A, RSA3000 Series RTSAs,
DSA/DSO70000 Series, and TLA5000/7000
Series)
OfflineAnalysisSoftwareforRSA6000,
RSA3000 Series RTSAs, DSA/DSO70000
Series Oscilloscopes, and TLA5000/7000
Logic Analyzers
RSAVu software enables offline analysis of data captured from Tektronix
Real-Time Spectrum Analyzers (RTSAs) and oscilloscopes. The software
The RSAVu s
offers u
the RSA3408B software option suite. From 3G wireless standards to the
latest RFID formats and pulsed-signal analysis, RSAVu is a tool designers
can use to analyze signals without having acquisition hardware connected.
The software supports data files saved on the RSA6106A, RSA6114A,
RSA3408A/B, R SA3 308A/B and RSA3303A/B Real-Time Spectrum
Analyz
When used with the RSA6000 Series RTSA and oscilloscopes, RSAVu
can be i
used on an external PC, RSAVu supports a remote interface for performing
data analysis in automated test environment. Users can programmatically
load RSA data files and extract demodulated parameters using their test
software to minimize time required for conformance and stress testing.
oft front panel allows easy offline access to settings and controls
sers the same demodulation and analysis capabilities included in
ers and DSA/DSO70000 Series oscilloscopes with option UWB.
nstalled and manually operated directly on the instrument. When
2 www.tektronix.com
Page 3

Characteristics
Sampling rates
instrument-dependent as shown in the table below.
, dynamic range, accuracy and memory depth of the analysis is
Real-Time Spectrum Analyzer Software — RSAVu
Supported Instrum ent /
Characteristics*
1
Frequency Range
Analysis Bandwidth 15 MHz 36 MHz Up to 110 MHz
Sampling Ra
te, Maximum
Memory Depth (max) Memory
Depth, seconds (at maximum
RSA3303
RSA3308
DC - 3/8 GHz DC - 8 GHz
RSA3408 RSA6106A
RSA61114A
9kHz-
6.2/14 GHz
DSA/DSO70000
DC -
Up to 20 GHz
Up to 20 GHz
51.2 MS/sec 102.4 MS/se
c
Up to
300 MS/sec
Up to
50 GS/sec
256 MB 2.56 sec 256 MB 1.28 sec 1000 MB 1.28 sec 200 MB X 4 channels 4 ms
at 50 GS/s
sampling rate)
Spectrum Analysis Spurious Free
-70dBc -73dBc -73dBc ~-40dBc
Dynamic Range
Residual EVM, typical
NA NA NA
<1.5%
(1.6 GSymbol/sec QPSK, 2 16 GHz Carrier Frequency)
al EVM, typical
Residu
mbol/sec QPSK, 2 GHz
(4 Msy
er Frequency)
Carri
*1Typical or representative performance. See individual data sheets for more complete specifications. Memory depth refers to available acquisition-instrument memory. RSAVu can accept waveforms as large as the available
instrument memory. RSAVu analysis length maximum is 64 MSamples.
Measurement Functions in the Base RSAVu Software
Note: available as a free download.
Measurement
Mode
Measurements and Displays
Spectrum Operates on recalled spectrum traces.
Channel Power, Adjacent Channel Power, Occupied
< 2% <0.6% <0.6% < 1%
Measurement Functions and Specifications Available
with RSAVu Options
Options allow you to extend the analysis capabilities of RSAVu to include general
purpose and applications-specific modulation analysis. The following measurement
characteristics apply to both the RSA3000A and RSA6000A Series Real-Time
Spectrum Analyzers.
Bandwidth, Emission Bandwidth, Carrier-to-Noise Ratio,
Carrier Frequency, Spurious Search, dBm/Hz Marker,
dBc/Hz Marker, Spectrum Emission Mask
DPX
Spectrum Trace and DPX Bitmap recall
RTSA Mode Channel Power, Adjacent Channel Power, Occupied
Bandwidth, Emission Bandwidth, Carrier-to-Noise Ratio,
Carrier Frequency, Spurious Search, dBm/Hz Marker,
dBc/Hz Marker, Real-Time Spectrum Emission Mask
RTSA with Zoom dBm/Hz Marker, dBc/Hz Marker
Analog Mod. Analysis
IQvs. Time,AMDepth,FMDeviation,PM,Pulse
Spectrum
Time
IQ vs. Time, Power vs. Time, Frequency vs. Time, CCDF,
Crest Factor
Pulse Pulse Width, Peak Power, Ripple, Pulse Repetition
Interval, Duty Cycle, Pulse-to-Pulse Phase, Frequency
Deviation, Channel Power, OBW, EBW
Opt. 10 - Audio Distortion Analysis
Characteristic
Description
Demodulation Types Baseband, AM and FM
Measurement Range 20 Hz to 100 kHz
Displays
Measurements
Spectrum and Spectrogram
S/N, SINAD, THD, TNHD, Hum and Noise Ratio, Audio
Frequency
Audio Filters
De-emphasis 25 us, 50 us, 75 us, 750 us
LPF 3 kHz, 15 kHz, 30 kHz, 80 kHz
HPF 50Hz,300Hz,400Hz
CCITT
C-message
www.tektronix.com 3
Page 4

Data Sheet
Opt. 21 – Advanced Measuremen t Suite Software
Characteristic
Modulation Formats
Parameter Presets
Vector Diagram
Display Format
Constellation Diagram
Display Format
Eye Diagram Display
Format
Error Vector Diagram
Display Format
gFormat
Codin
Symbol Table Display
Format
Signal Source Analysis Phase Noise, Jitter, and Frequency Settling Measurement
RFID Standards
Description
BPSK, QPSK, OQPSK, SOQPSK, π/4 – DQPSK, 8PSK,
D8PSK, 16QAM, 32QAM, 64QAM, 128QAM, 256QAM,
GMSK, GFSK, ASK, FSK, 4FSK, 8FSK, 16FSK, CPM
(per MIL STD 188-181C), DSB-ASK, OOK, PR-ASK,
SSB-ASK, Subcarrier OOK, Subcarrier BPSK, C4FM
(Fixed symbol rate and span). Coding format varies with
modulation type. User defined filters are also available.
PDC, PHS, NADC, TETRA, GSM, CDPD, Bluetooth, IEEE
802.15.4 OQPSK (ZigBee), C4FM (Project 25)
Symbol/Locus Display, Frequency Error and Origin Offset
Measurement
Symbol Display, Frequency Error and Origin Offset
Measurement
I/Q/Trellis Display (1 to 16 symbols)
EVM, Magnitude Error, Phase Error, Waveform Quality (ρ),
Frequency Error and Origin Offset Measurement ~
r, Modified Miller, Miller (M_2), Miller (M_4), Miller
Mille
, Manchester, NRZ, direct-phase, grey and
(M_8)
specific coding. Coding format availability varies
RFID-
modulation format.
with
Binary, Octal, Hexadecimal
ISO/IEC 18000-7
ISO/IEC 18000 Part 6 Type A, B, C
ISO/IEC 18000 Part 4 Mode 1
ISO/IEC 18092 (424k)
ISO/IEC 15693
ISO/IEC 14 443 Part 2 Type A, B
EPC Global Generation 1 Class 0, Class 1
Digital Demodulation
Characteristic
GMSK (1 MHz Span) EVM ≤1.8%, Magnitude Error ≤1.2%, Phase Error ≤1.0º
64QAM, 5.3 MS/s
1GHzCarrier(15MHz
Span)
QPSK, 3.84 MS/s
2GHzCarrier(15MHz
Span)
Description
EVM ≤2.5% (typical)
EVM ≤2.5% (typical)
QPSK EVM (%), Typical
Characteristic RSA6000A RSA3408A/B RSA3300A/B
QPSK EVM CF
=2GHz(typical
value)
0.5% (at 100 kS/s)
0.5% (at 1 MS/s)
0.6% (at 4 MS/s)
0.9% (at 10 MS/s)
0.5% (at 100 kS/s)
0.5% (at 1 MS/s)
0.6% (at 4 MS/s)
0.9% (at 10 MS/s)
0.5% (at 100 kS/s)
0.5% (at 1 MS/s)
1.2% (at 4 MS/s)
2.7% (at 10 MS/s)
Opt. 24 – GSM/EDGE Analysis Software
Burst Type: Normal
Characteristic
Modulation Measurement Accuracy
Carrier Power Range
Phase Error
Measurement
Accuracy for
Modulation
Phase Error Resolution
EVM Measurement
Accuracy for 8-PSK
Modulation (typical)
EVM Resolution
Time Resolution 0.15625 μsat5MHzspan
Burst Count
Mean Power Measurement
RF Input Range -50 dBm to +30 dBm
Absolute Power
Measurement
Accuracy for GSM900
at 20 ºC to 30 ºC,
Excluding Mismatch
Error (typical)
Absolute Power
Measurement
Accuracy for
DCS1800/PCS1900
at 20 ºC to 30 ºC,
Excluding Mismatch
Error (typical)
Resolution 0.01 dB
Burst Count
Power Versus Time Measurement
RF Input Range -50 dBm to +30 dBm
Power Ramp Relative
Accuracy (typical)
Time Resolution
(typical)
Marker Amplitude
Resolution
Burst Count
odulation Spectrum Measurement
M
Carrier Power Range
Dynamic Range for
GMSK Modulation
(typical)
Dynamic Range for
8-PSK Modulation
(typical)
Burst Count
Switching Spectrum Measurement
Carrier Power Range
Dynamic Range for
GMSK Modulation
(typical)
Dynamic Range for
8-PSK Modulation
(typical)
Burst Count
GMSK
(typical)
Description
-30to+30dBm
≤0.8º (RMS) 1.8º (Peak)
0.01º
≤0.9% (RMS)
0.01%
1000 maximum
±0.5 dB, Signal frequency: 880 MHz to 960 MHz, Signal
power: +10 dBm to -30 dBm, RF attenuator: 0 dB to
20 dB, after auto level is performed at 5 MHz span
±0.6 dB, Signal frequency: 1710 MHz to 1990 MHz, Signal
power: +10 dBm to -30 dBm, RF attenuator: 0 dB to
20 dB, after auto level is performed at 5 MHz span
1000 maximum
±0.2 dB at 0 dBfs to -40 dBfs
0.15625 μsat5MHzspan
0.001 dB
1000 maximum
-5 dBm to +30 dBm
82 dB at 600 kHz offset (30 kHz RBW) 86 dB at 1.2 MHz
offset (30 kHz RBW) 83 dB at 1.8 MHz offset (100 kHz
RBW),85dBat6MHzoffset(100kHzRBW)
82 dB at 600 kHz offset (30 kHz RBW), 85 dB at 1.2 MHz
offset (30 kHz RBW), 83 dB at 1.8 MHz offset (100 kHz
RBW),83dBat6MHzoffset(100kHzRBW)
1000 maximum
-5 dBm to +30 dBm
75 dB at 400 kHz offset (30 kHz RBW), 80 dB at 600 kHz
offset(30kHzRBW),84dBat1.2MHzoffset(30kHz
RBW),88dBat1.8MHzoffset(30kHzRBW)
75 dB at 400 kHz offset (30 kHz RBW), 80 dB at 600 kHz
offset (30 kHz RBW)
84 dB at 1.2 MHz offset (30 kHz RBW)
88 dB at 1.8 MHz offset (30 kHz RBW)
1000 maximum
4 www.tektronix.com
Page 5

Real-Time Spectrum Analyzer Software — RSAVu
Opt. 25 – cdma2000 1x Analysis Software
Perform key mea
surement for cdma2000 forward link (3GPP2 C.S0010) and reverse
link (3GPP2 C.S0011)
Opt. 26 – 1xEVDO Analysis Software
Perform key measurement for cdma2000 forward link (3GPP2 C.S0010) and reverse
link (3GPP2 C.S0011)
IEEE 802.11 Measurements
Measurement Measurement
Modulation Analysis
EVM vs. Time
Contents
EVM X X X X
802.11a 802.11b 802.11g 802.11n
Magnitude Error X X X X
Phase Error X X X X
Power vs. Time
Constellation
EVM vs. SC
—
—
XXXX
XXXX
EVM X X X X
Magnitude Error X X X X
Phase Error X X X X
Power vs. SC
SC Constellation
Frequency Error
OFDM Flatness
OFDM Linearity
Symbol Table
2x2MIMOSignalAnalysis
Power Analysis
Transmit Power
Transmission Analysis
Transfer Function vs. Time
Delay Profile vs. Time
—
—
—
—
—
—
————
——
————
————
XXXX
XXXX
XXXX
X
X
XXXX
cdma2000 1x and 1xEVDO Forward and Reverse Link
Characteristic
Code Domain Power
Relative Code Domain
Forward and Reverse Link
±0.075 dB
Power Accuracy,
Typical
QPSK EVM
Minimum Carrier
-40 dBm
Power at RF Input
EVM Floor, Typical
Modulation Accuracy (composite)
Minimum Carrier
2.0%
-40 dBm
Power at RF input
Composite EVM Floor,
2.0%
Typical
Rho (ρ)
Frequency Error
0.999
±10 Hz + center frequency accuracy
Accuracy
Forward Link Timing
±250 ns
Accuracy (τ)
CCDF
ogram Resolution
Hist
Minimum Carrier
0.01
-50 d
dB
Bm
Power at RF Input
-50 dBm
—
—
X
X
X(SISOonly)
X(SISOonly)
X
XX
—
X
X
Opt. 30 – 3GPP Release 99 (WCDMA) and Release 5 Downlink
(HSDPA) Analysis Software
3GPP Release 99 W-CDMA Uplink Analysis
Perform key measurements for 3GPP TS34.121 including PRACH analysis
capability.
Supports the following m easurements — Constellation, EVM, Eye Diagram,
Symbol Table, CDP Spectrogram, CDP vs. Short Code, CDP vs. Symbol, CDP vs.
Time Slot, Symbol Constellation, Symbol EVM, Symbol Eye Diagram.
Supports W-CDMA uplink signals — DPDCH 9 Dedicated Physical D ata
Channel/DPCCH (Dedicated Physical Control Channel), PRACH (Physical Random
Access Data Channel), PCPCH (Physical C ommon Packet Channel).
www.tektronix.com 5
Page 6

Data Sheet
3GPP Release 5 Downlink (HSDPA) Analysis
Perform key mea
surements for 3GPP TS25.141 v5.7.0
3GPP-R5 Downlink
Characteristic
Modulation Format
Channel Power Measurement
Minimum power at RF
Description
QPSK, 16QAM auto detection
-50 dBm
input
Absolute Power
Measurement
Accuracy (typical)
±0.6 dB at 20 °C to 30 °C, excluding mismatch error
Signal frequency: 1900 - 2200 MHz
Signal power: +10 dBm to -30 dBm after auto level is
performed at 10 MHz span.
Relative Power
Measurement
Accuracy (typical)
±0.2 dB at 20 °C to 30 °C, excluding mismatch error
Signal frequency: 1900 - 2200 MHz
Signal power: 0 dBm to -30 dBm after auto level is
performed at 10 MHz span.
on
Resoluti
ACLR Measurement
Minimum Carrier
0.01 dB
-40 dBm
Power at RF Input
Signal Type,
Measurement
Mode
3GPP Downlink, 1
ACLR
Adjacent Alternate
DPCH
-68 dB
Real-time (spec.)
Stepped (typical)
CCDF Measurement
ogram Resolution
Hist
OBW (Occupied Bandwidth) Measurement
Minimum Carrier
-66 dB
-70 dB
dB
0.01
-50 dBm
-72 dB
Power at RF Input
Measurement
2% (5 MHz Span, 1000 times averaging)
0.
Accuracy
Spectrum Emission Mask
Dynamic Range
ode Domain Power
C
Relative Accuracy of
Code Domain Power
Accuracy
QPSK EVM (Pilot Channel Only)
Minimum Carrier
82 dB (30 kHz BW, Input Power > -5 dBm, 5 MHz offset)
±0.15 dB, typically ±0.075 dB
Using Test Model 5, Total Power = 0 dBm, Code Level >
-15 dB
-60 dBm (EVM <9 %)
Power at RF Input
EVM Floor (typical) 2.0% (Input Power > -40 dBm, 10 times averaged)
Modulation Accuracy (Composite, Test Model 5)
Minimum Carrier
-60 dBm (EVM < 9%)
Power at RF Input
Composite EVM Floor
2.5% (Input Power > -40 dBm, 10 times averaged)
(typical)
Frequency Error
±10 Hz + (center frequency accuracy)
Accuracy
Modulation Accuracy (Composite, Alternate Scrambling Code)
Minimum Carrier
-60 dBm (EVM <9%)
Power at RF Input
Composite EVM Floor
2.5% (Input Power > -40 dBm, 10 times averaged)
(typical)
Frequency Error
±10 Hz + (center frequency accuracy)
Accuracy
3GPP-R5 Uplink
Characteristic
ACK/NACK Analysis
ACK/NACK Analysis
Description
ACK/NACK/DTX detection, CQI decode
Function
Code Domain Power
Relative Accuracy of
Code Domain Power
±0.15 dB, typically ±0.075 dB (Total Power = 0 dBm, Code
Level > -15 dB )
Accuracy
Opt. 40 – 3GPP Release 6 Uplink (HSUPA) Analysis Software
Perform key measurement for 3GPP TS25.141 141 V6.11.0 and TS25.101 V6.9.0
(Uplink)
3GPP - R6 Uplink
Characteristic
Modulation Format
Code Domain Power
Relative Accuracy of
Code Domain Power
Accuracy
QPSK EVM (Pilot Channel O nly)
Minimum Carrier
Description
Channel detection, IQ split analysis
±0.15 dB, typically ±0.075 dB
Using Test Model 5, Total Power = 0 dBm, Code Level >
-15 dB
-60 dBm (EVM <9%)
Power at RF Input
EVM Floor (typical) 2.0% (Input Power > -40 dBm, 10 times averaged)
lation Accuracy (Composite, Test Model 5)
Modu
Minimum Carrier
-60 dBm (EVM < 9%)
Power at RF Input
Composite EVM Floor
2.5% (Input Power > -40 dBm, 10 times averaged)
(typical)
Frequency Error
±10 Hz + (center frequency accuracy)
Accuracy
Modulation Accuracy (Composite, Alternate Scrambling Code)
Minimum Carrier
-60 dBm (EVM <9%)
Power at RF Input
Composite EVM Floor
2.5% (Input Power > -40 dBm, 10 times averaged)
(typical)
Frequency Error
±10 Hz + (center frequency accuracy)
Accuracy
6 www.tektronix.com
Page 7

Real-Time Spectrum Analyzer Software — RSAVu
3GPP-R6 Uplink and Downlink Analysis
Characteristic
Uplink
Phase Discontinuity
Gain Ratio over Time Power ratio % over time
Modulation Accuracy
over Time
Uplink Signaling Analy sis
HS-DPCCH Analysis ACK/NACK/PRE/POST/DTX detection, CQI decode
E-DPCCH Analysis RSN/E-TFCI/HAPPY decode
DPCCH TPC, TFCI decode
Downlink
Modulation Accuracy
over Time
Downlink Signaling Analysis
E-RGCH (E - Relative
Grant Channel)
Analysis
E-HICH (E-Hybrid
ARQ Indicator
Channel) Analysis
E-AGCH Analysis AGV/AGS decode
ommended PC Configuration
Rec
Characteristic
Processor
Platform Microsoft Windows XP
Space Required 100 MB free hard-disk space
Port
Description
Result of Phase Discontinuity in accordance with 3GPP
standard TS25.101(V6.9.0) 6.8.4
EVM, Mag error, Phase error, PCDE, Frequency error,
Origin offset, Phase discontinuity over time
EVM, Mag error, Phase error, PCDE, Frequency error,
Origin offset over time
UP/HOLD/DOWN detection
ACK/NACK decode
Description
Pentium-compatible: >2.4 GHz, and >500 MB RAM
Available USB port used for hardware license key
Ordering Information
RSAVu
Offline analy
oscilloscop
(www.tektro
Options may be ordered which provide digital modulation analysis, for a variety of
modulation types and standards. Options are delivered in the form of a USB key that
is used with your PC when RSAVu is operating.
Option
Option
Offlin
Opt. 10 Audio Distortion Analysis Software
Opt. 21 Advanced Measurement Suite Software
Opt. 24 G SM/EDGE
Opt. 25 CDMA2000/1X
Opt. 26 1x EVDO
Opt. 29 IEEE 802.11a/b/g/n
Opt. 30 3GPP Release 99 and Release 5 UL/DL Analysis
Opt. 40 HSUPA 3GPP Release 6*
*2Requires Option 30.
sis software for RSA Series spectrum analyzers and DSA/DSO70000
es. Basic RSAVu is free of charge on the Tektronix web site
nix.com) and is capable of performing :
Amplitude, frequency, and phase vs. time analysis.
Analog modulation analysis for AM, FM and PM signals
I and Q versus time measure ments
Pulsed signal analysis
s
Description
e Modulation Analysis
2
www.tektronix.com 7
Page 8

Data Sheet
RSAVuUP
Upgrades for offline analysis software. Upgrades are installed using a USB key that
ships with the purchased option. If you already own an RSAVu USB key, the new key
will reprogram your key to activate all purchased options.
Upgrade Options
Option
Reprograms USB HW Key to add option:
Opt. 10 Option 10 – Audio Distortion Analysis Software
Opt. 21 Option 21 – Advanced Measurement Suite Software
Opt. 24 Option 24 – GSM/EDGE
Opt. 25 Option 25 – CDMA2000/1X
Opt. 26 Option 26 – 1x EVDO
Opt. 29 Option 29 – IEEE 802.11a/b/g/n
Opt. 30 Option 30 – 3GPP Release 99 and Release 5 UL/DL
Opt. 40 Option 40 – HSUPA 3GPP Release 6*
*2Requires Option 30.
Description
Analysis
2
Product(s) are manufactured in ISO registered facilities.
Product(s) complies with IEEE Standard 488.1-1987, RS-232-C, and with Tektronix
Standard Codes and Formats.
Contact Tektronix:
ASEAN / Australa
Balkans, Israel, South Af rica and other ISE Countries +41 52 675 3777
Central East Eu
Mexico, Central/South America & Caribbean 52 (55) 54247900
rope, Ukraine, and the Baltics +41 52 675 3777
Central Europe & Greece +41 52 675 3777
Luxembourg +44 (0) 1344 392400
Middle E ast,
For other areas contact Tektronix, Inc at: 1 (503) 627-7111
Asia, and North Africa +41 52 675 3777
The N etherlands 090 02 021797
People’s Rep
United Kingdom & Ireland +44 (0) 1344 392400
ublic of China 86 (10) 6235 1230
Republic of
sia (65) 6356 3900
Austria +41 52 675 3777
Belgium 07 81 601
Brazil +55 (11) 40669400
Canada 1 (800) 661-5625
Denmark +4580881401
Finland +41526
France +33(0)169868181
Germany +49 (221) 94 77 400
Hong Kong (852
India (91) 80-42922600
Italy +39 (02) 25086 1
Japan 81 (3) 67
Poland +41 52 675 3777
Portugal 80 08 12370
Korea 82 (2) 6917-5000
Russia & CIS +7 (495) 7484900
South Africa +27 11 206 8360
Spain (+3 4)
Sweden 020 08 80371
Switzerland +41 52 675 3777
Tai wa n 886 (
USA 1 (800) 426-2200
75 3777
) 2585-6688
14-3010
Norway 800 16098
901 988 05 4
2) 2722-9622
Updated 30 October 2008
66
www.tektronix.com
For Further Information. Tektronix maintains a comprehensive, constantly expanding
collection of a pplication notes, technical briefs and other resources to help engineers working
on the cutting edge of technology. Please visit www.tektronix.com
t © Tektronix, Inc. All rights reserved. Tektronix products are covered by U.S. and foreign patents,
Copyrigh
d pending. Information in this publication supersedes that in all previously published material.
issued an
tion and p rice change privileges reserved. TEKTRONIX and TEK are registered trademarks of
Specifica
x, Inc. All other trade names referenced are the service marks, trademarks, or registered trademarks
Tek tro ni
espective companies.
of their r
28 May 2009 37W-20383-2
 Loading...