

Page 1

x
RSA6100A Series
Real-Time Spectrum Analyzers
ZZZ
Quick Start User Manual
*P071190907*
071-1909-07
Page 2

Page 3

xx
RSA6100A Series
Real-Time Spectrum Analyzers
ZZZ
Quick Start User Manual
www.tektronix.com
071-1909-07
Page 4

Copyright © Tektronix. All rights reserved. Licensed software products are owned by Tektronix or its subsidiaries or suppliers, and are
protected by na
tional copyright laws and international treaty provisions.
Tektronix pro
previously published material. Specifications and price change privileges reserved.
TEKTRONIX and TEK are registered trademarks of Tektronix, Inc.
ducts are covered by U.S. and foreign patents, issued and pending. Information in this publication supersedes that in all
Contacting Tektronix
Tektronix, Inc.
14200 SW Karl Braun Drive
P.O. Box 500
Beaverton, OR 97077
USA
For product information, sales, service, and technical support:
In North America, call 1-800-833-9200.
Worldwide, visit www.tektronix.com to find contacts in your area.
Page 5

Warranty
Tektronix warrants that this product will be free from defects in materials and workmanship for a period of one (1) year from the date of
shipment. If any such product proves defective during this warranty period, Tektronix, at its option, either will repair the defective
product without charge for parts and labor, or will provide a replacement in exchange for the defective product. Parts, modules and
replacement products used by Tektronix for warranty work may be new or reconditioned to like new performance. All replaced
parts, modules and products become the property of Tektronix.
In order to obtain service under this warranty, Customer must notify Tektronix of the defect before the expiration of the warranty period
and make suitable arrangements for the performance of service. Customer shall be responsible for packaging and shipping the
defective product to the service center designated by Tektronix, with shipping charges prepaid. Tektronix shall pay for the return of the
product to Customer if the shipment is to a location w ithin the country in which the Tektronix service center is located. Customer shall
be responsible for paying all shipping charges, duties, taxes, and any other charges for products returned to any other locations.
This warranty shall not apply to any defect, failure or damage caused by improper use or improper or inadequate m aintenance and
care. Tektronix shall not be obligated to furnish service under this warranty a) to repair damage resulting from attempts by personnel
other than Tektronix representatives to install, repair or service the product; b) to repair damage resulting from improper use or
connection to incompatible equipment; c) to repair any damage or malfunction caused by the use of non-Tektronix supplies; or
d) to service a product that has been modified or integrated with other products when the effect of such modification or integration
increases the time or difficulty of servicing the product.
THIS WARRANTY IS GIVEN BY TEKTRONIX WITH RESPECT TO THE PRODUCT IN LIEU OF ANY OTHER WARRANTIES,
EXPRESS OR IMPLIED. TEKTRONIX AND ITS VENDORS DISCLAIM ANY IMPLIED WARRANTIES OF MERCHANTABILITY OR
FITNESS FOR A PARTICULAR PURPOSE. TEKTRONIX’ RESPONSIBILITY TO REPAIR OR REPLACE DEFECTIVE PRODUCTS
IS THE SOLE AND E XCLU S IVE REMEDY PROVIDED TO THE CUSTOMER FOR BREACH OF THIS WARRANTY. TEKTRO NIX
AND ITS VENDORS WILL NOT BE LIABLE FOR ANY INDIRECT, SPECIAL, INCIDENTAL, OR CONSEQUENTIAL DAMAGES
IRRESPECTIVE OF WHETHER TEKTRONIX OR THE VENDOR HAS ADVANCE NOTICE OF THE POSSIBILITY OF SUCH
DAMAGES.
[W2 – 15AUG04]
Page 6

Page 7

Table of Contents
General Safety Summary ... . . .......... . . . . . . . . . . . . . . . . . . . ......... .. . . . . . . . . . . . . . . . . . . . ......... . . . . . . . . . . . . . . . . . . . . ......... . . . . . .. iii
Compliance I
Preface............................................................................................................................... viii
Installat
Operation.............................................................................................................................. 13
Index
nformation ............................................................................................................... v
EMCCompliance................................................................................................................. v
Safety Compliance ............................................................................................................... vi
Environmen
KeyFeatures ................................................................................................................... viii
Documenta
Software U pgrades........... . . . . . . . . . . . . . . . . . . . ......... . . . . . . . . . . . . . . . . . . ......... . . . . . . . . . . . . . . . . . . . . ....... .. . . . . . . . . . . . . . . . . ix
Conventions Used in This Manual................... . . . . . . . . . . . . . . . . . . . . . . . . .......... .. . . . . . . . . . . . . . . . . . . . . . . ........... . . . . . . . ix
ion.............................................................................................................................. 1
Before Installation ................................................................................................................ 1
Standard Accessories .. . . . . . . . . . . . . . . . . . . . . . .......... . . . . . . . . . . . . . . . . . . . . . ......... .. . . . . . . . . . . . . . . . . . . . . . .......... . . . . . . . . . . . . 1
Optional
Options ........................................................................................................................... 3
Operating Considerations........................................................................................................ 3
Connect
Powering On the Instrument ..................................................................................................... 5
Powering Off the Instrument..................................................................................................... 5
Removi
Adding an External Monitor...................................................................................................... 6
Inspecting the Instrument ....................................................................................................... 10
User M a
Getting Acquainted with Your Instrument ... .. . . . . . . . . . . . . . . . . . . . ......... . . . . . . . . . . . . . . . . . . . . ......... . . . . . . . . . . . . . . . . . . . ..... 13
Basic
Navigating Displays ............................................................................................................. 23
SelectingDisplays...............................................................................................................24
Conn
Starting and Stopping Acquisitions . . . . . . . . . . . . . . . . . . ......... . . . . . . . . . . . . . . . . . . . ......... . . . . . . . . . . . . . . . . . . ......... . . . . . . . . . . . 30
Markers.......................................................................................................................... 31
chscreen Actions............................................................................................................ 34
Tou
Printing .......................................................................................................................... 36
Saving Data ..................................................................................................................... 38
Rec
Advanced Techniques. . .......... . . . . . . . . . . . . . . . . . . . . . . . . ............ .. . . . . . . . . . . . . . . . . . . . . . . . . .......... .. . . . . . . . . . . . . . . . . . . . . . 40
talConsiderations.................................................................................................. vii
tion ................................................................................................................. viii
Accessories ............................................................................................................ 2
ing to the Instrument.................................................................................................... 4
ng the Power............................................................................................................. 5
intenance. . . .......... . . . . . . . . . . . . . . . . . . . . . ........... . . . . . . . . . . . . . . . . . . . . . .......... . . . . . . . . . . . . . . . . . . . . . ........... . . . 11
Concepts.................................................................................................................. 21
ecting a Signal........ . . . . . . . . . . . . . . . . . . ......... . . . . . . . . . . . . . . . . . . ......... . . . . . . . . . . . . . . . . . . ........ . . . . . . . . . . . . . . . . . . ... 29
alling Data................................................................................................................... 39
Table of Content
s
RSA6100A S eries Quick Start User Manual i
Page 8

Table of C ontent
s
ii RSA6100A Series Quick Start User Manual
Page 9

General Safety S
ummary
General Safet
Review the following safety precautions to avoid injury and prevent damage to this product or any products connected to it.
To avoid potential hazards, use this product only as specified.
Only qualified personnel should perform service procedures.
While using this product, you may need to access other parts of a larger system. Read the safety sections of the other
component manuals for warnings and cautions related to operating the system.
To Avoid Fire or Personal Injury
Use Proper Power Cord. Use only the power cord specified for this product and certified for the country of use.
Ground the Product. This product is grounded through the grounding conduc tor of the power cord. To avoid electric
shock, the
terminals of the product, ensure that the product is properly grounded.
Observe All Terminal Ratings. To avoid fire or shock hazard, observe all ratings and markings on the product. Consult
the product manual for further ratings information before making connections to the product.
The inputs are not rated for connection to mains or Category II, III, or IV circuits.
Power Disconnect. The power cord disconnects the product from the power source. Do not block the power cord; it
must rem
grounding conductor must be connected to earth ground. Before making connections to the input or output
ain accessible to the user at all tim e s.
y Summary
Do Not Op
Do Not O
qualified service personnel.
erate Without Covers.
perate With Suspected Failures.
Do not operate this product with covers or panels removed.
If you suspect that there is damage to this product, have it inspected by
Avoid Exposed Circuitry. Do not touch exposed connections and components when power is present.
Replace Batteries Properly. Replace batteries only with the specified type and rating.
Use Proper Fuse. Use only the fuse type and rating specified for this product.
Do Not Operate in Wet/Damp Conditions.
Do Not Operate in an Explosive Atmosphere.
Keep Product Surfaces Clean and Dry.
Provide Proper Ventilation.
proper ventilation.
Refer to the manual’s installation instructions for details on installing the product so it has
RSA6100A S eries Quick Start User Manual iii
Page 10

General Safety S
TermsinthisManual
These terms may appear in this manual:
WARNING. Warning statements identify conditions or practices that could result in injury or loss of life.
CAUTION. Caution statements identify conditions or practices that could result in damage to this product or other property.
Symbols and Terms on the Product
These terms may appear on the product:
DANGER indicates an injury hazard immediately accessible as you read the marking.
WARNING indicates an injury hazard not immediately accessible as you read the marking.
CAUTION indicates a hazard to property including the product.
The following symbol(s) may appear on the product:
ummary
iv RSA6100A Series Quick Start User Manual
Page 11

Compliance Info
rmation
Compliance In
This section lists the EMC (electromagnetic compliance), safety, and environmental standards with which the instrument
complies.
EMC Compliance
EC Declaration of Conformity – EMC
Meets intent of Directive 2004/108/EC for E lectromagnetic Compatibility. Compliance was demonstrated to the following
specifications as listed in the Official Journal of the European Communities:
EN 61326-1:2006, EN 61326-2-1:2006. EMC requirements for electrical equipment for measurement, control, and
laboratory use.
CISPR 11:2003. Radiated and conducted emissions, Group 1, Class A
IEC 61000-4-2:20
IEC 61000-4-3:2002. RF electromagnetic field immunity
IEC 61000-4-4:2004. Electrical fast transient/burst immunity
IEC 61000-4-5:2001. Power line surge immunity
IEC 61000-4-6:2003. Conducted RF immunity
IEC 61000-4-11:2004. Voltage dips and interruptions immunity
1234
formation
01. Electrostatic discharge immunity
5
6
7
EN 61000-3-2:2006. AC power line harmonic emissions
EN 61000-3-3:1995. Voltage changes, fluctuations, and flicker
European Contact.
Tektronix UK, Ltd.
Western Peninsula
Western Road
Bracknell, RG12 1RF
United Kingdom
1
This product is intended for use in nonresidential areas only. Use in residential areas may cause electromagnetic interference.
2
Emissions which exceed the levels required by this standar
3
To ensure compliance with the EMC standards listed here, high quality shielded interface cables should be used.
4
At the IEC 61000-4-11 Voltage-Interruption Transient Immunity test at 0% for 250 cycles, the EUT reboots and can take greater
than 10 seconds to recover.
5
Performance degradation information for the IEC 61000-4-3 test: Residual spurious signals can typically increase to -55 dBm with
exposure to the disturbance levels of this test.
6
Performance degradation inf
either 55 dB below reference level or -75 dBm, with exposure to the disturbance levels of this test.
7
Performance Criterion C applied at the 70%/25 cycle Voltage-Dip and the 0%/250 cycle Voltage-Interruption test levels
(IEC 61000-4-11).
ormation for the IEC 61000-4-6 test: Residual spurious signals can typically increase to the worse of
d may occur when this equipment is connected to a test object.
RSA6100A S eries Quick Start User Manual v
Page 12

Compliance Info
rmation
Australia / New Zealand Dec laration of Conformity – EMC
Complies with the EMC provision of the Radiocommunications Act per the following standard, in accordance with ACMA:
CISPR 11:2003. Radiated and Conducted Emissions, Group 1, Class A, in accordance with EN 61326-1:2006 and
EN 61326-2-1:2006.
Safety Compliance
EC Declaration of Conformity – Low Voltage
Compliance w as demonstrated to the following specification as listed in the Official Journal of the European Communities:
Low Voltage Directive 2006/95/EC.
EN 61010-1: 2001. Safety requirements for electrical equipment for measurement control and laboratory use.
U.S. Nationally Recognized Testing Laboratory Listing
UL 61010-1:2004, 2ndEdition. Standard for electrical measuring and test equipment.
Canadian Certification
CAN/CSA-C22.2 No. 61010-1:2004. Safety requirements for electrical equipment for measurement, control, and
laboratory use. Part 1.
Additional Compliances
IEC 61010-1: 2001. Safety requirements for electrical equipm
ent for measurement, control, and laboratory use.
Equipment Type
Test and measuring equipment.
Safety Class
Class 1 – grounded product.
Pollution Degree Description
A measure of the contaminants that could occur in the environment around and within a product. Typically the internal
environment inside a product is considered to be the same as the external. Products should be used only in the environment
for which they are rated.
Pollution Degree 1. No pollution or only dry, nonconductive pollution occurs. Products in this category are generally
encapsulated, hermetically sealed, or located in clean rooms.
Pollution Degree 2. Normally only dry, nonconductive pollution occurs. Occasionally a temporary conductivity that is
caused by condensation m ust be expected. This location is a typical office/home environment. Temporary condensation
occurs only when the product is out of service.
vi RSA6100A Series Q uick Start User Manual
Page 13

Compliance Info
Pollution Degree 3. Conductive pollution, or dry, nonconductive pollution that becomes conductive due to condensation.
These are shelt
sunshine, rain, or direct wind.
Pollution Degree 4. Pollution that generates persistent conductivity through conductive dust, rain, or snow. Typical
outdoor locations.
ered locations where neither temperature nor humidity is controlled. The area is protected from direct
rmation
Pollution De
Pollution Degree 2 (as defined in IEC 61010-1). Note: Rated for indoor use only.
gree
Environmental Considerations
This secti
Product End-of-Life Handling
Observe the following guidelines when recycling an instrument or component:
Equipment Recycling. Production of this equipment required the extraction and use of natural resources. The
equipme
product’s end of life. In order to avoid release of such substances into the environment and to reduce the use of natural
resources, we encourage you to recycle this product in an appropriate system that will ensure that most of the materials are
reused o
on provides information about the environmental impact of the product.
nt may contain substances that could be harmful to the environment or human health if improperly handled at the
r recycled appropriately.
This symbol indicates that this product c omplies w ith the applicable European Union requirements according
ctives 2002/96/EC and 2006/66/EC on waste electrical and electronic equipment (WEEE) and
to Dire
batteries. For information about recycling options, check the Support/Service section of the Tektronix Web
site (www.tektronix.com).
Mercury Notification. This product uses an LCD backlight lamp that contains mercury. Disposal may be regulated due
to environmental considerations. Please contact your local authorities or, within the United States, refer to the E-cycling
Central Web page (www.eiae.org) for disposal or recycling information.
Restriction of Hazardous Substances
This product has been classified as Monitoring and Control equipment, and is outside the scope of the 2002/95/EC RoHS
Directive.
RSA6100A S eries Quick Start User Manual vii
Page 14

Preface
Preface
This manual describes the installation and basic operation of the RSA6100A Series of real-time spectrum analyzers. For
more detailed information, see the online help for your instrument.
Key Features
The RSA6100A Series is a family of high-performance real-time spectrum analyzers. Key features include:
Digital Phosphor Spectrum analysis, which greatly reduces the amount of time to recognize and identify a fault
DPX Density triggering to easily capture instabilities, transients and hidden signals that are impossible for other signal
analyzers to catch
Conventional spectrum analysis controls
other measurements
Easy event-based capture of transient RF signals by triggering on changes in the frequency domain using
Tektronix-exclusive Frequency Mask Triggering
Time domain triggering capability: Runt Triggers, Holdoff Trigger, and Time Qualification to all of the instrument triggers
(Option 200)
Multi-domain displays that provide an intuitive understanding of ti me-varying RF signals
Conventional Vector Signal Analysis capability available (Option 21) w ith modulation analysis for >20 popular modulation
formats
Seamless capture of signals in up to 110 MHz spans
Documentation
The following documentation is available with your Tektronix RSA6100A Series Spectrum Analyzer. For the most current
documentation, refer to the Tektronix Web site.
To read about Use these documents
Installation and operation
(overviews)
In-depth operation and
user interface help
Application examples
Programming commands
Specifications and
performance verification
and functions including fast tuning, markers, phase noise, spurious and
RSA6100A Series R eal-Time Spectrum Analyzers Quick Start User Manual.
The quick start user manual contains general information about how to put your instrument
into service and guides to user interface controls.
RSA6100A Series Real-Time Spectrum Analyzers Online help.
The online help c ontains detailed information about how to operate the instrument.
RSA6100A Series R eal-Time Spectrum Analyzers Application Examples Manual.
This manual provides practical examples o f using the analyzer to accomplish tasks.
RSA6100A Series R eal-Time Spectrum Analyzers Programmer Manual.
The programming commands for the RSA6100A Series are located in a PDF file located
on the Documents CD.
RSA6100A Series R eal-Time Spectrum Analyzers Specifications and
Performance Verification Manual.
This manual contains the instrument specifications and a procedure to check instrument
performance against warranted characteristics. This manual is in a P DF file located
on the Documents CD.
viii RSA6100A Series Quick Start User Manual
Page 15

To read about Use these documents
User service
RSA6100A Series R eal-Time Spectrum Analyzers Service Manual.
An optional ma
information, and information for servicing the instrument to the module level. T his m anual
isinaPDFfile located on the Documents CD.
Software Upgrades
Software upgrades are available. Software upgrades become operational only after you enter a valid option key for the
specific spectrum analyzer model and serial number.
To check for upgrades:
1. Use your Web browser to go to www.tektronix.com/software.
2. Enter the product name (RSA6100A) to find available software upgrades.
Conventions Used in This Manual
The following icons are used throughout this manual:
Preface
nual that provides a list of replaceable parts, care and maintenance
Sequence
Step
Front panel
power
Connect
power
Network
PS2 SVGA USB
RSA6100A S eries Quick Start User Manual ix
Page 16

Preface
x RSA6100A Series Quick Start User Manual
Page 17

Installation
Before Installation
Unpack the instrument, and check that you received all items listed as Standard Accessories. Optional accessories and
instrument options are also listed in this section. Check the Tektronix Web site (www.tektronix.com) for the most current
information.
Standard Accessories
Your instrument comes with the following accessories: quick start user manual (languages are listed below), programmer
manual (on CD), specifications and performance verification manual (on CD), declassification and security instructions
(on CD), se
103-0045-XX), Jack-to-Jack SMA adapter (RSA6120A only, Tektronix part number 131-8508-XX) 50 Ω SMA terminator
(RSA6120A only, Tektronix part number 015-1022-XX), U SB keyboard, USB mouse, and instrument pouch.
rvice manual (on CD), power cord, BNC-N adapter (RSA6106A and RSA6114A only, Tektronix part number
Installation
Document
RSA6100A Series Real-Time Spectrum Analyzers Quick Start User Manual is available in the following languages:
RSA6100A Series R eal-Time Spectrum Analyzers Documents CD, Tektronix part number 063-3930-XX.
The Documents CD contains PDF versions of the following manuals:
s
English, Tektronix part number 071-1909-XX.
Simplified Chinese, Tektronix part number 071-1910-XX.
Japanese, Tektronix part number 071-1911-XX.
Russian, Tektronix part number 071-1912-XX.
RSA6100A Series Real-Time Spectrum Analyzers Quick Start User Manual,
in English, Japanese, Russian and Simplified Chinese.
RSA6100A S eries Real-Time Spectrum Analyzers Application Examples Manual,
Tektronix part number 071-2590-X X.
RSA6100A Series Real-Time Spectrum Analyzers Printable Online Help,
Tektronix part number 077-0169-X X.
RSA6100A Series Real-Time Spectrum Analyzers Programmer Manual,
Tektronix part number 077-0249-X X.
RSA6100A S eries Real-Time Spectrum Analyzers Service Manual,
Tektronix part number 077-0250-X X.
RSA6100A Series Real-Time Spectrum Analyzers Specifications and Performance Verification Manual,
Tektronix part number 077-0251-X X.
RSA6100A S eries Real-Time Spectrum Analyzers Declassification and Security Instructions,
Tektronix part number 077-0170-X X.
RSA6100A S eries Quick Start User Manual 1
Page 18

Installation
Power Cords
The RSA6100A Series Real-Time Spectrum Analyzers are shipped with one of the following power cord options. Power
cords for use in North America a re UL listed and CSA certified. Cords for use in areas other than North America are approved
by at least one authority acceptable in the country to which the product is shipped.
International Power Plugs
Opt. A0 - North America power
Opt. A1 - Universal EURO power
Opt. A2 - United Kingdom power
Opt. A3 - A ustralia power
Opt. A4 - 240 V, North America power
Opt. A5 - Switzerland power
Opt. A6 - Japan power
Opt. A10 - China power
Opt. A11 - India power
Opt. A99 - No power cord
Optional Accessories
RSA61RHD - Provides an additional removable hard disk drive for use with Option 06
065-0765-XX - Additional removable solid-state hard drive for use with Option 08
(Microsoft Windows XP Embedded and instrument SW pre-installed)
2 RS A6100A Series Quick Start User Manual
Page 19

Options
You can add the following options to your spectrum analyzer:
Installation
Option 01 - Adds 10 MHz to 3 GHz Pre-Amplifier
Option 02 - Adds frequency mask triggering and RAM expansion
Option 05 - Adds digital IQ output and 500 MHz analog IF output
Option 06 - Adds a removable hard disk drive (not compatible with Option 07 or O ption 08)
Option 07 - Adds a DVD±RW drive, no-cost option (not compatible with Option 06 or Option 08)
Option 08 - Adds a removable solid-state hard drive (not compatible with Option 06 or Option 07)
Option 11 - Adds Phase Noise and Jitter Measurement
Option 20 - Adds advanced signal analysis (including pulse measurements)
Option 21 - Adds general-purpose digital modulation analysis
Option 110 - Adds 110 MHz real-time capture bandwidth
Option 200 - Advanced DPX and Triggers
Option 1R - Adds Rackmount Kit
Operating Considerations
Power supply requirements
Source voltage and frequency Power consumption
100 – 240 V
115 V
RMS
Environmental requirements
Characteristic Description
Operating temperature +5 °C to +50 °C (+5 °C to +40 °C; when accessing the DVD drive or optional
Non-operating temperature
Humidity
Altitude:
Operating
Non-operating
Cooling clearance
Bottom
Sides and back
RMS
, 400 Hz
, 50/60 Hz
450 W maximum (all models)
removable hard-disk drive)
-20°Cto+60°C
90% at 30 °C (non-condensing)
80% maximum when accessing the DVD drive
Maximum wet-bulb temperature 29 °C
Up to 3000 m (9843 ft)
12190 m (40,000 ft)
20 mm (0.79 in)
50 mm (1.97 in)
RSA6100A S eries Quick Start User Manual 3
Page 20

Installation
CAUTION. To ensure proper cooling, do not operate the instrument on its side. Operate the instrument only when it is resting
on its feet
WARNING. To avoid personal injury, take extra care when lifting or moving the spectrum analyzer. The instrument is
somewhat heavy and requires extra care when moving it.
, located on the bottom of the case. M aintain at least 2 inches (5 cm.) clearance around ventilation openings.
Connecting to the Instrument
Connecting to a Network
Connect your keyboard, mouse, printer, and other accessories to your instrument before applying power. (Accessories with
USB connectors can be c
You can connect your in
network for printing, file sharing, Internet
access, and other functions. Consult your
network administrat
Windows utilities to configure the instrument
for your network.
Quick Tip
If you connect your
regular approved operating system updates, and using up-to-date antivirus software.
onnected before or after applying power.)
strument to a
or and use the standard
instrument to a network, you should protect your instrument by using an internet firewall, installing
4 RS A6100A Series Quick Start User Manual
Page 21

Powering On the Instrument
Installation
Powering O
ff the Instrument
Removing the Power
RSA6100A S eries Quick Start User Manual 5
Page 22

Installation
Adding an External Monitor
Use the following procedure to add an external monitor for dual monitor configuration. Both the spectrum analyzer and
the second monitor must have the color set to True Color.
1. Power off the spectrum analyzer and the
external monitor.
2. Connect the external monitor to the
spectrum analyzer.
3. Power on the spectrum analyzer and the
external monitor.
6 RS A6100A Series Quick Start User Manual
Page 23

4. Open the Windows C ontrol Panel.
5. Double-click Intel(R) Extreme Graphics
2Mto open the properties page.
6. Click Intel(R ) Dual Display Clone to
show internal screen (Notebook) content
on an exte
rnal monitor (Monitor).
Installation
RSA6100A S eries Quick Start User Manual 7
Page 24

Installation
7. Adjust the sett
then click OK to apply the settings and to
close the properties page.
ings as necessary and
8 RS A6100A Series Quick Start User Manual
Page 25

Installation
Adjusting the Windows Display Settings
To change the instrument display settings, use the Intel Graphics Driver instead of the default Windows display properties.
The Intel Graphics Driver provides additional capabilities that are not accessible from the Windows display properties
dialog box.
1. Open the Windows C ontrol Panel.
2. Double-click Intel(R) Extreme Graphics
2Mto open the properties page.
3. Adjust the settings as necessary.
NOTE. Not all of the selections in the
property page will be available if there is no
external monitor connected to the instrument.
4. Click OK to apply the settings and to
close the properties page.
. Although it is not recommended, you can attach a second monitor after the spectrum analyzer is powered on;
NOTE
however, after connecting, you will still need to enable the Extended Desktop from the Intel Extreme Graphics 2M control
panel.
RSA6100A S eries Quick Start User Manual 9
Page 26

Installation
Inspecting the Instrument
Launch the diagnostics application (Tools > Diagnostics). If failures occur, perform the following steps to get more information
about them. You can also use the following steps as a detailed incoming inspection to verify the functionality of your
instrument. If you want to check the accuracy specifications of your instrument, see the RSA6100A Series Real-Time
Spectrum Analyzers Specifications and Performance Verification Technical Reference manual PDF (Tektronix part number
077-0251-XX) located on the Documents CD.
1. Select Tools > Diagnostics.
2. On the Diag
Modules, All Tests.
3. Click Single Test.
4. Click RUN.
The instrument will run through
the tests
mark or X icon will appear to the
right of each check box as that
test is c
means the test was passed. The
X means the test was failed.
5. For tests that require manual
interv
instructions to com p lete the tests.
NOTE. Select the Diagnostics Failure Information tab to see basic diagnostic failure information. Use the Windows Event
Viewer (a subset of the Administrative tools in the Windows Control Panel) to view failure history and nondiagnostic failures
reported by the application.
nostics tab, click All
one at a time. A check
ompleted. The check icon
ention, follow the on-screen
10 RSA6100A Series Quick Start User Manual
Page 27
User Maintenance
Cleaning Your Instrument
Clean the exterior surfaces of the chassis with a dry lint-free cloth or a soft-bris tle brush. If any dirt remains, use a cloth or
swab dipped in a 75% isopropyl alcohol solution. Use a swab to clean narrow spaces around controls and connectors. Do
not use abrasi
CAUTION. Avoid getting moisture inside the instrument during exterior cleaning; use just enough moisture to dampen the
cloth or swab. Do not wash the front-panel On/Standby switch. Cover the switch while washing the instrument. Use only
deionized o
or distilled water. Do not use chemical cleaning agents; they might damage the chassis. Avoid chemicals that contain
benzene, toluene, xylene, acetone, or similar solvents.
ve compounds on any part of the instrument because they might damage the instrument.
r distilled water when cleaning. Use a 75% isopropyl alcohol solution as a cleanser and rinse with deionized
Installation
CAUTION. T
abrasive cleaners or commercial glass cleaners to clean the display surface. Avoid spraying liquids directly on the display
surface. Avoid scrubbing the display with excessive force.
Clean the
with distilled water or a 75% isopropyl alcohol solution and gently rub the display surface. Avoid using e xcess force; this
might damage the display surface.
Upgradi
Software upgrades are available from Tektronix. They can either be downloaded from the Tektronix Web site or they can be
ordered from your local Tektronix representative. To add additional software options or features, you will need an option key
from Tektronix. When you receive the software from Tektronix, install it on your instrument. When prompted, enter the option
key, and then follow the online instructions to complete the upgrade.
o prevent damage to the flat panel display, do not use improper cleaning agents or methods. Avoid using
display surface by gently rubbing the display with a clean-room wipe. If the display is very dirty, moisten the wipe
ng the Instrument Software
Returning Your Instrument
u return your instrument to Tektronix:
If yo
up any user software on the hard disk. You may need to reinstall the software after your instrument is returned.
Back
repacking the instrument for shipment, use the original packaging. If the packaging is unavailable or unfit for use,
When
contact your local Tektronix representative to obtain new packaging.
Seal the shipping carton with an industrial stapler or strapping tape.
RSA6100A S eries Quick Start User Manual 11
Page 28

Installation
12 RSA6100A Series Quick Start User Manual
Page 29

Operation
Getting Acquainted with Your Instrument
Controls and display elements are shown in the following illustrations and tables.
Front Panel Controls
Most front panel controls are shortcuts for opening control panels.
Operation
Ref number Item Description Menu equivalent
1 Medi
2Disp
3
4 Trigger
5
6 Analysis
7
8
9 Amplitude
a
lays
Settings Opens the Settings control panel for the selected display. Setup > Settings
Acquire
Freq
Span (Spectrum) Adjusts the span or frequency range shown in the Spectrum
RW drive, removable hard disk d rive, or removable
DVD±
solid-state hard drive.
Opens the Displays dialog box to select measurement
displays.
Opens the Trigger control panel. Setup > Trigger
Opens the Acquire control panel. Setup > Acquire
Opens the Analysis control panel. Setup > Analysis
Adjusts the measurement frequency. Setup > Analysis >
1
display.
Adjusts the reference level. Setup >
Setup > Displays
requency tab
F
Setup > Settings >
Freq & Span
Amplitude
2
12
2
RSA6100A S eries Quick Start User Manual 13
Page 30

Operation
Ref number Item Description Menu equivalen
10
1
Applicable only when the selected display is Spectrum, DPX Spectrum, or Spectrogram.
2
Press and hold
BW (Spectrum) Adjust the res
for one second to open the associated control panel.
olution bandwidth (RBW).
1
Setup > Settin
BW tab
gs >
12
Ref number Item Description Menu equivalent
11 Tab Mo ves th
e cursor to the next entry in the dialog box or
control panel. Same as pressing the Tab key on an external
keyboard.
12
Run (Stop)
13 Markers, Peak
Push to start and stop acquisitions. Run > Run
Moves the active marker to the maximum peak of the trace
selected display. If markers are turned off, the MR
in the
(marker reference) marker will appear at the maximum peak.
14
15
16 Esc Exit
17
Markers, Select Selects the next marker.
Markers, Define Opens the Markers control panel.
s dialog boxes without saving changes.
Con
trol knob
nges values in numeric and list controls. Pressing the
Cha
knob (clicking it) is the same as pressing the Enter key on
a keyboard.
18 Arrow keys Move the Markers. The Up arrow moves the selected
marker 10 trace points to the right. The down arrow moves
e selected marker 10 trace points to the left. The left and
th
right arrows move the selected marker to the next peak.
(Turning the knob moves the marker one trace point left or
ght.)
ri
t
14 RSA6100A Series Quick Start User Manual
Page 31

Operation
Ref number Item Description Menu equivalent
19 Keypad Enters values in controls.
20 Enter
Completes the data entry in controls. Same as pressing the
Enter key on the keyboard.
Ref number Item Description Menu equivalent
21 Recall
22
23
24 Help Displays the online help. Help >
25 Print
26 Preset
Save Saves working file using the same user selections as for the
Touch Screen
On/Off
Opens the Recall dialog box.
previous Save action.
Turns the touch screen on and off.
Opens the Print dialog box. Printouts are a screen capture
of the RSA6100A application w indow.
Returns the instrument to its default or preset values. After
a Preset action, the Spectrum Analyzer display is the only
open window.
File > Recall...
File > Save
User Manual
File > Print
Setup > Preset
RSA6100A S eries Quick Start User Manual 15
Page 32

Operation
Front Panel Connectors
Ref numbe
1
2 Trig In External Trigger input connector, –2.5 V to +2.5 V range,
3
4
5
r
Item Descript
Trig Out Trigger
USB 1.1 USB 1.1
USB 2.0 USB 2.0
RF Input
trigger
RF inp
ion
output connector. 50 Ω, BNC, High > 2.0 V, Low < 0.4 V, (output current 1 mA)
level is user adjustable
mouse connector
connector
ut connector 50 Ω
16 RSA6100A Series Quick Start User Manual
Page 33

Rear Panel
Operation
Ref number Connector, Description
1
2
3
4, 5
6
7
8 Headphone, audio output connector
9 External Trigger 2 Input
10
11
12
13
14
15
16 LAN, Ethernet network connector
AC Input, main power connector
GPIB
IF output (Option 05)
Real Time IQ Out (Option 05)
Ref In, reference frequency input
Ref Out, r eference frequency output
COM 2, serial port for connecting peripherals
VGA, external monitor output (resolution not limited to VGA)
PS2 Keyboard input
USB2 ports for mouse and other USB2 devices
TekLink, reserved for future use
+28 VDC Output, (switched)
RSA6100A S eries Quick Start User Manual 17
Page 34
Operation
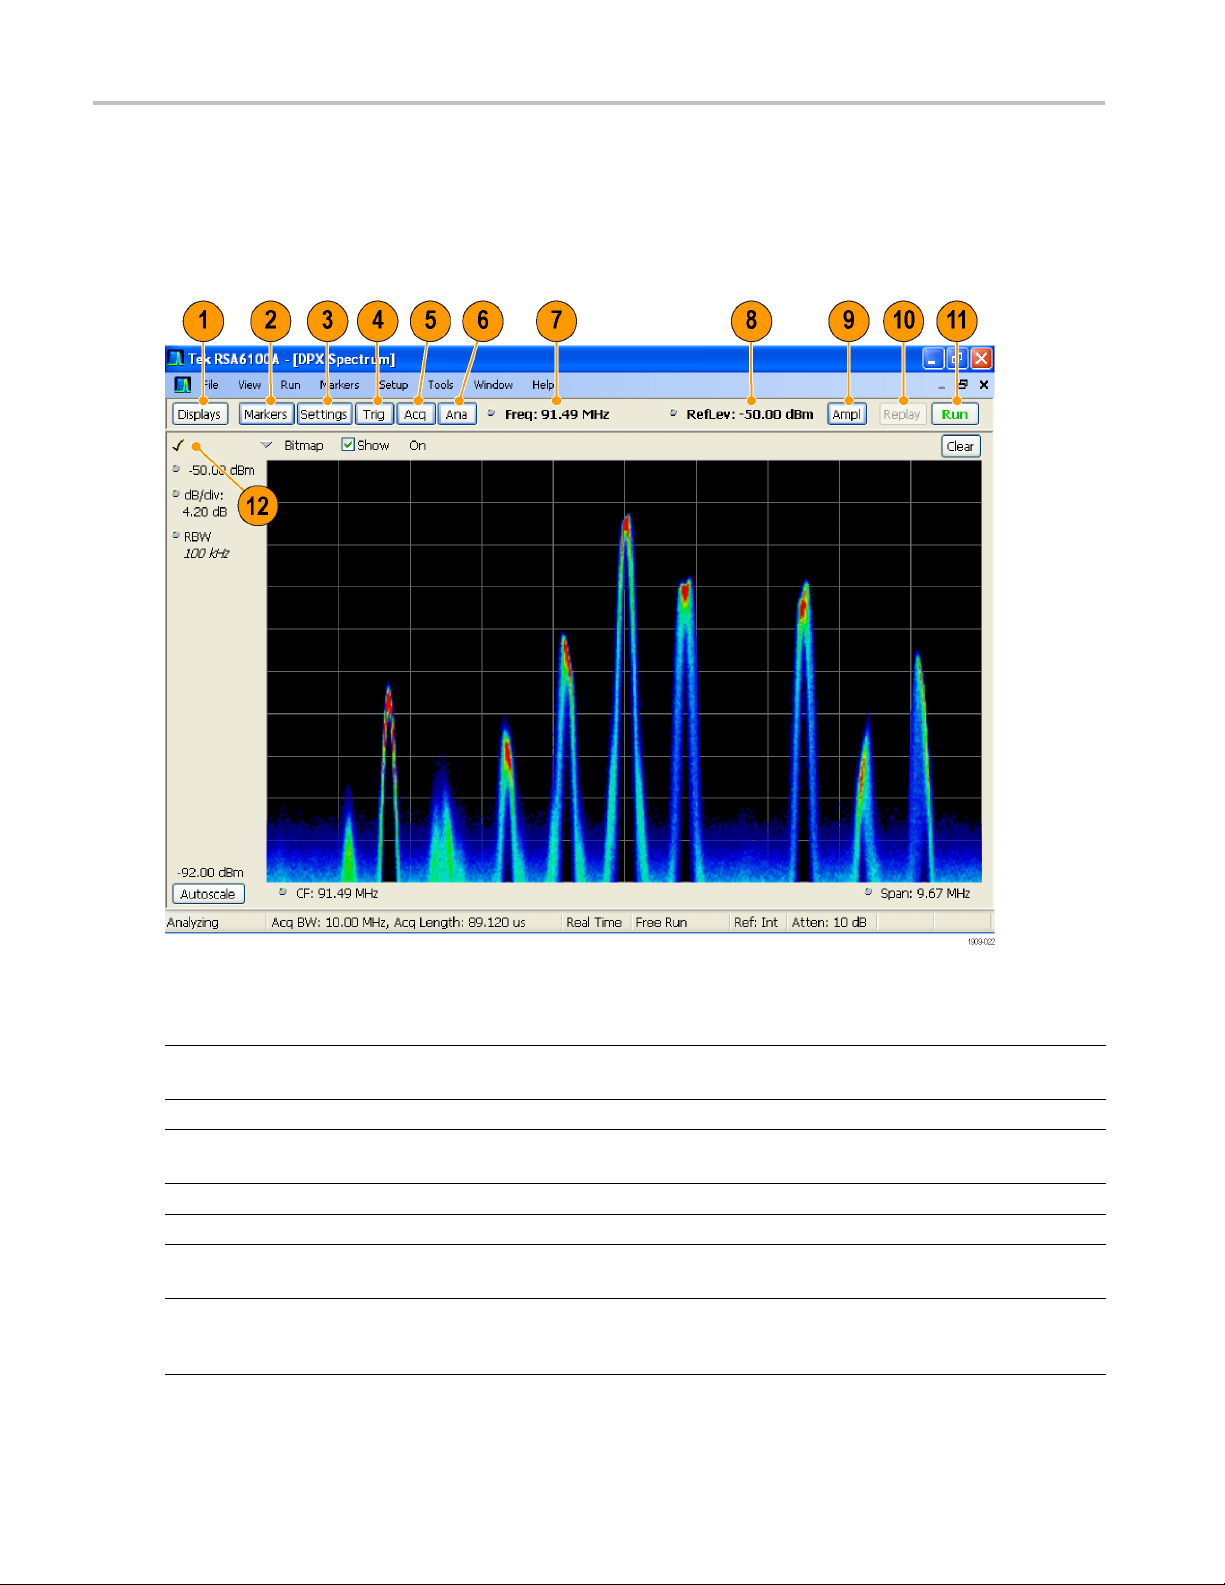
Interface and Display Elements
Commonly-used buttons and controls are located in the tool bar. Most of the buttons open control panels for changing the
instrument setups. The contents of the control panels vary depending on the selected display. You can also access the
control panels from the front panel buttons or from the keyboard.
Ref number Item Description
1 Displays
2Markers
3
4 Trigger
5
6 Analysis
7
18 RSA6100A Series Quick Start User Manual
Settings Opens the Settings control panel for the selected display. Each display has
Acquire
Center Frequency Displays the Center Frequency. To change the value, click the text and use the
Opens the Select Displays dialog box so that you can select measurement
displays.
Opens or closes the Marker toolbar at the bottom of the window.
its own control panel.
Opens the Trigger control panel so that you can define the trigger settings.
Opens the Acquire control panel so that you can define the acquisition settings.
Opens the Analysis control panel so that you can define the analysis settings
such as frequency, analysis time, and units.
front panel knob to dial in a frequency. You can also enter a frequency with the
front panel keypad or use the front panel up and down buttons.
Page 35

Operation
Ref number Item Description
8
9 Amplitude
10 Replay Runs a new measurement cycle on the existing acquisition data record using
11 R un
12
Reference Lev
Check Mark i ndicator
el
Displays the r
number from the keypad or use the front panel up and down buttons.
Opens the Amplitude control panel so that you can define the Reference Level,
configure internal attenuation, and enable/disable the (optional) Preamplifier.
any new settings.
Starts and stops data acquisitions. When the instrument is acquiring data, the
button labe
You can specify the run c onditions in the Run menu. For example, if you
select Single Sequence in the Run menu, when you click the Run button,
the instru
Continuous, the instrument will run continuously until you stop the acquisitions.
The check mark indicator (
indicates the display for which the acquisition hardware is optimized.
eference level. To change the value, click the text and enter a
l has green lettering. When stopped, the label has black lettering.
ment will run a single measurement cycle and stop. If you select
) in the upper, left-hand corner of the display
RSA6100A S eries Quick Start User Manual 19
Page 36

Operation
Display-Specific Controls
Most displays have commonly-used controls arranged around the graph. They provide quick access to common settings;
the full control set for the display is in the Settings control panel. The following illustration and table show some of the
common icons that appear in most displays.
1: Common icons
Table
Ref number Control icon Description
1
2
3 6.337μs
20 RSA6100A Series Quick Start User Manual
Drop-down List. Click to select a value from the drop-down list.
Knob. Click anywhere on the icon or on the text readout to select the control. You
can then change the value with the front panel control knob or arrow keys, or enter a
ue from the keypad.
val
licized numbers. These indicate automatically selected control values. Several
Ita
controls in the instrument (for example, RBW and Analysis Length) allow you to
select an Auto mode. In Auto mode, the instrument software automatically sets the
lue. You c an change the control to Manual mode by changing the value. To return
va
to Auto mode, clear the value, and then press the Enter key.
Page 37

Basic Concepts
Real Time Spectrum Analy zers
Tektronix Real-Time spectrum analyzers, such as the RSA6100A Series Spectrum Analyzers, have an optional, exclusive
frequency ma
anomaly occurs. This allows the real time spectrum analyzer to check 100% of the input signal before acquiring, and
then capture precisely the intermittent RF event of interest.
DPX™ technology allows you to view the RF signal as a live display. You can view very short transient signals, multilevel
signals, an
DPX display.
The RSA6100A Series Spectrum Analyzers allow you to view the captured signals in a w ide variety of time-correlated
displays. This is useful for device troubleshooting and signal characterization applications. All of the measurements are
based on th
Measurement Displays
The RSA6100A window can show one or any combination of general purpose and application-specific displays.
This example shows a single DPX Spectrum
display within the window.
sk trigger. The frequency mask trigger allows you to set up a spectral mask to capture a signal when a spectral
d time-varying events. Option 200 includes the ability to measure and trigger on signal density values in the
e same underlying set of time domain sample data.
Operation
RSA6100A S eries Quick Start User Manual 21
Page 38

Operation
This example sh
displays, a Spectrum display and a DPX
spectrum display.
When you have m
open, the display with the check mark icon
has control over the acquisition hardware.
Togiveadisp
click its title bar.
This example shows four displays in the
window.
ows the window with two
ore than one display
lay priority over any others,
quisition data source can be a live acquisition or a saved acquisition data file. The sharing of acquisition data between
The ac
displays allows you to view the same data in multiple ways. For example, you can display a power versus frequency
(spectrum) display and a spectrogram diagram at the same time. Because the data source is shared among the different
lays, the displays are correlated. That is, a point or set of points within one display is associated with a point or set of
disp
points in every other display in the application window.
22 RSA6100A Series Quick Start User Manual
Page 39

Navigating Displays
The RSA6100A uses multiple displays to keep operations simple, and yet provide advanced functionality w hen needed.
Some of the display categories include:
General Signal Viewing displays. These displays show graphs for basic signal parameters such as amplitude, phase,
and frequency plotted against frequency or time. Examples of these displays include: Spectrum, DPX, Spectrogram,
Time Overview, and Phase vs Time.
Analog Modulation. These displays show graphs and measurements for Analog Modulation, Frequency Modulation,
and Phase Modulation.
General Purpose Digital Modulation displays. Available with Option 21, General Purpose Modulation Analysis.
These displays show the results of demodulating s ignals and analyzing them in multiple domains. Examples of these
displays include: Constellation, EVM vs Time, Eye, Symbol Table, and Trellis diagrams.
RF Measurements displays. These displays show the results of automated measurements on RF signals. Examples
of these displays include: ACPR, MCPR, and CCDF.
Pulsed RF displays. Available with Option 20, Advanced Signal Analysis. These displays show the results of advanced
analysis for pulsed RF signals. Examples of these displays include: Pulse Statistics, Pulse Table, and Pulse Trace.
Operation
RSA6100A S eries Quick Start User Manual 23
Page 40
Operation
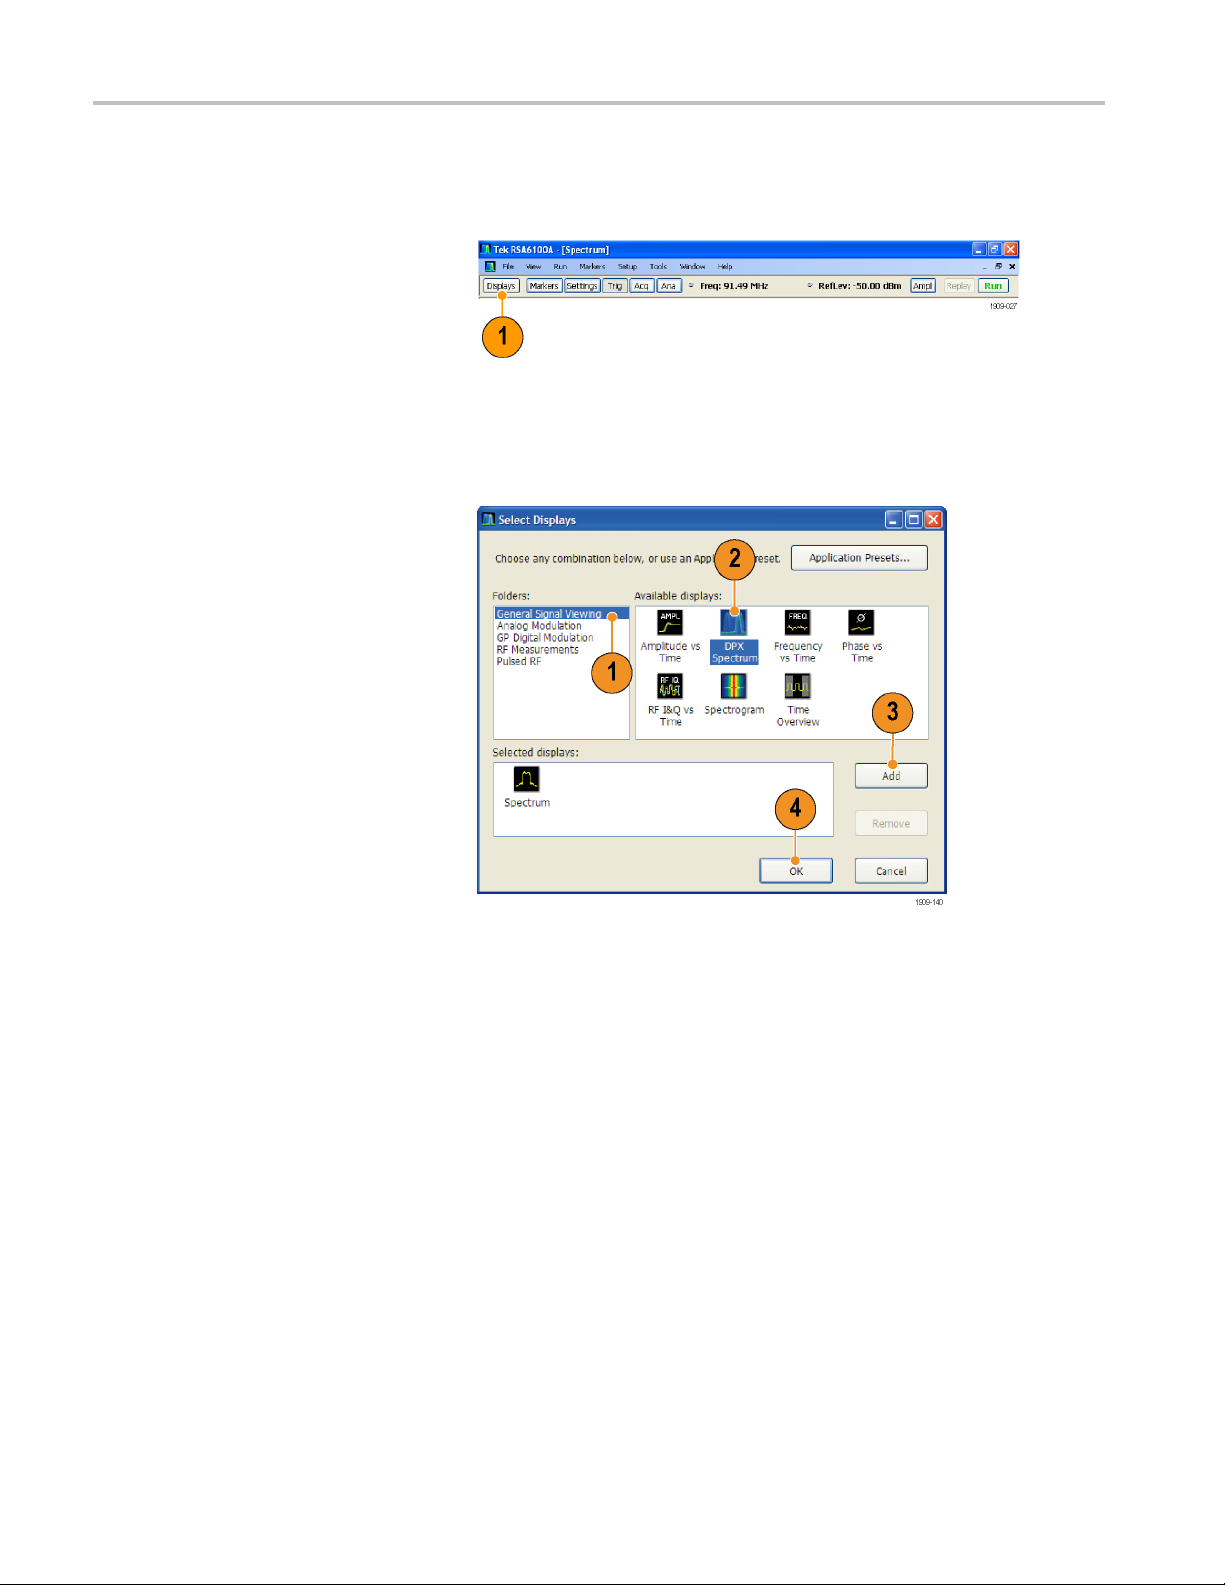
Selecting Displays
The spectrum analyzer provides an easy way of selecting displays.
1. Click Displays to open the Select
Displays dialog box.
There are two ways to select displays: choose any combination of displays or use an Application Preset.
Choose any Combination of Displays. Select displays one by one as needed.
1. Click the desired application folder
in the Sele
The available d isplays for each
folder are listed in the Available
Displays
ct Displays dialog box.
pane.
2. Click one
3. Click Add
icon) to add the selected display
to the Selected displays list.
Repeat t
displays.
4. Click OK to close the dialog box.
The selected displays w ill open.
of the display icons.
(or double-click the
he procedure to add other
24 RSA6100A Series Quick Start User Manual
Page 41
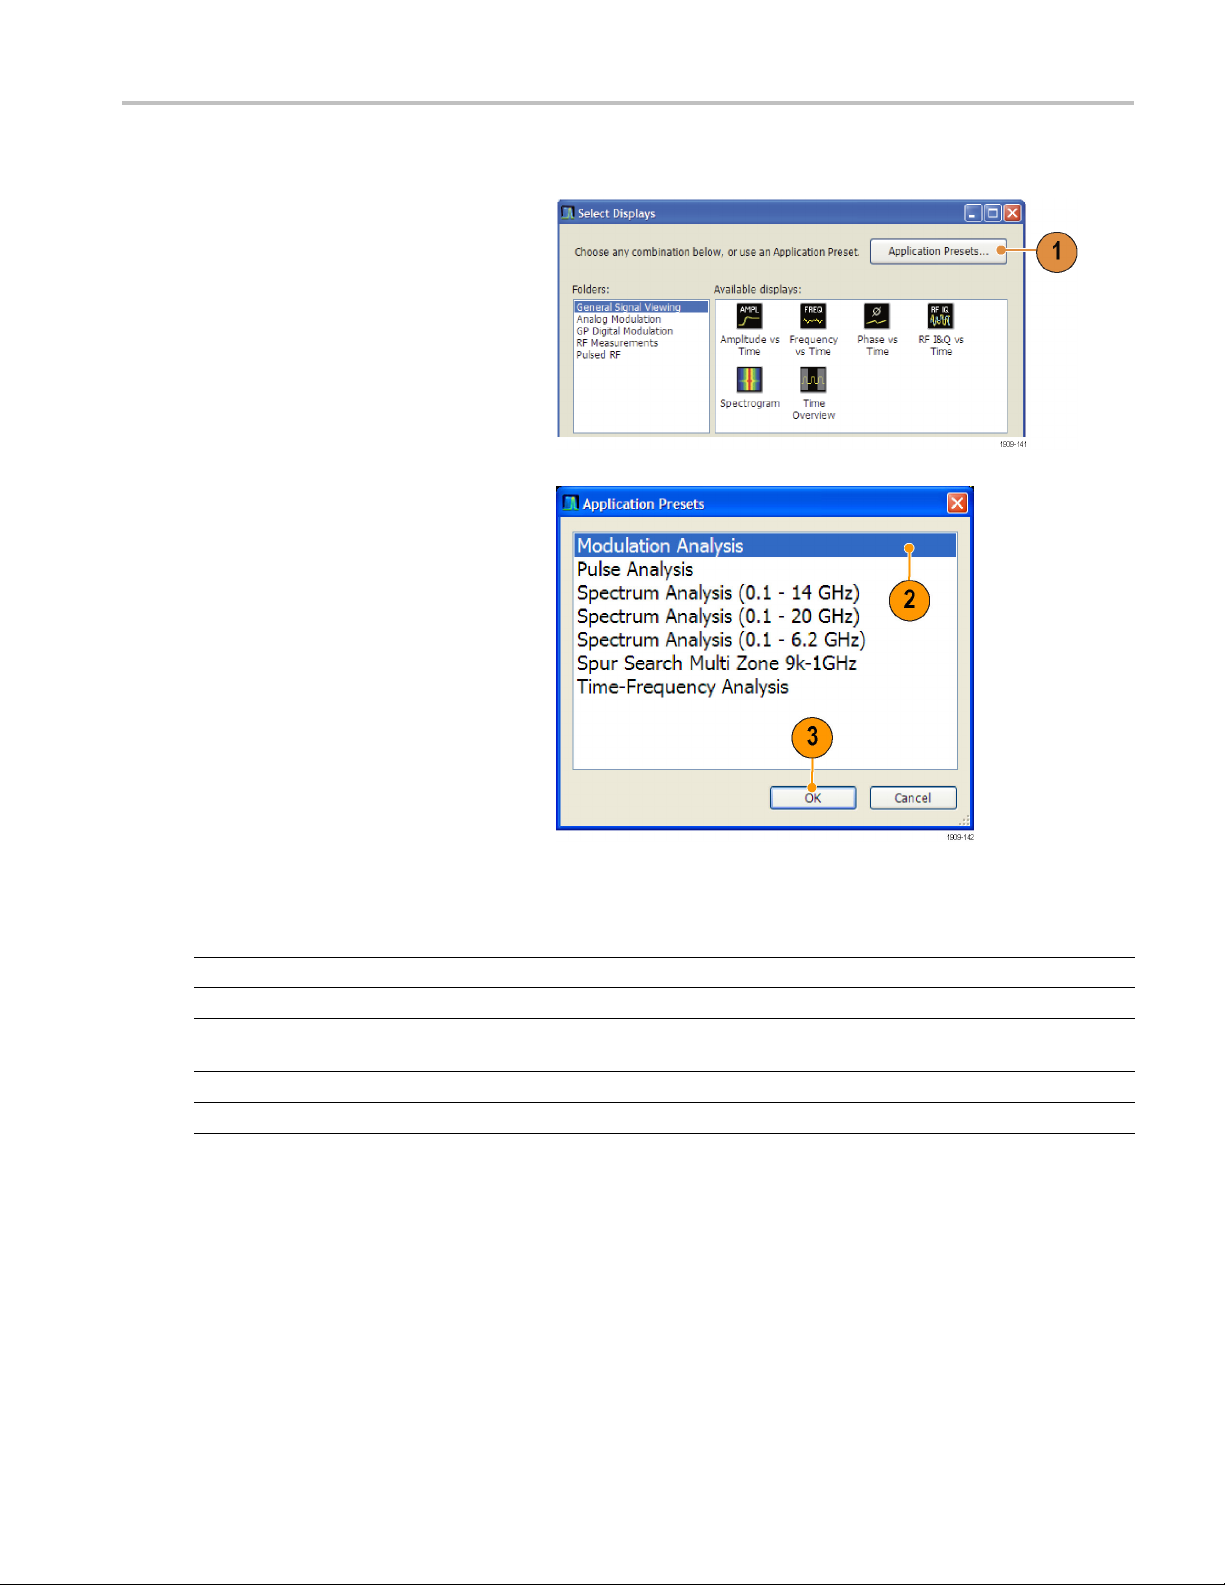
Use an Application Preset. Select displays from the presets for your application.
Operation
1. Click Applica
Select Displays dialog box
2. Select one of the presets.
3. Click OK to close the dialog box. T he
preset displays will open. (See Table 2.)
tion Presets... in the
Table 2
Preset
Modula
Pulse
Spec
0.1 - 6.2 GHz)
Spur Search Multi Zone 9k-1GHz Spurious
Tim
: Application presets
s
tion Analysis (Option 21 only)
Analysis (Option 20 only)
trum Analysis (0.1 - 20 GHz, 0.1 - 14 GHz, or
e-Frequency Analysis
Displa
Conste
DPX Sp
trum (center frequency of 10.5 GHz, 7.05 GHz or 3.15 GHz)
Spec
Frequency vs Time, Spectrogram, Spectrum, Time Overview
ys
llation, DPX Spectrum, Signal Quality, Symbol Table
ectrum, Pulse Table, Pulse Trace, Time Overview
RSA6100A S eries Quick Start User Manual 25
Page 42

Operation
Quick Tips
Push the Displays button on the front panel to open the Select Displays dialog box.
To add a display, double-click the icon.
To remove displays, do one of the following:
Select a display icon in the Selected Displays l ist, and then click Rem ove.
Double-click a display icon in the Selected Displays list.
Click the Close button in the upper right hand corner of the selected display.
You can mix displays from multiple application folders.
Common Information Messages
The following table lists some of the common information messages that might appear during normal operation.
Table 3: Common information messages
Message Explanation and recommended action
Acq BW too small for current setup
The displ
contains. This can be due to any of the following reasons:
ay needs a wider acquisition bandwidth than the current data record
A display other than the one you intended has been selected. The selected
display has requested a smaller acquisition bandwidth to achieve a better
y or dynamic range for its particular measurement.
accurac
Select the display that contains the message. Click Run if the instrument
is not already acquiring data.
Acquisitions are not running and the measurement now requests a wider
dth than the last acquisition.
bandwi
Click Run to perform a new acquisition with a wider bandwidth.
The data is from a recalled file.
There is no way to increase the acquisition bandwidth for saved data. You
djust the measurement settings so that less bandwidth is required.
must a
Need swept acq or larger Acq BW When any display requires a swept acquisition, the other displays are unable to
ess the swept data. This is because the swept data is customized for the
proc
selected display.
Select the display that you are interested in and the acquisition settings will
matically change to meet the requirements of the selected display.
auto
RBW increased to 100 kHz
current Spectrum Length or Analysis Length is not long enough to allow
The
a narrower RBW filter.
If the Length control is set to Manual, try increasing it or setting it to Auto so
t the Analysis Length will increase to the required value.
tha
26 RSA6100A Series Quick Start User Manual
Page 43
Operation
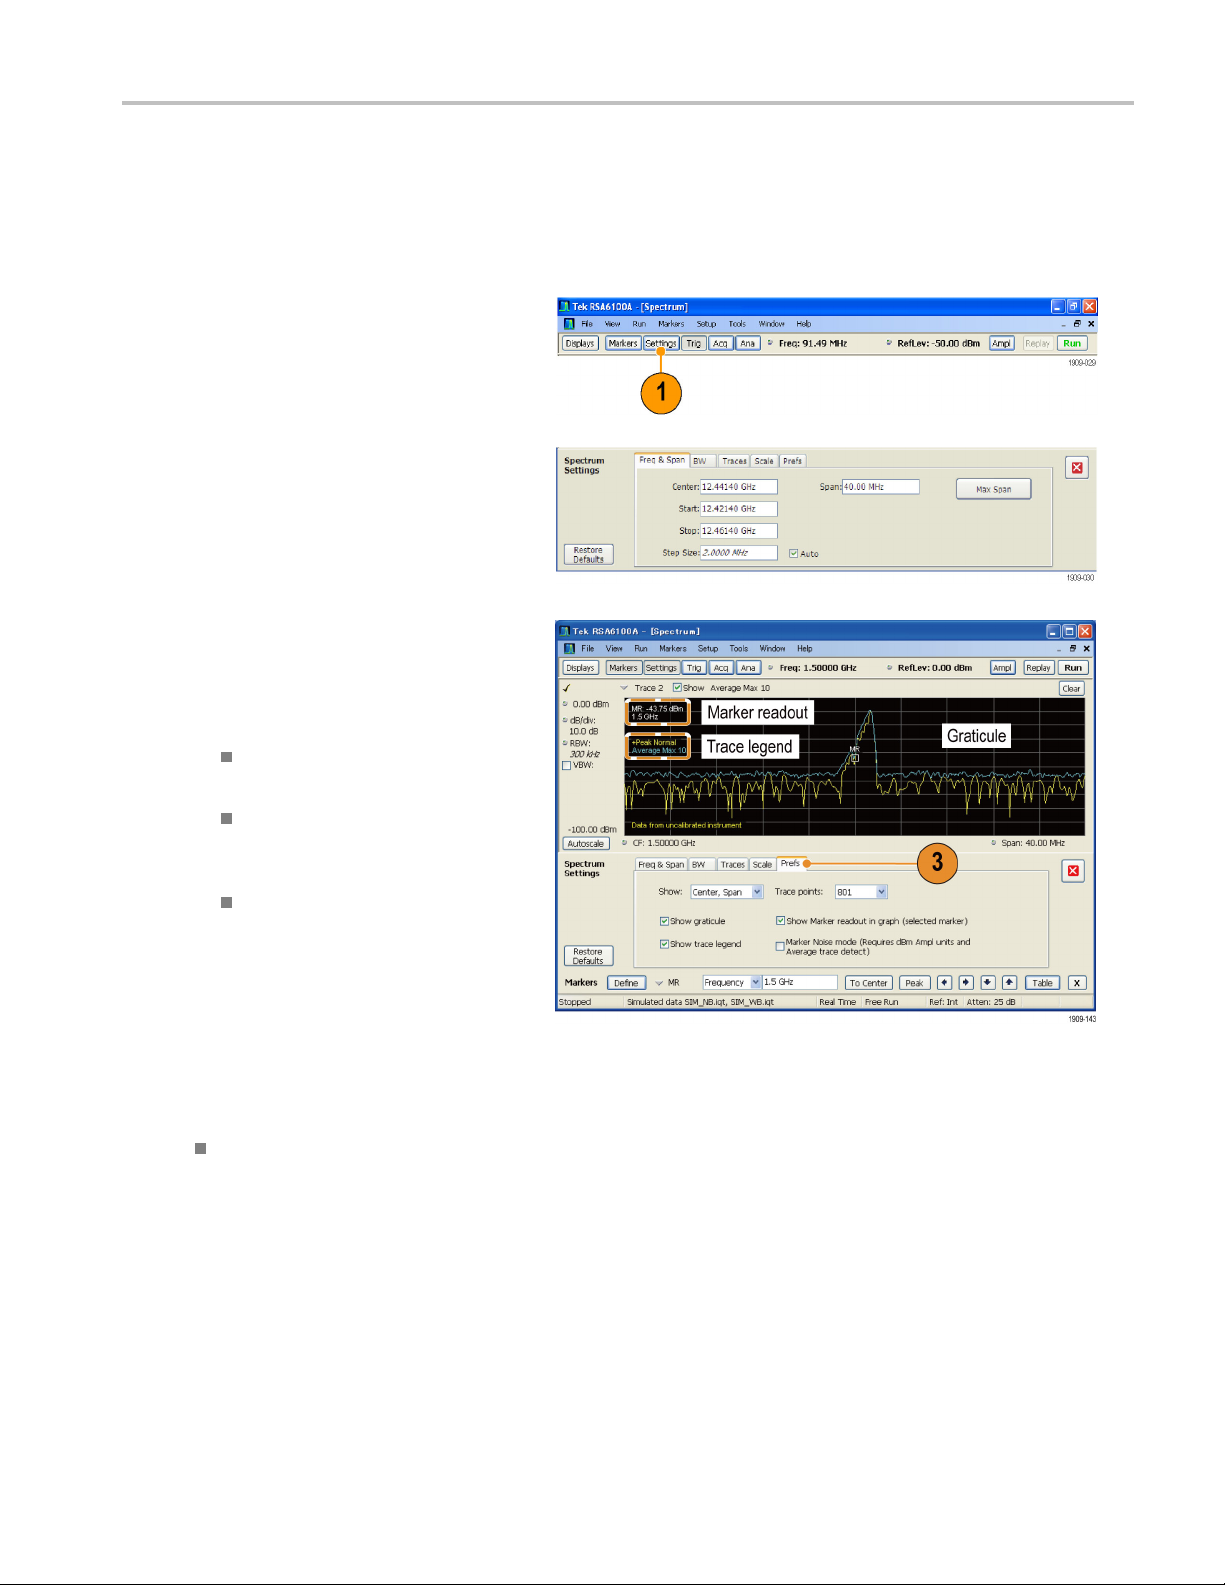
Changing Measurement Settings
The displays have settings that control how signals are acquired and processed. The settings that you can change depend
on the selected display.
To access the settings (in this case, for the Spectrum display):
1. Click Settings to open the Settings
control panel.
2. Adjust the controls as needed for your
signal or test. For example, use the
Freq & Span tab to set frequency and
span. Most of the control panels have
tabs that provide easy access to other
related controls.
3. You can change the appearance of the
display s
of the following controls apply to every
display. Some displays have additional
controls
creen in the Prefs tab. Not all
not described here.
To turn o
the Show graticule check box.
To turn on or off the marker readout,
select the Show Marker readout in
graph c
To t u rn
select the Show trace legend check
box.
kTip
Quic
If you have multiple displays on the screen, click anywhere inside one of the other displays to change to the control
panel for that display.
noroffthegraticule,select
heck box.
on or off the trace legend,
RSA6100A S eries Quick Start User Manual 27
Page 44

Operation
Presetting the Instrument
You can preset the instrument to restore the setups to their default values.
1. To start with the default instrument
settings, push the Preset button on the
front panel or select Preset from the
Setup menu.
Quick Ti
p
Preset does not change any of the settings specified from the C onfig In/Out control panel or from the Tools menu, such
as GPIB address, Save/Export preferences, or the Auto Alignment setting.
28 RSA6100A Series Quick Start User Manual
Page 45

Connecting a Signal
The spectrum analyzer has a single RF signal input located on the front panel. Make sure that you observe the input
signal requirements before connecting a signal to the input.
CAUTION. To prevent static damage to the instrument or to any instrument accessories, discharge to ground any
electrostatic charge that may be present on the center and outer conductors of cables, before attaching the cables to the
instrument inputs. Do not create an ESD (electrical static damage) antenna by leaving cables attached to the instrument with
the other ends of the cables open.
Required Signal Levels
The following table shows the input signal levels over which the Real Time S pectrum Analyzer can be used for
measurements. The accuracy is guaranteed at a signal amplitude and frequency (normalization point). Measurements can
be made on s
frequency and amplitude of the signal to be measured (see the RSA6100A data sheet for more information).
ignals within the entire range of allowable inputs, but the accuracy of the measurement is affected by the
Operation
RF signal
Modulation measurement requirement Spectral display requirement
-50 dBm t
Input si
Characteristic Description
Input i
Input frequency range
Maxi
Maxi
CAU
voltage rating is ±40 V DC. The maximum pulse specifications are 75 W peak, 10 μs pulse width, 0.001 duty cycle, and
≥30 dB attenuation.
input range (CW or peak envelope power)
o +30 dBm
DANL to +
30 dBm
gnal requirements
mpedance
RSA6106A
14A
RSA61
RSA6120A
mum measurable continuous input power
mum voltage rating
TION. To prevent damage to the instrument, do not connect CW signals greater than 1 Watt (+30 dBm). The maximum
50 Ω
9kHzto6.2GHz
9kHzto14GHz
to 20 GHz
9kHz
1 W (+30 dBm)
±40 V DC, AC coupled
RSA6100A S eries Quick Start User Manual 29
Page 46

Operation
To connect an RF signal:
1. Connect the si
connector on the front panel.
gnal to the RF INPUT
Quick Tip
If the source signal is greater than 1 Watt ( +30 dBm), connect the source signal to an attenuator. Connect the attenuator
output to the RF Input connector.
Starting and Stopping Acquisitions
1. ClicktheRunbuttontostartan
acquisition.
While acquiring data, the button
label has green lettering.
2. Click the Run button again to stop
an acquisition. If an analysis is in
process, it will finish its sequence
and then stop. The button label
changes from green lettering to
black lettering to indicate that the
instrument has stopped.
Quick Tip
Push the front panel Run button to start and stop acquisitions.
Run Control
The Run menu provides access to commands that control the acquisition and the measurement sequence. Refer to
the online help for information on all of the Run menu selections. Continuous is the default selection. When you select
Continuous, the instrument will continuously acquire data until you stop the acquisitions. Select Single Sequence to run a
single acquisition every time you click Run or push the Run button on the front panel.
30 RSA6100A Series Quick Start User Manual
Page 47

Markers
Use markers to measure time, frequency, power and other results. Markers measure absolute values and can also measure
the difference between markers.
Using Markers to Measure Frequency and Power
The following procedure shows how to use markers in the Spectrum display to measure frequency and power. The example
assumes that
1. Click Markers to open the
2. Select Add Marker from the
all markers are turned off and that a signal is on the screen.
Marker toolbar at the bottom of
the Analysi
drop-down list on the Marker
Toolbar.
The first marker is designated
the marker reference (MR).
s window.
Operation
3. Position the marker on the
screen using the arrow buttons in
the Marker toolbar. You can also
drag the marker to the desired
position using the touch screen
or the mouse.
4. Read the frequency and power
level from the marker readout on
the display.
RSA6100A S eries Quick Start User Manual 31
Page 48
Operation
Markers Display
Rectangular markers show absolute values i n the readout. The readout of the selected m arker appears in the upper left
corner of the display and in the Marker toolbar.
Diamond markers show delta values (relative to the reference marker). The delta readout of the selected marker appears
in the upper right corner of the display and in the Marker toolbar.
When you drag markers along a trace with either the touch screen or the mouse, the marker will seek the high points.
The marker stays within 20 trace points of the mouse position. If there are no peaks within the current range of trace
points, the marker finds the highest point.
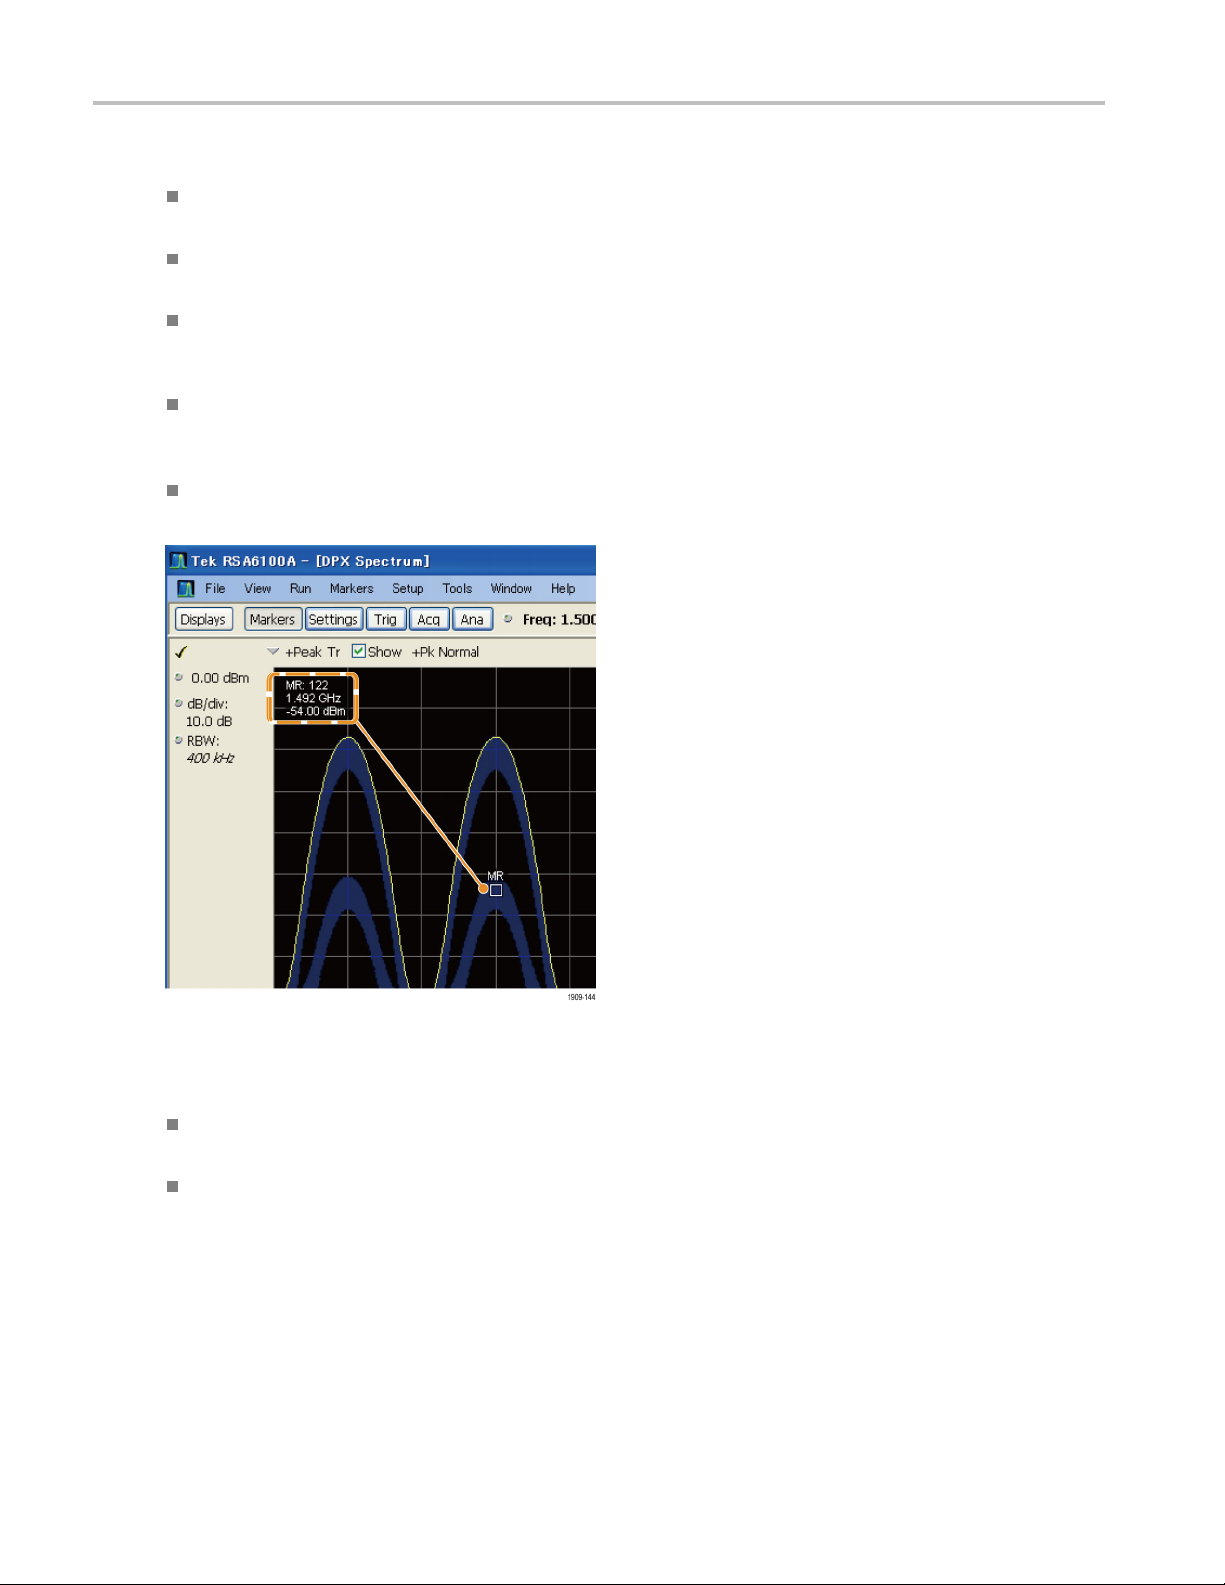
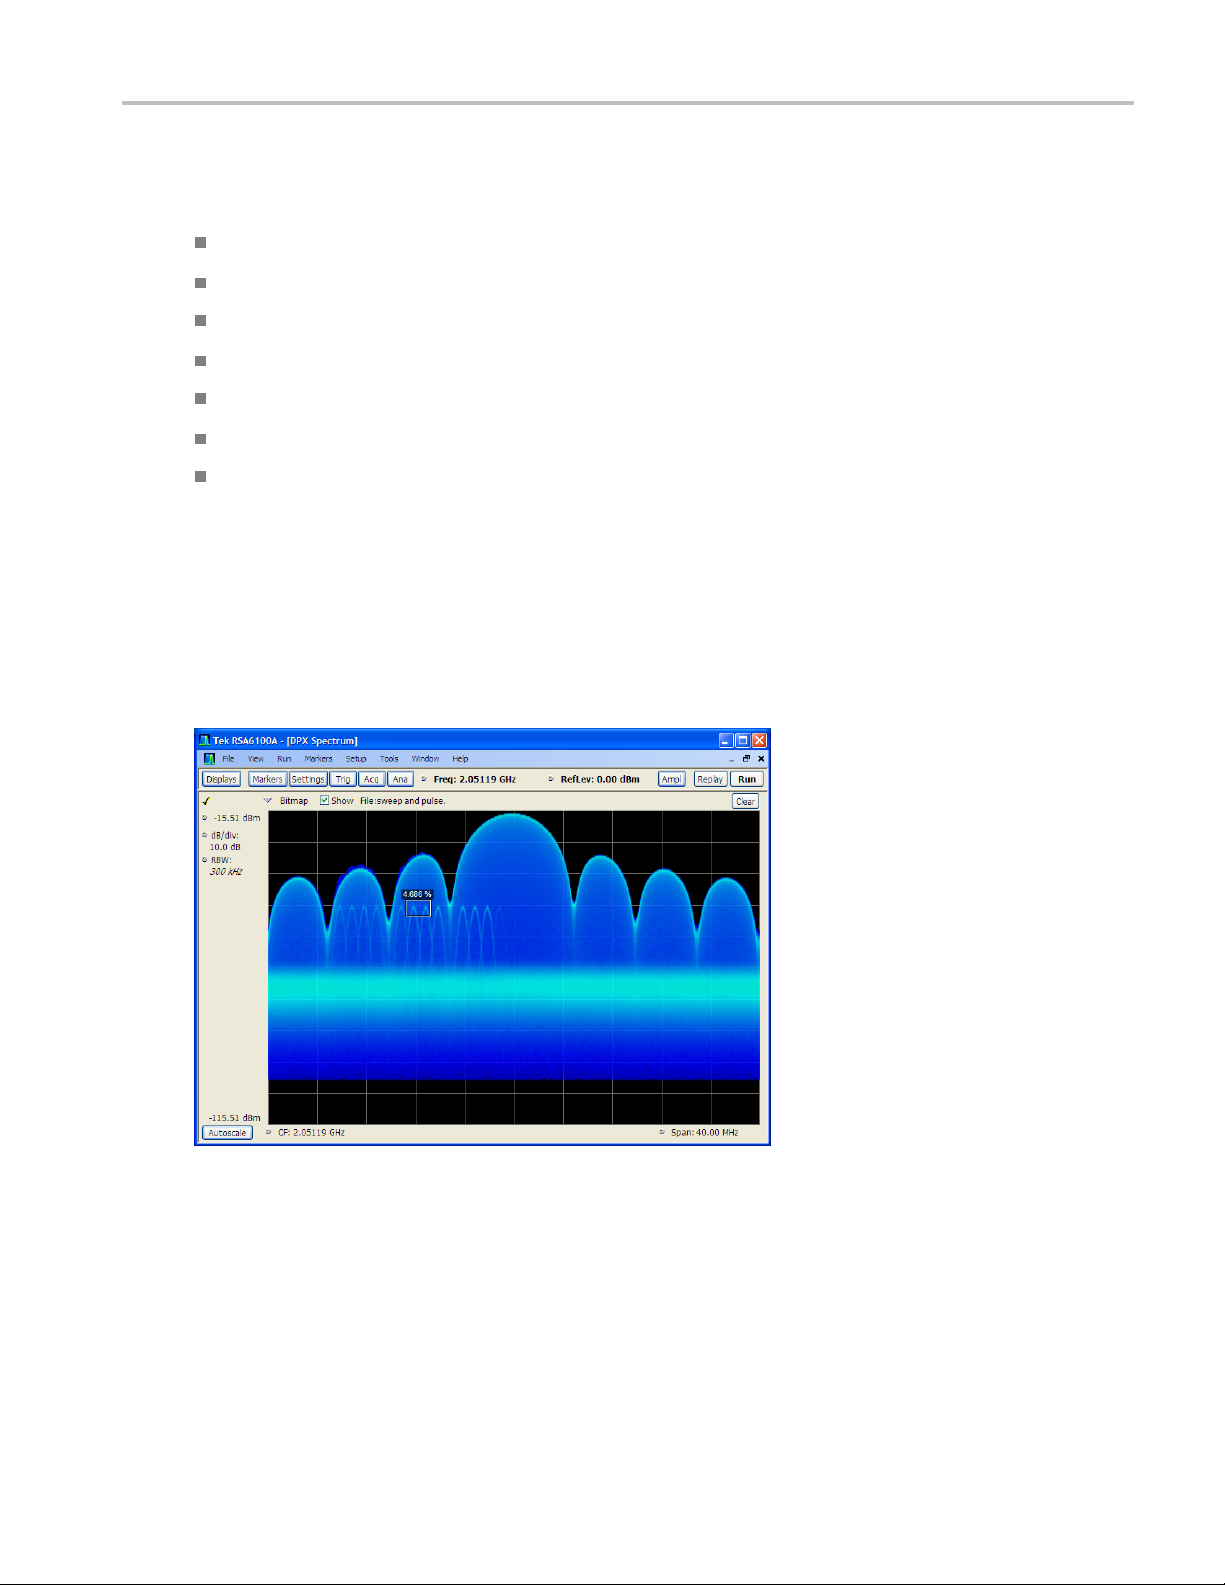
When you attach the m arker to the bitmap trace in the DPX spectrum display, the m arker readout indicates the hit count
for pixels (maximum 65,536) along with frequency and power (see the following figure). You can position the marker
at any point in the graph.
If O ption 200 is installed, markers a ttached to the D PX bitmap display the signal density in percent at the selected pixel,
rather then the hit count.
Quick Tips
If m arkers a re turned off, click Peak in the Marker toolbar or on the front panel to add the marker reference (MR) and to
position it on the maximum peak level on the trace in the selected display.
Click Table in the Marker toolbar to open a tabular display showing the marker information.
32 RSA6100A Series Quick Start User Manual
Page 49

Marker Toolbar
The Marker toolbar has several controls to work with markers. (See Table 4.) Some of these controls are similar to those
on the front panel.
Table 4: Marker toolbar
Icon Description
Opens the Define Markers control panel. Use the control panel to add and remove markers and
to set marker parameters.
Sets the Measurement Frequency of the instrument to the frequency of the selected marker. This
button is only present when the selected display has frequency on the horizontal axis.
Moves the marker to the maximum peak level on the trace. The maximum peak can be either the
highest or the lowest point in displays with both positive and negative values on their vertical axis
(such as Frequency Error or Phase).
Moves the selected marker to the next peak to the left of the current position.
Moves the selected marker to the next peak to the right of the current position.
Moves the selected marker to the next lower peak value. The peak value refers to the absolute
value of the peak amplitude. When repeatedly moving the marker, it can move in any direction
depending on the location of the next peak. If the marker is attached to the D PX bitmap trace, this
button moves it to the next-lower-amplitude density peak at the same frequency.
Operation
Moves the selected marker to the next higher peak value. The peak value refers to the absolute
value of the peak amplitude. When repeatedly moving the marker, it can move in any direction
depending on the location of the next peak. If the marker is attached to the D PX bitmap trace, this
button moves it to the next-higher-amplitude density peak at the same frequency.
Opens or closes the marker table in the display.
Adding Markers
an have u p to five markers. The first marker (MR) is a reference marker. The other markers (M1, M2, M3, and M4) can
You c
show absolute values or can show both absolute values and the difference values between them and the reference marker.
To add another marker, select Ad d Marker from the drop-down list in the toolbar.
RSA6100A S eries Quick Start User Manual 33
Page 50
Operation
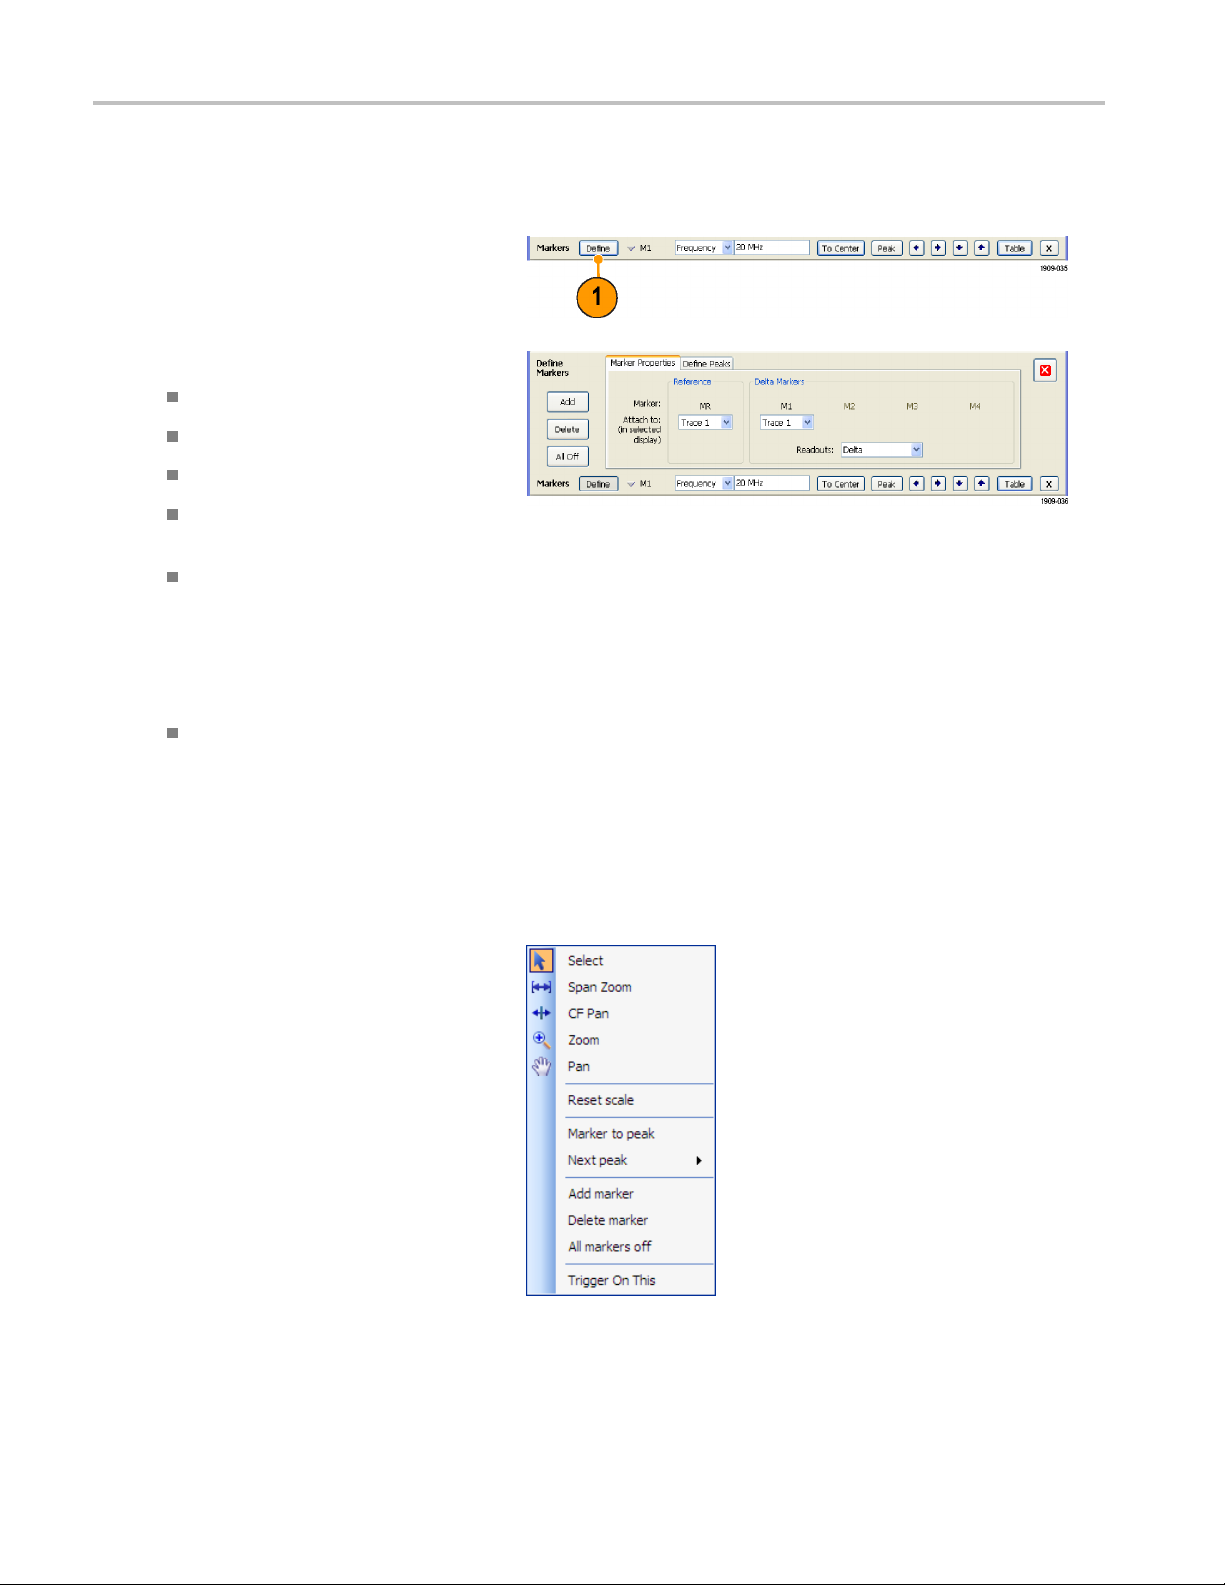
Defining Markers
Use the Define Markers control panel to define the marker settings.
1. Click Define to open the Define Markers
control panel.
Use the control panel to:
Add or delete markers.
Turn markers off.
Assign markers to specifictraces.
Set the marker readouts to absolute or
delta.
Define the t
values.
hreshold and excursion
Quick Tip
You can add or delete markers from the drop-down l ist next to Define in the Marker toolbar.
Touchscreen Actions
You can use the touchscreen to change marker settings and how waveforms are displayed by using the Touchscreen Actions
menu. T
also use a mouse to display the Touchscreen Action menu by clicking the right mouse button.
Some s elections in the Touchscreen Actions
menu a
defined.
o use the Touchscreen Actions menu, touch the display and hold for one second, then remove your finger. You can
re selectable only when a marker is
Touchscreen Actions menu
34 RSA6100A Series Quick Start User Manual
Page 51

Table 5: Touchscreen actions menu
Icon Menu item Description
Select Selects markers and adjusts their position.
Operation
—
—
—
—
—
—
Span Zoom
CF Pan Adjusts the Center Frequency according to horizontal movement.
Zoom
Pan
Reset Scale Returns the horizontal and vertical scale and position settings to their default
Marker to peak
Next Peak
Add marker
Delete marker Removes the last added marker.
All markers off
Trigger On This
Zooms the graph area about the selected point. Touch the graph display at a point
of interest and drag to increase or decrease the span about the point of interest.
Span Zoom adjusts the span control and can affect the acquisition bandwidth.
Adjusts horizontal and vertical scale of the graph. The first direction with
enough movement becomes the primary scale of adjustment. Adjustment in the
secondary direction does not occur until a threshold of 30 pixels of movement is
crossed.
Dragging to the left or down zooms out and displays a smaller waveform
(increases the scale value). Dragging to the right or up zooms in and displays a
larger waveform (decreases the scale value).
Adjusts horizontal and vertical position of the waveform. The first direction with
enough movement becomes the primary direction of movement. Movement in
the secondary direction does not occur until a threshold of 30 pixels of movement
is crossed.
values.
Moves the selected marker to the highest peak. If no marker is turned on, this
control automatically adds a marker.
Moves the selected marker to the next peak. Choices are Next left, Next right,
Next lower (absolute), and Next higher (absolute).
Defines a new marker located at the horizontal center of the graph.
Removes all markers.
Positions the DPX Density measurement box at the click point, measures the
current signal density, sets up the DPX Density Trigger function based on the
measurement result, and starts acquisitions.
RSA6100A S eries Quick Start User Manual 35
Page 52

Operation
Printing
You can print a copy of the screen and its contents (a screen shot) to a printer or a file.
1. Push the Print button on the front panel
or select Print from the File menu.
2. Fill out th
and then click OK.
The Print dialog box is the standard
Microsoft
printer controls are dependent on your
printer.
e details in the Print dialog box,
Windows P rint dialog box. The
Ink Saver Mode
You can print screen images with a white background.
1. Select Options from the Tools menu.
36 RSA6100A Series Quick Start User Manual
Page 53

2. Select the Colors tab in the control panel.
3. Set the Color Scheme to Blizzard.
The background color changes from
black to white
in the graphs.
Operation
RSA6100A S eries Quick Start User Manual 37
Page 54

Operation
Saving Data
You can save different types of data for future use.
1. Select Save As. . . from the File menu
to open the Save As dialog box.
2. Navigate to the folder where you want
to save the
location.
3. Enter a file name.
4. Select the type of file to save. (See
Table 6.)
setups, or use the default
5. Click Save.
Table 6: File types for save
File types Description
Setup files Saves all of the setup information for all settings displays, except those settings that
are specified under the Tools menu (Alignments and Options) or in the ConfigIn/Out
control panel.
Results Export files Saves the trace and numeric data for the selected display. The trace and numeric data
are saved in CSV format as text files.
Picture (PNG/JPG/BMP) Saves a graphical representation of the screen in the specified format. This option is
useful for including the graphic in reports or other applications. Marker readouts and
other information are included.
Selected Trace Saves a trace for later recall back into the display from which it was saved.
Data (acquisition data and
acquisition data export)
Saves data for reanalysis by the RSA6100A Series Real-Time Spectrum Analyzers or as
CSV (comma-separated value) data to use with external software.
38 RSA6100A Series Quick Start User Manual
Page 55
Quick Tips
Select File > Save or press the Save button to save the information to a file using the same name, path, and data type
as the last time that you saved. If the file already exists, the file name suffix number will increment if you previously
selected that option in the Tools > Options > Auto Filename control panel tab.
Select File > Save As to open the standard Windows Save dialog box where you can edit the file name, choose what
data type to save, and select a folder for storing the file.
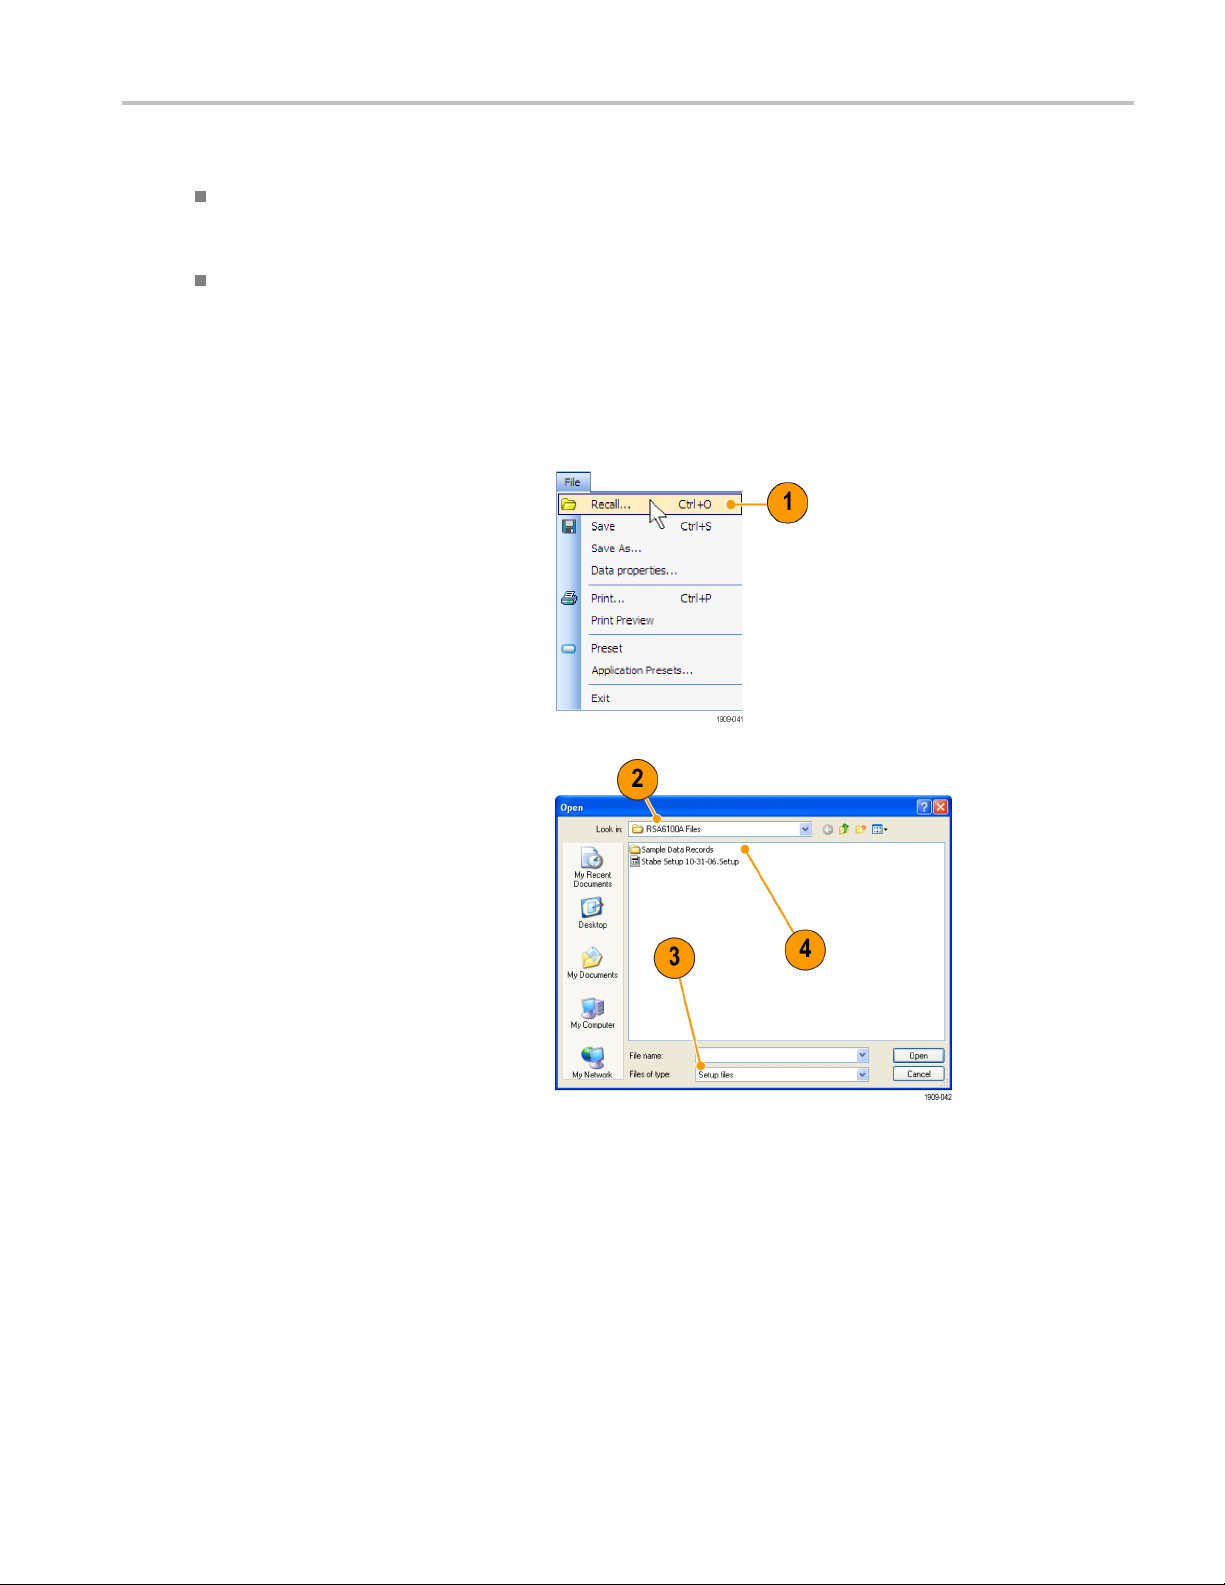
Recalling Data
You can recall acquisition data and setup files previously saved by the RSA6100A Series Real-Time Spectrum Analyzers.
Operation
1. Push the Rec
or select Recall from the File menu.
2. In the Open dialog box, browse to the
locatio
3. If you do
of file under Files of Type.
4. Double click the file name to l oad the file.
all button on the front panel
nofthefile.
not see the file, select the type
kTip
Quic
If you recall a trace that has an x-axis range that does not fall within the x-axis range of the current graph, the trace will not be
visible. A small arrow will point off-screen in the direction of the recalled trace. Use the Frequency and Span (or Span and
Offset) controls to bring the trace on the screen in the Spectrum display. In other displays, use Horizontal Scale and Offset
(which can also be used in the Spectrum displa y). These controls are on the Settings > Scale tab.
RSA6100A S eries Quick Start User Manual 39
Page 56

Operation
Advanced Techniques
This section contains advanced operating techniques. For examples of practical applications, see the RSA6100A Series
Real-Time Spectrum Analyzers Application Examples Manual.
Setting Up Triggering
The RSA6100A Series Real-Time Spectrum Analyzer offers real-time frequency domain triggering (option 02) in addition to
power-level
acquisition of the signal. This allows the spectrum analyzer to store both pretrigger and post-trigger information.
The spectrum analyzer has two triggering modes:
Free Run mode. In Free run mode, the instrument initiates acquisitions without considering any trigger conditions. It
is a fast and easy way to see the signals. Free Run is usually adequate for the Spectrum display unless you need to
specify a particular time at which to collect the data record.
Triggered mode. In Triggered mode, the instrument initiates an acquisition when a trigger event is recognized. The
conditions that define a trigger event depend on the selected trigger source. There are several source selections available for
choosing the signal to monitor for a trigger event.
Once you select the Triggered mode, you must select the source. The trigger sources are:
triggers, line trigger, and external triggers. It uses a trigger event as a reference point in time for the seamless
RF Input
Trig In
Trig2In
Gated
Line
Once you select the trigger source, you can set additional parameters to specify the trigger event. If you specify th
as the trigger source, you can chose from two trigger types:
e R F Input
DPX Density Triggering. This trigger type enables the instrument to capture any signal you can see in the DPX display,
including difficult to see signals hiding beneath other signals that have a higher amplitude or a greater repetition rate. Using
the Trigger On This™ feature, you can draw a box around the area of interest in the graph, set a Density threshold, and
the instrument will trigger when the measured Density exceeds your threshold.
Time Qualified Triggering. Time Qualified triggers allow you to trigger the instrument based on when signal transitions
occur in time. You can apply time qualification to the basic trigger types. For example, if you select the Power type and
configure it to trigger on a rising edge, Time Qualification allows you to screen rising-edge events based on how long the
signal stays high after it exceeds the trigger threshold. You may wish to trigger only on pulses that last longer than a
specified time or shorter than a specified time. You can set Time Qualified to accept only pulse widths between two specified
values, or outside of these two values.
You can also time qualify Frequency Mask, DPX Density, and Runt trigger events. For each trigger type, the instrument finds
all e vents that meet the basic trigger criteria, then further te
sts them against y our time qualification parameters.
Frequency Mask Triggering. Frequency Mask Triggering allows you to trigger the instrument when a signal in the
frequency domain violates the mask. You can draw a mask to define the condi
generate the trigger event. It allows you to trigger on weak signals in the presence of strong signals. This triggering is
also useful for capturing intermittent signals.
40 RSA6100A Series Quick Start User Manual
tions within the real-time bandwidth that will
Page 57

Operation
Power Triggering. Power triggering triggers the instrument on time-domain si gnal characteristics. The incoming data is
compared to a us
er-selected level in dBm. You can select the time-domain bandwidth and trigger on the rising or falling edge.
In addition to
the Trigger control panel:
Position and Delay parameters that define where a trigger occurs within the acquired data record and whether to
delay the trigger for a set amount of time.
Whether a single event can trigger an entire sweep, or each segment of the sweep requires a new trigger event in
swept acquis
defining the trigger event, you can define the following parameters by selecting the appropriate tab in
ition mode.
RSA6100A S eries Quick Start User Manual 41
Page 58

Operation
Accessing Trigger Parameters
1. Click Trig to open the Trigger control
panel.
2. As shown in the following steps, click
one of the tabs in the Trigger control
panel to define the trigger parameters.
3. Use the Event tab to set parameters that
define trigger events. The parameters
vary depending on the trigger Source
and Type selections.
4. Use the Time Qualified tab to set
parameters that qualify trigger events
based on their time duration.
5. Use the Advanced tab to select whether
to trigger on each segment while in
Swept acquisition mode and to set
parameters that control the position of
the trigger event.
Quick Tip
Other ways to access the Trigger control panel:
Push the Trigger button on the front panel.
Select Trigger . . . from the Setup menu.
Setting Up a DPX Density Trigger
The DPX Density trigger captures transients partially obscured by other higher-amplitude or more frequent signals. If you
can see it in the DPX bitmap, you c an trigger on it. The DPX Density area measurement is used to select the region of
interest in the display and to measure its current density. You set a density threshold, and the instrument triggers when the
density measurement exceeds your threshold.
42 RSA6100A Series Quick Start User Manual
Page 59
The quickest way to set up a DPX Density trigger is to use a mouse and right-click on a signal of interest in the DPX
graph, or press
This action performs several tasks:
Places the density measurement box at the click point
Sets the measurement box to its default size
Measures the average density in the box
Sets the Trigger mode to Triggered
Selects the DPX Density "Higher" trigger type
Adjusts the trigger threshold to a density value slightly below the current measured value
Starts the acquisition process
To optimize DPX Density trigger settings for your particular signals, open the Trigger control panel. Use the controls for
changing the polarity of the trigger’s threshold c omparison (Higher versus Lower), the Threshold value, and the size and
location o
values to adjust the width and height of the measurement box.
For events that are partially masked by stronger signals, you will often need to adjust the density Threshold based on
density measurements of the event of interest and of the obscuring signal. F or example, if the density of the background
color rep
set the Threshold to 8% .
on the screen and hold with your finger for one second. A menu will pop up. Select Trigger On This.
f the measurement box. Use the Frequency and Amplitude settings to locate the center of the box, and set the +/-
resenting only the stronger signal is 7% and the density measurement including both signals is 9%, you would
Operation
If your expected signal is a continuous tone and you want to capture events when it hops to a different frequency or drops
to a lower amplitude, move the Density measurement box to surround the peak of the signal, select Lower in the Density
control, and set Threshold to 100%. The instrument will trigger when the signal is absent from the measurement box.
Hint. The density measurement is the average of the densities for each column of pixels in the box. If your measurement
box is wider than the peak of a CW s ignal, the density reading will be less than 100%. To get a 100% reading, you can
broaden the peak by increasing RBW or narrow the box until there are no colored pixels either above or below the box. T he
signal should enter the left side of the box and exit the right side. It should not cross the bottom edge of the box.
RSA6100A S eries Quick Start User Manual 43
Page 60

Operation
Creating a Frequency Mask
Use the Mask Editor to create a Frequency Mask. The mask is a set of points defined by frequency and amplitude. Access
the Mask Editor from the Trigger control panel. (This procedure uses the Spectrum display.)
You can create a Frequency Mask by using either the manual or Auto Draw method. The following procedure explains the
manual method. For a procedure on how to use the Auto Draw method, see the topic Mask Editor (Frequency Mask
Trigger) in the online help.
1. Click Trig to open the Trigger control
panel.
2. Select the
3. Set the Sou
4. Set the Typ
5. Click Mas
Editor.
The Mask Editor opens with the traces of
the Spect
6. Click Ne
the existing mask and then creates a
default 6-point mask.
Event tab in the control panel.
rce to RF Input.
etoFrequency Mask.
kEditorto open the Mask
rum display in the graph.
w in the tool bar. This removes
44 RSA6100A Series Quick Start User Manual
Page 61

7. Click any point in the mask to select it.
The frequency and amplitude of the
selected poin
graph.
8. Edit the point by doing one of the
following:
Drag and drop the point with the
mouse.
t are highlighted in the
Operation
Enter the fr
in the table.
Adjust amplitude with the up/down
arrow keys and frequency with the
left/righ
equency and amplitude
t arrow keys.
Quick Tips
Click Auto draw to generate a mask automatically adjusted to the Reference.
Right click on the display screen to add a new point.
Click Add Points and then click on the graph to add a new point in the graph.
Click Next to select the next point in the graph.
Click the X (delete button) to delete the selected mask point.
Click Save to save the m ask file and continue working with the mask editor.
Click Open to load and edit a previously saved mask file.
Defining Trigger Conditions
After you have set up the mask, you can select whether to trigger on the presence or absence of mask violations.
1. Select a condition.
hoices are described in the
The c
following table. (See Table 7.) The icons
at the bottom of the control panel identify
t is considered true or false.
wha
ck Triggered.
2. Cli
The instrument will trigger when the
trigger conditions are met.
RSA6100A S eries Quick Start User Manual 45
Page 62

Operation
Table 7: Trigger violations
Violation Description
T
F The instrument triggers whenever the signal has no points in the mask.
T>F
F>T
T>F>T
F>T>F
The instrument triggers whenever the signal violates the mask (above the line).
Onetransitiondefines the trigger event. The signal must go out of the mask (no violation)
after being inside of the mask (violation).
Onetransitiondefines the trigger event. The signal must go into the mask after being
outside of t
Two transi
outside of the mask, and then cross back into the mask.
Two transitions define the trigger event. The signal must start outside of the mask (no
violation), cross into the mask, and then cross back outside of the m ask.
he mask.
tions define the trigger event. The signal must start inside of the mask, cross
Controlling Acquisitions
When two or more displays are open, one display controls the acquisition system. The acquisition requirements for the
selected display set the acquisition hardware parameters. While the acquisition parameters are optimized for the selected
display, they might not be ideal for other displays. In this case, the other displays might be unable to maintain optimum
performance and consequently might be unable to produce results. (This also happens when you analyze recalled data:
measurements attempt to deliver results, but may not be able to comply with all their settings.)
You can specify which display controls the hardware acquisition parameters by clicking anywhere in that display. When there
are multiple displays, the highlighted display controls the hardware acquisition parameters.
In this example, there are two displays, a
Spectrum display and a DPX Spectrum
display. The highlighted title bar on the DPX
Spectrum display indicates that it is the
selected display.
The check mark indicator in the upper
left corner of the display indicates that
acquisition hardware is optimized for the
Spectrum display.
Some displays do not control the acquisition hardware. These displays just show the captured data. Some displays share
the s ame parameters. If any of one of these displays in such a family controls the acquisition hardware, then the acquisition
rameters are optimized for all of the displays in that family.
pa
46 RSA6100A Series Quick Start User Manual
Page 63

Operation
Measurements with Conflicting Acquisition Requirements
The RSA6100A Series Real-Time Spectrum Analyzer lets you open any combination of measurements. You can select
the displays that you are interested in and the instrument will automatically set up the appropriate analysis and acquisition
parameters.
If measurements place conflicting requirements on the acquisition parameters, the current selected display takes priority. The
following example shows incompatible measurement settings when one display needs real-time data (such as the Amplitude
vs Time measurement) while another display requires swept data (such as a Spectrum graph with a very wide span).
1. Push the Preset button on the front
panel to set the instrument to the default
settings.
2. Tune the instrument to the frequency of
your signal and then set the span.
3. Click Displays to open the Select
Displays dialog box.
4. Select the General Signal Viewing folder.
5. Select the Amplitude vs Time icon.
6. Click Add to add the icon to the Selected
Displays list.
NOTE. Add the Spectrum display if it is not
already in the Selected Displays list.
7. Click OK to accept the changes and
close the dialog box.
RSA6100A S eries Quick Start User Manual 47
Page 64
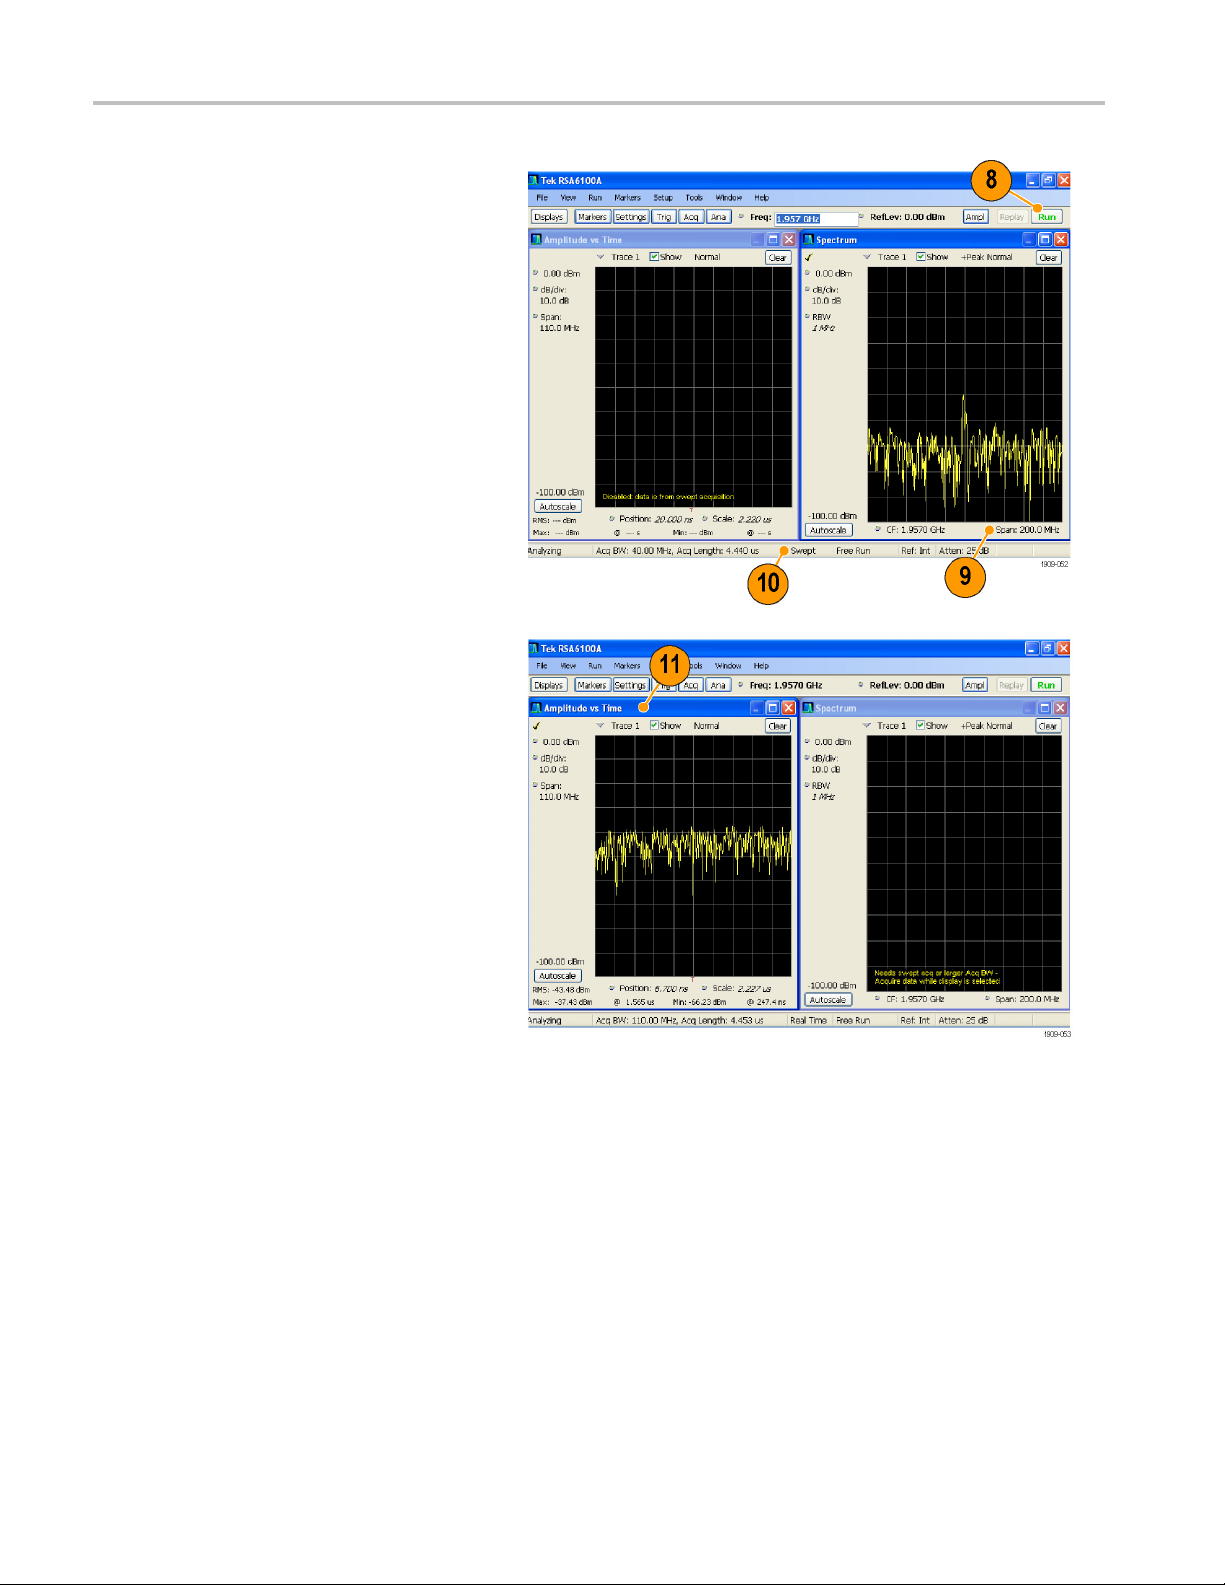
Operation
8. Click Run to start acquiring data.
9. Increase the span in the Spectrum
display to 200 MHz.
Because Spect
display, the acquisition parameters
adjust automatically to meet the needs
of the displa
exceeds the real-time bandwidth of the
instrument. As a result, the instrument
will change
rum i s the selected
y. The 200 MHz span
to swept mode.
10. Look at the S
“Swept” indicates when acquisitions are
swept.
When the ac
all measurements usually run. If the
acquisitions are s wept, only the selected
display ca
11. Click the
make it the active display.
The acquisition switches back to
real-ti
requires real-time. The data is now
suitable for the Amplitude vs Time
displa
of frequencies needed by the Spectrum
display.
In this
run.
tatus bar. The readout
quisitions are in “Real Time,”
n run.
Amplitude vs Time display to
me because the selected display
y but doesn’t contain the full range
case, the Spectrum is unable to
48 RSA6100A Series Quick Start User Manual
Page 65

Operation
12. Decrease the sp
an to 40 MHz in the
Spectrum display. Now the acquisitions
are real-time again.
13. Check the status bar readout to verify
that the acqui
sition is real-time.
Both of the displays can run now.
RSA6100A S eries Quick Start User Manual 49
Page 66
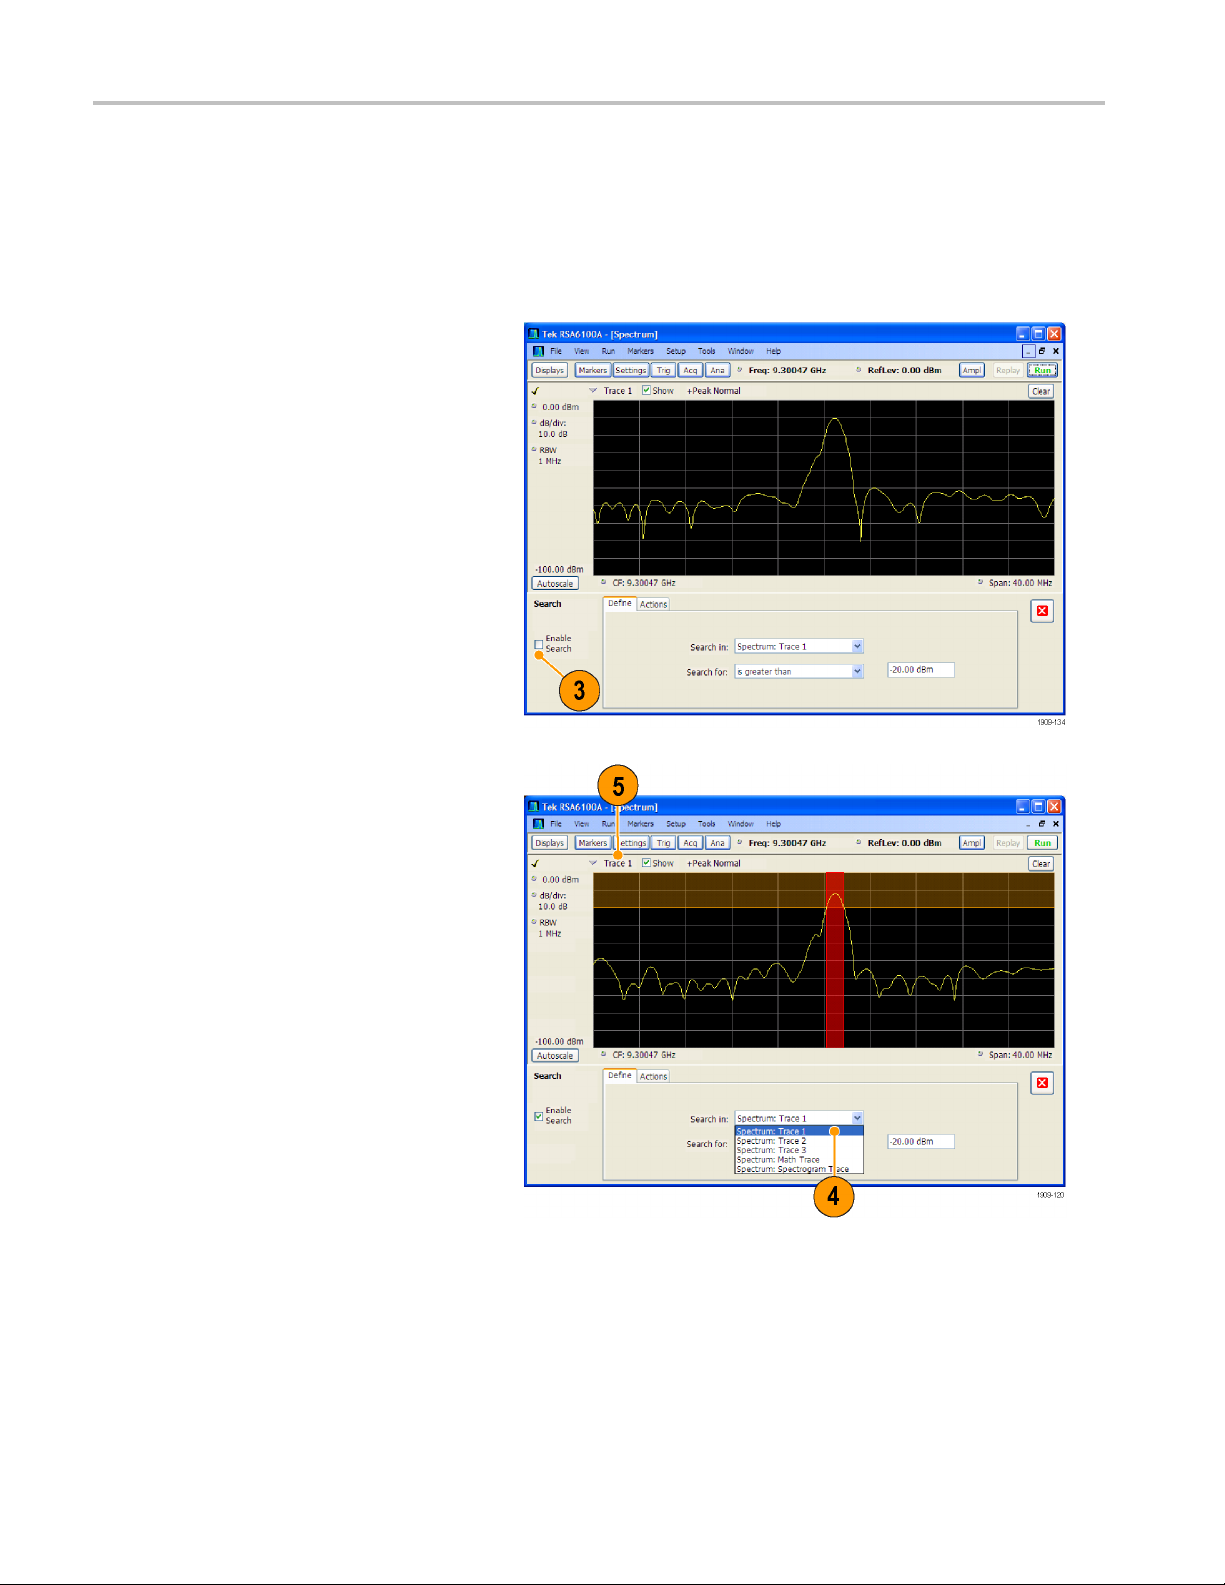
Operation
Searching Signals
The RSA6100A Real-Time S pectrum Analyzer lets you s earch signals for changes in power level. You can identify matches
as crossing a power level or you can create a mask that specifies power level and frequency range limits. You can select
which trace to search and specify an actiontotakewhenasearchmatchoccurs.
To search a trace:
1. Open the Spectrum display or select the
Spectrum display if it is already open.
2. Select Tools > Search.
3. Select the Enable Search check box.
4. Selectthetraceyouwishtosearchfrom
the Search in drop-down list box.
5. Verify that the trace you selected in the
Search in list is the selected trace and
that the Show box is checked.
50 RSA6100A Series Quick Start User Manual
Page 67
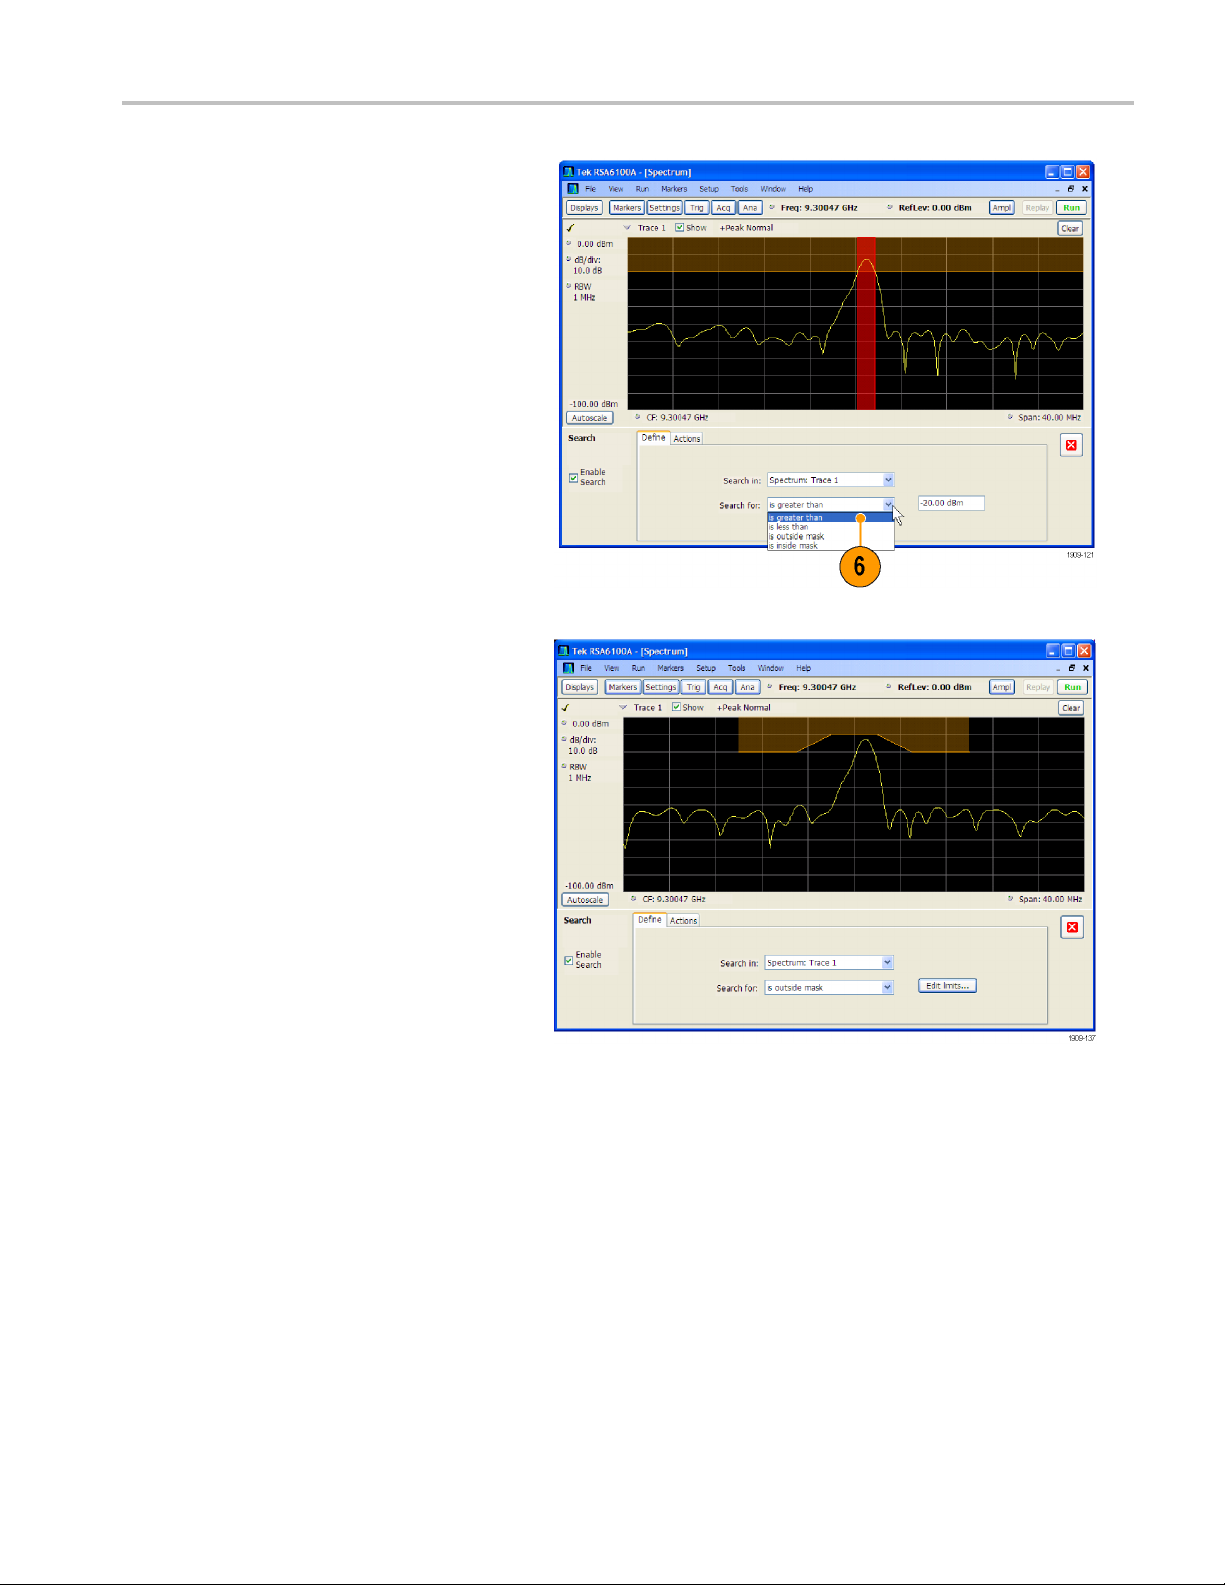
6. Specify what to search for by making a
selection from the Search for drop-down
list.
To search for signal levels above or
below a specified level, select either is
greater than
or is less than.
To search for signal levels that vary with
frequency, select either is outside mask
or is inside m
ask. To specify the limits
in the search mask, click the Edit limits
button.
The orange s
haded area in the graph
display shows the levels which, if
occupied by the signal, will constitute a
match.
Operation
Display wi
Display with outside mask search selected
th greater than search selected
RSA6100A S eries Quick Start User Manual 51
Page 68

Operation
7. Click the Actions tab to specify what
actions the spectrum analyzer should
takewhenamat
The spectrum analyzer can take up
to five actions when a match occurs,
depending on
mode, the spectrum analyzer can
sound a beep, stop acquisitions, save
acquisition
save a picture of the display. In Replay
mode, it can sound a beep and stop
analyzing.
ch occurs.
the run mode. In Run
data, save trace data, and
8. To have the
action when a match occurs, select the
desired action.
You can s el
actions to perform on a match. If you
select all actions, they will all occur when
amatchis
9. Click the
control panel.
10. Press th
Red lines appear in the graph display
when there is a match on incoming data.
Click th
to initiate a search on the current data
record.
spectrum analyzer take an
ect any combination of
found (in Run mode).
close box to remove the Search
e Run button to initiate a search.
e Replay button on the toolbar
52 RSA6100A Series Quick Start User Manual
Page 69

Using Correction Tables
The RSA6100A Real-Time Spectrum Analyzer lets you correct the signal displays and measurement results to account
for gains and losses in external equipment. You can specify a single gain value or you can use an external loss table to
adjust the gain/loss value based on frequency.
To specify external gain/loss corrections:
1. Press the Ampl button to display the
Amplitude control panel.
2. Select the External Gain/Loss Correction
tab.
Operation
3. To apply
select the External Gain value check
box. Enter a value into the text entry box.
NOTE. Y
negative gain values. Positive v alues
represent a gain. Negative values represent
aloss
4. To u s e
values depending on frequency, click a
check box under External Loss Tables.
You c
tables at the same time. Thus, you could
use different external loss tables for an
ante
5. To e
table, click the Edit button for the table
you want to edit.
a constant correction factor,
ou can enter either positive or
.
a table that corrects for gain/loss
an enable all three external loss
nna, a preamplifier, and for cabling.
dit the contents of an external loss
RSA6100A S eries Quick Start User Manual 53
Page 70
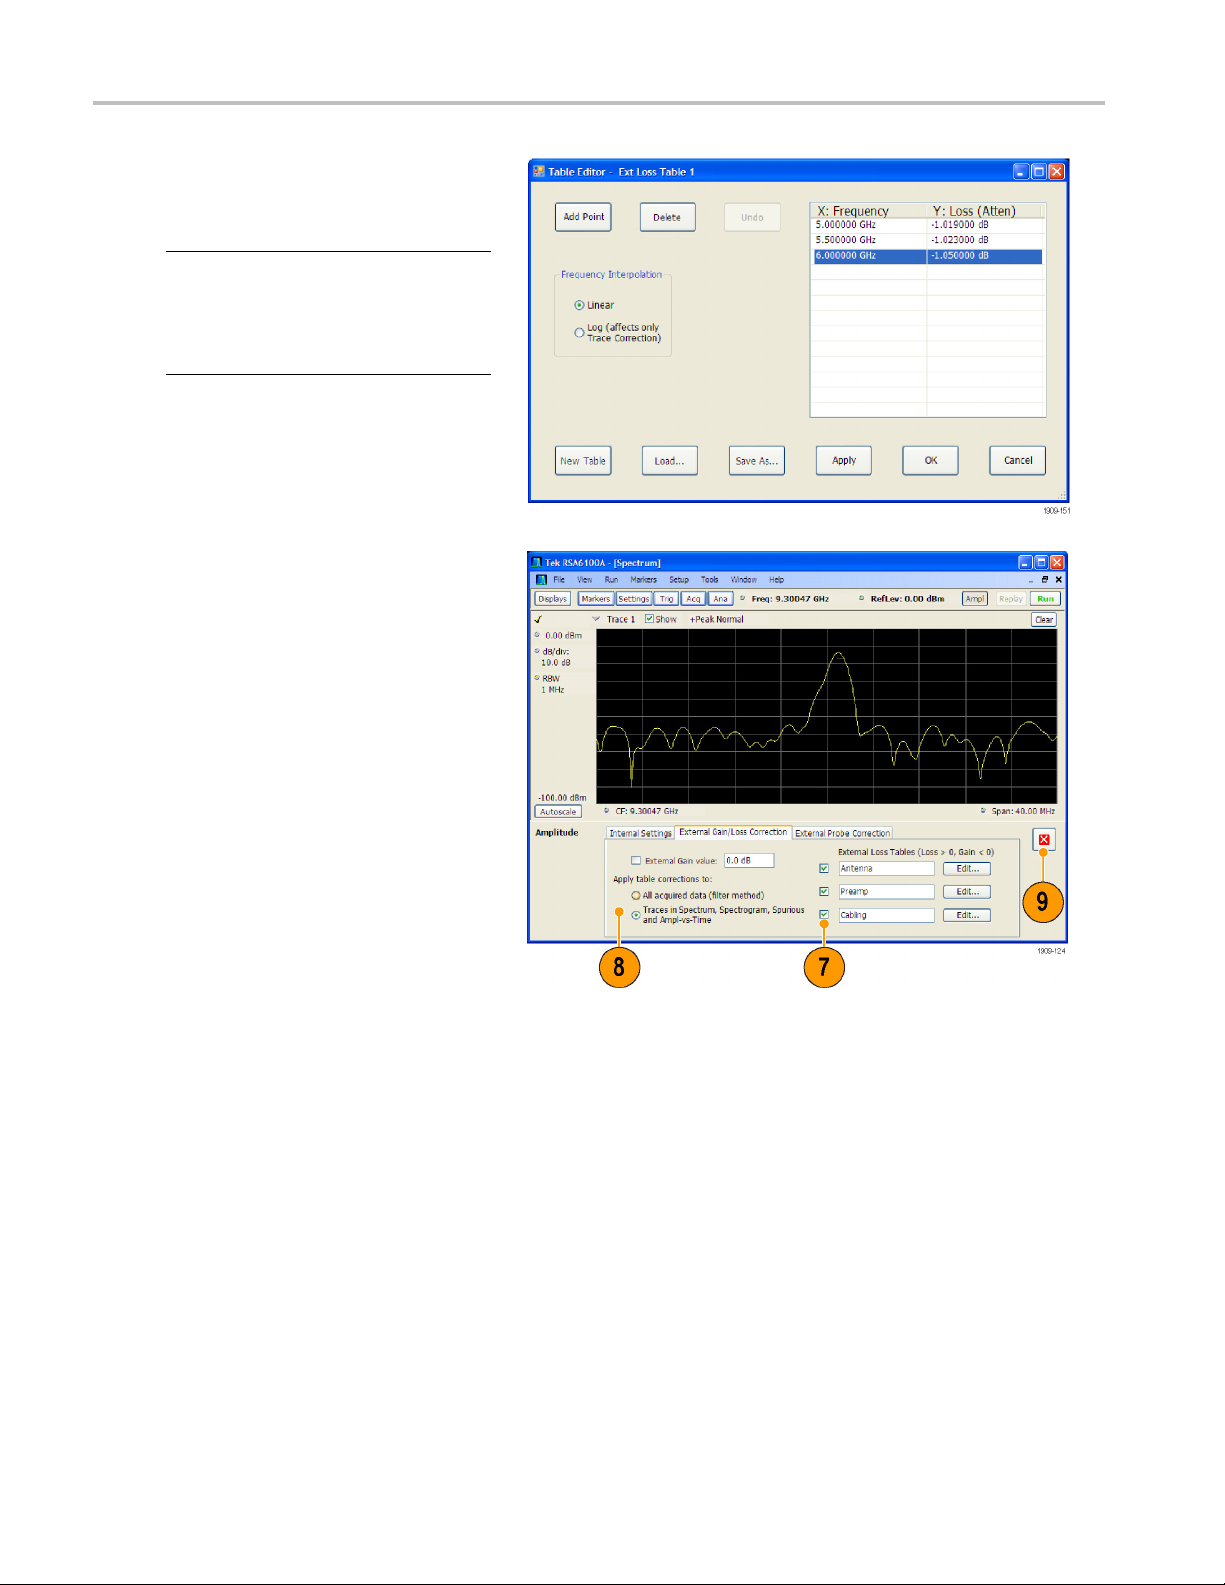
Operation
6. Edit the contents of the table to match
the loss characteristics of the equipment
you are correc
you are finished.
NOTE. You can enter either positive or
negative val
to the External Gain value setting, positive
values represent a loss and negative values
represent a g
For detailed information on using the Table
Editor, select Help > User Manual and look
in the Inde
7. You can change the title for each external
loss table. S e lect the title box and type
in a new title.
Note that the title is only a label. It is
not tied to the file name of any table you
have loaded or saved.
ting for. Click OK when
ues into the table. But in contrast
ain.
xforExternal Loss Tables.
8. Specify whether table corrections are
applied to all acquired data or only to
traces in the Spectrum, Spectrogram,
Spurious and Amplitude vs Time
displays.
54 RSA6100A Series Quick Start User Manual
Page 71

Operation
When choosing w
sample data or traces, keep the following
in mind:
If sample data is acquired while
data correcti
record is permanently corrected. If the
acquisition is saved and recalled, the
recalled acq
Corrections are not saved separately
from the raw data; they are used during
the acquisi
values.
Trace corrections can be applied
at any time, as they are part of the
measureme
Replay will apply trace corrections to
a trace if this control is enabled (and
an externa
enabled).
Be aware that if you recall acquisition
data that was saved with data corrections
and you us
corrections selected and an external
loss table enabled, the trace will be
ted using corrected data and also
calcula
corrected with trace corrections. This
usually creates incorrect traces.
hether to correct
on is enabled, that data
uisition includes corrections.
tion process to adjust the data
nt’s computations. Using
l loss table is specified and
e Replay with trace
9. Click the close box to remove the
ude control panel when you are
Amplit
finished making changes.
RSA6100A S eries Quick Start User Manual 55
Page 72

Operation
Using Audio Demodulation
The RSA6100A Real-Time Spectrum Analyzer can demodulate audio signals which can help you to identify unknown radio
signals. You access the Audio Demod tab from the Settings control panel of the DPX Spectrum display.
To demodulate an audio signal:
1. Press the Displays button to display the
Select Displays dialog box.
2. Select the General Signal Viewing
folder.
3. Double-click the DPX Spectrum icon to
add it to the Selected Displays list.
4. Click OK to close the dialog box. The
DPX Spectrum display will open.
5. Press the Settings front-panel button
to display the DPX Spectrum Settings
panel.
control
6. Click t
he Audio Dem od tab to d isplay
the Audio Demod control panel.
56 RSA6100A Series Quick Start User Manual
Page 73

7. Click the On button to enable audio
demodulation.
8. To specify the demodulation type, click
either the AM o
NOTE. Note that the AM and FM buttons
select only the demodulation type; they do
not specify a
9. Set the center frequency as needed.
The receiver frequency (frequency to
be demodulated) is specified with either
markers or
front panel Frequency button or the Freq
control in the toolbar). Use the Tune with
setting t
frequency control is used to s pecify the
receiver frequency.
10. Select either a marker or frequency
control
list.
r FM button.
frequency band.
the frequency control (the
o s pecify w hether markers or the
from the Tune wi th drop-down
Operation
11. If the marker you select is not enabled
(it will be visible in the display if it is
d), click the Markers button in the
enable
toolbar to display the Markers toolbar.
RSA6100A S eries Quick Start User Manual 57
Page 74

Operation
12. Click the Define button in the Marker
toolbar to display the Define Markers
control panel
.
13. Click Add to ad
d markers as needed.
14. Click the Settings button to return to the
Audio Demod
control panel.
15. Set the required receiver bandwidth by
entering a value into the Receiver BW
value entry box.
58 RSA6100A Series Quick Start User Manual
Page 75
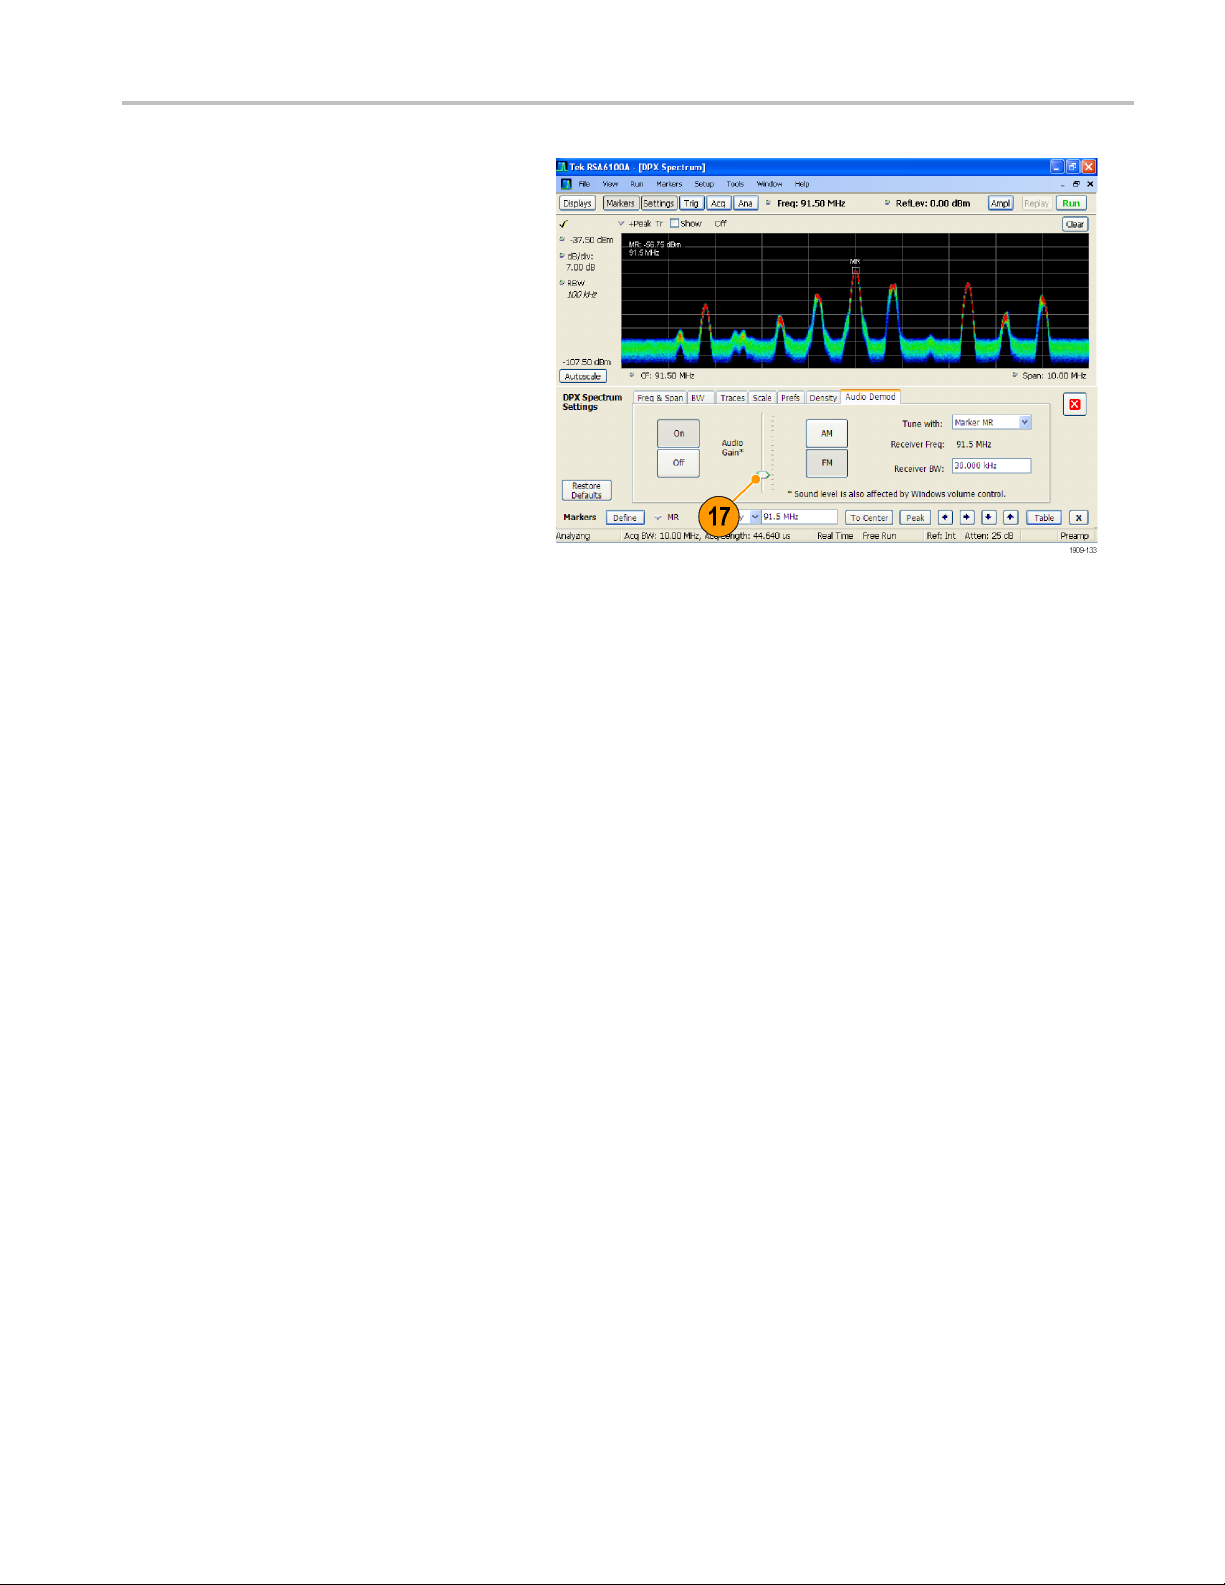
16. Set the receiver frequency.
If you specifiedamarkerwiththeTune
with setting,
required frequency. Fine tune the marker
position with the front-panel knob or
your mouse wh
Frequency contr ol in the Tune w ith
setting, press the front-panel FREQ
button, then
use the Freq setting in the toolbar to set
the required frequency.
The receive
Receiver Freq between the Tune with
and Receiver BW settings.
17. Adjust the Audio Gain setting so you can
hear the de
the sound level is also affected by the
setting of the Windows volume control.
drag the marker to the
eel. If you selected
turn the front-panel knob or
r frequency is displayed as
modulated signal. Note that
Operation
RSA6100A S eries Quick Start User Manual 59
Page 76

Operation
60 RSA6100A Series Quick Start User Manual
Page 77

Index
Index
A
Accessories
documents, 1
optional, 2
power cords,
standard, 1
Acquisition
conflicts, 4
controlling, 46
data source, 22
starting,
stopping, 30
Analysis window, 21, 23
Applicati
audio demodulation, 56
on presets, 25
2
7
30
C
CF Pan
Touchscr
check mark indicator, 19, 46
Cleaning procedures, 11
Conflict
measurement, 47
Connectors
front p
rear panel, 17
RF signal input, 29, 30
Contro
Controls
display-specific, 20
front
interface, 18
Cooling clearances, 3
ction tables, 53
corre
een actions menu, 34
s
anel, 16
lling acquisitions, 46
panel, 13
Display properties
changing, 9
Display sett
Displays
Documenta
ings
changing, 27
general sign
GP digital modulation, 23
printing, 36
Pulsed RF, 2
RF measurement, 23
selecting, 24
Tektronix part numbers, 1
al viewing, 23
3
tion, viii
E
Environmental specifications, 3
,3
altitude
cooling clearances, 3
humidity, 3
tempera
Extended desktop, 6
external gain/loss correction, 53
Externa
ture, 3
l monitor, 6
F
Features, viii
File types, 38
un trigger mode, 40
Free R
Frequency mask
Mask Editor, 44
ering, 40
trigg
Front panel
connectors, 16
rols, 13
cont
Input requirements
frequency range, 29
input impeda
power, 29
RF signal range, 29
voltage, 29
Installation, 1
network connections, 4
Italicized
numbers, 20
K
Key features, viii
M
Maintenance
cleaning
repackaging, 11
Marker toolbar, 33
Markers
absolute, 32
adding, 33
defining
delta, 32
DPX bitmap trace, 32
shapes
Mask Editor
adding points, 44
editi
Measurement
conflicts, 47
Mecha
Messages
on-screen, 26
MR, 3
procedures, 11
,31
,34
,32
ng points, 45
nical specifications, 3
2
nce, 29
D
Data
recalling, 39
ing, 38
sav
Default settings, 28
Diagnostics, 10
ital demodulation displays, 23
Dig
Display
conflicts, 47
RSA6100A S eries Quick Start User Manual 61
G
General signal viewing displays, 23
Graphics driver, 9
I
coming inspection, 10
In
Information messages, 26
Ink saver mode, 36
N
Network connections, 4
O
Optional accessories, 2
tions, 3
Op
Power cords, 2
Page 78

Index
P
Pan
Touchscreen actions menu, 34
Part numbers,
Power cord options, 2
Power level triggering, 40
Power supply
Preset, 28
selecting displays, 25
system setti
Printing, 36
ink saver mode, 36
Product fea
Pulsed RF displays, 23
manuals, 1
,3
ngs, 28
tures, viii
R
Real-Time spectrum analyzer, 21
Rear panel
Recalling data, 39
Repackaging, 11
Reset sca
Returning the instrument, 11
RF measur
RF signal connections, 29, 30
RF signal input range, 29
Run cont
Run menu, 30
connectors, 17
le
Touchscreen actions menu, 34
ement displays, 23
rol, 30
S
Safety Summary, iii
Save op
Saving data, 38
Screens, printing, 36
Searc
tions, 38
h, 50
Select
Touchscreen ac
Selected window, 46
Selecting displays, 24
Settings
changing, 27
default, 28
preset, 28
Setups
recalling, 39
saving, 38
Software upgrades, ix
installing, 11
Span Zoom
Touchscreen actions menu, 34
Specifications
altitude,
cooling clearances, 3
environmental, 3
humidity,
input requirements, 29
mechanical, 3
power sup
product dimensions, 3
temperature, 3
m analyzer
Spectru
real-time concepts, 21
Standard accessories, 1
documen
power cord, 2
Starting acquisitions, 30
ng acquisitions, 30
Stoppi
tions menu, 34
3
3
ply, 3
ts, 1
T
touchscreen actions menu, 34
Trace legend, 27
Trigger
control panel,
mask, 44
violations, 46
Trigger Event
accessing, 42
Triggered trigger mode, 40
Triggering
free run, 40
frequency mask, 40
parameters,
power level, 40
triggered, 40
42
parameters, 41
41
U
Upgrades
software, ix, 11
V
Violations
trigger m
ask, 46
W
Window
analysis, 21
ed, 46
select
Z
Zoom
Touchscreen actions menu, 34
62 RSA6100A Series Quick Start User Manual
 Loading...