

Page 1

Picture Quality Analysis System
PQA600 Data Sheet
Applications
Features & Benefits
Fast,Accurate,Repeatable,and ObjectivePicture Quality Measurement
Predicts DMOS(Differential Mean Opinion Score) based on Human
VisionSystem Model
Picture QualityMeasurements can bemade on aVarietyof HD Video
Formats ( 1080i, 720p) andSD VideoFormats (525ior 625i)
Makes PictureQuality Comparison acrossDifferent Resolutions fro m
HD toSD, or SD/HDto CIF
User-configurable ViewingCondition andDisplay Modelsfor Reference
and Comparison
Attention/Artifact WeightedMeasurement
RegionOf Interest (ROI) on MeasurementExecution andReview
Automatic Temporal andSpatial Alignment
Easy Regression Testing and Automation using XML Scriptingwith
"Export/Import" Filefrom GUI
Multiple Results View Options
Optional SD/HDSDI Interfacewith Simultaneous Generation/Capture,
2-channel Capture and 2-channel Gene ration with Swap-channel
Capability
Preinstalled Sample Reference andTestSequences
CODEC Design
Conformance Testing,Transmission Equipme nt, and System Evaluation
Digital VideoMastering
Video CompressionServices
DigitalConsumer Product Developmentand Manufacturing
, Optimization,and Verification
Picture Quality Analysis System
The PQA600is the latest-generation Picture QualityAnalyzer built onthe
EmmyAward winningTektronixPQA200/300. Basedonthe conceptsof the
human vision system, thePQA600 providesa suiteof repeatable,objective
quality mea
visual assessment. These measurements provide valuable info rmation
to engineersworking to optimize videocompression and recovery,and
maintaining a level ofcommon carrierand distributiontransmission service
to clientsand viewers.
Compressed Video Requires New Test Methods
The truemeasure of anytelevision system isviewer satisfaction. While
the qualityof analog andfull-bandwidth digital videocan becharacterized
indirectly bymeasuring the distortionsof static testsignals, compressed
television systemspose afar more difficultchallenge. Picturequality in a
compressed systemcan change dynamicallybased on acombination of
data rate
staticnature of te st signals doesnot providetrue characterizationof picture
quality.
Human viewertesting has been traditionallyconducted as described in
ITU-R Rec. BT.500-11. Atest scene with natural content and motion
is displayed ina tightly controlled environment, with human viewers
expressing theiropinion of picture quality to create a DifferentialMean
Opinion Score, orDMOS. Extensive testing using this method can be
refined to
evaluatingthe capabilities of a compressed video system canbe inefficient,
taking severalwee ks to months to perform the experiments. This test
methodology can be extremelyexpensive tocomplete, andoften theresults
are notrepeatable. Thus, subjectiveDMOS testing withhuman viewers
is impracticalfor the CODEC designphase, and inefficient forongoing
operati
repeatable, andobjective measurement alternative to subjective DMOS
evaluation ofpicture quality.
surements that closelycorrespond with subjective human
, picturecomplexity,and the encodingalgorithm employed. The
yield aconsistent subjective rating. However, this method of
onal qualityevaluation. The PQA600 provides afast, practical,
Page 2
Data Sheet
UserInterface of PQA600. Showing reference, testsequences, with differencemap and
statisticalgraph.
System Eva
luation
The PQA600 can beused for installation, verification, andtroublesh ooting
ofeach blo
ckof the videosystem becauseit isvideo technology agnostic:
any visibledifferences between videoinput and output fromprocessing
componentsin the systemchain canbe quantifiedand assessedfor video
quality degradation. Not only canCODEC technologies beassessed in a
system, butany process that has potentialfor visible differencescan also
be assessed. Forexample, digital transmissionerrors, format co nversion
0i to480p in set-top box conversions), 3-2pull-down, analog
(i.e. 108
transmission degradation, da ta errors, slowdisplay responsetimes, frame
rate reduction(for mobile transmissionand videophone teleconferencing),
andmore can allbe evaluated,separately orin anycombination.
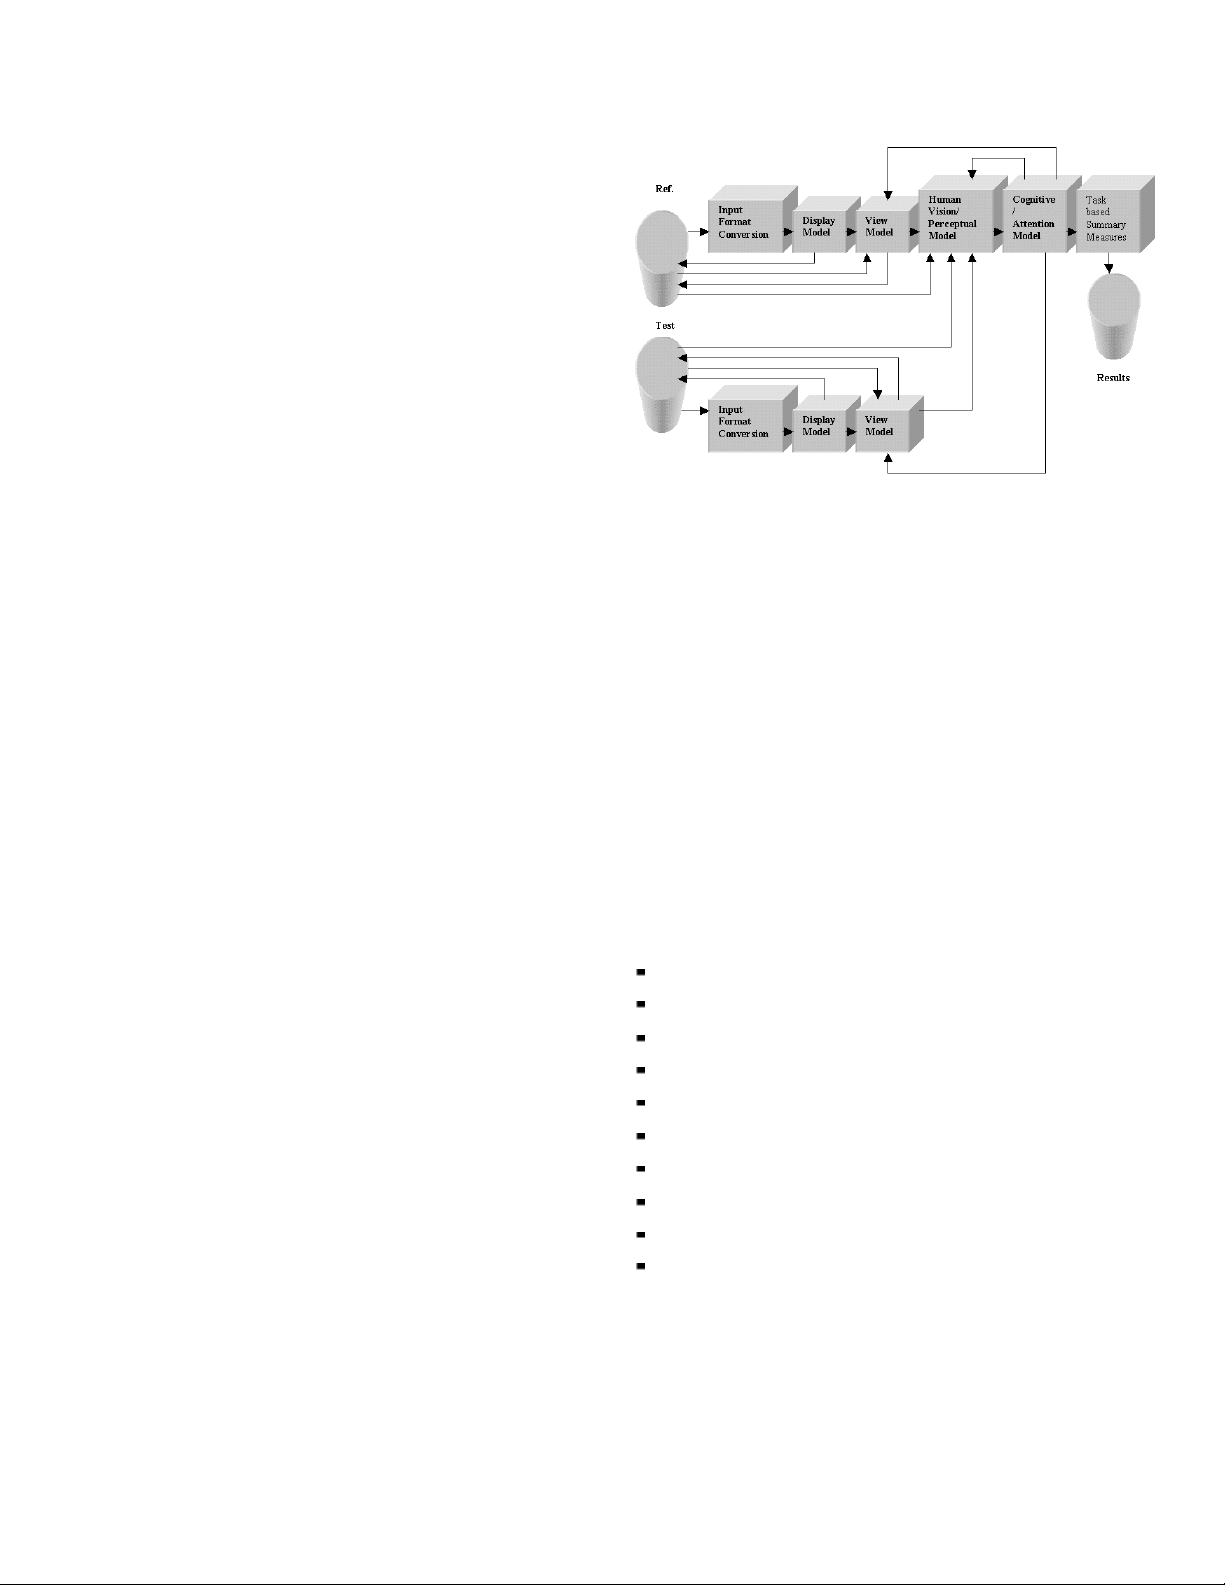
How It Works
The P QA600 takes twovideo files asinputs: areference videosequence
and a compressed, impaired,or processed versionof thereference. First,
the PQA600performs a spatialand temporal alignmentbetween the two
sequences, withoutthe need fora calibration stripeembedded within the
quence. Then the PQA600 analyzes the qualityof the testvideo,
videose
using measurementsbased on the humanvision system and attention
models, an d then outputsquality measurements thatare highlycorrelated
with subjectiveassessments. Theresults include overallquality summary
metrics,frame-by-frame measurement metrics,and animpairment map for
eachframe. ThePQA600 alsoprovides traditionalpicture qualitymeasures
such asP
SNR (PeakSignal-to-Noise Ratio) as anindustry benchmark
impairment diagnosistool for measuring typicalvideo impairments and
detecting artifacts.
Eachreference video sequenceand testclip canhave different resolution s
and framerates. The PQA600 can provide picturequality measurement
betweenHD vs SD, SD vsCIF,or anycombination. Thiscapability sup ports
Picture Quality Analysis System
a varietyof repurposing applications such as format conversion, DVD
authoring, IPbroadcasting, and semiconductordesign. ThePQA600 can
also supportmeasurement clips withlong sequence duration,allowing a
video clipto be quantified for picture quality throughvarious conversion
processes.
Prediction of Human Vision Perception
PQA600 measurementsare developed from thehuman vision system
model andadditional algorithms have beenadded to improve uponthe
model usedin the PQA200/300. Thisnew extended technology allows
legacy PQR measurements forSD whileenabling predictions ofsubjective
quality ratingof video for a varietyof video formats(HD, SD, CIF, etc.). It
takes into consideration different display typesused to view the video(for
example, interlacedor progressiveand CRTor LCD) anddifferent viewing
conditions (for example, roomlighting and viewin g distance).
A modelof the human visionsystem has beendeveloped to predict the
response tolight stimuluswith respectto thefollowing parameters:
Contrast includingSupra-threshold
Mean Luminance
Spatial Frequency
Temporal Frequency
Angular Extent
Temporal Extent
Surround
Eccentricity
Orientation
Adaptation Effects
2 www.tektronix.com
Page 3

A: Modulation Sensitivity vs. TemporalFrequency
Picture Quality Analysis System— PQA600
C: Reference Picture
B: Modulation Sensitivity vs. SpatialFrequency
This modelhas been calibrated, over theappropriate combinations of
s for these parameters, with reference stimulus-response data from
range
visionscience research. As aresult ofthis calibration,the modelprovides a
highly accurateprediction.
ptual Contrast Map
D:Perce
The graphsabove areexam ples of scientificdata regarding humanvision
characteristics usedto calibrate the humanvision system model in the
PQA600. Graph (A) showsmodulation sensitivity vs. temporal frequency,
and graph (B ) shows modulation sensitivity vs. spatial frequency. The
over 1400calibration pointssupports high-accuracy measurement
use of
results.
re (C)is a single frame fro m the reference sequence ofa moving
Pictu
sequence, andpicture (D)is theperceptual contrast mapcalculated bythe
PQA600. The perceptualcontrast mapshows howthe viewerperceives the
reference s equence. The blurringon thebackground iscaused by temporal
masking due to camera panning and theblack area around the jogger
showsthe masking effectdue to the highcontrast betweenthe background
ejogger. The PQA600creates the perceptualmap forboth reference
andth
and testsequences, then createsa perceptual differencemap for usein
making percep tually based, full-referencepicture quality measurements.
www.tektronix.com 3
Page 4

Data Sheet
E: Reference
F:Test
Comparison of Predicted DMOS with PSNR
In theexample above, Reference (E)is a scenefrom oneof the VClips
libraryfiles. Theimage Test (F),has been passedthrough a compression
system which has degraded the resultant image. In this case the
background ofthe joggerin Test (F) is blurred comparedto the Reference
image (E). A PSNR measurement ismade onthe PQA600of thedifference
en the Reference and Testclip and the highlighted whiteareas
betwe
of PSNR Map (G) shows the areasof greatest difference betweenthe
original and deg raded image. Anothermeasurement is then made bythe
PQA600, thistime usingthe Predicted DMOSalgorithm and theresultant
Perceptual D ifference Map forDMOS (H) imageis shown. Whiter regions
G: PSNR Map
ptual Difference Map forDMOS
H:Perce
in thisPerceptual Contrast Difference mapindicate greater perceptual
contrast differencesbetween the referenceand test images. In creating
the Perceptual Contrast Differencemap, thePQA600 usesa human vision
system model to determinethe differencesa viewer wouldperceive when
ing the video.
watch
The Predicted DMOS measurement uses the Perceptual Contrast
rence Map(H) to measure picture quality. ThisDMOS measurement
Diffe
wouldcorrectly recognize theviewers perceivethe joggeras lessdegraded
than the treesin the background. The PSNR measurement uses the
differencemap (G) andwould incorrectly includedifferences that viewers
do not see.
4 www.tektronix.com
Page 5

AttentionMap Example: The joggeris highlighted
Attention Model
ThePQA600 alsoincorporates an AttentionModel thatpredicts focusof
attention. Thismodel considers:
Motion of Objects
Skin Coloration(to identify people)
Location
Contrast
Shape
Size
ViewerDistraction due toNoticeable Quality Artifacts
These attention parameters canbe customized to give greateror less
importanceto each characteristic. Thisallows each measurementusing an
on modelto beuser-configurable. Themodel is especiallyuseful to
attenti
evaluatethe video process tuned tothe specificapplication. For example, if
the content issports programming, theviewer is expected to have higher
attentionin limited reg ional areas of the scene. Highlightedareas within th e
attention imagemap will showthe areas of th e image drawing theeye’s
attention.
Artifact Detection
Artifact Detection reports avariety of differentchanges tothe edges of the
image:
Loss ofEdges or Blurring
Addition ofEdges orRinging/Mosquito Noise
Rotationof Edges to Verticaland Horizontalor EdgeBlockiness
Loss of Edges withinan Image Block or DCBlockiness
They work as weighting parameters for subjective and objective
measurements with any combination. The resultsof these different
rement combinationscan help toimprove picture qualitythrough
measu
the system.
Picture Quality Analysis System— PQA600
ArtifactDetection Settings
For example,artifact detection canhelp answer questionssuch as: “Will
theDMOSbeimprovedwithmorede-blockingfiltering?” or, “Should less
prefiltering be used ?”
If edge-blockingweighted DMOS ismuch greater thanblurring-weighted
DMOS, theedge-b loc king isthe dominant artifact, and perhaps more
de-blocking filteringshould be considered.
In someapplications, itma y be knownthat added edges,such as ringing
and m osquito noise, aremore objectionablethan the otherartifacts. These
weightingscan becustomized bythe userand configured forthe application
toreflectthis viewerpreference, thus improvingDMOS prediction.
Likewise, PSNRcan be measured with these artifact w
determine howmuch of theerror contributing tothe PSNR m easurement
comes from each artifact.
The Att ention Model andArtifact Detectioncan also be used inconjunction
with anycombination of picture quality measurements. This allows,for
le, e valuation of howmuch of aparticular noticeable artifactwill be
examp
seen wherea viewer ismost likely tolook.
eightings to
www.tektronix.com 5
Page 6

Data Sheet
Configure Measure Dialog
Comprehensive Picture Quality Analysis
The P QA600 provides FullReference (FR) picturequality measurements
that comparethe luminance signal ofreference and test videos. It also
ome NoReference (NR) measurementson theluminance signal of
offerss
thetest video only. ReducedReference (RR)measurements canbe made
manually fromdifferences in NoReference measurements. Thesuite of
measurements includes:
Critical Viewing (Human VisionSystem Model-based, FullReference)
Picture Quality
Casual Viewing (Attention Weighted,Full Reference,or No Reference)
Picture Quality
Peak Signal-to-Noise Ratio (PSNR,Full Reference)
Focus ofAttention (Applied toboth Full Referenceand No Reference
Measurements)
ArtifactDetection (Full Reference, except forDC Blockiness)
DC Blockiness(Full Referenceand No Reference)
Edit Measure Dialog
The PQA600 supports these measurements through preset and
user-defined combinations ofdisplay type, viewing conditions, human
vision response(demographic), focus ofattention, and artifactdetection,
in additionto the defaultITU BT-500conditions. The abilityto configure
measurement conditions helps CODEC designers evaluate design
trade-offs as they optimize for different applications, and helps any
user investigate h ow different viewing conditions affectpicture quality
measurement results. Auser-defined measurementis createdby modifying
apreconfigured measurementor creating a new one,then saving and
recalling theuser-defined measurementfrom theConfig ure Measure dialog
menu.
Easy-to-Use Interface
The PQA600 has two modes: Measurement and Review. The
urement modeis used toexecute the measurementselected in the
Meas
Configure Dialog. During measurementexecution, the summarydata and
map resultsare displayed on-screenand saved tothe system harddisk.
The R eview mode isused to viewpreviously saved summaryresults and
maps creat ed either withthe measurement modeor XML scriptexecution.
The user can choosemultiple results in this modeand compare each
ltside by sideusing thesynchronous displayin Tilemode. Comparing
resu
multiple resultsmaps made with the differentCODEC parameters and/or
differentmeasurement configurations enableseasy investigationof theroot
cause ofany difference.
6 www.tektronix.com
Page 7

Integrated Graph
Picture Quality Analysis System— PQA600
Overlay display,Reference and Map
Six-tiled display
Multiple Result Display
Resultantmaps can be displayed synchronouslywith thereference andtest
video in a Summary,Six-tiled, orOverlaid display.
In Summarydisplay, the user can seethe multiple measurementgraphs
with abarchart along withthe reference video,test video, anddifference
map during videoplayback. Summarymeasures of st andard parameters
erceptual summation metrics for each frame and overall video
and p
sequence areprovided.
x-tiled display, theuser candisplay the2 measurement resultsside by
InSi
side. Each consists of a referencevideo, testvideo, and differencemap to
compare toeach other.
Autospatial alignment execution with spatialregion of interestselected
In Overlay display,the usercan control themixing ratio with the faderbar,
enabling co-locationof differencemap, reference, andimpairments intest
videos.
Error log ging and alarmsare available tohelp users efficiently trackdown
the causeof video quality problems.
Allresults, data,and graphscan berecalled tothe displayfor examination.
Automatic Temporal/Spatial Alignment
The PQA600supports automatic temporaland spatial alignmen t, as well
as manualalignm ent.
The automaticspatial alignment withspatial regionof interest inMeasure
modeselected independently ofthe spatialalignment functioncan measure
the cropping, scale,and shift in eachdimension, even across different
utionsand aspect ratios(for example,when aligning SD to HDvideo).
resol
Ifextra blanking ispresent withinthe standardactive region, itis measured
as croppingwhen this functionis enabled.
The automatic spatial andtemporal alignment allows picture quality
measurement betweenreference and testvideos of differentresolutions
and frame rates.
www.tektronix.com 7
Page 8

Data Sheet
SpatialROI on Reviewmode forin-depth investigation
Import/ExportScript in Configure MeasureDialog
Script Sample
Region of Interest
Onthe Re
viewmode, the PQA600allows usersto set thetemporal/spatial
Region OfInterest (ROI) area for detailedanalysis. Spatial ROI inthe
Review modeis instantly selectedby mouse operation and givesa score
just forthe selected spatial area. It’s an effectiveway to investigate the
specific spatial region in thedifference map showingcertain impairments.
Temporal ROIin theReview modeis setby marker operationon thegraph.
alROI allowsusers toget aresult fora scenewhen thevideo stream
Tempor
has multiplescenes. Temporal ROIalso allows usersto provide aresult
withoutthe influence frominitial transientsin thehuman visionmodel.
AutomatedTestingwithXMLScripting
In theCODEC debugging/optimizing process,the designer may wantto
repeat several measurement routinesas CODEC parameters a re revised.
Result File Sample
Automatedregression testingusing XMLscripting can ease therestrictions
of manualoperation by allowingthe userto write aseries ofmeasurement
sequences withinan XML script. The script filecanbeexportedfromor
importedto the measurementconfiguration menu tocreate andmanage the
scriptfiles easily. Measurementresults ofthe scriptoperation canbe viewed
g either the PQA600 userinterface or anyspreadsheet application
by usin
thatcan read thecreated .csvfile formatas asummary. Multiple scriptscan
be executed simultaneously forfaster measurement resu lts.
8 www.tektronix.com
Page 9

Picture Quality Analysis System— PQA600
Generation
/Capture
Optional SD/HD SDI Interface
An optionalSD/HD SDI interface en ables both generation and capture of
SDI video with threemodes of simultaneousoperation.
Simultaneous generationand capture letsthe user playoutthe reference
video clips directly from thePQA600 into the device under test. The
test outputfrom the devicecan then be simultaneouslycaptured by the
PQA600. This saves the user fromhaving touse an externalvideo source
to apply any required video input to the device under test. With this
generatio
ncapability, filescreated byvideo editingsoftware can bedirectly
usedas referenceand testsequences for picture qualityme asureme nts.
Simultan
eous2-channel capture lets theuser capturetwo livesignals touse
asreference andtest videosin evaluatingthe deviceunder testin operation.
To accomm
odate equipmentprocessing delay thatmay be present in the
system, theuser can usethe Delay Startfunction when capturingvideo.
Using D elayed Start minimizesthe number ofunused overheadframes in
the testfile and enablesfaster execution of the auto temporal alignment
in themeasurement.
Simultaneous 2-channel generation capabilitysupports two types of
subjectivetesting. Withtwo displays,the usercan check the reference and
test videocontent on side-by-side monitors.
2-channel Generation
2-channel Capture
With one display and swap-channel capability,the user can che ck the
reference and test videocontent withoutmoving theeye’s focuspoint.
www.tektronix.com 9
Page 10

Data Sheet
Supported File Formats for SD/HD SDI Interface
The SD/HDSDI video option can generateSDI video from files inthe
following formats (8 bit unlessotherwise stated):
.yuv (UYVY,YU
Y2)
.v210(10 bit,UYVY,3 componentsin 32 bits)
.rgb (BGR24)
.avi (uncomp
ressed, BGR32(discard alphachannel) / BGR24/ UYVY
/YUY2/v210)
.vcap (creat
ed byPQA600 video capture)
.vcap10 (10bit, createdby PQA600 videocapture)
Option Supported Frame
SD-SDI
HD-SDI
Geometry
720×486, 720×576
1280×720,1920×1080
Formats Supported
by SD/HD SDI
Interface
525i/59.94, 625i/50
720p/50, 720p/59.94,
720p/60
1080i/50, 1080i/59.94,
1080i/60
1080p/23.98,
1080p/23.98SF,1080p/24,
1080p/24SF, 1080p/25,
1080p/29.97,1080p/30
Supported File Formats for Measurement
All format s support 8bit unless otherwisestated, and measurementsuse
8MSBs:
.yuv (UYVY, YUY2, YUV4:4:4, YUV4:2:0_planar)
.v210(10 bit,UYVY,3 componentsin 32 bits)
.rgb (BGR24, GBR24 )
.avi (un c ompressed , BGR32 (discardalpha channel) /BGR24 / UYVY
/ YUY2 / v210)
ARIBITE format (4:2:0planar with3 separatefiles (.yyy,.bbb, .rrr))
.vcap (createdby PQA600 videocapture)
.vcap10 (10 bit, createdby PQA600 videocapture)
Preinstall
Sequence
Vclips
PQA300
without Trigger
PQA300 with
Trigger
ed Video Sequences
Resolution Formats
1920×1088 YUV4:2:0planar V031202_Eigth_Ave,
1920×1080 UYVY
1280×720 UYVY, YUV4:2:0
864×486 YUV4:2:0planar
0
320×18
720×486 UYVY Ferris, Flower, Tennis,
720×576 UYVY
720×486 UYVY
720×576 UYVY
planar
YUV4:2
:0 planar
V031255_TimeSquare,
V031251_Stripy_jogger
V031251_Stripy_jogger
V031002_Eigth_Ave,
V031055_TimeSquare,
V031051_Stripy_jogger
with 3/10/26 Mb/s
Converted
V031051_Stripy_jogger
with 2/4/7 Mb/s
Converted
V031051_Stripy_jogger
with1000/1780/2850Kb/s
Cheerwith 2Mb/s_25 fps
Auto, BBC, Ski,Soccer
Mobile with 3/6/9Mb/s
Mobile with 3/6/9Mb/s
Clips
10 www.tektronix.com
Page 11

Picture Quality Analysis System— PQA600
Related Products
Recent updatesand more detailsare availablein eachdata sheet.
Video Stream Analysis
MTS4EA Elementary Stream Analysis
Software for VC-1, H.264/AVC, MPEG-2,
MPEG-4, H.263, and 3GPP Standards
Features & Benefits
Next Generation (VC-1, H.264/AVC, MPEG-4, and3GPP) and Legacy
(MPEG-2 andH.263) CODEC Support
Frame-by-Frame andBlock-by-Block Analysis toallow Easy CODEC
Comparison
Easy-to-Int
Microsoft
Comprehensive Semantic Trace File Output to Determine
Block-by-Block EncoderDecision Making
AVDelay Measurement (Option)
Audio Decodeand Analysis (Option)
Synchronized Audioand Video Analysis
Real-Timeand Non-Real-Time Decoding and Analysisof Compressed
Video Stre
Bit Stream
Batch Mod
YUV Decod
Quality Analysis
Extractionof Elementary Streamfrom TransportStream
Availableas Single-userLocalLicense forPC and TektronixInstruments
or Server-basedFloating License
erpret DetailedGraphical Displays ( Requires User-installed
®
Excel)
ams (Dep endant on PC Performance)
Editing
etoallowAutomatedTesting
ed VideoOutput forBaseband Video Analysis and Picture
www.tektronix.com 11
Page 12

Data Sheet
Characteristics
Preconfigured
Measurement
Class
View Video with
Measurement Set
Measurement
Name
Display Model View Model
"000View Video" NA NA NA NA NA NA NA
NoMeasurement
Subjective
Noticeable Differen ces
SD Displayand
Viewing
HD Displayand
Viewing
CIF Display and
Viewing
D-CINEMA
Projector and
Prediction: Full Reference
"001 SD
SD Broadcast
BroadcastPQR"
"002 HD
HD Broadcast
BroadcastPQR"
"003 CIF and
CIF/QVGA LCD
QVGA PQR"
"004 D-CINEMA
DMD Projector 3 scrn heights,
PQR"
CRT
CRT
Viewing
Subjective Rating Predictions
SD Displayand
Viewing
"005 SD
Broadcast
SD Broadcast
CRT
DMOS"
HD Displayand
Viewing
"006 HD
Broadcast
HD Broadcast
CRT
DMOS"
CIF Display and
Viewing
D-CINEMA
Projector and
"007 CIF and
QVGA DMOS"
"008 D-CINEMA
DMOS"
CIF/QVGA LCD
MD Projector
D
Viewing
Attention Biased Subjective Ratin g Predictions
SD Displayand
Viewing
"009 SD
Broadcast
SD Broadcast
CRT
ADMOS"
HD Displayand
Viewing
"010 HD
Broadcast
HD Broadcast
CRT
ADMOS"
CIF Display and
Viewing
SD Sports "012 SD Sports
"011 CIF and
QVGAADMOS"
Broadcast
CIF/QVGA LCD
SD Broadcast
CRT
ADMOS"
HD Sports "013 HD Sports
Broadcast
HD Broadcast
CRT
ADMOS"
SDTalkingHead "014 SD Talking
Head Broadcast
SD Broadcast
CRT
ADMOS"
(ITU-R BT.500)
(ITU-R BT.500)
7 scrn heights,
20 cd/m^
.1 cd/m^
2
2
(ITU-R BT.500)
(ITU-R BT.500)
7 scrn heights,
3
2
20 cd/m^
scrn heights,
2
1cd/m^
.
(ITU-R BT.500)
(ITU-R BT.500)
7 scrn heights,
20 cd/m^
2
(ITU-R BT.500)
(ITU-R BT.500)
(ITU-R BT.500)
Configuration Nodes
PSNR
Perceptual
Difference
Artifact
Detection
Attention
Model
NA Typical NA NA
NA Typical NA NA
NA Typical NA NA
NA Typical NA NA
NA Typical NA NA
NA Typical NA NA
NA Typical NA NA
A
N
NA Typical NA
ypical
T
A
N
N
Default
Weightings
NA Typical NA
Default
Weightings
NA Typical NA
Default
Weightings
NA Typical NA Motion and
Foreground
Dominant
NA Typical NA Motion and
Foreground
Dominant
NA Typical NA
Skin and
Foreground
Dominant
Summary
Node
PQR Units
PQR Units
PQR Units
PQR Units
DMOS Units Re:
BT.500 Training
DMOS Units Re:
BT.500 Training
DMOS Units Re:
BT.500 Training
A
DMOS Units Re:
BT.500 Training
DMOS Units Re:
BT.500 Training
DMOS Units Re:
BT.500 Training
DMOS Units Re:
BT.500 Training
DMOS Units Re:
BT.500 Training
DMOS Units Re:
BT.500 Training
DMOS Units Re:
BT.500 Training
12 www.tektronix.com
Page 13

Picture Quality Analysis System— PQA600
Measurement
Class
Repurposing: Reference and Test are Independent. Use Any Combination Display Model and Viewing Conditions with Each Mea surement
Above
Format
Conversion:
Cinema to SD
Measurement
Name
"015 SD DVD
from D-Cinema
DMOS"
Display Model View Model
DMD Projector
and SD CRT
7 scrn heights,
2
20 cd/m^
and
(ITU-R BT.500)
Configuration Nodes
PSNR
Perceptual
Difference
Artifact
Detection
Attention
NA Expert NA NA
Model
Summary
Node
DMOS Units Re:
BT.500 Training
DVD
Format
Conversion: SD
to CIF
Format
Conversion: HD
to SD
Format
Conversion: SD
to HD
Format
Conversion: CIF
to QCIF
Attention
Attention
"016 CIF from
SD Broadcast
DMOS"
"017 SD from
HD Broadcast
DMOS"
"017-A SD from
HD Broadcast
DMOS"
"018 QCIF from
CIF andQVGA
DMOS"
"019 Stand-alone
Attention Model"
LCD and SD
BroadcastCRT
SD and HD
(ITU-R BT.500)
and 7 scrn
heights, 20
2
cd/m^
(ITU-R BT.500)
BroadcastCRT
SD and HD
(ITU-R BT.500)
ProgressiveCRT
QCIF and
CIF/QVGA LCD
7 scrn heights,
20 cd/m^
2
NA NA NA NA NA
NA Expert NA NA
NA Expert NA NA
NA Expert NA NA
NA Expert NA NA
Default
Weightings
DMOS Units Re:
BT.500 Training
DMOS Units Re:
BT.500 Training
DMOS Units Re:
BT.500 Training
DMOS Units Re:
BT.500 Training
Map units: %
Probability of
focus of attention
Objective Measurements: Full Reference
General Difference
PSNR "020 PSNR dB"
Artifact Measurement
Removed Edges "021 Removed
NA Auto-align spatial
Selected
NA Auto-align spatial NA NA Blurring NA
NA NA NA dB units
%
EdgesPercent"
AddedEdges "022 Added
EdgesPercent"
RotatedEdges "023 Rotated
NA Auto-align spatial NA NA
Ringing /
NA
Mosquito Noise
NA Auto-align spatial NA NA Edge Blockiness NA
%
%
EdgesPercent"
%ofOriginal
Deviation from
"024DC Blocking
Percent"
NA Auto-align spatial NA NA
DC Blockiness
NA
%
BlockDC
Artifact Classified (Filtered) PSNR
Removed Edges "025 Removed
NA Auto-align spatial
Selected
NA Blurring NA dB units
Edges Weighted
PSNR dB"
AddedEdges "026 Added
Edges Weighted
NA Auto-align spatial
Selected
NA
Ringing /
Mosquito Noise
NA dB units
PSNR dB"
RotatedEdges "027 Rotated
NA Auto-align spatial
Selected
NA Edge Blockiness NA dB units
Edges Weighted
PSNR dB"
%ofOriginal
Deviation from
BlockDC
Artifact Annoyance Weighted (Filtered) PSNR
PSNR w/
Default Artifact
Annoyance
Weights
"028DC Blocking
WeightedPSNR
dB"
"029 Artifact
Annoyance
WeightedPSNR
dB"
NA Auto-align spatial
NA Auto-align spatial
Selected
Selected
NA
NA
DC Blockiness
All artifacts
selected
NA dB units
NA dB units
www.tektronix.com 13
Page 14

Data Sheet
Measurement
Class
Repurposing: Use View Model to Resample, Shift, and Crop Test to Map to Reference
Format
Conversion:
Cinema to SD
DVD
Format
Conversion: SD
to CIF
Measurement
Name
"030 SD DVD
from D-Cinema
Artifact weighted
PSNR dB"
"031 CIF from
SD Broadcast
Artifact weighted
Display Model View Model
NA Auto-align s
patial
NA Auto-align spatial
PSNR
Selected
Selected
Configuration Nodes
Perceptual
Difference
NA
NA
Artifact
Detection
All artifacts
selected
All artifacts
selected
Attention
Model
PSNR dB"
Format
Conversion: HD
to SD
"032 SD from
HD Broadcast
Artifact weighted
NA Auto-align spatial
Selected
NA
All artifacts
selected
PSNR dB"
Format
Conversion: CIF
to QCIF
"033 QCIF from
CIF andQVGA
Artifact weighted
NA Auto-align spatial
Selected
NA
All artifacts
selected
PSNR dB"
Attention-weighted Objective Measurements
General Difference
PSNR
"034 Attention
WeightedPSNR
NA NA
Selected
NA NA
Default
Weightings
dB"
ctive Measurements: No Reference
Obje
Artifact
DCBlockiness
"035 No
Reference DC
NA NA NA NA
No-reference
DC Block
Blockiness
Percent"
Subjective Prediction Calibrated by Su bjec tive Rating Conducted in 2009 with 1080i29 Video Contents and H.264 CODEC
(Refer to application note, 28W_24876_0.pdf)
HD PQR
CustomHD CRT
scrn heights
3
A
N
Custom
A
N
ITU-BT500 with
Interlaced CRT
HD DMOS
CustomHD CRT
3 scrn heights NA
Custom
NA NA
ITU-BT500 with
Interlaced CRT
HD ADMOS
CustomHD CRT
3 scrn heights NA
Custom
NA Typical
ITU-BT500 with
Interlaced CRT
Summary
Node
NA dB units
NA dB units
NA dB units
NA dB units
dB units
NA
N
A
% DC Blockiness
PQR Units
DMOS Units
Re:BT.500
Training
DMOS Units
Re:BT.500
Training
14 www.tektronix.com
Page 15

Picture Quality Analysis System— PQA600
Nodes
Node Name
DisplayModel
View Model
PSNR No configurable parameters
PerceptualDifference The viewercharacteristics (acuity, sensitivity tochanges in
Attention Model
ArtifactDetect Added Edges (Blurring), Removed Edges
SummaryNode MeasurementUnits (Subjective: PredictedDMOS, PQR
Configurable Parameter
Display Technology: CRT/LCD/DMD each with preset
and user-configurable parameters(Interlace/Progressive,
Gamma, Response Time,etc). Reference Displayand Test
Displaycan beset independently
Viewing distance, Ambient Luminance for Reference
and Testindependently, imagecropping and registration:
automaticor manualcontrol of image cropping andtest
imagecontrast (ac gain),brightness (dc offset),horizontal
and vertical scale and shift
average brightness, response speed tothe movingobject,
sensitivity to photosensitiveepilepsy triggers, etc)
Overall attentionweighting formeasures, Temporal
(Motion), Spatial (Center,People (Skin),Foreground,
Contrast,Color,Shape, Size),Distractions(Differences)
(Ringing/Mosquito Noise), Rotated Edges (Edge
Blockiness), and DCBlockiness (Removed detail within a
block)
or % Perceptual Contrast. Objective: Mean Abs LSB,
dB)., Map type: Signed on gray or unsigned on black.
Worst-caseTrainingSequence for ITU-RBT.500Training
(Defaultor User-application Tuned: Determinedby Worst
Case Video % Perceptual Contrast), ErrorLog Threshold,
Save Mode
Computer System and Peripherals
ponent
Com
OperatingSystem Windows7 Professional64-bit
CPU Six-coreIntel
HardDisk Drive
CD/DVD Drive DVD±RW,CD R/W drive
Description
®
Xeon®5650Series processors
5x 3.5 in. Total 5TB SAS(Serial AttachedSCSI)
Ordering Information
PQA600
Picture Quality Analysis System
PC Monitor Requirement
Note: PQA600 does notinclude a PCmonitor. A monitor isto be providedby the
user.
Dual LinkDVI port orDisplay port
Up to2560×1600 resolution
Standard Accessories
Order Number
PQA600 Picture Q u a lity Analysis System Documentatio n
071-2775-xx
(English)
071-2781-xx Release Notes
071-2778-xx
077-0487-xx
077-0486-xx
063-3428-xx
Other
020-3054-xx Application RecoveryDisk
020-3053-xx
Options
SDI SD/HD SDI Interface
Description
QuickStart User Manualin English,and SimplifiedChinese
orJapanese translation if alanguageoption was ordered
User TechnicalReference
Specificationand Performance Verification Manual in PDF
formaton DocumentationCD
PQA600 Declassification andSecurityInstructions in PDF
formaton DocumentationCD
Documentation CD, containing PDF files of the
documentationset
VideoSequences Recovery Media
Input/Output Ports
Port Description
Power
KeyboardPort
Mouse Port
USB 2.0 Port Twofrontpanel, sixrear panel
LAN Port
IEEE-1394 Port
GraphicsPort
SDI IO Port (Option
SDI)
100-240 V,50/60 Hz
PS-2 compatible
PS-2 compatible
Three RJ-45 connector,supports 10/100/1000BASE-T
One front panel, onerear panel
DualLink DVI-I x1,Display x2. Upto 2560×160060Hz
2-CHInput, 2-CH Outputwith BNC tomini-BNC SDI cable
(174-5466-xx)
Physical Characteristics
Benchtop Confi guration
Dimensions
Height 565.4 22.26
Width 215.9 8.5
Depth 538.5 22.3
Weight kg lb.
Net 24.9
mm
in.
55
International Power Plugs
Option
A0 North America
A1
A2 United Kingdom
A3 Australia
A4 240 V NorthAmerica
A5
A6 Japan
A10
A11 India
A99
Description
Universal EURO
Switzerland
China
No Power Cordor AC Adapter
Language Options
Option
L0 English Manual
L5 Japanese Manual
L7
Description
Simplified Chinese Manual
www.tektronix.com 15
Page 16

Data Sheet
Service
Option
CA1
C3 CalibrationService 3 Years
IF
R3
Post-sale Upgrade
Option
PQA6UP Field Upgrade Kitfor PQA600
SDI SD/HD SDI Interface for Field Installation
Additional Information
Pleasecontact your localService Manager forinformationregarding our products
andservices, or contactus at: www.tektronix.com/serviceandsupportcontactus
Description
A single calibrationevent orcoverage
Upgrade Installation Service
Repair Service 3Years( including warranty)
Description
Product(s)are manufactured in ISO registered facilities.
Product(s) complies with IEEE Standard488.1-1987, RS-232-C, and with Tektronix
Standard Codes and Formats.
Contact Tektronix:
ASEAN / Australa
Balkans, Israel, South Africa and ot her ISE Countries +41 52 675 3777
Central East Eu
Mexico, Central/South America & Caribbean (52) 55 53 35 10 85
*If the Europeanphone number aboveis not accessible,please call: +41 52 675 3777
rope, Ukraine, and the Baltics +41 52 675 3777
Central Europe & Greece +41 52 675 3777
Middle E ast,
Asia, and North Africa +41 52 675 3777
The Netherlands* 00800 2255 4835
People’s Rep
Republic of
United Kingdom & Ireland* 00800 2255 4835
sia (65) 63563900
Austria* 00800 2255 4835
Belgium* 00800 2
Brazil +55(11)37597600
Canada 1 800833 9200
Denmark +4580881401
Finland +41526
France* 00800 2255 4835
Germany* 00800 2255 4835
Hong Kong 400 8
India 000 800 650 1835
Italy* 00800 2255 4835
Japan 81 (3) 67
Luxembourg +41526753777
ublic of China 400 820 5835
Poland +41 52 675 3777
Korea 001 800 8255 2835
Russia & CIS +7 (495) 7484900
South Africa +41526753777
Spain* 0080
Sweden* 00800 2255 4835
Switzerland* 00800 2255 4835
Tai wa n 886 (
255 4835
75 3777
20 5835
14 3010
Norway 800 16098
Portugal 80 08 12370
022554835
2) 2722 9622
USA 1 800 833 9200
Updated 21 April 2010
www.tektronix.com
For Further Information. Tektronix maintains a comprehensive, constantly expanding
collection of application notes, technical briefs and other resources to help engineers working
on the cutting edge of technology. Please visit www.tektronix.com
t © Tektronix, Inc. Allrights reserved. Tektronix products are covered by U.S. and foreign patents,
Copyrigh
d pending. Information in this publication supersedes that in all previously published material.
issued an
tion and price change privileges reserved. TEKTRONIX and TEK are registered trademarks of
Specifica
x, Inc. All othertrade names referencedare the servicemarks, trademarks, or registeredtrademarks
Tektroni
espective companies.
of their r
04Jun 2010 25W-25447-0
 Loading...