

Page 1

COMMITTED TO EXCELLENCE
PLEASE CHECK FOR CHANGE INFORMATION
AT THE REAR OF THIS MANUAL.
2213
OSCILLOSCOPE
OPERATORS
INSTRUCTION MANUAL
Tektronix, Inc.
P.O. Box
Beaverton, Oregon
500
97077
Serial Number __________
070-3397-00
Product Group 46
First Printing JUN 1981
Revised AUG 1982
Page 2
2213 Operators
CONTROLS, CONNECTORS, AND INDICATORS
The following descriptions are intended to familiarize
the operator with the location, operation, and function of
the instrument’s controls, connectors, and indicators.
POWER, DISPLAY, AND
PROBE ADJUST
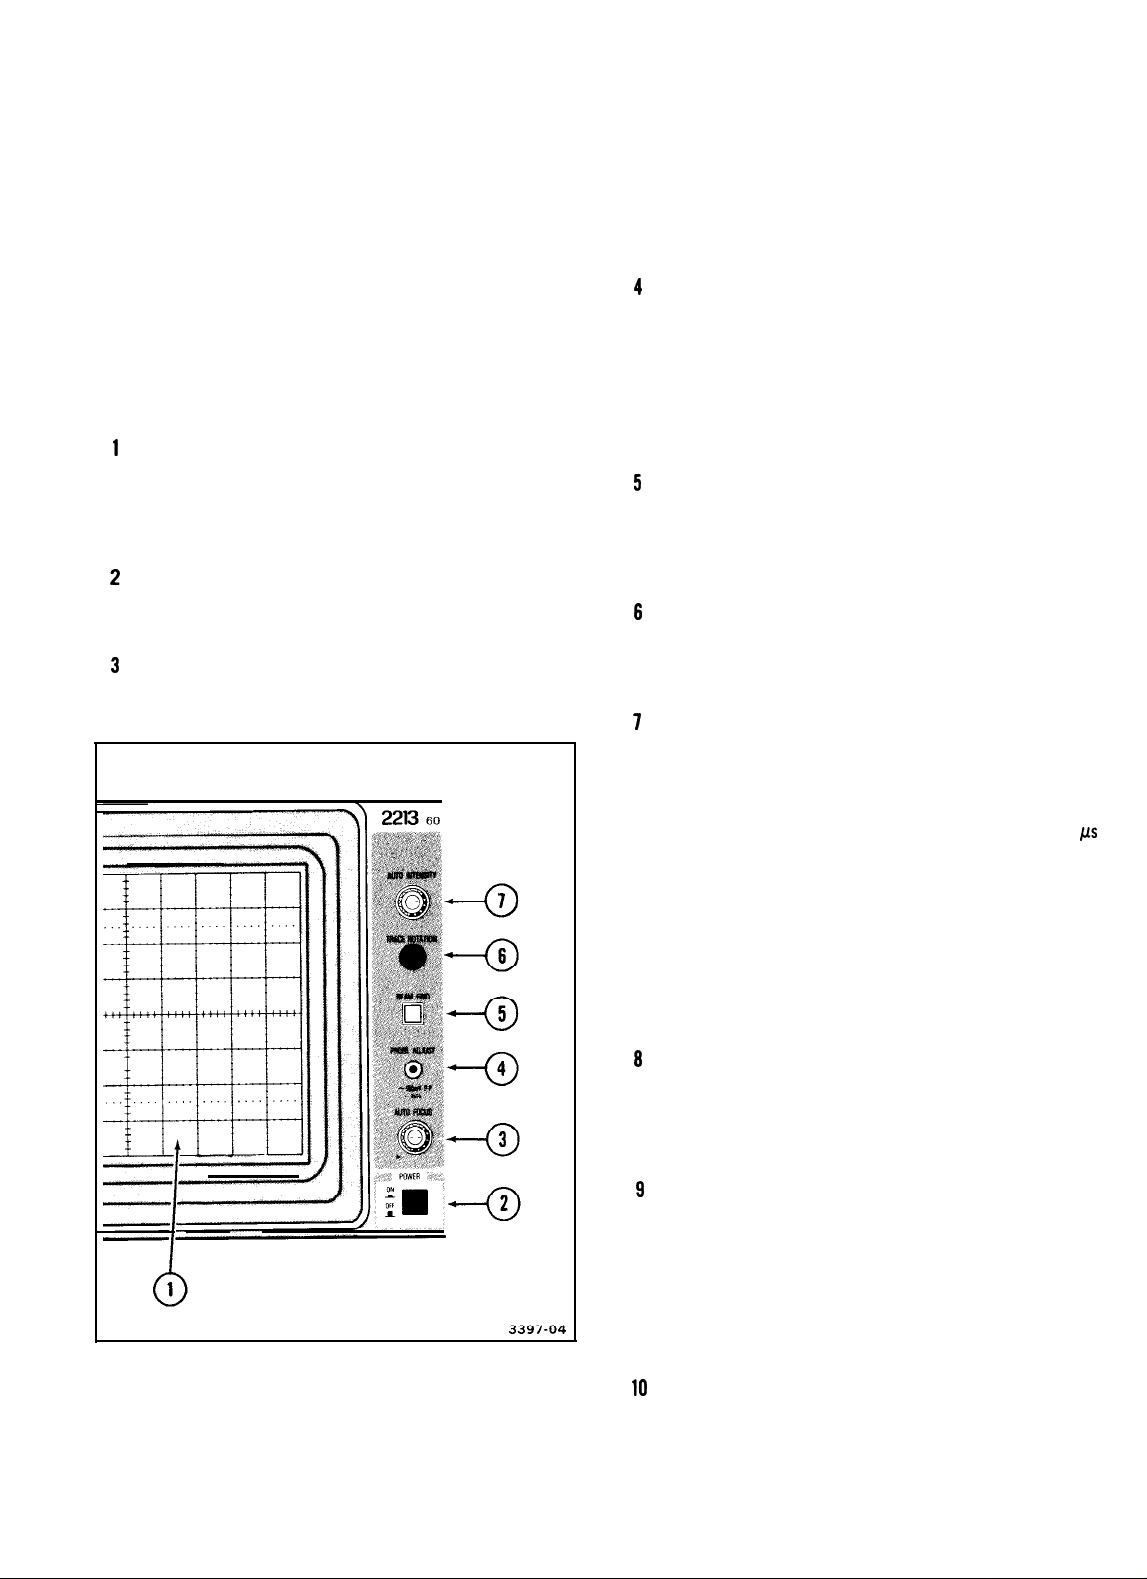
Refer to Figure 3 for location of items 1 through 7.
1
Internal Graticule-Eliminates parallax viewing error
0
between the trace and graticule lines. Rise-time
amplitude and measurement points are indicated at
the left edge of the graticule.
2
POWER Switch-Turns instrument power on and off.
0
Press in for ON; press again for OFF.
3
AUTO FOCUS Control-Adjusts display for optimum
0
definition. Once set, the focus of the crt display will
be maintained as changes occur in the intensity level
of the trace.
PROBE ADJ
4
0
0.5
V,
negative going, square-wave voltage (at approximately 1
pensate voltage probes and to check operation of the
oscilloscope vertical system. It is not intended to verify the accuracy of the vertical gain or time-base
calibration.
BEAM FIND Switch-When held in, compresses the
5
0
display to within the graticule area and provides a
visible viewing intensity to aid in locating off-screen
displays.
TRACE ROTATION Control-Screwdriver control
6
0
used to align the crt trace with the horizontal
graticule lines.
AUTO INTENSITY Control-Adjusts brightness of
7
0
the crt display. This control has no effect when the
BEAM FIND switch is pressed in. Once the control
is set, intensity is automatically maintained at
approximately the same level between SEC/DIV
switch settings from 0.5 ms per division to 0.05
per division.
Connector-Provides an approximately
kHz)
that permits the operator to com-
pus
Figure 3. Power, display, and probe adjust controls, connector, and
indicator.
4
VERTICAL
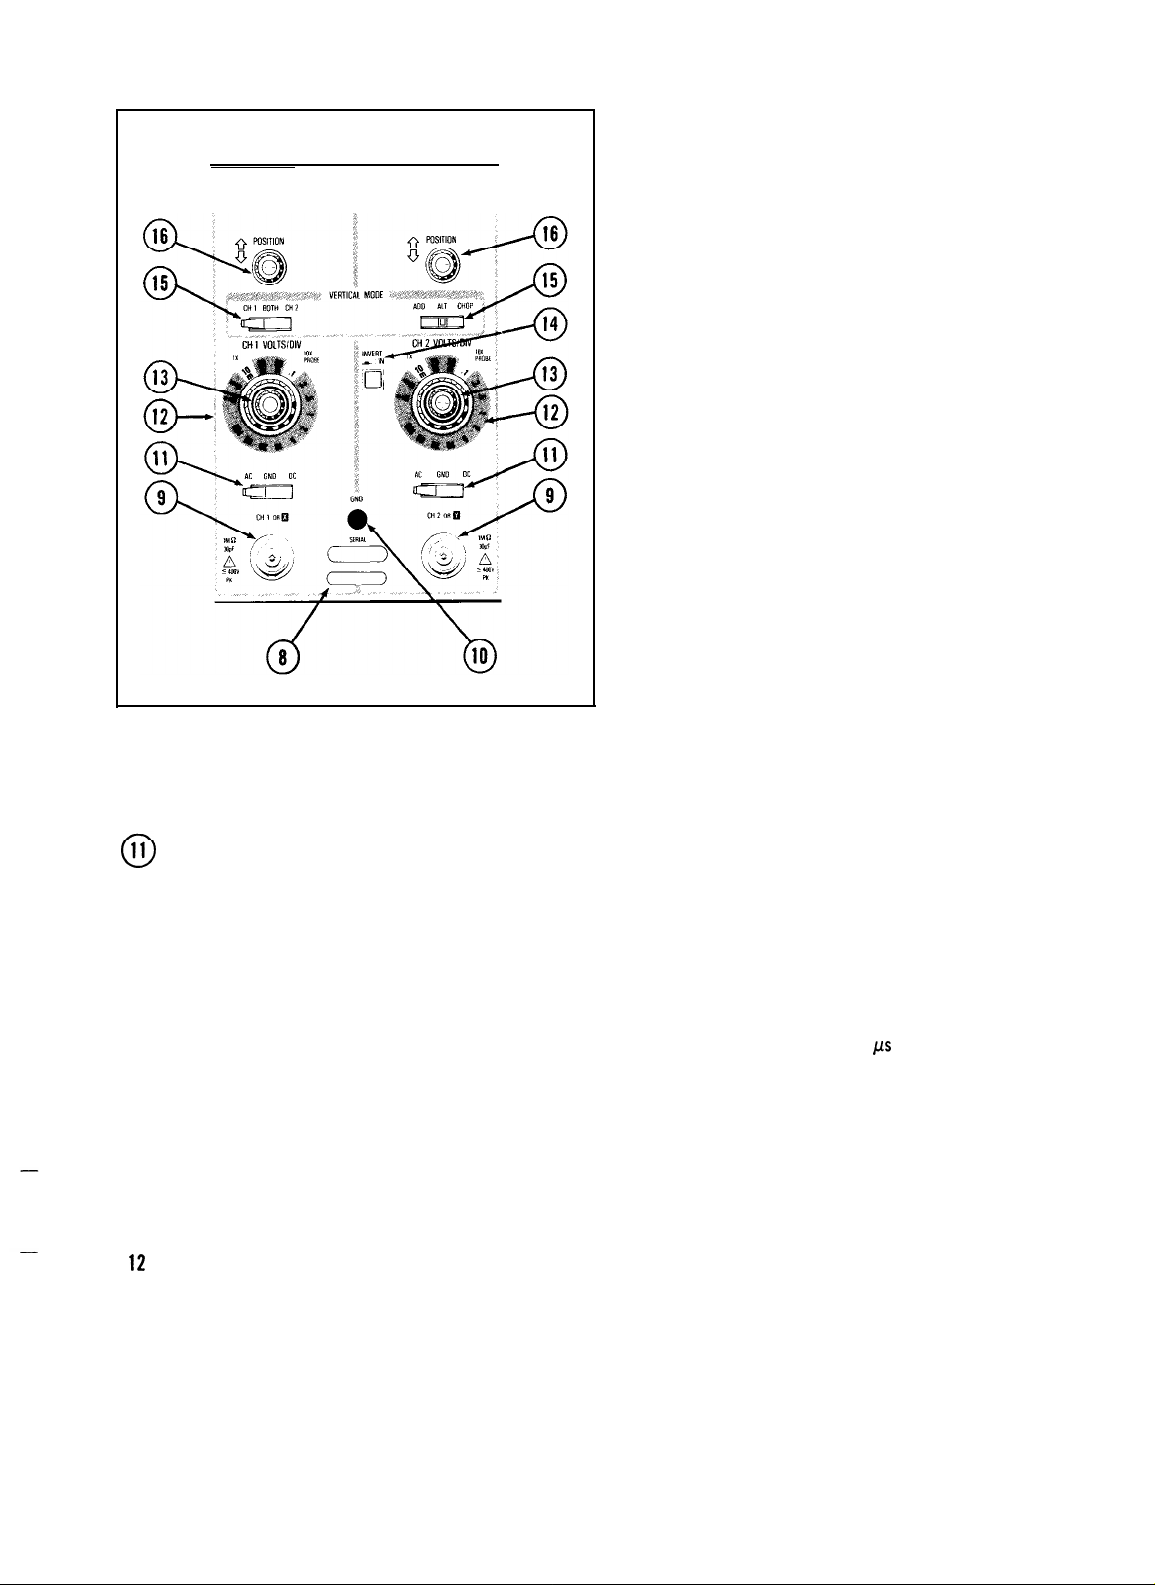
Refer to Figure 4 for location of items 8 through 16.
8
SERIAL and Mod Slots-The SERIAL slot is im-
0
printed with the instrument’s serial number. The
Mod slot contains the option number that has been
installed in the instrument.
9
CH 1 OR X and CH 2 OR Y Connectors-Provide
0
for application of external signals to the inputs of
the vertical deflection system or for an X-Y display.
In the X-Y mode, the signal connected to the CH 1
OR X connector provides horizontal deflection,
and the signal connected to the CH 2 OR Y connector provides vertical deflection.
10
GND Connector-Provides direct connection to
0
instrument chassis ground.
REV NOV 1981
Page 3
MHz OSCILLOSCOPE
Figure 4. Vertical controls and connectors.
3397-05
2213 Operators
10X
PROBE-Indicates the deflection factor
selected when using a 10X probe.
VOLTS/DIV
13
0
ter clockwise out of their detent positions, these
controls provide continuously variable, uncalibrated
deflection factors between the calibrated settings of
the
VOLTS/DIV
brated deflection factor to 25 volts per division with IX
probe (a range of at least 2.51).
INVERT Switch-Inverts the Channel 2 display when
14
0
button is pressed in. Push button must be pressed
in a second time to release it and regain a noninverted
display.
VERTICAL MODE Switches-Two three-position
15
0
switches are used to select the
the vertical amplifier system.
CH I-Selects only the Channel 1 input signal for
display.
BOTH-Selects both Channel 1 and Channel 2
input signals
be selected for either ADD, ALT, or CHOP
operation.
Variable Controls-When
switches.Extends maximum uncali-
for display.
The BOTH position must
rotated
mode of operation
coun-
for
u
Input Coupling (AC-GND-DC) Switches-Used to
select the method of coupling input signals to the
vertical deflection system.
AC-Input signal is capacitively coupled to the
vertical amplifier. The dc component of the input
signal is blocked. Low-frequency limit (-3
point) is approximately 10 Hz.
GND-The input of the vertical amplifier is
grounded to provide a zero (ground)
voltage display (does not ground the input signal).
This switch position allows
coupling capacitor.
DC-All frequency components of the input
signal are coupled to the vertical deflection system.
12
CH 1
0
VOLTS/DlV
Used to select the vertical deflection factor in a l-2-5
sequence. To obtain a calibrated deflection factor,
the
VOLTS/DIV
1X
PROBE-Indicates the deflection factor
selected when using either a 1X probe or a coaxial
cable.
and CH 2
variable control must be in detent.
precharging
VOLTS/DIV Switches-
dB
reference-
the input
CH
2-Selects
display.
ADD-Displays the algebraic sum of the Channel 1
and Channel 2 input signals.
ALT-Alternately displays Channel 1 and Channel
2 input signals. The alternation occurs during
retrace at the end of each sweep.
is useful for viewing both input signals at sweep
speeds from 0.05 ps per division to 0.2 ms per
division.
CHOP-The display switches between the Chan-
nel 1 and Channel 2 input signals during the
sweep. The switching rate is approximately 250
kHz.
This mode is useful for viewing both Channel
1 and Channel 2 input signals at sweep speeds
from 0.5 ms per division to 0.5 s per division.
POSITION Controls-Used to vertically position the
16
0
display on the crt. When the SEC/DIV switch is set to
X-Y, the Channel 2 POSITION control moves the
display vertically (Y-axis), and the Horizontal
POSITION control moves the display horizontally
(X-axis).
only the Channel 2 input signal for
This
mode
REV OCT 1981
5
Page 4
2213 Operators
HORIZONTAL
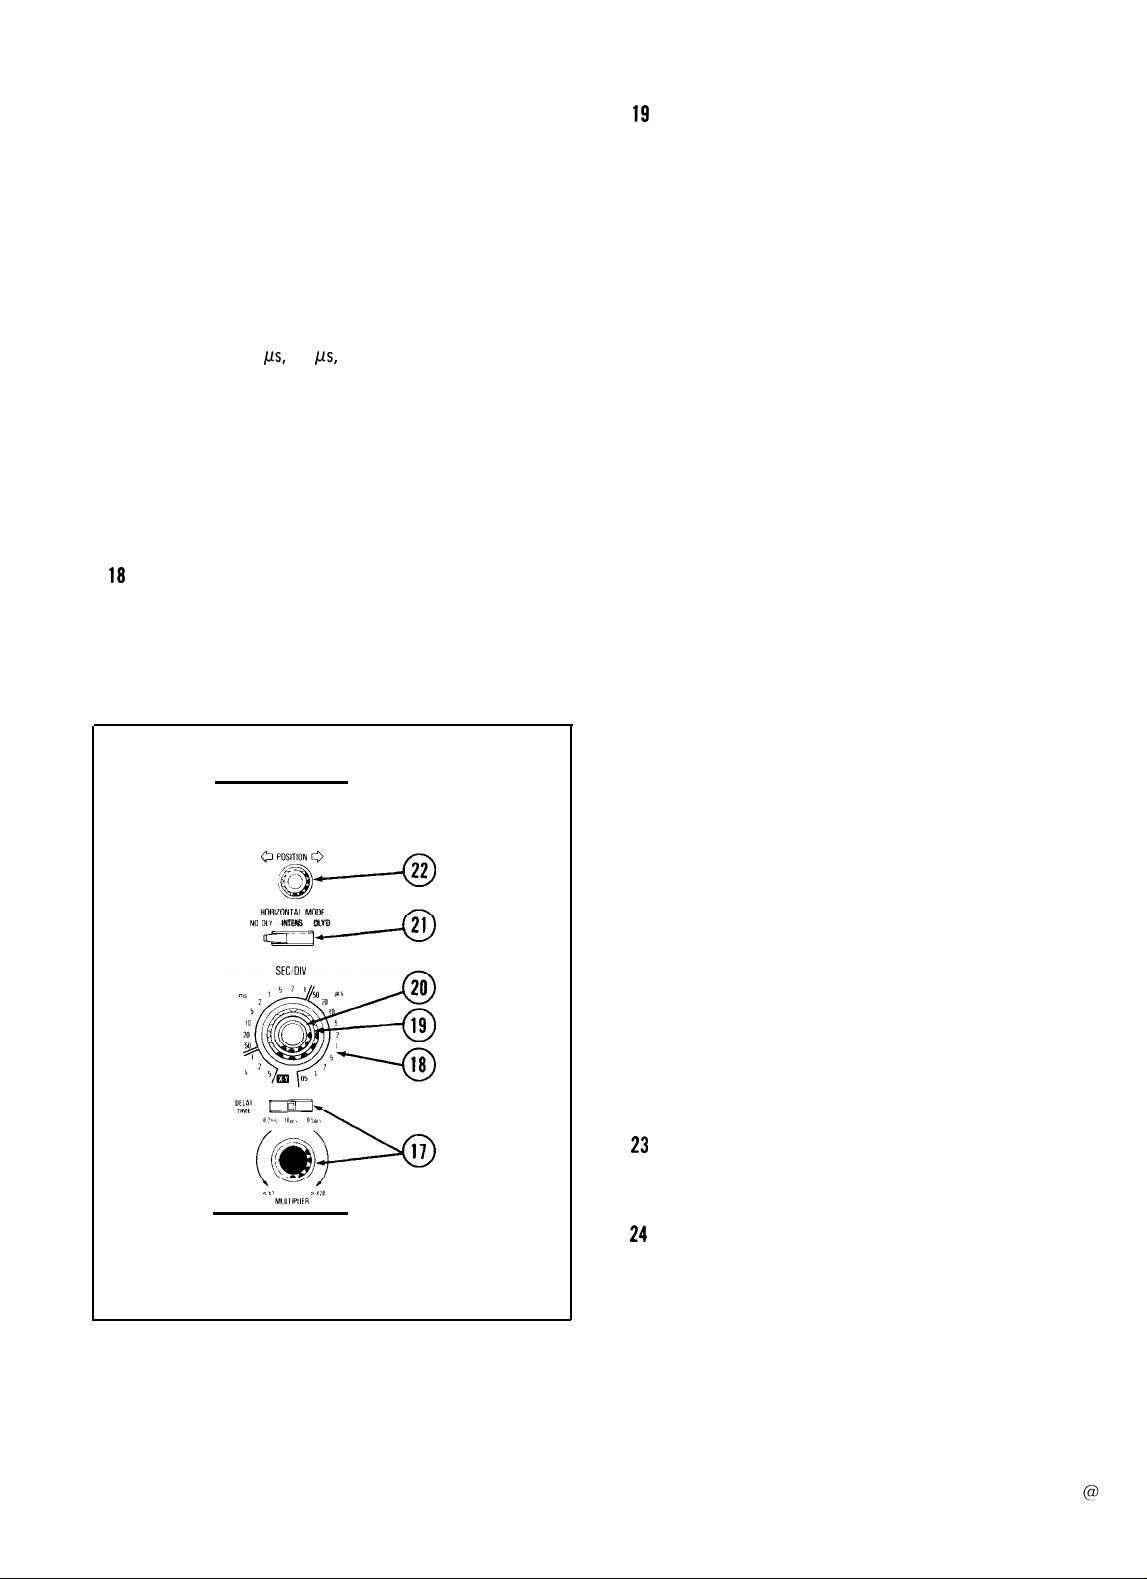
Refer to Figure 5 for location of items 17 through 22.
DELAY
17
0
with
select the amount of delay time between the start of
the sweep and the beginning of the intensified zone.
SEC/DIV
10
0
for the sweep generator in a l-2-5 sequence.
calibrated sweep speeds, the
control must
wise).
TIME-Two controls are used in conjunction
INTENS
Range Selector
selects 0.5
increase the sweep delay from the calibrated
setting of the Range Selector switch, rotate the
MULTIPLIER control clockwise.
MULTIPLIER Control-Provides variable sweep
delay from less than 1 to greater than 20 times the
setting of the Range Selector switch.
and DLY’D HORIZONTAL MODE to
Switch-This three-position switch
rc(s,
10
,us,
and 0.2 ms of delay time. To
Switch-Used to select the sweep speed
SEC/DIV
be in the calibrated detent (fully clock-
For
Variable
SEC/DIV
19
0
variable, uncalibrated sweep speeds to at least 2.5
times the calibrated setting. It extends the slowest
sweep speed to at least 1.25 s per division.
X10
20
0
speed by a factor of 10, pull out the
Variable knob. The fastest sweep speed can be
extended to 5 ns per division. Push in the
Variable control knob to regain the Xl sweep speed.
HORIZONTAL MODE Switch-This three-position
21
0
switch determines
horizontal deflection system.
Variable
Magnifier Switch-To
NO DLY-Horizontal deflection is provided by the
sweep generator,
sweep speed determined by the
INTENS-Horizontal deflection is provided by the
sweep generator at a sweep speed determined by
the
SEC/DIV
provides an intensified zone on the display. The
start of the intensified zone represents the sweep-
start point when DLY’D HORIZONTAL MODE
is selected.
Control-Provides continuously
increase displayed sweep
the mode of operation for the
without a delayed start, at a
SEC/DIV
switch. The sweep generator also
SEC/DIV
SEC/DIV
switch.
SEC/W
Figure 5. Horizontal controls.
3397-06
DLY’D-Horizontal deflection is provided by the
sweep generator at a sweep speed determined by
the
SEC/DIV
sweep is delayed from the initial sweep-trigger
point by a time determined by the setting of the
DELAY TIME Range Selector switch and MULTI-
PLIER control.
POSITION Control-Positions the display hori-
22
0
zontally
in all modes.
switch setting. The start of the
TRIGGER
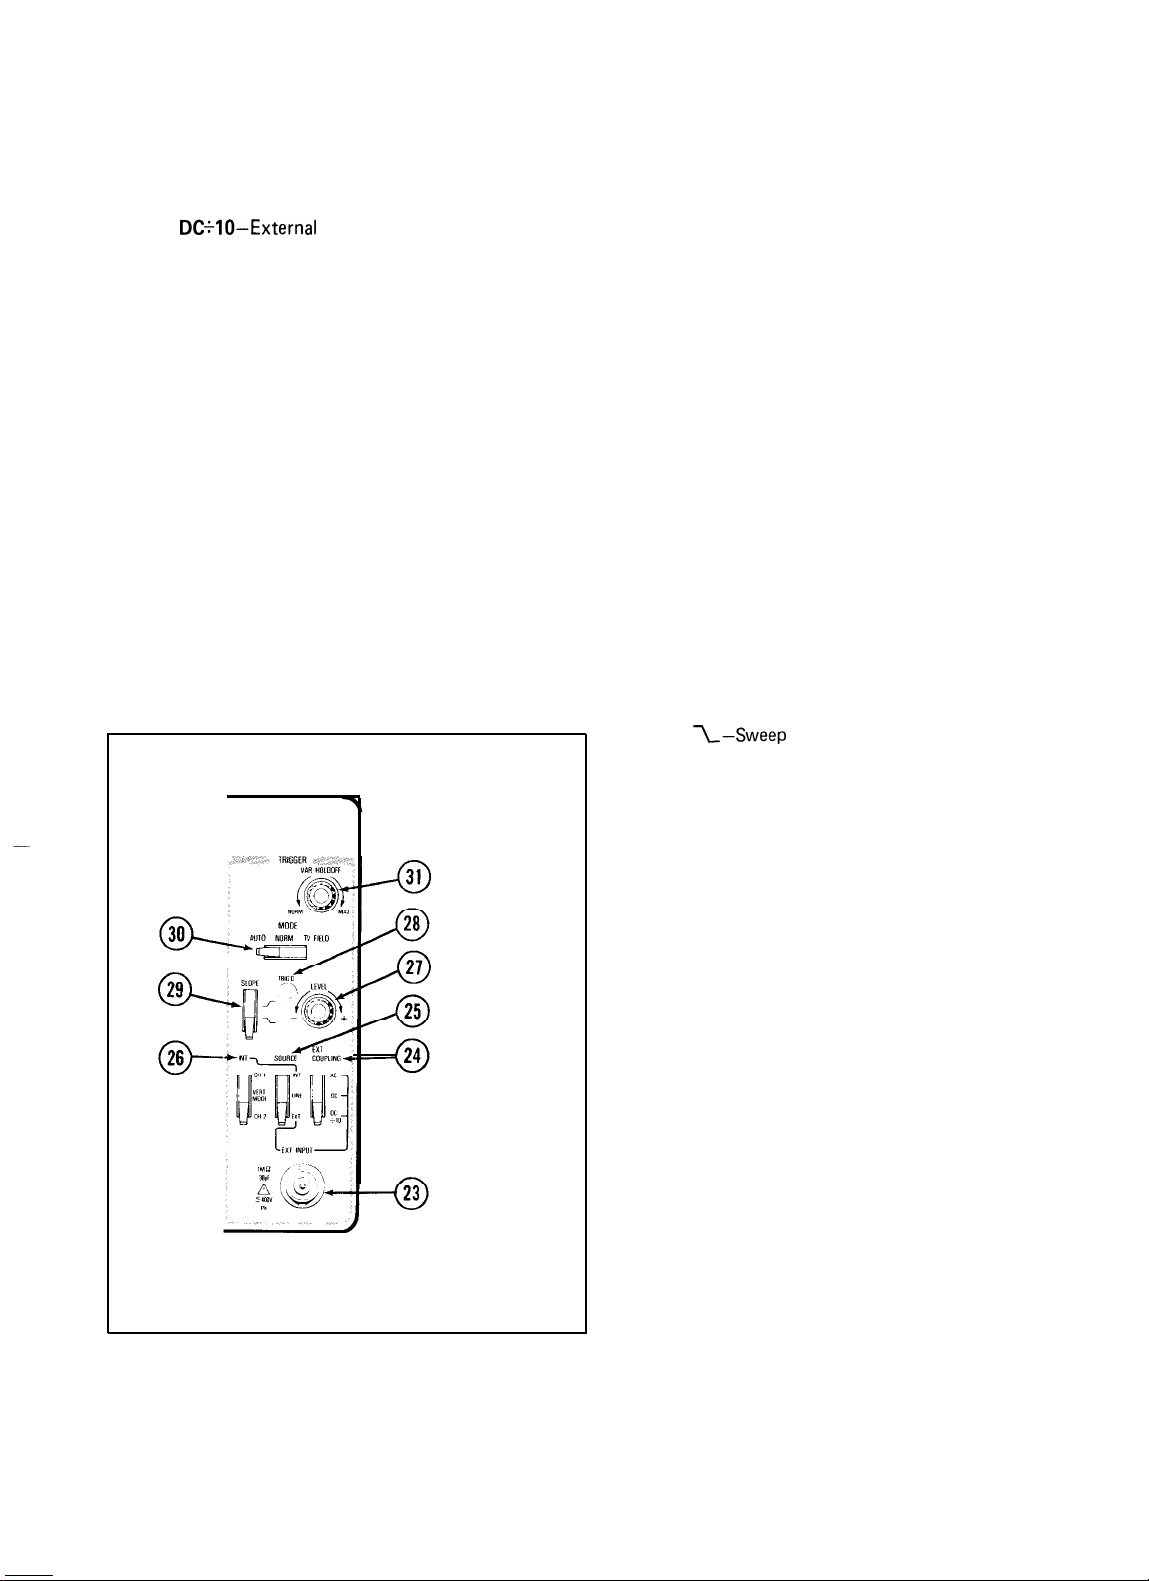
Refer to Figure 6 for locations of items 23 through 30.
23
EXT INPUT
0
ducing external signals into the trigger generator.
24
EXT COUPLING
0
used
AC-Signals above 60 Hz are capacitively coupled
to the input of the Trigger circuit.
ponents are blocked, and signals below 60 Hz are
attenuated.
Connector-Provides a means of intro-
Switch-Determines the method
to
couple external signals to the Trigger circuit.
Any dc com-
__
Page 5
2213 Operators
DC-All
components of the signal are coupled to
the trigger circuitry. This position
displaying low-frequency or low-repetition-rate
signals.
DC+lO-External
a factor of 10.
25
SOURCE Switch-Determines the source of the
0
trigger signal that is coupled to the input of the
trigger circuit.
INT-Permits triggering on signals that are applied
to the CH 1 OR X and CH 2 OR Y input connectors.
selected by the INT switch.
LINE-Provides a triggering signal from a sample
of the ac-power-source waveform. This trigger
source is useful when channel-input signals are
time related (multiple or submultiple) to the
frequency on the power-source-input voltage.
EXT-Permits triggering on signals applied to the
EXT INPUT connector.
trigger signals are attenuated by
The source of the internal signal is
is
useful
for
INT Switch-Selects the source of the triggering
26
0
signal when the
CH I-The signal applied to the CH 1 OR X input
connector is the
VERT MODE-The internal trigger source is
determined by the signals selected for display by
the VERTICAL MODE switches.
CH
connector is the source of the trigger signal.
LEVEL Control-Selects the amplitude point on the
27
0
trigger signal at
TRIG’D Indicator-The light-emitting diode (LED)
28
0
illuminates to indicate that the sweep is triggered.
SLOPE Switch-Selects the slope of the signal that
29
triggers the sweep (also refer to TV Signal Displays at
0
the end of “Instrument Familiarization”).
I-Sweep is
portion of the trigger signal.
SOURCE switch is set to INT.
source of the trigger signal.
2-The signal applied to the CH 2 OR Y input
which
the sweep is triggered.
triggered on the positive-going
Figure 6. Trigger controls, connector, and indicator.
3397-07
I-Sweep
portion of the trigger signal.
MODE Switch-Determines the trigger mode for the
30
0
sweep.
AUTO-Permits triggering on waveforms having
repetition rates of at least 20 Hz. Sweep free-runs
in the absence of an adquate trigger signal or when
the repetition rate is below 20 Hz. The range of
the TRIGGER LEVEL control will compensate
for the amplitude variations of the trigger signals.
NORM-Sweep is initiated when an adequate
trigger signal is applied.
signal, no baseline trace will be present. Triggering
on television lines is accomplished in this mode.
TV FIELD-Permits triggering on television fieldrate signals (refer to
of “Instrument Familiarization”.
VAR HOLDOFF
31
0
trol of
the
holdoff
control improves the ability to trigger on aperiodic
signals (such as complex digital waveforms).
is triggered on the negative-going
In the absence of a trigger
TV
Signal Displays at the end
Control-Provides continuous con-
holdoff
time between sweeps. Increases
time by at least a factor of four. This
REV NOV 1981
Page 6
2213 Operators
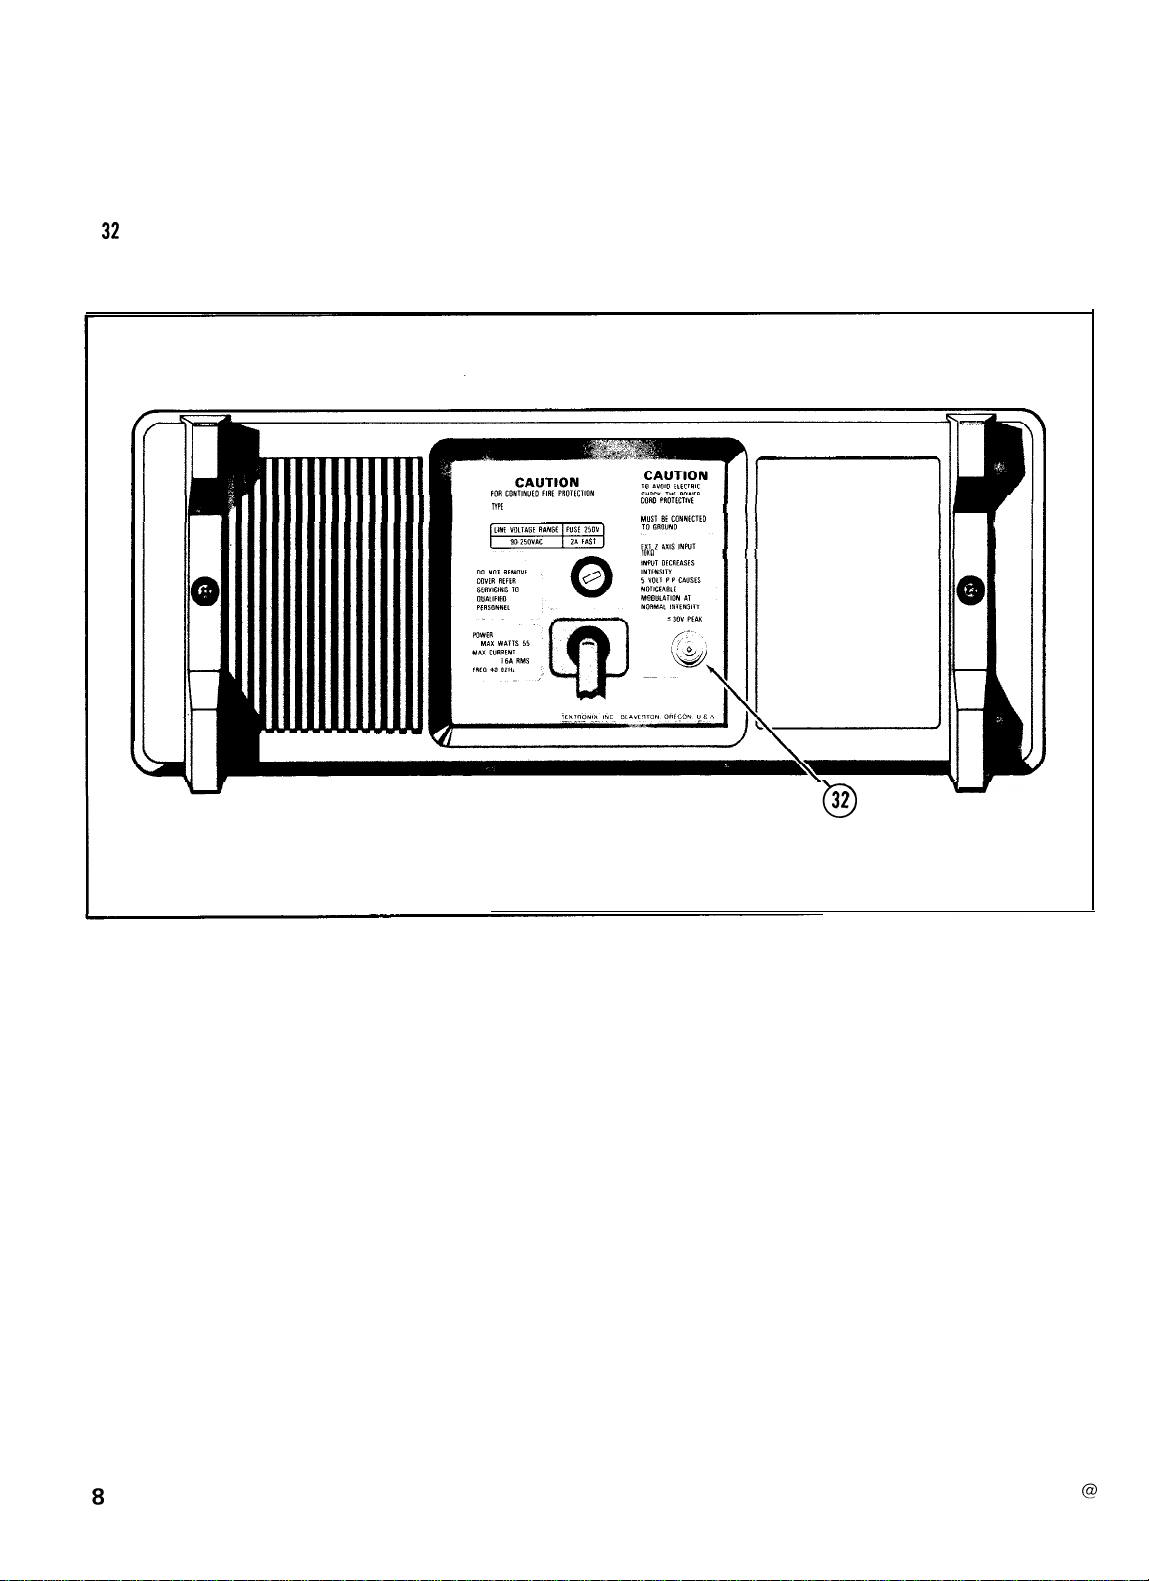
REAR PANEL
Refer to Figure 7 for location of item 32.
32
EXT
Z
0
necting
AXIS Connector-Provides a means of
external signals to the Z-axis amplifier to
con-
REPLACE ONLY WITH SPECIFIED
TYPE
AND RATED FUSE DISCONNECT
POWER INPUT BEFORE REPLACING FUSE
intensity modulate the crt display. Applied signals
do not affect display waveshape. Signals with fast
rise times and fall times provide the most abrupt
intensity change, and a 5-V p-p signal will produce
noticeable modulation. The Z-axis signals must be
time-related to the display to obtain a stable
ation
on the crt.
GROUNDING CONDUCTOR
lOK0
POSITIVE GOING
present-
Figure 7. Rear-panel connector.
32
0
3397-08
Page 7
OPERATING CONSIDERATIONS
2213 Operators
This section contains basic operating information and
techniques that should be considered before attempting
any measurements.
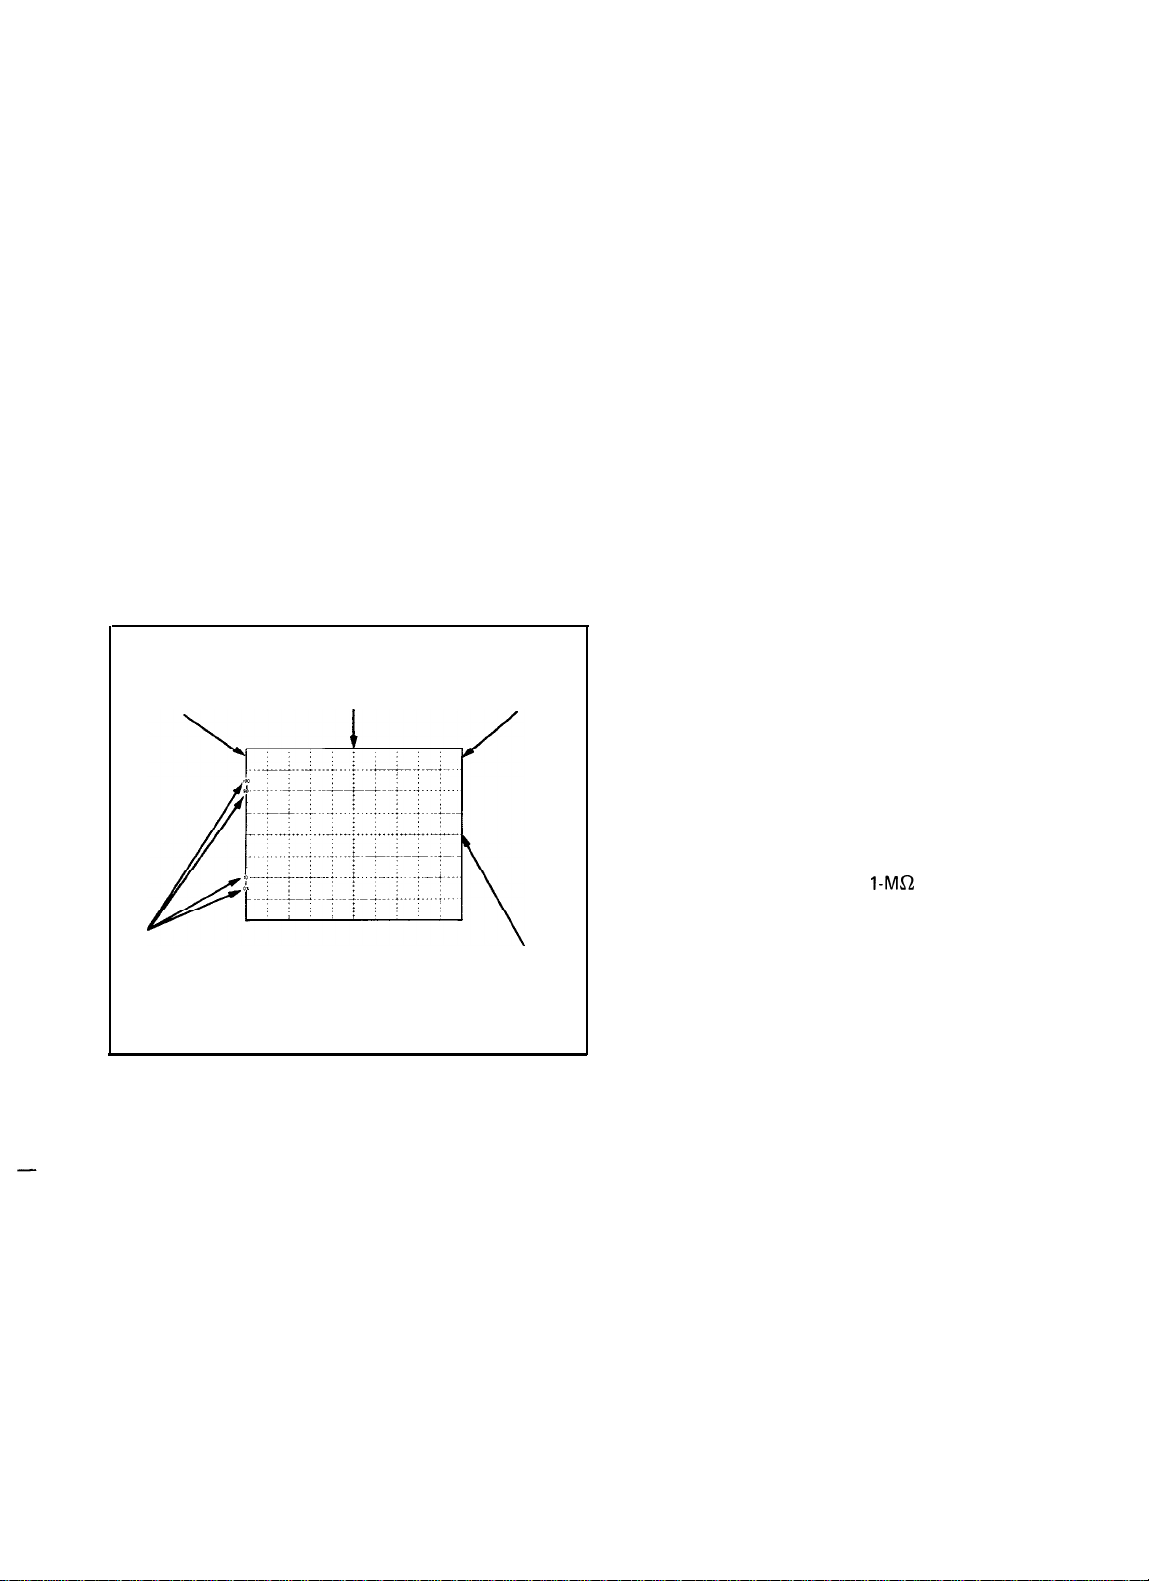
GRATICULE
The graticule is internally marked on the faceplate of
the crt to enable accurate measurements without parallax
error (see Figure 8). It is marked with eight vertical and ten
horizontal major divisions. Each major division is divided
into five subdivisions. The vertical deflection factors and
horizontal timing are calibrated to the graticule so that
accurate measurements can be made directly from the crt.
Also, percentage markers for the measurement of rise and
fall times are located on the left side of the graticule.
1ST OR LEFT
VERTICAL
GRATICULE
LINE
CENTER
VERTICAL
GRATICULE
LINE
11TH
OR RIGHT
VERTICAL
GRATICULE
LINE
SIGNAL CONNECTIONS
Generally, probes offer the most convenient means of
connecting an input signal to the instrument. They are
shielded to prevent pickup of electromagnetic interference,
and the supplied 10X probe offers a high input impedance
that minimizes circuit loading. This allows the circuit under
test to operate with a minimum of change from its normal
condition as measurements are being made.
Coaxial cables may also be used to connect signals to the
input connectors, but they may have considerable effect on
the accuracy of a displayed waveform. To maintain the
original frequency characteristics of an applied signal,
only high-quality, low-loss coaxial cables should be used.
Coaxial cables should be terminated at both ends in their
characteristic impedance. If this is not possible, use suitable
impedance-matching devices.
INPUT COUPLING CAPACITOR
PRECHARGING
RISE AND CENTER
FALL TIME HORIZONTAL
MEASUREMENT GRATICULE
PERCENTAGE LINE
MARKERS
Figure 8. Graticule measurement markings.
GROUNDING
The most reliable signal measurements are made when
the 2213 and the unit under test are connected by a com-
mon reference (ground lead), in addition to the signal lead
or probe. The probe’s ground lead provides the best
grounding method for signal interconnection and ensures
the maximum amount of signal-lead shielding in the probe
cable. A separate ground lead can also be connected from
the unit under test to the oscilloscope GND connector
located on the front panel.
4115-16
When the input coupling switch is set to GND, the input
signal is connected to ground through the input coupling
capacitor in series with a
l-MS2
resistor to form a
precharging network. This network allows the input coupling
capacitor to charge to the average dc-voltage level of the
signal applied to the probe. Thus, any large voltage
transients that may accidentally be generated will not be
applied to the amplifier input when the input coupling
switch is moved from GND to AC. The
precharging
network also provides a measure of protection to the external
circuitry by reducing the current levels that can be drawn
from the external circuitry during capacitor charging.
The following procedure should be used whenever the
probe tip is connected to a signal source having a different
dc level than that previously applied, especially if the
level difference is more than 10 times the
VOLTS/DIV
dc-
switch setting:
1. Set the AC-GND-DC switch to GND before con-
necting the probe tip to a signal source.
2. Insert the probe tip into the oscilloscope GND
connector.
@
9
Page 8
2213 Operators
3. Wait several seconds for the input coupling capacitor
to discharge.
4. Connect the probe tip to the signal source.
5. Wait several seconds for the input coupling capacitor
to charge.
6. Set the AC-GND-DC switch to AC. The display will
remain on the screen, and the ac component of the signal
can be measured in the normal manner.
INSTRUMENT COOLING
To maintain adequate instrument cooling, the ventilation holes on both sides and rear panel of the equipment
cabinet must remain free of obstructions.
INSTRUMENT FAMILIARIZATION
INTRODUCTION
The procedures in this section are designed to assist you
in quickly becoming familiar with the 2213. They provide
information which demonstrates the use of all the controls,
connectors, and indicators and will enable you to efficiently operate the instrument.
Before proceeding with these instructions, verify that
the POWER switch is OFF (push button out), then plug
the power cord into the ac-power-input-source outlet.
If during the performance of these procedures an improper indication or instrument malfunction is noted, first
verify correct operation of associated equipment. Should
the malfunction persist, refer the instrument to qualified
service personnel for repair or adjustment.
The equipment listed in Table 1, or equivalent equipment,
procedures.
is
required to complete these familiarization
Equipment Required for Instrument
Familiarization Procedure
Description
Calibration
Generator
Dual-Input
Coupler
Cable
(2 required)
Adapter
Termination
Standard-ampl
Signal amplitude: 2 mV to 50 V.
Output signal: 1 -kHz square wave.
Fast-rise repetition rate: 1 to
Rise time: 1 ns or less.
Signal amplitude: 100
Aberrations:
Connectors: bnc-female-to-dual-bnc-male.
Impedance: 50
Connectors: bnc.
Connectors: bnc-female-to-bnc female.
Impedance: 50
Table 1
Minimum Specification
itude accuracy:
100
mV
to 1 V.
+2%.
s2.
Length: 42 in.
a.
Connectors: bnc.
50.25%.
kHz.
10
Page 9

2213 Operators
BASELINE TRACE
First obtain a baseline trace, using the following
procedure.
1. Preset the instrument front-panel controls as follows:
Display
AUTO INTENSITY
AUTO FOCUS
Vertical (Both Channels)
AC-GND-DC
VOLTS/DlV
VOLTS/D IV Variable
VERTICAL MODE
INVERT
POSITION
Horizontal
SEC/DIV
SEC/DlV
HORIZONTAL MODE
X 10 Magnifier
Variable
POSITION
DELAY TIME
Range Selector
MULTIPLIER
Trigger
SLOPE
LEVEL
MODE
EXT COUPLING
SOURCE
VAR
HOLDOFF
INT
Fully counterclockwise
(minimum)
Midrange
AC
50m (IX)
Calibrated detent
(fully clockwise)
CH 1
Off (button out)
Midrange
0.5
ms
Calibrated detent
(fully clockwise)
NO DLY
Off (variable knob in)
Midrange
0.2 ms
Fully counterclockwise
J(lever
Midrange
AUTO
AC
INT
Fully counterclockwise
VERT MODE
up)
NOTE
Normally, the resulting trace will be parallel with
the center horizontal graticule line and should not
require adjustment. If trace alignment is required,
see the
under “Opera tor’s Adjustments.
“Trace Rotation
adjustment procedure
”
”
DISPLAYING A SIGNAL
ne
1
obtaining a baseli
After
connectan input signal and
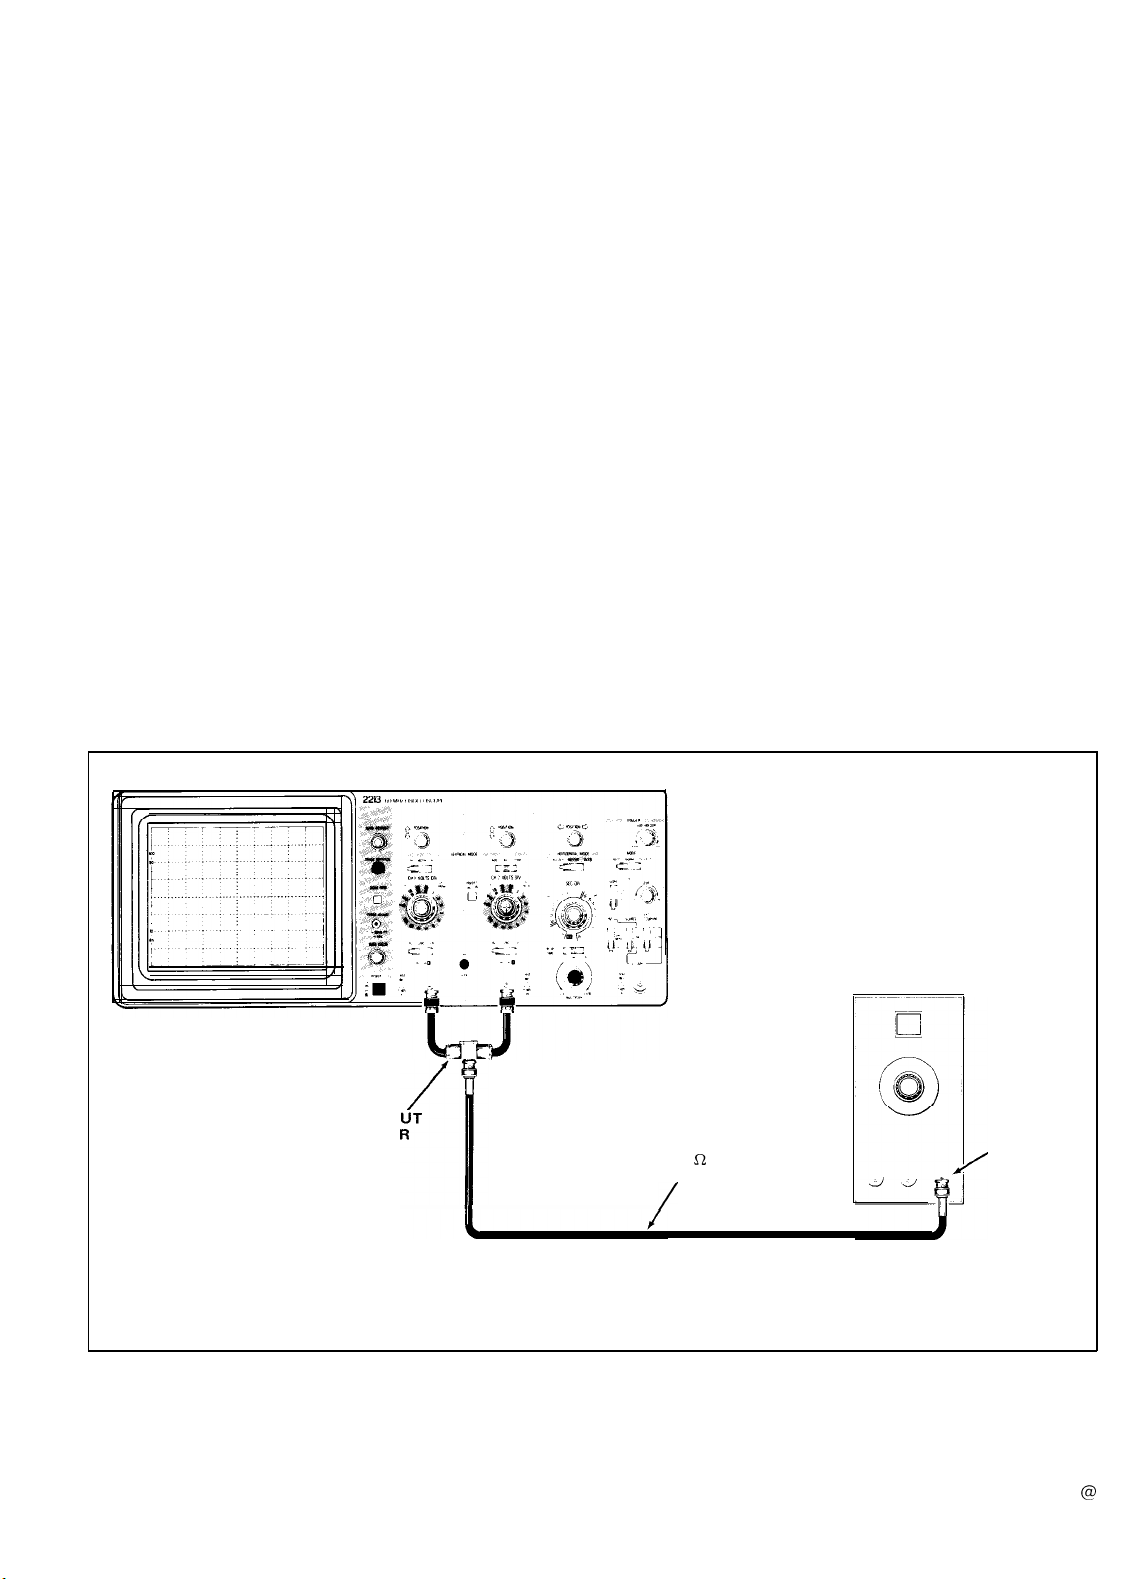
1. Connect the calibration generator standard-amplitude
output to both the CH 1 and CH 2 inputs as shown in
Figure 9.
2.
Set the calibration generator for a standard-amplitude
1-kHz
square-wave signal and adjust its output to obtain
a vertical display of 4 divisions.
3. Adjust the Channel 1 POSITION control to center
the display vertically on the screen.
4. Adjust the TRIGGER LEVEL control, if necessary,
to obtain a stable triggered display.
The
TRIG’D
that the sweep is triggered.
5. Rotate the AUTO FOCUS control between its
maximum
The display should become blurred on either side of the
optimum control setting.
indicator should illuminate to indicate
clockwise and counterclockwise positions.
trace,you are now ready to
di
splay it
NOTE
on the crt screen.
2. Press in the POWER switch button (ON) and allow
the instrument to warm up for 20 minutes.
3. Adjust the AUTO INTENSITY control for desired
display brightness.
4. Adjust the Vertical
controls to center the trace on the screen.
and Horizontal POSITION
@
6. Set the AUTO FOCUS control for a sharp,
defined display over the entire trace length.
7. Move the display off the screen using the Channel 1
POSITION control.
8. Press in and hold the BEAM FIND push button;
the display should reappear on the screen. Adjust the
Channel 1 and Horizontal POSITION controls to center
the trace both vertically and horizontally. Release the
well-
11
Page 10
2213 Operators
BEAM FIND
button; the display should remain within
5.
Set the Channel 1 AC-GND-DC switch to AC.
the viewing area.
6. Observe that the display is centered approximately
at the center horizontal line.9. Adjust the AUTO INTENSITY control counterclock-
wise until the display disappears.
7.
Set the CH 1
10. Press in and hold the BEAM FIND push button;
observe that a 2-division vertical display appears.
the display should reappear. Release the BEAM FIND
button and adjust the AUTO INTENSITY control to
desired display brightness. 8. Rotate the CH
fully counterclockwise.
Using the Vertical Section
1.
Set the Channel 1 AC-GND-DC switch to GND.
2. Adjust the trace to the center horizontal graticule
line.
3. Set the Channel 1 AC-GND-DC switch to DC.
4. Observe that the bottom of the display remains at
the center horizontal graticule line (ground reference).
9. Observe that minimum vertical deflection occurs
when the
VOLTS/DlV
clockwise.
IO. Rotate the CH 1 VOLTS/DIV
clockwise
11.
to the CAL detent.
Select
CH 2 VERTICAL MODE and again perform
preceding steps 1 through 10 using Channel
Performance should be similar to Channel 1.
VOLTS/DlV
1
switch to 0.1 (IX) and
VOLTS/DIV
Variable control
Variable contol is fully counter-
Variable control
2
controls.
fully
12
CALIBRATION
GENERATOR
DUAL-INP
COUPLE
50
!2
CABLE
/
Figure 9. Initial setup for instrument familiarization procedure.
AMPL
OUTPUT
3397-10
Page 11

12.
Set both Channel 1 and Channel 2
switches to DC. Ensure that both CH 1 and CH 2 VOLTS/
DIV switches are set to 0.1
(1 X)
for 2-division displays.
AC-GND-DC
2213
Operators
24.
Select CH 1
AC-GND-DC switch to DC. Recenter the display on the
screen.
VERTICAL MODE
and set Channel 1
13. Select BOTH and ADD VERTICAL MODE and
observe that the resulting display is 4 divisions in amplitude.
Both Channel 1 and Channel 2 POSITION controls should
move the display. Recenter the display on the screen.
14. Press in the Channel 2 INVERT push button to invert
the Channel 2 signal.
straight line,
Observe that
15.
he algebraic su
that t
16. Set the CH 2
17. Observe the 2-division display, indicating
algebraic sum of the two signals is no longer zero.
18. Press in the Channel 2 INVERT push button again
to release it. Observe a noninverting display having a
6-division signal amplitude.
19. Set both Channel 1 and Channel 2 AC-GND-DC
switches to GND.
20. Set the CH 1
the displ
m of the
VOLTS/DIV
VOLTS/DlV
is a
aY
nals is zero.
tw
‘0
sig
switch to 50 m (1X).
switch to 50 m (1X).
indicating
that the
Using the Horizontal Section
1. Return the
the display for future comparison in step 3.
3. Observe that the display is similar to that obtained
in step 1.
5. Push in the
a Xl sweep.
6. Return the
7. Rotate the VAR
clockwise position.
SEC/DIV
SEC/DIV
SEC/DIV
switch to 0.5 ms and note
Variable control knob to obtain
switch to 0.5 ms.
HOLDOFF
control to its maximum
8. Observe that the
holdoff
21. Select ALT VERTICAL MODE. Position the Channel 1 trace two divisions above the center graticule line and
position the Channel 2 trace two divisions below the center
graticule line.
22. Rotate the
(except X-Y). The display will alternate between channels
at all sweep speeds. This mode is most useful for sweep
speeds from 0.05
23. Select CHOP VERTICAL MODE and rotate the 11. Observe that the sweep rate is approximately 2.5
SEC/DIV
trace display will be presented at all sweep speeds, but
unlike the ALT mode, both Channel 1 and Channel 2
signals are displayed for each sweep speed on a time-shared
basis. This mode is most useful for sweep speeds from
0.5 ms to 0.5 s per division.
switch throughout is range (except X-Y). A dual- times slower than in step 9, as indicated by more cycles
SEC/DIV
pus
switch throughout its range
to 0.2 ms per division.
displayed on the screen.
detent (fully clockwise).
between sweeps
10. Rotate the
CAL detent to its maximum counterclockwise position.
12. Return the
crt trace starts to flicker as the
is increased.
SEC/DIV
SEC/DIV
Variable control out of the
Variable control to the CAL
13
Page 12

2213 Operators
Using the Delay Time Controls
Select
1.
2.
start of the intensified zone moves along the display.
3. Select DLY’D HORIZONTAL MODE and observe
that the intensified zone, previously viewed with
selected, is now displayed on the crt screen.
4.
Observe that the display moves continuously across
the screen as the MULTIPLIER control is rotated.
5. Set the
magnification of the display is approximately 100 times
greater.
6.
the
SEC/DIV
INTENS
Rotate the MULTIPLIER control; observe that the
Select NO DLY HORIZONTAL MODE and return
switch to 0.5 ms.
HORIZONTAL MODE.
SEC/DIV
switch to 5 ps and observe that the
INTENS
Using the Trigger Section
1. Rotate the TRIGGER LEVEL control between its
maximum clockwise and counterclockwise positions. The
display will remain triggered throughout the rotation of the
control.
2. Return the TRIGGER LEVEL control to the
midrange position.
3. Set the TRIGGER SLOPE switch to
Observe that the display starts on the negative-going slope
of the applied signal.
7_
(minus).
7. Set the TRIGGER MODE switch to NORM.
8. Rotate the TRIGGER LEVEL control between its
maximum
Observe that the TRIG’D indicator illuminates only when
the display is correctly triggered.
9.
the TRIGGER SOURCE switch to EXT.
10. Remove the calibration signal from the CH 2 input
connector and connect it to the EXT INPUT connector.
11.
adjust the output of the calibration generator to provide
a 4-division display. Adjust the TRIGGER LEVEL control
for a stable display and note the range over which a stable
display can be obtained
12. Set the TRIGGER SOURCE switch to
13. Observe that adjustment of the TRIGGER LEVEL
control provides a triggered display over a narrower range
than in preceding step 11, indicating trigger-signal
attenuation.
14.
connector and reconnect it to the CH 2 input connector.
Set the TRIGGER SOURCE switch to INT and adjust the
TRIGGER LEVEL control
clockwise and counterclockwise positions.
Set
the TRIGGER MODE switch to AUTO and set
Set
the CH 1
VOLTS/DIV
(for comparison in step 13).
switch to 0.5
EXT+lO.
(IX)
and
Remove the calibration signal from the EXT INPUT
for a stable display.
Using the X-Y Mode
Set both the CH 1 and CH 2
1.
to 1 (IX) and adjust the generator output to provide a
5-division
display.
VOLTS/DIV
switches
4.
Return the TRIGGER SLOPE switch to f (plus).
Observe that the display starts on the positive-going slope
of the applied signal.
5. Set the INT switch to CH 1, select CH 2 VERTICAL
MODE, and set the Channel
Observe that the display free-runs. Return the Channel
AC-GND-DC switch to AC.
6. Set the
MODE, and set the Channel 2 AC-GND-DC switch to GND.
Observe that the display free-runs. Return the Channel 2
AC-GND-DC switch to AC and set the INT switch to
VERT MODE.
INT
switch to CH 2, select CH 1 VERTICAL
1
AC-GND-DC switch to GND.
2. Select X-Y mode by switching the
to its fully counterclockwise position.
3. Adjust the AUTO INTENSITY control for desired
display brightness.
diagonally. This display can then be positioned horizontally
with the Horizontal POSITION control and vertically with
the Channel 2 POSITION control. Note that the dots are
1
separated by 5 horizontal divisions and 5 vertical divisions.
4. Set both the CH 1 and CH 2
to 2 (1X). Note that the dots are now separated by 2.5
horizontal divisions and 2.5 vertical divisions.
5. Return the
AUTO INTENSITY control for desired display brightness.
Observe that two dots are displayed
SEC/DIV
switch to 0.5 ms and adjust the
SEC/DIV
VOLTS/DlV
REV OCT 1981
switch
switches
Page 13

2213
Operators
Using the Z-Axis Input
1. Disconnect the dual-input coupler from the CH 2
input connector and connect a bnc-female-to-bnc-female
adapter to the disconnected end of the coupler.
2. Connect a 42-inch,
INPUT connector (located on the rear panel) to the
input coupler via the bnc-female-to-bnc-female adapter.
3. Set the Channel
adjust the output of the calibration generator to provide
a
5-division
4. Observe that the positive peaks of the waveform are
blanked, indicating intensity modulation (adjust AUTO
INTENSITY control as necessary).
5. Disconnect the
connector and disconnect the dual-input coupler from the
CH 1 input connector.
display.
50-a
bnc cable from the
1
VOLTS/DIV
50-a
cable from the
Z-AXIS
dual-
switch to 1 (IX) and
Z-AXIS INPUT
TV SIGNAL DISPLAYS
Displaying a TV Line-rate Signal
1. Perform the steps and set the controls as outlined
under Baseline Trace and Signal Display to obtain a basic
display of the desired TV signal.
2. Set A
CH 2 as appropriate for applied signal.
SEC/DIV
to 10
I_LS,
and A & B INT to CH 1 or
4.
Adjust the A TRIGGER LEVER control for a stable
display, and AUTO INTENSITY for desired display brightness. If necessary, adjust VERTICAL
VOLTS/DIV
control to
obtain 5 divisions or greater amplitude for a stable display.
Displaying a TV Field-rate Signal
1. Perform Step 1 under Displaying a TV Line-rate
Signal.
2. Set A
FIELD and A
SEC/DIV
to 2 ms, A TRIGGER MODE to TV
&
B INT to CH 1 or CH 2 as appropriate for
the applied signal.
3. Perform Step 3 and 4 under Displaying a TV Line-rate
Signal.
4. To display either Field 1 or Field 2 individually at faster
sweep rates (displays of less than one full field), set VERTICAL MODE to BOTH and ALT simultaneously. This synchronizes the Channel 1 display to one field and the
Channel 2 display to the other field.
To change the field that is displayed, interrupt the triggering
by repeatedly setting the AC GND DC switch to GND or disconnecting the signal from the applied signal input until the
other field is displayed. To display both fields simultaneously, apply the input signal to both the CH 1 and CH 2 inputs
via two probes, two cables, or through a dual-input coupler.
--
3. Set A TRIGGER SLOPE for a positive-going signal
(lever up) if the applied TV signal sync pulses are positivegoing, or for a negative-going signal (lever down) if the
TV
sync pulses are negative-going.
OPERATOR’S ADJUSTMENTS
INTRODUCTION
Two adjustments should be performed before making
measurements with your oscilloscope: Trace Rotation and
Probe Compensation. Before proceeding with the following
adjustment instructions,
is installed (refer to the “Preparation for Use” information).
Verify that the POWER switch is OFF (button out), then
plug the power cord into the ac-power-input source. Push in
the POWER switch (ON) and allow a 20-minute warm-up
time before starting these adjustments.
TRACE ROTATION
set instrument
1. Pre
trace (ref
baseline trace to the center horizontal graticule line.
‘er to “lnstrumen
2. Use the Channel 1 POSITION control to move the
verify that the correct line fuse
controlsandobta
t Familiarization”).
in a baseline
To examine either a TV Field-rate or Line-rate signal in more
detail, either the X10 Magnifier or HORIZONTAL
MODE
functions may be employed as described for other signals
elsewhere in this manual.
NOTE
Normally, the resulting trace will be parallel to the
cen
ter horizon
tal
graticule line, and the Trace
Rotation adjustment should not be required.
3.
If
the resulting trace is not parallel to the center
horizontal graticule line, use a small flat-bit screwdriver to
adjust the TRACE ROTATION control and align the trace
with the center horizontal graticule line.
PROBE COMPENSATION
Misadjustment of probe compensation is one of the
sources of measurement error. Most attenuator probes
are equipped with compensation adjustment. To ensure
optimum measurement accuracy, always compensate the
oscilloscope probe before making measurements. Probe
compensation is accomplished as follows:
REV OCT 1981
15
Page 14

2213 Operators
1. Preset instrument controls and obtain a baseline
trace (refer to “Instrument Familiarization”).
2.
Connect the two 10X probes (supplied with the
instrument) to the CH 1 and CH 2 input connectors.
CORRECT
FLAT
3. Set both
VOLTS/DIV
switches to 0.1 (10X PROBE)
and set both AC-GND-DC switches to DC.
4. Select CH 1 VERTICAL MODE and insert the tip
of the Channel 1 probe in the PROBE ADJUST output
jack.
5. Using the approximately
1-kHz
PROBE ADJUST
square-wave signal as the input, obtain a display of the
signal (refer to
“Instrument Familiarization”).
6. Set the SEC/DIV switch to display several cycles of
the PROBE ADJUST signal. Use the Channel
1
POSITION
control to vertically center the display.
7. Check the waveform presentation for overshoot and
rolloff
(see Figure 10). If necessary, adjust the probe
compensation for flat tops on the waveforms. Refer to the
instructions supplied with the probe for details of com-
pensation adjustment.
BASIC APPLICATIONS
After becoming familiar with all the capabilities of the
2213 Oscilloscope, the operator can then adopt a convenient method for making a particular measurement. The
following information describes the recommended procedures and techniques for making basic measurements
with your instrument.
presetting instrument controls and obtaining a baseline
trace, refer to the
and perform steps 1 through 4 under “Baseline Trace.”
NONDELAYED MEASUREMENTS
When a procedure first calls for
“Instrument Familiarization” section
OVER COM-
PENSATED
(OVERSHOOT)
UNDER COM-
PENSATED
(ROLLOFF)
465/DM-O-5
Figure 10. Probe compensation.
8.
Select CH 2 VERTICAL MODE and connect the
Channel 2 probe tip to the PROBE ADJUST output jack.
9. Use the Channel 2 POSITION control to vertically
center the display and repeat step 7 for the Channel 2
probe.
2.
Apply the ac signal to either vertical-channel input
connector and set the VERTICAL MODE switch to display
the channel used.
3. Set the appropriate
VOLTS/DIV
switch to display
about five divisions of the waveform, ensuring that the
VOLTS/DIV
Variable control is in the CAL detent.
4. Adjust the TRIGGER LEVEL control to obtain a
stable dispaly.
AC Peak-to-Peak Voltage
To perform a peak-to-peak voltage measurement, use the
following procedure:
NOTE
This procedure may also be used to make voltage
measurements between any two points on the
waveform.
1. Preset instrument controls and obtain a baseline
trace.
16
5. Set the SEC/DIV switch to a position that displays
several cycles of the waveform.
6. Vertically position the display so that the negative
peak of the waveform coincides with one of the horizontal
graticule lines (see Figure 11, Point A).
7. Horizontally position the display so that one of the
positive peaks coincides with
the center vertical graticule
line (see Figure 11, Point B).
8. Measure the vertical deflection
(see
Figure 11, Point A to Point B).
from peak to peak
REV OCT 1981
Page 15

2213 Operators
POSITION TO
CENTERLINE
MEASURE AMPLITUDE
FROM@TO@
Figure 11. Peak-to-peak waveform voltage.
(1738-l 612038-l 5
2. Apply the signal to either vertical-channel input
connector and set the VERTICAL MODE switch to display
the channel used.
3. Verify that the
the CAL detent and set the AC-GND-DC switch to GND.
4. Vertically position the baseline trace to the center
horizontal graticule line.
5. Set the AC-GND-DC switch to DC. If the waveform
moves above the centerline of the crt, the voltage is positive.
If the waveform moves below the centerline of the crt,
the voltage is negative.
VOLTS/DlV
Variable control is in
NOTE
If using Channel 2, ensure that the Channel
2
INVERT switch is in its noninverting mode (push
NOTE
button out).
If the amplitude measurement is critical or if the
trace is thick (as a result of hum or noise on the
signal), a more accurate value can be obtained by
measuring from the top of a peak to the top of a
valley. This will eliminate trace thickness from the
measurement.
9.
--
--
Calculate the
lowing formula:
vertical
Volts (p-p) = deflection x
(divisions)
peak-to-peak voltage, using the
VOLTS/DIV
switch
setting
probe
x attenuation
factor
fol-
6.
Set the AC-GND-DC switch to GND and position the
baseline trace to a convenient reference line, using the
Vertical POSITION control. For example, if the voltage to
be measured is positive, position the baseline trace to the
bottom graticu le I ine.
measured, position the baseline trace to the top graticule
line. Do not move the Vertical POSITION control after
this reference line has been established. The ground reference line can be checked at any later time by switching the
AC-GND-DC switch to GND.
7. Set the AC-GND-DC switch to DC.
If a negative voltage is to be
__ __
EXAMPLE:
tion is 4.6 divisions (see Figure 11) with a
switch setting of 0.5, using a 10X probe.
Substituting the given values:
Volts (p-p)
The measured peak-to-peak vertical deflec-
VOLTS/DIV
=
4.6 div x 0.5
V/div
x 10 = 23 V.
Instantaneous DC Voltage
To measure the dc level at a given point on a waveform,
use the following procedure:
1. Preset instrument controls and obtain a baseline
trace.
@
8. If the voltage-level measurement is to be made with
respect to a voltage level other than ground, apply the
reference voltage to the unused vertical-channel input
connector. Then position its trace to the reference line.
9. Adjust the TRIGGER LEVEL control to obtain a
stable display.
10. Set the
several cycles of the signal.
11.
Measure the divisions of vertical deflection between
the reference line and the desired point on the waveform
at which the dc level is to be determined (see Figure 12).
SEC/DIV
switch to a position that displays
17
Page 16

2213 Operators
LINE
VERTICAL
DEFLECTION
POSITIVE
REFERENCE
1
_INE
, -
MEASURE POSITIVE
AMPLITUDE
@TO@
OR
The following general precautions should be observed
whenusing the ADD mode.
Do not exceed the input voltage rating of the oscillo-
a.
scope.
b.
Do not apply signals that exceed the equivalent of
about eight times the
VOLTS/DIV
switch settings,
since large voltages may distort the display. For
example, with a
VOLTS/DIV
switch setting of .5, the
voltage applied to that channel should not exceed
approximately 4 volts.
Use Channel 1 and Channel 2 POSITION control
C.
settings which most nearly position the signal on each
channel to midscreen, when viewed in either CH 1 or
CH 2 VERTICAL MODE. This ensures the greatest
dynamic range for ADD mode operation.
Figure 12. Instantaneous voltage measurement.
12. Calculate the instantaneous voltage, using the fol-
lowing formula:
Instantaneous
Voltage
VOLTS/DlV
X
switch
setting
EXAMPLE:
vertical
= deflection x
(divisions)
probe
x attenuation
factor
The measured vertical deflection from the
reference line is 4.6 divisions (see Figure
form is above the reference line, the
polarity
(+ or -)
VOLTS/DIV
12),
the wave-
switch
is set to 2, and a 10X attenuator probe is being used.
Substituting the given values:
Instantaneous Voltage
4.6 div x
(+1)
x 2
V/div
=
x 10 = 92 V.
Algebraic Addition
With the VERTICAL MODE switch set to BOTH and
ADD, the waveform displayed is the algebraic sum of the
signals applied to the Channel
(CH
1 +
CH 2). If the Channel 2 INVERT push button is
pressed in,
the waveform displayed is the difference
between the signals applied to the Channel 1 and Channel 2
inputs (CH 1
-
CH 2). The total deflection factor in the
ADD mode is equal to the deflection factor indicated by
either
VOLTS/DIV
switch (when both
switches are set to the same deflection factor). A common
use for the ADD mode is to provide a dc offset for a signal
riding on top of a high dc level.
1
and Channel 2 inputs
VOLTS/DIV
d.To attain similar response from each channel, set
both the Channel 1 and Channel 2 AC-GND-DC
switches to the same position.
EXAMPLE: Using the graticule center line as 0 V, the
Channel 1 signal is at a 3-division, positive dc level
(see Figure
1. Multiply 3 divisions by the
13A).
VOLTS/DIV
switch
setting to determine the dc-level value.
2. To the Channel 2 input connector, apply a negative
dc level (or positive level, using the Channel 2 INVERT
switch) whose value was determined in step 1 (see Figure 13B).
3. Select ADD and BOTH VERTICAL MODE to place
the resultant display within the operating range of the
vertical POSITION controls (see Figure 13C).
Common-Mode Rejection
The ADD mode can also be used to display signals
that contain undesirable frequency components. The
undesirable components can be eliminated through
common-mode rejection. The precautions given under the
preceding “Algebraic Addition” procedure should be
observed.
EXAMPLE: The signal applied to the Channel 1 input
connector contains unwanted ac-input-power-source
frequency components (see Figure 14A). To remove
the undesired components, use the following procedure:
1. Preset instrument controls and obtain a baseline
trace.
18
@
Page 17

2213
Operators
t i
100
POSITIVE LEVEL
I I I
9
t 1
(A) CHANNEL 1 SIGNAL
WITH 3 DIVISIONS OF
POSITIVE DC LEVEL.
Figure 13. Algebraic addition.
2. Apply the signal containing the unwanted line-
frequency components to the Channel 1 input.
3. Apply a line-frequency signal to the Channel 2 input.
4. Select BOTH and ALT VERTICAL MODE and press
in the Channel 2 INVERT push button.
i
NEGATIVEOFFSETI
(B)
CHANNEL 2 DISPLAY
WITH 3 DIVISIONS OF
NEGATIVE OFFSET.
4.
period of the waveform. Ensure that the
control is in the CAL detent.
5. Position the display to place the time-measurement
points on the center horizontal graticule line (see Figure 15).
Set
the
SEC/DIV
1
(C)
RESULTANT DISPLAY
465/DM-0-l9
switch to display one complete
SEC/DIV
Variable
5. Adjust the Channel 2
VOLTS/DIV
switch and Variable control so that the Channel 2 display is approximately
the same amplitude as the undesired portion of the Channel 1 display (see Figure 14A).
6. Select ADD VERTICAL MODE and slightly readjust
the Channel 2
VOLTS/DIV
Variable control for maximum
cancellation of the undesired signal component (see
Figure 14B).
Time Duration
To measure time between two points on a waveform,
use the following procedure:
1. Preset instrument controls and obtain a baseline
trace.
2. Apply the signal to either vertical-channel input
connector and set the VERTICAL MODE switch to display
the channel used.
3. Adjust the TRIGGER LEVEL control to obtain a
stable display.
CH 1 SIGNAL
WITH UNWANTED
LINE FREQUENCY
COMPONENT
CH 2 SIGNAL
FROM LINE
FREQUENCY
SOURCE
(INVERTED)
SIGNAL WITH
LINE FREQUENC
COMPONENT
CANCELED
OUT
(A)
CH 1 AND CH 2 SIGNALS.
(B)
RESULTANT SIGNAL.
Figure 14. Common-mode rejection.
1738-19
@
19
Page 18

2213 Operators
Calculating the reciprocal of time duration:
Figure 15. Time duration.
6.
Measure the horizontal distance between the
measurement points.
7. Calculate time duration, using the following formula:
horizontal
distance x switch
Time
Duration
EXAMPLE:
points
is 8.3 divisions (see Figure
switch is set to 2 ins. The X10 Magnifier switch is
pushed in (1 X magnification).
Substituting the
Time Duration
(divisions)
magnification factor
=
The distance between the time-measurement
given values:
= 8.3 div x 2 ms/div = 16.6 ms
SEC/DIV
setting
15),
and the
SEC/DIV
1738-20
time-
Frequency
=
time
1
duration =
1
-
16.6 ms
Rise Time
Rise-time measurements use the same methods as time
duration, except that the measurements are made between
the 10% and 90% points on the leading edge of the waveform (see Figure 16). Fall time is measured between the
90% and 10% points on the trailing edge of the waveform.
I
1. Preset instrument controls and obtain a baseline
trace.
2. Apply an exact 5-division signal to either
channel input connector and set the VERTICAL
switch to display the channel
VOLTS/DIV
Variable control
used. Ensure that the
is in the CAL detent.
NOTE
For rise time greater than 0.2
Variable control may be used to
the VOL TS/D/ V
,us,
obtain an exact
S-division display.
3.
Set the
a
sweep-speed setting that displays several complete cycles
or events (if possible).
4.
Adjust vertical positioning so that the zero reference
of the waveform touches the 0% graticule line and the top
of the waveform touches the 100% graticule line (see
Figure 16).
TRIGGER SLOPE switch to f (plus).
= 60 Hz
vertical-
MODE
Use
Frequency
The frequency of a recurrent signal can be determined
from its time-duration measurement as follows:
1. Measure the time duration of one waveform cycle
using the preceding “Time Duration” measurement
cedu
re.
2. Calculate the reciprocal of the time-duration value
to determine the frequency of the waveform.
EXAMPLE:
of 16.6
The signal in Figure 15 has a time duration
ms.
20
pro-
---I
Figure 16. Rise time.
HORIZONTAL
DISTANCE
#SURE
FROM
-0@
I--
465/DM-0-13
Page 19

5. Set the
display, with the rise time spread horizontally as much
as possible.
6. Horizontally position the display so the 10% point
on the waveform intersects the second vertical graticule
line (see Figure 16, Point A).
7. Measure the horizontal distance between the 10%
and 90% points and calculate the time duration using the
following formula:
Rise Time =
EXAMPLE:
and 90% points is 5 divisions (see Figure
SEC/DIV
knob is pushed in (1 X magnification).
Substituting the given values in the formula:
Rise Time
SEC/DIV
switch is set to 1
=
switch for a single-waveform
horizontal
distance x switch
(divisions)
magnification factor
The horizontal distance between the 10%
5 div x 1
,us/div
1
SEC/DIV
setting
16),
pus.
The X10 magnifier
=
5&&
and the
2213 Operators
7.
If the two signals are of opposite polarity, press
in the Channel 2 INVERT push button to invert the
Channel 2 display (signals may be of opposite polarity due
to
180Hello Hello Hello Hello
phase difference; if so, note this for use later in
the final calculation).
8. Adjust the TRIGGER LEVEL control for a stable
display.
9. Set the
provides three or more divisions of horizontal separation
between the reference points on the two displays. Center
each of the displays vertically (see Figure 17).
10. Measure the horizontal difference between the two
signal reference points and calculate the time difference
using the following formula:
Time
Difference
EXAMPLE:
X10 magnifier knob is pulled out, and the
difference between waveform measurement points is
4.5 divisions.
SEC/DIV switch to a sweep speed which
SEC/DIV
switch
setting
magnification factor
=
The
SEC/DlV
horizontal
x difference
(divisions)
switch is set to
50
ps,
the
horizontal
Time Difference Between Two Time-Related Pulses
The calibrated sweep speed and dual-trace features of
the 2213 allow measurement of the time difference
--
between two separate events. To measure time difference,
use the following procedure:
1. Preset instrument controls and obtain a baseline
trace.
2. Set the TRIGGER SOURCE switch to CH 1.
3. Set both AC-GND-DC switches to the same position,
depending on the type of input coupling desired.
4. Using either probes or cables with equal time delays,
connect a known reference signal to the Channel 1 input
and the comparison signal to the Channel 2 input.
5. Set both
displays.
6. Select BOTH VERTICAL MODE; then select either
ALT or CHOP, depending on the frequency of input
signals.
VOLTS/DIV
l
switches for 4- or 5-division
Substituting the given values in the formula:
Time
Difference
CHANNEL 1 (REFERENCE)
Figure 17. Time difference between two time-related
50&div
=
I
4
HORIZONTAL
’
DIFFERENCE
10
x 4.5 div
i
I-
1
= 22.5
,CHANNEL
ps
2
465/DM-0-14
pulses.
@
21
Page 20

2213 Operators
Phase Difference
In a similar manner to “Time Difference,” phase comparison between two signals of the same frequency can be
made using the dual-trace feature of the 2213. This method
of phase difference measurement can be used up to the
frequency limit of the vertical system. To make a phase
comparison, use the following procedure:
1.
Preset instrument controls and obtain a baseline
trace, then set the TRIGGER SOU RCE switch to CH 1.
2. Set both AC-GND-DC switches to the same position,
depending on the type of input coupling desired.
3. Using either probes or coaxial cables with equal time
delays, connect a known reference signal to the Channel 1
input and the unknown signal to the Channel 2 input.
4. Select BOTH VERTICAL MODE; then select either
ALT or CHOP, depending on the frequency of the input
signals. The reference signal should precede the comparison
signal in time.
5. If the two signals are of opposite polarity, press
in the Channel 2 INVERT push button to invert the
Channel 2 display.
Phase
Difference
EXAMPLE:
horizontal
=
difference
(divisions)
The horizontal difference is 0.6 division
with a graticule calibration of
horizontal
graticule
X
calibration
(deg/div)
45’
per division as shown
in Figure 18.
Substituting the given values into the phase difference
formula:
Phase Difference = 0.6 div x
45’/div
=
27’
More accurate phase measurements can be made by
using the X10 Magnifier function to increase the sweep rate
without changing the
EXAMPLE:
SEC/DIV
Variable control setting.
If the sweep rate were increased 10 times
with the magnifier (X10 Magnifier out), the magnified
horizontal graticule calibration would be
divided by 10 (or
4,5O/division).
Figure 19 shows the
45O/division
same signals illustrated in Figure 18, but magnifying
the displays results in a horizontal difference of 6
divisions between the two signals.
6. Set both
VOLTS/DIV
switches and both Variable
controls so the displays are equal in amplitude.
7. Adjust the TRIGGER LEVEL control for a stable
display.
8. Set the
SEC/DIV
switch to a sweep speed which
displays about one full cycle of the waveforms.
9. Position the displays and adjust the
SEC/DIV
Variable control so that one reference-signal cycle occupies
exactly 8 horizontal graticule divisions at the 50% rise-time
points (see Figure 18). Each division of the graticule now
represents 45” of the cycle (360”
-+
8 divisions), and the
horizontal graticule calibration can be stated as 45” per
division.
10. Measure the horizontal difference between corresponding points on the waveforms at a common horizontal graticule line (50% of rise time) and calculate the
phase difference using the following formula:
Substituting the given values in the phase difference
formula:
Phase Difference = 6 div x
CHANNEL 1
(REFERENCE)
II-
I
8 DIVISIONS
\vvv
Figure 18. Phase difference.
CHANNEL 2
r
(LAGGING)
I I
I
I
4.5’/div
=
T
I
I -1
DIFFERENCE
27’
MEASURE
HORIZONTAL
465/DM-0-15
22
Page 21

2213 Operators
CHANNEL 1
(REFERENCE)
;_
Figure 19. High-resolution phase difference.
HORIZONTAL
DIFFERENCE
CHANINEL 2
’
7
MEASURE
TIME FROM
@TO@
465/DM-O-16
Amplitude Comparison
In some applications it may be necessary to establish
a set of deflection factors other than those indicated by
the
VOLTS/DIV
paring unknown signals to a reference signal of known
amplitude. To accomplish this, a reference signal of known
amplitude is first set to an exact number of vertical
divisions by adjusting the
control. Unknown signals can then be quickly and
accurately compared with the reference signal without
disturbing the setting of the
The procedure is as follows.
switch settings. This is useful for com-
VOLTS/DlV
VOLTS/DlV
switch and Variable
Variable control.
5. Disconnect the reference signal and apply the
unknown signal to be measured to the same channel input.
Adjust the
sufficient vertical deflection to make an accurate measurement. Do not readjust the
6.
following formula:
Arbitrary
Deflection = conversion x
7. Measure the vertical deflection of the unknown signal
in divisions and calculate its amplitude using the following
formula:
Unknown arbitrary
Amplitude factor
EXAMPLE: The reference signal amplitude is 30 V,
with a
DIV Variable control adjusted to provide a vertical
deflection of exactly 4 divisions,
Substituting these values in the vertical conversion factor
formula:
VOLTS/DIV
Establish an arbitrary deflection factor, using the
Factor
Signal
= deflection x deflection
VOLTS/DIV
switch to a setting that provides
VOLTS/DlV
vertical
factor
switch setting of 5 and the VOLTS/
Variable control.
VOLTS/DIV
switch
setting
vertical
(divisions)
1. Preset instrument controls and obtain a baseline
trace.
2. Apply the reference signal to either vertical channel
input and set the VERTICAL MODE switch to display the
channel used.
3. Set the amplitude of the reference signal to an exact
number of vertical divisions by adjusting the
switch and
4. Establish a vertical conversion factor, using the following formula (reference signal amplitude must be known):
Conversion =
Vertical
Factor
VOLTS/DIV
reference signal amplitude (volts)
deflection x switch
(divisions)
Variable control.
vertical
VOLTS/DIV
VOLTS/DIV
setting
Vertical
Conversion =
Factor
Continuing, for the unknown signal the
switch setting is 1, and the peak-to-peak amplitude spans
five vertical divisions. The arbitrary deflection factor is then
determined by substituting values in the formual:
Arbitrary
Deflection = 1.5 x 1
Factor
The amplitude of the unknown signal can then be
determined by substituting values in the unknown signal
amplitude formula:
Amplitude
= 1.5
30 v
4 div x 5
V/div
x 5 div = 7.5 V
V/div
V/div
= 1.5
= 1.5
VOLTS/DIV
V/div
23
Page 22

2213 Operators
Time Comparison
In a similar manner to “Amplitude Comparison,”
repeated time comparisons between unknown signals and
a reference signal (e.g., on assembly line test) may be easily
and accurately measured with the 2213. To accomplish
this, a reference signal of known time duration is first set
to an exact number of horizontal divisions by adjusting
the
SEC/DIV
Unknown signals can then be compared with the reference
signal without disturbing the setting of the
Variable control. The procedure is as follows:
1. Set the time duration of the reference signal to an
exact number of horizontal divisions by adjusting the
SEC/DIV
2. Establish a horizontal conversion factor, using the
following formula (reference signal time duration must be
known):
Horizontal
Conversion =
switch and the
switch and the
Factor
SEC/DIV
SEC/DlV
reference signal time
duration (seconds)
horizontal
distance x
(divisions)
Variable control.
Variable control.
SEC/DlV
SEC/DIV
switch
setting
SEC/DIV
horizontal distance of exactly 8 divisions.
Su bstitu
on factor
Horizontal
Conversion =
Continuing, for the unknown signal the
switch setting is 50
horizontal divisions. The arbitrary deflection factor is then
determined by substituting values in the formula:
Arbitrary
Deflection
The time duration of the unknown signal can then be
computed by substituting values in the formula:
Duration
Variable control is adjusted to provide a
ting the
formula:
Factor
Factor
Time
given values in the horizontal
2.19 ms
8 div x 0.2 ms/div
JJS,
and one complete cycle spans 7
=
1.37 x 50 psldiv = 68.5
68.5
=
psldiv x 7 div =
= 1.37
480~s
conver-
SEC/DIV
&div
3. For the unknown signal, adjust the
to a setting that provides sufficient horizontal deflection
to make an accurate measurement. Do not readjust the
SEC/D IV Variable control.
4. Establish an arbitrary deflection
following formula:
Arbitrary horizontal
Deflection = conversion x
Factor factor setting
5. Measure the horizontal distance of the unknown
signal in divisions and calculate its time duration using the
following formula:
Time
Duration
6. Frequency of the unknown
mined by
calculating the reciprocaaI of its
EXAMPLE: The reference signal time duration is
2.19 ms, the
arbitrary
= deflection x
factor
SEC/DIV
switch setting is 0.2 ms, and the
signal
SEC/DlV
factor, using the
SEC/DIV
switch
horizontal
distance
(divisions)
an then
C
t
ime
dur
switch
be de
ation.
ter-
The frequency of the unknown signal is then calculated:
Frequency =
-
480
1
pus
= 2.083
kHz
DELAYED-SWEEP MAGNIFICATION
The delayed-sweep feature of the 2213 can be used to
provide higher apparent magnification than is provided by
the X10 Magnifier switch. Apparent magnification occurs
as a result of displaying a selected portion of the trace
(INTENS
(DLY’D HORIZONTAL MODE).
intensified zone indicates both the location and the start
of the sweep that will be displayed in DLY’D HORIZONTAL MODE. Positioning of the intensified zone
(i.e.,setting the amount of time between start of the
sweep and start of the intensified zone) is accomplished
with the MULTIPLIER control and the DELAY TIME
Range Selector switch. At higher sweep speeds the delay
time can be adjusted to allow the starting point of the
intensified zone to occur past the end of the display.
HORIZONTAL MODE) at a faster sweep speed
When
INTENS
HORIZONTAL MODE is selected, the
24
@
Page 23

2213 Operators
With either
selected, the
MULTIPLIER control provide continuously variable
positioning of the start of the delayed sweep. The DELAY
TIME Range Selector switch allows the start of the intensified zone to be placed near the point of interest, while
the MULTIPLIER control provides fine adjustment of the
intensified zone.
When viewing aperiodic signals (such as complex digital
waveforms) with DLY’D HORIZONTAL MODE selected,
the start of the sweep may not be at the same point as the
start of the intensified zone. It may be necessary to connect
a reference signal (of the system under test) to the EXT
INPUT connector to ensure correct display of the selected
portion of the waveform.
Using delayed-sweep magnification may produce a
display with some slight horizontal movement (pulse jitter).
Pulse jitter includes not only the inherent uncertainty of
triggering the delayed sweep at exactly the same trigger
point each time, but also jitter that may be present in the
input signal. If pulse jitter needs to be measured, use the
“Pulse Jitter Time Measurement” procedure which follows
the discussion of “Magnified Sweep.”
INTENS
or
DLY’D HORIZONTAL MODE
DELAY TIME
Range Selector switch and the
6.
Select the DLY’D HORIZONTAL MODE and
increase the sweep speed to magnify the intensified portion
of the sweep (see Figure 20B).
7. The apparent sweep magnification can be calculated
from the following formula:
Apparent
Delayed Sweep =
Magnification
EXAMPLE: Determine the apparent magnification of a
display with an initial
and the second
Substituting the given values:
Apparent
Magnification
second
SEC/DIV
1 x
=
1 x 1
initial
SEC/DIV
SEC/DIV
SEC/DIV
switch setting of 0.1 ms
switch setting of 1
1o-4 s
o-+
=
s
setting
setting
lo2
ps.
= 100
Magnified Sweep
The following procedure explains how to operate the
delayed-sweep feature and to determine the resulting
apparent magnification factor.
1. Preset instrument controls and obtain a baseline trace.
2. Apply the signal to either vertical channel input
connector and set the VERTICAL MODE switch to display
the channel used.
3. Set the appropriate
a display of approximately 5 divisions in amplitude and
center the display.
4. Set the
displays at least one complete waveform cycle.
5.
Select
DELAY TIME Range Selector switch for the appropriate
delayed time. Adjust the MULTIPLIER control to position
the start of the intensified zone to the portion of the
display to be magnified (see Figure 20A).
SEC/DIV
INTENS
VOLTS/DIV
switch to a sweep speed which
HORIZONTAL MODE and set the
switch to produce
POINT OF INTEREST INTENSIFIED
TO BE MAGNIFIED
(A) INTENSIFIED TRACE
(B) MAGNIFIED TRACE
Figure 20. Delayed-sweep magnification.
ZONE
3397-2 1
@
25
Page 24

2213 Operators
Pulse Jitter Time Measurement
To measure pulse jitter time:
1. Perform steps
nif
ied
Sweep” procedure.
2. Referring to Figure 21, measure the difference
between Point A and Point B in divisions and calculate the
pulse jitter time using the following formula:
Pulse
Jitter =
Time
1
through 6 of the preceding
horizontal
difference x
(divisions)
switch setting
“Mag-
second
SEC/DIV
MEASURE
TIME FROM
@TO@
I
I
v
,-
Figure 21. Pulse jitter.
JITTER
1738-34
SPECIFICATION
The following electrical characteristics (Table 2) are
valid for the 2213 when it has been adjusted at an ambient
temperature between
period of at least 20 minutes, and is operating at an
ambient temperature between 0°C and
otherwise noted).
Item listed in the “Performance Requirements” column
are verifiable qualitative or quantitative limits, while items
listed in the
either explanatory notes,
+20°C
and
+30°C,
has had a warm-up
+50°C
(unless
“Supplemental Information” column are
calibration setup descriptions,
performance characteristics for which no absolute limits
are specified, or characteristics that are impractical to
check.
Environmental characteristics are given in Table 3.
The 2213 meets the requirements of
Class 5 equipment, except where otherwise noted.
Physical characteristics of the instrument are listed
in Table 4.
Ml
L-T-288008,
26
Page 25

Table 2
Electrical Characteristics
2213 Operators
Characteristics
Deflection Factor
Range
Accu racy
+2o”c
to
0°C to
+5o”c
Range of
Control.
Step Response
VOLTS/Dl V
+3o”c
Variable
I
2
a l-2-5 sequence.
+3%.
+4%.a
Continuously variable between settings.
2.5 to 1.
Performance Requirements Supplemental Information
VERTICAL DEFLECTION SYSTEM
mV
per division to 10 V per division in
Increases deflection factor by at least
1X gain adjusted with
switch set to 20 mV per division.
10X
gain adjusted with
switch set to 2 mV per division.
Measured with a vertically centered
5-divisio n
source driving a
that is terminated in 50
connector, with the
Variable control in its CAL detent.
reference signal from a
50- a
coaxial cable
VOLTS/DlV
VOLTS/DIV
VOLTS/DIV
a
at the input
50-a
Rise Time
Bandwidth
o”c
to
+4o”c
20 mV to 10 V per Division
mV
to 10 mV per Division
2
+4o”c
to
+5o”c
2 mV to 10 V per Division
Chop Mode Repetition Rate
D
C
to at least 60 MHz.
C
to at least 50 MHz.
D
C
to at least 50 MHz.~
D
5.8 ns or less.
Rise time is calculated from the
formula:
Rise Time =
Measured with a vertically centered
6-division reference signal from a
source driving a
that is terminated in 50
input connector and at the
probe input, with the
Variable control in its CAL detent.
kHz +30%.
250
0.35
BW (in MHz)
50- a
coaxial cable
VOLTS/DIV
s2,
both at the
P6120
50-a
aPerformance Requirement not checked in Service Manual.
@
27
Page 26

2213 Operators
Characteristics
Input Characteristics
Resistance
Capacitance
Maximum Safe Input Voltage
DC Coupled
AC Coupled
Common-Mode Rejection Ratio
(CMRR)
1
.
A
Table 2
I
VERTICAL DEFLECTION SYSTEM
30 pF
400 V (dc + peak ac) or
800 V p-p ac to 1
400 V (dc + peak ac) or
800 V p-p ac to 1
At least 10 to 1 at 10 MHz.
Performance Requirements
-
1
Ma +2% a
.
It3 PF.~
kHz
kHz
(cant)
or
or
(cont)
less.a
less.a
TRIGGER SYSTEM
Supplemental Information
mV
Checked at 20
common-mode signals of
less, with
adjusted for best CMRR at 50
VOLTS/DIV
per division for
8
divisions or
Variable control
kHz.
Trigger Sensitivity
AUTO and NORM
0.4
to 2 MHz, increasing to 1.5 divisions
internal or 250 mV external at 60 MHz.
AUTO Lowest Usable Frequency
TV FIELD
External Input
Maximum Input Voltage
Input Resistance 1
Input Capacitance
AC Coupled
LEVEL Control Range
(with NORM TRIGGER MODE)
INT On screen
!
A
20
2.0 divisions of composite video or
composite
400
800 V p-p ac at 1
30
10 Hz or less at lower -3 dB
division internal or 50
Hz.~
sync.a
V (dc + peak ac) or
kHz
MQ_+2%a
.
pF +3 PF.~
limits.a
or
mV
external
less.a
point.a
External trigger signal from a
source driving a
that is terminated in 50 a at the input
connector.
Will trigger on tv line sync components
in NORM only:
or 50 mV p-p external.
50-Q
coaxial cable
>
0.4 division internal
50-Q
EXT and DC
aPerformance Requirement not checked in Service Manual.
At least
28
+2 V (4 V
p-~).~
Page 27
2213 Operators
Characteristics
LEVEL Control Range (with
NORM TRIGGER MODE)
EXT and DC+ 10
VAR
HOLDOFF
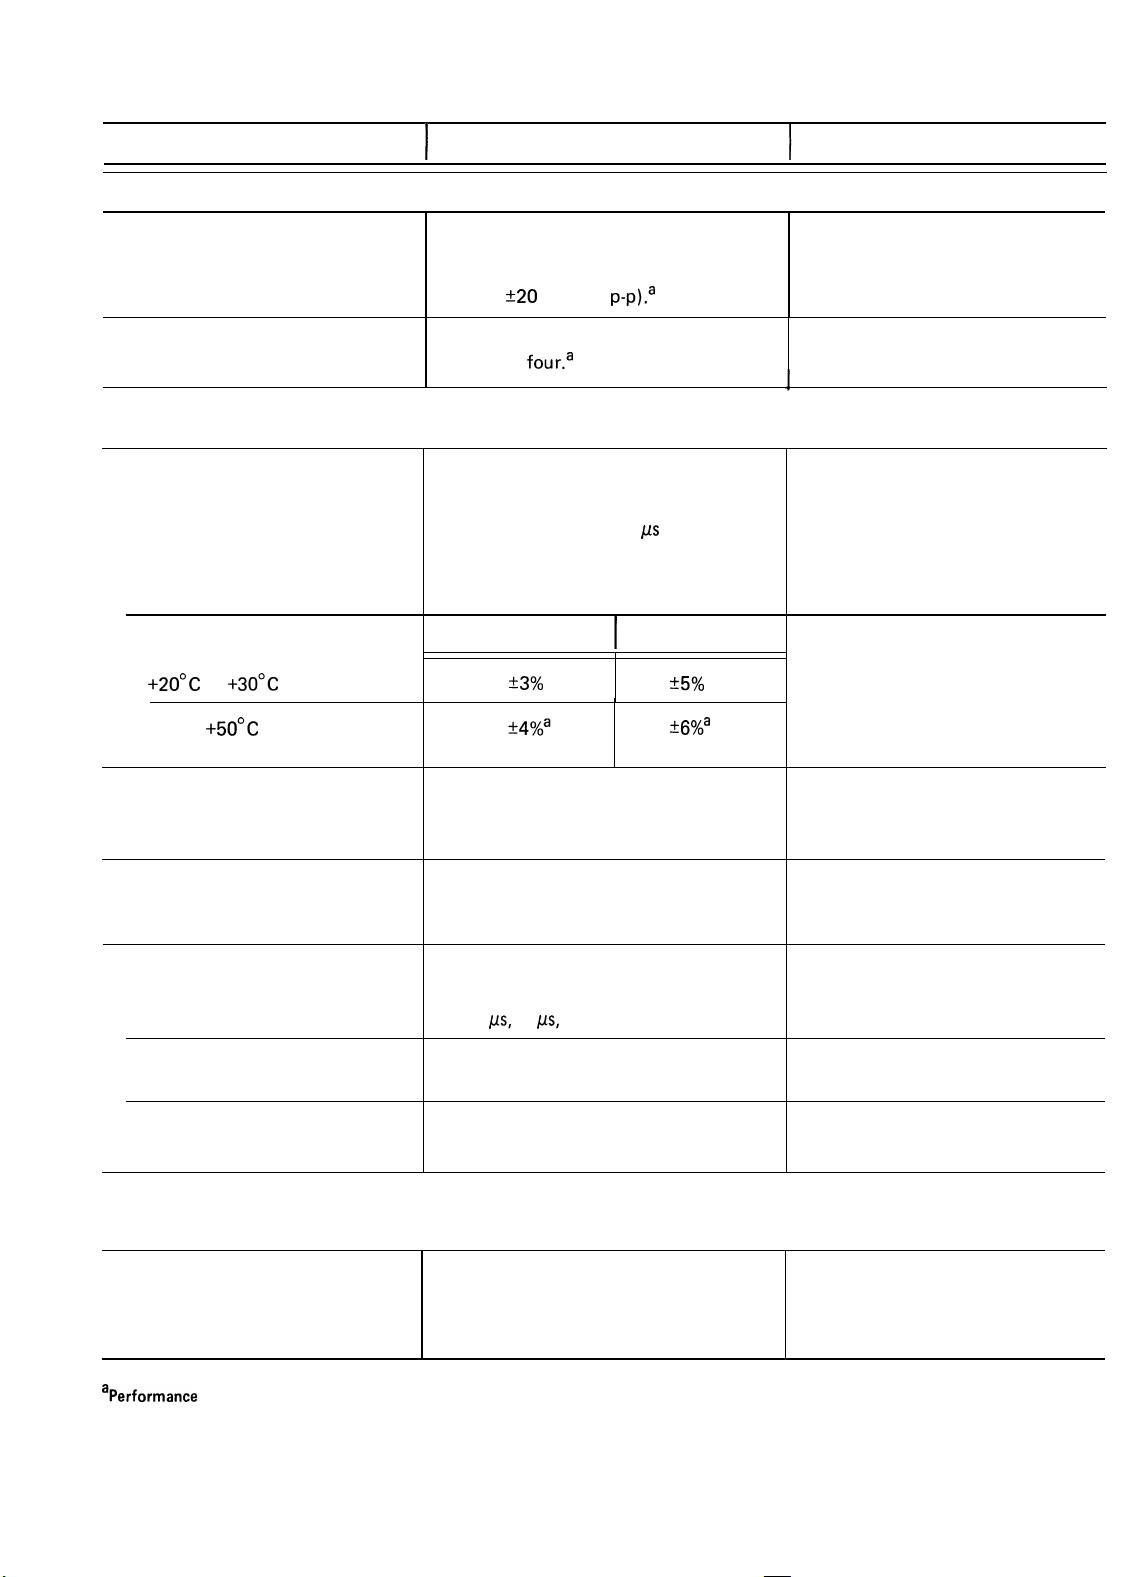
Sweep Rate
Calibrated Range
A Sweep
Accuracy
+2o”c
0” c to
Control Range
to
+3o”c
+5o”c
(cont)
Table 2
I
Performance Requirements
TRIGGER SYSTEM
At least
Increases sweep
a factor of
HORIZONTAL DEFLECTION SYSTEM
0.5 s per division to 0.05
in a l-2-5 sequence. Xl 0 Magnifier
extends maximum sweep speed to 5 ns
per division.
520
V (40 V p-~).~
four.a
Unmagnified
+3%
(cont)
holdoff
I
(cont)
time by at least
pus
per division
Magnified
+5%
+6%a
Supplemental Information
Sweep accuracy applies over the center
8 divisions. Exclude the first 50 ns of
the sweep for both magnified and unmagnified sweep speeds and exclude
anything beyond the 100th magnified
division.
POSITION Control Range
Variable Control Range
Delay Time
Range Selector
MULTIPLIER Control
Jitter
Deflection Factors
Range
Start of sweep to 100th division will
position past the center vertical graticule
line with
Continuously variable between calibrated
settings. Extends the sweep speeds by at
least a factor of 2.5.
Minimum delay is less than selected values
of 0.5
Increases delay time by at least a factor
of 20.
One part, or less, in 5,000 (0.02%) of the
maximum available delay time.
X-Y OPERATION (Xl MAGNIFICATION)
Same as Vertical Deflection System, with
both
CAL detent.
X10
Magnifier.
ps, 10 ps, and 0.2 ms.
VOLTS/DIV
Variable controls in
aPerformance Requirement not checked in Service Manual.
@
29
Page 28

2213 Operators
Characteristics
Deflection Factors
Accuracy
+2o”c
0°C to
Bandwidth
X-Axis
Y-Axis
Phase Difference Between X-
and Y-Axis
Signal at PROBE ADJUST Jack
Voltage
Amplifiers
to
+5o”c
(cont)
+3o”c
Table 2
I
X-Y OPERATION (Xl MAGNIFICATION)
Same as Vertical Deflection System.
+3’ from dc to 50
0.5 v
Performance Requirements
X-Axis Y-Axis
+5%
-+6%a
D
C
to at least 2 MHz.
PROBE ADJUST
220%
.
(cont)
+3%
k4%a
kHz.a
Supplemental Information
(cont)
Measured with a dc-coupled, 5-division
A
reference signal.
Measured with a 5-division reference
signal.
With dc-coupled inputs.
kHz
?20%.a
Repetition Rate
Sensitivity
Usable Frequency Range
Maximum Safe Input Voltage
Input Impedance
Line Voltage Range
Line Frequency Range
Maximum Power Consumption 50
Line Fuse
aPerformance Requirement not checked in Service Manual.
1
5 V causes noticeable modulation.
Positive-going input signal decreases
intensity.
D
C
to 5 MHz.~
30 V (dc + peak ac) or
30 V p-p ac at 1
-
ka +lO% a
10
90 V to 250
48 Hz to 62
W.a
2 A, 250 V, fast.
Z-AXIS INPUT
kHz
or
less.a
.
POWER SOURCE
V.a
Hz.~
I
30
Page 29

Table 2 (cont)
2213
Operator!
Characteristics
Display Area
Standard Phosphor
Nominal Accelerating Voltage
aPerformance Requirement not checked in Service Manual.
80 by 100
I
P3Ka
10,000 V.a
Environmental Characteristics
Characteristics
Performance Requirements
Supplemental Information
CATHODE-RAY TUBE
mm.a
I
Table 3
Description
NOTE
The instrument meets all of the following MIL-T-288006 require-
ments for Class 5 equipment.
Temperature
Operating
Nonoperating
Altitude
Operating
Nonoperating
Humidity (Operating and Nonoperating)
Vibration (Operating)
Shock (Operating and Nonoperating)
I
+5O”C
(+32”F
to
0°C to
-55°C to
I
To 4,500 m (15,000 ft). Maximum operating temperature decreased 1°C per
300
To 15,000 m (50,000 ft).
I
5 cycles (120 hours) referenced to MI
15 minutes along each of 3 major axes at a total displacement of 0.015 inch p-p
(2.4 g
l-minute sweeps. Hold for 10 minutes at 55 Hz. All major resonances must be
above 55 Hz.
30 g, half-sine, 1 I-ms duration; 3 shocks per axis each direction, for a total of
18 shocks.
+75”C (-67’F
m (1,000 ft) above
at
55
Hz), with frequency varied from 10 Hz to 55 Hz to 10 Hz in
+122’F).
to
+167’F).
1,500 m (5,000
L-T-28800B,
ft).
Class 5 instruments.
31
Page 30

223 3 Operators
Table 4
Physical Characteristics
Characteristics
Weight
With Front-Panel Cover, Accessories, and Pouch
Without Front-Panel Cover, Accessories, and Pouch
Domestic Shipping
Height With Feet and Handle
Width
With Handle
Without Handle
Depth
With Front-Panel Cover
Without Front-Panel Cover
With Handle Extended
Description
I
7.6 kg (16.8 lb).
6.1 kg (13.5 lb).
I
137 mm (5.4 in).
I
361 mm (14.2 in).
328 mm (12.9 in).
I
445 mm (17.5 in).
439 mm (17.3 in).
I
511 mm (20.1 in).
I
ACCESSORIES
STANDARD ACCESSORIES
INCLUDED
2 Probes, 10X 1.5-m length
with accessories.
2 Probe accessories, Grabber Tips
1 Operators Manual
1 Service Manual
..................
........
.................
...................
010-6120-01
013-0191-00
070-3397-00
070-3827-00
OPTIONAL ACCESSORIES
Protective Front-Panel Cover.
Cord Wrap and Storage Pouch
Protective Front-Panel Cover, Cord Wrap,
and Storage Pouch.
Low-Cost, General-Purpose Camera.
SCOPE-MOB1
than 18 inches of aisle space, with
storage area in base
Rack-Mount Adapter Kit
..................
LE Cart-Occupies less
..................
. . . . . . . . . . .
. . . . . . . . . . .
........
..............
200-2520-00
016-0677-00
020-0672-00
Order C-5C
Option 04
.Order 200C
016-0466-00
32
Page 31

 Loading...