

Page 1

Instruction Manual
1705A
Spectrum Monitor (SN B040000 and Above)
070-8222-08
Warning
The servicing instructions are for use by qualified
personnel only. To avoid personal injury, do not
perform any servicing unless you are qualified to
do so. Refer to all safety summaries prior to
performing service.
www.tektronix.com
Test Equipment Depot - 800.517.8431 - 99 Washington Street Melrose, MA 02176 - FAX 781.665.0780 - TestEquipmentDepot.com
Page 2

Table of Contents
General Safety Summary ix..............................................
Service Safety Summary xi..............................................
Preface xiii.............................................................
Contacting Tektronix xv
Introduction
Section 1 Introduction 1--1................................................
Typical Configurations 1--1...................................................
Options 1--2...............................................................
Accessories 1--2............................................................
Standard Accessories 1--2.................................................
Optional Accessories 1 --3.................................................
Safety Information 1--3......................................................
ELECTRICAL SPECIFICATION 1--4..........................................
APPLICA TIONS 1--9........................................................
Locating Satellites 1-- 9...................................................
Satellite Footprints 1--10...................................................
Using the 1705A for Satellite Communication 1--11................................
L--Band Input Signals 1--12....................................................
Zeroing in on a Satellite 1--13..................................................
Locating the Satellite 1--13.................................................
Identifying the Satellite 1--13...............................................
Finding The Correct Transponder 1--15.......................................
Optimize Signal Strength 1--15..............................................
Looking at Exciters with the 70 MHz Input 1--16...............................
Miscellaneous Uses for the 1705A 1--17..........................................
Operating Instructions
Section 2 Operating Instructions 2--1.......................................
Front-panel Controls and Indicators 2--1.........................................
FILTER 2--1............................................................
INPUT 2--1............................................................
SWEEP 2--2............................................................
DISPLAY 2--3..........................................................
POSITION 2--4.........................................................
POWER 2--4...........................................................
Rear--Panel Connectors 2--4...................................................
INPUTS 2--4...........................................................
POWER 2--5...........................................................
Powering--up 2--6...........................................................
Measurement Graticule 2--7...................................................
1705A Spectrum Monitor
i
Page 3

Table of Contents
Installation
Section 3 Installation 3--1.................................................
Vertical Scales 2--7......................................................
Horizontal Scales 2 --9....................................................
Center Frequency Readout 2--11................................................
Customizing Frequency Readout 2--14...........................................
Turning On or Off Readout 2--14............................................
Changing Readout Position 2--14............................................
Changing Readout Frequency 2--15..........................................
Test Mode 2--17..........................................................
Locating Ku--Band Satellites 2--17..............................................
Basic Operating Procedure 2--17............................................
Packaging 3--1..........................................................
Electrical Installation 3--1....................................................
Power Source 3--1.......................................................
Mains Frequency and Voltage Ranges 3--1....................................
+18 Volts For Block Down Converter 3--1....................................
Operating Options 3--2...................................................
Mechanical Installation 3--2...................................................
Cabinet Options 3--2.....................................................
Cabinetizing 3--4........................................................
Rack Adapter 3--5.......................................................
Custom Installation 3--8..................................................
Theory of Operation
Section 4 Theory of Operation 4--1.........................................
Overview 4--1..............................................................
Block Diagram 4--1.........................................................
RF Input Circuits (Diagram 1) 4--1..........................................
IF Amplifier Circuits (Diagram 2) 4--2.......................................
Sweep Generator Circuits (Diagram 3) 4--2...................................
Deflection Amplifiers (Diagram 4) 4--3......................................
Microprocessor (Diagram 5) 4--3...........................................
Front Panel (Diagram 6) 4--3..............................................
Low Voltage Power Supply (Diagram 7) 4--3..................................
High Voltage (Diagram 8) 4--4.............................................
RF Input
L--Band Input 4--4.......................................................
70 MHz Input 4--4.......................................................
70 MHz Local Oscillator 4--5..............................................
IF Amplifier
2nd Local Oscillator 4--5..................................................
Input Filter, Mixer, and IF Amplifier 4--6.....................................
Resolution Filter and Log Detector 4--6......................................
Sweep Generator
Diagram 1 4--4..................................................
Diagram 2 4--5..................................................
Diagram 3 4--7..................................................
ii
1705A Spectrum Monitor
Page 4

Ramp Generator 4--7.....................................................
Gain Control (SPAN/DIV) 4--7.............................................
Sweep Shapers 4--7......................................................
Bright--Up Generator 4--8.................................................
Z--Axis Control 4--9.....................................................
Deflection Amplifiers
Diagram 4 4--9..................................................
Buffers 4--9............................................................
Vertical Deflection Amplifier 4 --10..........................................
Horizontal Deflection Amplifier 4--10........................................
Microprocessor
Diagram 5 4--11..................................................
Microprocessor 4--11......................................................
Readout 4--12...........................................................
Trace Rotate 4--12........................................................
Graticule Lights 4--12.....................................................
Front Panel
Diagram 6 4--12..................................................
Indicators, Controls, and Switches 4--12......................................
+18 Volt Supply 4--13.....................................................
Low Voltage Power Supply
Diagram 7 4--14..................................................
Line Rectifier and Filter 4--15..............................................
Pulse Width Modulator 4--15...............................................
Output Filters 4--16.......................................................
Error Amplifier 4--16.....................................................
Feedback Transformer Driver and Peak Detector 4--16...........................
Output Under-Voltage Shutdown 4--16........................................
High Voltage Power Supply
Diagram 8 4--17..................................................
HV Osc and Error Amp 4--17...............................................
Power Supply Outputs 4--18................................................
Focus Amplifier 4 --18.....................................................
Grid Drive Circuit 4--18...................................................
Z-Axis Amplifier 4--18....................................................
Table of Contents
Checks and Adjustments
Section 5 Checks And Adjustments 5--1.....................................
Recommended Equipment List 5--1.............................................
Electrical Instruments 5--1................................................
Auxiliary Equipment 5 --2.................................................
Performance Check 5--3......................................................
Short-Form Procedure 5--3................................................
Long Form Procedure 5--5................................................
Adjustment Procedure 5--17....................................................
1705A Spectrum Monitor
iii
Page 5

Table of Contents
Short--Form Procedure 5--17................................................
Long Form Procedure 5--18................................................
Maintenance 6- - 1..........................................
Section 6 Maintenance 6--1................................................
PREVENTIVE MAINTENANCE 6--1..........................................
Cleaning 6--1...........................................................
V isual Inspection 6--2....................................................
Static--Sensitive Components 6--2..........................................
Performance Checks and Readjustments 6--3..................................
TROUBLESHOOTING 6--3..................................................
Diagnostic Routines 6--4.....................................................
Memory Test 6--5.......................................................
DAC Test 6--7..........................................................
LED and Key Tests 6-- 8..................................................
Troubleshooting Aids 6--8....................................................
Foldout Pages 6--8.......................................................
Parts Lists 6--9..........................................................
Major Assembly Interconnection 6--10........................................
General Troubleshooting Techniques 6--10....................................
Power Supply Troubleshooting Procedure 6--12....................................
Introduction 6--12........................................................
Low Volts Supply 6--13....................................................
High Volts Supply 6--15...................................................
CORRECTIVE MAINTENANCE 6--18..........................................
Obtaining Replacement Parts 6--18..............................................
Test Selected Components 6--18.............................................
Mechanical Disassembly/Assembly 6--19.........................................
Bezel Removal 6-- 19......................................................
Graticule Light Removal and Replacement 6--20...............................
Removal of the CRT 6--21.................................................
Replacing the CRT 6--21...................................................
Removal of the Rear Panel 6--22............................................
Removal of Front--Panel Assembly 6--22......................................
Removing the L--Band Tuner 6--23..........................................
Removing the 70 MHz Tuner 6--24..........................................
Removal and Replacement of the Main Board 6--24.............................
Removal and Replacement of the Power Supply Board 6--25......................
Removing the LNB Power Supply Board 6--26.................................
REPACKAGING 6--27........................................................
Options
iv
Section 7 Options 7--1....................................................
Options 7--1...............................................................
Field Upgrade Kits 7--1......................................................
ORDERING 7--2...........................................................
1705A Spectrum Monitor
Page 6

Replaceable Electrical Parts
Section 8 Replaceable Electrical Parts 8--1...................................
Parts Ordering Information 8-- 1................................................
Using the Replaceable Electrical Parts List 8--1...................................
Cross Index--Mfr. Code Number to Manufacturer 8--1...........................
Abbreviations 8--1.......................................................
List of Assemblies 8--1...................................................
Column Descriptions 8--2.....................................................
Component No. (Column 1) 8--2.........................................
Tektronix Part No. (Column 2) 8--2.........................................
Serial/Assembly No. (Column 3 a nd 4) 8--2...................................
Name and Description (Column 5) 8--2......................................
Mfr. Code (Column 6) 8--2........................................
Mfr. Part No. (Column 7) 8--2..............................................
Diagrams/Circuit Board Illustrations
Replaceable Mechanical Parts
Table of Contents
Section 10 Replaceable Mechanical Parts 10--1................................
Parts Ordering Information 10--1................................................
Using the Replaceable Mechanical Parts List 10--1.................................
1705A Spectrum Monitor
v
Page 7

Table of Contents
List of Figures
Figure 1-1: 1705A used to locate satellites and determine maximum signal level 1--2.........
Figure 1-2: Relationship of a communications satellite to earth 1--9.......................
Figure 1-3: Angle A (the difference at a specific latitude between the angle to the sun
and the angle to a satellite) 1--10.........................................
Figure 1-4: Sample longitudinal map of the Ku-Band satellites 1--11.......................
Figure 1-5: The western spot beam footprint for one Ku-Band satellite 1--12.................
Figure 1-6: A computer representation of the 1705A display showing the 12.198 GHz
horizontally polarized telemetry beacon on the SATCOM K2 satellite 1--14........
Figure 1-7: Transponder assignments for a typical Ku--Band, 16--transponder satellite
that employs alternate polarization 1--15....................................
Figure 1-8: Simulation of a 1705A FULL SPAN/DIV display 1--16.......................
Figure 1-9: Up link Video Exciter, Up converter, and High Power Amplifier (HPA) showing
how to hook up a 1705A Spectrum Monitor to look at the Video Exciter output 1--17
Figure 1-10: 1705A hooked up to look at either the output of the Video Exciter (70 MHz)
or the Receiver Input (L-Band) 1--18.......................................
Figure 2-1: 1705A front panel 2--2.................................................
Figure 2-2: 1705A rear panel controls and connectors 2--5..............................
Figure 2-3: 1705A display when powered up in L-BAND and FULL SPAN 2--6.............
Figure 2-4: 1705A graticule scale 2--7..............................................
Figure 2-5: Relationship of sweep to graticule showing minimum and maximum frequencies 2--10
Figure 2-6: Frequency relationship to horizontal graticule scale 2--11.......................
Figure 2-7: Center frequency cursor and readout for the L-Band with FULL SPAN/DIV 2--12...
Figure 2-8: 1705A CRT with the SCALE turned down 2--13.............................
Figure 2-9: The setting of the HORIZONTAL POSITION control can displace the location
of the displayed center frequency 2--13.....................................
Figure 2-10: Using the 1705A menus 2--15...........................................
Figure 2-11: An example of the readout displayed while satellite frequency is being set 2--16....
Figure 3-1: L-BAND INPUT connector and controls 3--2...............................
Figure 3-2: Dimensions of the 1700F00 plain cabinet 3--3...............................
Figure 3-3: 1700F02 portable cabinet dimensions 3--4..................................
Figure 3-4: Cabinet securing screws 3--5............................................
Figure 3-5: The WFM7F05 side-by-side rack adapter 3--5...............................
Figure 3-6: A WFM7F05 with a blank front panel (1700F06) 3--6........................
Figure 3-7: WFM7F05 rack mount cabinet with a 1700F06 utility drawer 3--7...............
vi
1705A Spectrum Monitor
Page 8

Table of Contents
Figure 3-8: Considerations for custom installation of an instrument 3--8....................
Figure 4-1: 1705A L--Band comb display showing the areas each of the six sweep shaper
variable resistors adjust 4--8.............................................
Figure 4-2: Output duty cycle of the pulse width modulator used in the +18 V Power Supply 4--13
Figure 4-3: Pinout of the CRT Socket 4--19...........................................
Figure 5-1: Initial equipment connections 5--6........................................
Figure 5-2: Check time mark graticule alignment 5--8..................................
Figure 5-3: Output of the SG503 connected directly to the 1705A 70 MHz INPUT 5--9.......
Figure 5-4: Equipment connections for L--Band checkout 5--12...........................
Figure 5-5: Aligning L--Band time markers with the graticule lines 5--13....................
Figure 5-6: Using the UHF Signal Generator to check L--Band Span/Division, Readout, Gain,
and Flatness 5--14.....................................................
Figure 5-7: Adjustment locations 5--19...............................................
Figure 5-8: DAC check waveforms used to check Focus, Astigmatism, Geometry, and setting
of the Trace Rotation 5--20..............................................
Figure 5-9: Location of the shorting strap used when adjusting sweep length 5--21............
Figure 6-1: Using the 1705A menus 6--4............................................
Figure 6-2: 1705A Test menu, displayed when Test is the Main menu selection 6--5..........
Figure 6-3: 1705A CRT display when the NOVRAM Test has been successfully completed 6--6
Figure 6-4: 1705A power up error message 6--7.......................................
Figure 6-5: DAC check waveform 6--8.............................................
Figure 6-6: Circuit board assembly locations 6--9.....................................
Figure 6-7: Multiple pin connectors used in the 1705A Spectrum Monitor 6--11..............
Figure 6-8: Bezel securing screws 6--20..............................................
Figure 6-9: Screws securing the rear panel 6--22.......................................
Figure 6-10: Screws securing the front panel board (A2) in place 6--23.....................
Figure 6-11: Screws holding the Main board (A3) and the Tuners (A5 and A6) in place 6--24....
Figure 6-12: Removing the Power Supply board 6--26...................................
Figure 6-13: Mounting screws for the LNB Power Supply circuit board, A4 6--26.............
Figure 6-14: Repackaging a 1705A instrument 6--27....................................
1705A Spectrum Monitor
vii
Page 9

Table of Contents
List of Tables
Table 1--1: Spectrum Display 1--4.................................................
Table 1--2: CRT Display 1--5.....................................................
Table 1--3: Power Source 1--5....................................................
Table 1--4: Environmental Characteristics 1--6.......................................
Table 1--5: Physical Characteristics 1--6............................................
Table 1--6: Certifications and Compliances 1--6......................................
Table 2--1: dB Reference 2--8.....................................................
Table 2--2: dBm to mv Conversion 2--9............................................
Table 2--3: Azimuth / Elevation Table for 21 CONUS Cities 2--18........................
Table 3--1: Internal Jumper Selection 3--2...........................................
Table 5--1: Preliminary Control Settings 5--6.........................................
Table 5--2: Preliminary Control Settings 5--18.........................................
Table 6--1: Static Susceptibility 6--2................................................
Table 6--2: Power Supply Fault Symptoms 6--12......................................
Table 6--3: Low Volts Supply Voltages 6--13.........................................
Table 6--4: Control Circuit Test Points 6--15..........................................
Table 6--5: High Volts Supply Fault Symptoms 6--16...................................
Table 6--6: High Voltage Oscillator Test Points 6--17...................................
Table 6--7: Test Selectable Components 6--19.........................................
Table 7--1: Power Cord Options 7--1...............................................
viii
1705A Spectrum Monitor
Page 10

General Safety Summary
Review the following safety precautions to avoid injury and prevent damage to
this product or any products connected to it. To avoid potential hazards, use this
product only as specified.
Only qualified personnel should perform service procedures.
While using this product, you may need to access other parts of the system. Read
the General Safety Summary in other system manuals for warnings and cautions
related to operating the system.
ToAvoidFireor
Personal Injury
Use Proper Power Cord. Use only the power cord specified for this product and
certified for the country of use.
Connect and Disconnect Properly. Do not connect or disconnect probes or test
leads while they are connected to a voltage source.
Ground the Product. This product is grounded through the grounding conductor
of the power cord. To avoid electric shock, the grounding conductor must be
connected to earth ground. Before making connections to the input or output
terminals of the product, ensure that the product is properly grounded.
Observe All Terminal Ratings. To avoid fire or shock hazard, observe all ratings
and markings on the product. Consult the product manual for further ratings
information before making connections to the product.
Connect the ground lead of the probe to earth ground only.
Do not apply a potential to any terminal, including the common terminal, that
exceeds the maximum rating of that terminal.
Do Not Operate Without Covers. Do not operate this product with covers or panels
removed.
Use Proper Fuse. Use only the fuse type and rating specified for this product.
Avoid Exposed Circuitry. Do not touch exposed connections and components
when power is present.
1705A Spectrum Monitor
Wear Eye Protection. Wear eye protection if exposure to high-intensity rays or
laser radiation exists.
Do Not Operate With Suspected Failures. If you suspect there is damage to this
product, have it inspected by qualified service personnel.
Do Not Operate in Wet/Damp Conditions.
Do Not Operate in an Explosive Atmosphere.
Keep Product Surfaces Clean and Dry.
ix
Page 11

General Safety Summary
Provide Proper Ventilation. Refer to the manual’s installation instructions for
details on installing the product so it has proper ventilation.
Symbols and Terms
Terms in this Manual. These terms may appear in this manual:
WARNING. Warning statements identify conditions or practices that could result
in injury or loss of life.
CAUTION. Caution statements identify conditions or practices that could result in
damage to this product or other property.
Terms on the Product. These terms may appear on the product:
DANGER indicates an injury hazard immediately accessible as you read the
marking.
WARNING indicates an injury hazard not immediately accessible as you read the
marking.
CAUTION indicates a hazard to property including the product.
Symbols on the Product. The following symbols may appear on the product:
CAUTION
Refer to Manual
WARNING
High Voltage
Double
Insulated
Protective Ground
(Earth) Terminal
Not suitable for
connection to
the public telecom-
munications network
x
1705A Spectrum Monitor
Page 12

Service Safety Summary
Only qualified personnel should perform service procedures. Read this Service
Safety Summary and the General Safety Summary before performing any service
procedures.
Do Not Service Alone. Do not perform internal service or adjustments of this
product unless another person capable of rendering first aid and resuscitation is
present.
Disconnect Power. To avoid electric shock, switch off the instrument power, then
disconnect the power cord from the mains power.
Use Caution When Servicing the CRT. To avoid electric shock or injury, use
extreme caution when handling the CRT. Only qualified personnel familiar with
CRT servicing procedures and precautions should remove or install the CRT.
CRTs retain hazardous voltages for long periods of time after power is turned off.
Before attempting any servicing, discharge the CRT by shorting the anode to
chassis ground. When discharging the CRT, connect the discharge path to ground
and then the anode. Rough handling may cause the CRT to implode. Do not nick
or scratch the glass or subject it to undue pressure when removing or installing it.
When handling the CRT, wear safety goggles and heavy gloves for protection.
Use Care When Servicing With Power On. Dangerous voltages or currents may
exist in this product. Disconnect power, remove battery (if applicable), and
disconnect test leads before removing protective panels, soldering, or replacing
components.
To avoid electric shock, do not touch exposed connections.
X-Radiation. To avoid x-radiation exposure, do not modify or otherwise alter the
high-voltage circuitry or the CRT enclosure. X-ray emissions generated within
this product have been sufficiently shielded.
1705A Spectrum Monitor
xi
Page 13

Service Safety Summary
xii
1705A Spectrum Monitor
Page 14

Preface
The information in this manual is intended for instrument operators and service
technicians. Operators are assumed to befamiliar with basic television terms and
measurements. Qualified service technicians are also assumed to be familiar with
television terms and measurements, and have moderate experience with analog
and logic circuits.
The manual is divided into two parts: Operator’s Information and Service
Information. The Operator’s Information is useful to both operators and service
technicians. The Service Information is intended only for qualified service
technicians.
Section 1, Introduction
Section 2, Operating
Instructions
Section 3, Installation
Section 4, Theory of
Operation
Section 5, Checks and
Adjustments
Section 1, Introduction, includes a general description of the instrument followed
by the Specifications. The Specifications include references to the corresponding Performance check steps.
Section 2, Operating Instructions, familiarizes the user with the front-- and
rear--panel controls, connectors, and indicators; includes an operator’s check-out
procedure; and includes other operator familiarization information.
Section 3, Installation, includes electrical and mechanical installation information. The electrical installation information includes adjustments and operational
changes available with the instrument. The mechanical installation information
includes rackmounting, custom installation, and portable use.
Section 4, Theory of Operation, provides an over-all block diagram description and
detailed circuit descriptions. Read the block diagram description for an overview of the
instrument. The detailed circuit descriptions should be used with the block diagram and
schematic diagrams in the foldout pages for specific information about individual
circuits.
Section 5, Checks and Adjustments, includes the Performance Check Procedure and the
Adjustment Procedure. The Performance Check Procedure is used to verify that the
instrument’s performance is within its specifications, and the Adjustment Procedure is
used to adjust the instrument to meet its specifications. The procedures are preceded by
a list of recommended test equipment. Each procedure has a short form listing of the
individual steps.
Section 6, Maintenance
1705A Spectrum Monitor
Section 6, Maintenance, includes preventive, troubleshooting, and corrective
information.
xiii
Page 15

Preface
Section 7, Options
Section 8, Replaceable
Electrical Parts
Section 9, Diagrams
Section 10, Replaceable
Mechanical Parts
Section 7, Options, documents instrument options. The information in this
section summarizes the options. Additional details are included in appro-priate
places throughout the manual.
Section 8, Replaceable Electrical Parts, includes order information and part
numbers for all replaceable electrical parts.
Section 9, Diagrams, contains servicing illustra-tions. These include adjustment
locations, circuit board part locations, a block diagram, and schematic diagrams.
Parts locating tables are included that cross--reference the circuit board illustrations to the schematic diagrams.
Section 10, Replaceable Mechanical Parts, includes ordering information and
part numbers for all replaceable mechanical parts. This parts list is referenced to
an exploded view mechanical drawing. Also included are lists of accessories and
optional accessories.
xiv
1705A Spectrum Monitor
Page 16

Contacting Tektronix
Preface
Phone 1-800-833-9200*
Address Tektronix, Inc.
Department or name (if known)
14200 SW Karl Braun Drive
P.O. Box 500
Beaverton, OR 97077
USA
Web site www.tektronix.com
Sales support 1-800-833-9200, select option 1*
Service support 1-800-833-9200, select option 2*
Technical support Email: techsupport@tektronix.com
1-800-833-9200, select option 3*
6:00 a.m. -- 5:00 p.m. Pacific time
* This phone number is toll free in North America. After office hours, please leave a
voice mail message.
Outside North America, contact a Tektronix sales office or distributor; see the
Tektronix web site for a list of offices.
1705A Spectrum Monitor
xv
Page 17

Preface
xvi
1705A Spectrum Monitor
Page 18

Introduction
Page 19

Page 20

Section 1 Introduction
The TEKTRONIX 1705A Spectrum Monitor is an 8½” wide by 5¼” high
special purpose spectrum analyzer. It weighs approximately 8½ pounds and is
powered from an ac source. The crt occupies approximately two-thirds of the
front-panel area, with the control panel taking up the remainder of the space.
Operation is controlled by a microprocessor that polls the front-panel switches.
Front-panel switches are of the momentary touch type with lighted functional
indicators. In addition to polling the front panel, the microprocessor provides
the characters for an alphanumeric crt readout.
The signal is displayed on a bright crt. It is of the mesh type, for better
geometry, and uses an internal graticule to reduce parallax. Variable graticule
scale illumination provides even lighting over the usable graticule area to
improve measurement accuracy and the quality of display photographs.
The 1705A Spectrum Monitor is a swept front-end superheterodyne-type
spectrum analyzer with two inputs; L--Band to accommodate Low-Noise
Amplifier/Block Down Converter (LNB) outputs, and 70 MHz for use with
Video Exciters. The L--Band input (950 to 1800 MHz) is through an F-type
connector, while the 70 MHz input is through a standard bnc connector. The
L--BAND INPUT connector is the output for the selectable 18 V supply that is
the Block Down Converter auxiliary power.
Typical Configurations
1705A Spectrum Monitor
The TEKTRONIX 1705A Spectrum Monitor is designed primarily for use in
locating satellites and monitoring their signals. It is designed so that it can be
rack mounted, in a dual-width rack adapter, along with a half-rack waveform
monitor, such as a TEKTRONIX 1740-Series Waveform/Vector Monitor.
However, it can be used as a portable instrument. It is intended to be connected
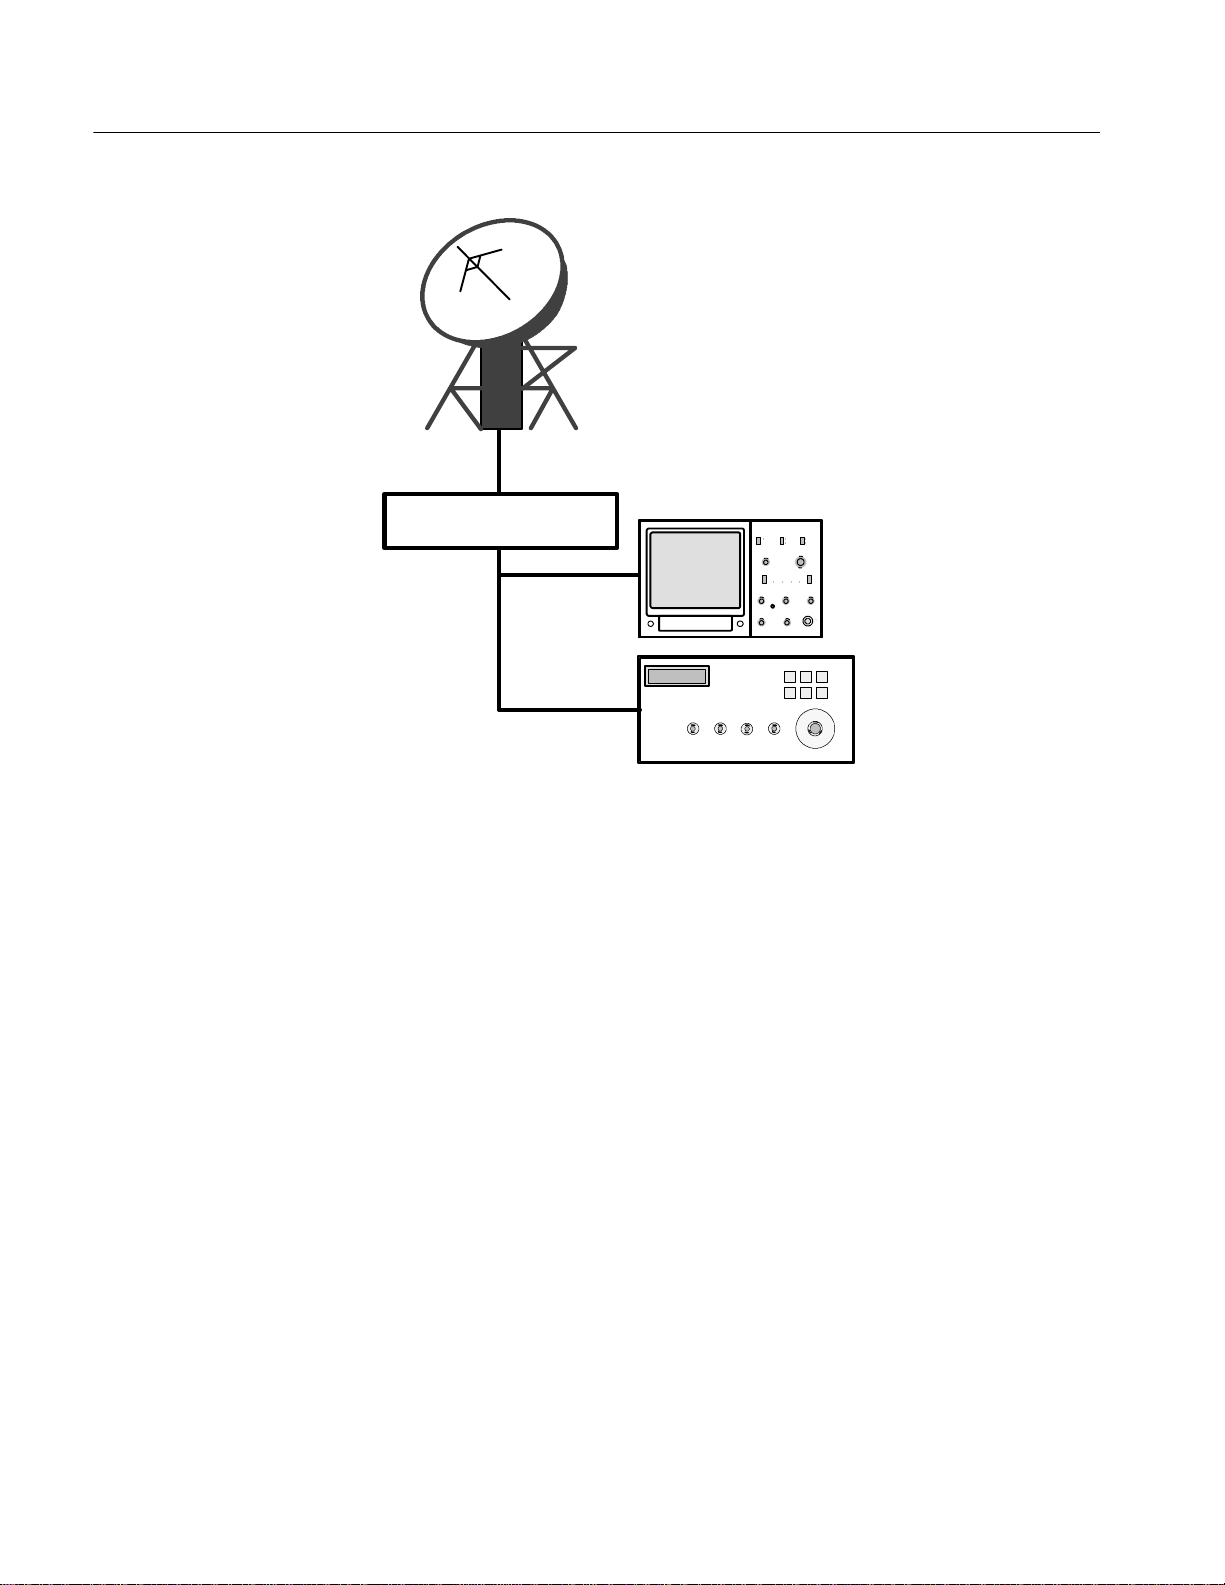
to the rf feed with a directional connector. See Figure 1-1. It is capable of
providing the dc power required to run an LNB. The auxiliary LNB power is
turned on or off by a rear-panel slide switch. An indicator on the rear panel
lights when the +18 V supply is operating normally.
1- 1
Page 21
Introduction
LOW-NOISE AMPLIFIER/
BLOCK DOWN CONVERTER
1705A
SPECTRUM MONITOR
Options
Accessories
Standard Accessories
RECEIVER
Figure 1-1: 1705A used to locate satellites and determine maximum signal level
The only options currently available for the 1705A Spectrum Monitor are the
power plug options described in Section 7 (Options). If no power cord options
are ordered, instruments are shipped with the North American 125 V power cord
and one replacement fuse.
1 Manual, Instruction
1 Adapter, F--type Male connector to BNC female connector
1 Power Cord, with the correct plug for the selected power plug option
1 Replacement Cartridge Fuse (correct rating for the power plug option)
1- 2
3 Replacement Scale Illumination Bulbs (Tektronix P/N 150-0168-00 or ANSI
#73)
1705A Spectrum Monitor
Page 22

Introduction
Optional Accessories
Safety Information
Camera, C9 (Option 20)
Viewing Hood (016-0475-00)
Front Panel Cover (200-3897-01)
1700F00, Plain Cabinet (painted silver grey)
1700F02, Portable Cabinet (painted silver grey with handle, feet, and front
cover)
1700F05, Side-by-Side Rack Adapter
1700F06, Blank Half-Rack Width Panel
1700F07, Utility Drawer
The 1705A Spectrum Monitor is intended to operate from an ac power source
that will not apply more than 250 V rms between the supply conductors or
between either supply conductor and ground. A protective ground connection,
by way of the grounding conductor, is essential for safe operation.
The instrument was tested for compliance in a cabinet. To ensure continued
compliance, the instrument will need to be enclosed in a cabinet that is equivalent to those listed as Optional Accessories for the 1705A. A drawing of the
1700F00 plain cabinet is contained in the Installation Instructions (Section 3).
1705A Spectrum Monitor
1- 3
Page 23
Introduction
ELECTRICAL SPECIFICATION
Table 1- 1: Spectrum Display
Performance
Characteristic
Frequency Range
L --- B a n d
70 MHz
Frequency Span
L --- B a n d
Full
10 MHz/Division
1 MHz/Division
100 kHz/Division
70
MHz
Full
1 MHz/Division
100 kHz/Division
Span/Div Accuracy Typically 0.5 minor Division.
Flatness L---Band ±5 dB.
Maximum Signal Input L --- B a n d : --- 3 0 d B m ,
Minimum Signal Input --- 8 0 d B m .
Relative Amplitude Accuracy L---Band (only)
Sweep Length
Sweep Speed Typically 20 --- 200 ms. 9
Positioning Range
Ver ti ca l
Horizontal
Displayed Frequencies in FULL
SPAN/DIV
L---BAND (900 --- 1900 MHz)
70 MHz (45 --- 100 MHz)
Frequency Readout Center Frequency shown by time
Requirements
950 to 1800 MHz
45 to 100 MHz
70 MHz ±2 dB.
75Ω.70MHz:
---20 dBm, 75Ω..
±3 dB/100 MHz.
+ and ---3 Divisions.
+ and ---2 Divisions.
Supplemental Information
F---type connector
Bnc connector
10 Horiz. Div. Equals:
1000 MHz
100 MHz
10 MHz
1MHz
10 Horiz. Div. Equals:
50 MHz
10 MHz
1MHz
Brightup offset by 1 Division in FULL
SPAN/DIV should still come on screen
in the next magnified position.
± from center (1400 MHz).
± from center (70 MHz).
Typically ±1 dB /100 MHz. 12
¶12 Divisions all SPANS/DIV settings.
Left Grat. Mid Grat. Right Grat.
Edge Line Edge
900 1400 1900
45 70 95
sharing graphic readout. Exact position on the trace of the center frequency shown by a caret in all spans except
FULL.
Check
Step
11
5
4, 5, 10, 11
11
12,
7
4
13
11
5
11
1- 4
1705A Spectrum Monitor
Page 24
Table 1- 1: Spectrum Display (Cont.)
Introduction
Performance
Characteristic
Frequency Bright Up
Marker Registration
Readout Accuracy L---Band ±20 MHz.
Resolution
6dBDown
300 kHz
10 kHz
Video Filter
Low Noise Amplifier/Block Down
Converter dc Supply (LNB Power)
2 dB Gain Accuracy
Requirements
70 MHz ±2 MHz
+18 Vdc ±5%. 250
mA max.
¶2 dB/Division.
Supplemental Information
Full Span has bright up and frequency
readout (without cursor). Bright-up
area will be on screen in at least the
next narrower span.
Typically ±10 MHz.
Typically ±1 MHz.
300 kHz ±1 Division at 100 kHz
Span/Div.
<2 minor Divisions at 100 kHz Span/
Div.
Reduces Video bandwidth to ¶10 kHz.
Output through L---BAND input
connector, switched on and off by
rear-panel slide switch. LED indicator
on rear panel.
<3 dB/Division at ---50 dBm. 14
5
11
5
6
6
8
3
Check
Step
Table 1- 2: CRT Display
Performance
Characteristic
Crt Viewing Area 80 X 100 mm.
Accelerating Potential 13.75 kV.
Trace Rotation Range Greater than ±1˚
Graticule Internal 8 X 10 Division spectrum
Requirements
from horizontal.
Supplemental Information
Total adjustment range is typically 8˚.
analyzer graticule with variable SCALE
illumination.
Table 1- 3: Power Source
Performance
Characteristic
Mains Voltage Range 90---250 V. Continuous range from 90 to 250 Vac. 2
Mains Frequency Range 48 Hz to 66 Hz.
Power Consumption 35 Wa tts (120 BTU/HR) maximum.
Requirements
Supplemental Information
Check
Step
Check
Step
1705A Spectrum Monitor
1- 5
Page 25
Introduction
Table 1- 4: Environmental Characteristics
Characteristic Supplemental Information
Temperature
Non-Operating
Operating
Altitude
Non-Operating
Operating
Vibration --- Operating 15 minutes each axis at 0.015”, frequency varied from 10---55---10 Hz in 1-minute
Shock --- Non-Operating 30 g’s, ½ sine, 11 ms duration, 3 shocks per surface (18 total).
Transportation Qualified under NTSC Test Procedure 1A, Category II (30” drop).
Humidity Will operate at 95% relative humidity for up to five days.
--- 5 5 ˚Cto+75˚C.
0˚Cto+50˚C.
To 50,000 feet (15,000 meters).
To 15,000 feet (4,800 meters).
cycles with instrument secured to vibration platform. Ten minutes each axis at
any resonant point or at 55 Hz if no resonant point is found.
Table 1- 5: Physical Characteristics
Characteristic Supplemental Information
Dimensions
Height
Widt h
Length
Weight Approximately 8.5 lbs (approximately 3.8 kg).
5 1/4 inches (133.4 mm).
8 1/2 inches (215.9 mm).
18 1/8 inches (460.4 mm).
Table 1- 6: Certifications and Compliances
EC Declaration of Conformity -EMC
Meets intent of Directive 89/336/EEC for Electromagnetic Compatibility. Compliance was
demonstrated to the following specifications as listed in the Official Journal of the European
Communities:
EN 50081-1 Emissions:
EN 55022 Class B Radiated and Conducted Emissions
EN 50082-1 Immunity:
IEC 801-2 Electrostatic Discharge Immunity
IEC 801-3 RF Electromagnetic Field Immunity
IEC 801-4 Electrical Fast Transient/Burst Immunity
High-quality shielded cables must be used to ensure compliance to the above listed standards.
This product complies when installed into any of the following Tektronix instrument enclosures:
1700F00 Standard Cabinet
1700F02 Portable Cabinet
1700F05 Rack Adapter
An increase of up to 20dB in the displayed noise floor may be observed if this instrument is
operated in electromagnetic fields of 3V/M or more, at frequencies of approximately 130, 250, 350,
or 490 MHz.
1- 6
Test Equipment Depot - 800.517.8431 - 99 Washington Street Melrose, MA 02176 - FAX 781.665.0780 - TestEquipmentDepot.com
1705A Spectrum Monitor
Page 26

Introduction
Table 1- 6: Certifications and Compliances (cont.)
FCC Compliance Emissions comply with FCC Code of Federal Regulations 47, Part 15, Subpart B, Class A Limits
Installation (Overvoltage)
Category
Pollution Degree A measure of the contaminates that could occur in the environment around and within a product.
Safety Standards
U.S. Nationally Recognized
Testing Laborat ory Listing
Canadian Certification CAN/CSA C22.2 No. 231 CSA safety requirements for electrical and electronic measuring and
European Union Compliance Low Voltage Directive 73/23/EEC, amended by 93/69/EEC
Terminals on this product may have different installation (overvoltage) category designations. The
installation categories are:
CAT III Distribution-level mains (usually permanently connected). Equipment at this level is
typically in a fixed industrial location.
CAT II Local-level mains (wall sockets). Equipment at this level includes appliances, portable
tools, and similar products. Equipment is usually cord-connected.
CAT I Secondary (signal level) or battery operated circuits of electronic equipment.
Typically the internal environment inside a product i s considered to be the same as the external.
Products should be used only in the environment for which they are rated.
Pollution Degree 1 No pollution or only dry, nonconductive pollution occurs. Products in
this category are generally encapsulated, hermetically sealed, or
located in clean rooms.
Pollution Degree 2
Pollution Degree 3
Pollution Degree 4
UL1244 Standard for electrical and electronic measuring and test equipment.
Normally only dry, nonconductive pollution occurs. Occasionally a
temporary conductivity that is caused by condensation must be
expected. This location is a typical office/home environment.
Temporary condensation occurs only when the product is out of
service.
Conductive pollution, or dry, nonconductive pollution that becomes
conductive due to condensation. These are sheltered locations where
neither temperature nor humidity is controlled. The area is protected
from direct sunshine, rain, or direct wind.
Pollution that generates persistent conductivity through conductive
dust, rain, or snow. Typical outdoor locations.
test equipment.
EN 61010-1 Safety requirements for electrical equipment for measurement,
control, and laboratory use.
Additional Compliance IEC61010-1 Safety requirements for electrical equipment for measurement,
control, and laboratory use.
1705A Spectrum Monitor
1- 7
Page 27
Introduction
Table 1- 6: Certifications and Compliances (cont.)
Safety Certification Compliance
Temperature, operating +5 to +40_ C
Altitude (maximum operating) 2000 meters
Equipment Type Test and measuring
Safety Class Class 1 (as defined in IEC 1010-1, Annex H) -- grounded product
Overvoltage Category Overvoltage Category II (as defined in IEC 1010-1, Annex J)
Pollution Degree Pollution Degree 2 (as defined in IEC 1010-1). Note: Rated for indoor use only.
1- 8
1705A Spectrum Monitor
Page 28
APPLICATIONS
Introduction
The principal application for the TEKTRONIX 1705A Spectrum Monitor is to
provide a convenient method to locate and identify Ku-Band satellites, find the
correct transponder and check on its availability, and optimize antenna positioning and polarization. The remainder of this section provides basic satellite
communications application data. Specific operating instructions are located in
Section 2, Operating Instructions.
Locating Satellites
The communications satellites that the television industry is interested in lie in a
band directly over the earth’s equator, at a distance of approximately 35,900 km
(or about 3.7 times the earth’s diameter). Traveling at approximately
11,000 km/h the satellite completes one full orbit in 23 hours, 56 minutes,
4.9 seconds, which is referred to as a sidereal day. When a satellite completes
one orbit in a sidereal day it is geographically stationary (geostationary) to a
point on the earth’s surface. Without being geostationary, using a satellite would
be extremely complicated and the calculations required to determine when they
were in the usable window, and how long they would stay there would, in most
cases, require a computer.
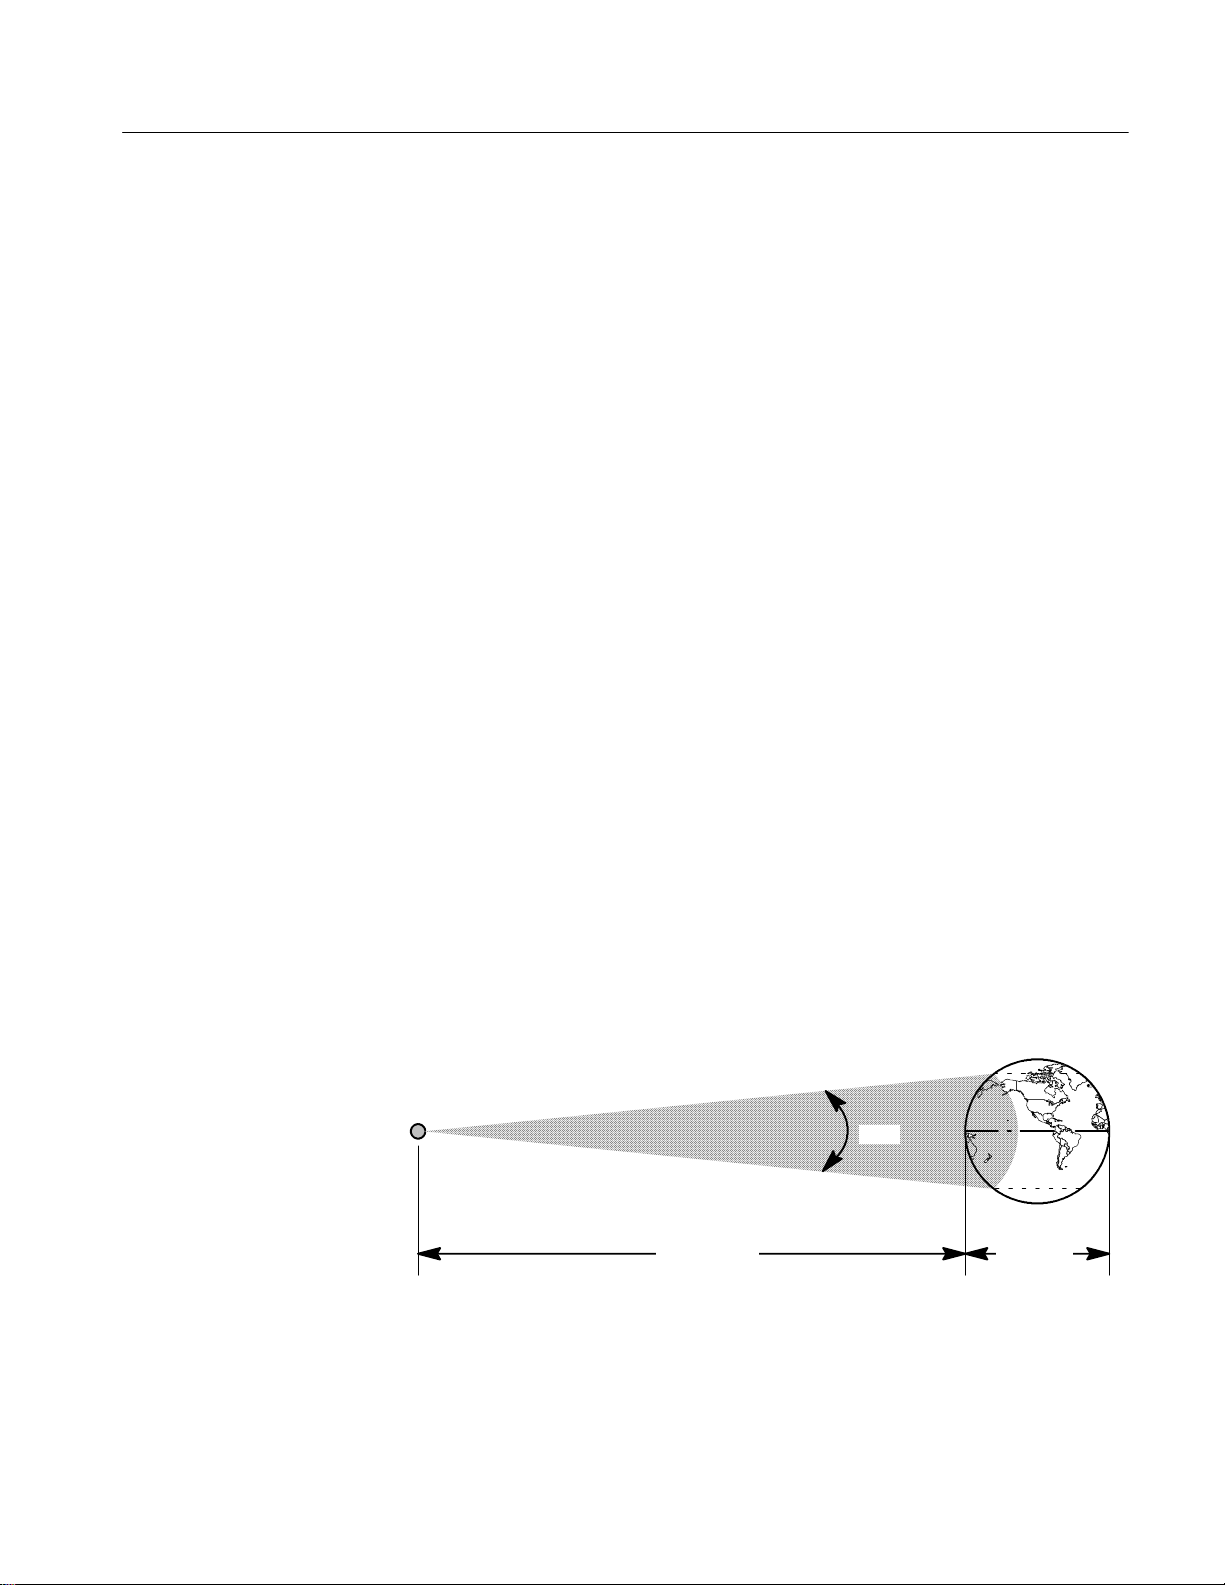
At 35,900 km distance the earth subtends an angle of 18˚, which provides
coverage of approximately 40% of the earth’s surface. See Figure 1-2. Forty
percent (40%) of the earth’s surface corresponds to an area stretching from 70˚
North latitude to 70˚ South latitude. For rough assumptions, a satellite, in
geostationary orbit over the equator, could cover latitudes from the Arctic circle
(66˚ 30’ N) to the Antarctic circle (66˚ 30’ S). However it should be noted that
even though the satellite is capable of covering 40% of the earth’s surface the
actual coverage will be less in most cases because of the antenna design and
available transmitter power.
70° N
1705A Spectrum Monitor
18°
70° S
35,900 km
Figure 1-2: Relationship of a communications satellite to earth
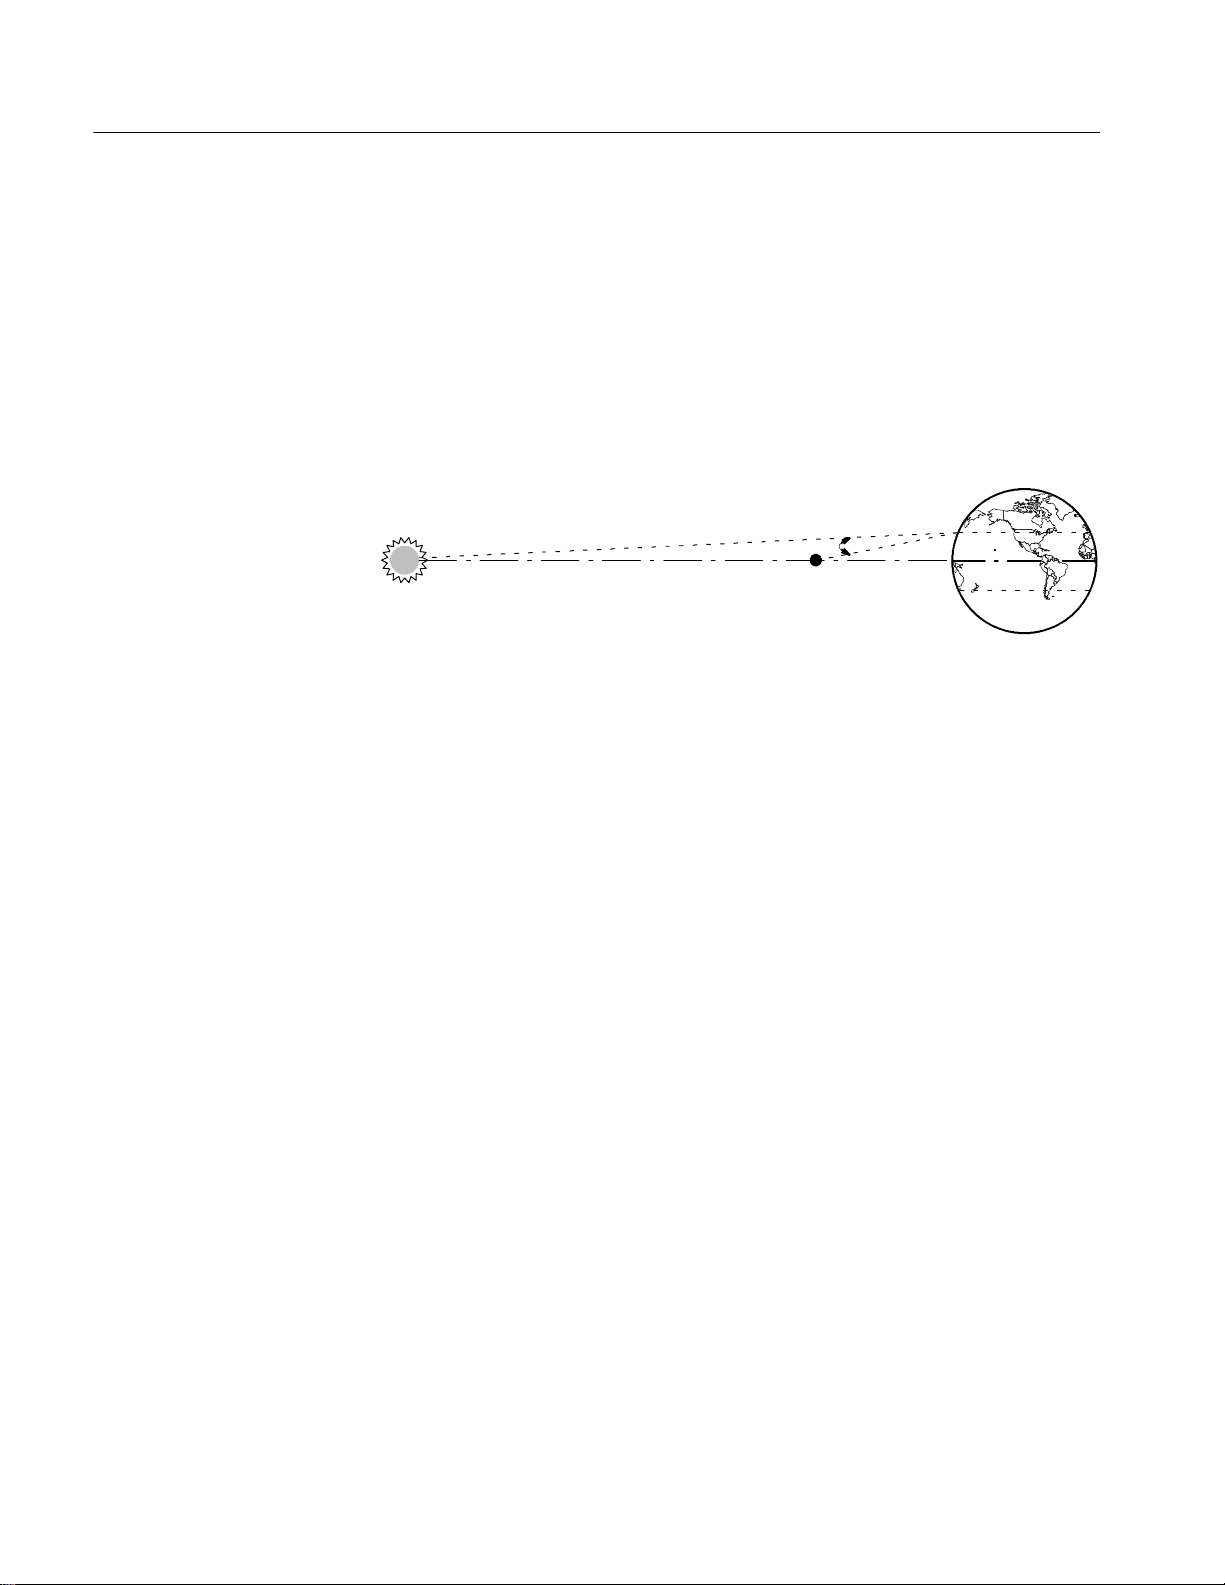
Determining the exact angle from the horizon to a satellite (other than at the
equator) requires a knowledge of trigonometry, because of the relatively close
9,675 km
1- 9
Page 29
Introduction
orbit of the satellite. If the orbit of an equatorial orbiting satellite were roughly
equal to the distance from earth to the sun, ordinary latitude could be used to
determine the elevation of the antenna, which is, of necessity, very finely
focused. However since there is a disparity this angle is somewhat less than the
latitude for the earth station. See Figure 1-3. Simple logic readily points out
that as the latitude increases the angle from horizon to the satellite decreases. An
example of this would be that at 45˚ North or South latitude the angle above the
horizon is about 40˚ for a satellite at the earth station’s longitude. Figure 1-3
illustrates why it is not possible to pinpoint a satellite with ordinary navigation.
Satellite Footprints
SUN
A
SATELLITE
45° N
00°
(EQUATOR)
EARTH
Figure 1-3: Angle A (the difference at a specific latitude between the angle to the
sun and the angle to a satellite) is the reason ordinary navigation techniques
cannot be used to find a satellite
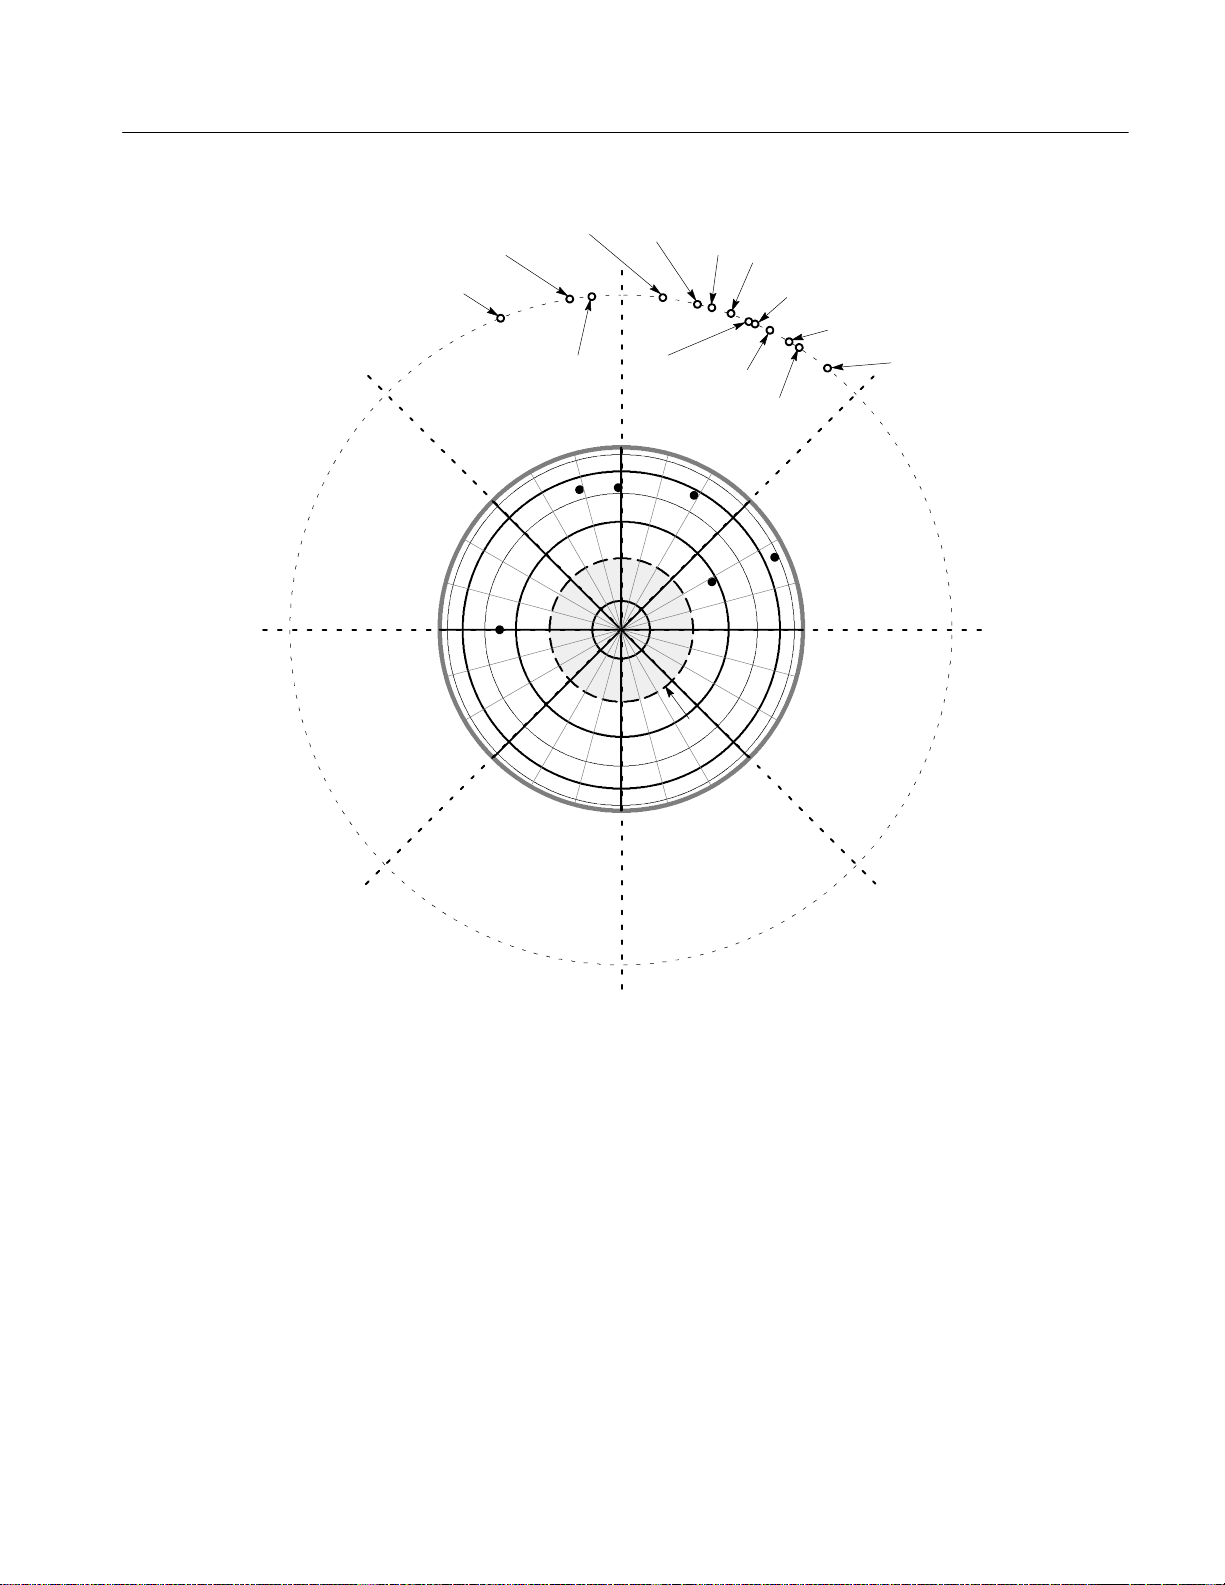
Figure 1-4 confirms that the angle from the prime meridian to a satellite will be
considerably different than the angle from a North American or European earth
station to the same satellite. It should also be noted that the elevation also
decreases for a satellite the further east or west from the earth station’s longitude.
Even though a satellite, in theory, can communicate with 40% of the earth’s
surface from its location, in most cases it will not. The antenna systems onboard
the satellites are usually designed to cover a specific area. These areas are
referred to as hemispheres, zones, and spots. A hemispherical beam is designed
to cover roughly 40% of the earth’s surface, for example, the western hemisphere. A zonal beam covers a specific area, for example, the Continental
United States, which is usually referred to as the CONUS beam. A spot beam is
exactly what it implies, concentrating on a smaller geographical area, such as the
western United States. With each of these beams there are areas where the signal
strength is greater. Figure 1-5 shows a propagation map for the western spot
beam for one Ku--Band satellite.
1- 10
1705A Spectrum Monitor
Page 30
SPACENET 2
45°W
69°
RCA K2
81°
SBS 3
RCA K1
85°
97°
GSTAR A2
103°
ANIK C2
112.5°
GSTAR A1
105°
MORELOS 2
116.5°
ANIK B
109°
SBS 5
122°
MORELOS 1
113.5°
SPACENET 1
135°W
120°
ASC 1
128°
Introduction
PRIME MERIDIAN
000°
NORTH
POLE
90°E
CHICAGO
LOS ANGELES
ARCTIC
CIRCLE
ANCHORAGE
HONOLULU
INTERNATIONAL DATELINE
135°E
180°
45°E
GREENWICH
ENGLAND
NEW YORK CITY
Figure 1-4: Sample longitudinal map of the Ku-Band satellites of most interest to
news vehicle earth stations on the North American continent and Hawaii
Using the 1705A for Satellite Communication
The 1705A has two separate inputs, one, the L--Band Input, is specifically
designed to work with LNB down converters, which have an output signal range
of 0.95 to 1.80 GHz. This provides a means of looking at the signals from either
Ku or C--Band satellites. The second input is identified as 70 MHz and accepts
signals from 45 to 100 MHz. This second input is primarily designed to work
with the IF frequency of an exciter, but can also be used to look at signals in the
low VHF television band and the FM broadcast band up to 100 MHz.
1705A Spectrum Monitor
1- 11
Page 31

Introduction
L- Band Input Signals
At the present time there are numerous satellites in geostationary orbit. The
transponders on each have specific assigned functions, which makes it essential
to accomplish at least four things before illuminating a particular transponder:
1. Locate a satellite.
2. Identify the satellite.
3. Find the transponder and check availability with the satellite operator.
4. Optimize signal strength and polarization.
Once a satellite is located and a particular transponder is identified, the 1705A
frequency readout can be set so that the entire range of transponder frequencies
can be read directly from the 1705A display. As it is shipped from the factory
the 1705A provides a readout in MHz for both bands. However, the 1705A has
several customizing routines that can be used to tailor displays for ease of
operation. In particular the Readout Mode routine provides for frequency offset,
so that the frequency displayed on the crt is the actual frequency of the transponder down link. The readout can be set to indicate any 1.10 GHz block within
the range of 0.9 GHz to 20 GHz.
VANCOUVER BC
SEATTLE
PORTLAND
SAN FRANCISCO
LOS ANGELES
SAN DIEGO
50dBw
47dBw
HELENA
BOISE
46dBw
44dBw
42dBw
Figure 1-5: The western spot beam footprint for one Ku-Band satellite
1- 12
1705A Spectrum Monitor
Page 32

Zeroing in on a Satellite
Introduction
In almost all cases a set procedure for Locating, Identifying, Finding (transponders), and Optimizing will be followed. The 1705A Spectrum Monitor is a tool
that greatly simplifies the individual steps so the correct satellite transponder can
be accessed in the minimum time.
Locating the Satellite
Identifying the Satellite
In most cases the elevation (angle above the horizon) and the true azimuth
(direction east or west to the satellite) of the antenna will be the same as it was
for the previous access of the same satellite. This angle can be found in one of
two ways, calculation or approximation from previous accesses; however, no
matter how the satellite is located the signal path will need to be optimized. In
most cases the approximate location of the satellite is known from previous
transactions and only identification of transponders and signal strength remain to
be dealt with.
Each of the satellites has one or more singular characteristics. In many cases the
singular characteristics can be easily identified on the spectrum monitor, which
can save valuable setup time. These characteristics can take the form of
telemetry beacons, transponder polarization schemes, or blocks of non-video
signals that stand out. And in a few cases, the easiest method of identification
may be the fact that the satellite is near another satellite that is readily identifiable.
T elemetry Beacons. Satellites have special tracking or telemetry beacons that
are easily recognizable on the spectrum monitor. Not only do these assist in
identifying the satellite, but they provide an accurate way to set the frequency
offset to correspond with actual satellite frequencies. Figure 1-6 shows a typical
Ku--Band satellite telemetry beacon. Note that the 1705A readout frequency can
be offset to read the down link frequency in GHz. S imilar beacons can be found
on some C--Band satellites also.
1705A Spectrum Monitor
1- 13
Page 33

Introduction
Tek
12.20 GHZ
+f
REF
--10
--20
--30
--40
--50
--60
--70
L
O
G
Figure 1-6: A computer representation of the 1705A display showing the 12.198 GHz
horizontally polarized telemetry beacon on the SATCOM K2 satellite (Span/Div set
to 100 kHz with a 10 kHz Resolution filter)
Transponder Polarization. Whether one or two polarizations are used can
often be an easy way to identify a satellite. For example, a satellite with
alternate polarization will have overlapping bandwidths, similar to those
depicted in Figure 1-7. In this example the center frequency of each transponder
down link is given. With the center frequency for each transponder known,
finding the correct transponder and determining its activity is easily accomplished with the 1705A Spectrum Monitor.
1- 14
1705A Spectrum Monitor
Page 34
TRANSPONDER
FREQUENCY AND NUMBER
DOWN LINK
FREQUENCY
11.729GHz 11.788GHz 11.847GHz 11.906GHz 11.965GHz 12.024GHz 12.083GHz 12.142GHz
1
3
5
7
9
11
TRANSPONDER
13
NUMBER
15
Introduction
2
11.7585GHz 11.8175GHz 11.8765GHz 11.9355GHz 11.9945GHz 12.0535GHz 12.1125GHz 12.1715GHz
HORIZONTAL
POLARIZATION
4
6
8
10
12
VERTICAL
POLARIZATION
14
16
Figure 1-7: Transponder assignments for a typical Ku-Band, 16-transponder satellite that employs alternate
polarization (Not all Ku-Band satellites conform to these frequencies and/or this polarization scheme)
Finding The Correct
Transponder
Once the satellite has been found it will be necessary to find the proper transponder and determine if it is available. With the 1705A frequency readout offset
correctly set up, it is possible to directly zero in on the correct transponder.
Figure 1-8 is a computer simulation of the 1705A Spectrum Monitor display in
FULL SPAN/DIVISION. Each division corresponds to 100 MHz. If the
satellite previously discussed is being looked at and the brightup is on the first
marker, then the first signal is transponder number 1 and the antenna feed horn is
horizontally polarized. Further, it is possible to determine that transponders 5, 7,
9, 13, and 15 are currently in use. Rotating the feed horn polarity 90˚ would
bring up a display of the vertically polarized transponder down links.
Optimize Signal Strength
1705A Spectrum Monitor
Once the correct satellite has been identified, minor adjustment to the antenna
position will optimize the link. The antenna azimuth and elevation can be fine
tuned for maximum signal strength and the opposite polarization carefully nulled
while observing the spectrum monitor crt screen.
1- 15
Page 35

Introduction
11. 7 3 GH Z
REF
Tek
--10
--20
--30
--40
--50
--60
13 5 7 9111315
--70
L
O
+f
G
Figure 1-8: Simulation of a 1705A FULL SPAN/DIV display showing six transponders
illuminated
Looking at Exciters with
the 70 MHz Input
The 70 MHz Input to the spectrum monitor is a bnc connector. It is designed for
use with the IF signal from an up link exciter. Most up link transmitters use an
exciter to drive an Upconverter and High Power Amplifier (HPA), and, in most
cases, the driving signal to the Upconverter is a 70 M Hz IF. If the exciter output
is at the up link frequency, a 70 MHz monitoring point is often provided.
Sometimes the coupling of the IF signal between the exciter and Upconverter is a
coaxial link that can be opened and a directional coupler installed for sampling
purposes. See Figure 1-9.
NOTE. The 70 MHz input is rated at --20 dBm maximum, external pads may be
required to meet this operating condition.
Once a directional coupler is installed a whole series of checks can be made,
including presence of the proper carriers and an indication of the modulation
level. More detail can be found in the Tektronix Television booklet “Television
Operational Measurements; Video and RF for NTSC Systems.”
1- 16
1705A Spectrum Monitor
Page 36

HPA
IN
UP CONVERTER
OUT
IN
Introduction
RF
OUT
1705A
SPECTRUM MONITOR
Figure 1-9: Up link Video Exciter, Up converter, and High Power Amplifier (HPA)
showing how to hook up a 1705A Spectrum Monitor to look at the Video Exciter
output
In addition to the other measurements that can be made a quick check of HPA,
antenna, and transponder (as a system) can be made by comparing the exciter
output (using the 70 MHz input) to the incoming signal from the down link
(using the L--Band Input) by simply switching between inputs. See Figure 1-10.
Miscellaneous Uses for the 1705A
The 1705A Spectrum Monitor 70 MHz band covers a frequency range from 45
to 100 MHz, at center screen. The low VHF television channels and major
portion of the FM broadcast band are within the frequency range of the 1705A.
If a spectrum monitoring application within this band of frequencies exists the
1705A can easily be used.
70 MHZ
INPUT
DIRECTIONAL
COUPLER
OUT
VIDEO
EXCITER
1705A Spectrum Monitor
1- 17
Page 37

Introduction
L-OUT
L-BAND
900--1450 MHZ
LNB
Ku-IN
1705A
SPECTRUM MONITOR
Ku-BAND
12 GHZ
HPA
IN
UP CONVERTER
OUT
IN
Ku-BAND
14 GHZ
RF
OUT
3dB
SPLITTER
70 MHZ
INPUT
RECEIVER
DIRECTIONAL
COUPLER
OUT
VIDEO
EXCITER
Figure 1-10: 1705A hooked up to look at either the output of the Video Exciter (70
MHz) or the Receiver Input (L-Band)
1- 18
1705A Spectrum Monitor
Page 38

Operating Instructions
Page 39

Page 40

Section 2 Operating Instructions
These instructions provide information about the front-panel controls and
indicators, rear-panel connectors and switch, powering-up, and the measurement
graticule and alphanumeric readout.
Front-panel Controls and Indicators
The front--panel controls and indicators consist of momentary contact push-button switches, with backlit switch selections, and variable controls. For frontpanel control and indicator locations, see Figure 2-1. There are also functions
that are accessed by holding the switch down for approximately 1 second. These
functions are identified by a blue box surrounding the front--panel label.
FILTER
1. VIDEO
INPUT
Turns on or off the Video Filter, which reduces the post detection bandwidth
(video), to reduce the high-frequency components for display noise
averaging. A front-panel LED indicator lights when the Video Filter is on.
Holding the Video switch activates the High Gain mode. An on-screen
readout indicates 2 dB/Div. To exit this mode, hold the switch again, and the
on-screen readout returns to 10 dB/Div. Gain selection will not affect the
momentary touch VIDEO On/Off selection.
2. RESOLUTION
Selects the 2
indicated by the front-panel indicator.
3. INPUT
L--BAND or 70 MHz —A push-button switch to select either the L--BAND
(900 to 2000 MHz) or the 70 MHz (45 to 100 MHz) input for display.
Indicator lights show which input is displayed.
nd
IF bandwidth. Toggles between 10 kHz and 300 kHz as
1705A Spectrum Monitor
2- 1
Page 41

Operating Instructions
Tek
+f
REF
--10
--20
--30
--40
--50
--60
--70
1
4
Tektronix
VIDEO
ON 300 KHz
SWEEP
SPEED
FOCUS SCALE INTENS
L
O
G
FILTER
100
KHz
TRACE
RO TATI ON
2
1705A
RESOLUTION
10 KHz
CENTER FREQUENCY
SPAN/DIV
MENU
1
10 FULL
MHz
MHz
DISPLAY
6
POSITION
HORIZONTA L VERTICAL
3
SPECTRUM
MONITOR
INPUT
LBAND
70 MHz
POWER
5
ON
= HOLD FOR FUNCTION
7
11
10
8
12
Figure 2-1: 1705A front panel; refer to text for descriptions of controls identified with circled numbers
SWEEP
4. SWEEP SPEED
A variable control that sets the sweep repetition rate, which is typically
between 20 and 200 ms.
5. CENTER FREQUENCY
A ten-turn variable control that determines the center frequency of the
displayed portion of the spectrum.
13
9
2- 2
1705A Spectrum Monitor
Page 42

Operating Instructions
6. SPAN/DIV
Two push-button switches (left and right) that select the calibrated span per
division. Each span is indicated by a front-panel LED.
FULL -- Provides a span of 50 MHz per division for the L--Band (900 -- 2000
MHz) input, and 5 MHz per division (45 to 100 MHz) for the 70 MHz input.
10 MHz -- Sets display span to 10 MHz per division. Displays a maximum
of 120 MHz for one full sweep (not available for the 70 MHz input). The
100 MHz portion of the sweep that is displayed is dependent on the setting
of the HORIZONTAL POSITION control.
1 MHz -- Sets display span to 1 MHz per division. Displays a maximum of
12 MHz for one full sweep. The 10 MHz portion of the sweep that is
displayed is dependent on the setting of the HORIZONTAL POSITION
control.
100 kHz -- Sets display span to 100 kHz per division. Displays a maximum
of 1.2 MHz for one full sweep. The 1 MHz portion of the sweep that is
displayed is dependent on the setting of the HORIZONTAL POSITION
control.
DISPLAY
MENU -- When both SPAN/DIV switches are pressed simultaneously, the
normal display is replaced by the Main menu. To exit the Main menu,
position the cursor by EXIT and press the INPUT switch. The M enu
functions are discussed in detail later in this section.
7. FOCUS
A variable control that adjusts the crt beam for optimum definition.
8. SCALE
A variable control that adjusts the level of graticule illumination.
9. INTENS
A variable control that adjusts the display brightness.
10. TRACE ROTATION
A screwdriver adjustment that aligns the crt trace with the crt graticule to
compensate for variations in the magnetic field surrounding the 1705A.
1705A Spectrum Monitor
2- 3
Page 43

Operating Instructions
POSITION
POWER
11. HORIZONTAL
A variable control that positions the trace horizontally (X axis).
12. VERTICAL
A variable control that positions the display vertically (Y axis).
13. POWER
Switches the instrument between a powered up state and standby. Portions
of the Power Supply circuit board have mains potential on them in either
state. A mechanical indicator in the center of the switch shows the status of
the POWER switch.
Rear - Panel Connectors
INPUTS
WARNING. Mains power is still applied to the 1705A Power Supply circuit board,
regardless of POWER switch state. To totally remove shock hazard, it is
necessary to unplug the instrument and wait for the capacitors to discharge.
Signal input and power input are located on the 1705A rear panel. See Figure 2-2 for the locations of the rear-panel connectors.
1. L--BAND
A75Ω input f-type connector used for the 900 -- 2000 MHz input of L--Band
rf, which is down converted by a Low-Noise Amplifier/Block Down
Converter (LNB) from the received satellite signal.
2. LNB POWER (Switch)
Switch to turn on or off the +18 V supply on the L--BAND INPUT connector. Supply is normally used to power a Low-Noise Amplifier/Block Down
Converter at the antenna.
2- 4
1705A Spectrum Monitor
Page 44

Operating Instructions
6
SPECTRUM MONITO R
WARNING
TO AVOID ELECTRI CAL SHOCK, THE POWER
CORD PROTECTI VE GROUNDI NG CONDUCTOR
MUST BE CO NNECTED TO EARTH GROUND.
0.7AMAX
50/60Hz
REPLACE FUSE ONLY WI TH
90-250V
250V 2A F TYPE
70 MHz
INPUT
!
5
4
3
333--3990 --01
DIE I N DIESEM GERATENTSTEHENDE
RONTGENSTRAHLUNG IST AUSREICHEND ABG ESCHIRMT
BESCHLEUNIGUNGSSPANNUNG KLEINER ALS
LNB POW-
ER
ON
L BAND
!
1
INPUT
LNB POW-
ER
ON
OFF
+18 VDC @ 2 50 mA
2
20kV
Figure 2-2: 1705A rear panel controls and connectors; refer to text for descriptions
of controls identified with circled numbers
3. LNB POWER (Indicator)
POWER
LED indicator that lights when the +18 V supply is turned on and operating
correctly. Indicator will not light if the +18 V supply is shorted.
4. 70 MHz
A75Ω input bnc-type connector used for the input of the 45 -- 100 MHz rf.
5. AC FUSE
Holder for the instrument’s mains fuse.
6. AC POWER
A standard ac plug receptacle for 120 or 220 Vac power mains.
1705A Spectrum Monitor
2- 5
Page 45

Operating Instructions
Powering- up
When the 1705A is first powered up, it should come up in a measurement mode.
Most commonly it will be configured as it was when it was last turned off. If
not, there are some very simple checks that should be made.
If the power switch is showing ON, but the graticule and front-panel indicators
do not come on, check for a mains power problem, such as a blown fuse or
interrupted power mains (unplugged or main breaker thrown). If these are right,
refer to a qualified service technician for troubleshooting.
If the Non-Volatile RAM (NVRAM) is defective, which disables the operation of
the Microprocessor, there is a crt readout. If the 1705A comes on with the
following message:
ERROR : CANNOT READ OR WRITE
TO 2444
PRESS [VIDEO] KEY TO EXIT
operation will be questionable and the 1705A should be thoroughly checked out
by a qualified service technician.
Normal start-up of the instrument should consist of a display of alphanumeric
frequency readout and a spectrum display similar to that in Figure 2-3.
Tek
1400 MHZ
REF
--10
--20
--30
--40
--50
--60
--70
L
O
G
Figure 2-3: 1705A display when powered up in L-BAND and FULL SPAN; CENTER
FREQUENCY set to approximately mid range
2- 6
1705A Spectrum Monitor
Page 46

Measurement Graticule
Operating Instructions
The 1705A is equipped with an internal graticule crt. The graticule has an 8 X
10 division scale that is lighted. Scale brilliance is controlled by the front-panel
SCALE control. Figure 2-4 shows the 1705A graticule. Refer to this figure and
subsequent figures when reading the following discussion of the graticule.
Vertical Scales
Tek
REF
--10
--20
--30
--40
--50
--60
--70
L
O
+f
G
Figure 2-4: 1705A graticule scale
The vertical scale is eight divisions in height. The center vertical scale is broken
into five equal minor divisions per major division. Note that the 0 dB reference
is at the top of the graticule and that 80 dB (maximum division) is at the bottom
of the graticule. There are two gain selections: normal gain (10 dB/div) and
high gain (2 dB/div). In normal gain mode, major divisions are 10 dB, which
makes each minor division 2 dB. When the GAIN front-panel push button is
held, high gain is selected, and major divisions are approximately 2 dB, which
makes minor divisions about 0.4 dB each.
1705A Spectrum Monitor
Since dB is a dimensionless ratio, and there are several scale variations, it is
essential that there be some discussion of the various scales. The unit of
measure described as dB (decibel) is 10 LOG P1/P2. If there is a specific scale
defined (m, k, w, p, etc.), there is a specific reference point established. The
1705A has input specifications in dBm, which means that they are referenced to
1 mW (milliwatt). Therefore, --30 dBm is 30 dB below 1 mW. Table 2--1 is a
handy reference table for dB and dBm. Table 2--2 provides a reference for
conversion from dBm to v.
2- 7
Page 47

Operating Instructions
Table 2- 1: dB Reference
Reading in dB Voltage Ratio Power Ratio Reading in dB Voltage Ratio Power Ratio
0.0 1.000 1.000 25.0 17.783 316.228
0.1 1.012 1.023 26.0 19.953 398.107
0.2 1.023 1.047 27.0 22.387 501.187
0.3 1.035 1.072 28.0 25.119 630.957
0.4 1.047 1.096 29.0 28.184 794.328
0.5 1.059 1.122 30.0 31.623 1000.000
0.6 1.072 1.148 31.0 35.481 1258.925
0.7 1.084 1.175 32.0 39.811 1584.893
0.8 1.096 1.202 33.0 44.668 1995.262
0.9 1.109 1.230 34.0 50.119 2511.886
1.0 1.122 1.259 35.0 56.234 3162.278
1.5 1.189 1.413 36.0 63.096 3981.072
2.0 1.259 1.585 37.0 70.795 5011.872
2.5 1.334 1.778 38.0 79.443 6309.573
3.0 1.413 1.995 39.0 89.125 7943.282
4.0 1.585 2.512 40.0 100.000 10000.000
5.0 1.778 3.162 41.0 112.202 12589.254
6.0 1.995 3.981 42.0 125.893 15848.932
7.0 2.239 5.012 43.0 141.254 19952.623
8.0 2.512 6.310 44.0 158.489 25118.864
9.0 2.818 7.943 45.0 177.828 31622.777
10.0 3.162 10.000 46.0 199.526 39810.717
11.0 3.548 12.589 47.0 223.872 50118.723
12.0 3.981 15.849 48.0 251.189 63095.734
13.0 4.467 19.953 49.0 281.838 79432.023
14.0 5.012 25.119 50.0 316.228 100000.000
15.0 5.623 31.623 51.0 354.813 125892.541
16.0 6.310 39.811 52.0 398.107 158489.319
17.0 7.079 50.119 53.0 446.684 199526.231
18.0 7.943 63.096 54.0 501.187 251188.643
19.0 8.913 79.433 55.0 562.341 316227.766
20.0 10.000 100.000 56.0 630.957 398107.171
21.0 11.220 125.893 57.0 707.946 501187.234
22.0 12.589 158.489 58.0 794.328 630957.344
23.0 14.125 199.526 59.0 891.251 794328.235
24.0 15.849 251.189 60.0 1000.00 1000000.000
2- 8
1705A Spectrum Monitor
Page 48

Operating Instructions
Table 2- 2: dBm to
v Conversion
Reading in dBm v(75Ω) v(50Ω) Reading in dBm v(75Ω) v(50Ω)
--- 3 0 8660 7071 --- 1 0 5 1.540 1.257
--- 3 5 4870 3976 --- 1 1 0 0.866 0.707
--- 4 0 2739 2236 --- 1 1 5 0.487 0.398
--- 4 5 1540 1257 --- 1 2 0 0.274 0.224
--- 5 0 866 707 --- 1 2 5 0.154 0.126
--- 5 5 487 398 --- 1 3 0 0.087 0.071
--- 6 0 274 224 --- 1 3 5 0.049 0.040
--- 6 5 154 126 --- 1 4 0 0.027 0.022
--- 7 0 87 71 --- 1 4 5 0.015 0.013
--- 7 5 49 40 --- 1 5 0 0.009 0.007
--- 8 0 27 22 --- 1 5 5 0.005 0.004
--- 8 5 15 13 --- 1 6 0 0.003 0.002
--- 9 0 9 7 --- 1 6 5 0.002 0.001
--- 9 5 5 4 --- 1 7 0 0.001 0.001
--- 1 0 0 3 2 --- 1 7 5 0.000 0.000
Horizontal Scales
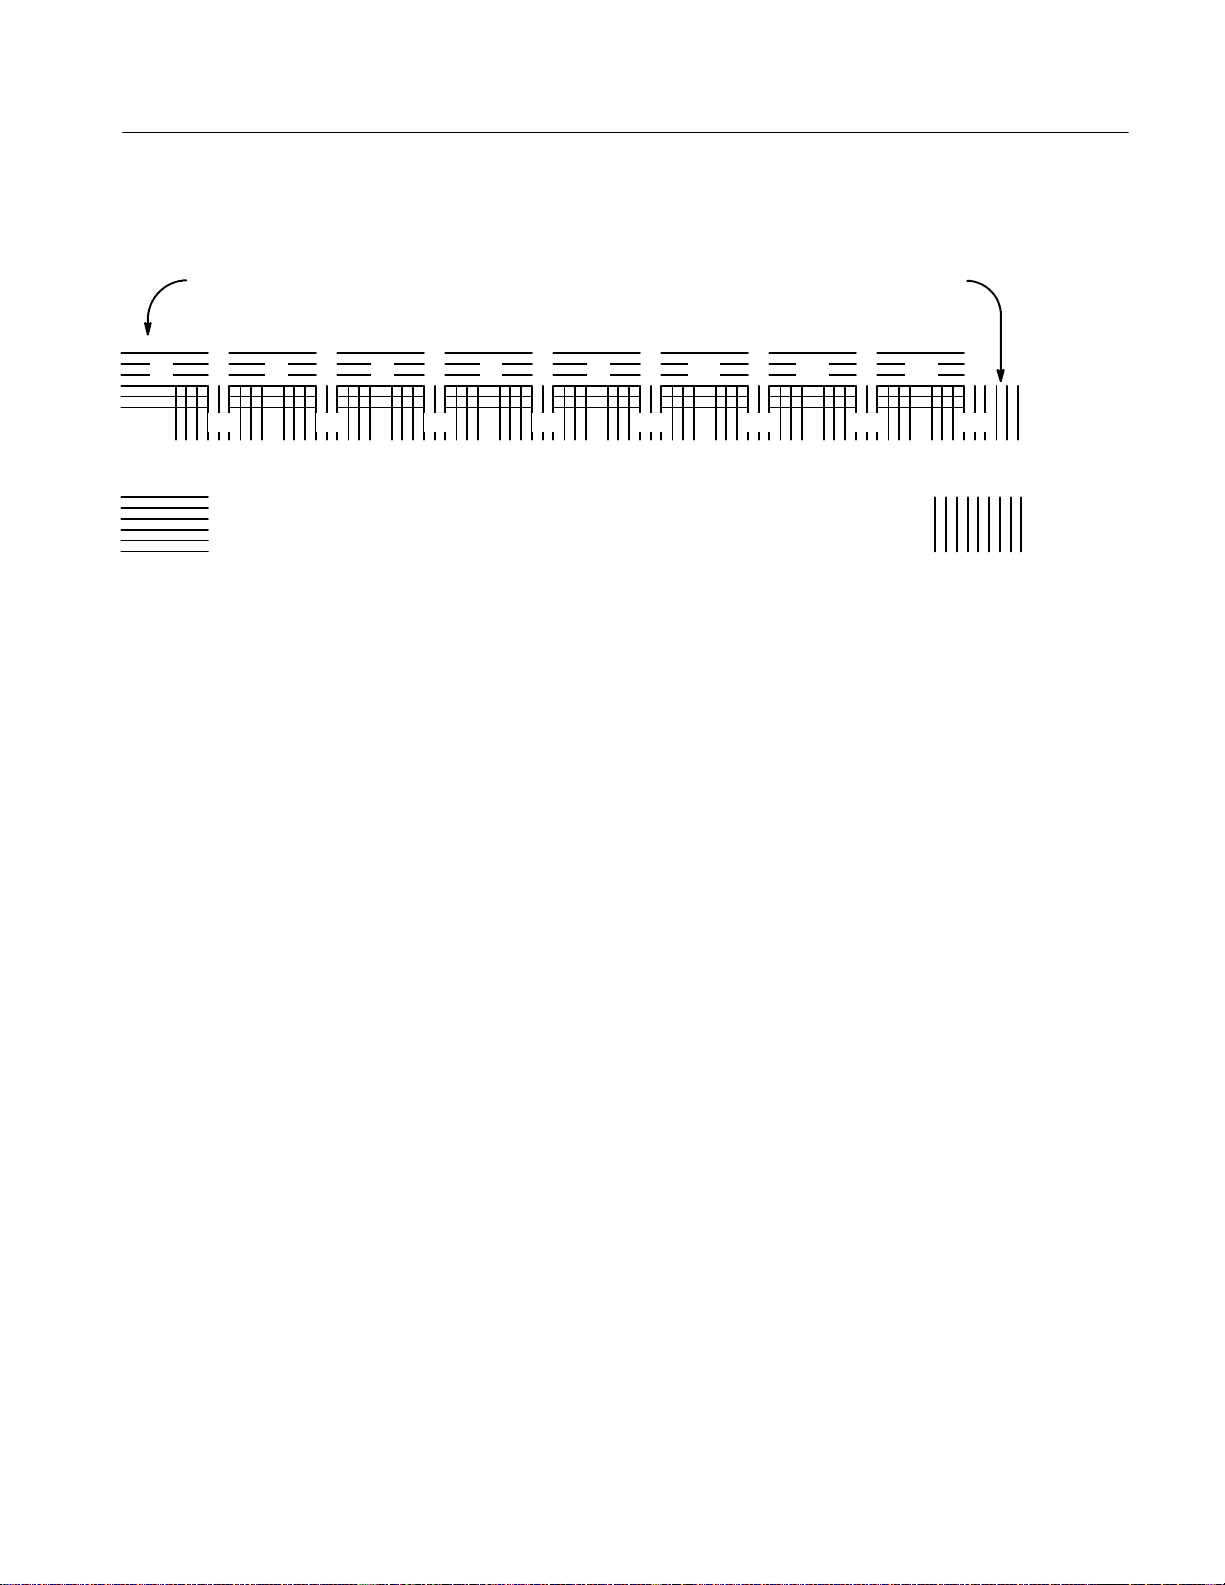
The horizontal graticule scales are divided into ten major divisions, which are
further divided into five minor divisions each. The horizontal scale corresponds
to frequency, with the lowest frequency to the left. Note the arrow in Figure 2-4
that signifies that the frequency ascends toward the right. Both the --60 and --80
dB lines are subdivided with minor division marks. Traditionally, many
spectrum analyzer measurements and specifications are between 6 and 60 dB.
The available sweep for the 1705A is 12 divisions long, which means that not all
of the frequencies that it is capable of displaying can be displayed simultaneously. Figure 2-5 compares the sweep length to the graticule. It shows the usable
areas of the sweep, as well as the minimum and maximum frequencies of the two
bands.
1705A Spectrum Monitor
2- 9
Page 49

Operating Instructions
MINIMUM
FREQUENCY
L-BAND = 900 MHz
70 MHz = 45 MHz
L-BAND = 2000 MHz
MID
FREQUENCY
SCALE = 10 DIVISIONS
SWEEP LENGTH = 12 DIVISIONS
MAXIMUM
FREQUENCY
70 MHz = 100 MHz
Figure 2-5: Relationship of sweep to graticule showing minimum and maximum
frequencies when CENTER FREQUENCY is set to mid band
Figure 2-6 shows frequencies associated with the graticule lines in FULL
SPAN/DIV when the CENTER FREQUENCY control is set to 1400 (for
L--Band) or 70 MHz (for the 70 MHz). Note also that the HORIZONTAL
POSITION control affects the frequency-to-graticule scale resolution. Determining where the HORIZONTAL POSITION control is set can easily be determined
using one of the magnified SPAN/DIV settings and the readout cursor.
2- 10
1705A Spectrum Monitor
Page 50

Operating Instructions
45
70 MHZ
MHZ
50 55 60 65 70 75 80 85 90
Tek
+f
1000 1100 1200 1300 1400 1500 1600 1700 1800
95
MHZ
REF
--10
--20
--30
--40
--50
--60
--70
L
O
G
900
MHZ
Figure 2-6: Frequency relationship to horizontal graticule scale; center frequency
corresponds to the center of the horizontal scale
Center Frequency Readout
The 1705A is equipped with alphanumeric readout for the CENTER FREQUENCY. This readout works in conjunction with a cursor. In FULL SPAN/DIV, the
cursor is actually a bright-up zone on the trace. See Figure 2-7. Actual position
of the readout on the crt can be positioned to a location where it will not interfere
with the measurements being made.
L-BAND
1900
MHZ
1705A Spectrum Monitor
Test Equipment Depot - 800.517.8431 - 99 Washington Street Melrose, MA 02176 - FAX 781.665.0780 - TestEquipmentDepot.com
2- 11
Page 51

Operating Instructions
Tek
1400 MHZ
+f
REF
--10
--20
--30
--40
--50
--60
--70
L
O
G
Figure 2-7: Center frequency cursor and readout for the L-Band with FULL
SPAN/DIV
In the magnified, or decreased, SPAN/DIV settings the cursor is an inverted
pyramid (caret) that is directly over the part of the sweep that corresponds to the
setting of the front-panel CENTER FREQUENCY control. See Figure 2-8.
Horizontal positioning affects the position of the cursor and the associated
alphanumeric readout, which is directly above the cursor. The displayed location
of the CENTER FREQUENCY can be displaced by up to 2 divisions from
graticule center depending on the setting of the control. See Figure 2-9.
2- 12
1705A Spectrum Monitor
Page 52

1400 MHZ
POINT ON THE TRACE THAT
CORRESPONDS TO 1400 MHZ.
CENTER FREQUENCY
TUNED AT THIS POINT.
Operating Instructions
Figure 2-8: 1705A CRTwith the SCALE turned down to show the relationship
between the alphanumeric readout and the front-panel CENTER FREQUENCY
tuning
1400 MHZ
POINT ON THE
TRACE THAT
CORRESPONDS TO
1400 MHZ.
CENTER FREQUENCY
TUNED AT THIS POINT.
1705A Spectrum Monitor
Figure 2-9: The setting of the HORIZONTAL POSITION control can displace the
location of the displayed center frequency
2- 13
Page 53

Operating Instructions
Customizing Frequency Readout
The type and location of the readout for the TEKTRONIX 1705A Spectrum
Monitor can be changed from the front panel. The options available are: 1. The
choice of having readout or turning it off. 2. The position on the crt where the
readout appears. 3. A customized readout that displays the satellite transponder
frequency rather than the L--Band tuner frequency.
The auxiliary setup menu used to make these selections is brought up to the crt
when both ←SPAN/DIV→ buttons are pushed simultaneously. Figure 2-10
shows the selections that are available from the crt menus. Pushing the
designated front-panel switch accomplishes the specified menu task. Note that
the solid lines in Figure 2-10 denote how to work through the menus, while the
dashed lines show how to exit from the menu and return to the normal monitor
display.
The readout control options share a software routine with the operator diagnostics (Test) in the Main menu. The Main menu, along with the Readout Mode
and Test menus, use a cursor and select method of operation. With these menus
the selection is marked by moving the cursor, up with the SPAN→ push button
or down with the ←SPAN push button, and pushing the INPUT button to
complete the selection.
Turning On or Off Readout
Changing Readout
Position
The Readout Position and Offset Adjust menus assign other functions to some of
the front-panel push-button switches. For these specific functions the names in
brackets correspond to front-panel switch names.
The selections for disabling/enabling the crt readout are contained in the Readout
Mode menu. Readout is turned off by setting the displayed cursor (>) next to the
OFF selection and pushing the INPUT push button. Readout is turned on by
moving the displayed cursor next to ON and pushing the INPUT push button.
Once the function is selected pushing the INPUT push button a second time
returns to normal monitor operation.
Pushing the RESOLUTION, VIDEO, ←SPAN, and SPAN→ push buttons after
the Readout Position auxiliary menu has been displayed moves the readout
around the crt area. Readout can be anywhere within the crt area. See Figure
2-10 for the function of the push-button switches in the Readout Position menu.
Pushing any one of the four (newly assigned positioning) buttons returns to the
normal display, with readout. At this point, pushing RESOLUTION, VIDEO, or
either of the SPAN buttons moves the readout. Push buttons can be held down
for smooth advancement, or pushed for each small movement increment. Once
the readout location is satisfactory, pushing the INPUT button saves the position
and returns to the Main menu. When the INPUT push button is pushed again,
the monitor returns to normal operation.
2- 14
1705A Spectrum Monitor
Page 54

.
ON
OFF
L-BAND
OFFSET
L.O. HIGH
>EXIT
USE SPAN KEYS TO MOVE CURSOR,
PRESS INPUT KEY TO SELECT.
OFFSET ADJUST
DOWN
UP
EXIT/SAVE
READOUT MODE
[<SPAN]
[SPAN>]
[INPUT]
SPECTRUM
DISPLAY
READOUT POSITION
UP
DOWN
LEFT
RIGHT
EXIT/SAVE
[RES]
[VIDEO]
[<SPAN]
[SPAN>]
[INPUT]
Operating Instructions
SPAN/DIV
MAIN MENU
READOUT MODE
READOUT POSITION
TEST
>EXIT
USE SPAN KEYS TO MOVE CURSOR,
PRESS INPUT KEY TO SELECT.
TEST
MEMORY
DAC
LED
KEY
>EXIT
USE SPAN KEYS TO MOVE CURSOR,
PRESS INPUT KEY TO SELECT.
Figure 2-10: Using the 1705A menus. Main menu is entered from the spectrum display by pressing both SPAN/DIV
buttons simultaneously
NOTE. The 1705A must be returned to the normal operating routine before the
front-panel push-button switches perform the label functions. Push the INPUT
push button as many times as required to bring up the spectrum analyzer display.
Changing Readout
Frequency
The 1705A readout normally displays the frequency of the L--Band or 70 MHz
input signal. The L--Band input is a downconverted signal between 900 to
2000 MHz, which by itself does not return meaningful information. Because of
this it may be easier to display the readout that corresponds to the actual satellite
1705A Spectrum Monitor
2- 15
Page 55

Operating Instructions
transponder frequency. Changing the readout to reflect these frequencies is
easily accomplished by selecting the Readout Mode from the Main menu and
Offset from the Readout Mode menu, which brings up the Offset Adjust menu.
Selecting Offset allows the readout units to be changed to GHz and the frequency
set to a value between 0.9 and 20. Push buttons can be held down for smooth
advancement or pushed for each small movement increment. Maximum and
minimum readout can only be achieved with the CENTER FREQUENCY at the
appropriate extreme.
CENTER FREQUENCY control can change the range of readout (in L--Band)
by 1.1 GHz for full end-to-end rotation. See Figure 2-11 for an example of the
display during Offset Adjust.
12.00 GHZ
2- 16
Figure 2-11: An example of the readout displayed while satellite frequency is being
set. The ∆ is the same for both increasing and decreasing frequency
When Offset is selected from the Readout Mode an additional auxiliary menu
appears on screen for several seconds before it extinguishes and the spectrum
analyzer display with GHz readout appears. Refer to Figure 2-10. Pushing the
SPAN→ push button causes the numerical part of the readout to scale upward
toward 20. Pushing the ←SPAN push button scales down the numerical readout
toward 0.9.
Once the readout has been changed to GHz, the frequency display can be altered
to show frequencies ascending or descending from left to right. When L.O. High
is selected turning the front-panel CENTER FREQUENCY clockwise incre-
1705A Spectrum Monitor
Page 56

Operating Instructions
ments the frequency readout (low to high) and moves the brightened portion of
the sweep from left to right. When L.O. Low is selected the readout decrements
(high to low) and the brightened portion of the sweep moves from left to right,
with clockwise rotation of the CENTER FREQUENCY.
When L--Band is selected from the Readout Mode menu, the Main menu returns
and the readout is scaled in MHz. Changes of frequency readout are shown in
ascending order when the front-panel CENTER FREQUENCY control is rotated
clockwise.
Once the satellite frequency and L.O. have been set, pushing the INPUT push
button saves the display and returns the Main menu. Pushing the INPUT push
button again returns to normal monitor operation.
NOTE. The 1705A must be returned to the normal operating routine before the
front-panel push-button switches perform the label functions. Push the INPUT
push-button as many times as required to bring up the spectrum analyzer
display.
Test Mode
The series of tests that can be made are documented in Section 6, Maintenance,
under the sub-section heading of “General Troubleshooting Techniques.”
Locating Ku- Band Satellites
The TEKTRONIX 1705A Spectrum Monitor is specifically designed to help the
television news vehicle operator quickly and properly address a satellite. Even
though the 1705A will be most often used for Ku--Band transmissions, it can be
used with any satellite system that can be downconverted to its L--Band input
frequencies.
The following operating procedure is typical and can be adjusted to fit particular
vehicle and operator preferences.
Basic Operating
Procedure
1. The expected true azimuth and elevation to the satellite from a specific
location should be determined by calculation or reference to Table 2--3 for
popular news satellites. Table 2--3 lists 21 Continental United States
(CONUS) cities; the cities in the table are spotted around the country and
can help to approximate (the location of a satellite) from any area of the 48
contiguous states.
1705A Spectrum Monitor
2- 17
Page 57

Operating Instructions
2. Stabilize the vehicle in a location where there will be a clear path between
the antenna and the satellite. The vehicle should be reasonably level to
facilitate antenna and polarization adjustment.
3. Point the antenna in the expected direction of the satellite. Note that
compass readings may not be accurate in the presence of vehicles or
structures. Several readings, at nearby locations, should be taken to
determine any unusual effects. Appropriate correction for magnetic variation
must be made when a magnetic compass is used. The locating tables
indicate true north.
4. If the antenna azimuth and elevation are remotely adjusted, the TEKTRONIX 1705A may be permanently connected to the splitter feeding the
L--Band downlink signal from the outdoor Low Noise Block Converter
(LNB) to the indoor receiver . If the antenna is to be adjusted manually, a
portable ac or battery-powered 1705A may be connected directly to the LNB
at the antenna, in which case the spectrum monitor can be used to power the
LNB.
Table 2- 3: Azimuth / Elevation Table for 21 CONUS Cities
SATCOM K2 G--STAR II SBS--3
CITY
Atlanta 175˚
Boston
Chicago
Dallas /Ft. Worth
Denver
Detroit
Houston
Las Vegas
Los Angeles
Miami
Minneapolis/St Paul
Nashville
New Orleans 162˚ 54˚ 208˚ 51˚ 190˚ 55˚
AZ EL
50˚ 214˚ 45˚ 199˚ 49˚
195˚ 40˚ 225˚ 31˚ 214˚ 36˚
170˚ 41˚ 205˚ 38˚ 190˚ 41˚
150˚ 47˚ 192˚ 53˚ 172˚ 51˚
145˚ 38˚ 180˚ 44˚ 165˚ 43˚
177˚ 44˚ 212˚ 38˚ 198˚ 42˚
153˚ 52˚ 199˚ 53˚ 180˚ 55˚
131˚ 35˚ 163˚ 47˚ 148˚ 43˚
127˚ 34˚ 158˚ 48˚ 143˚ 43˚
180˚ 61˚ 227˚ 49˚ 211˚ 55˚
164˚ 37˚ 198˚ 37˚ 184˚ 38˚
170˚ 48˚ 209˚ 44˚ 193˚ 47˚
AZ EL AZ EL
2- 18
New York 191˚ 42˚ 223˚ 33˚ 211˚ 38˚
Philadelphia 189˚ 43˚ 222˚ 34˚ 210˚ 39˚
Phoenix 132˚ 39˚ 168˚ 51˚ 150˚ 47˚
1705A Spectrum Monitor
Page 58

Operating Instructions
Table 2- 3: Azimuth / Elevation Table for 21 CONUS Cities (Cont.)
Salt Lake City 137˚ 34˚ 169˚ 42˚ 155˚ 39˚
San Francisco 125˚ 28˚ 154˚ 42˚ 140˚ 38˚
Seattle 131˚ 22˚ 158˚ 32˚ 146˚ 29˚
St. Louis 166˚ 44˚ 204˚ 42˚ 188˚ 45˚
Washington DC 186˚ 45˚ 221˚ 36˚ 216˚ 38˚
5. If the antenna is pointed close to a satellite, one or both polarizations of the
full satellite will appear on the screen because the 1705A S pectrum Monitor
is a much more sensitive indicator than a receiver and picture monitor.
Initially, there is no need to be concerned with antenna polarization or which
satellite channels may be active.
6. If no satellite signal is observed, or the incorrect satellite is identified, sweep
the antenna azimuth carefully around the expected satellite direction. If no
satellite is found, return the azimuth to the expected direction and increase
(or decrease) the elevation by about one degree and resweep the azimuth.
7. When a satellite signal has been observed on the 1705A display, it may be
identified by the nature of the signals on the satellite. For example, wide
bandwidth NBC television signals with multiple audio and data carriers on
many transponders will identify Satcom K--2. Other satellites will have
similar identifying characteristics. If the incorrect satellite has been selected,
repoint the antenna to locate the desired satellite. Once any satellite is found
and identified, a reference point is established and nearby satellites may be
located by moving the antenna carefully in the proper direction.
8. Optimize the antenna by carefully adjusting azimuth and elevation while
observing the signal strength on the 1705A Spectrum Monitor. At this time
one or both satellite polarizations will be observed, but the received signal
may not be a viewable picture for a picture monitor.
9. The polarization must be adjusted in a transmit/receive system by rotating
the antenna feed to minimize the undesired, cross polarized signal.
WARNING. This adjustment requires a spectrum monitor and should not be
attempted using a r eceiver and picture monitor alone. Any mis-adjustment will
put the transmit signal on the wrong satellite transponder and create interference with another user. Furthur access to the satellite may be denied!
1705A Spectrum Monitor
As the antenna feed is rotated, observe that there will be a sharp null of
signals on one polarization or the other. Rotate the feed carefully to null the
signals of the polarization that will not be used. Most news vehicle feed
2- 19
Page 59

Operating Instructions
systems are single polarization receive to avoid the possibility of nulling the
wrong polarization. If the antenna is set up to receive more than one
polarization, be sure that the feed polarization being observed is associated
with the transponder that will be used for the transmission.
10. Before transmitting, the satellite operator will need to be contacted. The
operator will want a transmit signal to be brought up to verify correct
transponder, signal polarization, and to determine the correct operating
power. If the antenna and transmitting system are correctly adjusted, this
check will only take seconds. This check may be permitted earlier in the
day, if time is available and the antenna or transmitter setting are not to be
changed.
11. During transmit, the 1705A may be used to verify the presence of video,
audio, and any communications signals at the 70 MHz output of the Video
Exciter. This signal may be permanently connected to the 1705A, along with
the L--Band receive connection, to allow front-panel selection. With either
input, narrower spans may be selected to permit observing discrete signals.
12. Be sure that there is an agreed upon “good night” for the transmission. The
carrier will not be watching your program content, and must know clearly
when you are finished with the satellite. Unless there is a specific agreement, the carrier will expect a telephone call to know you are clear, and you
will be charged.
2- 20
1705A Spectrum Monitor
Page 60

WARNING
The following servicing instructions are for use only by qualified personnel. To
avoid injury, do not perform any servicing other than that stated in the operating
instructions unless you are qualified to do so. Refer to all safety summaries before
performing any service.
Page 61

Page 62

Installation
Page 63

Page 64

Section 3 Installation
Packaging
Electrical Installation
Power Source
Mains Frequency and
Voltage Ranges
The shipping carton and pads provide protection for the instrument during
transit, and should be retained in case subsequent shipment becomes necessary.
Repackaging instructions can be found in Section 6 (Maintenance) of this
manual.
This instrument is intended to operate from a single-phase power source having
one of its current-carrying conductors at or near earth-ground (the neutral
conductor). Only the line conductor is fused for over-current protection.
Systems that have both current-carrying conductors live with respect to ground
(such as phase-to-phase in multiphase systems) are not recommended as power
sources.
The 1705A operates over a frequency range of 48 to 66 Hz, at any mains voltage
between 90 Vac and 250 Vac. These newer versions of the 1705A instruments
do not require any internal changes to select their operating voltage range.
+18 Volts For Block Down
Converter
1705A Spectrum Monitor
The slide switch located on the 1705A rear panel, between the input connectors,
enables/disables the +18 V supply on the L--BAND connector. See Figure 3-1.
This supply, when switched on, is intended to provide power for a Block Down
Converter (LNB), through the L--BAND INPUT connector.
3- 1
Page 65

Installation
LNB POWER
ON
Operating Options
L BAND
INPUT
LNB POWER
ON
OFF
+18 VDC @ 250 mA
Figure 3-1: L-BAND INPUT connector and controls
Under extreme LNB load conditions it is possible for the +18 V supply to load
the main 1705A power supply enough to change the low line regulation. Under
these circumstances the power supply may go out of regulation when mains
voltage falls below 100 V.
The 1705A provides an internal jumper setting to enable or disable the graticule
lights. See Table 3--1.
Table 3- 1: Internal Jumper Selection
Jumper
Name Positio n Function
Mechanical Installation
Cabinet Options
3- 2
A3A1 J100 Light Enable 1 --- 2
Graticule lights enabled
(factory set)
2 --- 3
Graticule lights disabled
NOTE. Cabinet drawings are provided for installation information only, and are
not to scale. All dimensions are in inches.
1705A Spectrum Monitor
Page 66

Installation
All qualification testing for the 1705A was performed with a 1700F00 cabinet
installed. See Figure 3-2. To guarantee compliance with specifications, the
instrument must be operated in a cabinet. The portable cabinet, 1700F02, has a
handle, four feet, a flip-up stand, and has different hole sizes and spacing than
the 1700F00. See Figure 3-3.
All of the 1700-Series metal cabinets, available from Tektronix as Optional
Accessories, provide the proper electrical environment for the instrument, supply
adequate shielding, minimize handling damage, and reduce dust accumulation
within the instrument.
8.250
6.8750.688
5.105
1.060
16.180
0.156 DIA.
6.130
BOTTOM SIDE
REAR
12.725
(4)
Figure 3-2: Dimensions of the 1700F00 plain cabinet
1705A Spectrum Monitor
3- 3
Page 67

Installation
Top
410.97 mm
(16.180 in)
Side
Figure 3-3: 1700F02 portable cabinet dimensions
Cabinetizing
WARNING.
mounting screws. There is nothing to hold the instrument in the cabinet if it is tipped
forward.
Do not attempt to carry a cabinetized instrument without installing th e
209.55 mm
(8.250 in)
126.49 mm
(4.980 in)
209.55 mm
(8.250 in)
174.63 mm
(6.875 in)
Rear
17.48 mm
(0.688 in)
14.00 mm
(0.551 in)
3- 4
The instrument is secured to the cabinet by two 6--32 PozidriveǺ screws, located
in the upper corners of the rear-panel. See Figure 3-4.
1705A Spectrum Monitor
Page 68

Cabinet Securing Screws
Installation
Rack Adapter
SPECTRUM MONITO R
WARNING
TOAVOID ELECTR ICAL SHOCK, THE POWER
CORDPROTECTIVEGROUNDINGCONDUCTOR
MUSTBE CONNECTEDTOEARTH GROUND.
0.7AMAX
50/60Hz
REPLACEFUSEONLYWITH
V
90-250
250V 2A F TYPE
70 MHz
INPUT
!
333--3990 --01
DIE IN DI ESEM GERATEN TSTEHENDE
RONTGENSTRAHLUNGIST AUSREICHEND ABGESCHIRMT
BESCHLEUNIGUNGSSPANNUNGKLEINER ALS
LNB POWER
ON
L BAND
LNB POWER
INPUT
ON
OFF
!
+18 VDC @ 25 0 m A
20kV
Figure 3-4: Cabinet securing screws
The optional WFM7F05 side-by-side rack adapter, shown in Figure 3-5, consists
of two attached cabinets. It can be used to mount the 1705A and another
half-rack width instrument in a standard 19-inch rack.
CAUTION. Be sure to read and follow the instructions that are shipped with the
rack adapter.
1705A Spectrum Monitor
Use the correct sleeve for your product. The ventilation holes and EMI shielding
on the sleeves are specially designed to meet the requirements of the instruments
for which they were intended. If you use the wrong sleeve, it could damage the
instrument and cause overheating problems.
When working with instruments that are not enclosed in a chassis, you must
observe static precautions. You must also be careful not to damage circuit board
mounted components or interconnection wiring when sliding a sleeve over these
products.
3- 5
Page 69

Installation
18.970
5.250
Mounting
holes
6.875
Rear view
17.270
Controls front panel
to rack alignment
Figure 3-5: The WFM7F05 side-by-side rack adapter
The rack adapter is adjustable, so the instrument can be more closely aligned
with other equipment in the rack. See Figure 3-5.
WFM7F05
3- 6
1700F06
Figure 3-6: A WFM7F05 with a blank front panel (1700F06)
1705A Spectrum Monitor
Page 70
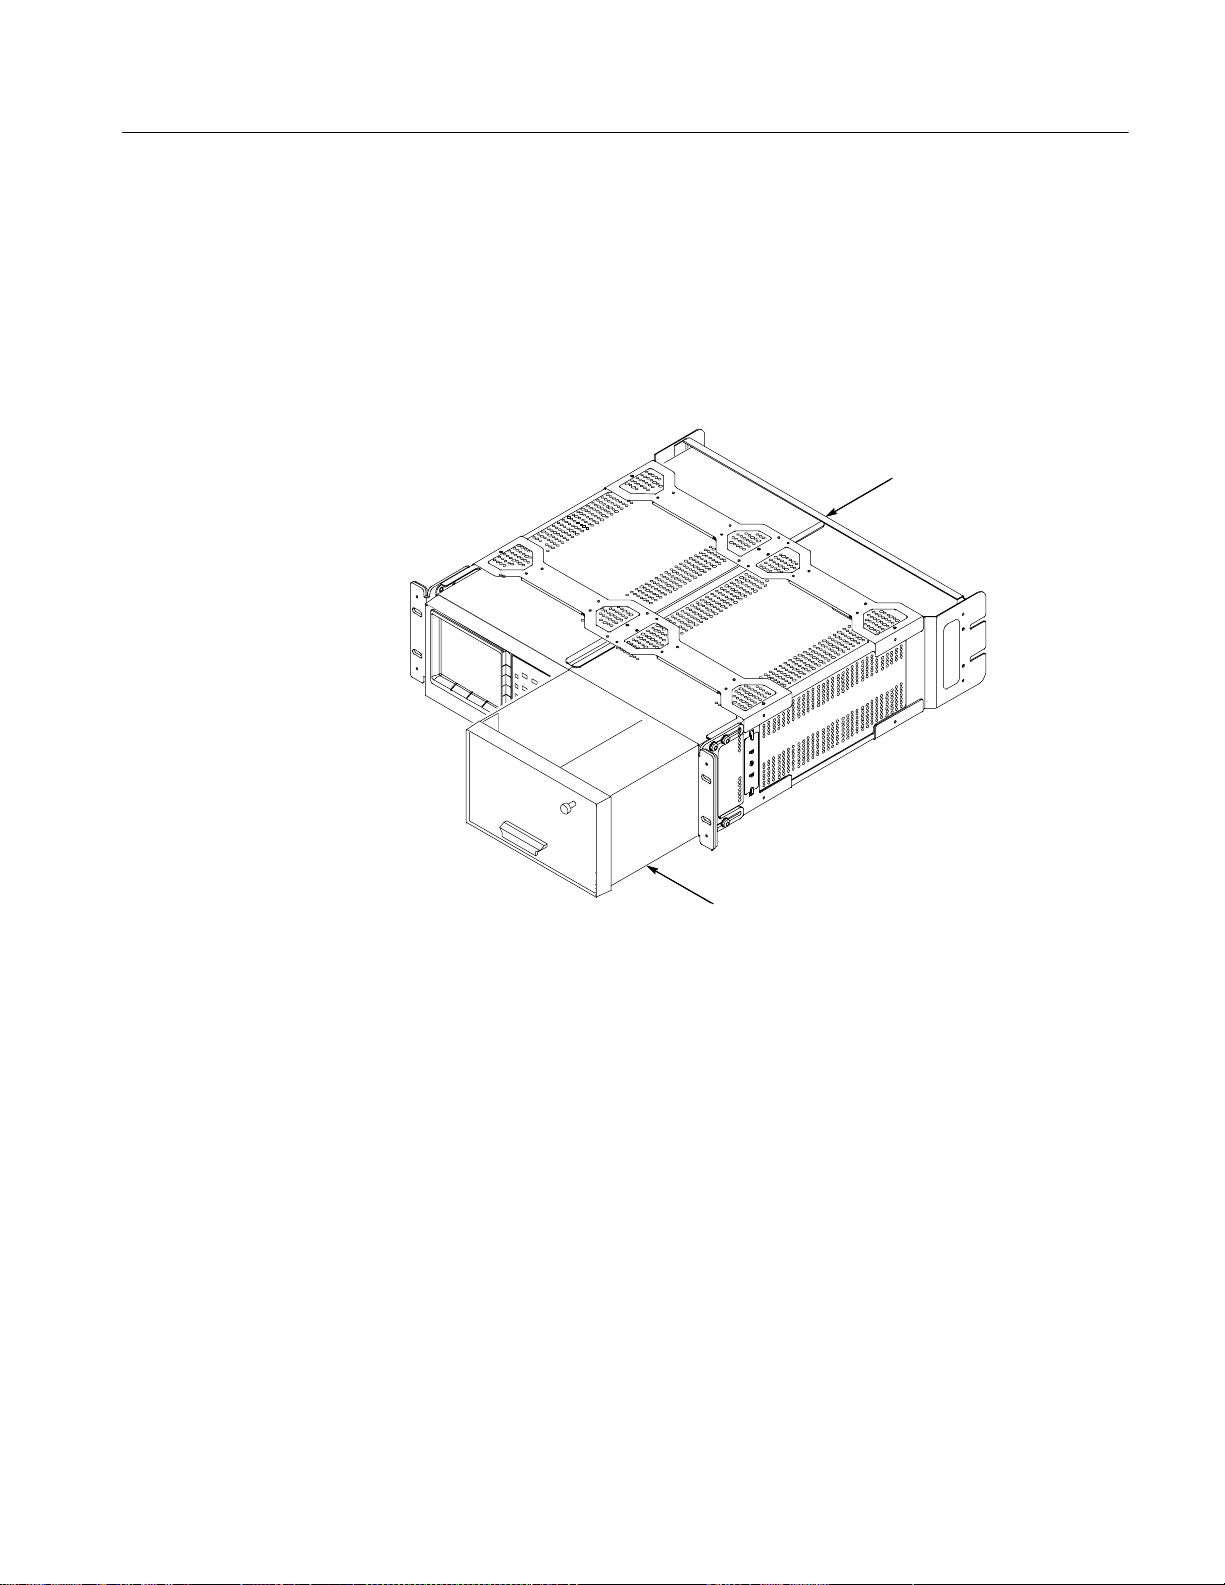
Installation
If only one side of the rack adapter is used, a 1700F06 Blank P anel can be
inserted in the unused section. See Figure 3-6. The rack adapter and panel are
available through your local Tektronix field office or representative.
When only one instrument is mounted in the side-by-side adapter, an accessory
drawer (1700F07) can be installed in the blank side of the cabinet. See
Figure 3-7.
WFM7F05
1700F07
Figure 3-7: WFM7F05 rack mount cabinet with a 1700F07 utility drawer
1705A Spectrum Monitor
3- 7
Page 71

Installation
Custom Installation
For applications such as consoles, shown in Figure 3-8, the instrument can be
mounted with front molding flush or protruding from the console. In both cases,
allow approximately 3 inches of rear clearance for bnc and power cord connections.
For Flush Front Panel: Cut hole
the same size as the monitor front
molding to allow the monitor front
panel to align with the custom
panel surface.
Requires four 0.156” holes below
the 1700F00 cabinet to secure the
instrument to the shelf.
For Protruding Front Molding:
Cut hole in panel the same size as the
opening in the monitor cabinet to allow the front-panel molding to cover
the hole.
Figure 3-8: Considerations for custom installation of an instrument
To mount the 1705A safely, attach it to a shelf strong enough to hold its weight,
using the four 0.156-inch diameter holes in the bottom of the 1700F00 cabinet.
See Figure 3-8.
3- 8
1705A Spectrum Monitor
Page 72

Theory of Operation
Page 73

Page 74

Section 4 Theory of Operation
The material in this section is subdivided into a general description (which is
supported by the main block diagram) and detailed circuit descriptions that use
the schematic diagrams as illustrations. A thorough understanding of the
instrument starts with knowing how the major circuit blocks fit together,
followed by an understanding of the individual circuit’s functions. These
discussions of the 1705A Spectrum Monitor begin with a brief, fundamental
overview, then proceed on to the block diagram, and then into individual circuit
descriptions.
Overview
The 1705A Spectrum Monitor is a specialized spectrum analyzer, designed to
assist in locating satellites, and to help optimize communication with the
satellite. It is capable of displaying the spectral plot of signals in the L--Band
(900 -- 1750 MHz), and the 45 -- 100 MHz range on the crt. An alphanumeric
frequency readout displays the frequency at the center of the intensified zone, in
FULL SPAN/DIV, on the crt. In the magnified SPAN/DIV ranges, the frequency
readout is the approximate frequency under the readout marker.
Block Diagram
RF Input Circuits
(Diagram 1)
Front-panel mode switching is accomplished by push-button switches whose
status is constantly polled by a microprocessor. In turn, the microprocessor
controls switching functions and circuit gains so that the instrument can be used
to locate or monitor a specific set of frequencies.
The Low Voltage Power Supply is a high-efficiency switching type. The High
Voltage Power Supply provides 13 kV acceleration potential.
The 1705A has two separate signal inputs, L--Band (Sweep range 900 -2000 MHz, calibrated range 900 -- 1750 MHz) and 70 MHz (45 -- 100 MHz).
Selection of the frequency band to be displayed is accomplished by pushing a
front-panel, momentary, push-button switch, which is monitored and acted upon
by the microprocessor. When one input is selected, the other has its supply
voltage interrupted.
The L--Band Tuner is self contained and consists of an RF Amplifier, Voltage
Controlled Oscillator, and a mixer stage. The gain, at the 1
489.9 MHz, is ¶10 dB. Both RF and IF gain can be adjusted. Its VCO is
st
IF frequency of
1705A Spectrum Monitor
4- 1
Page 75

Theory of Operation
driven with a pre-corrected sweep ramp. Pre-correction is required to make up
for the inherent VCO nonlinearity.
A +18 V supply is connected to the L--BAND input connector so that it can be
used to power a Block Down Converter (usually at the antenna). The supply can
be switched on and off by a recessed slide switch on the rear panel. The voltage
is generated on a separate circuit board that is mounted inside the 1705A rear
panel.
st
The L--Band Tuner output passes through a 1
IF filter which contains a notch at
590 MHz to eliminate a spurious mixing product. It is then mixed with an L.O.
nd
of 359.4 MHz to produce a 2
IF output at 130.5 MHz. This output is
amplified by an 8 dB gain MMIC and is combined with the 70 MHz tuner
output.
The 70 MHz input consists of a 7-pole, 120 MHz, bandwidth low-pass filter; a
VCO (which, like the L--Band VCO, is driven by a pre-corrected sweep ramp); a
mixer; and a 20 dB amplifier. The 70 MHz input circuits also output a 136 MHz
st
IF with a gain of 0 dB ±3dB.
1
IF Amplifier Circuits
(Diagram 2)
Sweep Generator Circuits
(Diagram 3)
The 136 MHz 2
nd
IF is converted a third time to produce a 3rdIF frequency of
10.7 MHz. The crystal-controlled Local Oscillator operates at 119.8 MHz to
provide the 10.7 conversion. The oscillator’s output is tripled to 359.4 MHz to
provide the 130.5 MHz conversion for the L--Band Tuner output. A three-section helical resonator is used for the 130.5 MHz IF filter.
An additional band-pass crystal filter, centered at 10.7 kHz, with a 10 kHz
bandwidth, can be added by front-panel selection, to provide narrow resolution.
The 300 kHz bandwidth filter is always in the circuit regardless of the front-panel RESOLUTION selection. Maximum bandwidth of the 1705A is 300 kHz.
The resolution filters drive a FSK receiver IC. Only the meter output of this IC
is used to provide a voltage proportional to the log of the input power. This
drives a selectable video filter and the Vertical Deflection Amplifier.
The output of the Ramp Generator drives the Horizontal Deflection Amplifier
(Diagram 4), Gain Control (SPAN/DIV), and the Marker Generator. The Ramp
Generator free runs with its repetition rate controlled by the front-panel SWEEP
SPEED control. The amplitude of the ramp remains constant.
The Gain Control, which provides the ramp that is eventually used to drive the
VCOs, consists of an operational amplifier with selectable input resistances. The
resistance selected is dependent upon the SPAN/DIV setting selected from the
front panel. The output ramp from the Gain Control circuit drives the Sweep
Shapers.
The CENTER FREQUENCY control provides an offset to the sweep ramps in
all SPAN/DIV settings except FULL. In the FULL SPAN/DIV setting, a
4- 2
Test Equipment Depot - 800.517.8431 - 99 Washington Street Melrose, MA 02176 - FAX 781.665.0780 - TestEquipmentDepot.com
1705A Spectrum Monitor
Page 76

Theory of Operation
bright-up signal, centered around the center frequency, is generated for the
Z--Axis Control circuit by the Marker Generator.
The Z--Axis Control circuit provides the driving signal for the Z--Axis Amplifier
(Diagram 8). Included in these unblanking signals are the sweep unblanking,
readout unblanking, and the intensified marker. This circuit controls both
display and readout intensity and adding the intensified marker in FULL
SPAN/DIV.
Deflection Amplifiers
(Diagram 4)
Microprocessor
(Diagram 5)
The output signal from the Log Detector (Diagram 2) is buffered and switched in
and out, for time sharing with the readout signal, prior to driving the Vertical
Output Amplifier. The output amplifier normalizes gain and matches the crt
deflection plate input impedance.
The ramp signal from the Sweep Generator (Diagram 3) is buffered, inverted,
and has its gain set prior to being used to drive the Horizontal Output Amplifier.
Like the Vertical Output Amplifier, the readout signal is time shared with active
signal. The horizontal amplifier has approximately three times the gain of the
vertical amplifier to meet the crt gain requirements.
The microprocessor, along with the EPROM that contains the measurement and
diagnostic routines, is the controlling element of the 1705A. A Non-Volatile
Random Access Memory (NVRAM) provides a method to store the current
front-panel switch settings, at power down, so that the 1705A can come back up
with the last front-panel setup.
CENTER FREQUENCY readout data is converted to digital data by an
Analog-to-Digital Converter and then input into the microprocessor. Readout
data and the Readout Enable (/RO--EN) are output from the microprocessor. The
readout data is converted back to an analog signal by the Digital-to-Analog
Converter.
Front Panel (Diagram 6)
Low Voltage Power Supply
(Diagram 7)
1705A Spectrum Monitor
All of the switching and external control for the 1705A is shown on this
diagram. Control voltages are limited to 11.8 V or less. All switching is done in
conjunction with the microprocessor (Diagram 5). Indicator lights, that are
controlled by the microprocessor, are also included on this diagram.
The +18 V supply that is designed to drive an external Block Down Converter is
also shown on this schematic. The On/Off switch for the +18 V supply is
located on the 1705A rear panel.
The Low Voltage Power Supply converts the mains ac line voltage to 4 dc output
voltages (--15 V, +5 V, +15 V, and +40 V). The +40 V is used to power the
Vertical Deflection Amplifier (Diagram 4). The + and --15 V supplies are post
4- 3
Page 77

Theory of Operation
regulated to become the + and --11.8 V supplies on the Main circuit board
(regulator circuits are on Diagram 4).
The Power Supply schematic also contains the 11.8 V Post Regulators, whose
outputs are used by most of the circuits on the Main circuit board. The Post
Regulators do not appear on the block diagram.
High Voltage (Diagram 8)
RF Input Diagram 1
L- Band Input
The unblanking signal from the Z--Axis Control drives the Z--Axis Amplifier.
The Focus Amplifier, controlled by the front-panel control, provides a voltage to
the crt focus ring. The crt is of the Post Acceleration type, which requires a
relatively high potential difference between the cathode and post anode. The
boost in 2
The High Voltage supply also provides the +100 V, required by the Horizontal
Deflection Amplifier (Diagram 4), to drive the crt horizontal deflection plates.
This diagram has both RF inputs for the Spectrum Monitor. The L--Band and
70 MHz inputs are both off-board subassemblies. The 70 MHz input consists of
discrete components on a small circuit board that is totally shielded. The
L--Band Tuner is also self contained, totally shielded, and contains no user-serviceable parts.
The L--Band signal (900 -- 1750 MHz) is input directly to a tuner subassembly
that contains the Tuned RF Amplifier, mixer, and Voltage Controlled Oscillator
(VCO) required to produce the first Intermediate Frequency (IF) of 489.9 MHz.
The 489.9 MHz 1
nd
anode voltage is provided by an encapsulated 4X Multiplier.
st
IF signal is cabled to the Main board.
4- 4
70 MHz Input
The tuner subassembly is powered by the +11.8 volts, which is controlled by the
Input Switching. (The +11.8 V to the L--Band Tuner is disabled when the
70 MHz input is selected.) In addition, the Block Down Converter +18 V supply
(from Diagram 5) is fed to the tuner for output on its F-type connector. A
recessed, rear-panel slide switch connects the +18 V supply to the L--Band Tuner.
A pre-corrected ramp (from Diagram 3) to drive the VCO is also supplied to the
tuner subassembly.
The /LBAND control line, from the microprocessor, is low when the L--Band is
selected. When /LBAND goes high (indicating that the 70 MHz input has been
selected) Q31 turns on and Q30 turns off, causing Q32 to turn off and disconnect
the +11.8 V from the tuner.
The input to the 70 MHz tuner has a 75Ω, 10 dB pad, which allows it to accept
signals up to --20 dBm. The 70 MHz signal (45 -- 100 MHz) is preconditioned
1705A Spectrum Monitor
Page 78

Theory of Operation
by a 7-pole, 120 MHz, low-pass filter that rejects out-of-band frequencies. The
Mixer, U190, with input frequencies of 45 -- 100 MHz, and the Local Oscillator
operating at [F
+ 130 MHz] provide a 130 MHz 1stIF. The signal output from
i
the Mixer is terminated by a 75Ω, 3 dB pad made up of R291, R292, and R293.
The IF signal is ac coupled into the amplifier, U296, with a gain of 20 dB.
R396, R391, and R392 form a 6 dB pad that outputs the 136 MHz 1
st
IF signal
that approximates the L--Band output level for inputs 10 dB higher.
L393, L391, L389, C292, and C290 form a low-pass filter that is peaked at the
st
IF frequency (136 MHz) and approximately 20 dB down at the Local
1
Oscillator frequency. Harmonics of the Local Oscillator frequency are at least
30 dB down.
70 MHz Local Oscillator
IF Amplifier Diagram 2
The Local Oscillator (LO) is a Voltage Controlled Oscillator (VCO) whose
output frequency range is 175 MHz to 230 MHz. The oscillator is a differential
pair (pins 7--8 and 5--11) contained in U283. The oscillator employs positive
feedback through L284 to the base tank circuit (L280 and C281). CR280 is a
varactor whose capacitance is determined by the instantaneous level of the
pre-corrected ramp from the Sweep Generator (Diagram 3). The center tap of
T187 is the LO output providing an amplitude of approximately +7 dBm.
Q20 and Q21 form a switching circuit that turns off the VCO when the L--Band
input is selected. When /LBAND goes low, Q21 is shut off, causing Q20 to
unsaturate and disconnect the --11.8 V from the VCO.
The 70 MHz tuner assembly (A5) is contained in a rigidly mounted shield.
Control signals and the --11.8 V supply are brought into this shielded tuner
through feedthrough capacitors.
This diagram shows the L--Band and 70 MHz inputs to the various conversion
stages. It also shows the Local Oscillator/Tripler circuitry, Mixers, Amplifiers,
IF filters, and Log Detector output.
2ndLocal Oscillator
1705A Spectrum Monitor
Both Local Oscillator (LO) signals are derived from a single crystal, whose
operating frequency is 119.8 MHz. The crystal is a 5
th
overtone type in a Butler
oscillator configuration using Q13. Q11 buffers the oscillator and drives a 3 dB
isolation pad on the LO input of Double Balanced Mixer (DBM) U25. Q12 is a
cascode stage driving a tank circuit at the 3
rd
harmonic (359.4 MHz). The tank
circuit is tapped down to drive a three-section helical resonator, FL1, tuned to
359.4 MHz. The output from FL1 is coupled into DBM U28.
4- 5
Page 79

Theory of Operation
DBM U28 is driven by the L--Band Tuner output at 489.9 MHz through a
LPF/Notch filter consisting of L11, L12, and series resonant circuit C69 and
W13. W13 is a shorted length of 50Ω coax forming a high-Q inductor. This
provides a narrow notch at 590 MHz to eliminate a spurious output from the
L--Band Tuner.
The output from DBM U28 drives U31 which provides about 8 dB gain to
compensate for the mixer loss and optimize the system dynamic range. This
signal is then combined with the 70 MHz tuner output with 3 dB combiner T1.
Input Filter, Mixer, and IF
Amplifier
Resolution Filter and Log
Detector
The band-pass filter, FL2, is a three-section helical resonator with about 8 MHz
bandwidth.
U25 is a double balanced mixer that converts the 130.5 MHz 2
the 10.7 MHz 3
nd
2
IF frequency by the 3rdIF frequency. J6 is a test jumper that can be lifted to
evaluate prior circuitry or to insert a signal at the 3
rd
IF frequency. The LO frequency (119.8 MHz) is below the
rd
IF frequency to trouble-
nd
IF frequency to
shoot the circuits that follow.
nd
The 2
IF Amplifier, U22, has a gain of 20 dB. U22 requires a 6 V Vcc; VR3
and R136 are used to derive the voltage from the +11.8 V supply. C31 and C32
are decoupling capacitors. The output signal level is --20 dBm maximum. J5 is
another test jumper that can be used to access prior circuits or insert a signal at
nd
the 2
The 10.7 MHz 2
IF frequency.
nd
IF signal passes through the 300 kHz Resolution filter or a
combination of the 10 kHz and the 300 kHz Resolution filters. The switching of
filters is accomplished by a combination of a control signal (/10KHZ) from the
microprocessor (Diagram 5) and a switching network consisting of U23D, E, and
F, Q9, and Q10, and switching diodes (CR22, 23, 25, 26, 27, 28, 29, and 30).
When the control line is low, the signal path is through the 10 kHz filter. The
300 kHz filter is always in the circuit. Q10, CR22, and CR30 turn on to enable
the 10 kHz filter; Q9, CR23, and CR28 turn off to switch out the bypass line.
When the control line goes high, Q10 turns off to turn off CR22 and CR30; Q9,
CR23, and CR28 turn on to shunt the 10 kHz filter and provide 300 kHz
resolution. R175, the 300 kHz Gain adjustment, is set to match the loss of the
10 kHz filter. J10 is another test jumper provided to access prior circuits or
insert a signal directly into the Log Detector.
4- 6
The input to the Log Detector, U32, is amplified by U29 and pre-shaped by FL3
and FL4, a 300 kHz Resolution filter, and then ac coupled to U32. When the
10 kHz filter is selected, the signal is filtered by the 10 kHz filter and then
applied to the Log Detector. The output current from the Log Detector is
processed by Q24 and Q25 to the 15 kHz low-pass filter at U27 pin 3 (Diagram 4). The filter output then drives the Vertical Deflection Amplifier.
1705A Spectrum Monitor
Page 80

Sweep Generator Diagram 3
Theory of Operation
This schematic contains the free--running Ramp Generator, Switchable Gain
Control (SPAN/DIV), Sweep Shapers, Marker Generator, and the Z--Axis
(Brightness) control.
Ramp Generator
Gain Control (SPAN/DIV)
Sweep Shapers
U24 is the Ramp Generator; U24B is configured as an integrator and U24A is
used as a comparator. C40 is the integration capacitor and is charged by current
from the front-panel SWEEP SPEED control. The ramp integrates in the
positive direction from --2 volts to +2 volts. At +2 V the output of U24A trips to
the positive power supply voltage (+5 V) and causes C40 to ramp down through
CR24 and R151. The value of R151 determines the amount of time required to
discharge C40 (retrace time). The power supply for U24 is +5 and --11.8 volts.
The output swing of U24A is nearly to these supply values. The R amp
Generator output, through R142, drives Q6 through U23B in the Z--Axis control
to provide retrace blanking. CR21 limits the output swing in the negative
direction to --0.7 volts.
The Ramp Generator output (U24B, pin 7) drives the Horizontal Deflection
Amplifier and the Gain Control (SPAN/DIV) switching, U20. Each switch in
U20 selects a different value of R
maximum at FULL (50 MHz per division) and minimum at 100 kHz per
division. The output of U18A is a negative-going ramp that drives the Sweep
Shapers.
U16B and C form the Sweep Shaper that drives the L--BAND VCO; U16A and
D drive the 70 MHz VCO. The Sweep Shapers pre-distort the VCO driving
ramps to compensate for the inherent nonlinearity of the VCO. The shapers have
adjustable break points so that gain at each can be individually adjusted. The
70 MHz shaper has four adjustments, R48, R49, R55, R56; and the L--BAND
shaper has six adjustments, R35, R51, R58, R75, R81, and R82. Figure 4-1
shows the area of control for the various adjustments on the 1705A L--Band
display, when a comb signal is applied.
for operational amplifier U18A. The gain is
i
1705A Spectrum Monitor
4- 7
Page 81

Theory of Operation
R737R733
R731 R735
START
OF
DISPLAY
R727 R729
Figure 4-1: 1705A L- Band comb display showing the areas each of the six sweep
shaper variable resistors adjust
Bright- Up Generator
The Marker Generator is U14. The front-panel CENTER FREQUENCY control
provides the voltage from which the digital frequency readout is obtained. In
addition, the CENTER FREQUENCY (through U14) positions the bright zone
in FULL SPAN/DIV and tunes the center frequency in magnified SPAN/DIV
settings. The gain and offset of U14A are adjustable with R37 and R38. When
the CENTER FREQUENCY control is turned from one end to the other, the
output of U14A will move from about -- to +2 V, which is approximately the
range of the ramp at U24B. In any SPAN/DIV setting other than FULL, analog
switch U17A is closed and the output of U14A provides an offset voltage to
move the attenuated ramp, at the output of U18A, over the range of the large
ramp in FULL SPAN/DIV
When the SPAN/DIV is set at FULL, the output of U14A positions the bright-up
zone to correspond to the frequency displayed by the readout. The output of
U14B provides a voltage that offsets the ramp at the output of U14C.
In the FULL setting of SPAN/DIV, U17D (an analog switch) is closed and U14C
provides a gain of 10 to both the ramp from U24B and the offset from U14B.
The bright-up zone is generated when the ramp, at the output of U14C, passes
through 0 V. The offset voltage from U14B can offset the ramp from almost tip
to tip, thus moving the bright-up zone over almost the entire length of the sweep.
U14D is an absolute value circuit. Its output will be near the positive power
supply unless the input, from U14C, is within ±0.7 V of ground. If the input
goes above +0.7 V, CR8 conducts and U14D becomes a non-inverting amplifier
with a gain of about 20 (set by R83 [R
], R84 [Ri] and the divider R87, R88).
f
Under these conditions the output goes towards the positive power supply. If the
input to U14D goes below --0.7 V, CR12 conducts and becomes an inverting
amplifier with a gain of ¶ 20 (set by R83 [R
] and R87 [Ri]). Again under these
f
4- 8
1705A Spectrum Monitor
Page 82

Theory of Operation
conditions the output goes toward the positive supply. If the input is between +
and --0.7 V, neither diode conducts and the amplifier has no input and, consequently, an output of 0 V. When the output of U14D is near 0 V, a pulse that
produces the crt bright zone is generated by the Z--Axis Control circuit.
Z- Axis Control
The Z--Axis Control circuit is comprised of a transistor array, U13, and discrete
transistors Q4 and Q5. The output is the common collector line of the three
differential amplifiers (Q5, and pins 5 and 8 of U13). The output line drives the
summing junction of the Z--Axis Amplifier on Diagram 8. The front-panel
INTENSITY control drives the current source (pins 12, 13, and 14 of U13). All
of the current from this transistor can be directed to the Z--Axis Amplifier,
through the differential amplifiers or shunted away if Q6 is turned on. Q6 is on
during sweep retrace, to blank the crt, and during crt readout time, when
/RO--EN is active (low). With Q6 off, the current from the source is split
between R54 and R79. The current through R54 is the collector current on pin 5.
The current through R79 will appear as collector current on pin 8 if its base
(pin 9) is low, which occurs at marker time. The result is that when the
instrument is in FULL SPAN, the trace is brightened for the marker. In any
other SPAN/DIV setting, the trace is of uniform brightness when the output of
U14D is near 0 V, a pulse that produces the crt bright zone is generated by the
Z--Axis Control circuit.
The readout intensity is controlled separately by Q4 and Q5. If the RO--BLANK
control line is active (low), Q4 is turned off and Q5 is turned on. When Q5 is
on, the current through R89 and R91 is sent to the Z--Axis Amplifier. When the
control line goes high, Q4 turns on and the emitter current from the readout
intensity control is directed into the +5 volt supply instead of into the Z --Axis
Amplifier.
Deflection Amplifiers Diagram 4
Buffers
1705A Spectrum Monitor
Circuitry on this schematic normalizes gains, and drives the crt deflection plates.
The vertical signal from the Log Detector is buffered by U27. U27 drives the
Vertical Output Amplifier, whose input can be filtered to reduce the effects of
noise. The Video Filter is a 15 kHz, 3-pole, low-pass filter whose output is
switched in by U30A. The enable, for U30A, is the /VFILTER signal from the
microprocessor (Diagram 5).
U27 is a switchable gain amplifier. When high gain (2 dB/Div) is selected with
the front-panel push button, the signal at pin 12 of the microprocessor (U2) goes
high, and the switch in U21C grounds R135 through pins 3 and 4. This
increases the gain of U27 by approximately a factor of five. U21A also
switches, connecting pins 13 and 14, putting a portion of the Vertical Position
4- 9
Page 83

Theory of Operation
control into the summing junction of U27 (pin 2). The Vertical Position control
is attenuated by resistors R152 and R140 (2 dB POS RANGE). This positions
the video signal at pin 6 of U27, providing greater positioning range while in
High Gain mode.
The horizontal ramp signal from the Sweep Generator (Diagram 3) is approximately 4 V in amplitude. Typical sweep length is 12 divisions. The variable
resistor, R168, is one-half of the input resistance (R
operational amplifier. The amplifier feedback resistance (R
and R177. Reducing the R
of the operational amplifier while holding R
f
) for U26B, an inverting
i
) consists of R180
f
i
constant reduces the gain, and in this case the sweep length. Strapping across
W11 and W12 provides a convenient method of shortening the sweep to adjust
the Horizontal Gain (R168) against the 10 divisions of the crt graticule. When
the strap is removed the sweep length increases to 12 divisions.
Switches U30B and C are are enabled by the Readout Enable (/RO--EN) from the
microprocessor (Diagram 5). When enabled, the input to the Deflection
Amplifier is the X-- (horizontal) and Y--Axis (vertical) components of the crt
alphanumeric readout. The readout signal components are from the microprocessor through a Digital-to-Analog Converter (DAC) (Diagram 5). The vertical
positioning signal, from the front-panel VERTICAL POSITION control, is
applied to the readout in order to common mode out positioning effect when the
trace is repositioned.
Vertical Deflection
Amplifier
Horizontal Deflection
Amplifier
The vertical output signal, or the Y--Axis readout, drives the base of Q26, one
side of a differential input amplifier. The other side, Q28, is driven by the
positioning voltage from the front-panel VERTICAL POSITION control. The
signal from the collectors of Q26 and Q28 drive Q27 and Q29, common base
amplifier stages. The gain of the Vertical Deflection Amplifier is approximately
7. The gain normalized output voltage, to drive the crt deflection plates, is
developed across R229 and R230, the load resistors. Q22 and Q23 are a
temperature-compensated current source from the --11.8 volt supply.
Sweep ramp or X--Axis readout drives the base of Q17, one side of a differential
input amplifier. The other side, Q16, is driven by the positioning voltage from
the front-panel HORIZONTAL POSITION control (Diagram 5). The signal
from the collectors of Q17 and Q16 drive Q14 and Q15, common base amplifier
stages. The gain of the Horizontal Deflection Amplifier is approximately 20.
The gain normalized output voltage, to drive the crt deflection plates, is
developed across load resistors R178 and R179. Q18 and Q19 are a temperaturecompensated current source from the --11.8 volt supply.
4- 10
1705A Spectrum Monitor
Page 84

Microprocessor Diagram 5
Theory of Operation
The 1705A is a microprocessor-controlled instrument. Circuitry on Diagram 5
shows the microprocessor, the front-panel LED drive, the crt readout drive, the
graticule light circuit, and the trace rotation circuit.
Microprocessor
The processor (U2) is an 8-bit, 3-port microprocessor running at 12 MHz. U8 is
the lower order address de-multiplexer for the Program PROM U9. U9 is a 64K
UV Erasable CMOS PROM. R5 is the bus termination assuring TTL levels (0
=0 V, 1 = 5 V). Output enable for the PROM is the PSEN output from the
microprocessor (U2, pin 29). The lower-order addresses from the processor
(AD0 -- AD7), which are de-multiplexed by U8, are from Port 0; the higher-order
addresses (AD8 -- AD12) are from Port 2. The higher-order addresses are not
multiplexed.
Port 1 is a multifunction input/output port. Lines 0 through 4 are used to poll the
front-panel push-button switches (momentary ground closures) to set up the
measurement program. Line 6 outputs the clock (U2, pin 7) that is used by the
Readout DAC and the NVRAM (Non-Volatile Random Access Memory).
Line 5 is the data transfer (U2, pin 6) for the NVRAM, U4. The Readout Enable
(/RO--EN) that turns on the crt readout is output through Line 7 (U2, pin 8). The
Center Frequency Readout data from U1, the readout ADC, is input through
Line 5 also (U2, pin 6).
U1 is an A-to-D Converter (ADC), with successive approximation register. It is
used to convert the analog voltage level from the front--panel CENTER
FREQUENCY control to a digital signal for the microprocessor and the Readout
Digital-to-Analog Converter (DAC). R4 is the calibration adjustment to ensure
correct readout.
1705A Spectrum Monitor
U4 is the NVRAM that stores the instrument condition when power is turned off
or lost, to ensure that the instrument will come back up in the correct operating
condition. The power down detection circuit consists of a comparator, U11, and
a +5 volt regulator, U3. U3 input voltage is from the +15 volt supply. C5
charges up high enough to allow U3 to continue to power U11 so that it can store
needed data during the power-down sequence. U11 monitors the +5 volt supply
on pin 2. Pin 3 is set to approximately 2.5 volts and has a large capacitor, C13,
to provide a slow decay. Under normal conditions, pin 2 is slightly higher than
pin 3, keeping the output (pin 7) high. When instrument power starts to go
down, pin 2 goes below pin 3, which forces the output (pin 7) low to enable the
/STO input to U4. When /STO goes low, the current conditions, as input from
the microprocessor D-Out output, are stored in the U4 Non-Volatile RAM.
4- 11
Page 85

Theory of Operation
Readout
Trace Rotate
Graticule Lights
U6 is an 8-bit D-type data latch that drives all the front-panel LEDs and most of
the internal control lines. Chip select for U6 is /WR (U2, pin 16) inverted (U7C)
and ANDed with Address 14 (U2, pin 27) by U7A.
U10 is a dual 8-bit DAC (Digital-to-Analog Converter) that generates the
horizontal and vertical readout signals. The analog current outputs of U10 are
pins 2 and 20, which are converted to voltage by U12 A and B. Chip select is
/WR (U2, pin 16) which is inverted (U7C) and ANDed with Address 7 in U7D.
Line A0 from U8, pin 19, is the DAC A select (low enable). U5 provides a
--5 volt analog voltage reference for U10.
Trace rotation compensates for changes in the magnetic field surrounding the
1705A. Q1 and Q2 are emitter followers that provide the Trace Rotation current
to a coil around the crt, inside the shield. The voltage on the emitter of either Q1
or Q2 will develop a current through R19 to drive the coil. Current amplitude
and polarity are controlled by the front-panel TRACE ROTATION screwdriver
adjustment.
Q3 and Q100 provide a current source for the graticule lights. Base voltage,
which controls the amount of current flowing in the light circuit, is set by the
front-panel SCALE control. Jumper J100 on the Graticule Light board allows
the graticule lights to be disabled.
Front Panel Diagram 6
Indicators, Controls, and
Switches
The front-panel schematic shows all of the operational controls for the instrument, including potentiometers, momentary push-button switches, and indicator
LEDs. All the push buttons are polled by the microprocessor, and the LEDs are
driven by output ports from the microprocessor. Also included on this diagram
is the +18 volt Block Down Converter (BDC) power supply.
The front-panel LED indicators are returned to a current source (+5 V). When an
LED is lighted, there is a complete circuit from the Light Driver (Diagram 5)
through the LED to the +5 V supply. The five function switches (front-panel
push buttons) are simple ground closures that are read by the microprocessor to
determine the operating mode.
The eight front-panel controls determine voltages (in a range between --11.8 V
and +11.8 V) depending on circuit requirements. Each control works with a
specific circuit on another diagram.
4- 12
1705A Spectrum Monitor
Page 86

Theory of Operation
+18 Volt Supply
The +18 V supply is of the Buck-Regulator type. It uses a Switched Mode
Power Supply Control Circuit, U583. Q783 is a buffer for slow startup and duty
cycle limit. R681 and R680 are the limit resistors. The voltage on C684 ramps
up to provide for slow startup when power is initially applied. The Internal
Zener reference (V
) for U583 is approximately 8 V and is present on pin 2.
Z
R586 and C583 are the frequency determining components for the IC’s internal
sawtooth generator, which in this instance runs at approximately 50 kHz. R686
and R685 are the voltage setting components on the feedback input; C683, C684,
and R682 form a frequency compensation network to prevent the IC from
oscillating.
+40V
LOW LOAD
A VERAGE
LOAD
+18V
--0.7V
+40V
+18V
--0.7V
+40V
HIGH LOAD
+18V
--0.7V
Figure 4-2: Output duty cycle of the pulse width modulator used in the +18 V Power
Supply
Q481 and Q482 drive the switching transistor. Q482 provides forward base
current to the switching transistor, Q596. Q483 provides reverse base current to
effectively turn off Q596. Q596 operates with voltage levels between --0.7 V and
+40 V. CR594 is the commutating diode that sets the voltage level when Q596
is off (--.07 V) and current is still flowing in L591. The input filter circuit,
composed of L591 and C690, is effectively driven with a square wave; however
it is not a true square wave and is dependent on the loading of the +18 V supply.
See Figure 4-2. The output voltage is fed back to the FB input of U583, which
compares it to an internal reference voltage to determine the on time for the
1705A Spectrum Monitor
4- 13
Page 87

Theory of Operation
internal pulse width modulator. Q588 is the current sense, sampling current
across R690 to provide a voltage level to the sensing input of U583. If the level
on the over current sense input (Sen) gets too high, U583 shuts down to prevent
damage.
L695 and C697 are the output filter providing a dc output that can be switched
onto the rear-panel L--Band connector to power a Block Down Converter.
DS698 is an LED indicator light which is lighted when the +18 V supply is
operating into a normal or no-load condition. If the +18 V output is shorted, the
light will extinguish.
Low Voltage Power Supply Diagram 7
4- 14
The Low Voltage Power Supply converts the mains line voltage (90 -- 250 Vac)
to supply the power requirements of the instrument. The voltages supplied by
the Low Voltage Power Supply are +40 V, 15V,and+5V.
The Low Voltage Power Supply is called a F lyback Switcher. When switcher
mosfet Q9 is turned on, its drain voltage drops to approximately 0 V. The
current through the 350 H primary winding of T3 begins ramping up. The
voltages present at all secondaries is such that the rectifier diodes are reverse
biased. Energy is being stored in the magnetic field of T3. When Q9 turns off,
the drain voltage “flies back” in a positive direction. Current now flows in all of
the secondary windings and supplies power.
1705A Spectrum Monitor
Page 88

Theory of Operation
Line Rectifier and Filter
Pulse Width Modulator
The input line voltage is filtered by the rear-panel connector to reduce the
electrical noise conducted into or out of the instrument. R89 limits the initial
charging current through the rectifier diodes and C54.
CR21, CR22, CR23, and CR24 form a bridge rectifier. C54 filters the 110 to
350 Vdc rectifier output. L4 filters the switching noise produced by the
switcher. R102 reduces the circulating current in the parallel circuit consisting of
L4 and C44. DS4, R93, and R94 form a line voltage indicator. R91 and R92
charge C42. C 42 provides power to U5 until the primary housekeeping winding
provides power through CR17.
1705A Spectrum Monitor
U5 is a current-mode pulse width modulator (PWM). A current-mode PWM
uses two feedback loops. The inner current-feedback loop directly controls the
switcher mosfet peak current. The outer voltage-feedback loop programs the
inner loop peak current trip point.
U5 pin 2 is the inverting input of an internal op-amp. The non-inverting input is
set to 2.5 V by an internal voltage reference. Current from the peak detector
flows through R83 and R79. R84 provides a 100 A offset. The voltage at U5
pin1willvaryinordertomaintainU5pin2at2.5V.
The voltage at U5 pin 1 is modified by an internal circuit and sets the trip point
of the internal comparator. U5 pin 3 is the external input to the comparator. R88
and C52, connected to U5 pin 4, set the internal oscillator to 80 kHz.
The circuit works as follows: The oscillator resets the latch and U5 pin 6 goes
high, turning the switcher mosfet on. The current through the switcher mosfet
4- 15
Page 89

Theory of Operation
increases, causing the voltage across R96 to increase. This voltage is divided by
R87 and R101, and is applied to the comparator (pin 3). When the voltage at U5
pin 3 reaches the comparator trip point, the latch toggles and the switcher mosfet
is turned off. This process is repeated at an 80 kHz rate.
C58 increases the PWM noise immunity by rolling off the internal op-amp
frequency response. R82 holds the switcher mosfet off as the circuit is powering
up. R81 slows the turn-on of the switcher mosfet while CR27 speeds up the turn
off.
Output Filters
Error Amplifier
Feedback Transformer
Driver and Peak Detector
Output Under-Voltage
Shutdown
The three output windings supply four output voltages. Each output is rectified
by a single diode and filtered by an LC pi filter.
The Error Amplifier regulates the +5 V output by feeding an error signal to the
Pulse Width Modulator. VR1 is a 2.5 V shunt regulator containing an op-amp
and a voltage reference. The +5 V is divided by R69 and R70 to provide 2.5 V
to VR1, with fine adjustment provided by R99. C40 and R71 determine the gain
and frequency response of VR1. VR4 controls overshoot of the +5 V at power
up. R98 and CR26 provide a minimum operating current for VR1. R68
decouples C39 from VR1. Overvoltage protection for the +5V supply is
provided by a crowbar circuit formed by Q11, VR3, R13, and R14.
The80kHzsawtoothwaveformatU3pin3tripscomparatorU3. U3pin1then
feeds a trigger pulse to one-shot U4. U4 pin 13 outputs a 300 nS pulse to the
130 mA current source consisting of Q7 and Q8. When Q8 turns on, T2 pin 2 is
pulled down until CR15 (Error Amplifier) is forward biased. The negative-going
pulse at T2 pin 2 is peak detected by CR16 and C 46. The dc voltage present at
the anode of CR16 feeds the pulse width modulator and the Output Under-Voltage Shutdown circuit. CR29 resets T2 between pulses.
If the +5 V is below 4.9 V, the Error Amplifier will cause the Peak Detector
output to go below 2.9 V. The output of comparator U3B will pull low and shut
down pulse width modulator U5. C47 and R96 delay the operation of U3B long
enough for the power supply to power up. If the +5 V does not reach 4.9 V
within 50 ms of power up, U3B will shut down the switcher. The power supply
will then cycle on and off every couple of seconds.
4- 16
1705A Spectrum Monitor
Page 90

High Voltage Power Supply Diagram 8
Theory of Operation
HV Osc and Error Amp
The High Voltage Power Supply generates the heater, cathode, control grid, focus
anode, and post accelerating potentials required to display the outputs of the
Vertical and Horizontal Output Amplifiers.
The High Voltage Power Supply is generated by a sine-wave oscillator and
step-up transformer. Q6 and T1 are the principal elements of an Armstrong
oscillator running at about 22 kHz. Error Amplifier U2 regulates the +100 V
output and keeps the High Voltage Power Supply constant under varying load
conditions by controlling the base current to Q6. The +100 V output is regulated
directly, while the High Voltage Power Supply is indirectly regulated through a
current feedback circuit.
R48, C16, R60, and R64 form the High Voltage Power Supply current feedback
circuit. As the current from the High Voltage Power Supply is increased, the
voltage to the + side of the Error Amplifier (U2) increases, which increases the
base drive to Q6, the HV Osc. This current feedback compromises the regulation of the +100 V supply to keep the high voltage constant with varying
intensities.
C66 and Q10 are a start delay circuit that holds the Error Amplifier output low,
through CR30, until C66 is charged. Delaying the start of the high voltage
oscillator allows the Low Voltage Power Supply to start, unencumbered by the
load from the high voltage oscillator.
1705A Spectrum Monitor
4- 17
Page 91

Theory of Operation
Power Supply Outputs
Focus Amplifier
Grid Drive Circuit
CR4 is the high voltage rectifier. Filter capacitors C3, C4, and C8 work with
CR4 to provide --2530 V to the crt cathode. U1 is a four-times multiplier
providing +11 kV to the crt anode.
Q1 and Q2 form an operational amplifier that sets the voltage at the bottom of
the focus divider. The front-panel FOCUS pot determines the voltage at the
bottom of the focus divider. The Center Focus control, R11, is set for optimum
beam focus, as viewed on the crt, with the front-panel FOCUS control set to mid
range. Once the Center Focus adjustment has been set, adjusting the front-panel
FOCUS control changes the voltage at the bottom end of the divider and,
consequently, the voltage on the crt focus anode.
The cathode of the crt is at a --2530 V potential with the grid coupled to the
Z–Axis Amplifier by the grid drive circuit. The grid is approximately 75 V
negative with respect to the cathode. The 200 V p-p sine wave present at the
cathode of CR8 is input to the Grid Drive circuit where it is clipped for use as
the crt control grid bias.
The sine wave from the cathode of CR8 is coupled through R47 to a clipping
circuit consisting of CR5 and CR6. Clipping level for the positive excursion of
the sine wave is set by the CRT Bias adjustment, R58. The negative clipping
level is set by the front-panel INTENSITY control through the Z-Axis Amplifier.
The clipped sine wave is coupled through C11 to a rectifier made up of C R1 and
CR3. The rectified, clipped sine wave is the crt control grid bias voltage. C9
couples the blanking signal from the Z-Axis Amplifier to the crt control grid.
DS1 and DS2 limit the crt grid to cathode voltage at instrument turn on or off.
DS3 limits the crt heater to cathode voltage.
4- 18
Z-Axis Amplifier
This is an inverting amplifier with negative feedback. R22 is the feedback
resistor while R7, R20, and R33 act to maintain the summing junction at +5 V.
Without any Z–Axis input current, the amplifier output is approximately +10 V.
Negative Z–Axis input current will cause the output to go positive.
1705A Spectrum Monitor
Page 92

Theory of Operation
Q5 is a current amplifier feeding the output stage. Q3 and Q4 form a push-pull
output stage. Q3 acts as a 2.7 mA constant current pull-up, while Q4 is the
pull-down transistor. C6 speeds up the amplifier by coupling ac signals to the
base of Q3. CR2 and R41 protect the amplifier during crt arcing.
CRT
The pinout for the CRT is shown in Figure 4-3.
54
3
2
1
14
13
12
6
7
9
11
Figure 4-3: Pinout of the CRT Socket
Pin Description
1 Filament (f)
2 Cathode (k)
3 GRID (g1)
4 FOCUS (g3)
5 ASTIG (g4)
6 GEOM (g5)
7 VERT PLATE (y2)
9 VERT PLATE (y1)
11 HORIZ PLATE (x2)
12 1st ANODE (g2)
13 HORIZ PLATE (x1)
14 Filament (f)
1705A Spectrum Monitor
4- 19
Page 93

Theory of Operation
4- 20
1705A Spectrum Monitor
Page 94

Checks and Adjustments
Page 95

Page 96

Section 5 Checks And Adjustments
This section consists of two separate procedures. The first, a Performance
Check, is used to determine compliance with the Performance Requirements in
the Specification. The second is the Adjustment Procedure, that provides the
instructions on how to adjust the instrument and return it to operation within the
specification.
In both procedures, front- and rear-panel controls and connectors, on the
instrument under test, are fully capitalized (e.g., 300 kHz RESOLUTION).
Control and connector names on test equipment and internal controls and
adjustments for the instrument under test are initial capitalized (e.g., Time/Div,
Geometry, etc.).
Limits, tolerances, and waveforms given in this section are guides to adjustments
and checks. They are not instrument specifications, except when listed in the
Performance Requirement column of the Specification Tables in Section 1 of this
manual.
Recommended Equipment List
The following equipment and accessory items are required to do the Performance
Check and/or Adjustment Procedures. Broad specifications are followed by a
piece of equipment that meets these specifications; in most cases, the recommended instrument was used in preparing the procedures that follow.
Electrical Instruments
1. Test Oscilloscope
Vertical Amplifier:
30 MHz Bandwidth, 1 mV Sensitivity.
Time Base:
10 ns/Division to 5 ms/Division sweep speeds, triggering to 5 MHz.
For example: a TEKTRONIX 7603 Oscilloscope with a 7A18 Dual-Trace
Amplifier and a 7B53A Dual Time Base, or a TEKTRONIX 11403A
Oscilloscope with a 11A34V Video Amplifier and an 11T5H Video Trigger.
Also a 10X probe, P6106 (Tektronix Part No. 010-6106-03).
1705A Spectrum Monitor
5- 1
Page 97

Checks and Adjustments
2. Leveled Sine Wave Generator, at least 250 kHz to 95 MHz.
For example: A TEKTRONIX SG503 Leveled Sine Wave Generator
installed in a TEKTRONIX TM500 Series Power Module.
3. Voltmeter
Range, 0 to greater than 100 Vdc; accuracy, ±0.1%.
For example: A TEKTRONIX DM501A in a TM500 Series Power Module.
4. Power Module for powering and housing TEKTRONIX DM501A,
DC503A, FG503, 067-0916-00, and 015-0408-00.
For example: A TEKTRONIX TM506 Power Module.
5. UHF Signal Generator
A frequency range of at least 900 to 1800 MHz, with an amplitude of
--20 dBm, or more, and flatness within 3 dB over the frequency range.
Accurate step attenuator calibrated in dB (0 to --60).
Auxiliary Equipment
For example: A TEKTRONIX TR502 Tracking Generator and associated
equipment, a Wavetek Model 3520, or a Hewlett Packard 8614A Signal
Generator with 8496A Attenuator/110 dB.
6. Variable Autotransformer
For example: General Radio Metered Auto Transformer W10MT3W . If
220 volt operation must be checked, a conversion transformer or appropriate
220 volt autotransformer is needed.
7. Comb Generator
For example: Tektronix Part No. 015-1054-00.
8. 50Ω Coaxial Cable
Two required.
For example: Tektronix Part No. 012-0057-01.
9. Bnc Male-to-bnc Male Adapter
For example: Tektronix Part No. 103-0029-00.
5- 2
10. F-Type Male-to-bnc Female Adapter
For example: Tektronix Part No. 103-0158-00.
1705A Spectrum Monitor
Page 98

Performance Check
Short-Form Procedure
Checks and Adjustments
11. SMA Male-to-bnc Female Adapter
Two required (supplied with the Tektronix Comb Generator).
For example: Tektronix Part No. 015-1018-00.
12. SMB Female-to-bnc Female Adapter
For example: Coaxial Components Corporation Part No. 2525-4.
The Short-Form Procedure is intended for those who are familiar with the
complete Performance Check procedure. Step numbers and sub-step designations correlate directly to the steps in the Performance Check Procedure; this
makes it possible to use the Short-Form Procedure as a table of contents.
1. Preliminary Setup
a. Connect autotransformer .
b. Connect markers from Comb Generator.
2. Check Power Supply Operation
d. CHECK -- for stable operation over the prescribed voltage range.
3. Check LNB Power Supply
c. CHECK -- that the rear-panel, red indicator lamp is lighted and that the
DVM reads +18 V ±0.9 V.
e. CHECK -- that the red indicator lamp extinguishes and then comes back
on when the short is removed.
4. Check 70 MHz Linearity
c. CHECK -- for 10 frequency markers from beginning to end of sweep.
d. CHECK -- that each marker is within one minor Division of a major
graticule Division.
5. Check 70 MHz SPAN/DIV and Readout
1705A Spectrum Monitor
d. CHECK -- for one mark every 5 major Divisions, ±1 major Division.
k. CHECK -- that readout reads 45, ±1 count.
m. CHECK -- that the marker is on screen.
5- 3
Page 99

Checks and Adjustments
6. Check Resolution Filter
b. CHECK -- that the marker width 0.6 Divisions down from the top is
3 Divisions, ±1 Division.
e. CHECK -- that the marker width 0.6 Divisions down from the top of the
signal is ≤2 minor Divisions.
f. CHECK -- that the 10 kHz marker amplitude matches the highest point
of the 300 kHz marker amplitude within 1 minor Division.
7. Check 70 MHz Gain and Flatness
e. CHECK -- for a marker amplitude change of 2 Divisions, ±2 minor
Divisions when switching the leveled sine wave generator Amplitude
Multiplier between .01 and 0.1 (a 20 dB change).
i. CHECK -- that the tip of the marker is on the crt center line, ±1 minor
Division (vertically).
8. Check Video Filter
d. CHECK -- that the baseline noise amplitude drops approximately 50%
when the VIDEO FILTER is ON.
9. Check Sweep Speed
b. CHECK -- for a solid trace with almost no flicker.
d. CHECK -- for approximately 3 to 4 sweeps per second.
Alternate Method
e. CHECK -- for a ramp duration of 20 ms ±10 ms.
h. CHECK -- for a ramp duration of 200 ms ±100 ms.
10. Check L--Band Linearity
e. CHECK -- for 10 frequency markers.
f. CHECK -- that each marker is within 1 minor Division of a major
graticule line.
11. Check L-- Band SPAN/DIV and Readout
d. CHECK -- for 1 marker every 5 Divisions, ±1 Division.
i. CHECK -- for 1 marker every 5 Divisions, ±1 Division.
5- 4
o. CHECK -- that the marker is intensified.
q. CHECK -- that the marker is on screen.
1705A Spectrum Monitor
Page 100

Checks and Adjustments
s. CHECK -- that the readout still reads 1000, ±10.
u. CHECK -- that the marker is on screen.
v. CHECK -- that the readout still reads 1000, ±10.
x. CHECK -- that the marker is on screen.
12. Check L--Band Gain and Flatness
e. CHECK -- that the marker is on the same crt center line (vertically),
±0.5 Division.
g. CHECK -- that the marker is on the same crt line (vertically), ±0.5
Division.
j. CHECK -- that the marker tip is on the --10 reference line, ±0.5
Division. Note: Make sure that the baseline is on the --70 graticule
reference line.
13. Check Positioning Range
Long Form Procedure
b. CHECK -- that the tip can be positioned 2 Divisions left and right of
center.
e. CHECK -- that the marker tip can be positioned 3 Divisions down from
its present position.
f. CHECK -- that the baseline can be positioned to the --30 graticule line.
14. Check2dB/DivGain
g. CHECK -- for more than 1 Division of amplitude change.
h. CHECK -- that the noise floor can be positioned on screen.
1. Preliminary Setup
a. Connect the 1705A ac power cord to the variable autotransformer. Turn
power on and set the autotransformer to the local nominal mains voltage
(110 V or 220 V). Allow 15 minutes for warm-up time before continuing.
b. Set up the 1705A as shown in Table 5--1.
1705A Spectrum Monitor
Test Equipment Depot - 800.517.8431 - 99 Washington Street Melrose, MA 02176 - FAX 781.665.0780 - TestEquipmentDepot.com
5- 5
 Loading...