

Page 1
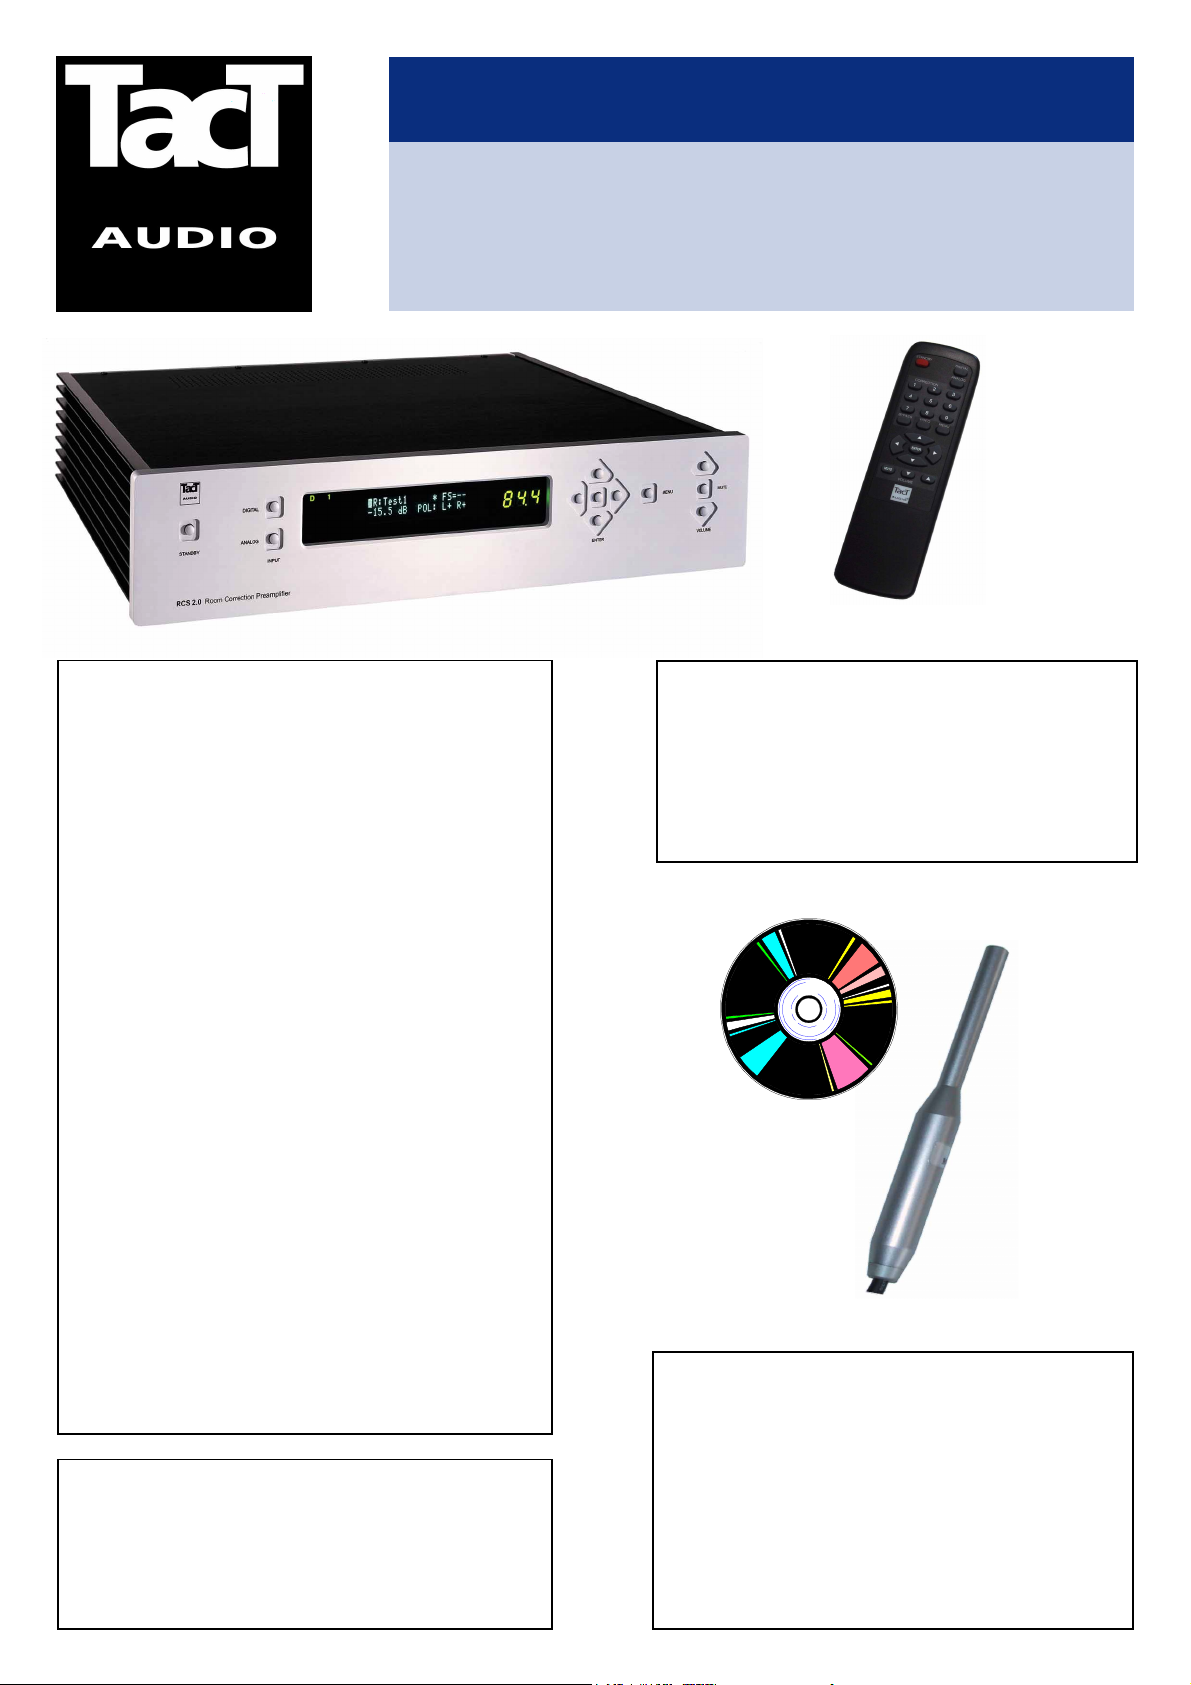
INSTRUCTION MANUAL
TACT RCS 2.0 DIGITAL ROOM
CORRECTION PREAMPLIFIER
C
ONGRATULATIONS
You have now acquired the most advanced
audio product ever developed for the reproduction of music.
The RCS 2.0 is the result of more than 10
years of intensive scientific research into
wave propagation by TacT partner Dr.
Radomir Bozovic. Although this product is the
most advanced of its kind, you will find the
operation surprisingly simple. The software
and controls have been designed for intuitive
ease of use. All aspects of the unit have been
designed for upgradeability. This includes the
front panel functions and display which can
be changed via the host computer.
The 3 powerful DSP’s have the capacity to
handle even more features in the future, and
there are installation slots for 3 additional
DSP’s for future upgrades.
Most importantly, the TacT RCS 2.0 will take
you to new levels of extreme listening pleasure. After a short time, you will realize that
the TacT RCS 2.0 offers such substantial improvements in the areas of spatial presentation, imaging, depth and dynamic control that
it can only be described as an evolution (to
quote a review of TacT 2.0).
!
REMOTE CONTROL
The included TacT remote control has the same
buttons as the front panel, plus 9 number keys
for direct access to the memory positions.
SECURITY
TacT® is a registered trademark of TacT Audio Inc.,
201 Gates Road, Unit G, NJ 07643, Little Ferry, USA.
Tel: +12014409300 • Fax: +12014405580 •
Email: info@tactaudio.com
www.tactaudio.com
RCS 2.0 has a unique software key implemented in the internal memory section. This
means that the software supplied will only
work with this particular unit. In case of theft,
the unit can only operate as a preamplifier it will not be able to perform any room correction functions.
Page 2
IMPORTANT INFORMATION
Pre-Operating Instructions
1. When removing the unit from the packing case, visually check for shipping damage. Contact both the shipper and
TacT Audio immediately if the unit bears any sign of damage from mishandling. All TacT Audio equipment is carefully inspected before leaving our factory.
2. KEEP SHIPPING CARTON AND PACKING MATERIALS for use in the unlikely event that the unit needs servicing.
If this unit is shipped without the original packing, damage could occur and void the warranty.
Important Safety Instructions
1. Read these instructions entirely before installing or operating this apparatus.
2. Keep these instructions.
3. Heed all warnings.
4. Follow all instructions.
5. Do not use this apparatus near water.
6. Clean only with dry cloth.
7. Do not block any ventilation openings. Install in accordance with the manufacturer’s instructions.
8. Do not install near any heat sources such as radiators, heat registers, stoves, or other apparatus (including amplifiers) that produce heat.
9. Do not defeat the safety purpose of the polarized or grounding-type plug. A polarized plug has two blades with one
wider than the other. A grounding-type plug has two blades and a third grounding prong. The wide blade or the
third prong are provided for your safety. If the provided plug does not fit into your outlet, consult an electrician for
replacement of the obsolete outlet. To protect against electrical shock, match the wide blade of the polarized plug
to the wide slot in the outlet, fully insert plug.
10. Protect the power cord from being walked on or pinched, particularly at plugs, convenience receptacles, and the
point where they exit from the apparatus. Do not use this unit with a damaged cord or plug.
11. Only use attachments/accessories specified by the manufacturer.
12. Use only with cart, stand, tripod, bracket, or table specified by the manufacturer, or sold with
the apparatus. When a cart is used, use caution when moving the cart/apparatus combination
to avoid injury from tip-over.
13. Unplug this apparatus during lightning storms or when unused for long periods of time.
14. Refer all servicing to qualified service personnel. Servicing is required when the apparatus has been damaged in
any way, such as when the power-supply cord or plug are damaged, liquid has been spilled or objects have fallen
into the apparatus, the apparatus has been exposed to rain or moisture, does not operate normally, or has been
dropped.
Cleaning and Maintenance
1. Always unplug the unit from the electrical outlet.
2. Do not use abrasive cleaners. Simply wipe the exterior
with a clean soft cloth. A small amount of non-abrasive
cleaner may be used on the cloth to remove any exces-
sive dirt or fingerprints.
CUSTOMER REGISTRATION
For security reasons and to make future
upgrades easier for you, we strongly
WARNING:
To reduce the risk of fire or electric shock, do not expose
this apparatus to rain or moisture
recommend that you submit the enclosed
registration form so that TacT Audio can
register you as owner of the unit
The exclamation point within an equilateral triangle is intended to alert the user
to the presence of important operating
and maintenance (servicing) instructions
in the literature accompanying the
product.
The lightning with arrowhead symbol
within an equilateral triangle is intended to
alert the user to the presence of uninsulated “Dangerous Voltage” within the
products’ enclosure that maybe of sufficient magnitude to constitute a risk of
electrical shock to person.
Page 3

REAR PANEL CONNECTIONS
AD Module (optional)
Microphone
input
Digital coaxial
Analog inputs for
Digital AES/
EBU input
inputs
Digital coaxial
Digital
optical input
Analog outputs from
DA Module (optional)
Digital optical
output
Digital AES/
EBU output
output
Mains input and
on/off switch
PC connection
RS232 input
DIGITAL INPUTS:
The RCS 2.0 DD (basic version) has the
following digital inputs:
• 3 coaxial/RCA inputs
• 1 AES/EBU input
• 1 Toslink optical input
DIGITAL OUTPUTS:
The RCS 2.0 DD has 3 digital outputs:
• 1 coaxial/RCA inputs
• 1 AES/EBU input
• 1 Toslink optical input
ANALOG INPUTS:
The optional AD converter has 4 stereo
inputs: 3 x RCA, 1 x balanced XLR
How to get started:
1. Connect your computer to the RCS 2.0 via the
RS232 cable supplied with the unit. Be sure to connect
to the RS232 input and NOT to the RS232 Aux.
2. Connect the microphone to the microphone input on
the RCS 2.0.
3. Connect the appropriate analog and/or digital inputs
and outputs according to the labeling on the back of the
RCS 2.0.
4. Connect the powercord and turn the RCS 2.0 ON.
ANALOG OUTPUTS:
The optional DA converter has 2 stereo
outputs: 1 x RCA, 1 x balanced XLR
5. Follow the instructions on page 7 to install the
software.
Page 4
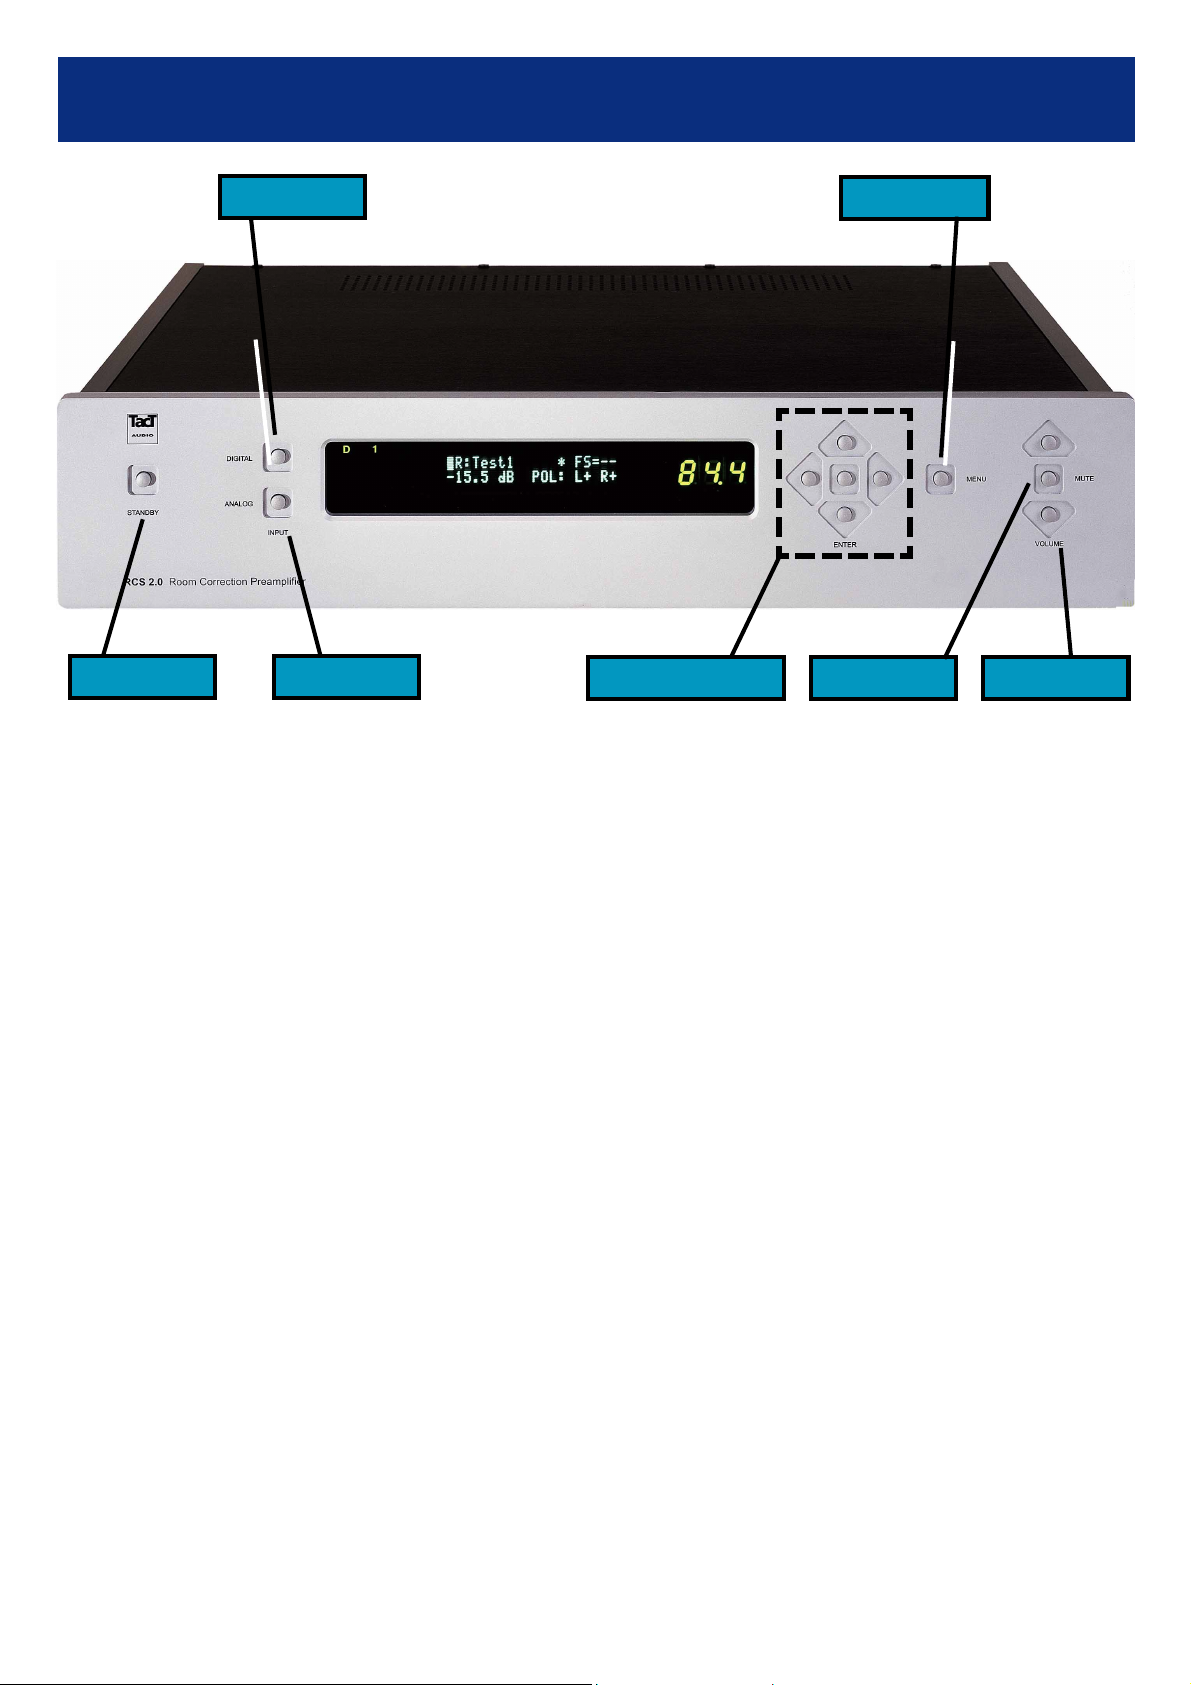
FRONT PANEL CONTROLS
1. Standby
2. Digital
3. Analog
5. Menu
7. Volume6. Mute4. Enter/Cursor
1. STANDBY
Toggles between On and Standby mode. In Standby
power consumption is less than 2 W. The main power
switch is on the back of the unit adjacent to the power
cable.
2. DIGITAL
Toggles between the 5 digital inputs. The selected input is
displayed in the window.
3. ANALOG
Toggles between the 4 optional analog inputs. The selected input is displayed in the window.
PLEASE OBSERVE:This button will only function if
the optional Analog-to-Digital module (AD module)
has been installed in the RCS 2.0.
4. CURSOR & ENTER
Four buttons will scroll the display or move the cursor
up/down, left/right. The middle button will enter the selection.
5. MENU
Press to access the menu and sub-menu system of the
RCS display.
6. MUTE
Press to mute the digital and analog outputs.
7. VOLUME VOLUME
The upper and lower buttons will adjust the volume in
0.1 dB steps from 0.0 to 99.9. If the RCS 2.0 is combined with the TacT Millennium amplifier, it is suggested
to choose a maximum level of 93.9 on the RCS display
scale.
Page 5
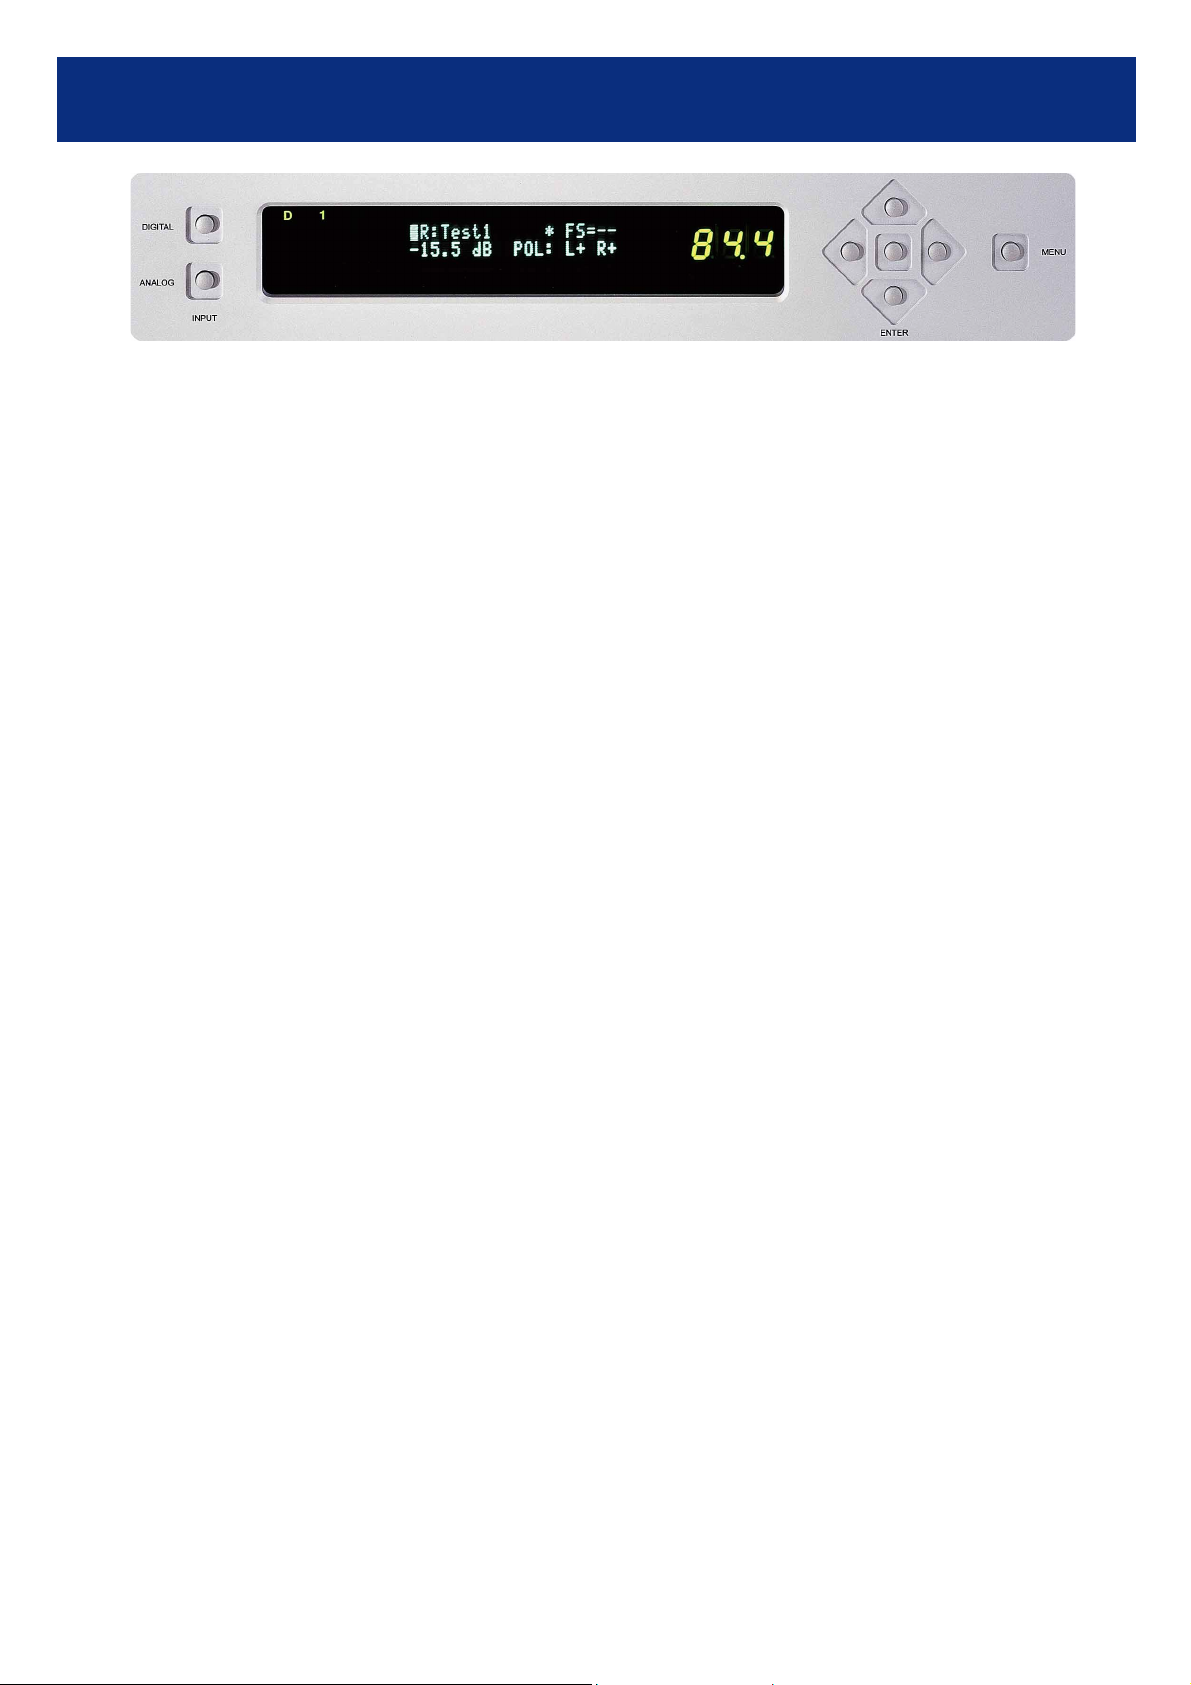
DISPLAY FUNCTIONS
The main screen of the display
will show the name of the chosen
memory position: MEM1, MEM2
etc. The names of the memory positions can be changed using the
computer software.
Change memory position from the
front panel:
Make sure that the cursor (blinking
rectangle) is over the C. Use the
toggle up/down buttons. When the
desired memory position is displayed, select by pressing enter. The
selection is confirmed by the display
of a star to the right of the memory
position name. If the star is not
shown, the displayed memory position is not the one in use.
Change memory position from the
Remote control:
Press buttons 1-9 to enter the
memory position directly. Bypass will
bypass the correction.
Sampling frequency:
FS=44, FS=48 or FS=96: This is the
sampling frequency used by the system. When a digital input is used, the
system will automatically match the
sampling rate of the selected digital
source. When no source is present,
the display will show: FS= — .
When an analog input is used, the
system will use the sampling rate selected in the analog input menu.
Attenuation:
This is the attenuation from maximum output level in dB. At max. output it will display +6.0 dB. At min.
output it will display -99.9 dB. Controlled by the volume control.
POL:
Use the toggle right/left buttons to
place cursor over either L or R to
change polarity (absolute phase) of
the Left or Right channel. The normal
setting should be +L and +R for positive polarity on both channels.
SUB-MENU:
Access the sub-menu by pressing
the menu button. The following
nine functions will be displayed.
Select one of them by moving the
cursor and pressing enter:
1. DELAY:
Displays the delay in milliseconds of
the left and right channels for the
memory position used. Place cursor
on the delay setting for either channel and change the value with the up/
down buttons.
Please note that the values set by
the room correction software are extremely accurate. Under normal op-
eration, it is not desirable to change the values. Exit the sub-screen
by pressing menu.
2. LEVEL:
Displays the level in dB of the left
and right channels for the memory
position used. Place cursor on the level setting for either channel and
change the value with the up/down
buttons.
Please note that the values set by
the room correction software are extremely accurate. Under normal op-
eration, it is not desirable to
change the values. Exit the sub-
screen by pressing menu.
3. ADC:
This will enable you to change the
sampling rate of the optional AD converter. Place the cursor on the desired sampling rate and press enter
to change sampling rate.
Please note that the RCS 2.0 will
operate at the selected sampling
rate in the complete digital system. This means that you can only
us the 96 kHz sampling rate, if the
RCS 2.0 has the optional DA con-
verter or if the external DA converter
supports 96 kHz. Exit the sub-screen
by pressing menu.
4. DISPLAY:
This is a time-out function. Place cursor on Off or On and press enter to
disable or enable the time-out function. With time-out engaged the display will turn off after 10 seconds.
Any operation by the remote control
or at the front panel will enable the
display while the unit is being controlled. Exit sub-screen by pressing
menu.
5. TEST:
This basic test facility generates a
white noise signal at the selected
channel to check that the correct
channel assignment has been made.
Place cursor on either LEFT or
RIGHT and engage the test signal by
pressing enter. Exit the sub-screen
by pressing menu.
6. ANL:
If the optional TacT DAC (digital-toanalogue) module has been installed
in your RCS unit, you will find an
additional volume control that allows
you to increase the analog output
level up to 6 dB for each channel
separately. You will find this submenu in the display by using the right
arrow button.
7. REM:
This feature enables or disables remote control reception. When programming RCS 2.0 it is recommended to set this menu to OFF.
8. ADDR:
This is the units device address. It
can be changed if multiple TacT
products are controlled by the same
computer. Default setting is “001”.
Page 6

SOFTWARE INSTALLATION
Software installation
The RCS 2.0 employs some of the most advanced audio-software ever developed. In order to use the
proprietary TacT Room Correction System, you have to install the supplied software on your computer. This
guide will help you through the software installation process:
System requirements
Your system must meet the following requirements:
· An IBM compatible PC with Pentium 100 MHz, 16 MB Ram & 25 MB free hard disk
space or better
· Microsoft Windows 98, ME or 2000
· Microsoft Windows-compatible graphics-card and monitor with screen
resolution 800x600 or better
· CD-ROM drive
· Microsoft windows compatible 2- or 3- button mouse
· Standard RS-232 serial port with DB-9 connectors
1. Start windows and insert the TacT software CD into your CD-ROM drive.
2. Double-click on the “My Computer” icon on the desktop.
3. Double-click on the CD icon to launch the CD browser.
4. Click on “Install Tact-20” and follow the on screen instructions.
When prompted, select “Launch TacT-20” and the software will start. You should now see the TacT Room Correction System main-screen.
Microphone installation
All TacT measurement microphones are individually calibrated to perform with the highest accuracy and come
with a unique calibration file. This file needs to be installed before the correction process:
- Insert the TacT software disc into the computers CD-rom drive.
- Open the TacT software and select “File” from the main-screen
- Click on “Microphone” and a new window will open
- Select your CD-Rom drive in the “Look-in” menu - you should now see two files in the larger window below
- Double click on the “Micxxxxx” file. The number should match the serial number of the microphone.
- The software will confirm with “Mic installation complete
Tutorial
This tutorial is designed to help first time users to understand the basics of the Tact-2.0 room correction process.
This tutorial will guide you through each step necessary to perform measurement, correction, programming and system
verification using Dual Domain analysis software. This tutorial is composed of four steps:
Step 1 – Hardware check up
Step 2 – Communication test
Step 3 – Project assignment
Step 4 – Correction process
Usually, you would go through step 1 & 2 every time you use the computer to re-adjust or re-calibrate the system. Before
proceeding to anything else, it is good practice to verify that the communication channel is functioning properly.
You would go through step 3 only if you want to change the current project directory.
Page 7

SOFTWARE - TUTORIAL
Step 1
Make sure that Tact-2.0 is turned on. Connect your music source, digital or analog, to one of digital or analog
inputs. From the front panel of Tact-2.0, select an appropriate input. Connect the output of Tact-2.0, digital or analog, to
your power amplifier. Make sure that level settings for both left and right channel are set to 0 dB (Front panel - Level
menu). Verify that the system is functioning properly by playing some music..
NOTE: Master level gain and individual channel levels are not relevant for the measurement/correction process.
Using the supplied RS232 cable, connect Tact-2.0 to your personal computer. Your PC must have at least one free DB9
type RS232 connector. For connection to your PC, refer to manufacturer’s PC user’s manual.
NOTE: Make sure that the RS232 cable is
connected to the Tact-2.0 “RS 232 Input” con-
nector and
not to the “RS232 AUX” connector.
Step 2
The TacT 2.0 software will automatically perform a communication test when it is launched. This is done in
order to assure that proper communication is established between the computer and the TacT 2.0.
If any problems occur, a message box will pop up and tell you to check the connections, that the unit is powered on, etc.
You can then check the communication manually by opening the communication box. It should be located in the lower
left corner of the screen. Select the appropriate serial communication port. There are four options: COM1, COM2, COM3
and COM4. From your PC users manual you should be able to find which communication port is used. To verify that the
Tact-2.0 is properly connected to the host computer, click on the “Start” button to perform the communication test. If
everything is functioning properly, “Rx Buf” should display “170”, “Count” label should count in increments of 100, and
“Err Count” should be 0.
If you do not know what serial port you use, try selecting them one by one and for each port perform the communication
test. Once the “Err Count” counter shows 0, you have selected the right port.
If “Err Count” is not equal to 0, check the connection. Make sure that you use correct port assignment and run the
communication test again.
NOTE: You have to select the communication port only once. Next time you run Tact-2.0 software it will restore previous
settings.
Step 3
At this point your system is ready to perform the
room correction process. From the file menu in the main
screen select “Project” menu option. This will open the Tact-
2.0 project dialog window. In the new project box type in the
project name “Room 1” and click on “OK”. This will create
project “Room 1”. In this project (directory) the system will
keep all measurement, correction and other relevant data.
After you exit this screen the new project name will be
displayed in the upper left corner of the screen.
(1) – Current project path (2) – Project list box
(3) – Displays current project (4) – New project
(5) – “Template” directory (6) – Project directory “Test1”
(7) – Measurement directory “Msr1” under project “Test1”
(8) – Project directory “Test2”
(9) – Measurement directory “Msr2” under project “Test2”
Page 8

SOFTWARE - TUTORIAL
Step 4
From the main screen click on “COR” button located on the top
of the screen. This will enter the correction screen. (See page
9 for detailed description of the correction screen layout) This
screen is almost fully automated. However, there are a few
parameters that must be properly set before you initiate the
whole process.
Connect the microphone and place it in the primary listening
position at the height of your head pointing towards the center
of the two loudspeakers.
NOTE: For the first setup of the system we have pre-set most
of the selections. This means that, if you wish to do your first
setup very quickly, you can skip all points except 1 and 13.
1. Using the mouse select correction memory option #1 (20) or any other memory position.
2. Click on the measurement directory label (2). This will open the measurement directory window. In the new Measure-
ment Directory box (5) type in the new measurement directory name “Msr1” and click on “OK”. Notice that when you exit
the screen the new measurement directory name will be displayed in the measurement directory label (2).
3. In the averaging box (4) enter 20. This will tell the system to perform twenty measurements on each channel and then
take the average value as the final measured result. Enter a higher value if you have a lot of background noise.
4. In the initial delay box (6) enter 0. This will tell the system to start acquiring data as soon as the impulses are produced.
5. In the delay box (8) enter 10. After you initiate the correction/measurement process the system will wait for 10 seconds which should give you enough time to leave the room if you wish to do so.
6. By clicking on "L" and "R" (10, 11) select both channels. This will tell the system that you want to measure both
channels.
Main screen - “COR button”
7. Uncheck all microphone measurement position check boxes (12). This ensures that only one microphone measurement position is used.
9. In the middle of the screen check "Left" and "Right" correction check (21) box. This will enable correction on both
channels.
10. If spatial averaging box displays “AVG ON (22)” double click on it and disable spatial averaging (1).
11. In the Target Curve panel (24) double click inside the “Left” channel target curve label. This will open the target curve
list box. From the list box select the appropriate target curve. (See page 13 for guidelines to target curve selection) We
recommend that you use the Target Curve Editor to modify the curves towards your preferences and the sonic
balance of your system (see page 13 for more information) . After you exit this screen, the selected target curve
name will appear in both “Left” and “Right” target curve labels on the Target Curve panel. If you wish to select a different
target curve for the right channel, repeat the same process by double clicking on the “Right” target curve label. Note that
the selected target curve will be displayed on the target curve graph.
12. If you use the Tact supplied measurement microphone, enable the microphone calibration file by clicking on "Mic"
label (23). If you use a measurement microphone other than Tact, disable this feature.
13. At this point you have set all parameters needed to perform one microphone measurement position room correction.
To start the process click on "GO" (13) in the upper half of the screen – time domain section.
Page 9

Correction Screen
SOFTWARE - TUTORIAL
Page 10

SOFTWARE - TUTORIAL
(1) – Displays current project directory.
(2) – Measurement directory. This is active control. Click to enter the measurement directory selection screen.
(3) – COM Port. Displays the selected communication port.
(4) – Averaging. This is active control. It is used to set averaging of the impulse response measurement. For
example, if this number is 10 the system will pulse the room ten times for each channel and then average
the measurements. This feature is used to reduce ambient noise. It is recommended that this number be
greater than 10. In particular, this is very important for low frequency noise reduction. A larger averaging
number will ensure a better signal to noise ratio and a more reliable measurement.
(5) – Device address.
(6) – Initial Delay. This is active control. It is used to set initial acquisition delay time. For example, if this number
is set to 10 msec, the system will pulse the room, wait for 10 msec and then start acquiring data. This
feature is useful in cases where there is a large distance between the speakers and microphone. In typical
applications (home and studio applications) this parameter can always be set to 0.
(7) – Microphone level. Displays the current microphone preamplifier gain as set by the microphone calibration
screen.
(8) – Delay. This is an active control. It is used to set measurement delay time. For example if it is set to 10 sec,
the system will wait for 10 seconds after the measurement process is initiated and then start pulsing the
room. It is designed to allow the user to initiate the measurement/correction process and then leave the
room.
(9) – Status label.
(10) – Click to enable/disable left channel. If the channel is not enabled measurement on that channel will not be
performed.
(11) – Click to enable/disable right channel. If the channel is not enabled measurement on that channel will not be
performed.
(12) – Select microphone measurement position. Center position is always position #1. If more than one micro
phone position is enabled, spatial averaging has to be defined.
(13) – Click to initiate the complete measurement, correction and programming sequences.
(14) – Click to initiate the measurement sequence only.
(15) – Click to cancel the measurement process.
(16) – Select between time and frequency domain. When time domain is selected, the room impulse response is
displayed. When frequency domain is selected, the room frequency response is displayed.
(17) – Selects between low and high frequency measurement data. When LP is selected, the low frequency mea-
surement data is displayed. Low frequencies cover frequencies up to 2000 Hz. When HP is selected the full
range data is displayed – up to 20,000.00 Hz.
(18) – Click to auto scale. This feature will automatically select X and Y scale ranges for the best display data cover
age.
(19) – Click to enable/disable left and right channel display.
(20) – Correction memory selection.
(21) – Enable/disable left and right channel correction.
(22) – This is an active control. Double click to enter the “Spatial Averaging” screen.
(23) – Microphone correction. Double click to enable/disable microphone frequency response correction. If enabled it
will read the microphone calibration file saved in “Mic” sub-directory and apply it to the measurement data.
(24) – Left channel target curve (See page 11 for guidelines to target curve selection)
(25) – Right channel target curve (See page 11 for guidelines to target curve selection)
(26) – Left and right channel delay time.
(27) – Left and right channel level adjustment.
(28) – Master volume control.
(29) – Click to initiate the correction process.
(30) – Click to cancel the correction process.
(31) – Click to toggle between Left, Right and Left & Right target curve display.
(32) – Click to enter the Left/Right target curve editor. (See page 13 for detailed description of the editor screen)
(33) – Click to overlay target curve.
(34) – Double click to remove the overlaid target curve.
(35) – Measurement data graph.
(36) – Target curve graph.
(37) – Correction Names. This is an active control. Click to enter the correction names screen.
Page 11

SOFTWARE - TUTORIAL
From this point the system will take over and perform the following steps:
- The system will count down from 10 to 0 before it starts pulsing the room.
- Microphone calibration. The microphone calibration
window will pop up. The system will pulse both channels a few times and will automatically set the microphone preamplifier gain so that signal to noise ratio is
optimized. After this is completed, this window will be
closed and the microphone preamplifier gain will be
displayed in the "Mic" box.
- Left channel measurement process. The system will pulse the left channel 20 times and will transfer measurement data to the computer.
- Right channel measurement process. The system will pulse the right channel 20 times and will transfer
measurement data to the computer. At this point the measurement process is completed.
- Correction process. The Correction list box will pop up in the lower left corner of the screen. The system
will compute correction filters for both channels. Also, at this point level balancing and time alignment is performed.
- System programming. The programming screen will
open. Note that only memory position 1 is checked. At
this point the system is programming Tact-2.0 internal
memory with the correction filters for memory position
#1.
When system programming is finished, the entire correction process is completed. The system is ready to play. If
there is any level mismatch between the channels the system will set one channel to 0 dB and scale down the other
channel to obtain perfect balance (27). Also, notice the change in the delay time (26) numbers. Master volume (28)
is not affected by the correction process. Note: You have to exit the PC-software to enable the front-panel controls.
NOTE: If you wish to make a correction with a different target curve for another memory position then repeat the
steps: (1) – Select memory position, (2) Select the same measurement directory, (11) Select target curve, Then push
GO (29) on the lower half of the screen.
The system will now make a correction based on the same measurement but with the new target curve. ( steps 5 and
6 ) Time required: approx. 1 min.
NOTE: If you wish to make a correction with a different measurement for another memory position, repeat the steps:
(1) – Select memory position, (2) Select or create a different measurement directory, (11) Select target curve, (12)
Initiate the measurement and correction process by pushing “GO” on the upper half of the screen.
Page 12

TARGET CURVES
Selecting Target Curves
The target curve is an essential part of the correction as it determines the systems frequency response after correction,
and thereby the tonal balance of the system. The software comes pre-installed with a variety of curves. These curves
are meant as a guideline and to get you started with the correction process (see description of the curves below). However, it is recommended that you tailor the target curves to suite your system and personal preferences. A separate tool
has been developed for this purpose: the Target Curve Editor. This software is similar to a drawing program, and allows
you to manipulate existing curves or create your own. It offers endless possibilities of “sound-shaping” and extreme
fine-tuning. (See examples on page 18-20) The software will also allow you to compare the measured response (before correction) with the target curve. This is very useful to create curves that maintain the overall signature of the system, that corrects for the channel differences and the acoustical influence of the room. To open the Target Curve Editor
simply press “Edit Left” in the correction main screen, and the Editor will open in a new window.
A short description of the pre-installed target curves:
TacT A_.cor
The “A” curves are intended for full range systems
with high power handling. All curves have bass extension to below 17 Hz. and should only be used
with speakers that can handle large amounts of
power at low frequencies. All curves have a slight
roll-off from approx 3kHz which creates a warm
sound with most systems. A2, A3 and A4 are less
bright sounding than A1.
TacT B_.cor
All “B” curves are bright sounding curves with a
slight lift in the upper midrange. Bass extension to
approx. 20Hz. which means they should be used
with full range system and good power handling. B2
& B3 are less bright than B1
TacT C_.cor
The “C” curves have flat midrange response but are
lifted at 12-18kHz and also from 60Hz to +6dB at
20Hz. This could be considered a “Loudness”
curve. Use with full range systems. C2, C3 and C4
are less bright.
TacT D_.cor
The “D” curves are similar to the A-curves but with
less extension in the bass. The curve is lifted from
90 Hz down to 30 Hz where the roll-off begins. Use
with smaller speakers that lack energy in the low
bass region.
D2, D3 and D4 are less bright.
Page 13

TARGET CURVES
TacT E_.cor
“E” curves are close to flat response with a roll-off at
high frequencies (3-8dB down) and flat response
down to 20Hz.
E2 and E3 are less bright
TacT G_.cor
“G” curves are close to A-curves but have more
level in upper midrange/highs and are therefor
brighter sounding.
TacT F_.cor
“F” curves are similar to the A-curves, but have
more midrange level and a softer roll off at high frequencies.
TacT H_.cor
H-curves are lifted in the bass and at high frequencies. Furthermore, they have a retracted midrange
which creates a deeper soundstage. Soft, warm
sounding curve.
TacT Small_.cor
The “Small” curves are intended for use with small
speakers with limited bass-response. Curves roll-off
at 45 Hz. Small2, Small3 and Small4 are less bright.
Page 14

TARGET CURVE EDITOR
Using the target curve editor screen
The editor will display the current selected target curve (active memory). The target curve is drawn as a series of connected straight lines. Points at which the lines are connected are called “corners”. Corners can be added, moved or deleted. In order to edit the curve, select “Options” menu and make sure that “View Corners 1” is checked. This will display the corners (red dots). To move a corner click on “Move” and use the mouse to click and drag the corner in any direction. If you need to add a corner click on “Add” and click on the curve where you wish to add the corner. If you wish
to delete a corner click on “Delete” and then click on the corner you wish to delete. “Redo” and “Undo” will either repeat
or delete the last changes you have made.
Import of measurements to target curve screen:
This feature allows you to directly compare between the measured response and the target response. To use this feature follow these steps: Go to “File” and select “Import Measurement M1”, select a measurement from the Windows file
system ( The latest measurement will automatically be suggested ). Pick the left channel measurement by double clicking on msrl_l1. Then pick the right channel by clicking on msr_r1. Now the left and right channels will be displayed together with the target curve. (If not, check that “Mem1” and “Mem2” buttons are set to ON) Align the levels of the measurement with the up-down arrows for M1 and M2. This will allow you to see exactly how much your target curve differs
from your measured response. If – for instance – you do not want to change the overall tonal balancing of your speaker
system at the higher frequencies, then just plot the target curve according to the speakers natural response. You will
also be able to see directly how much correction will be applied at any frequency. We have included 3 examples on
how target curves can be customized and what to look out for.
Page 15

TARGET CURVE EDITOR
Target curve editor screen:
2 3 4 5 6 7 8 9 10 11 12 13
1
14
31
32
15
16
17 18 19 20 21 22 23 24 25 26 27 28 29 30
Page 16

TARGET CURVE EDITOR
(1) - File menu. Consists of the following menu options:
- Load menu. Click to load an existing target curve file into the target curve editor’s active memory.
Once the file is loaded it can be modified and saved under a different name. All target curves are
saved in the “Target” sub-directory. Target curve files have file extension “cor”.
- Load Memory menu. Click to load an existing target curve file into the target curve editor’s viewing
memory. This file can not be modified.
- Save menu. Click to save currently displayed target curve. The curve will be saved under the same
file name it was loaded.
- Save As menu. Click to save currently displayed target curve using a different file name.
- Import Measurement M1 & M2. Click to import a measured frequency response into the target curve
editors viewing memory #1 or #2. The software will automatically bring up the latest measurement
performed.
- Print menu. Click to print the displayed target curve.
- Exit menu. Click to exit the target curve editor screen.
(2) - Option menu. Consists of the following menu options:
- View Table menu. If this option is checked a table displaying all corner frequencies and levels will
be displayed.
- View Corners 1. When this option is checked all target curve corners will be displayed as red boxes
- View Corners 2. When this option is checked all target curve corners will be displayed larger than in the
previous option.
- Default Scale. Click to select default scale. Default scale is: (1-20,000) Hz, (-80,20) dB.
(3) - Click to re-draw the screen.
(4) - Click to enable adding corners to the target curve. Once this feature is enabled, use the mouse to point at
the desired target curve location and click on the left mouse button to add a new corner.
(5) - Click to enable deleting corners from the target curve. Once this feature is enabled use the mouse to point
at the corner to be deleted and click on the left mouse button.
(6) - Click to enable moving target curve corner. Once this feature is enabled use the mouse to point at the
selected corner, hold the left mouse button down, drag the corner to a new position and release the left
mouse button.
(7) - Click to undo the change.
(8) - Click to redo the undo operation.
(9) - Click to enable zoom feature. When enabled this button will display “Zoom In”. Use the mouse to define
zoom in range. Hold down the left mouse button, drag the mouse to define the zoom in range and than
release the mouse. The part of the target curve inside the zoom in range will be displayed, and the zoom
button will display “Zoom Out”. To go back to the previous view click on “Zoom Out”.
(10) - Displays frequency coordinate of the selected corner.
(11) - Displays level coordinate of the selected corner.
(12) - Displays the target curve file name loaded into the active memory.
(13) - Target curve list box. Displays the requencies and levels assigned to each corner. To modify a corner click
on a selected corner inside the list box, or click on the actual corner on the target curve.
(14) - Target curve stop level. To change the stop level click on the actual number.
(15) - Target curve start level. To change the start level click on the actual number.
(16) - Target curve start frequency. To change the start frequency click on the actual number.
(17) - Displays the current project directory.
(18) - Displays the file name loaded into the editor’s viewing memory.
(19) - Click to move the target curve up for manual alignment.
(20) - Click to move the target curve down for manual alignment.
(21) - Click to auto-scale the target curve.
(22) - Click to switch viewing memory #1 ON or OFF.
(23) - Click to move viewing memory #1 curve up.
(24) - Click to move viewing memory #1 curve down.
(25) - Click to auto-scale viewing memory #1.
(26) - Click to switch viewing memory #2 ON or OFF.
(27) - Click to move viewing memory #2 curve up.
(28) - Click to move viewing memory #2 curve down.
(29) - Click to auto-scale viewing memory #2.
(30) - Target curve stop frequency. To change the stop frequency click on the actual number.
(31) - Target curve loaded into the active memory. Notice the red dots representing target curves corners. (click-
and -drag to modify the curve)
(32) - Measured response curves loaded into viewing memory #1 (grey) and memory #2 (yellow)
Page 17

Example 1:
TARGET CURVE EXAMPLE
Situation: High End speaker system with dual 8” woofers and a mid size room. (Sonus Faber Amati)
Notes:
1. Resonances at 64 & 124 Hz will be removed by the target-curve, without correction these resonances are
so audible that almost all other frequencies below 200 Hz becomes inaudible.
2. Target curve will increase level below 32 Hz, this can be allowed for large powerful speakers in relatively
small rooms.
3. System lacks energy in the region 150-350 Hz, this makes the system sound clean and detailed, but also
thin and slightly aggressive. The target curve is chosen to remove most of the dip, but not all of it.
4. In this region the system clearly has too much energy. The target curve will take it down by about 2 dB
5. At the highest frequencies the target curve will not change the overall balance, just smooth out the levels
In this case the target curve was chosen to maintain the general sound character of the speaker system. We did try to
linearize the region 150-350 Hz completely, but this was clearly to much for the speakers, so we settled for less than full
correction in this region.
The system was big and powerful with good quality woofers, so we had no problem extending the low frequencies by
about one octave.
Page 18

Example 2:
TARGET CURVE EXAMPLE
Situation: High End speaker system with 15” woofer in mid size room. (B&W Nautilus 801)
Notes:
1. Resonance at 48 Hz will be removed by the system
2. Broad resonance at 100-190 Hz will be removed
3. Broad band with excess energy around 600 Hz will be corrected
4. Above 800 Hz the general frequency response of the speakers are followed
With this setup the best results were achieved when the general tendency of the speaker system was followed. After
Correction the sound was lighter in the bass so we made a curve with more warmth in the bass region. Lifted about 3 dB
at 30 Hz levelling off to around 1 dB at 150 Hz.
Page 19

Example 3:
TARGET CURVE EXAMPLE
Situation: High End speaker system with dual 8” woofers in a recording studio.
Notes:
1. Resonance at 260 Hz will be removed by the system
2. Broad resonance at around 600 Hz will be removed by the system
3. The speakers are powerful - they can easily cope with an increase at 30-15 Hz
4. The high frequencies roll off to early. The target curve will lift the high frequencies by 1 - 3 dB
This is quite typical for a studio with very elaborate acoustical treatment. The good part is that the bass response is quiet
flat. On the other hand, there is far too much absorption of high frequencies and broad resonances at 260 and 600 Hz.
Without correction the sound was very unnatural, so we ended up with a target curve that radically change the overall
tonal balance of the system.
Page 20

TacT Audio, Inc.
201 Gates Road Unit G, Little Ferry – New Jersey 07643, USA
Phone: +1 201 440 9300 – Fax: +1 201 440 5580 – Email: info@tactaudio.com
www.tactaudio.com
 Loading...