


Radar Level Recorder
RLR-0001-1
RLR-0003-1
Operations & Maintenance
Manual
Part No. 8800-1169
Revision – 1.31
Mar 11th, 2010

Bringing the Benefits of Real-Time Data Collection to the World
2
INTRODUCTION............................................................................................................................................ |
6 |
FEATURES ....................................................................................................................................................... |
7 |
UNPACKING................................................................................................................................................... |
8 |
CABLING......................................................................................................................................................... |
9 |
RLR-0003-1 ................................................................................................................................................... |
9 |
TERMINAL BLOCK – RLR-0001-1................................................................................................................... |
9 |
Power Connections .................................................................................................................................... |
9 |
SDI-12 Connections ................................................................................................................................. |
10 |
DB9 CONNECTOR ......................................................................................................................................... |
10 |
QUICK INSTALL.......................................................................................................................................... |
11 |
STANDALONE QUICK INSTALL ...................................................................................................................... |
11 |
QUICK INSTALL WITH A LOGGER................................................................................................................... |
11 |
Redundant Data Collection...................................................................................................................... |
12 |
SETUP AND OPERATION .......................................................................................................................... |
13 |
OVERVIEW .................................................................................................................................................... |
13 |
STARTING THE RADAR................................................................................................................................... |
13 |
STAGE, DISTANCE TO WATER, AND MEASUREMENT POINT .......................................................................... |
14 |
SETTING STAGE............................................................................................................................................. |
14 |
MEASURING STAGE....................................................................................................................................... |
15 |
Signal Strength......................................................................................................................................... |
15 |
Stage Details ............................................................................................................................................ |
15 |
Stage Units............................................................................................................................................... |
15 |
Right Digits .............................................................................................................................................. |
15 |
Automeasure ............................................................................................................................................ |
16 |
Operating Modes ..................................................................................................................................... |
16 |
Averaging Time........................................................................................................................................ |
17 |
Averaging................................................................................................................................................. |
17 |
DQAP....................................................................................................................................................... |
17 |
Sample Form Period ................................................................................................................................ |
17 |
LAST AUTOMEASURED ................................................................................................................................. |
18 |
DISCHARGE................................................................................................................................................... |
18 |
LOGGING....................................................................................................................................................... |
18 |
Events....................................................................................................................................................... |
19 |
Logged Measurement Time ...................................................................................................................... |
19 |
Log Daily Values ..................................................................................................................................... |
19 |
SETUP ........................................................................................................................................................... |
19 |
CONNECTING RADAR TO A LOGGER .............................................................................................................. |
19 |
Satlink and Radar .................................................................................................................................... |
20 |
STATION NAME ............................................................................................................................................. |
20 |
RADAR TIME................................................................................................................................................. |
20 |
WDID .......................................................................................................................................................... |
20 |
BATTERY VOLTAGE ...................................................................................................................................... |
20 |
PASSWORD.................................................................................................................................................... |
21 |
DIAGNOSTICS ................................................................................................................................................ |
21 |
Raw Radar Sensor Data........................................................................................................................... |
21 |
Subsamples............................................................................................................................................... |
21 |
Lock/Unlock Quality Engine.................................................................................................................... |
21 |
DEFAULT, MAX, MIN SETTINGS .................................................................................................................... |
23 |
FRONT PANEL INTERFACE..................................................................................................................... |
24 |
|
|
Bringing the Benefits of Real-Time Data Collection to the World |
|
3 |
|

NAVIGATING THE MENUS.............................................................................................................................. |
24 |
TURNING DISPLAY ON/OFF........................................................................................................................... |
24 |
BACKLIGHT................................................................................................................................................... |
24 |
CONTRAST .................................................................................................................................................... |
24 |
VIEWING CURRENT DATA ............................................................................................................................. |
25 |
Understanding the “?” indicator............................................................................................................. |
25 |
VIEWING LOGGED DATA............................................................................................................................... |
25 |
FRONT PANEL MENU TREE .................................................................................................................... |
26 |
SDI-12 SENSOR OPERATION.................................................................................................................... |
28 |
SDI-12 REFERENCE ...................................................................................................................................... |
28 |
XXS Generic Change Radar Setup Command ..................................................................................... |
33 |
RS232 COMMAND LINE INTERFACE .................................................................................................... |
34 |
RS232 SETUP................................................................................................................................................ |
34 |
MACHINE TO MACHINE COMMUNICATION .................................................................................................... |
34 |
VIEWING STAGE............................................................................................................................................ |
34 |
DOWNLOADING THE LOG .............................................................................................................................. |
35 |
AUTO OUTPUT .............................................................................................................................................. |
35 |
TARGET MODE ............................................................................................................................................. |
35 |
RS232 COMMAND REFERENCE..................................................................................................................... |
35 |
List of commands ..................................................................................................................................... |
36 |
List of setup variables .............................................................................................................................. |
37 |
List of calibration setup variables ........................................................................................................... |
38 |
SETUP TRANSFER VIA HYPERTERMINAL ....................................................................................................... |
38 |
CONNECTING A MODEM................................................................................................................................ |
38 |
Xpert-Xlite Modem 8080-0005 ................................................................................................................ |
39 |
Raven Modem .......................................................................................................................................... |
39 |
DISCHARGE ................................................................................................................................................. |
41 |
WHAT THE RADAR CAN DO FOR YOU .......................................................................................................... |
41 |
DISCHARGE SETUP SEQUENCE ...................................................................................................................... |
41 |
CORRECTLY RECORDING DISCHARGE ........................................................................................................... |
41 |
Enabling The Computation ...................................................................................................................... |
41 |
Selecting the Calculation Type ................................................................................................................ |
42 |
Entering the Coefficients.......................................................................................................................... |
44 |
INSTALLATION ........................................................................................................................................... |
46 |
ELECTRICAL CONNECTIONS: ......................................................................................................................... |
46 |
MOUNT THE RADAR...................................................................................................................................... |
46 |
TARGETING THE RADAR................................................................................................................................ |
46 |
FIRMWARE UPGRADE.............................................................................................................................. |
48 |
METHODS FOR UPGRADE:.............................................................................................................................. |
48 |
Method 1: Using „UPGRADE‟ command using Hyperterm: .................................................................. |
48 |
Method 2: Using Hyperterm and „Escape‟ key: ..................................................................................... |
48 |
GPS.................................................................................................................................................................. |
49 |
TIMEKEEPING................................................................................................................................................ |
49 |
GPS INSTALLATION AND SETUP.................................................................................................................... |
49 |
GPS POSITIONING ......................................................................................................................................... |
49 |
GPS OPERATION........................................................................................................................................... |
50 |
GPS ERRORS ................................................................................................................................................ |
50 |
JUMPERS ....................................................................................................................................................... |
50 |
RJ45 TO RS232 CONNECTOR........................................................................................................................ |
51 |
Bringing the Benefits of Real-Time Data Collection to the World |
|
4

MODBUS........................................................................................................................................................ |
53 |
MODBUS MENU OPTIONS.............................................................................................................................. |
53 |
Modbus Enabled ...................................................................................................................................... |
53 |
Modbus Device ID ................................................................................................................................... |
53 |
Modbus Protocol...................................................................................................................................... |
53 |
Modbus Parity.......................................................................................................................................... |
53 |
Modbus Delay before Tx .......................................................................................................................... |
54 |
Modbus Delay after Tx............................................................................................................................. |
54 |
Modbus Baud Rate................................................................................................................................... |
54 |
MODBUS FUNCTION CODES .......................................................................................................................... |
54 |
Identifying Registers ................................................................................................................................ |
54 |
GET LOG COMMAND..................................................................................................................................... |
57 |
APPENDIX A – SPECIFICATIONS FOR THE RADAR ......................................................................... |
58 |
ORDERING INFORMATION ............................................................................................................................. |
58 |
APPENDIX B – SUTRON CUSTOMER SERVICE POLICY.................................................................. |
59 |
APPENDIX C – COMMERCIAL WARRANTY ....................................................................................... |
60 |
SUTRON MANUFACTURED EQUIPMENT ............................................................................................ |
60 |
NON-SUTRON MANUFACTURED EQUIPMENT .................................................................................. |
60 |
REPAIR AND RETURN POLICY .............................................................................................................. |
60 |
EXTENDED WARRANTY AND ON-SITE MAINTENANCE ................................................................. |
60 |
APPENDIX D – FCC INFORMATION ...................................................................................................... |
61 |
INDEX............................................................................................................................................................. |
62 |
Bringing the Benefits of Real-Time Data Collection to the World
5
Introduction
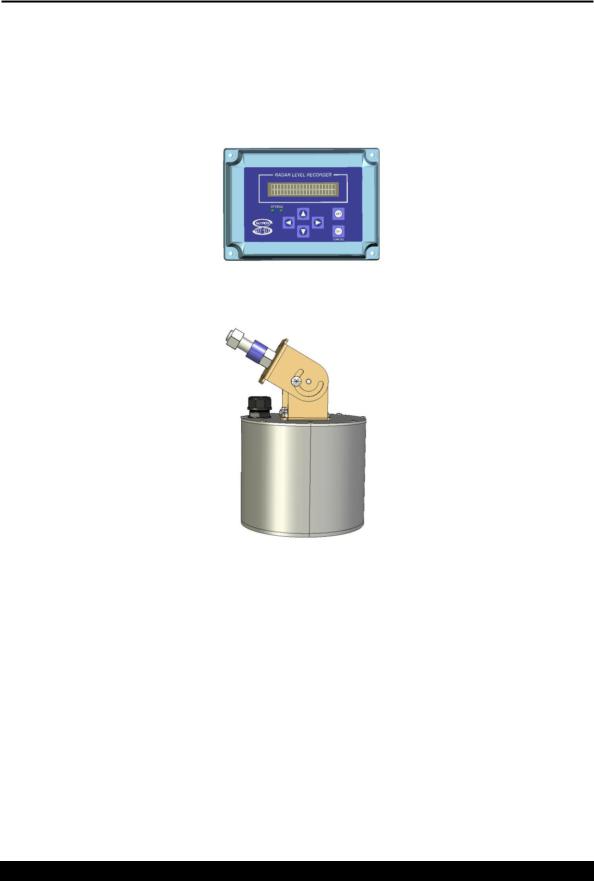
Sutron‟s Radar Level Gauge/Recorders are self-contained, precision devices for measuring stages (water level) without direct contact with the water surface. The Radar comes in three different models. The RLR- 0001-1 combines into a single package radar, antenna, keypad, display, permanent log, SDI-12 interface, RS232 interface. The RLR-0001-1 is packaged in sealed enclosure; however, the enclosure is not rugged enough to be installed outdoors without additional protection.
RLR-0001-1
RLR-0003-1
The RLR-0003-1 is an integrated unit without display. The enclosure is rugged and can be installed outdoors without additional protection. All the electronics for the radar are housed in the antenna enclosure. A 25 foot long cable provides both RS232 and SDI-12 interfaces to the radar.
The Radar Level Recorder is ideally suited for making stage (stage) measurements in rivers, streams, reservoirs, tidal, oceans and industrial areas where the sensor can be located above the water surface. Using a special pulse-echo measurement technique, the radar has a range of 60 ft.
Bringing the Benefits of Real-Time Data Collection to the World
6

The radars that have a front panel that allow a user to setup the operating parameters, monitor performance and perform tests via the front panel.
The radar is both a sensor and a logger, allowing for stand-alone and integrated applications. The log inside radar is capable of holding more than 300 000 readings, and allows the recording of status and stage (stage) data. The radar has an SDI-12 interface as well as RS232 so it can provide data to data loggers or communications equipment.
All radars provide an RS232 port that supports a simple command line mode compatible with HyperTerminal and other communications programs to display data from the log and perform some essential operating functions. It is possible to connect the radar to a modem or radio.
Features
Non-contact measurement of stage (water level).
Low power consumption (<1ma quiescent, <20ma measuring @ 12V) for long battery life.
High precision featuring 0.001 ft resolution a range of 60ft.
High accuracy 0.01ft 5- 20ft, 0.05% reading 20-60ft.
Powerful and configurable processing filters out waves (Averaging and DQAP)
Automatically saves data in permanent log
User-settable measurement, logging, and averaging
Built-in flash log for 300,000 readings safeguards your data even if power is lost
Stand-alone operation or operation with other loggers/communications via SDI-12 and RS232
Automatically computes discharge
Front panel allows full access to setup, status and data
Provides redundant data storage when connected to a logger
Bringing the Benefits of Real-Time Data Collection to the World
7

Unpacking
Remove the Radar from the shipping container and visually inspect the unit for signs of damage during shipment. Report any such damage to the factory immediately to ensure a prompt response and resolution. Retain one shipping container in the event a factory return is necessary.
Please note that if a return is required, a return material authorization (RMA) number is required. To get this RMA number, call the Sutron Customer Service Department at (703) 406-2800.
Bringing the Benefits of Real-Time Data Collection to the World
8

Cabling
RLR-0003-1
The RLR-0003-1 comes with the interface cable already connected. The interface cable provides both SDI12 and RS232 communications. DO NOT open the radar enclosure during the course of installation or maintenance as the water tight seal may be broken. The DB9 is wired as described on the following page. The SDI and power wiring is as follows:
Color |
Description |
Notes |
GREEN |
Earth |
Earth ground for protection |
WHITE |
SDI Data |
To Data Logger SDI-12 Data |
RED |
SDI +12V |
To Data Logger SDI-12 Power |
BLACK |
SDI GND |
To Data Logger SDI-12 Ground |
RED /w Black Stripe |
Backup Battery +12 |
Optional backup battery connection |
BLUE /w WHITE STRIPE |
Backup Battery GND(-) |
Optional backup battery connection |
Terminal Block – RLR-0001-1
The following table contains the pin descriptions for the terminal block. You must open the radar enclosure to access this terminal block:
Terminal Block |
Description |
Notes |
|
|
|
|
|
|
|
|
|
1 |
Earth |
Earth |
|
|
|
|
|
|
|
|
|
2 |
Data |
SDI-12 |
|
|
|
|
|
|
|
|
|
3 |
+12V |
SDI-12 |
|
|
|
|
|
|
|
|
|
4 |
GND |
SDI-12 |
|
|
Pin 8 |
|
|
|
|
|
|
5 |
|
|
|||
|
|
|
|
|
|
|
|
|
|
|
|
6 |
|
|
|
|
|
|
|
|
|
|
|
|
|
Battery power |
|
|
|
7 |
Battery +12V |
-- Not needed |
|
|
|
|
|
|
|||
when powered |
|
Pin 1 |
|
||
|
|
|
|
||
|
|
via SDI-12 |
|
|
|
|
|
|
|
|
|
|
|
Battery power |
|
|
|
8 |
Battery GND |
-- Not needed |
|
|
|
when powered |
|
|
|
||
|
|
|
|
|
|
|
|
via SDI-12 |
|
|
|
Power Connections
The radar requires external +12V power to operate. Power may be given via the battery connector (pins 7 and 8), and /or via the SDI-12 connector (pins 3 and 4). When both sets of connections are used, the radar will operate off either power source. This allows a redundant power source for the radar. The two sets of power connections are separate – current will not flow from one to the other.
Use wire that is at least 24 gauge.
When using the radar with a Satlink or other logger, you may use the SDI-12 power connection with or without the battery connection.
Bringing the Benefits of Real-Time Data Collection to the World
9

Please note that the radar battery voltage (page 20) measurement will measure the higher of the two voltages (battery and SDI-12) that can be supplied to it.
SDI-12 Connections
The SDI-12 interface has only 3 connections – GND, +12V and Data. The connections are made to the terminal block as given in the table above and as shown in the above picture. Wire all three connections directly to the SDI-12 connections on a compatible data logger. The sensor is shipped to respond to SDI-12 address 0 (the address can be changed via the front panel). See the section titled SDI-12 Sensor Operation on page 28 for more details.
Note that if operating without a logger, nothing need be connected to the SDI-12 pins.
DB9 Connector
The radar comes with a DB9F connector for connection to RS-232 devices. The DB9F can be connected to the serial port on most PCs using a straight cable. A null modem adapter is needed to connect to most PDAs and modems. This connector allows for access to the command line interface (see page 34) using a terminal program. Some modems (see page 38) and radios can be connected to this port. A logger can be programmed to use this port.
The following table shows the pin assignments of the DB9F connector.
DB9F Pin |
Name |
Notes |
|
|
|
|
|
1 |
N/C |
No Connection |
|
|
|
|
|
2 |
RXD |
Data from Radar |
|
|
|
|
|
3 |
TXD |
Data to the radar |
|
|
|
|
|
4 |
DTR |
Signal to the radar |
|
|
|
|
|
5 |
Ground |
|
|
|
|
|
|
6 |
DSR |
Signal from unit, asserted as long as unit has |
|
power |
|||
|
|
||
7 |
RTS |
Request to Send, signal to the radar |
|
|
|
|
|
8 |
CTS |
Clear to Send, signal from the radar |
|
|
|
|
|
|
|
Jumper J8 selectable for 5V (default) or VBAT |
|
9 |
VOUT |
(100ma max) - this line is usually NOT passed by |
|
|
|
a null modem |
Bringing the Benefits of Real-Time Data Collection to the World
10
Quick Install
It is very important to properly install the radar sensor. The RLR-0001-1 radar is designed to mount with the front panel display facing up. In this orientation, the radar antenna points down to the water surface. You may switch the orientation of the antenna by opening the enclosure and changing the mounting plate so the antenna points to the side of the enclosure. Do not install the RLR-0001-1 outdoors without an additional protective enclosure.
The RLR-0003-1 is designed with a 5/8” bolt for connection to a mounting arm. The bolt and the swivel bracket can be adjusted to allow the radar to point directly to the water surface no matter what the angle is of the mounting arm. The adjustments are made by loosening the two screws in the sides of the swivel bracket and also rotating the bracket relative to the bolt.
Mount the radar directly above the water surface, such that the radar beam is perpendicular to the water. The radar will not operate well if the beam strikes the water at an angle or if there objects other than the water that will reflect the signals from the radar. A circular level is provided to simplify the process of pointing the antenna at the water surface. For more details on the antenna beamwidth see Targeting the Radar on page 46. Keep in mind that the range of the sensor is up to 60 feet with a minimum of 5 feet.
After setting up the radar above the water‟s surface and providing power to the unit, use the front panel to bring up the Diagnostic > Signal Quality menu (press the up arrow several times until “Diagnostic” is displayed, then press right). Adjust the antenna pointing to the water surface for a peak signal. Additionally, you may find the command line TARGET mode useful for setting up the Radar.
Once the radar is properly mounted and indicates a good signal strength, set the stage. The stage is the first item shown on the front panel after power-up. Once the stage is shown, press set, enter the new stage, and press set again. After a few seconds, the radar will show the entered stage. Ensure that ? is not shown. If ? is shown, it means the radar does not have a good signal. Please see page 14 for more details on setting the stage.
Standalone Quick Install
The radar starts measuring and collecting data as soon as it is powered up. By default, the radar will measure and log stage every 15 minutes; each reading is averaged for 10 seconds. All of these settings and more can be changed – please refer to page 16 to learn more about how the radar measures.
Quick Install with a Logger
Radar can be connected to other devices via either SDI-12 and RS232.
For SDI-12 operation, connect the three wire interface to the properly labeled pins on the radar and setup the logger to periodically collect data from the sensor. The first parameter of the M! command
Bringing the Benefits of Real-Time Data Collection to the World
11

will provide the stage. For more details on SDI-12, please refer to the SDI-12 Sensor Operation section on page 28.
If connecting using the RS232 port, the data can be polled from the radar, or it can be automatically output by the radar. Setup the connected device (which may be a logger, a modem, or even a direct connection to a PC running HyperTerminal) for 115200 baud, 8 data bits, no parity (the baud rate can be changed via the front panel Setup > Other Settings > Baud Rate).
To poll for data, have the connected device issue a carriage return, wait for prompt, issue the
ASCII command “!MEAS” followed by a carriage return, and capture the returned data. The first data item returned is the stage.
To capture data, setup the radar for auto output via the front panel Setup > Other Settings > Auto Output. Once setup, the radar will periodically output the stage in ASCII.
Please refer to the section RS232 Command Line Interface on page 34 for more details.
Redundant Data Collection
Connect the radar via SDI-12 to a logger and setup the logger to get data from the radar.
Provide a redundant power supply to the radar (via the Battery connector).
With this setup, if the logger malfunctions, the radar will keep on collecting data.
Bringing the Benefits of Real-Time Data Collection to the World
12

Setup and Operation
Overview
Radar operates as both a sensor and a logger. As a sensor, it is capable of performing stage measurements. As a logger, it is capable of recording those stage measurements.
Radar will measure and log data as long as it has power, regardless of whether it is connected to a logger. This ensures that data is not lost if the logger malfunctions.
The digital SDI-12 interface allows for a standardized connection to a logger. SDI-12 also provides power to the radar. For full details on SDI-12, please refer to the section on page 28.
The radar can be attached to a telemetry device, such as a modem, via its RS232 port. Radar allows full access to status, setup and data via the RS232 port, using the command line interface (detailed on page 34). Loggers that do not support SDI-12 should interface via the RS232 port.
The front panel offers a means of viewing data, status, and configuring the unit. Please see page 24 for details. The RLR-0003-1 without a front panel can be setup and operated via the RS232 and/or SDI-12 interfaces.
Starting the radar
The radar starts operating as soon as power is applied. On models with displays, the green LED will flash occasionally to let you know that the radar is operational. The Radar cannot be stopped from measuring without removing power from it.
Green LED |
flashes every several seconds to indicate the radar is operating normally |
Red LED |
flashes if the radar has encountered a problem |
When the radar first starts, it may display the message “Calculating…” on the LCD. This means that the radar is in the process of taking a measurement. This message will be displayed for as long as it takes to make one measurement (see Averaging Time). The message “Error in Reading” means that the radar was unable to get valid signals from the radar.
Bringing the Benefits of Real-Time Data Collection to the World
13

Stage, Distance to Water, and Measurement Point
Ultimately, the job the radar is to compute a stage measurement. However, the direct measurement made by the radar is distance to water.
Distance to water is the length between the radar and the water surface.
Stage is the depth of water; for a river it is distance between the water surface and the riverbed.
Stage = Measurement point – Distance to water
Measurement point is the length between the radar and the riverbed (or ocean floor or well bottom).
(NOTE: Calibration of the radar unit has been made with respect to the front cover of the antenna unit.)
Bridge or Structure over Water
|
|
|
|
|
|
|
|
|
|
|
|
|
|
|
|
|
|
|
|
|
|
|
|
|
|
|
|
|
|
|
|
|
|
|
|
|
|
|
|
|
|
|
|
|
|
|
|
|
|
|
|
|
|
|
|
|
|
|
|
|
|
|
Measuring Point: |
|
|
|
|
|
|
|
|
|
|
||
|
|
|
|
|
|
|
|
|
|
|
|
|
|
|
|
|
|
|
|
|
|
|
|
|
|
|
|
|
|
|
|
|
|
|
|
|
|
|
|
|
|
|
|
|
|
|
|
|
|
|
|
|
|
|
|
|
|
|
|
|
|
|
|
|
|
|
|
|
|
|
|
|
Distance to Water |
|
|
|
|
|
|
|
Staff |
|
|
|
|
|
|
|
|
|
||||
|
|
|
|
|
|
|
|
|
|
|
|
|
|
|||||
|
|
|
|
|
|
|
|
|
|
|
||||||||
|
|
|
|
|
Gauge |
|
|
|
|
|
|
|
|
|
||||
|
|
|
|
|
|
|
|
|
|
|
|
|
|
|
|
|
||
|
|
|
|
|
|
|
|
|
|
|
|
|
|
|
|
|
|
|
|
|
|
|
|
|
|
|
|
|
|
|
|
|
|
|
|
|
|
|
|
|
|
|
|
|
|
Water Level (Stage) |
|
|
|
|
|
|
|
|
|
|
|
Stage Reading: |
|
|
|
|
|
|
|
|
|
|
|
|
|
|
|||
|
|
|
|
|
|
|
|
|
|
|
|
|
|
|
|
|
||
|
|
|
|
|
|
|
|
|
|
|
|
|
|
|
|
|
|
|
Stage
Riverbed:
Measuring Point = Stage + Distance to Water or
Stage = Measuring Point – Distance to Water
Stage is displayed on the first menu shown on the front panel. Via command line, use the “MEAS” command or the “LAST” command. Via SDI-12, use the M command.
Measurement point can be accessed via the front panel Station setup > Measurement Setup > Measurement point, via SDI-12 using the XE command, and the command line MEASURING POINT.
Setting Stage
When the radar is installed, you will typically read the current stage off a staff gauge and then set this new stage into the radar.
To set the stage via front panel, power up the radar, wait for it to show a stage reading (which will be negative until the stage is set), and the press SET. Enter the correct stage and press set again. Don‟t forget to change the sign of the stage to “+”. It is also possible to use SDI-12 XS command and command line STAGE to set the stage.
The radar compares this user entered value with its own reading and uses it to set the Measuring Point. From then on, the radar will report the stage relative to this Measuring Point – so it will match the staff gauge.
Bringing the Benefits of Real-Time Data Collection to the World
14

Alternatively, if you know the exact elevation of the radar, you can enter this elevation as the Measuring Point and the radar will automatically display the stage relative to this elevation.
Measuring Stage
The radar takes multiple samples and computes a stage from them. Each sample is itself the average of millions of radar pulses to the water surface and as such has a quality reading and signal strength associated with it. If the radar is not getting a good reflection from the water surface, the quality of the sample will be bad. If less than half of the samples were good, the quality will be set to bad. The user controls when the samples are collected and how the average is computed through the Measurement Setup settings. Please see sections on Operating Modes, Averaging and Sample Form Period for further details.
A bad quality is indicated with a “?” after the reading if using the front panel. The command line interface will say „error‟, and SDI-12 will indicate an invalid reading. In addition, the red LED will flash and the front panel will show „Error in reading‟ if the last reading was invalid. Logged data will be marked as invalid..
To see the stage, use the first menu shown on the front panel. Via command line, use the “MEAS” command. Via SDI-12, use the M command.
Signal Strength
The radar gives a signal strength expressed as a percentage 0 to 100%. The higher the number, the better the signal. Signal strength can be viewed via the front panel Diagnostic > Signal Strength.
Stage Details
In addition to providing a stage, the radar sensor can provide additional details:
average signal strength
standard deviation (of good samples)
number of good samples
total number of samples
These details can be viewed by pressing right when viewing the stage via front panel. Also, command lines MEAS and LAST, and SDI-12 M2 will reveal stage details.
In order to log all these details, make sure to enable the measurement setup field Station Setup > Measurement Setup > Log Stage Details.
Stage Units
Radar can report stage readings in feet, meters, centimeters or millimeters. Please use Station Setup > Measurement Setup > Stage units to change the units. Units are logged along with stage. They are also shown on the front panel and reported with the results of SDI-12 and command line measurements.
Right Digits
The number of digits shown after the decimal place is referred to as the Right Digits. If you would like the stage to read 10.12 rather than 10.12345, set the right digits to 2.
Bringing the Benefits of Real-Time Data Collection to the World
15

Automeasure
Automeasure refers to the radar‟s ability to automatically measure and log stage data. The user can determine when this will occur by changing Station Setup > Measurement Setup > Automeasure Interval and Offset settings. Automeasure cannot be turned off.
Automeasure time and interval determine when the radar measures and logs data.
E.g. Automeasure time 00:00:00 interval 00:10:00
00:10:00 data measured and logged
00:20:00 data measured and logged
00:30:00 data measured and logged
and every ten minutes afterwards…
E.g. Automeasure time 00:00:30 interval 00:05:00
00:00:30 data measured and logged
00:05:30 data measured and logged
00:10:30 data measured and logged
and every five minutes afterwards...
The last automeasured data can be accessed via SDI-12 and command line – please see page 18.
Operating Modes
There are two operating modes: normal and continuous:
In normal mode, radar spends its time in low power mode until it is time to measure or a measurement is requested via the front panel, RS232 or SDI-12. Once the measurement is complete, radar goes back to low power mode. This is the most commonly used mode and is recommended unless the radar will be measuring very frequently.
In the continuous mode, radar is constantly collecting data. When it is time to measure, radar will use the previously collected data to instantly come up with a stage reading. The radar does not go into low power in continuous mode. The continuous mode adds about 10 mA to the quiescent power consumption compared with 0.25mA in the normal mode. Please note that Radar can hold only 180 samples in continuous mode. If the averaging time and the sample form period are such that more than 180 samples are collected, the system will only use the last 180 samples. For example, if the averaging time is 10 minutes, and the sample form period is one second, the radar compute the r based on three and not ten minutes worth of data. Normal mode is unaffected by this limitation.
These examples illustrate the difference between continuous and normal modes:
Normal mode with 10 second averaging:
1.12:00:00 measure command is received (via SDI-12, front panel, RS232, or automeasure)
2.12:00:00 sensors are powered on and measurement starts
3.12:00:11 measurement completes with data collected between 12:00:00 and 12:00:10
4.12:00:11 sensors are powered down
Continuous mode with 10 second averaging (sensors are powered on all the time):
1.12:00:00 measure command is received (via SDI-12, front panel, RS232, or automeasure)
2.12:00:00 measurement completes with data collected from 11:59:50 to 12:00:00
Desired Effect |
Appropriate Mode |
Low power consumption |
Normal mode |
Low power consumption and immediately ready data |
Normal mode, use last measured readings (page 18) |
Immediately ready and current data |
Continuous mode |
Very frequent measurements (every 15 seconds or less) |
Continuous mode |
More than 180 samples |
Normal mode |
Operating mode can be changed via front panel Station Setup > Measurement Setup > Operating Mode, via SDI-12 XOM and via OPERATING MODE command line
Bringing the Benefits of Real-Time Data Collection to the World
16

Averaging Time
Every time the radar measures it will collect samples for a user defined period (Station Setup > Measurement Setup > Averaging Time) in order to produce a stage reading. The setting avg time determines how long to collect samples for. Averaging time can be changed via SDI-12 XT, and via AVG TIME command line.
In addition to the averaging time, the sample form period can be adjusted, allowing for control of the number of samples collected. The sample form period determines how often each sample is collected.
Two methods are offered for computing a stage from multiple samples: averaging and DQAP.
Averaging
Adding all the (good) samples and dividing the sum by the number of (good) samples will provide the average distance to water. In addition to the averaged distance to water, radar will also provide the average signal strength, the standard deviation of the good samples, the total number of samples and the number of good samples. Finally, the quality of the stage will be set to good if at least half of the samples were good. In order to log all these details, make sure to enable the measurement setup field log water details. They can also be accessed via command line or SDI-12.
Averaging is enabled by default. If DQAP is disabled, averaging is enabled (Station Setup > Measurement Setup > DQAP Enable).
DQAP
DQAP is a method defined by the NOS (National Ocean Service) of computing the stage that is designed to eliminate erroneous values from the calculation. With DQAP, the distance to water is calculated using two computations:
For the first computation, the average and standard deviation of all the samples are calculated. Then, two limits are figured: the average plus/minus three times the computed standard deviation. Each sample is then compared against the two limits. If the sample is outside the limits, it will not be used in the final computation.
In the final computation, the average and standard deviation are recomputed from all the samples remaining from the first calculation. The quality of the stage reading will be set to good if at least half of the samples were selected for the secondary computation; it will be set to bad otherwise. The good sample count of the stage reading will be set to the number of samples selected for the secondary computation.
To enable DQAP, use the Station Setup > Measurement Setup > DQAP Enable menu. If DQAP is enabled, averaging is disabled.
Sample Form Period
As mentioned in measuring stage, each sample of the stage is actually the average of millions or radar pulses to the water. The sample form period value controls how much raw radar data to include in each sample. The default value for sample form period is 1.0 second. Do not change this value without consulting with the factory. The quality of the sample depends on the number of good subsamples collected. If there are not enough good subsamples, the quality is set to bad.
The details of each sample can be viewed in the diagnostic menu. The details consist of distance to water, standard deviation, number of good and number of total subsamples, sample validity, signal strength, minimum and maximum. Each sample may be logged by activating log every sample setting.
|
Log entry |
Description |
|
|
Sample Min |
The minimum distance to water |
|
|
Sample Max |
The maximum distance to water |
|
|
Sample Avg |
The average distance to water |
|
|
Sample StdDev |
The standard deviation of all the subsamples |
|
|
Sample Good Subs |
The number of valid subsamples included in the average |
|
|
Sample Total Subs |
The total number of subsamples collected (only the good subsamples are included in |
|
|
|
computation) |
|
|
|
|
|
|
|
Bringing the Benefits of Real-Time Data Collection to the World |
|
|
|
|
|
17

Last Automeasured
Stage measurements made by the radar are not instantaneous; how long they take depends on averaging time (page 17). When a logger is communicating with the radar, it can ask the radar to make a new measurement. However, the logger then has to wait for the radar to complete the measurement.
If the user desires data that is instantly available, the radar can provide the last measured data. The radar automatically measures based on the automeasure interval (see page 16) . That data can be retrieved as the last measured data.
For example, if radar is setup to automeasure every 10 minutes, with an averaging time of 10 seconds: 12:00:00 to 12:00:10 radar measures stage
12:01:00 logger asks for last measured data; radar immediately returns 12:00:10 data 12:10:00 to 12:10:10 radar measures stage
12:11:00 logger asks for last measured data; radar immediately returns 12:10:10 data
If the user desires data that is both immediately available and current, continuous mode (page 16) is the way to go.
Last measured data can be accessed via SDI-12 M3 and via LAST command.
Discharge
Discharge is a measurement of water volume flowing over time. Please refer to the discharge section on page 41 for complete details.
Logging
A secure flash chip in the radar provides a logging capacity of more than 300,000 entries. Data will not be lost if power is removed. There is not a means of erasing data from the log. Once the log is full, the oldest data will be overwritten.
Each log entry consists of
date and time (with a second resolution)
name of the logged entry
measurement reading (optional)
measurement quality and units (optional)
The format of logged data is the Sutron Standard CSV format which was introduced in the Summer of 2009. It is a format common to current Sutron products.
The general format specification for Sutron Standard CSV format is mm/dd/yyyy,hh:mm:ss,label,data[,units,qual][,label,data[,units,qual]]
Here are several examples of log entries:
01/19/2010,09:21:49,Reset Powerup,1
01/19/2010,09:30:00,Stage,1.25,feet
01/19/2010,09:45:00,Stage,1.27,feet
01/19/2010,09:50:27,Setup Change
Minimally, radar will log stage and various events. The user can decide how often to log stage (via automeasure settings see page 15), and the user can chose to log stage details (via front panel, access Station
Bringing the Benefits of Real-Time Data Collection to the World
18

Setup>Measurement Setup>Log Stage Details), which consist of signal strength, standard deviation of samples, number of good and total samples.
Events
Occasionally, the radar will log events. Events are used to help troubleshoot the data. The following actions will cause the radar to log an event:
Setup change (whenever any setting is changed)
Log download (whenever the log is downloaded)
Display On and Display off (whenever the user wakes the unit up by pressing a button)
Command line enter (whenever the user connects via the RS232 port)
Reset (log contains reset type and count)
Errors (such as low battery and sensor failure)
Before cal and after cal (logged whenever the user sets the stage to record the stage before and after the calibration)
Log in events (if password is enabled), including failure to log in.
The log can be examined via the front panel (the Logged Data menu), or downloaded via command line (using the LOG command). SDI-12 does not provide access to the log.
Logged Measurement Time
Measurements are not instant. Once initiated, a radar measurement will take the user defined averaging time plus some overhead to complete. For example, a measurement that starts at 12:00:00, with an averaging time of 10 seconds will complete at about 12:00:11. That measurement will be logged with 12:00:00 as the timestamp. The timestamp of the logged measurement is the time the measurement was started.
Log Daily Values
The Radar log the battery voltage into at 23:59:59 each day. Whether it does is controlled by the log daily values setting (Station Setup > Other Setup > Log Daily Values).
Setup
The radar‟s setup is stored in secure memory, meaning it will not be lost if power is removed (for any time period). The setup of the radar is broken into sections: Measurement Setup, Discharge Setup, and Other Setup. All setup can be changed through any interface: SDI-12, front panel or RS232 command line.
Setting the setup to defaults (Station Setup > Other Setup > Default Setup) will reset all the settings to factory defaults.
Connecting Radar to a Logger
The radar will measure on its own schedule regardless of whether it is connected to another logger. This ensures redundancy of logged data. If the connected logger malfunctions, the radar will keep collecting data.
The digital SDI-12 interface allows for a standardized connection to a logger. SDI-12 also provides power to the radar. For full details on SDI-12, please refer to the section on page 28.
The radar can be attached to a telemetry device, such as a modem, via its RS232 port. Radar allows full access to status, setup and data via the RS232 port, using the command line interface (detailed on page 34). Loggers that do not support SDI-12 should interface via the RS232 port.
To ensure that the logs of the radar and the attached logger match (as far as stage goes), make sure that the automeasure time and interval of the radar are the same as the measurement time and interval of the logger.
Bringing the Benefits of Real-Time Data Collection to the World
19
 Loading...