

Page 1
AN2272
Application Note
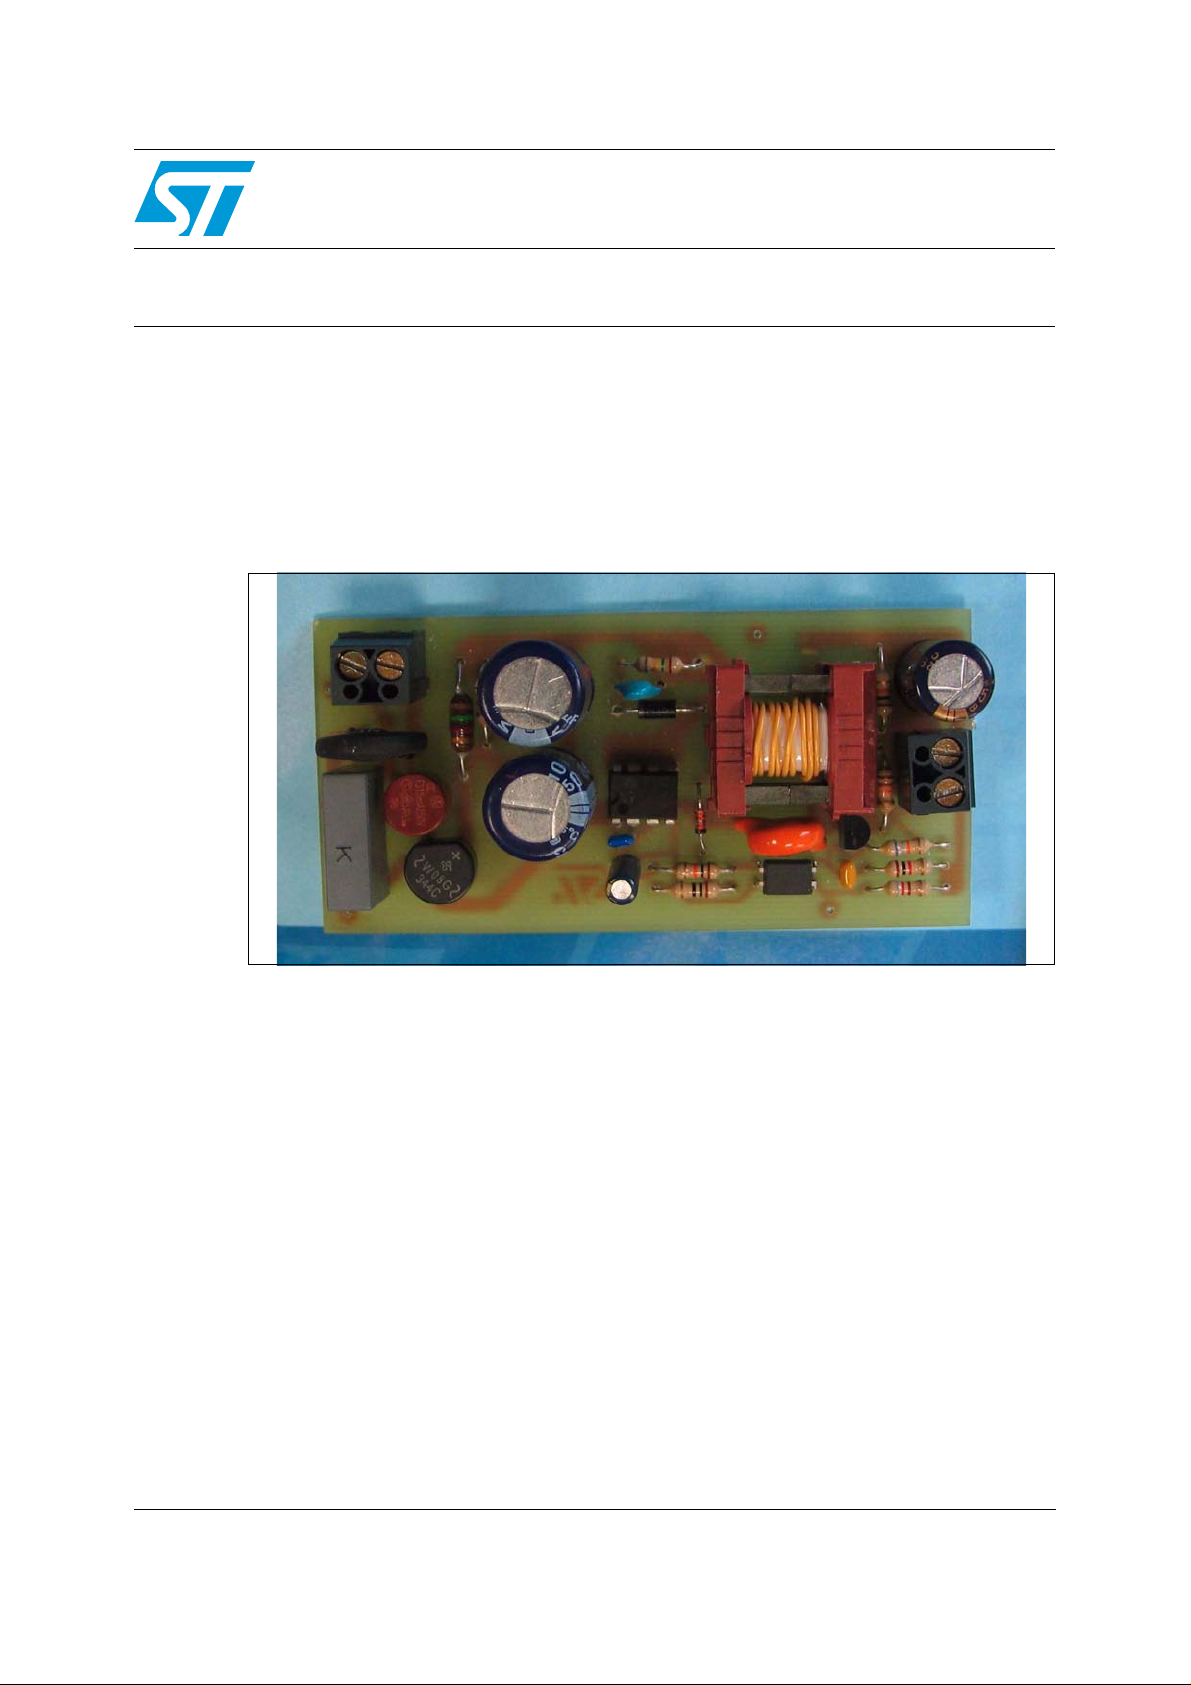
VIPer12A-based Low Power AC/DC Adapter
Introduction
This application note describes a low power , (output power of 4.1W) general purpose
adapter which is able to handle a wide range input voltages (88V
(Order Code STEVAL-ISA011V1) is based on the Viper12A monolithic device that has the
power switch as well as the basic control function needed to implement a current mode
flyback converter.
to 265VAC). The adapter
AC
February 2006 Rev . 1 1/33
www.st.com
Page 2

Table of Contents AN2272 - Application Note
Table of Contents
1 STEVAL-ISA011V1 Board Design . . . . . . . . . . . . . . . . . . . . . . . . . . . . . . 5
1.1 Primary Side . . . . . . . . . . . . . . . . . . . . . . . . . . . . . . . . . . . . . . . . . . . . . . . . 5
1.1.1 Step 1, Input Capacitor Selection . . . . . . . . . . . . . . . . . . . . . . . . . . . . . . 5
1.1.2 Step 2, Transformer Selection . . . . . . . . . . . . . . . . . . . . . . . . . . . . . . . . . 6
1.2 Secondary Side . . . . . . . . . . . . . . . . . . . . . . . . . . . . . . . . . . . . . . . . . . . . . 8
1.2.1 D11 Current and Power Dissipation . . . . . . . . . . . . . . . . . . . . . . . . . . . . . 9
1.2.2 Transformer Turns Ratio and D
1.2.3 C
Output Capacitor Selection . . . . . . . . . . . . . . . . . . . . . . . . . . . . . . . 11
11
1.3 Completed Transformer Design . . . . . . . . . . . . . . . . . . . . . . . . . . . . . . . . 12
1.4 Feedback Loop . . . . . . . . . . . . . . . . . . . . . . . . . . . . . . . . . . . . . . . . . . . . . 12
2 STEVAL-ISA011V1 Board Tests . . . . . . . . . . . . . . . . . . . . . . . . . . . . . . . 15
Peak Current . . . . . . . . . . . . . . . . . . . 10
11
2.1 Start-up Tests . . . . . . . . . . . . . . . . . . . . . . . . . . . . . . . . . . . . . . . . . . . . . . 15
2.1.1 Full Load Star t- up Waveforms . . . . . . . . . . . . . . . . . . . . . . . . . . . . . . . . 16
2.1.2 No Load Start-up Waveforms . . . . . . . . . . . . . . . . . . . . . . . . . . . . . . . . 18
2.2 Temperature Tests . . . . . . . . . . . . . . . . . . . . . . . . . . . . . . . . . . . . . . . . . . 20
2.3 Dynamic Load Regulation Tests . . . . . . . . . . . . . . . . . . . . . . . . . . . . . . . . 20
2.4 Steady-State Tests . . . . . . . . . . . . . . . . . . . . . . . . . . . . . . . . . . . . . . . . . . 23
2.4.1 Steady-State Full Load Waveforms . . . . . . . . . . . . . . . . . . . . . . . . . . . . 24
2.4.2 Steady-State No Load Waveforms . . . . . . . . . . . . . . . . . . . . . . . . . . . . . 26
2.5 EMI Tests . . . . . . . . . . . . . . . . . . . . . . . . . . . . . . . . . . . . . . . . . . . . . . . . . 28
Appendix A STEVAL-ISA011V Demo Board Schematic . . . . . . . . . . . . . . . . . . . 30
Appendix B STEVAL-ISA011V1 Bill of Materials . . . . . . . . . . . . . . . . . . . . . . . . . 31
3 Revision History . . . . . . . . . . . . . . . . . . . . . . . . . . . . . . . . . . . . . . . . . . . 32
2/33 Rev. 1
Page 3

AN2272 - Application Note List of Figures
List of Figures
Figure 1. Full Load Start-up Waveforms at 88V. . . . . . . . . . . . . . . . . . . . . . . . . . . . . . . . . . . . . . . . . 16
Figure 2. Full Load Start-up Waveforms at 265V. . . . . . . . . . . . . . . . . . . . . . . . . . . . . . . . . . . . . . . . 16
Figure 3. Full Load Start-up Waveforms at 115V. . . . . . . . . . . . . . . . . . . . . . . . . . . . . . . . . . . . . . . . 17
Figure 4. Full Load Start-up Waveforms at 230V. . . . . . . . . . . . . . . . . . . . . . . . . . . . . . . . . . . . . . . . 17
Figure 5. No Load Start-up Waveforms at 88V . . . . . . . . . . . . . . . . . . . . . . . . . . . . . . . . . . . . . . . . . 18
Figure 6. No Load Start-up Waveforms at 265V . . . . . . . . . . . . . . . . . . . . . . . . . . . . . . . . . . . . . . . . 18
Figure 7. No Load Start-up Waveforms at 115V . . . . . . . . . . . . . . . . . . . . . . . . . . . . . . . . . . . . . . . . 19
Figure 8. No Load Start-up Waveforms at 230V . . . . . . . . . . . . . . . . . . . . . . . . . . . . . . . . . . . . . . . . 19
Figure 9. Step Load Change Stability Tests at 88V. . . . . . . . . . . . . . . . . . . . . . . . . . . . . . . . . . . . . . 21
Figure 10. Step Load Change Stability Tests at 265V. . . . . . . . . . . . . . . . . . . . . . . . . . . . . . . . . . . . . 21
Figure 11. Step Load Change Stability Tests at 115V. . . . . . . . . . . . . . . . . . . . . . . . . . . . . . . . . . . . . 22
Figure 12. Step Load Change Stability Tests at 230V. . . . . . . . . . . . . . . . . . . . . . . . . . . . . . . . . . . . . 22
Figure 13. Steady-state Full Load 88V
Figure 14. Steady-state Full Load 265V
Figure 15. Steady-state Full Load 115V
Figure 16. Steady-state Full Load 230V
Figure 17. Steady-state No Load 88V
Figure 18. Steady-state No Load 265V
Figure 19. Steady-state No Load 115V
Figure 20. Steady-state No Load 230V
Figure 21. 115V
Figure 22. 115V
Figure 23. 230V
Figure 24. 230V
Line Voltage. . . . . . . . . . . . . . . . . . . . . . . . . . . . . . . . . . . . . . . . . . . . . . . . . . . . . . 28
AC
Line Neutral. . . . . . . . . . . . . . . . . . . . . . . . . . . . . . . . . . . . . . . . . . . . . . . . . . . . . . 28
AC
Line Voltage. . . . . . . . . . . . . . . . . . . . . . . . . . . . . . . . . . . . . . . . . . . . . . . . . . . . . . 29
AC
Line Neutral. . . . . . . . . . . . . . . . . . . . . . . . . . . . . . . . . . . . . . . . . . . . . . . . . . . . . . 29
AC
Figure 25. STEVAL-ISA011V1 Schematic. . . . . . . . . . . . . . . . . . . . . . . . . . . . . . . . . . . . . . . . . . . . . . 30
Waveforms. . . . . . . . . . . . . . . . . . . . . . . . . . . . . . . . . . . . . 24
AC
Waveforms. . . . . . . . . . . . . . . . . . . . . . . . . . . . . . . . . . . . 24
AC
Waveforms. . . . . . . . . . . . . . . . . . . . . . . . . . . . . . . . . . . . 25
AC
Waveforms. . . . . . . . . . . . . . . . . . . . . . . . . . . . . . . . . . . . 25
AC
Waveforms . . . . . . . . . . . . . . . . . . . . . . . . . . . . . . . . . . . . . 26
AC
Waveforms . . . . . . . . . . . . . . . . . . . . . . . . . . . . . . . . . . . . 26
AC
Waveforms . . . . . . . . . . . . . . . . . . . . . . . . . . . . . . . . . . . . 27
AC
Waveforms . . . . . . . . . . . . . . . . . . . . . . . . . . . . . . . . . . . . 27
AC
Rev. 1 3/33
Page 4

List of Tables AN2272 - Application Note
List of Tables
Table 1. Electrical Characteristics . . . . . . . . . . . . . . . . . . . . . . . . . . . . . . . . . . . . . . . . . . . . . . . . . . 15
Table 2. Start up Measures . . . . . . . . . . . . . . . . . . . . . . . . . . . . . . . . . . . . . . . . . . . . . . . . . . . . . . . 15
Table 3. Component Critical Temperatu re Measurem ent s. . . . . . . . . . . . . . . . . . . . . . . . . . . . . . . . 20
Table 4. Steady-state Full Load Condition Measurem ent s. . . . . . . . . . . . . . . . . . . . . . . . . . . . . . . . 23
Table 5. Steady-state Output Voltag e Ripple . . . . . . . . . . . . . . . . . . . . . . . . . . . . . . . . . . . . . . . . . . 23
Table 6. Bill Of Materials. . . . . . . . . . . . . . . . . . . . . . . . . . . . . . . . . . . . . . . . . . . . . . . . . . . . . . . . . . 31
Table 7. Document revision history . . . . . . . . . . . . . . . . . . . . . . . . . . . . . . . . . . . . . . . . . . . . . . . . . 32
4/33 Rev. 1
Page 5

AN2272 - Application Note STEVAL-ISA011V1 Board Design
1 STEVAL-ISA011V1 Board Design
In order to improve regulation, the feedback loop is designed to have enough bandwidth so
the converter can react on time to load changes. As is shown in the
Load Regulation Tests on page 20
, the board is able to handle high load step changes with
very low variations in the output voltage.
The flyback converter is designed to work in Discontinuous Conduction Mode (DCM) in all
operating conditions (i.e. Minimum Input Voltage, Maximum Load), because it provides
better dynamic performance.
1.1 Primary Side
1.1.1 Step 1, Input Capacitor Selection
Section 2.3: Dynamic
The first design step is to calculate the input capacitor value (C2a + C2b see
ISA011V Demo Board Schematic on page 30
).
Equation 1
is useful for this purpose:
Equation 1
C
IN
-----------------------------------------------------------------=
V
2PINΔT⋅⋅
2
AC min()pk
2
V
–
DC m in()
Where,
C
= input capacitor value,
IN
= input power,
P
IN
ΔT = the time between the two conduction cycles of the input bridge diodes,
V
AC(min)pk
V
DC(min)
In this case, th e P
= sinusoidal input waveform peaks (when AC voltage is at its minimum), and
= selected minimum input voltage required for the flyback (converter) stage.
value used is calculated as PO/η, where PO is the maximum output
IN
power and η is the overall ex pect ed efficie ncy (70% in this example).
STEVAL-
Rev. 1 5/33
Page 6

STEVAL-ISA011V1 Board Design AN227 2 - Application Note
An acceptable value for V
DC(min)
is 80% of V
Equation 2
V
DC min()
==
ΔT is expressed as:
Equation 3
1
------------------------- -
ΔT
2 π f
⋅⋅
line
Where,
ΔT = the time between the two conduction cycles of the input bridge diodes, and
f
= line frequency.
line
using
The calculated value of C
and C2b, see
This means that C
STEVAL-ISA011V Demo Board Schematic on page 30
= 20µF. This value was selected because the tolerance for an
IN
IN
Equation 1
electrolytic capacitor is usually around 20%.
1.1.2 Step 2, Transformer Selection
The next step is selecting a transformer with a Primary Inductance (LP) that allows the
system to work at the boundary between Continuous Conduction Mode (CC M) and
Discontinuous Conduction Mode (DCM). The worst case is minimum input voltage and full
load. This value is expressed as:
0.8V
AC(min)pk
AC min()pk
π arc
:
2V
AC min()
V
DC min()
⎛⎞
-----------------------------
cos–⋅=
⎝⎠
V
AC m in()pk
is 16µF. For the board, two capacitors (C2a
) of 10µF were used.
Equation 4
SW
2
L
MAX
3.5mH=⇒=
L
MAX
V
DC min()DMAX
----- ----------- ----------- ----------- ----------- ------------ -
⋅()
2PINf
⋅⋅
Where,
L
= maximum inductance for discontinuous mode operation,
MAX
V
D
P
f
V
SW
= selected minimum input voltage required for the flyback (converter) stage,
DC(min)
= maximum duty cycle,
MAX
= input power,
IN
= switching frequency (internally fixed in the VIper12A to 60kHz), and
= reflected voltage (fixed to 90V).
R
6/33 Rev. 1
Page 7

AN2272 - Application Note STEVAL-ISA011V1 Board Design
The D
at the boundary between CCM and DCM is expressed as:
MAX
Equation 5
V
D
MAX
----- ----------- ----------- ----------- ------- -
V
The transformer selected for this application provides an L
than the maximum inductance (L
MAX
R
DC m in()VR
+
D
⇒
MAX
0.47==
of 3mH, whic h is a little les s
P
) calculated in the first equation (3.5mH). This ensures
that the system is not working at boundary and will always func tion in DC M.
Using the transformer’s L
● Peak Primary Current, expressed as,
, the designer can calculate the:
P
Equation 6
2P
⋅
I
PEAK
IN
----- ----------- -------- -
fSWL
⋅
I
⇒
PEAK
P
258m A==
Where,
I
= peak primary current,
PEAK
= input power,
P
IN
= switching frequency, and
f
SW
= primary inductan ce.
L
P
● actual Maximum Duty Cycle (D
), expressed as,
MAX
Equation 7
D
MAX
⋅⋅⋅
------ ----------- ----------- ----------- ---------- -
f
SWLP
P
⋅
D
MAX
0.42=⇒=
2PINfSWL
and
● the primary side Root Mean Square (RMS) current value (I
PRMS(max)
), which is the
current that flows through the main switch and primary winding. It is expressed as:
Equation 8
D
I
PRMS max()IPEAK
MAX
------ ----------- -- I
3
PRMS max()
97m A=⇒⋅=
Where,
I
PRMS(max)
= Primary Current root mean square,
Rev. 1 7/33
Page 8

STEVAL-ISA011V1 Board Design AN227 2 - Application Note
The conduction losses in the main switch depend on the VIPer12A I
resistance, and are expressed as:
Equation 9
Where,
P
VIPer12A
r
ds(on)
= VIPer12A conduction losses, and
= VIPer12A ON resistance.
1.2 Secondary Side
In order to select the output rectifier (secondary) diode D11, the designer needs to know the
maximum reverse voltage that the diode has to sustain, as well as the average and root
mean square of the current flowing through it (see
page 30
Equation 10
). V
is calculated as follows:
R(max)
P
VIPer12Ards on()
V
Rmax()VOUT
PRMS(max)
2
I
⋅=
PRMS max()
STEVAL-ISA011V1 Schematic on
V
OUT
------- ---------- -
V
⋅+=
R
DC m ax()
V
and ON
Where,
V
V
V
V
= maximum reverse vo ltage,
R(max)
= output voltage,
OUT
= reflected voltage, and
R
DC(max)
= selected maximum input voltage.
A commonly used selection method is to choose a diode with a 40% to 50% safety margin
from the value given by the V
calculation when a Schottky diode is used, or a safety
R(max)
margin of 20% to 30% if a standard “fast” diode is used. The safety margin prevents diode
breakdown from oscillation caused by circuit parasitic elements (e.g. transformer secondary
inductance leakage or parasitic diode capacitance) when the MOSFET is turned ON.
If the calculated V
the D
value is about 34V. This makes the STPS340U (with 40V breakdown voltage) an
11
is 23V and a Schottky diode is used (adding a 50% safety margin),
R(max)
excellent choice for this application.
8/33 Rev. 1
Page 9

AN2272 - Application Note STEVAL-ISA011V1 Board Design
1.2.1 D11 Current and Power Dissipation
● The average current flowing through D
is the output current while the I
11
expressed as:
Equation 11
I
DRMSIPKS
⋅=
Where,
I
= current root mean square,
DRMS
= peak current at secondary winding, and
I
PKS
D
For one output flyback, I
= conduction duty cycle of the secondary diode.
s_cond
(peak current at the secondary winding) can be calculated
PKS
as the primary peak current multiplied by the turns ratio.
Note: This formula applies only to DCM operation.
● D
power dissipation is calculated as follows:
11
Equation 12
P
lossDVdDIDavg()rdD
Where,
P
= diode power dissipation,
lossD
= drop voltage (when the diode is forward-biased),
V
dD
= diode average current, and
I
D(avg)
= dynamic resistance.
r
dD
Note: The formula and the correct values for V
DRMS
D
s cond
–
-------------------- 3
2
I
⋅+⋅=
DRMS
and rdD are in the diode datasheets.
dD
value is
Rev. 1 9/33
Page 10

STEVAL-ISA011V1 Board Design AN227 2 - Application Note
1.2.2 Transformer Turns Ratio and D11 Peak Current
● The turns ratio that is selected for the transformer depends on the output voltage, the
chosen reflected voltage, and the average voltage drop across the output diode.
Keeping in mind the voltage drop across its dynamic resistance, V
expressed as:
Equation 13
DROP(avg)
is
V
DROP avg()VdDrdD
Where,
V
DROP(avg)
= drop voltage (when the diode is forward-biased),
V
dD
= dynamic resistance,
r
dD
= diode output current, and
I
O
● Using the calculated V
= average voltage drop (across the output diode)
DROP(avg)
Equation 14
N
P
------N
S
Where,
N
= Primary Turns,
P
= Secondary Turns,
N
S
= reflected voltage, and
V
R
= output voltage.
V
O
● Using the calculated turns ratio, I
Equation 15
+ I
⋅=
O
value, the turns ratio is expressed as:
V
----------------------------------------------=
VOV
is then expressed as:
PKS
I
PKS
R
+
DROP avg()
N
P
-------
⋅=
I
PKP
N
S
Where,
I
= peak current at secondary winding, and
PKS
= peak power current
I
PKP
Note: The worst case (maximum power dissipation) will be in full load condition.
● The D
conduction duty cycle is expressed as:
11
Equation 16
D
scond
–
Where,
D
L
f
10/33 Rev. 1
= Secondary Diode conduction duty cycle,
s_cond
= primary inductan ce, and
P
= switching frequency.
SW
I
⋅⋅
PKPLPfSW
------ ----------- ----------- ----------- ----- -=
V
R
Page 11

AN2272 - Application Note STEVAL-ISA011V1 Board Design
1.2.3 C11 Output Capacitor Selection
The output capacitor selection (C11, see
depends on the output voltage ripple specification (ΔV
STEVAL-ISA011V1 Schematic on page 30
= 300mV), and the ripple current
O
)
rate of the capacitor itself. The output voltage ripple is mainly due to the Equivalent Series
Resistor (ESR), so we have to select a capacitor with an ESR lower than the maximum
allowed ESR value:
Equation 17
ΔV
ESR
MAX
---------------=
I
PKS
O
Where,
ESR
ΔV
I
PKS
= maximum allowed ESR rating,
MAX
= output voltage ripple, and
O
= peak current at secondary winding.
The AC component of the current flowing through the output diode is also that of the current
flowing through the capacitor. The C11 capacitor current rate has to be higher than the
calculated current, which is expressed as:
Equation 18
I
CAPRMS
2
I
DRMS
2
I
–=
O
Where,
I
CAPRMS
I
DRMS
I
O
= capacitor current root mean square,
= diode current root mean square, and
= output current.
The MBZ Type 1500 μF 10V by RUBYCON capacitor was selected for this application.
Rev. 1 11/33
Page 12

STEVAL-ISA011V1 Board Design AN227 2 - Application Note
1.3 Completed Transformer Design
All of the calculations for the transformer design are complete. They include:
● Primar y Inducta nce,
● Turns Ratio, and
● Winding Current Values (RMS, Average, and Peak).
Notes:
1. In order to prevent transformer saturation during the start-up phase, the current limit of
the VIPer12A (I
= 480mA, see datasheet for details) must be considered as the peak
LIM
current.
2. For thermal limits (power dissipated in the magnetic core), the peak current (calculated
in
Equation 6: on page 7
) must be used.
3. The RMS value of the current flowing through the windings is used first fo r calculating
the power dissipated in the windings, then fo r winding size selection.
The transformer (reference number SRW16ES_E44H013) was designed and manufactured
by TDK using aforementioned the data.
1.4 Feedback Loop
The transfer function 'control-to-output' for a flyback converter operating in DCM is given by
the following formula:
Equation 19
s
⎛⎞
1
--------+
⎝⎠
z
fly
s()ΔIFBs()⁄ G
ΔV
O
----------------------- -
⋅=
fly
s
⎛⎞
-------- -+
1
⎝⎠
p
fly
Where,
ΔV
= output voltage ripple,
O
= VIPer12A feedback pin current,
ΔI
FB
= flyback gain,
G
fly
= flyback zero compensation reference,
z
fly
= flyback pole reference, and
p
fly
12/33 Rev. 1
Page 13

AN2272 - Application Note STEVAL-ISA011V1 Board Design
Using the VIPer12A input current (IFB) to the feedback pin and G
values,
fly
Equation 20
V
O
fly
------ ----
I
PK
G
⋅=
ID
G
Where,
= flyback gain,
G
fly
= voltage output,
V
O
= primary peak current, and
I
PK
= feedback current-to-drain current gain (see VIPer12A datasheet for details).
G
ID
● The flyback pole value is expressed as:
Equation 21
p
----- ----------- ----------- ----------- ----------- ----------- ----------- ---------- -=
fly
C
OUTRL
2
2ESR
⋅+()⋅
OUT
Where,
p
= flyback pole reference,
fly
= output capacitor (see C11,
C
OUT
= inductor resistance, and
R
L
ESR
● The flyback zero value (for two poles, one zero compensation network) is expressed
= equivalent series resistor output.
OUT
STEVAL-ISA011V1 Schematic on page 30
),
as:
Equation 22
OUT
1
ESR
⋅
OUT
z
fly
------------------------------------------- -=
C
Where,
z
= flyback zer o.
fly
One pole is located at zero frequency in order to maximize the precision of the
regulation. Compensation zero was used in order to compensate the p
it has to be located between one-half and double the p
frequency. The last pole of the
fly
compensation network is used to compensate flyback zero due to the ESR.
and, typically,
fly
Rev. 1 13/33
Page 14

STEVAL-ISA011V1 Board Design AN227 2 - Application Note
● Loop Gain crossover frequency is the last calculation required to define the
compensation network. In this design, the crossover frequency selected is as high as
2.5kHz to provide the converter with good bandwidth.
The Transfer Function output control is expressed as:
Equation 23
1sR9C
ΔI
FB
------- ----------- ------
ΔV
O
s()
s()
CTR
------ ----------- ----------- -------
R
⋅⋅
6R8C8
----- ----------- ----------- ----------- ----------- --------- -
⋅=
s1sRFBC
⋅⋅+()
8
⋅⋅+()⋅
5
Where,
ΔI
= VIPer12A feedback pin current,
FB
= output voltage ripple,
ΔV
O
CTR = optocoupler Current Transfer Ratio
= VIPer12A feedback pin input impedance.
R
FB
Note: Using these resistance and capacitance values as guidelines will provide the
user with a stable loop as well as the required converter bandwidth.
14/33 Rev. 1
Page 15

AN2272 - Application Note STEVAL-ISA011V1 Board Tests
2 STEVAL-ISA011V1 Board T ests
The tests performed with the STEVAL-ISA011V1 demo board are used to evaluate the
converter behavior in terms of:
● efficiency,
● safe operating area of the devices,
● line regulation, and
● load regu lation.
2.1 Start-up Tests
The diagnostic board will handle a wide range of AC input voltage (88VAC to 265VAC), and
its maximum output power is 4.1W with one output of 4.5V. Its maximum output current is
900mA (see
For flyback conv erters, the most critical conditions for the main switch in terms of Maximum
Drain Current and of Maximum Drain Voltage (when no abnorm al event occurs), are those
that exist during the start-up phase. The maximum values for drain voltage and current are
measured in both full load and no load conditions (the two extreme points in terms of load),
and for minimum, maximum, and nominal input voltages (see
Table 1
).
Table
).
All the measured values are within the rated maximum values of the VIPer12A so they are
not critical for device operation.
Table 1. Electrical Characteristics
Symbol Description Limits or Value Units
V
AC(max)
V
AC(min)
V
O
ΔV
O
I
O
η230
η115
Table 2. Start up Measures
V
(V
INAC
88 352 353 0.460 0.458
115 393 401 0.472 0.470
230 581 581 0.507 0.505
Maximum AC Input Voltage 265V
Minimum AC Inpu t Voltage 88V
RMS
RMS
Output Voltage 4.5 V
Maximum Output Vol tage Ripple 300 mV
Maximum Output Current 900 mV
Efficiency (at f ull Load and 230V
Efficiency (at f ull Load and 115V
V
DRAIN(max)
RMS
)
Full lo a d No load Full loa d No load
)
AC
)
AC
(V) I
70 %
70 %
DRAIN(max)
(mA)
V
V
265 638 633 0.515 0.515
Rev. 1 15/33
Page 16

STEVAL-ISA011V1 Board Tests AN227 2 - Application Note
2.1.1 Full Load Start-up Waveforms
Figure 1, Figure 2, Figure 3
, and
Figure 4 on page 17
show the most pertinent waveforms
that occur during the circuit start-up phase when it is in Full Load condition, for the minimum
(88V
), maximum (265VAC), and nominal voltages (115VAC and 230VAC).
AC
Figure 1. Full Load Start-u p Waveforms at 88V
Notes: Cyan/Blue (Ch2) = drain current,
Green (Ch4) = output voltage,
Magenta/Red (C h3) = auxiliary output vol tage for the VIPer12A self-supply (on V
Yellow (Ch1) = drain voltage.
pin), and
DD
Figure 2. Full Load Start-u p Waveforms at 265V
Notes: Cyan/Blue (Ch2) = drain current,
Green (Ch4) = output voltage,
Magenta/Red (C h3) = auxiliary output vol tage for the VIPer12A self-supply (on V
Yellow (Ch1) = drain voltage.
pin), and
DD
16/33 Rev. 1
Page 17

AN2272 - Application Note STEVAL-ISA011V1 Board Tests
Figure 3. Full Load Start-u p Waveforms at 115V
Notes: Cyan/Blue (Ch2) = drain current,
Green (Ch4) = output voltage,
Magenta/Red (C h3) = auxiliary output vol tage for the VIPer12A self-supply (on V
Yellow (Ch1) = drain voltage.
pin), and
DD
Figure 4. Full Load Start-u p Waveforms at 230V
Notes: Cyan/Blue (Ch2) = drain current,
Green (Ch4) = output voltage,
Magenta/Red (C h3) = auxiliary output vol tage for the VIPer12A self-supply (on V
Yellow (Ch1) = drain voltage.
Rev. 1 17/33
pin), and
DD
Page 18

STEVAL-ISA011V1 Board Tests AN227 2 - Application Note
2.1.2 No Load Start-up Waveforms
Figure 5, Figure 6, Figure 7
(
Section 2.1.1
the minimum (88V
) as they occur during the circuit start-up phase when no load is applied, for
), maximum (265VAC), and nominal voltages (115VAC and 230VAC).
AC
, and
Figure 8 on page 19
show th e sam e wave fo rms
Figure 5. No Load Start-up Waveforms at 88V
Notes: Cyan/Blue (Ch2) = drain current,
Green (Ch4) = output voltage,
Magenta/Red (C h3) = auxiliary output vol tage for the VIPer12A self-supply (on V
Yellow (Ch1) = drain voltage.
pin), and
DD
Figure 6. No Load Start-up Waveforms at 265V
Notes: Cyan/Blue (Ch2) = drain current,
Green (Ch4) = output voltage,
Magenta/Red (C h3) = auxiliary output vol tage for the VIPer12A self-supply (on V
Yellow (Ch1) = drain voltage.
pin), and
DD
18/33 Rev. 1
Page 19

AN2272 - Application Note STEVAL-ISA011V1 Board Tests
Figure 7. No Load Start-up Waveforms at 115V
Notes: Cyan/Blue (Ch2) = drain current,
Green (Ch4) = output voltage,
Magenta/Red (C h3) = auxiliary output vol tage for the VIPer12A self-supply (on V
Yellow (Ch1) = drain voltage.
pin), and
DD
Figure 8. No Load Start-up Waveforms at 230V
Notes: Cyan/Blue (Ch2) = drain current,
Green (Ch4) = output voltage,
Magenta/Red (C h3) = auxiliary output vol tage for the VIPer12A self-supply (on V
Yellow (Ch1) = drain voltage.
Rev. 1 19/33
pin), and
DD
Page 20

STEVAL-ISA011V1 Board Tests AN227 2 - Application Note
2.2 Temperature Tests
These tests verify the board’s device and component temperatures.
temperatures (the most stress measured, in terms of power dissipation) for the board’s main
components.
Note: The tests were performed at 25°C (ambient temperature), in Full Load conditions.
Table 3. Component Critical Temperature Measurements
V
(V
RMS
)
INAC
88V 38 37 36 45 °C
115V 39 36 37 45 °C
230V 42 38 38 45 °C
265V 45 35 39 45 °C
VIPer12A T ransformer Clamp Resistor Output Diode Units
2.3 Dynamic Load Regulat ion Tests
These tests monitor and verify the stability and quality of the system response to load
changes, in terms of speed and overshoot.
Figure 11
load changes, for the minimum (88V
and 230V
, and
Figure 12 on page 22
).
AC
AC
During these tests, load changes from a minimum of 180mA to a maximum of 900mA are
applied to the circuit as squarewaves, with 3ms periods and a duty cycle of 50%.
● The output voltage (Ch3) has a variation of some tenths of a mV (about 40mV), with
some mV overshoots. These results indicate very good dynamic behavior on the part of
the system.
● The VIPer12A feedback pin voltage (Ch1) in
input voltage is 265V
, the load is 180mV (its minimum value) while the output and
AC
feedback pin voltages show some oscillation. This oscill ation is not relat ed to a low
phase margin of the Loop Gain, but is related to the VIPer12A Burst mode operation.
Note: Even with the oscillation, the output voltages are still regulated well.
Figure 9
show the waveforms as they occur during the circuit
), maximum (265VAC), and nominal voltages (115VAC
Table 3
, and
Figure 10 on page 21
Figure 10 on page 21
shows critical
, and
shows that when the
20/33 Rev. 1
Page 21

AN2272 - Application Note STEVAL-ISA011V1 Board Tests
Figure 9. Step Load Chang e Stab ility Tests at 88V
Notes: Magenta /R ed (Ch3) = output voltage (set to 50mV/division),
Yellow (Ch1) = V IPer12A f eedback pin voltage, and
Cyan/Blue (Ch2) = output (load) current.
Figure 10. Step Load Change Stability Tests at 265V
Notes: Magenta/Red (Ch3) = output voltage,
Yellow (Ch1) = feedback pin voltage, and
Cyan/Blue (Ch2) = output current.
Rev. 1 21/33
Page 22

STEVAL-ISA011V1 Board Tests AN227 2 - Application Note
Figure 11. Step Load Change Stability Tests at 115V
Notes: Magenta/Red (Ch3) = output voltage,
Yellow (Ch1) = feedback pin voltage, and
Cyan/Blue (Ch2) = output current.
Figure 12. Step Load Change Stability Tests at 230V
Notes: Magenta/Red (Ch3) = output voltage,
Yellow (Ch1) = feedback pin voltage, and
Cyan/Blue (Ch2) = output current.
22/33 Rev. 1
Page 23

AN2272 - Application Note STEVAL-ISA011V1 Board Tests
2.4 Steady-State Tests
These tests evaluate the converter’s behavior (see
● converter efficiency for the minimum (88V
voltages (115V
● output voltage quality (Static Load regulation, where voltage output is measured in both
and 230VAC),
AC
Table 4
), maximum (265VAC), and nominal input
AC
). The measurements include:
full load and no load conditions), and
● voltage ripple which is superimposed on the output voltage at the switching frequency
(see
Table 5
).
Note: The tests were performed in Full Load conditions.
Table 4. Steady-state Full Load Condition Measurements
V
(V
INAC
)P
RMS
88V 5.9 4.13 4.59 70
115V 5.9 4.13 4.59 70
230V 5.9 4.13 4.59 70
265V 6.1 4.13 4.59 68
Table 5. Steady-state Output Vo ltage Ripple
Input Voltage (V
(W) P
IN
) ΔVO at Full Load
RMS
(W) VO (V) η (%)
OUT
88V 210mV
115V 214mV
230V 215mV
265V 220mV
Rev. 1 23/33
Page 24

STEVAL-ISA011V1 Board Tests AN227 2 - Application Note
2.4.1 Steady-State Full Load Waveforms
Figure 13
and
Figure 14
, and
Figure 15
and
Figure 16 on page 25
show the waveforms that
occur during converter steady-state testing when it is in Full Load condition, for the minimum
(88V
Figure 13. Steady-state Full Load 88V
Notes: Magenta/Red (Ch3) = output voltage,
), maximum (265VAC), and nominal voltages (115VAC and 230VAC).
AC
Waveforms
AC
Green (Ch4) = drain voltage, and
Cyan/Blue (Ch2) = drain current.
Figure 14. Steady-state Full Load 265VAC Waveforms
Notes: Magenta/Red (Ch3) = output voltage,
Green (Ch4) = drain voltage, and
Cyan/Blue (Ch2) = drain current.
24/33 Rev. 1
Page 25

AN2272 - Application Note STEVAL-ISA011V1 Board Tests
Figure 15. Steady-state Full Load 115VAC Waveforms
Notes: Magenta/Red (Ch3) = output voltage,
Green (Ch4) = drain voltage, and
Cyan/Blue (Ch2) = drain current.
Figure 16. Steady-state Full Load 230VAC Waveforms
Notes: Magenta/Red (Ch3) = output voltage,
Green (Ch4) = drain voltage, and
Cyan/Blue (Ch2) = drain current.
Rev. 1 25/33
Page 26

STEVAL-ISA011V1 Board Tests AN227 2 - Application Note
2.4.2 Steady-State No Load Waveforms
Figure 17
and
Figure 18
, and
Figure 19
and
Figure 20 on page 27
show the waveforms that
occur during converter steady-state testing when it is in No Load condition, for the minimum
(88V
Figure 17. Steady-state No Load 88V
Notes: Magenta/Red (Ch3) = output voltage,
), maximum (265VAC), and nominal voltages (115VAC and 230VAC).
AC
Waveforms
AC
Green (Ch4) = drain voltage, and
Cyan/Blue (Ch2) = drain current.
Figure 18. Steady-state No Load 265VAC Waveforms
Notes: Magenta/Red (Ch3) = output voltage,
Green (Ch4) = drain voltage, and
Cyan/Blue (Ch2) = drain current.
26/33 Rev. 1
Page 27

AN2272 - Application Note STEVAL-ISA011V1 Board Tests
Figure 19. Steady-state No Load 115VAC Waveforms
Notes: Magenta/Red (Ch3) = output voltage,
Green (Ch4) = drain voltage, and
Cyan/Blue (Ch2) = drain current.
Figure 20. Steady-state No Load 230VAC Waveforms
Notes: Magenta/Red (Ch3) = output voltage,
Green (Ch4) = drain voltage, and
Cyan/Blue (Ch2) = drain current.
Rev. 1 27/33
Page 28

STEVAL-ISA011V1 Board Tests AN227 2 - Application Note
2.5 EMI Tests
Pre-compliant tests with European Normative EN55022 for electromagnetic interference
(EMI) were performed.
illustrate that the conducted EMI induced by the converter to the main are below the
normative limits.
Figure 21
and
Figure 22
, and
Figure 23
and
Figure 24 on page 29
Figure 21
Note:
to 30MHz frequency range.
Figure 21. 115V
Figure 22. 115V
through
Line Voltage
AC
Line Neutra l
AC
Figure 24
show the Input current spectrum to be inside the 150kHz
28/33 Rev. 1
Page 29

AN2272 - Application Note STEVAL-ISA011V1 Board Tests
Figure 23. 230V
Figure 24. 230V
Line Voltage
AC
Line Neutra l
AC
Rev. 1 29/33
Page 30

STEVAL-ISA011V Demo Board Schematic AN2272 - Application Note
Appendix A STEV AL-ISA011V Demo Board Schematic
Figure 25. STEVAL-ISA011V1 Schematic
J2
1
2
R7
12.5k
4
6
7
8
R4
10E
D2
D3
D4
Viper12A
R8 10k
1% Precision
Resistor
R5
1k
U5
R6
560
VDD D1
FB
S2
S1
PC817
12
4
3
C4
10µF
45
3
2
1
U2
R9 56k
C8 100nF
U3
TL431
10k R2
C5
1% Precision
Resistor
3
21
33nF
C7 2.2nF Y1
4.5V - 0.9A
C11
1.5mF 10V MBZ Rubycon
+
D11 STPS340U
8
7
T1
1
2
R1
12k 1/4W
C3
150pF 400V
3
D5
STTH1R06
D3 1N4148
+
C2b
10µF 400V
R3 1.5k
L12 1.5mH 0.25
C2a
10µF 400V
4
1
D4
1A 600V Bridge
3
–+
2
30/33 Rev. 1
F1 315mA
0.1µF CX2 cap
1
2
J3
C1
CON2
NTC1 33
AI12225
Page 31

AN2272 - Application Note STEVAL-ISA011V1 Bill of Materials
Appendix B STEVAL-ISA011V1 Bill of Materials
Table 6. Bill Of Materials
Item Qty Reference Value
1 1 C1 0.1uF CX2 cap
2 2 C2a, C2b 10uF 400V
3 1 C3 150pF 400V
4 1 C4 10uF
5 1 C5 33nF
6 1 C6 47pF 400V
7 1 C7 1.8nF Y1
8 1 C8 100nF
9 1 C11 1.5mF 10V MBZ (10X16) Rubycon (L ow ESR Capacitor)
10 1 D3 1N4148
11 1 D4 1A 600V Bridge
12 1 D5 STTH1R06 STMicroelectronics Part
13 1 D11 STPS340U (SMB Package) STMicroelectronics Part
14 1 F1 250mA
15 1 L12 1.5mH 0.25A
16 1 NTC1 33
17 1 R1 12K 1/4W
18 2 R2 10k
19 1 R3 1.5k
20 1 R4 10E
21 1 R5 1k
22 1 R6 560
23 1 R7 12.5k 1% Pr ecision Resistor
24 1 R8 10k 1% Precision Resistor
25 1 R9 56k
26 1 T1 TDK SRW16ES_E44H013
27 1 U2 VIPer12A (ST Part)
28 1 U3 TL1431 (ST Part)
29 1 U4 PC817
Ω
Rev. 1 31/33
Page 32

Revision History AN2272 - Application Note
3 Revision History
Table 7. Document revision history
Date Revision Changes
2-February-2006 1 First edition
32/33 Rev. 1
Page 33

AN2272 - Application Note
Information furnished is believed to be accurate and reliable. However, STMicroele ctronics assumes no responsibilit y for th e consequences
of use of such information nor for any infringement of patents or other rights of third parties which may result from its use. No license is granted
by implica tion or otherwise under any patent or patent rights of STMi croelectro ni cs. Specifications mentioned in th is publication are subject
to change without notice. This publication supersedes and replaces all information previously supplied. STMicroelectronics products are not
authorized for use as cri tical compo nents in life s upport devic es or system s w ithout express written approval of STMicroel ectronics.
The ST logo is a registered t rademark of S T M i croelectr oni cs.
All other nam es are the pro p erty of their respectiv e owners
© 2006 STMi croelectronics - All ri ghts reserved
STMicroelectron ics group of co m panies
Austra l i a - Be l gi um - Brazil - Canada - Chi na - Czech Republic - Finl and - Franc e - Germany - Ho ng Kong - India - Israel - It al y - Japan -
Malaysi a - M al ta - Morocco - Singapore - Spain - Sweden - Swit zerland - Un i ted Kingdom - Uni ted States of America
www.st.com
Rev. 1 33/33
 Loading...