

Page 1

SPSS Maps™ 10.0
Page 2

For more information about SPSS® software pro du cts, please visit ou r WWW site at http://www.spss.com or contact
Marketing Department
SPSS Inc.
233 South Wacker Drive, 11th Floor
Chicago, IL 60606-6307
Tel: (312) 651-3000
Fax: (312) 651-3668
SPSS is a registered trademark and the other product names are the tradema rks of SPSS Inc . fo r its propriet a ry
computer software. No mat er ia l describing such software may be produced or distributed without the written
permission of the owners of the tra de m ark and license rights in the software and the copyrights in the published
materials.
The SOFTWARE and documentation are provided with RESTRICTED RIGHTS. Use, duplication, or disclosure by
the Government is subject to res trictions as set for th in subdivision (c ) (1 )(ii) of The Rights in Technica l Data and
Computer Software clause at 52.227-7013 . Contractor/manufacturer is SPSS Inc., 233 South Wacker Drive, 11th
Floor, Chicago, IL 60606-6307.
General notice: Other product names mentioned herein are used for identification purposes only and may be
trademarks of th eir respective companies.
TableLook is a trademark of SPSS Inc.
Windows is a registered trademark of Microsoft Corporation.
®
ImageStream
Graphics & Presentation Filters, copyright © 1991–1999 by INSO Corporation. All Rights Reserved.
ImageStream Graphics Filters is a registered trademark and ImageStream is a trademark of INSO Corporation.
™
MapInfo MapX
is a proprietary trademark of MapInfo Corporation, Troy, NY, and is licensed to SPSS by MapInfo.
Copyright © 1999 by Clarit a s Inc. This product contains proprietary and conf ide n t ia l pr ope rt y of Claritas Inc.
Unauthorized use, includin g copying of this product, is expressly prohibited.
Data have been provided for SPSS Maps by MapInfo.
Data have been provided for MapX by the following vendors:
GisNET data licensed to MapInfo by GISdata Limited. Copyright © by GDC Ltd ., 1993.
Copyright © 1995 by Geog raphic Data Technology, Inc.
Polk, Detroit, MI.
Copyright © by United Nations Demographic Yearbook, 1994.
Data copyrighted and produced by GEODAN, BV, Amsterdam NL and GisNET data l icensed to MapInfo by GISdata
Limited. Copyright © by GDC Ltd., 1993.
™
SPSS Maps
10.0
Copyright © 1999 by SPSS Inc.
All rights reserved.
Printed in the United States of America.
No part of this publication may be reproduced, stored in a retrieval system, or tra nsm it te d, in an y form or by any
means, electronic, mech anical, photocopying, recording, or othe rw ise , without the prior written permission of the
publisher.
2 3 4 5 6 7 8 9 0 04 03 02 01 00
ISBN 1-56827-231-6
Page 3

Preface
If your data have a geographical component, SPSS Maps™ 10.0 can display it in the
most natural and effective way—in a map. You can create range, graduated symbol,
and dot density maps to sh ow where probl ems or op portunities are concentr ated. You
can place bar or pie charts to compare variables or show a breakdown, such as how
agricultural, manufacturing, and service components contribute to the economics of
each area. And you can combine these themes into maps that pack a wealth of
information into one easily interpreted page. After you have created your map, you
can modify it to emphasize the most important information and customize it for
presentation.
SPSS Maps uses map-drawing software from industry-leading MapInfo that
ensures quality of presentation and availability of map data (geosets) for almost any
area of the world. The software comes with a number of these geosets, and you can
obtain additional geosets directly from SPSS or from other suppliers who have
adopted the MapInfo format. These geosets are flexibly configured as sets of layers
that allow you to show and hide feat ures a s you zoom i n and ou t of the map. You can
combine these layers into different sets for special purposes, and you can create
custom layers that show , for example, the locat ion of every hot el in a particular c hain.
Because SPSS Maps is an option t o the SPSS Base software, you have available all
of the data analysis and manipulation power of the SPSS syst em to prepare your data
for display. As long as the data contain some information to identify location—a
country, state, or postal code—you can map it. And you can quickly create ratios
between variables or more complex calculations—perhaps the outliers from a
statistical analysis—to o btain exactly the right information to display. See the SPSS
Base User’s Guide for information on these ca pab ilities.
This manual contains instructions for creating maps and editing them. It also
contains a complete reference to the command language used to create maps both in
online sessions and in production j obs. The softwar e includes a t utori al that prov ides
a quick introduction to the way SPSS Maps works with your data and geoset
information to produce a map. It also offers an extensive Help system that makes most
of the information in this manual available online.
iii
Page 4

Installation
To install SPSS Maps, follow the instructions for adding and removing features in the
installation instructions supplied with the SPSS Base. (To start, double-click on the
SPSS Setup icon.)
Compatibility
The SPSS system is desi gned to operat e on many comp uter systems. Se e the material s
that came with your system for specific information on minimum and recommended
requirements.
Serial Numbers
Your serial number is your identification number with SPSS Inc. You will need this
serial number when you call SPSS I nc. for info rmation regardi ng support, payment, or
an upgraded system. The serial number was provided with your Base system. Before
using the system, please copy this number to the registration card.
Registration Card
Don’t put it off: fill out and send us your registration card. Until we receive your
registration card, you have an unre gistered system. Ev en if you have previou sly sent a
card to us, please fill out and return the card enclosed in your SPSS Maps package.
Registering your system entitles you to:
Technical support services
New product announcements and upgrade announcements
Customer Service
If you have any questions concerning your shipment or accou nt, contact your local office,
listed on page vii. Please have your serial number ready f or identification when calling.
iv
Page 5

Training Seminars
SPSS Inc. provides both public and onsite training seminars for SPSS. All seminars
feature hands-on workshops. SPSS seminars will be offered in major U.S. and
European cities on a regular basis. For more information on these seminars, call your
local office, listed on page vii.
Technical Support
The services of SPSS Technical Support are available to registered customers.
Customers may call Technical Support for assistance in using SPSS products or for
installation help for one of the supported hardware environments. To reach Technical
Support, see the SPS S h ome page on the World Wid e Web at http://www.spss.com, or
call your local office, listed on page vii. Be prepared to identify yourself, your
organization, and the serial number of your system.
Additional Publications
Additional copies of SPSS prod uct manuals may be pu rchased from Pren tice Hall, the
exclusive distributor of SP SS publ icat ions. To order, fill ou t and mail the Publicat ions
order form included wit h yo ur syst em or cal l t ol l-f ree. I f y ou r epr ese nt a bo okst ore or
have an account with Prentice Hall, call 1-800-223-1360. If you are not an account
customer, call 1-800-374-1200. In Canada, call 1-800-567-3800. Outside of North
America, contact your local Prentice Hall office.
Except for academic course adoptions, manuals can also be purchased from SPSS
Inc. Contact your local SPSS office, listed on page vii.
Tell Us Your Thoughts
Your comments are important. Please send us a letter and let us know about your
experiences with SPSS products. W e especially like to hear about new and interesting
applications using the SPSS system. Write to SPSS Inc. Marketing Department, Attn:
Director of Product Planning, 233 South Wacker Drive, 11th Floor, Chicago, IL
60606-6307.
v
Page 6

About This Manual
This manual is divided into two sections. The first section documents the graphical
user interface. Illustrations of dialog b oxes are take n from SPS S for Windows. Dialog
boxes in other operating systems are similar . The second part of the manual is a Syntax
Reference section that contains a comp lete reference to the command language used to
create maps both in online sessions and in production jobs. The Maps command syntax
is also available online with the CD-ROM version of SPSS. Thi s manual also contains
two indexes: a subject index and a syntax index.
Contacting SPSS
If you would like to be on our mailing list, co ntact one of our offices, l ist ed o n p age vii ,
or visit our WWW site at http://www.spss.com. We will send you a copy of our
newsletter and let you know about SPSS Inc. activities in your area.
vi
Page 7

SPSS Inc.
Chicago, Illinois, U.S.A.
Tel: 1.312.651.3000
www.spss.com/corpinfo
Customer Service:
1.800.521.1337
Sales:
1.800.543.2185
[email protected]
Training:
1.800.543.6607
Technical Support:
1.312.651.3410
[email protected]
SPSS Federal Systems
Tel: 1.703.527.6777
www.spss.com
SPSS Argentina srl
Tel: +5411.4814.5030
www.spss.com
SPSS Asia Pacific Pte. Ltd.
Tel: +65.245.9110
www.spss.com
SPSS Australasia Pty. Ltd.
Tel: +61.2.9954.5660
www.spss.com
SPSS Belgium
Tel: +32.163.170.70
www.spss.com
SPSS Benelux BV
Tel: +31.183.651777
www.spss.com
SPSS Brasil Ltda
Tel: +55.11.5505.3644
www.spss.com
SPSS Czech Republic
Tel: +420.2.24813839
www.spss.cz
SPSS Danmark A/S
Tel: +45.45.46.02.00
www.spss.com
SPSS Finland Oy
Tel: +358.9.524.801
www.spss.com
SPSS France SARL
Tel: +01.55.35.27.00 x03
www.spss.com
SPSS Germany
Tel: +49.89.4890740
www.spss.com
SPSS Hellas SA
Tel: +30.1.72.51.925/72.51.950
www.spss.com
SPSS Hispanoportuguesa S.L.
Tel: +34.91.447.37.00
www.spss.com
SPSS Hong Kong Ltd.
Tel: +852.2.811.9662
www.spss.com
SPSS India
Tel: +91.80.225.0260
www.spss.com
SPSS Ireland
Tel: +353.1.496.9007
www.spss.com
SPSS Israel Ltd.
Tel: +972.9.9526700
www.spss.com
SPSS Italia srl
Tel: +39.51.252573
www.spss.it
SPSS Japan Inc.
Tel: +81.3.5466.5511
www.spss.com
SPSS Kenya Limited
Tel: +254.2.577.262/3
www.spss.com
SPSS Korea KIC Co., Ltd.
Tel: +82.2.3446.7651
www.spss.co.kr
SPSS Latin America
Tel: +1.312.651.3539
www.spss.com
SPSS Malaysia Sdn Bhd
Tel: +60.3.7873.6477
www.spss.com
SPSS Mexico SA de CV
Tel: +52.5.682.87.68
www.spss.com
SPSS Norway
Tel: +47.22.40.20.60
www.spss.com
SPSS Polska
Tel: +48.12.6369680
www.spss.pl
SPSS Russia
Tel: +7.095.125.0069
www.spss.com
SPSS Schweiz AG
Tel: +41.1.266.90.30
www.spss.com
SPSS Sweden AB
Tel: +46.8.506.105.68
www.spss.com
SPSS BI (Singapore) Pte. Ltd.
Tel: +65.324.5150
www.spss.com
SPSS South Africa
Tel: +27.11.807.3189
www.spss.com
SPSS Taiwan Corp.
Taipei, Republic of China
Tel: +886.2.25771100
www.sinter.com.tw/spss/
SPSS (Thailand) Co., Ltd.
Tel: +66.2.260.7070, +66.2.260.7080
www.spss.com
SPSS UK Ltd.
Tel: +44.1483.719200
www.spss.com
vii
Page 8

Page 9

Contents
1 Introduction to Thematic Mapping 1
What Is Thematic Mapping? . . . . . . . . . . . . . . . . . . . . . . . . . . 1
Geosets and Layers. . . . . . . . . . . . . . . . . . . . . . . . . . . . .2
Data Binding. . . . . . . . . . . . . . . . . . . . . . . . . . . . . . . . . 3
Geographic Variables . . . . . . . . . . . . . . . . . . . . . . . . . . . 4
Available Summary Functions in Maps . . . . . . . . . . . . . . . . . . . . 5
2 Working with Geosets 7
Geoset Tables and Layers. . . . . . . . . . . . . . . . . . . . . . . . . . . . 7
Using the Geoset Manager . . . . . . . . . . . . . . . . . . . . . . . . . . . 8
Creating New Geosets . . . . . . . . . . . . . . . . . . . . . . . . . . .9
To Create a New Geoset. . . . . . . . . . . . . . . . . . . . . . . . . 10
Modifying a Geoset . . . . . . . . . . . . . . . . . . . . . . . . . . . . 10
To Add or Remove Layers in a Geoset . . . . . . . . . . . . . . . . . 11
To Reorder Layers in a Geoset . . . . . . . . . . . . . . . . . . . . . 12
To Modify Layer Properties . . . . . . . . . . . . . . . . . . . . . . . 12
Geosets and Data Binding . . . . . . . . . . . . . . . . . . . . . . . . . . 12
Using the Geodictionary Manager . . . . . . . . . . . . . . . . . . . . . . 13
Registering Geoset Layers . . . . . . . . . . . . . . . . . . . . . . . . 14
To Register Layers from the Geodictionary Manager . . . . . . . . 15
To Register Layers from the Geoset Manager . . . . . . . . . . . . 16
3 Creating Thematic Maps 17
Selecting Geosets and Data Binding Options. . . . . . . . . . . . . . . . 19
To Select a Geoset . . . . . . . . . . . . . . . . . . . . . . . . . . . . 21
To Select Geographic Variables . . . . . . . . . . . . . . . . . . . . 21
ix
Page 10

X/Y Binding . . . . . . . . . . . . . . . . . . . . . . . . . . . . . . . . . . . 21
To Use X/Y Binding . . . . . . . . . . . . . . . . . . . . . . . . . . . . 23
To Set a Coordinate Projection System . . . . . . . . . . . . . . . . 23
Point Reference Tables . . . . . . . . . . . . . . . . . . . . . . . . . . . . 24
To Use a Point Reference Table . . . . . . . . . . . . . . . . . . . . 25
Advanced Options in Thematic Maps . . . . . . . . . . . . . . . . . . . . 26
To Select Advanced Options . . . . . . . . . . . . . . . . . . . . . . 27
Title Options in Thematic Maps . . . . . . . . . . . . . . . . . . . . . . . 28
To Select Title Options . . . . . . . . . . . . . . . . . . . . . . . . . . 29
Measurement System Used in Thematic Maps . . . . . . . . . . . . . . 29
To Select a Measurement System . . . . . . . . . . . . . . . . . . . 29
4 Range of Values Maps 31
Sample Output . . . . . . . . . . . . . . . . . . . . . . . . . . . . . . . . . 33
To Create a Range of Values Map . . . . . . . . . . . . . . . . . . . . . . 34
5 Graduated Symbol Maps 35
Sample Output . . . . . . . . . . . . . . . . . . . . . . . . . . . . . . . . . 37
To Create a Graduated Symbol Map. . . . . . . . . . . . . . . . . . . . . 38
6 Dot Density Maps 39
Sample Output . . . . . . . . . . . . . . . . . . . . . . . . . . . . . . . . . 41
To Create a Dot Density Map . . . . . . . . . . . . . . . . . . . . . . . . . 41
7 Individual Values Maps 43
Sample Output . . . . . . . . . . . . . . . . . . . . . . . . . . . . . . . . . 45
To Create an Individual Values Map. . . . . . . . . . . . . . . . . . . . . 45
x
Page 11

8 Bar Chart Maps 47
Sample Output . . . . . . . . . . . . . . . . . . . . . . . . . . . . . . . . . .49
To Create Bars for Counts of a Categorical Variable . . . . . . . . . . . .49
To Create Bars of Summary Statistics for One or More
Scale Variables . . . . . . . . . . . . . . . . . . . . . . . . . . . . . . . . .50
To Create Bars of Summary Statistics for a Scale Variable
within Categories . . . . . . . . . . . . . . . . . . . . . . . . . . . . . . . .50
9 Pie Chart Maps 51
Sample Output . . . . . . . . . . . . . . . . . . . . . . . . . . . . . . . . . .53
To Create a Pie Chart Map . . . . . . . . . . . . . . . . . . . . . . . . . . .53
10 Multiple Theme Maps 55
Sample Output . . . . . . . . . . . . . . . . . . . . . . . . . . . . . . . . . .57
To Select Common Controls for a Multiple Theme Map . . . . . . . . . .57
Adding Themes to a Multiple Theme Map . . . . . . . . . . . . . . . . . .58
To Add Themes to a Multiple Theme Map . . . . . . . . . . . . . . . . . .60
11 Modifying Thematic Maps 61
Modifying Themes Using the Theme Control . . . . . . . . . . . . . . . .62
To Modify Themes . . . . . . . . . . . . . . . . . . . . . . . . . . . . . . .63
Range of Values Properties. . . . . . . . . . . . . . . . . . . . . . . .64
Individual Values Properties . . . . . . . . . . . . . . . . . . . . . . .65
Line Style Properties . . . . . . . . . . . . . . . . . . . . . . . . . . .67
Graduated Symbol Properties . . . . . . . . . . . . . . . . . . . . . .67
Symbol Style Properties. . . . . . . . . . . . . . . . . . . . . . . . . .69
Dot Density Properties . . . . . . . . . . . . . . . . . . . . . . . . . .70
Bar Chart Properties. . . . . . . . . . . . . . . . . . . . . . . . . . . .71
xi
Page 12

Fill Style Properties . . . . . . . . . . . . . . . . . . . . . . . . . . . . 73
Pie Chart Properties . . . . . . . . . . . . . . . . . . . . . . . . . . . 74
Modifying Map Titles. . . . . . . . . . . . . . . . . . . . . . . . . . . 76
Legend Properties . . . . . . . . . . . . . . . . . . . . . . . . . . . . 76
Modifying Map Layers Using the Layer Control . . . . . . . . . . . . . . 78
To Use the Layer Control . . . . . . . . . . . . . . . . . . . . . . . . . . . 79
Adding Layers to a Map . . . . . . . . . . . . . . . . . . . . . . . . . 80
Display Properties . . . . . . . . . . . . . . . . . . . . . . . . . . . . 81
Label Properties . . . . . . . . . . . . . . . . . . . . . . . . . . . . . 82
Geographic Variable Mismatches . . . . . . . . . . . . . . . . . . . . . . 84
To Correct Mismatches . . . . . . . . . . . . . . . . . . . . . . . . . . . . 85
Syntax Reference 87
Subject Index 103
Syntax Index 107
xii
Page 13

Chapter
Introduction to Thematic Mapping
Thematic maps show you how data are distributed over a geographical area. They
illustrate relationships and patterns in your data and help you make projections for
your business. SPSS Maps turns your geographically distributed data into highquality maps with symbols, colors, bar charts, pie chart s, and combinations of themes.
This chapter provides an introduction to thematic mapping. It includes important
mapping concepts and terminology that will help you to create meaningful maps in
SPSS. Specific issues, such as geo sets and data bin ding, will be cove red in Chapter 2.
The step-by-step process of creating thematic maps begins in Chapte r 3. Each type of
map is discussed in subsequent chapters. Modification of existing maps is described
in Chapter 11.
1
What Is Thematic Mapping?
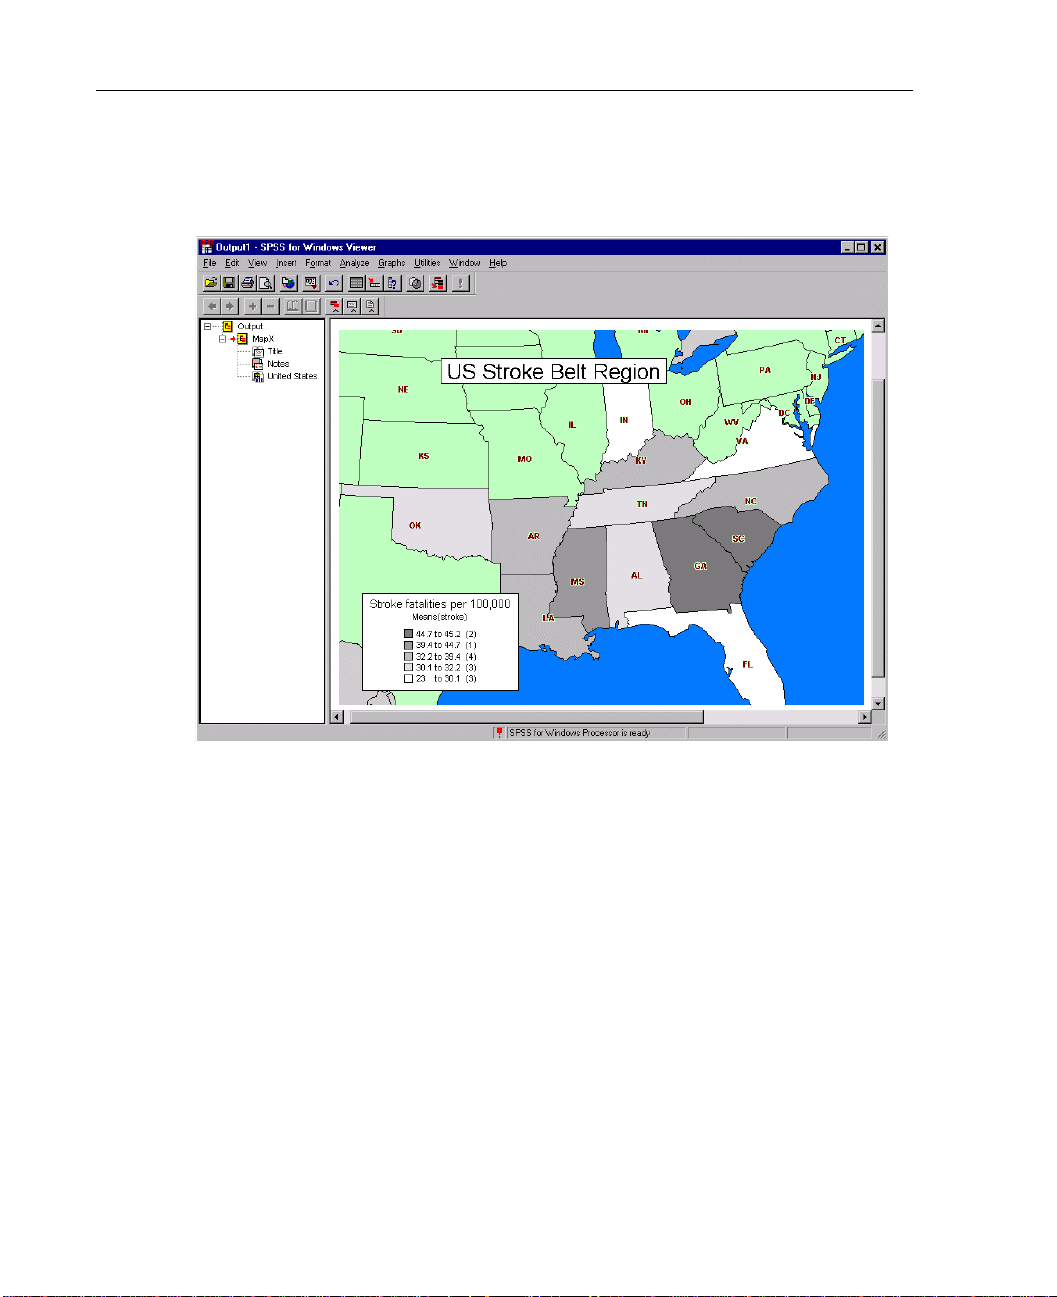
Thematic mapping is the display of data on a map. Maps can be color -coded, shaded ,
or used to display symbols and/or charts. For exampl e, you can use thematic mapping
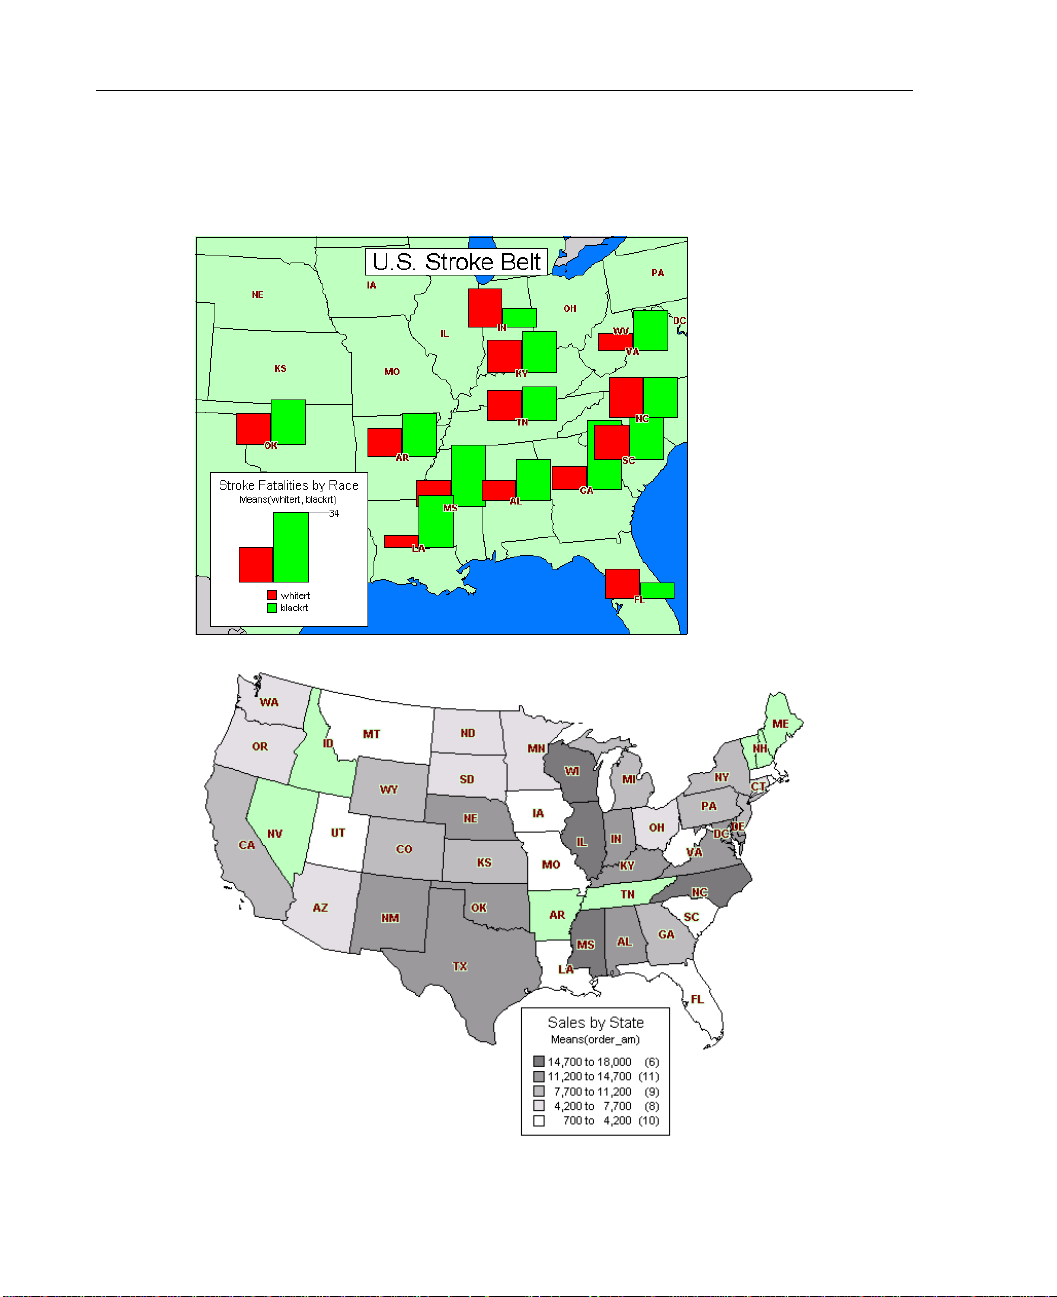
to illustrate the relationship between United States region and incidence of strokes.
Such a map would show you that the stroke rate in the southeastern U.S. is nearly
twice as high as in other areas.
1
Page 14
2
Chapter 1
Figure 1-1
Thematic map showing stroke fatality rate in the stroke belt
Before you start making thematic maps, there are several concepts you should
understand.
Geosets and Layers
Computer maps are made up of layers. Each layer, like an overhead transparency, is
stacked upon the other to create a detailed map. A typical map, for example, contains
different layers for country , ocean, highways, and major cities. T hese layers overlap to
create a map with varying degrees of detail.
Each layer contains a different set of geographical information and is therefore a
separate file. These layer files are bundled together according to geographic area in a
set of files called a geoset.
Page 15
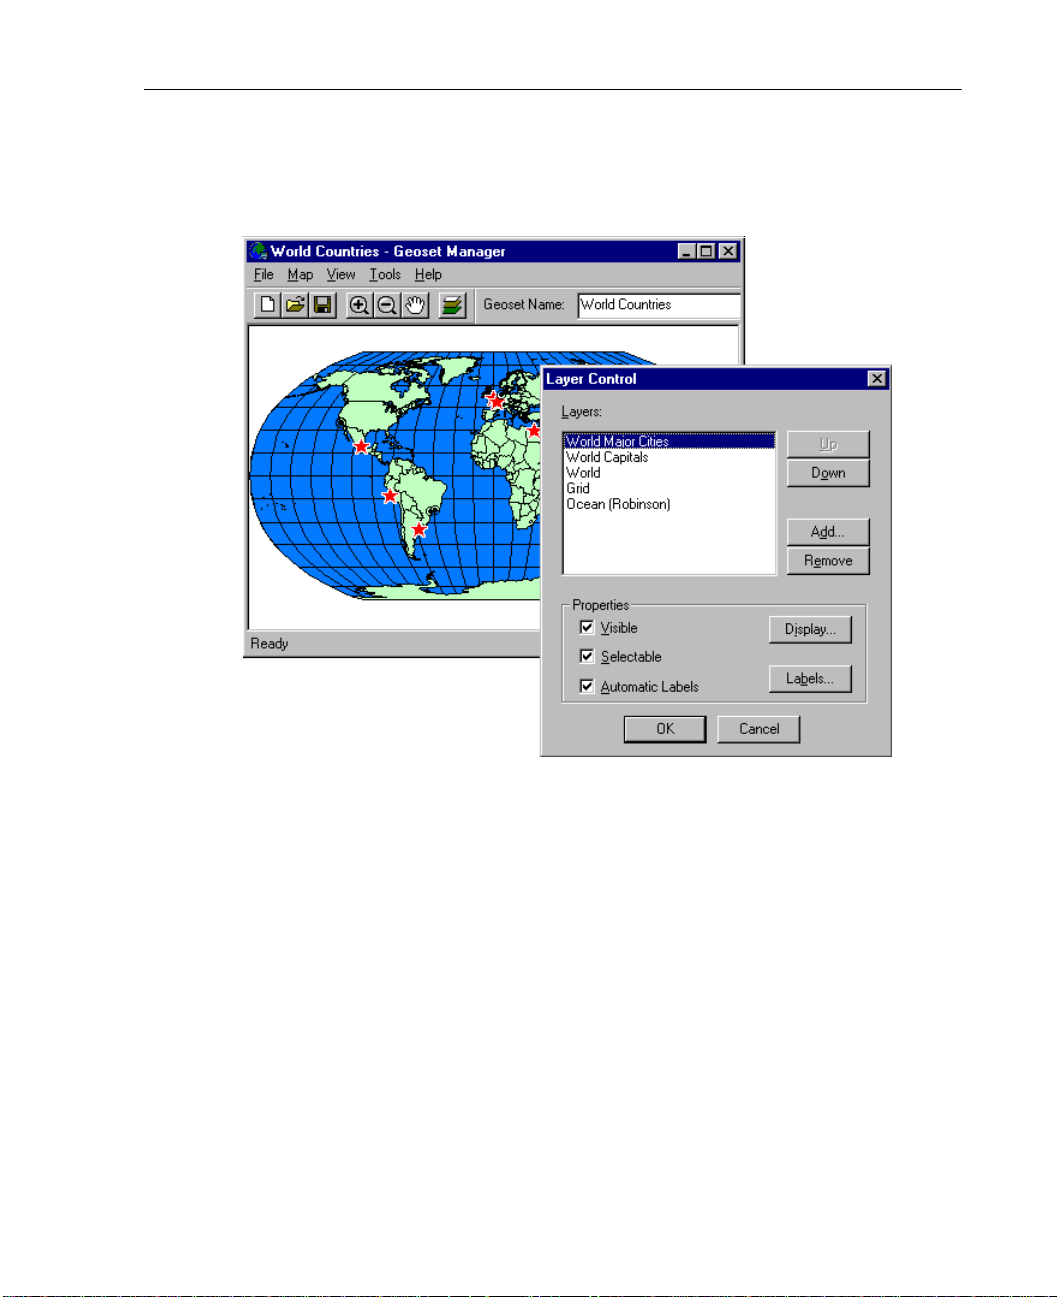
Figure 1-2
Geoset layers displayed in the Geoset Manager
3
Introduction to Thematic Mapping
A typical geoset contains separate data files for states, capitals, rivers, and highways
that are layered to create a detailed map. Layer s in a geoset c an be reordered, adde d, or
deleted using the Geoset Manager. You can also create new geosets from geographic
data in MapInfo format.
For more information about geosets and layers, see Chapter 2.
Data Binding
In order to make thematic maps, your data need to have a geographic component. A
typical data file used for mapping might cont ain data for states, countries, or zip code.
When you create a thematic map, data are aggregated for each geographic region and
matched to a loc ation on the map.
Page 16
4
Chapter 1
The process of matching dat a to a map is known as data bindin g. For example, data
binding occurs when the name “Washington, D.C.” is matched with a geoset that
knows to position the U.S. capital near Maryland and Virginia.
Geographic Variables
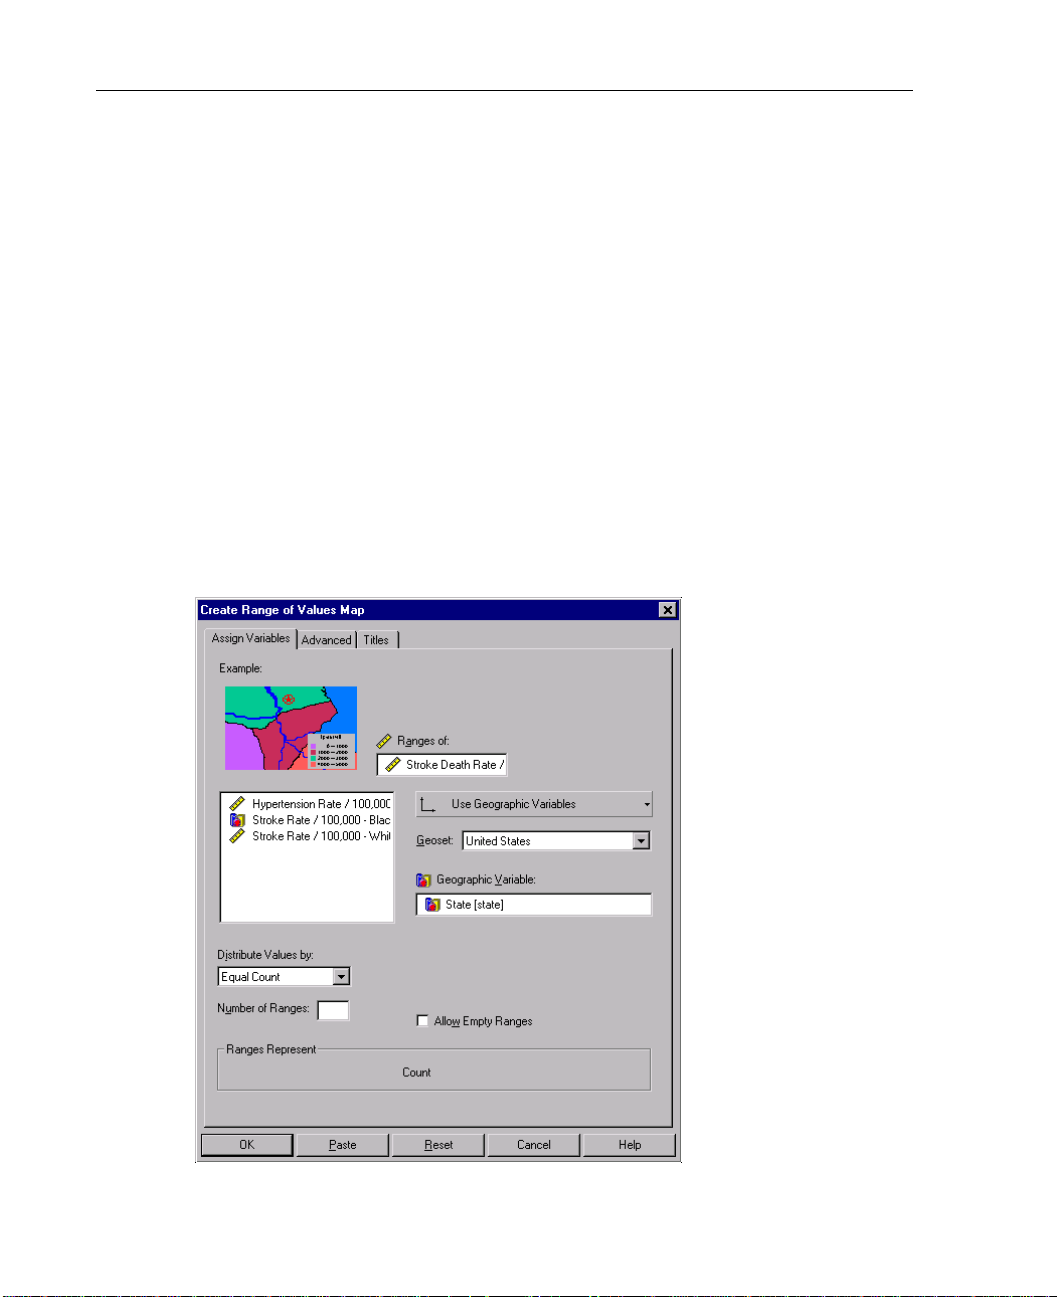
The most common way to cond uct data binding i s to use g eographic va riables, such as
state and county, from your data file. A geographic variable should have values that
match a similar set of values in a geoset layer (.tab file). F or example, you could map
property tax rates b ased on a geographi c variable, su ch as US county. The values of the
county variable in your dat a ( f or exampl e, Door County, WI) wou ld match the values
of the county layer in the geoset. If there is a mismatch between values, data will not
be displayed for that region.
Figure 1-3
Geographic variable in the creation dialog box
Page 17

In some cases, the data file may not contain a geographic variable. Instead, you may
have x and y variables t hat contain lat itude and longit ude coordinate s for points on th e
map. This type of dat a b in ding is called X/Y binding. X/Y binding is frequentl y used
to create custom maps showing sales by store loc ation or inventory type by dist ribution
center.
In other cases, your data may contain a geographic variable, such as zip code, that
is not part of a geoset. In order to li nk this vari able to point s on a map, you need to use
a table file called a point reference file. This table contains both the values of the
geographic variable and x/y coordinates for each data value. Using these x/y
coordinates, the location of each zip code can be projected on the map.
For more information about these three types of data binding, see Chapter 3.
Available Summary Functions in Maps
The following statistics are supported in the SPSS Maps option. Only summary
functions appropriate for each chart type are available.
First Values. The value found in the first case for each category in the data file at the
time the summary function was assigned.
5
Introduction to Thematic Mapping
Last Values. The value found in the last case for each category in the data file that
created it.
Maximum Values. The largest value for each category.
Means. The arithmetic average for each category.
Medians. The value below which half of the cases fall in each category. If there is an
even number of cases, the media n is the average o f the two middl e cases when they are
sorted in ascending or descending order.
Minimum Values. The smallest value w ithin the category.
Modes. The most frequently occurring value within each category. If multiple modes
exist, the smallest value is use d.
Number of Cases Above (N of Cases >). The number of cases having values above the
specified value.
Number of Cases Between (N Between). The number of cases between two specified
values.
Page 18

6
Chapter 1
Number of Cases Equal to (N of Cases =). The number of cases equal to the specified
value.
Number of Cases Greater Than or Equal to (N of Cases >=). The number of cases having
values above or equal to the specified value.
Number of Cases Less Than (N of Cases <). The number of cases below the specified
value.
Number of Cases Less Than or Equal to (N of Cases <=). The number of cases below or
equal to the specified value.
Standard Deviations (SD). A measure of dispersion around the mean, expressed in the
same unit of measurement as the observatio ns, equal to the square root of the variance.
In a normal distribution, 68% of cases fall within one standard deviation of the mean
and 95% of cases fall within two standard deviations.
Sums. The sums of the values within each category.
Variances. A measure of how much observations vary from the mean, expressed in
squared units.
Page 19

Working with Geosets
Geosets contain the information needed to draw a map. Th e SPSS Maps option comes
with a variety of basic geosets. Each geoset comprises a group of table files (.tab)
from the same geographic region. The World geoset, for example, contains different
tables for oceans, countries, and major world cities. Each of these tables has display
properties that you can specify and save in the geoset file (.gst). The .gst file itself
does not contain map data; it is simply a worksp ace, or v iew, of map tables and their
properties.
You can create new geosets and open or edit existing ones using the Geoset
Manager. Layers in a geoset can be registered and modified in the Geodictionary
Manager. The Maps optio n uses geosets in Map Info format. To purcha se new geosets,
you should contact SPSS at www.spss.com.
This chapter discusses how to work with geosets using both the Geoset Manager
and the Geodictionary Manager.
Chapter
2
Geoset Tables and Layers
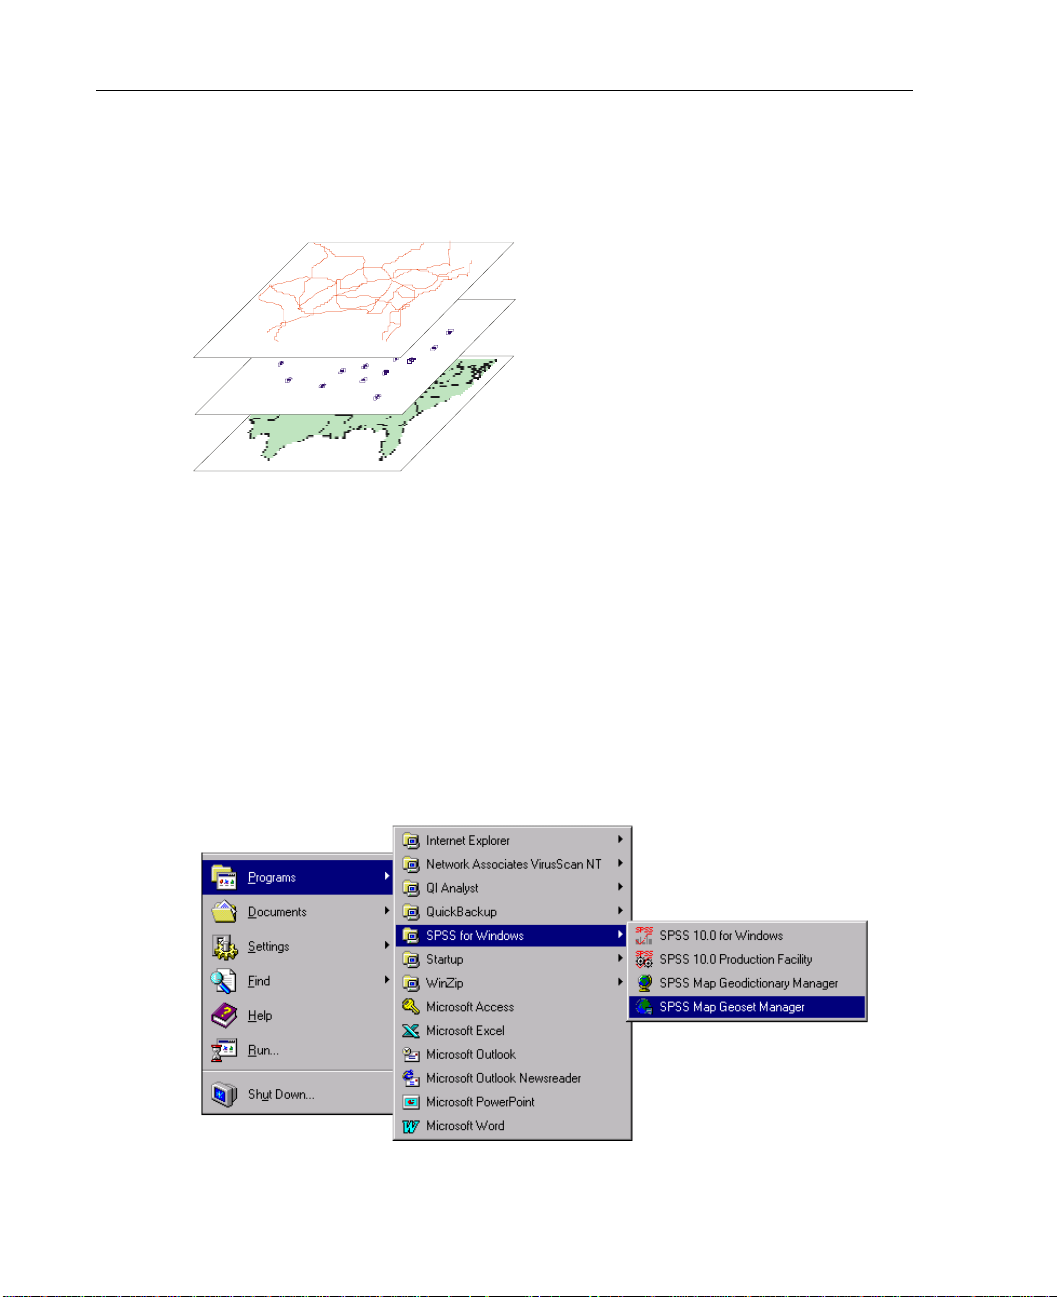
In a map, geoset tables are displayed as layers. These layers are like a stack of
transparencies. In a map of the world, for example, the .tab file for world capitals
becomes a layer with symbols at the location of each country’ s ca pital city . T his layer
is stacked on the world countr ies layer and the ocea ns layer to become a detail ed map.
The visibility and options for each layer can be modified in the Geoset Manager.
7
Page 20
8
Chapter 2
Figure 2-1
Maps as a collection of layers
Behind the scenes, each geoset layer is made up of several file types. Every layer has
a .tab file that contains crucial geographic data. Other file types found in a layer are
.ind, .dat, .map, and .id.
Using the Geoset Manager
The Geoset Manager is a utility that ships with the SPSS Map s option. You can access
it from the SPSS for Windows software group on your Start menu.
Figure 2-2
Selecting the Geoset Manager
Page 21
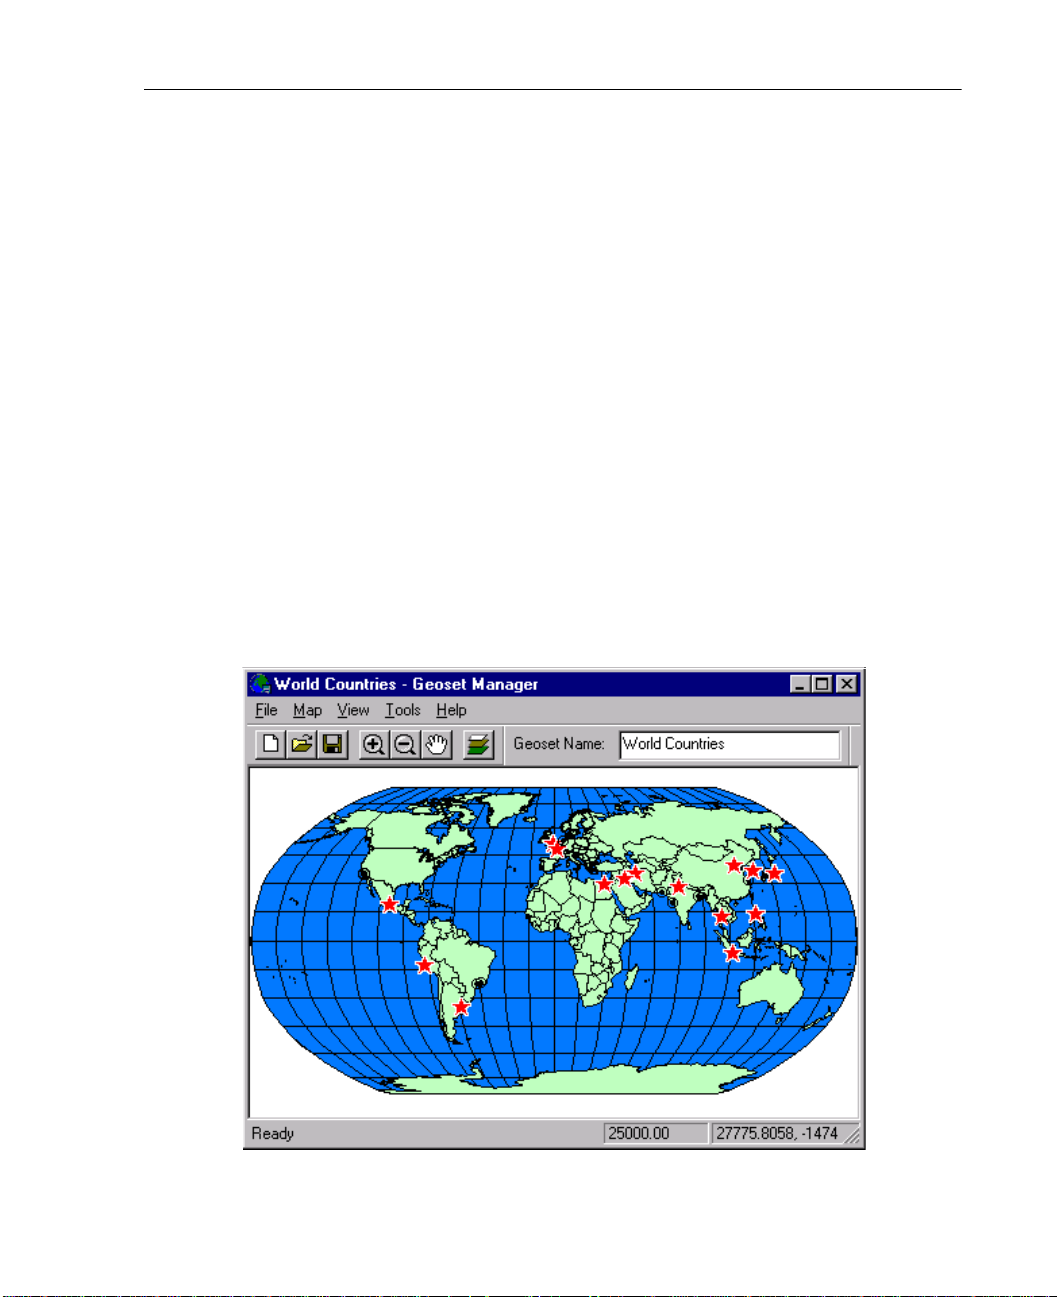
Use the Geoset Manager to create new geosets and organize map layers in existing
geosets. The Geoset Manager acts as a library for your geosets, where you can
customize, reorder, add, or delete layers. Any changes that you make to your geoset,
or workspace, are stored in the .gst file.
Creating New Geosets
You can create new geosets through the Geoset Manager. For example, you can create
a new geoset that includes airpor t and casino locati ons throughout the world. First, you
need to import airport and casino data into your SPSS Maps folder. Then, using the
Geoset Manager, you can create a new geoset by adding lay ers such as world countries,
oceans, and highways. Next, add layers for world airports and casino locations. After
you name and save this new geoset, you are ready to make thematic maps.
Note: Map data must be in MapInfo format to create maps in SPSS. To purchase
MapInfo geosets, you should contact SPSS at www.spss.com.
Figure 2-3
World.gst as displayed in the Geoset Manager
9
Working with Geosets
Page 22

10
Chapter 2
To Create a New Geoset
From the Geoset Manager menus choose:
File
New Geoset
Click Add.
Select the desired layers (.tab files). Use the Ctrl-cl ic k me thod to select multiple files.
Click Open.
Use the Layer Control dialog box to reorder layers and select properties.
Click OK to display the new geoset.
From the menus choose:
File
Save Geoset
Modifying a Geoset
You can modify existing geosets in the Geoset Manager. Using the Layer Control
dialog box, you can add, remove, or reorder layers in a geoset. You can also select
properties such as color , line style, fonts, and zoom for ea ch layer. These changes will
be saved with the geoset and specified in the .gst file.
Page 23
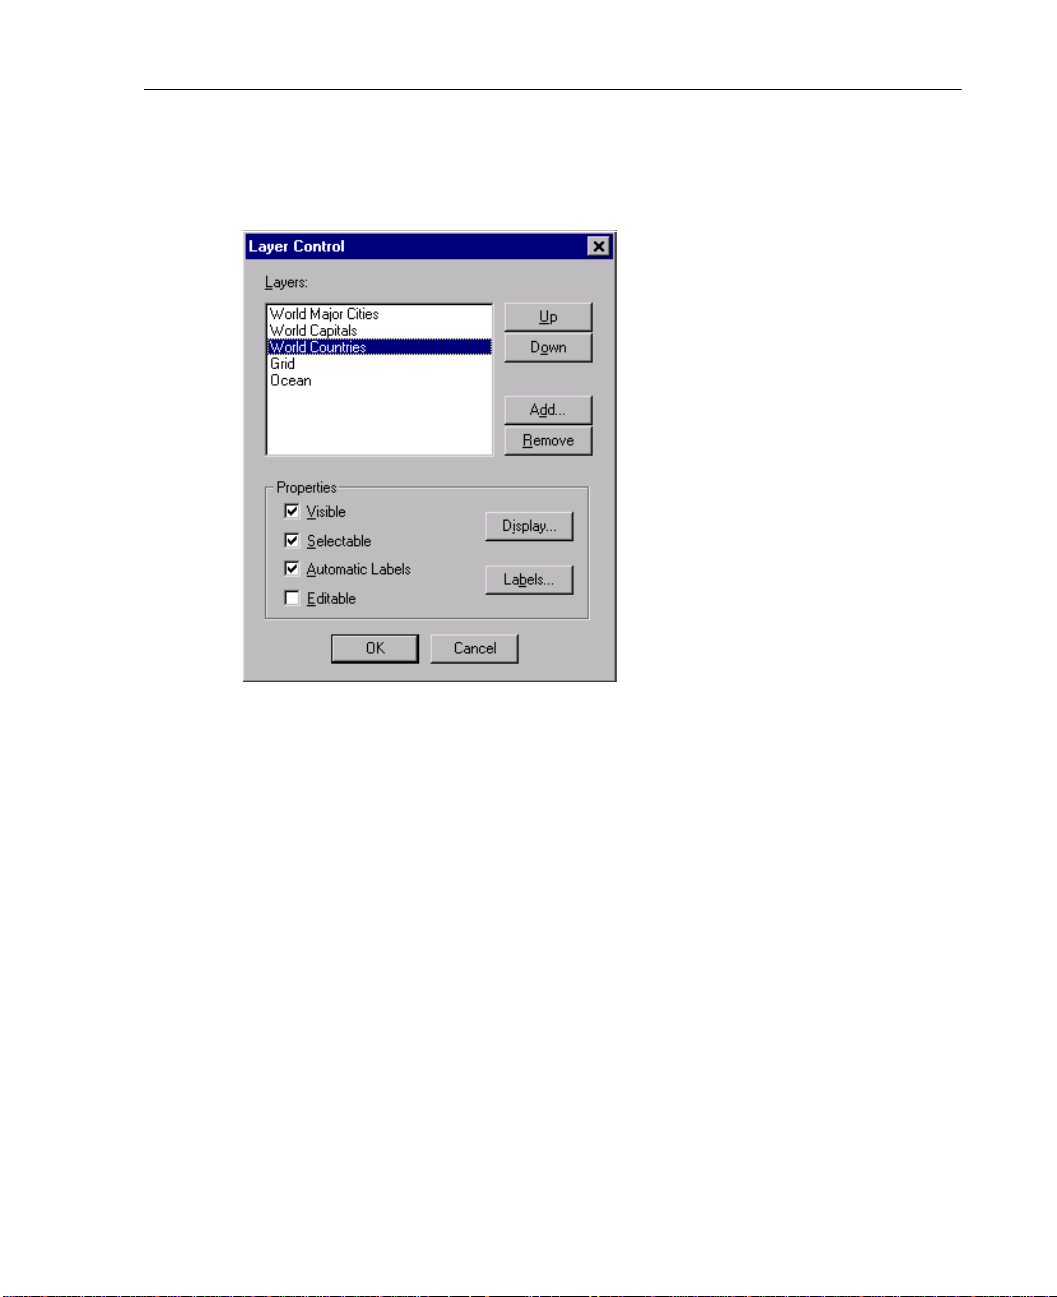
Figure 2-4
Layer Control dialog box
11
Working with Geosets
To Add or Remove Layers in a Geoset
Click the Layer Control tool in the Geoset Manager.
To Remove Layers
Select a layer from the list.
Click Remove.
Note: You cannot undo this action.
To Add Layers
Click Add in the Layer Control dialog box.
Select a file and click Open.
Page 24

12
Chapter 2
To Reorder Layers in a Geoset
Click the Up or Down button to change the order of the layers.
Layers commonly at the top of the list include highways and cities. Oceans and
countries work best at the bottom.
To Modify Layer Properties
Select the desired Properties check boxes to make each layer visible, selectable,
editable, and labe led.
Click Display or Labels for more options.
You must repeat this process for each layer by selecting one from the list.
Geosets and Data Binding
T o make t hemat ic maps in SPSS, you need to create a l i nk bet we en t he dat a f il e and a
particular geoset. This link is called data binding. Data binding is the process of
matching a geographical var i abl e fr om you r dat a fil e t o a par t icu la r geoset l ayer. This
layer has x/y coordinates that point to locations on the map.
For example, if you want to create a bar chart map of deforestation rate by country,
your geographic variable would be country. Each value of this variable—such as
Brazil, France, or United States—must exactly match the values in the geoset for
correct data binding. If the geo set refer s to USA inst ead of United St ates , you wil l not
get a chart for that country.
You can check the values in y our geoset files by opening th e .dat file for each layer.
For example, to check the value for United St ates in the Worl d layer, you would op en
world.dat, located in the SPS S Maps directory. You can either make changes in the .dat
file or in the SPSS .sav file.
Page 25
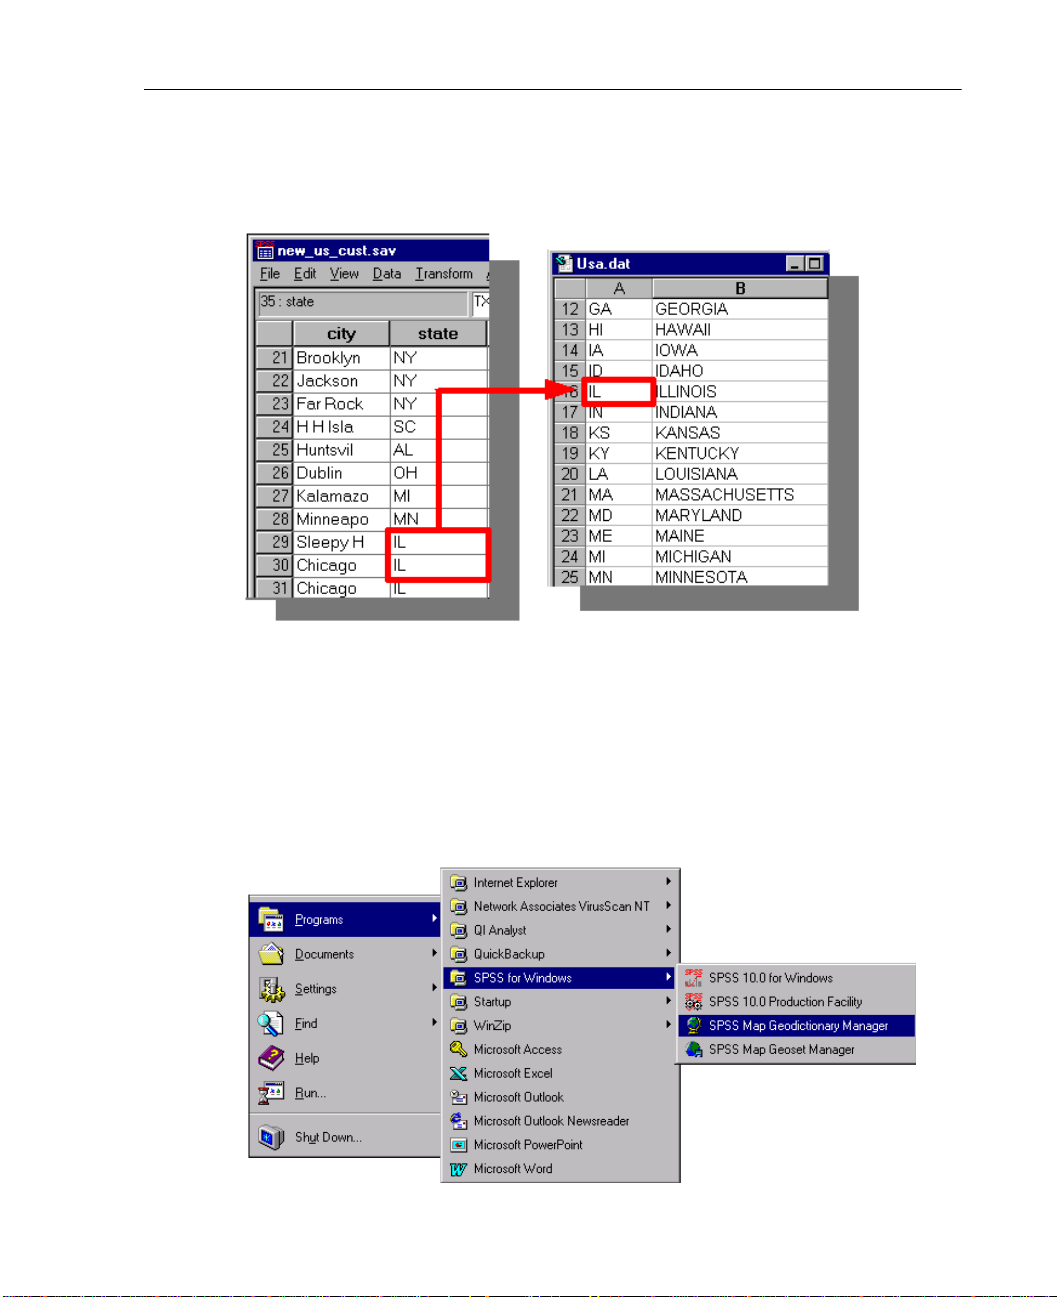
Figure 2-5
Comparing values for data binding
13
Working with Geosets
Using the Geodictionary Manager
The Geodictionary Manager is a utility that ships with the SPSS Maps option. You can
access it from the SPSS for Windows software group on your Start menu.
Figure 2-6
Selecting the Geodictionary Manager
Page 26

14
Chapter 2
The Geodictionary Manager keeps track of layers for data binding. You can register,
unregister, and modify layer pro perties. Changes you make throu gh the Geodiction ary
Manager are saved in a text file called the Geodictionary.
For example, if you import a new boundary file showing U.S. national park
locations, you will first need to add the National Parks layer to a geoset and then
register it in the Geodictionary. This allows SPSS to know that the National Parks layer
is available for data binding.
In order to register layers in the Geodictionary, all geosets need to be located in the
same directory as the geodict.dct fil e. You can change the location of the geodiction ary
and reference multiple geodictionaries by clicking the
dialog box.
Registering Geoset Layers
There are two ways to register layers. You can open a geoset in the Geoset Manager
and register the current layers, or you can use the Geodictionary Manager. The
Geodictionary recognizes all layers (.tab files) in the SPSS Maps directory. If you
register a layer that is not located in the same directory, it will store a copy locally.
… button at the top right of the
Note: Geosets that shipped with the SPSS Maps option have already been registered.
Page 27
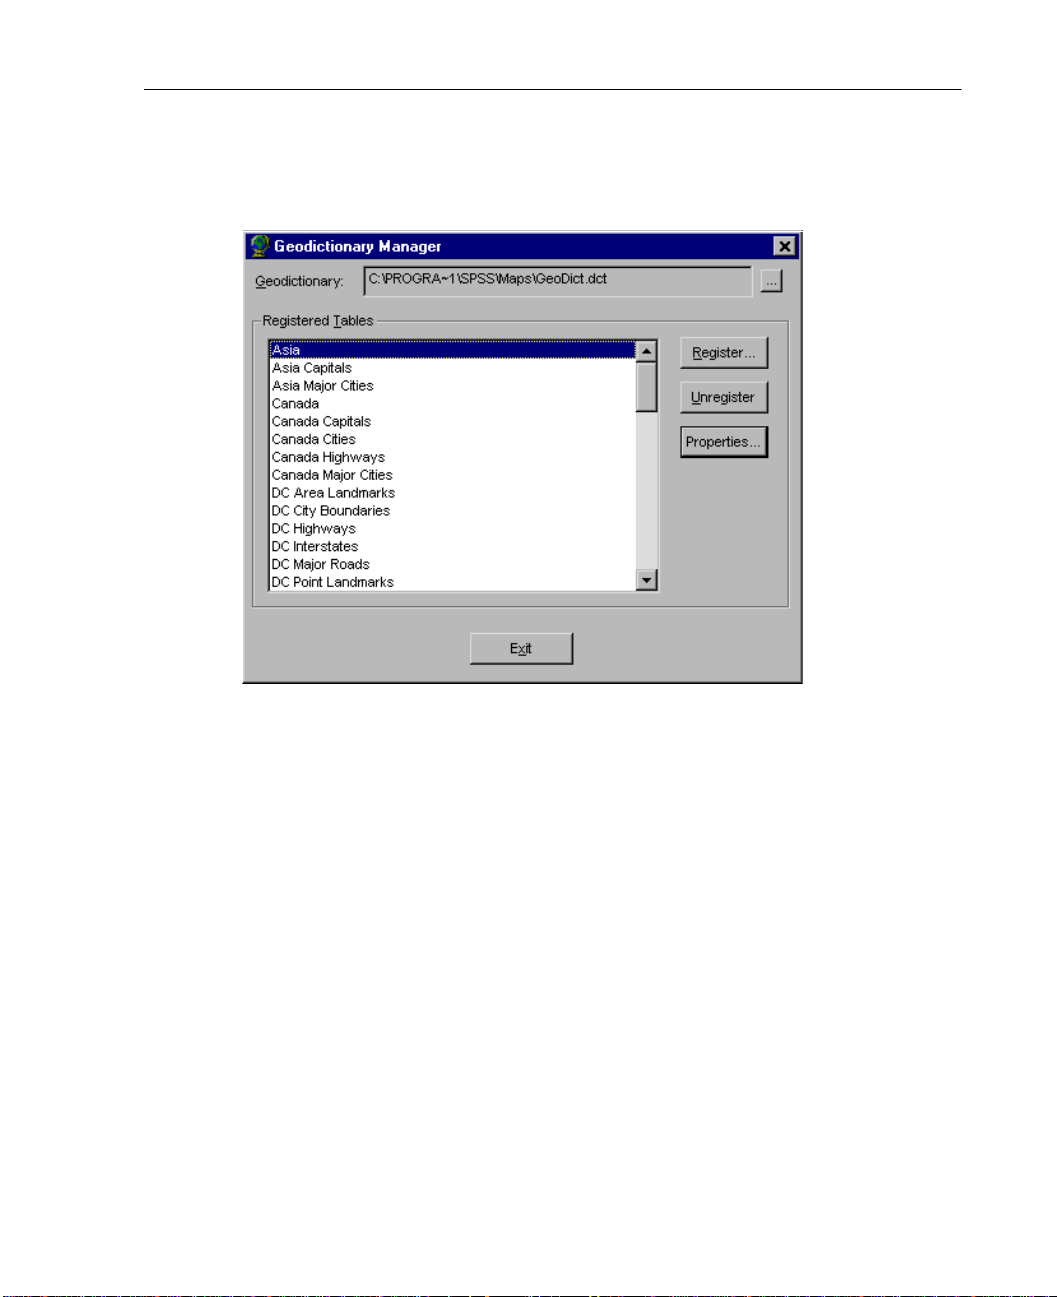
Figure 2-7
Registered geoset layers used to create maps
15
Working with Geosets
To Register Layers from the Geodictionary Manager
Click Register.
Select a MapInfo table from the list and click Open.
In the Table Properties dialog box, type a name in the Description text box.
Optionally, you can:
Select the Search check box for each layer field to be searched during data binding.
Click the Add button to select geosets that will be loaded when the layer is matched.
Page 28

16
Chapter 2
To Register Layers from the Geoset Manager
From the Geoset Manager menus choose:
Tools
Register Layers in GeoDictionary...
Select the layers you would like to register.
Page 29

Creating Thematic Maps
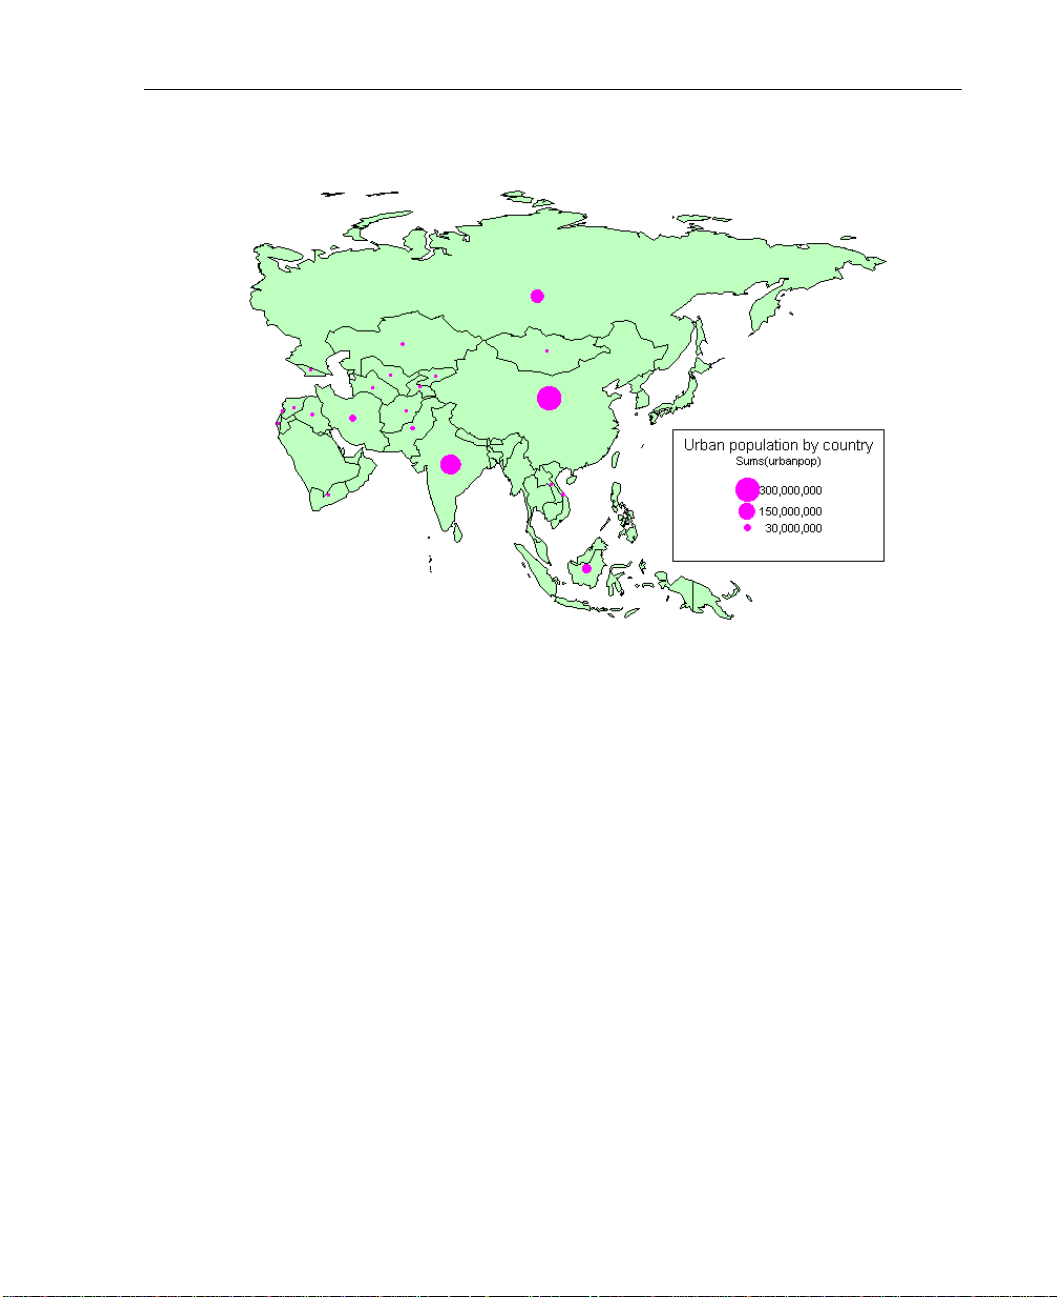
Thematic mapping is the display of data on a map. Maps can be color coded, shaded,
or used to display symbols and/or charts. These visual displays are called map
themes. For example, you could create a map theme illustrating the relationship
between stroke incidence and race fo r different geographi c regions. Such a map might
reveal that African-Americans have a higher number of strokes in the southeastern
United States than Caucasians.
Chapter
3
You can create seven types of thematic maps:
Range of values
Dot density
Graduated symbol
Individual values
Bar charts
Pie charts
Multiple theme maps combining any of the above themes
Depending on your data, certain types of maps will display statistics more
appropriately. For example, if your ag gregated dat a have negat ive values, y ou should
use a range of values, individual values, or bar chart map.
17
Page 30
18
Chapter 3
Figure 3-1
Thematic maps
Page 31
19
Creating Thematic Maps
Selecting Geosets and Data Binding Options
To create thematic maps, you need to link the SPSS data file to map boundary files.
This process is call ed data bind ing . Data bind ing oc curs when a geogr aphic variabl e,
such as state or country, is linked to the appro priate layer in a geoset file. This allows
SPSS to display shading, symbols, or charts based on dat a aggregate d for each region.
There are three data binding methods:
Geographic variables
X/Y binding
Point reference tables
For general information about data binding, see Chapter 2.
Page 32
20
Chapter 3
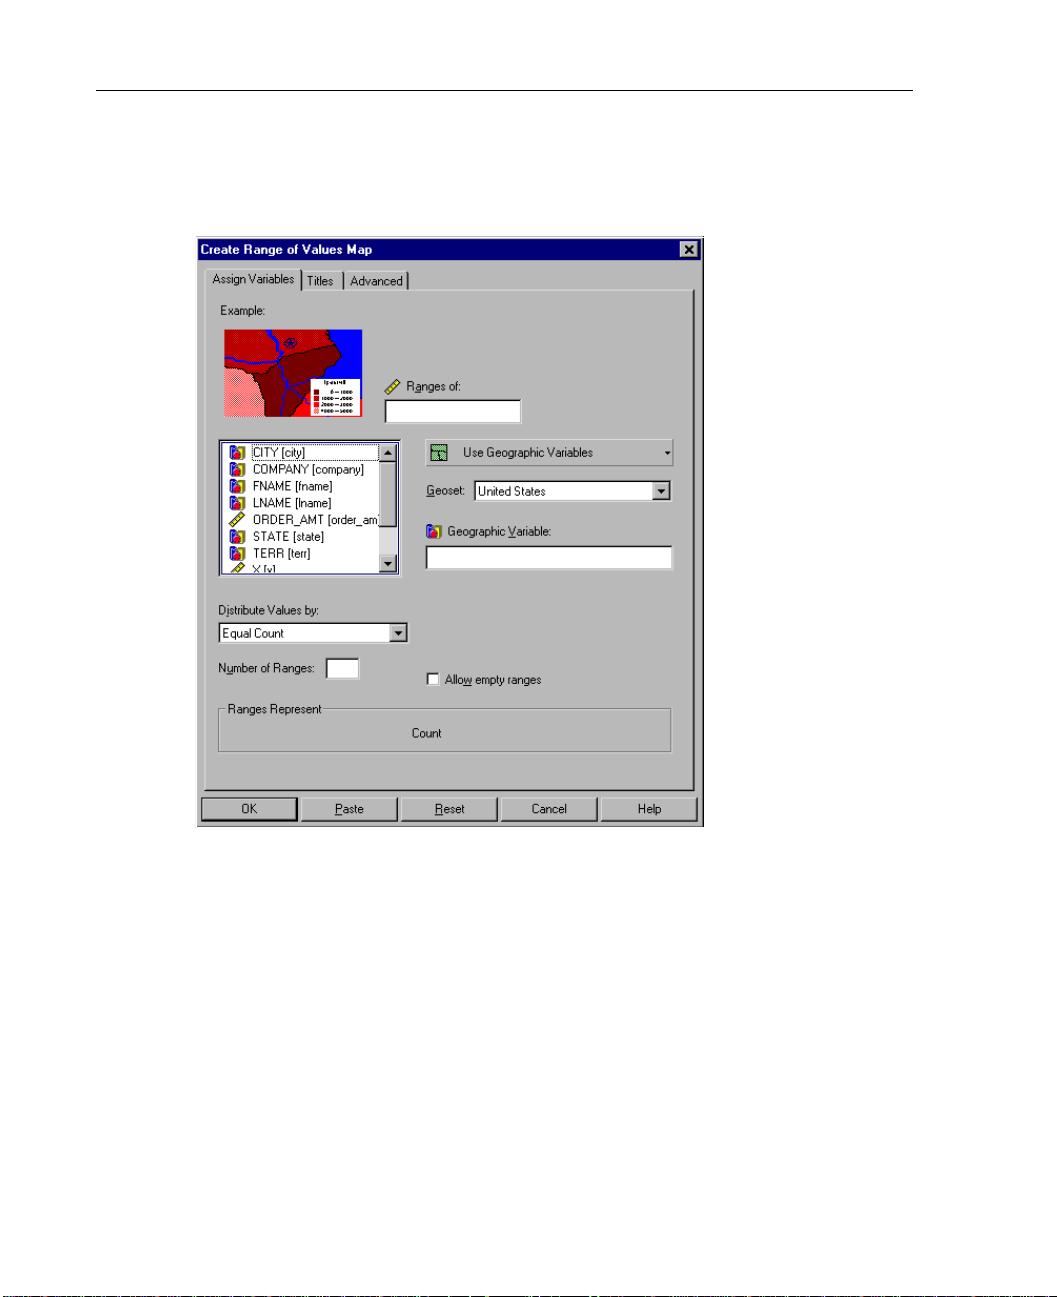
Figure 3-2
Creation dialog box showing geoset and data binding options
Geographic Variable. Matches a geographic variable, such as country or region, to a
layer in the map geoset. If n o layer mat ches this vari able, you will get a blank map. To
select a layer other than the default, click the
Advanced tab.
X/Y Binding. Links your data t o poi nts on a map u sing long itude and l atitude vari ables,
typically called x and y. This type of binding could be used to show government
incentive amounts at specific building sites around the country.
Point Reference Table. Refers to a file containing x/y coordinates for a loo kup varia ble,
such as cities or zip code. You can specify any table file in the SPSS Maps directory.
Geoset. The geoset determines the map that will be displayed and the information that
will be used for data binding. All geosets in the SPSS Maps directory are listed here.
Page 33

To Select a Geoset
From the menus choose:
Graphs
Map
Choose a map type.
Select a geoset from the Geoset drop-down list that matches the geographic variable.
For example, if your geographic variable is customer location by US county, you
would choose the
Click the Advanced tab to select options, such as geoset layer, a variable to refine the
United States geoset.
geographic match, and mismatch handling.
To Select Geographic Variables
From the data binding drop-down list, select Use Geographic Variables.
21
Creating Thematic Maps
Drag a variable, such as country, state, or zip code, to Geographic Variable.
X/Y Binding
Instead of using geographic variables to bind data to a map, you can use a method
called X/Y binding. This typ e of dat a bi ndi ng uses two variables in your data fil e th at
represent longitude (x) and latitude (y). These variables place dat a at specific points on
the map and are frequently use d to show the exact location of stores a nd other facilities.
In the output map, the x/y points become a separate layer that can be modified in
addition to the theme.
Note: Dot density maps do not support X/Y binding. For range of values and individual
values maps, a symbol is placed on the x/y intersection and shaded accordingly.
In some cases, you may need to adjust the coordinate pr ojection system of th e selected
geoset to match the projection of the x and y variables.
Projections are methods used to translate the three-dimensional world onto a two-
dimensional map.
You can pick a projection that matches your x and y variables using the Geoset
Manager.
Page 34
22
Chapter 3
Example. You could show mean revenue by store location using X/Y binding in a
graduated symbols map. Data would be aggr ega ted for a uni que k ey vari abl e, such as
store number.
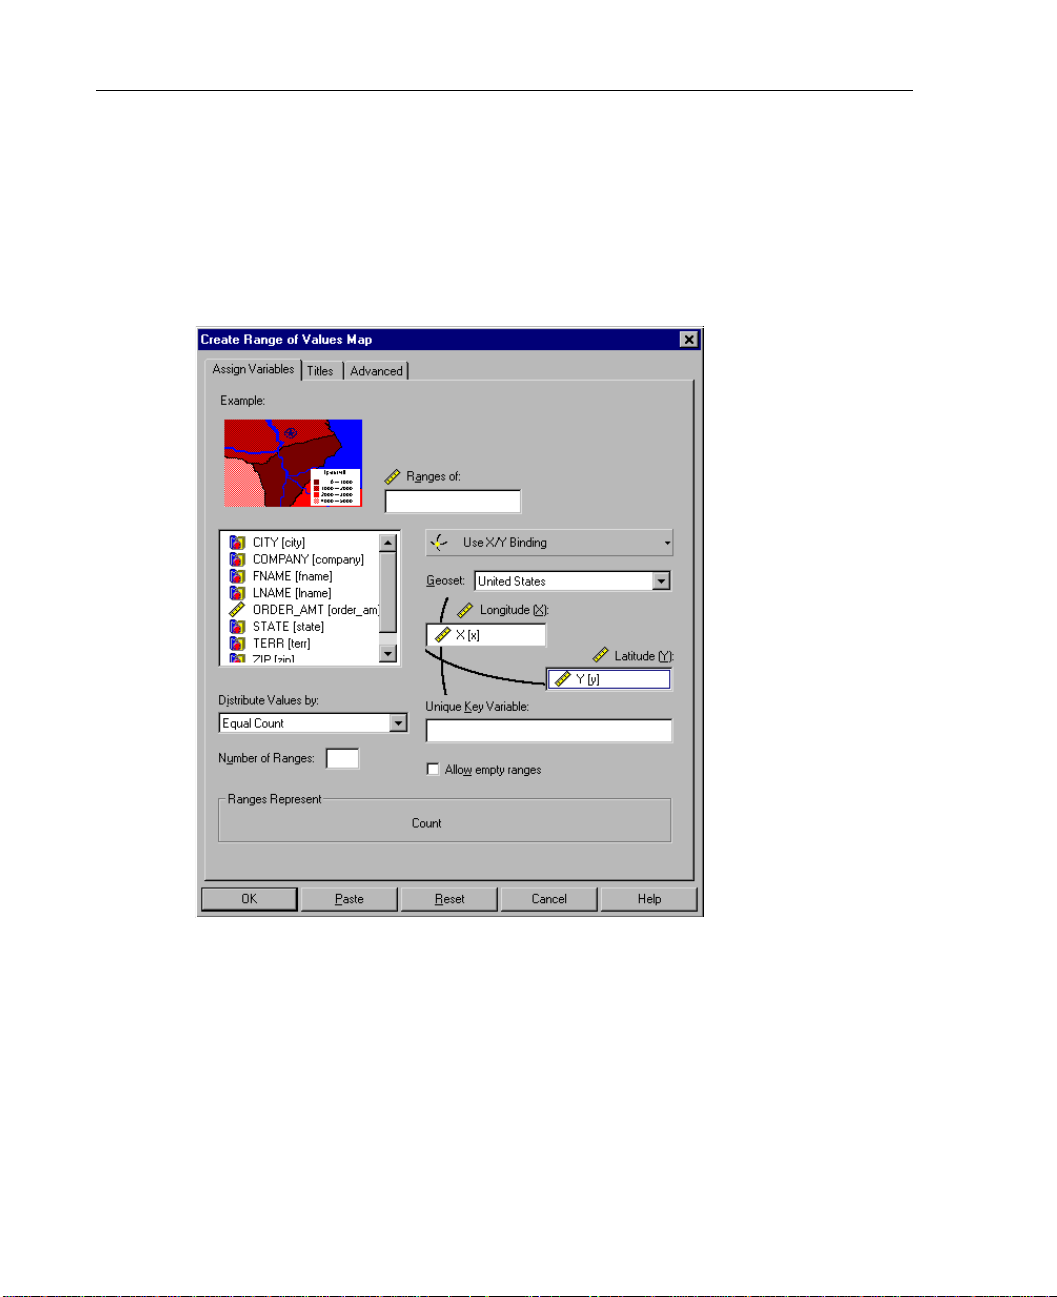
Figure 3-3
Map creation using X/Y binding
Longitude (X variable). Creates points corresponding to longitude. This variable is
commonly named x.
Latitude (Y variable). Creates points corresponding to latitude. This variable is
commonly named y.
Unique Key Variable. Aggregates data for a v ariable, such as stor e number . Ever y value
in this variable must be unique in the sense that all instances of the same value must
refer to the same entity . For example, if there are multiple rec ords for one store number,
those records are aggregated into a single record for that store.
Page 35

To Use X/Y Binding
From the data binding drop-down list, select Use X/Y Binding.
Drag a longitude variable (frequently called x) to Longitude.
Drag a latitude variable (frequently called y) to Latitude.
Drag a variable to Unique Key Variable. The values of this variable must uniquely
identify each record you want in the aggregated data used to draw the map.
Select a geoset from the Geoset drop-down list.
To Set a Coordinate Projection System
When using X/Y binding, y ou may need to chan ge the coordinat e projection system of
the selected geoset to match the projection used by the x and y variables in your data.
You can change the projection using the Geoset Manager utility.
23
Creating Thematic Maps
From the Windows Start menu choose:
Programs
SPSS for Windows
SPSS Maps Geoset Manager
Open the geoset you want to use for X/Y binding.
From the Map menu choose:
Projection…
From the Category drop-down list, select a projection category, such as Universal
Transverse Mercator.
From the Category Members drop-down list, select a specific projection type.
Click OK to apply the projection to the current geoset.
Save the geoset before returning to SPSS.
Page 36
24
Chapter 3
Point Reference Tables
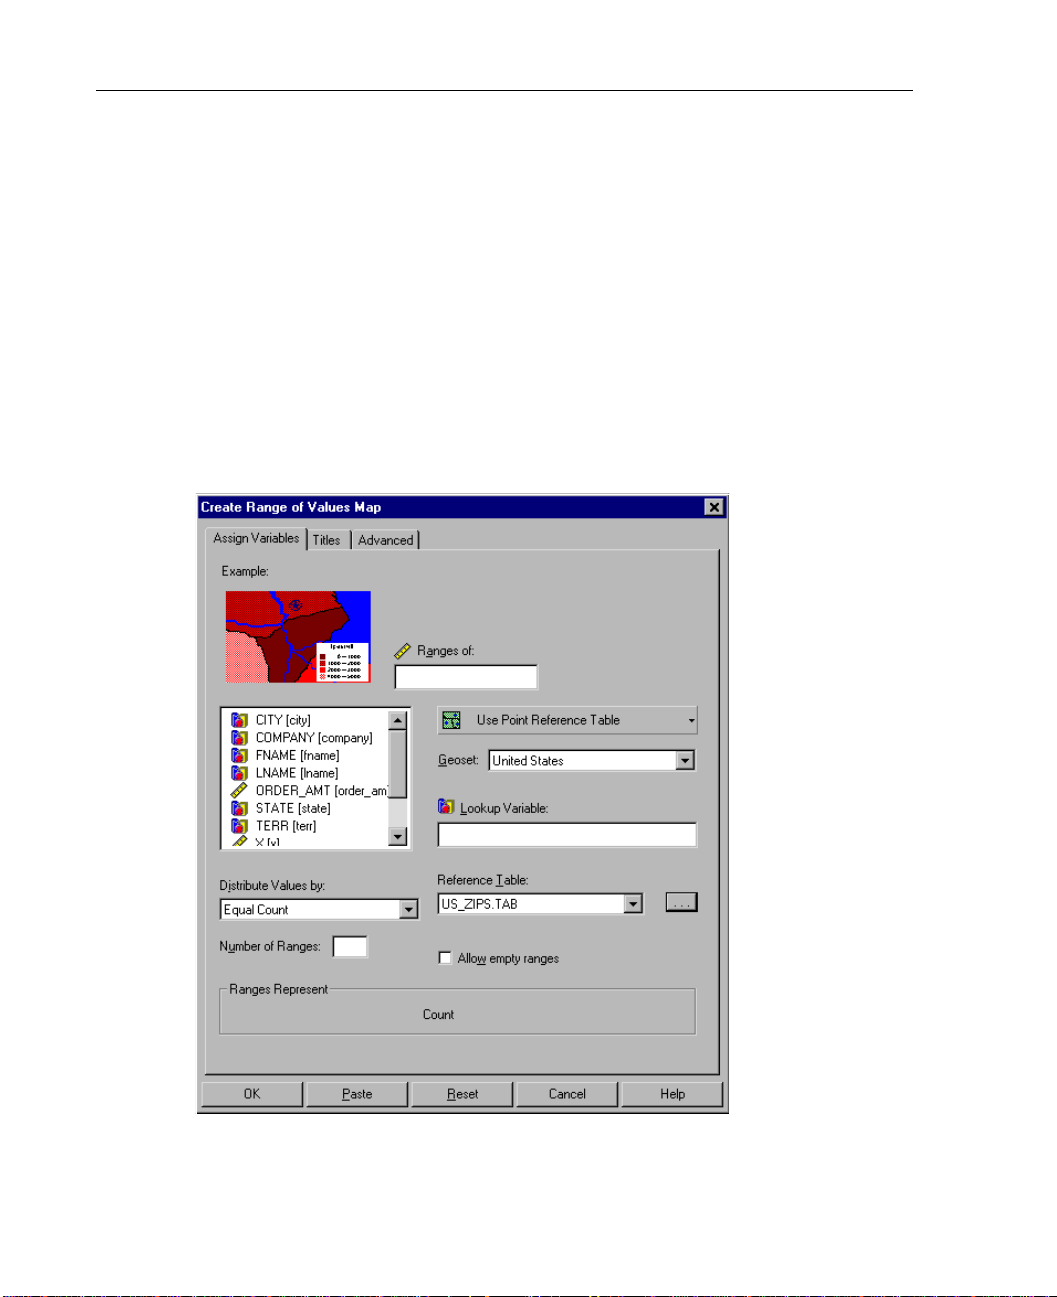
T o place charts or symbols at specif ic points on the map withou t x and y variables, you
can use a point reference table. A point reference ta bl e is a fil e containi ng values for
a lookup variable as well as longitude and latitude (x/y) coordinates for each value.
Coordinates place each va lue of the l ookup variable at a particular l ocation on the map.
These points become a new map layer that can be modified in addition to the theme.
Example. You could show customer sales and location by city using a point reference
table in a graduated symbol map. Only cities with data will be displayed on the map.
Figure 3-4
Map creation using a point reference table
Page 37

Lookup Variable. A variable whose values specify geographic locations. The point
reference table must contain the values of this variable.
Reference Table. Contains x/y coordinates for values of the lookup v a riab le . All t abl es
in the SPSS Maps directory are listed in the drop-down list. Point reference files
frequently have a .tab extension; however, you can use any table file containing x/y
coordinates for the lookup variable. Click
directory.
Note: To use a point reference table, you must register it in the geodictionary.
To Use a Point Reference Table
From the data binding drop-down list, select Use Point Reference Table.
Drag a lookup variable to Lookup Variable.
Select a reference tabl e fro m the drop-down list. Click … to browse for tables ou tsi de
the SPSS directory.
25
Creating Thematic Maps
… to select tables outside the SPSS Maps
All reference tables used in data bind ing must be registered i n the geodictionary. Open
the Geodictionary Manager and click
Register to add the desired reference table.
Page 38
26
Chapter 3
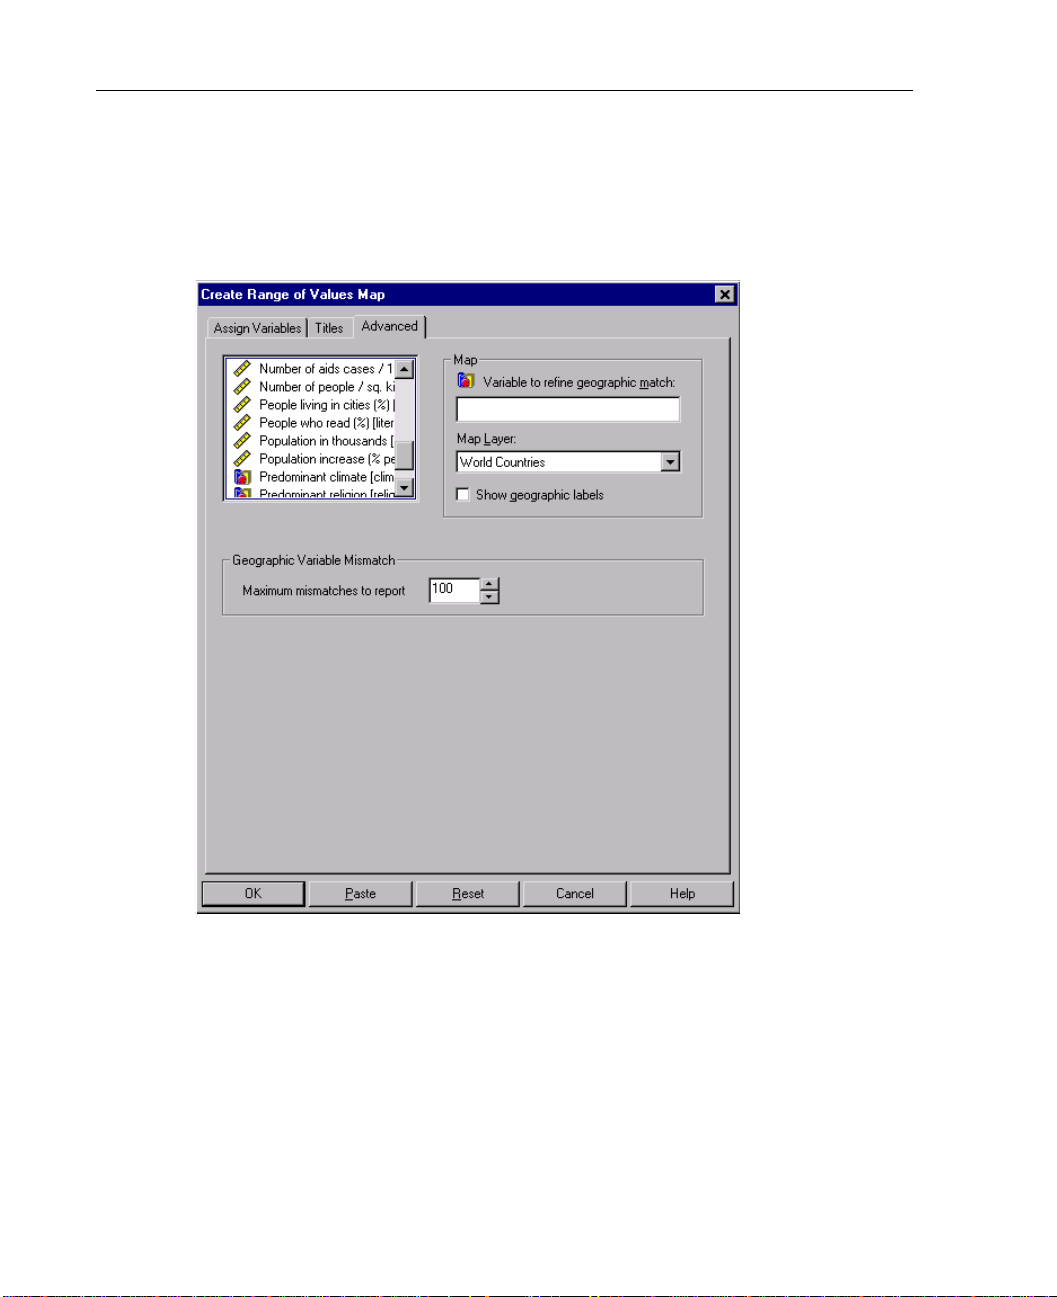
Advanced Options in Thematic Maps
Figure 3-5
Advanced options
Variable to refine geographic match. In some cases, you need to select a variable to
refine the geographic match. For example, if your geographic variable is US county,
you need a refining variable, such as state, to distinguish between identical county
names.
Map Layer. All registered layers for the geoset selected on the Assign Variables tab are
listed here. Choose a layer that matches your geographic variable. When showing
Internet commerce by city, for example, choose the Cities layer in the United States
geoset.
Page 39

Creating Thematic Maps
Note: For X/Y binding and point reference binding, the layer list is disabled.
27
You can also choose to show labels for a layer by selecting
Geographic Variable Mismatch. Sets options in case of a mismatch between the data file
and geoset. For example, if the geographic variable world countries uses the country
name Great Britain and th e layer file uses United Kingdom, a mismatch will occ ur . All
mismatches are reported in a warnings table in the Viewer. You can specify the
maximum number of reports in the table.
To Select Advanced Options
Click the Advanced tab.
If needed, select a variable to refine the geographic match to distinguish between
identical values in a geographic variable, such as county.
Select a geoset layer, such as US Capital s , from the drop-down list.
To avoid excessive warnings, enter a maximum number of mismatches to report.
Show geographic labels.
Page 40
28
Chapter 3
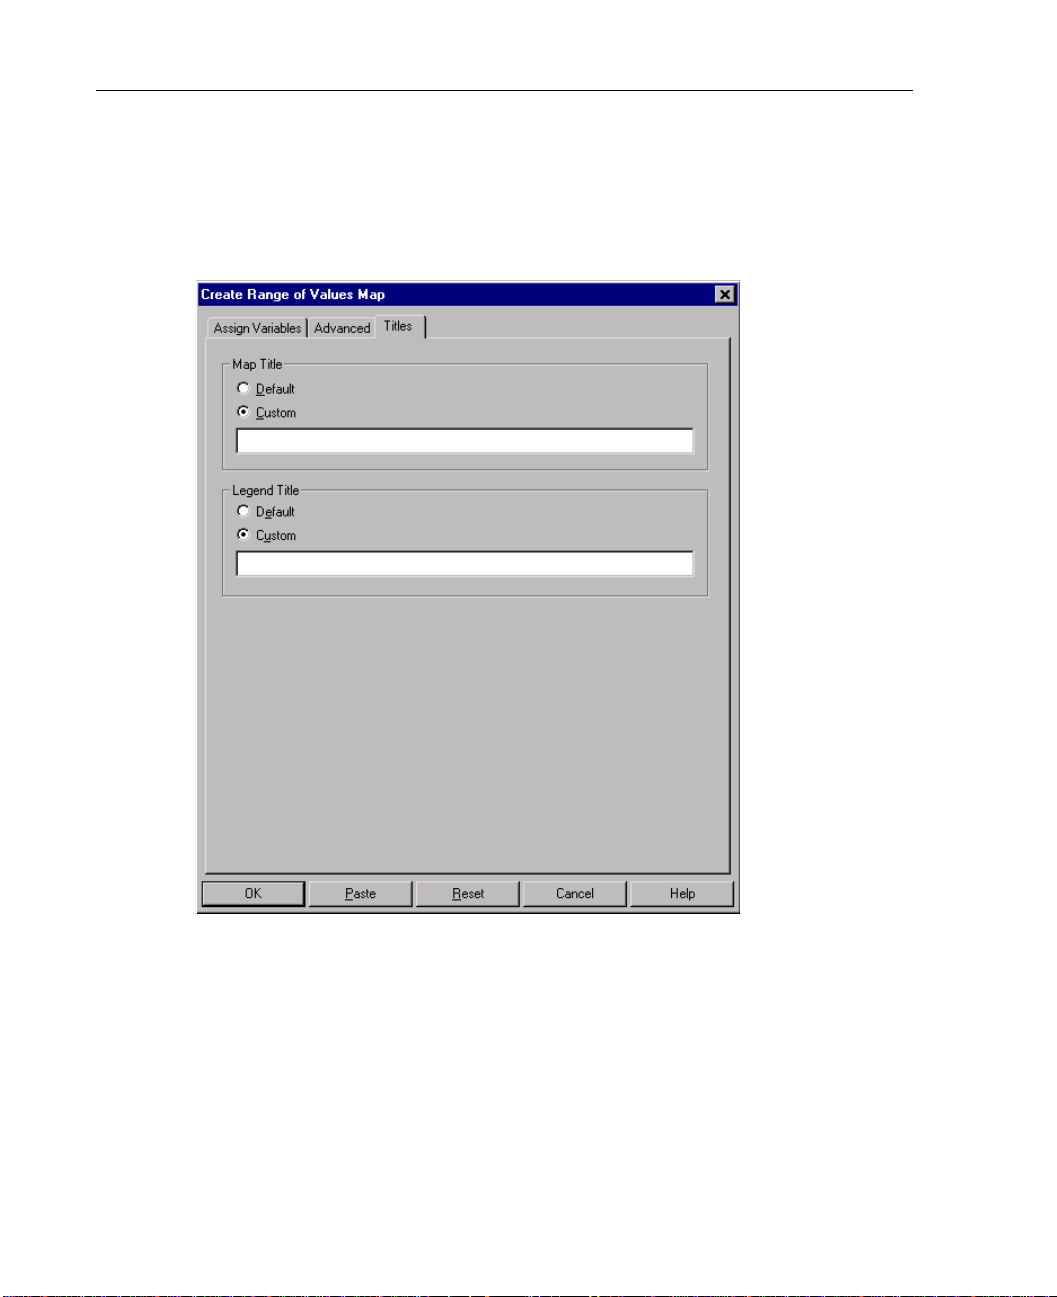
Title Options in Thematic Maps
Figure 3-6
Titles options
Map Title. Choose Custom to create your own map title. The default title is the name of
the geoset used to create the map.
Legend Title. Choose Custom to create your own legend title. The default title is the
variable label of the summary variable used to create the map.
Page 41

To Select Title Options
Click the Titles tab.
For both Map Title and Legend Title, select Custom and enter an appropriate title.
Measurement System Used in Thematic Maps
Units of measurement for maps are specified in the General Options dialog box for
SPSS.
Measurement System. Selections made in General Options affect theme and map
measurement units as follows:
29
Creating Thematic Maps
If you select
Theme measurement units (used for pie diameter, bar hei ght, etc.) will be points or
Points or Inches:
inches.
Measurement units for maps will be miles.
If you select
Theme measurement units (used for pie diameter, bar height, etc.) will be
Centimeters:
centimeters.
Map measurement units will be kilometers.
To Select a Measurement System
From the menus choose:
Edit
Options...
Choose a map type.
Click the General tab.
Select the measurement system you want to use.
Click OK or Apply.
Page 42

Page 43

Range of Values Maps
Range of values maps divide a range of summary statist i c values in to categories and
indicate the range category (for example, 0–100, 101–200, 201–300, etc.) for each
geographic unit. Each range uses a separat e color or pattern to show which range each
geographic region falls into. Experimenting with numbers of ranges and different
methods of forming ranges can help you examine your data more closely.
Chapter
4
Example. To determine placement of medical assistance programs, you could create a
range of values map showing AIDS rate by country. Countries with the highest AIDS
rates appear in the darkest shade.
31
Page 44
32
Chapter 4
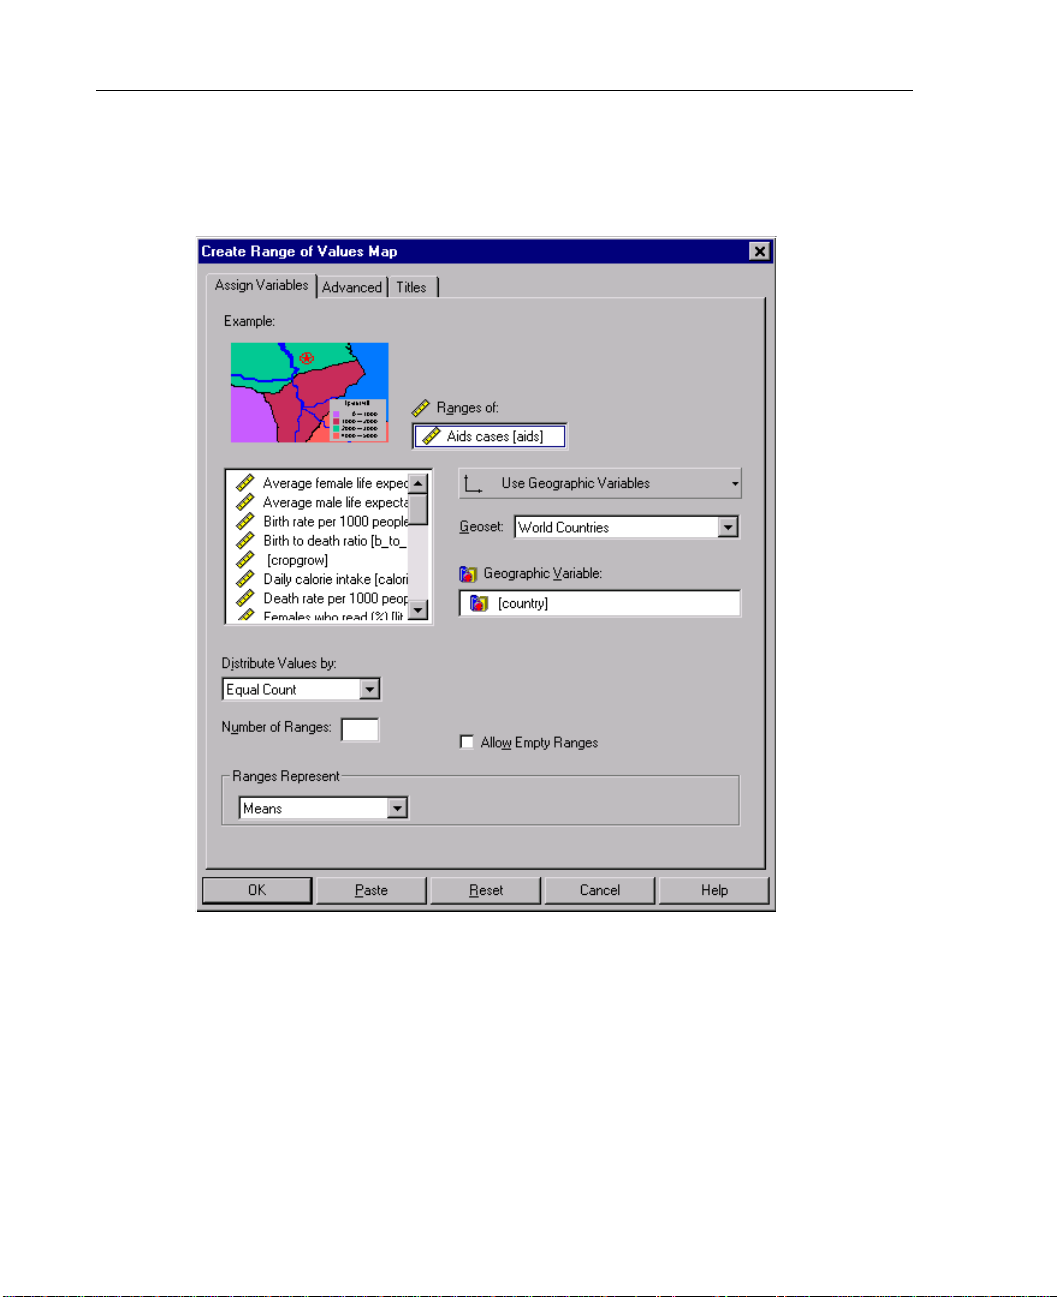
Figure 4-1
Create Range of Values Map: Assign Variables tab
Ranges of. Creates ranges for the values of a scale variable. Data are aggregated
according to the summary function yo u choose from t he
Ranges Represent drop -down
list. Leave the target blank to get the count of cases within each region.
Distribute Values by. You can distribute data values into ranges using one of the
following methods:
Equal Count. Each range contains the same number of cases (records).
Equal Size. Creates ranges of equal size (for example 0–10, 11–20, 21–30, etc.).
Page 45
Natural Break. Uses an algorithm that attempts to find natural breaks in the data and
keep clusters of values together.
Standard Deviation. Each range represents approximately one standard deviation.
The mean falls approximately at the boundary between the middle two ranges.
Number of Ranges. Specify a number of ranges up to 16.
Allow Empty Ranges. This selection allows empty ranges to be cr eated. For exampl e, if
you choose a number of ranges and method of distribution that forces some ranges to
be empty, and you do not select
specifications.
Sample Output
Figure 4-2
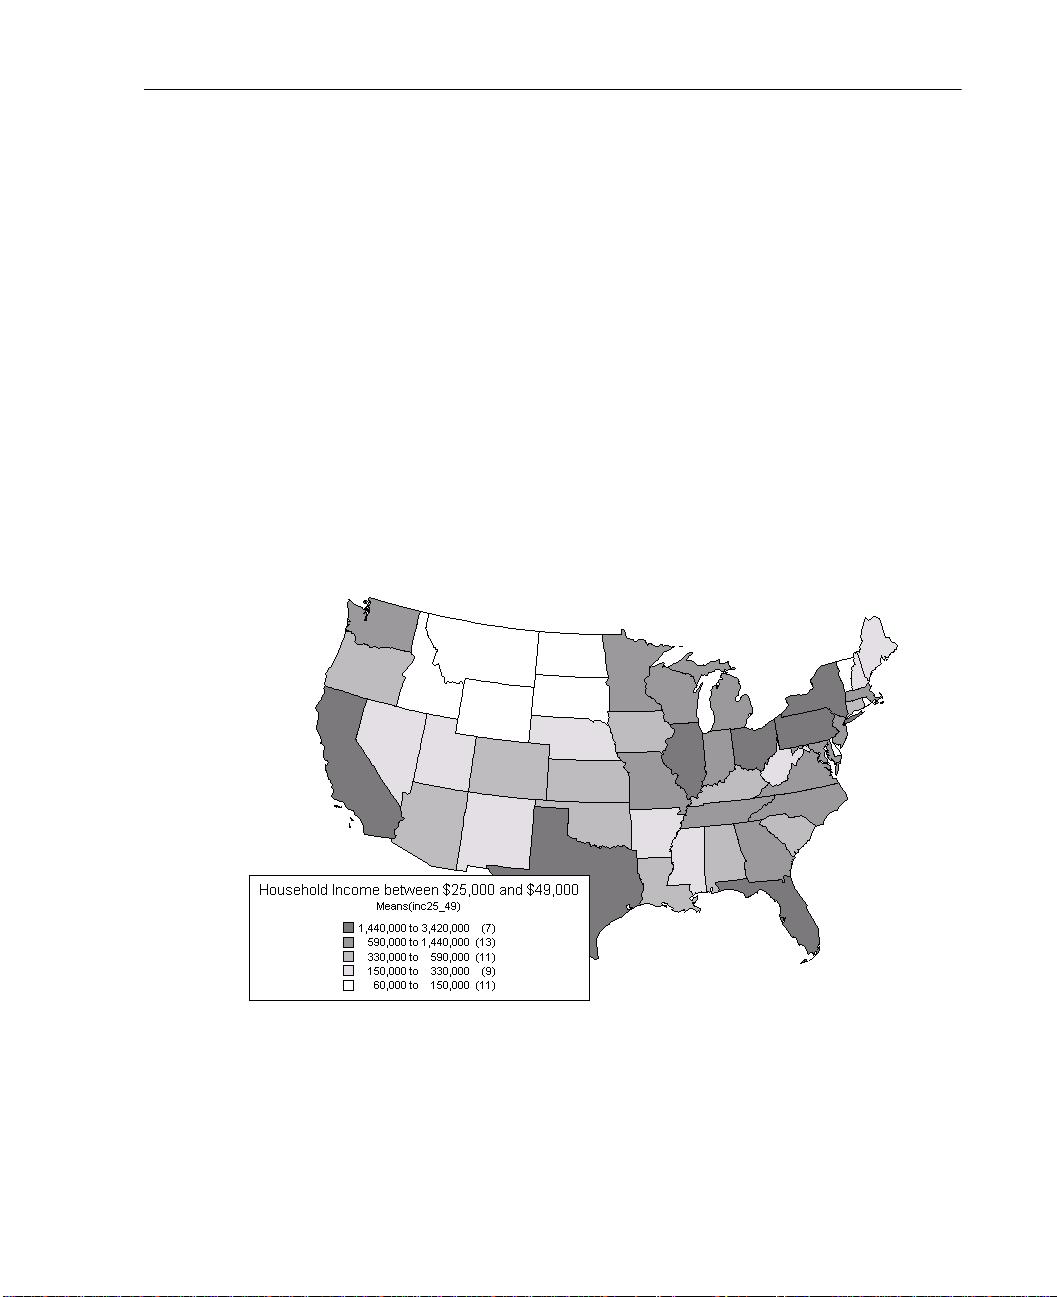
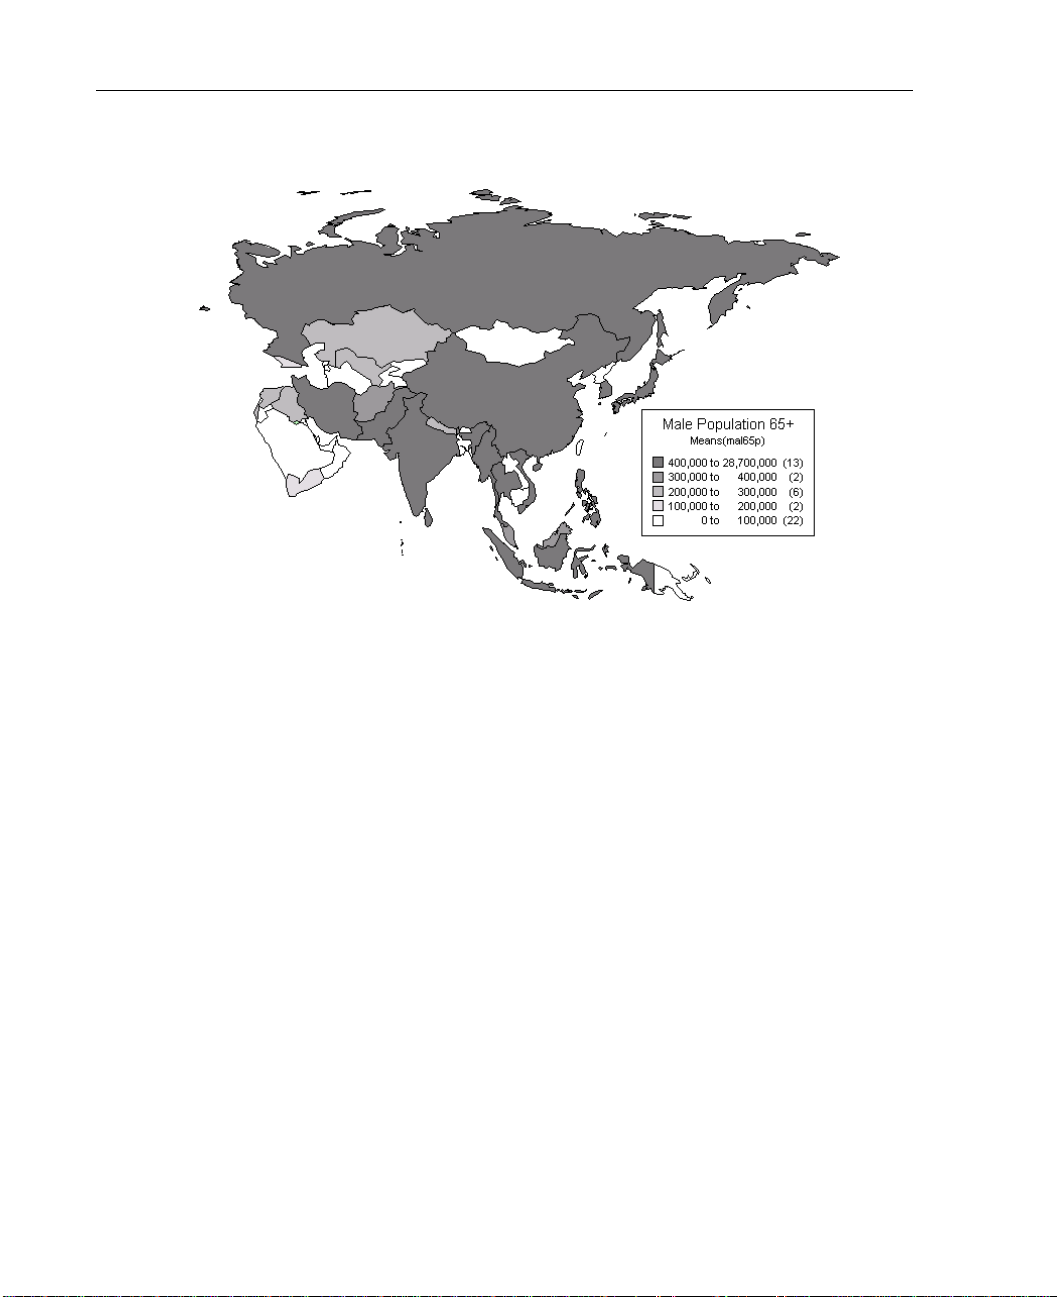
Range of values maps
33
Range of Values Maps
Allow Empty Ranges, SPSS Maps will override your
Page 46
34
Chapter 4
To Create a Range of Values Map
From the menus choose:
Graphs
Map
Range of Values…
Drag a scale variable to Ranges o f. Or leave this fi eld blank to ge t the count of cases in
each region.
Select a distribution method from Distribute Values by.
Select a summary statistic from the Ranges Represent drop-down list.
Drag a geographic variab le to Geographic Vari able. Or you can select an alt ernative data
binding method:
Select a geoset from the Geoset drop-down list.
Click the Advanced tab to select options, such as geoset layer, mismatch han dling, and
a variable to refine the geographic match.
Use X/Y Binding or Use Point Reference Table.
Page 47

Graduated Symbol Maps
Graduated symbol maps use symbols to represent values in a scale variable by
geographic region. The size of each symbol is proportional to the value for that region.
The total number of hospitals per state, for example, c an be illu strated with a med ical
icon that varies in size. Scale variables work best in graduated symbol maps.
Chapter
5
Example. You could create a graduated symbol map displaying the total amount of
federal funding spent on veterans’ hospitals per region.
35
Page 48
36
Chapter 5
Figure 5-1
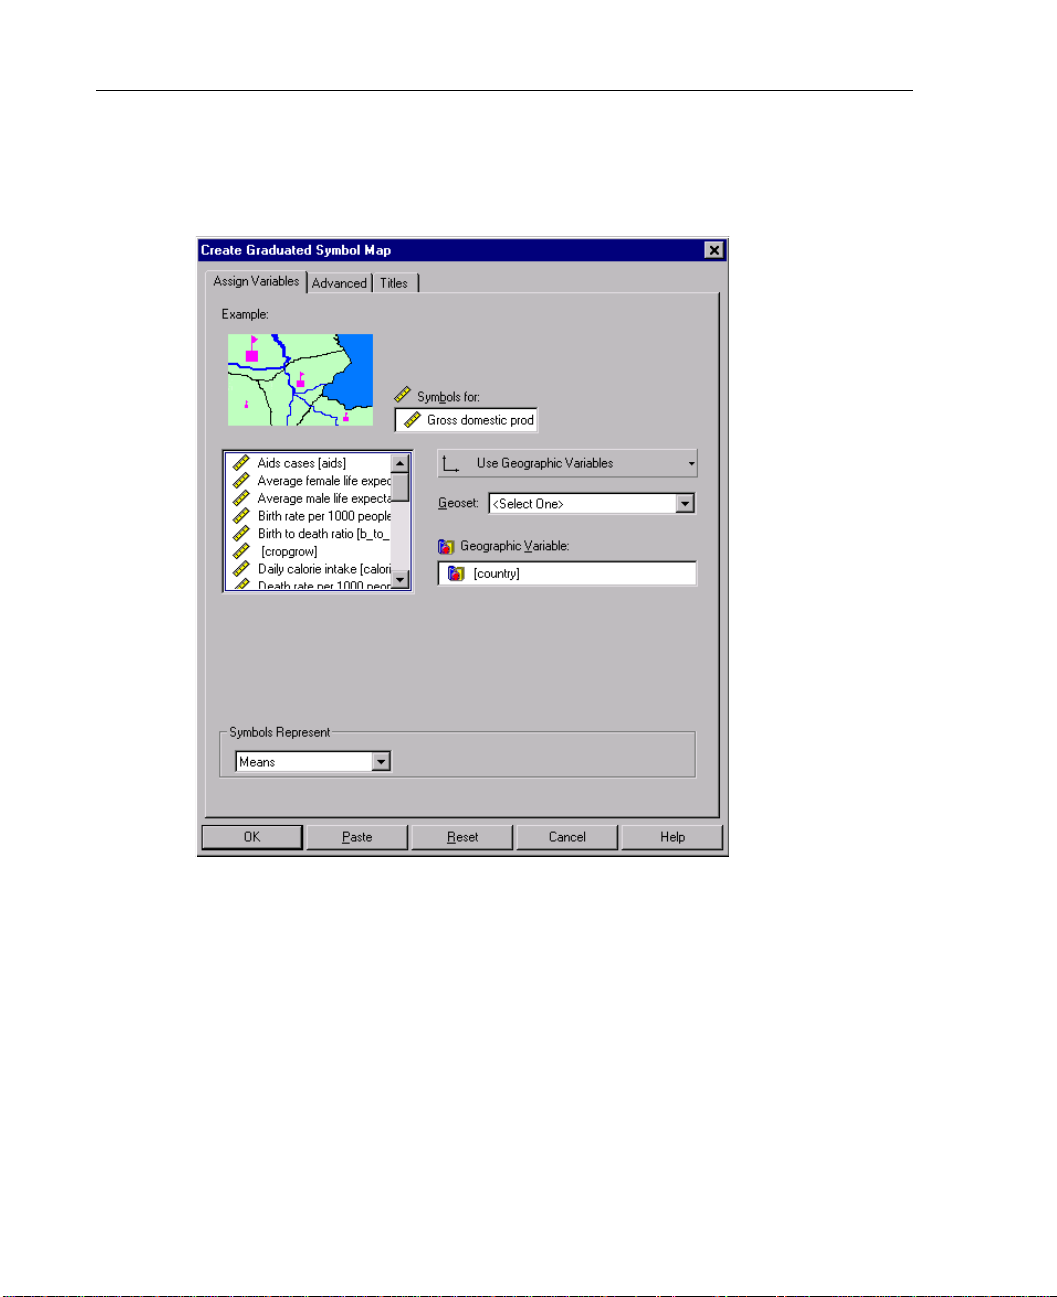
Create Graduated Symbol Map: Assign Variables tab
Symbols for. Graduates symbols according to scale variable valu es aggregated fo r each
geographic region. You can select a summary function from the
Symbols Represent
drop-down list.
Page 49
Sample Output
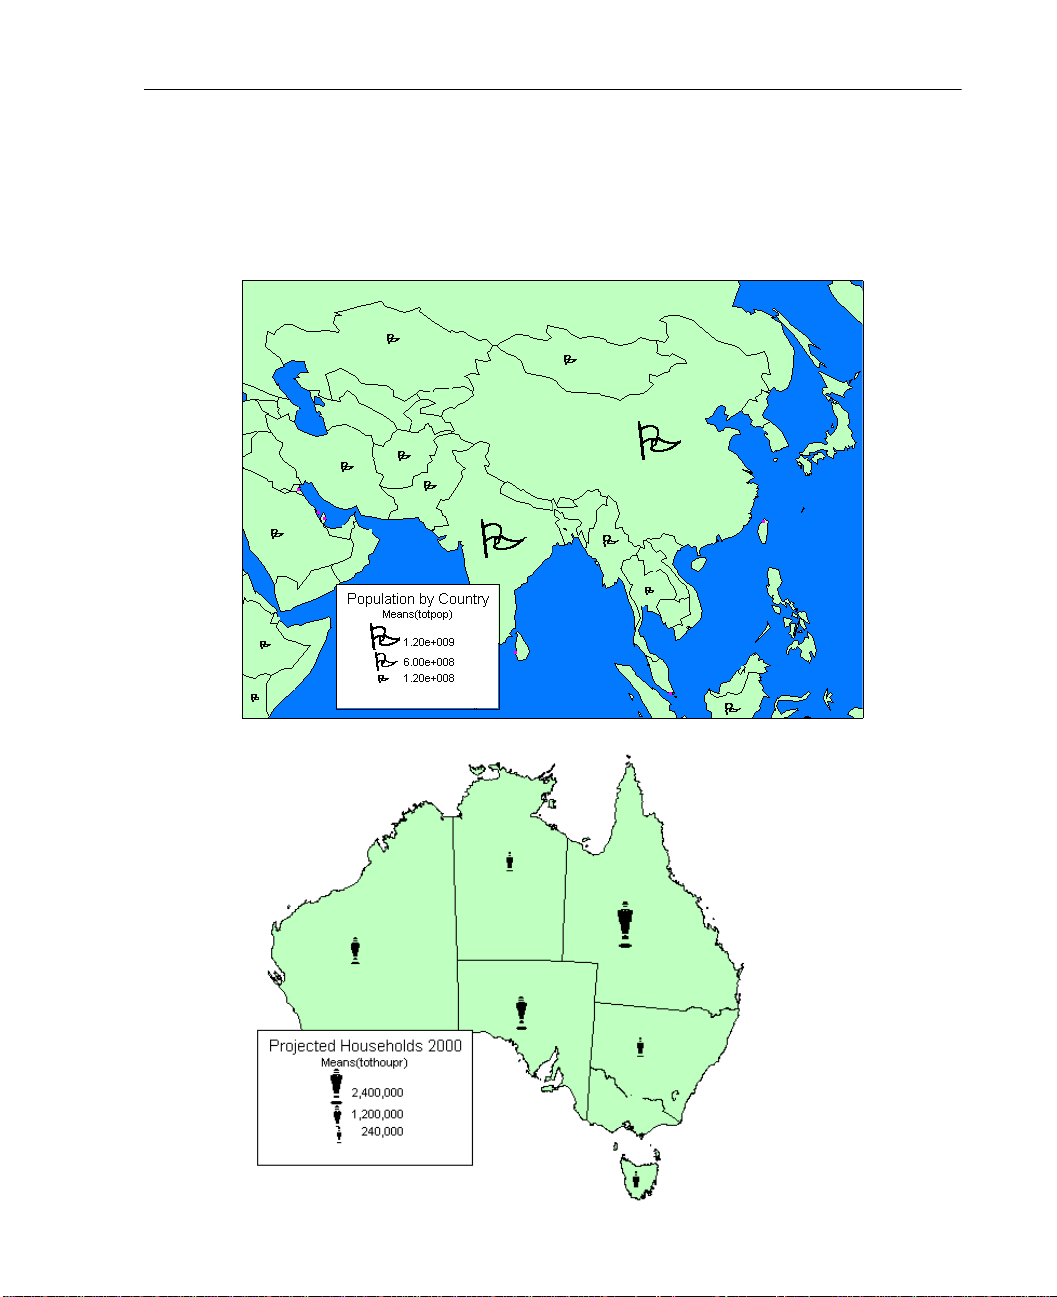
Figure 5-2
Graduated symbol maps
37
Graduated Symbol Maps
Page 50

38
Chapter 5
To Create a Graduated Symbol Map
From the menus choose:
Graphs
Map
Graduated Symbol…
Drag a scale variable to Symbols for. Or leave this field blank to show counts.
Select a summary statistic from the Symbols Represent drop-down list.
Drag a geographic variab le to Geographic Vari able. Or you can select an alt ernative data
binding method:
Select a geoset from the Geoset drop-down list.
Click the Advanced tab to select options, such as geoset layer, mismatch han dling, and
a variable to refine the geographic match.
Use X/Y Binding or Use Point Reference Table.
Page 51

Dot Density Maps
Dot density maps use dots to represent a data value within a geographic region or
boundary . The sum of dots in a region i s proportion al to the dat a value for t hat region.
For example, if you have 1000 stores in Illinois and each dot represents 10 stores,
there would be 100 dots within the state boundary. Notice that dots are distributed
randomly within a boundary. In this example, dots would not represent the exact
location of potential customers. Instead, dots indicate the total number of customers
within each geographic region.
Chapter
6
Example. To gage prospective store competition, you could create a dot density map
showing the total number of existing retailers by region.
39
Page 52
40
Chapter 6
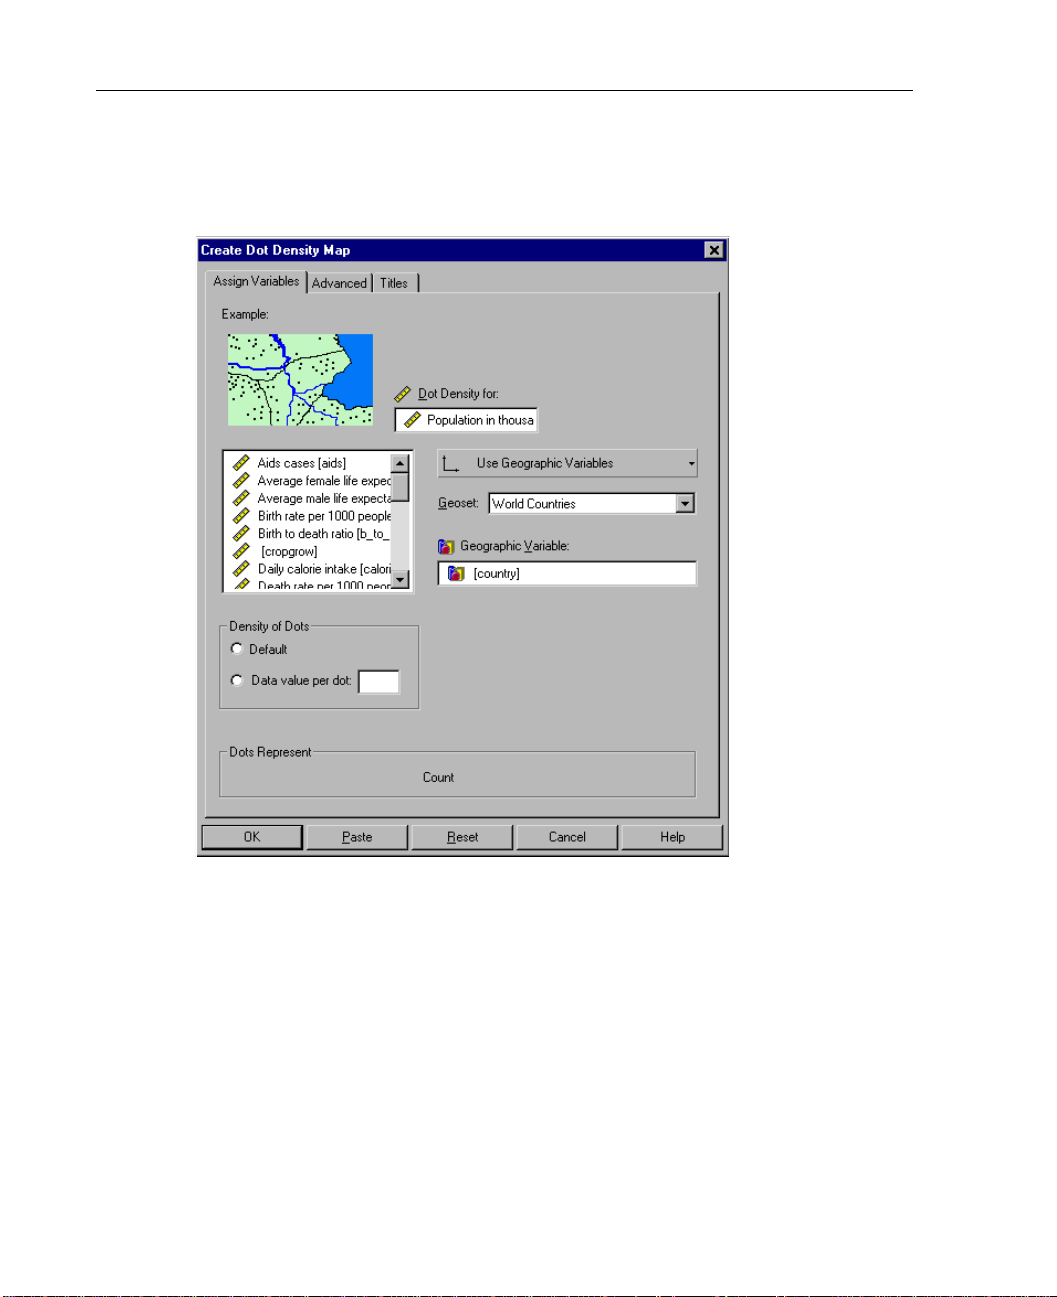
Figure 6-1
Create Dot Density Map: Assign Variables tab
Dot Density for. Di splays dots in propo rtion to the data values in a single scale variabl e.
You can select a summary function from the
Dots Represent drop-down list.
Density of Dots. Sets the data value that one dot represents.
Page 53
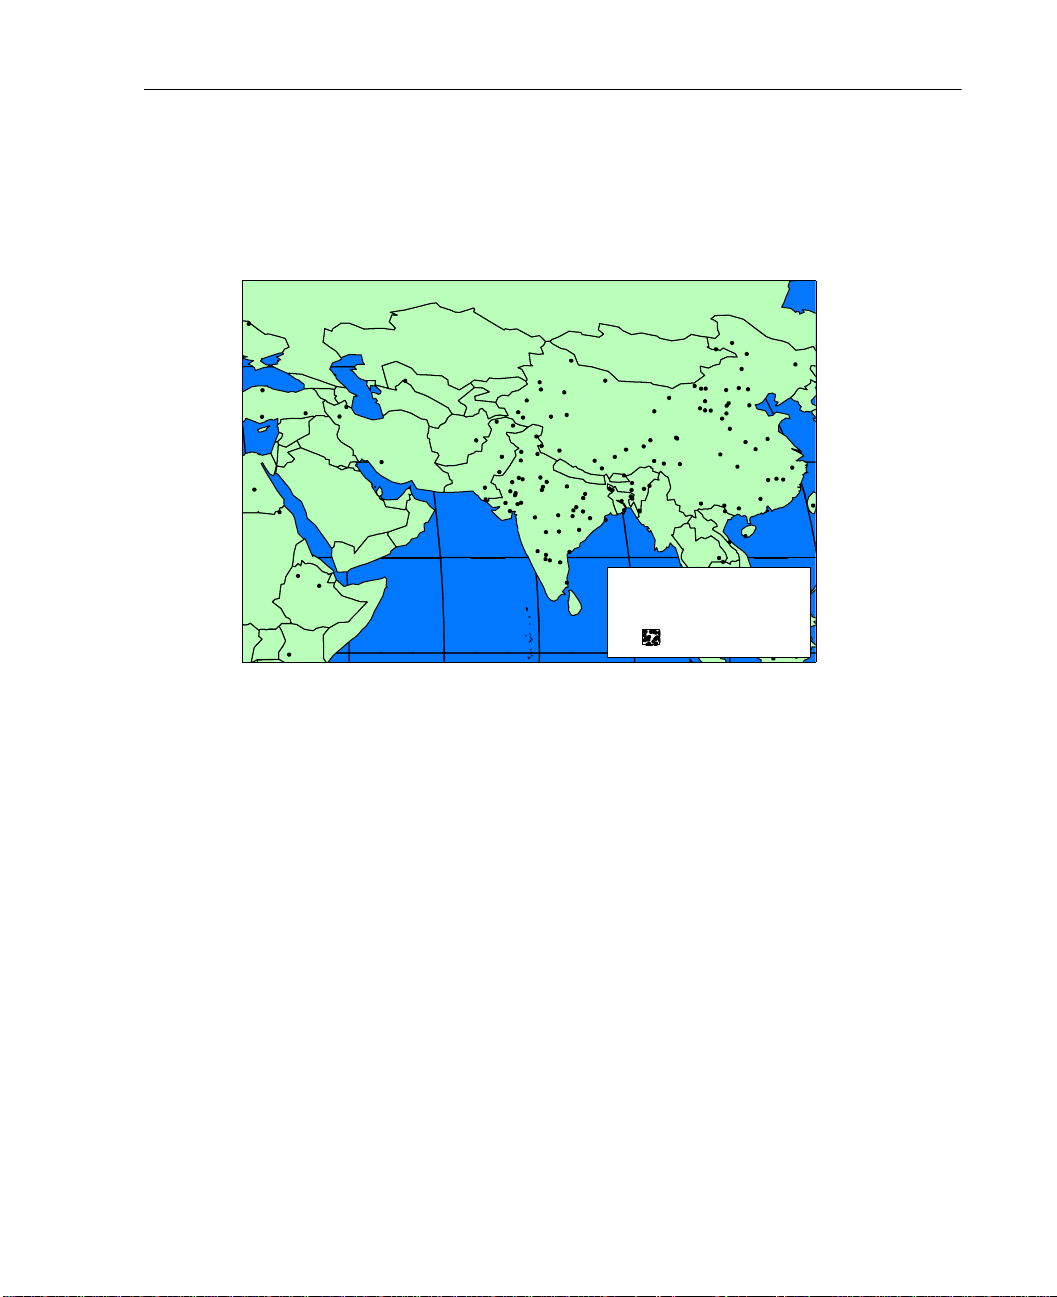
Sample Output
Figure 6-2
Dot density map
41
Dot Density Maps
World
Population in thousands
1 Dot = 20,000
To Create a Dot Density Map
From the menus choose:
Graphs
Map
Dot Density…
Drag a single scale variable to Dot Density for.
Select a summary statistic from the Dots Represent drop-down list.
Drag a geographic variable to Geog raphic Variable. Or you can sel ect an alternative data
binding method:
Select a geoset from the Geoset drop-down list.
Click the Advanced tab to select options, such as g eoset layer , mismatch hand ling, and
a variable to refine the geographic match.
Use X/Y Binding or Use Point Reference Table.
Page 54

Page 55

Individual Values Maps
Individual values maps are useful for data files i n which each case represents a singl e
geographic region, such as a different country. For example, you might have a table
that shows major export commodities by country. You could simply enter the values
from this table in the Data Editor (one variable for the country and one variable for
the commodity), and then create a map of th e data. Individual values can be displayed
for the following geographic features:
Regions (such as countries) are shaded with a color or pattern.
Points (such as cities or locations specified by x/y coordinates) are shaded by
changing symbol properties displayed on each point.
Lines (such as highways or rivers) are shaded by varying line properties.
Chapter
7
Example. You can create an individual values map showing major export commodi ty
by country.
43
Page 56
44
Chapter 7
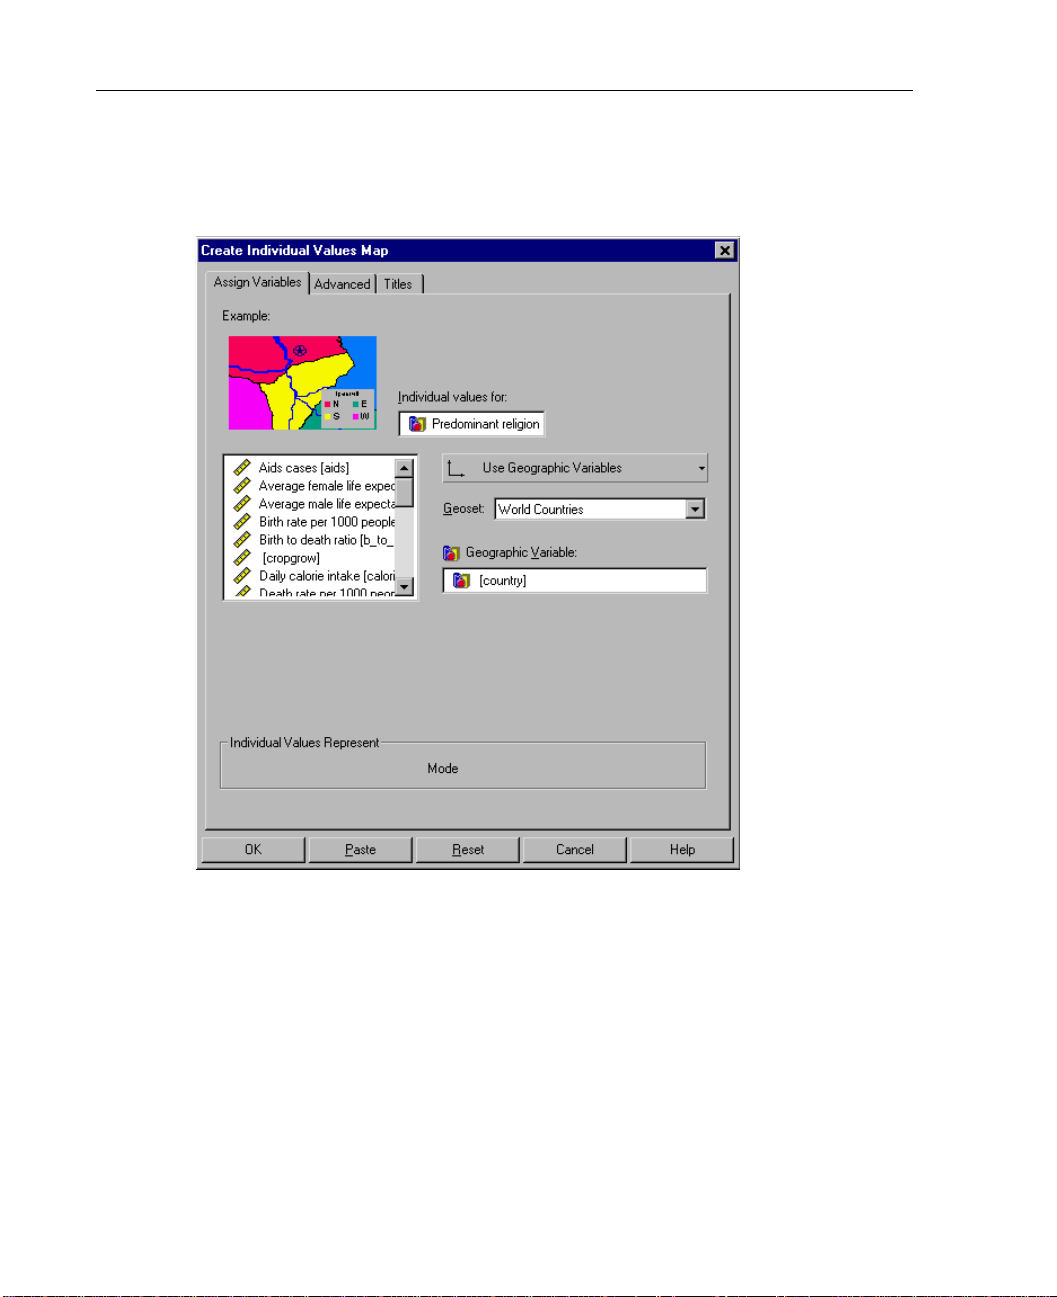
Figure 7-1
Create Individual Values Map: Assign Variables tab
Individual values for. Shades points, lines, or regions according to data values in a
variable (usually categorical).
Page 57
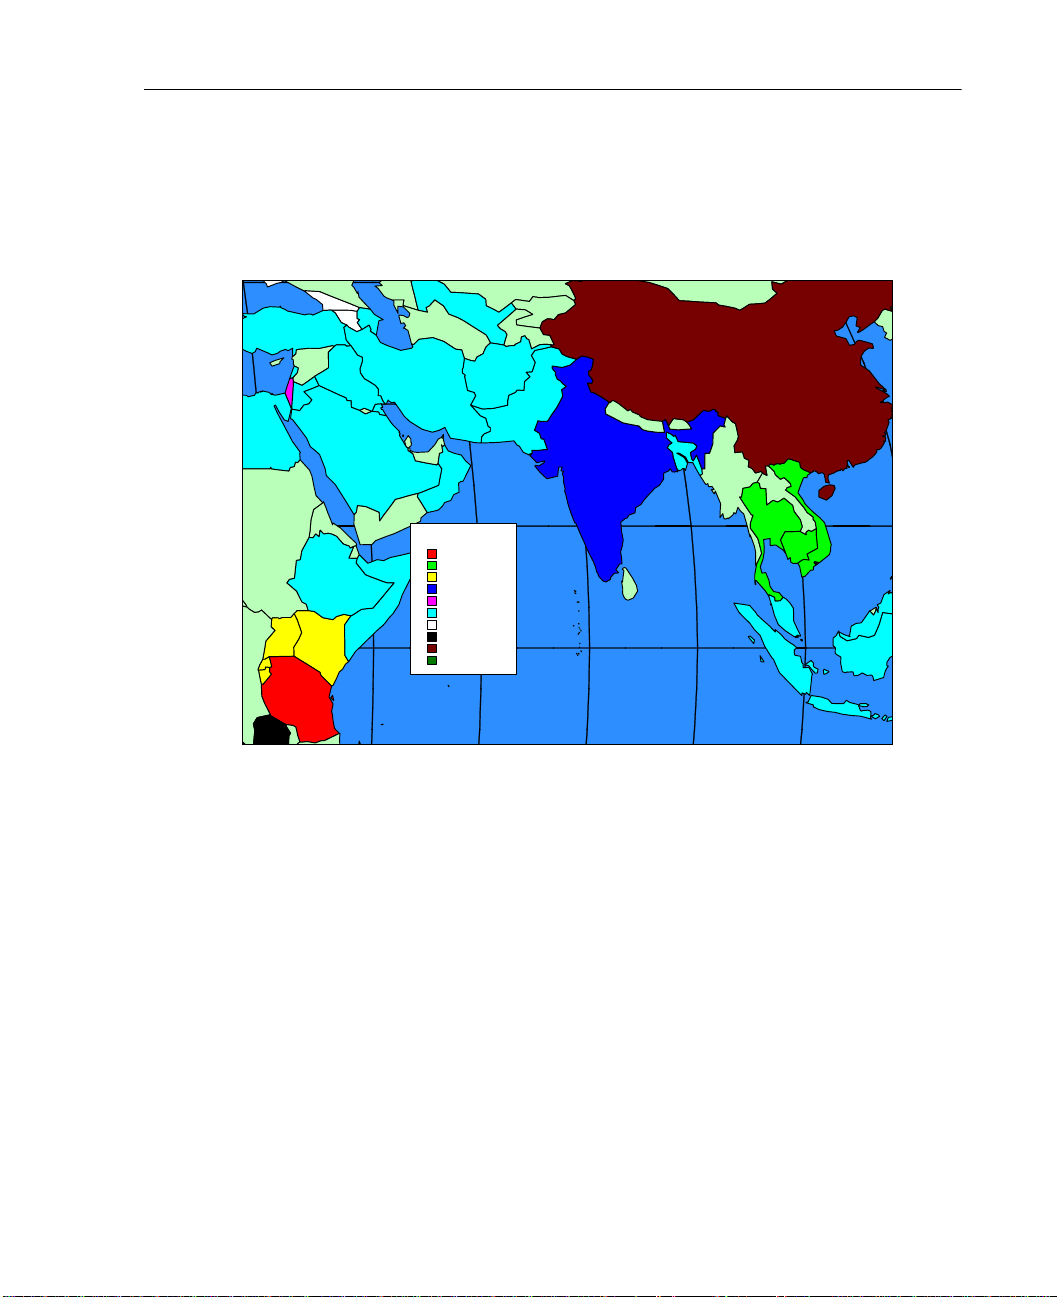
Sample Output
Figure 7-2
Individual values map
Predominant Religion
Animist (4)
Buddhist (5)
Catholic (39)
Hindu (1)
Jewish (1)
Muslim (23)
Orthodox (7)
Protstnt (12)
Taoist (2)
Tribal (1)
45
Individual Values Maps
To Create an Individual Values Map
From the menus choose:
Graphs
Map
Individual Values…
Drag a variable (usually categorical) to Individual values for.
Drag a geographic variable to Geog raphic Variable. Or you can sel ect an alternative data
binding method:
Select a geoset from the Geoset drop-down list.
Click the Advanced tab to select options, such as g eoset layer , mismatch hand ling, and
a variable to refine the geographic match.
Use X/Y Binding or Use Point Reference Table.
Page 58

Page 59

Bar Chart Maps
Bar chart maps are useful when you want to compare more than one variable or
category across a geographic area. Each variable or category is represented by a bar
plotted against a background map. Bars are located at the center of each map object
and are identified in a legend.
Chapter
8
There are three types of bar chart maps:
Bars that display counts within categories of a single cat egorical variable, such as
number of males and females.
Bars that display summary statistics for two or more scale variables, such as urban
and rural population rates.
Bars that display summary statistics for a scale variable within categories defined
by a categorical variabl e. T his typ e of bar ch ar t co ul d be u sed t o show t ot al sale s
to three different customer types within each country.
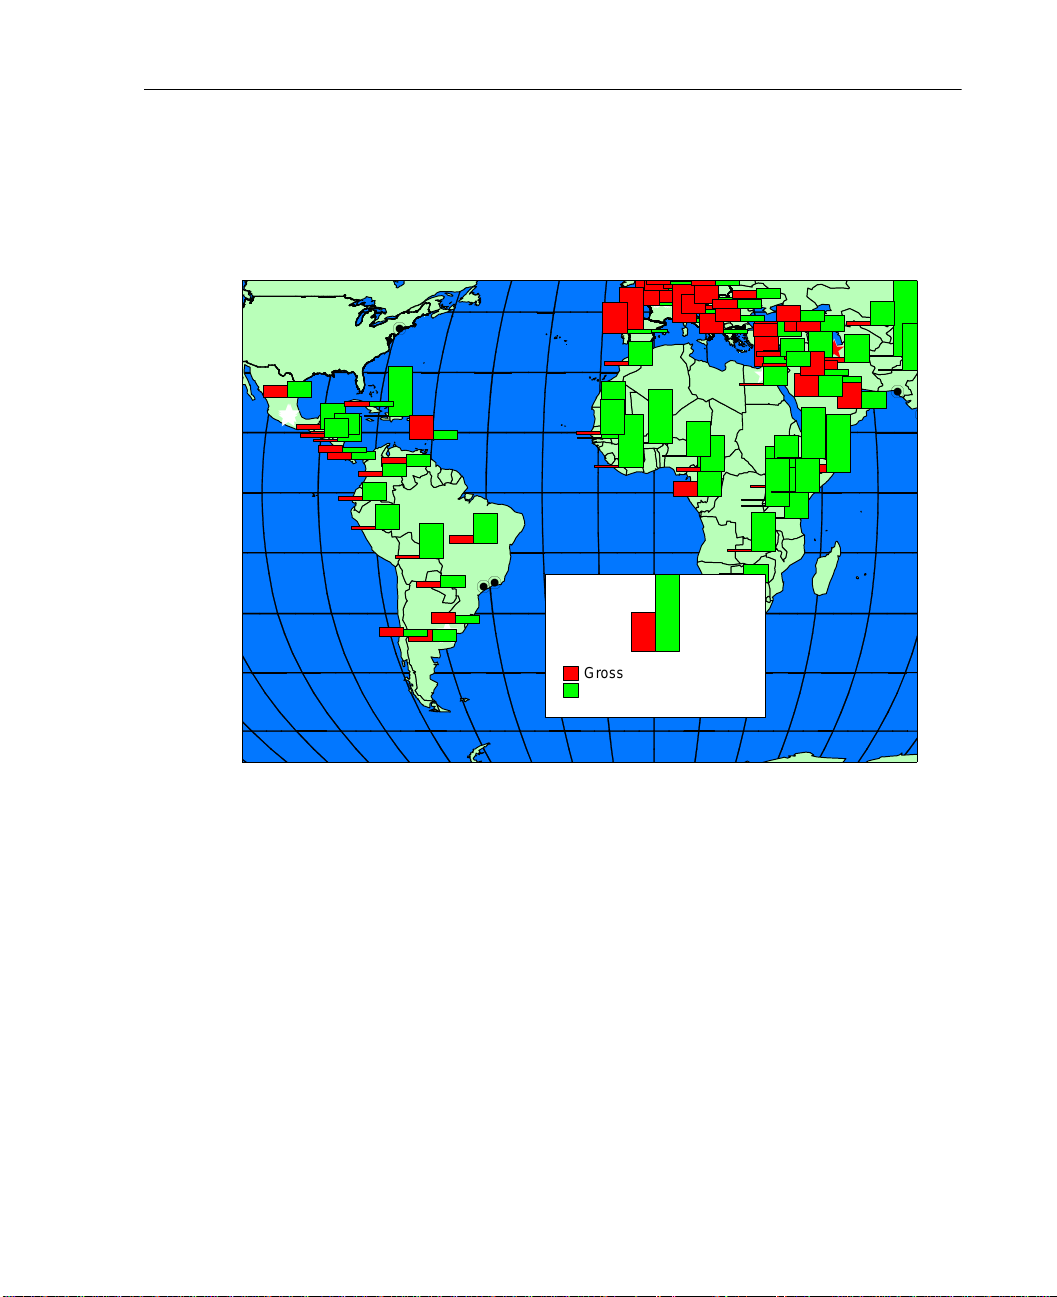
Example. You could create a bar chart map showing male and female lite racy rates by
country.
47
Page 60
48
Chapter 8
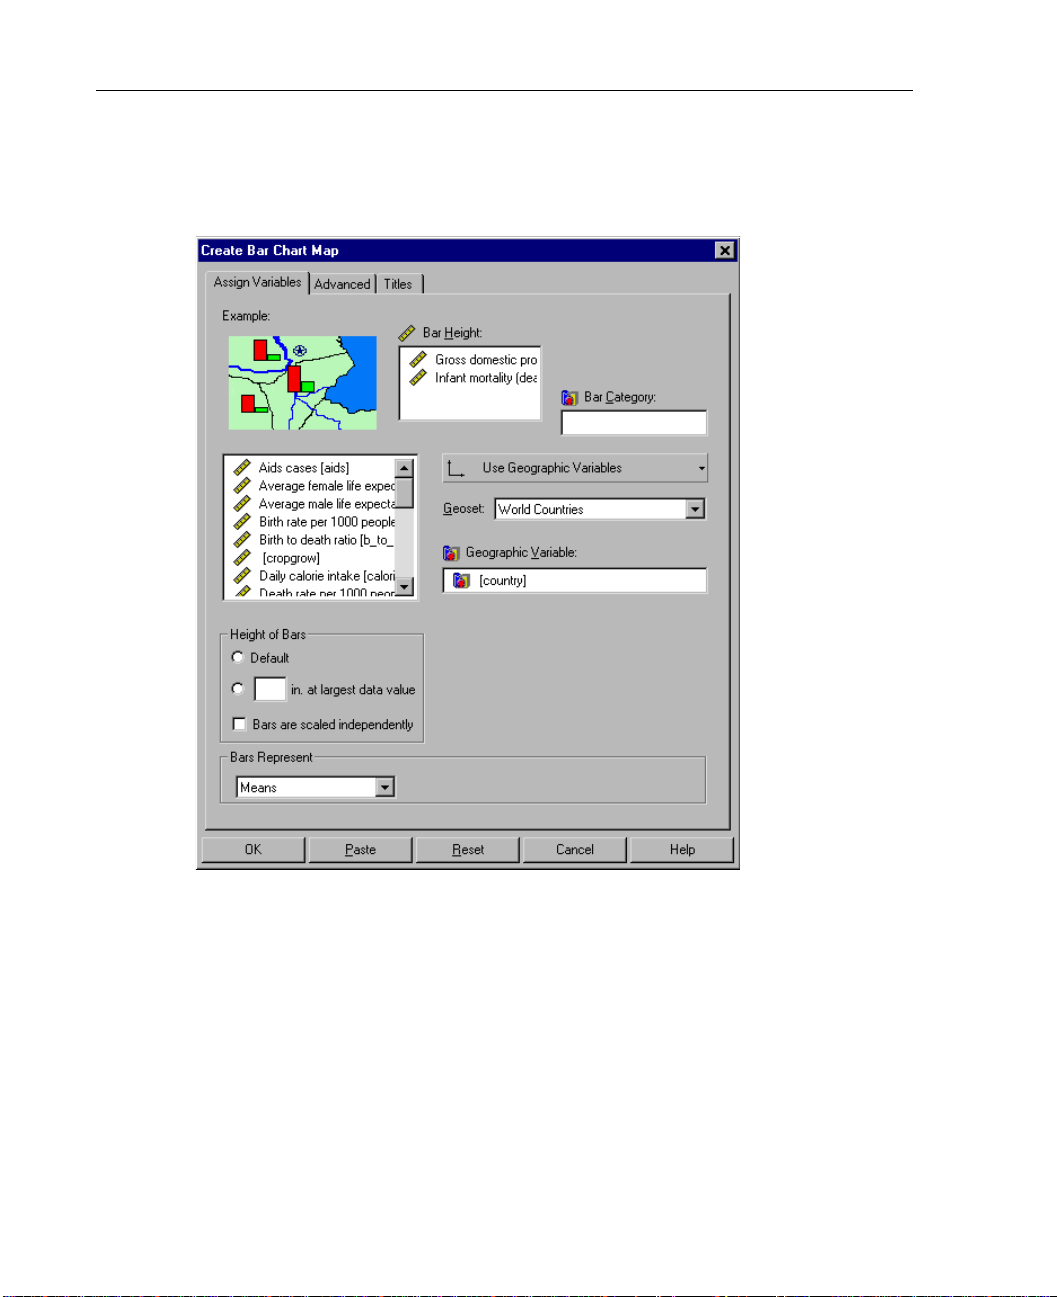
Figure 8-1
Create Bar Chart Map: Assign Variables tab
Bar Height. Creates bars of summary statistics for one or more scale variables. Leave
this target blank to get the count of cases in each geographic region. You can select a
summary function from the
Bars Represent drop-down list.
Bar Category. Creates a bar for each category of a categorical variable. Variables with
a small number of categories, such as gender, work best. If you select a bar category
variable, you can select only one bar height variable.
Height of Bars. Sets the height of the bar that represents the largest data value.
Page 61
Sample Output
Figure 8-2
Bar chart map
Bar Chart Maps
49
Gross Domestic Product
Infant Mortality
To Create Bars for Counts of a Categorical Variable
From the menus choose:
Graphs
Map
Bar…
Drag a categorical variable to Bar Category.
Drag a geographic variable to Geog raphic Variable. Or you can sel ect an alternative data
binding method:
Select a geoset from the Geoset drop-down list.
Click the Advanced tab to select options, such as g eoset layer , mismatch hand ling, and
a variable to refine the geographic match.
Use X/Y Binding or Use Point Reference Table.
Page 62

50
Chapter 8
To Create Bars of Summary Statistics for One or More Scale Variables
Drag one or more scale variables to Bar Heig ht.
Select a summary statistic from the Bars Represent drop-down list.
Select a data binding method (such as Use Geographic Variables), a geoset, and other
optional settings as appropriate.
To Create Bars of Summary Statistics for a Scale Variable within Categories
Drag a single scale variable to Bar Height.
Drag a categorical variable to Bar Category.
Select a summary statistic from the Bars Represent drop-down list.
Select a data binding method (such as Use Geographic Variables), a geoset, and other
optional settings as appropriate.
Page 63

Pie Chart Maps
Pie charts show the contribution of parts to a whole. Putting pies on a map enables
you to see how the distri bution of categor ies diffe rs by geographic r egion. A pie c hart
map summarizes categories defined by a single variable, such as the political party of
registered voters. The size of each slice represents either counts of a categorical
variable or the summary function of a scale variable within categories of a categori cal
variable.
Chapter
9
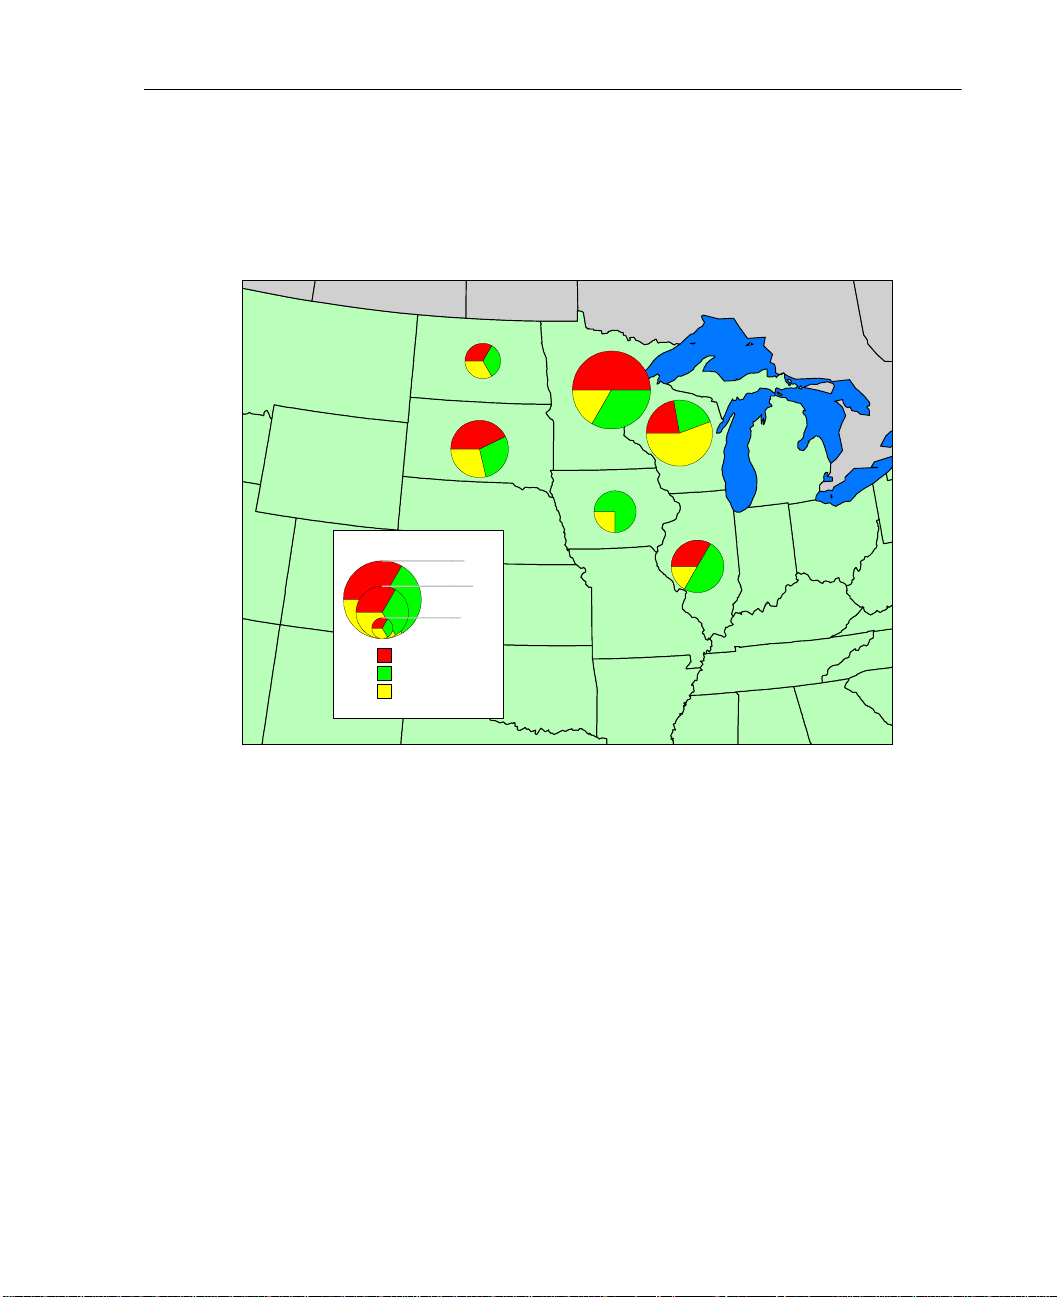
Example. You could use pie charts to display t he types of computer operat ing systems
your customers are using in each region.
51
Page 64
52
Chapter 9
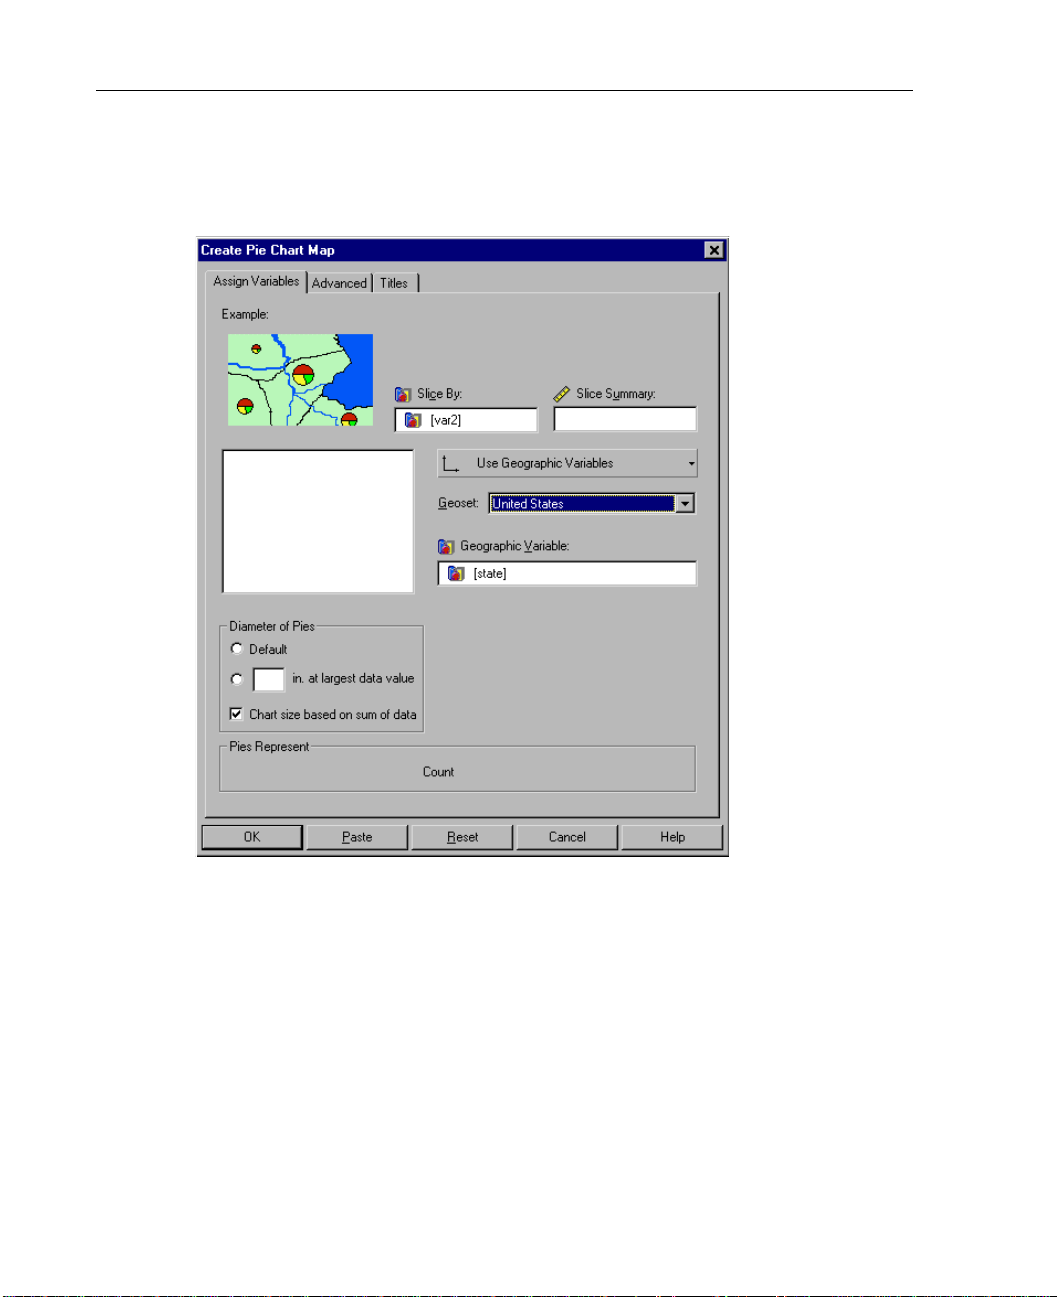
Figure 9-1
Create Pie Chart Map: Assign Variables tab
Slice By. Creates pie slices for each category of a categorical variable.
Slice Summary. Determines the size of each slice by the summary function of a scale
variable. You can select a summary function from the
Pies Represent drop-down list.
Leave this target empty to display counts for a categorical variable.
Diameter of Pies. Sets the diameter of pies relative to the largest data value. Select Chart
size based on sum of data to graduate pies, in dicating th e sum of the values represen ted
for each pie. Pies are sized in proportion to the total value of their slices so t hat you can
compare the distribution of values across regions as well as within a region.
Page 65
Sample Output
Figure 9-2
Pie chart map
53
Pie Chart Maps
Customer Satisfaction
High
Low
Medium
12
1.2
To Create a Pie Chart Map
From the menus choose:
Graphs
Map
Pie…
Drag a categorical variable to Slice By.
Optionally, you can drag a scal e variable to Slice Sum mary to create a pie in which each
slice represents the value of a summary fun ction for the scale variable for that categ ory.
6
Page 66

54
Chapter 9
Select a geoset from the Geoset drop-down list.
Click the Advanced tab to select options, such as geoset layer, mismatch han dling, and
Drag a geographic variab le to Geographic Vari able. Or you can select an alt ernative data
binding method:
Use X/Y Binding or Use Point Reference Table.
a variable to refine the geographic match.
Page 67

Multiple Theme Maps
Y ou can create a map wi th multiple chart types, or “themes.” For example, i f you want
to show sales revenue and distribution cost pe r customer region, you could use ran ges
of values to show revenue and bar charts to show distribution costs. The bar charts
would be displayed on top of th e shaded ranges, but each theme would ha ve a separate
legend.
To create a map with multiple themes, you need to select a geographic variable and
geoset. These selections will apply to all themes.
Chapter
10
Note: Map themes can be added only during creation. You should create all themes
you would like to explore in the output map.
Click the tab for each theme type to assign variables.
Select Invisible to aggregate data for a theme you might want to show during
editing.
Click the Advanced tab to sel ect a geoset l ayer, a vari able to re fine the geo graphic
search, and mismatch options.
You can add, delete, or change both invisible and visible themes during editing.
55
Page 68
56
Chapter 10
Figure 10-1
Create Multiple Theme Map dialog box
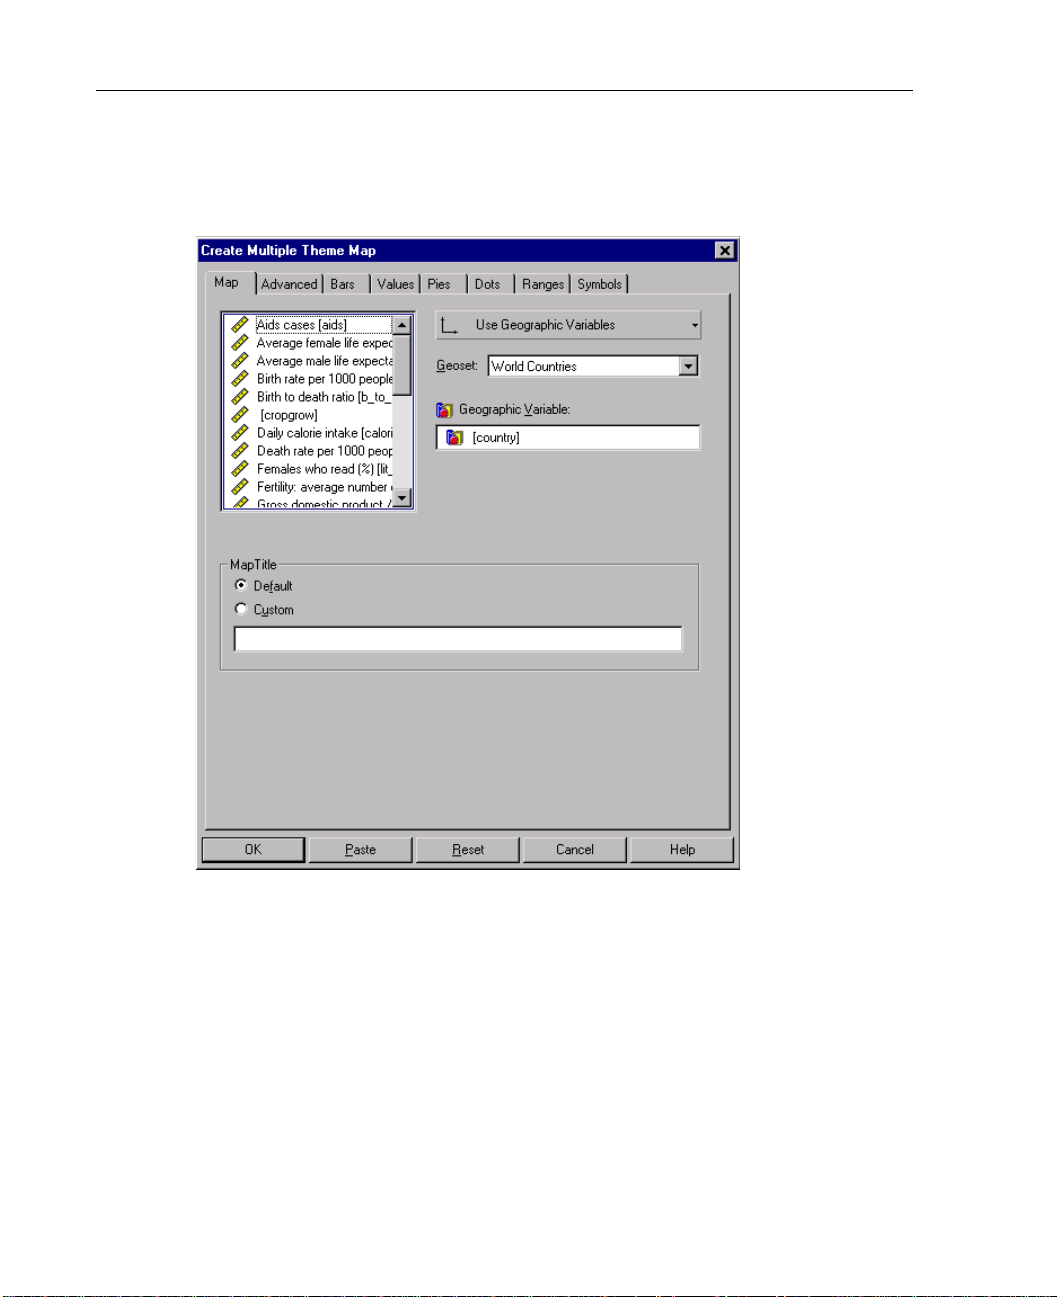
Geographic Variable. A geographic variable, such as country or region, that matches
your data to a key column in the geoset.
Geoset. A geoset determines the background map and is crucial for data binding. All
geosets in the SPSS Maps directory are listed here. All theme types will use the
selected geoset.
Map Title. Select Custom to create your own map title.
Page 69
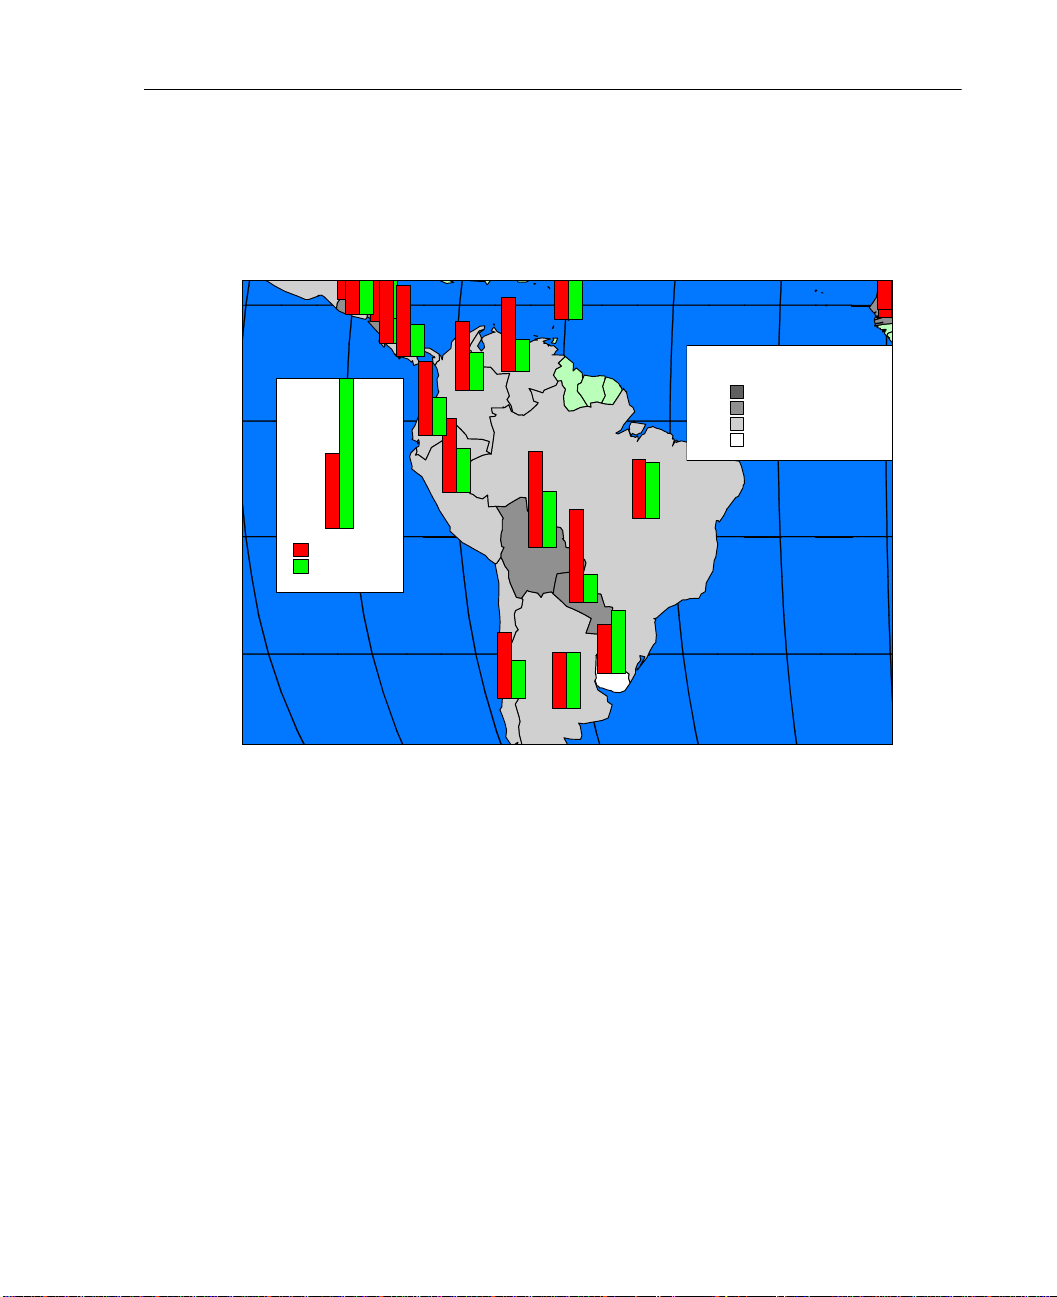
Sample Output
Figure 10-2
Multiple theme map
Birth Rate
Death Rate
Multiple Theme Maps
Population Increase (%)
3.84 to 5.24 (1)
2.46 to 3.84 (27)
1.08 to 2.46 (35)
-0.3 to 1.08 (33)
57
To Select Common Controls for a Multiple Theme Map
From the menus choose:
Graph
Map
Multiple Themes…
Click the Map tab.
Drag a geographic variable to Geog raphic Variable. Or you can sel ect an alternative data
binding method:
Select a geoset from the Geoset drop-down list.
Use X/Y Binding or Use Point Reference Table.
Page 70

58
Chapter 10
Click the appropriate tab to create each theme type.
Click the Advanced tab to select options, such as geoset layer, differenti ating variable,
and mismatch handling.
Adding Themes to a Multiple Theme Map
In multiple theme maps, each theme type has a tab on wh ich you can select v ariab les,
summary functions, and other options. You can either select
to get started or drag a variable to the target box. You can also choose to create an
invisible theme that can be displayed during editing.
After selecting geographic variables and a geoset on the Maps tab, you can add
themes to the map. For example, you could click the
theme.
Add this theme to th e m ap
Dots tab to add a dot density
Page 71
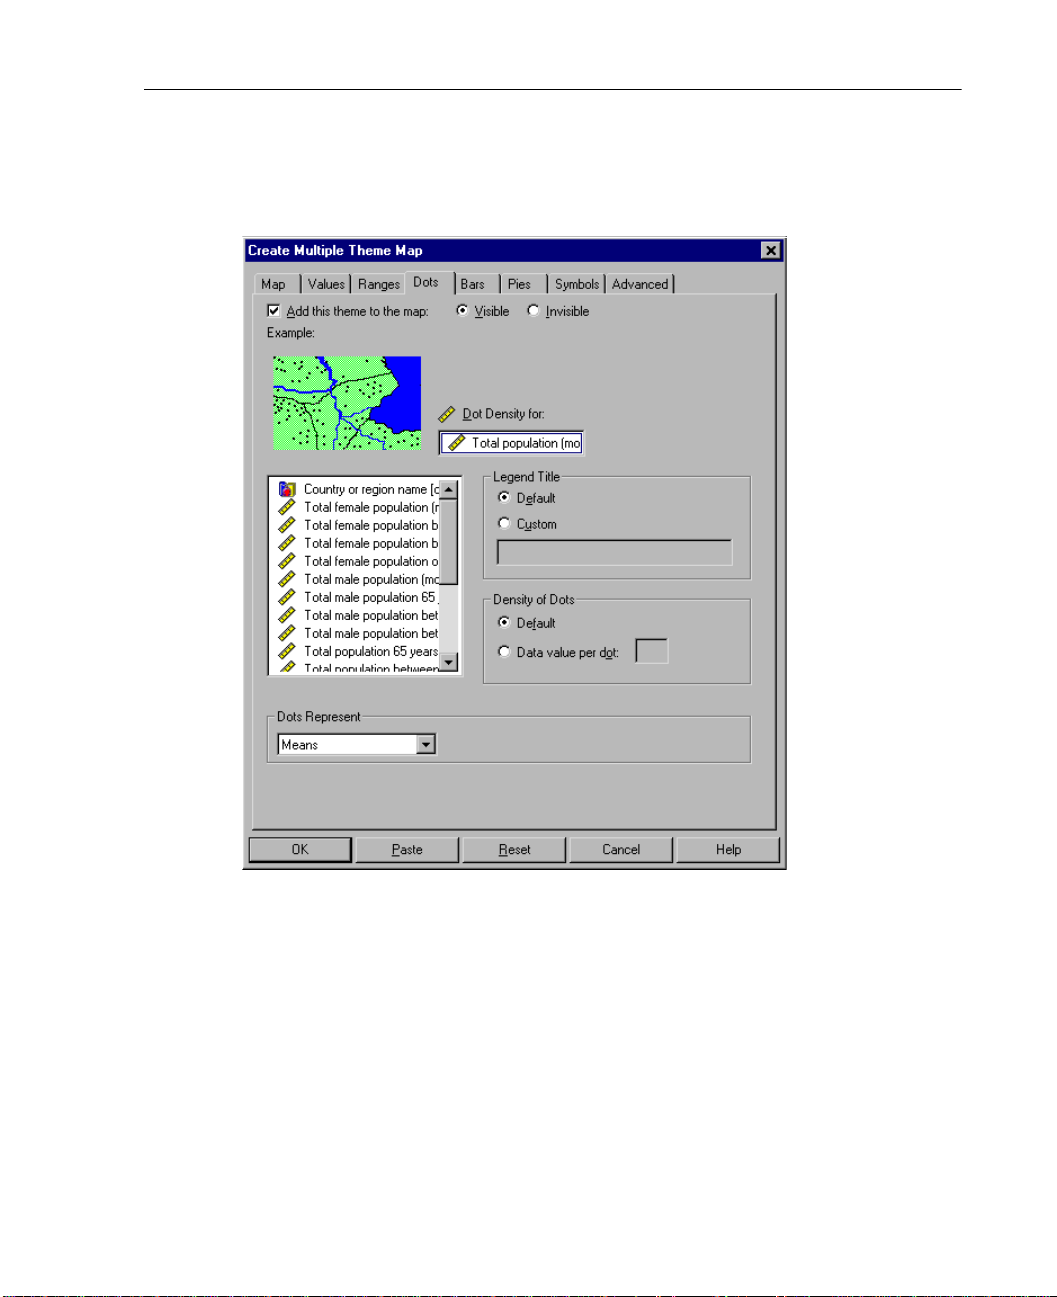
Figure 10-3
Create Multiple Theme Map: Dots tab
59
Multiple Theme Maps
Add this theme to the map. Select Visible to include the theme in t h e output map. Select
Invisible to aggregate data for this theme but hide it in the output map. You can show,
hide, modify, or delete invisible and visible themes during editing.
Dot Density for. Displ ays dots in pr oporti on to the da ta val ues in a singl e scale vari able.
Legend Title. Creates a custom legend title for each theme type.
Density of Dots. Sets the data value that one dot represents.
For detailed information about creating othe r themes, see the chapter about each theme
type.
Page 72

60
Chapter 10
To Add Themes to a Multiple Theme Map
From the menus choose:
Graphs
Map
Multiple Themes…
Click the appropriate tab to add a theme type.
Drag a variable (or variables) to the appropriate targets.
Select a summary statistic from the drop-down list.
To suppress the initial display of the theme, select Invisible. This option is useful when
you are unsure which themes will work best but still want to aggregate data for later
use during editing.
Click the Advanced tab to select o ptions, such as ge oset layer , differ entiat ing va riable,
and mismatch handling.
Page 73

Modifying Thematic Maps
Thematic maps have two components: theme layers and map layers.
Theme layers include bar charts, pie charts, ranges of values, individual values,
graduated symbols, and dots. Theme layers can be modified using the Theme
Control.
Map layers include geoset compone nts, such as oceans, cities, and high ways. Map
layers can be modified using the Layer Control.
Chapter
11
X/Y and point reference binding create both map layers and theme layers. The layer
of points (showing location of stores, facili ties, etc.) created from x and y coordinates
can be modified using the Layer Control. Themes bound to this layer (for example,
bar charts showing sales by store location) can be modified using the Theme Control.
61
Page 74
62
Chapter 11
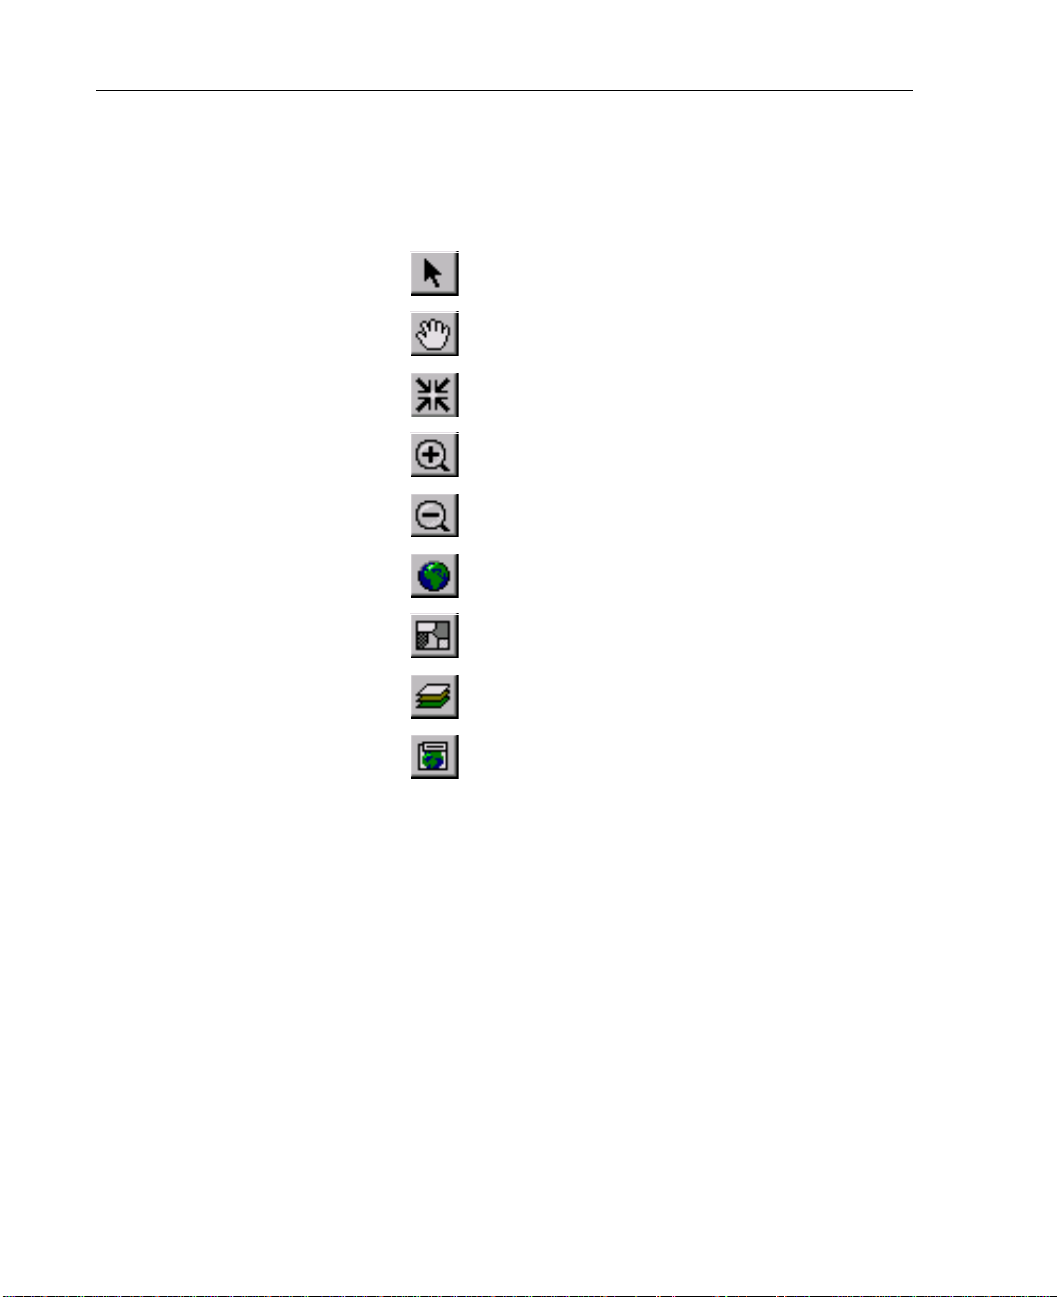
When you activate a thematic map, the editing toolbar appears. The editing tools
allow you to zoom, center, pan, and open the Theme and Layer Controls.
Pointer
Hand Pan
Center Map
Zoom In
Zoom Out
Display Entire Map
Themes
Map Layers
Map Title
Modifying Themes Using the Theme Control
Y ou can change theme properties for each theme type in a map. Each t heme has unique
properties, such as symbol color , bar height, and dot size, that c an be changed using t he
properties dialog box for each theme.
Note: Thematic laye rs cannot be added during editing. Usin g multiple theme maps, you
can create additional themes and choose to display or hide them in the final map.
Page 75
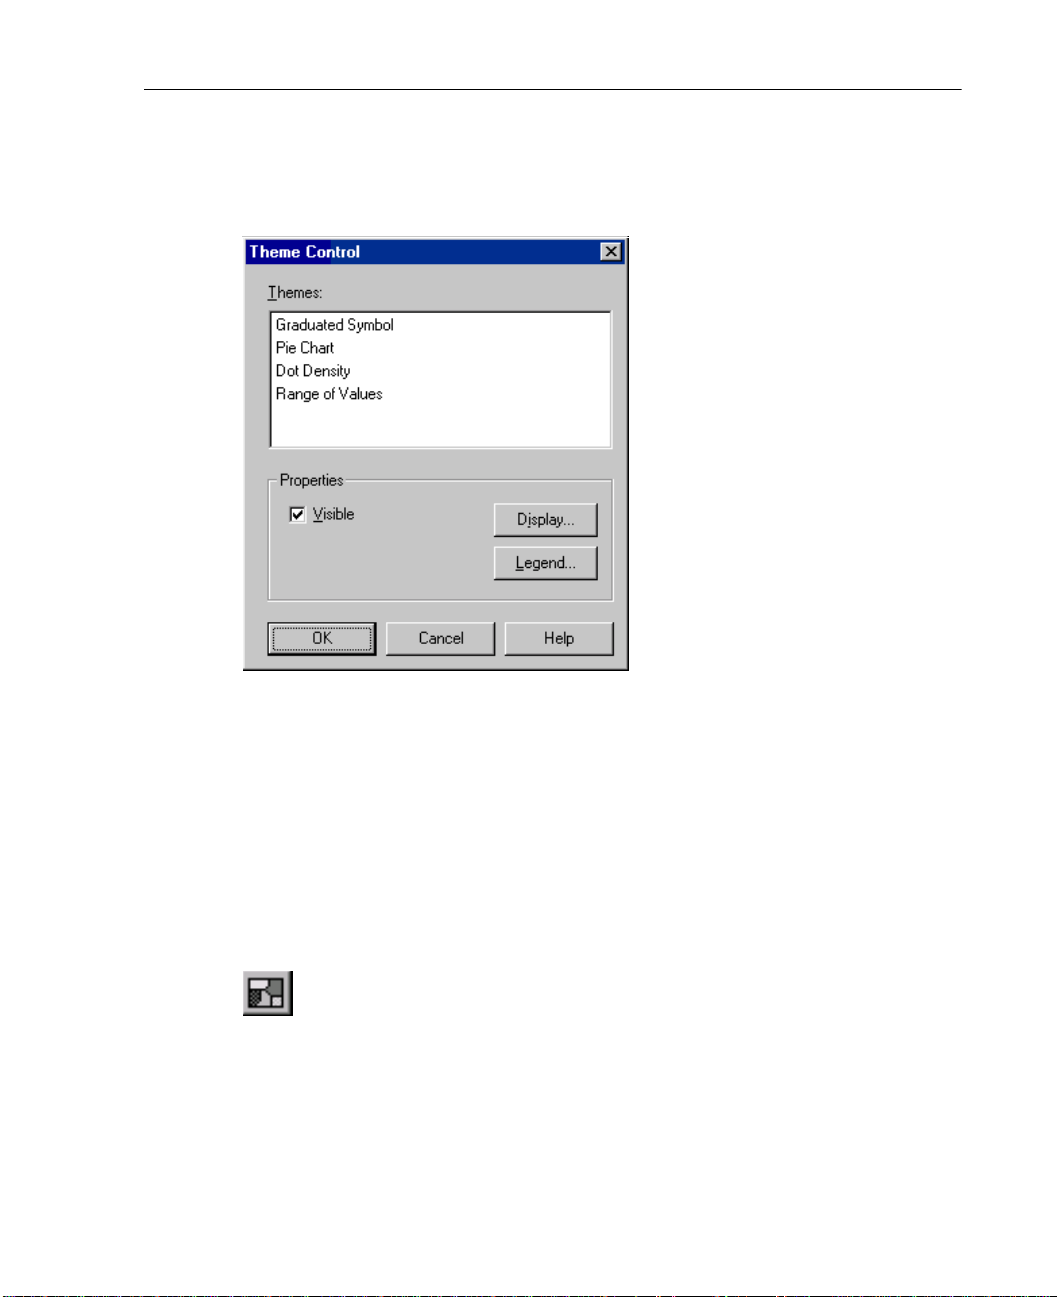
Figure 11-1
Theme Control dialog box
63
Modifying Thematic Maps
Themes. All themes in the activated map are listed here.
Properties. Properties for the selected theme can be changed by clicking Display or
Legend. Deselect Visible to hide a theme in the map.
To Modify Themes
Activate the map (double-click it).
Click the Themes tool on the toolbar.
Select a theme in the list.
Click Display to edit theme properties.
Page 76
64
Chapter 11
Click Legend to edit legend options for each theme.
Optionally, you can hide or show theme layers by clicking the Visible check box.
Range of Values Properties
In a range of values map, you can change range properties and distribution as well as
the range of fill colors. For each type of range of values map, there are two color values
available that represent the minimum and maximum data value.
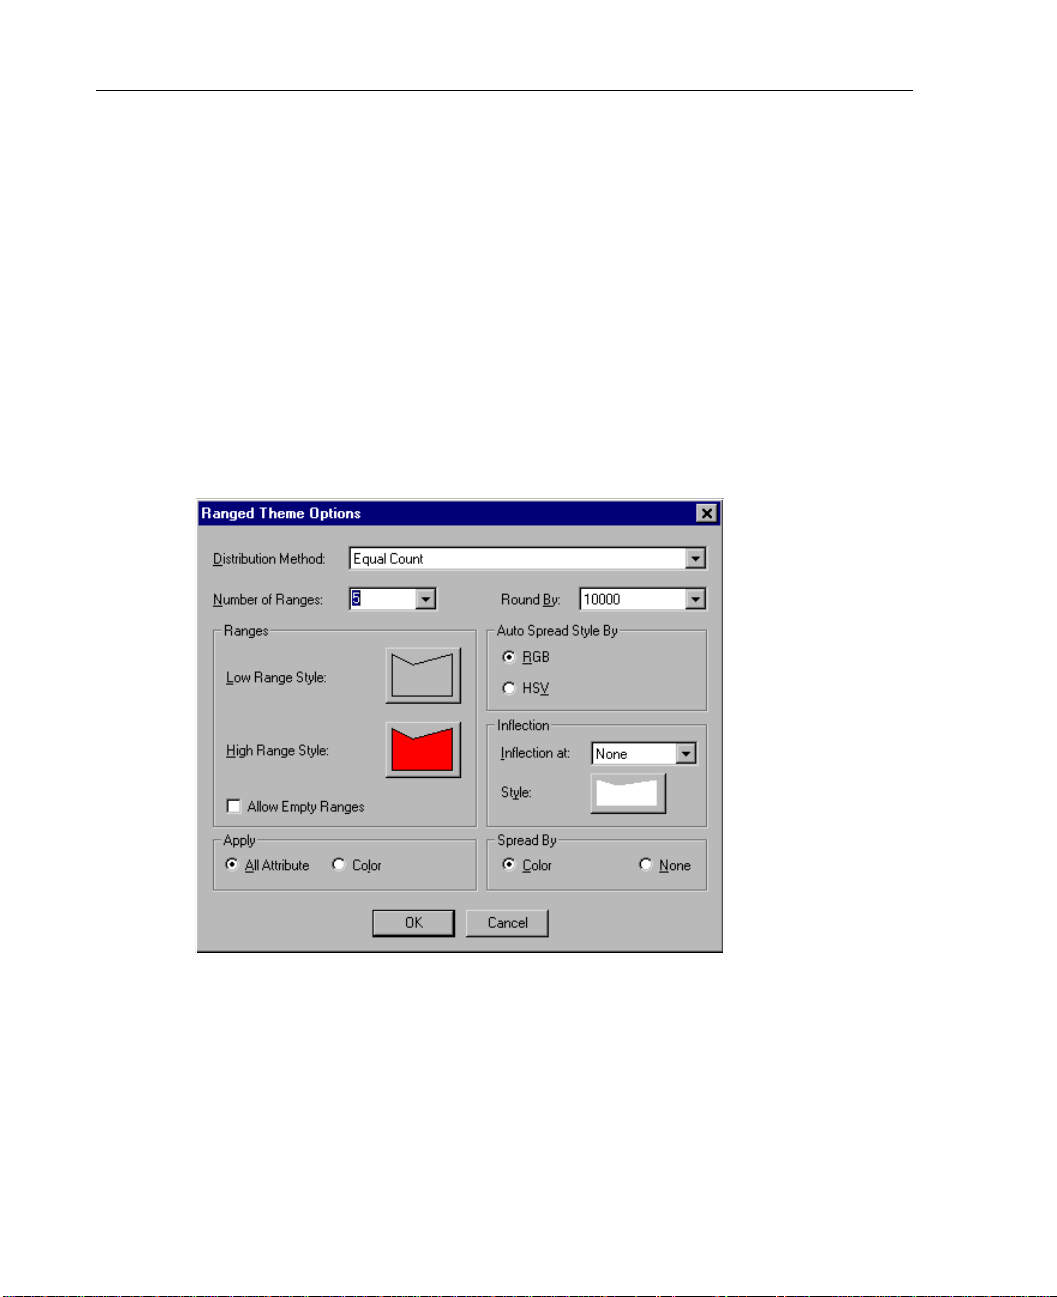
Figure 11-2
Ranged Theme Options dialog box
Distribution Method. Changes the method of distributing data values into ranges.
See Chapter 4 for more information about distribution methods.
Number of Ranges. Breaks data values into a specified number of ranges. Enter a
number of ranges or select one from the drop-down list.
Round By. Rounds range values to the decimal of your choice.
Page 77

Modifying Thematic Maps
Ranges. Low and high range colors for fill progression. To apply all style attributes,
such as fill color and pattern, select
All Attribute. Selecting Color will apply only color
choices and ignore pattern choices.
Allow Empty Ranges. Allows empty ranges to be created.
Auto Spread Style By. Sets a color model used to spread colo r between the low and high
ranges. Choose
Inflection. An inflection point separates the ranges i nto two sec tions. The colo rs in the
RGB (red, green, blue) or HSV (hue, saturation, value ).
ranged theme will spread from the top range color to the inflection color , and then from
the inflection color to the bottom range color.
Spread By. Controls how autospreading is done for ranged thematic maps. You can
spread ranges by color (when binding to a region layer) or size (when binding to a poin t
layer).
To Modify Range of Values Themes
Select Range of Values in the theme list.
65
Click Display to edit theme properties.
Select the settings you want to change, such as style prope rties, range distribution, and
inflection.
Click Legend to edit legend options for each theme.
Individual Values Properties
In an individual values map, you can change fill, symbol, and line properties,
depending on the type of individual values map. For example, for a map showing
political domina nce by city, the individ ual values might appear as shade d points on a
map. You can edit the symbo l style, size, fill, and rotation at these points. F or a map
showing types of major roadways in Europe, each highway might have different line
properties that you could adjust.
Page 78
66
Chapter 11
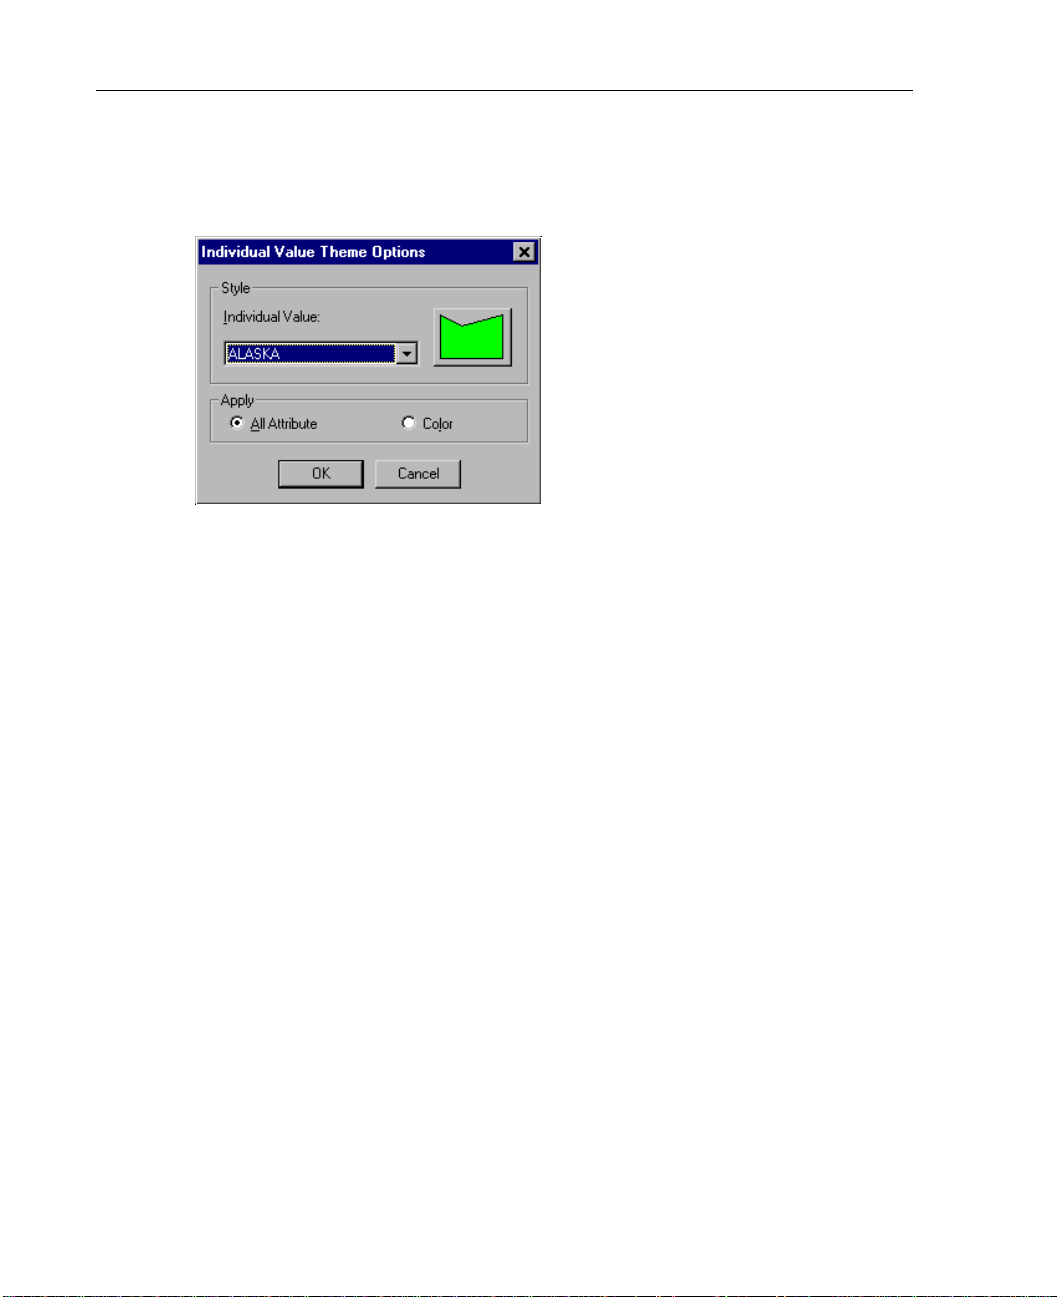
Figure 11-3
Individual Value Theme Options dialog box
Style. In maps bound to a region layer , such as category by country, you can change fill
color and border styles. Click the style button for each category to specify options.
Apply. To apply all style attributes, such as fill color and pattern, select All Attribute.
Selecting
Color will apply only color choices and ignore pattern choices.
To Modify Individual Values Themes
Select Individual Values in the theme list.
Click Legend to edit legend options for each theme.
Click Display to edit theme properties.
To select style options for each category:
Select a category from the drop-down list.
Click the style button to change style options for the region, point, or line layers.
Page 79
Line Style Properties
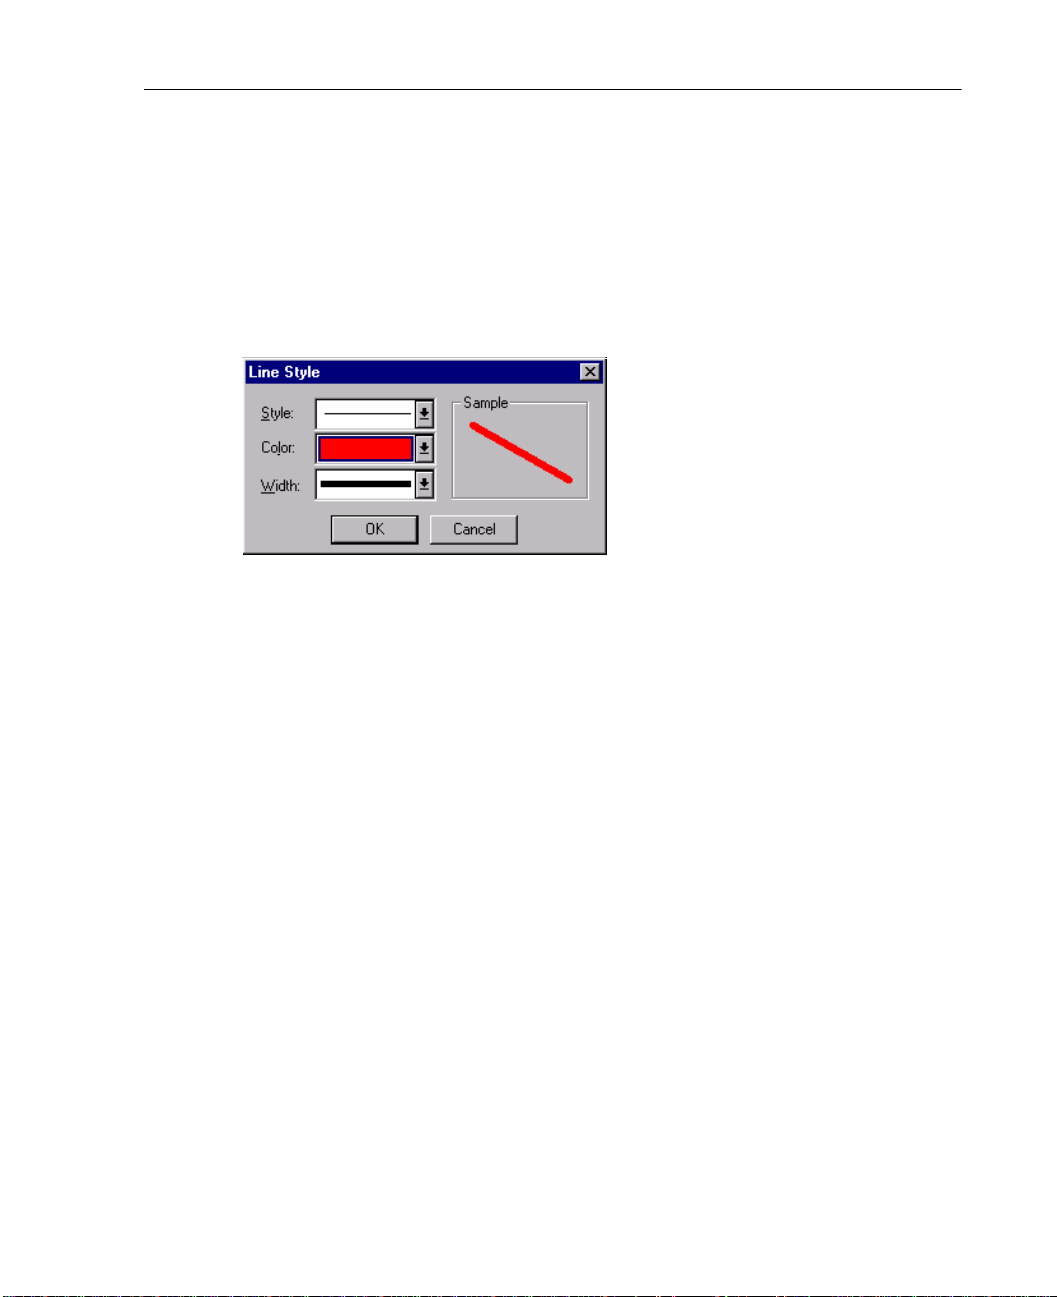
For individual value themes bound to a line laye r, such as highways, you can edit line
style properties for each category.
Figure 11-4
Line Style dialog box
Style. Applies a style from the list to all lines.
Color. Sets line color.
67
Modifying Thematic Maps
Width. Sets the width (weight) of lines.
To Change Line Style Properties
Click the line style button.
Select the settings you want to change, such as line style, color, and width.
Graduated Symbol Properties
In a graduated symbol map, you can chang e the look and size of symbo ls disp layed in
each region.
Note: Changes apply to all symbols on the theme layer.
Page 80
68
Chapter 11
Figure 11-5
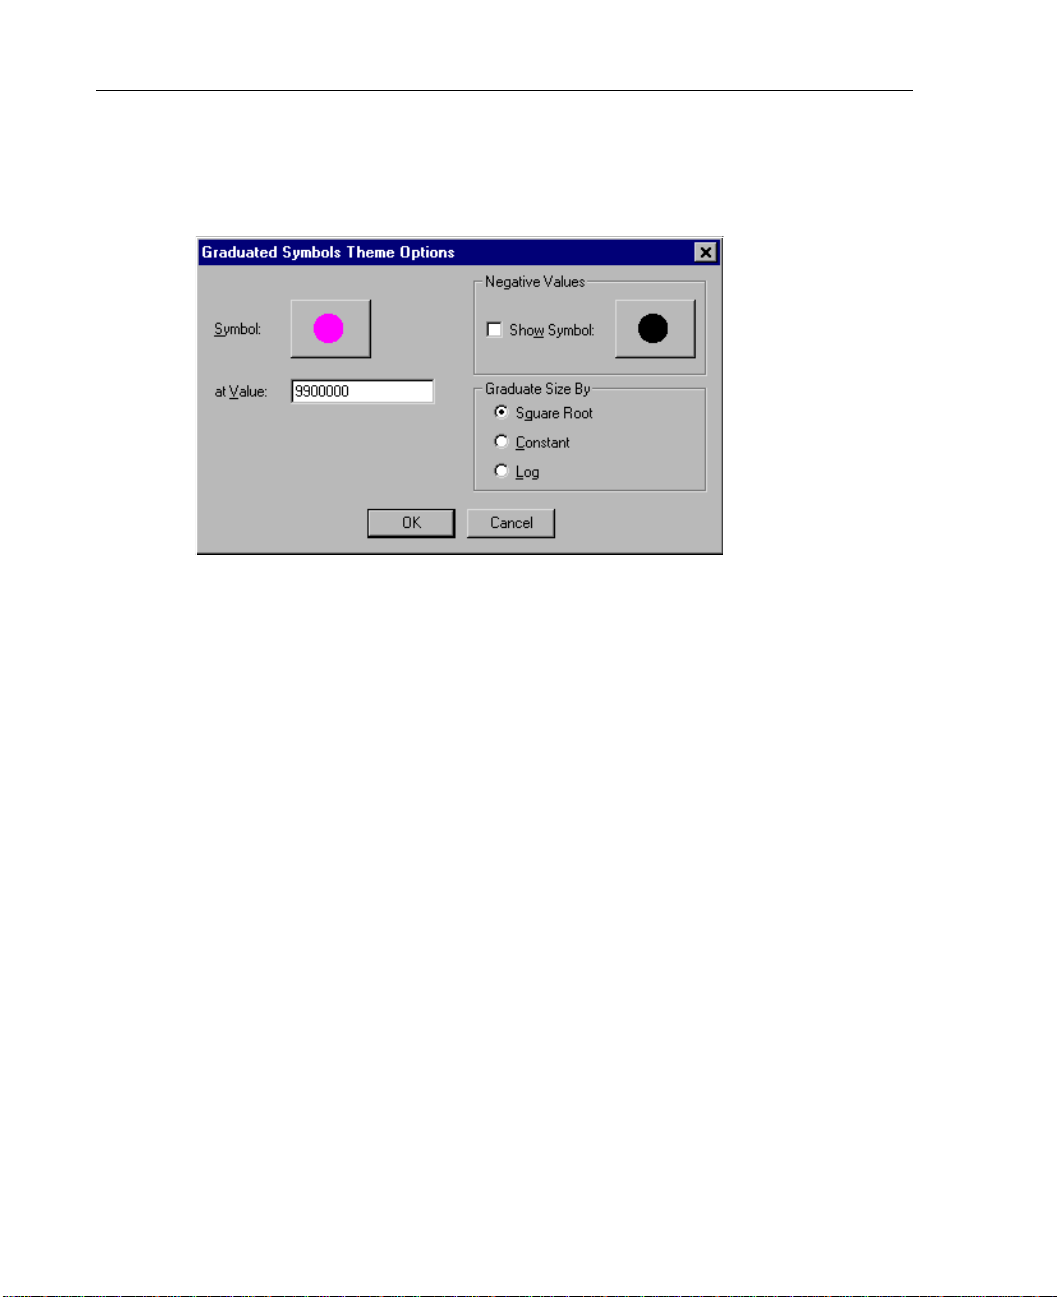
Graduated Symbols Theme Options dialog box
Symbol. Click the symbol style button to change symbol options, such as:
Font, size, and color of the chosen symbol
Rotation angle for all symbols
Background color and effects
At Value. Sets a d ata val ue for the symb ol size de fined i n the Symbol Style di alog box.
For example, you could set the size of the largest symbol at 36 and the data value for
the largest symbol at 1000 00. Choosing a data val ue lower than the lar gest value in th e
data will cause the largest symbol to be larger than specified.
Negative Values. Sets a symbol to display at negative data values. Click the symbol
button to select a symbol.
Graduate Size By. Graduates bar size according to a square roots scale, a constant
(linear) scale, or a logarithmic scale.
To Modify Graduated Symbol Themes
Activate the map (double-click it).
Click the Them es tool on the toolbar.
Select Graduated Symbol in the theme list.
Page 81
Click Legend to edit legend options for each theme.
Click Display to edit theme properties, such as data value of the largest symbol.
Click the symbol style button to change font, size, color, rotation, background, and
effects.
If desired, select a symbol to display for negative values.
Optionally, you can choose a scale to graduate symbol size.
Symbol Style Properties
For graduated symbol the mes, you can edit symbol properties for di splay in the current
map.
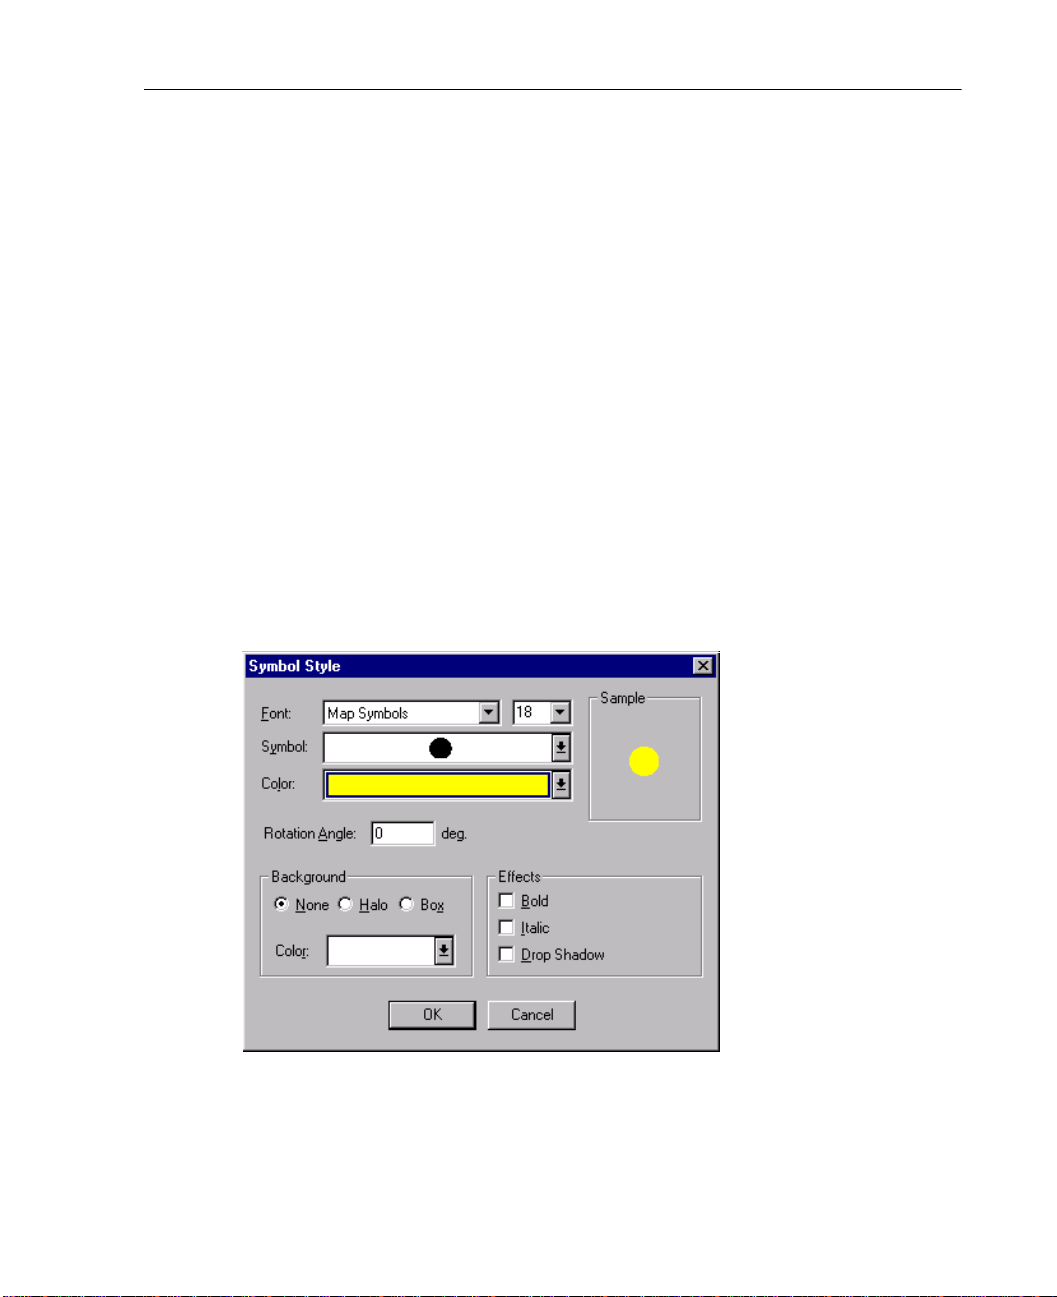
Figure 11-6
Symbol Style dialog box
69
Modifying Thematic Maps
Style. Sets font, size, symbol, and color options.
Rotation Angle. Rotates all symbols according to the degree you specify.
Page 82
70
Chapter 11
Background. Creates a halo or box in the color of your choice for all symbols.
Effects. Adds effects, such as bold, italic, and drop shadow.
To Change Symbol Style Properties
Click the symbol style button.
Select the settings you want to change, such as font style, symbol, background, and
rotation.
Dot Density Properties
In a dot density map, you can change data va lue per do t. You can also specify the size
of dots.
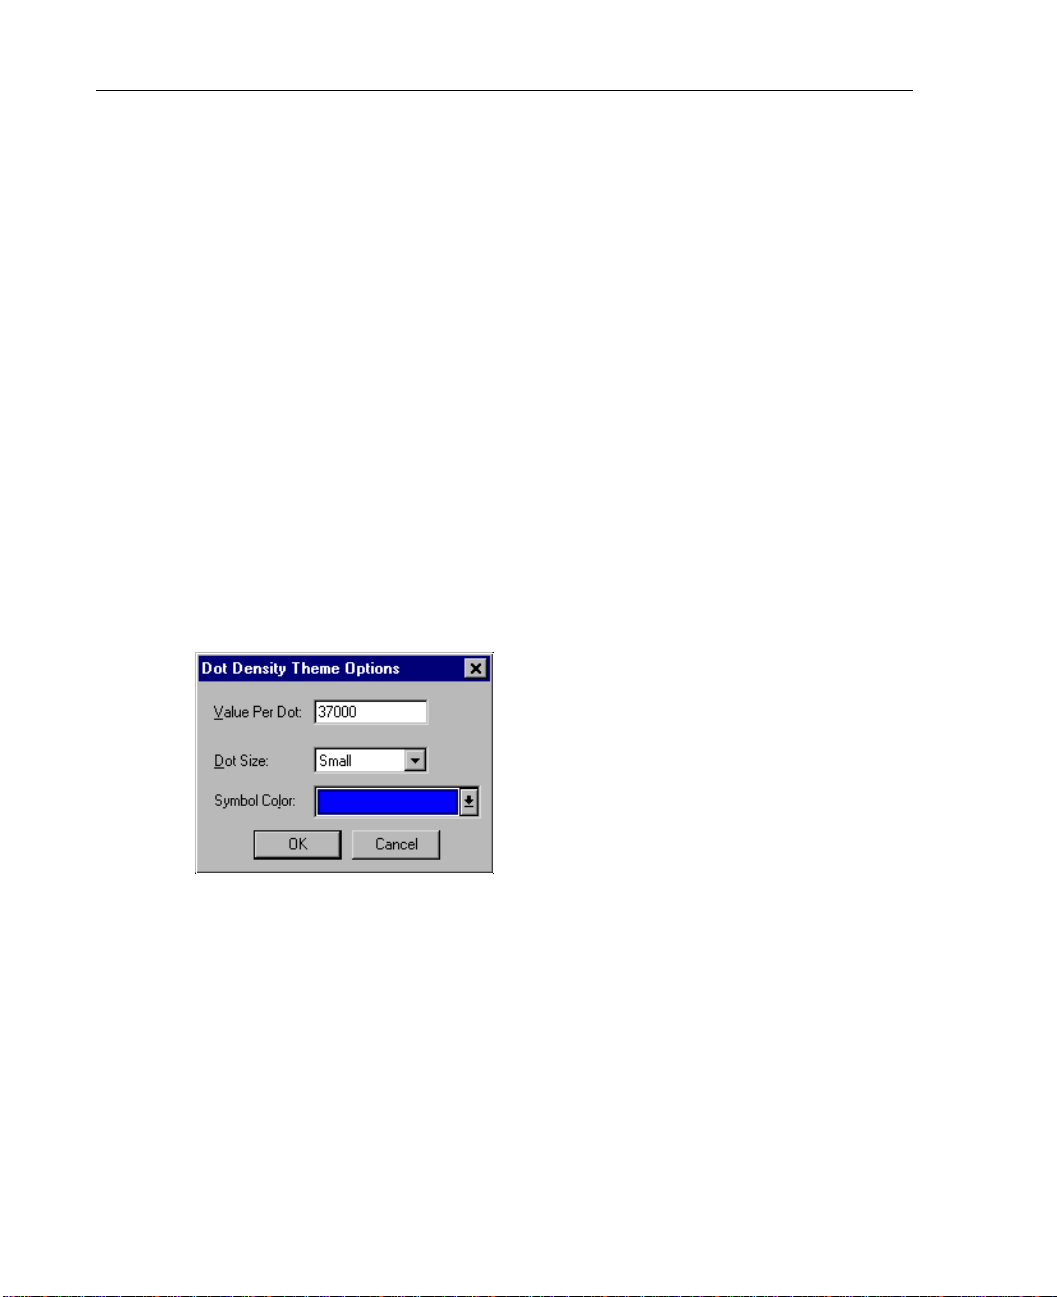
Figure 11-7
Dot Density Theme Options dialog box
Value Per Dot. Sets the value of each dot. For example, each dot could represent 1000.
Dot Size. Displays small or large dots. Using small dots can reduce clutter if you have
a high dot density.
Symbol Color. Sets a color for dots.
Page 83
To Modify Dot Density Themes
Select Dot Density in the theme list.
Click Legend to edit legend options for each theme.
Click Display to edit theme properties.
Select the settings you want to change, such as dot size, color, and data value.
Bar Chart Properties
In a bar chart map, you can modify bar size, fill progression, st yle, and border . You can
also set the size of bars relative to values in the data.
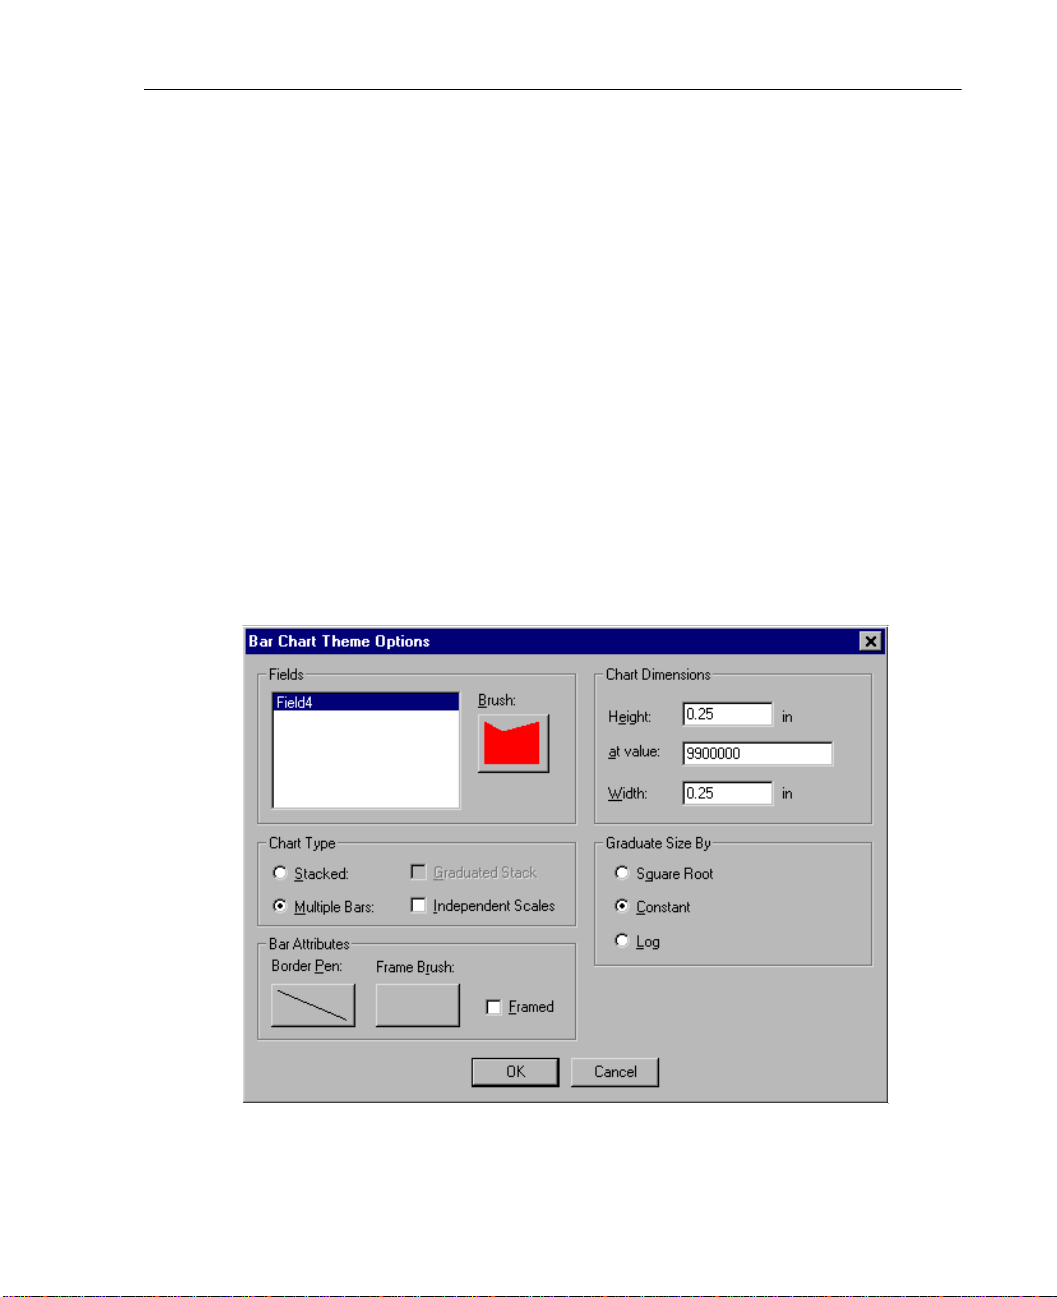
Figure 11-8
Bar Chart Theme Options dialog box
71
Modifying Thematic Maps
Page 84

72
Chapter 11
Fields. You can change properties for each bar in a chart by selecting a field from the
list. Click the brush style button to change fill options for each bar.
Chart Type. Creates stacked bars or multiple bars. You can specify whethe r stacked bars
will be graduated and select independent scales for multiple bars. Scaling
independently is appropriat e when you are displaying two or more scale variables wit h
different scales, such as grain output per acre and annual rainfall.
Bar Attributes. Creates a border and frame around bars. Click the border pen or frame
brush buttons to specify properties.
Chart Dimensions. Sets the height for the bar chart at a particular data value. For
example, with a setting of 1000, a bar representing a value of 500 would be half the
size specified in
Graduate Size By. Graduates bar size according to a square roots scale, a constant
(linear) scale, or a logarithmic scale.
To Modify Bar Chart Themes
Chart Dimensions: Height. You can also specify chart width.
Select Bar Chart in the theme list.
Click Legend to edit legend options for each theme.
Click Display to edit theme properties.
Select the settings you wan t to change, such as the value of t he largest bar, chart wi dth,
and bar attributes.
To select style options for each category:
Select a bar field from the list.
Click the brush style button to change fill and border options.
Page 85
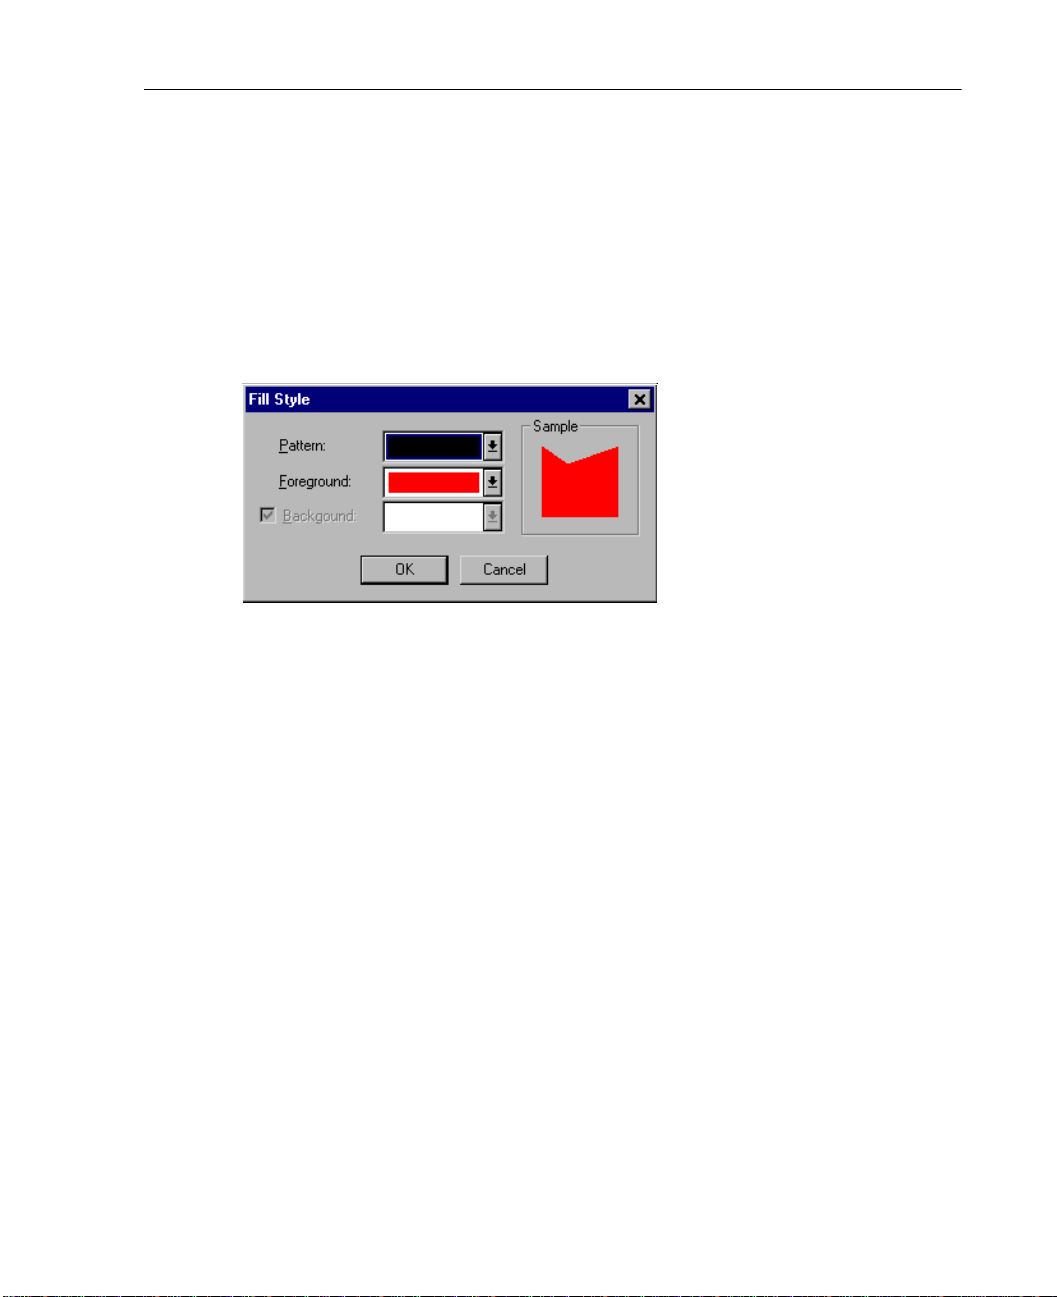
Fill Style Properties
You can set fill pattern and foreground and background colors. Choo se styles from t he
drop-down lists. For patterned fills, you can also select a background fill.
For bar themes, you can edit fill style properties for each bar.
Figure 11-9
Fill Style dialog box
73
Modifying Thematic Maps
To Change Fill Style Properties
Click the region style button.
Select the settings you want to change, such as fill pattern and color.
Page 86
74
Chapter 11
Pie Chart Properties
In a pie chart map, you can modify pie size, slice style, and fill progression. You can
also set the diameter of pies relative to data values.
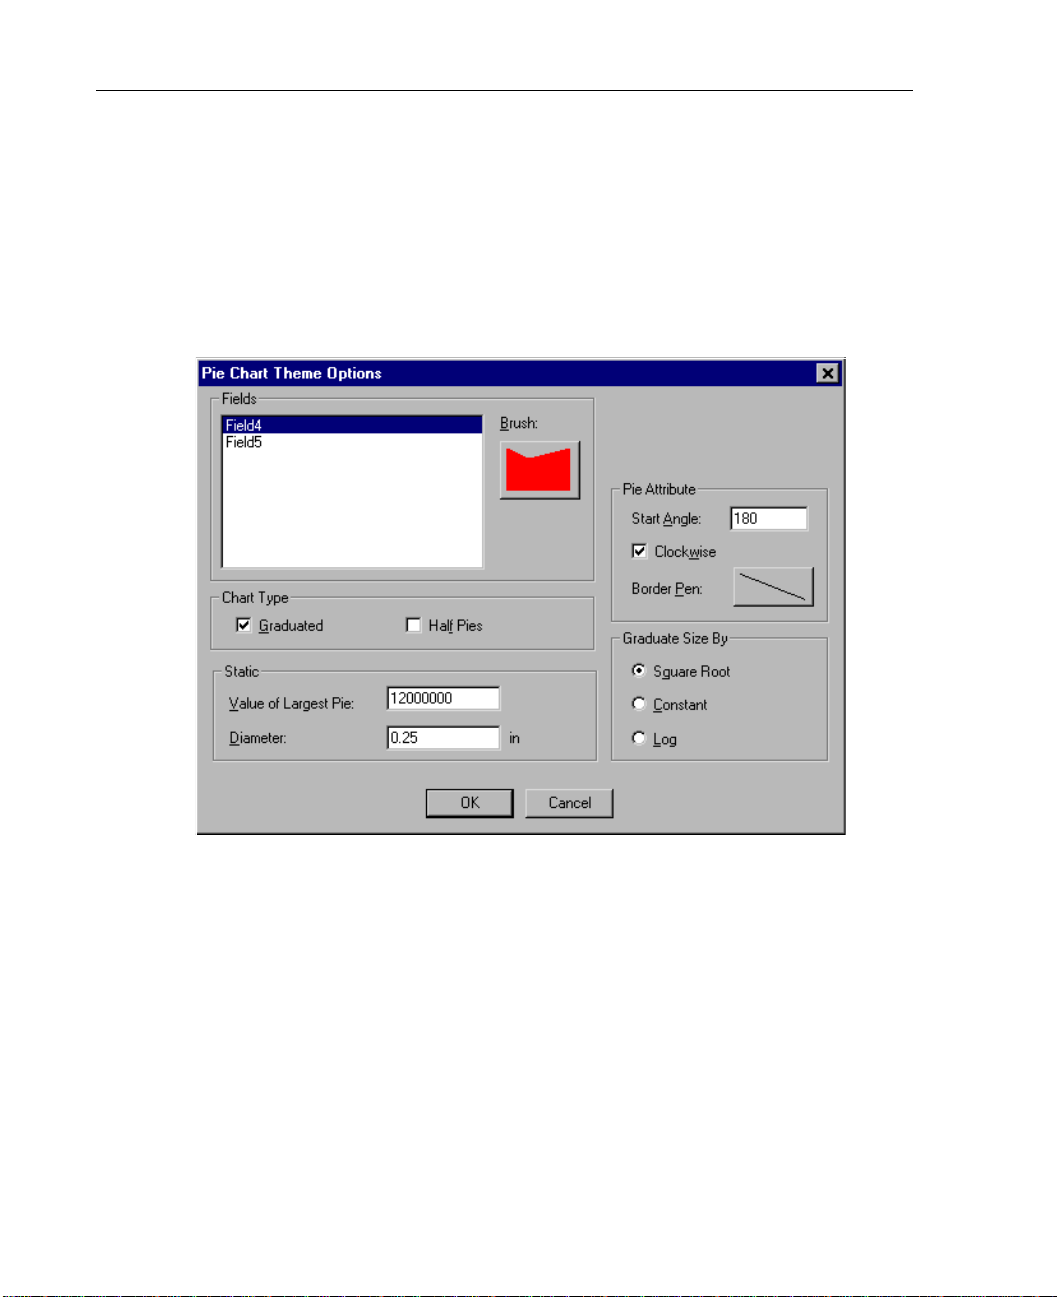
Figure 11-10
Pie Chart Theme Options dialog box
Fields. You can change properties for pie slices in a chart by selecting a fiel d from t he
list. Click the brush style button to change fill options for each slice.
Chart Type. Creates pie chart variations, such as graduated pies and half pies. Pies are
graduated according to dat a values specified in
Value of Largest Pie, indicating the sum
of the values represented in each pie. You can also create half pies, which compress t he
data displayed into 180 degrees.
Static. Sets a data value, such as 1000, for the largest pie. You can set the diameter of
the largest pie. In this example, a pie representing a total value of 500 would be half
the size of the pie specified for
Diameter.
Page 87

75
Modifying Thematic Maps
Diameter. Sets the diameter of the pie whose value is speci fied fo r Value of Largest Pie.
Pie Attribute. Sets a start angle (suc h as 90 degrees) and rot ation for pie sli ces. You can
set border options for pies and slices by clicking the border pen style button.
Graduate Size By
. Graduates pie size according to a square roots scale, a constant
(linear) scale, or a logarithmic scale.
To Modify Pie Chart Themes
Select Pie Chart in the theme list.
Click Legend to edit legend options for each theme.
Click Display to edit theme properties.
Select the settings you want to change, such as the value and diameter of the largest
pie, chart type, and pie attributes.
To select style options for each pie slice (or section):
Select a field from the list.
Click the brush style button to change fill options.
Page 88
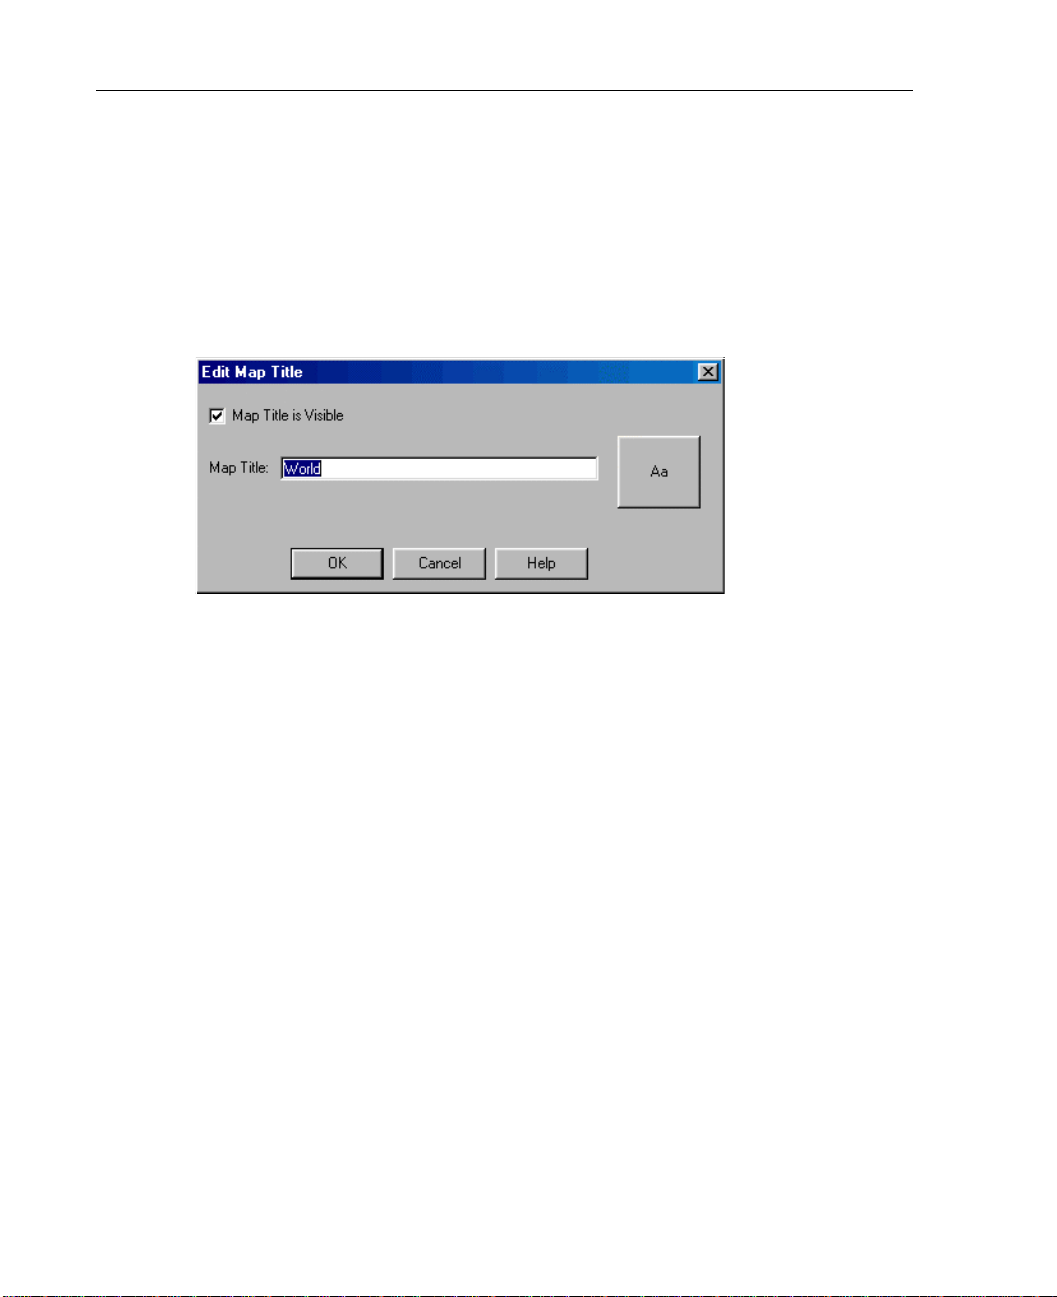
76
Chapter 11
Modifying Map Titles
You can show, hide, or modify map titles. The default map title is the name of the
geoset used to make the map.
Figure 11-11
Edit Map Title dialog box
Map Title is Visible. Displays the title in th e current map.
Map Title. You can create a new title or edit the current one. Click t he t ext st yle bo x t o
change options, such as text font, style, and size.
To Modify Map Titles
Activate the map (double-click it).
Click the Map Title tool on the toolbar.
Select the settings you wa nt to change, such as title visibility and title text.
Legend Properties
For all theme layers, you can modify legend type, options, and contents.
Page 89
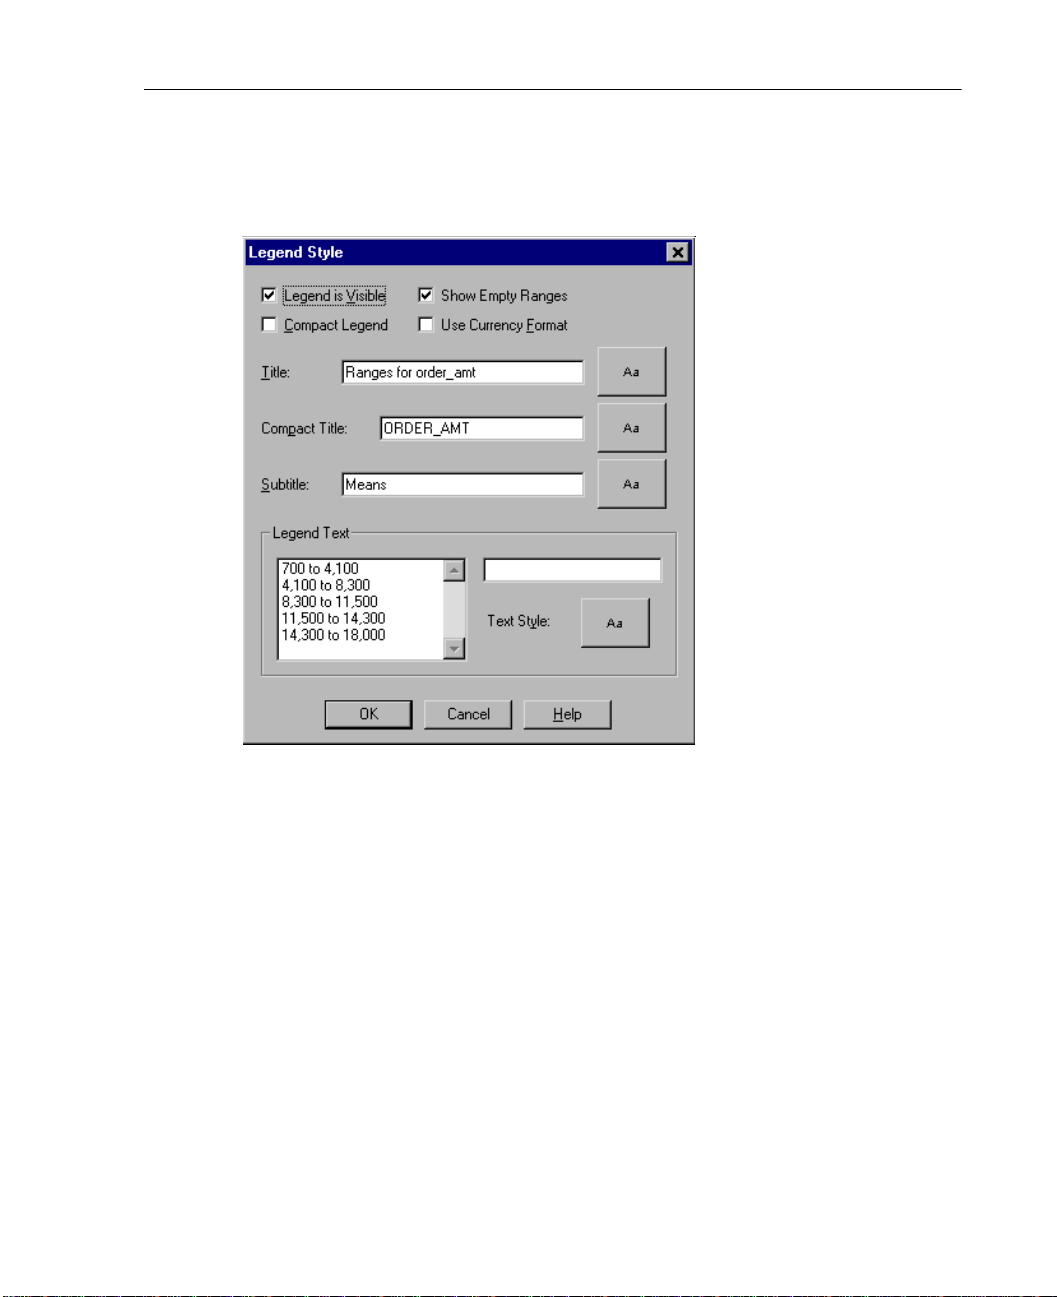
Figure 11-12
Legend Style dialog box
77
Modifying Thematic Maps
Legend is Visible. Displays the legend in the current map.
Compact Legend. Displays a compact legend. A full legend is displayed by default.
Show Empty Ranges. Includes empty ranges in the legend.
Use Currency Format. Displays numbers as currency for maps showing sales figures,
income, etc.
Title. You can edit title text for titles and subtitles. You can also edit text for a compact
legend. Click the text style button to edit font style, color, and effects.
Legend Text. Select an entry to edit the text. Click the text style button to edit font style,
color, and effects.
Page 90
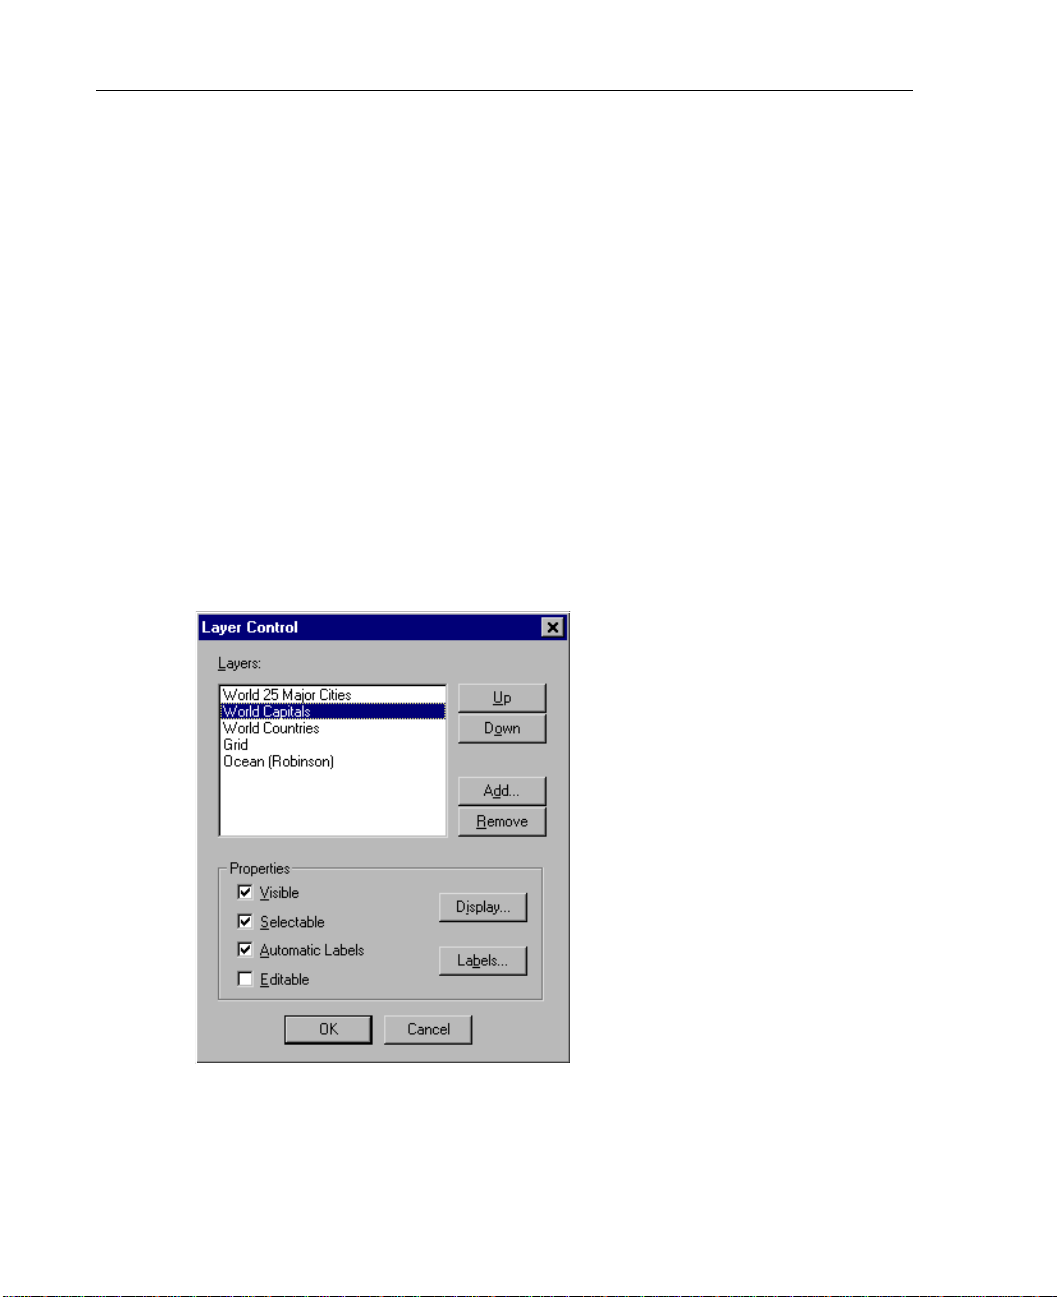
78
Chapter 11
To Change Legend Properties
Click Legend to edit the legend for each theme.
Select the settings you want to change, such as title, subtitle, and legend text.
Modifying Map Layers Using the Layer Control
Map layers are files, such as oceans, countries, and cities, that make up a map. For each
map layer, y ou can use the Layer Control to add, remove, and reorder layers. You can
also select properties, such as color, line style, fonts, labels and zoom. To make
permanent changes to geoset layers, use the Geoset Manager.
For more information on using the Geoset Manager, see Chapter 2.
Figure 11-13
Layer Control dialog box
Page 91
Layers. Displays all layers in the current map, including geoset layers and layers
created during X/Y binding. You can reorder, add, and remove layers, such as grid or
ocean, from the current map.
Properties. For each layer, you can choose to make it visible, selectable, and editable.
You can also choose to show labels, such as country names. For cosmetic edits, click
the
Display button. You can also change label options by clicking Labels.
To Use the Layer Control
Activate the map (double-click it).
Click the Map Layers tool.
Select a layer from the list.
79
Modifying Thematic Maps
Click Up or Down to reorder layers.
Click Display to change the zoom level and region, line, or point properties.
Click Labels to change label style, visibilit y, and loca ti on opt io ns.
Page 92
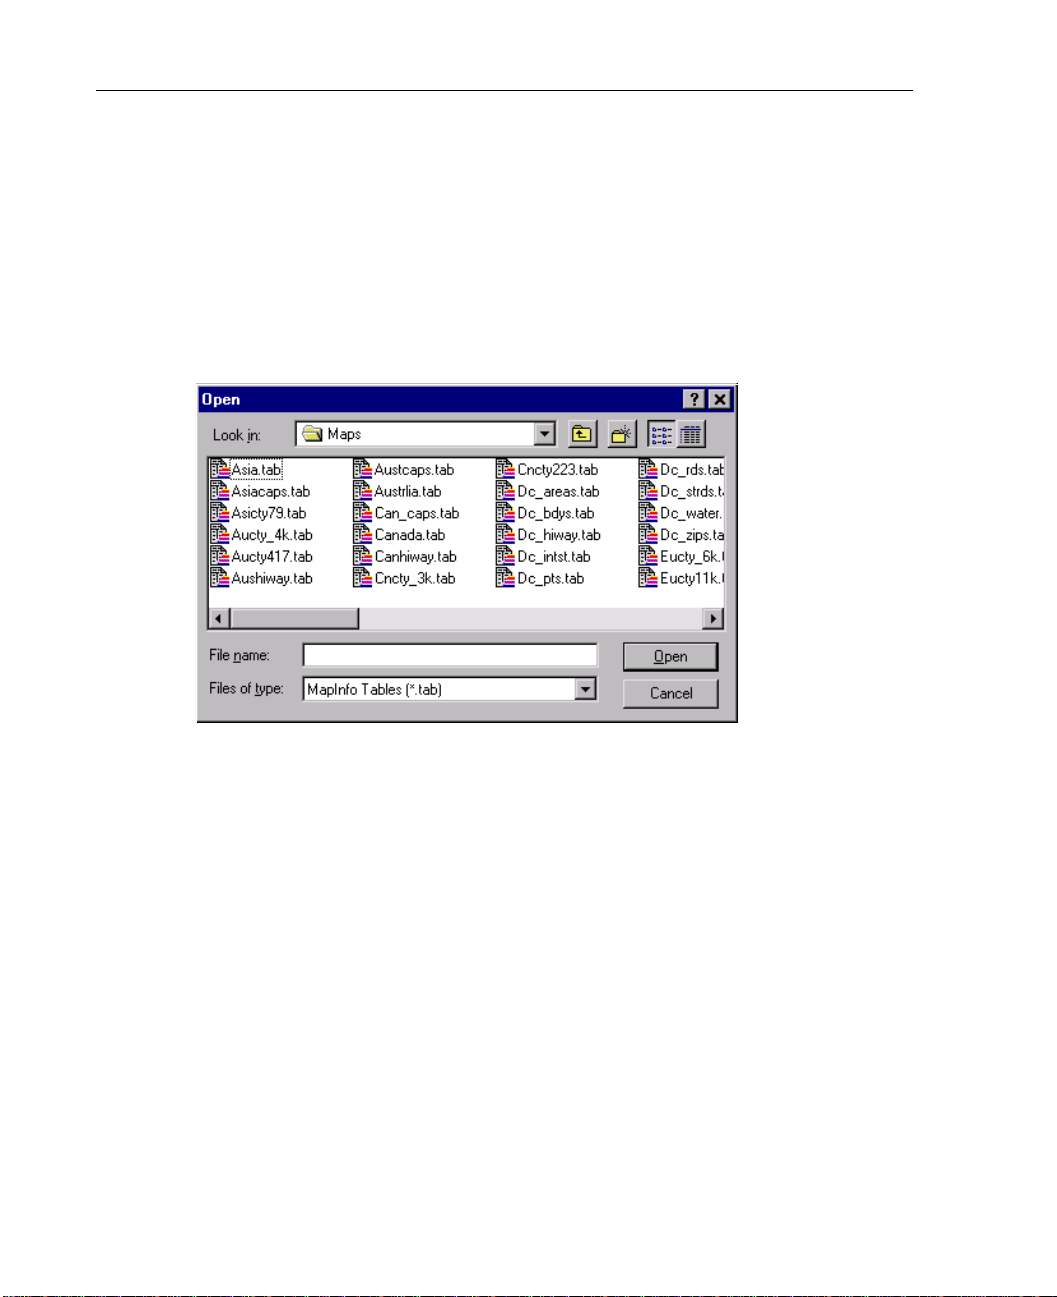
80
Chapter 11
Adding Layers to a Map
Click Add in the Layer Control to bring up a dialog box listing all layers, or .tab files,
in the SPSS Maps dir ectory. After adding map layers, you can re order them and a djust
their zoom level using the Layer Control.
Figure 11-14
Adding map layers
To Add Map Layers
Activate the map (double-click it).
Click the Map Layers tool.
Click Add.
Select a layer from the list and click Open to add the layer.
Note: This action adds a layer to the current m ap. To add a permanent layer to th e
geoset, use the Geoset Manager.
Page 93
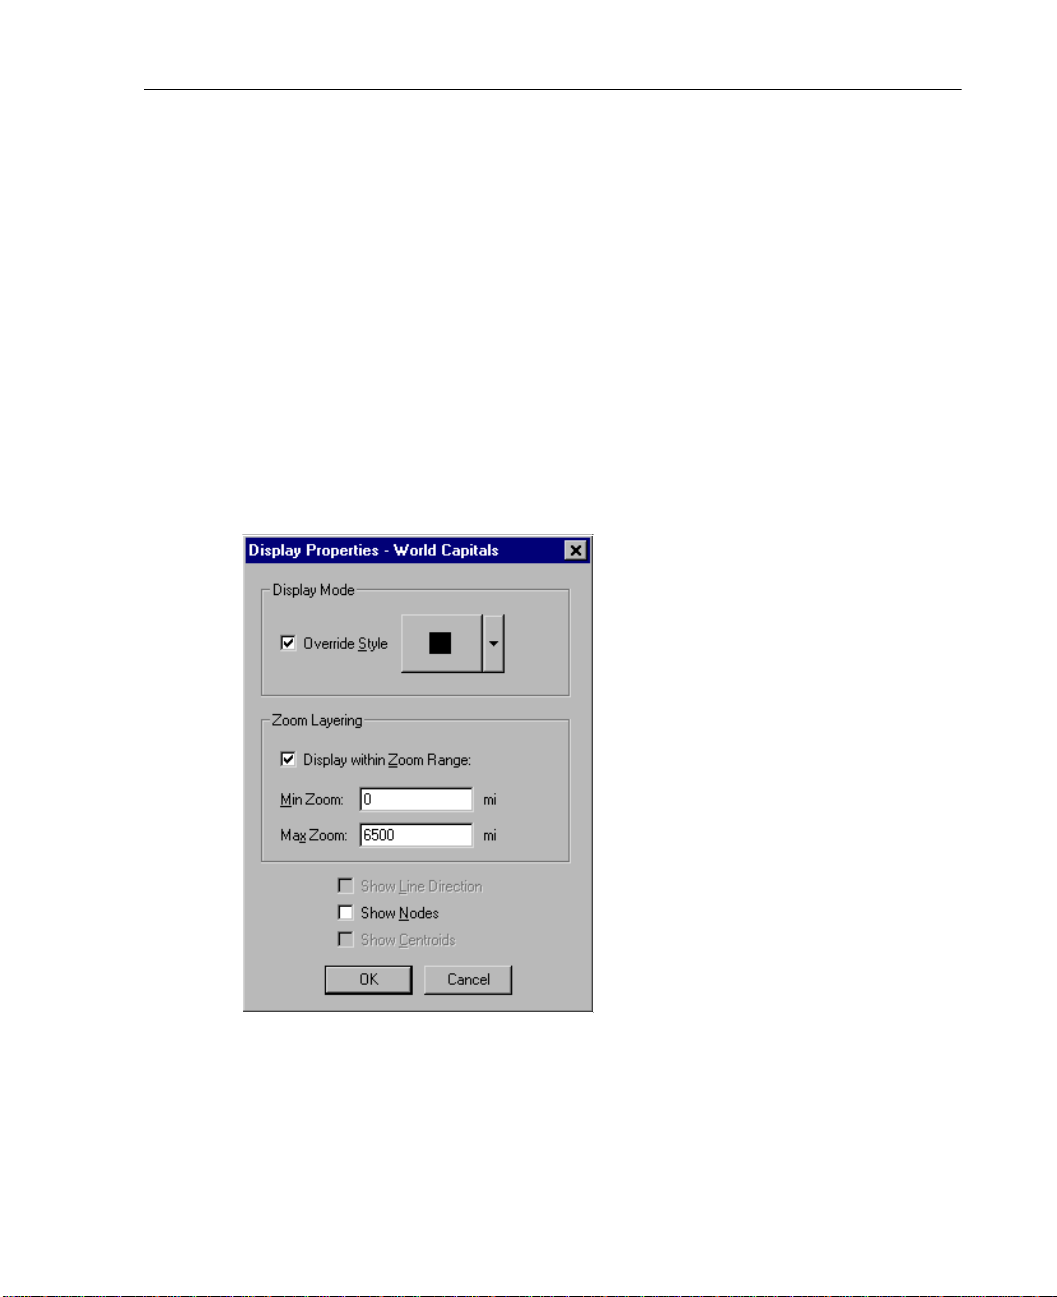
Display Properties
Using the Layer Control, you can specify displ ay properties for all types of map layers,
including region, point, and line layer s. You can choose to display certain map layers,
such as power plant location, at a detailed zoom level. This reduces clutte r in your map
by making certain layers invisible at high or low zoom levels. You can set zoom levels
manually by entering a value in map units. Additional display properties include:
Show line direction for line layers such as highways.
Show nodes.
Show centroids of each geographic region.
Figure 11-15
Display Properties dialog box
81
Modifying Thematic Maps
Display Mode. Fi r s t, select Override Style to activate the style button. Click the style
button to change options for reg io n fil l, poin t symbols, and line style. For example, if
the selected layer is
World Capitals, the st yle but to n will op en a dial og box fo r symbol
options.
Page 94

82
Chapter 11
Zoom Layering. Select Display within Zoom Range to specify zoom levels for a layer . For
example, you could display a layer of nu clear power plants at all zo om levels between
1256 miles and 314 miles. When you zo om to a l evel, such as 800 miles, you will t hen
see the location of nuclear power plants in each region.
To Change Display Properties
Select a layer in the Layer Control and click Display.
Set zoom level visibility for the selected layer.
Click the style button to change options for region, point, and line layers.
Label Properties
For each map layer, you can change the appearance, visibility, and location of labels.
Page 95
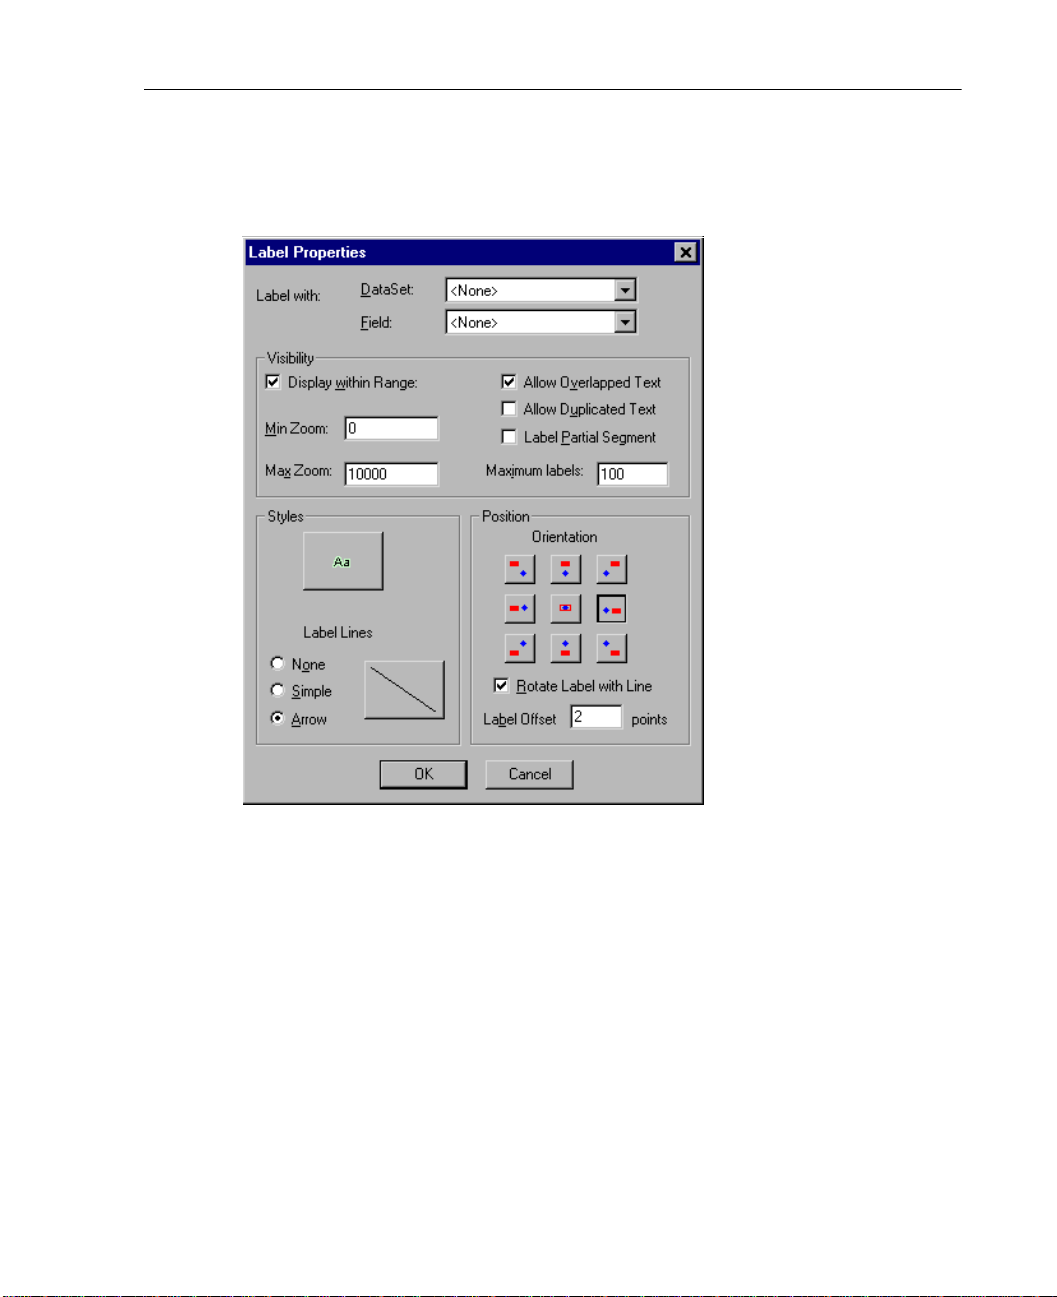
Figure 11-16
Label Properties dialog box
83
Modifying Thematic Maps
Label with. Displays labels using either a data set value , such as sales amount, or a field
name, such as country name.
Visibility. Sets a zoom range in which the labels will be visible for each layer. Labels
are visible only when a layer is visible. You can also control the way labels are
displayed. Choose to allow overlap and duplicate labels. Select
Label Partial Segment
for more specific labeling of geographic features, such as merged highways. You can
also set a maximum numb er of labels per layer to limit clutter.
Styles. Sets options for a line connecting labels with the center of a feature. Click the
text style button to edit font style, color, and effects.
Position. Sets the location of the label relative to the center of the geographic feature.
Y ou can specify a speci fic distance from the center . For line layers, keep labels parallel
with lines by selecting
Rotate Label with Line.
Page 96
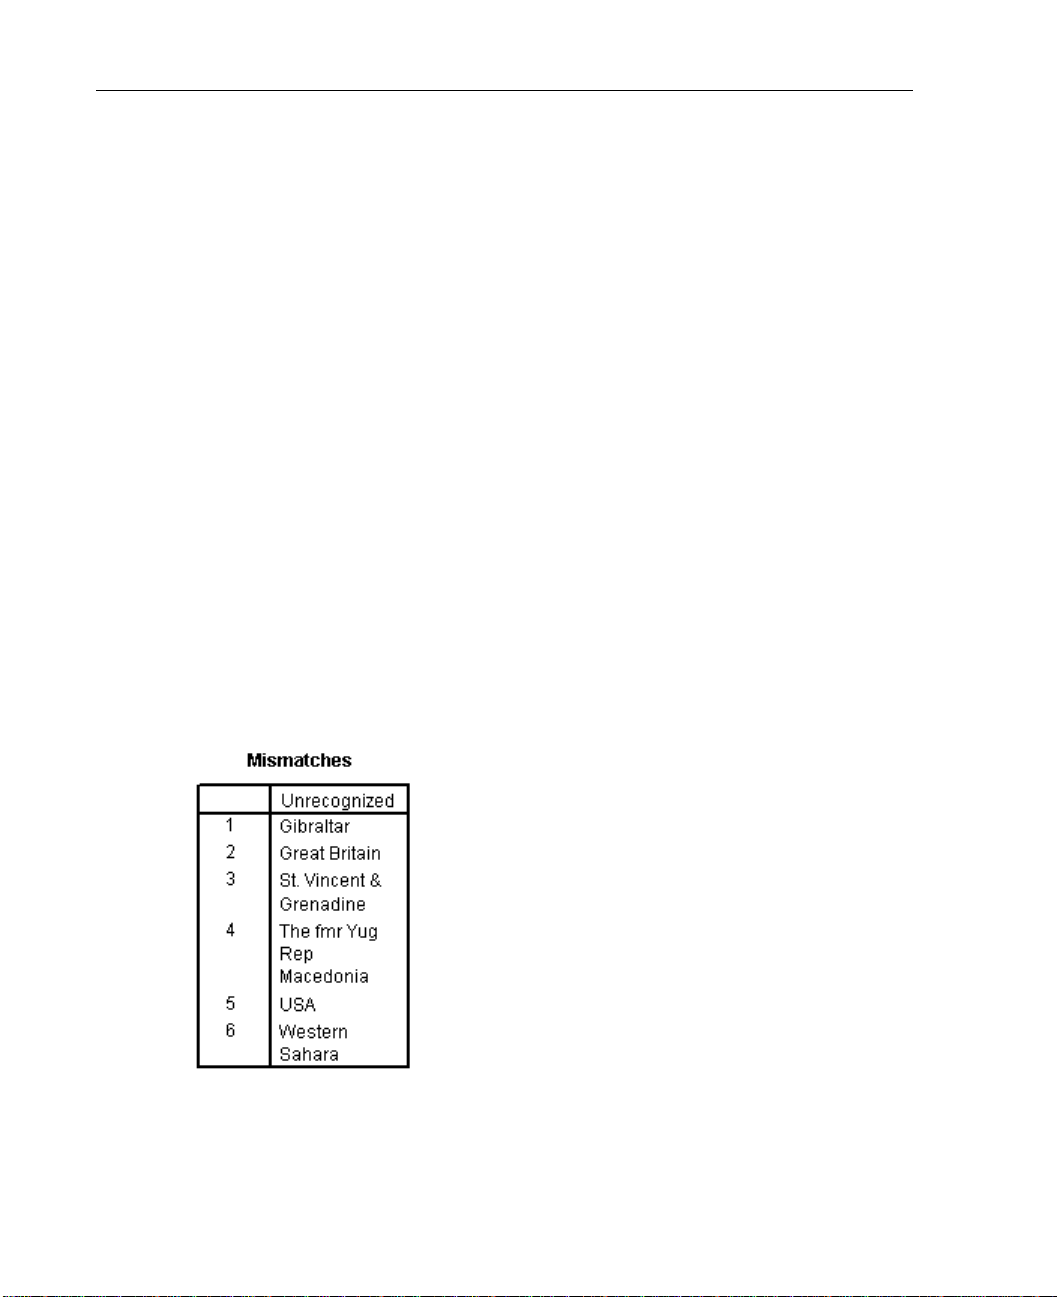
84
Chapter 11
To Change Label Properties
Select a map layer from the list.
Select or deselect Automatic Labels to show or hide labels.
Click the Labels button for more options.
Select the settings you want to change, such as label visibility, styles, and position.
Geographic Variable Mismatches
Sometimes you will get a mismatch warning table in the Viewer window. This table
lists discrepancies between values in the geoset layer and values in the .sav file. For
example, if the geoset layer uses the name United States while the .sav file uses the
abbreviation USA, you will se e a mismatch for USA in the warnings table. To avoid
mismatches, you can change values in your .sav file to correspond to values in the
geoset layer.
Figure 11-17
Mismatch between the geoset and .sav file
Page 97

To Correct Mismatches
To turn on labels for the geographic feature with a mismatch (for example, state or
country):
Activate the map (double-click it).
Click the Map Layers tool.
Select the map layer with a mismatch from the list.
Select Automatic Labels to display labels (geographic values from the geoset).
To determine data values in the geoset:
Zoom in to the mismatched geographic feature (such as USA).
Determine the value displayed for that feature (such as United States, USA, or US).
85
Modifying Thematic Maps
To resolve mismatches in the .sav file:
In the Data Editor, find the field with a mismatch.
Change the value to match that in the geoset layer.
Save changes and recreate the thematic map.
Page 98

Page 99

Syntax Reference
Page 100

 Loading...