

Page 1
SPSS Data Validation™ 14.0
Page 2

For more information about SPSS®software products, please visit our Web site at http://www.spss.com or contact
SPSS Inc.
233 South Wacker Drive, 11th Floor
Chicago, IL 60606-6412
Tel: (312) 651-3000
Fax: (312) 651-3668
SPSS is a registered trademark and the other product names are the trademarks of SPSS Inc. for its proprietary computer software. No
material describing such software may be produced or distributed without the written permission of the owners of the trademark and
license rights in the software and the copyrights in the published materials.
The SOFTWARE and documentation are provided with RESTRICTED RIGHTS. Use, duplication, or disclosure by the Government is
subject to restrictions as set forth in subdivision (c) (1) (ii) of The Rights in Technical Data and Computer Software clause at 52.227-7013.
Contractor/manufacturer is SPSS Inc., 233 South Wacker Drive, 11th Floor, Chicago, IL 60606-6412.
General notice: Other product names mentioned herein a re used for identification purposes only and may be trademarks of th eir
respective companies.
TableLook is a trademark of SPSS Inc.
Windows is a registered t rademark of Microsoft Corporation.
DataDirect, DataDirect Connect, INTERSOLV, and SequeLink are registered trademarks of DataDirect Technologies.
Portions of this product were created using LEADTOOLS © 1991–2000, LEAD Technologies, Inc. ALL RIGHTS RESERVED.
LEAD, LEADTOOLS, and LEADVIEW are registered trademarks of LEAD Technologies, Inc.
Sax Basic is a trademark of Sax Software Corporation. Copyright © 1993–2004 by Polar Engineering and Consulting. All rights reserved.
Portions of this product were based on the work of the FreeType Team (http://www.freetype.org).
A portion of the SPSS software contains zlib technology. Copyright © 1995–2002 by Jean-loup Gailly and Mark Adler. The zlib
software is provided “as is,” without express or implied warranty.
A portion of the SPSS software contains Sun Java Runtime libraries. Co pyright © 2003 by Sun Microsys tems, Inc. All rights reserved.
The Sun Java Runtime libraries include code licensed from RSA Security, Inc. Some portions of the libraries are licensed from IBM and
are available at http://oss.software.ibm.com/icu4j/ .
SPSS Data Validation™ 14.0
Copyright © 2005 by SPSS Inc.
All rights reserved.
Printed in the United States of America.
No part of this publication may be reproduced, stored in a retrieval system, or transmitted, in any form or by any means, electronic,
mechanical, photocopying, recording, or otherwise, without the prior written permission of the publisher.
1234567890 08070605
ISBN 1-56827-372-X
Page 3

Preface
SPSS 14.0 is a comprehensive system for analyzing data. The SPSS Data Validation
optional add-on module provides the additional analytic techniques described in this
manual. The Data Validation add-on module must be used with the SPSS 14.0 Base
systemandiscompletelyintegratedintothatsystem.
Installation
To install the SPSS Data Validation add-on module, run the License Authorization
Wizard using the authorization code that you received from SPSS Inc. For
more information, see the installation instructions supplied with the SPSS Data
Validation add-on module.
Compatibility
SPSS is designed to run on many computer systems. See the installation instructions
that came with your system for specific information on minimum and recommended
requirements.
Serial Numbers
Your serial number is your identification number with SPSS Inc. You will need this
serial number when you contact SPSS Inc. for information regarding support, payment,
or an upgraded system. The serial number was provided with your Base system.
Customer Service
If you have any questions concerning your shipment or account, contact your local
office, listed on the SPSS Web site at http://www.spss.com/worldwide.Pleasehave
your serial number ready for identification.
iii
Page 4

Training Seminars
SPSS Inc. provides both public and onsite training seminars. All seminars feature
hands-on workshops. Seminars will be offered in major cities on a regular basis. For
more information on these seminars, contact your local office, listed on the SPSS Web
site at http://www.spss.com/worldwide.
Technical Support
The services of SPSS Technical Support are available to maintenance customers.
Customers may contact Technical Support for assistance in using SPSS or for
installation help for one of the supported hardware environments. To reach Technical
Support, see the SPSS Web site at http://www.spss.com, or contact your local office,
listed on the SPSS Web site at http://www.spss.com/worldwide. Be prepared to identify
yourself, your organization, and the serial number of your system.
Additional Publications
Additional copies of SPSS product manuals may be purchased dir ectly from SPSS Inc.
Visit the SPSS Web Store at http://www.spss.com/estore, or contact your local SPSS
office,listedontheSPSSWebsiteathttp://www.spss.com/worldwide. For telephone
orders in the United States and Canada, call SPSS Inc. at 800-543-2185. For telephone
orders outside of North America, contact your local office, listed on the SPSS Web site.
The SPSS Statistical Procedures Companion, by Marija Norušis, has been published
by Prentice Hall. A new version of this book, updated for SPSS 14.0, is planned.
The SPSS Advanced Statistical Procedures Companion, also based on SPSS 14.0, is
forthcoming. The SPSS Guide to Data Analysis for SPSS 14.0 is also in development.
Announcements of publications available exclusively through Prentice Hall will be
available on the SPSS Web site at http://www.spss.com/estore (select your home
country, and then click
Books).
Tell Us Your Thoughts
Your comments are important. Please let us know about your experiences with SPSS
products. We especially like to hear about new and interesting applications using the
SPSS Data Validation add-on module. Please send e-mail to [email protected] or
write to SPSS Inc., Attn.: Director of Product Planning, 233 South Wacker Drive, 11th
Floor, Chicago, IL 60606-6412.
iv
Page 5

About This Manual
This manual documents the graphical user interface for the procedures included in the
SPSS Data Validation add-on module. Illustrations of dialog boxes are taken from
SPSS for Windows. Dialog boxes in other operating systems are similar. Detailed
information about the command syntax for features in the SPSS Data Validation add-on
module is available in two forms: integrated into the overall Help system and as
a separate document in PDF form in the SPSS 14.0 Command Syntax Reference,
available from the Help menu.
Contacting SPSS
If you would like to be on our mailing list, contact one of our offices, listed on our Web
site at http://www.spss.com/worldwide.
v
Page 6

Page 7

Contents
Part I: User's Guide
1 Introduction to SPSS Data Validation 1
UsageofDataValidationProcedures............................... 1
2 Validation Rules 3
LoadPredefinedValidationRules.................................. 3
DefineValidationRules.......................................... 4
DefineSingle-VariableRules.................................. 5
DefineCross-VariableRules .................................. 8
3 Validate Data 11
ValidateDataBasicChecks ..................................... 13
ValidateDataSingle-VariableRules ............................... 15
ValidateDataCross-VariableRules ............................... 16
ValidateDataOutput .......................................... 17
ValidateDataSave ........................................... 19
4 Identify Unusual Cases 21
IdentifyUnusualCasesOutput ................................... 24
vii
Page 8

IdentifyUnusualCasesSave..................................... 26
IdentifyUnusualCasesMissingValues............................. 27
IdentifyUnusualCasesOptions................................... 28
DETECTANOMALYCommandAdditionalFeatures..................... 29
Part II: Examples
5 Validate Data 33
ValidatingaMedicalDatabase................................... 33
PerformingBasicChecks.................................... 33
CopyingandUsingRulesfromAnotherFile ...................... 37
DefiningYourOwnRules.................................... 49
Cross-VariableRules....................................... 56
CaseReport.............................................. 57
Summary................................................ 58
RelatedProcedures........................................... 58
6 Identify Unusual Cases 59
IdentifyUnusualCasesAlgorithm................................. 59
IdentifyingUnusualCasesinaMedicalDatabase..................... 60
RunningtheAnalysis....................................... 60
CaseProcessingSummary .................................. 66
AnomalyCaseIndexList .................................... 66
AnomalyCasePeerIDList................................... 67
AnomalyCaseReasonList................................... 68
ScaleVariableNorms ...................................... 70
CategoricalVariableNorms.................................. 71
viii
Page 9

AnomalyIndexSummary.................................... 73
ReasonSummary.......................................... 74
ScatterplotofAnomalyIndexbyVariableImpact.................. 75
Summary................................................ 78
RelatedProcedures........................................... 78
Index 79
ix
Page 10

Page 11

Part I:
User's Guide
Page 12

Page 13

Introduction to SPSS Data Validation
As computing systems increase in power, appetites for information grow
proportionately, leading to more and more data collection—more cases, more variables,
and more data entry errors. These errors are the bane of the predictive model forecasts
that are the ultimate goal of data warehousing, so you need to keep the data “clean.”
However,theamountofdatawarehousedhasgrownsofarbeyondtheabilitytoverify
the cases manually that it is vital to implement automated processes for validating data.
The SPSS Data Validation add-on module allows you to identify unusual cases and
invalid cases, variables, and data values in your active dataset.
Chapter
1
Usage of Data Validation Procedures
Your usage of Data Validation procedures depends on your particular needs. A typical
route, after loading your data, is:
Metadata preparation. Review the variables in your data file and determine their
valid values, labels, and measurement level. Identify combinations of variable
values that are impossible but commonly miscoded. Define validation rules based
on this information. This can be a time-consuming task, but it is well worth the
effort if you need to validate data files with similar attributes on a regular basis.
Data validation. Run basic checks and checks against defined validation rules to
identify invalid cases, variables, and data values. When invalid data are found,
investigate and correct the cause. This may require another step through metadata
preparation.
Model preparation. Identify potential statistical outliers that can cause problems for
many predictive models. Some outliers are the result of invalid variable values
that have not been identified. This may require another step through metadata
preparation.
1
Page 14

2
Chapter 1
Once your data file is “clean,” you are ready to build models from other SPSS modules.
Page 15

Validation Rules
A rule is used to determine whether a case is valid. There are two types of validation
rules:
Single-variable rules. Single-variable rules consist of a fixed set of checks
that apply to a single variable, such as checks for out-of-range values. For
single-variable rules, valid values can be expressed as a range of values or a list of
acceptable values.
Cross-variable rules. Cross-variable rules are user-defined rules that can be applied
toasinglevariableoracombinationofvariables. Cross-variable rules are defined
by a logical expression that flags invalid values.
Validation rules are saved to the data dictionary of your data file. This allows you
to specify a rule once and then reuse it.
Chapter
2
Load Predefined Validation Rules
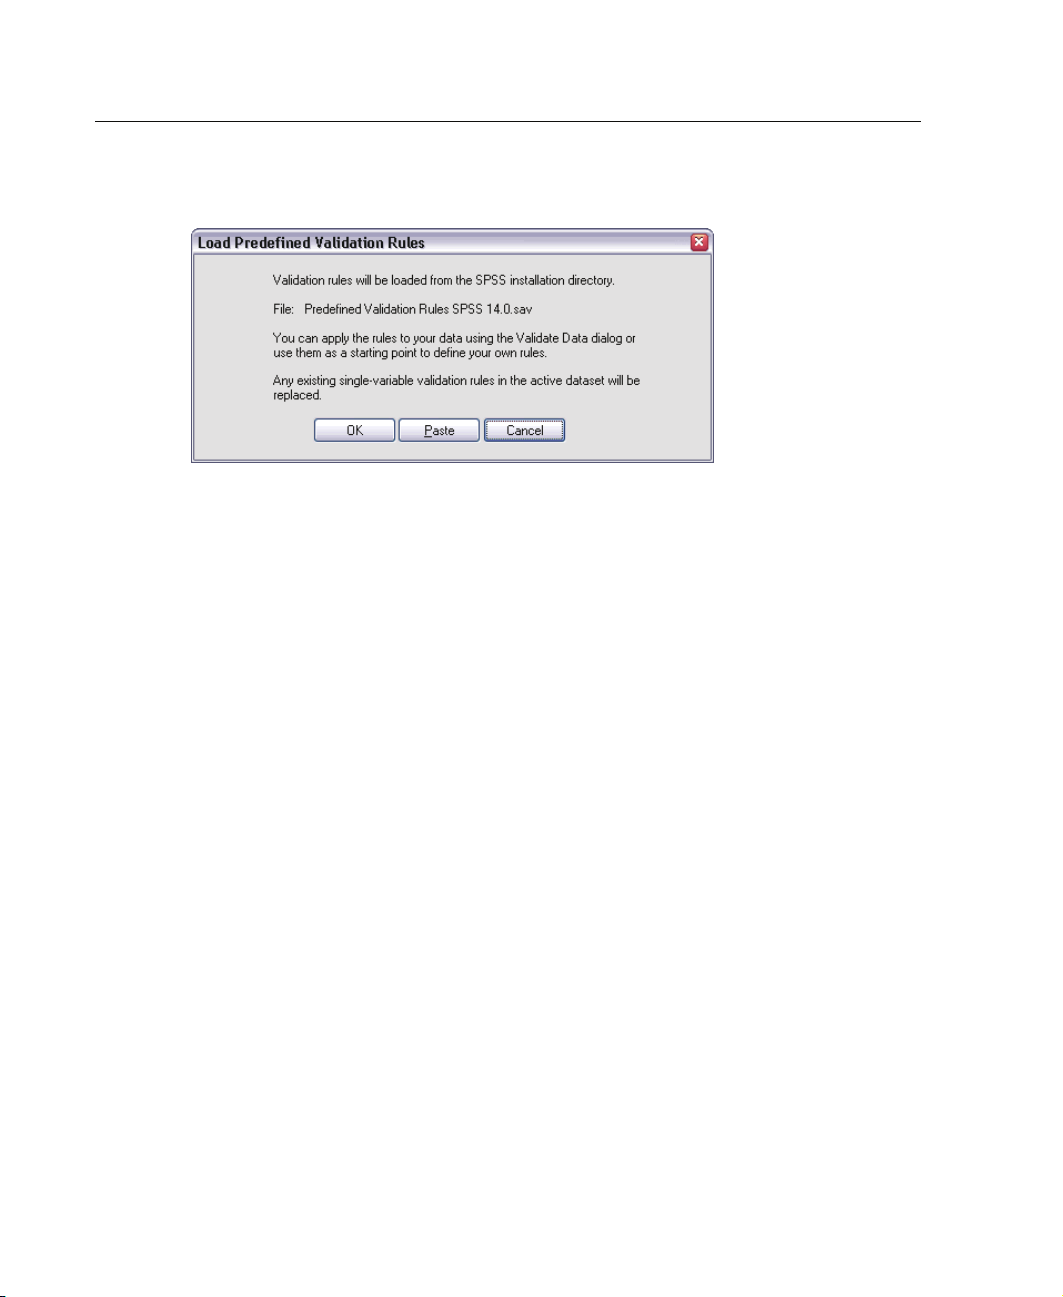
You can quickly obtain a set of ready-to-use validation rules by loading predefined
rules from an external data file that ships with SPSS.
To Load Predefined Validation Rules
E From the menus choose:
Data
Validation
Load Predefined Rules...
3
Page 16
4
Chapter 2
Figure 2-1
Load Predefined Validation Rules
Note that this process deletes any existing single-variable rules in the active dataset.
Alternative
ly, you can use the Copy Data Properties Wizard to load rules from
any data file.
Define Vali
The Define V
and cross-variable validation rules.
To Cre a t e a n
E From the me
Data
Validation
Define Rules...
The dialog b
read from the SPSS data dictionary. When there are no rules, a new placeholder rule
that you can modify to suit your purposes is created automatically.
E Select individual rules on the Single-Variable Rules and Cross-Variable Rules tabs to
view and mo
dation Rules
alidation Rules dialog box allows you to create and view single-variable
d View Validation Rules
nus choose:
ox is populated with single-variable and cross-variable validation rules
dify their properties.
Page 17
Define Single-Variable Rules
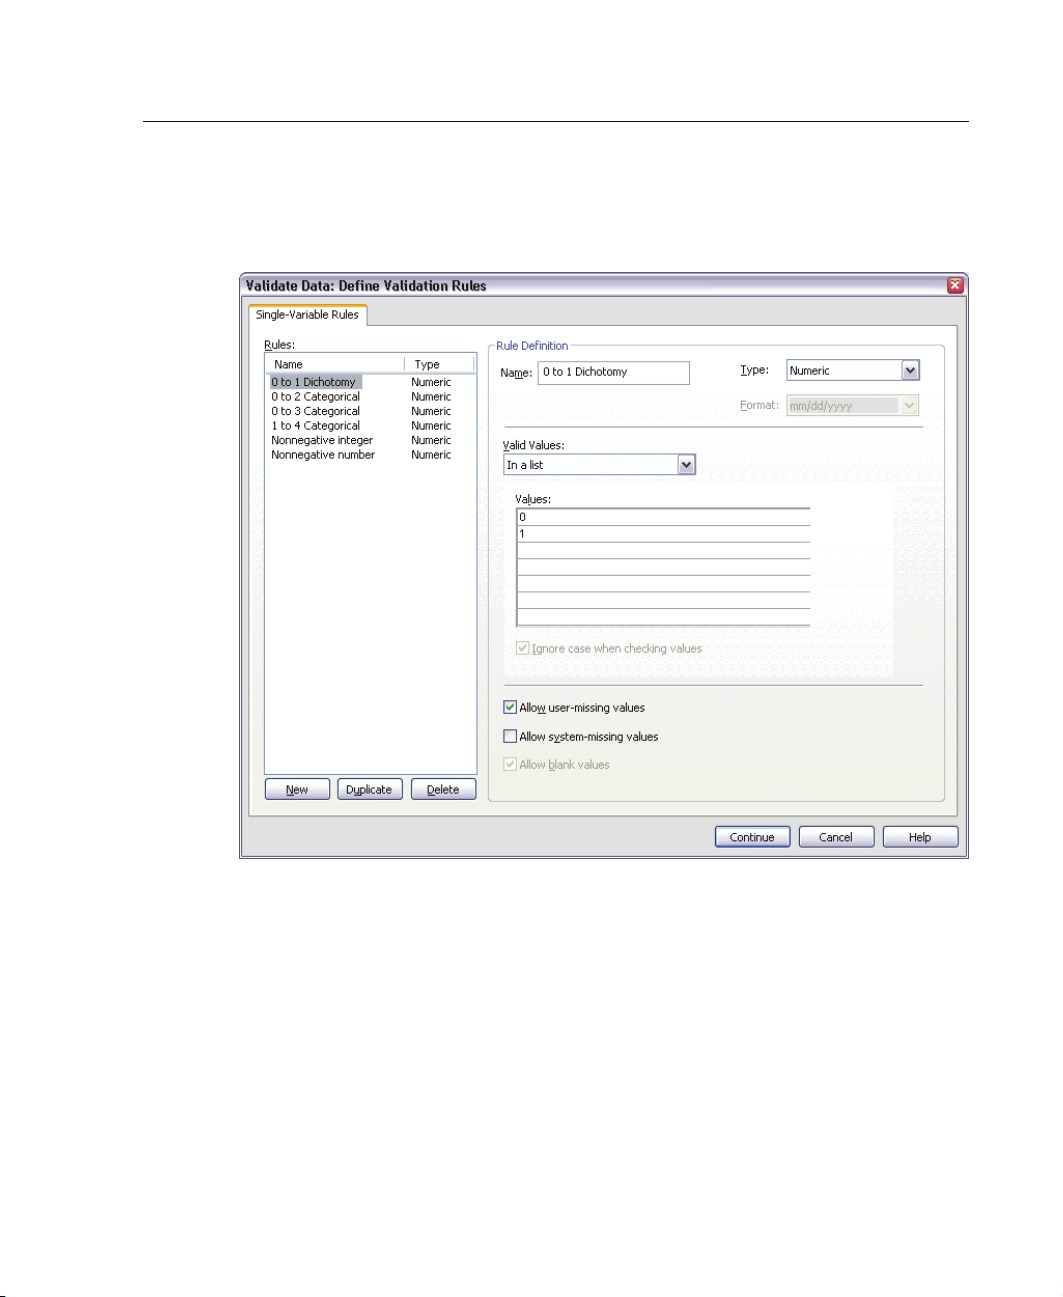
Figure 2-2
Define Validation Rules: Single-Variable Rules tab
5
Validation Rules
The Single-Variable Rules tab allows you to create, view, and modify single-variable
validation rules.
Rules. The list shows single-variable validation rules by name and the type of variable
to which the rule can be applied. When the dialog box is opened, it shows rules defined
in the data dictionary, or, if no rules are currently defined, a placeholder rule called
“Single-Variable Rule 1.” The following buttons appear below the Rules list:
New. Adds a new entry to the bottom of the Rules list. The rule is selected and
assigned the name “SingleVarRule n,” where n is an integer so that the new rule’s
name is unique among single-variable and cross-variable rules.
Page 18
6
Chapter 2
Duplicate. Adds a copy of the selected rule to the bottom of the Rules list. The rule
name is adjusted so that it is unique among single-variable and cross-variable
rules. For example, if you duplicate “SingleVarRule 1,” the name of the first
duplicate rule would be “Copy of SingleVarRule 1,” the second would be “Copy
(2) of SingleVarRule 1,” and so on.
Delete. Deletes the selected rule.
Rule Definit ion. These controls allow you to view and set properties for a selected rule.
Name. The name of the rule must be unique among single-variable and
cross-variable rules.
Type. Thisisthetypeofvariabletowhichtherulecanbeapplied. Selectfrom
Numeric, String,andDate.
Format. This allows you to select the SPSS date format for rules that can be applied
to date variables.
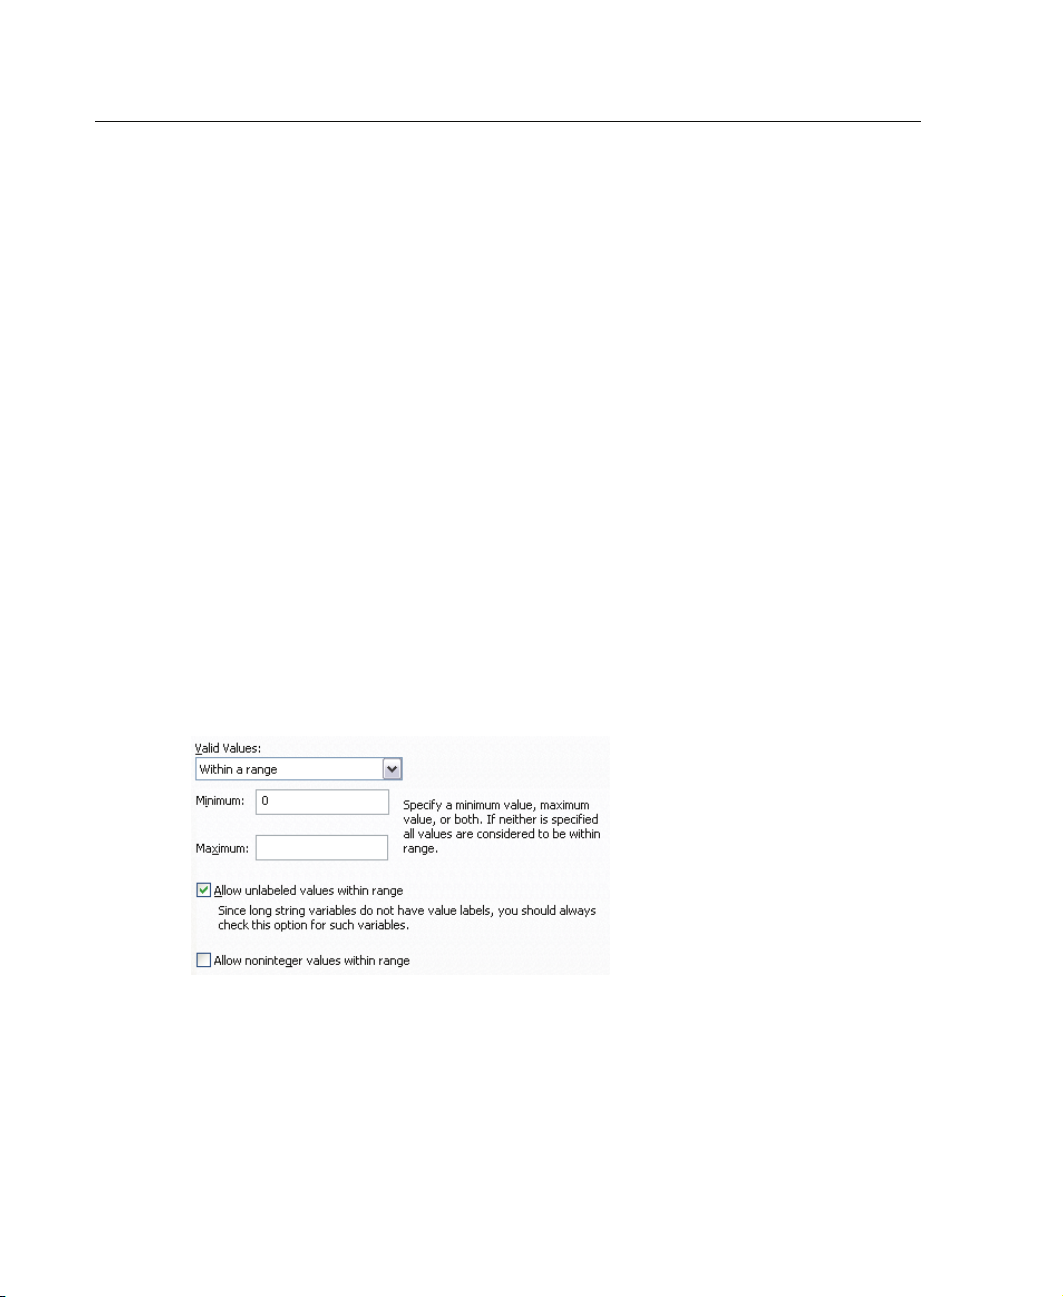
Valid Values. You can specify the valid values either as a range or a list of values.
Range definition controls allow you to specify a valid range. Values outside the range
are flagged as invalid.
Figure 2-3
Single-Variable Rules: Range Definition
To specify a range, enter the minimum or maximum values, or both. The check box
controls allow you to flag unlabeled and noninteger values within the range.
List definition controls allow you to define a list of valid values. Values not included
in the list are flagged as invalid.
Page 19
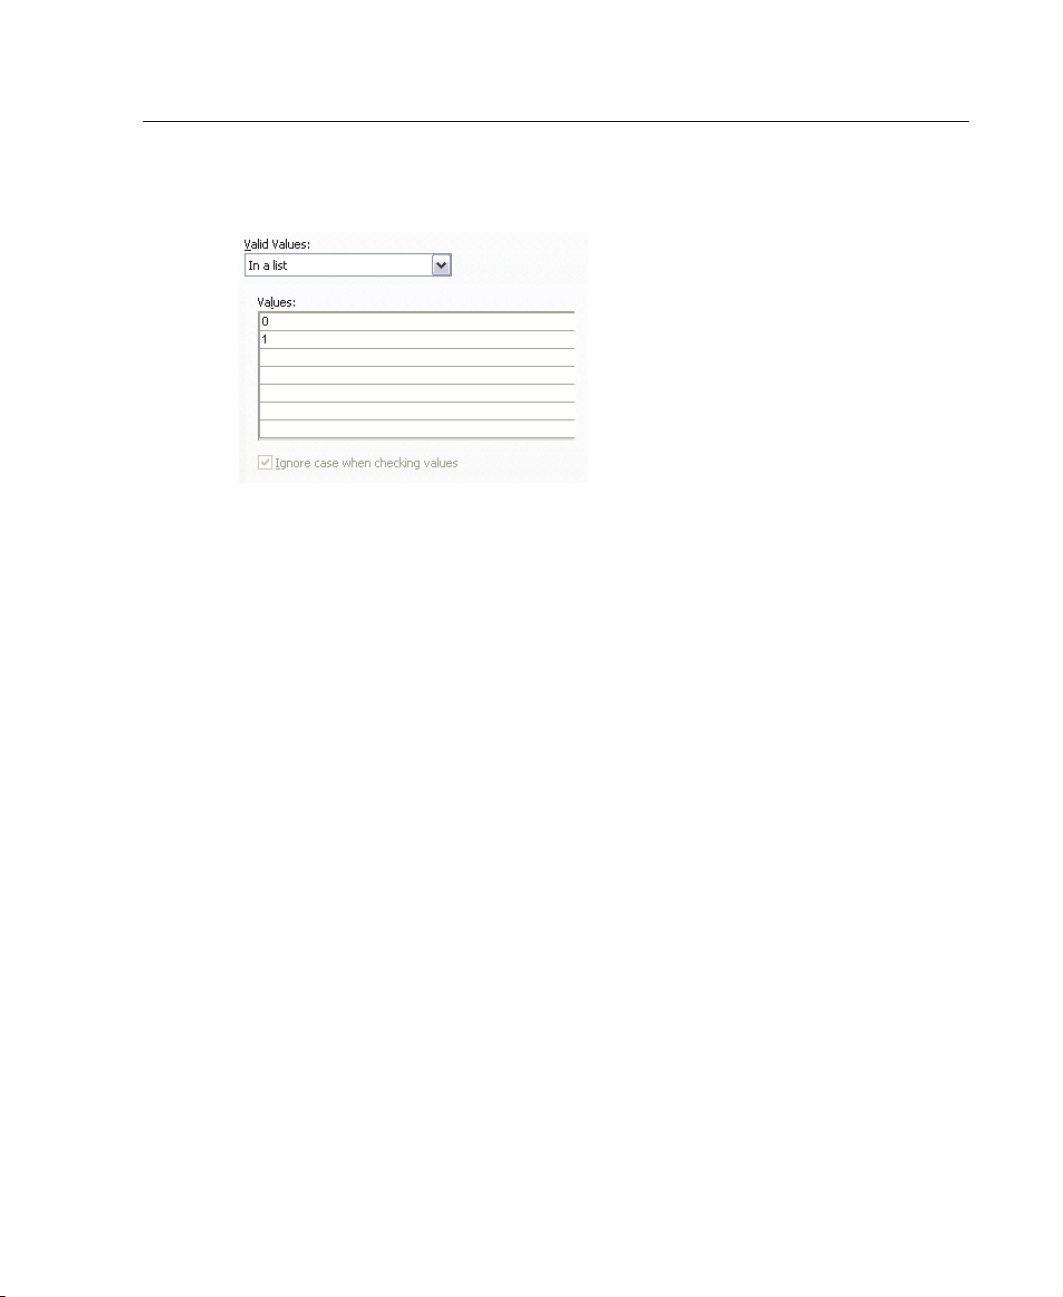
Figure 2-4
Single-Variable Rules: List Definition
7
Validation Rules
Enter list va
lues in the grid. The check box determines whether case matters when
string data values are checked against the list of acceptable values.
Allow user-missing values. Controls whether user-missing values are flagged
as invalid.
Allow syst
em-missing values.
Controls whether system-missing values are flagged
as invalid. This does not apply to string rule types.
Allow blank values. Controls whether blank (that is, completely empty) string
values are flagged as invalid. This does not apply to nonstring rule types.
Page 20
8
Chapter 2
Define Cross-Variable Rules
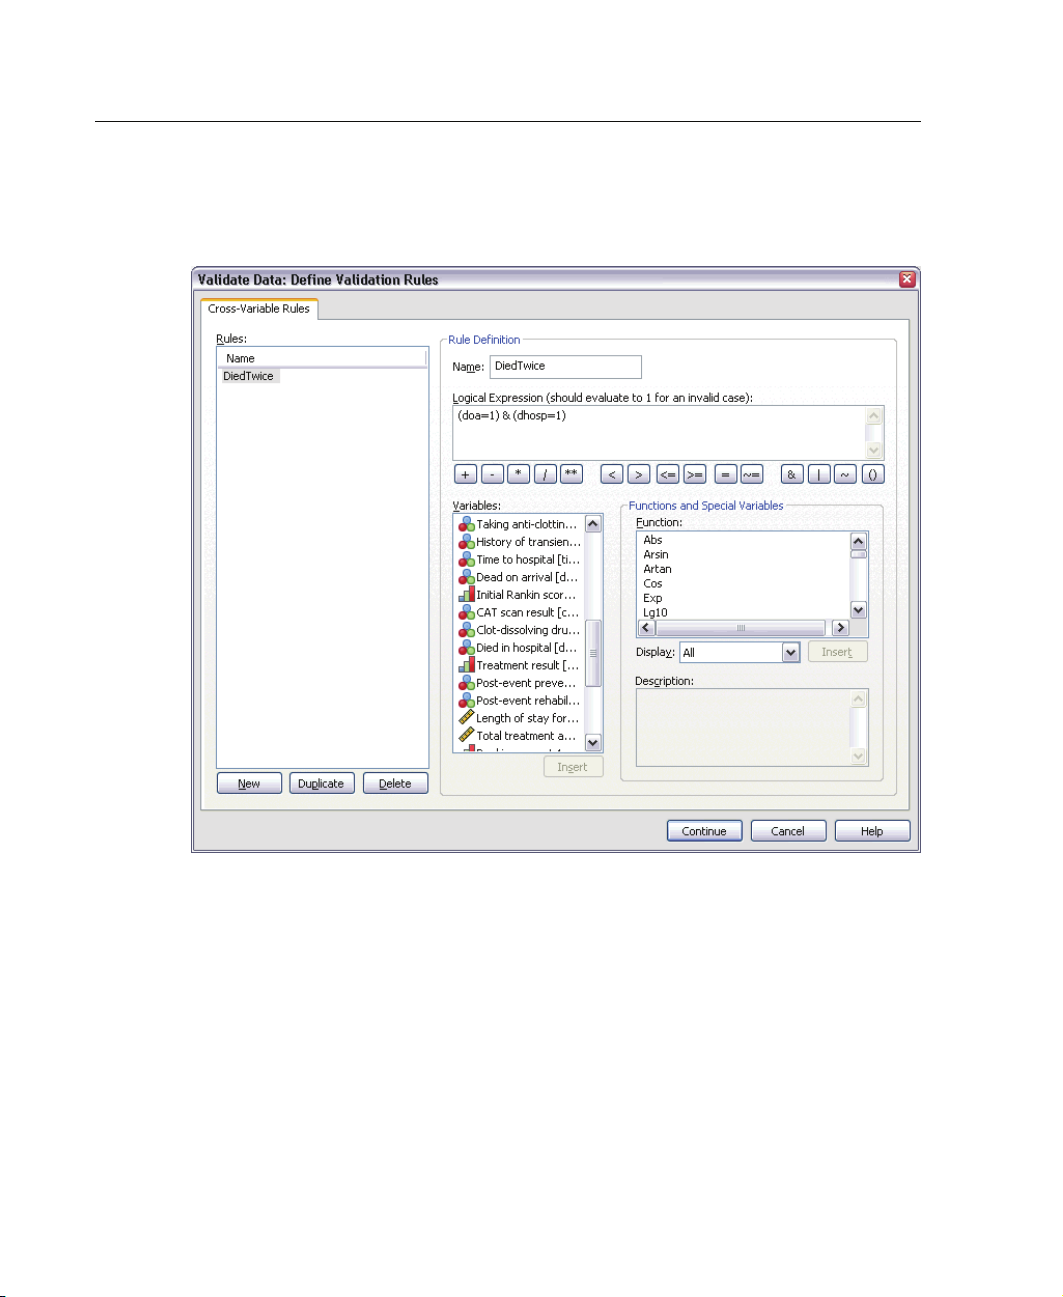
Figure 2-5
Define Validation Rules: Cross-Variable Rules tab
The Cross-Variable Rules tab allows you to create, view, and modify cross-variable
validation rules.
Rules. The list shows cross-variable validation rules by name. When the dialog box is
, it shows a placeholder rule called “CrossVarRule 1.” The following buttons
opened
appear below the Rules list:
New. Adds a new entry to the bottom of the Rules list. The rule is selected and
ned the name “CrossVarRule n,” where n is an integer so that the new rule’s
assig
name is unique among single-variable and cross-variable rules.
Page 21

Validation Rules
Duplicate. Adds a copy of the selected rule to the bottom of the Rules list. The rule
name is adjusted so that it is unique among single-variable and cross-variable
rules. For example, if you duplicate “CrossVarRule 1,” the name of the first
duplicate rule would be “Copy of CrossVarRule 1,” the second would be “Copy (2)
of CrossVarRule 1,” and so on.
Delete. Deletes the selected rule.
Rule Definit ion. These controls allow you to view and set properties for a selected rule.
Name. The name of the rule must be unique among single-variable and
cross-variable rules.
Logical Expression. This is, in essence, the rule definition. You should code the
expression so that invalid cases evaluate to 1.
Building Expressions
E To build an expression, either paste components into the Expression field or type
directly in the Expression field.
You can paste functions or commonly used system variables by selecting a group
from the Function group list and double-clicking the function or variable in the
Functions and Special Variables list (or select the function or variable and click
Insert). Fill in any parameters indicated by question marks (applies only to
functions). The function group labeled
All provides a list of all available functions
and system variables. A brief description of the currently selected function or
variable is displayed in a reserved area in the dialog box.
String constants must be enclosed in quotation marks or apostrophes.
If values contain decimals, a period (.) must be used as the decimal indicator.
9
Page 22

Page 23

Validate Data
The Validate Data dialog box allows you to identify suspicious and invalid cases,
variables, and data values in the active dataset.
Example. A data analyst must provide a monthly customer satisfaction report to her
client. The data she receives every month needs to be quality checked for incomplete
customer IDs, variable values that are out of range, and combinations of variable
values that are commonly entered in error. The Validate Data dialog box allows the
analyst to specify the variables that uniquely identify customers, define single-variable
rules for the valid variable ranges, and define cross-variable rules to catch impossible
combinations. The procedure returns a report of the problem cases and variables.
Moreover, the data has the same data elements each month, so the analyst is able to
apply the rules now to the new data file next month.
Chapter
3
Statistics. The procedure produces lists of variables, cases, and data values that fail
various checks, counts of violations of single-variable and cross-variable rules, and
simple descriptive summaries of analysis variables.
Weights. The procedure ignores the SPSS weight variable specification and instead
treats it as any other analysis variable.
To Validate Data
E From the menus choose:
Data
Validation
Validate Data...
11
Page 24
12
Chapter 3
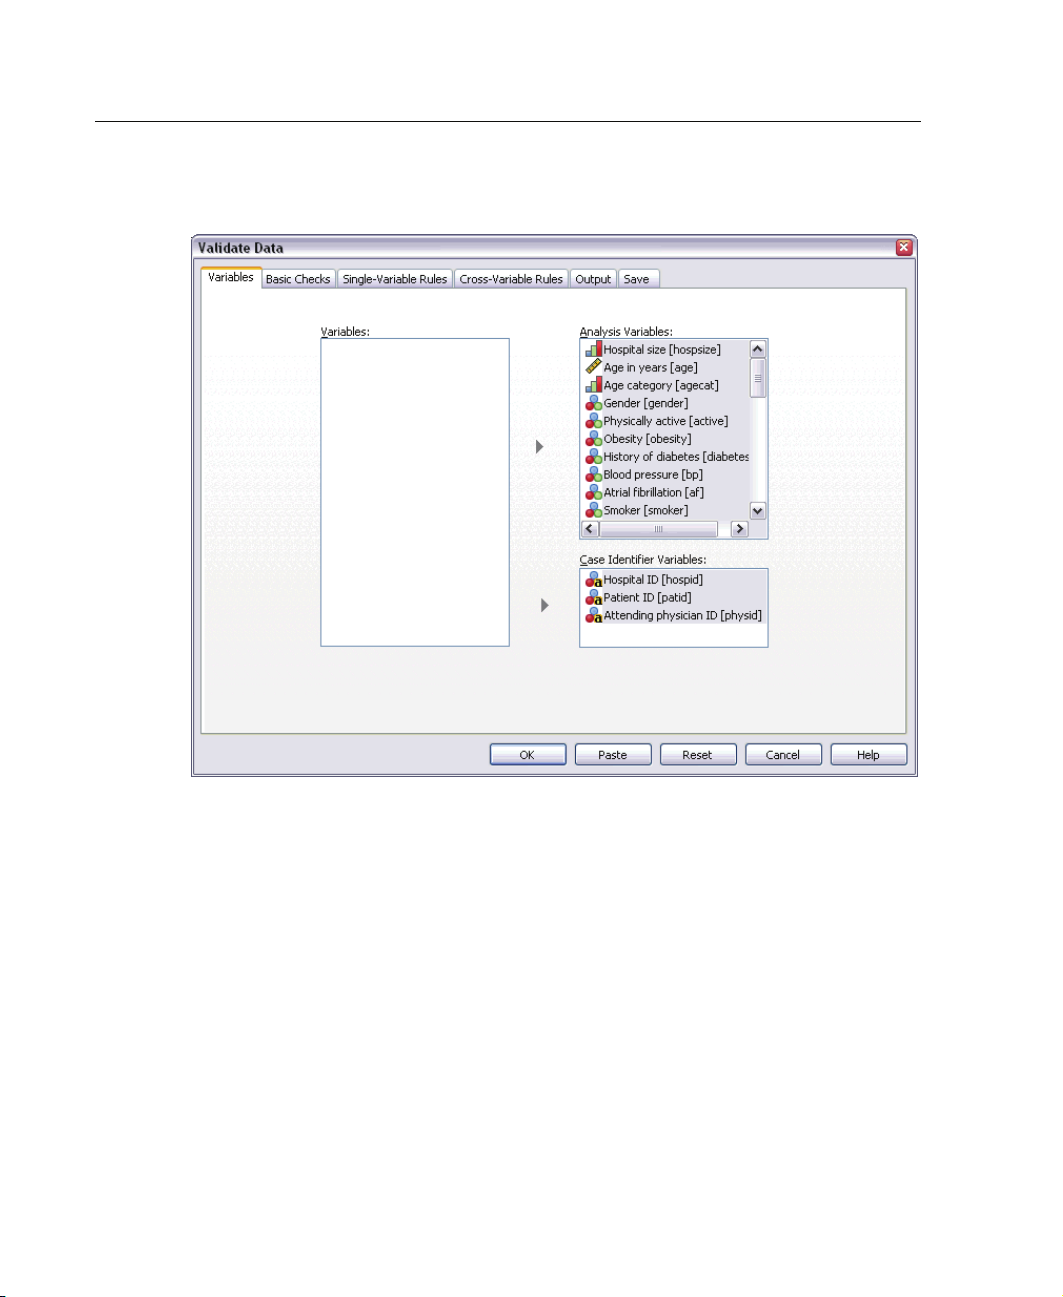
Figure 3-1
Validate Data dialog box
E Select
one or more analysis variables for validation b y basic variable checks or by
single-variable validation rules.
Alterna
E Click t
tively, you can:
he
Cross-Variable Rules tab and apply one or more cross-variable rules.
Optionally, you can:
Select one or more case identification variables to check for duplicate or
incompl
ete IDs. Case ID variables are also used to label casewise output. If two or
more case ID variables are specified, the combination of their values is treated as
a case identifier.
Page 25
Validate Data Basic Checks
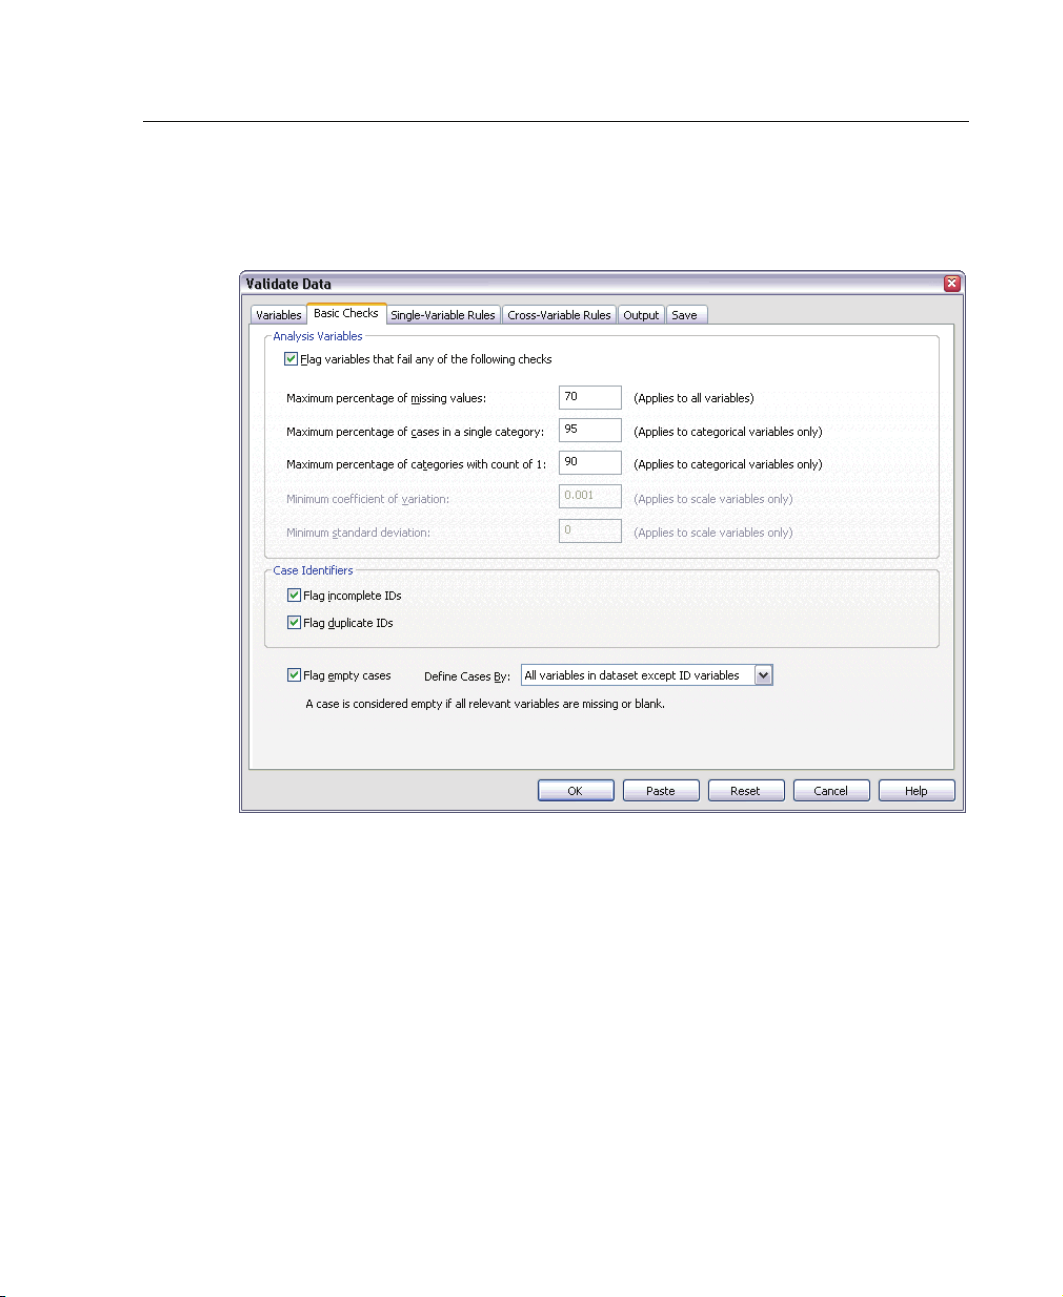
Figure 3-2
Validate Data: Basic Checks tab
13
Val ida te D ata
The Basic Checks tab allows you to select basic checks for analysis variables, case
identifiers, and whole cases.
Analysis Variables. If you selected any analysis variables on the Variables tab, you
can select any of the following checks of their validity. The check box allows you to
turn the checks on or off.
Maximum percentage of missing values. Reports analysis variables with a
percentage of missing values greater than the specified value. The specified value
must be a positive number less than or equal to 100.
Maximum percentage of cases in a single category. If any analysis variables are
categorical, this option reports categorical analysis variables with a percentage of
cases representing a single nonmissing category greater than the specified value.
Page 26

14
Chapter 3
The specified value must be a positive number less than or equal to 100. The
percentage is based on cases with nonmissing values of the variable.
Maximum percentage of categories with count of 1. If any analysis variables
are categorical, this option reports categorical analysis variables in which the
percentage of the variable’s categories containing only one case is greater than
thespecifiedvalue. Thespecifiedvaluemustbeapositivenumberlessthanor
equal to 100.
Minimum coefficient of variation. If any analysis variables are scale, this option
reports scale analysis variables in which the absolute value of the coefficient of
variation is less than the specified value. This option applies only to variables in
which the mean is non-zero. The specifiedvaluemustbeanon-negativenumber.
Specifying 0 turns off the coefficient of variation check.
Minimum standard deviation. If any analysis variables are scale, this option reports
scale analysis variables whose standard deviation is less than the specified value.
The specified value must be a non-negative number. Specifying 0 turns off the
standard deviation check.
Case Iden tifier s. If you selected any case identifier variables on the Variables tab, you
can select any of the following checks of their validity.
Flag incomplete IDs. This option reports cases with incomplete case identifiers. For
a particular case, an identifier is considered incomplete if the value of any ID
variable is blank or missing.
Flag duplicate IDs. This option reports cases with duplicate case identifiers.
Incomplete identifiers are excluded from the set of possible duplicates.
Flag empty cases. This option reports cases in which all variables are empty or blank.
For the purpose of identifying empty cases, you can choose to use all variables in the
file (except any ID variables) or only analysis variables defined on the Variables tab.
Page 27
Validate Data Single-Variable Rules
Figure 3-3
Validate Data: Single-Variable Rules tab
15
Val ida te D ata
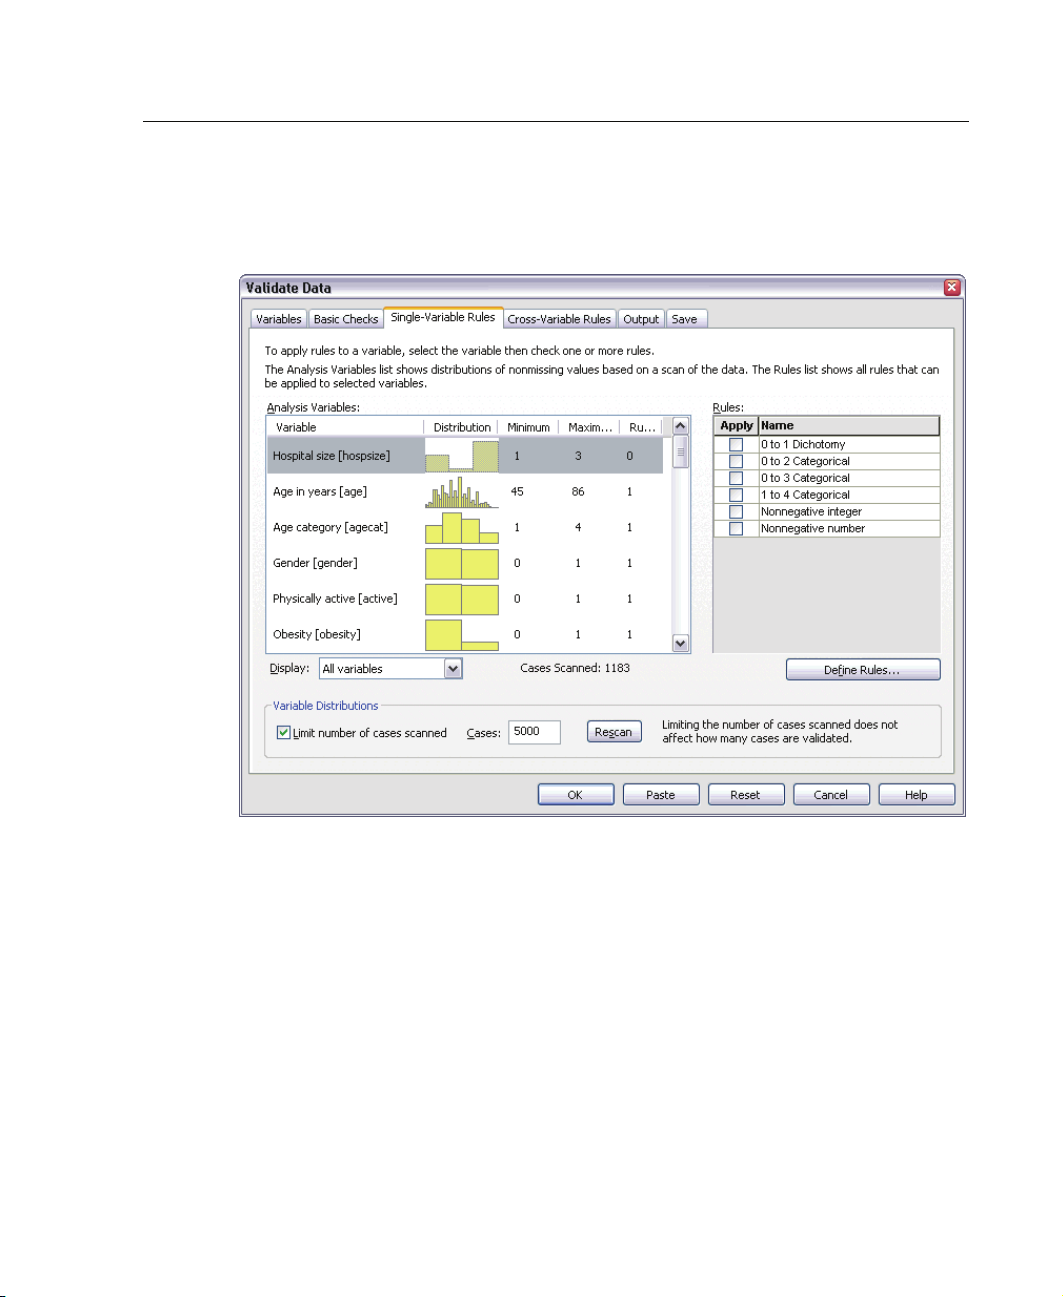
The Single-Variable Rules tab displays available single-variable validation rules and
allows you to apply them to analysis variables. To define additional single-variable
click
rules,
Define Rules. For more information, see “Define Single-Variable Rules” in
Chapter 2 on p. 5.
Analysis Variables. The list shows analysis variables, summarizes their distributions,
and sho
ws the number of rules applied to each variable. Note that user- and
system-missing values are not included in the summaries. The Display drop-down
list controls which variables are shown; you can choose from
bles
varia
, String variables,andDate variables.
All variables, Numer ic
Page 28
16
Chapter 3
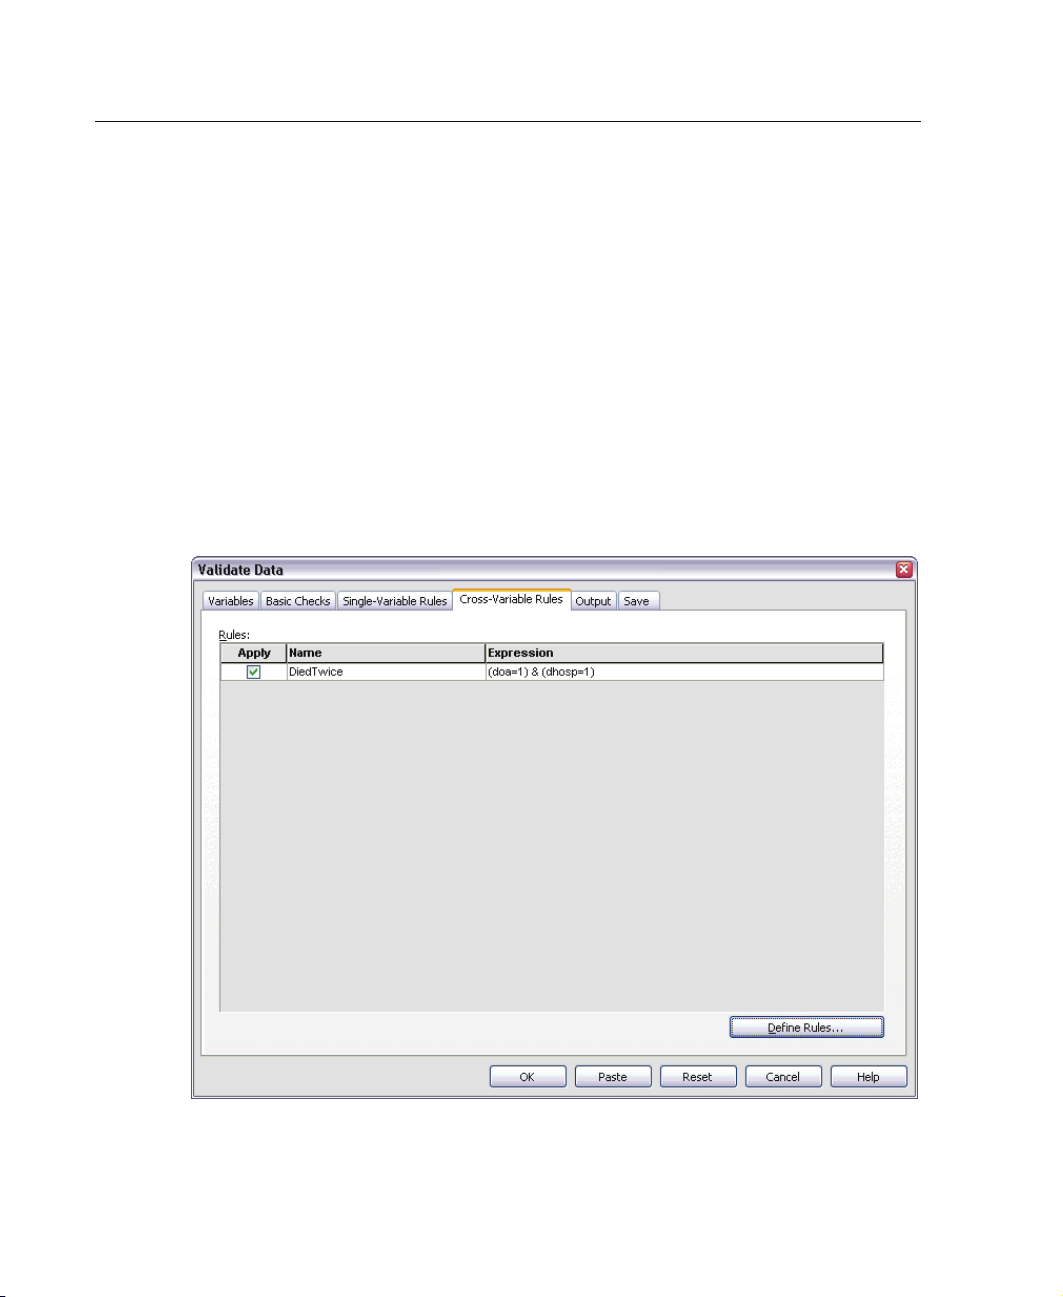
Rules. To apply rules to analysis variables, select one or more variables and check all
rules that you want to apply in the Rules list. The Rules list shows only rules that
are appropriate for the selected analysis variables. For example, if numeric analysis
variables are selected, only numeric rules are shown; if a string variable is selected,
only string rules are shown. If no analysis variables are selected or they have mixed
data types, no rules are shown.
Variable Distributions. The distribution summaries shown in the Analysis V ariables list
can be based on all cases or on a scan of the first n cases, as specified in the Cases text
box. Clicking Rescan updates the distribution summaries.
Validate Data Cross-Variable Rules
Figure 3-4
Validate D ata: Cross-Variable Rules tab
Page 29
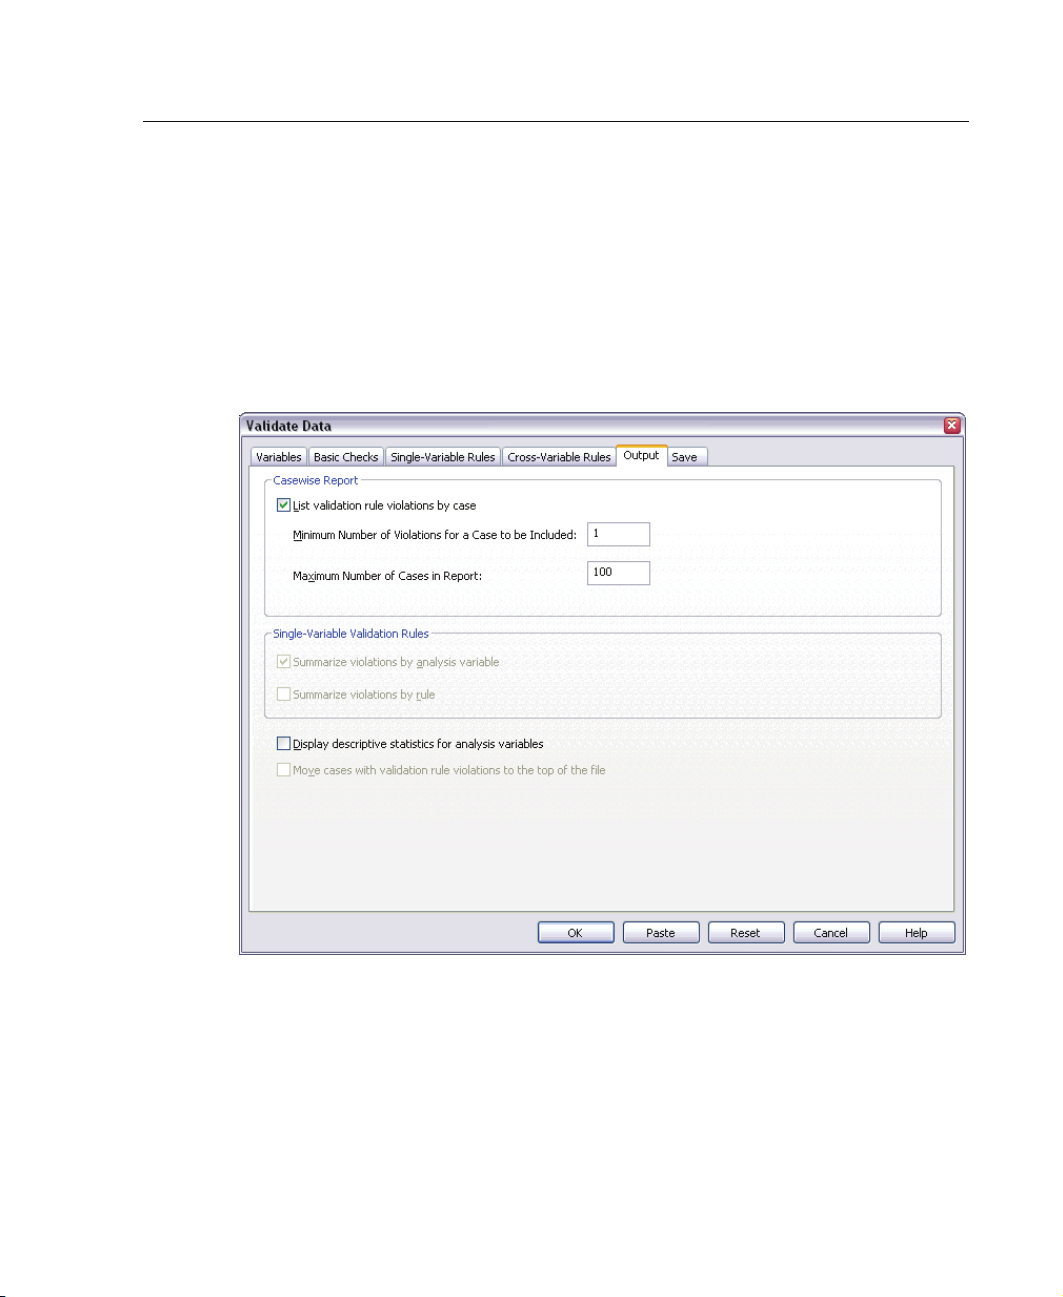
The Cross-Variable Rules tab displays available cross-variable rules and allows you to
apply them to your data. To define additional cross-variable rules, click Define Rules.
For more information, see “Define C ross-Variable Rules” in Chapter 2 on p. 8.
Validate Data Output
Figure 3-5
Validate Data: Output tab
17
Val ida te D ata
Casewise Report. If you have applied any single-variable or cross-variable validation
rules, you can request a report that lists validation rule violations for individual cases.
Minimum Number of Violations. This option specifies the minimum number of rule
violations required for a case to be included in the report. Specify a positive integer.
Maximum Number of Cases. This option specifies the maximum number of cases
included in the case report. Specify a positive integer less than or equal to 1000.
Page 30

18
Chapter 3
Single-Variable Validation Rules. If you have applied any single-variable validation
rules, you can choose how to display the results or whether to display them at all.
Summarize violations by analysis variable. For each analysis variable, this option
shows all single-variable validation rules that were violated and the number of
values that violated each rule. It also reports the total number of single-variable
rule violations for each variable.
Summarize violations by rule. For each single-variable validation rule, this option
reports variables that violated the rule and the number of invalid values per
variable. It also reports the total number of values that violated each rule across
variables.
Display descriptive statistics. This option allows you to request descriptive statistics
for analysis variables. A frequency table is generated for each categorical variable.
A table of summary statistics including the mean, standard deviation, minimum, and
maximum is generated for the scale variables.
Move cases with validation rule violations. This option moves cases with single-variable
or cross-variable rule violations to the top of the active dataset for easy perusal.
Page 31
Validate Data Save
Figure 3-6
Validate Data: Save tab
19
Val ida te D ata
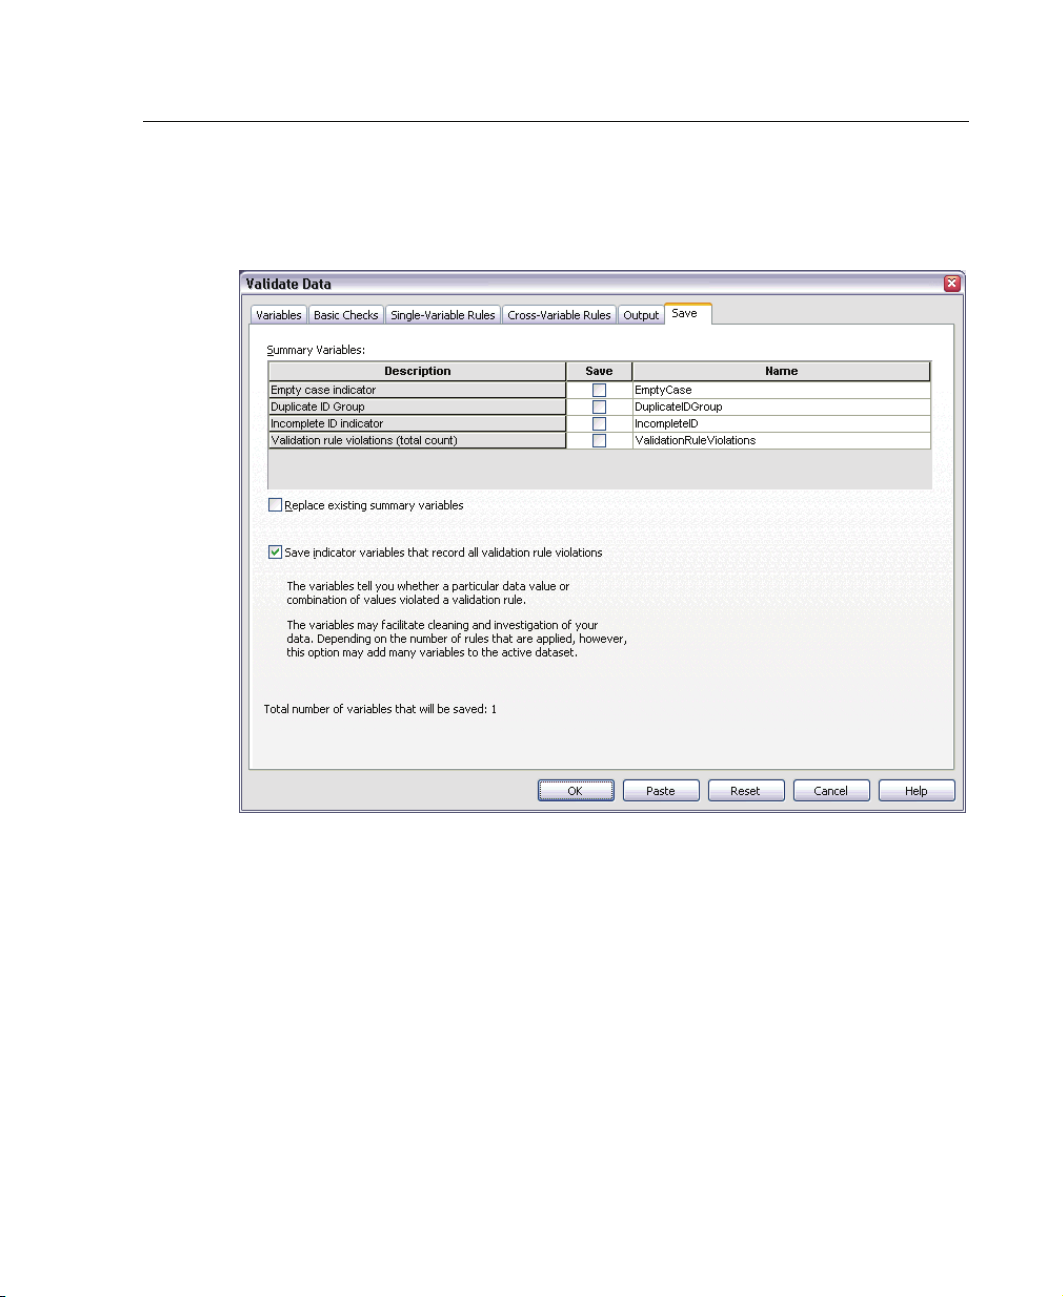
The Save tab allows you to save variables that record rule violations to the active
dataset.
Summary
Variables.
These are individual variables that can be saved. Check a box to
save the variable. Default names for the variables are provided; you can edit them.
Empty case indicator. Empty cases are assigned the value 1. All other cases are
coded 0
Dupli
. Values of the variable reflect the scope specified on the Basic Checks tab.
cate ID group.
Cases that have the same case identifier (other than cases with
incomplete identifiers) are a ssigned the same group number. Cases with unique
or incomplete identifiers are coded 0.
Page 32

20
Chapter 3
Incomplete ID indicator. Cases with e mpty or incomplete case identifiers are
assigned the value 1. All other cases are coded 0.
Validation rule violations. This is the casewise total count of single-variable and
cross-variable validation rule violations.
Replace existing summary variables. Variables saved to the data file must have unique
names, or replace variables with the same name.
Save indicator variables. This option allows you to save a complete record of validation
rule violations. Each variable corresponds to an application of a validation rule and has
a value of 1 if the case violates the rule and a value of 0 if it does not.
Page 33

Identify Unusual Cases
The Anomaly Detection procedure searches for unusual cases based on deviations
from the norms of their cluster groups. The procedure is designed to quickly detect
unusual cases for data-auditing purposes in the exploratory data analysis step, prior to
any inferential data analysis. This algorithm is designed for generic anomaly detection;
that is, the definition of an anomalous case is not specific to any particular application,
such as detection of unusual payment patterns in the healthcare industry or detection
of money laundering in the finance industry, in which the definition of an anomaly
can be well-defined.
Example. A data analyst hired to build predictive models for stroke treatment outcomes
is concerned about data quality because such models can be sensitive to unusual
observations. Some of these outlying observations represent truly unique cases and
are thus unsuitable for prediction, while other observations are caused by data entry
errors in which the values are technically “correct” and thus cannot be caught by data
validation procedures. The Identify Unusual Cases procedure finds and reports these
outliers so that the analyst can decide how to handle them.
Chapter
4
Statistics. The procedure produces peer groups, peer group norms for continuous and
categorical variables, anomaly indices based on deviations from peer group norms, and
variable imp
unusual.
Data Considerations
Data.
represents a distinct observation, and each column represents a distinct variable upon
which the peer groups are based. A case identification variable can be available in the
data file for marking output, but it will not be used in the analysis. Missing values are
allowed. The SPSS weight variable, if specified, is ignored.
act values for variables that most contribute to a case being considered
This procedure works with both continuous and categorical variables. Each row
21
Page 34

22
Chapter 4
The detection model can be applied to a new test data file. The elements of the test
data must be the same as the elements of the training data. And, depending on the
algorithm settings, the missing value handling that is used to create the model may be
applied to the test data file prior to scoring.
Case order. Note that the solution may depend on the order of cases. To minimize order
effects, randomly order the cases. To verify the stability of a given solution, you may
want to obtain several different solutions with cases sorted in different random orders.
In situations with extremely large file sizes, multiple runs can be performed, with a
sample of cases sorted in different random orders.
Assumptions. The algorithm assumes that all variables are nonconstant and independent
and assumes that no case has missing values for all of the input variables. Each
continuous variable is assumed to have a normal (Gaussian) distribution, and each
categorical variable is assumed to have a multinomial distribution. Empirical internal
testing indicates that the procedure is fairlyrobusttoviolationsofboththeassumption
of independence and the distributional assumptions, but be aware of how well these
assumptions are met.
To Identify Unusual Cases
E From the menus choose:
Data
Identify Unusual Cases...
Page 35
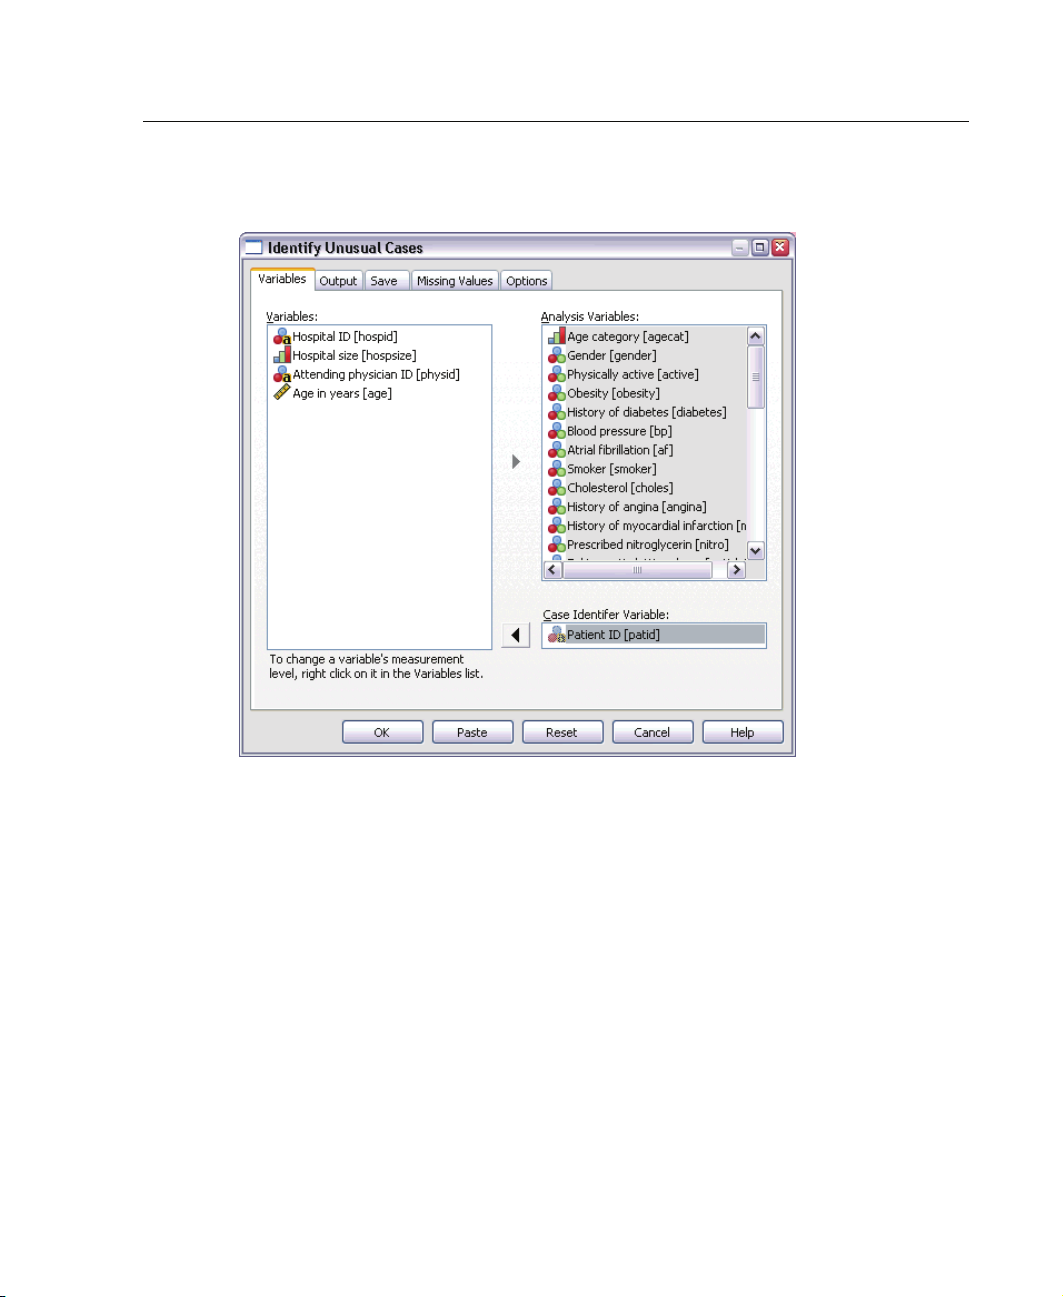
Figure 4-1
Identify Unusual Cases: Variables tab
23
Identify Unusual Cases
E Select at least one analysis variable.
E Optionally, choose a case ID variable to use in labeling output.
Page 36
24
Chapter 4
Identify Unusual Cases Output
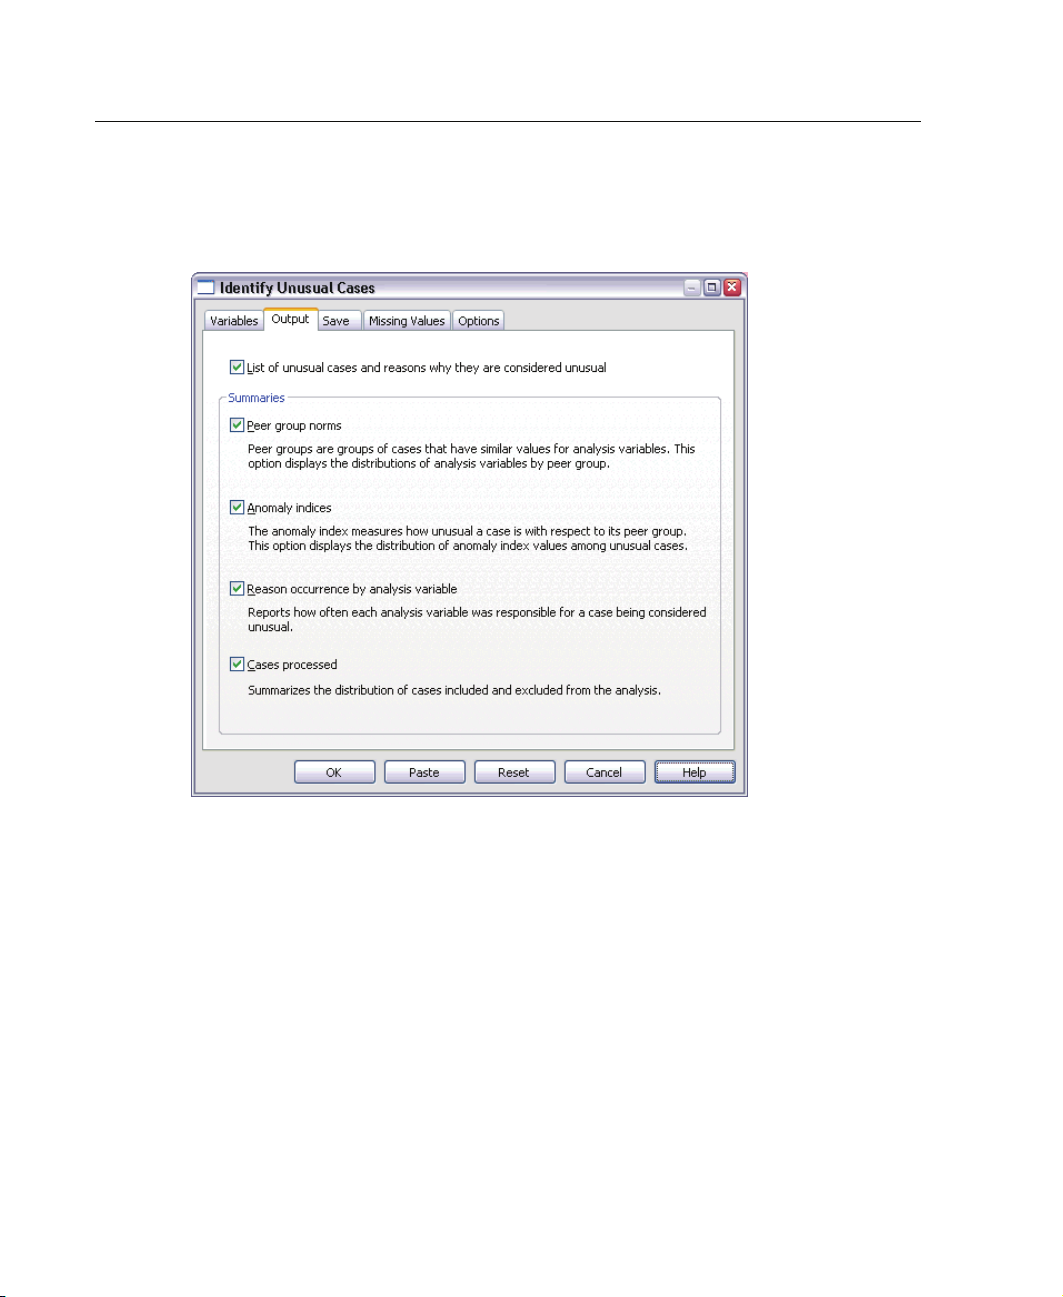
Figure 4-2
Identify Unusual Cases: Output tab
List of unusual cases and reasons why the y are considered unusual. This option produces
three tables:
The anomaly case index list displays cases that are identified as unusual and
displays their corresponding anomaly index values.
The anomaly case peer ID list displays unusual cases and information concerning
their corresponding peer groups.
The anomaly reason list displays the case number, the reason variable, the variable
impact value, the value of the variable, and the norm of the variable for each reason.
All tables are sorted by anomaly index in descending order. Moreover, the IDs of the
cases are displayed if the case identifier variable is specified on the Variables tab.
Page 37

25
Identify Unusual Cases
Summaries. The controls in this group produce distribution summaries.
Peer group norms. This option displays the continuous variable norms table (if any
continuous variable is used in the analysis) and the categorical variable norms
table (if any categorical variable is used in the analysis). The continuous variable
norms table displays the mean and standard deviation of each continuous variable
for each peer group. The categorical variable norms table displays the mode (most
popular category), its frequency, and frequency percentage of each categorical
variable for each peer group. The mean of a continuous variable and the mode of a
categorical variable are used as the norm values in the analysis.
Anomaly indices. The anomaly index summary displays descriptive statistics for the
anomaly index of the cases that are identified as the most unusual.
Reason occurrence by analysis variable. For each reason, the table displays the
frequency and frequency percentage of each variable’s occurrence as a reason.
The table also reports the descriptive statistics of the impact of each variable.
If the maximum number of reasons is set to0ontheOptionstab,thisoptionis
not available.
Cases processed. The case processing summary displays the counts and count
percentages for all cases in the active dataset; the cases included and excluded in
the analysis; and the cases in each peer group.
Page 38
26
Chapter 4
Identify Unusual Cases Save
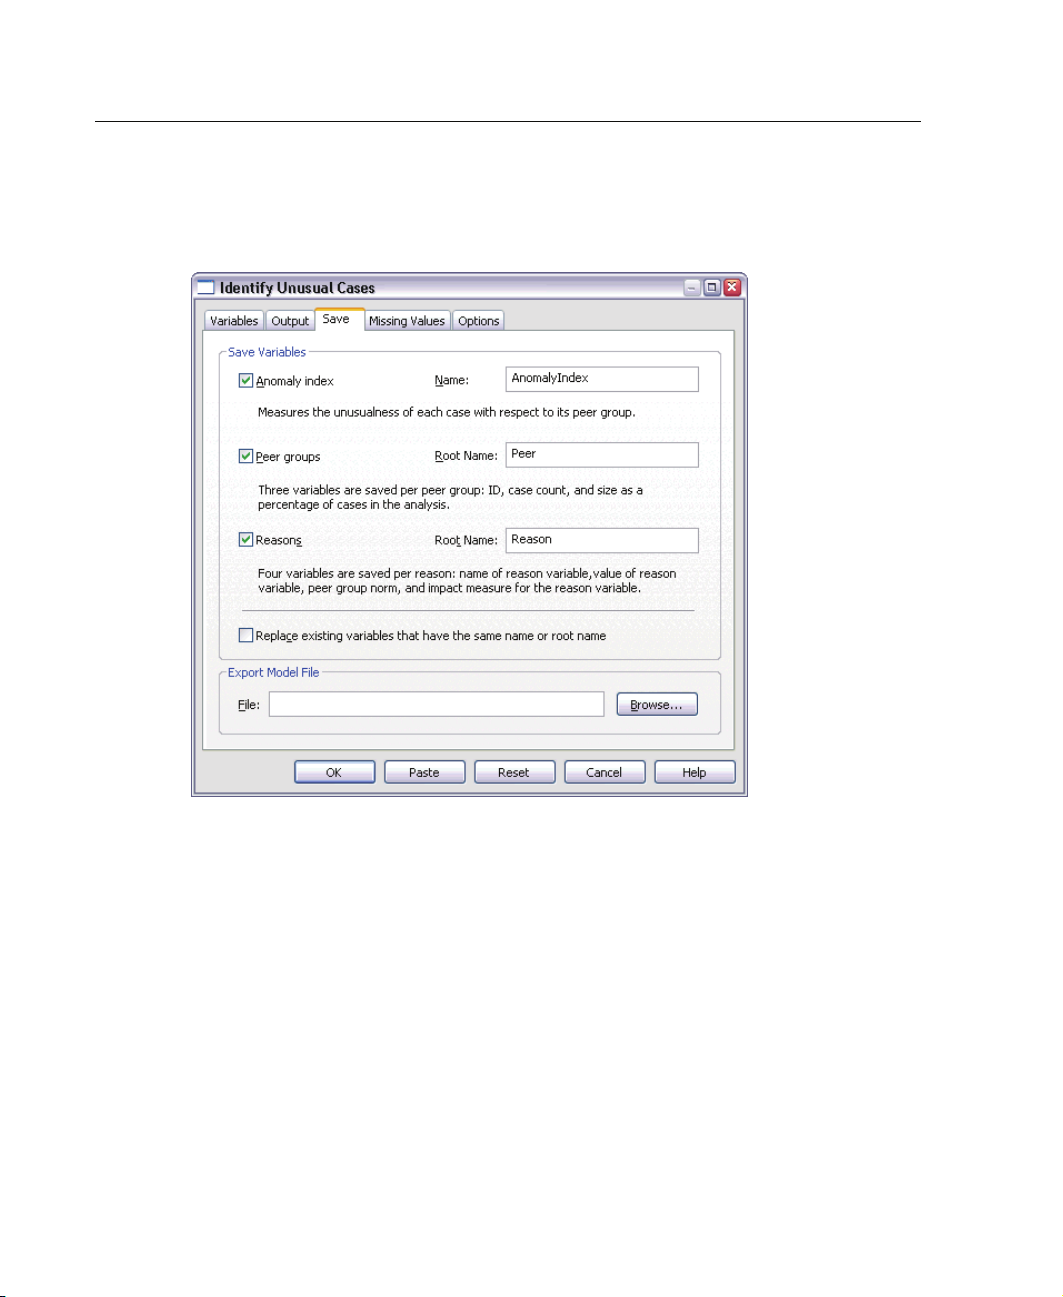
Figure 4-3
Identify Unusual Cases: Save tab
Save Variables. Controls in this group allow you to save model variables to the active
. You can also choose to replace existing variables whose names conflict with
dataset
the variables to be saved.
Anomaly index. Saves the value of the anomaly index for each case to a variable
e specified name.
with th
Saves the peer ID, peer group size, and peer group size as a percentage
Peer g
roups.
for each case to variables with the specified rootname. For example, if the
rootname Peer is specified, the variables Peerid, Peer S i ze ,andPeerPctSize are
Page 39
generated. Pee ri d is the peer group ID of the case, Peer S i ze is the group’s size,
and Pee r Pc tS i ze is the group’s size as a percentage.
Reasons. Saves sets of reasoning variables with the specified rootname. A set of
reasoning variables consists of the name of the variable as the reason, its variable
impact measure, its own value, and the norm value. The number of sets depends
on the number of reasons requested on the Options tab. For example, if the
rootname Reason is specified, the variables ReasonVar_k, ReasonMeasure_k,
ReasonValue_k,andReasonNorm_k are generated, where k is the kth reason. This
option is not available if the number of reasons is set to 0.
Export Model File. Allows you to save the model in XML format.
Identify Unusual Cases Missing Values
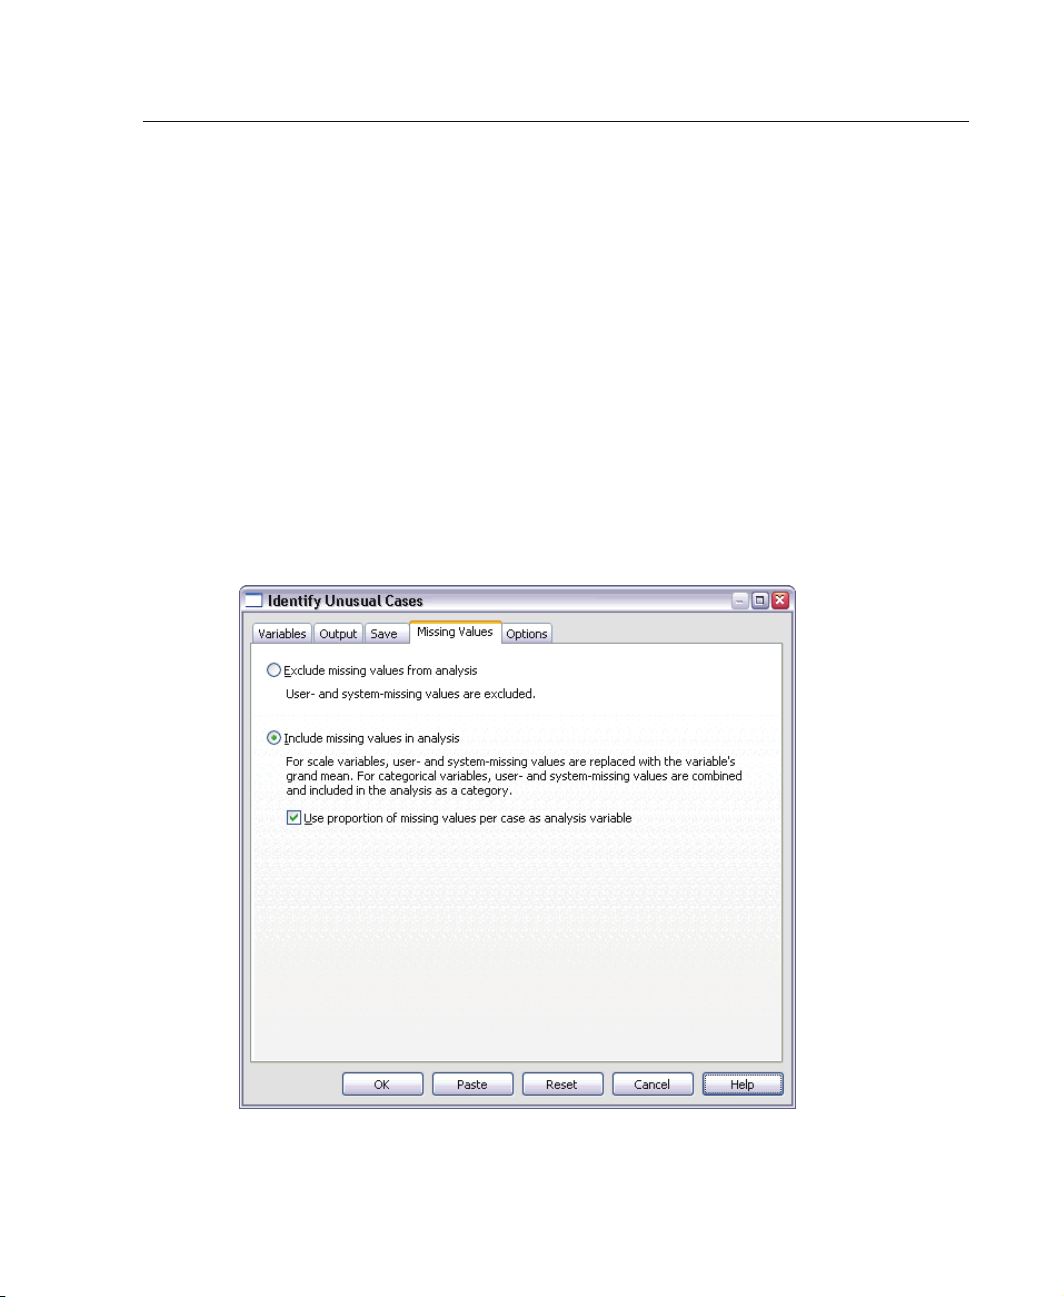
Figure 4-4
Identify Unusual Cases: Missing Values tab
27
Identify Unusual Cases
Page 40
28
Chapter 4
The Missing Values tab is used to control handling of user-missing and system-missing
values.
Exclude missing values from analysis. Cases with missing values are excluded from
the analysis.
Include missin g values in analysis. Missing values of continuous variables are
substituted by their corresponding grand means, and missing categories of
categorical variables are grouped and treated as a valid category. The processed
variables are then used in the a nalysis. Optionally, you can request the creation of
an additional variable that represents the proportion of missing variables in each
case and use that variable in the analysis.
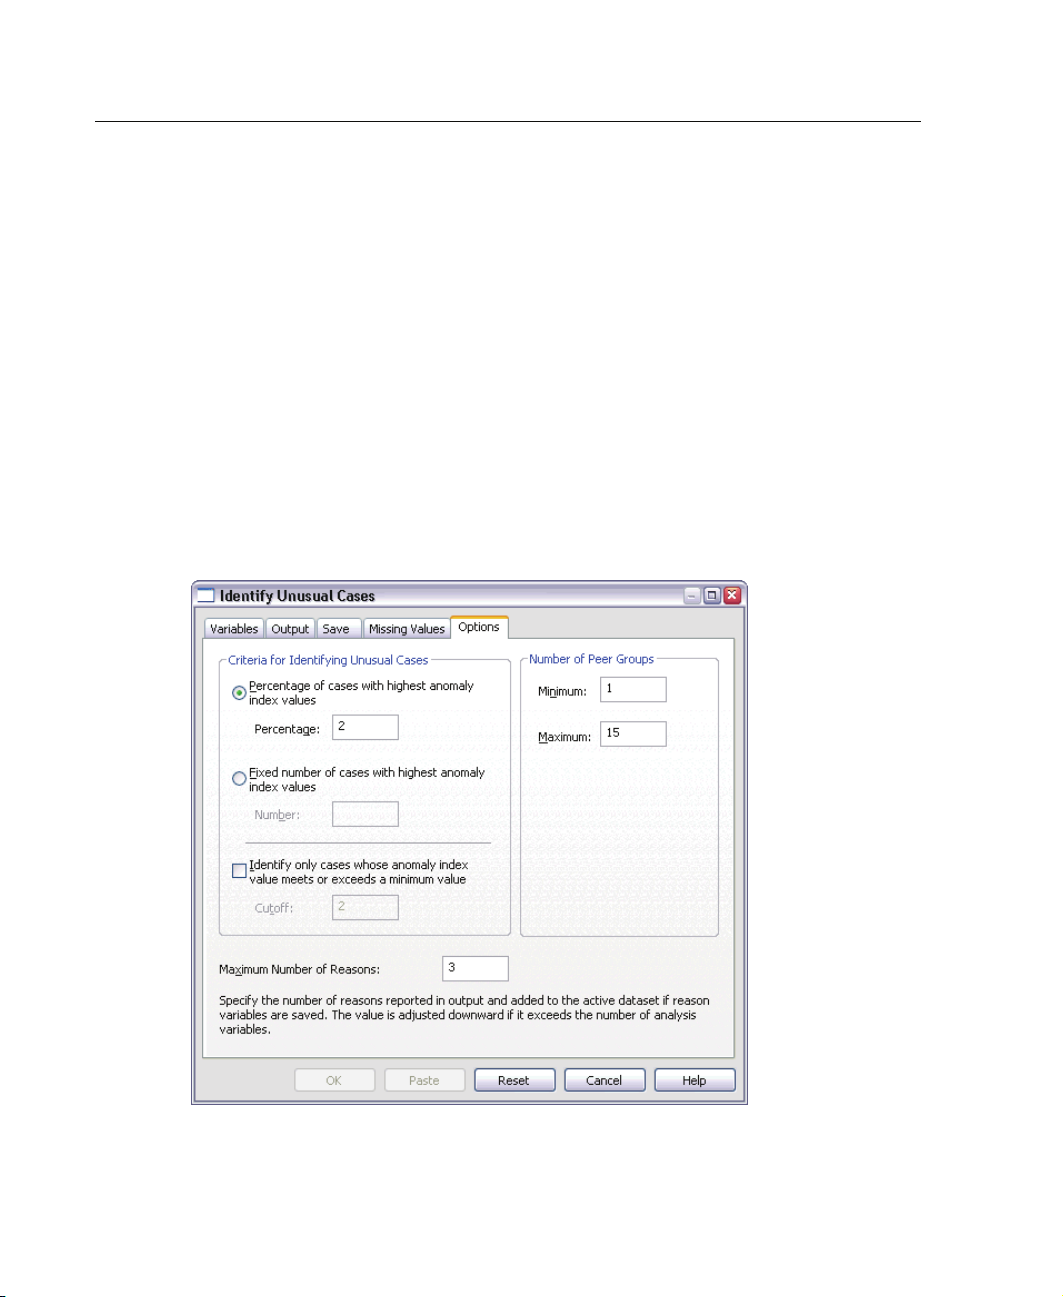
Identify Unusual Cases Options
Figure 4-5
Identify Unusual Cases: Options tab
Page 41

Identify Unusual Cases
Criteria for Identifying Unusual Cases. These selections determine how many cases
are included in the anomaly list.
Percentage of cases with highest anomaly index values. Specify a positive number
that is less than or equal to 100.
Fixed number of cases with highest anomaly index values. Specify a positive integer
that is less than or equal to the total number of cases in the active dataset and
used in the analysis.
Identify only cases whose anomaly index value meets or exceeds a minimum value.
Specify a non-negative number. A case is considered anomalous if its anomaly
index value is larger than or equal to the specified cutoff point. This option is used
together with the
Percentage of cases and Fixed number of cases options. For
example, if you specify a fixed number of 50 cases and a cutoff value of 2, the
anomaly list will consist of, at most, 50 cases, each with an anomaly index value
that is larger than or equal to 2.
Number of Peer Groups. The procedure will search for the best number of peer groups
between the specified minimum and maximum values. The values must be positive
integers, and the minimum must not exceed the maximum. When the specified values
are equal, the procedure assumes a fixed number of peer groups.
29
Note: Depending on the amount of variation in your data, there may be situations in
which the number of peer groups that the data can support is less than the number
specified as the minimum. In such a situation, the procedure may produce a smaller
number of peer groups.
Maximum Number of Reasons. A reason consists of the variable impact measure,
the variable name for this reason, the value of the variable, and the value of the
corresponding peer group. Specify a non-negative integer; if this value equals or
exceeds the number of processed variables that are used in the analysis, all variables
are shown.
DETECTANOMALY Command Additional Features
The SPSS command language also allows you to:
Omit a few variables in the active dataset from analysis without explicitly
specifying all of the analysis variables (using the
Specify an adjustment to balance the inf luence of continuous and categorical
variables (using the
MLWEIGHT keyword on the CRITERIA subcommand).
EXCEPT subcommand).
Page 42

30
Chapter 4
See the SPSS Command Syntax Reference for complete syntax information.
Page 43

Part II:
Examples
Page 44

Page 45

Validate Data
The Validate Data procedure identifies suspicious and invalid cases, variables, and
data values.
Validating a Medical Database
An analyst hired by a medical group must maintain the quality of the information in
the system. This process involves checking the values and variables and preparing a
report for the manager of the data entry team.
The latest state of the database is collected in stroke_invalid.sav. Use the Validate
Data procedure to obtain the information that is necessary to produce the report.
Syntax for producing these analyses can be found in validatedata_stroke.sps.
Chapter
5
Performing Basic Checks
E To run a Validate Data a nalysis, from the menus choose:
Data
Validation
Validate Data...
33
Page 46
34
Chapter 5
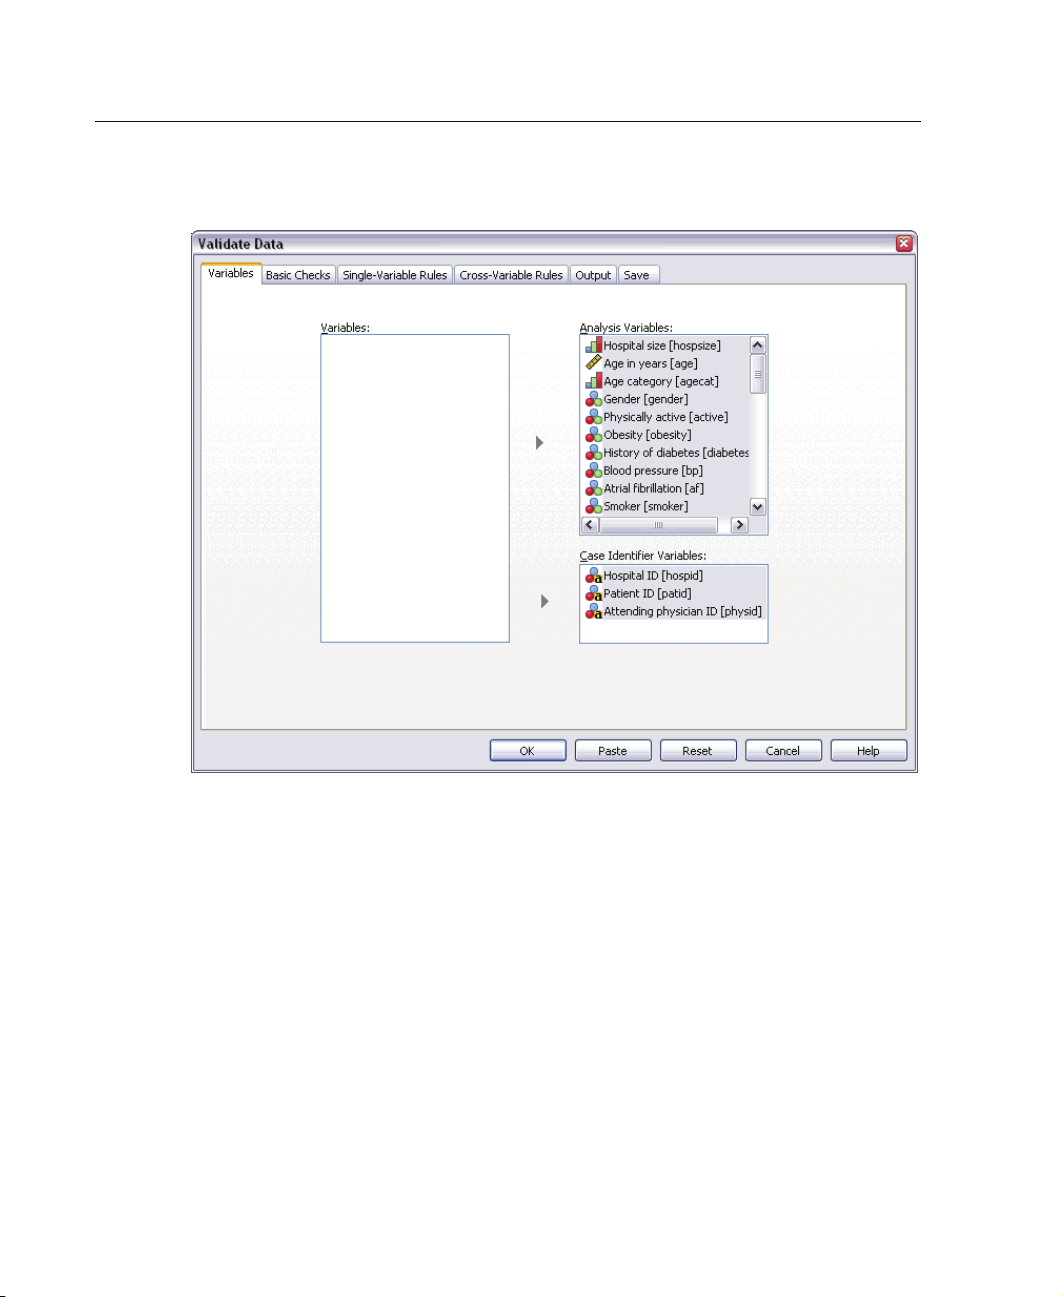
Figure 5-1
Validate Data: Variables tab
E Select
Hospital size and Age in years through Recoded Barthel index at 6 months as
analysis variables.
E Select Hospital ID, Patie n t I D,andAttending Physician ID as case identifier variables.
E Click the Basic Checks tab.
Page 47
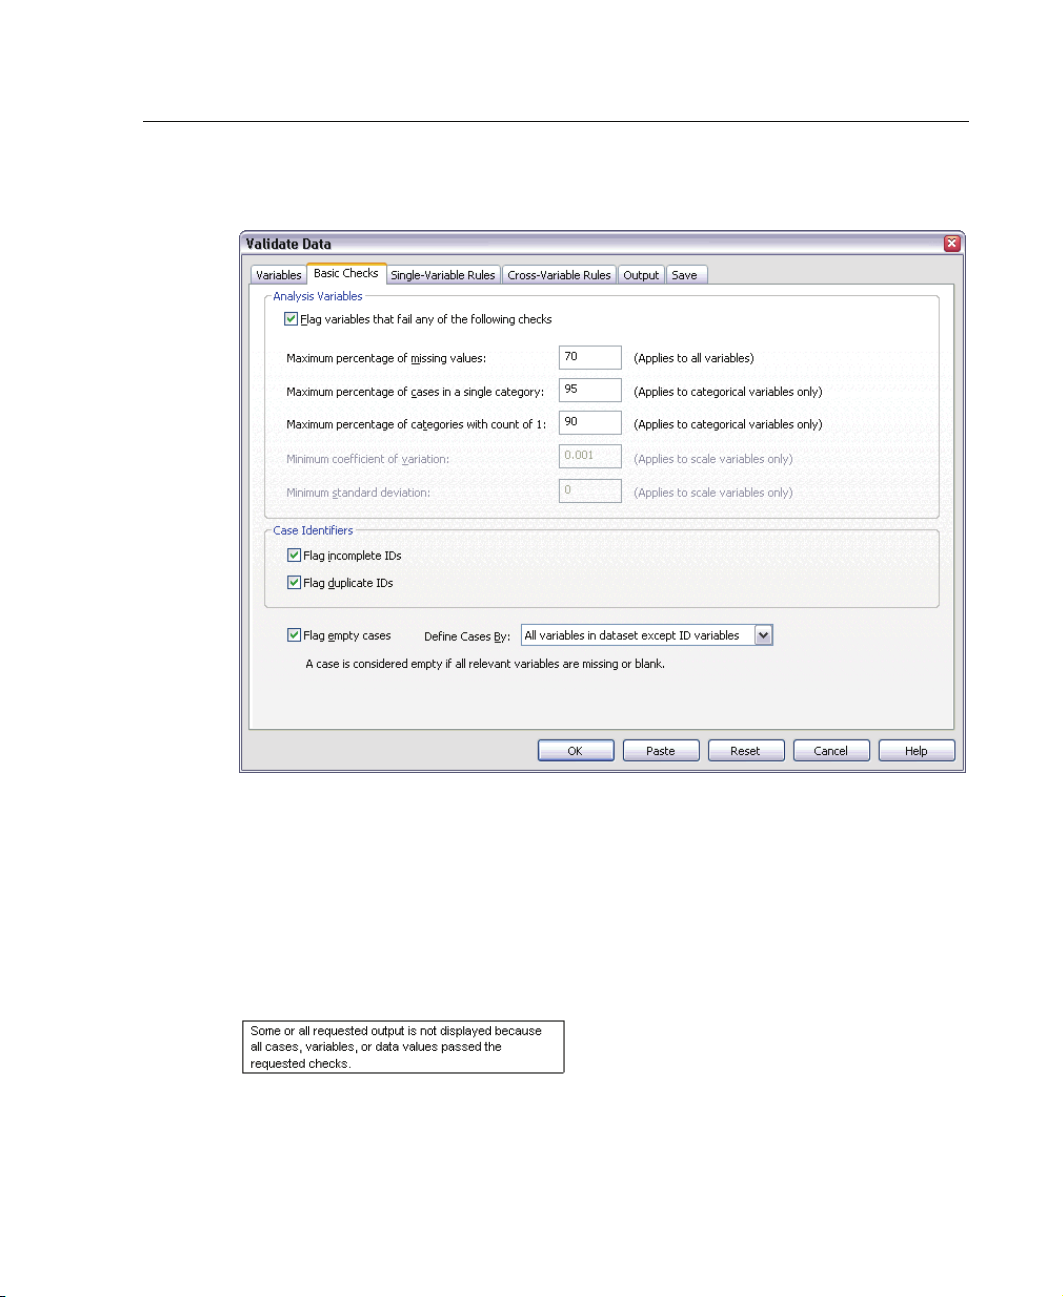
Figure 5-2
Validate Data: Basic Checks tab
35
Val ida te D ata
The default settings are, in fact, the settings that you want to run.
E Click OK.
Warnings
Figure 5-3
Warnings
The analysis variables passed the basic checks, and there are n o empty cases, so a
warning is displayed that explains why there is no output corresponding to these checks.
Page 48
36
Chapter 5
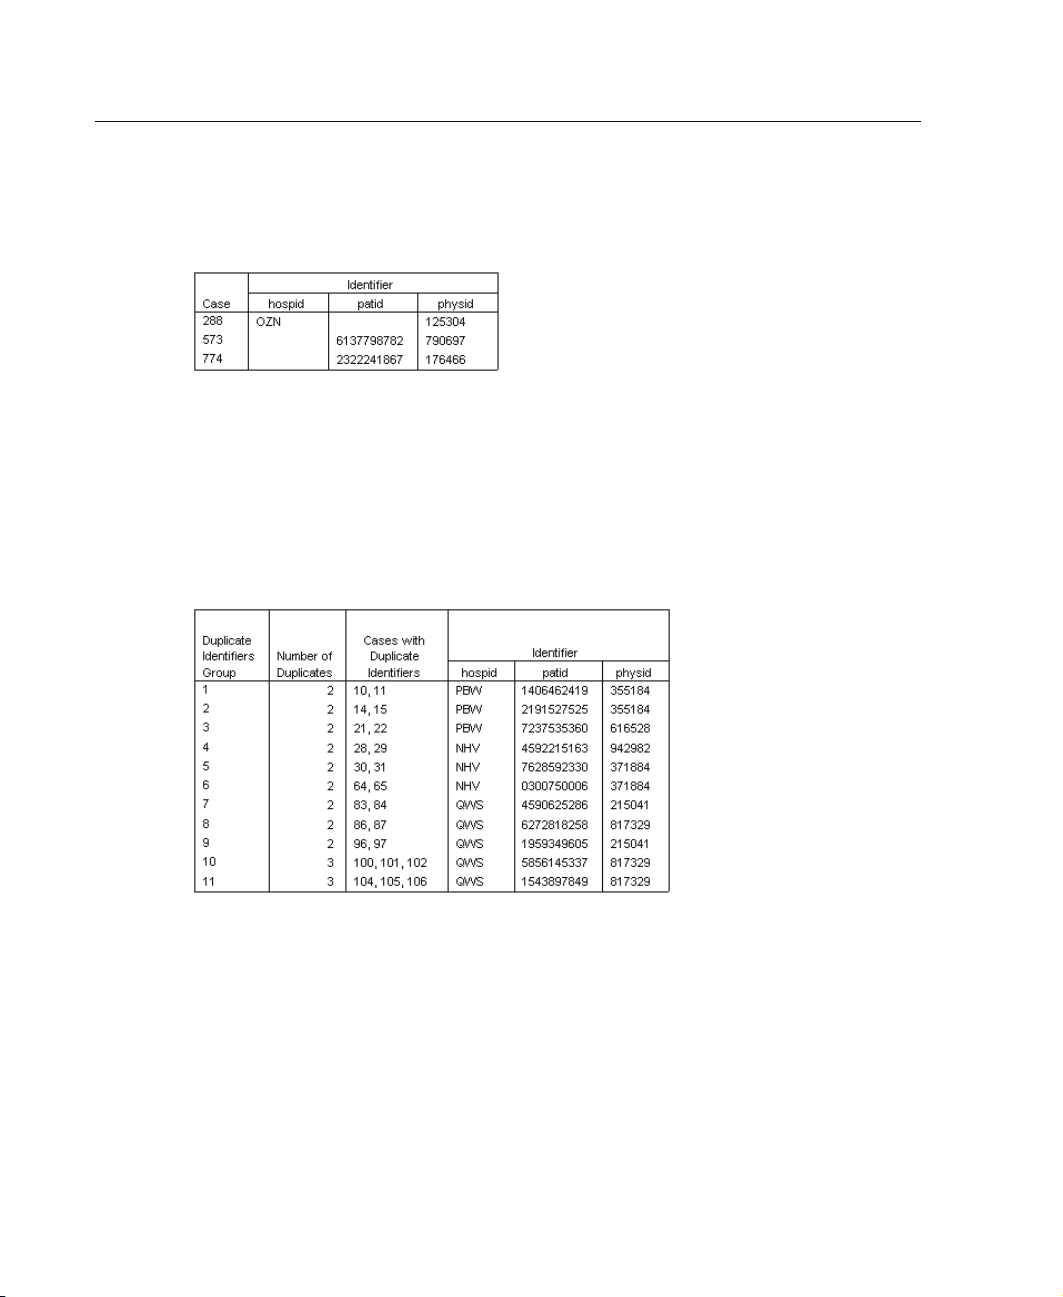
Incomplete Identifiers
Figure 5-4
Incomplete case identifiers
When there are missing values in case identification variables, the case cannot be
properly identified. In this data file, case 288 is missing the Pa t ie n t ID, while cases
573 and 774 are missing the Hospital ID.
Duplicate Identifiers
Figure 5-5
Duplicate case identifiers (first 11 shown)
A case should be uniquely identified by the combination of values of the identifier
variables. The first 11 entries in the duplicate identifiers table are shown here. These
duplica
tes are patients with multiple events who were entered as separate cases for
each event. Because this information can be collected in a single row, these cases
should be cleaned up.
Page 49

Copying and Using Rules from Another File
The analyst notes that the variables in this data file are similar to the variables from
another project. The validation rules that are defined for that project are saved as
properties of the associated data file and can be applied to this data file by copying
the data properties of the file.
E To copy rules from another file, from the menus choose:
Data
Copy Data Properties...
37
Val ida te D ata
Page 50
38
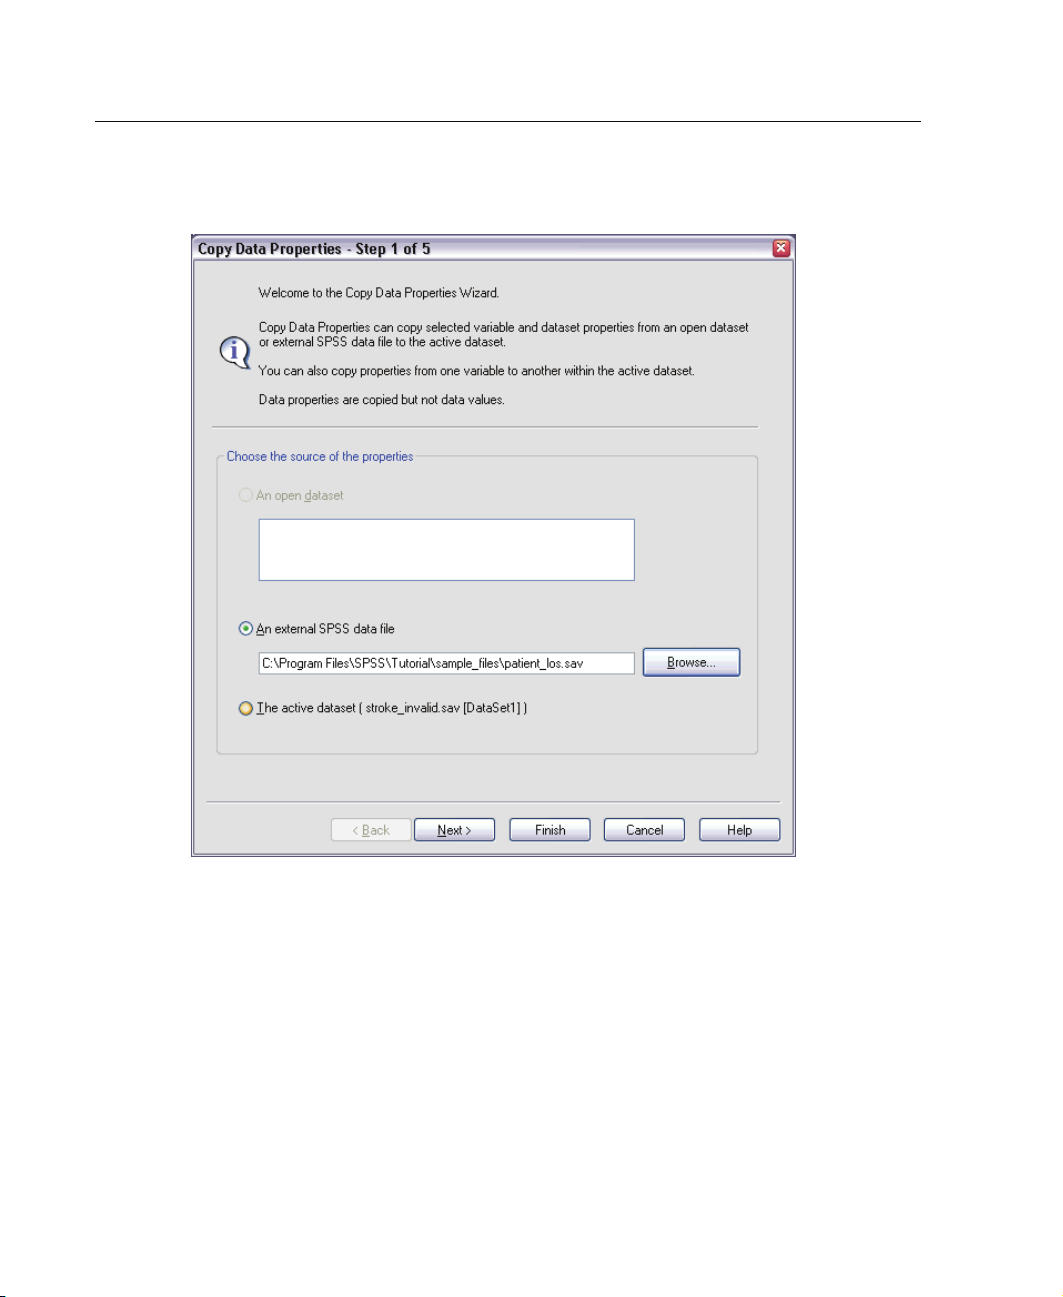
Chapter 5
Figure 5-6
Copy Data Properties - Welcome
E Choose to copy properties from an external SPSS data file, patient_los.sav, which can
be found in the \Tutorial\sample_files subdirectory of the SPSS installation directory.
E Click Next.
Page 51
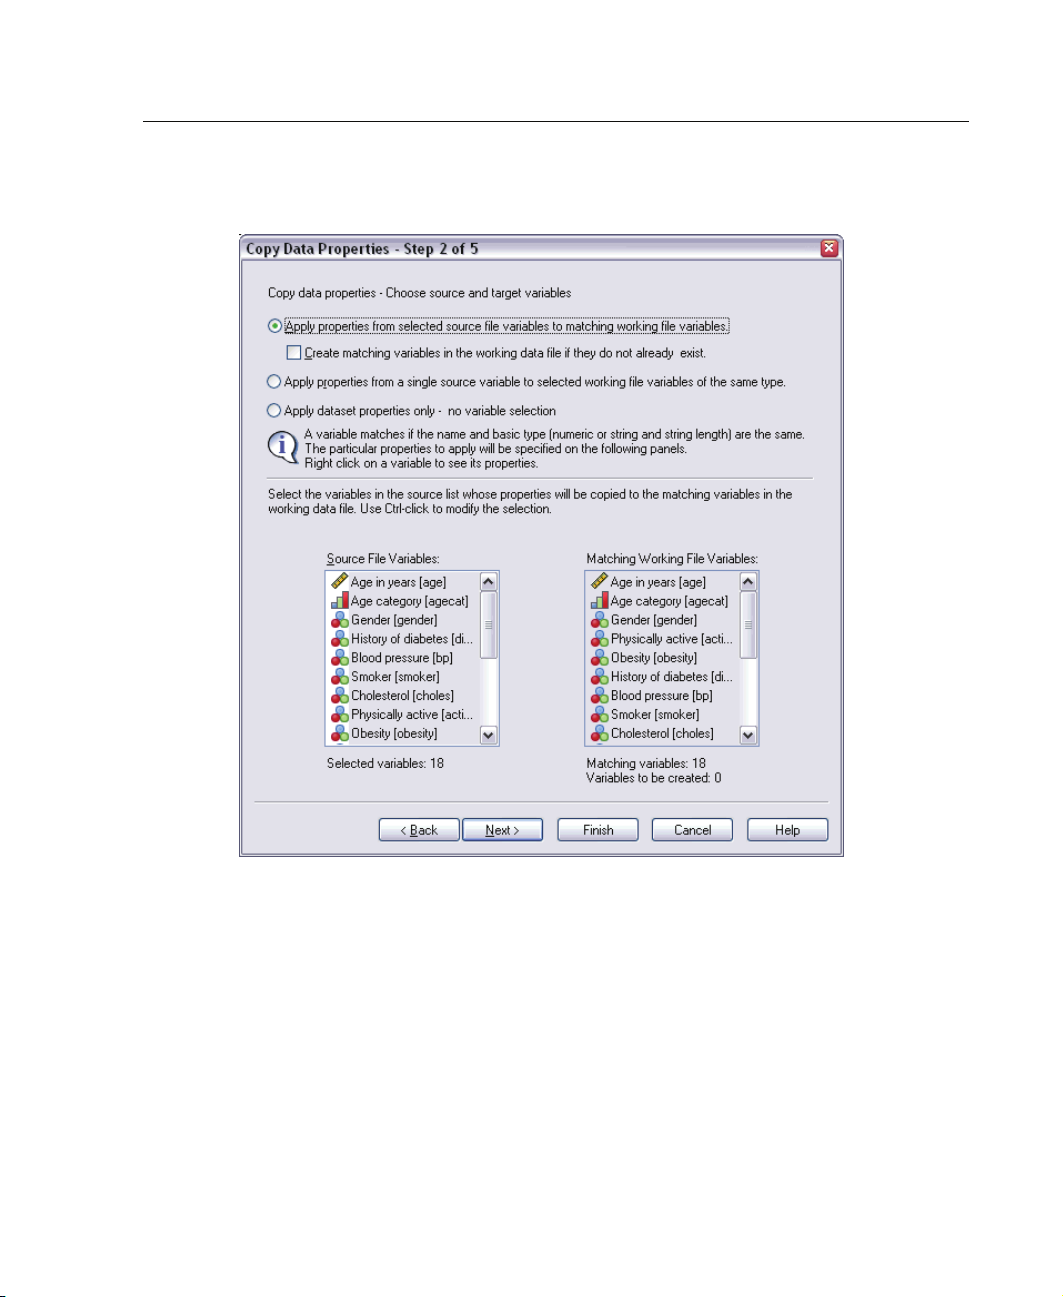
Figure 5-7
Copy Data Properties - Choose variables
39
Val ida te D ata
These are the variables whose properties you want to copy from patient_los.sav to the
corresponding variables in stroke_invalid.sav.
E Click Next.
Page 52
40
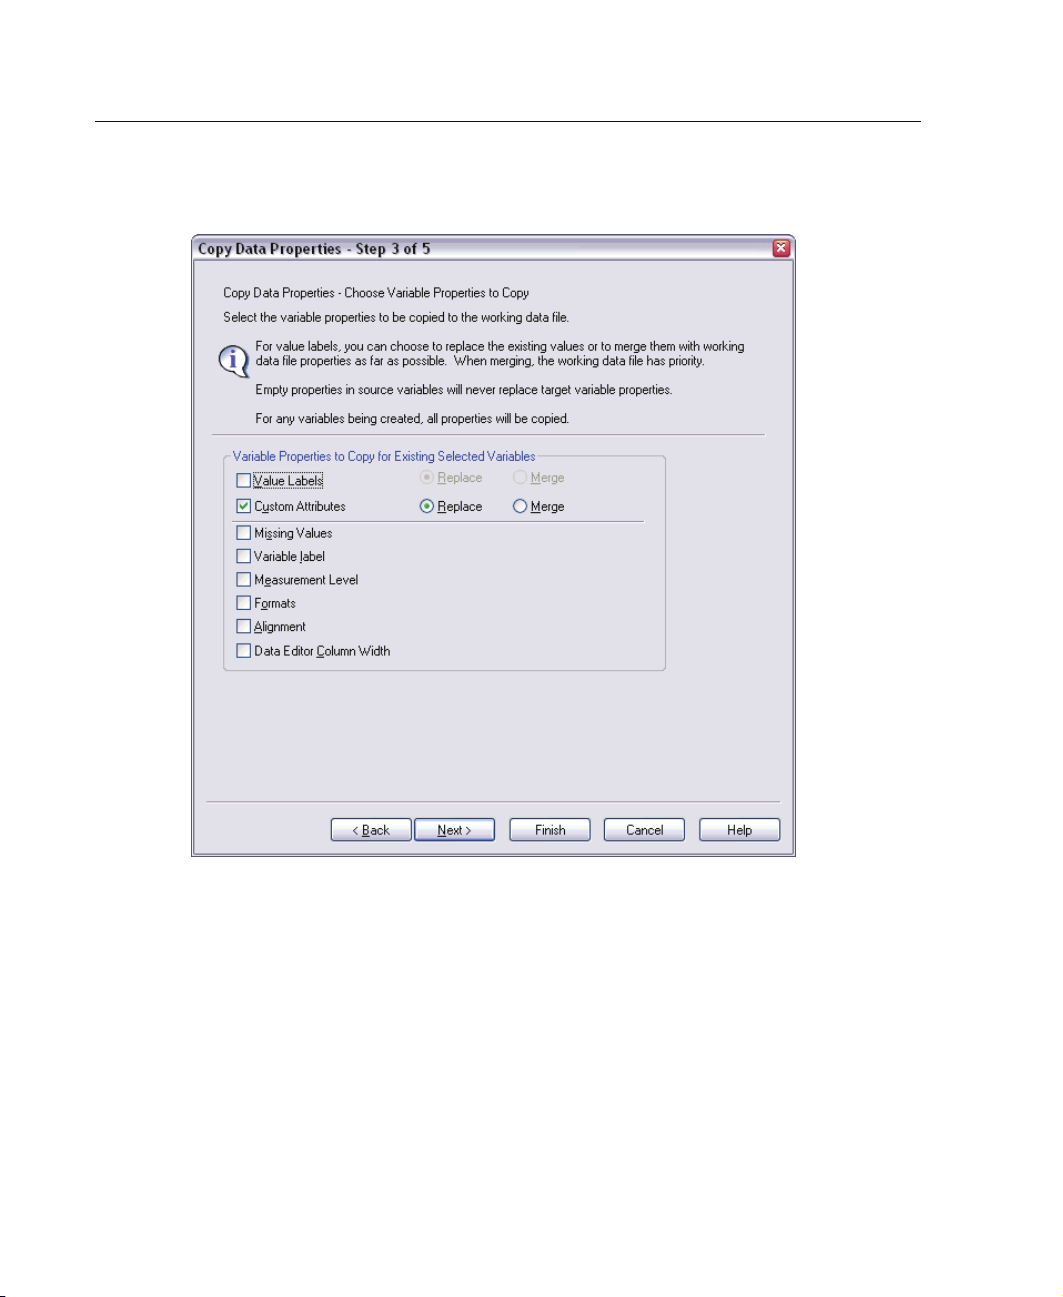
Chapter 5
Figure 5-8
Copy Data Properties - Choose variable properties
E Deselect all properties except Custom Attributes.
E Click Next.
Page 53
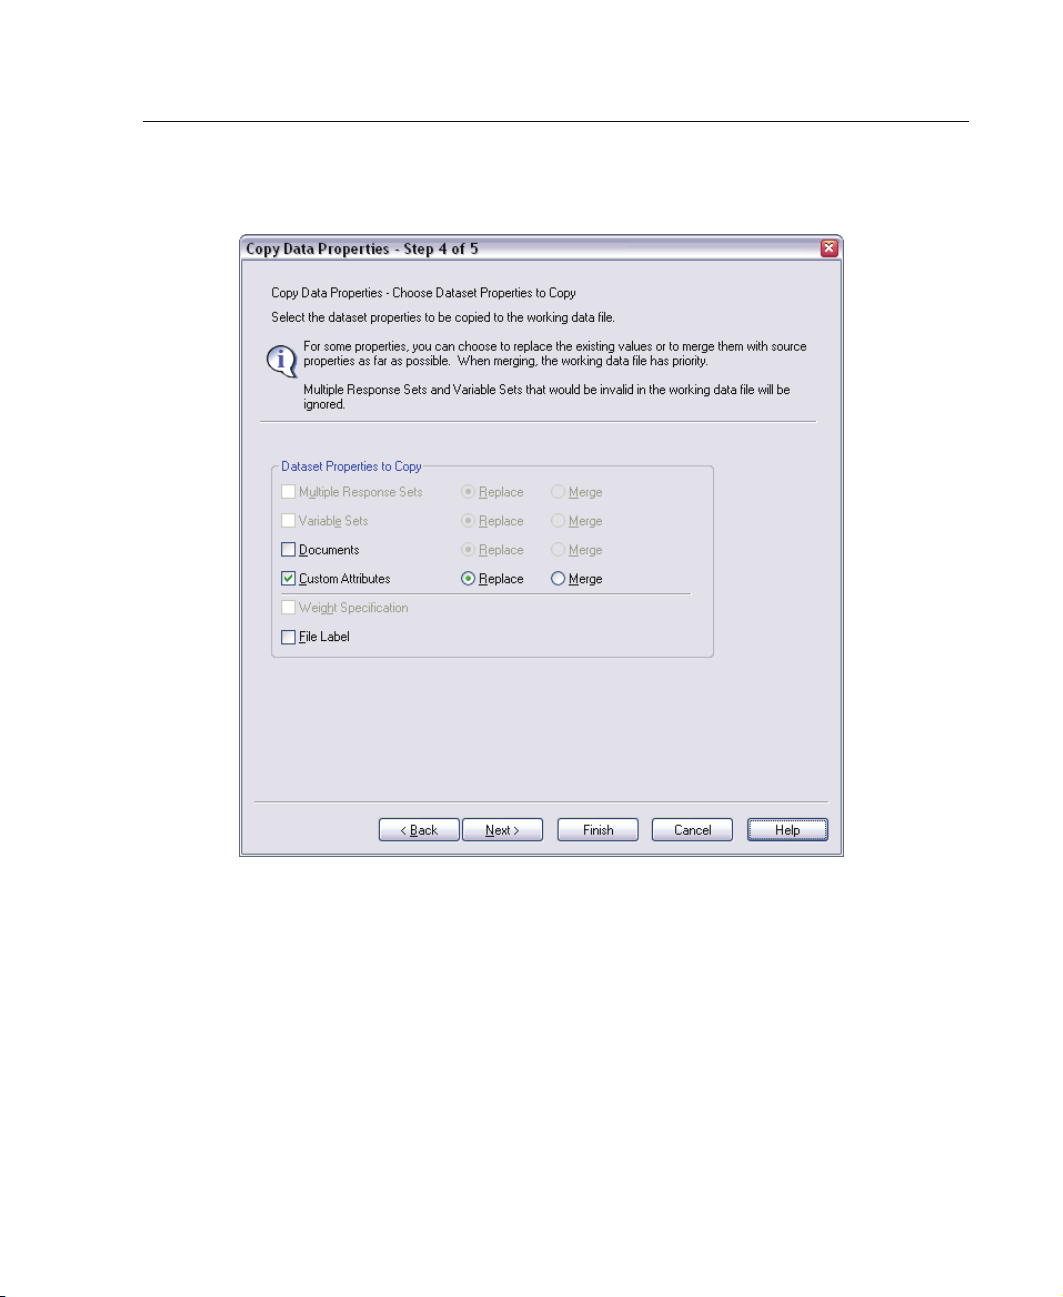
Figure 5-9
Copy Data Properties - Choose dataset properties
41
Val ida te D ata
E Select Custom Attributes.
E Click Finish.
You are now ready to reuse the validation rules.
Page 54
42
Chapter 5
Figure 5-10
Validate Data: Single-Variable Rules tab
E To va l i
E Click the Single-Variable Rules tab.
date the stroke_invalid.sav data by using the copied rules, click the Dialog
Recall toolbar button and choose
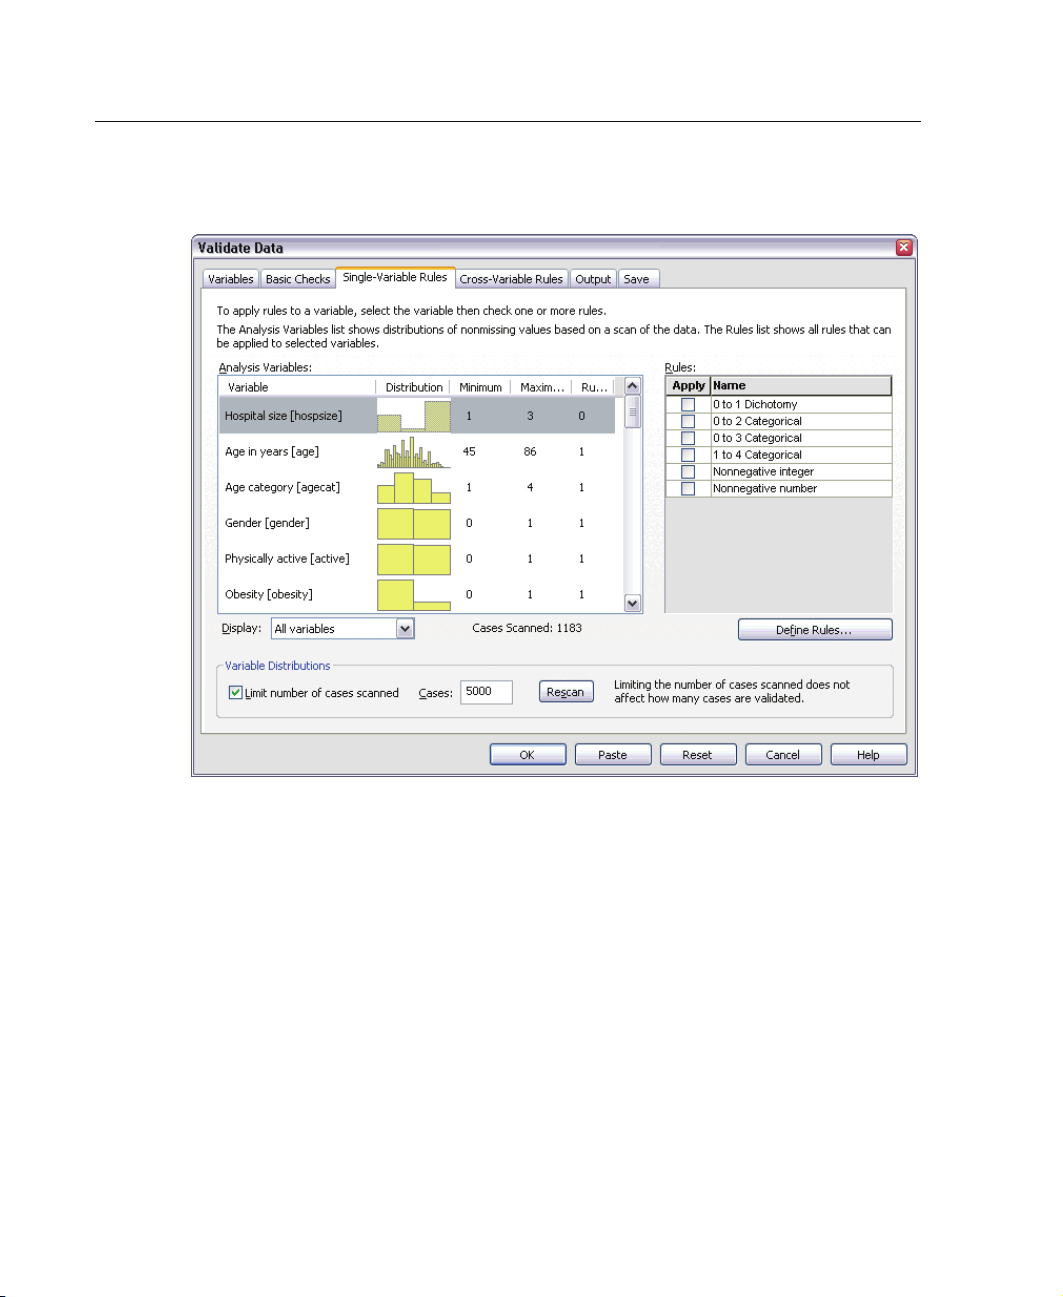
Val idate Data .
The Analysis Variables list shows the variables that are selected on the Variables tab,
some summary information about their distributions, and the number of rules attached
to each
variable. Variables whose properties were copied from patient_los.sav have
rules that are attached to them.
The Rules list shows the single-variable validation rules that are available in the data
hese rules were all copied from patient_los.sav. Note that some of these rules
file. T
are applicable to variables that did not have exact counterparts in the other data file.
Page 55
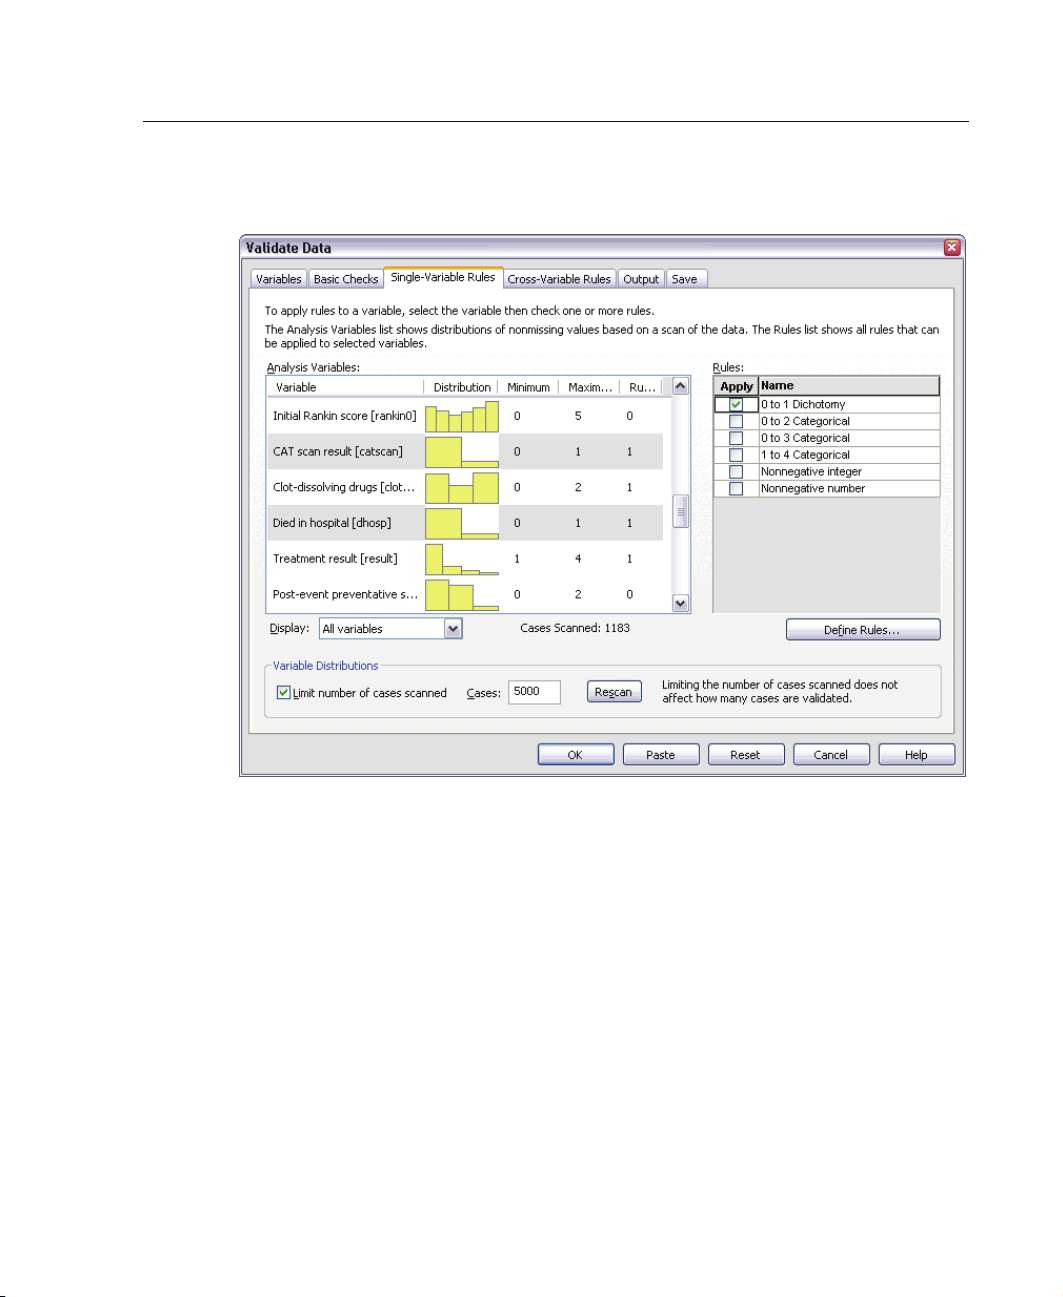
Figure 5-11
Validate Data: Single-Variable Rules tab
43
Val ida te D ata
E Select Atrial fibrillation, History of transient ischemic attack, CAT scan result,and
Died in hospital, and then apply the
E Apply 0 to 3 Categorical to Post-event rehabilitation.
E Apply 0to2Categoricalto Post-event preventative surgery.
E Apply No nnegative integer to Length of stay for rehabilitation.
E Apply 1to4Categoricalto Recoded Barthel index at 1 month through Recoded Barthel
0to1Dichotomyrule.
index at 6 months.
E Click the Save tab.
Page 56
44
Chapter 5
Figure 5-12
Validate Data: Save tab
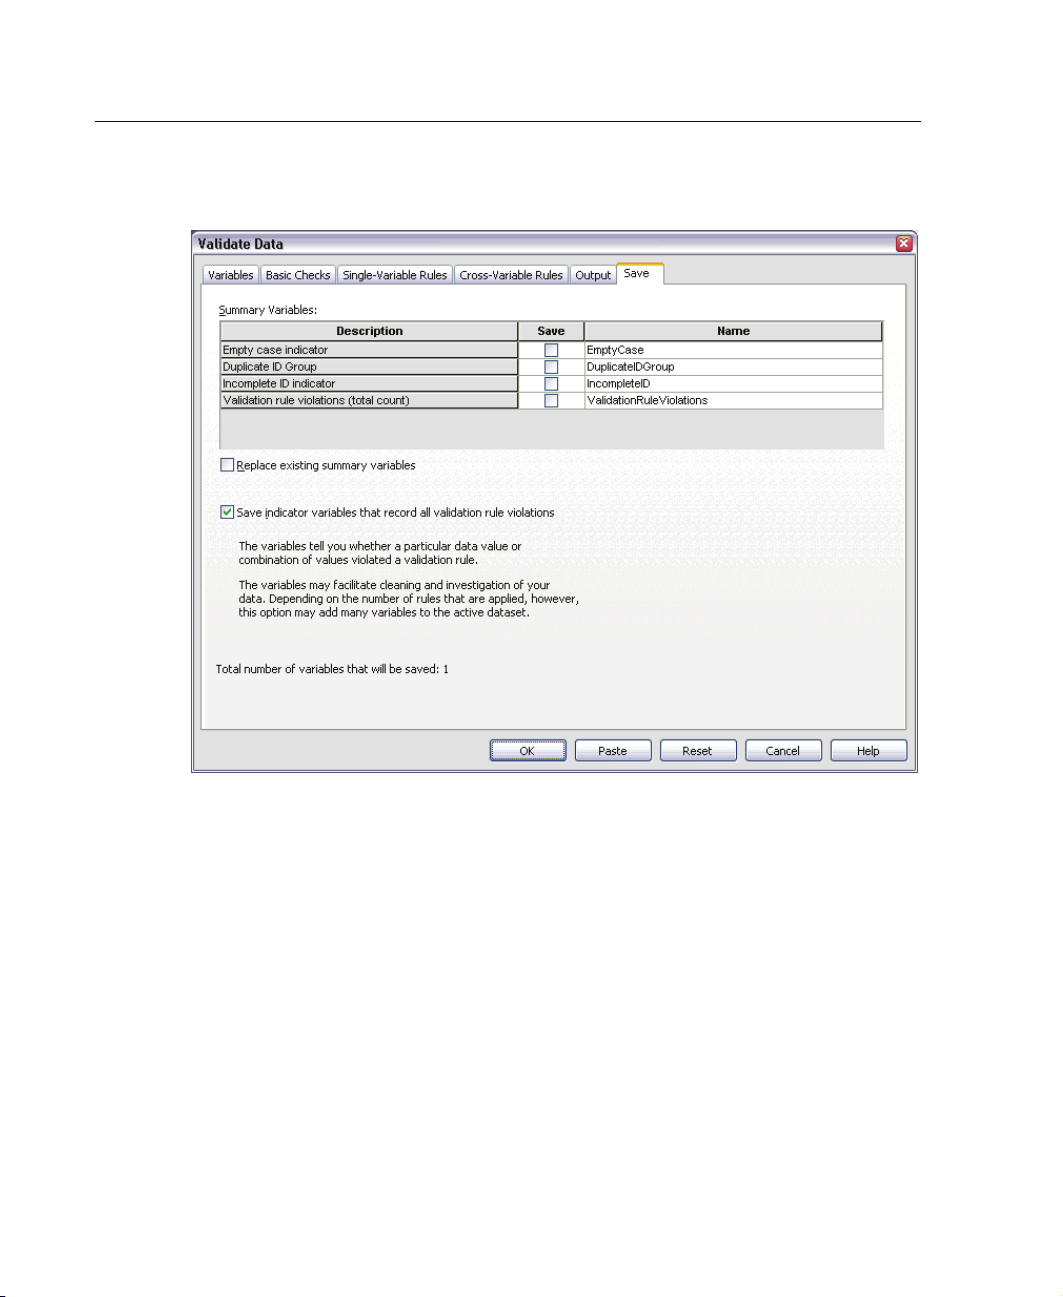
E Select
Save indicator variables that record all validation rule violations.Thisprocesswill
make it easier to connect the case and variable that cause single-variable rule violations.
E Click OK.
Page 57
Rule Descriptions
Figure 5-13
Rule descriptions
45
Val ida te D ata
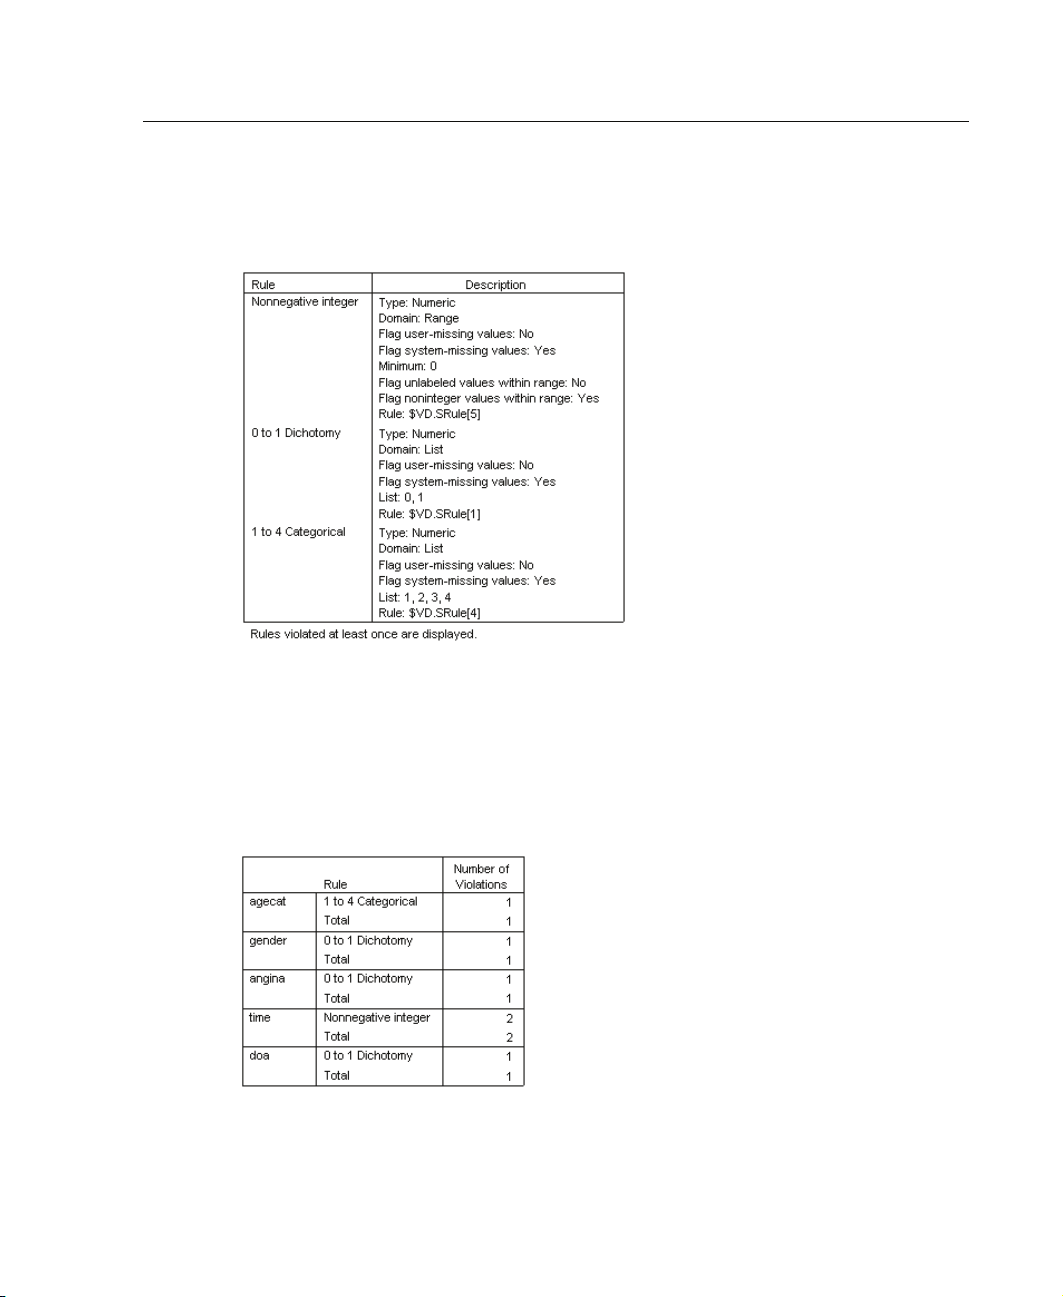
The rule descriptions table displays explanations of rules that were violated. This
feature is very useful for keeping track of a lot of validation rules.
Variable Summary
Figure 5-14
Variable summary
Page 58
46
Chapter 5
Case Report
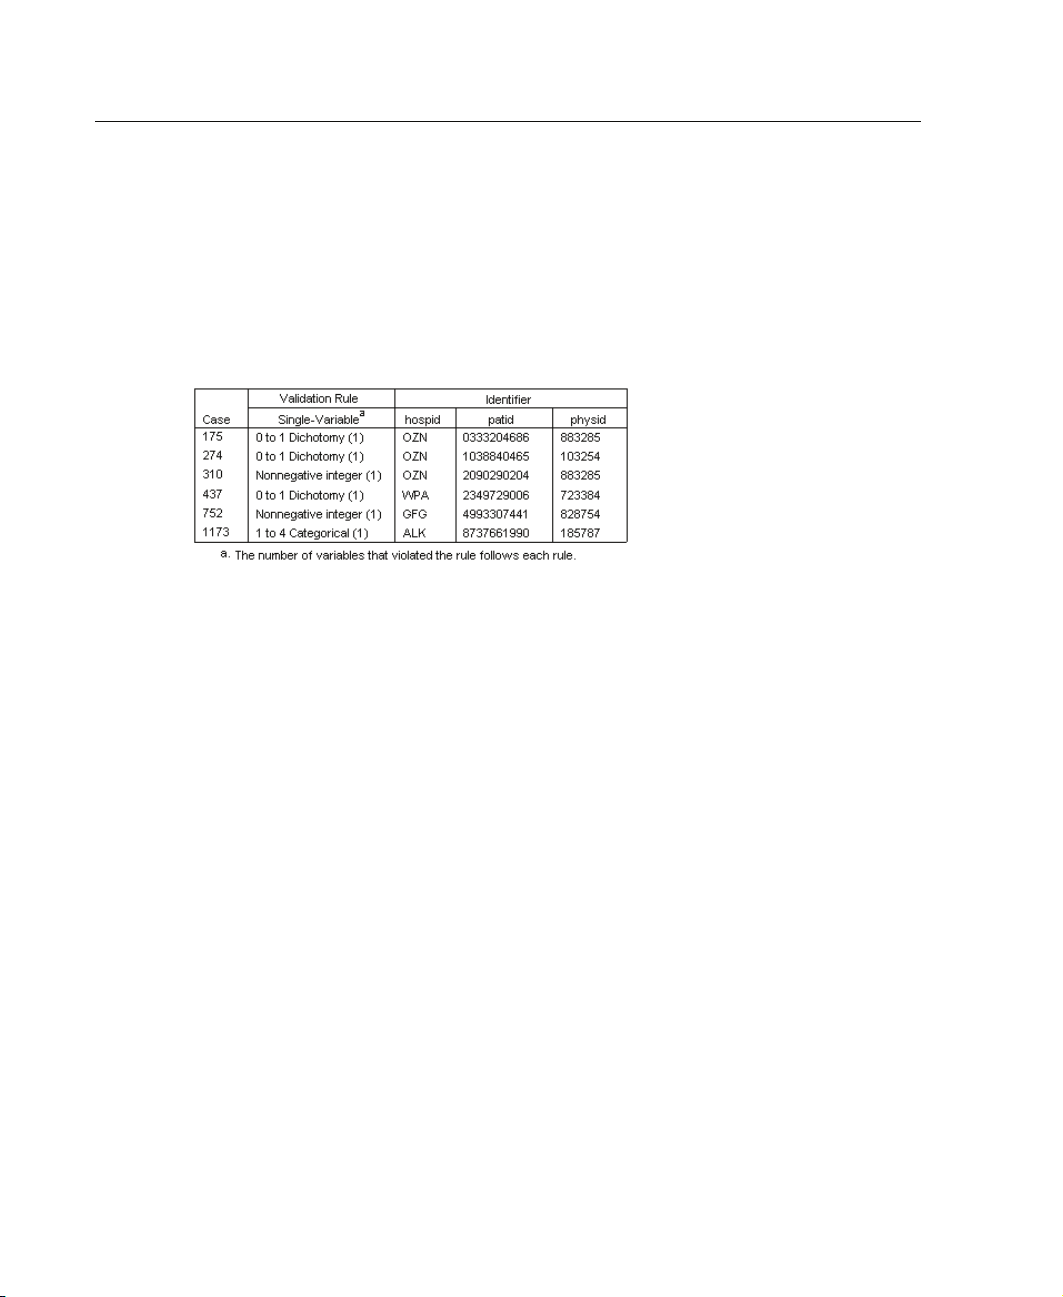
The variable summary table lists the variables that violated at least one validation rule,
the rules that were violated, and the number of violations that occurred per rule and
per variable.
Figure 5-15
Case report
The case report table lists the cases (by both case number and case identifier) that
violated at least one validation rule, the rules that w ere violated, and the number of
times that the rule was violated by the case. The invalid values are shown in the Data
Editor.
Page 59
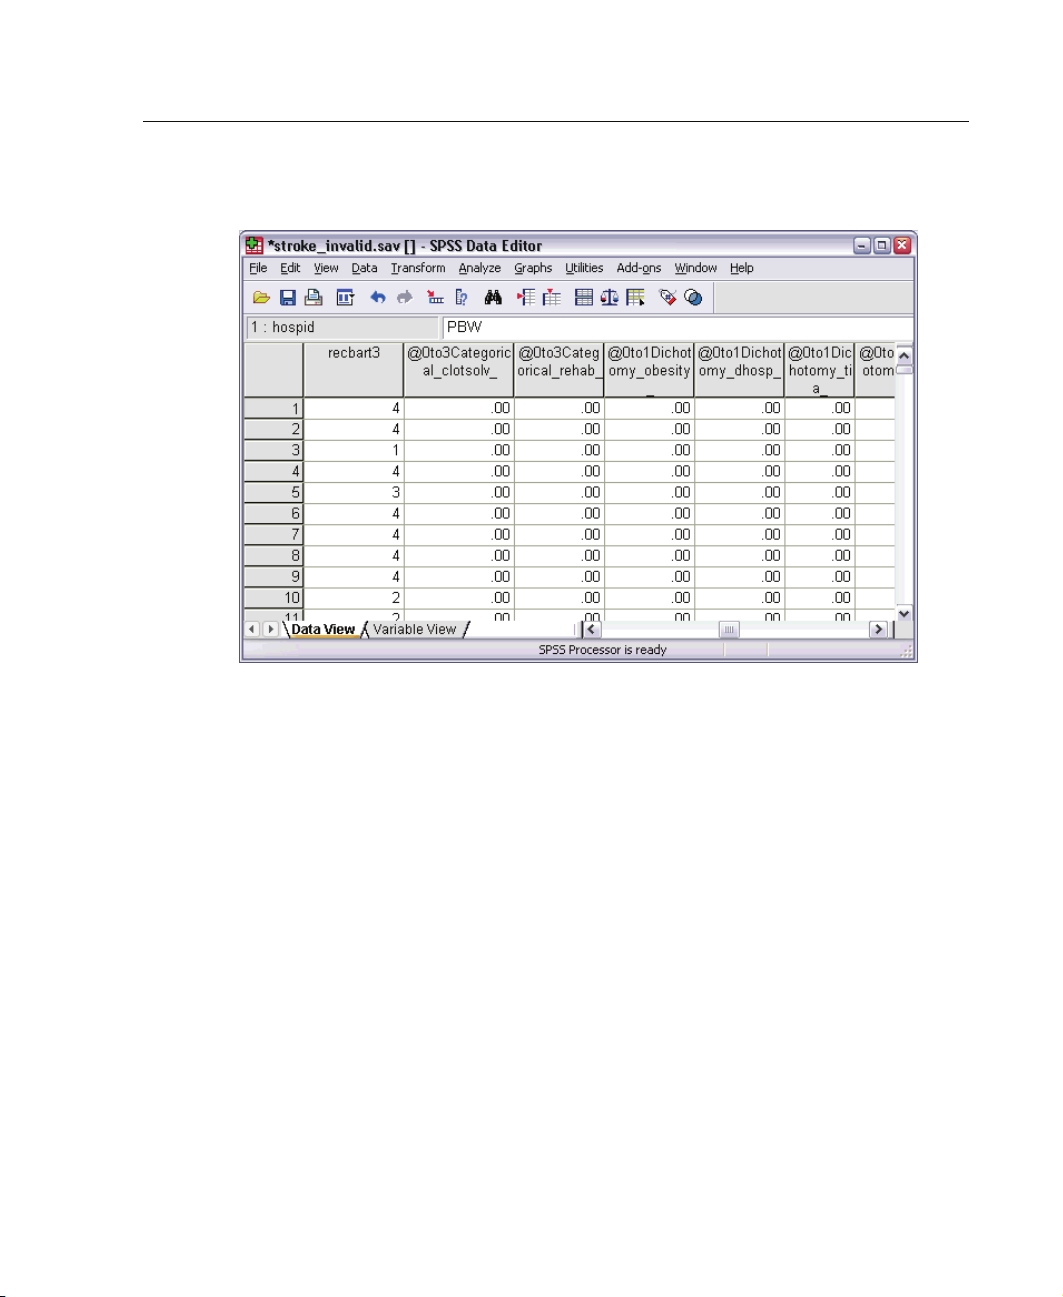
Figure 5-16
Data Editor with saved indicators of rule violations
47
Val ida te D ata
A separate indicator variable is produced for each application of a validation rule. Thus,
@0to3Cat
egorical_anticlot_ is the application of the 0 to 3 Categorical single-variable
validation rule to the variable Taking anti-clotting drugs. For a given case, the easiest
way to figure out which variable’s value is invalid is simply to scan the values of the
ors. A value of 1 means that the associated variable’s value is invalid.
indicat
Page 60
48
Chapter 5
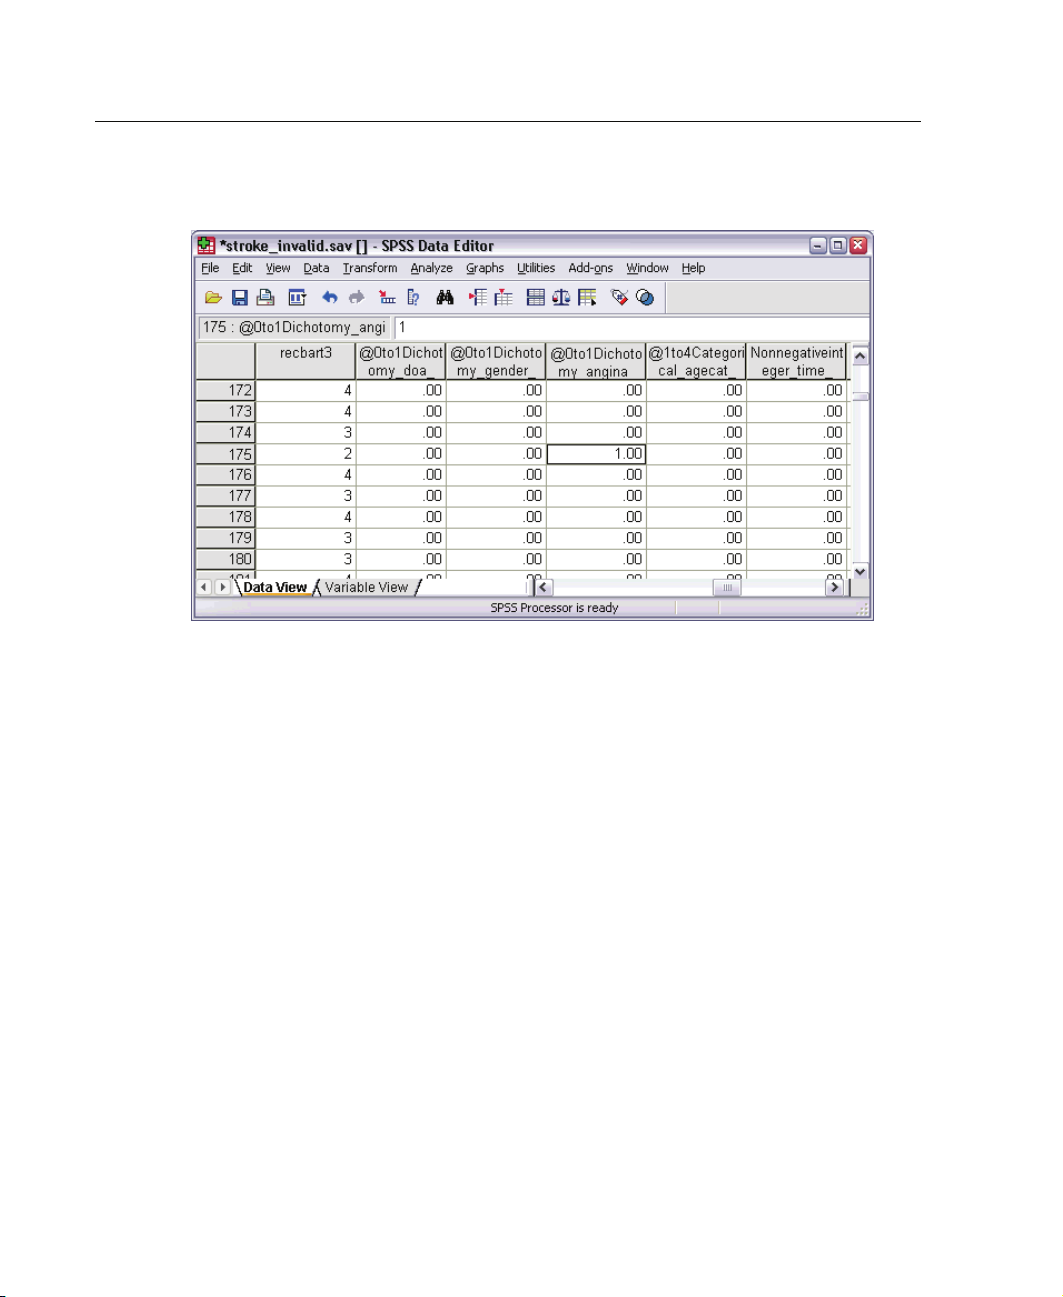
Figure 5-17
Data Editor with indicator of rule violation for case 175
Go to case 175, the first case with a rule violation. To speed your search, look at the
indicators that are associated with variables in the variable summary table. It is easy to
see that History of angina has the invalid value.
Page 61
Val ida te D ata
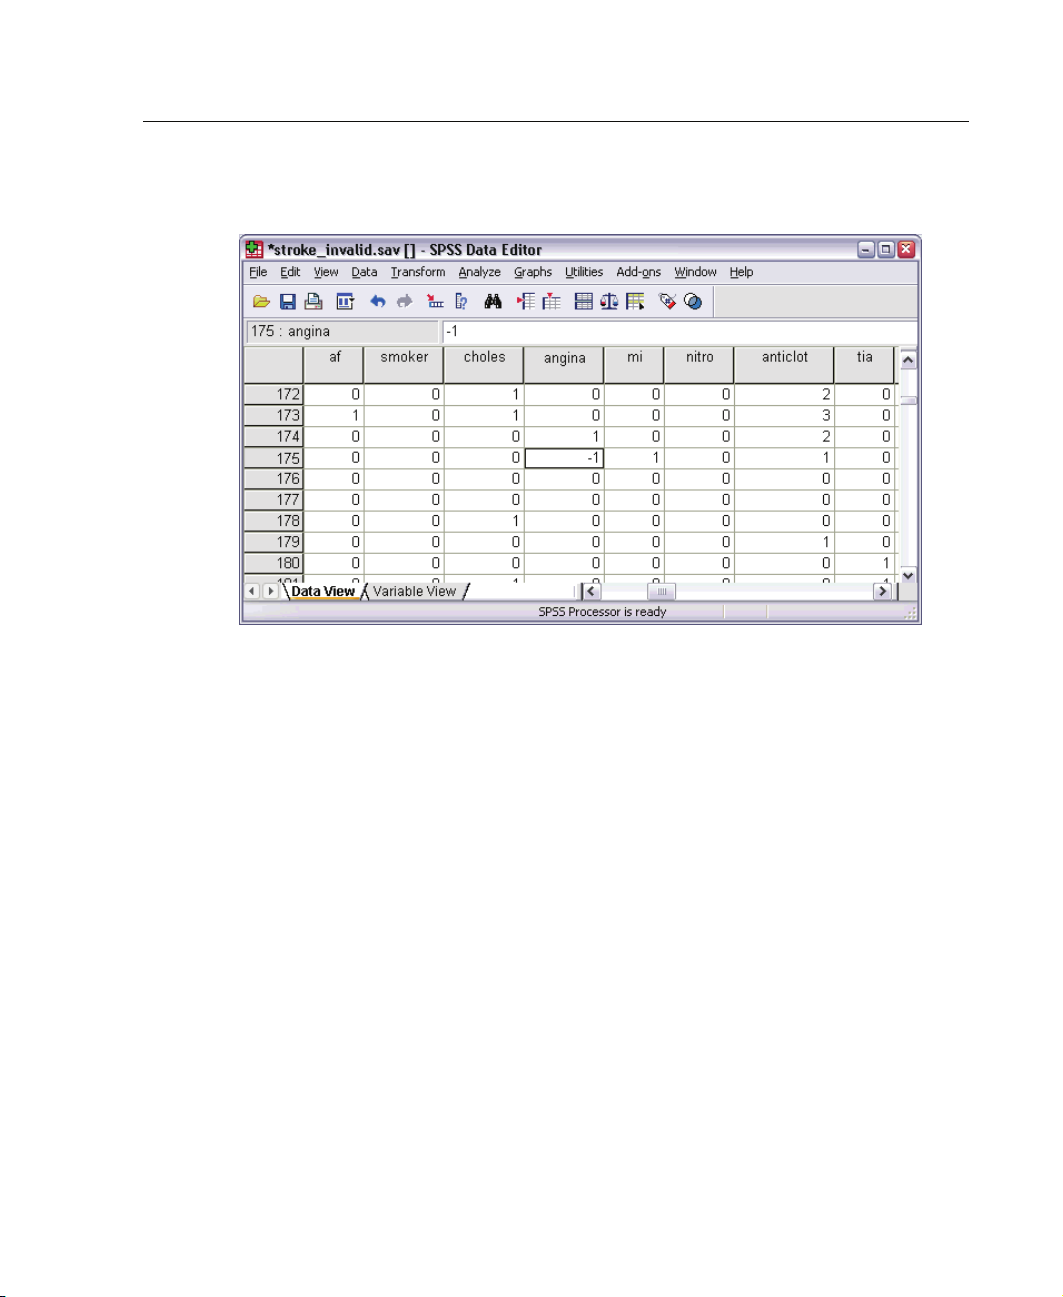
Figure 5-18
Data Ed itor with invalid value for History of angina
History of angina has a value of –1. While this value is a valid missing value for
treatment and result variables in the data file, it is invalid here because the patient
history values do not currently have user-missing values defined.
49
Defining Your Own Rules
The validation rules that were copied from patient_los.sav have been very useful,
but you need to define a few more rules to finish the job. Additionally, sometimes
patients that are
Single-variable validation rules cannot catch this situation, so you need to define a
cross-variable rule to handle the situation.
E Click the Dialog Recall toolbar button and choose Val idate Dat a .
E Click t he Single-Variable Rules tab. (You need to define rules for Hospital size,the
variables that measure Rankin scores, and the variables corresponding to the unrecoded
Barthel indices.)
E Click Define Rules.
dead on arrival are accidentally marked as having died at the hospital.
Page 62
50
Chapter 5
Figure 5-19
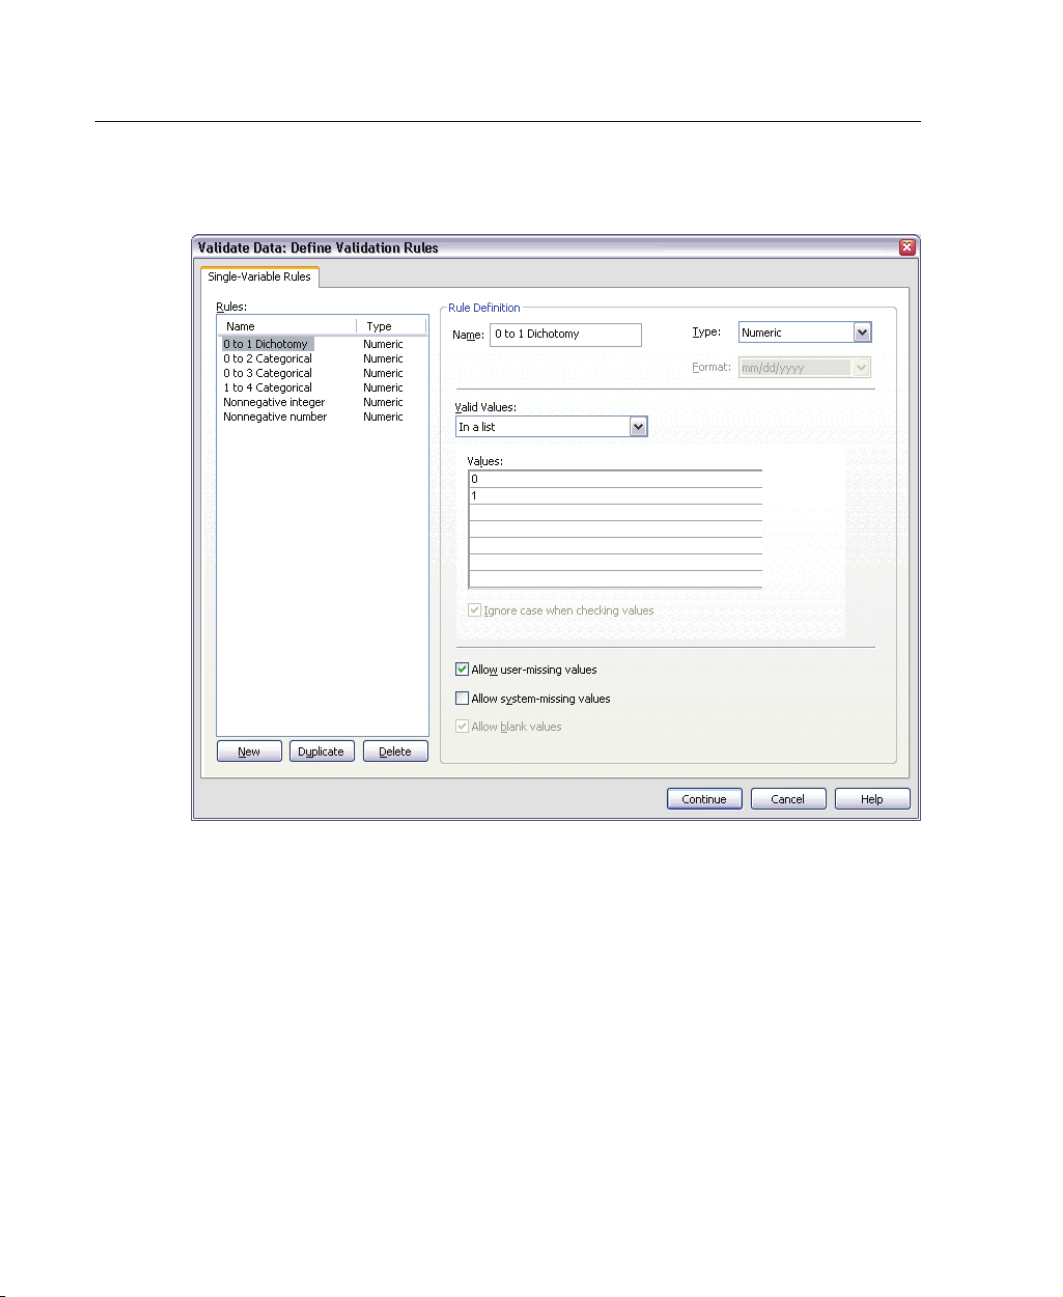
Define Validation Rules: Single-Variable Rules tab
The currently defined rules are shown with 0to1Dichotomyselected in the Rules list
and the
E To def
rule’s properties displayed in the Rule Definition group.
ine a rule, click
New.
Page 63
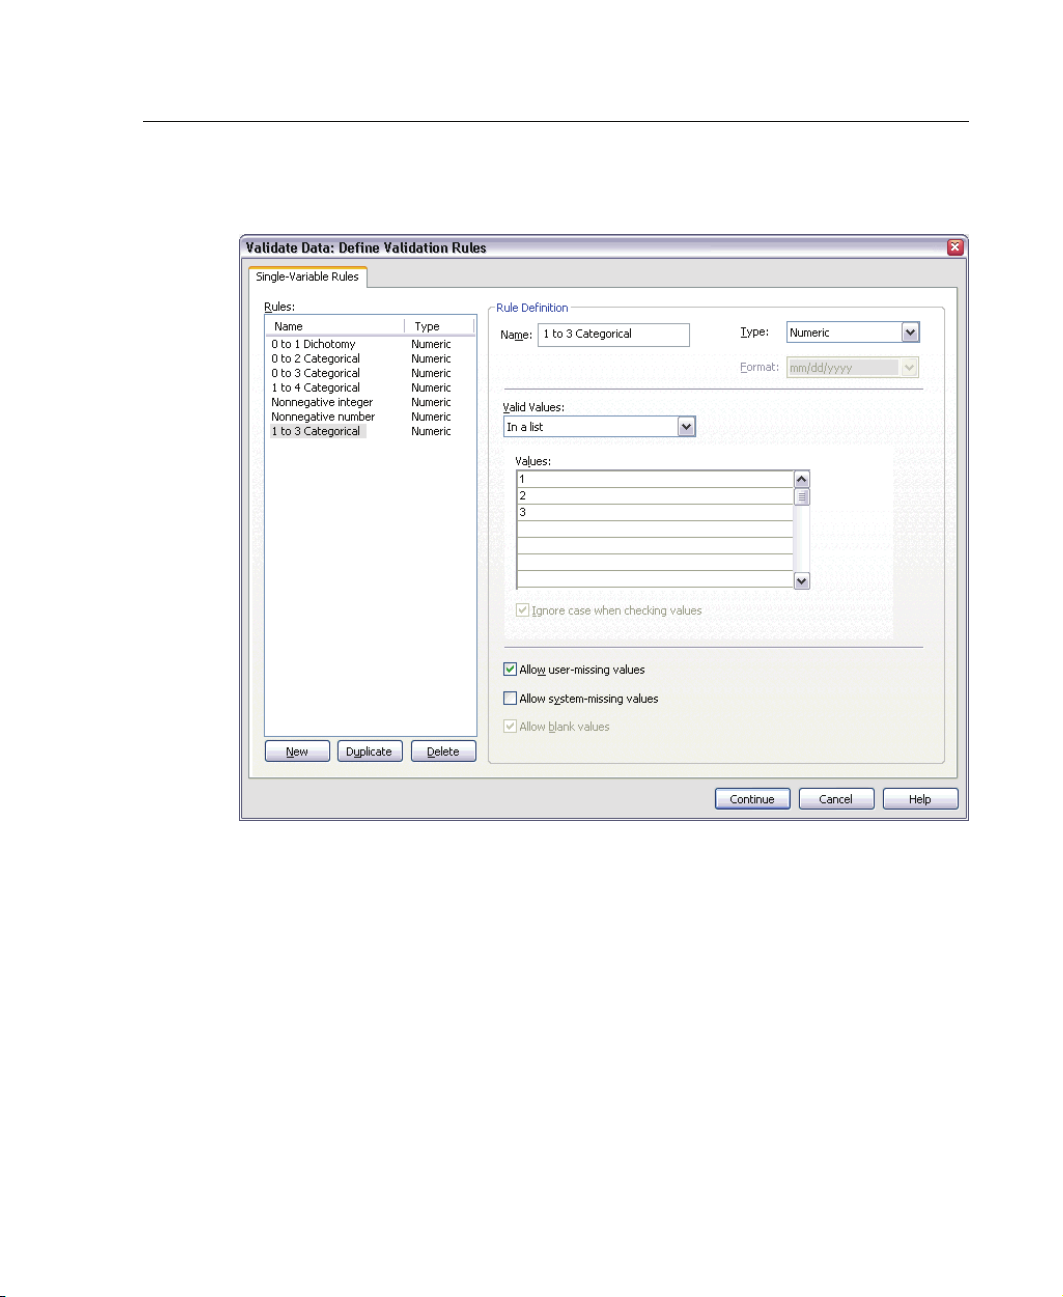
Figure 5-20
Define Validation Rules: Single-Variable Rules tab (1 to 3 Categorical defined)
51
Val ida te D ata
E Typ e 1to3Categoricalastherulename.
E For Valid Values, choose In a list.
E Typ e 1, 2,and3 as the values.
E Deselect Allow system-missing values.
E To define the rule for Rankin scores, click New.
Page 64
52
Chapter 5
Figure 5-21
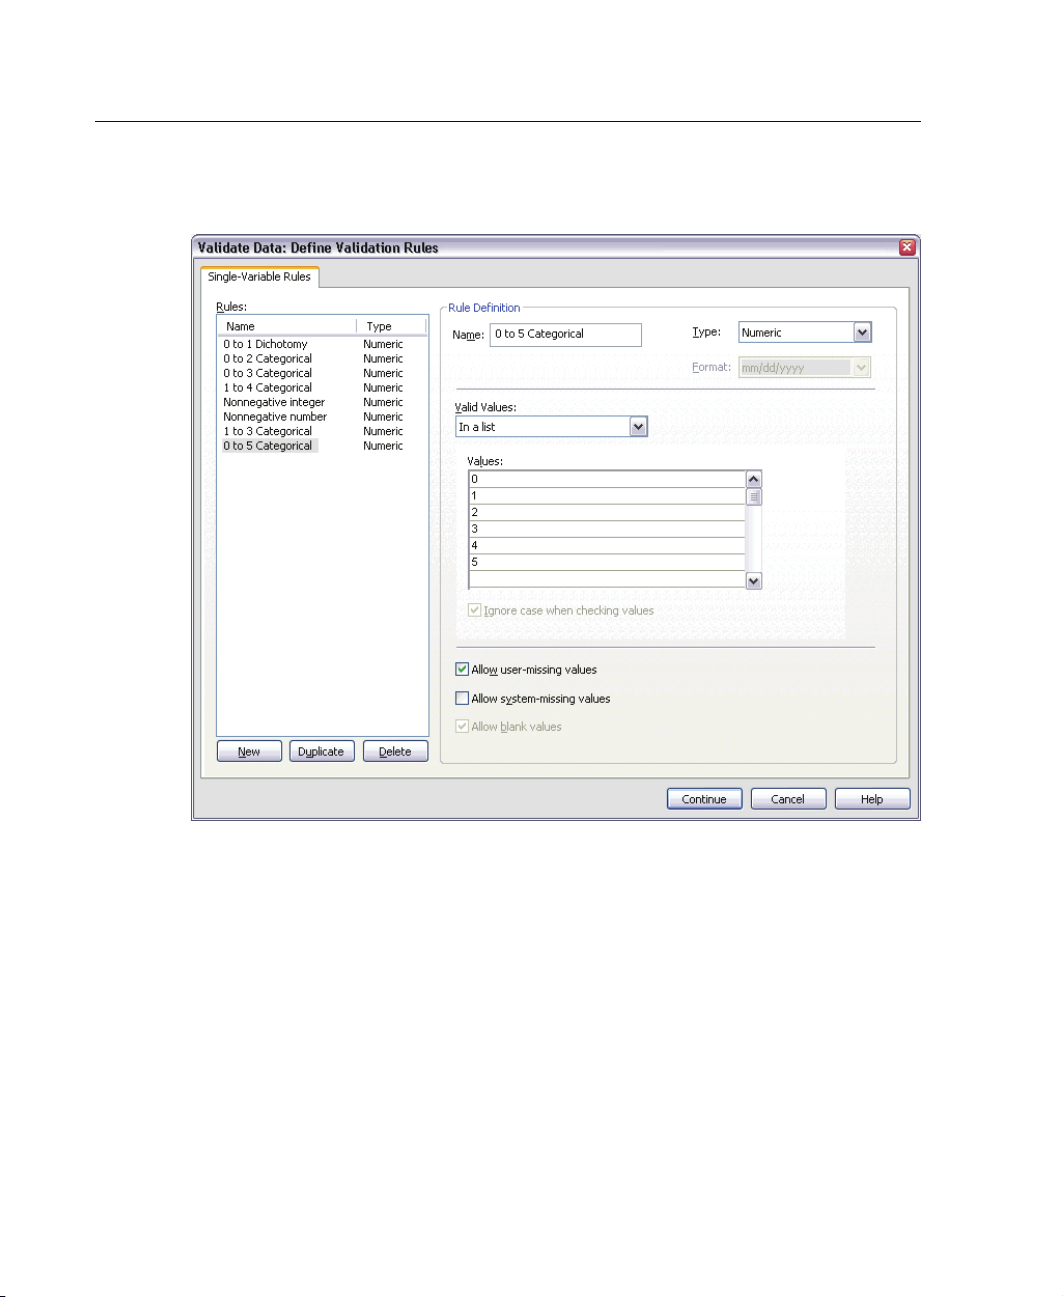
Define Validation Rules: Single-Variable Rules tab (0 to 5 Categorical defined)
E Typ e 0to5Categoricalastherulename.
E For Valid Values, choose In a list.
E Typ e 0, 1, 2, 3, 4,and5 as the values.
E Deselect Allow system-missing values.
E To define the rule for Barthel indices, click New.
Page 65
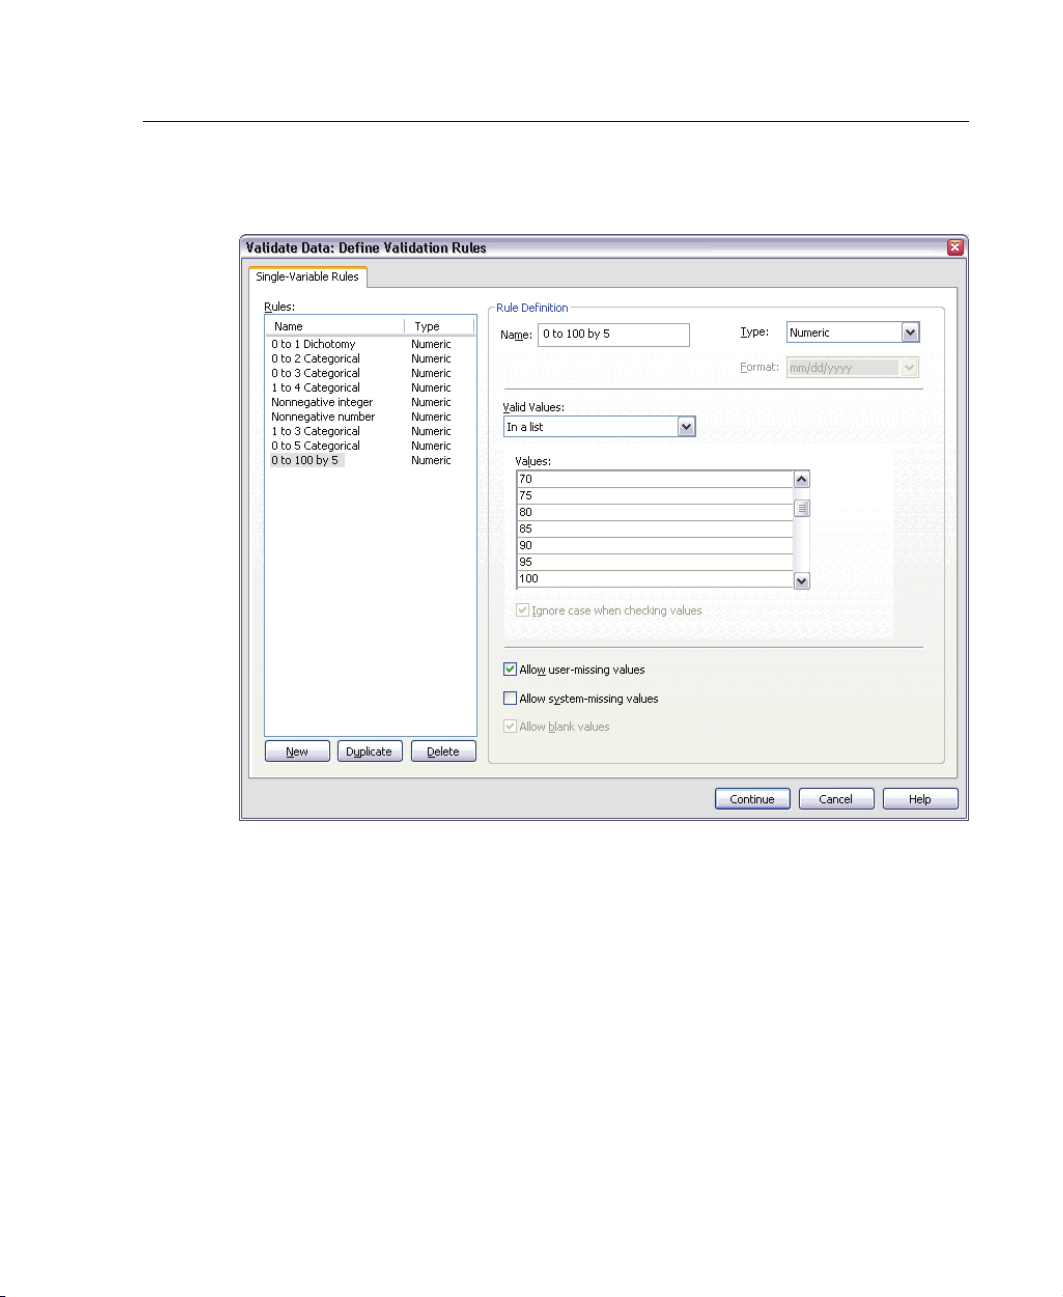
Figure 5-22
Define Validation Rules: Single-Variable Rules tab (0 to 100 by 5 defined)
53
Val ida te D ata
E Typ e 0to100by5astherulename.
E For Valid Values, choose In a list.
E Typ e 0, 5,...,and100 as the values.
E Deselect Allow system-missing values.
E Click Continue.
Page 66
54
Chapter 5
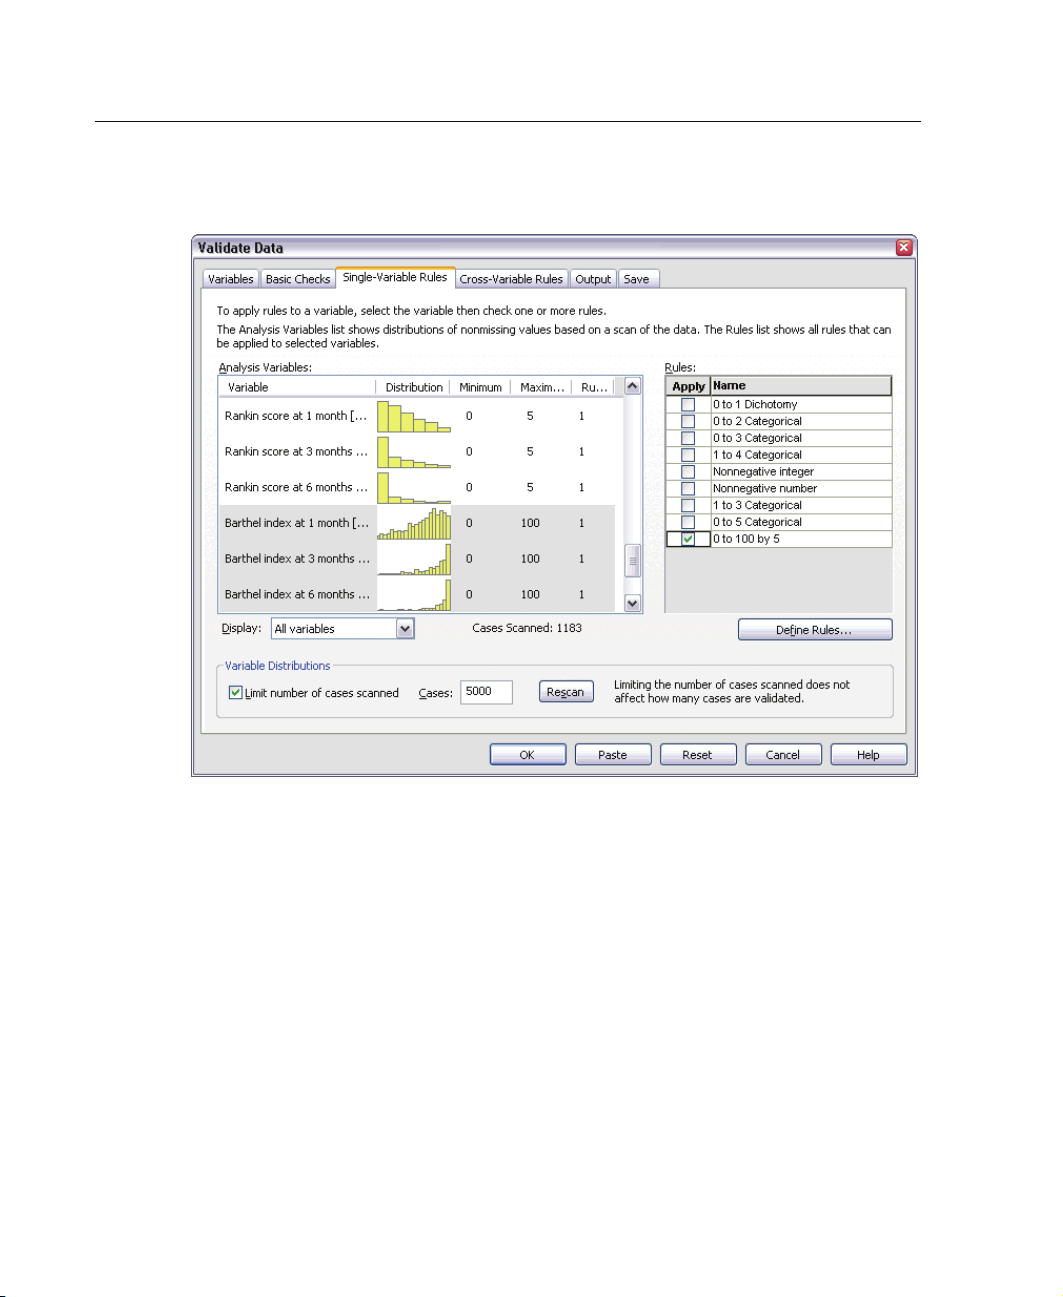
Figure 5-23
Validate Data: Sin gle-Variable Rules tab (0 to 100 by 5 defined)
Now you need to apply the defined rules to analysis variables.
E Apply 1to3Categoricalto Hospital size.
E Apply 0to5Categoricalto Initial Rankin score and Rankin score at 1 month through
Rankin score at 6 months.
E Apply 0to100by5to Barthel index at 1 month through Barthel index at 6 months.
E Click the Cross-Variable Rules tab.
There are no currently defined rules.
E Click Define Rules.
Page 67
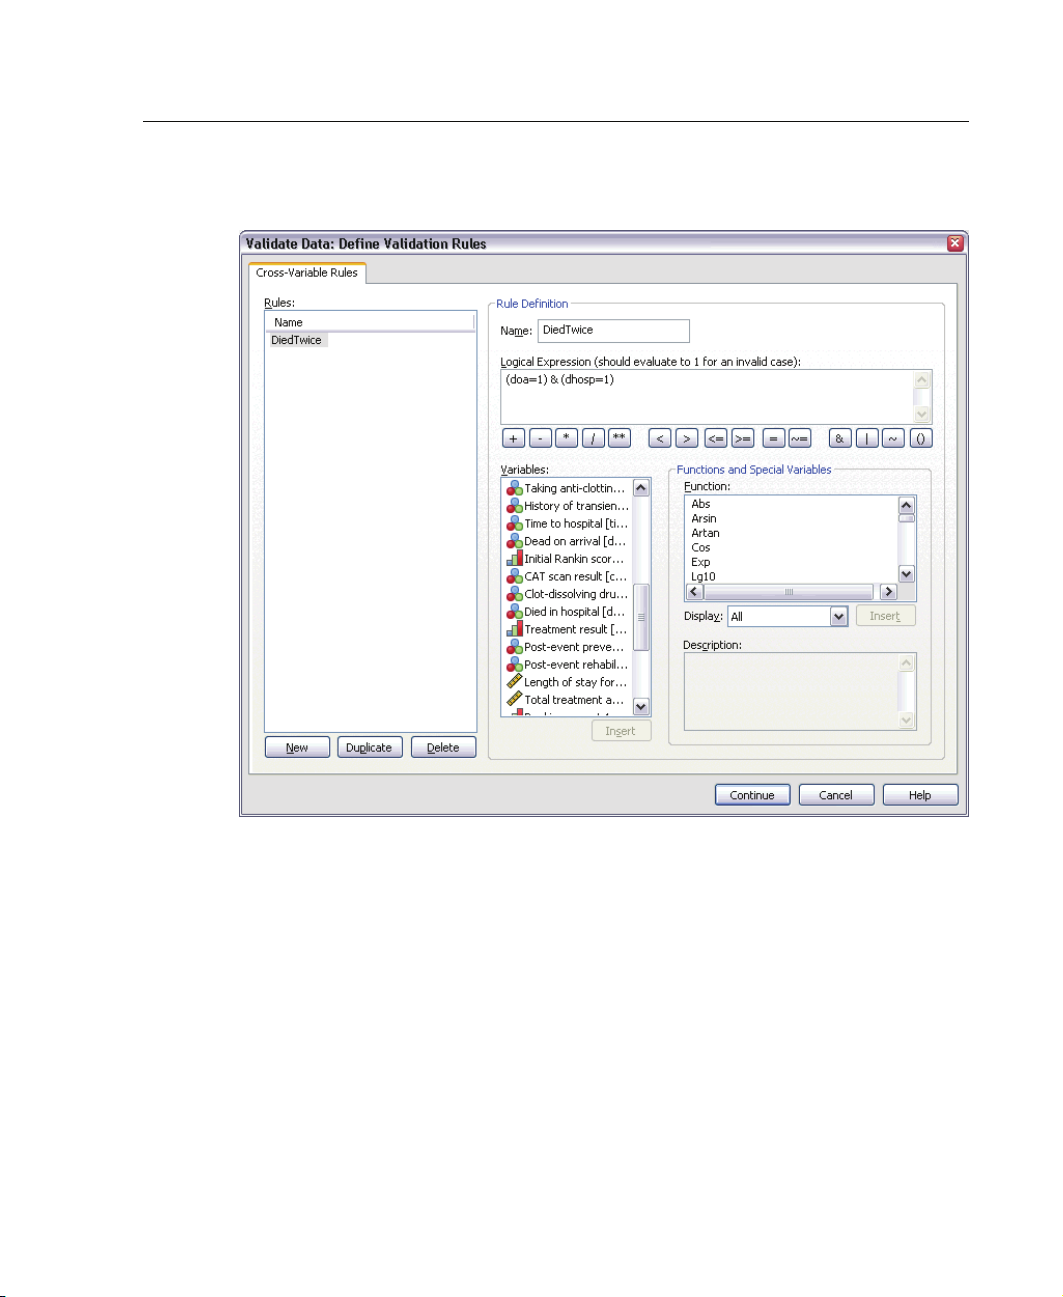
Figure 5-24
Define Validation Rules: Cross-Variable Rules tab
55
Val ida te D ata
When there are no rules, a new placeholder rule is automatically created.
E Typ e DiedTwice as the name of the rule.
E Typ e (doa=1) & (dhosp=1) as the logical expression. This will return a value of 1 if the
patient is recorded as both having been dead on arrival and having died in the hospital.
E Click Continue.
The newly defined rule is automatically selected in the Cross-Variable Rules tab.
E Click OK.
Page 68
56
Chapter 5
Cross-Variable Rules
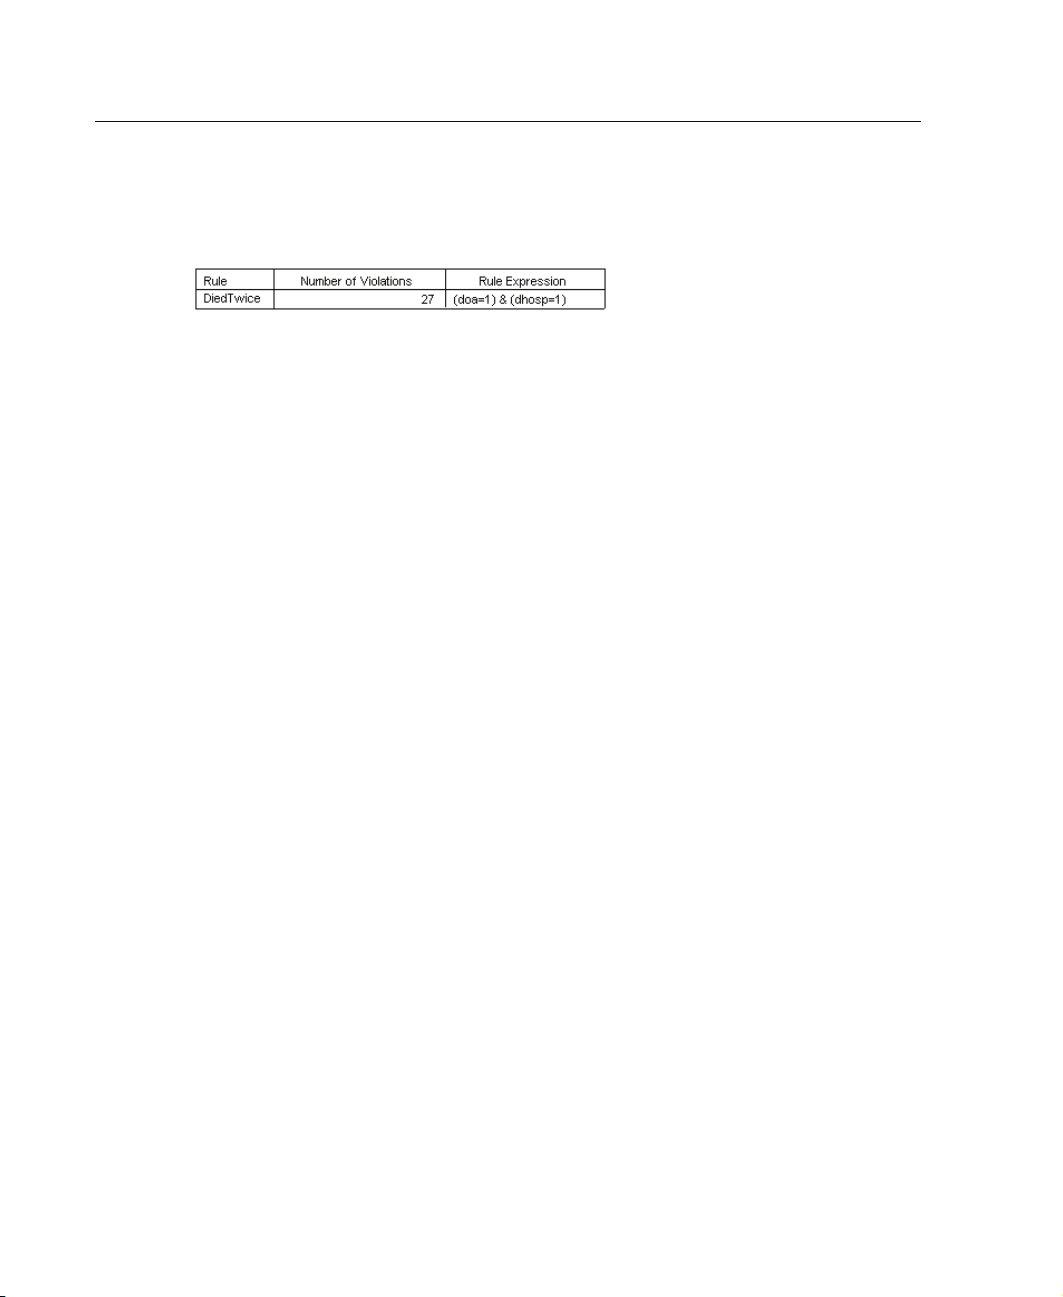
Figure 5-25
Cross-variable rules
The cross-variable rules summary lists cross-variable rules that were violated at least
once, the number of violations that occurred, and a description of each violated rule.
Page 69
Case Report
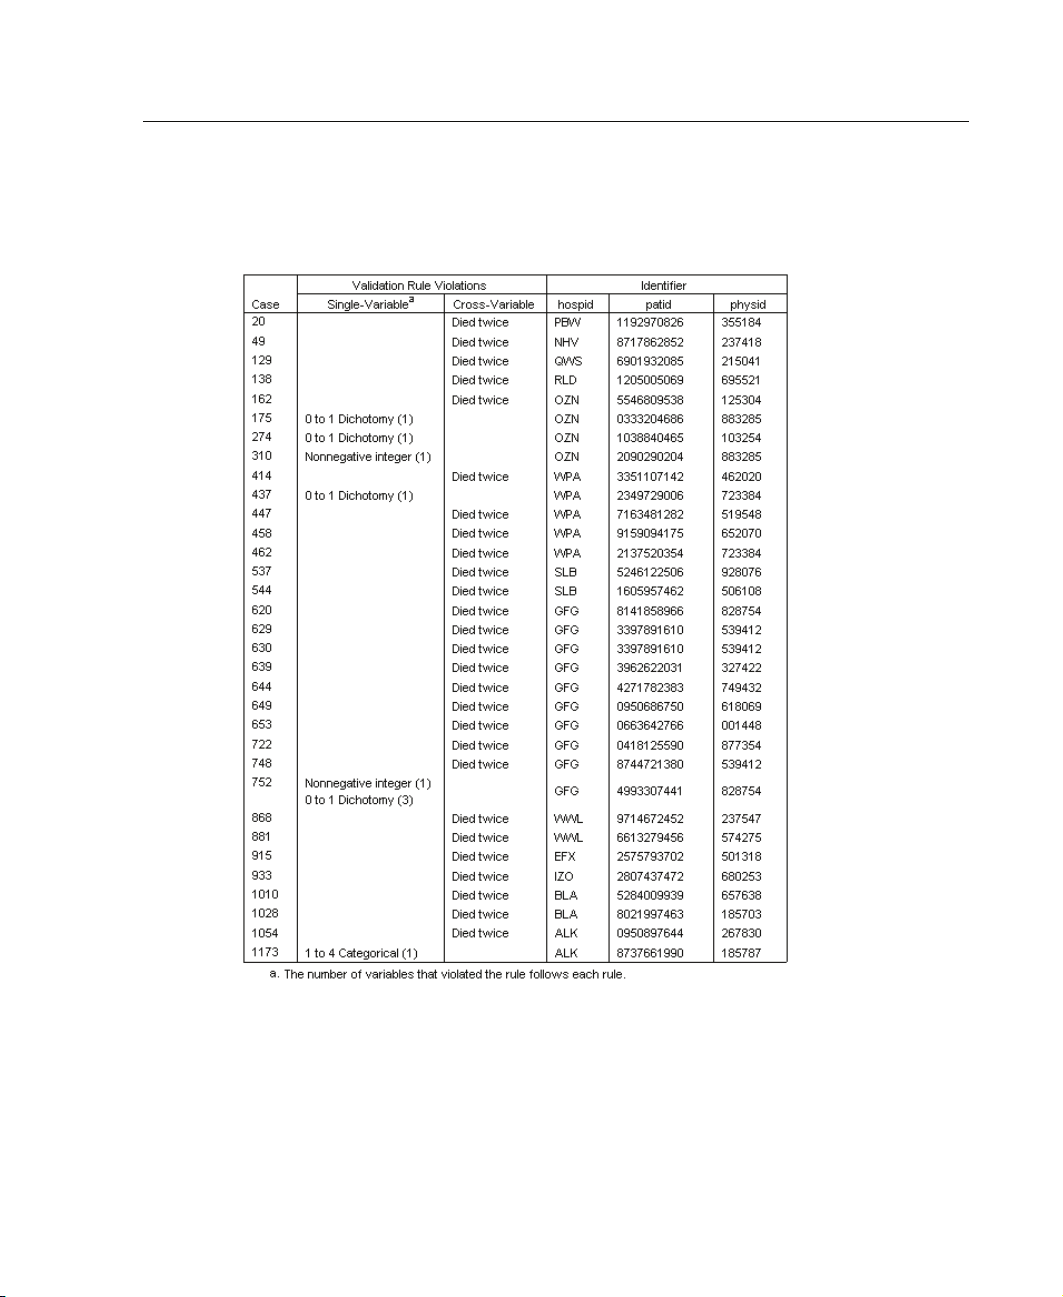
Figure 5-26
Case report
57
Val ida te D ata
The case report now includes the cases that violated the cross-variable rule, as w ell as
the previously discovered cases that violated single-variable rules. These cases all need
to be reported to data entry for correction.
Page 70

58
Chapter 5
Summary
The analyst has the necessary information for a preliminary report to the data entry
manager.
Related Procedures
The Validate Data procedure is a useful tool for data quality control.
The Identify Unusual Cases procedure analyzes patterns in your data and identifies
cases with a few significant values that vary from type.
Page 71

Identify Unusual Cases
The Anomaly Detection procedure searches for unusual cases based on deviations
from the norms of their cluster groups. The procedure is designed to quickly detect
unusual cases for data-auditing purposes in the exploratory data analysis step, prior to
any inferential data analysis. This algorithm is designed for generic anomaly detection;
that is, the definition of an anomalous case is not specific to any particular application,
such as detection of unusual payment patterns in the healthcare industry or detection
of money laundering in the finance industry, in which the definition of an anomaly
can be well-defined.
Chapter
6
Identify Unusual Cases Algorithm
This algorithm is divided into three stages:
Modeling. The procedure creates a clustering model that explains natural groupings (or
clusters) within a dataset that would otherwise not be apparent. The clustering is based
on a set of input variables. The resulting clustering model and sufficient statistics for
calculating the cluster group norms are stored for later use.
Scoring. Themodelisappliedtoeachcasetoidentifyitsclustergroup,andsome
indices are created for each case to measure the unusualness of the case with respect to
its cluster group. All cases are sorted by the values of the anomaly indices. The top
portion of the case list is identified as the set of anomalies.
Reasoning. For each anomalous case, the variables are sorted by their corresponding
variable deviation indices. The top variables, their values, and the corresponding norm
values are presented as the reasons why a case is identified as an anomaly.
59
Page 72

60
Chapter 6
Identifying Unusual Cases in a Medical Database
A data analyst hired to build predictive models for stroke treatment outcomes is
concerned about data quality because such models can be sensitive to unusual
observations. Some of these outlying observations represent truly unique cases and
are thus unsuitable for prediction, while other observations are caused by data entry
errors in which the values are technically “correct” and thus cannot be caught by
data validation procedures.
This information is collected in stroke_valid.sav. Use Identify Unusual Cases
to clean the data file. Syntax for reproducing these analyses can be found in
detectanomaly_stroke.sps.
Running the Analysis
E To identify unusual cases, from the menus choose:
Data
Identify Unusual Cases...
Page 73
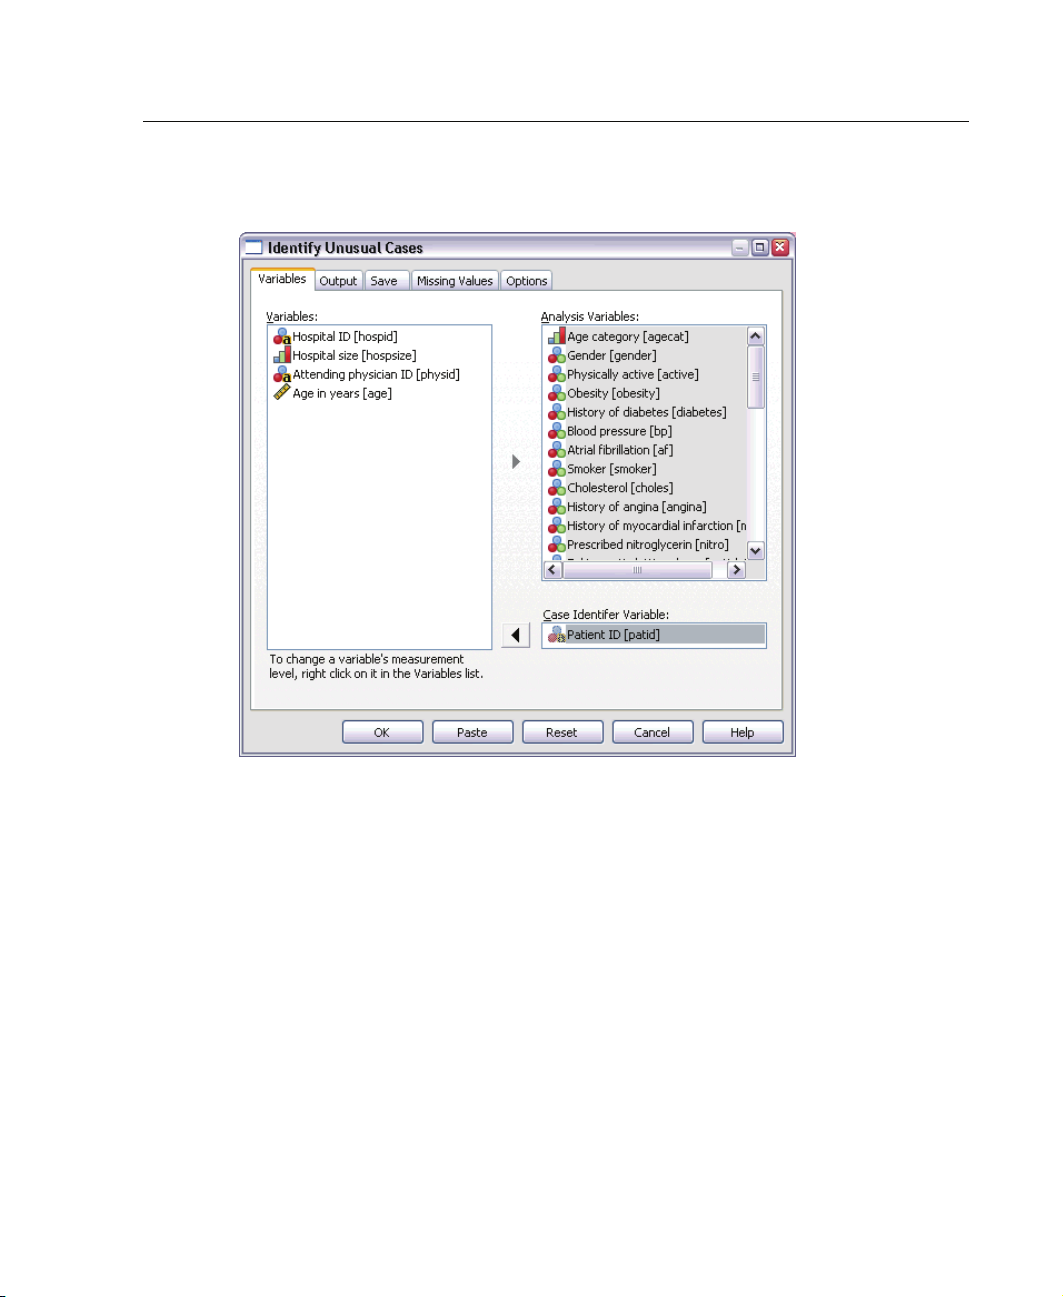
Figure 6-1
Identify Unusual Cases: Variables tab
61
Identify Unusual Cases
E Select Age category through Strokebetween3and6monthsas analysis variables.
E Select Pa t ie n t ID as the case identifier variable.
E Click the Output tab.
Page 74
62
Chapter 6
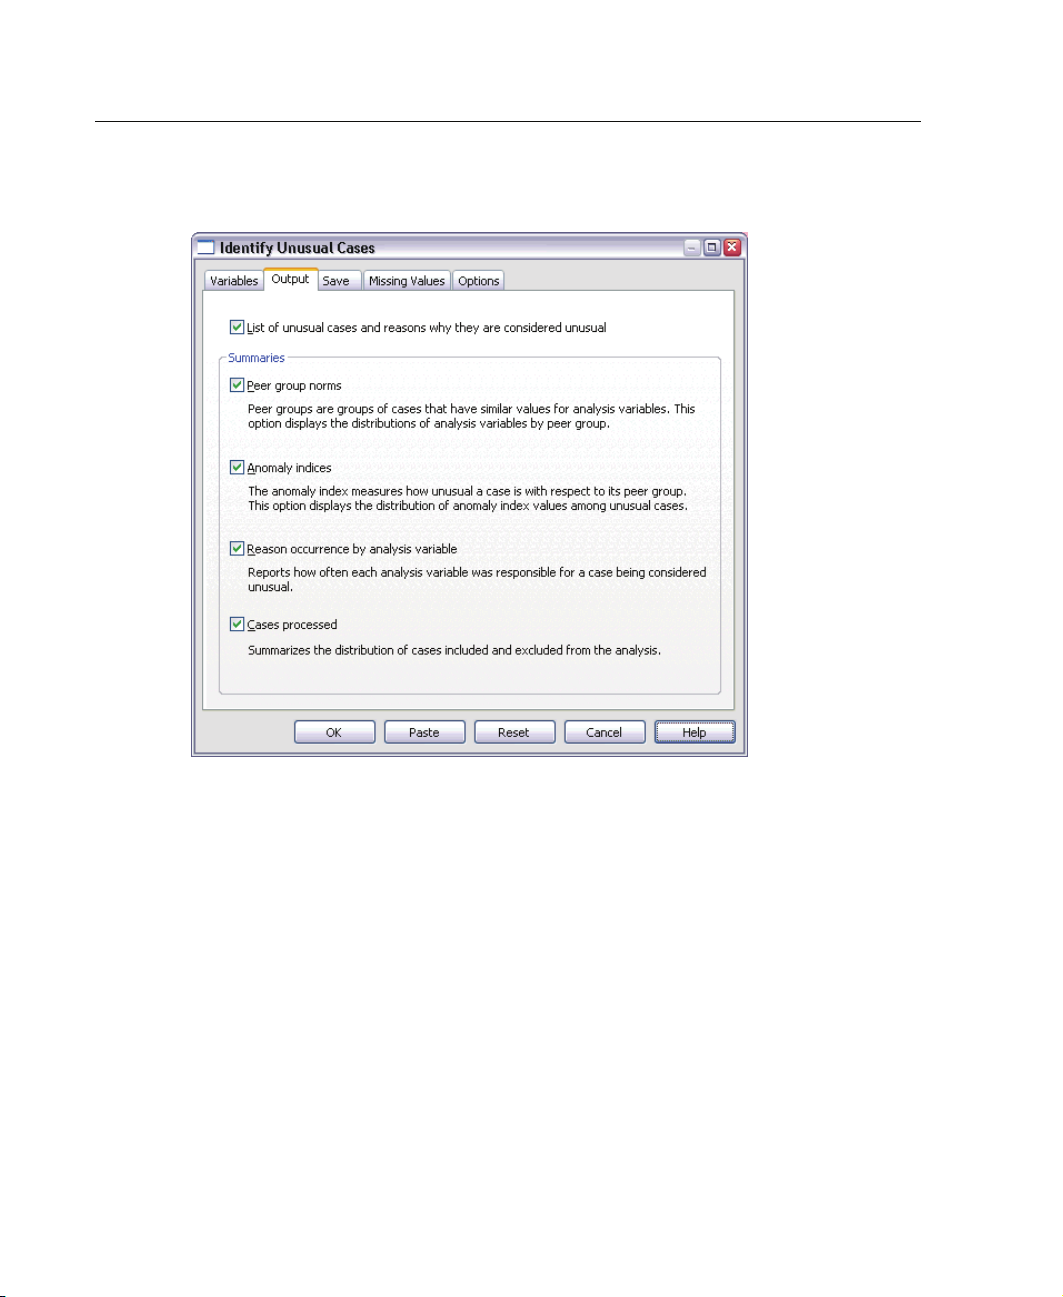
Figure 6-2
Identify Unusual Cases: Output tab
E Select Peer group norms, Anomaly indices, Reason occurrence by analysis variable,and
Cases process ed.
E Click the Save tab.
Page 75
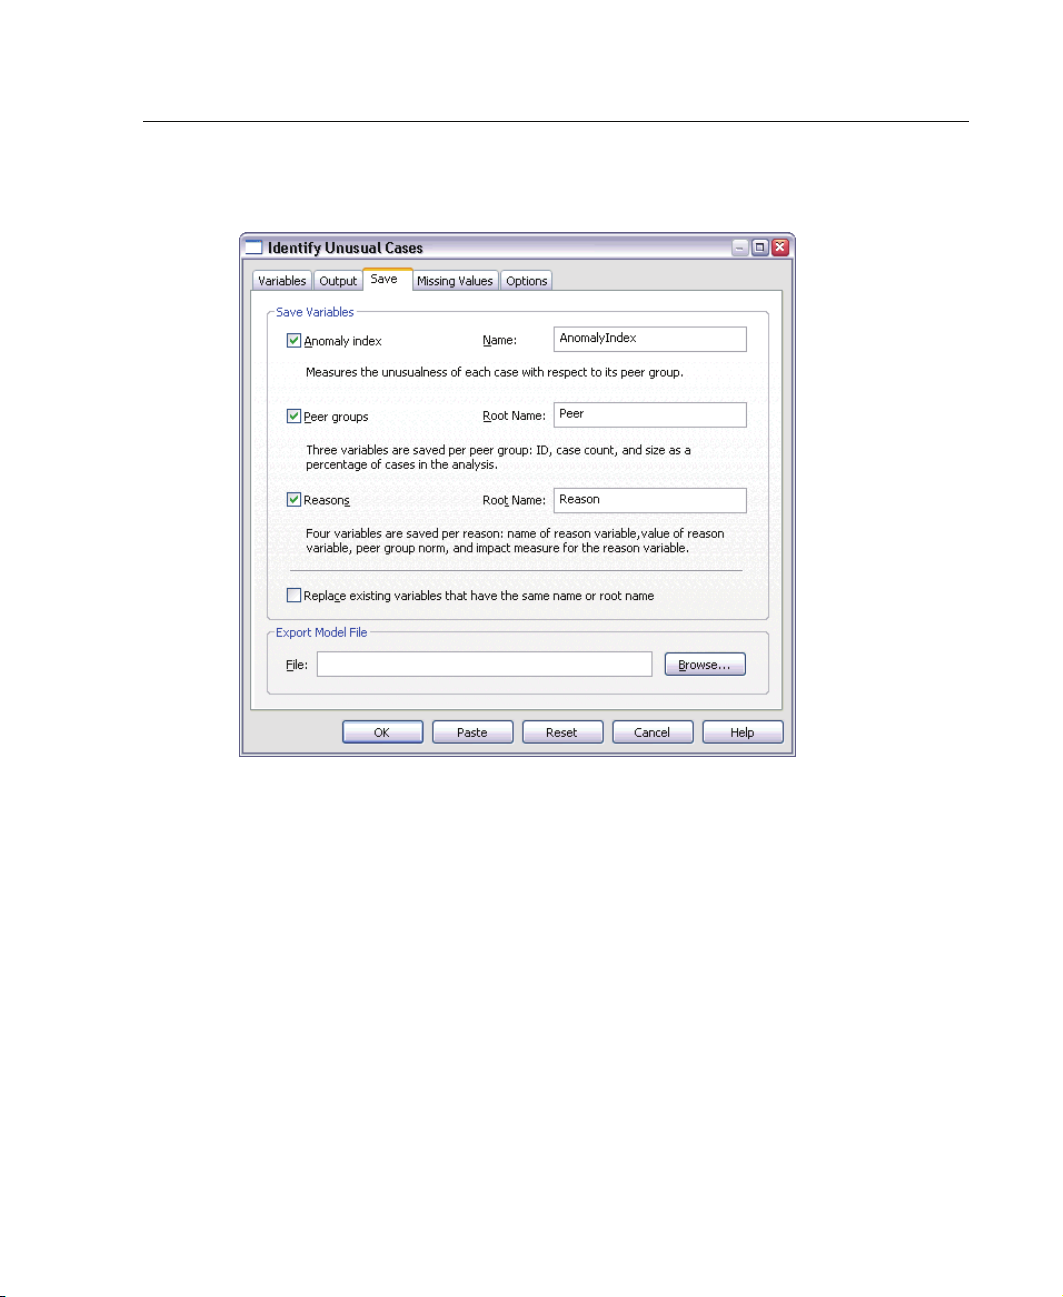
Figure 6-3
Identify Unusual Cases: Save tab
63
Identify Unusual Cases
E Select Anomaly index, Peer groups,andReasons.
Saving t
hese results allows you to produce a useful scatterplot that summarizes the
results.
E Click the Missing Values tab.
Page 76
64
Chapter 6
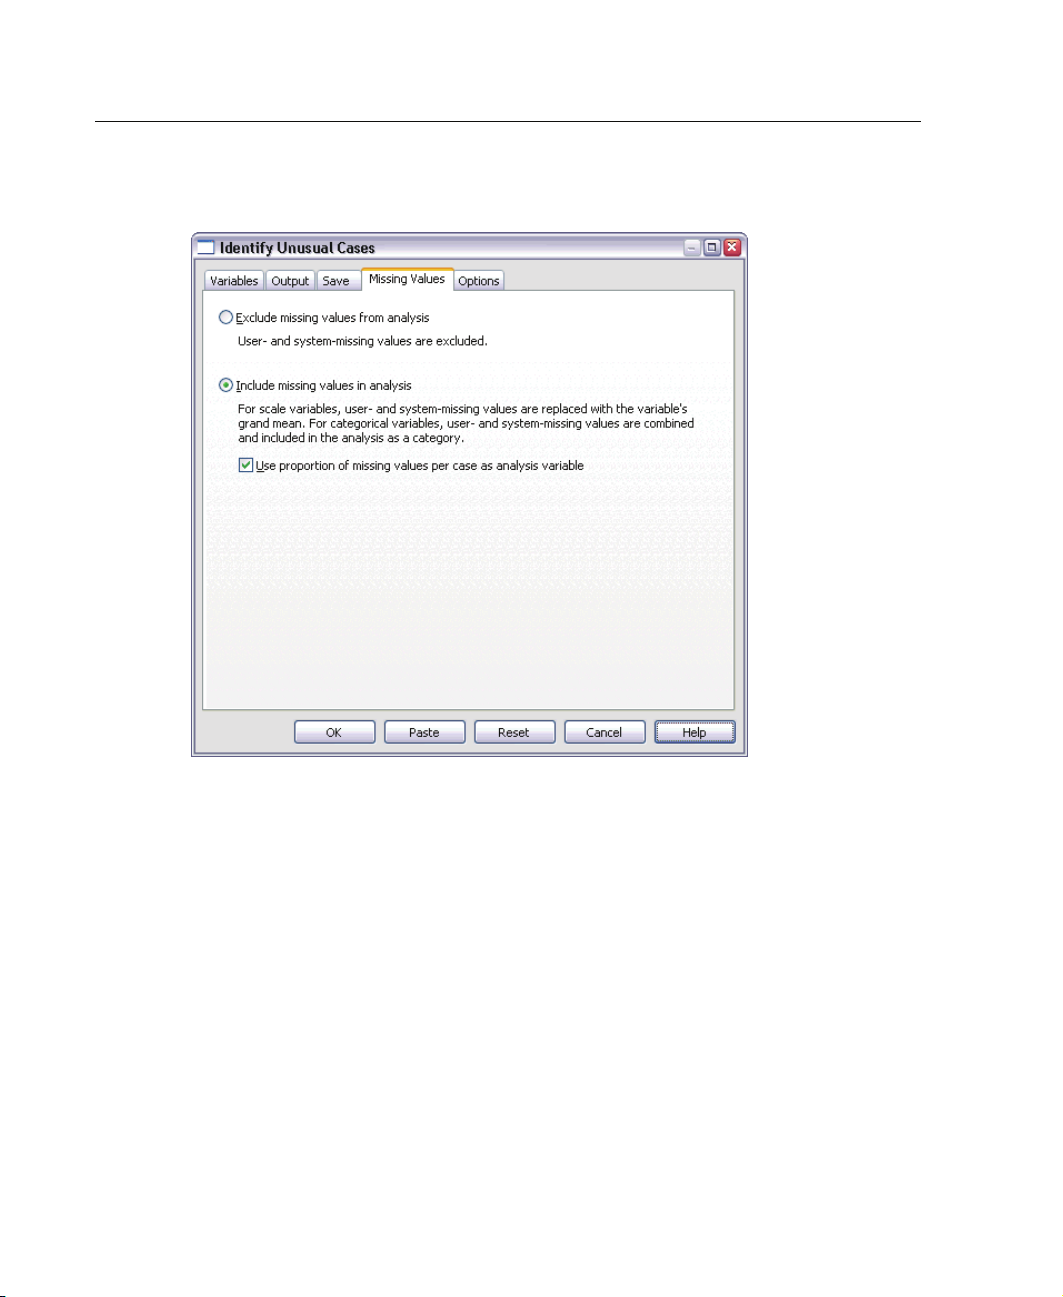
Figure 6-4
Identify Unusual Cases: Missing Values tab
E Select Include missing values in analysis. This process is necessary because there are
a lot of user-missing values to handle patients who died before or during treatment.
An extra
variable that measures the proportion of missing values per case is added to
the analysis as a scale variable.
E Click the Options tab.
Page 77
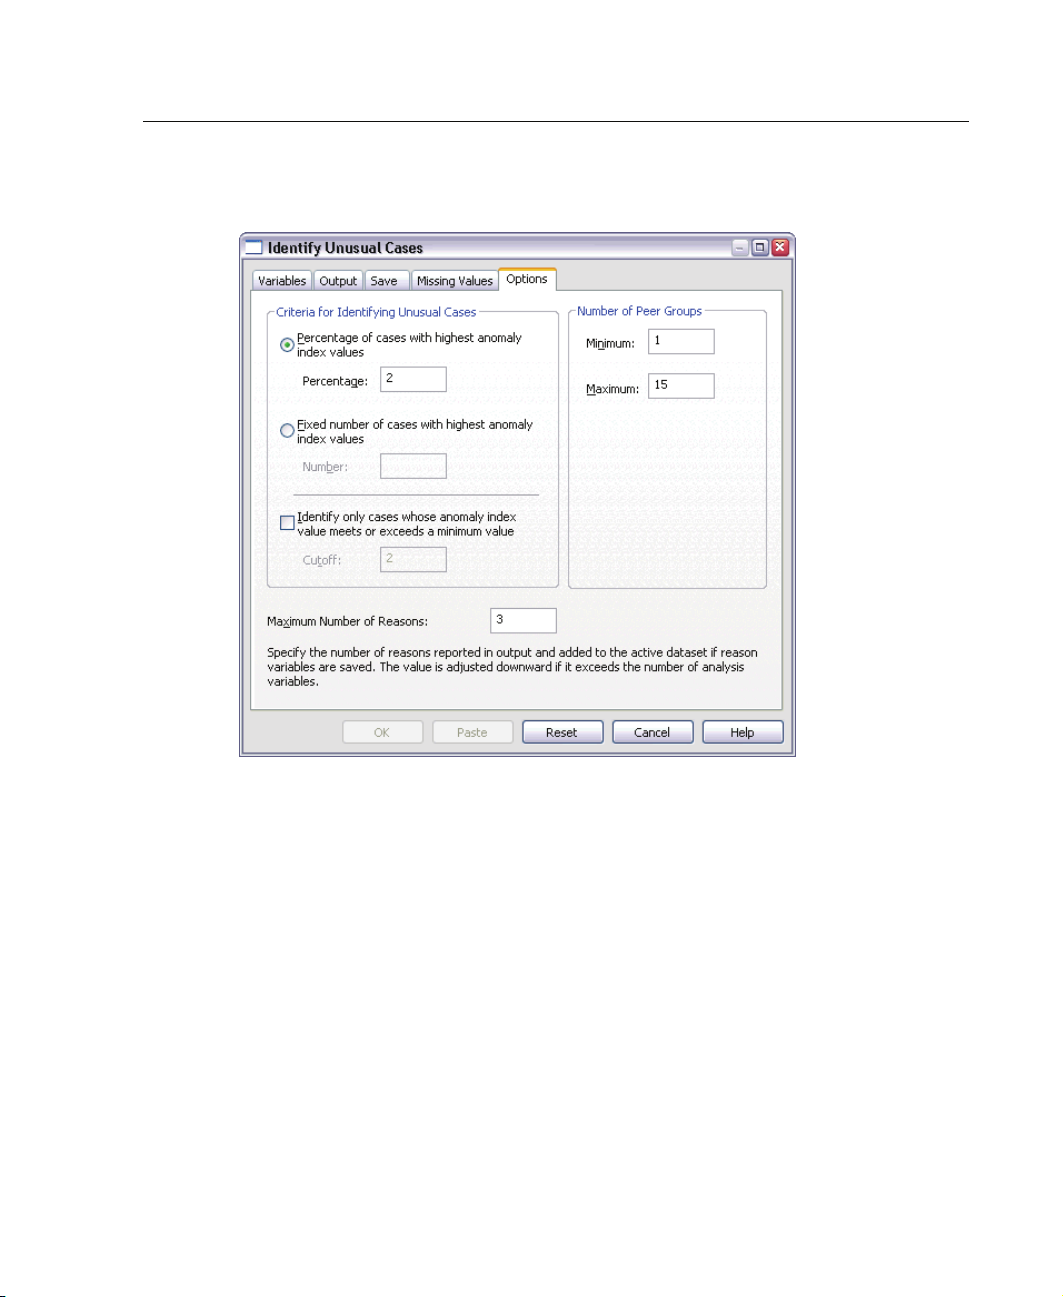
Figure 6-5
Identify Unusual Cases: Options tab
65
Identify Unusual Cases
E Typ e 2 as the percentage of cases to consider anomalous.
E Deselect Identify only cases whose anomaly index value meets or exceeds a minimum
value
.
E Typ e 3 as the maximum number of reasons.
E Click OK.
Page 78
66
Chapter 6
Case Processing Summary
Figure 6-6
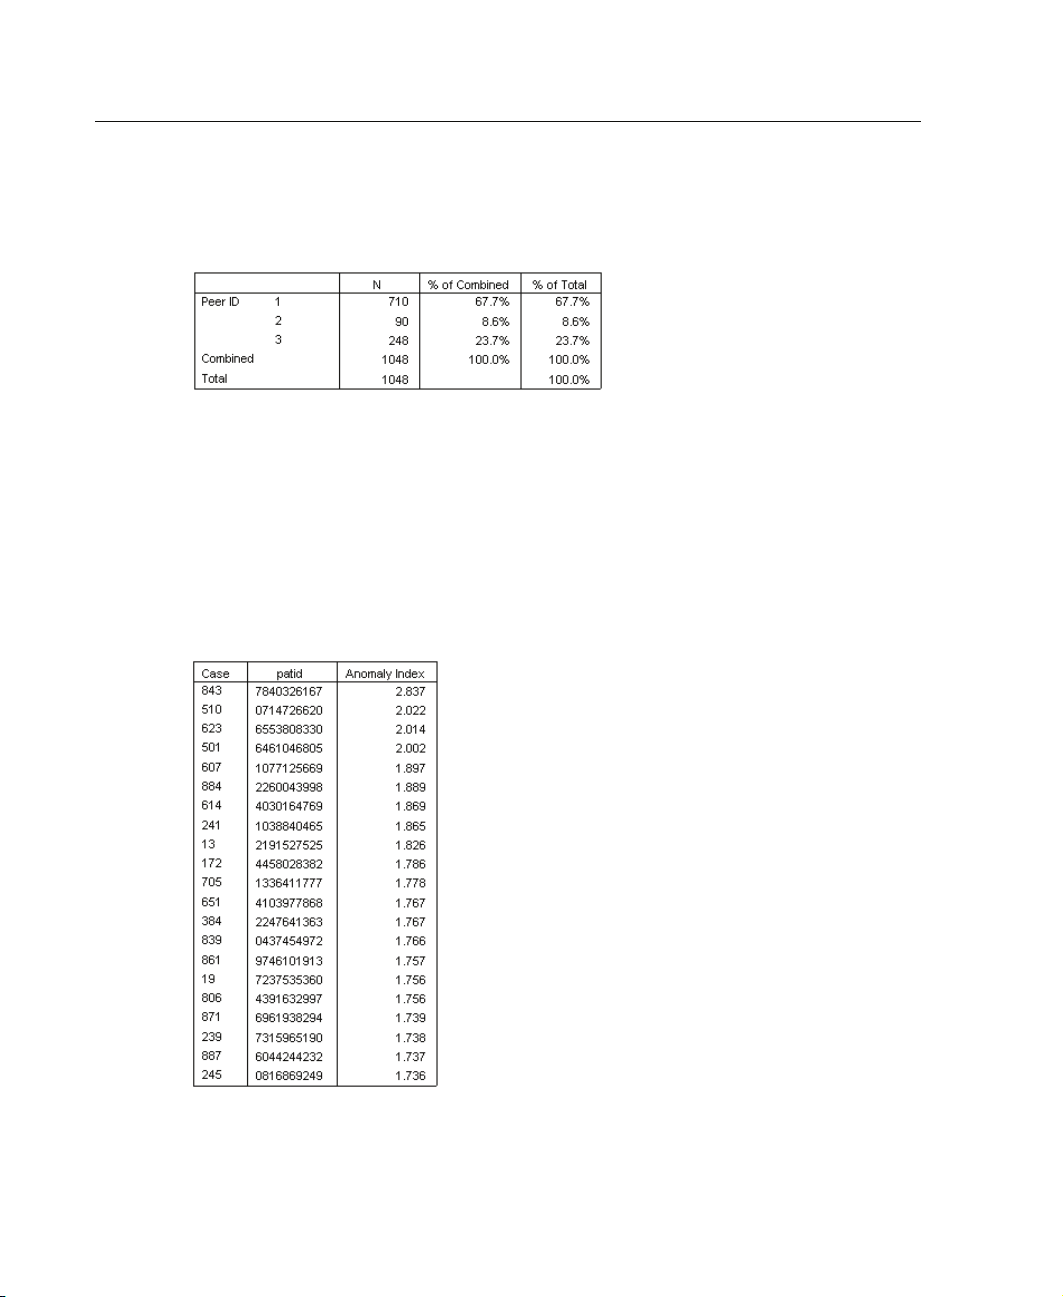
Case processing summary
Each case is categorized into a peer group of “similar” cases. The case processing
summary shows the number of peer groups that were created, as well as the number
and percentage of cases in each peer group.
Anomaly Case Index List
Figure 6-7
Anomaly case index list
Page 79
The anomaly index is a measure that reflects the unusualness of a case with respect
to its peer group. The 2% of cases with the highest values of the anomaly index
are displayed, along with their case numbers and IDs. Twenty-one cases are listed,
ranging in value from 1.736 to 2.837. There is a relatively large difference in the value
of the anomaly index between the first and second cases in the list, which suggests
that case 843 is probably anomalous. The other cases will need to be judged on a
case-by-case basis.
Anomaly Case Peer ID List
Figure 6-8
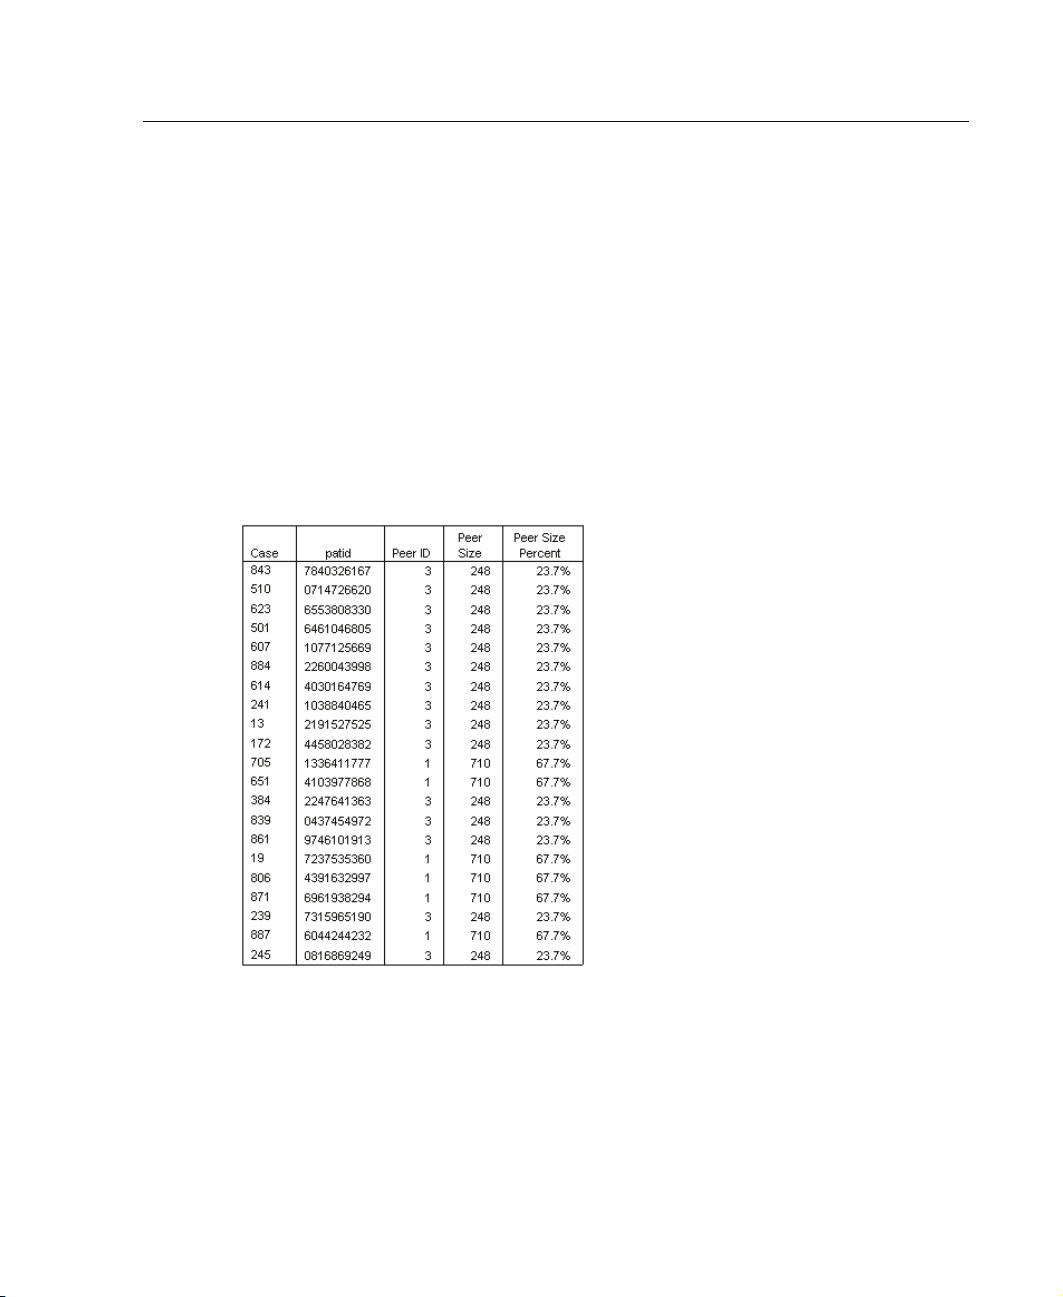
Anomaly case peer ID list
67
Identify Unusual Cases
The potentially anomalous cases are displayed with their peer group membership
information. The first 10 cases, and 15 cases overall, belong to peer group 3, with
the remainder belonging to peer group 1.
Page 80
68
Chapter 6
Anomaly Case Reason List
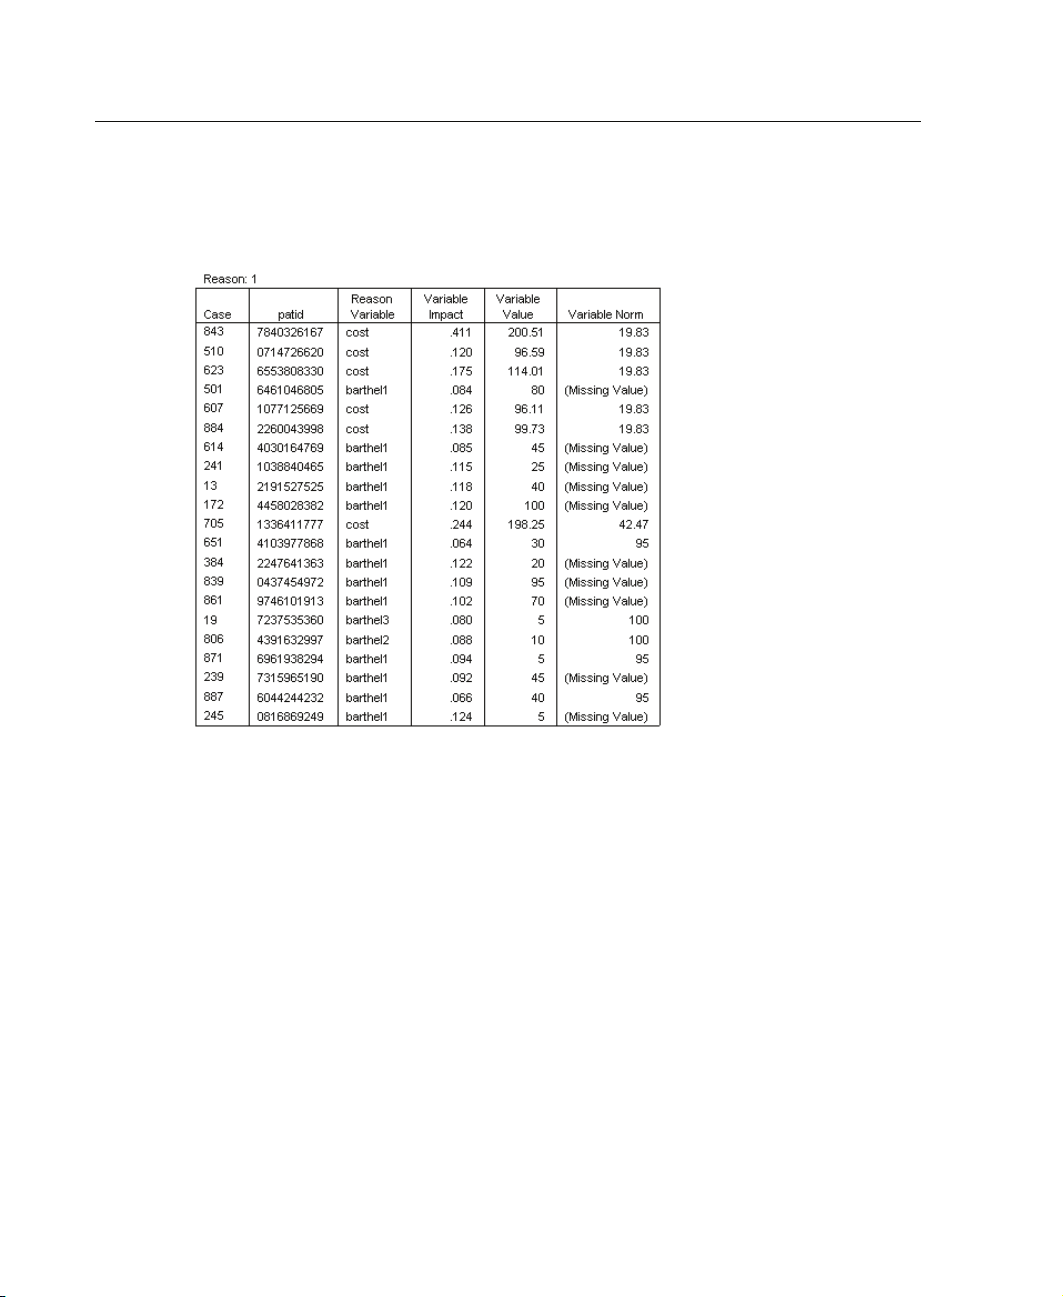
Figure 6-9
Anomaly case reason list
Reason variables are the variables that contribute the most to a case’s classification as
“unusual.” The primary reason variable for each anomalous case is displayed, along
with its impact, value for that case, and peer group norm. The peer group norm
(Missing Value) for a categorical variable indicates that the plurality of cases in the
peer group had a missing value for the variable.
The variable impact statistic is the proportional contribution of the reason variable
to the deviation of the case from its peer group. With 38 variables in the analysis,
including the missing proportion variable, a variable’s “expected” impact would be
1/38 = 0.026. The impact of the variable cost on case 843 is 0.411, which is relatively
very large. The value of cost for case 843 is 200.51, compared to the average of 19.83
for cases in peer group 3.
The dialog box selections requested results for the top three reasons.
E To see the results for the other reasons, activate the table by double-clicking it.
E Move Reason from the layer dimension to the row dimension.
Page 81
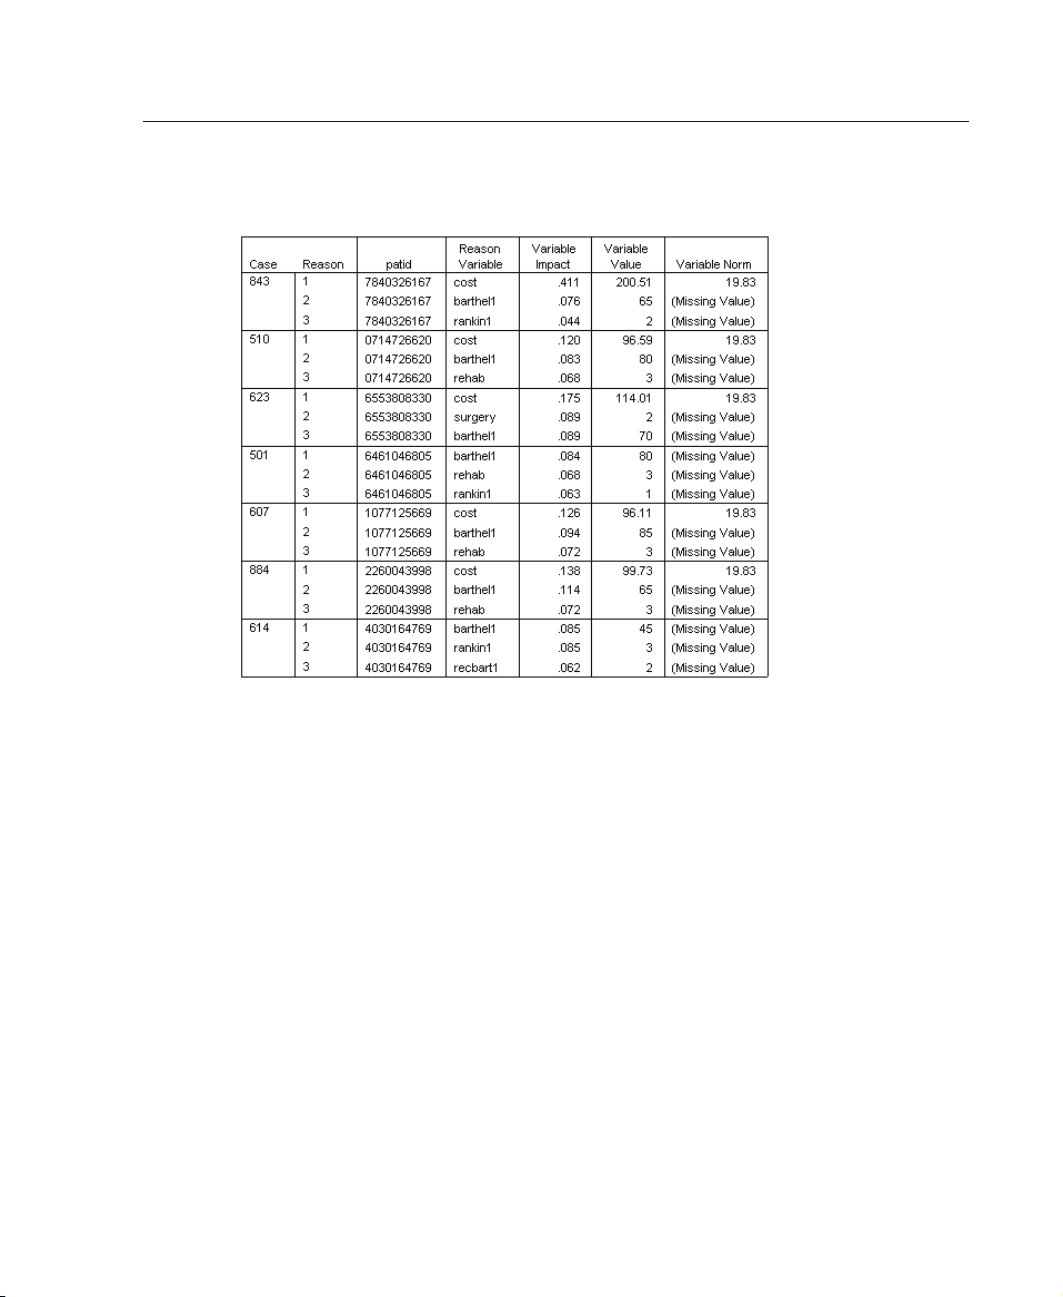
Figure 6-10
Anomaly case reason list (first 8 cases)
69
Identify Unusual Cases
This conf
iguration makes it easy to compare the relative contributions of the top three
reasons for each case. Case 843 is, as suspected, considered anomalous because of its
unusually large value of cost. In contrast, no single reason contributes more than 0.10
to the un
usualness of case 501.
Page 82
70
Chapter 6
Scale Variable Norms
Figure 6-11
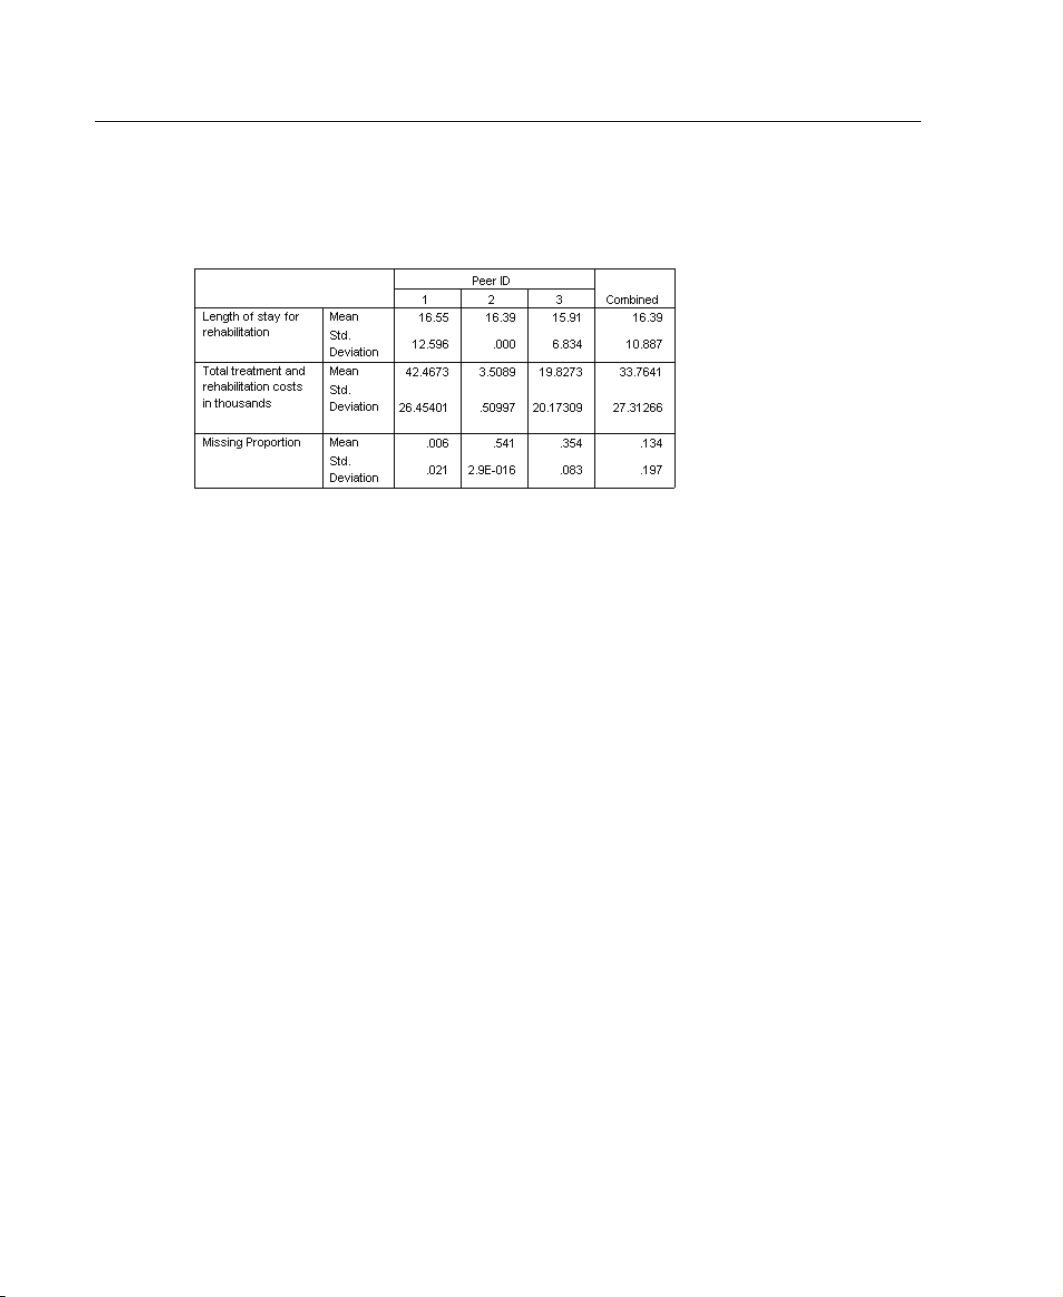
Scale variable norms
The scale variable norms report the mean and standard deviation of each variable for
each peer group and overall. Comparing the values gives some indication of which
variables co
For example, the mean for Length of stay for rehabilitation is fairly constant across
all three peer groups, meaning that this variable does not contribute to peer group
formation.
Missing Proportion each provide some insight into peer group membership. Peer group
1 has the highest average cost and the fewest missing values. Peer group 2 has very low
costs and a l
This organization suggests that peer group 2 is composed of patients who were
dead on arrival, thus incurring very little cost and causing all of the treatment and
rehabilita
died during treatment, thus incurring the treatment costs but not the rehabilitation costs
and causing the rehabilitation variables to be missing. Peer group 1 is likely composed
almost ent
incurring the highest costs.
ntribute to peer group formation.
In contrast, Total treatment and rehabilitation costs in thousands and
ot of missing values. Peer group 3 has middling costs and missing values.
tion variables to be missing. Peer g roup 3 likely contains many patients who
irely of patients who survived through treatment and rehabilitation, thus
Page 83
Categorical Variable Norms
Figure 6-12
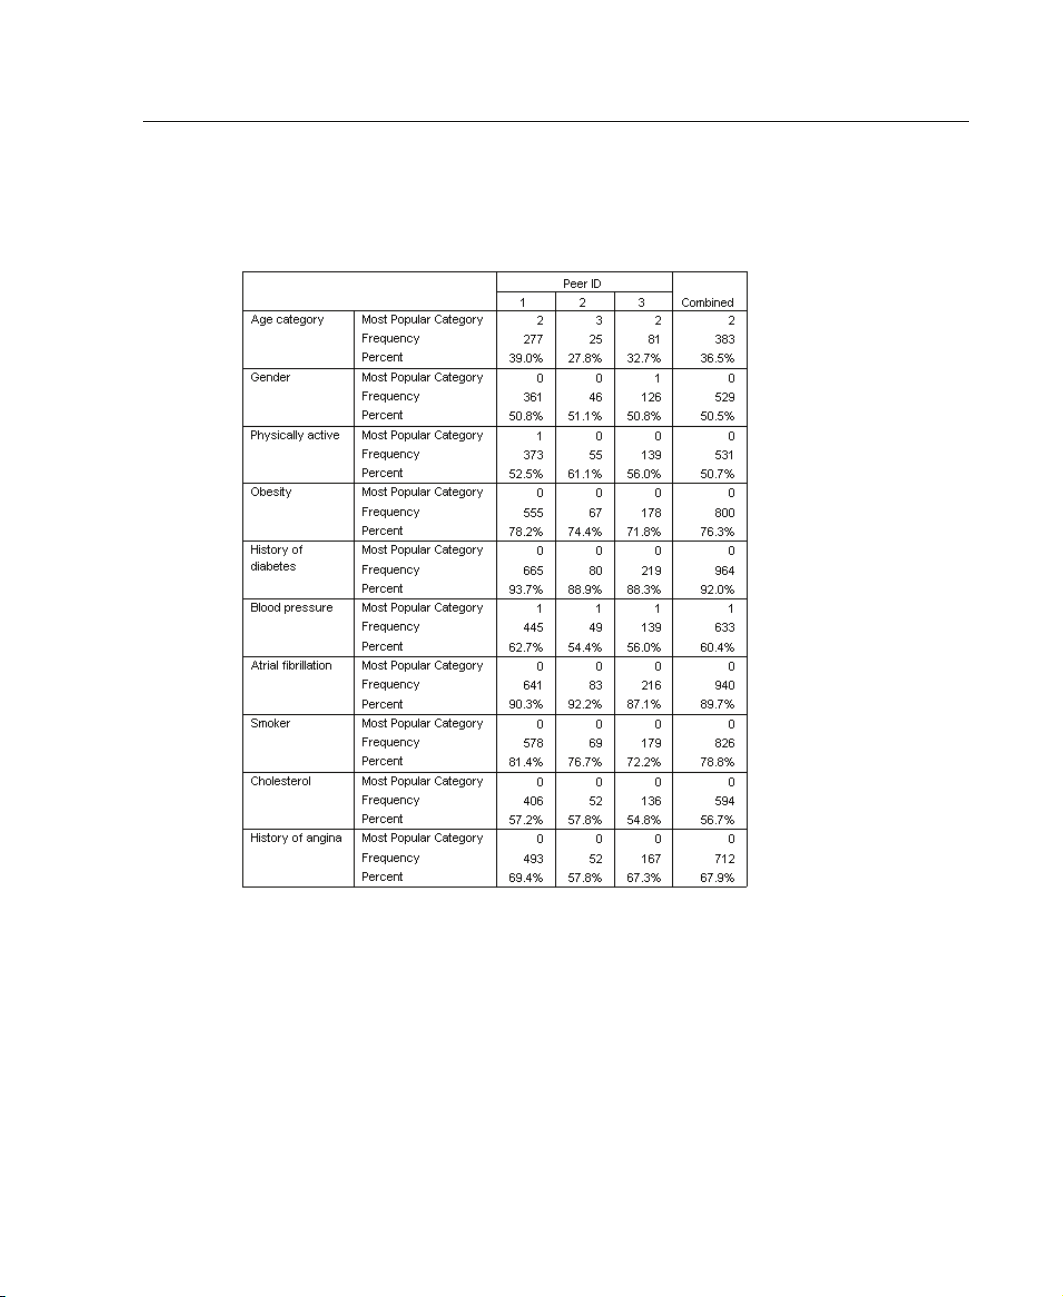
Categorical variable norms (first 10 variables)
71
Identify Unusual Cases
The categorical variable norms serve much the same purpose as the scale norms, but
categorical variable norms report the modal (most popular) category and the number
and percentage of cases in the peer group that fall into that category. Comparing the
values can be somewhat trickier; for example, at first glance, it may appear that
Gender contributes more to cluster formation than Smoker because the modal category
for Smoker is the same for all three peer groups, while the modal category for Gender
differs on peer group 3. However, because Gender has only two values, you can infer
that 49.2% of the cases in peer group 3 have a value of 0, which is very similar to the
Page 84
72
Chapter 6
percentages in the other peer groups. By contrast, the percentages for Smoker range
from 72.2% to 81.4%.
Figure 6-13
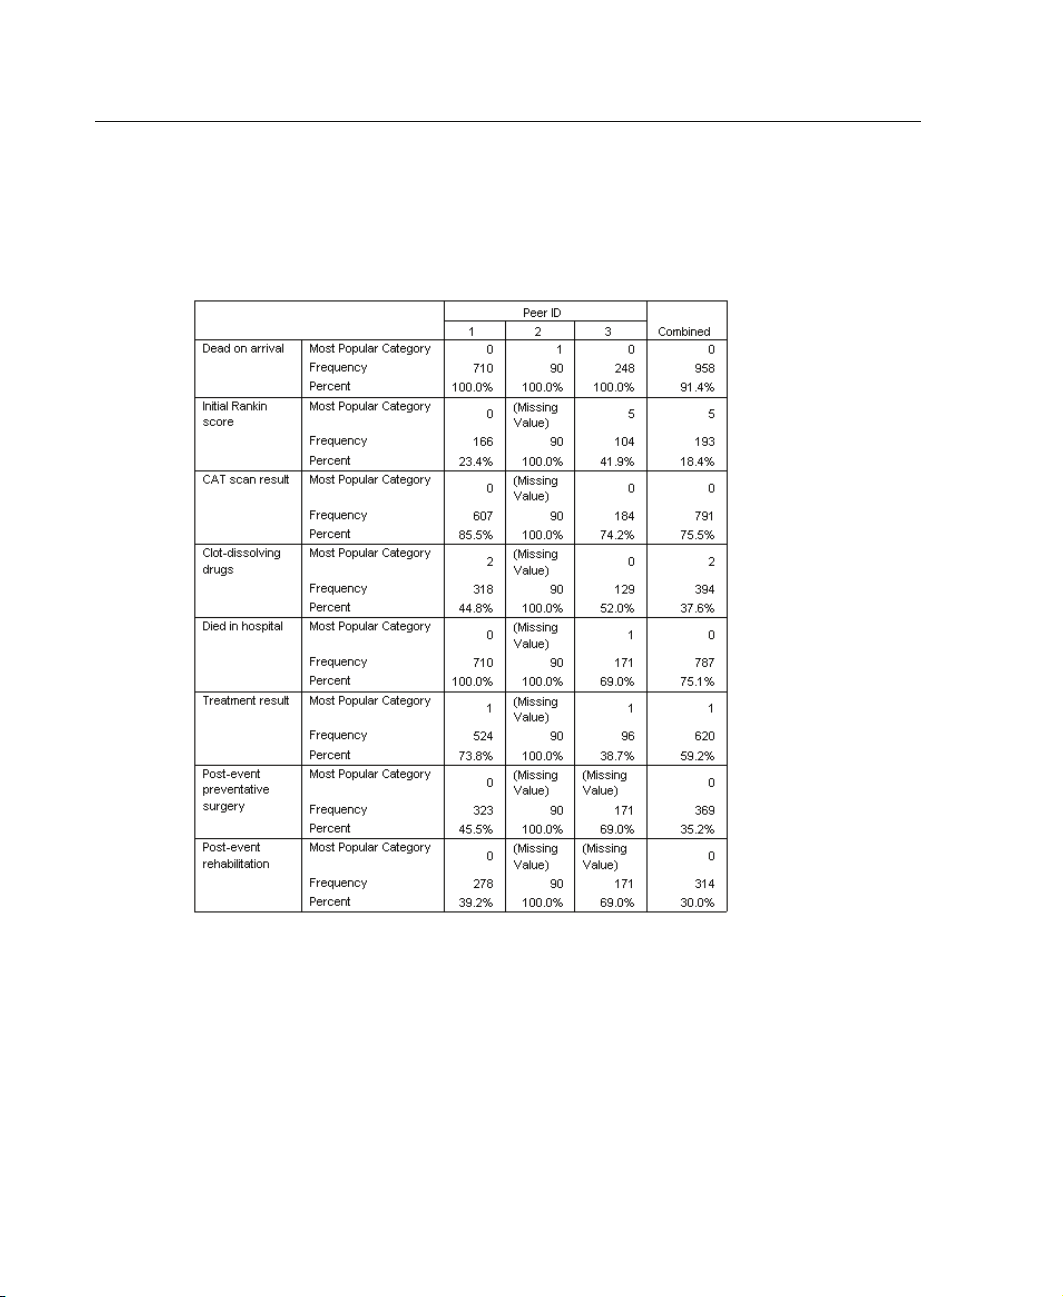
Categorical variable norms (selected variables)
The suspicions that were raised by the scale variable norms are c onfirmed further
down in the categorical norms table. Peer group 2 is entirely composed of patients who
were dead on arrival, so all treatment and rehabilitation variables are missing. Most of
the patients in p eer group 3 (69.0%) died during treatment, so the modal category for
rehabilitation variables is (Missing Value).
Page 85
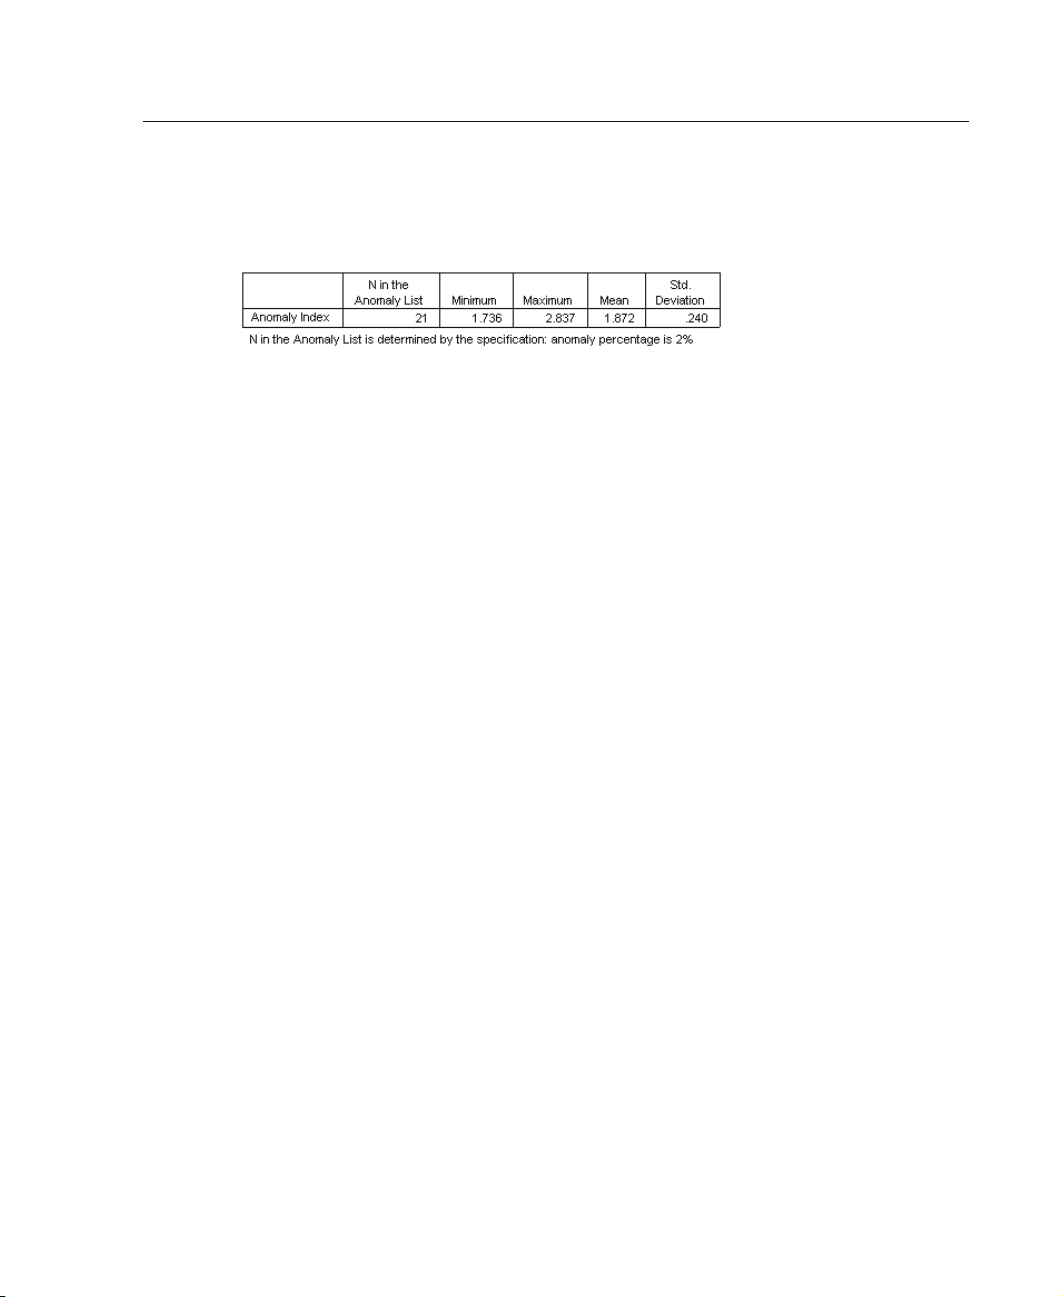
Anomaly Index Summary
Figure 6-14
Anomaly index summary
The table provides summary statistics for the anomaly index values of cases in the
anomaly list.
73
Identify Unusual Cases
Page 86
74
Chapter 6
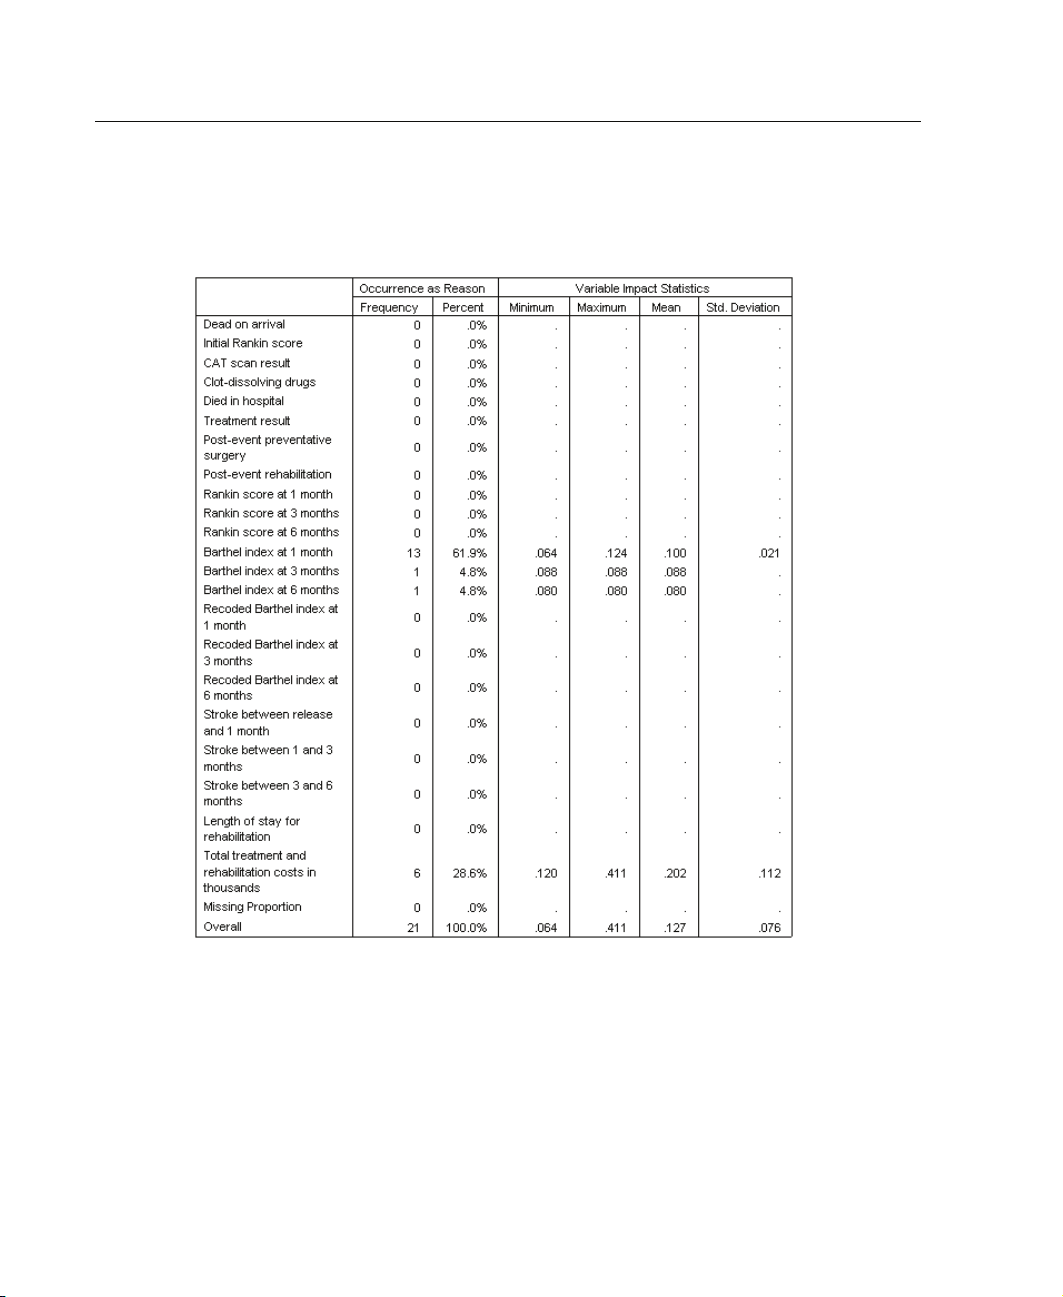
Reason Summary
Figure 6-15
Reason summary (treatment and r ehabilitation variables)
For each variable in the analysis, the table summarizes the variable’s role as a
primary reason. Most variables, such as variables from Dead on arrival to Post-event
rehabilitation, are not the primary reason that any of the cases are on the anomaly list.
Barthel index at 1 month is the most frequent reason, followed by Total treatment and
rehabilitation costs in thousands. The variable impact statistics are summarized, with
the minimum, maximum, and mean impact reported for each variable, along with the
standard deviation for variables that were the reason for more than one case.
Page 87
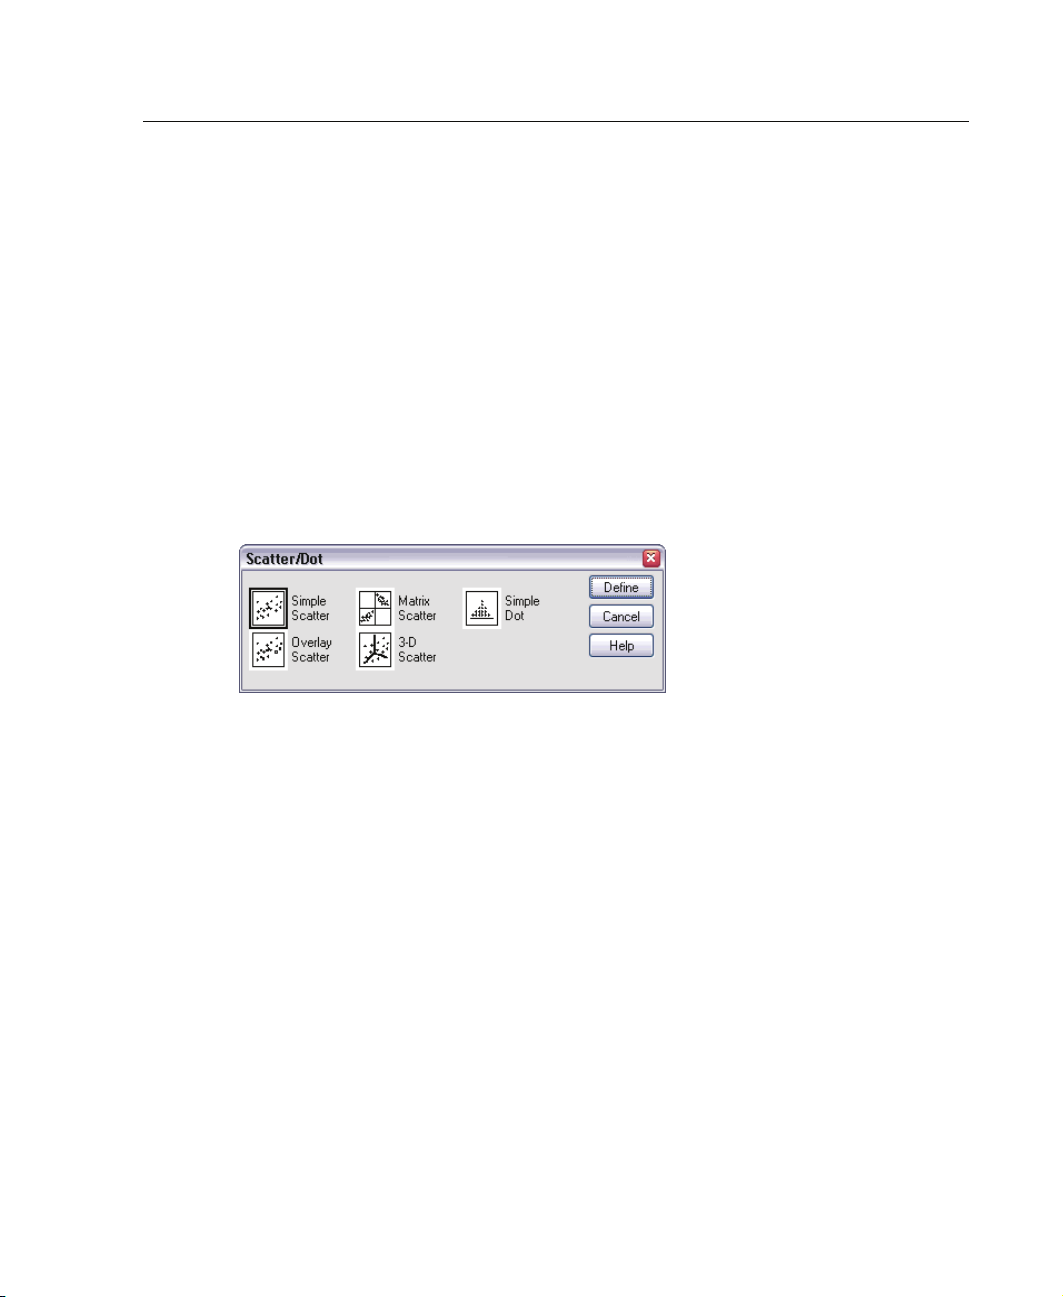
Scatterplot of Anomaly Index by Variable Impact
The tables contain a lot of useful information, but it can be difficult to grasp the
relationships. Using the saved variables, you can construct a graph that makes this
process easier.
E To produce this scatterplot, from the menus choose:
Graphs
Scatter/Dot...
Figure 6-16
Scatterplot dialog box
75
Identify Unusual Cases
E Click Define.
Page 88
76
Chapter 6
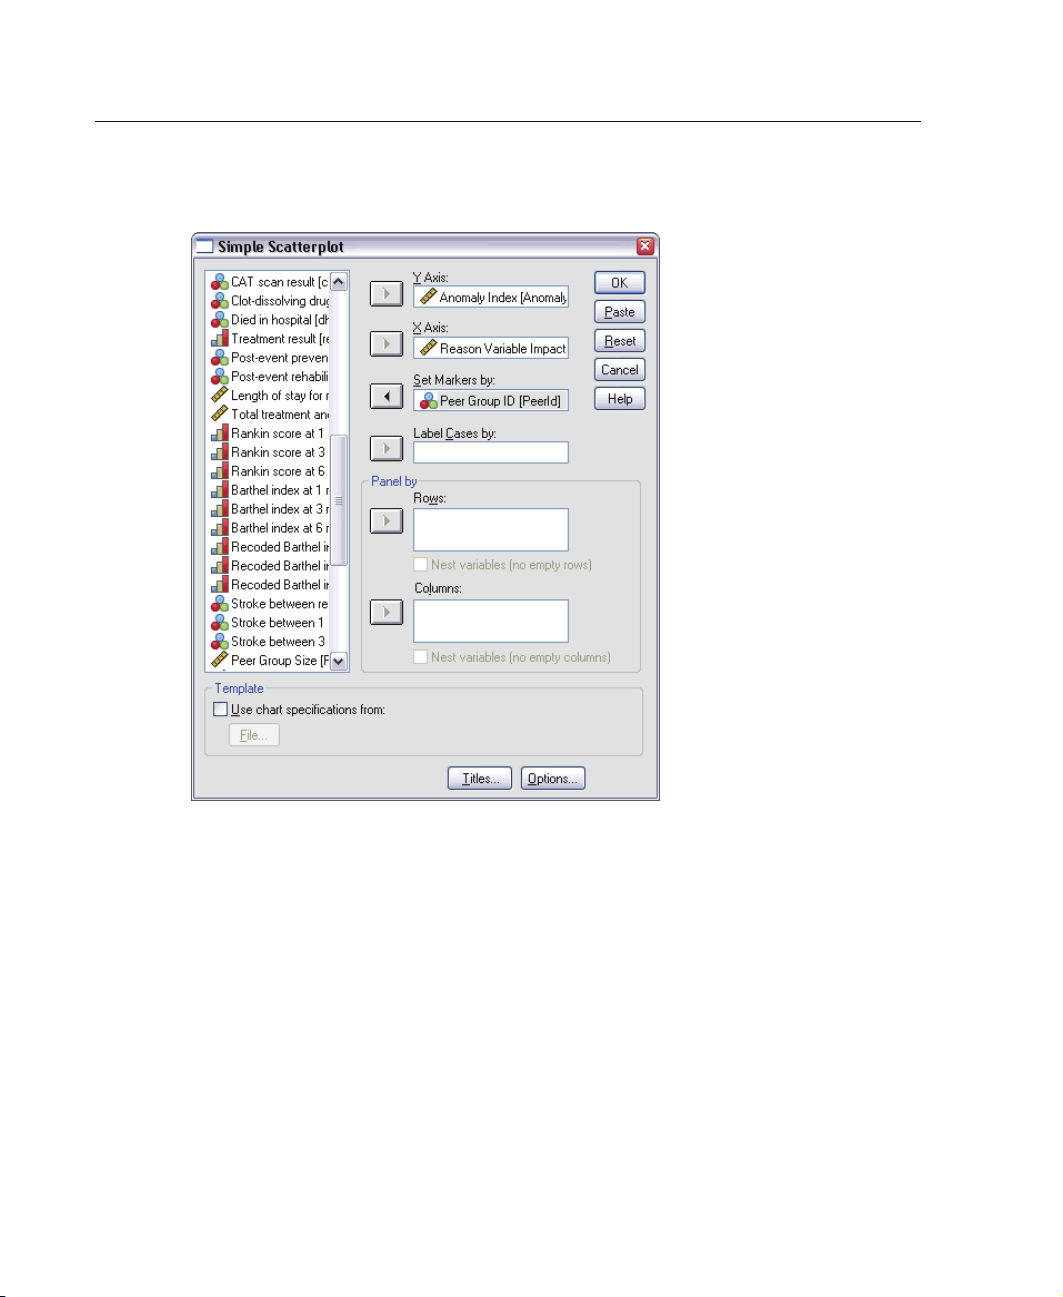
Figure 6-17
Simple Scatterplot d ialog box
E Select Anomaly Index as the y variable and Reason Variable Impact Measure 1 as
the x variable.
E Select Pe er Gro u p ID as the variable to set markers by.
E Click OK.
These selections produce the scatterplot.
Page 89
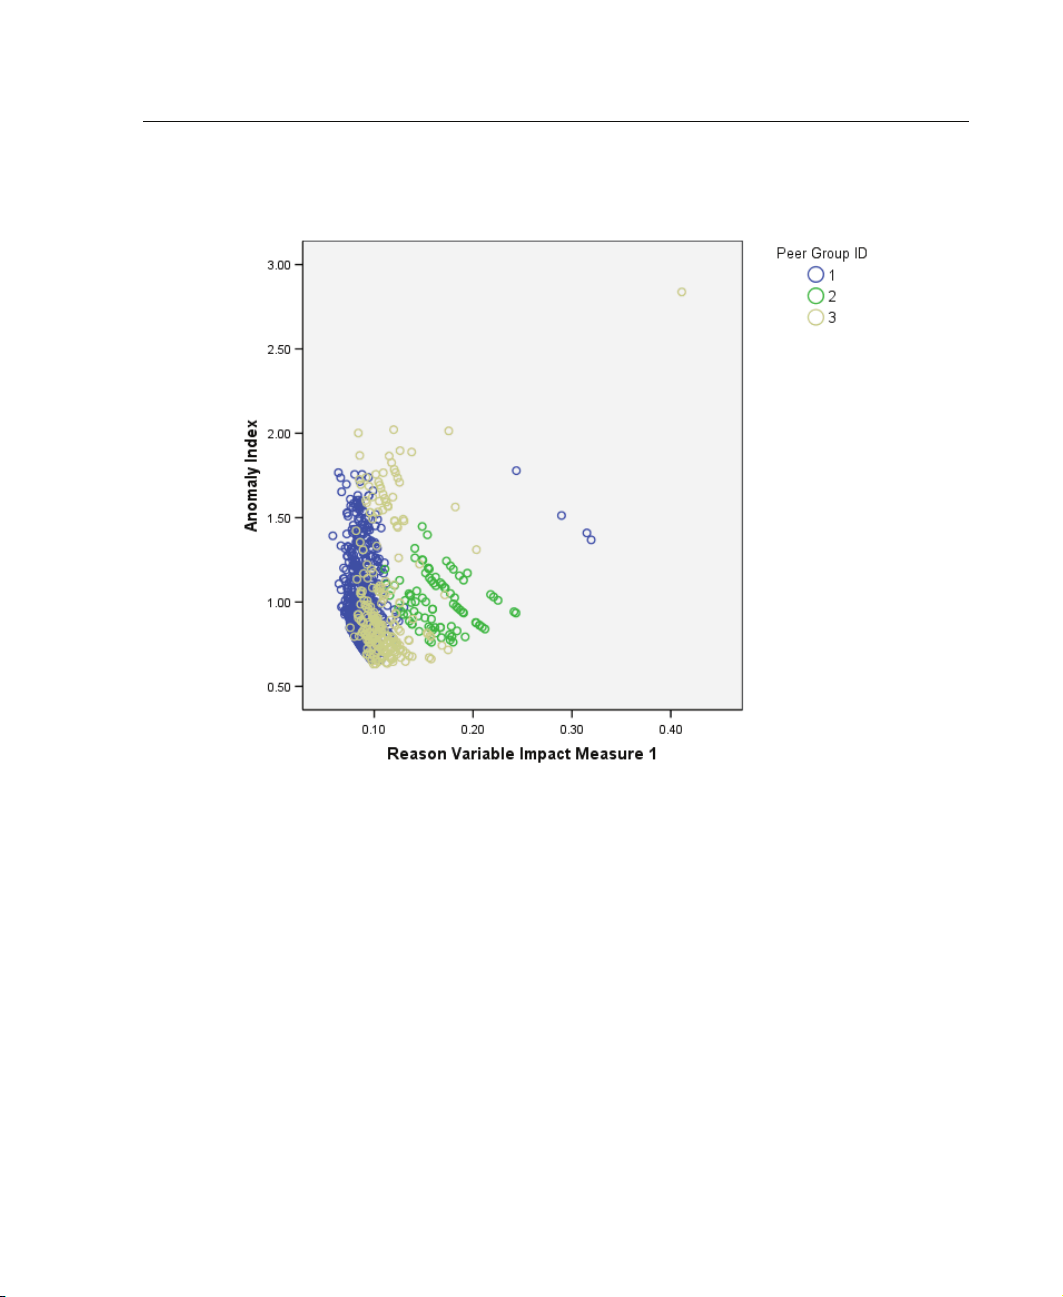
Identify Unusual Cases
Figure 6-18
Scatterplot of anomaly index by impact measure of first reason variable
77
nspection of the graph leads to several observations:
I
he case in the upper right corner belongs to peer group 3 and is both the most
T
anomalous case and the case with the largest contribution made by a single
variable.
Moving down along the y axis, we see that there are three cases belonging to
eer group 3, with anomaly index values just above 2.00. These cases should be
p
investigated more closely as anomalous.
Moving along the x axis, we see that there are four cases belonging to peer group 1,
with variable impact measures approximatelyintherangeof0.23to0.33.These
ases should be investigated more thoroughly because these values separate the
c
cases from the main body of points in the plot.
Peer group 2 seems fairly homogenous in the sense that its anomaly index and
variable impact values do not vary widely from their central tendencies.
Page 90

78
Chapter 6
Summary
Using the Identify Unusual Cases procedure, you have spotted several cases that
warrant further examination. These cases are cases that would not be identified by
other validation procedures because the relationships between the variables (not just
the values of the variables themselves) determine the anomalous cases.
It is somewhat disappointing that the peer groups are largely constructed based on
two variables: Dead on arrival and Died in hospital. In further analysis, you could
study the effect of forcing a larger number of peer groups to be created, o r you could
perform an analysis that includes only patients who have survived treatment.
Related Procedures
The Identify Unusual Cases procedure is a useful tool for detecting anomalous cases in
your data file.
The Validate Data procedure identifies suspicious and invalid cases, variables,
and data values in the active dataset.
Page 91

Index
anomaly indices
in Identify Unusual Cases
case processing summary
in Identify Unusual Cases
case report
in Validate Data
cross-variable validation rules
defining
in Define Valida tion Rules
in Validate Data
data validation
in Validate Data
Define Validation Rules
cross-variable rules
single-variable rules
duplicate case identifie
in Validate Data
empty cases
in Validate Data
, 49
, 46, 57
, 16, 56
, 11
,
, 8
5
,
rs
, 19, 36
, 19
4
, 24, 26, 66
, 66
, 8
missing values
model
, 59
options
output
, 24
reason summary
related procedures
save variables
scale variable norms
incomplete case identifiers
in Validate Data
missing values
in Identify Unusual Cases
peer group norms
in Identify Unusual Cases
peer groups
in Identify Unusual Cases
reasons
in Identify Unusual Cases
rule descriptions
in Validate Data
, 27
, 28
, 74
, 78
, 26
, 70
, 19, 36
, 45
, 27
, 70–71
, 24, 26, 66–67
, 24, 26, 68, 74
Identify Unusual Cases
anomaly case index list
anomaly case peer ID list
anomaly case reason list
anomaly index summary
case processing summary
categorical variable norms
export model file
, 26
, 21, 59
, 66
, 67
, 68
, 73
, 66
, 71
single-variable validation rules
defining
in Define Validation Rules
in Validate Data
Validate Data
basic checks
79
, 49
, 15
, 11, 33
, 13
, 5
Page 92

80
Index
case report, 46, 57
cross-variable rules
duplicate case identifiers
incomplete case identifiers
output
, 17
related procedures
rule descriptions
save variables
single-variable rules
variable summary
warnings
validation rule violations
in Validate Data
validation rules
variable summary
in Validate Data
violations of validation rules
in Validate Data
, 35
, 16, 56
, 58
, 45
, 19
, 15
, 45
, 19
, 3
, 45
, 19
, 36
, 36
warnings
in Validate Data
, 35
 Loading...