

Page 1

SPSS® Base 11.5 User’s Guide
Page 2

For more information about SPSS® software products, please visit our Web site at
http://www.spss.com or contact
SPSS Inc.
233 South Wacker Drive, 11th Floor
Chicago, IL 60606-6412
Tel: (312) 651-3000
Fax: (312) 651-3668
SPSS is a registered trademark and the other product names are the trademarks of SPSS Inc. for its
proprietary computer software. No material describing such software may be pr oduced or distributed
without the written permission of the owners of the trademark and license rights in the software and
the copyrights in the published materials.
The SOFTWARE and documentation are provided with RESTRICTED R IGHTS. Use, duplication,
or disclosure by the Government is subject to restrictions as set forth in subdivision (c)(1)(ii) of The
Rights in T echnical Data and Computer Sof tware clause at 52.227 -7013. Contractor/manuf acturer is
SPSS Inc., 233 South Wacker Drive, 11th Floor, Chicago, IL 60606-6412.
General notice: Other product names mentioned herein are used for identif ication purposes only and
may be trademarks of their respective companies.
TableLook is a trademark of SPSS Inc.
Windows is a registered trademark of Microsoft Corporation.
DataDirect, DataDirect Connect, INTERSOLV, and SequeLink are registered trademarks of
MERANT Solutions Inc.
Portions of this product were created using LEADTOOLS © 1991-2000, LEAD Technolo gies, Inc.
ALL RIGHTS RESERVED.
LEAD, LEADTOOLS, and LEADVIEW are registered trademarks of LEAD Technologies, Inc.
Portions of this product were based on the work of the FreeType Team (http://www.freetype.org).
®
Base 11.5 User’s Guide
SPSS
Copyright © 2002 by SPSS Inc.
All rights reserved.
Printed in the United States of America.
No part of this publication may be reproduced, stored in a retrieval system, or transmitted, in any
form or by any means, electronic, mechanical, photocopying, recording, or otherwise, without the
prior written permission of the publisher.
1 2 3 4 5 6 7 8 9 0 05 04 03 02
ISBN 1-56827-304-5
Page 3

Preface
SPSS® 11.5 is a comprehensive system for analyzing data. SPSS can take data from
almost any type of fi le and use them to g enerate tab ulate d reports , charts, and plots of
distributions and trends, descriptive statistics, and complex statistical analyses.
SPSS makes statisti cal analy sis ac cessi ble for the cas ua l user and conve nient for the
experienced user. The Data Editor offers a simple and efficient spreadsheet-like facility
for entering data and browsing the working data file. High-resolution, presentationquality charts and plots are integral parts of the Base system. Much of the output from the
Base system and Tables option takes the form of flexible pivot tables that you can modify
quickly and copy directly into other applications. The Viewer makes it easy to organize
and manage your tables and charts using a familiar tree structure. When you have
questions about an item in a dialog box, a statistic in your output, or the steps needed to
accomplish a task, help is only a click or two away. With the Draft Viewer, you can create
simple text output instead of interactive pivot tables. See the overview (Chapter 1) for a
list of new features and an introduction to the Base system.
This manual, th e SPSS Base 11.5 User’s Guid e, do cumen ts th e grap hi cal use r
interface of SPSS for Windows. Complete information about using interactive graphics
can be found in SPSS Interactive Graphics 10 .0, which is compatible with release 11.5
of SPSS. Examples using the statistical procedures found in SPSS Base 11.5 are
provided in the Help system, installed with the software. Algorithms used in the
statistical procedures are available on the product CD-ROM.
Beneath the menus and dial og boxes, SPSS uses a command language that can be
used to create and run p r oduc ti on j obs. Dial o g boxes can “paste” commands into a
syntax window, where they can be modif ied and sav ed; a fe w featu res of the system ca n
be accessed only via command syntax. Compl ete command syntax is documente d in the
SPSS 11.5 Syntax Reference Guide, whi ch is incl uded on the prod uct CD-ROM and is
available for purchase separat el y in pr int . T he Help system contains brief syntax
diagrams in addition to full help on the graphical user interface.
iii
Page 4

SPSS Options
The SPSS family o f products i ncludes add-on enh ancements to t he SPSS Base system,
which are availabl e on several computer platforms. Contact your local SPSS office or
sales representative about availability of the following options:
n SPSS Regression Models
traditional linear statistical models. It includes procedures for probit analysis,
logistic regression, weight estimatio n, two-stage least-squares regression, and
general nonlinear regression.
n SPSS Advanced Models
experimental and biomedical research. It includes procedures for general linear
models (GLM), linear mixed models, variance components analysis, loglinear
analysis, ordinal regression, actuarial life tables, Kaplan-Meier survival analysis,
and basic and extended Cox regression.
n SPSS Tables
complex stub-and-banner tables and displays of multiple-response data.
n SPSS Trends
multiple curve-fitting models, smoothing m odels, and methods for estim ating
autoregressive functions.
n SPSS Categories
analysis.
n SPSS Conjoint
n SPSS Exact Tests
unevenly distributed samples could make the usual tests inaccurate.
n SPSS Missing Value Analysis
and other statistics, and imputes values for missing observations.
n SPSS Maps
symbols, colors, bar charts, pie charts, and comb i n ations of themes to present not
only what is happening but where it is happening.
™
provides techniques for analyzing da ta that do not fit
™
focuses on techniques often used in sophisticated
™
creates a variety of presentation-quality tabular reports, including
™
performs comprehensive forecasting and time series analyses with
®
performs optimal scaling procedures, including correspondence
™
performs conjoint analysis.
™
calculates exact p values for statistical tests when small or very
™
describes patterns of missing data, estimates means
™
turns your geographically distributed data into high-quality maps with
iv
Page 5

Compatibility
The SPSS Base 11.5 system is designed to operate on computer systems running
Windows 98, Windows 2000, Windows Me, or Windows NT 4.0.
Serial Numbers
Your serial number is your identification number with SPSS Inc. You will need this
serial number when you contact SPSS I nc. for information regardi ng support, payment,
or an upgraded system. The serial number was provided with your Base system. Before
using the system, please copy this number to the registration card.
Registration Card
Don’t put it off: fill out and send us your registration card. Until we receive your
registration card, you ha v e an un regi ster ed system. Ev en if you have previously sent a
card to us, please fill out and return the card enclosed in your Base system package.
Registering your system entitles you to:
n Technical support services
n New product announcements and upgrade announcements
Customer Service
If you have any questions concerning your shipment or accoun t, contact your local office,
listed on page vii. Please hav e your serial n umber ready for i dentification when calling.
Training Seminars
SPSS Inc. provides both public and onsite training seminars for SPSS. All seminars
feature hands-on workshops. SPSS seminars will be offered in major U.S. and
European cities on a regular basis. For more information on these seminars, call your
local office, l i sted on pa ge vii .
v
Page 6

Technical Support
The services of SPSS T ech nical Support a re av ailable to registered cust omers of SPSS.
Customers may contact T echn ical Support for assistance in using SPSS products or for
installation help for one of the supported h ard ware environments. To reach Te chnical
Support, see the SPSS W e b site at http://www.spss.com, or call your local office, listed
on page vii. Be prepared to identify yourself, your organization, and the serial number
of your system.
Additional Publications
Except for academic course adoption s, additional copies of SPSS product manual s may
be purchased directly from SPSS Inc. Vi sit our W eb site at http://www.spss.com/estore,
or contact your local SPSS office, listed on page vii.
SPSS product manuals may also be purchased from Prentice Hall, the exclusive
distributor of SPSS pu blications. To or der, fill out and mail the Publications orde r form
included with your system, or call 800- 947-7700. I f you repres ent a booksto re or have
an account with Prentice Hall, call 800-382-3419. In Canada, call 800-567-3800.
Outside of North America, contact your local Prentice Hall office.
Statistical introductions to procedures in the Base, Regress io n Models, and
Advanced Models written by Marija Norusis a re planned to be available from
v
Prentice Hall. Check with the publisher or visit the SPSS Web site for announcements
regarding availability.
Tell Us Your Thoughts
Your comments are important. Please let us know about your experiences with SPSS
products. W e especially like to hear about new and interesting applications using the
SPSS system. Pl ease send e-mail to [email protected], or write to SPSS Inc., Attn:
Director of Product Planning , 233 South Wacker Drive, 11th Floor, Chicago, IL
60606-6412.
Contacting SPSS
If you would like to b e on our mailing list, con tact one of our of fic es, lis ted on p age vii,
or visit our W eb site at http://www.spss.com. We will send you a copy of our newsletter
and let you know about SPSS Inc. activities in your area.
vi
Page 7

SPSS Inc.
Chicago, Illinois, U.S.A.
Tel: 1.312.651.3000
or 1.800.543.2185
www.spss.com/corpinfo
Customer Service:
1.800.521.1337
Sales:
1.800.543.2185
[email protected]
Training:
1.800.543.6607
Technical Support:
1.312.651.3410
[email protected]
SPSS Federal Systems
Tel: 1.703.740.2400
or 1.800.860.5762
www.spss.com
SPSS Andino
Tel: +57.1.635.8585
www.spss.com/la
SPSS Argentina SA
Tel: +5411.4371.5031
www.spss.com/la
SPSS Asia Pacific Pte. Ltd.
Tel: +65.245.9110
www.spss.com
SPSS Australasia Pty. Ltd.
Tel: +61.2.9954.5660
www.spss.com
SPSS Belgium
Tel: +32.163.170.70
www.spss.com
SPSS Benelux BV
Tel: +31.183.651777
www.spss.com
SPSS Brasil Ltda.
Tel: +55.11.5505.3644
www.spss.com
SPSS Chile
Tel: +56.2.233.7499
www.spss.com/la
SPSS Czech Republic
Tel: +420.2.24813839
www.spss.cz
SPSS Denmark
Tel: +45.45.46.02.00
www.spss.com
SPSS East Africa
Tel: +254 2 577 262
www.spss.com
SPSS Finland Oy
Tel: +358.9.4355.920
www.spss.com
SPSS France SARL
Tel: +01.55.35.27.00
www.spss.com
SPSS Germany
Tel: +49.89.4890740
www.spss.com
SPSS BI Greece
Tel: +30.1.6971950
www.spss.com
SPSS Hong Kong Ltd.
Tel: +852.2.811.9662
www.spss.com
SPSS Iberica, S.L.U.
Tel: +34.902.123.606
www.spss.com
SPSS Ireland
Tel: +353.1.415.0234
www.spss.com
SPSS BI Israel
Tel: +972.3.6166616
www.spss.com
SPSS Italia srl
Tel: +800.437300
www.spss.it
SPSS Japan Inc.
Tel: +81.3.5466.5511
www.spss.co.jp
SPSS Korea DataSolution Co.
Tel: +82.2.563.0014
www.spss.co.kr
SPSS Latin America
Tel: +1.312.651.3539
www.spss.com
SPSS Malaysia Sdn Bhd
Tel: +603.6203.2300
www.spss.com
SPSS Mexico SA de CV
Tel: +52.5.682.87.68
www.spss.com
SPSS Miami
Tel: 1.305.627.5700
www.spss.com
SPSS Norway AS
Tel: +47.22.99.25.50
www.spss.com
SPSS Polska
Tel: +48.12.6369680
www.spss.pl
SPSS Russia
Tel: +7.095.125.0069
www.spss.com
SPSS San Bruno
Tel: 1.650.794.2692
www.spss.com
SPSS Schweiz AG
Tel: +41.1.266.90.30
www.spss.com
SPSS BI (Singapore) Pte. Ltd.
Tel: +65.346.2061
www.spss.com
SPSS South Africa
Tel: +27.21.7120929
www.spss.com
SPSS South Asia
Tel: +91.80.2088069
www.spss.com
SPSS Sweden AB
Tel: +46.8.506.105.50
www.spss.com
SPSS Taiwan Corp.
Taipei, Republic of China
Tel: +886.2.25771100
www.sinter.com.tw/spss/main
SPSS (Thailand) Co., Ltd.
Tel: +66.2.260.7070
www.spss.com
SPSS UK Ltd.
Tel: +44.1483.719200
www.spss.com
vii
Page 8

Page 9

Contents
1Overview 1
What’s New in SPSS 11.5? . . . . . . . . . . . . . . . . . . . . . . . . . . . 2
Windows . . . . . . . . . . . . . . . . . . . . . . . . . . . . . . . . . . . . . 4
Designated versus Active Window . . . . . . . . . . . . . . . . . . . 5
Menus . . . . . . . . . . . . . . . . . . . . . . . . . . . . . . . . . . . . . . 6
Toolbars . . . . . . . . . . . . . . . . . . . . . . . . . . . . . . . . . . . . . 6
Showing and Hiding Toolbars . . . . . . . . . . . . . . . . . . . . . . 7
Moving Toolbars . . . . . . . . . . . . . . . . . . . . . . . . . . . . . . 7
Status Bar . . . . . . . . . . . . . . . . . . . . . . . . . . . . . . . . . . . . 8
Showing and Hiding the Status Bar . . . . . . . . . . . . . . . . . . . 9
Dialog Boxes. . . . . . . . . . . . . . . . . . . . . . . . . . . . . . . . . . . 9
Variable Names and Variable Labels in Dialog Box Lists . . . . . . .10
Dialog Box Pushbuttons. . . . . . . . . . . . . . . . . . . . . . . . . .11
Subdialog Boxes. . . . . . . . . . . . . . . . . . . . . . . . . . . . . .12
Selecting Variables . . . . . . . . . . . . . . . . . . . . . . . . . . . .12
Getting Information about Variables in Dialog Boxes . . . . . . . . .13
Getting Information about Dialog Box Controls . . . . . . . . . . . .13
Basic Steps in Data Analysis . . . . . . . . . . . . . . . . . . . . . . . . .14
Statistics Coach . . . . . . . . . . . . . . . . . . . . . . . . . . . . . . . . .15
Finding Out More about SPSS . . . . . . . . . . . . . . . . . . . . . . . . .15
2 Getting Help 17
Using the Help Table of Contents . . . . . . . . . . . . . . . . . . . . . . .18
Using the Help Index . . . . . . . . . . . . . . . . . . . . . . . . . . . . . .19
Getting Help on Dialog Box Controls . . . . . . . . . . . . . . . . . . . . .20
ix
Page 10

Getting Help on Output Terms . . . . . . . . . . . . . . . . . . . . . . . . 20
Using Case Studies . . . . . . . . . . . . . . . . . . . . . . . . . . . . . . 21
Copying Help Text from a Pop-Up Window . . . . . . . . . . . . . . . . . 21
3 Data Files 23
Opening a Data File . . . . . . . . . . . . . . . . . . . . . . . . . . . . . . 23
Data File Types . . . . . . . . . . . . . . . . . . . . . . . . . . . . . . 24
Opening File Options . . . . . . . . . . . . . . . . . . . . . . . . . . . 25
How the Data Editor Reads Excel 5 or Later Files. . . . . . . . . . . 25
How the Data Editor Reads Older Excel Files and
Other Spreadsheets . . . . . . . . . . . . . . . . . . . . . . . . . . . 25
How the Data Editor Reads dBASE Files. . . . . . . . . . . . . . . . 26
Reading Database Files . . . . . . . . . . . . . . . . . . . . . . . . . . . . 26
Selecting a Data Source . . . . . . . . . . . . . . . . . . . . . . . . . 28
Database Login . . . . . . . . . . . . . . . . . . . . . . . . . . . . . . 30
Selecting Data Fields. . . . . . . . . . . . . . . . . . . . . . . . . . . 30
Creating a Parameter Query. . . . . . . . . . . . . . . . . . . . . . . 37
Defining Variables . . . . . . . . . . . . . . . . . . . . . . . . . . . . 39
Results . . . . . . . . . . . . . . . . . . . . . . . . . . . . . . . . . . . 40
Reading Text Data Files . . . . . . . . . . . . . . . . . . . . . . . . . . . . 41
To Read Text Data Files . . . . . . . . . . . . . . . . . . . . . . . . . 42
Text Wizard Step 1 . . . . . . . . . . . . . . . . . . . . . . . . . . . . 42
Text Wizard Step 2 . . . . . . . . . . . . . . . . . . . . . . . . . . . . 43
Text Wizard Step 3: Delimited Files . . . . . . . . . . . . . . . . . . . 44
Text Wizard Step 3: Fixed-Width Files . . . . . . . . . . . . . . . . . 46
Text Wizard Step 4: Delimited Files . . . . . . . . . . . . . . . . . . . 47
Text Wizard Step 4: Fixed-Width Files . . . . . . . . . . . . . . . . . 48
Text Wizard Step 5 . . . . . . . . . . . . . . . . . . . . . . . . . . . . 49
Text Wizard Step 6 . . . . . . . . . . . . . . . . . . . . . . . . . . . . 51
File Information . . . . . . . . . . . . . . . . . . . . . . . . . . . . . . . . . 52
Obtaining Data File Information. . . . . . . . . . . . . . . . . . . . . 52
x
Page 11

Saving Data Files . . . . . . . . . . . . . . . . . . . . . . . . . . . . . . . .52
Saving Data Files in Excel Format . . . . . . . . . . . . . . . . . . . .53
Saving Data Files in SAS Format. . . . . . . . . . . . . . . . . . . . .54
Saving Data Files in Other Formats . . . . . . . . . . . . . . . . . . .55
Saving Data: Data File Types . . . . . . . . . . . . . . . . . . . . . . .56
Saving Subsets of Variables . . . . . . . . . . . . . . . . . . . . . . .58
Saving File Options . . . . . . . . . . . . . . . . . . . . . . . . . . . .59
Virtual Active File . . . . . . . . . . . . . . . . . . . . . . . . . . . . . . . .59
Creating a Data Cache . . . . . . . . . . . . . . . . . . . . . . . . . .60
4 Distributed Analysis Mode 63
Distributed versus Local Analysis. . . . . . . . . . . . . . . . . . . . . . .63
Server Login . . . . . . . . . . . . . . . . . . . . . . . . . . . . . . . .65
Opening Data Files from a Remote Server . . . . . . . . . . . . . . .68
Saving Data Files from a Remote Server . . . . . . . . . . . . . . . .69
Data File Access in Local and Distributed Analysis Mode . . . . . .70
Availability of Procedures in Distributed Analysis Mode . . . . . . .72
Using UNC Path Specifications . . . . . . . . . . . . . . . . . . . . .72
5 Data Editor 75
Data View . . . . . . . . . . . . . . . . . . . . . . . . . . . . . . . . . . . .76
Variable View . . . . . . . . . . . . . . . . . . . . . . . . . . . . . . . . . .77
Displaying or Defining Variable Attributes . . . . . . . . . . . . . . .78
Variable Names . . . . . . . . . . . . . . . . . . . . . . . . . . . . . .78
Variable Measurement Level. . . . . . . . . . . . . . . . . . . . . . .79
Variable Type. . . . . . . . . . . . . . . . . . . . . . . . . . . . . . . .81
Variable Labels. . . . . . . . . . . . . . . . . . . . . . . . . . . . . . .83
Value Labels . . . . . . . . . . . . . . . . . . . . . . . . . . . . . . . .83
Missing Values. . . . . . . . . . . . . . . . . . . . . . . . . . . . . . .84
Column Width . . . . . . . . . . . . . . . . . . . . . . . . . . . . . . .85
xi
Page 12

Variable Alignment . . . . . . . . . . . . . . . . . . . . . . . . . . . . 85
Applying Variable Definition Attributes to Multiple Variables. . . . 85
Entering Data . . . . . . . . . . . . . . . . . . . . . . . . . . . . . . . . . . 87
Entering Numeric Data. . . . . . . . . . . . . . . . . . . . . . . . . . 88
Entering Non-Numeric Data. . . . . . . . . . . . . . . . . . . . . . . 88
Using Value Labels for Data Entry . . . . . . . . . . . . . . . . . . . 89
Data Value Restrictions in the Data Editor. . . . . . . . . . . . . . . 89
Editing Data. . . . . . . . . . . . . . . . . . . . . . . . . . . . . . . . . . . 90
Replacing or Modifying Data Values . . . . . . . . . . . . . . . . . . 90
Cutting, Copying, and Pasting Data Values . . . . . . . . . . . . . . 90
Inserting New Cases . . . . . . . . . . . . . . . . . . . . . . . . . . . 91
Inserting New Variables . . . . . . . . . . . . . . . . . . . . . . . . . 92
Changing Data Type . . . . . . . . . . . . . . . . . . . . . . . . . . . 93
Go to Case. . . . . . . . . . . . . . . . . . . . . . . . . . . . . . . . . . . . 93
Finding a Case in the Data Editor . . . . . . . . . . . . . . . . . . . . 93
Case Selection Status in the Data Editor . . . . . . . . . . . . . . . . . . 94
Data Editor Display Options. . . . . . . . . . . . . . . . . . . . . . . . . . 94
Data Editor Printing . . . . . . . . . . . . . . . . . . . . . . . . . . . . . . 95
Printing Data Editor Contents . . . . . . . . . . . . . . . . . . . . . . 95
6 Data Preparation 97
Copying Data Properties . . . . . . . . . . . . . . . . . . . . . . . . . . . 98
To Copy Data Properties . . . . . . . . . . . . . . . . . . . . . . . . . 99
Selecting Source and Target Variables . . . . . . . . . . . . . . . 100
Choosing Variable Properties to Copy . . . . . . . . . . . . . . . . 102
Copying Data Set (File) Properties . . . . . . . . . . . . . . . . . . 104
Results . . . . . . . . . . . . . . . . . . . . . . . . . . . . . . . . . . 106
Defining Variable Properties . . . . . . . . . . . . . . . . . . . . . . . . 107
To Define Variable Properties. . . . . . . . . . . . . . . . . . . . . 107
Defining Value Labels and Other Variable Properties . . . . . . . 109
Suggest Measurement Level . . . . . . . . . . . . . . . . . . . . . 111
Copying Variable Properties. . . . . . . . . . . . . . . . . . . . . . 112
xii
Page 13

7 Data Transformations 115
Compute Variable . . . . . . . . . . . . . . . . . . . . . . . . . . . . . . . 115
Compute Variable: If Cases. . . . . . . . . . . . . . . . . . . . . . . 117
Compute Variable: Type and Label . . . . . . . . . . . . . . . . . . 118
Functions . . . . . . . . . . . . . . . . . . . . . . . . . . . . . . . . . . . . 118
Missing Values in Functions . . . . . . . . . . . . . . . . . . . . . . 119
Random Number Seed . . . . . . . . . . . . . . . . . . . . . . . . . . . . 119
Count Occurrences of Values within Cases . . . . . . . . . . . . . . . . 120
Count Values within Cases: Values to Count . . . . . . . . . . . . . 121
Recoding Values . . . . . . . . . . . . . . . . . . . . . . . . . . . . . . . 122
Recode into Same Variables . . . . . . . . . . . . . . . . . . . . . . 122
Recode into Different Variables . . . . . . . . . . . . . . . . . . . . 125
Rank Cases. . . . . . . . . . . . . . . . . . . . . . . . . . . . . . . . . . . 127
Rank Cases: Types. . . . . . . . . . . . . . . . . . . . . . . . . . . . 128
Rank Cases: Ties . . . . . . . . . . . . . . . . . . . . . . . . . . . . . 129
Categorize Variables . . . . . . . . . . . . . . . . . . . . . . . . . . . . . 130
Automatic Recode . . . . . . . . . . . . . . . . . . . . . . . . . . . . . . 131
Time Series Data Transformations . . . . . . . . . . . . . . . . . . . . . 132
Define Dates . . . . . . . . . . . . . . . . . . . . . . . . . . . . . . . 132
Create Time Series . . . . . . . . . . . . . . . . . . . . . . . . . . . 134
Replace Missing Values . . . . . . . . . . . . . . . . . . . . . . . . 137
8 File Handling and File Transformations 141
Sort Cases . . . . . . . . . . . . . . . . . . . . . . . . . . . . . . . . . . . 142
To Sort Cases. . . . . . . . . . . . . . . . . . . . . . . . . . . . . . . 142
Transpose . . . . . . . . . . . . . . . . . . . . . . . . . . . . . . . . . . . 143
To Transpose Variables and Cases . . . . . . . . . . . . . . . . . . 143
Merging Data Files . . . . . . . . . . . . . . . . . . . . . . . . . . . . . . 143
xiii
Page 14

Add Cases. . . . . . . . . . . . . . . . . . . . . . . . . . . . . . . . . . . 144
To Merge Data Files with the Same Variables and
Different Cases . . . . . . . . . . . . . . . . . . . . . . . . . . . . . 145
Add Cases: Rename . . . . . . . . . . . . . . . . . . . . . . . . . . 146
Add Cases: Dictionary Information . . . . . . . . . . . . . . . . . . 147
Add Variables. . . . . . . . . . . . . . . . . . . . . . . . . . . . . . . . . 147
To Merge Files with the Same Cases but Different Variables. . . 149
Add Variables: Rename . . . . . . . . . . . . . . . . . . . . . . . . 149
Aggregate Data. . . . . . . . . . . . . . . . . . . . . . . . . . . . . . . . 150
To Aggregate a Data File . . . . . . . . . . . . . . . . . . . . . . . 151
Aggregate Data: Aggregate Function . . . . . . . . . . . . . . . . 151
Aggregate Data: Variable Name and Label . . . . . . . . . . . . . 152
Split File . . . . . . . . . . . . . . . . . . . . . . . . . . . . . . . . . . . . 153
To Split a Data File for Analysis . . . . . . . . . . . . . . . . . . . . 154
Select Cases . . . . . . . . . . . . . . . . . . . . . . . . . . . . . . . . . 154
To Select a Subset of Cases. . . . . . . . . . . . . . . . . . . . . . 155
Select Cases: If . . . . . . . . . . . . . . . . . . . . . . . . . . . . . 156
Select Cases: Random Sample . . . . . . . . . . . . . . . . . . . . 156
Select Cases: Range . . . . . . . . . . . . . . . . . . . . . . . . . . 157
Weight Cases. . . . . . . . . . . . . . . . . . . . . . . . . . . . . . . . . 158
To Weight Cases . . . . . . . . . . . . . . . . . . . . . . . . . . . . 159
Restructuring Data. . . . . . . . . . . . . . . . . . . . . . . . . . . . . . 160
To Restructure Data . . . . . . . . . . . . . . . . . . . . . . . . . . 160
Restructure Data Wizard: Select Type. . . . . . . . . . . . . . . . 160
Restructure Data Wizard (Variables to Cases):
Number of Variable Groups . . . . . . . . . . . . . . . . . . . . . . 165
Restructure Data Wizard (Variables to Cases):
Select Variables . . . . . . . . . . . . . . . . . . . . . . . . . . . . 166
Restructure Data Wizard (Variables to Cases):
Create Index Variables. . . . . . . . . . . . . . . . . . . . . . . . . 169
Restructure Data Wizard (Variables to Cases):
Create One Index Variable. . . . . . . . . . . . . . . . . . . . . . . 171
Restructure Data Wizard (Variables to Cases):
Create Multiple Index Variables . . . . . . . . . . . . . . . . . . . 173
Restructure Data Wizard (Variables to Cases): Options . . . . . . 174
xiv
Page 15

Restructure Data Wizard (Cases to Variables):
Select Variables . . . . . . . . . . . . . . . . . . . . . . . . . . . . . 176
Restructure Data Wizard (Cases to Variables): Sort Data . . . . . 177
Restructure Data Wizard (Cases to Variables): Options . . . . . . 179
Restructure Data Wizard: Finish . . . . . . . . . . . . . . . . . . . . 181
9 Working with Output 183
Viewer . . . . . . . . . . . . . . . . . . . . . . . . . . . . . . . . . . . . . 183
Using the Draft Viewer . . . . . . . . . . . . . . . . . . . . . . . . . 185
Showing and Hiding Results . . . . . . . . . . . . . . . . . . . . . . 185
Moving, Deleting, and Copying Output . . . . . . . . . . . . . . . . 186
Changing Alignment . . . . . . . . . . . . . . . . . . . . . . . . . . . 187
Viewer Outline . . . . . . . . . . . . . . . . . . . . . . . . . . . . . . 188
Using Output in Other Applications . . . . . . . . . . . . . . . . . . . . . 191
Copying a Table or Chart . . . . . . . . . . . . . . . . . . . . . . . . 192
Copying and Pasting Results into Another Application . . . . . . . 192
Embedding a Table in Another Application . . . . . . . . . . . . . . 193
Pasting a Pivot Table or Chart as a Picture (Metafile) . . . . . . . 194
Pasting a Pivot Table as a Table (RTF) . . . . . . . . . . . . . . . . 194
Pasting a Pivot Table as Text. . . . . . . . . . . . . . . . . . . . . . 194
Copying and Pasting Multiple Items into Another Application. . . 195
Pasting Objects into the Viewer . . . . . . . . . . . . . . . . . . . . . . . 195
Paste Special. . . . . . . . . . . . . . . . . . . . . . . . . . . . . . . 195
Pasting Objects from Other Applications into the Viewer . . . . . 196
Export Output . . . . . . . . . . . . . . . . . . . . . . . . . . . . . . . . . 196
Exporting Output . . . . . . . . . . . . . . . . . . . . . . . . . . . . . 198
HTML, Word/RTF, and Excel Options . . . . . . . . . . . . . . . . . 199
Text Options . . . . . . . . . . . . . . . . . . . . . . . . . . . . . . . 200
Chart Size . . . . . . . . . . . . . . . . . . . . . . . . . . . . . . . . . 201
JPEG Chart Export Options . . . . . . . . . . . . . . . . . . . . . . . 202
BMP and PICT Chart Export Options . . . . . . . . . . . . . . . . . 203
PNG and TIFF Chart Export Options . . . . . . . . . . . . . . . . . . 203
EPS Chart Export Options . . . . . . . . . . . . . . . . . . . . . . . . 204
xv
Page 16

WMF Chart Export Options . . . . . . . . . . . . . . . . . . . . . . 205
Setting Chart Export Options . . . . . . . . . . . . . . . . . . . . . 205
Viewer Printing . . . . . . . . . . . . . . . . . . . . . . . . . . . . . . . . 205
Printing Output and Charts . . . . . . . . . . . . . . . . . . . . . . 206
Print Preview . . . . . . . . . . . . . . . . . . . . . . . . . . . . . . 206
Page Setup . . . . . . . . . . . . . . . . . . . . . . . . . . . . . . . 208
Saving Output. . . . . . . . . . . . . . . . . . . . . . . . . . . . . . . . . 212
Saving a Viewer Document . . . . . . . . . . . . . . . . . . . . . . 212
Save With Password Option. . . . . . . . . . . . . . . . . . . . . . 212
10 Draft Viewer 213
Draft Viewer Output . . . . . . . . . . . . . . . . . . . . . . . . . . . . . 213
To Create Draft Output . . . . . . . . . . . . . . . . . . . . . . . . . 214
Controlling Draft Output Format . . . . . . . . . . . . . . . . . . . . . . 215
To Set Draft Viewer Options. . . . . . . . . . . . . . . . . . . . . . 219
Fonts in Draft Output . . . . . . . . . . . . . . . . . . . . . . . . . . . . . 219
To Change Fonts in Draft Viewer . . . . . . . . . . . . . . . . . . . 219
Printing Draft Output. . . . . . . . . . . . . . . . . . . . . . . . . . . . . 220
Draft Viewer Print Preview . . . . . . . . . . . . . . . . . . . . . . . . . 220
To View Draft Viewer Print Preview . . . . . . . . . . . . . . . . . 221
Saving Draft Viewer Output. . . . . . . . . . . . . . . . . . . . . . . . . 221
To Save Draft Output as Text . . . . . . . . . . . . . . . . . . . . . 221
11 Pivot Tables 223
Manipulating a Pivot Table . . . . . . . . . . . . . . . . . . . . . . . . . 223
Working with Layers . . . . . . . . . . . . . . . . . . . . . . . . . . . . . 228
Bookmarks . . . . . . . . . . . . . . . . . . . . . . . . . . . . . . . . . . 231
Showing and Hiding Cells . . . . . . . . . . . . . . . . . . . . . . . . . . 233
Editing Results . . . . . . . . . . . . . . . . . . . . . . . . . . . . . . . . 234
xvi
Page 17

Changing the Appearance of Tables . . . . . . . . . . . . . . . . . 235
Table Properties . . . . . . . . . . . . . . . . . . . . . . . . . . . . . 237
Font . . . . . . . . . . . . . . . . . . . . . . . . . . . . . . . . . . . . 244
Set Data Cell Widths. . . . . . . . . . . . . . . . . . . . . . . . . . . 245
Cell Properties . . . . . . . . . . . . . . . . . . . . . . . . . . . . . . 246
Footnote Marker . . . . . . . . . . . . . . . . . . . . . . . . . . . . . 250
Selecting Rows and Columns in Pivot Tables . . . . . . . . . . . . 251
Modifying Pivot Table Results . . . . . . . . . . . . . . . . . . . . . 252
Printing Pivot Tables . . . . . . . . . . . . . . . . . . . . . . . . . . . . . 253
Controlling Table Breaks for Wide and Long Tables . . . . . . . . 254
12 Working with Command Syntax 257
Command Syntax Rules . . . . . . . . . . . . . . . . . . . . . . . . . . . 257
Creating Command Syntax from Dialog Boxes . . . . . . . . . . . . . . 259
To Paste Command Syntax from a Dialog Box . . . . . . . . . . . . 259
Using Syntax from the Output Log. . . . . . . . . . . . . . . . . . . . . . 260
Using Syntax from the Journal File . . . . . . . . . . . . . . . . . . . . . 261
To Run Command Syntax. . . . . . . . . . . . . . . . . . . . . . . . . . . 263
Execute Command . . . . . . . . . . . . . . . . . . . . . . . . . . . . . . 263
13 Frequencies 265
Sample Output. . . . . . . . . . . . . . . . . . . . . . . . . . . . . . . . . 266
To Obtain Frequencies and Statistics. . . . . . . . . . . . . . . . . . . . 267
Frequencies Statistics. . . . . . . . . . . . . . . . . . . . . . . . . . 268
Frequencies Charts . . . . . . . . . . . . . . . . . . . . . . . . . . . 269
Frequencies Format . . . . . . . . . . . . . . . . . . . . . . . . . . . 270
xvii
Page 18

14 Descriptives 271
Sample Output . . . . . . . . . . . . . . . . . . . . . . . . . . . . . . . . 272
To Obtain Descriptive Statistics . . . . . . . . . . . . . . . . . . . . . . 272
Descriptives Options . . . . . . . . . . . . . . . . . . . . . . . . . . 273
15 Explore 275
Sample Output . . . . . . . . . . . . . . . . . . . . . . . . . . . . . . . . 276
To Explore Your Data . . . . . . . . . . . . . . . . . . . . . . . . . . . . 277
Explore Statistics . . . . . . . . . . . . . . . . . . . . . . . . . . . . 278
Explore Plots . . . . . . . . . . . . . . . . . . . . . . . . . . . . . . 279
Explore Options . . . . . . . . . . . . . . . . . . . . . . . . . . . . . 281
16 Crosstabs 283
Sample Output . . . . . . . . . . . . . . . . . . . . . . . . . . . . . . . . 284
To Obtain Crosstabulations . . . . . . . . . . . . . . . . . . . . . . . . . 284
Crosstabs Layers . . . . . . . . . . . . . . . . . . . . . . . . . . . . 285
Crosstabs Clustered Bar Charts . . . . . . . . . . . . . . . . . . . 286
Crosstabs Statistics . . . . . . . . . . . . . . . . . . . . . . . . . . 286
Crosstabs Cell Display . . . . . . . . . . . . . . . . . . . . . . . . . 288
Crosstabs Table Format . . . . . . . . . . . . . . . . . . . . . . . . 288
17 Summarize 289
Sample Output . . . . . . . . . . . . . . . . . . . . . . . . . . . . . . . . 290
To Obtain Case Summaries . . . . . . . . . . . . . . . . . . . . . . . . . 290
Summarize Options . . . . . . . . . . . . . . . . . . . . . . . . . . . 291
Summarize Statistics . . . . . . . . . . . . . . . . . . . . . . . . . . 292
xviii
Page 19

18 Means 293
Sample Output. . . . . . . . . . . . . . . . . . . . . . . . . . . . . . . . . 294
To Obtain Means . . . . . . . . . . . . . . . . . . . . . . . . . . . . . . . 295
Means Options . . . . . . . . . . . . . . . . . . . . . . . . . . . . . . 296
19 OLAP Cubes 297
Sample Output. . . . . . . . . . . . . . . . . . . . . . . . . . . . . . . . . 298
To Obtain OLAP Cubes . . . . . . . . . . . . . . . . . . . . . . . . . . . . 299
OLAP Cubes Statistics. . . . . . . . . . . . . . . . . . . . . . . . . . 300
OLAP Cubes Differences . . . . . . . . . . . . . . . . . . . . . . . . 301
OLAP Cubes Title. . . . . . . . . . . . . . . . . . . . . . . . . . . . . 302
20 T Tests 303
Independent-Samples T Test . . . . . . . . . . . . . . . . . . . . . . . . 303
Sample Output. . . . . . . . . . . . . . . . . . . . . . . . . . . . . . . . . 304
To Obtain an Independent-Samples T Test . . . . . . . . . . . . . . . . 305
Independent-Samples T Test Define Groups. . . . . . . . . . . . . 306
Independent-Samples T Test Options . . . . . . . . . . . . . . . . . 307
Paired-Samples T Test . . . . . . . . . . . . . . . . . . . . . . . . . . . . 307
Sample Output. . . . . . . . . . . . . . . . . . . . . . . . . . . . . . . . . 308
To Obtain a Paired-Samples T Test . . . . . . . . . . . . . . . . . . . . . 309
Paired-Samples T Test Options . . . . . . . . . . . . . . . . . . . . 310
One-Sample T Test . . . . . . . . . . . . . . . . . . . . . . . . . . . . . . 310
Sample Output. . . . . . . . . . . . . . . . . . . . . . . . . . . . . . . . . 311
To Obtain a One-Sample T Test . . . . . . . . . . . . . . . . . . . . . . . 312
One-Sample T Test Options. . . . . . . . . . . . . . . . . . . . . . . 312
xix
Page 20

21 One-Way Analysis of Variance 315
Sample Output . . . . . . . . . . . . . . . . . . . . . . . . . . . . . . . . 316
To Obtain a One-Way Analysis of Variance. . . . . . . . . . . . . . . . 317
One-Way ANOVA Contrasts. . . . . . . . . . . . . . . . . . . . . . 318
One-Way ANOVA Post Hoc Tests . . . . . . . . . . . . . . . . . . 319
One-Way ANOVA Options . . . . . . . . . . . . . . . . . . . . . . . 320
22 GLM Univariate Analysis 323
Sample Output . . . . . . . . . . . . . . . . . . . . . . . . . . . . . . . . 325
To Obtain a GLM Univariate Analysis . . . . . . . . . . . . . . . . . . . 326
GLM Univariate Model . . . . . . . . . . . . . . . . . . . . . . . . . 327
GLM Univariate Contrasts . . . . . . . . . . . . . . . . . . . . . . . 329
GLM Univariate Profile Plots . . . . . . . . . . . . . . . . . . . . . 331
GLM Univariate Post Hoc Multiple Comparisons for
Observed Means . . . . . . . . . . . . . . . . . . . . . . . . . . . . 332
GLM Univariate Save. . . . . . . . . . . . . . . . . . . . . . . . . . 335
GLM Univariate Options . . . . . . . . . . . . . . . . . . . . . . . . 336
UNIANOVA Command Additional Features . . . . . . . . . . . . . 337
23 Bivariate Correlations 339
Sample Output . . . . . . . . . . . . . . . . . . . . . . . . . . . . . . . . 340
To Obtain Bivariate Correlations . . . . . . . . . . . . . . . . . . . . . . 341
Bivariate Correlations Options . . . . . . . . . . . . . . . . . . . . 342
CORRELATIONS and NONPAR CORR Command
Additional Features. . . . . . . . . . . . . . . . . . . . . . . . . . . 343
xx
Page 21

24 Partial Correlations 345
Sample Output. . . . . . . . . . . . . . . . . . . . . . . . . . . . . . . . . 346
To Obtain Partial Correlations . . . . . . . . . . . . . . . . . . . . . . . . 347
Partial Correlations Options . . . . . . . . . . . . . . . . . . . . . . 348
25 Distances 349
To Obtain a Distance Matrix . . . . . . . . . . . . . . . . . . . . . . . . . 350
Distances Dissimilarity Measures . . . . . . . . . . . . . . . . . . . . . 351
Distances Similarity Measures . . . . . . . . . . . . . . . . . . . . . . . 352
26 Linear Regression 353
Sample Output. . . . . . . . . . . . . . . . . . . . . . . . . . . . . . . . . 354
To Obtain a Linear Regression Analysis . . . . . . . . . . . . . . . . . . 356
Linear Regression Variable Selection Methods . . . . . . . . . . . 357
Linear Regression Set Rule . . . . . . . . . . . . . . . . . . . . . . 358
Linear Regression Plots . . . . . . . . . . . . . . . . . . . . . . . . 358
Linear Regression Save . . . . . . . . . . . . . . . . . . . . . . . . . 359
Linear Regression Statistics . . . . . . . . . . . . . . . . . . . . . . 360
Linear Regression Options . . . . . . . . . . . . . . . . . . . . . . . 362
27 Curve Estimation 363
Sample Output. . . . . . . . . . . . . . . . . . . . . . . . . . . . . . . . . 364
To Obtain a Curve Estimation . . . . . . . . . . . . . . . . . . . . . . . . 365
Curve Estimation Models . . . . . . . . . . . . . . . . . . . . . . . . 366
Curve Estimation Save . . . . . . . . . . . . . . . . . . . . . . . . . 367
xxi
Page 22

28 Discriminant Analysis 369
Sample Output . . . . . . . . . . . . . . . . . . . . . . . . . . . . . . . . 370
To Obtain a Discriminant Analysis . . . . . . . . . . . . . . . . . . . . . 371
Discriminant Analysis Define Range . . . . . . . . . . . . . . . . . 372
Discriminant Analysis Select Cases . . . . . . . . . . . . . . . . . 372
Discriminant Analysis Statistics . . . . . . . . . . . . . . . . . . . 373
Discriminant Analysis Stepwise Method . . . . . . . . . . . . . . 373
Discriminant Analysis Classification . . . . . . . . . . . . . . . . . 374
Discriminant Analysis Save . . . . . . . . . . . . . . . . . . . . . . 375
29 Factor Analysis 377
Sample Output . . . . . . . . . . . . . . . . . . . . . . . . . . . . . . . . 379
To Obtain a Factor Analysis. . . . . . . . . . . . . . . . . . . . . . . . . 382
Factor Analysis Select Cases . . . . . . . . . . . . . . . . . . . . . 382
Factor Analysis Descriptives . . . . . . . . . . . . . . . . . . . . . 383
To Specify Descriptive Statistics and
Correlation Coefficients . . . . . . . . . . . . . . . . . . . . . . . . . . . 384
Factor Analysis Extraction. . . . . . . . . . . . . . . . . . . . . . . 384
To Specify Extraction Options . . . . . . . . . . . . . . . . . . . . . . . 385
Factor Analysis Rotation . . . . . . . . . . . . . . . . . . . . . . . . 385
To Specify Rotation Options . . . . . . . . . . . . . . . . . . . . . . . . 386
Factor Analysis Scores . . . . . . . . . . . . . . . . . . . . . . . . 386
To Specify Factor Score Options. . . . . . . . . . . . . . . . . . . . . . 386
Factor Analysis Options . . . . . . . . . . . . . . . . . . . . . . . . 387
To Specify Factor Analysis Options . . . . . . . . . . . . . . . . . . . . 387
xxii
Page 23

30 Choosing a Procedure for Clustering 389
31 TwoStep Cluster Analysis 391
To Obtain a TwoStep Cluster Analysis . . . . . . . . . . . . . . . . . . . 393
TwoStep Cluster Analysis Options. . . . . . . . . . . . . . . . . . . 394
TwoStep Cluster Analysis Plots . . . . . . . . . . . . . . . . . . . . 397
TwoStep Cluster Analysis Output . . . . . . . . . . . . . . . . . . . 398
32 Hierarchical Cluster Analysis 401
Sample Output. . . . . . . . . . . . . . . . . . . . . . . . . . . . . . . . . 402
To Obtain a Hierarchical Cluster Analysis . . . . . . . . . . . . . . . . . 405
Hierarchical Cluster Analysis Method . . . . . . . . . . . . . . . . 406
Hierarchical Cluster Analysis Statistics. . . . . . . . . . . . . . . . 407
Hierarchical Cluster Analysis Plots . . . . . . . . . . . . . . . . . . 408
Hierarchical Cluster Analysis Save New Variables . . . . . . . . . 408
33 K-Means Cluster Analysis 409
Sample Output. . . . . . . . . . . . . . . . . . . . . . . . . . . . . . . . . 410
To Obtain a K-Means Cluster Analysis . . . . . . . . . . . . . . . . . . . 413
K-Means Cluster Analysis Efficiency . . . . . . . . . . . . . . . . . 414
K-Means Cluster Analysis Iterate . . . . . . . . . . . . . . . . . . . 414
K-Means Cluster Analysis Save . . . . . . . . . . . . . . . . . . . . 415
K-Means Cluster Analysis Options . . . . . . . . . . . . . . . . . . 415
xxiii
Page 24

34 Nonparametric Tests 417
Chi-Square Test . . . . . . . . . . . . . . . . . . . . . . . . . . . . . . . 418
Sample Output . . . . . . . . . . . . . . . . . . . . . . . . . . . . . . . . 419
To Obtain a Chi-Square Test . . . . . . . . . . . . . . . . . . . . . . . . 420
Chi-Square Test Expected Range and Expected Values. . . . . . 421
Chi-Square Test Options . . . . . . . . . . . . . . . . . . . . . . . . 421
NPAR TESTS Command
Additional Features (Chi-Square Test) . . . . . . . . . . . . . . . . 422
Binomial Test . . . . . . . . . . . . . . . . . . . . . . . . . . . . . . . . . 422
Sample Output . . . . . . . . . . . . . . . . . . . . . . . . . . . . . . . . 423
To Obtain a Binomial Test. . . . . . . . . . . . . . . . . . . . . . . . . . 424
Binomial Test Options . . . . . . . . . . . . . . . . . . . . . . . . . 424
NPAR TESTS Command
Additional Features (Binomial Test) . . . . . . . . . . . . . . . . . 425
Runs Test . . . . . . . . . . . . . . . . . . . . . . . . . . . . . . . . . . . 425
Sample Output . . . . . . . . . . . . . . . . . . . . . . . . . . . . . . . . 426
To Obtain a Runs Test . . . . . . . . . . . . . . . . . . . . . . . . . . . . 427
Runs Test Cut Point. . . . . . . . . . . . . . . . . . . . . . . . . . . 427
Runs Test Options . . . . . . . . . . . . . . . . . . . . . . . . . . . 428
NPAR TESTS Command Additional Features (Runs Test) . . . . . 428
One-Sample Kolmogorov-Smirnov Test . . . . . . . . . . . . . . . . . . 429
Sample Output . . . . . . . . . . . . . . . . . . . . . . . . . . . . . . . . 430
To Obtain a One-Sample Kolmogorov-Smirnov Test. . . . . . . . . . . 430
One-Sample Kolmogorov-Smirnov Test Options . . . . . . . . . . 431
NPAR TESTS Command
Additional Features (One-Sample Kolmogorov-Smirnov Test) . . 432
Two-Independent-Samples Tests . . . . . . . . . . . . . . . . . . . . . 432
Sample Output . . . . . . . . . . . . . . . . . . . . . . . . . . . . . . . . 433
To Obtain Two-Independent-Samples Tests . . . . . . . . . . . . . . . 434
Two-Independent-Samples Test Types . . . . . . . . . . . . . . . 434
Two-Independent-Samples Tests Define Groups . . . . . . . . . 435
Two-Independent-Samples Tests Options . . . . . . . . . . . . . 436
xxiv
Page 25

NPAR TESTS Command
Additional Features (Two Independent Samples) . . . . . . . . . . 436
Tests for Several Independent Samples . . . . . . . . . . . . . . . . . . 437
Sample Output. . . . . . . . . . . . . . . . . . . . . . . . . . . . . . . . . 437
To Obtain Tests for Several Independent Samples . . . . . . . . . . . . 438
Several-Independent-Samples Test Types . . . . . . . . . . . . . . 438
Tests for Several Independent Samples Define Range . . . . . . . 439
Tests for Several Independent Samples Options . . . . . . . . . . 439
NPAR TESTS Command
Additional Features (K Independent Samples) . . . . . . . . . . . . 440
Two-Related-Samples Tests . . . . . . . . . . . . . . . . . . . . . . . . . 440
Sample Output. . . . . . . . . . . . . . . . . . . . . . . . . . . . . . . . . 441
To Obtain Two-Related-Samples Tests. . . . . . . . . . . . . . . . . . . 442
Two-Related-Samples Test Types. . . . . . . . . . . . . . . . . . . 442
Two-Related-Samples Tests Options . . . . . . . . . . . . . . . . . 443
NPAR TESTS Command
Additional Features (Two Related Samples) . . . . . . . . . . . . . 444
Tests for Several Related Samples . . . . . . . . . . . . . . . . . . . . . 444
Sample Output. . . . . . . . . . . . . . . . . . . . . . . . . . . . . . . . . 444
To Obtain Tests for Several Related Samples . . . . . . . . . . . . . . . 445
Tests for Several Related Samples Test Types . . . . . . . . . . . 446
Tests for Several Related Samples Statistics . . . . . . . . . . . . 446
NPAR TESTS Command
Additional Features (K Related Samples) . . . . . . . . . . . . . . . 446
35 Multiple Response Analysis 447
Multiple Response Define Sets . . . . . . . . . . . . . . . . . . . . . . . 448
To Define Multiple Response Sets . . . . . . . . . . . . . . . . . . . . . 449
Multiple Response Frequencies. . . . . . . . . . . . . . . . . . . . . . . 450
Sample Output. . . . . . . . . . . . . . . . . . . . . . . . . . . . . . . . . 451
To Obtain Multiple Response Frequencies. . . . . . . . . . . . . . . . . 451
Multiple Response Crosstabs . . . . . . . . . . . . . . . . . . . . . . . . 452
xxv
Page 26

Sample Output . . . . . . . . . . . . . . . . . . . . . . . . . . . . . . . . 453
To Obtain Multiple Response Crosstabs . . . . . . . . . . . . . . . . . 454
Multiple Response Crosstabs Define Variable Ranges . . . . . . 454
Multiple Response Crosstabs Options . . . . . . . . . . . . . . . . 455
MULT RESPONSE Command Additional Features . . . . . . . . . 456
36 Reporting Results 457
Report Summaries in Rows . . . . . . . . . . . . . . . . . . . . . . . . . 457
Sample Output . . . . . . . . . . . . . . . . . . . . . . . . . . . . . 458
To Obtain a Summary Report: Summaries in Rows. . . . . . . . . 459
Report Column Format . . . . . . . . . . . . . . . . . . . . . . . . . 460
Report Summary Lines . . . . . . . . . . . . . . . . . . . . . . . . . 461
Report Break Options . . . . . . . . . . . . . . . . . . . . . . . . . 462
Report Options . . . . . . . . . . . . . . . . . . . . . . . . . . . . . 462
Report Layout . . . . . . . . . . . . . . . . . . . . . . . . . . . . . . 463
Report Titles. . . . . . . . . . . . . . . . . . . . . . . . . . . . . . . 464
Report Summaries in Columns . . . . . . . . . . . . . . . . . . . . . . . 465
Sample Output . . . . . . . . . . . . . . . . . . . . . . . . . . . . . 466
To Obtain a Summary Report: Summaries in Columns . . . . . . . 466
Report Summary Lines . . . . . . . . . . . . . . . . . . . . . . . . . 467
Total Summary Column . . . . . . . . . . . . . . . . . . . . . . . . 468
Report Column Format . . . . . . . . . . . . . . . . . . . . . . . . . 469
Report Break Options for Summaries in Columns . . . . . . . . . 469
Report Options for Summaries in Columns . . . . . . . . . . . . . 470
Report Layout for Summaries in Columns . . . . . . . . . . . . . . 470
REPORT Command Additional Features . . . . . . . . . . . . . . . 471
xxvi
Page 27

37 Reliability Analysis 473
Sample Output. . . . . . . . . . . . . . . . . . . . . . . . . . . . . . . . . 474
To Obtain a Reliability Analysis . . . . . . . . . . . . . . . . . . . . . . . 475
Reliability Analysis Statistics. . . . . . . . . . . . . . . . . . . . . . 476
RELIABILITY Command Additional Features . . . . . . . . . . . . . 477
38 Multidimensional Scaling 479
To Obtain a Multidimensional Scaling Analysis . . . . . . . . . . . . . . 480
Multidimensional Scaling Shape of Data . . . . . . . . . . . . . . . 481
Multidimensional Scaling Create Measure. . . . . . . . . . . . . . 482
Multidimensional Scaling Model. . . . . . . . . . . . . . . . . . . . 483
Multidimensional Scaling Options . . . . . . . . . . . . . . . . . . . 484
Multidimensional Scaling Command Additional Features . . . . . 485
39 Ratio Statistics 487
To Obtain Ratio Statistics . . . . . . . . . . . . . . . . . . . . . . . . . . 488
Ratio Statistics . . . . . . . . . . . . . . . . . . . . . . . . . . . . . . 489
40 Overview of the Chart Facility 491
Creating and Modifying a Chart . . . . . . . . . . . . . . . . . . . . . . . 491
Creating the Chart . . . . . . . . . . . . . . . . . . . . . . . . . . . . 491
Modifying the Chart . . . . . . . . . . . . . . . . . . . . . . . . . . . 494
Chart Definition Global Options . . . . . . . . . . . . . . . . . . . . . . . 495
Titles, Subtitles, and Footnotes. . . . . . . . . . . . . . . . . . . . . 496
Options . . . . . . . . . . . . . . . . . . . . . . . . . . . . . . . . . . 497
Chart Templates . . . . . . . . . . . . . . . . . . . . . . . . . . . . . 500
xxvii
Page 28

41 ROC Curves 503
Sample Output . . . . . . . . . . . . . . . . . . . . . . . . . . . . . . . . 504
Obtaining an ROC Curve . . . . . . . . . . . . . . . . . . . . . . . . . . . 505
ROC Curve Options . . . . . . . . . . . . . . . . . . . . . . . . . . . 506
42 Utilities 507
Variable Information . . . . . . . . . . . . . . . . . . . . . . . . . . . . . 507
To Obtain Variable Information . . . . . . . . . . . . . . . . . . . . 508
Variable Sets . . . . . . . . . . . . . . . . . . . . . . . . . . . . . . . . . 508
To Define Variable Sets . . . . . . . . . . . . . . . . . . . . . . . . 509
Use Sets . . . . . . . . . . . . . . . . . . . . . . . . . . . . . . . . . 510
Reordering Target Variable Lists . . . . . . . . . . . . . . . . . . . . . . 511
43 Options 513
General Options . . . . . . . . . . . . . . . . . . . . . . . . . . . . . . . 514
Viewer Options . . . . . . . . . . . . . . . . . . . . . . . . . . . . . . . . 516
Draft Viewer Options. . . . . . . . . . . . . . . . . . . . . . . . . . . . . 517
Output Label Options. . . . . . . . . . . . . . . . . . . . . . . . . . . . . 519
Chart Options . . . . . . . . . . . . . . . . . . . . . . . . . . . . . . . . . 520
Interactive Chart Options . . . . . . . . . . . . . . . . . . . . . . . . . . 521
Pivot Table Options . . . . . . . . . . . . . . . . . . . . . . . . . . . . . 522
Data Options . . . . . . . . . . . . . . . . . . . . . . . . . . . . . . . . . 524
Currency Options. . . . . . . . . . . . . . . . . . . . . . . . . . . . . . . 525
To Create Custom Currency Formats . . . . . . . . . . . . . . . . . 526
Script Options. . . . . . . . . . . . . . . . . . . . . . . . . . . . . . . . . 526
To Specify Global Procedure File and Autoscript File . . . . . . . 527
xxviii
Page 29

44 Customizing Menus and Toolbars 529
Menu Editor . . . . . . . . . . . . . . . . . . . . . . . . . . . . . . . . . . 529
To Add Items to the Menus . . . . . . . . . . . . . . . . . . . . . . . 529
Customizing Toolbars . . . . . . . . . . . . . . . . . . . . . . . . . . . . . 530
To Customize Toolbars . . . . . . . . . . . . . . . . . . . . . . . . . 531
45 Production Facility 537
Syntax Rules for the Production Facility . . . . . . . . . . . . . . . . . . 538
Export Options. . . . . . . . . . . . . . . . . . . . . . . . . . . . . . . . . 540
User Prompts . . . . . . . . . . . . . . . . . . . . . . . . . . . . . . . . . 542
Production Macro Prompting . . . . . . . . . . . . . . . . . . . . . . . . 544
Production Options . . . . . . . . . . . . . . . . . . . . . . . . . . . . . . 544
Changing Production Options . . . . . . . . . . . . . . . . . . . . . 545
Format Control for Production Jobs. . . . . . . . . . . . . . . . . . . . . 545
Creating a Custom Default TableLook. . . . . . . . . . . . . . . . . 546
Setting Options for Production Jobs. . . . . . . . . . . . . . . . . . 547
Controlling Pivot Table Format with Command Syntax . . . . . . . 547
Running Production Jobs from a Command Line . . . . . . . . . . . . . 548
Publish to Web . . . . . . . . . . . . . . . . . . . . . . . . . . . . . . . . 549
SmartViewer Web Server Login . . . . . . . . . . . . . . . . . . . . 550
46 Scripting Facility 551
To Run a Script . . . . . . . . . . . . . . . . . . . . . . . . . . . . . . . . 552
Autoscripts . . . . . . . . . . . . . . . . . . . . . . . . . . . . . . . . . . . 553
Creating and Editing Scripts . . . . . . . . . . . . . . . . . . . . . . . . . 555
To Edit a Script . . . . . . . . . . . . . . . . . . . . . . . . . . . . . . 556
Script Window . . . . . . . . . . . . . . . . . . . . . . . . . . . . . . 556
xxix
Page 30

Starter Scripts. . . . . . . . . . . . . . . . . . . . . . . . . . . . . . 558
Creating Autoscripts . . . . . . . . . . . . . . . . . . . . . . . . . . 560
How Scripts Work . . . . . . . . . . . . . . . . . . . . . . . . . . . . . . 564
Declaring Variables . . . . . . . . . . . . . . . . . . . . . . . . . . 565
Getting Automation Objects . . . . . . . . . . . . . . . . . . . . . . 566
Properties and Methods . . . . . . . . . . . . . . . . . . . . . . . . 568
The Object Browser . . . . . . . . . . . . . . . . . . . . . . . . . . 570
Procedures . . . . . . . . . . . . . . . . . . . . . . . . . . . . . . . . . . 571
To Add a New Procedure in a Script . . . . . . . . . . . . . . . . . 571
Global Procedures . . . . . . . . . . . . . . . . . . . . . . . . . . . 572
Adding a Description to a Script . . . . . . . . . . . . . . . . . . . . . . 573
Scripting Custom Dialog Boxes. . . . . . . . . . . . . . . . . . . . . . . 573
To Create a Custom Dialog Box . . . . . . . . . . . . . . . . . . . . 574
Dialog Monitor Functions (DialogFunc) . . . . . . . . . . . . . . . 575
Debugging Scripts . . . . . . . . . . . . . . . . . . . . . . . . . . . . . . 578
To Step through a Script . . . . . . . . . . . . . . . . . . . . . . . . 578
The Debugging Pane . . . . . . . . . . . . . . . . . . . . . . . . . . 579
Script Files and Syntax Files . . . . . . . . . . . . . . . . . . . . . . . . 580
Running Command Syntax from a Script. . . . . . . . . . . . . . . 580
Running a Script from Command Syntax. . . . . . . . . . . . . . . 582
Appendix A
Database Access Administrator 583
Appendix B
Customizing HTML Documents 585
To Add Customized HTML Code to Exported
Output Documents . . . . . . . . . . . . . . . . . . . . . . . . . . . 585
Content and Format of the Text File for Customized HTML . . . . 586
To Use a Different File or Location for Custom HTML Code . . . . 586
Index 589
xxx
Page 31

Overview
SPSS for Windows provides a powerful statistical analysis and data management
system in a graphical e nvironment, using descriptive menus and simple dialog boxes
to do most of the work for you. Most tasks can be accomplished simply by pointing
and clicking the mouse.
Chapter
1
In addition to the simple point-and-click interface for statistical analysis, SPSS for
Windows provides:
Data Editor. A versatile spreadsheet-like system for defining, entering, editing, and
displaying data.
Viewer. The Viewer makes it easy to browse your results, selectively show and hide
output, change the display order results, and move presentation-quality tables and
charts between SPSS and other applications.
Multidimensional pivot tables. Your results come alive with multidimensional pivot
tables. Explore your tables by rearranging rows, columns, and layers. Uncover
important findings that can get lost in standard reports. Compare groups easily by
splitting your table so that only one group is displayed at a time.
High-resolution graphics. High-resolution, full-color pie charts, bar charts,
histograms, scatterplots, 3-D graphics, and more are include d as st andard featu res in
SPSS.
Database access. Retrie v e i nformat ion fr om dat abases b y u sin g the Dat abase Wizard
instead of complicated SQL queries.
1
Page 32

2
Chapter 1
Data transformations. Transformation features help get your data ready for analysis.
You can easily subset data, combine categories, add, aggregate, merge, split, and
transpose files, and more.
Electronic distribution. Send e-mail reports to others wi th the click of a b utton, or exp ort
tables and charts in HTML format for Internet and intranet distribution.
Online Help. Detailed tutorials provide a comprehensive overview; context-sensitive
Help topics in dialog boxes guide you through specific tasks; pop-up definitions in
pivot table results explain statistical terms; the Sta tistics Coach helps you find the
procedures that you need; and Case Studie s provi de hands-on e xampl es of ho w to use
statistical proced ures and interpret the results.
What’s New in SPSS 11.5?
There are a number of new features in SPSS 11.5.
New data definition tools. Two new features make defining data faster and easier:
n The Copy Data Properti es wizard pr ovides the abi lity to use an externa l SPSS data
file as a template for defini ng f i le an d var iabl e pr oper t ie s in the worki ng data file.
You can also use variables in the working data file as templates for other variables
in the working data fil e. Copy Data Pr operties is av ailable o n the Data menu in the
Data Editor window. For more information, see “Copying Data Properties” in the
chapter Data Preparation.
n Define Variable Propertie s (also available on the Data menu in the Data Editor
window) scans your data and li sts all uniq ue data values for an y selected variables,
identifies unlabeled values , and pr ovides an auto-l abel feature . This i s particul arly
useful for categorical variables that use numeric cod es to represent categories—for
example, 0 = Male, 1 = Female. For more information, see “Defining Variable
Properties” in the chapter Data Preparation.
Expanded support for SAS format data files. You can now sav e data f iles in SAS version 6,
SAS version 7, and SAS Tr ansport f ile format. Fo r more information, see “Sa ving Data:
Data File Types” in the chapter Data Files.
Expanded output export capabilities. You can now export entire Viewer documents or
selected output objects in Word/RTF format and Excel format (charts are not included
in Excel format). For more information, see “Export Output” in the chapter Working
with Output.
Page 33

Overview
Multiple output languages. You can now produce pivot table output in different
languages and switch languages during the same session. For more information, see
“General Options” in the chapter Options.
TwoStep Cluster Analysis. This new clustering procedure offers the following features
not available in the other SPSS clustering procedures:
n Automatic s election of th e best number of clusters, in addition to me asures for
choosing between cluster models.
n Ability to create cluster models simultaneously based on categorical and
continuous variables.
n Ability to save the cluster model to an external XML file, then re ad that file and
update the cluster model using newer data.
n Ability to analyze large data files with a single clustering procedure.
For more information, see the chapter TwoStep Cluster Analysis.
New Custom Tables option. If you have used the Tables option in the past, you will
discover that almost everything is new in this release, including:
3
n A simple, drag-and-drop table builder interface that allows you to preview your
table as you select variables and options.
n A single, unified table builder interface instead of multiple menu choices and
dialog boxes for different types of tables.
n Subtotals for subsets of categories of a categorical variable.
n Custom control over category display order and ability to selectively show or hid e
categories.
Note: Custom Tables is not included in the SPSS Base system. It is only available if
you have purchased the Tables add-on option.
Page 34

4
Chapter 1
Windows
There are a number of different types of windows in SPSS:
Data Editor. This windo w displays the cont ents of the data f ile. You can create ne w data
files or modify existing ones with the Data Editor. The Data Editor window opens
automatically when you start an SPSS session. You can have only one dat a file open at
a time.
Viewer. All statistical results, tables, and charts are displayed in the Viewer. You can
edit the output and save it for later use. A V ie wer windo w opens automatically the f irst
time you run a procedure that generates output.
Draft Viewer. You can display output as simple text (ins tead of interact iv e pi vot tables)
in the Draft Viewer.
Pivot Table Editor. Output displayed in pivot tables can be modified in many ways with
the Pivot Table Editor. You can edit text, swap data in rows and columns, add color,
create multidimensional tables, and selectively hide and show results.
Chart Editor. You can modify high-resolution charts and plots in chart windows. You
can change the colors, select different type fonts or sizes, switch the horizontal and
vertical axes, rotate 3-D scatterplots, and even change the chart type.
Text Output Editor. Text output not displayed in pivot tables can be modified with the
T ext Output Ed itor . You can edit th e output and change font characteristi cs (type, style,
color, size).
Syntax Editor. You can paste your dialog box choi ces into a syntax wi ndow, where your
selections appear in the form of command syntax. You can then edit the command
syntax to use special features of SP SS not av ailable through dialog box es. Y ou can sa ve
these commands in a file for use in subsequent SPSS sessions.
Script Editor. Scripting and OLE automation allow you to customize and automate
many tasks in SPSS. Use the Script Editor to create and modify basic scripts.
Page 35
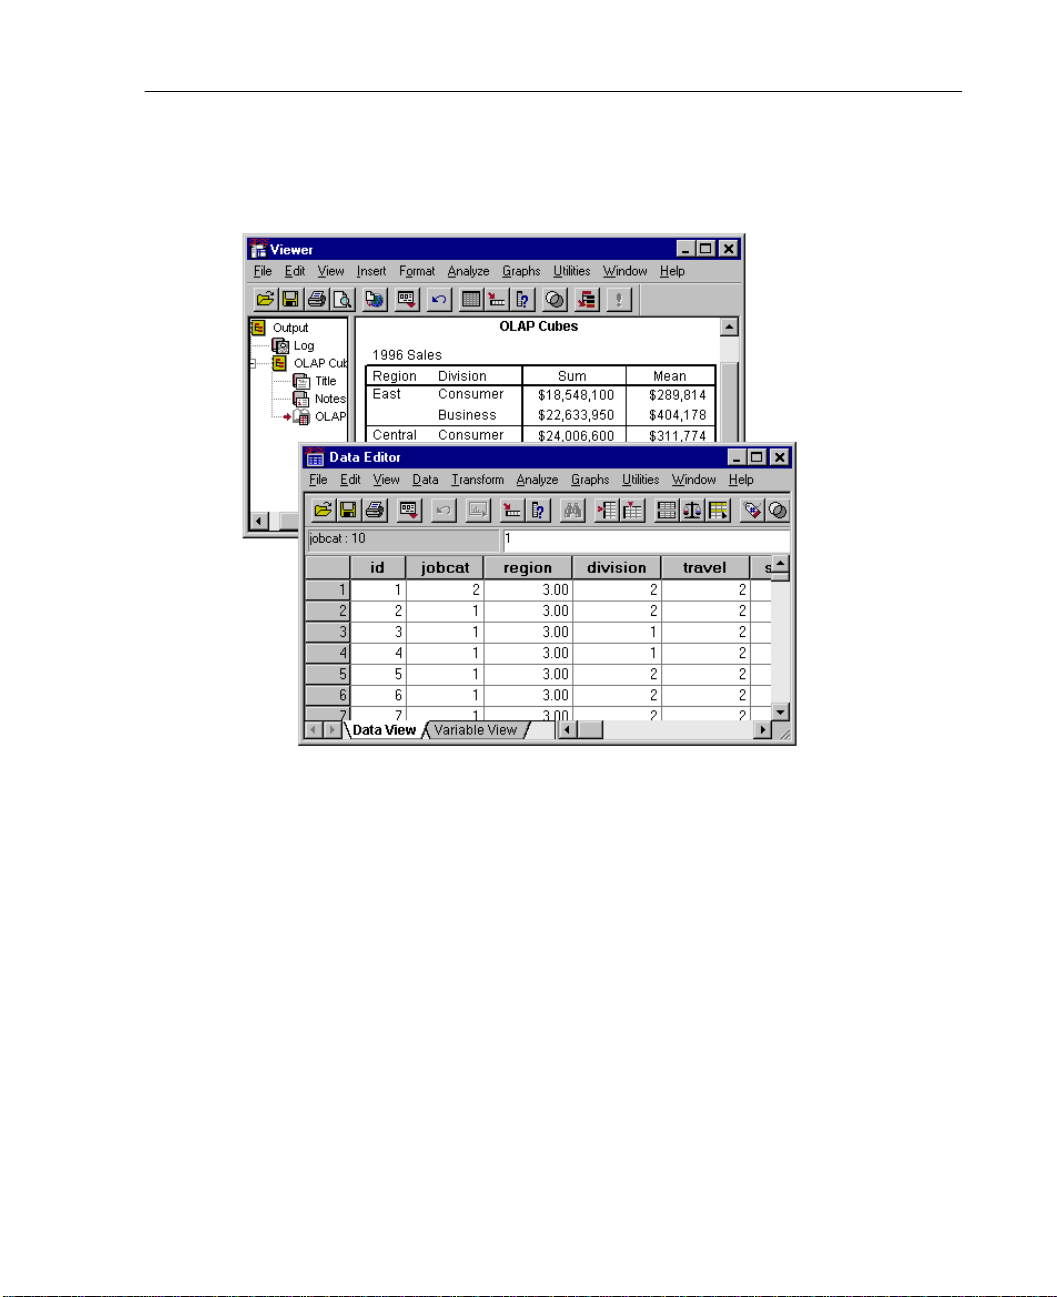
Figure 1-1
Data Editor and Viewer
5
Overview
Designated versus Active Window
If you have more than one open Viewer window, output is routed to the designated
Viewer window. If you have more than one open Syntax Editor window, command
syntax is pasted into the designated Syntax Editor window. The designated windows
are indicated by an exclamation point (!) in the status bar. You can change the
designated windows at any time.
The designated window should not be confused with the active window, which is
the currently selected window. If you have overlapping windows, the active window
appears in the foreground. If you open a new Syntax Editor or Viewer window, that
window automatically becomes the active window and the designated window.
Page 36
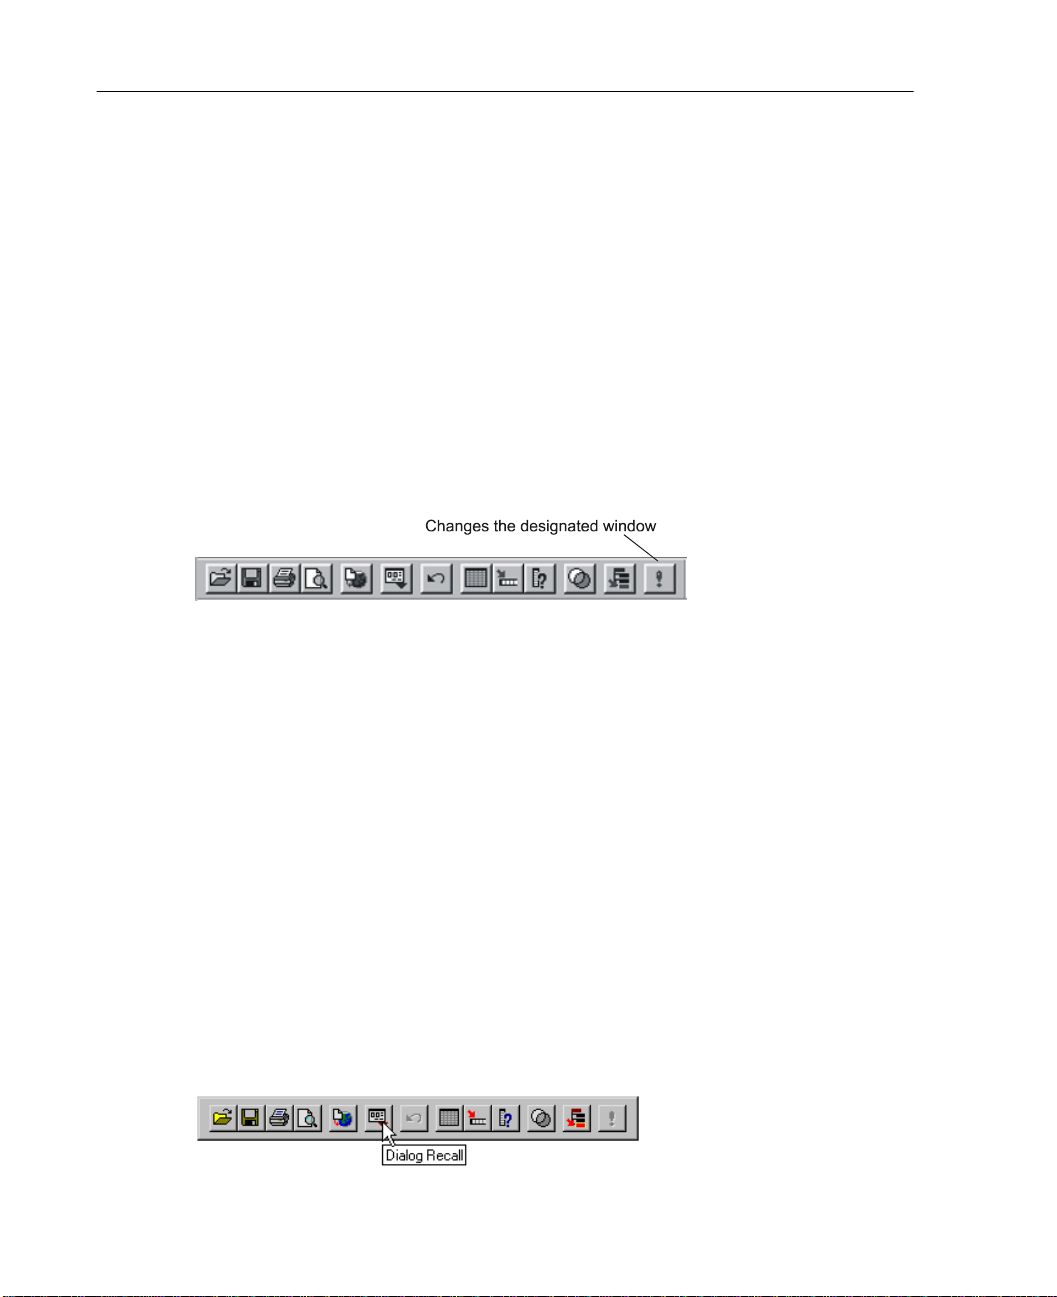
6
Chapter 1
Changing the Designated Window
Make the window that you want to designate th e active window (cl ick anywhere in t he
window).
Click the Designate Window tool on the tool bar (the one with th e exclamati on poin t).
or
From the menus choose:
Utilities
Designate Window
Figure 1-2
Designate Window tool
Menus
Many of the tasks that you want to perform with SPSS start with menu selections. Each
window in SPSS has its own menu bar with menu selections appropriate for that
window type.
generate new output without having to switch windows.
Toolbars
Each SPSS window has its own toolbar that provides quick, easy access to common
tasks. Some windows ha v e more than one toolbar. T oolT ips p rovide a br ief description
of each tool when you put the mouse pointer on the tool.
Figure 1-3
Toolbar with ToolTip Help
The Analyze and Graphs menus are available on all windows, making it easy to
Page 37

You can control the display of toolbars in several ways:
n Show or hide toolbars.
n Display toolbars verti cally or horizont ally, attached to t he left, right, t op, or bottom
of the window.
n Display toolbars as floating palettes anywhere inside or outside of the window.
n Customize toolbars to contain the features that you use most often, including
scripts.
Showing and Hiding Toolbars
From the menus choose:
View
Toolbars...
In the Show Toolbars dialog box, select the toolbars that you want to show (or hide).
Moving Toolbars
7
Overview
Click anywhere in the toolbar outside of the toolbar buttons.
Drag the toolbar to where you want it.
n Dragging the toolbar to the left or right side of the window attaches a toolbar
vertically to that side.
n Dragging the toolbar to the top or bottom of the window attaches the toolbar
horizontally.
n Dragging the toolbar an ywher e ot her t han t he wind ow borders creates a detached,
floating toolbar.
Page 38
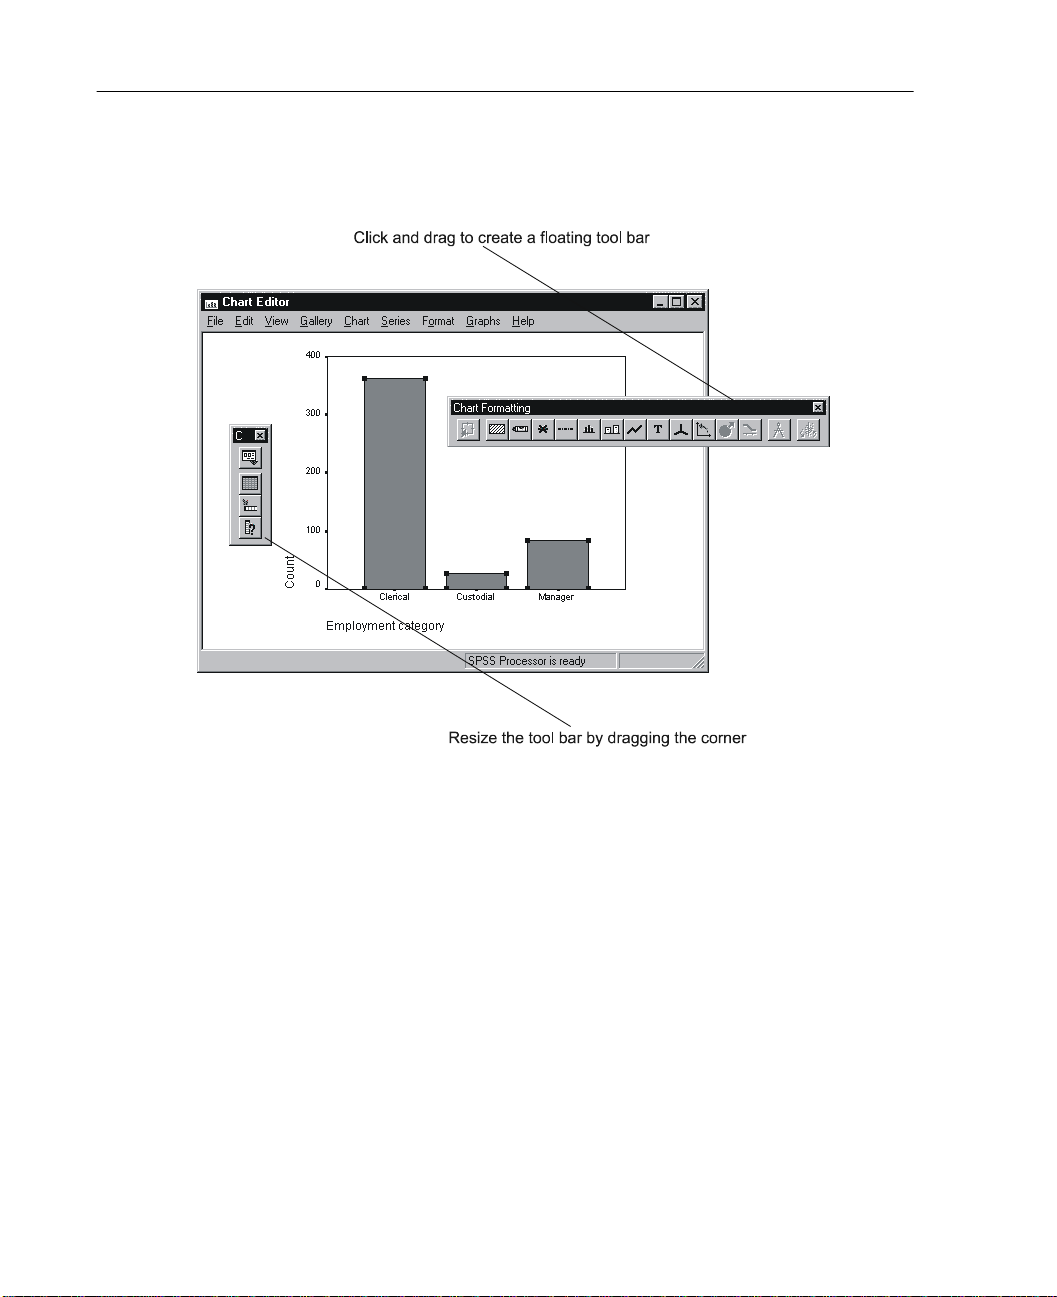
8
Chapter 1
Figure 1-4
Floating toolbars
Status Bar
The status bar at the bottom of each SPSS window pro vides the following informati on:
Command status. For each procedure or command that you run, a case counter indicat es
the number of cases processed so far. For statistical procedures that require iterative
processing, the number of iterations is displayed.
Filter status. If you have selected a rand om sample or a subset of cases for analysis, t he
message
all cases in the data file are included in the analysis.
Filter on indicates that some type of case filtering is curren tly in effect and not
Page 39

Weight status. The message Weight on indicates that a weight variable is being used to
weight cases for analysis.
Split File status. The message Split File on indicates that the data file has been split into
separate groups for analysis, based on the values of one or more grouping variables.
Showing and Hiding the Status Bar
From the menus choose:
View
Status Bar
Dialog Boxes
Most menu selections open dial og box es. You use d ialog boxes to select variables and
options for analysis.
Each main dialog box for statistical procedures and charts has several basic
components:
9
Overview
Source variable list. A list of variables in the working data file. Only variable types
allowed by the selected procedure are displayed in the source list. Use of short string
and long string variables is restricted in many procedures.
Target variable list(s). One or more lists indicating the variables that you have chosen
for the analysis, such as dependent and independent variable lists.
Command pushbuttons. Buttons that instruct the program to perform an action, such as
run the procedure, display Help, or open a subdialog box to make additional
specifications.
For informatio n on i ndividual controls in a dialo g box, click the control with the right
mouse button.
Page 40
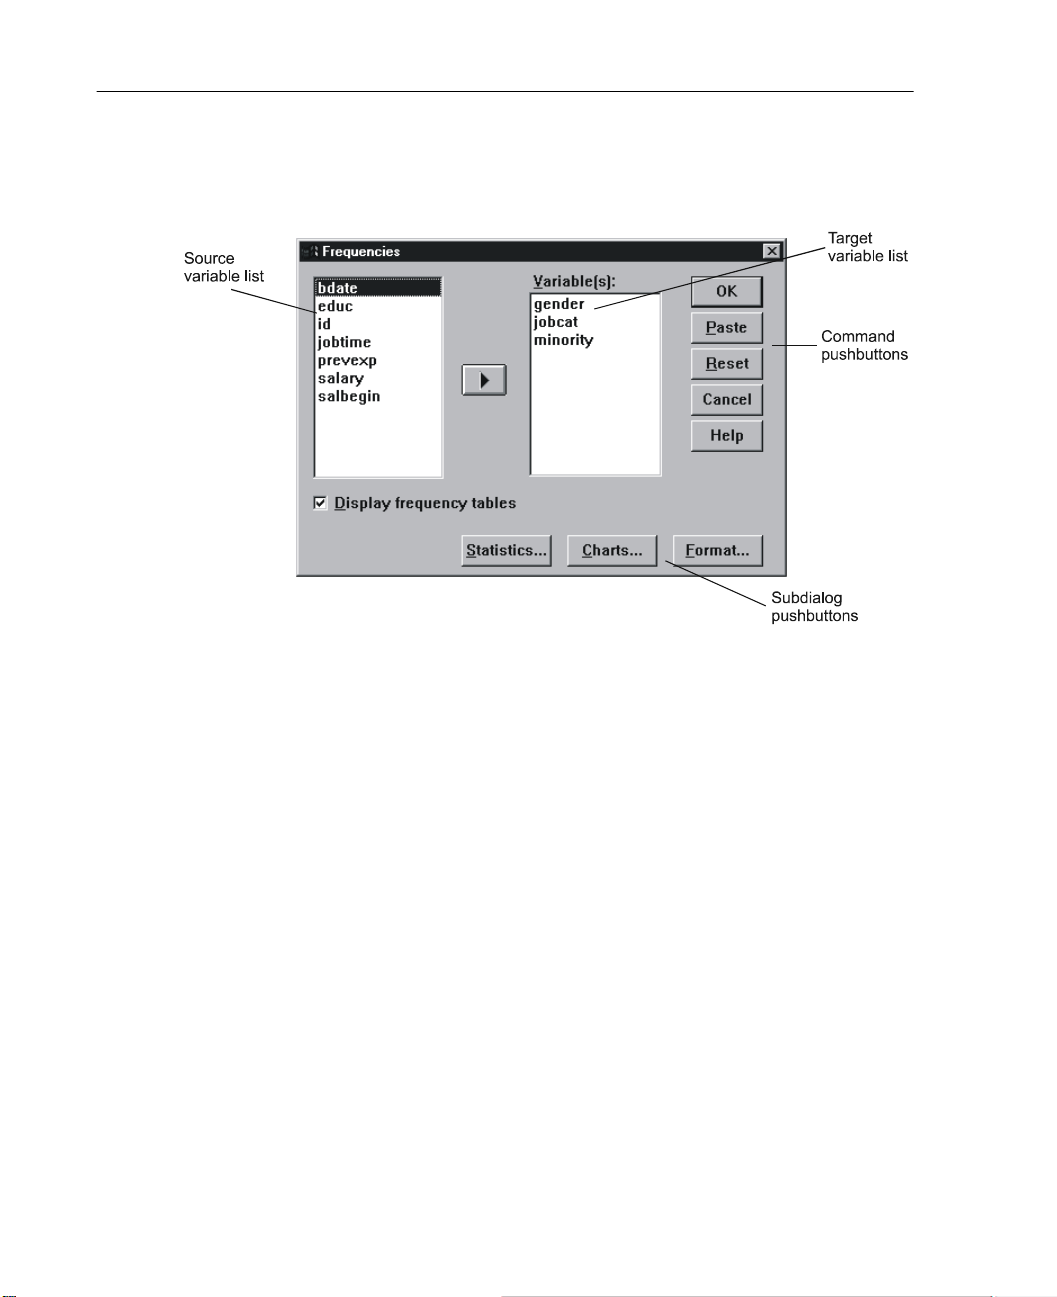
10
Chapter 1
Figure 1-5
Dialog box controls
Variable Names and Variable Labels in Dialog Box Lists
You can display either variable names or variable labels in dialog box lists. Since
variable names are limited to eight characters, variable labels often provide more
descriptive information.
n To control the display of variable names or labels, choose Options from the Edit
menu in any window.
n To define or modify variable labels, use Variable View in the Data Editor.
n For data imported from database sources, field names are used as variable labels.
n For long labels, position the mouse pointer over the label in the list to view the
entire label.
n If no variable label is defined, the variable name is displayed.
Page 41
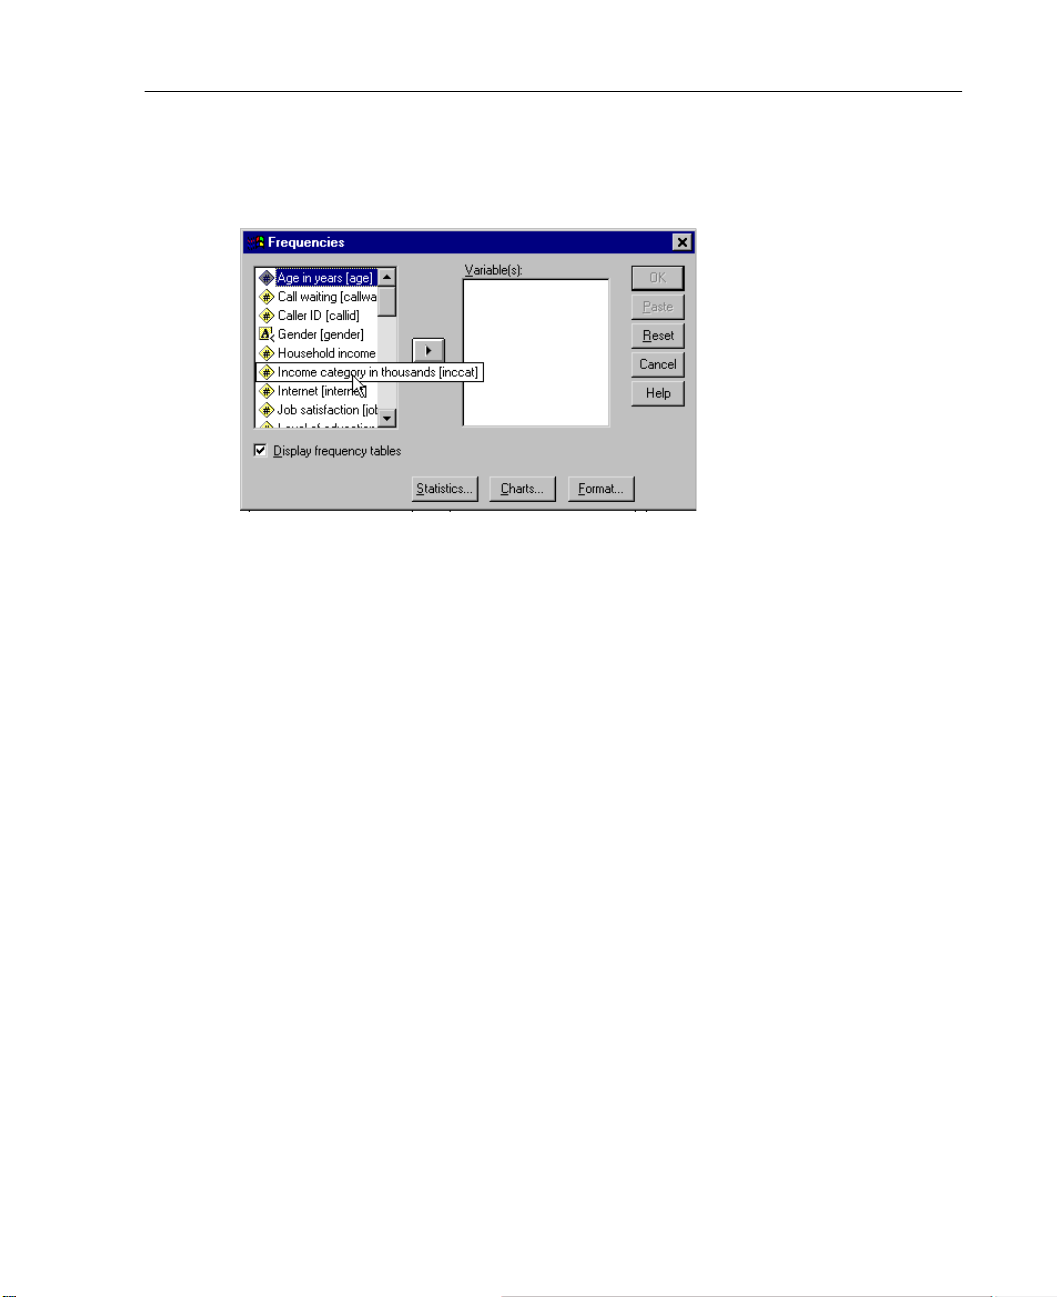
Figure 1-6
Variable labels displayed in a dialog box
Dialog Box Pushbuttons
There are five standard command pushbuttons in most dialog boxes:
11
Overview
OK. Runs the procedure. After you select your variables and choose any additional
specifications, click
OK to run the procedure. This also closes the dialog box.
Paste. Generates command syntax from the dialo g box selections and past es the syntax
into a syntax window. You can then customize the commands with addit ional fea tures
not availab le fro m dialo g box es.
Reset. Deselects any variables in the selected variable list(s) and resets all
specifications in the dialog box and any subdialog boxes to the default state.
Cancel. Cancels any changes in the di alog box settings since t he last time it was open ed
and closes the dialog bo x. W ithin a session, dialog box settings are pers istent. A dia log
box retains your last set of specifications until you override them.
Help. Context-sensiti ve Help. This t akes you to a standard Microso ft Help windo w that
contains information about th e current dia log box. You can also get help on indi vidual
dialog box controls by clicking the control with the right mouse button.
Page 42

12
Chapter 1
Subdialog Boxes
Since most procedures provide a great deal of flexibility, not all of the possible choices
can be contained in a single dialog box. The main dialog box usually contains the
minimum information requi red to ru n a procedure. Additional speci f ications ar e made
in subdialog boxes.
In the main dialog box, pushbutt ons with an ellipsis (. ..) after the name indicate t hat
a subdialog box will be displayed.
Selecting Variables
T o select a sin gle v ari able, y ou simpl y high light i t on t he source variable list and click
the right arro w but ton ne xt to the tar get v aria ble list . If there i s only one tar get v ariab le
list, you can double-click ind i vidual v ariables to move t hem from the source li st to the
target list.
You can also select multiple variables:
n To select multiple variables that are grouped together on the variable list, click the
first one and then Shift-click the last one in the group.
n To select multiple varia bles that are not grouped together on the variable list, use
the Ctrl-click method. Click the first variable, then Ctrl-click the next variable, and
so on.
n To select all variables in the list, press Ctrl-A.
Page 43
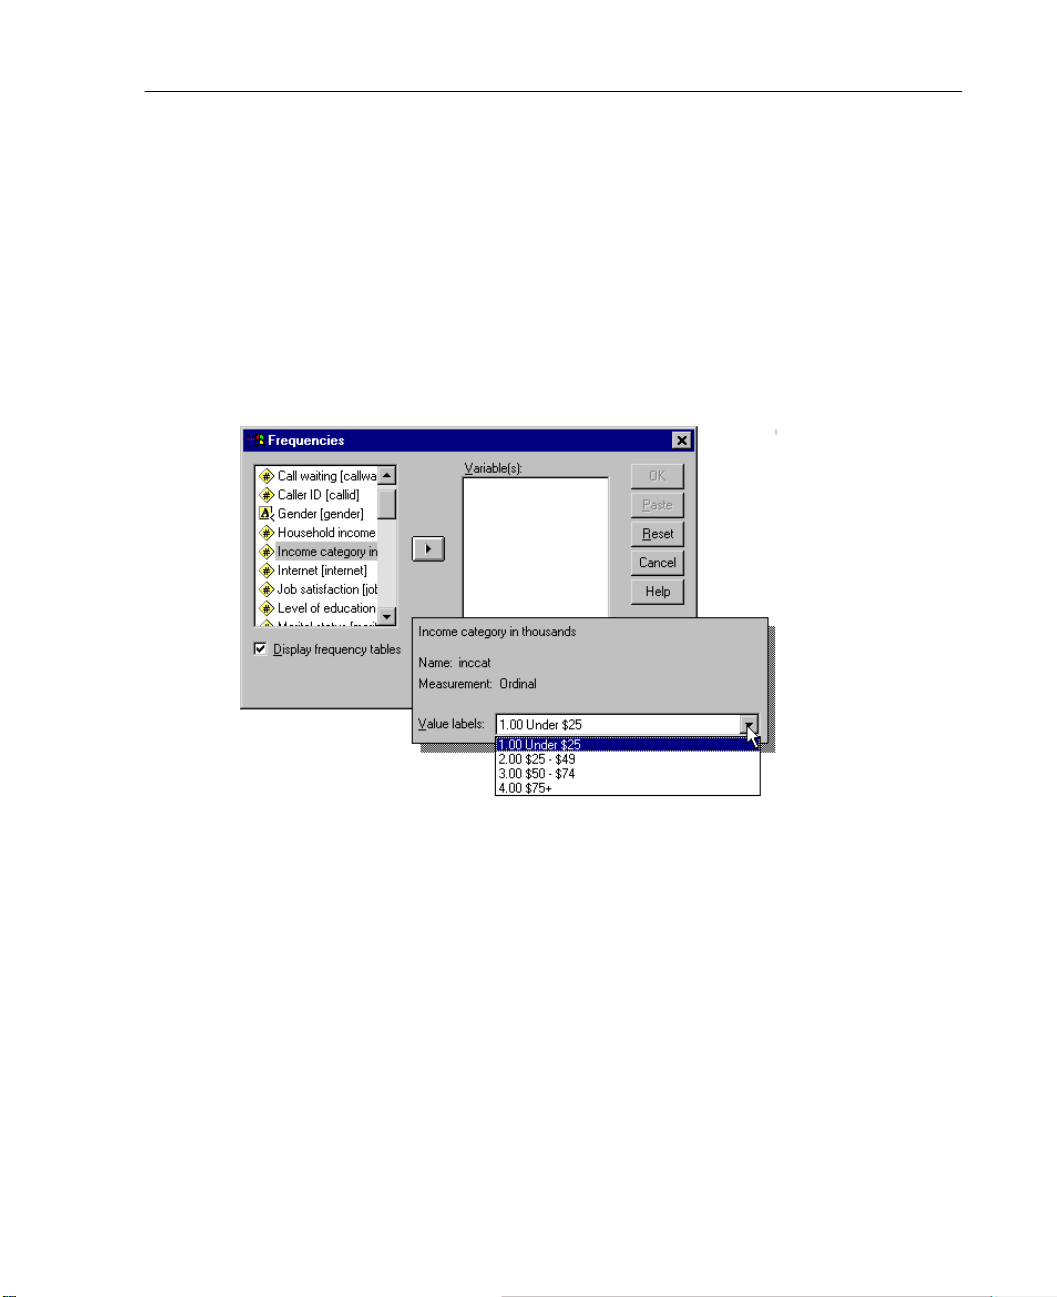
Getting Information about Variables in Dialog Boxes
Left-click a variable in a list to select it.
Right-click anywhere in the list.
Select Variable Information in the pop-up context menu.
Figure 1-7
Variable information with the right mouse button
13
Overview
Getting Information about Dialog Box Controls
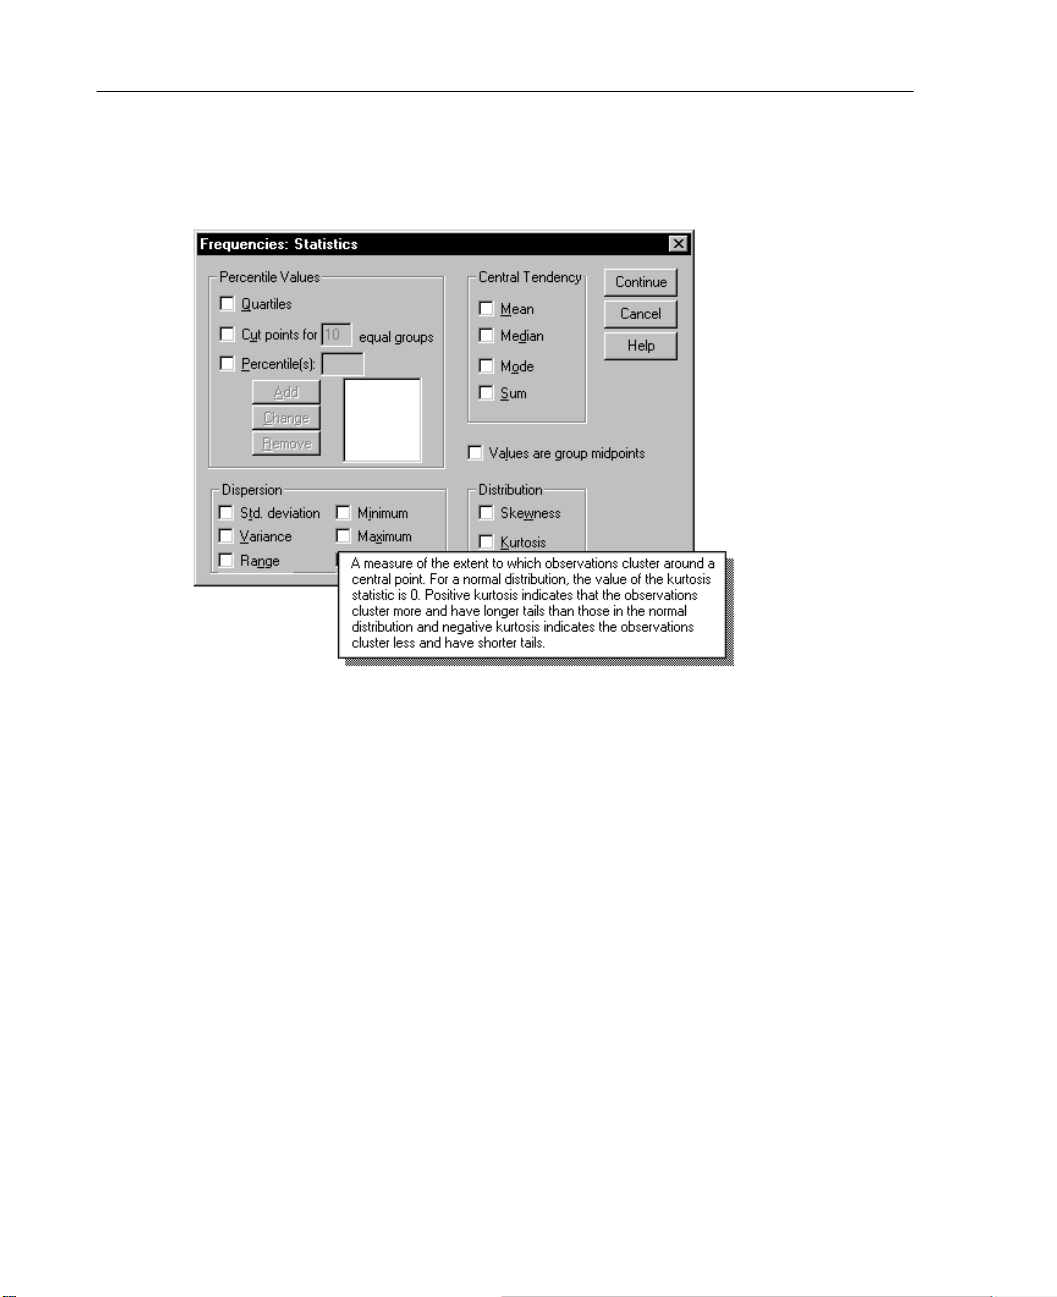
Right-click the control you want to know about.
Select What’s This? on the pop-up context menu.
A pop-up window displays information about the control.
Page 44
14
Chapter 1
Figure 1-8
Right mouse button “What’s This?” pop-up Help for dialog box controls
Basic Steps in Data Analysis
Analyzing data with SPSS is easy. All you have to do is:
Get your data into SPSS. You can open a previously saved SPSS data file; read a
spreadsheet, database, or text data file; or enter your data directly in the Data Editor.
Select a procedure. Se lect a procedure from the menus to calcul ate statistics or to create
a chart.
Select the variables for the analysis. The variables in the data file are displayed in a
dialog box for the procedure.
Run the procedure and look at the results. Results are displayed in the Viewer.
Page 45

Statistics Coach
If you are unfamiliar with S PSS or with the statistical proce dures available in SPSS,
the Statistics Coach can help you get st arte d by pr ompting yo u with simp le questi ons,
nontechnical language, and visual examples that help you select the basic statistical
and charting features that are best suited for your data.
To use the Statistics Coach, from the menus in any SPSS window choose:
Help
Statistics Coach
The Statistics Coach covers only a selected subset of procedures in the SPSS Base
system. It is designed to provide general assistance for many of the basic, commonly
used statistical techniques.
Finding Out More about SPSS
For a comprehensiv e ov ervie w of SPSS basics, see t he online tutorial. From an y SPSS
menu choose:
Help
Tutorial
15
Overview
Page 46

Page 47

Getting Help
Online Help is provided in several ways:
Help menu. Every windo w has a Help menu on the menu bar. Topics provides access
to the Contents and I ndex tabs, which you can u se to find specif ic Help topic s.
provides access to the introductory tutorial.
Chapter
2
Tutorial
Dialog box context menu Help. Right-click on any control in a dialog box and select
What’s This? from the context menu to display a description of the control and
directions for its use.
Dialog box Help buttons. Most dial og box es h a v e a Hel p b utt on th at t akes y ou dir ectl y
to a Help topic for that dialog box. The Help topic provides general information and
links to related topics.
Pivot table context menu Help. Right-click on te rm s in an activated pivot table in the
Viewer and select
terms.
Case Studies. The Case Studies item on the Help menu in the Viewer wind ow
provides hands-on e xamples of ho w to cr eate var ious types of sta tistical an alyses and
how to interpret the results. The sample data files used in the examples are also
provided so you can work through the examples to see exactly how the results were
produced.
Tut or ia l. Select Tutorial on the Help menu in any window to access the online
introductory tutoria l.
CD-ROM Syntax Reference Guide. Detailed syntax reference information is available
online with the CD-ROM version. The SPSS Syntax Refer ence Guide is av ailable from
the Help menu. If you did not install the SPSS Syntax Reference Guide when you
What’s This? from the context menu to display definitions of the
17
Page 48
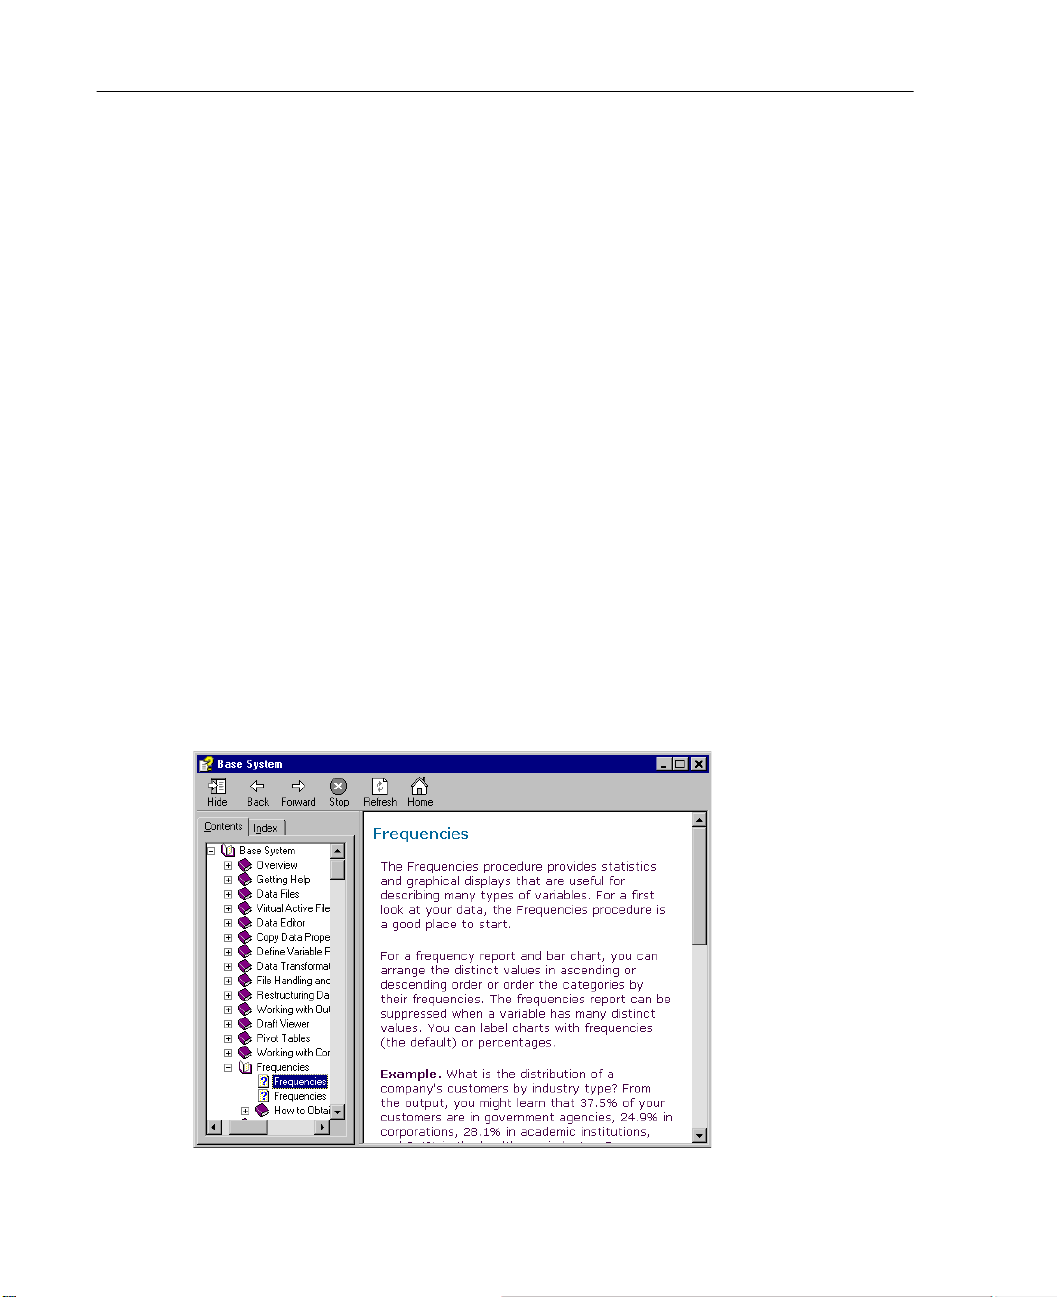
18
Chapter 2
installed this software, you will need the CD-ROM to access it. (It is no t av ailable with
some versions.) To install the SPSS Syntax Reference Guide, in the Setup program
select
Custom for the type of installation and then select Syntax Guide.
Note: The Help system requires Internet Explorer 5 or later, and the SPSS Syntax
Reference Guide requires Adobe Acrobat. I nstal lable ve rsion s of both are pro vided on
the CD.
Using the Help Table of Contents
In any windo w, from the me nus choose:
Help
Topics
Click the Contents tab.
Double-click items with a book icon to expand or collapse the contents.
Click an item to go to that Help topic.
Figure 2-1
Help window with Contents tab displayed
Page 49
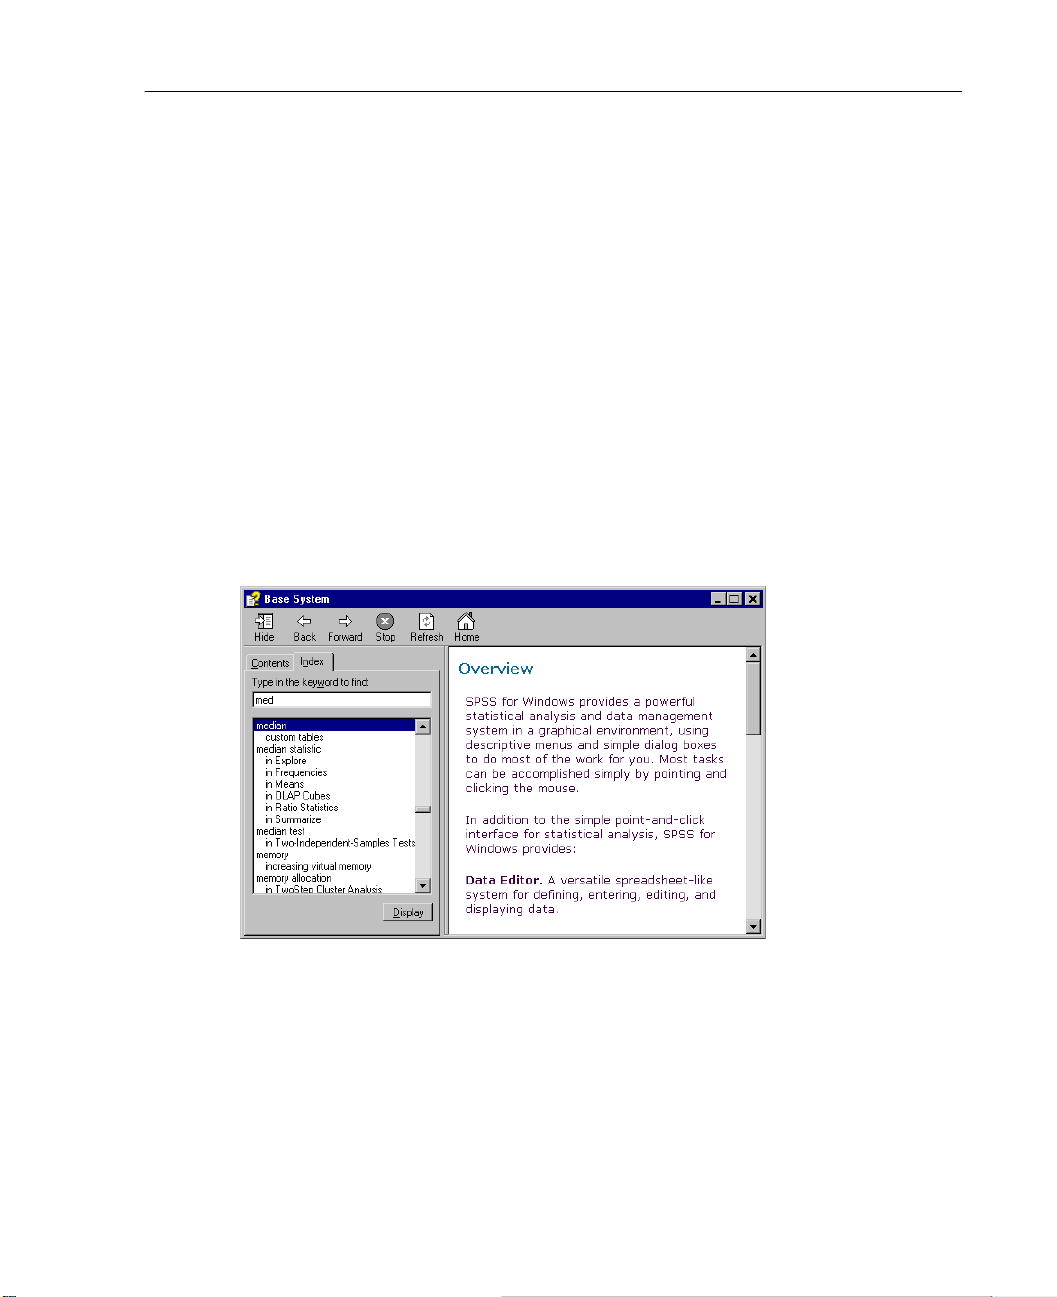
Using the Help Index
In any window, from the menus choose:
Help
Topics
Click the Index tab.
Enter a term to search for in the index.
Double-click the topic that you want.
The Help index uses incremental search to find the text that you enter and selects the
closest match in the index.
Figure 2-2
Index tab and incremental search
19
Getting Help
Page 50
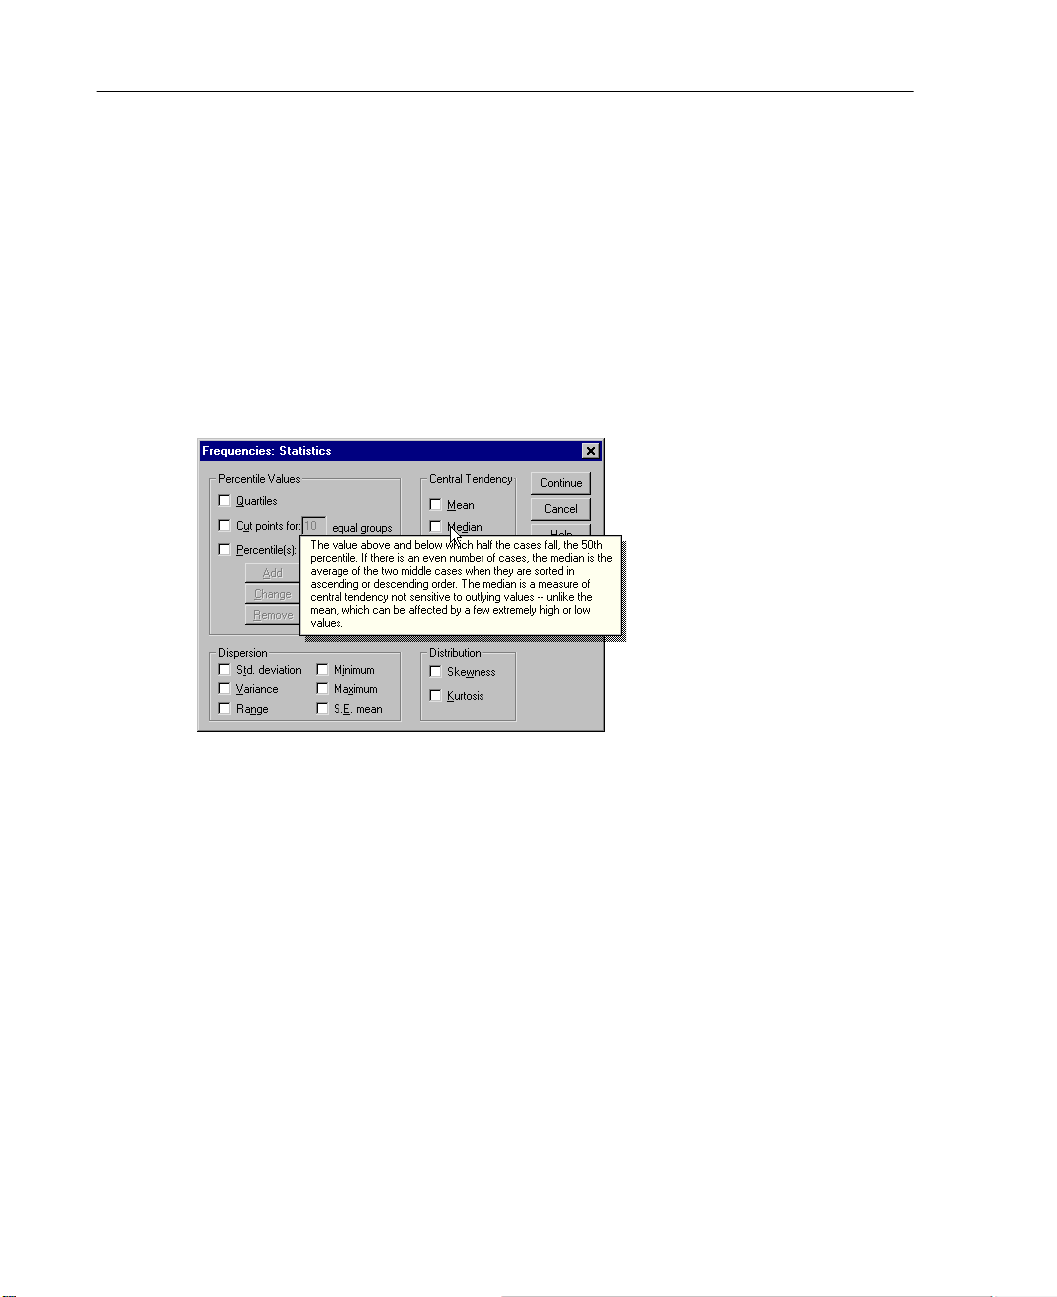
20
Chapter 2
Getting Help on Dialog Box Controls
Right-click on the dialog box control that you want information about.
Choose What’s This? from the pop-up context menu.
A description of the contro l and how to use it is displayed i n a pop-up windo w . General
information about a dialog box is available from the Help button in the dialog box.
Figure 2-3
Dialog box control Help with right mouse button
Getting Help on Output Terms
Double-click the pivot table to activate it.
Right-click on the term that you want to be explained.
Choose What’s This? from the context menu.
A definition of the term is displayed in a pop-up window.
Page 51
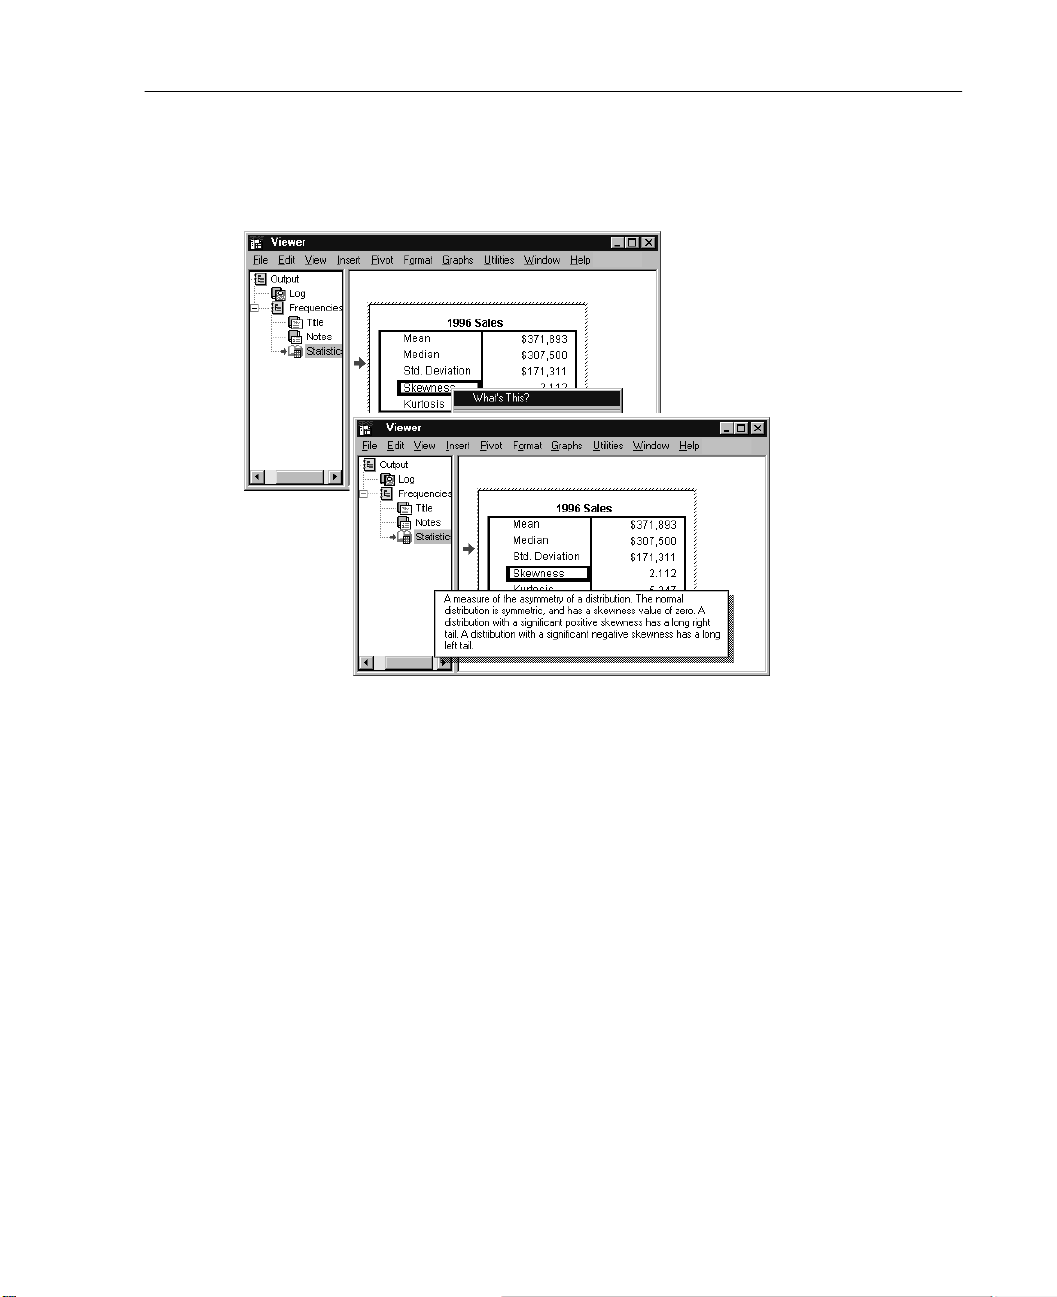
Figure 2-4
Activated pivot table glossary Help with right mouse button
21
Getting Help
Using Case Studies
Right-click on a pivot ta ble in the Viewer window.
Choose Case Studies from the pop-up context menu.
Copying Help Text from a Pop-Up Window
Right-click anywhere in the pop-up window.
Choose Copy from the context menu.
The entire text of the pop-up window is copied.
Page 52

Page 53

Data Files
Data files come in a wide variety of formats, and this software is designed to handle
many of them, including:
n Spreadsheets created with Lotus 1-2-3 and Excel
n Database files created with dBASE and various SQL formats
n Tab-delimited and other types of ASCII text files
n Data files in SPSS format created on other operating systems
n SYSTAT data files
n SAS data files
Chapter
3
Opening a Data File
In addition to files saved in SPSS format, you can open Excel, Lotus 1-2-3, dBASE,
and tab-delimited files without converting the files to an intermediate format or
entering data definition information.
To Open Data Files
From the menus choose:
File
Open
Data...
In the Open File dialog box, select the file that you want to open.
Click Open.
23
Page 54

24
Chapter 3
Optionally, you can:
n Read variable names from the first row for spreadsheet and tab-delimited files.
n Specify a range of cells to read for spreadsheet files.
n Specify a sheet within an Excel file to read (Excel 5 or later).
Data File Types
SPSS. Opens data files saved in SPSS format, including SPSS for Windows,
Macintosh, UNIX, and also the DOS product SPSS/PC+.
SPSS/PC+. Opens SPSS/PC+ data files.
SYSTAT. Opens SYSTAT data files.
SPSS Portable. Opens data files saved in SPSS portable format. Saving a file in portable
format takes considerably longer than saving the file in SPSS format.
Excel. Opens Excel files.
Lotus 1-2-3. Opens data files sav ed in 1-2-3 for mat for release 3.0, 2.0, or 1A of Lotus.
SYLK. Opens data fi les saved in SYLK (symbolic link) format, a format used by some
spreadsheet applications.
dBASE. Opens dBASE-format files for either dBASE IV, dBASE III or III PLUS, or
dBASE II. Each case is a record. Variable and value labels and missing-value
specifications are lost when you save a file in this format.
SAS Long File Name. SAS version 7-8 for Windows, long extension.
SAS Short File Name. SAS version 7-8 for Windows, short extension.
SAS v6 for Windows. SAS version 6.08 for Windows and OS2.
SAS v6 for UNIX. SAS version 6 for UNIX (Sun, HP, IBM).
SAS Transport. SAS transport file.
Tex t. ASCII text file.
Page 55

Opening File Options
Read variable names. For sprea dsheets, you can read v ariable names from the f irst ro w
of the file or the first row of the defined range. If the names are longer than eight
characters, they are truncated. If the first eight characters do not create a unique
variable name, the name is modified to create a unique variable name.
Worksheet. Excel 5 or later files can contain multiple worksheets. By default, the Data
Editor reads the first worksheet. To read a different worksheet, select the worksheet
from the drop-down list.
Range. For spreadsheet data files, you can also read a range of cells. Use the same
method for specifying cell ranges as you would with the spreadsheet application.
How the Data Editor Reads Excel 5 or Later Files
The following rules apply to reading Excel 5 or later files:
Data type and width. Each column is a variable. The data type and width for each
variable is determined by the da ta type and width in the Excel file. If the column
contains more than one dat a ty pe ( for example, date and numeric), the data ty pe i s set
to string, and all values are read as valid string values.
25
Data Files
Blank cells. For numeric variables, blank cells are converted to the system-missing
value, indicated by a period. For string variables, a blank is a valid string value, and
blank cells are treated as valid string values.
Variable names. If you read the first row of the Excel file (or the first row of the
specified range) as variable names, names longer than eight characters are truncated,
non-unique names are converted to unique ones, and the original names are used as
variable labe ls. If yo u do n ot read variable names from the Excel file, default variable
names are assigned.
How the Data Editor Reads Older Excel Files and Other Spreadsheets
The following rules apply to reading Excel files prior to version 5 and other
spreadsheet data:
Data type and width. The data type and width for each variable are determined by the
column width and data type of the first data cell in the column. Values of other types
Page 56

26
Chapter 3
are conv erted t o the syste m-missing value. If the first data cell in the column is blank,
the global default data type for the spreadsheet (usually numeric) is used.
Blank cells. For numeric variables, blank cells are converted to the system-missing
value, indicated by a period. For string variables, a blank is a valid string value, and
blank cells are treated as valid string values.
Variable names. If you do not read variable names from the spreadsheet, the column
letters (A, B, C, ...) are used for variable names for Excel and Lotus files. For SYLK
files and Excel files saved in R1C1 display format, th e software uses the column
number preceded by the letter C for variable names (C1, C2, C3, ...).
How the Data Editor Reads dBASE Files
Database files are logically very similar to SPSS-format data files. The following
general rules apply to dBASE files:
n Field names are automatically translated to variable names.
n Field names should comply with variable naming conventions for SPSS format.
Field names longer than eight charact ers are t runc ate d. If the fi rst ei ght cha racte rs
of the field name do not produce a unique name, the field is dropped.
n Colons used in dBASE field names are translated to underscores.
n Records marked for deletion but not actually purged are included. The software
creates a new string variable, D_R, which contains an asterisk for cases marked for
deletion.
Reading Database Files
You can read data from any database format for which you have a database driver. In
local analysis mode, the necessary driv ers must be installed on your local comput er . In
distributed analysis mode (available with the server version), the drivers must be
installed on the remote server. For more information about distributed analysis, see
Chapter 4.
Page 57

Data Files
To Read Database Files
From the menus choose:
File
Open Database
New Query…
Select the data source.
Depending on the data source, you may need to select the database file and/or enter a
login name, password, and other information.
Select the table(s) and fields.
Specify any relationships between your tables.
Optionally, you can:
n Specify any selection criteria for your data.
n Add a prompt for user input to create a parameter query.
n Define any variable attri butes.
n Save the query you have constructed before running it.
27
To Edit a Saved Database Query
From the menus choose:
File
Open Database
Edit Query…
Select the query file (*.spq) that you want to edit.
Follow the instructions for creating a new query.
Page 58

28
Chapter 3
To Read Database Files with a Saved Query
From the menus choose:
File
Open Database
Run Query…
Select the query file (*.spq) that you want to run.
Depending on the database file, you may need to enter a login name and password.
If the query has an embedded prompt, you may need to enter other information (for
example, the quarter for which you want to retrieve sales figures).
Selecting a Data Source
Use the first dia log box to select the t ype of data source to r ead into the software. After
you have chosen the file type, the Database Wizard may prompt you for the path to
your data file.
If you do not have any data sources configured, or if you want to add a new data
source, click
version), this button is not avail able. To add data sources in distributed anal ysis mode,
see your system administrator.
Add Data Source. In distributed analysis mode (available with the server
Data sources. A data source consists of two essen tial pi eces of i nformation: the d river
that will be used to access the data and the location of the database that you want to
access. To specify data sources, you must have the appropriate drivers installed. For
local analysis mode, you can install drivers from the CD-ROM for this product:
n SPSS Data Access Pack. Installs drivers for a variety of dat abase formats. Available
on the AutoPlay menu.
n Microsoft Data Access Pack. Installs drivers for Microsoft products, including
Microsoft Access. To install the Microsoft Data Access Pack, double-click
Data Access Pack
in the Microsoft Data Access Pack folder on the CD-ROM.
Microsoft
Page 59
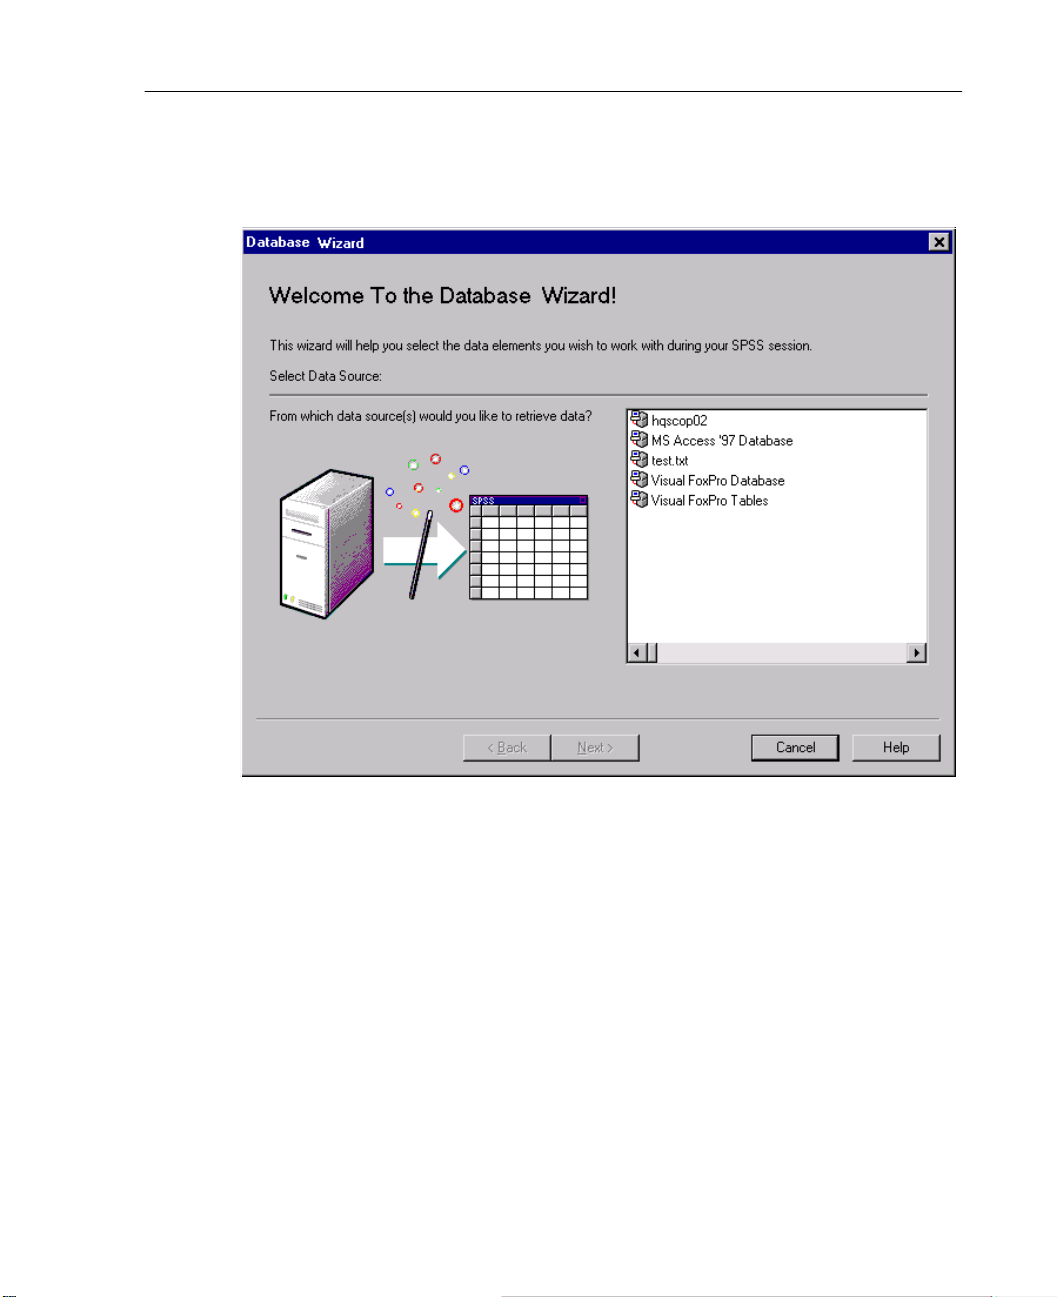
Figure 3-1
Database Wizard dialog box
29
Data Files
Example. Let’s say you have a Microsoft Access 7.0 dat abase that con tains dat a abo ut
your employees and about t he regions i n which they w ork, and you w ant to import th at
data. Select the
the Select Database dialog box. Specify the path to your database and click
MS Access 7.0 Database icon, and click Next to proceed. You will see
OK.
Page 60
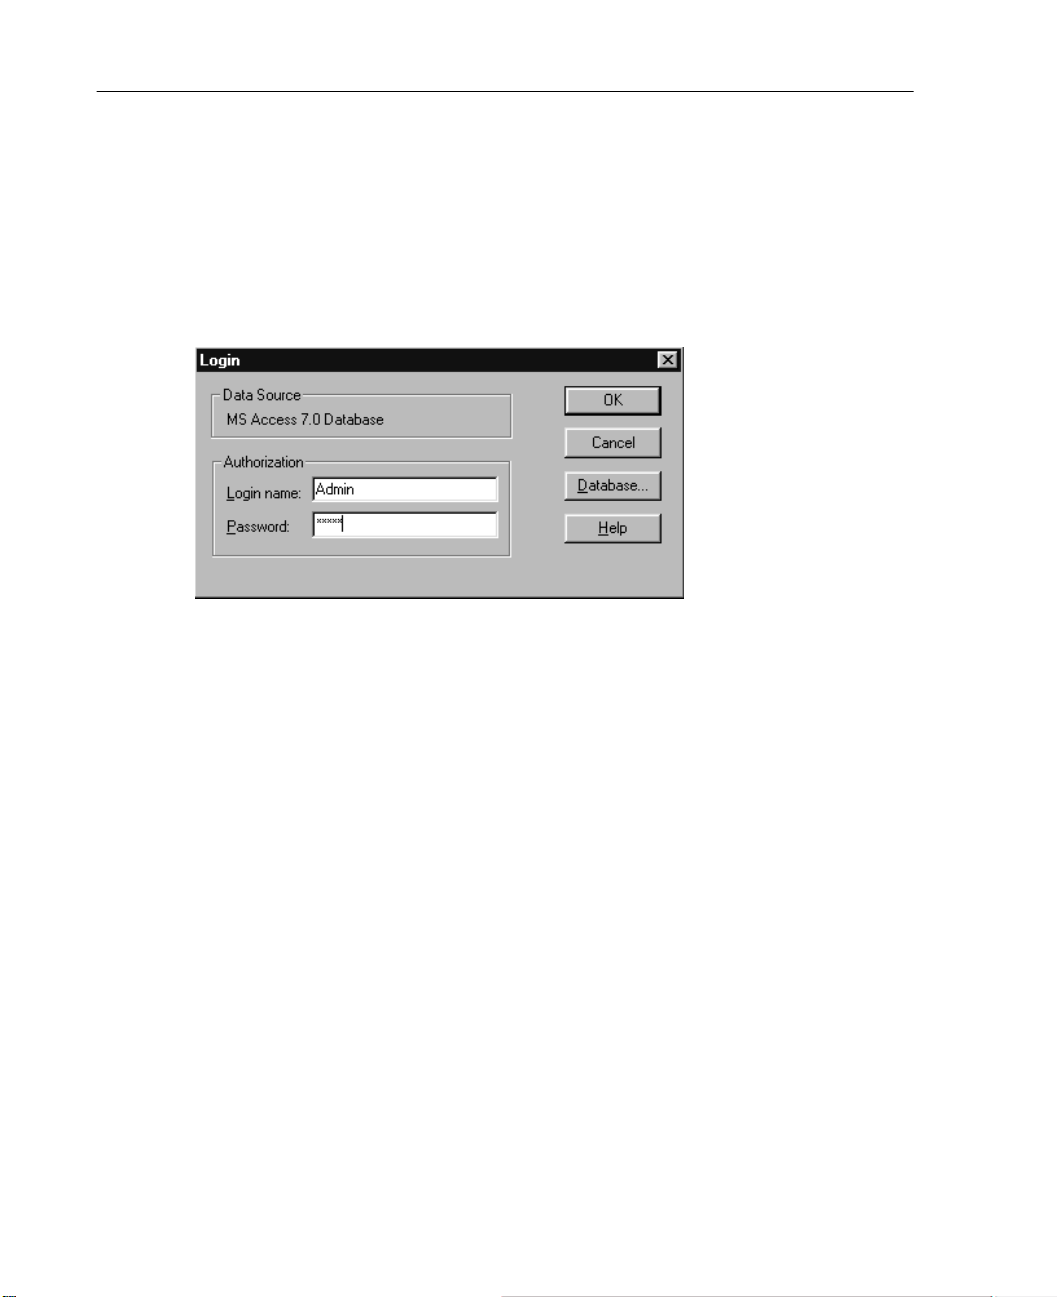
30
Chapter 3
Database Login
If your database requires a password, the Database Wizard will prompt you for one
before it can open the data source.
Figure 3-2
Login dialog box
Selecting Data Fields
This dialog box controls which tables and fields are read into the software. Database
fields (columns) are read as variables.
If a table has any field(s) selected, all of its fields will be visible in the following
Database Wizard windows, but only those fields selected in this dialo g box will be
imported as variables. This enables you to create table joins and to specify criteria
using fields that you are not importing.
Page 61
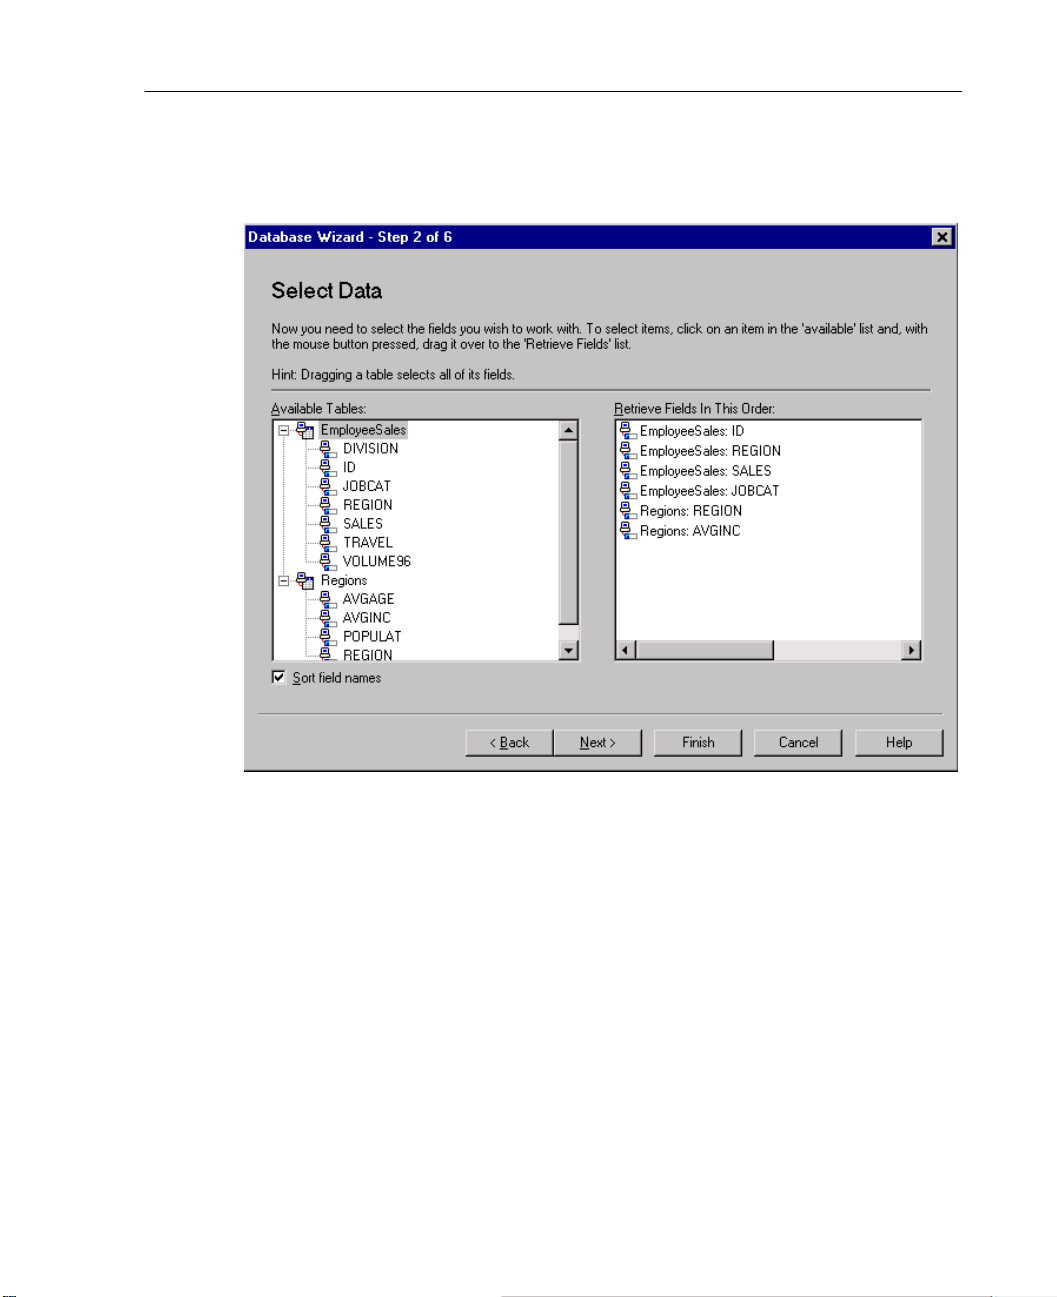
Figure 3-3
Select Data dialog box
31
Data Files
Displaying field names. To list the fields in a table, click the plus sign (+) to the left of
a table name. To hide the fields, click the minus sign (–) to the left o f a table name.
To add a field. Double-click any field in the Available Tables list, or dr ag it to the
Retrieve Fields in This Order list. Fields can be reordered by dragging and dropping
them within the selected fields list.
To remove a field. Double-click any field in the Retrieve Fields in This Order list, or
drag it to the Available Tables list.
Sort field names. If selected, the Database Wizard will display your available fields in
alphabeti cal order.
Example. Assume that you want to import from a datab ase with t wo tabl es, Emplo yees
and Regions. The Employees table contains information about your company’s
employees, including t he region they work in, their job category , and their annual sales.
Page 62
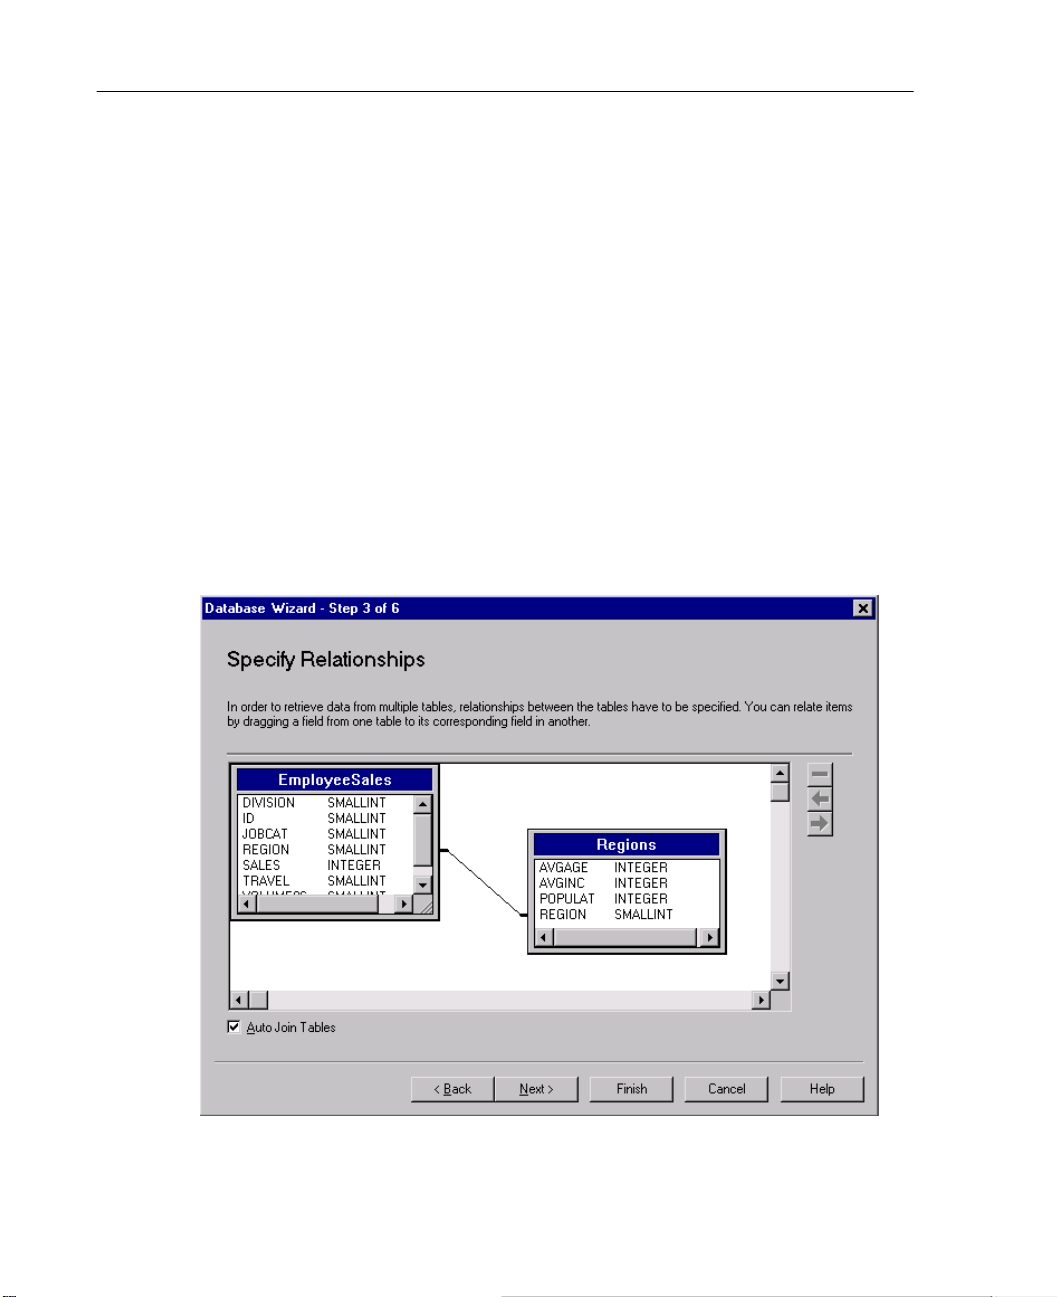
32
Chapter 3
Employees are each assigned a reg ion code (REGION), while th ose who do no t ha ve a
home region get the special code of 0. The Re gi ons table holds a large amount of data
about the areas in which your company operates and prospective markets. It uses a
region code (REGION) to identify the area and provides the av erage per capita income
for the area, among other things. To relate each employee’s sales to the a verage income
in the region, you would select the following fields from the Employees table: ID,
REGION, and SALES. Then, select the following fields from the Regions table:
REGION and AVGINC. Click
Creating a Relationship between Tables
This dialog box allo ws you to define the relationships bet ween the tables. If fields from
more than one table are selected, you must define at least one join.
Figure 3-4
Specify Relationships dialog box
Next to proceed.
Page 63
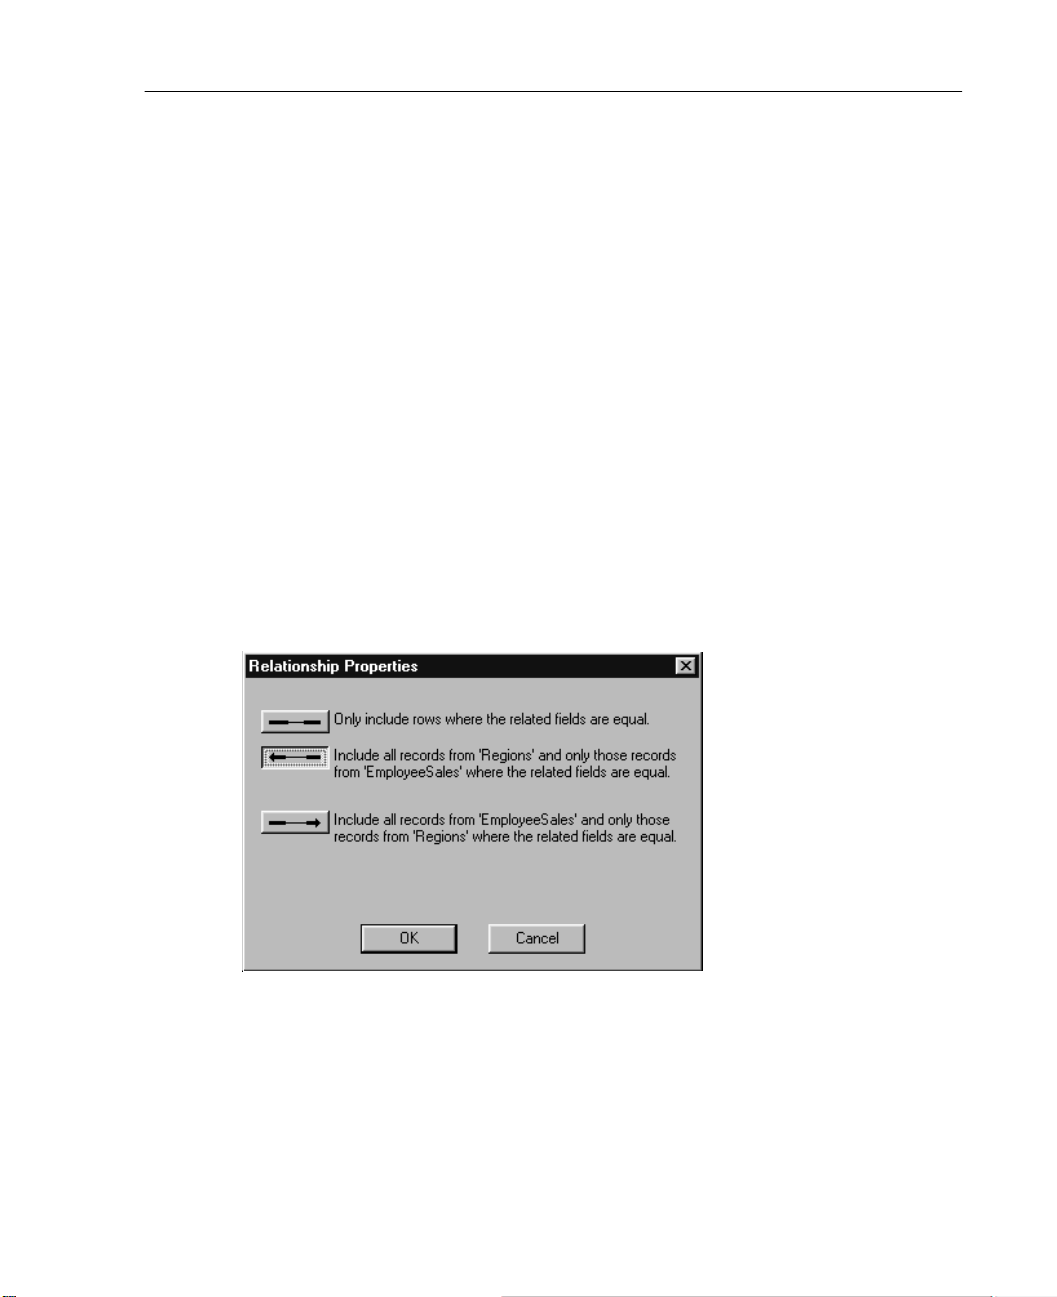
Establishing relationships. To create a relationship, drag a f ield from an y table onto the
field to which you want to join it. The Database Wizard will draw a join line between
the two fields, indicat ing their relationship. These f ields must be of t he same data type.
Auto Join Tables. Attempts to automatically join tables based on pri mary/ f ore ign keys
or matching field names and data type.
Specifying join types. If outer joins are supported by your driver, you can specify either
inner joins, left outer joins, or right outer joins. T o select the type of join, click the join line
between the fields, and the software will display the Relationship Properties dialog box.
Y ou can al so use the icons in the upper right corne r of the dialog box to choose t he type
of join.
Relationship Properties
This dialog box allows you to specify which type of relationship joins your tables.
Figure 3-5
Relationship Properties dialog box
33
Data Files
Inner joins. An inner join includes only rows where the related fields are equal.
Example. Continuing with our data, suppo se that you want to import data only for those
employees who work in a fixed region and only for those regions in which your
company operates. In this case, you would use an inner join, which would exclude
traveling employees and would filter out information about prospective regions in
which you do not currently have a presence.
Page 64
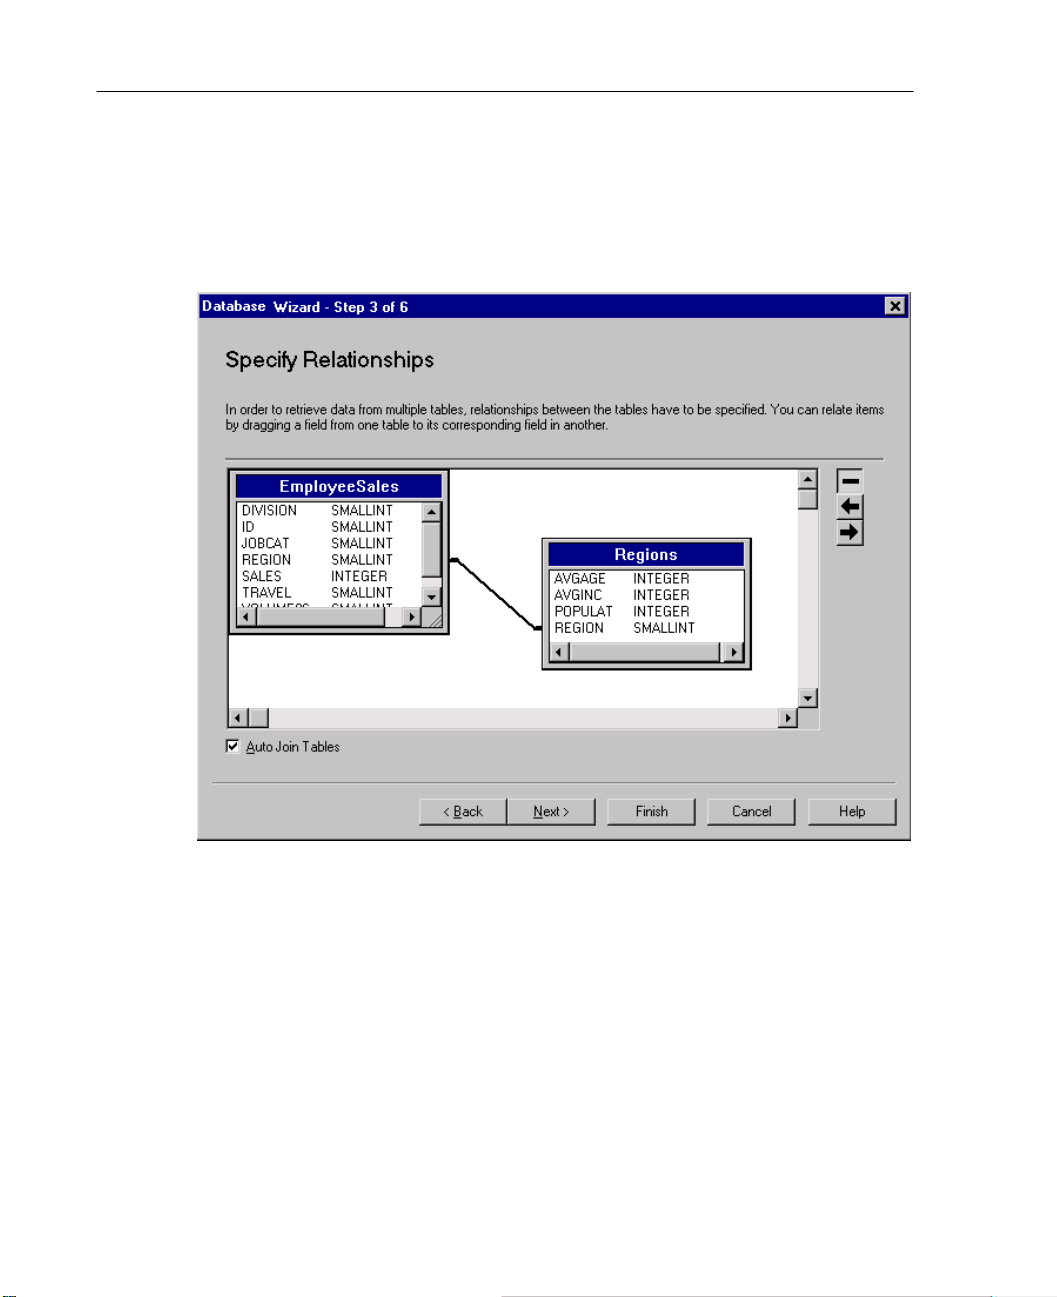
34
Chapter 3
Completing this would give you a data set t hat contains the vari ables ID, REGION,
SALES95, and AVGINC for each employee who worked in a fixed region.
Figure 3-6
Creating an inner join
Outer joins. A left outer join includ e s al l records from the table on the left and only
those records from the table on t he right in whi ch the related fiel ds are equal . In a right
outer join, this relationship is switched, so that the software imports all records from
the table on the righ t and only those records fro m the table on the left in whic h the
related fields are equal.
Example. If you wanted to import data only for those employees who worked in fixed
regions (a subset of the Employees table) but needed information about all of the
regions, a right ou ter joi n woul d be appr opriat e. This results i n a data set th at c ontains
the var ia bl es ID, REGION, SALES95, and AVGINC for each employee who worked in
a fixed region, plus data on the remaining regions in which your company does not
currently operate.
Page 65
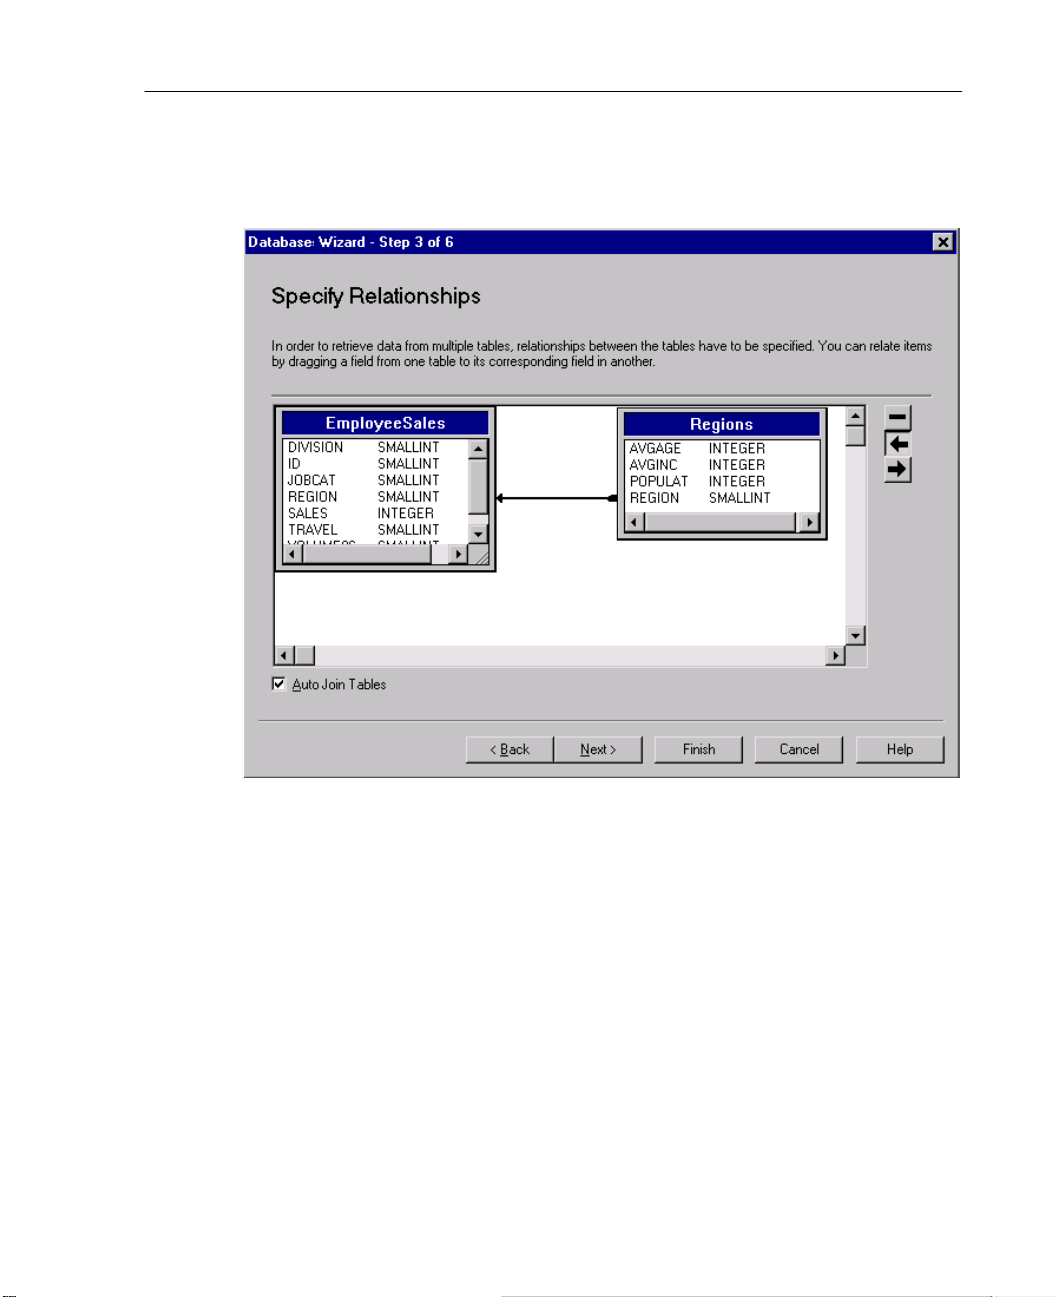
Figure 3-7
Creating a right outer join
35
Data Files
Limiting Retrieved Cases
The Limit Retrieved Cases dialog box allows you to specify the criteria to select
subsets of cases (rows). Limiting cases generally consists of filling the criteria grid
with one or more criteria. Criteria consist of two expressions and some relation
between them. They return a value of true, false, or missing for each case.
n If the result is true, the case is selected.
n If the result is false or missing, the case is not selected.
n Most criteria use one or more of the six relational operators (<, >, <=, >=, =, and <>).
n Expressions can include fie ld names, constants, a rithmet ic ope rators, numeri c and
other functions, and logical variables. You can use fields that you do not plan to
import as variables.
Page 66
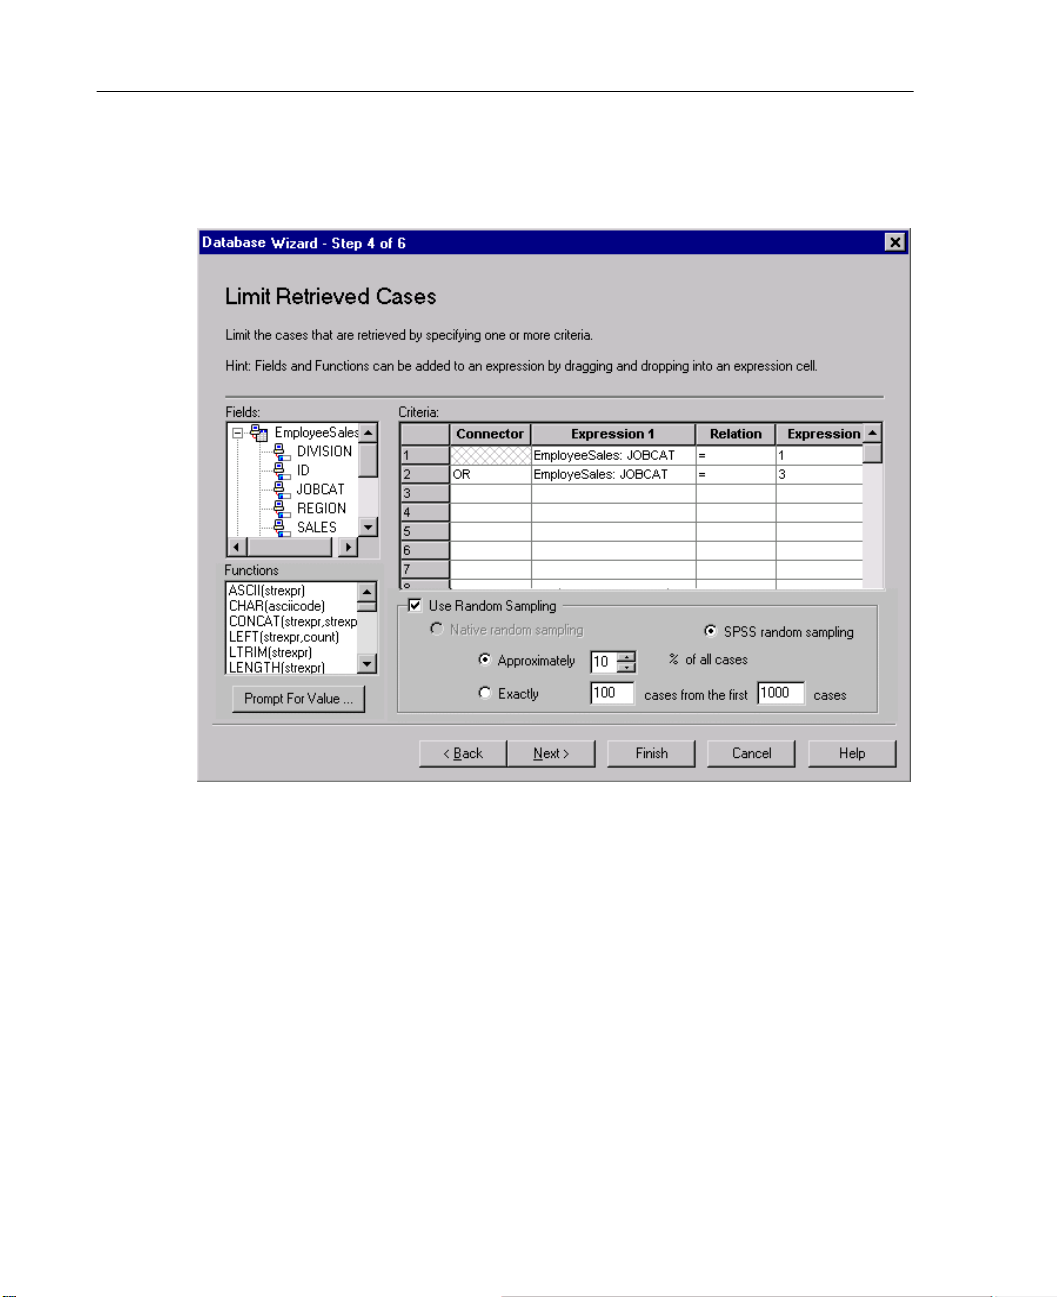
36
Chapter 3
Figure 3-8
Limit Retrieved Cases dialog box
T o bu ild your criter ia, you need at least tw o expressio ns and a relation t o connect them.
To build an expression, put your cursor in an Expression cell. You can type field
names, constants, arithmetic operators, numeric and other functions, and logical
variables. Other methods of putting a field into a criteria cell include double-clicking
the field in the Fields list, dragging the field from the Fields list, or selecting a field
from the drop-down menu that is available in any active Expression cell.
The two expressions a re usu ally connect ed by a rel ational oper ator, such as = or >. To
choose the relation, put your cursor in the R elati on cell and eit her type t he operat or or
select it from the drop-down menu.
Page 67

37
Data Files
To mod ify our earlier example to ret r ieve data only about employees who fit into job
categories 1 or 3, create two criteria in the criteria grid, and prefix the second criteria
with the connector
OR.
Criteria 1:
’EmployeeSales’.’JOBCAT’ = 1
Criteria 2: ’EmployeeSales’.’JOBCAT’ = 3
Functions.
A selection of built-in arithmetic, logical, string, date, and time SQL
functions are provided. You can select a function from the list and drag it into the
expression, or you can enter any v alid SQL function. See your da tabase documentation
for valid SQL functions.
Use Random Sampling. Selects a random sample of cases from the data source. For lar ge
data sources, you may want to limit the number of cases to a small, representative
sample. This can significantly reduce the time that it takes to run proced ures. Native
random sampling, if available for the data so urce, is faster than SPSS random
sampling, since SPSS random sampling must still read the ent ire data source to extr act
a random sample.
Prompt for Value. Y ou c an embed a p rompt in you r query to create a param eter query.
When users run the query , th e y will be ask ed t o enter informati on specified here. You
might want to do this if you need to see dif ferent view s of the same data. For e xample,
you may want to run the same query to see sales figures for different fiscal quarters.
Place your cursor in any Expression cell , and click
Creating a Parameter Query
Prompt for Value to create a prompt.
Use the Prompt for Value dialog box to create a dialog box that solicits information
from users each time someone runs your query. It is useful if you want to query the
same data source using different criteria.
Page 68
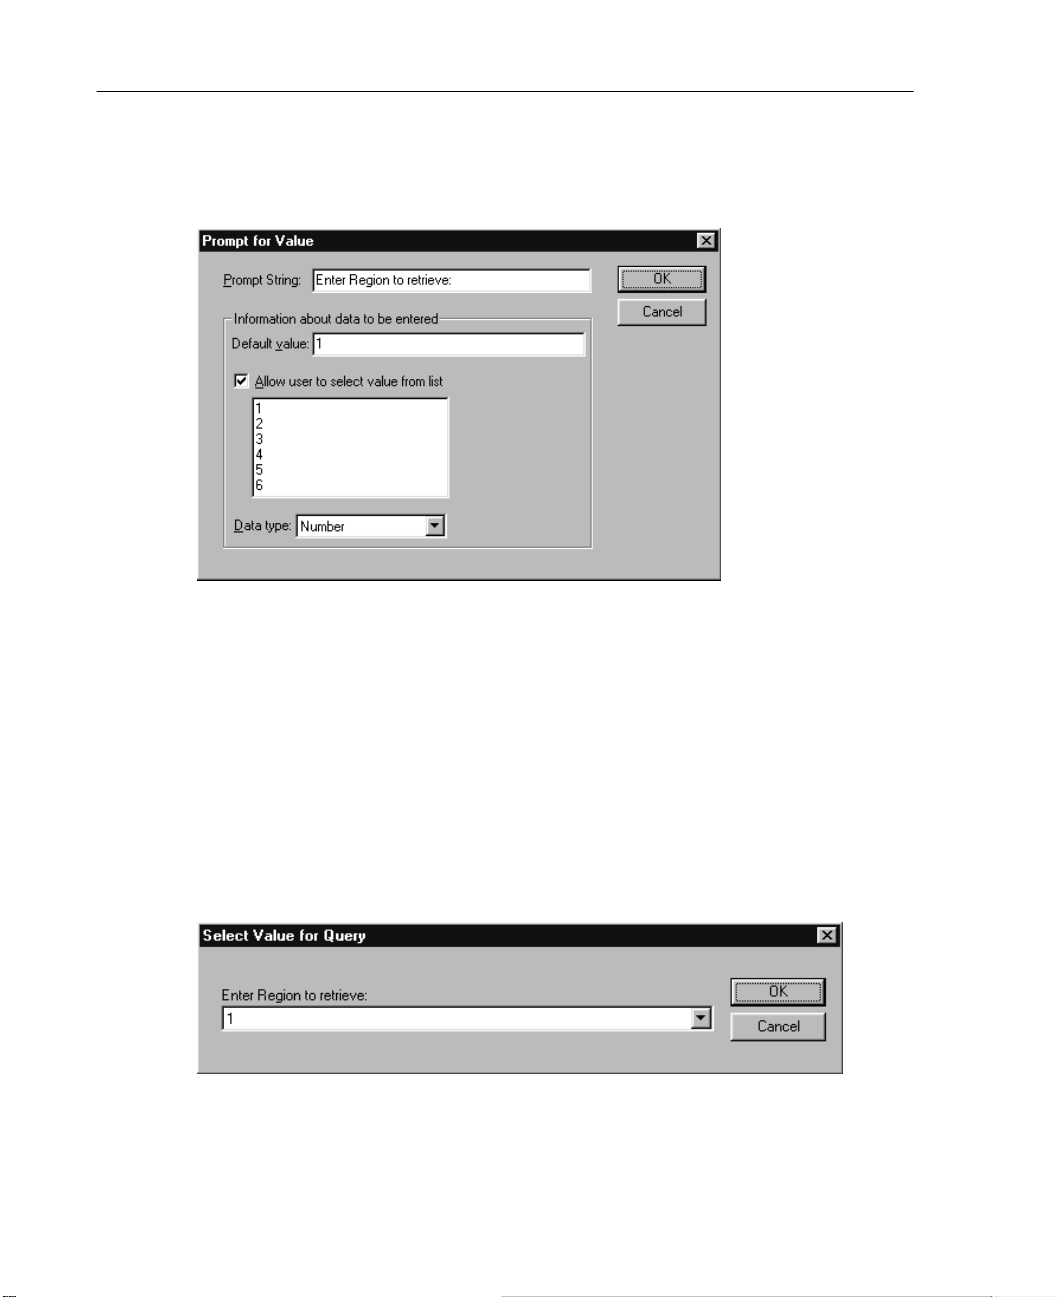
38
Chapter 3
Figure 3-9
Prompt for Value dialog box
To build a prompt, you need to enter a prompt string and a default value. The prompt
string is displayed each time a user runs your query. It should specify the kind of
information to enter, and, if the user is not selecting from a list, it should giv e hints about
how the input should be formatted. For example, “Enter a Quarte r (Q1, Q2, Q3, …):”.
Allow user to select value from list. If this is selected, you can limit the user to the v alues
you place here, which are separated by carriage returns.
Data type. Specify the data type here, either number, string, or date.
The final result looks like this:
Figure 3-10
User-defined prompt dialog box
Page 69

Defining Variables
Variable names and labels. The complete database field (column) name is used as the
variable label. Unless you modify the variable name, the Database Wizard assigns
variable names to each column from the database in one of two ways:
n If the name of the database field (or the first eight cha racters) forms a valid, unique
variable name, it is used as the variable name.
n If the name of the database field does not form a valid, unique variable name, the
software creates a unique name.
Click any cell to edit the variable nam e.
Converting strings to numeric values. Check the Value Labels box for a string variable if
you want to automatically con v ert it to a numeric v ariable. String values are converted
to consecutive integer values based on alphabetic order of the original values. The
original values are retained as value labels for the new variables.
39
Data Files
Page 70
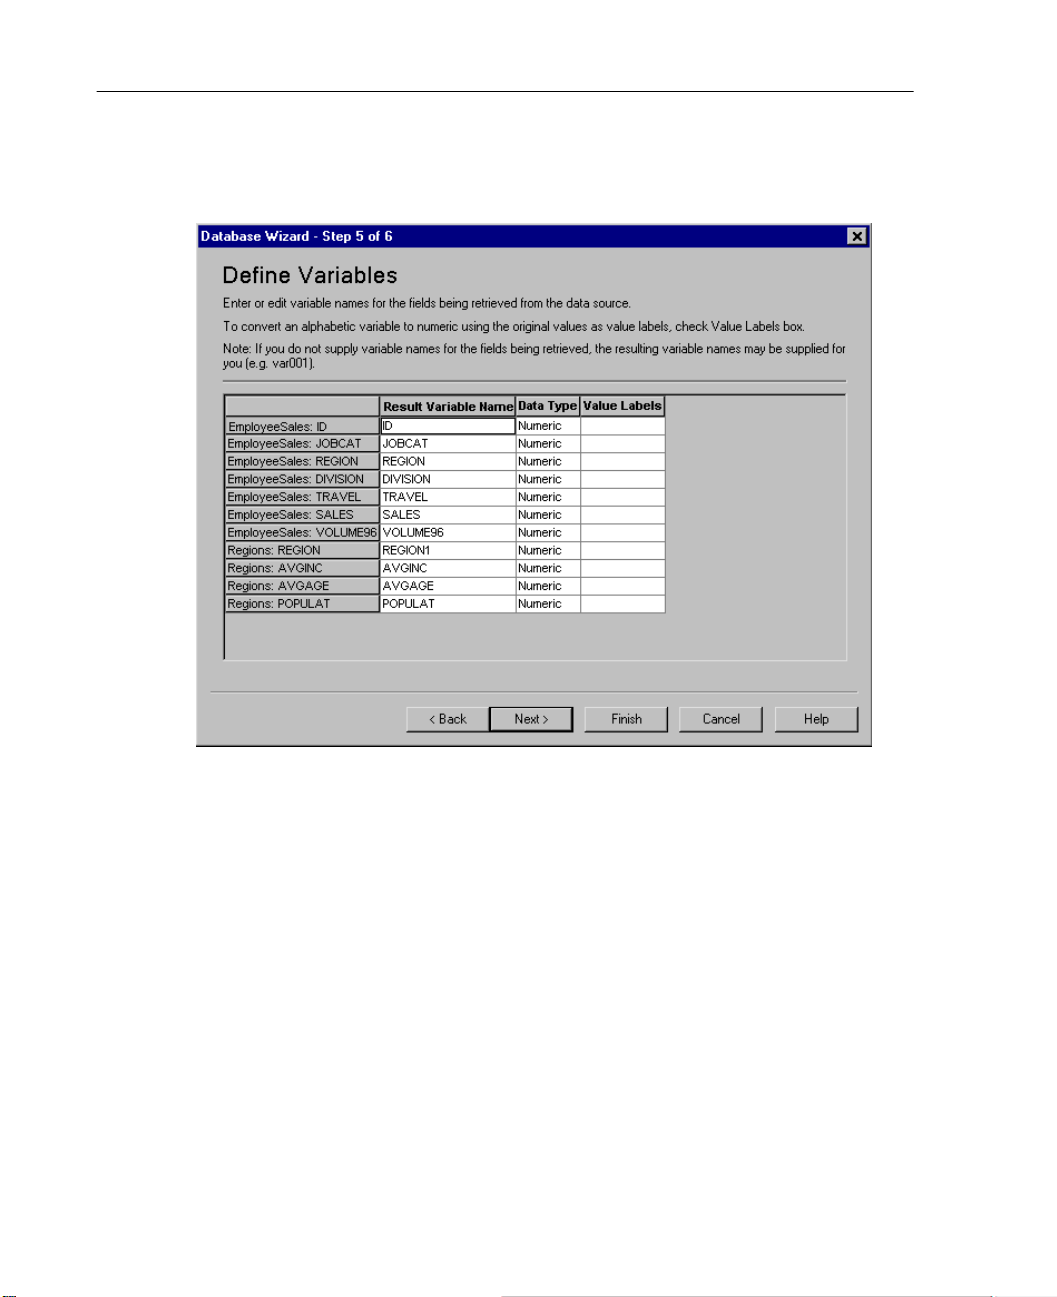
40
Chapter 3
Figure 3-11
Define Variables dialog box
Results
The Results dialog box displays the SQL Select statement for your query.
n You can edit the SQL Select statement before you run the query, but if you click
Back button to make changes in previous steps, the changes to the Select
the
statement will be lost.
n You can save the query for future use with Save query to a file.
n Select Paste it into the syntax editor for further modification to paste complete GET
DATA syntax into a syntax window. Copying and pa sting the Select statemen t from
the Results window will not paste the necessary command syntax.
Page 71
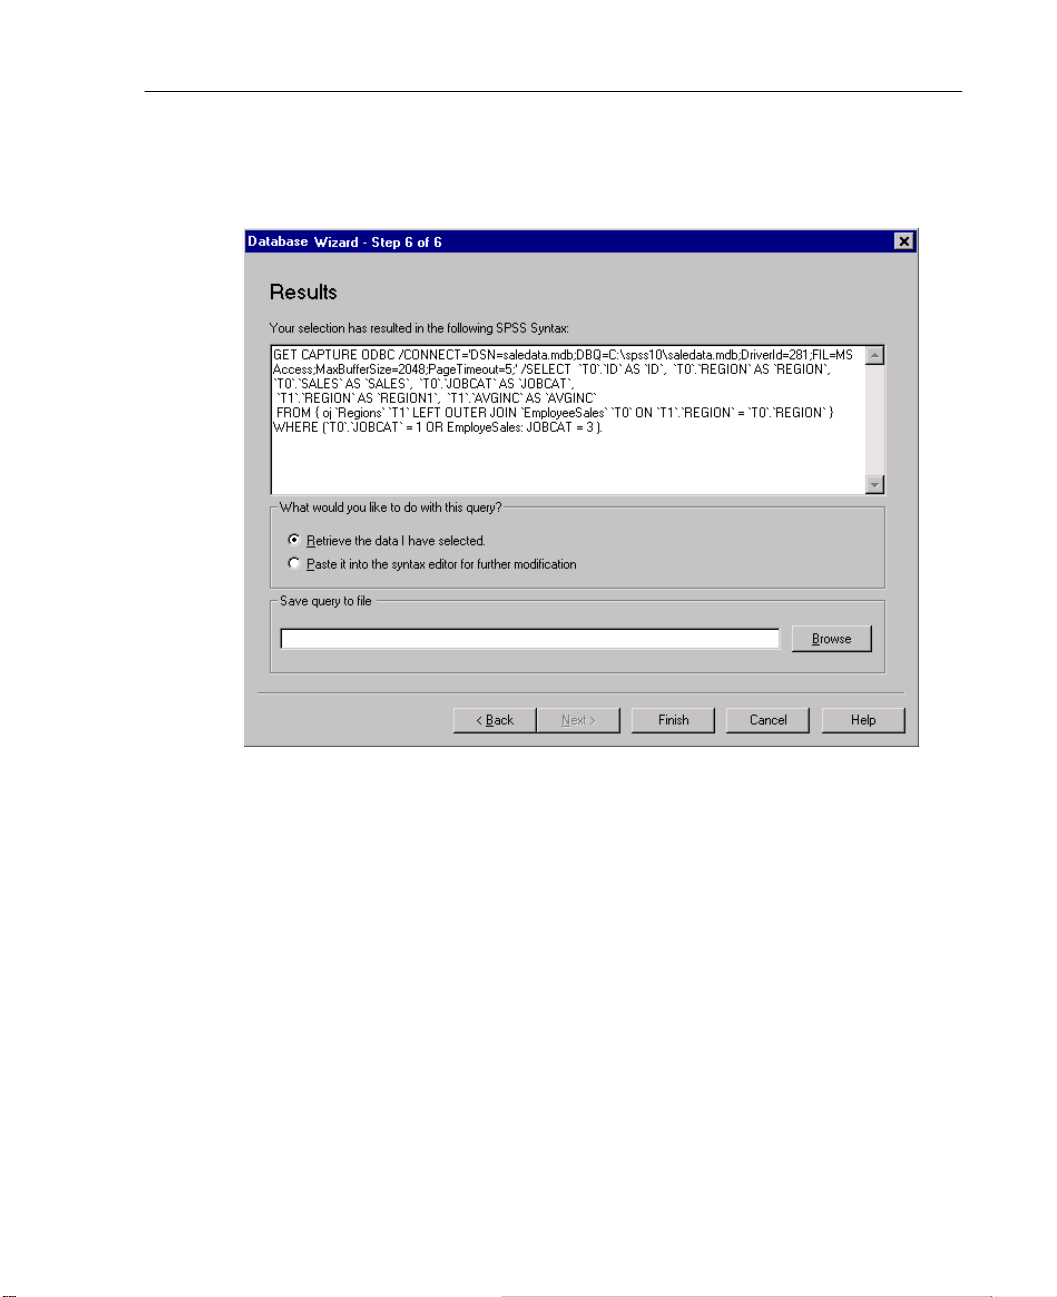
Figure 3-12
Results dialog box
41
Data Files
Reading Text Data Files
The Text Wizard can read text data files formatted in a variety of ways:
n Tab-delimited files
n Space-delimited files
n Comma-delimited files
n Fixed-field format files
For delimited fi les, you can also specify other characters as delim iters between v alues,
and you can specify multiple delimiters.
Page 72
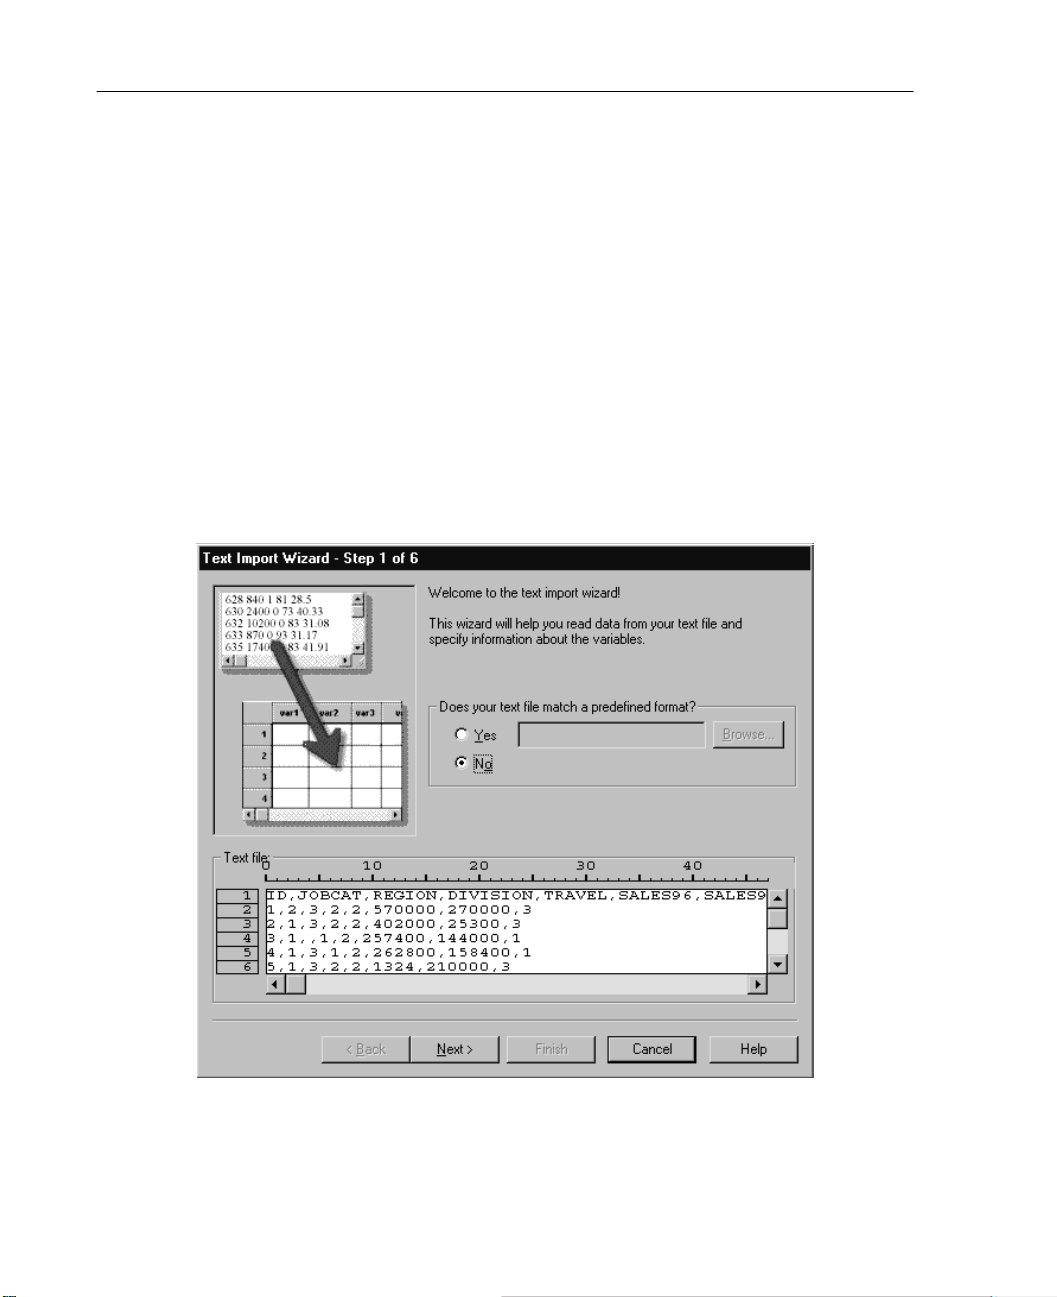
42
Chapter 3
To Read Text Data Files
From the menus choose:
File
Read Text Data
Select the text file in the Open dialog box.
Follow the steps in the Text Wizard to define how to read the data file.
Text Wizard Step 1
Figure 3-13
Text Wizard Step 1
Page 73
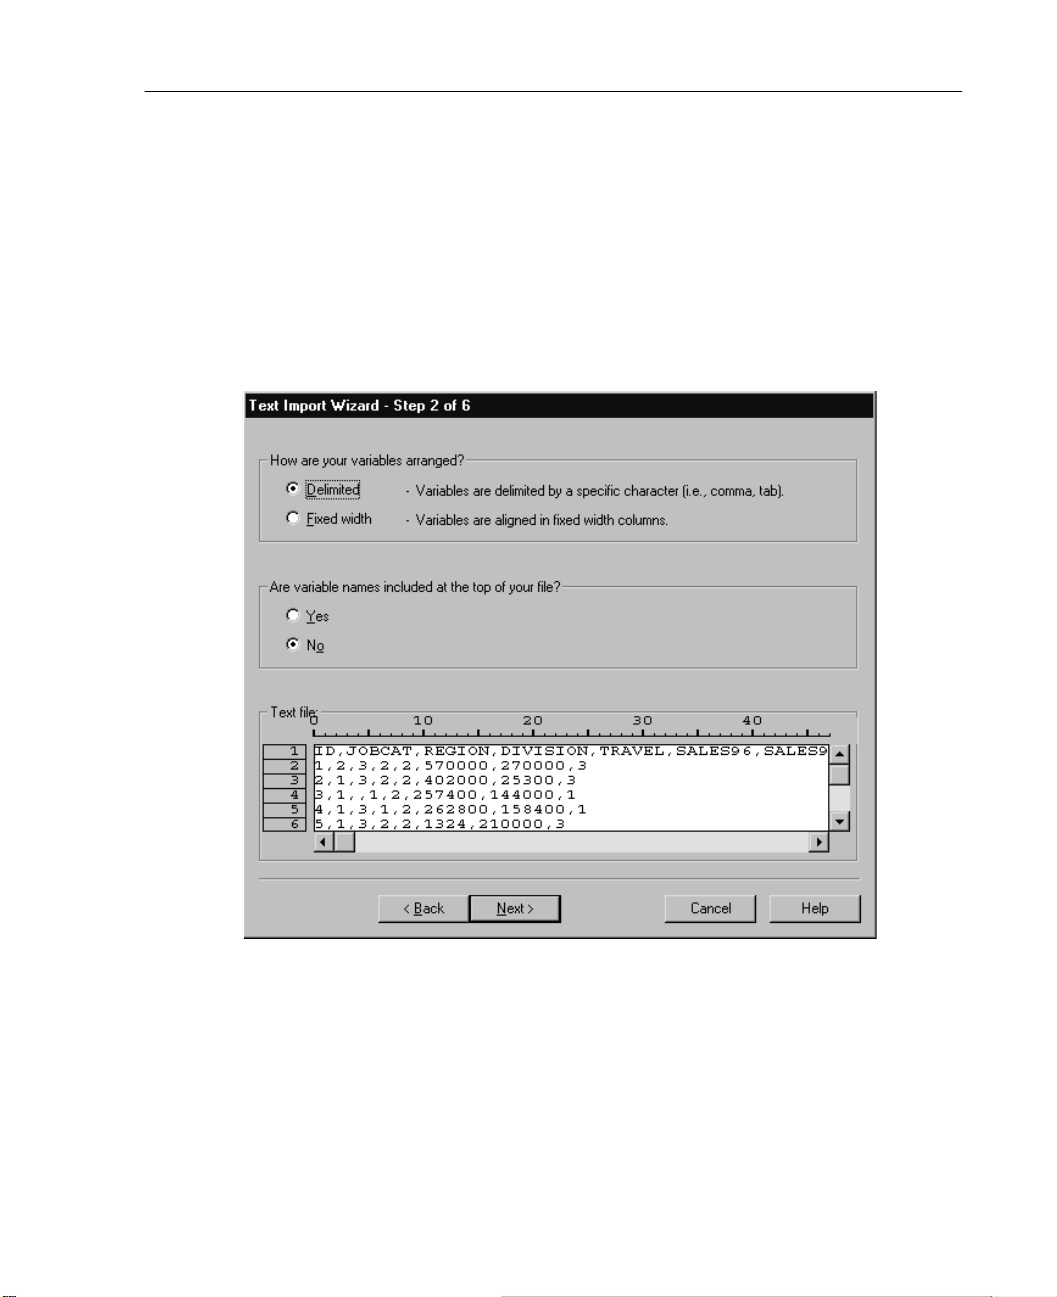
The text file is displayed in a preview window. You can apply a predefined format
(previously saved from the Text Wizard) or follow the steps in the Text Wizard to
specify how the data should be read.
Text Wizard Step 2
Figure 3-14
Text Wizard Step 2
43
Data Files
This step provides information about variables. A variable is similar to a field in a
database. For example, each item in a questionnaire is a variable.
How are your variables arranged? T o read yo ur data p roperl y, the T ext Wizard needs to
know how to determine where the data value for one variable ends and the data value
for the next variable begins. The arrangement of variables defines the method used to
differentiate one variable from the next.
Page 74
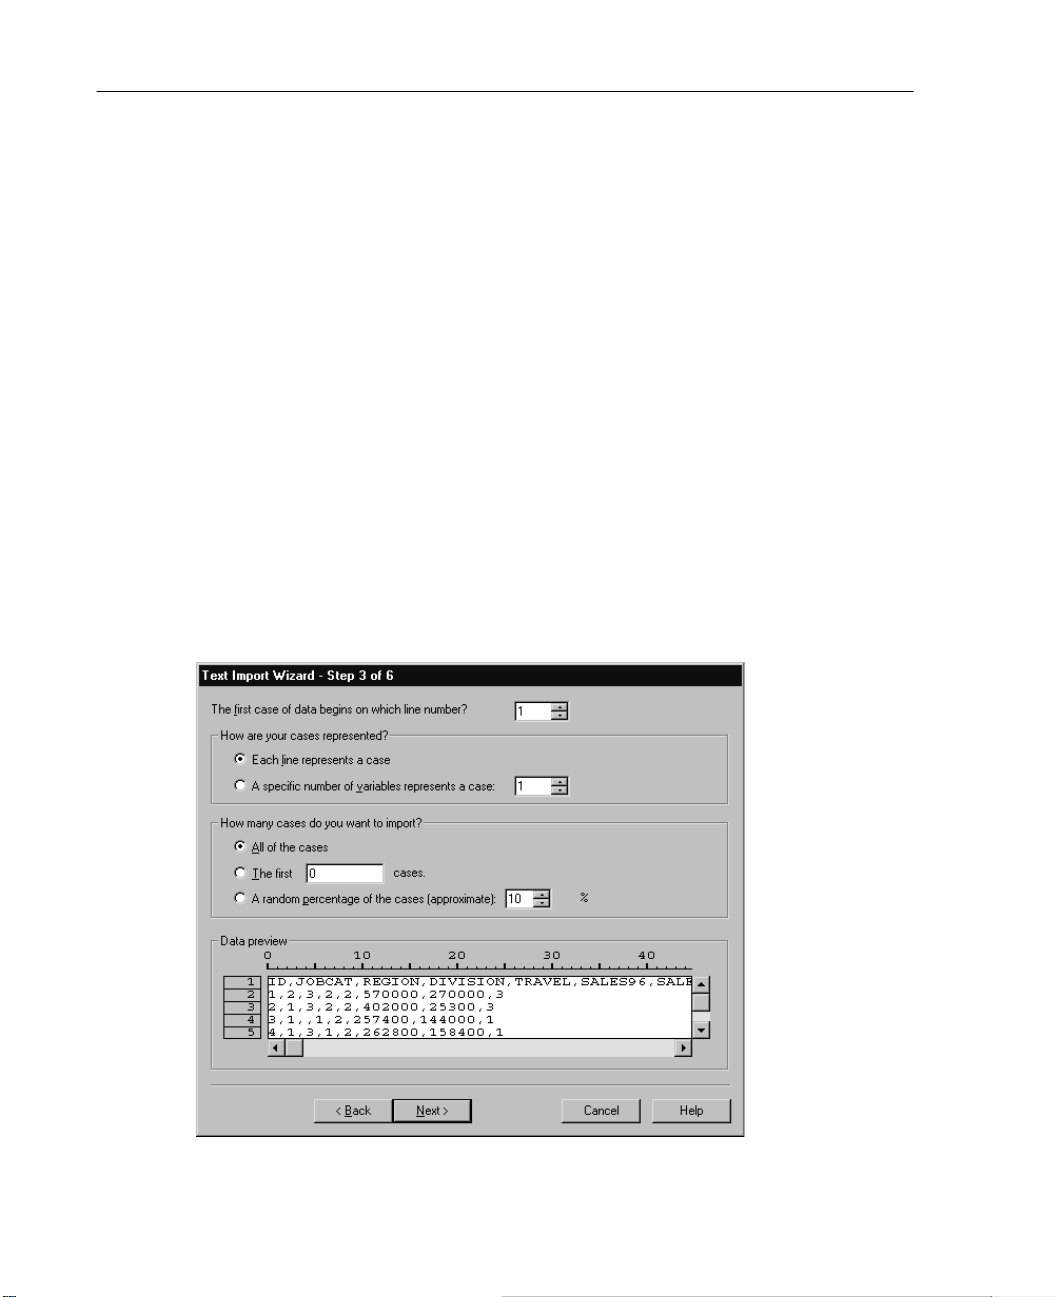
44
Chapter 3
Delimited. Spaces, commas, tabs, or other characters are used to sep arate variables.
n
The variables are recorded in the same order for each case but not necessarily in
the same column locations.
n Fixed width. Each variable is recorded in the same column location on the same
record (line) for each case in the data file. No delimiter is required between
variables. In fact, in many text data files generated by computer programs, data
values may appear to run together without even spaces separating them. The
column location determines which variable is being read.
Are variable names included at the top of your file? If the first row of the data file
contains descriptive labels for each variable, you can use these labels as variable
names. If the labels are longer tha n eight characters, they a re truncated. If the f irst eight
characters do not create a unique variable name, the name is modified to create a
unique variable name.
Text Wizard Step 3: Delimited Files
Figure 3-15
Text Wizard Step 3 for delimited files
Page 75

45
Data Files
This step provides informatio n about cases. A case is similar to a record in a database.
For example, each respondent to a questionnaire is a case.
The first case of data begins on which line number? Indicates the first line of the data file
that contains data val ues. If the top line (s) of the data f ile cont ain descri pti v e lab els or
other text that does not repre s e nt data values, this will not be line 1.
How are your cases represented? Controls how the Text W izard det ermines where eac h
case ends and the next one begins.
n Each line represents a case. Each line contains only one case. It is fairly common
for each case to be contained on a single line (row), even though this can be a very
long line for data files with a large number of variabl es. If not all lines cont ain the
same number of data values, the number of variables for each case is determined
by the line with the greatest number of data values. Cases with fewer data values
are assigned missing values for the additional variables.
n A specific number of variables represents a case. The specified number of variables
for each case tells the Text Wizard where to stop reading one case and start reading
the next. Multiple cases can be contained on the same line, and cases can start in
the middle of one line and be continued on the next line. The Text Wizard
determines the end of each case based o n t he numb er of v alues read , regardless of
the number of lines. Each case must contain data values (or missing values
indicated by delimiters) for all variables, or the data file will be read incorrectly.
How many cases do you want to import? Y ou can import all cases in the data file, the first
n cases (n is a number you specify), or a random sample of a specified percentage.
Since the random sampling routin e makes an independent pseu do-random decision for
each case, the percentage of cases selected can only approximate the specified
percentage. The more cases there are in the data f ile, the closer the percentag e of cases
selected is to the specified percentage.
Page 76
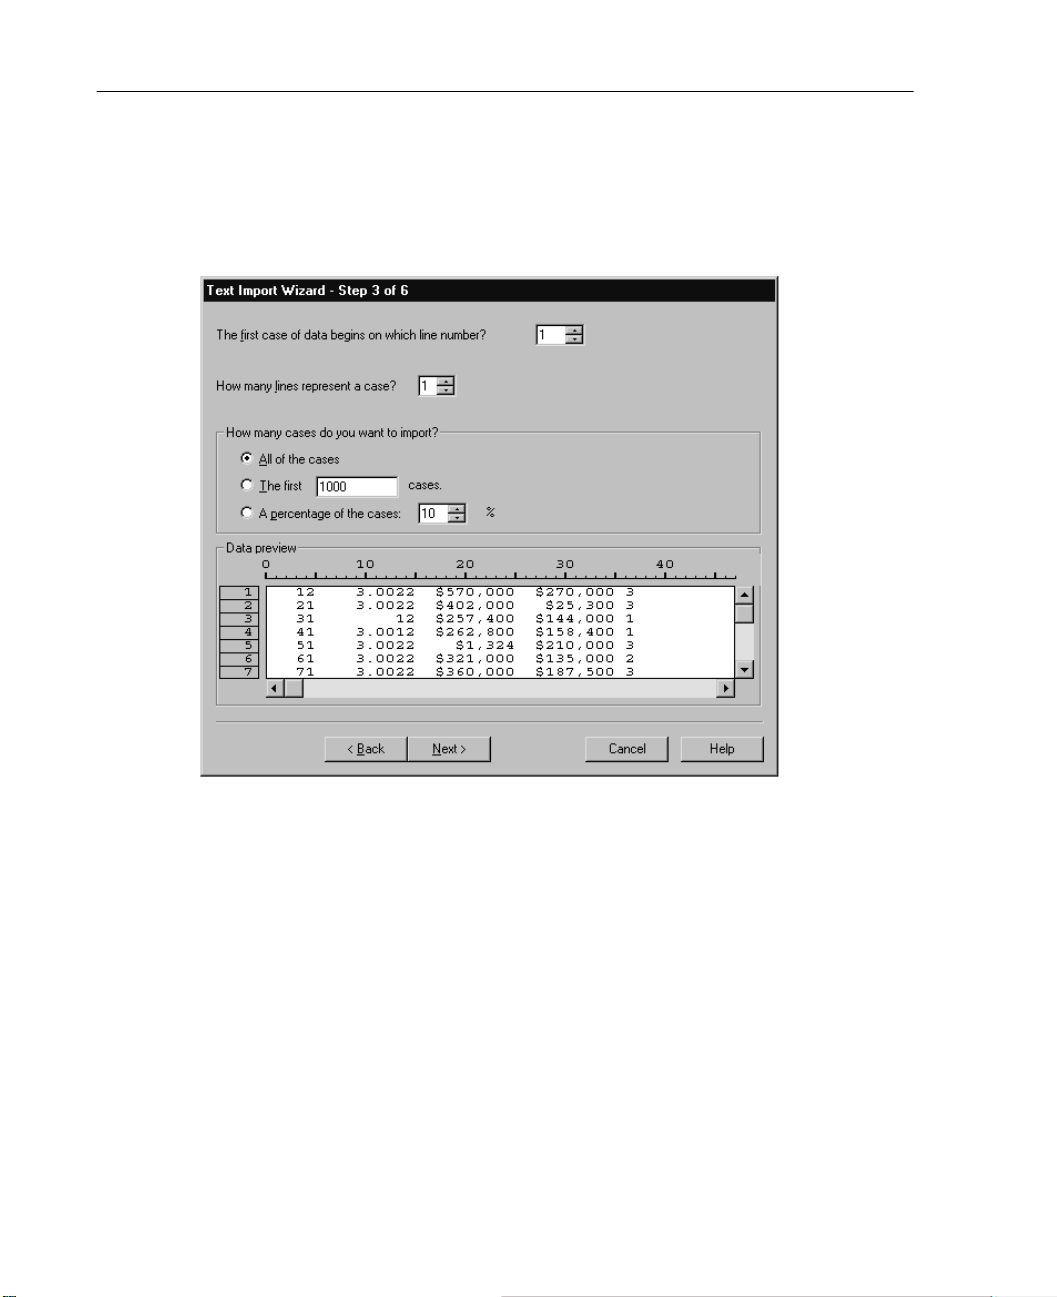
46
Chapter 3
Text Wizard Step 3: Fixed-Width Files
Figure 3-16
Text Wizard Step 3 for fixed-width files
This step provides information about cases. A case is similar to a record in a database.
For example, each respondent to questionnaire is a case.
The first case of data begins on which line number? Indicates the first line of the data file
that contains data val ues. If the top line (s) of the data f ile contain descri ptive labels or
other text that does not represent data values, this will not be line 1.
How many lines represent a case? Controls how the T ext W izard determines where each
case ends and the next one begins. Each variable is defined by its line number within
the case and its column location. You n eed to speci fy the number of lines for ea ch case
to read the data correctly.
How many cases do you want to import? You can import all cases in the data file, the f irst
n cases (n is a number you specify), or a random sample of a specified percentage.
Since the random sampling routin e makes an independent pseudo-r andom decision for
Page 77
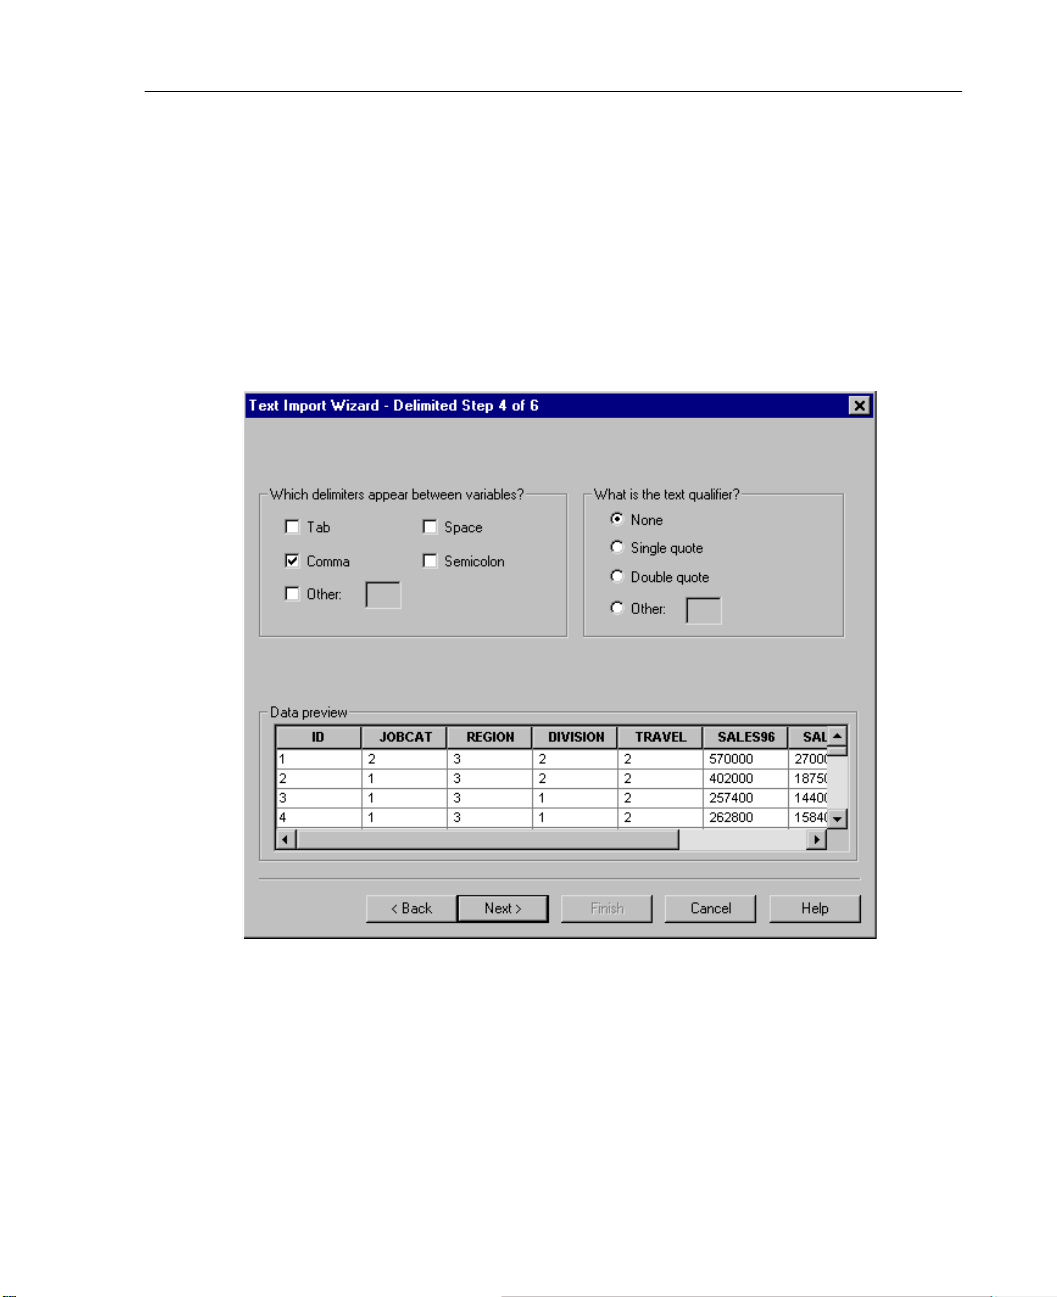
each case, the percentage of cases selected can only approximate the specified
percentage. The more cases there are in the data f ile, the closer the percentag e of cases
selected is to the specified percentage.
Text Wizard Step 4: Delimited Files
Figure 3-17
Text Wizard Step 4 for delimited files
47
Data Files
This step displays the Text Wi zard’s best guess on ho w to read the data f i le and allo ws
you to modify how the Text Wizard will read variables from the data file.
Which delimiters appear between variables? Indicates the characters or symbols that
separate data values. You c an select any combination of spaces, commas, semico lons,
tabs, or other chara ct ers. Multiple, consecutive delimiters without in tervening data
values are treated as missing values.
Page 78
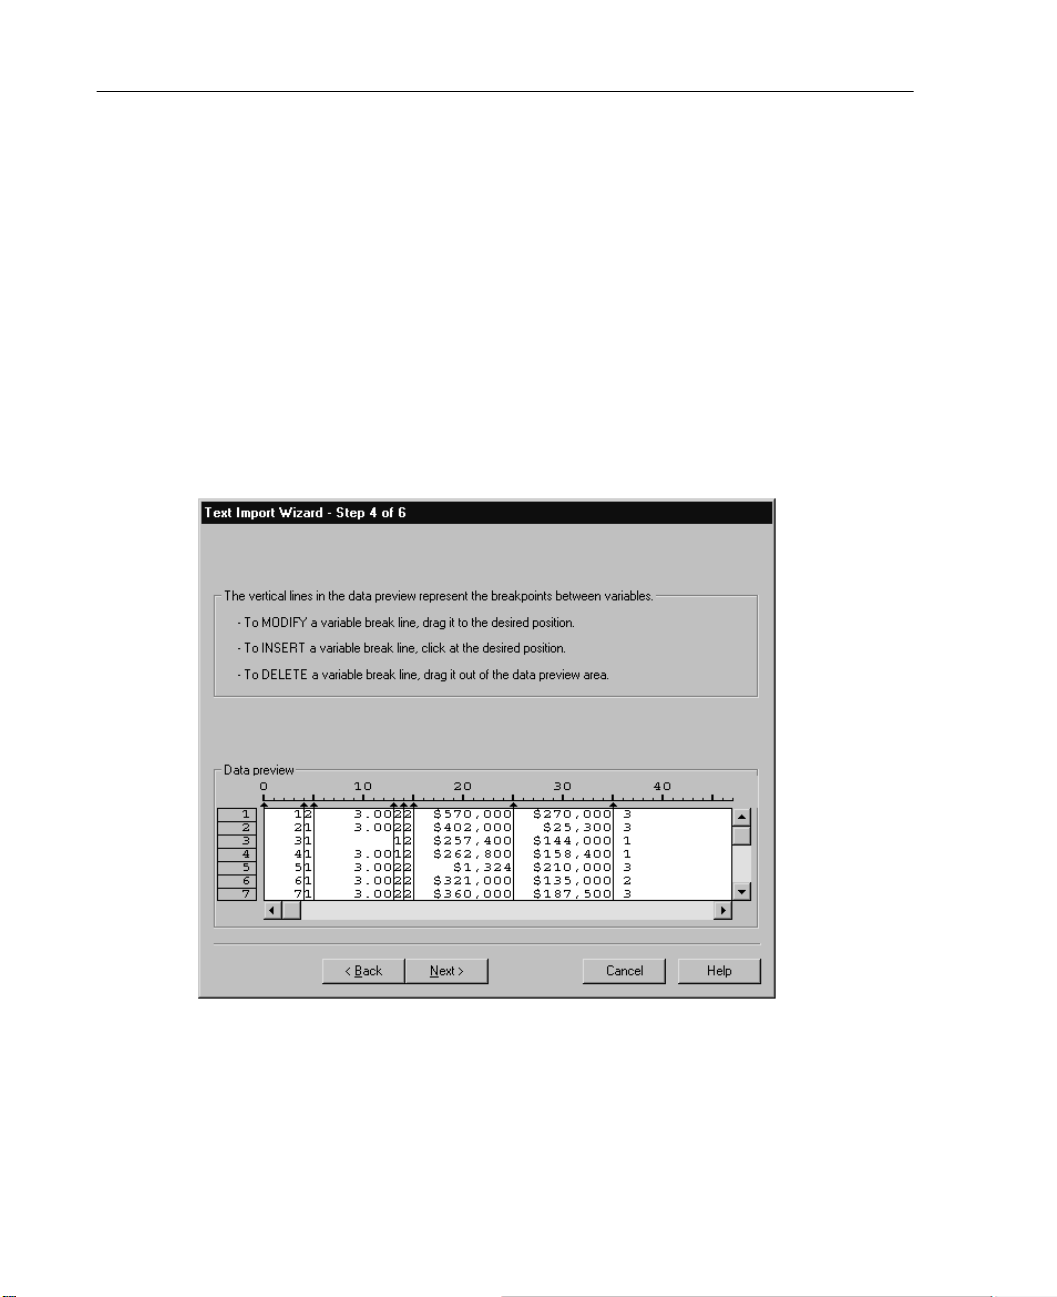
48
Chapter 3
What is the text qualifier? Characters used to enclose values that contain delimiter
characters. For example, if a comma is the del i miter, values that contain commas will
be read incorrectly unless there is a text qualifier enclosing the value, preventing the
commas in the value from being interpreted as delimiters bet ween values. CSV-format
data files expor ted from Ex cel use a doubl e quo tat i on mark ( ") as a te xt qualifier. The
text qualifier appears at both the beginning and the end of the value, enclosing the
entire value.
Text Wizard Step 4: Fixed-Width Files
Figure 3-18
Text Wizard Step 4 for fixed-width files
This step displays the T e xt W izard’s best guess on how to read the data file and allo ws
you to modify ho w the Text Wi zard will read v ariables from the data f ile. Vertical line s
in the preview window indicate where the Text Wizard currently thinks each variable
begins in the file .
Page 79
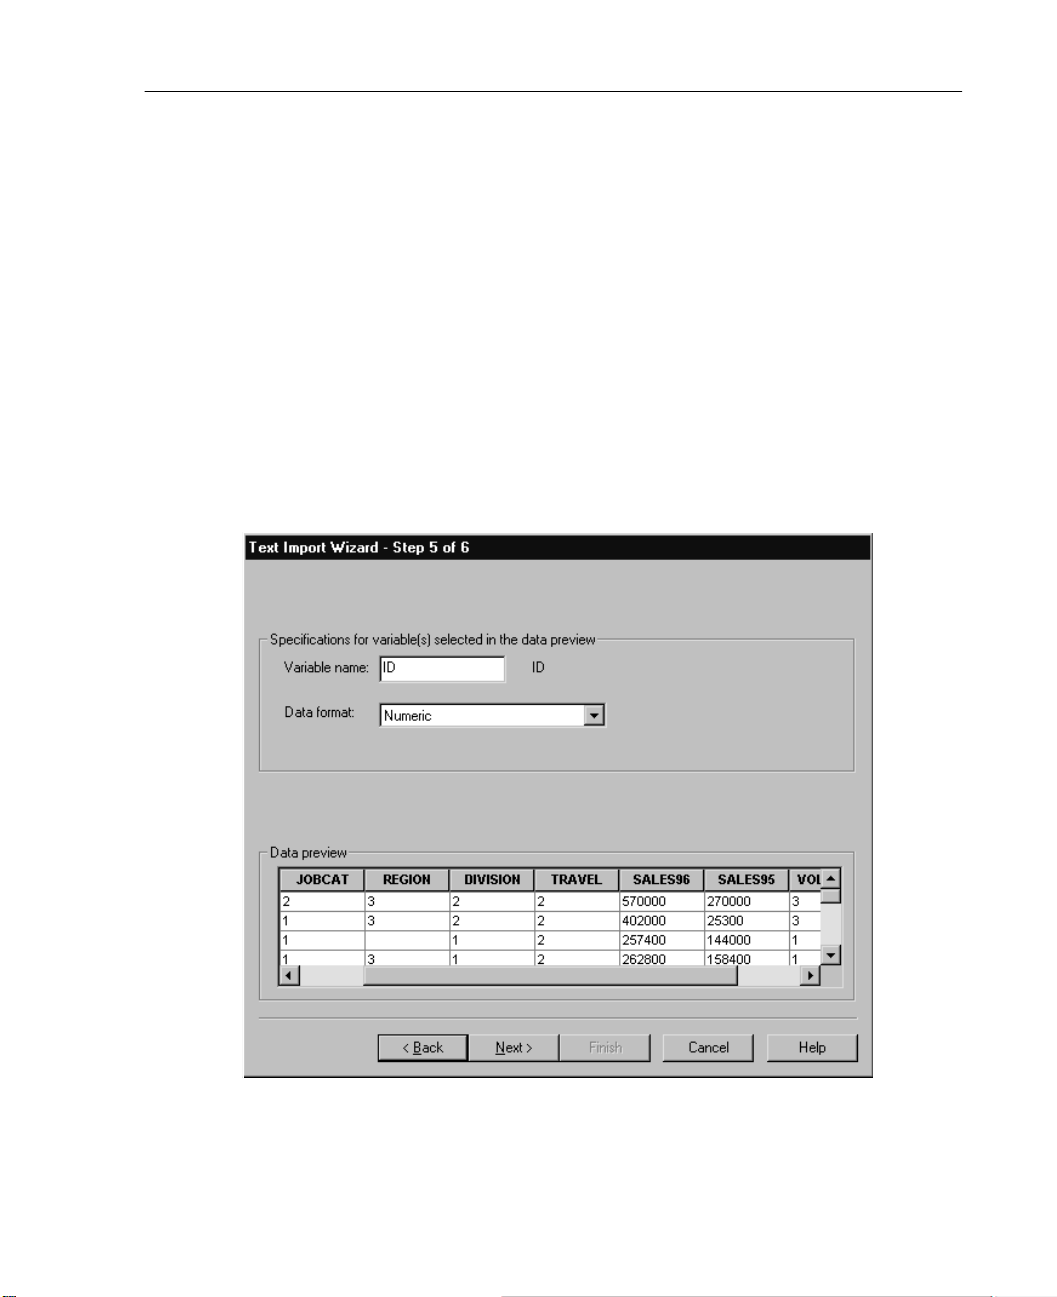
Insert, move, and delete variable break lines as necessary to separate variables. If
multiple lines are used for each case, select each line from the drop-down list and
modify the variable break lines as necessary.
Note: For computer-generated data files that produce a continuous stream of data
values with no intervening spaces or other distinguishing characteristics, it may be
difficu lt to determine where each variable be gins. Such da ta files usual ly rely on a data
definition file or some other written description that specifies the line and column
location for each variable.
Text Wizard Step 5
Figure 3-19
Text Wizard Step 5
49
Data Files
This steps controls the vari able name and t he data format that the Text W izard will use
to read each variable and which variables will be included in the final data file.
Page 80

50
Chapter 3
Variable name. You can overwrite the default variable names with your own variable
names. If you read variable names from the data file, the Text Wizard will
automatically modify variable names that are longer than eight characters or are not
unique. Select a variable in the preview window and then enter a variable name.
Variable names cannot exceed eight characters, cannot start with a number or the
pound sign (#), and cannot contain spaces.
Data format. Select a variable in the p re vie w wi ndo w and then select a fo rmat from the
drop-down list. Shift- click to select multiple contiguous v ariables or Ctrl-click to select
multiple noncontiguous variables.
Text Wizard Data Formatting Options
Formatting options for reading variables with the Text Wizard include:
Do not import. Omit the sele cted variable(s) from the imported data file.
Numeric. Valid values include numbers, a leading plus or minus sign, and a decimal
indicator.
String. Valid values include virtually any keyboard characters and embedded blanks.
For delimited files, you can specify the number of characters in the value, up to a
maximum of 255. By default, the Text Wizard sets the number of characters to the
longest string value encountered for the sele cted v ariable(s). F or f ix ed-width f il es, the
number of characters in string values is def ined by the placement of variable break lines
in step 4.
Date/Time. Valid values include dates of the general format dd-mm-yyyy, mm/dd/yyyy,
dd.mm.yyyy, yyyy/mm/dd, hh:mm:ss, and a variety of other date and time formats.
Months can be represented in digits, Roman numeral s, or three-letter abbr evia tions, or
they can be fully spelled out. Select a date format from the list.
Dollar. Valid values are numbers with an optional leading dollar sign and optional
commas as thousands separators.
Comma. Valid values include numbers that use a period as a decimal indicator and
commas as thousands separators.
Dot. V ali d values inclu de numbers that use a comma as a decimal indicator and periods
as thousands separators.
Page 81
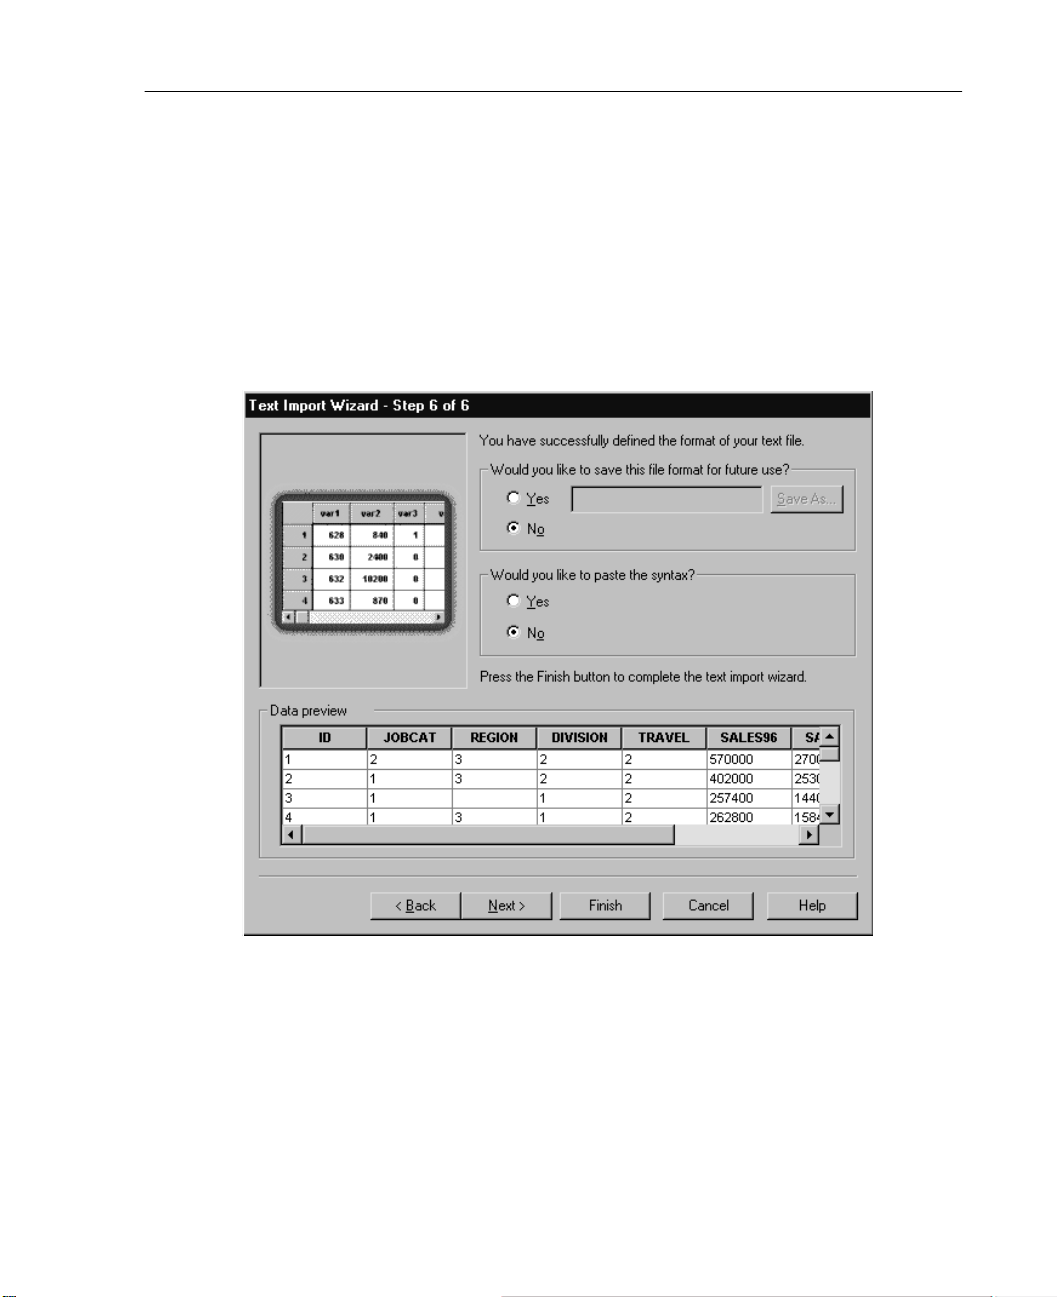
Note: Values that contain invalid characters for the selected format will be treated as
missing. Values that contain any of t he sp eci f i ed d el imit ers will be t reat ed as mul tipl e
values.
Text Wizard Step 6
Figure 3-20
Text Wizard Step 6
51
Data Files
This is the final step of the Text Wizard. You can save your specifications in a file for
use when importing similar text data files. You can also paste the synt ax ge ner ated by
the Text Wizard into a syntax window. You can then customize and/or sa ve the syntax
for use in other sessions or in production jobs.
Page 82

52
Chapter 3
File Information
A data file contains much more than raw data. It also contains any variable definition
information, including:
n Variable names
n Variable formats
n Descriptive variable a nd value labels
This information is stored in the dictionary portion of t he data file. The Data Editor
provides one way to view the variable definition information. You can also display
complete dictionary information for the working data file or any other data file.
Obtaining Data File Information
For the working data file, from the menus choose:
Utilities
File Info
For other data files, from the menus choose:
File
Display Data Info...
Select a file from the Display Data Info dialog box.
The data file information is displa yed in the Viewer.
Saving Data Files
Any changes that you make in a data file last only for the duration of the current
session—unless yo u explicitly save the changes.
Make the Data Editor the active window (click anywhere in the window to make
it active).
From the menus choose:
File
Save
The modified data file is saved, overwriting the previous version of the file.
Page 83

Saving Data Files in Excel Format
You can save your data in one of three Microsoft Excel file formats. The choice of
format depends on the version of Excel that will be used to open the data. The Excel
application cannot open an Excel file from a newer version of the application. For
example, Excel 5.0 cannot open an Excel 2000 document. However, Excel 2000 can
easily read an Excel 5.0 document.
There are a few limitations to the Excel file format that don’t exist in SPSS. These
limitations incl ude:
n Variable information, such as missing values and variable labels, is not included in
exported Excel files.
n When exporting to Exc el 97 and lat er, an optio n is provided to include val ue labels
instead of values.
n Because all Excel files are limited to 256 columns of data, only the first 256
variables are included in the exported file.
n Excel 4.0 and Excel 5.0/95 files are limited to 16,384 records, or rows of data.
Excel 97-2000 files allow 65,536 records. If your data exceed these limits, a
warning message is displayed and the data are truncated to the maximum size
allowed by Excel.
53
Data Files
Variable Types
The following table shows the variable type matching between th e original data in
SPSS and the exported data in Excel.
SPSS Variable Type Excel Data Format
Numeric 0.00; #,##0.00;...
Comma 0.00; #,##0.00;...
Dollar $#,##0_);...
Date d-mmm-yyyy
Time hh:mm:ss
String General
Page 84

54
Chapter 3
Saving Data Files in SAS Format
Special handling is given to various aspects of your data when saved as a SAS file.
These cases include:
n Certain characters that are allowed in SPSS variable names are not valid in SAS,
such as @, #, and $. These illegal characters are replaced with an underscore when
the data are exported.
n SPSS variable labels containing more than 40 characters are truncated when
exported to a SAS v6 file.
n Where they exist, SPSS variable labels are mapped to the SAS variable labels. If
no variable label exists in the SPSS data, the variable name is mapped to the SAS
variable label.
n SAS allows only one value for system-missing, whereas SPSS allows numerous
system-missing values. As a result, all system-missing values in SPSS are mapped
to a single system-missing value in the SAS file.
Save Value Labels
Y ou hav e the opti on of savi ng the v alues and v alue lab els associated with your data f ile
to a SAS syntax file. For example, when the value labels for the cars.sav data file are
exported, the generated syntax file contains:
libname library ’d:\spss\’ ;
proc format library = library ;
value ORIGIN /* Country of Origin */
1 = ’American’
2 = ’European’
3 = ’Japanese’ ;
value CYLINDER /* Number of Cylinders */
3 = ’3 Cylinders’
4 = ’4 Cylinders’
5 = ’5 Cylinders’
6 = ’6 Cylinders’
8 = ’8 Cylinders’ ;
Page 85

Data Files
value FILTER__ /* cylrec=1|cylrec = 2 (FILTER) */
0=’Not Selected’
1=’Selected’ ;
proc datasets library = library ;
modify cars;
format ORIGIN ORIGIN.;
format CYLINDER CYLINDER.;
format FILTER__ FILTER__.;
quit;
This feature is not supported for the SAS transport file.
Variable Types
The following table shows the variable type matching between th e original data in
SPSS and the exported data in SAS:
55
SPSS Variable Type SAS Variable Type SAS Data Format
Numeric Numeric 12
Comma Numeric 12
Dot Numeric 12
Scientific Notation Numeric 12
Date Numeric (Date) for example, MMDDYY10, ...
Date (Time) Numeric Time18
Dollar Numeric 12
Custom Currency Numeric 12
String Character $8
Saving Data Files in Other Formats
Make the Data Editor the acti ve window (click anywhere in the window to make it
active).
From the menus choose:
File
Save As...
Page 86

56
Chapter 3
Select a file type from the drop-down list.
Enter a filename for the new data file.
To write variable names to the first row of a spreadsheet or tab-delimit ed data file:
Click Write variable names to spreadsheet in the Save Data As dialog box.
To save value labels instead of data values in Excel 97 format:
Click Save value labels where defined instead of data values in the Save Data As
dialog box.
T o save value labels to a SAS syntax file (act ive only when a SAS f ile type is selected):
Click Save value labels into a .sas file in the Save Data As dialog box.
Saving Data: Data File Types
You can save data in the following formats:
SPSS (*.sav). SPSS format. Data files saved in SPSS format cannot be read by v ersions
of the software prior to version 7.5.
SPSS 7.0 (*.sav). SPSS 7.0 for Windows format. Data f iles saved i n SPSS 7.0 format can
be read by SPSS 7.0 and earlier versions of SPSS for Windows but do not include
defined multiple response sets or Data Entry for Windows information.
SPSS/PC+ (*.sys). SPSS/PC+ format. If the data file contains more than 500 variables,
only the first 500 will be sa ved. F or v ariables with more than on e defined user -missing
value, additional user-missing values will be recoded into the first defined user-missing
value.
SPSS Portable (*.por). SPSS portable format that can be read by versions of SPSS on
other operating systems (for example, Macintosh or UNIX).
Tab-delimited (*.dat). ASCII text files with values separated by tabs.
Fixed ASCII (*.dat). ASCII text file in fixed format, using the default wr ite formats for
all variables. There are no tabs or spaces between variable fields.
Page 87

57
Data Files
Excel 2.1–4.0 (*.xls). Microsoft Excel 2.1 spreadsheet file. The maximum number of
variables is 256, and the maximum number of rows is 16,384.
Excel 5.0/95 (*.xls). Microsoft Excel 5.0/95 spreadsheet file. The maximum number of
variables is 256, and the maximum number of rows is 16,384.
Excel 97 and later (*.xls). Microsoft Excel 97/2000/XP spreadsheet f il e. The maxi mum
number of variables is 256, and the maximum number of rows is 65,536.
1-2-3 Release 3.0 (*.wk3). Lotus 1-2-3 spreadsheet file, release 3.0. The maximum
number of variables that you can save is 256.
1-2-3 Release 2.0 (*.wk1). Lotus 1-2-3 spreadsheet file, release 2.0. The maximum
number of variables that you can save is 256.
1-2-3 Release 1.0 (*.wks). Lotus 1-2-3 spreadsheet file, release 1A. The maximum
number of variables that you can save is 256.
SYLK (*.slk). Symbolic link format for Microsoft Excel and Multiplan spreadsheet files.
The maximum number of variables that you can save is 256.
dBASE IV (*.dbf). dBASE IV format.
dBASE III (*.dbf). dBASE III format.
dBASE II (*.dbf). dBASE II format.
SAS v6 for Windows (*.sd2). SAS v6 file format for Windows/OS2.
SAS v6 for UNIX (*.ssd01). SAS v6 file format for UNIX (Sun, HP, IBM).
SAS v6 for Alpha/OSF (*.ssd04). SAS v6 file format for Alpha/OSF (DEC UNIX).
SAS v7+ Windows short extension (*.sd7). SAS version 7–8 for Windo ws short f ilena me
format.
SAS v7+ Windows long extension (*.sas7bdat). SAS version 7–8 for Windows long
filename format.
SAS v7+ for UNIX (*.ssd01). SAS v8 for UNIX.
SAS Transport (*.xpt). SAS transport file.
Page 88
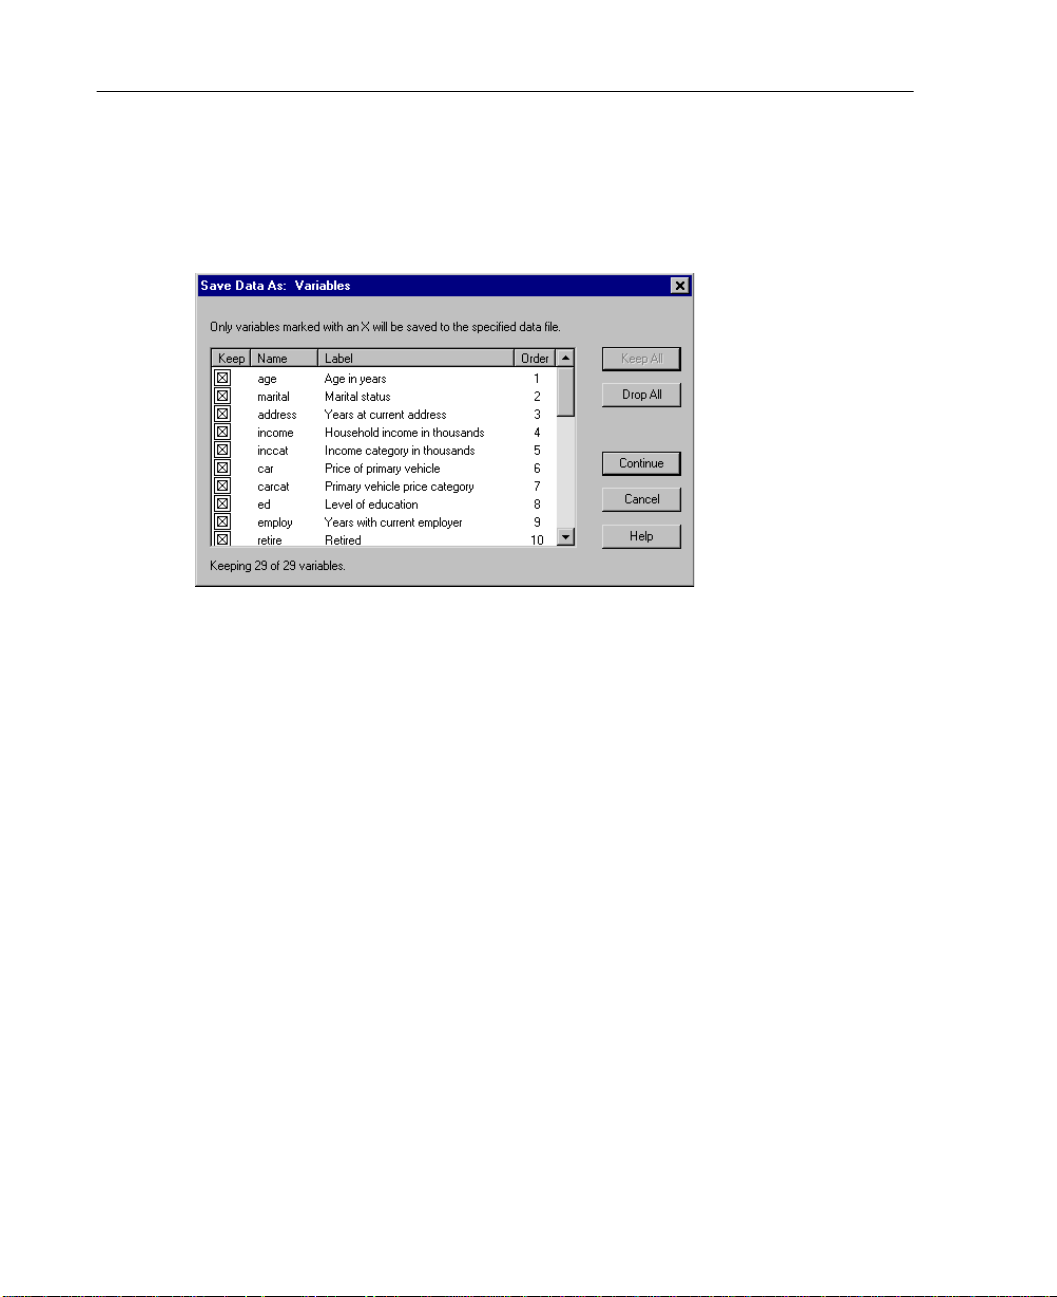
58
Chapter 3
Saving Subsets of Variables
Figure 3-21
Save Data As Variables dialog box
For data sav ed as an S PSS data f ile, t he Sa v e Dat a As Variabl es dia log box a llo ws you
to select the variables that you want to be saved in the new data file. By default, all
variables will be saved. Deselect the variables that you don’t want to save, or click
Drop All and then select the variables that you want to save.
To Save a Subset of Variables
Make the Data Editor the active window (click anywhere in the window to make it
active).
From the menus choose:
File
Save As...
Select SPSS (*.sav) from the list of fi le types.
Click Variables.
Select the variables that you want to save.
Page 89
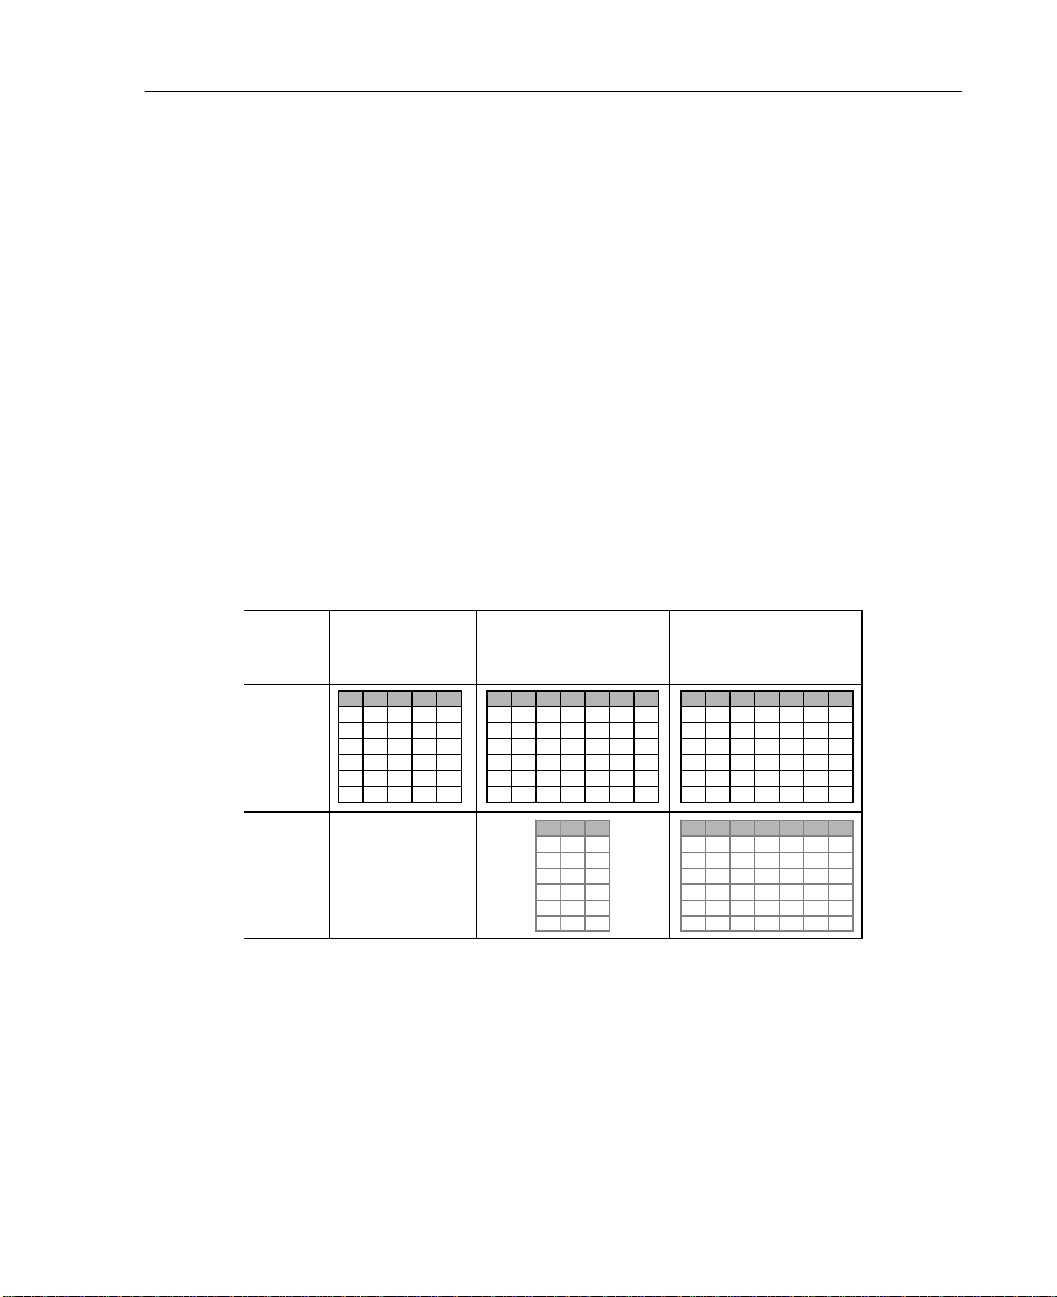
Saving File Options
For spreadsheet and tab-delimited files, you can write variable names to the first row
of the file.
Virtual Active File
The virtual active file enables you to work with large data files without requiring
equally large (or larger) amounts of temporary disk space. For most analysis and
charting procedures, the original data source is re-read each time you run a different
procedure. Procedures tha t modify the data req uire a certain amount of temporary d isk
space to keep track of the changes, and some act ions alwa ys require enough disk sp ace
for at least one entire copy of the data file.
Figure 3-22
Temporary disk space requirements
Action
Virtual
Active
File
Data
Stored
in
Temporary
Disk
Space
GET FILE = 'v1-5.sav'. REGRESSION… or
FREQUENCIES… /SAVE ZPRED.
v1 v2 v3 v4 v5 v1 v2 v3 v4 v5 v6 zpre v1 v2 v3 v4 v5 v6 zpre
11 12 13 14 15 11 12 13 14 15 16 1 11 12 13 14 15 16 1
21 22 23 24 25 21 22 23 24 25 26 2 21 22 23 24 25 26 2
31 32 33 34 35 31 32 33 34 35 36 3 31 32 33 34 35 36 3
41 42 43 44 45 41 42 43 44 45 46 4 41 42 43 44 45 46 4
51 52 53 54 55 51 52 53 54 55 56 5 51 52 53 54 55 56 5
61 62 63 64 65 61 62 63 64 65 66 6 61 62 63 64 65 66 6
None
COMPUTE v6 = …
RECODE v4…
v4 v6 zpre v1 v2 v3 v4 v5 v6 zpre
1416 1 111213141516 1
2426 2 212223242526 2
3436 3 313233343536 3
4446 4 414243444546 4
5456 5 515253545556 5
6466 6 616263646566 6
SORT CASES BY…
CACHE
59
Data Files
Actions that don’t require any temporary disk space include:
n Reading SPSS da ta files
n Merging two or more SPSS data files
n Reading database tab le s with the Database Wizard
n Merging an SPSS data file with a database table
n Running procedures that read data (for example, Frequencies, Crosstabs, Explore)
Page 90

60
Chapter 3
Actions that create one or more columns of data in temporary disk space include:
n Computing new variables
n Recoding existing variables
n Running procedures that create or modify v ariables (for example, saving pred icted
values in Linear Regression)
Actions that create an entire copy of the data file in temporary disk space include:
n Reading Excel files
n Reading text data files with the Text Wizard
n Running procedures that sort data (for example, Sort Cases, Split File, Report
Summaries in Rows/Columns)
n Reading data with GET TRANSLATE or DATA LIST commands
n Using the Cache Data facility or the CACHE command
n Launching other applications from SPSS that read the data file (for example,
AnswerTree, DecisionTime).
Note: The
GET DATA command provides functionality comparable to DATA LIST,
without creating an entire cop y of the data f ile in temporary di sk space. The
and
REPORT commands in command syntax do not sort the data file and therefore do
not create a copy of the data file. Both commands, however, require sorted data for
proper operation, and the dialog box interface for these procedu re s wil l aut omati cal ly
sort the data file, resulting in a complete copy of the data file.
Creating a Data Cache
Although the virtual active file can vastly reduce the amount of temporary disk space
required, the absence of a temporary copy of the “active” file means that the original
data source has to be re-read for each procedure. For data tables read from a database
source, this means the SQL query that reads the information from the database must be
re-executed for any command or procedur e that needs to read th e data. Since virtually
all statistical analysis procedures and charting procedures need to read the data, the
SQL query is re-ex ecute d for each pr ocedure you r un, which ca n result in a signif icant
increase in processing time if you run a large number of procedures.
SPLIT FILE
Page 91

If you have sufficient disk space on the computer performing the analysis (either
your local computer or a remote server), you can eliminate multiple SQL queries and
improve processing time by creating a data cache of the active file. The data cache is
a temporary copy of the complete data table.
To Create a Data Cache
From the menus choose:
File
Cache Data
Click OK or Cache Now.
OK creates a data cache the next time the p rogram reads the data (for examp le, the next
time you run a statistical procedure), which is usually what you want since it doesn’t
require an extra data pass.
shouldn’t be necessary under most circumstances.
Cache Now creates a data cache immediately, which
Cache Now is useful primarily for
two reasons:
61
Data Files
n A data source is “locked” and can’t be updated by anyone until you end your
session, open a different data source, or cache the data.
n For large data sources, scrolling t hrou gh the con tents of t he Data view i n th e Data
Editor will be much faster if you cache the data.
Page 92

Page 93

Distributed Analysis Mode
Distributed analysis mode allows you to use a computer other than your local (or
desktop) computer to do memory-intensive work for you. Since remote servers used
for distributed analysis are typically more powerful and faster than your local
computer, appropriate use of distributed analysis mode can significantly reduce
computer processing time. Distributed analysis with a remote server can be useful if
your work involve s :
n Large data files, particularly data read from database sources.
n Memory-intensive tasks. Any task that seems to take a long time i n local analysis
mode might be a good candidate for distributed analysis.
Chapter
4
Distributed analysis af fects only data-related tasks, such as reading da ta, transforming
data, computing new variables, and calculating statistics. It has no effect on tasks
related to editing output, such as manipulating pivot tables or modifying charts.
Note: Distributed anal ysis is ava ilable only if you ha ve both a lo cal version and access
to a licensed server version of the software installed on a remote server.
Distributed versus Local Analysis
Following ar e some gui del i nes that yo u mi ght find useful for choosing distrib ut ed o r
local analysis mode:
Database access. Jobs that perform database queries may run faster in distributed
mode if the server has supe rior access to the database or if the server is running on the
same machine as the database engine. If the necessary database access software is
63
Page 94

64
Chapter 4
available only on the server, or if your network administrator does not permit you to
download lar ge da ta t abl es, yo u wil l be abl e to access t he dat abase onl y in distr i buted
mode.
Ratio of computation to output. Commands that perform a lot of computation and
produce small output results (for example, fe w and small pivo t tables, brief text results,
few or simple charts) have the most to gain from runn ing in distributed mode. The
degree of impro vement depends lar gel y on the co mputing po wer of the remote server.
Small jobs. Jobs that run quickly in local mode will almost always run slower in
distributed mode because of inherent client/server overhead.
Charts. Case-oriented charts, such as scatterplots, regression residual plots, and
sequence charts, require raw data on your local computer. For large data files or
database tables, this can result i n slower performance in distributed mode because the
data have to be sent from the remote server to your local computer. Other charts are
based on summarized or aggregated data and should perform adequately because the
aggregation is performed on the server.
Interactive graphics. Since it is possible to save raw data with interactive graphics (an
optional setting), thi s can result in large amounts of data bein g transferred from the
remote server to your local computer, significantly increasing the time it takes to save
your results.
Pivot tables. Large pivot tables may take longer to create in distributed mode. This is
particularly true for the OLAP Cubes p rocedure and tabl es that contain i ndividu al case
data, such as those available in the Summarize procedure.
Text output. The more text that is produced, the slower it will be in distributed mode
because this text is produced on the remote server and copied to your local computer
for display. Text results have low overhead, however, and tend to transmit quickly.
Page 95
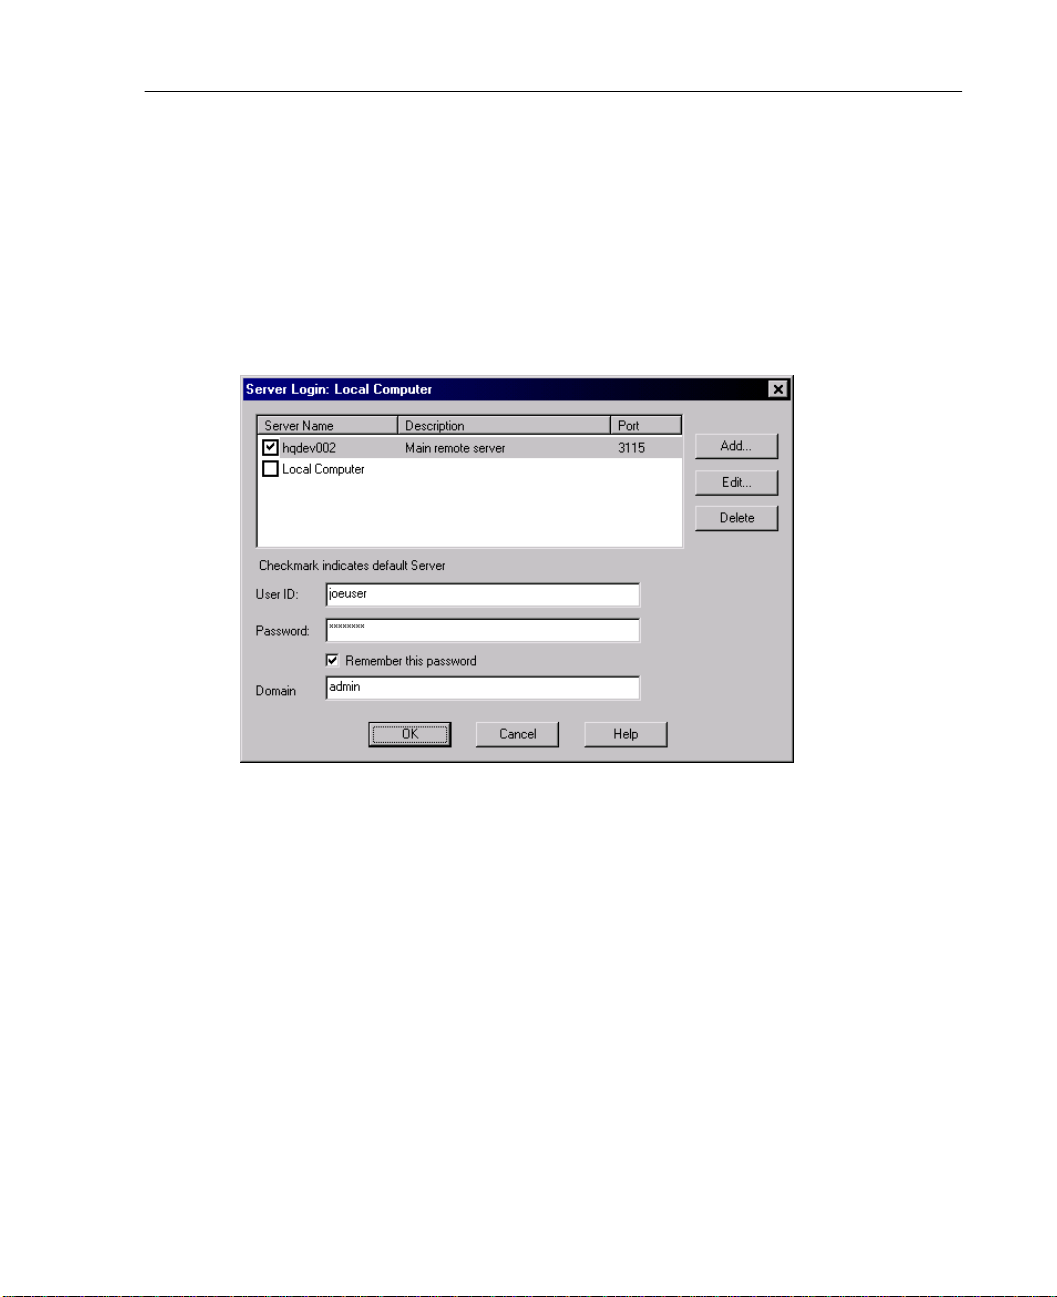
Server Login
The Server Login dialog box allows you t o select the computer t hat you want to use to
process commands and run procedures. This can be either your local computer or a
remote server.
Figure 4-1
Server Login dialog box
65
Distributed Analysis Mode
You can add, modify, or delete remote servers in the list. Remote servers usually
require a user ID and a password, a nd a domain name may also be necessary. Con ta ct
your system administrator fo r information a bout av ailab le servers, use r ID, passwords,
domain names, and other connection information.
You can select a default server and save the user ID, domain name, and password
associated with any server. You are automati cally connected to the defaul t server when
you start a new session.
Page 96
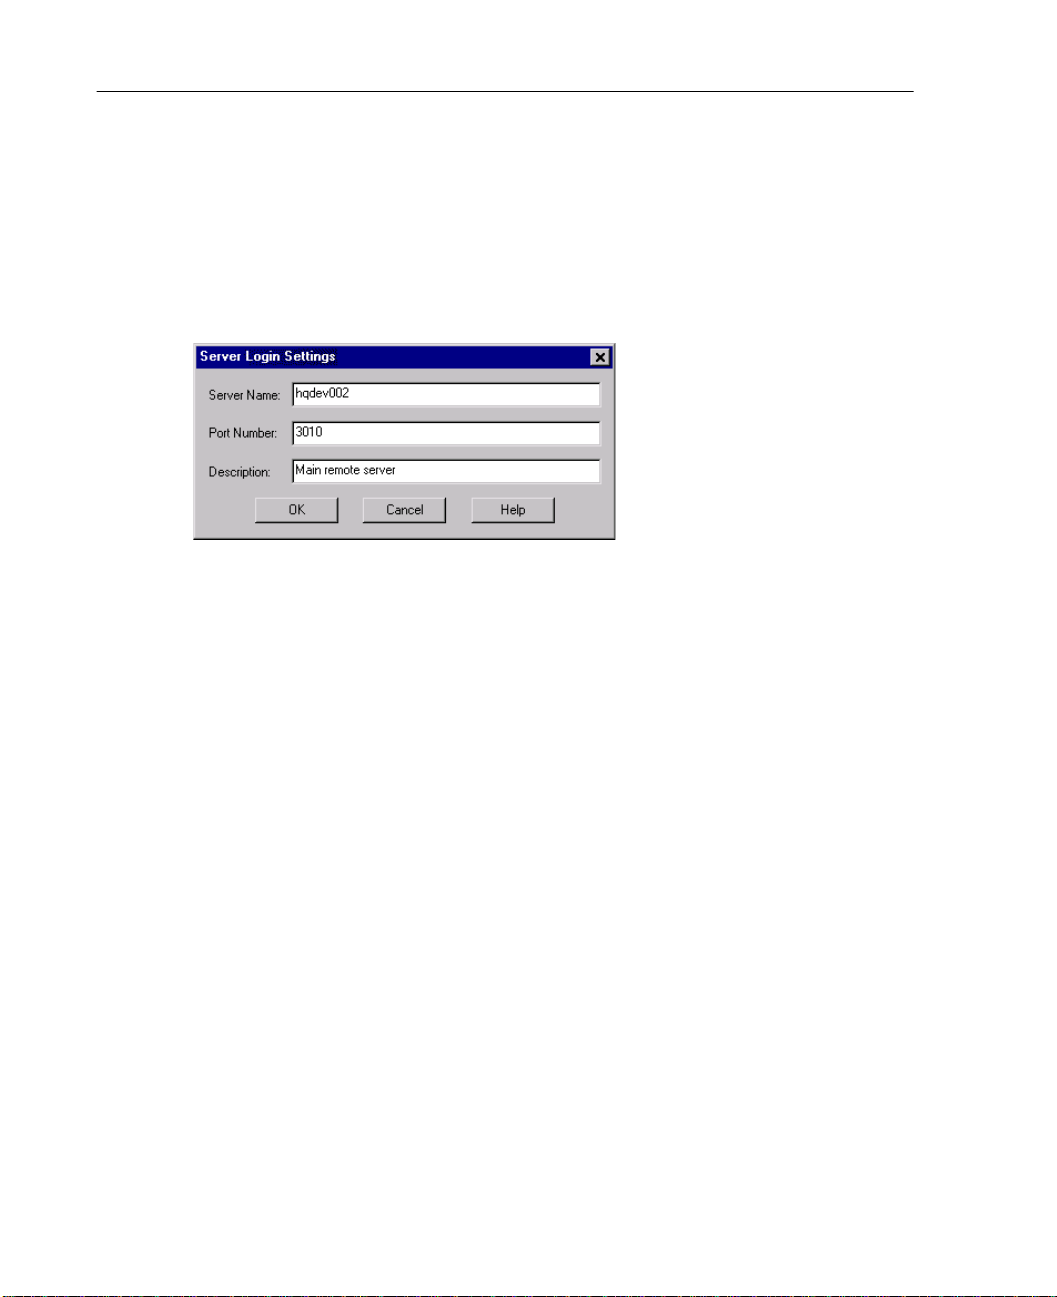
66
Chapter 4
Adding and Editing Server Login Settings
Use the Server Login Settings dialog box to add or edit connection information for
remote servers for use in distributed analysis mode.
Figure 4-2
Add Server dialog box
Contact your system administrator for a list of available servers, port numbers for the
servers, and additional connection information.
Name. A server “name” can be an alphanumeric name assigned to a computer (for
example, hqdev001) or a unique IP address assigned to a computer (example,
202.123.456.78).
Port Number. The port number is the port that the server software uses for
communications.
Description. Enter an optional descrip tion to display in the servers list.
To Select, Switch, or Add Servers
From the menus choose:
File
Switch Server...
To select a default server:
In the server list, check the box next to the server that you want to use.
Enter the user ID, domain name, and password provided by your administrator.
Page 97

Distributed Analysis Mode
Note: You are automatically conne cted to the de fault server when you start a
new session.
To switch to another server:
Select the server from the list.
Enter your user ID, domain name, and password (if necessary).
Note: When you switch server s during a session, all open windows are closed. You will
be prompted to save changes before the windows are closed.
To add a server:
Get the server connection information from your administrator.
Click Add to open the Server Login Settings dialog box.
Enter the connection information and optional settings and click OK.
67
To edit a server:
Get the revised connection information from your administrator.
Click Edit to open the Server Login Settings dialog box.
Enter the changes and click OK.
Page 98
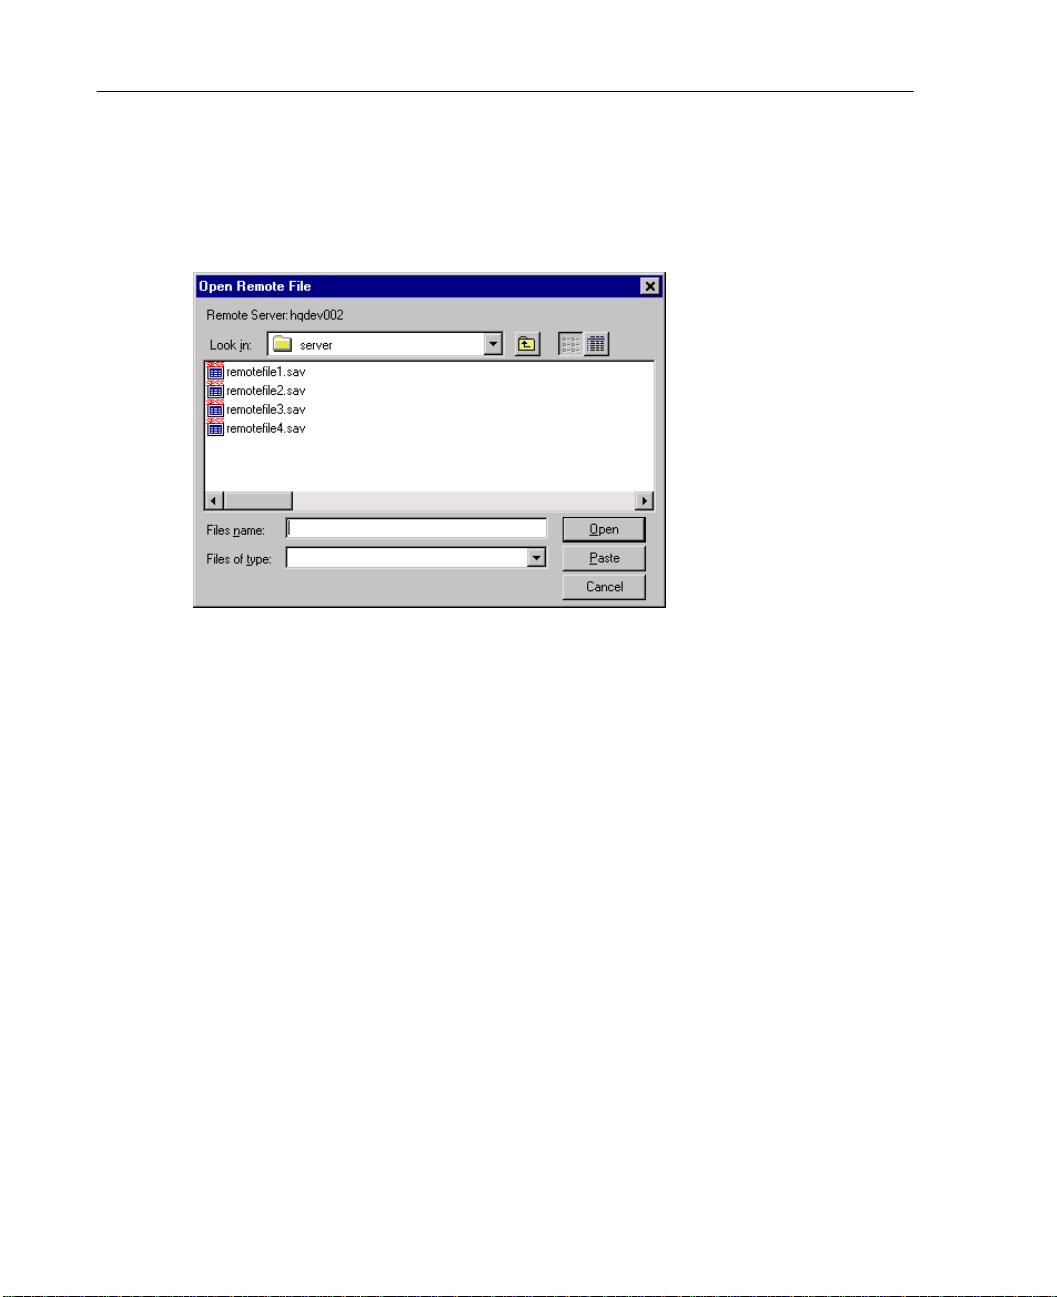
68
Chapter 4
Opening Data Files from a Remote Server
Figure 4-3
Open Remote File dialog box
In distributed analysis mode, the Open Remote File dialog box replaces the standard
Open File dialog box.
n The list of available files, fold er s, and dr iv es is depe ndent on what is avai l abl e on
or from the remote server. The current server name is indicated at the top of the
dialog box.
n You will not have access to files on your local computer in distributed analysis
mode unless you specify the drive as a shared device or the folders containi ng your
data files as shared folders.
n If the server is running a different operating system (for example, you are running
Windows and the server is running UNIX), you probably won’t have access to
local data files in distributed analysis mode even if they are in shared folders.
Only one data file can be open at a time. The current data file is automatically closed
when a new data f ile is opened. If y ou want to have multiple dat a files o pen at the same
time, you can start multiple sessions.
Page 99
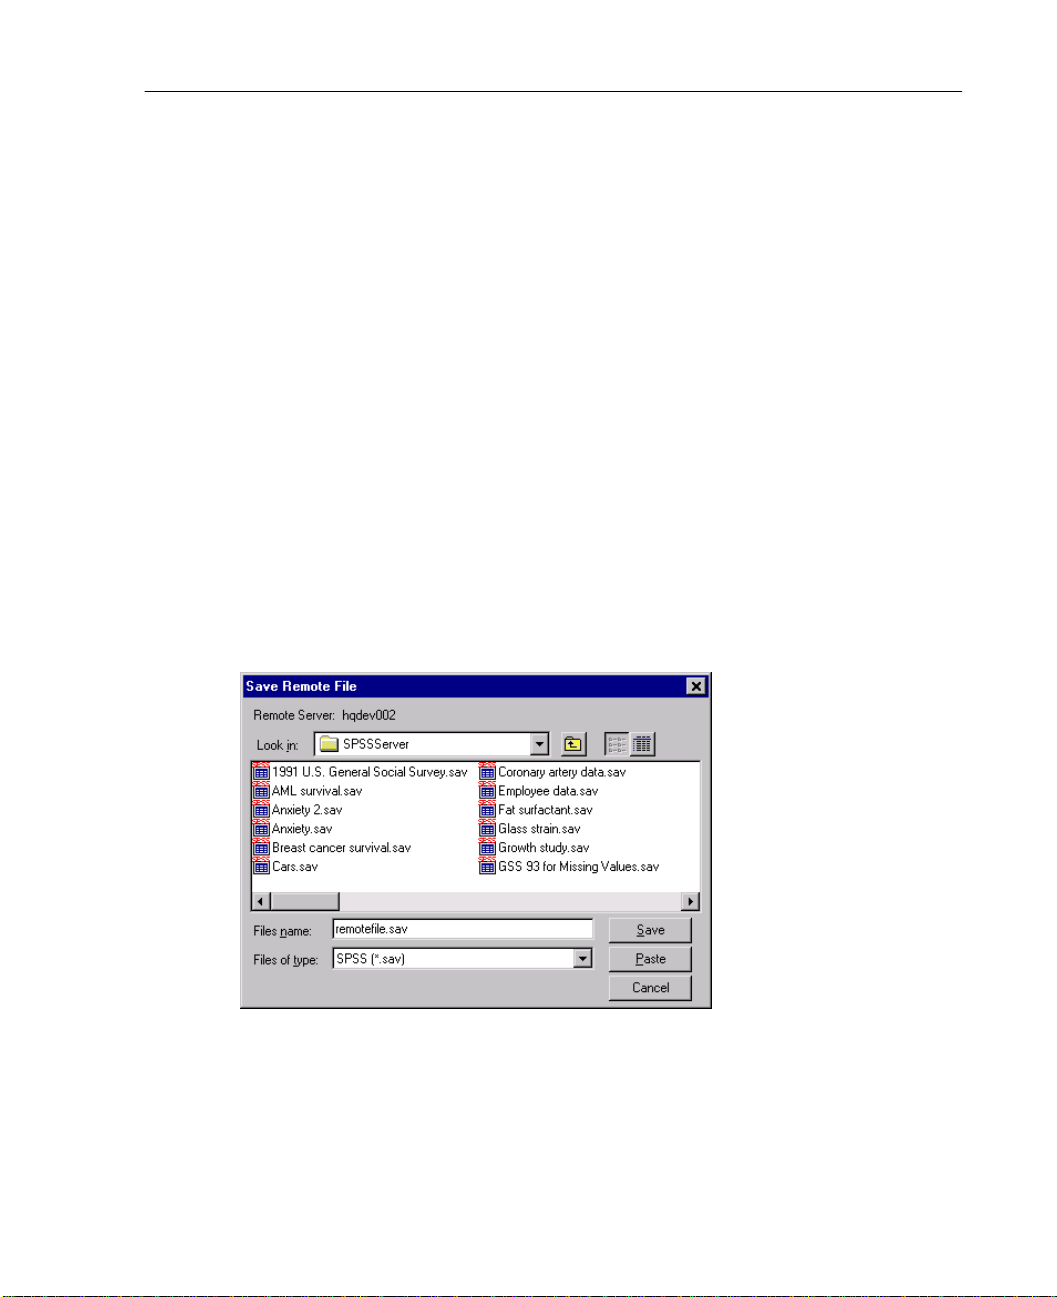
To Open Data Files from a Remote Server
If you aren’t already connected to the remote server, log in to the remote server.
Depending on the type of data file that you want to open, from the menus choose:
File
Open
Data...
or
File
Open Database
or
File
Read Text Data
Saving Data Files from a Remote Server
Figure 4-4
Save Remote File dialog box
69
Distributed Analysis Mode
In distributed analysis mode, the Save Remote File dialog box replaces the standard
Save File dialog box.
The list of available folders and drives is dependent on what is available on or from
the remote server. The current server name is indicated at the top of the dialog box.
You will not have access to folders on your lo cal computer unless you specify the drive
Page 100

70
Chapter 4
as a shared device and the folders as shared folders. If the server is run ning a di fferent
operating system (for example, you are running Windows and the server is running
UNIX), you probably won’t have access to local data fil es in distributed analysis mode
even if they are in shared folders. Permissions for shared folders must include the
ability to write to the folder if y ou want to save data files in a local folder.
To Save Data Files from a Remote Server
Make the Data Editor the active window.
From the menus choose:
File
Save (or Save As...)
Data File Access in Local and Distributed Analysis Mode
The view of data f iles, folders (directories), and dri ves for both your loc al computer and
the network is based on the comp uter you are currently using to pr ocess commands and
run procedures—which is not necessarily the computer in front of you—where you
select those commands and procedures and see the results.
Local analysis mode. When you use your local computer as your “server,” the view of
data files, folders, a nd driv es that you see i n the file access dialog box (for opening data
files) is similar to what you see in other appli cations or in the Windows Explorer . You
can see all of the data files and folders on your computer and any files and folders on
mounted network drives that you would normally see.
Distributed analysis mode. When you use another computer as a “remote server” to
run commands and procedures, the view of data files, folders, and drives represents
the view from the perspect ive of the remote se rver comp uter. Although you ma y
see familiar folder names such as Pro gram F iles and dri v es such as C, these are not
the folders and drives on your computer; they are the folders and drives on the
remote server.
 Loading...