

Page 1
Page 2
Throughout history, curiosity has been a source of inspiration,
expanding the possibilities for the future.
The fun of discovery; the joy of creation; technology that goes beyond “convenience” to touch the hearts –
these concepts have driven Sony since its founding.
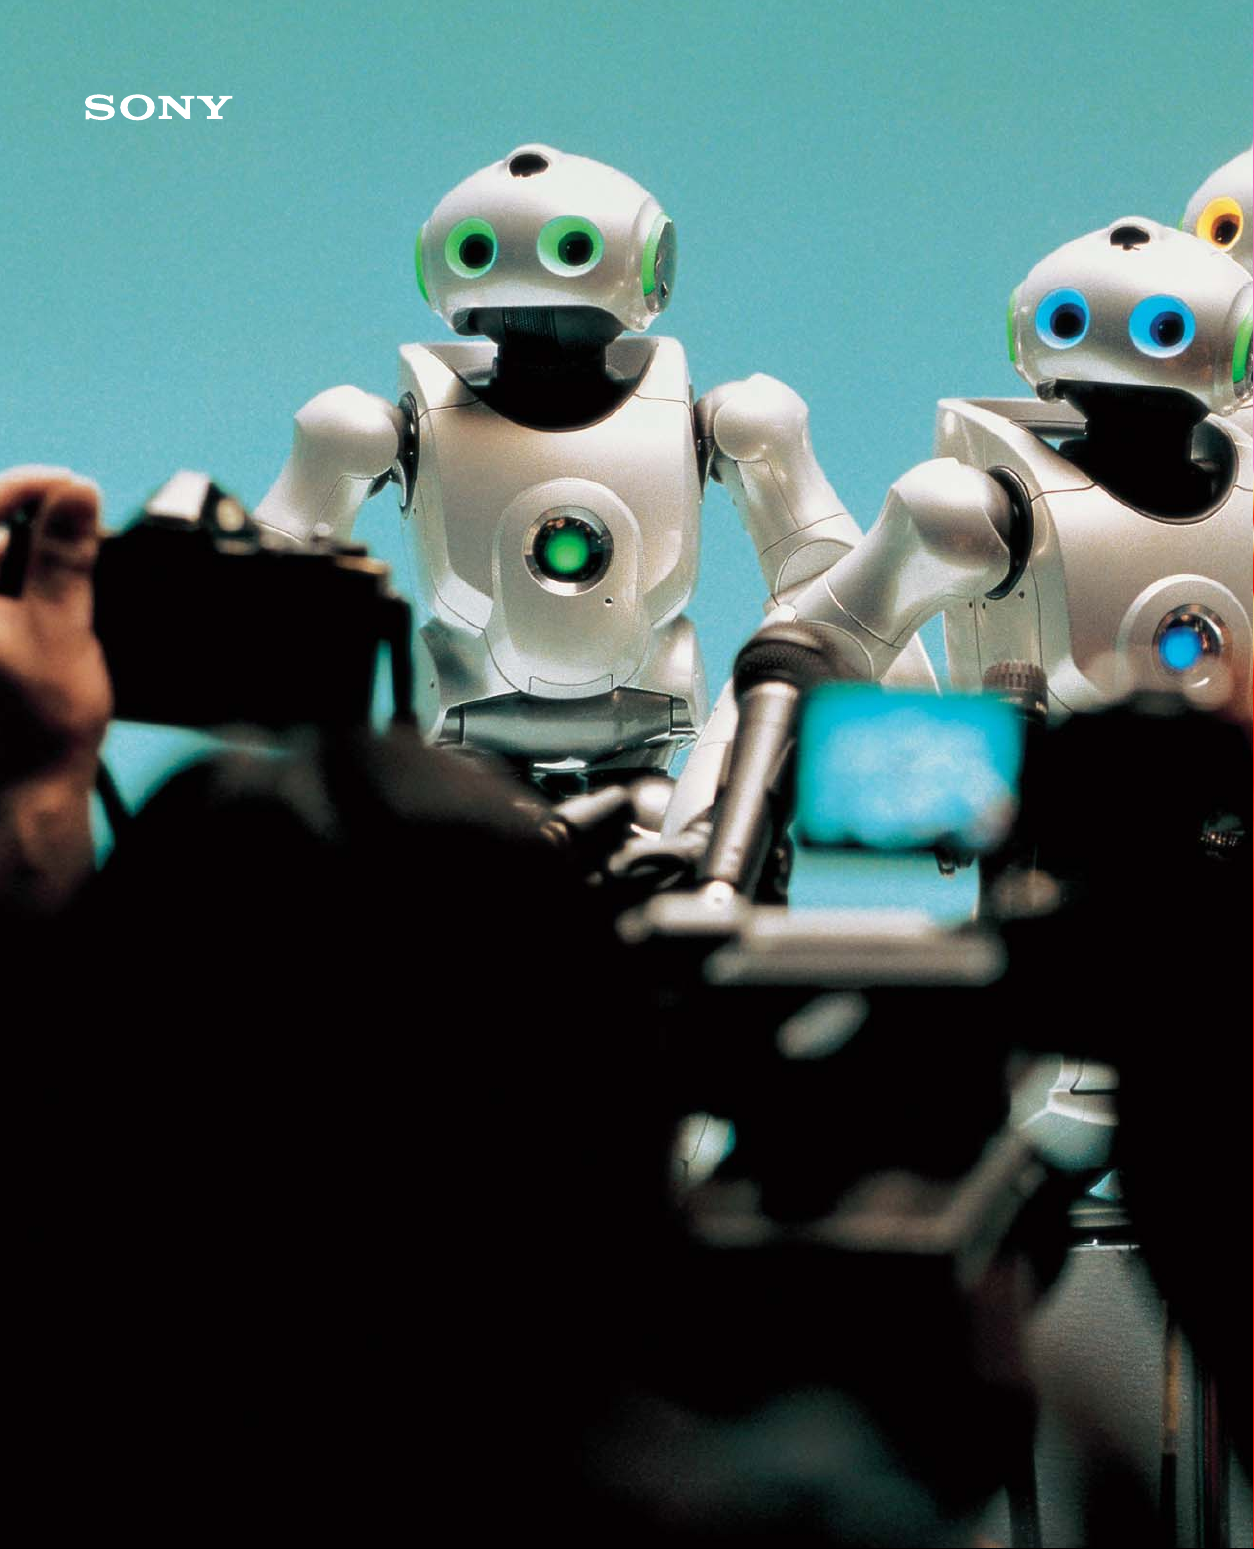
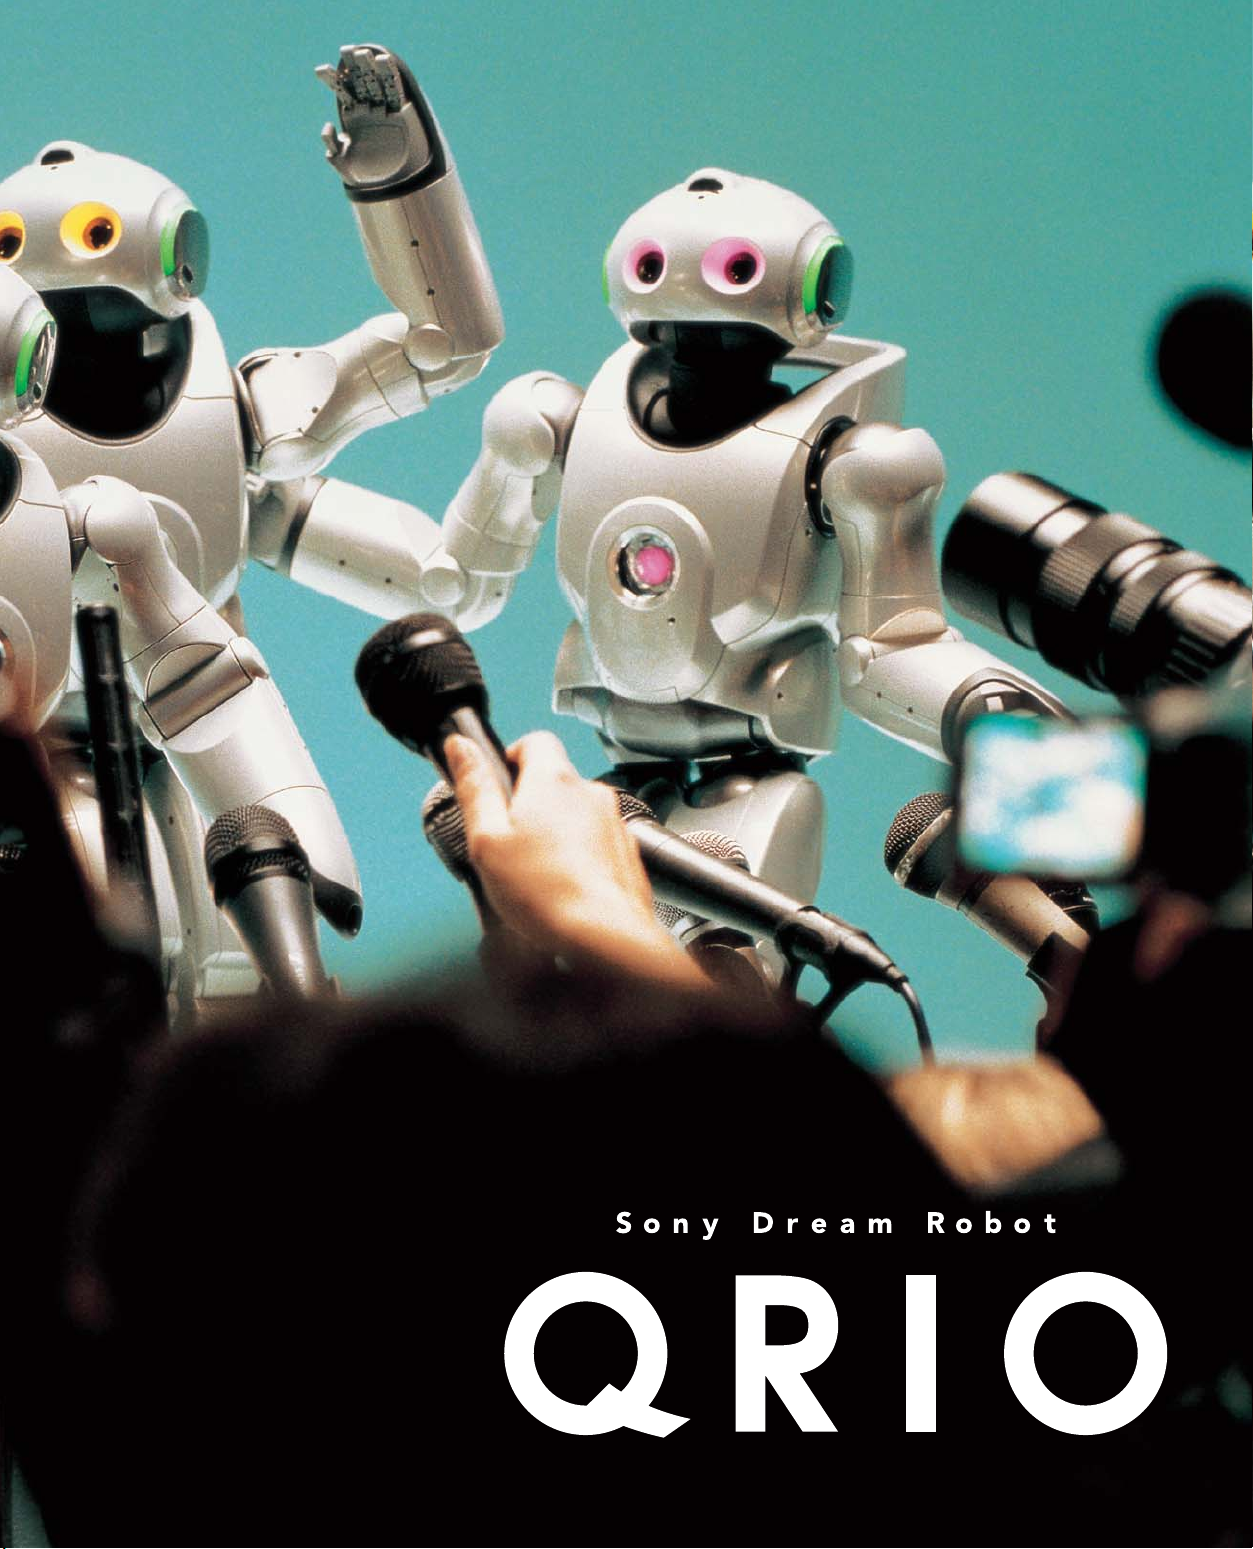
Quest for Curiosity: QRIO.
QRIO embodies Sony’s dreams and most advanced technologies in recognition,
motion control, communications, IT and AI.
Through QRIO’s continued growth and development,
Sony will pursue the infinite possibilities of curiosity.
The resulting technologies will be applied to a wide range of products and services,
beyond robots, to enhance the joy of life.
Let’s discover the future together!
Page 3
1
Page 4
To Our Shareholders
Sony continued to face a challenging business environment during the fiscal year ended March 31, 2004. Nevertheless,
our sales increased as a result of higher sales to outside customers in the Electronics segment and higher revenue in the
Financial Services segment. Measures taken to bolster our lineup of electronics products proved to be particularly
beneficial. Our aggressive launch of new products in such categories as digital still cameras, flat panel televisions and
DVD recorders led to significant sales growth during the 2003 year-end holiday season. Operating income, in contrast,
fell sharply, primarily due to an increase in restructuring expenses and research and development expenses in new
businesses that will foster growth in the years ahead.
In the fiscal year ending March 31, 2005, we will concentrate management resources in businesses with significant
growth potential, making substantial investments in such areas as next generation, multi-purpose processors and other
key components and increasing the number of internally produced key components. By producing these components
internally, we will be able to build in added value — thereby differentiating them from the rest of the market. We are
planning to introduce more products that will be recognized as distinctly “Sony” in both the home and mobile electronics
categories, as well as innovative services, including an online music distribution service. At the same time, we will
continue to strengthen our operations through restructuring initiatives and take steps to improve the efficiency of our
product development and design. Through these and other initiatives, the Sony Group will lay a firm foundation for
growth and higher profitability in the mid- to long-term.
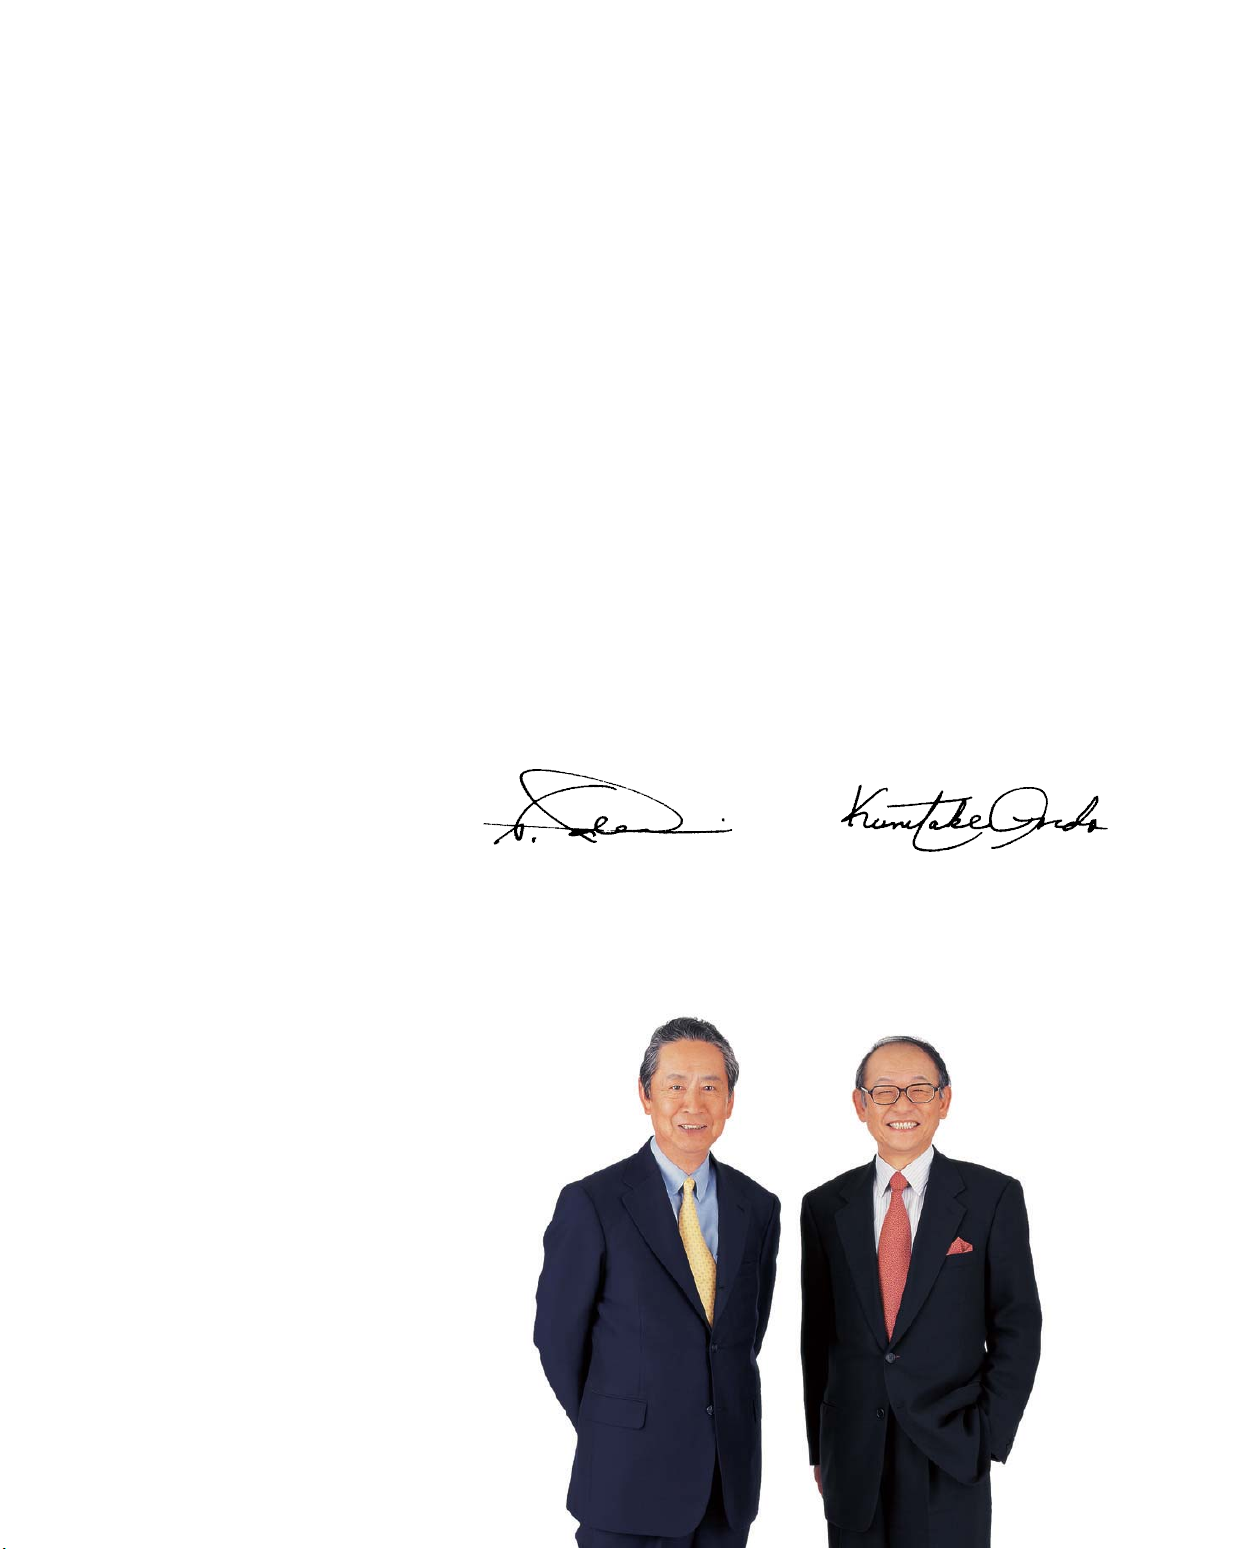
April 27, 2004
Nobuyuki Idei Kunitake Ando
Chairman and Group Chief President and Group Chief
Executive Officer Operating Officer
2
Page 5

Management Message
02 To Our Shareholders
“Continuing to be One of the World’s Leading Consumer Brands”
04
Nobuyuki Idei
07
“Operational Restructuring Aimed at Realizing Outstanding
Efficiency and High Added Value”
Kunitake Ando
Strategy
18 The Future of Key Components
24 Research and Development
28 Sony Craftsmanship
Convergence
40
– A Key to Sony’s Constant Transformation
• Home Electronics
• Mobile Electronics
• Game
• Entertainment
• Financial Services
• Other
Products
11 Sony Products File 01-06
• File 01 – Flat Panel Television “WEGA”
• File 02 – DVD Recorder “Sugoroku”
• File 03 – DVD Recorder “PSX”
• File 04 – PC “VAIO”
• File 05 – Digital Still Camera “Cybershot”
• File 06 – Video Camera “DVD Handycam”
Topics
36 At a Glance: Operating Performance Highlights
55 Sony’s Advertising Around the World
56 Corporate Governance
58 New Members of the Board and Corporate
Executive Officers
107 Investor Information
Report
30 The Inside Story from Sony’s
Nagasaki Fab
People
Sony with You
10 Claude Nobs
23 Eikou Sumura
34 Alejandro M. Lopez
35 Lance Lee
Financial Section
59 Consolidated Financial Information
105 Stock Information
106 Stock Acquisition Rights and Bond Information
Cautionary Statement
Statements made in this annual report with respect to Sony’s current plans, estimates, strategies and beliefs and other statements that are not historical facts are forward-looking statements about the future
performance of Sony. Forward-looking statements include, but are not limited to, those statements using words such as “believe”, “expect”, “plans”, “strategy”, “prospects”, “forecast”, “estimate”,
“project”, “anticipate”, “aim”, “may” or “might” and words of similar meaning in connection with a discussion of future operations, financial performance, events or conditions. From time to time, oral or
written forward-looking statements may also be included in other materials released to the public. These statements are based on management’s assumptions and beliefs in light of the information currently
available to it. Sony cautions you that a number of important risks and uncertainties could cause actual results to differ materially from those discussed in the forward-looking statements, and therefore you
should not place undue reliance on them. You also should not rely on any obligation of Sony to update or revise any forward-looking statements, whether as a result of new information, future events or
otherwise. Sony disclaims any such obligation. Risks and uncertainties that might affect Sony include, but are not limited to (i) the global economic environment in which Sony operates, as well as the
economic conditions in Sony’s markets, particularly levels of consumer spending; (ii) exchange rates, particularly between the yen and the U.S. dollar, the euro and other currencies in which Sony makes
significant sales or in which Sony’s assets and liabilities are denominated; (iii) Sony’s ability to continue to design and develop and win acceptance of its products and services, which are offered in highly
competitive markets characterized by continual new product introductions, rapid development in technology and subjective and changing consumer preferences (particularly in the Electronics, Game, Music
and Pictures segments); (iv) Sony’s ability to implement successfully personnel reduction and other business reorganization activities in its Electronics, Music and Pictures segments; (v) Sony’s ability to implement successfully its network strategy for its Electronics, Music, Pictures and Other segments and to develop and implement successful sales and distribution strategies in its Music and Pictures segments in
light of the Internet and other technological developments; (vi) Sony’s continued ability to devote sufficient resources to research and development and, with respect to capital expenditures, to correctly
prioritize investments (particularly in the Electronics segment); (vii) the success of Sony’s joint ventures and alliances; and (viii) the risk of being able to obtain regulatory approval and successfully form a
jointly owned recorded music company with BMG. Risks and uncertainties also include the impact of any future events with material unforeseen impacts.
33
Page 6

Continuing to be one
of the world’s leading
consumer brands
– Nobuyuki Idei, Chairman
By successfully executing “Transformation
60,” Sony is enacting bold reforms that will
create new value and generate growth
What is your assessment of the current
operating environment, and what are
Sony’s primary goals in this environment?
The markets Sony is involved in are undergoing dramatic changes. In the consumer electronics industry, we are witnessing rapid
advances in cutting-edge technologies in such
areas as networks and semiconductors. The
industry has been further thrust into an age
of mega-competition by the entry of new
participants from other industries and strong
economic growth in countries such as China,
India and Russia. The needs of customers are
becoming more diverse than ever, and advances in network technologies are creating
new ways to enjoy music, movies and other
content. The pace of change will only continue to accelerate.
Sony has been a fountain of groundbreaking
ideas since its inception in 1946. The transistor
radio, the Trinitron color television and
Walkman are just a few of our many innovations that have altered people’s lifestyles. Sony’s
hallmark has always been its ability to identify
trends sparked by changes in the times and in
customer needs, and to use that insight to
create innovative products and services. Some
people believe that today’s remarkable pace
of change makes this a time of chaos. At
Sony, however, we believe this is a time of
unlimited possibilities and opportunities.
In this environment, it is vital that we initiate
reforms in order to remain a youthful, energetic
company for the 21st century. This is why we
formulated a group-wide mid-term corporate
strategy called “Transformation 60” (TR60),
scheduled for completion in 2006, Sony’s 60th
anniversary. Our objective is to position Sony as
a truly global company with an operating framework capable of withstanding dramatic shifts in
business conditions. This will allow us to remain
one of the world’s leading consumer brands.
Sony’s aim is to continue to be a leading
consumer brand and evolve as a 21stcentury global company
To this end, Sony is implementing dramatic
structural reforms and a growth strategy
based on the convergence of management
resources
Can you explain TR60 in more detail?
TR60 can be thought of as having two central
pillars. One is a structural reform to enhance
our operational profitability. The other is a
growth strategy.
The first pillar is designed to enhance the
profit structure of our businesses. We are
doing this by cutting fixed costs through the
downsizing of our workforce and the consolidation of our manufacturing, distribution and
customer service facilities. We are also endeavoring to reduce variable costs by reassessing
our strategy for the procurement of production materials.
The second pillar, our growth strategy, positions home electronics, mobile electronics and
entertainment content as core businesses and
focuses on the convergence and centralization of
management resources within the Sony Group.
In the home electronics category, we believe
that the role of the television as the centerpiece of the living room will be enhanced by its
increasing ability to be linked up with other
electronics devices and access a wide range of
content. In the mobile electronics category, we
plan to accelerate the convergence of mobile
handset communication functions and audiovisual functions, such as those found in video
cameras and digital still cameras, in a manner
similar to that in which functions have already
been added to cellular phones.
Concurrently, Sony is making substantial
investments in key components such as semiconductors that we believe are strategically
important. By increasing the proportion of
key components produced internally, we plan
to increase the proportion of added value
captured by our finished products. We believe
that this will further enhance the differentiation of our products from those of our competitors. An additional goal is to maximize
operating efficiency by leveraging information
systems to strengthen both our demand and
supply chain management operations.
Our convergence strategy for the entertainment business is equally important. We plan to
capitalize on our entertainment assets in
music, pictures and games to increase the
value of our content. At the same time, we will
accelerate the convergence of entertainment
content and electronics products, building a
new business model that is suited to the network era. Through these activities, we intend
to generate further growth in our entertainment business, positioning us even more firmly
as a global media and content company.
44
Page 7
“Transformation 60” is a road map for
transforming Sony into a global
company of the 21st century for the
year 2006, Sony’s 60th anniversary
Transformation 60
“Transformation 60” — a group-wide mid-term
corporate strategy
“Transformation 60” has set in motion sweeping reforms
for the entire Sony Group. The objective is to ensure that
Sony remains as one of the world’s leading consumer
brands in the 21st century by developing attractive
products, content and services.
• Initiate reforms to improve Sony’s profitability
• Execute growth strategies by clearly defining Sony’s business
categories and focusing the allocation of strategic technological
and management resources
5
Page 8

While continuing to be a company that evokes
fascination and excitement, the management
team is working together to build a foundation
for future growth
How did Sony perform in the fiscal year
ended March 31, 2004 vis-à-vis its mid-term
corporate strategy TR60?
Sales for the fiscal year ended March 31,
2004 increased 0.3% to ¥7,496.4 billion. Due
to restructuring expenses, operating income
fell 46.7% to ¥98.9 billion.
In the Electronics segment, we focused on
strengthening our product lineup. Sales of flat
panel televisions increased significantly. We
expanded our LCD and plasma television
product lineups, and Grand Wega, our rearprojection television achieved substantially
higher sales, especially in the U.S. We introduced several new DVD recorder models,
which led to an increase in our market share
from late 2003 to the spring of 2004. In the
intensively price competitive digital still camera
market, the success of our best selling
product, contributed to profitability. We also
retained our leading market share in the video
camera market, which remains the most
profitable category in the Electronics segment. In the PC market, another area of fierce
competition, we significantly increased profitability in our VAIO business by focusing on
value-added models.
In the Game segment, total cumulative
production shipments of the PlayStation 2
(PS2) consoles surpassed 70 million units.
Software remained strong, too, as the annual
number of units shipped increased, proving
that the PS2 business is still in its peak years. In
the Music segment, past restructuring initiatives have resulted in significant improvements
in profitability, allowing us to record an operating profit, compared with an operating loss
in the previous year, despite the continued
contraction of the global music industry. The
Pictures segment achieved record-breaking
revenues on a U.S. dollar basis due to higher
sales within the television business. In the
Financial Services segment, higher insurance
revenues, along with an improvement in
valuation gains and losses from investments,
contributed to an increase in both revenue
and profit. In April 2004, we established Sony
Financial Holdings Inc. (SFH). This financial
holding company will play a pivotal role in our
drive to create synergies among our life insurance, non-life insurance and banking businesses, and to increase the total value of our
financial services business.
What are Sony’s primary objectives for the
fiscal year ending March 31, 2005?
I view the current fiscal year as a time for Sony
to firmly execute the fundamental strategies
that were formulated in the previous fiscal year.
In the Electronics and Game segments, we
will accelerate our convergence strategy and
one of the goals is to introduce highly attractive products in both the home and mobile
electronics categories. In the home electronics
category, we intend to accomplish this by
aggressively pursuing superior display picture
quality and increasing the speed and capacity
of storage devices. We will introduce a rearprojection television with a high resolution
display device and a home server with more
than a terabyte of storage capacity. In the
mobile electronics category, through close
cooperation with Sony Ericsson Mobile
Communications AB, we will promote the
convergence of our electronics products and
wireless technologies in products such as
cellular phones and wireless LANs. New
mobile products in the pipeline include
PlayStation Portable (PSP), a handheld video
game system, and a cellular phone equipped
with FeliCa, a contactless IC card technology.
We will also continue to invest strategically in
key components such as semiconductors.
Examples of ongoing development projects
include the Cell, a next generation multi
purpose microprocessor; imaging devices like
CCDs and CMOS image sensors; display
devices; and storage devices.
As for our entertainment business, our
entertainment and electronics businesses
joined forces in May 2004 to launch a music
download service called Connect in the U.S.,
and to introduce new Sony products compatible with this service. We will see more convergence between our entertainment and
electronics businesses. At the same time, we
will continue to strengthen our capabilities in
content development and develop new business models for the coming network era.
I firmly believe that Sony will remain a
leading consumer brand in the 21st century.
Sony will continue to be a company that
evokes fascination and excitement among its
shareholders and investors, as well as among
its customers, employees and other stakeholders. The management team is dedicated
to building a new foundation that will support expansive growth in the years ahead.
66
Page 9

Operational restructuring aimed at realizing
outstanding efficiency
and high added value
Phase 2 structural reforms are a vital element of “Transformation 60.” Here,
President Kunitake Ando discusses these reforms and his vision of Sony’s future
Structural reforms are an important element of
“Transformation 60” (TR60), Sony’s mid-term
corporate strategy. Would you tell us more
about these reforms?
In 1999, Sony embarked on the first phase of
structural reforms, which included consolidating
operating bases and reducing its workforce. These
reforms produced some benefits. However, the
pace of change in Sony’s operating environment is
accelerating, as evidenced by rapid technological
progress, particularly with respect to semiconductors, and industrial realignment. To assure Sony’s
continued growth as one of the leading consumer
brands, TR60 sets forth a second phase of structural reforms, focusing primarily on our electronics business. These reforms are designed to create
an efficient, value-added operating framework
befitting a leading global company. In concrete
terms, we intend to strengthen our operating
structure through cuts in fixed costs and production
material and other variable costs, and the generation of more added value within the Sony Group,
thereby creating a foundation for implementing a
growth strategy.
For this purpose, we are implementing structural
reforms centered on five themes: (1) intensifying
our focus on strategic businesses; (2) accelerating
reform in global manufacturing activities;
(3) streamlining administrative, sales and marketing operations; (4) transforming design processes,
quality management and the procurement of
production materials; and (5) restructuring the
procurement strategy for non-production materials. In the fiscal year ended March 31, 2004, the
Sony Group, through the implementation of
initiatives to reduce fixed costs, recorded restructuring expenses of ¥168.1 billion.
Breakdown of Restructuring Expenses Recorded in the Fiscal
Year Ended March 31, 2004
(%)
Electronics
Music
Pictures
None of the above
2.7
5.7
6.4
Total:
¥168.1 billion
85.2
Early retirement
Asset sales and disposals
20.6
Total:
¥168.1 billion
79.4
77
7
Page 10

Accelerating the identification of, and focus on,
strategic businesses and shifting management
resources from mature to strategic product
categories
Please outline Sony’s plans to tighten its focus on
strategic businesses, one of the themes of the
structural reform program.
Naturally, improving earnings in the Electronics
segment, which accounts for more than 60% of
Group sales, is a central element of our profit–
structure reform measures. In our consumer electronics business, product life cycles have become
much shorter due to the increasing speed of technological progress. To focus on strategic businesses, we are dividing our electronics business
into two product categories, strategic and mature.
We are concentrating our product design and
development resources in strategic product categories where future growth is expected, such as flat
panel televisions, home servers and mobile devices.
We expect this will lead to higher efficiency and
business expansion.
To add more value to products in strategic
categories, it is essential to strengthen our lineup
of semiconductors and other key components, as
well as to produce a larger share of these components internally. With this in mind, we established
a new unit to centralize the management of the
Sony Group’s semiconductor business. The aim is
to make our semiconductor business more competitive through unified strategies. In the fiscal
year ended March 31, 2004, we designated flat
panel televisions, DVD recorders, digital still
cameras, video cameras and VAIO PCs as strategic
products. We strengthened and expanded our
product lineups in these categories and introduced
new models in a timely manner. This focus produced enormous benefits during the 2003 yearend holiday season.
In contrast to sales in strategic product categories, sales in mature product categories are expected to fall as a share of total sales. However, we
intend to raise efficiency and maximize earnings in
mature product categories by upgrading the design
and production capabilities of our manufacturing
units, as well as by outsourcing work.
Accelerating reform in manufacturing activities
What steps are you taking to accelerate the
reforms of global manufacturing activities?
The goal of our manufacturing reforms is to
achieve a qualitative shift from assembly-oriented
manufacturing to knowledge-intensive methods.
To accomplish this goal, we are reinforcing the
role of global manufacturing bases in adding value
to products. At the same time, we are reviewing
our existing manufacturing systems and overhauling design and production systems to better reflect
the characteristics of each regional market.
At each of our manufacturing facilities, we are
enhancing the technical skills involved in design and
production activities, both of which are essential to
making competitive products. Concurrently, we are
integrating the existing design, production, customer service and logistics functions of factories to
establish a more sophisticated supply chain management system. This will enable us to strengthen our
Customer Front Center (CFC) activities, which
connect us directly to retailers and end users. Based
on this concept, we are restructuring design, manufacturing, logistics and customer service functions
on a global scale. We will also implement factory
realignments and consolidations as part of this
restructuring process. Ultimately, we expect to see
higher efficiency in all manufacturing activities.
Streamlining administrative, sales and marketing operations
What kind of structural reforms are planned for
administrative, sales and marketing operations?
We are streamlining administrative, sales and
marketing operations mainly in Japan, the U.S.
and Europe. One way we are accomplishing this is
by building common platforms that can perform
administrative functions for many business units
and sites. Another is by raising white collar productivity through reviews of administrative business processes and the greater use of IT systems.
In the U.S. and Europe, we are consolidating
our operational bases in each region. In our U.S.
electronics business, for example, we are relocating
our marketing groups so that they may be closer to
our engineering, manufacturing and other headquarter functions. This move will naturally foster
greater levels of cooperation and communication,
thus strengthening our design, manufacturing, sales
and marketing operations as well as increasing the
efficiency of our administrative functions.
Along with these measures, we are revising
personnel systems in Japan. In line with the principle of matching compensation with contribution, we will rigorously implement a merit-based
compensation structure. Our plans also include
enhanced diversity in our workforce and our
employment structure. Through these and other
efforts, we are building new kinds of relationships
between Sony and its employees.
Greater cost reduction through group-wide
initiatives
How is Sony transforming design processes,
quality management and the procurement of
production materials?
We are now pushing through far-reaching reforms
in design processes, quality management and the
procurement of production materials—domains
that support the fabrication of products. In the
area of product design, we are raising efficiency
through the extensive use of standardized design
technologies and components, and becoming
more competitive by sharply reducing the time
required to formulate new designs. For production
materials, we are strategically cutting costs through
the standardization of components and the concentration of procurement with specific suppliers.
Quality is the highest priority of any manufacturer. During the fiscal year ended March 31,
2004, we initiated an exhaustive and group-wide
review of quality-related systems. We will execute
initiatives to enhance quality so that we can deliver
high-quality products to all customers.
Transforming Sony into a leading global
company through TR60 reforms
Please describe what Sony is seeking by carrying
out this second phase of structural reforms.
At Sony the most important theme is building a
powerful operating framework that can constantly
deliver products and services worthy of the Sony
name, even when our markets are undergoing
dramatic changes.
Reforms are inevitably accompanied by challenges.
The Sony Group is fortunate to have employees
who have the motivation to embrace these challenges. Our reforms and growth strategy, progressing side by side, will ensure that Sony continues to
grow as a leading company on the global stage.
(as of May 2004)
8
Page 11

Phase 2 Structural Reforms
(1) Intensifying our focus on strategic businesses
(2) Accelerating reform in global manufacturing activities
(3) Streamlining administrative, sales and marketing operations
(4) Transforming design processes, quality management and
the procurement of production materials
(5) Restructuring the procurement strategy for non-
production materials
Building a powerful operating framework
through structural reforms
9
Page 12

Producer of the
Montreux Jazz Festival,
held annually on the
shore of Lake Geneva
in Switzerland, Mr.
Claude Nobs is a big
fan of Sony products.
Sony is dedicated to creating dreams and experiences that make our
lives more enjoyable and enriching. In this section, we introduce four
Sony enthusiasts who work closely with Sony products every day.
A stellar performer at the Montreux Jazz Festival
Surrounded by Sony at home and in
the studio
Sony products, especially my P900 Sony Ericsson cellular phone, are an
essential part of my life at home and at the Montreux Sounds Video
Studio. At the studio, I use an XPRI HD (high-definition) non-linear
video production system for editing and transferring material. I also
have a D-2, Digital Betacam, Betacam SP (Super Performance) and IMX,
which I use to make copies of video clips in various formats. At home,
my favorite Sony products are my PX40 projector and 50-inch plasma
television. They’re perfect for showing my jazz festival HD video
recordings to important guests and artists. So hardly a day goes by
without Sony.
The late Ray Charles performing at the 1991 Montreux
Jazz Festival
A fascination with innovation
When Sony comes out with a new product, I buy it immediately. I recall buying the first Sony Walkman and
CD player as soon as they went on sale in Europe. I also bought the first SACD (Super Audio CD) player
model and the very first VAIO PC, even though the instruction manual was only available in Japanese. And
I’ve even owned three generations of AIBO entertainment robots.
Claude Nobs CEO, Montreux Jazz Festival
Born in Switzerland in 1936, Claude Nobs gave up a career as a chef to found the Montreux Jazz Festival in 1967. Now a 17-day event held
every July and attended by 200,000 people annually, the festival has grown to feature a wide range of music, from jazz to blues and rock.
Montreux Jazz Festival URL: http://www.montreuxjazz.com
10
Outstanding performance and ease of use
I really count on Sony at the
Montreux Jazz Festival; all my HD
video and audio recordings are
made using Sony products. One of
the best things about Sony
products is their compatibility,
even between consumer and
professional equipment. And
thanks to the compact size of Sony
video cameras and digital cameras,
I’ve been able to assemble an
extensive library of candid shots of
many artists.
Page 13

Sony
Products File
01–06
A look inside Sony’s DNA
“To establish an ideal factory that stresses a spirit of freedom and openmindedness, and where engineers with sincere motivation can exercise their technological skills to the highest level”
This statement of the purpose of incorporation from Sony’s Founding Prospectus
continues to define “Sony’s DNA,” guiding the activities of Sony engineers who
develop new technologies and products. Today, those tackling the challenge of
devising new Sony products are motivated by a single thought—to create unique
products that inspire and bring joy to consumers. The following pages take a close
look at some of these products through interviews with the developers who helped
bring them to life.
11
Page 14

Enjoy a realistic television picture
anytime, anywhere
Television powered by Wega Engine
technology
With the Wega Engine’s high-quality
picture image circuit, users can enjoy the
same breathtaking picture on any
television—LCD Wega, plasma Wega or
Grand Wega.
The Wega Engine’s high-quality picture image circuit
Studio Application, a function
that combines Sony’s expertise
in many fields
Record television programs onto a
Memory Stick and enjoy watching them
anywhere on cellular phones or personal
digital assistants.
File 01: Flat panel television “WEGA”
[KDE-P61-HX2N]
http://www.sony.net/
A stylish remote control that’s
easy to use
The Wega’s aluminum remote control
reflects Sony’s commitment to style and
functionality. Operation is as easy as
pressing the Wega Gate button and using
the jog dial to navigate the control panel
on the television screen. The jog dial
enables the smooth execution of desired
actions from the control panel menu,
which is arranged conveniently by
function.
Making the television experience
more realistic and user friendly
Powered by Wega Engine
High-definition technologies and high resolution
differentiate Sony’s televisions
Sony has almost half a century of experience in
television development. Throughout its history,
Sony has pursued the ideal in picture quality—
“realism”—by bringing transparency, depth,
sharpness and vibrant color together on the
television screen. The Trinitron television, Wega,
the culmination of Sony’s efforts to create the
ideal picture, has inspired and impressed people
everywhere.
The arrival of the broadband era has created an
environment ripe for enjoying an array of content
at home. Moreover, with digital broadcasting
becoming mainstream, demand is expanding for
televisions with higher resolution. To achieve the
same remarkable picture quality made possible
by the Trinitron display technology in plasma and
LCD televisions, as well as in the Grand Wega
rear-projection television, in 2001 Sony embarked
on a project to develop Wega Engine, a highquality, integrated digital picture system, that
capitalizes on Sony’s image processing expertise.
The most distinguishing feature of Wega
Engine is its ability to adapt to the characteristics
of various display devices, digitally processing a
variety of input signals to generate an exception-
12
ally sharp and realistic picture. Drawing on the
expertise of Sony engineers with decades of
experience in analog signal processing, the Wega
Engine’s circuitry can produce a high-quality
picture from digital and analog input signals alike.
The Wega Engine’s picture was created by optimizing the four key elements that determine
image quality—brightness, contrast, color compatibility and sharpness—and was evaluated
extensively in line with Sony’s “realism” ideal.
With Wega Engine, Sony has succeeded in
combining imaging technologies it has cultivated
over the years to create a new digital technology.
This has facilitated the development of a television with a picture so realistic that it can, for
example, precisely reproduce the natural color
and depth of a red flower, thereby creating an
entirely new dimension of viewing excitement.
Wega Gate and Studio Application—Intuitive
controls for enhanced enjoyment
Today’s televisions often come with complicated
remote controls with multiple buttons and thick
owner’s manuals that confuse many users. After
giving considerable thought to this problem,
Sony’s Product Planning Managers came up with
Wega Gate. A push of the Wega Gate button on
the television remote control brings up a control
panel on the screen that enables the user to perform a variety of tasks intuitively. Sony has also
developed Studio Application, which allows users
to watch digital images from a video camera
Handycam and television programs stored in a
VAIO PC on a Wega television. This function was
developed in response to user demand for the
ability to copy recorded television programs and
other content onto a Memory Stick for viewing on
cellular phones or personal digital assistants. With
its firm commitment to both picture quality and
ease of use, Sony achieved the leading share of the
global television market* in the fiscal year ended
March 31, 2004.
* Indicates share of the total global market (by value) for
CRT, rear-projection and flat panel televisions.
Yoshihiro Yamamoto
General Manager
Systems Technology Section
Display Solutions Department
Home Electronics Development Division
Home Electronics Network Company
Noriyasu Yamada
Product Planning Manager
FTV Product Planning Section
Product Planning Department
Television Business Division
Home Electronics Network Company
Page 15

Setting up a program recording
has never been easier
Simply choose a program that you want to
record from the electronic program guide
(EPG). Search for a program recorded on the
hard disc drive (HDD) by its title or use the
keyword recording function, which takes full
advantage of the EPG, to automatically
locate and record all programs related to a
particular keyword. With the “Manage
game extension” function, the recording
time of the baseball game or soccer match
will be extended automatically so that you
don’t miss the end of the event.
File 02: DVD recorder “Sugoroku”
[RDR-HX10]
Compatibility with various disc
formats for stress-free
recording
Dual RW compatibility means the unit
can record and play DVD+RW and DVDRW discs, both rewritable formats. It also
accepts DVD-R discs, providing even
more versatility.
I want to record programs
without worrying about how
much space is left on the HDD
Equipped with a large capacity HDD, the
unit can store many hours of programs,
even those recorded in the highest
picture quality mode. Worrying about
the amount of time left on a videotape
is a thing of the past. Simply record the
programs you want and enjoy them at
your leisure.
Sugoroku’s EPG
I want to copy something onto
a DVD as quickly as possible
Recording from the HDD to a DVD-R can
be performed at a maximum speed of
24x, so it only takes about 150 seconds
to copy a one-hour program. It’s also
possible to delete unnecessary scenes
when making a copy.
http://www.sony.net/
I want the same picture quality
even after watching a
recorded program repeatedly
The unit is equipped with both HQ+, a
high-quality recording mode, and
Dynamic VBR Dubbing, a function that
enables high resolution dubbing of
programs to a DVD. Both allow you to
enjoy high-quality recordings of your
favorite programs over and over again.
Automatic recording of your favorite programs
and many other amazing features
Introducing a DVD recorder with intelligent
recording functionality
Sony has earned a solid reputation for devising
new ways to record television programs through
the launch of such products as the Clip-On hard
disk recorder and the CoCoon channel server. As
the market for DVD recorders began to take off in
early 2003, particularly in Japan, consumers and
retailers began to have high expectations for the
Sony DVD recorder. Determined to develop a
unique DVD recorder, a team of Sony engineers
were at that time involved in the Sugoroku
(“amazing recording”) Project, the goal of which
was to develop a DVD recorder like no other.
Sony’s Sugoroku DVD recorder was an immediate hit following its fall 2003 launch in Japan. The
unit is packed with intelligent recording functionality. First, in order to appeal to the large number of
Japanese customers who record TV programs, the
unit features DVD+RW/-RW/-R disc compatibility. It
also incorporates an electronic program guide
(EPG), along with an automatic recording function
based on keywords. For example, if a user enters
“football” as a keyword, the unit will search
through the EPG and record programs that are
associated with “football.” In addition, the HQ+
recording mode allows users to make high-quality
recordings of programs. To store programs recorded
through the automatic recording and HQ+ recording modes, the unit has a 250GB hard disc drive
(HDD) with enough space for up to 325 recorded
hours. The Sugoroku DVD recorder was made
possible by a combination of the engineering
team’s determination and accumulated know-how
within the company.
The HQ+ recording mode for outstanding
picture quality and Dynamic VBR Dubbing—
The pride of Sony engineers
The Sugoroku DVD recorder has many technologies that cannot be found on conventional models.
One technology is the HQ+ recording mode, which
records a program onto the hard disk at a rate of
approximately 15Mbps. This recording mode is
based on a technology that Sony engineers had
long been working on for producing recordings
with a picture quality indistinguishable from that of
a live broadcast.
Dynamic VBR Dubbing, a new technology used
for dubbing programs from the hard disk to a DVD
has also been successful. Inspired by methods used
to create software for DVDs such as movies etc.,
Sony engineers succeeded in minimizing picture
degradation by allocating the optimum amount of
data based on the amount of information contained in each scene, when a program is recorded
onto the DVD. This makes it possible to make
high-quality dubbing, efficiently utilizing the
capacity of DVDs. It also allows dubbing onto
both DVD+RW and DVD-RW/-R formats.
Yoshihiro Saitoh
Recorder Strategy Manager
Product Planning Section 1
Product Planning Department
Video Group
Home Electronics Network
Company
Hitoshi Hiraga
Senior Manager
Section 1
Department 1
DVD Division
Video Group
Home Electronics Network
Company
Jun Watanabe
Senior Manager
Section 4
Video Products Software Department
Software Technology Division
Home Electronics Development Group
Home Electronics Network Company
13
Page 16
The remote control should be
simple and fun to use
The cross-shaped menu, with controls
aligned vertically, permits smooth and
speedy operations. Press any button
and the action on the screen will
immediately stop, as the image fades
into the background. Never before has
the operation of a remote control
been so easy.
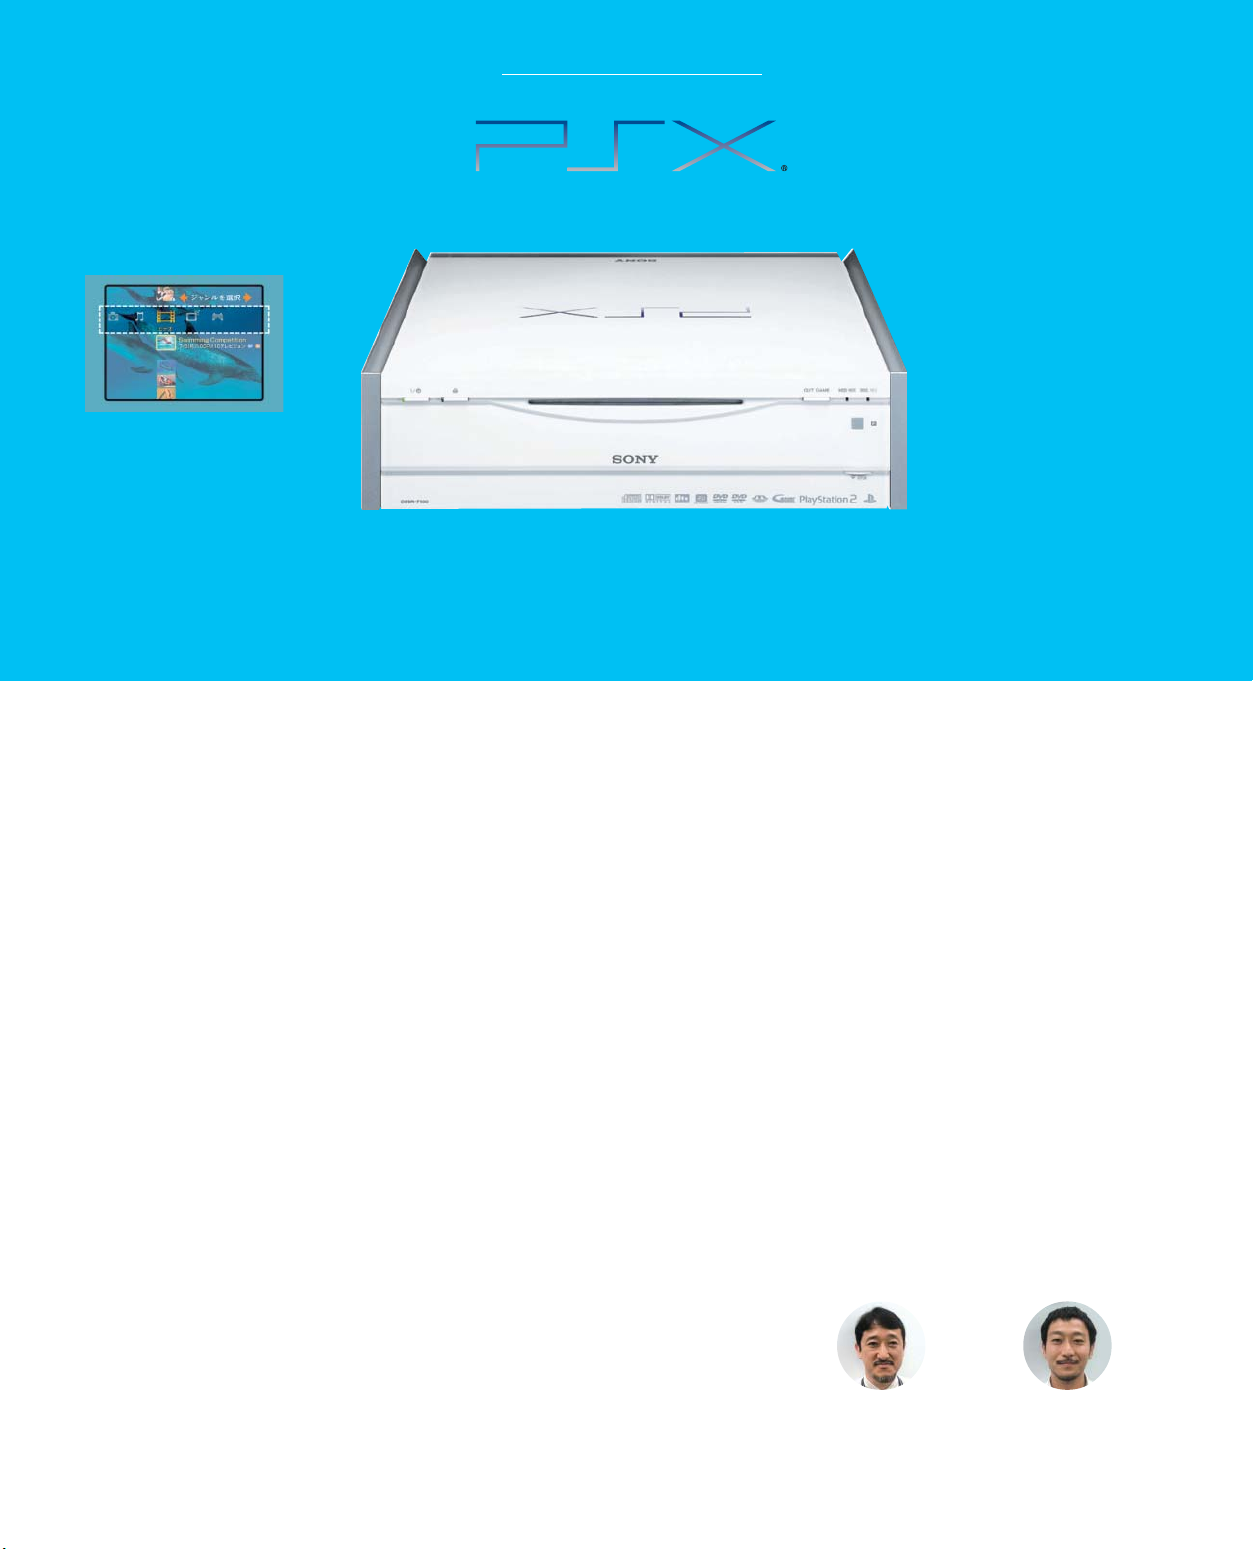
File 03: DVD recorder “PSX”
[DESR-7100]
I want to connect my PSX to
lots of other equipment
PSX comes with a game controller
port, a network port for online
gaming like that on PlayStation 2
(PS2), a USB socket for PS2compatible keyboards and
peripherals, a Memory Stick slot and
much more.
I want a design that goes
with my living room décor
PSX has a stylish design and is only
312mm in width, permitting the unit
to be placed vertically if desired.
Translucent white was chosen so that
the unit would be a handsome
addition to any room.
http://www.sony.net/
I want the freedom to be
able to play games even
while recording a television
program
PSX is compatible with both
PlayStation and PS2 software and
online games. You can even play
games while recording a television
program.
PSX—A world of entertainment in one box
An industry first: The convergence of games and
electronics in a single unit
Enhanced user control thanks to a GUI that is
supported by PlayStation 2 technology
PSX arose from the idea of making a consumer
AV product using state-of-the-art semiconductor
technology developed for PlayStation 2 (PS2)—
the world’s number one home gaming system,
from Sony’s game business. PSX drastically alters
the image of DVD recorders, with differences
extending far beyond its functionality and design.
The feeling of direct control that users experience
is unlike that of any conventional AV device. How
did Sony accomplish this? The answer lies in two
semiconductors at the heart of PS2: the
EmotionEngine (EE) CPU and the Graphics Synthesizer (GS) image processor. In PSX, both the EE
and GS are on a single chip, a feat made possible
by Sony’s unprecedented advances in semiconductor engineering and manufacturing. Furthermore, the tremendous amount of time and
energy taken by engineers to perfect the graphical user interface (GUI) is reflected in its unparalleled usability. Their efforts were not wasted. The
GUI is by far the most popular feature of PSX.
14
A world of entertainment
Enjoy television, DVDs, music, photos and games on
a single unit
Sony had a simple objective: to create a comprehensive entertainment device that can be enjoyed
by everyone, not just a particular user group.
Priority was thus placed on engineering a product
that maximizes usability while providing such basic
functions as an electronic program guide (EPG) for
television timer recording, a high-capacity hard
disc drive (HDD) for recording and a DVD recorder.
As a comprehensive entertainment device, the
PSX houses music, photo and game functions, in
addition to the DVD recorder. Recording music
CDs to the HDD transforms PSX into a jukebox.
Inserting a Memory Stick from a digital still
camera allows you to view photos on a large
screen television. Or you can simply enjoy a PS2
game. PSX is packed with possibilities.
The new PSX model, released in July 2004, has
up to 50 DVD menu, making it easy to choose
from your favorite titles when recording material
onto a DVD, making PSX an increasingly powerful
means of enjoying a world of entertainment
content from the comfort of your living room.
The achievement of a team of engineers who
were willing to tackle unprecedented challenges, PSX
is the first product line to result from Sony’s convergence of its electronics and game technologies.
Yuichi Yazawa
Senior Manager
Section 2
Video Products Software Department
Software Technology Division
Home Electronics Development Group
Home Electronics Network Company
Kenji Matsuoka
Senior Manager
Product Planning Section 2
Product Planning Department
Video Group
Home Electronics Network Company
Page 17
I want to see LCD televisionquality images on my PC
This PC is equipped with Sony’s exclusive
high-quality picture image circuit Motion
Reality. There’s also a fast response 20inch television-grade LCD screen
equipped with broad viewing angles.
Furthermore, the Clear Black LCD delivers
a vivid picture with excellent quality
contrast and brightness even when
displaying light colors or jet black.
High-quality picture image circuit Motion Reality
I only want to see the
keyboard and mouse when
they’re needed
With a wireless keyboard and mouse,
VAIO type V eliminates the need for any
kind of wired connection. The keyboard
and mouse can be put away until
they’re needed again.
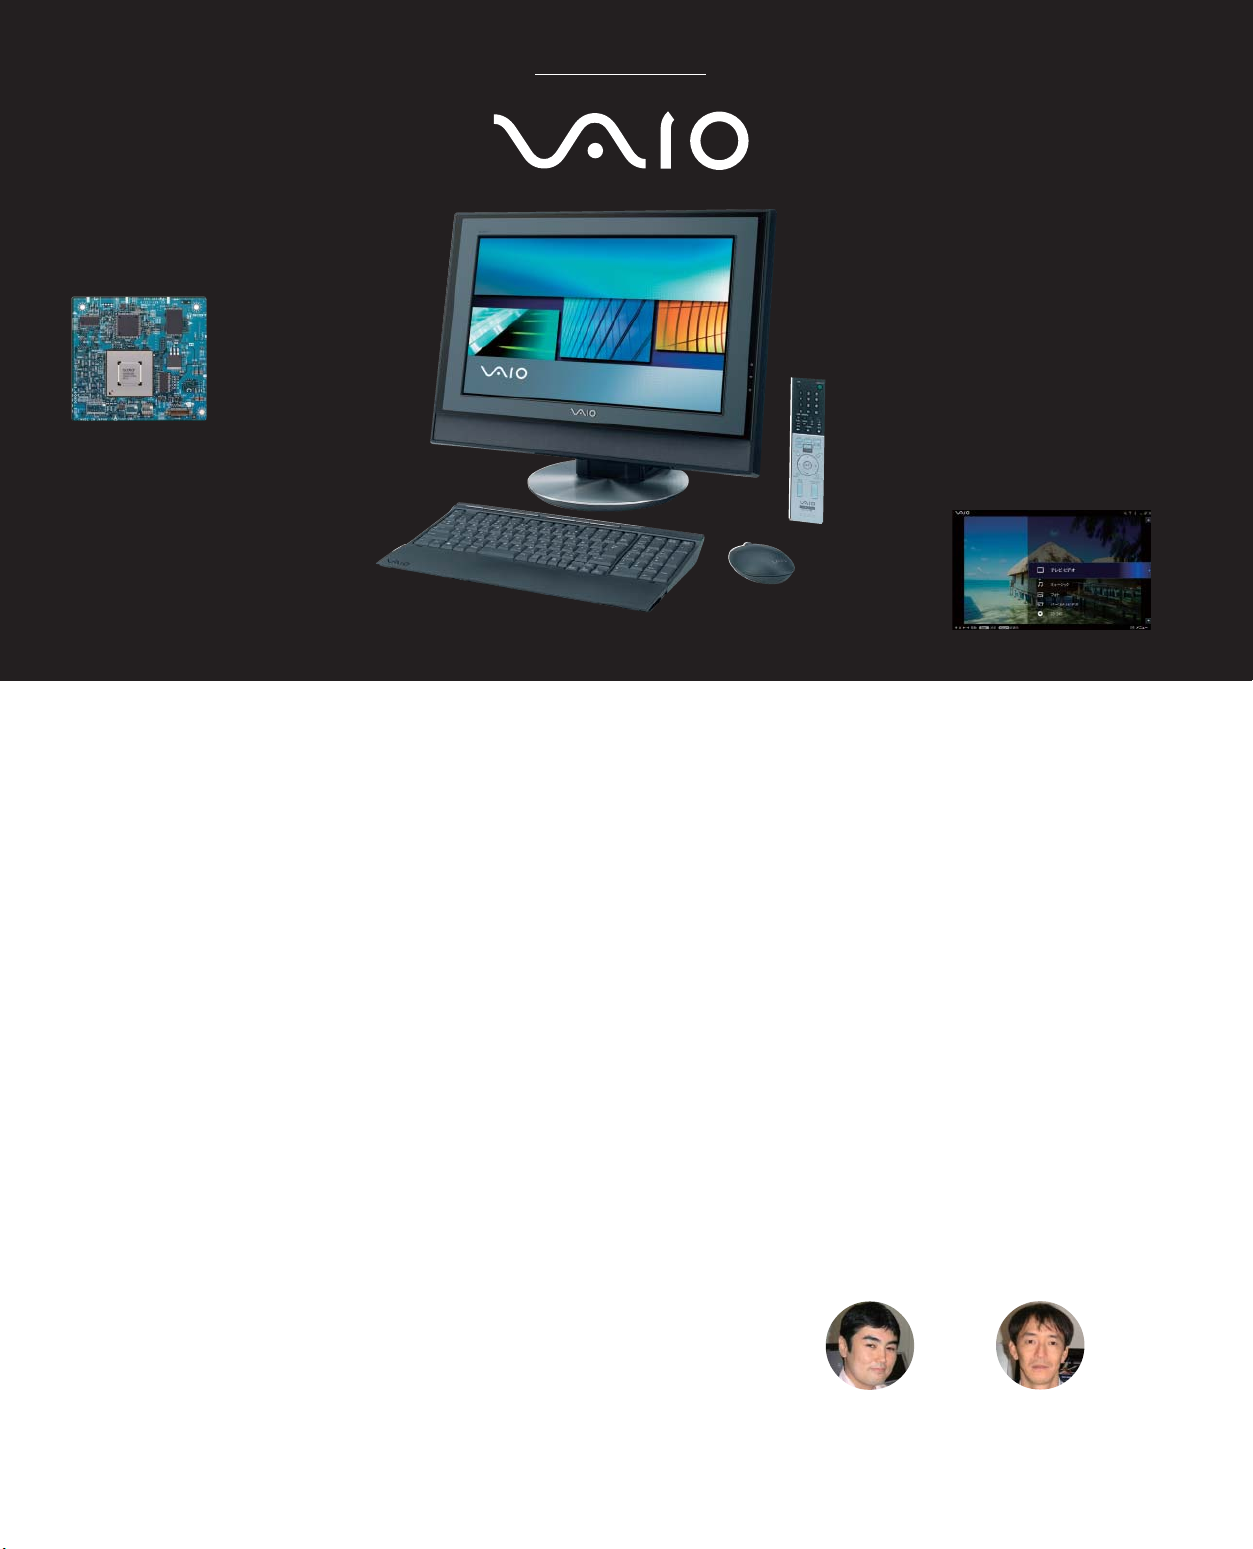
File 04: PC “VAIO”
[VGC-V201]
http://www.sony.net/
Can a PC double as both a
video deck and DVD recorder?
The hard disk drive (HDD) in the VAIO
type V can record up to approximately
103 hours of television programs. The
timer function, used to record programs,
can also be set via the Internet.
It would be great if I could do
everything with a remote
control
The stylish remote control is an integral
part of this PC. At the touch of a button
you can watch television, enter a timer
recording setting, change channels,
adjust the volume or perform various
other tasks.
The VAIO type V’s AV entertainment menu
Chapter two of the VAIO story:
Television picture quality on your PC
Picture quality virtually indistinguishable from an
LCD television—The VAIO type V’s picture quality
has broken the conventions for a PC
Since its debut in 1996, VAIO PC has enhanced
the AV experience of the user through the convergence of audio and visual contents and Sony
took the industry lead through the introduction of
a function that allows users to watch television on
their PC. However, watching television on a PC
used to present problems as, due to the limitations of the PC format, the quality of the television images tended to deteriorate as the screen
size increased. In the search for a solution to this
problem, the developers of VAIO turned their
attention to the television technology of Sony’s
Wega, which facilitates outstanding picture quality. This technology uses a powerful IC chip that,
through Sony’s unique high-quality picture image
circuit Motion Reality, allows the high-quality
display of video images. The engineers thought if
this chip could be utilized, they might be able to
produce images of television quality on a PC
screen. At this point, the developers of VAIO
embarked on a project that would confound the
conventional logic of the PC.
Until then, problems involved with viewing
television on a PC screen had been overcome
through the clever utilization of software or the
optimization of hardware performance. However,
whereas a television screen displays a single, fullscreen image, on a PC the user has the ability to
alter the size of the window, containing the
image as they see fit. Therefore, to produce a
television-quality image on a PC, engineers had to
overcome the challenges of adapting a chip
originally developed for AV devices; optimizing its
performance for the PC; and allowing televisionquality images to be displayed on the adaptable
window sizes of a PC.
VAIO type V is the result of these efforts. Its
20-inch screen generates television images with
quality on a par with those of an LCD television.
With its dazzling picture quality, this new VAIO is
pioneering uncharted territory for PCs.
Never before could a PC have delivered this kind
of enjoyment
But even then, Sony’s engineers chose not to stop
If VAIO type V can be used like a television, then
why can’t it also be used, at the user’s discretion,
to watch television anywhere in the home? To
allow this, the new VAIO has a tilting mechanism
that can be used to angle the screen downward,
a first for a PC. But there’s much more: a 360-
degree swivel stand; a wireless keyboard and
mouse; speakers that deliver high-quality dynamic
sound over a larger area; minimal fan noise; and
much more. All these features add up to make
the VAIO type V everything its creators intended:
a revolutionary PC that is as easy to use as a
television. The PC is also installed with an MPEG
hardware encoder board that can make highquality recordings of television programs. A single
remote control handles everything from television
functions to hard disk recordings and DVD operations. The concept of AV and PC convergence,
central to the VAIO lineup, is now entering a new
phase—one that will open up a new chapter in
PC history.
Yoichiro Hachiya
Assistant Manager
Product Planning Dept.
IT Company
IT & Mobile Solutions Network Company
Naoki Kameyama
Senior Engineering Manager
Hardware Design
Section 3, Department 4
IT Company
IT & Mobile Solutions Network Company
15
Page 18

I want a compact camera that’s
slender, yet durable
Miniaturizing CCD to create an ultracompact, high-resolution digital still camera
was a challenge. Stainless steel was chosen
for the body material of the 17.3mm thick
digital still camera because of its strength
and resilience. The aluminum alloy sliding
cover protects the lens and also serves as
the power switch.
This 5.1 megapixel CCD is approximately
half the size of a conventional CCD.
I want to share my pictures with
friends and family immediately after
taking them
DSC-T1’s large 2.5 inch LCD monitor is
nearly three times the size of a 1.5
inch LCD monitor. The large
monitor makes it simpler to
compose photos and easier
to playback and share photos
with friends and family by using
the monitor as a display.
17.3mm
2.5 inch LCD monitor
File 05: Digital Still Camera “Cybershot”
[DSC-T1]
http://www.sony.net/
I don’t want to miss another great shot
Equipped with Sony’s proprietary Real Imaging
Processor, the camera powers up in about 1.3
seconds, takes approximately one second between
shots and has a shutter lag of about 0.24 seconds and
a release lag of about 0.009 seconds.
I want to enjoy taking photos using a
camera equipped with a Carl Zeiss lens
The newly designed folded-optics lens system was jointly
developed by Sony and Carl Zeiss. The system was
designed specifically to keep the lens within the camera
body and features a 3x optical zoom. Another unique
feature is the Magnifying Mode, which allows users to
shoot objects from as close as a centimeter away.
Newly designed folded-optics lens system
The new Cybershot:
Fun to carry around and take photos
Cybershot DSC-T1—The result of Sony’s desire to
create an entirely new digital still camera
Featuring a large, easy-to-see LCD monitor and
5.1 megapixel CCD in an ultra-compact, slim
body, the Cybershot DSC-T1 has been a bestselling digital still camera in many countries since
its initial release in Japan in fall 2003.
About a year and a half ago, a group of young
engineers, determined to create a new digital still
camera unlike any before it, got together to
develop a next-generation model. The team
started from scratch, rethinking every aspect,
from product concept and design to components.
For example, CCD required a high, 5.1 megapixel
resolution, but also needed to be about half the
volume of a conventional CCD to achieve an
ultra-compact, slim size. A retractable zoom lens
would have made the camera too bulky. The
solution was a folded-optics lens system, codeveloped with Carl Zeiss, which moves within
the camera body instead of projecting in and out.
The result is a unique, ultra-compact, slim camera
with a 3x optical zoom. Further distinguishing
DSC-T1 is a 2.5 inch hybrid LCD monitor that uses
nearly half of the camera’s surface area. This large
display is one more reason this revolutionary
digital still camera continually amazes users.
16
A simple design with capabilities that people
appreciate more with use
Unlike a conventional camera, which has the lens
in the center and is held with two hands, the
innovative design of DSC-T1 was intended to
attract people’s attention. On the front is a sliding
cover made of aluminum alloy that protects the
lens. A specially coated stainless steel was used
for the camera’s body to prevent tarnishing and
preserve its beautiful appearance over the years.
The sliding lens cover also serves as the power
switch. Users can take out DSC-T1 from a shirt
pocket with one hand, open the lens cover,
switch the power on and snap a photo all in one
motion. DSC-T1 incorporates Sony’s latest advanced technologies, including a 5.1 megapixel
Super HAD CCD, Sony’s proprietary Real Imaging
Processor and a thin, high-capacity InfoLITHIUM
T-type battery. Incorporating these technologies
into such a compact space in DSC-T1 represented
yet another plunge into uncharted territory for the
project team. This achievement enables users to
immediately view and share photos with friends and
family on the large 2.5 inch LCD monitor, a capability no conventional digital still camera can match.
Yasushi Noda
Product Manager
Group 2
Product Design 2 Department
DSC Division
Personal Imaging Company
IT & Mobile Solutions Network
Company
Koichi Tanigawa
Department No. 2
Imaging Technology Group
IT & Mobile Solutions Network
Company
Atsushi Kawase
Senior Art Director
Design Center
Page 19

There is no danger of mistakenly
recording over other material
DVD Handycam uses a DVD with a diameter of
8cm. It automatically records new material onto
unused disc space, so there is no need to fast
forward or rewind, or worry about mistakenly
recording over other material.
Rewritable DVD
DVD editing is easy
By using a DVD-RW disc in Video Recording
(VR) mode, DVD Handycam functions as a
simplified editing tool. Users can easily erase
unwanted scenes, split and rearrange scenes,
and perform other basic editing functions.
File 06: Video Camera “DVD Handycam”
[DCR-DVD201]
http://www.sony.net/Products/handycam/
It has never been easier to dub
content and send it to family
and friends
Material stored on DVD Handycam can
be dubbed for family and friends by
using either a DVD recorder with a hard
disk or a PC.
I want to be able to find any
scene I want quickly
With DVD Handycam’s Visual Index
function, the content on the disc can be
checked at a glance. To play a specific
scene, simply select it from the onscreen display.
Example of a Visual Index
Capture it on DVD and watch it on a DVD player
The first-generation consumer DVD based video
camera, DVD Handycam, was a huge hit in the U.S.
In developing the next generation of models,
further miniaturization is the key
Sony’s video camera, DVD Handycam, was a
major hit in the U.S. market during the fiscal year
ended March 31, 2004. As the name suggests,
unlike other conventional video cameras, DVD
Handycam uses a DVD as its storage medium.
Material recorded on the DVD can be viewed
right away on a DVD player at home or can be
copied to another DVD for friends and family. Its
light weight, in particular, has made it very popular among many users, especially among families
who want to capture memories of their children
growing up or family vacations.
Sony’s next goal was to make an even smaller
DVD Handycam so that even more people could
enjoy this technology, and a project team was
established with this aim in mind. Smaller size
naturally requires both smaller components and
lower power consumption. While smaller components reduce the overall size, the circuitry would
overheat if the same level of power were to be
used. Sony engineers solved this problem by
adopting the Intermittent Recording Method, a
technique that is not possible with a videotape.
Normally, when recording to a DVD, the data of
the moving image is simultaneously saved in the
memory and written onto the disc by laser, and it
is this part of the process that consumes the most
energy. Using the Intermittent Recording Method,
disc recording is twice as fast as normal speed,
meaning that recording takes half the time,
thereby lowering power consumption. This innovative approach has facilitated a level of energy
efficiency that eliminates the risk of overheating
and has enabled this second-generation DVD
Handycam to be 30% smaller in size than the
first-generation model.
Taking advantage of features unique to DVDs
One of the biggest challenges in using a DVD
rather than a videotape for this video camera was
the problem of vibration. A shock or jolt can
interrupt the recording process on a DVD, in the
same way that a bump can cause the needle of a
record player to jump. To solve this problem, Sony
engineers applied their broad knowledge of drive
mechanisms, software and electronic circuit
technology to create a mechanism that is capable
of precisely offsetting the force of an external
shock. However, there are many other types of
vibrations and jolts that the video camera must be
able to cope with. During a testing phase that
was nicknamed the “Vibration Project” by those
involved, Sony conducted repeated and rigorous
testing on nearly 100 types of vibration and
impact right up until the start of mass production.
Engineers also focused on achieving an image
with the highest possible resolution by utilizing
Variable Bit Rate (VBR) Recording. With this technique, a fast-moving scene is recorded at a higher
bit rate, while a slower bit rate is used to record
scenes with less movement. Because bit rate
adjusts according to the volume of visual data,
the capacity of the DVD is more efficiently utilized
and picture quality is significantly enhanced.
Another advantage of this technique is that there
is less digital noise compared to Constant Bit Rate
(CBR) Recording, thereby making it possible to
record a wide range of subjects with the same
consistently high-quality picture.
For the next generation of DVD Handycam,
Sony engineers are working hard to pull a few
more exciting surprises out of the hat for video
camera users around the world.
Tadayuki Miyamoto
Project Leader
Design 2 Section 2 Group
Camcorder Business Section
Personal Video Company
IT & Mobile Solutions Network
Company
Yukiko Sakota
Planning Group
Personal Video Product Planning
Section
Personal Video Company
IT & Mobile Solutions Network
Company
Masahiro Shigenobu
Project Manager
Media Technology 3 Group
Camcorder Business Section
Personal Video Company
IT & Mobile Solutions
Network Company
17
Page 20

The future of key components
To reinforce its competitive strength in its core electronics business, Sony is seeking to differentiate its products by implementing a vertically integrated business model that incorporates
internally produced proprietary semiconductors, modules and components. Key components
include Cell, a next generation, multi-purpose microprocessor; imaging components, such as
CCDs and CMOS image sensors; display components, such as LCDs and organic electroluminescence (OEL) displays; Memory Stick; optical devices; and lithium-ion batteries. These
components are essential for producing highly competitive products.
Cell: The next generation, multi-purpose microprocessor
Differentiating products by strategic
component
Over the years, Sony’s ability to develop such
proprietary key components as Trinitron and
CCD internally has been instrumental in creating numerous appealing products, and has
been the foundation of Sony’s evolution.
PlayStation 2 (PS2), for example, features the
EmotionEngine (EE), a 128-bit CPU incorporating highly advanced technology, and the
Graphics Synthesizer (GS), a high performance
image processor. Since its debut, PS2 has
revolutionized the game console market. As
the vital role played by EE and GS in the
success of PS2 showed, highly differentiated,
advanced semiconductors are essential in order
to open up new markets. Currently, Sony is
developing a new microprocessor, Cell, which
is ideally suited for the upcoming era when
the proliferation of broadband networks will
enable people everywhere to enjoy highresolution images.
The heart of next generation digital
consumer electronics
The concept behind Cell is to evolve the conventional microprocessor, which is more of a
narrowband data processor that computes text
and still images mainly for PCs into a broadband data processor for game consoles and
high-definition televisions. Connecting several
multiple processors using a home network or
an IP broadband network will create a processing capability that far exceeds that of a single
processor. The name Cell reflects Sony’s belief
that stand-alone microprocessors will be connected through a broadband network and will
evolve to become a single global processor, in
the same way as organic cells combine to
create a living organism. Accordingly, networkenabled devices, including consumer electronics equipped with Cell, will become a structural
element of the broadband network itself.
Strategic alliance with IBM and Toshiba
expedites the development process
In March 2001, the Sony Group reached an
agreement with IBM Corporation and Toshiba
Corporation to collaborate in research and
development to create the architecture for a
new microprocessor, Cell, which it envisions as
the foundation of the next generation broadband network era. Combining their respective
strengths and technologies, the three companies expect to invest more than $400 million in
this project over five years. By incorporating
several of today’s most advanced semiconductor manufacturing technologies, such as copper interconnects, a silicon-on-insulator (SOI)
process and low-K dielectric material, the
project aims to create a microprocessor that is,
in effect, a supercomputer on a chip.
Investment to facilitate production of
semiconductors for 65 nanometer process
technology—the most advanced in the world
Preparations are under way to fabricate Cell
and a variety of media processors in three
locations: Sony’s Nagasaki Fab; an IBM manufacturing facility in East Fishkill, New York; and
a Toshiba manufacturing facility in Oita, Japan.
In the fiscal year ended March 31, 2004, the
Sony Group recorded capital expenditure of
about ¥69.0 billion for the first stage of
construction of a mass-production facility for
semiconductors that use 65 nanometer (one
nanometer equals 1/1,000 of a micrometer)
process technology. Additional capital expenditure of about ¥120.0 billion is planned for the
second stage of construction, beginning in the
fiscal year ending March 31, 2005. Trial operations at each of the three locations are scheduled to commence during the first half of
2005. Combined monthly production capacity
of the three facilities for 300mm wafers is
expected to be approximately 15,000 wafers.
18
Page 21

Taking the initiative to lead the broadband
network era
Digital consumer electronics and networkenabled devices, which support games, music,
pictures, digital broadcasts and many other
broadband applications, will be the leaders of
the broadband network era. Accordingly,
semiconductors, the key strategic components
in these products, will be one of the key
sources of Sony’s competitiveness.
A chip combining the EE and GS
“Sony’s goal is to be a manufacturer of the world’s preeminent
semiconductors”
Interview with Ken Kutaragi, Executive Deputy President, Corporate Executive Officer
Why are these components so important
to Sony?
Many people believe that digital consumer
electronics goods will become
“commodified,” that is, inexpensive enough
for anybody to buy, thereby preventing
manufacturers from making a profit. In fact,
nothing could be further from the truth. Of
course, it is true that, manufacturers cannot
create any added value by simply procuring
components and using them to assemble
their finished products. However, the story is
different for companies that in addition to
being able to manufacture key components
themselves utilizing their own distinctive
technologies, and being able to take advantage of mass production technology, can also
capture the imagination of consumers. An
enormous amount of value can be added in
this manner. For example, Sony’s Handycam
video camera and Cybershot digital still
camera are making large contributions to our
earnings. That is because we produce CCDs,
the camera’s “electronic eye,” LCD panels,
batteries and other advanced components
ourselves. This allows us to create more competitive, value-added products. The shift of
management resources in order to concentrate on key components is essential to our
pursuit of implementing a vertically integrated business model that will enable us to
create distinctive new products.
Exactly what kind of components are there?
In order to differentiate our products, we
must develop components for display, imaging, storage, semiconductor and many other
types of devices. Among these components,
semiconductors are considered to be the
most important key component, based on
the plans for our future product lineup. In
the near future, semiconductors will become
ever more miniaturized, enabling a vast
number of transistors to be incorporated
onto one chip. The development of this
semiconductor technology will enable the
realization of a diverse range of ideas and
architecture, meaning continued convergence of added-value on the semiconductor.
In addition, as the resolution of displays
improves, there will be more demand for
even better picture quality, whether for
video or still photos. This trend points to an
even more important role for CCDs and
other imaging components used in video
cameras and digital still cameras.
What kind of measures is Sony taking to
secure a stable supply of key components?
To meet the explosive growth in demand
that is foreseen for digital consumer electronics, we are currently making substantial
investments in the construction of manufacturing facilities for key components.
For example, to manufacture Cell we
must introduce state-of-the-art semiconductor production technologies and facilities.
We are working with IBM and Toshiba to
put in place a highly sophisticated massproduction infrastructure.
As for display components, we are striving
to enhance our manufacturing capability of
amorphous silicon TFT LCD panels, enabling
us to keep up with the expected growth in
demand for LCD televisions.
19
Page 22

Image sensors Display components Memory Stick
Tapping the strengths of CCD and CMOS
image sensors
Sony has the leading share of the global market for CCDs. This key component not only
supports our lineup of mobile products, such
as digital still cameras and video cameras, but
also contributes to profitability through sales
to external customers. In July 2003, Sony was
the first company to develop a CCD for consumer digital still cameras that has a four-color
filter: red, green, blue and emerald. This breakthrough will be leveraged to differentiate Sony
cameras from those of its competitors. We will
also strive to make the CCDs smaller, while
simultaneously enhancing picture quality.
Sony is also developing CMOS image sensors.
This component offers the advantages of low
power consumption, faster processing speed,
and the ability to place peripheral circuitry on a
single chip. Traditionally, picture quality from
CMOS image sensors has been thought to be
inferior to that of CCDs. Sony has almost
completed work on a CMOS image sensor that
produces a higher-quality picture. This is being
accomplished by applying manufacturing knowhow that was gained from the production of
CCDs and using sophisticated equipment for
the MOS process. Sony will continue its CMOS
image sensor development program with the
goal of expanding this business.
Joint venture with Samsung to massproduce next generation LCD panels
Demand for flat panel displays is increasing
rapidly, with applications for this technology
ranging from cellular phones, digital still
cameras, televisions, PC monitors and rearprojection televisions. To ensure a stable
supply of LCD panels to meet the expected
growth in demand for large screen LCD
televisions, Sony and Samsung Electronics Co.,
Ltd. established S-LCD Corporation. This joint
venture will develop and manufacture seventhgeneration (1,870mm x 2,200mm glass substrate) amorphous silicon TFT LCD panels to be
used in large screen televisions. Full scale production is scheduled to begin in the fiscal year
ending March 31, 2006.
A rear-projection television with an ultra
high-resolution LCD
As LCD panels with increasingly high-resolution
become available, even small devices will have
the ability to display ultra-fine images. Sony has
developed a display device called the SXRD
(Silicon X-tal Reflective Display) that can produce high-resolution, high-contrast images with
cinematic quality. Sony will use SXRD to produce front projectors and rear-projection televisions that will have a far better picture quality
than those currently available.
Meeting the new demand for increasingly
widespread music distribution and highresolution video recording
Since its debut six years ago, the Memory Stick
business has continued to grow rapidly, fueled
by the growth of the digital still camera market.
As a result, cumulative shipments have surpassed 70 million units. Sony and more than
500 other companies that support this technology are developing new markets for Memory
Stick. Music and e-book distribution services are
two applications that will be added during the
fiscal year ending March 31, 2005, with highresolution video recording as another potential
addition. To ensure ease of use for a broad
range of applications, all Memory Stick media is
equipped with copyright protection technology
and high-speed data transfer capability. Sony
plans to launch higher-capacity media with the
introduction of a 2GB version in 2004 and a
4GB version in 2005.
Memory Stick PRO
Memory Stick PRO Duo
CCD with a four-color filter
20
Practical application for OEL displays
OEL displays can reproduce highly vivid colors
with the fast response required for smooth
video playback. Backlighting is not required
because the panel is self-luminescent, producing three colors: red, green and blue. This
allows for panels to be extremely slim. Sony is
working toward the practical application of the
OEL display to mobile devices.
LCD display component, “4K SXRD”
Memory Stick
Memory Stick Duo
Page 23
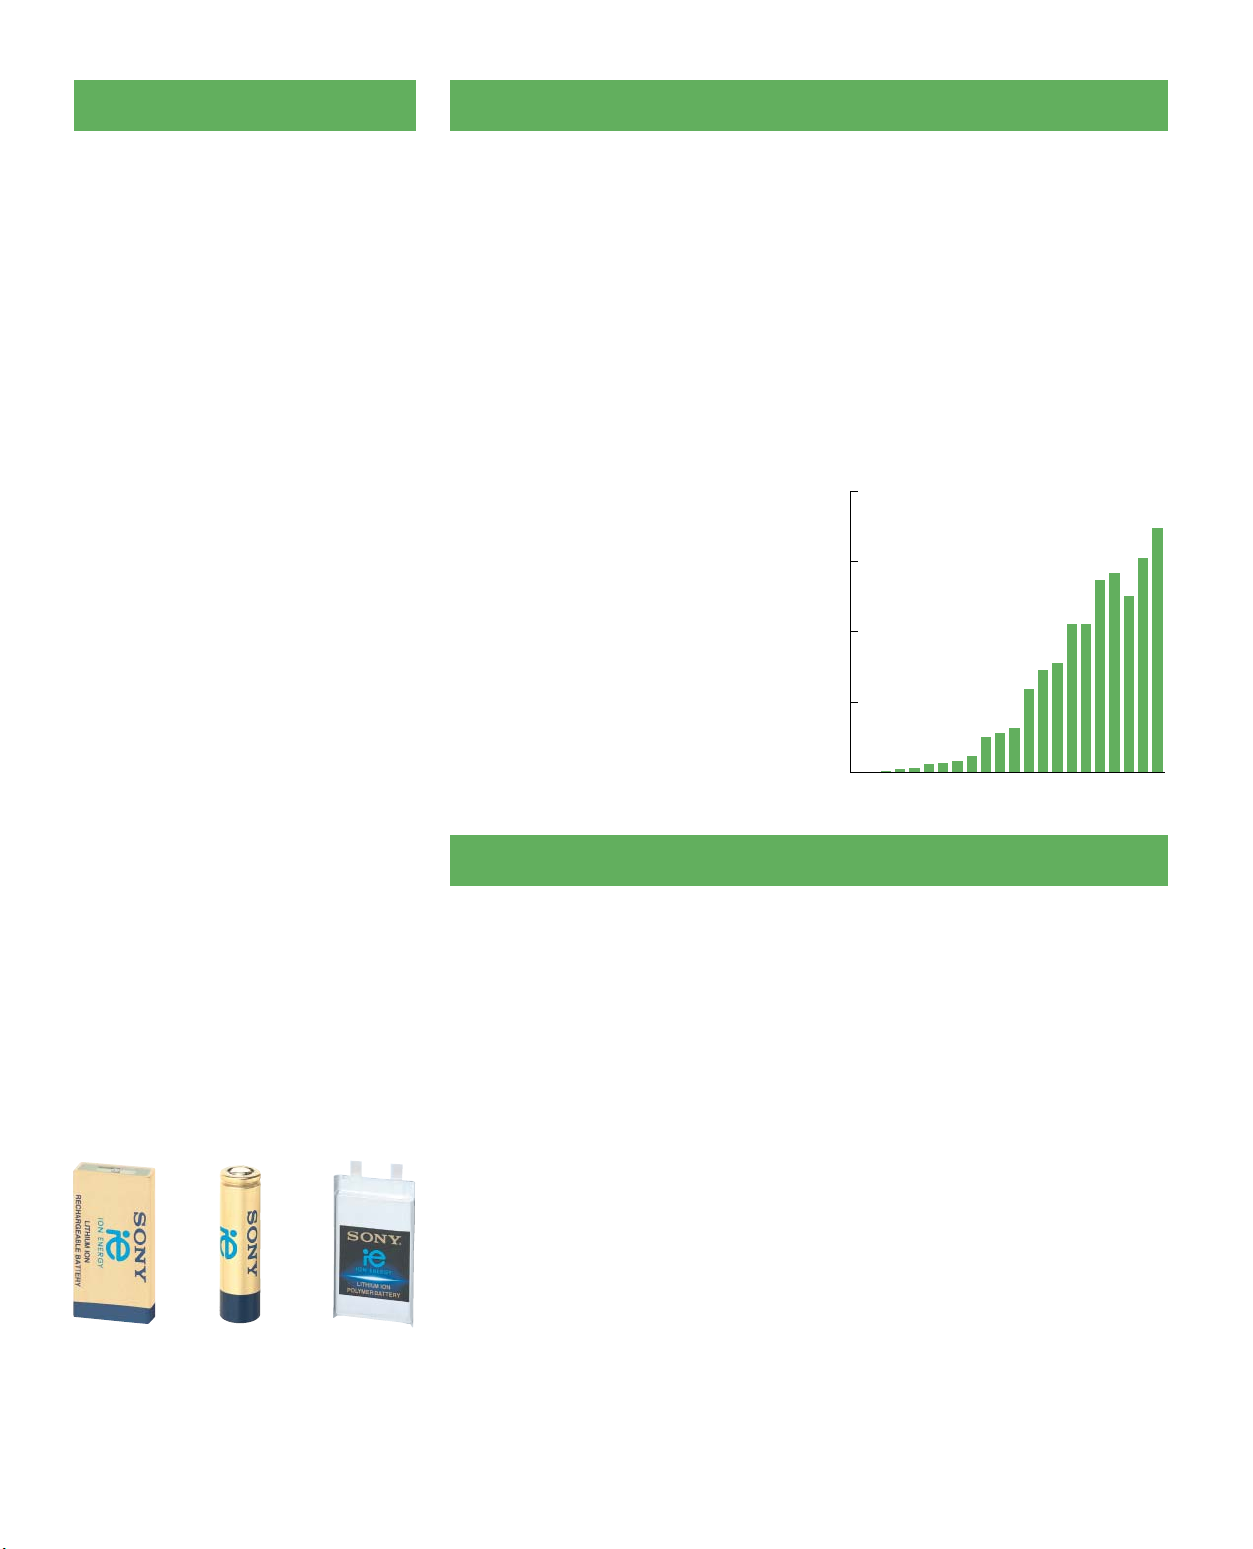
Lithium-ion batteries
Optical disc components and digital tuners
Supporting Sony’s mobile products
Demand for rechargeable lithium-ion batteries is
rapidly growing due to its use in a diverse range
of mobile devices, such as notebook PCs, cellular
phones, digital still cameras and video cameras.
With superior safety and high performance,
Sony’s lithium-ion batteries have contributed to
making Sony’s core mobile devices, such as the
digital still camera Cybershot, VAIO PCs and the
video camera Handycam, more slender and
compact. There is no doubt that these batteries
will play a greater role in Sony’s strategy to differentiate its mobile products by making them
even slimmer and lighter.
Aiming to increase sales of lithium-ion
batteries
Sony has secured firm positions in the markets
for both the liquid-electrolyte lithium-ion batteries used in notebook PCs and the lithiumion polymer batteries used in cellular phones.
To reinforce its leading position in the notebook PC battery market, Sony will continue to
increase the capacity and output of liquidelectrolyte lithium-ion batteries. In 3G and
subsequent generations of the cellular phone
market, the goal is to increase sales by taking
advantage of the high capacity and light
weight of polymer batteries, which give them
the flexibility to fit any size of cellular phones.
Opportunities also exist for using lithium-ion
batteries in electric tools, shavers and other
products that currently use nickel metal hydride
batteries. Sony is currently making inroads into
these market segments.
Prismatic
liquid-electrolyte
lithium-ion
battery
Cylindrical
liquid-electrolyte
lithium-ion
battery
Lithium-ion
polymer battery
Concentrate our energies on high-density,
high-speed recording technology for optical
disc components
Sony manufactures semiconductor lasers,
optical pickups and other components used in
CD and DVD players and recorders, PlayStation
2, disk drives for PCs, the video camera DVD
Handycam and other products. Sony is the
industry leader in the field of optical pickups for
audio-visual equipment. Currently, demand for
DVD optical pickups and semiconductor lasers is
increasing, due to the growing diffusion of DVD
players. To further expand this component
business, work is under way to commercialize
recordable dual-layer DVDs and an optical
pickup and semiconductor laser with 16x
recording speed. In addition, Sony has developed a three-wavelength optical pickup and
semiconductor laser that are compatible with
the Blu-ray Disc, DVD and CD formats.
Blu-ray Disc
The Blu-ray Disc format
The increase in high-definition broadcast programs is sparking demand for technologies
capable of recording outstanding picture and
sound quality. In response, Sony and eight
other companies signed an agreement in February 2002 and formed the Blu-ray Disc Founders
(BDF), to promote the rewritable Blu-ray Disc
standard. While promoting the Blu-ray Disc
standard with members of the computer, media
and other industries, the number of BDF members has increased to 13*. To establish the Bluray Disc standard and capitalize on business
opportunities, BDF has decided to establish the
Blu-ray Disc Association (BDA), which solicits the
participation of companies from a wide range
of industries.
Quick to respond to the opportunities of
digital broadcasting
Sony has developed an ultra-compact digital
tuner that can receive terrestrial digital broadcasts. The industry’s smallest tuner measures
18mm x 14mm x 2mm, weighs only 1.5 grams
and is also low power consumption. Sony
plans to use this digital tuner in a variety of
mobile devices.
■
Sales of Sony Optical Pickups
(Million units)
200
150
100
50
2003
20001995199019851982
*Sony Corporation, Dell Inc., Hitachi, Ltd., LG Electronics
Inc., Matsushita Electric Industrial Co., Ltd., HewlettPackard Company, Pioneer Corporation, Royal Philips
Electronics, Samsung Electronics Co., Ltd., Sharp
Corporation, TDK Corporation, Thomson, Mitsubishi
Electric Corporation (As of March 18, 2004)
Key technologies underlying the Blu-ray Disc
system
Blu-ray Disc requires at least 27GB of storage
capacity to record two hours of high-definition
television programs. This is about six times the
storage capacity of a standard DVD. Yet the
Blu-ray Disc provides this massive capacity
within the 12cm diameter (and 1.2mm thickness) of a CD or DVD. Listed on the following
page are some of the key technologies that
made this possible.
(FY)
21
Page 24

Blue-violet laser achieves high
recording density
Data on an optical disc is recorded and read by
passing a beam from the laser through the lens
and onto a spot on the disc called the beam
spot. Since blue-violet light has a shorter wavelength than red, it can produce a smaller beam
spot. The result is higher recording density.
Blue-violet lasers with a wavelength of 405
nanometer enable Blu-ray Disc to increase
recording density about 2.6 times, and combined with high-powered lenses, the recording
capacity of Blu-ray Disc is six times that of the
standard DVD.
19%100%
0.85
Blu-ray Disc
(simplified diagram)
1.2
mm
DVD
Comparison of beam spot size
1.2
mm
Lens numerical aperture
(approx. doubles density)
0.6
Laser wavelength
(raises density approx. 2.6 times)
650nm 405nm
High-speed data rate of 36Mbps to accommodate digital content
Blu-ray Disc has a data rate of 36Mbps, much
greater than the maximum speed of 24Mbps
in digital HDTV from a broadcasting satellite
(BS). This speed enables Blu-ray Disc to easily
record digital HDTV programs from the BS and
play them with remarkably high-quality picture.
Blu-ray Disc recorder
In April 2003, Sony unveiled the world’s first
Blu-ray Disc recorder. By using the same MPEG2TS video recording method used in BS digital
TV broadcasts, this unit can record more than
two hours of BS digital TV programming with
no degradation in picture quality.
The development of three-wavelength
recording/playback optical pickups
that are compatible with Blu-ray Disc,
DVDs and CDs
Sony has developed a three-wavelength recording/playback optical pickup that is compatible
with the Blu-ray Disc, DVD and CD. In addition
to reducing the number of components required and decreasing its size, Sony is striving to
increase the optical pickup’s reliability and
productivity, in order to rapidly commercialize
this product. As the key component for the
Blu-ray Disc system, this new optical pickup is
positioned to contribute to the expansion of
this market.
Prototype of the newly developed three-wavelength
optical pickup for recording and playback
0.1mm optical cover layer improves
reliability
On a Blu-ray Disc, data is stored at more than
2.5 times the density of a DVD, while the width
of the recording tracks is less than half that of a
DVD. Furthermore, the tracks where the data is
stored are only 0.1mm below the disc surface.
Placing the recording tracks closer to the surface means that Blu-ray Discs are less prone to
problems caused by disc warping and other
factors compared to CDs and DVDs.
Optical cover layer
For 0.6mm thickness
(same as in a DVD)
Blu-ray Disc
Scanning electron
microscope view
DVD-RW
Scanning electron
microscope view
0.6mm
Substrate
Recording
layer
Optical
cover layer
Shortest
recording mark of
0.4μm
Track pitch of
0.74μm
NA 0.85
Optical cover layer
For 0.1mm thickness
0.1mm
Shortest
recording mark
(0.16μm for 23GB;
μ
m for 25GB;
0.149
0.138
μ
m for 27GB)
Track pitch of
0.32μm
Substrate
Recording layer
Optical cover layer
(simplified diagram)
Blu-ray Disc recorder
Success in developing a 25GB optical
disc made of paper
Sony and Toppan Printing Co., Ltd., have succeeded in developing a 25GB paper optical disc
with a paper content of more than 51%. Part of
the disc uses paper because Blu-ray Discs can be
played and recorded on the 0.1mm surface
layer. The use of paper reduces the need for
plastic, making the discs more environmentfriendly and decreasing manufacturing costs.
A paper disc
Optical pickup for conventional DVDs/CDs
(top) and Blu-ray Disc (bottom)
Cross-licensing agreement for optical
disc-related blue-violet laser diode
patents
Sony and Nichia Corporation from Japan have
agreed to cross-license patents involving the
Blu-ray Disc format’s blue-violet laser diode. This
agreement is expected to open the door to
Sony’s mass-production of blue-violet laser
diodes, a big step that will position it to respond
to expansion in the market for Blu-ray Discformat products.
22
Page 25

Ikebana (the ancient
Japanese art of flower
arrangement) and leading
edge technology don’t
seem like natural partners,
yet Ms. Eikou Sumura has
been using a recordable
Walkman for more than 20
years to refine her teaching
skills in this ancient
art form.
Sony stands
Eikou Sumura
Sony first caught my eye when I was a young child
When I was a child, I was captivated by the Sony products. I saw them at elementary
school and on billboards on the way to school. The novelty of Sony, which was somehow different and “newer” than other electronics, left a lasting impression on me. I
remember reading the autobiographies of Sony founders, Masaru Ibuka and Akio
Morita. I was impressed by their dedication to corporate citizenship. What particularly
struck me was their efforts to create employment opportunities for disabled people.
When I was growing up, like most people in Japan, I was fascinated by American culture.
The Sony Plaza in Ginza was like a variety store offering a slice of American life. It was
an ideal place to see the kinds of things you couldn’t find in Japan back then and I often
went there. Sony has been an important part of my life.
for captivating
products
Good instructors should listen to themselves
I have used a recordable Walkman for more than 20 years. I use it mostly to record myself
explaining the principles of ikebana and giving demonstrations during class. Later when I
play back the recordings they allow me to identify things I can improve on, even things
like the tone of my voice. As a teacher, the ability to hear yourself in the third-person is
extremely important. I strongly recommend this technique to my advanced students
who are teachers themselves.
Eikou Sumura Master Instructor, Sogetsu Headquarters
A native of Tokyo, Eikou Sumura began studying ikebana in 1953 and from 1963, worked as an assistant to her
father, the famous ikebana master Kousoku Sumura. She became a director of the Sogetsu Ikebana Instructors
Association in 1973. Ms. Sumura has traveled the world conducting demonstrations and workshops. Always looking
for new challenges, she recently began collaborating with a French chef.
Eikou Sumura URL: http://www.sumuraeikou.com
Like a memopad, my IC recorder
is always by my side
I bought an IC recorder not long ago, not for recording
my classes but to record ideas that come into my head
or phrases that I don’t want to forget. It’s smaller than
a Walkman, so I can take it with me everywhere. I even
keep it by my bed at night.
23
Page 26

R&D
research & development
Sony’s DNA: Freedom and
open-mindedness
Sony has created an environment of freedom and open-mindedness
in which its researchers and developers can give free rein to their
imaginations while managing research and development by efficiently focusing management resources in strategic fields
Biped robot
Sony’s R&D strategy
The importance of R&D and its management
Sony’s philosophy regarding R&D was set forth
by Masaru Ibuka in the Founding Prospectus
when he established the company: “To establish an ideal factory that stresses a spirit of
freedom and open-mindedness, and where
engineers with sincere motivation can exercise
their technological skills to the highest level.”
Today, Sony carries on its tradition of fostering
freedom in research while concurrently managing R&D by efficiently focusing management
resources in strategic fields.
How research priorities are determined
Sony has a virtually unlimited selection of key
technologies. To identify which of these will
have the potential to deliver revolutionary
devices and products, Sony holds the Technology Round Table, at which senior management and research engineers gather to
formulate strategies consistent with Sony’s
R&D road map. These Round Tables are also
responsible for determining how management
resources should be concentrated within
strategic fields.
R&D and Sony’s intellectual property strategy
There are many R&D accomplishments that are
of vital strategic importance to Sony. Three
operating units—R&D, business and intellectual property—all combine to forge Sony’s
intellectual property strategy, ensuring that
these assets are properly protected and effectively utilized.
Sony is acutely aware of the importance of
utilizing intellectual property to reinforce its
competitive edge and, to this end, frames an
intellectual property portfolio suited to each
business unit and determines policy for the use
of each. This approach entails the acquisition
of intellectual property assets for Sony’s exclusive use, as well as establishing cross-licensing
rights and taking other actions as required,
giving Sony more flexibility in its business
operations. Moreover, the standardization of
basic technologies has become an increasingly
important issue with the growth of digital
networks in recent years. In response, Sony is
actively pursuing alliances, licenses and other
means to increase the utilization of technologies in its patent portfolio.
Strategic fields for the
next three years
Sony is focusing on semiconductors, displays and home servers as its key strategic
fields for R&D over the next three years
Semiconductors
In electronics, added value has migrated from
finished products to key components. In light of
this, Sony regards the semiconductor business
as one of its most important R&D priorities.
Sony’s semiconductor business has steadily
raised its profile in terms of production value, as
well as in capital expenditure and R&D spending. In the short and medium terms, central
R&D themes will concentrate on functional
components, particularly CCDs, where Sony
holds the number one worldwide market share,
and semiconductor lasers. Another priority is
System-on-Chip (SoC) components, which
integrate an enormous number of processors
and memories. Components incorporating
these technologies play a central role in enabling
Sony to supply highly distinctive digital consumer electronics and game products with
increasingly sophisticated functions.
24
Page 27

Displays
Display technology has been a Sony core technology since the days of the CRT, when Sony
created its highly acclaimed Trinitron system.
Sony is developing next generation display
technologies for LCDs, organic electroluminescence (OEL) and projectors to best match
differing market requirements in terms of
screen size and product category. One highly
advanced component is the Grating Light
Valve (GLV) projector, which uses high-output
lasers to produce the three primary colors.
Sony has also developed a Silicon X-tal Reflective Display (SXRD) projector that produces a
high-resolution 8.85 megapixel (4,096H x
2,160V), four times sharper than current
digital high-definition televisions. Development
work continues with the aim of delivering
solutions that achieve remarkable resolution
and color reproduction from content to displays, all with the unmistakable Sony touch.
Home Servers
Home servers are set to become important
fixtures in the home. As digital consumer electronics become increasingly linked through
networks, home servers will be needed to control both the operations of network appliances
and the flow of content. These servers are likely
to function as storage terminals, most likely in
the form of DVD or Blu-ray Disc recorders
equipped with hard disk drives, as well as content service and network portals. Possessing
many of the world’s most advanced technologies in both semiconductor lasers and optical
pickups, Sony is set to become the industry
leader in an emerging network server market
that demands expanded storage functionality
and high-speed transfer rates.
Long-term research fields
The shift from inorganic to organic materials
Inorganic materials, such as metals and silicon,
in addition to mechanical technologies, have
defined much of the technology of the past
century. But a new century has shifted the
spotlight to carbon-based and other organic
materials, as well as biomolecular emulation
technologies. Sony is targeting this shift
through its R&D activities with a mid- to long-
term perspective. The fiscal year ended March
31, 2004, witnessed the first step in this direction, namely, Sony’s announcement that it had
developed a tandem dye-sensitized solar cell
that employs a polymer gel electrolite and
nano-structured electrode. Currently, solar cells
are made of semiconductor materials, such as
silicon and gallium arsenide. Polymers have a
transistors. Sony engineers were not only successful in proving the operation of these
transistors, but also in utilizing them as the
driving transistor for an LCD that produces a
160 x 120 pixel image.
Sony’s wide-ranging technological expertise
in materials, analysis, circuitry and finished
products made these accomplishments possible.
high energy conversion efficiency of 10.5%.
Moreover, they are inexpensive and enable the
easy creation of a large surface area. At the
time of announcement, this technology had the
highest conversion rate for its type in the world.
In the field of electronic components, Sony
unveiled an organic transistor in February 2004
at the Institute of Electrical and Electronics
Engineers International Solid-State Circuit
Conference (IEEE ISSCC), the world’s most
prestigious international conference for semiconductor ICs. The fruits of Sony’s research
shed light on the mechanism by which charged
carriers are injected from electrodes into the
organic semiconductor layer. This made possible
a new technology that improves the charge
carrier mobility of electrons within organic
Imitating living organisms and brain
functions
Sony is exploring sophisticated robotics and
computing technology to create robots even
more like living beings.
In December 2003, Sony announced the
world’s first humanoid robot with the ability to
run and jump. Over the mid- to long-term, Sony
plans to further refine these movements while
incorporating the latest advances in perception
technology, as well as utilizing networks so that
robots can acquire knowledge and learn about
their environment. Research continues with the
aim of making robots even more human-like to
the point where people do not tire of them even
after frequent and extended encounters.
R&D activities for the fiscal year ended March 31, 2004
R&D expenses totaled ¥514.5 billion for
the fiscal year ended March 31, 2004,
which amounted to ¥71.4 billion, or 16%,
more than in the previous fiscal year. The
ratio of R&D expenses to sales, excluding
the Financial Services segment, rose from
6.4% to 7.5%.
R&D expenses in the Electronics segment
increased ¥49.1 billion, or 13%, to ¥429.4
billion, while in the Game segment R&D
expenses increased ¥21.9 billion, or 36%,
to ¥83.4 billion.
Within R&D expenses in the Electronics
segment, about 62% was allocated for
product prototype development and the
remaining 38% for new, mid- to longterm technologies for semiconductors,
telecommunications, displays, next generation optical discs and other fields. In the
Game segment, R&D expenses were
mainly allotted for hardware, including
semiconductors and network technology,
and the creation of software.
■
R&D Expenses
(Billion ¥)
433.2
2001 2002 2003
■
Composition of FY2003 R&D Expenses
Game 16.2%
443.1
Others 0.3%
¥514.5
Total:
514.5
billion
Others
Game
Electronics
(FY)
Electronics
83.5%
25
Page 28

Since the founding of our company, Sony has always sought to deliver new qualia—to captivate and
move people, bringing them joy and excitement—through our products, content and services.
With the “QUALIA Movement”, we express our sincere determination and
great joy in introducing new qualia to the world.
In the electronics field, we will realize the “QUALIA Movement” through our product creation, marketing
and service activities, offering unique emotional value that touches people’s hearts.
http://www.sony.net/QUALIA/
26
Page 29

27
Page 30

Sony
How Sony makes its products
Speeding up the manufacturing revolution
Craftsmanship
The art of manufacturing—Adding value and driving Sony’s growth
As one element of “Transformation 60,” Sony is taking a fresh look at its past manufacturing practices
and conducting a worldwide realignment of manufacturing activities. Engineering and manufacturing
capabilities and operating speed are crucial to creating competitive products. By globally reinforcing
these capabilities, Sony believes it can bolster its entire product lineup and enhance profitability.
Constant manufacturing innovation propels
product creation at Sony
Sony views manufacturing as a core competence.
Over the years, Sony has introduced many revolutionary products as only Sony can do. To cope with
rapidly changing market conditions, even more
manufacturing innovations are being implemented
at Sony. The aim is to restructure the product
creation framework into a knowledge-intensive
process that can generate added value. One
example of this kind of measure is the widespread
adoption of a highly efficient, flexible production
system called the “cell production method.” Other
ongoing projects involve increasing the output of
devices and modules, upgrading core technologies,
such as high-density mounting, and building an
integrated manufacturing process for semiconductors and components that extends to the point
where they are incorporated on the circuit board
and as parts of products in the assembly process.
Concurrent to this, Sony is assembling a powerful
supply chain management system and raising
overall production-related operating efficiency. The
combined result of these actions is the optimization
of Sony’s engineering and manufacturing systems
for each regional market. Sony is now accelerating
the innovation of its product creation as a vital
factor in maintaining its vitality and continued
ability to flourish and grow.
Integrating distribution with engineering,
manufacturing and customer service axis
To add even more value to its manufacturing operations, Sony is extending the level of its process
integration over and above the engineering,
manufacturing and customer service axis. Logistics have been seamlessly integrated, and an even
more advanced supply chain management (SCM)
system is being assembled. Close links between
manufacturing and distribution mean products
can reach customers even faster. Also, by executing logistics reforms in tandem with manufacturing innovation, Sony is cutting the procurement
costs of product components as well as reducing
the inventories of these components and the
finished products themselves. As a result, overall
space utilization at manufacturing and distribution sites can be enhanced.
Sony believes constant manufacturing and
distribution innovation—even on a daily basis—
will yield continuous improvements, essential to
the Sony Group‘s success.
Strengthening the development, engineering
and manufacturing processes of key components
will accelerate product differentiation
Semiconductors and other new components are
vital to success in the emerging market for digital
consumer electronics. With this in mind, operation
sites in Japan are positioned as hubs to strengthen
the domestic production sites’ ability to produce
advanced modules and components. By stepping
up the output of original and unique components,
Sony is differentiating its products and creating
added value in the manufacturing stage.
28
Page 31

Promoting a worldwide EMCS structure: Overhauling engineering and manufacturing frameworks to reflect distinctive regional needs on a global scale
Rethinking global engineering, manufacturing,
distribution and service functions
As part of “Transformation 60,” Sony is busy
reshaping its product creation structure into a
more knowledge-intensive model. For its worldwide operations, Sony has introduced a new
engineering and production platform called EMCS
(representing engineering, manufacturing and
customer services). From the ground up, Sony is
completing a comprehensive review of its production network, which had been structured to manufacture products within each region. The intent is
to overhaul the engineering and manufacturing
frameworks to better reflect the distinct features of
each region, and simultaneously increase the added
value generated by these frameworks. Maximizing
the integration of global functions from engineering through manufacturing, distribution and customer service will foster an environment for the
global implementation of an advanced supply
chain management (SCM) system. Sony plans to
convert some of its manufacturing facilities into
Customer Front Centers (CFC). By improving distribution and service capabilities, these centers will
enable Sony to further upgrade various customer
services and respond even more efficiently to
consumer needs.
Sony seeks to reinforce its engineering framework
and refine its ability to manufacture value-added
components, such as semiconductors, in turn
enhancing its mounting processes and helping to
create new state-of-the-art products. Producing a
steady flow of new products that use leadingedge components, hence giving them a distinctly
Sony feel, will be central to the future of Sony’s
electronics business.
as well as increasing the output of both costcompetitive, mass-produced products for export
and components and modules associated with
operations in Japan. Products that are manufactured price-competitively in other parts of Asia
are exported to Japan, Europe and the U.S. as well
as supplied within the region itself. To enhance
responsiveness to customer needs in each
region, CFC functions are also being added to
Asian manufacturing sites. In Europe and the
Regional production strategies that mirror
market needs
Sony’s strategy for its global production bases is
to deepen ties between manufacturing activities
in Japan, China and elsewhere in Asia. Sony is
increasing production of finished goods in China in
U.S., two of Sony’s major markets, the current
single-category mass-production framework will
be complemented by adding CFC functions, thus
enabling a faster response to market needs
while strengthening manufacturing and sales
activities within each region.
anticipation of continued rapid growth in demand,
Production Locations and Destinations of Electronics Products
Europe
China
SE Asia
Japan
North
America
Raising Japan’s profile as a source of advanced
technology
Through the creation of its new EMCS-based
structure, Sony has made Japan a focal point for
sophisticated technology. By forming close ties
*Size of circle represents scale of production
Production
Destination
between its development and engineering teams,
A new information system that integrates sales, manufacturing and distribution
• Prepares highly accurate sales forecasts based on actual results through collaboration
with distribution operations
• Performs real-time monitoring of retail sales and inventories and uses this data to
create an optimal manufacturing and supply system
• Provides highly accurate responses to inquiries for delivery times by combining manufacturer inventory data with manufacturing plans
• Constructs a logistics system that minimizes manufacturer inventories
• Expands the scope of weekly management operations to increase responsiveness to
rapid shifts in sales trends and other events
Utilizing demand chain management to create a product supply framework that
responds immediately to sales data
CLOVER comes into operation: A new information system supporting the integration
of sales, manufacturing and distribution operations
The new CLOVER information system began operating in May 2004. Adopted by Sony Corporation, Sony
Marketing (Japan) Inc. (SMOJ), Sony EMCS Corporation (EMCS) and Sony Supply Chain Solutions, Inc.
(SSCS), the new system integrates sales, manufacturing and distribution operations to give Sony a competitive edge in Japan. CLOVER provides sophisticated data links between individual operations, facilitating
demand chain management with the aim of creating an enhanced flexible product supply system that
responds immediately to changes in actual retail sales data. Key benefits are greater customer satisfaction,
minimal loss of sales opportunities, and lower inventories at manufacturing sites and in distribution
channels. Sony expects CLOVER to produce cost savings and inventory reductions in Japan.
Retail stores
■ Japan
■ North America
■ Europe
■ SE Asia
■ China
Overseas manufacturing sites and suppliers
Components suppliers
EMCSSMOJ
SONY
Corp.
SSCS
Information
Products
29
Page 32

The inside story from Sony’s Nagasaki Fab
Isahaya City in Nagasaki Prefecture, in Japan, is the home to Sony’s strategic semiconductor
production base. Since 2000, Nagasaki Fab* has produced state-of-the-art semiconductors and
continues to be an industry-leading manufacturing facility. Nagasaki Fab produces the key
components that give the Sony Group its solid competitive edge.
*The official name of the facility is “Sony Computer Entertainment Fab.“ Following the integration of the semiconductor production businesses
of the Sony Group, the name will be changed to “Sony Semiconductor Kyushu Corporation Nagasaki Technology Center” on July 1, 2004.
The strategic base for next generation key
components that give the Sony Group its
solid competitive edge
30
Page 33

Staff wearing particle-free suits called Clean Suits Electrical testing after packaging
One of the world’s most advanced
semiconductor fabs
Nagasaki Fab started out as the semiconductor
production base of Sony Computer Entertainment Inc. (SCE), producing advanced LSIs for
PlayStation 2 (PS2), notably the Graphics
Synthesizer (GS), a high performance graphic
rendering processor. Fab 1 began operations in
spring of 2000 and Fab 2 in spring of 2001.
Since then, Sony has continued to upgrade
both fabs with the latest production equipment. The two fabs have a total of three clean
rooms. Fab 1 produces chips on 200mm wafers
using 0.18–0.15 micrometer processes (one
micrometer equals 1/1,000 of one mm). On the
upper level of Fab 2, another line processes
200mm wafers utilizing 90 nanometer (one
nanometer equals 1/1,000 of a micrometer)
technology. As of spring 2004, there were only
a few fabs in the global semiconductor industry using a 90 nanometer mass-production
process, giving Nagasaki Fab recognition as
one of the world’s most advanced wafer fabs.
A vital strategic base for the Sony Group
In November 2003, the Semiconductor
Solutions Network Company (SSNC) was
established within Sony Corporation. This
gave the Sony Group an integrated framework within which to implement its semiconductor strategy, including semiconductor
development and design. In order to further
enhance and integrate its semiconductor manufacturing operations, SCE’s semiconductor
production business will be merged with Sony
Semiconductor Kyushu Corporation (SCK) in
July 2004 (meaning that SCK will now be
responsible for all production operations). In
areas such as production, personnel and
technology, the two units already have a
history of extremely close cooperation. Formal
integration is expected to deepen these ties,
strengthening Sony’s semiconductor production system and further enhancing the efficiency of its operations.
Cumulative capital investments in Nagasaki
Fab through March 2004 totaled approximately ¥290 billion. The fab is now equipped
with the most advanced semiconductor process technology in the world. Since the fiscal
year ended March 31, 2004, Nagasaki Fab
has been preparing for 300mm wafer, 65
nanometer process technology production
lines on the lower level of Fab 2. This will
enable fabrication of many sophisticated processors that will inevitably be at the heart of
next generation digital consumer electronics
products and computer entertainment system. Nagasaki Fab will be increasingly important as the Sony Group’s strategic base for
semiconductor production as it establishes a
mass-production system with 65 nanometer
process technology.
200mm wafer in manufacturing process Surface inspection stage of the LSI production process
31
Page 34

Setting the industry standard for time to
commission a new fab
Speed was essential when Fab 1 was built.
Fab 1 had to be able to supply a large volume
of semiconductors for PS2, which was scheduled to go on sale in March 2000, meaning
that SCE needed to set a new standard for
speed in commissioning a new fab. Construction began in spring 1999. Only five and a half
months was needed to complete the Fab 1
clean room, while production of prototypes
began in the ninth month following the installation of equipment. The construction period
was about half of the industry norm at that
time, thereby setting a new industry standard.
Productivity well above the
industry standard
Early adoption of the new Standard of
Mechanical Interface (SMIF) production
system is one reason Nagasaki Fab is the
leader in productivity in the fabrication of
advanced semiconductors. Another is the
existence of PS2, a product sold in enormous
volumes worldwide.
When fabricating semiconductors, even the
tiniest speck of airborne dust can ruin a chip.
That is why wafer fabs typically place manufacturing equipment in a class 1 (one dust particle
or less per cubic foot) clean room, one of the
highest standards for these types of facilities.
The SMIF method, on the other hand, does not
place the entire production line into a clean
room. Instead, only the insides of production
machines and the SMIF-Pod, where wafers
are stored, need to be raised to class 1 level.
Thanks to this technology, Sony gained much
more freedom in the layout of production
machinery and management of each process.
The result is improvements in capacity utilization and overall productivity.
Cumulative production shipments of PS2
surpassed 70 million units only four years
after its introduction, and high shipment
volumes continue. From the beginning,
Nagasaki Fab produced the GS, one of the
core semiconductor components for PS2 and
a key factor in its performance. The enormous
popularity of PS2 forced the fab to make
constant improvements in productivity in
order to ensure a large and reliable supply of
chips. GS is an LSI with embedded DRAM,
making it more complex than ordinary logic
LSIs. Manufacturing GS and other specialized
chips in large quantities is one of the greatest
strengths of Nagasaki Fab. This skill has
enabled the fab to raise productivity to one of
the highest levels through its focus on
improvements in production processes.
Central to raising productivity has been an
unrivaled quality evaluation and analysis
system, permitting the detailed monitoring of
quality as each process is under way. This
system improves the ability to detect and
instantly respond to abnormalities, raising
both quality level and productivity.
An optimal production strategy based on
process technologies
At Nagasaki Fab, the best possible production
strategies are formulated and executed based
on the process technologies used on each
line. Currently, the 0.18–0.15 micrometer line
at Fab 1 produces LSIs for PS2; Wega Engine,
an image quality enhancing signal processor
for Sony televisions; video cameras and other
AV products. In the near future, this line will
be used to manufacture CMOS image sensors, a component for which demand is likely
to rise, especially for use in mobile products.
The 90 nanometer line on the upper level of
Fab 2 produces a highly sophisticated chip that
integrates GS and EmotionEngine (EE), a 128bit CPU for PS2 into a single chip. This chip,
which has 53.5 million transistors, is used in
PSX, a DVD recorder. Benefits of this chip
include reductions in both power consumption
and production costs. This line is planned to
be used for the production of the CPU for
PlayStation Portable (PSP), a handheld video
game system that is expected to go on sale
during the fiscal year ending March 31, 2005.
On the lower level of Fab 2, the 65 nanometer process line employs the FOUP (Front
Opening Unified Pod) method, a technique
that takes SMIF to a higher level. Additionally,
this facility is moving toward complete automation by integrating the AMHS (Automated
Material Handling System) and MES (Manufacturing Execution System). Armed with
these cutting-edge processes, this fab plans
to produce some of the most sophisticated
microprocessors for use in next generation
digital consumer electronics products and
computer entertainment system.
SMIF technology achieves local clean areas A material handling box used for SMIF technology State of the art equipment for ultra-fine processing
32
Page 35

The automated material handling system installed
to new 300mm wafer line
FOUP holding 300mm wafers Deionized water system for ultra high-purity water
A zero-emission facility backed by
advanced energy conservation and
environmental technologies
Environmental preservation and energy conservation technologies are found throughout
Nagasaki Fab, where operations adhere to
two principles: 1) coexisting in harmony with
people, that is to say, making products that
do not contain prohibited substances and
2) reducing environmental impact. Advanced
technologies and know-how in the semiconductor business are applied to protect the environment. One illustration is a zero-emission
program that has raised the facility’s recycling
rate for waste materials to 99.8%. Since wafer
fabs use large amounts of pure water and
liquid chemicals, sound facility management is
essential. At Nagasaki Fab, three different
elevations of the site are utilized for a gravitydriven wastewater removal and treatment
system. This reduces the electricity used on
pumps by 20%. Use of the SMIF method
further reduces energy consumption.
Increasing the Sony Group’s
competitiveness
Nagasaki Fab, constructed in a short time
frame and now established as one of the
world’s most advanced semiconductor
fabrication facilities, has amassed various
technological know-how, while achieving the
highest level of productivity in the industry.
Three key factors have underpinned these
accomplishments. First is the feedback loop in
quality detection and production technology.
Second is the high degree of freedom in
process management afforded by the
adoption of SMIF. Third is taking advantage
of the fact that a large customer, that is Sony,
already exists for the production and
shipments of these components. These accomplishments, which represent a major competitive advantage, will be indispensable
elements in the Sony Group’s design and
development of various digital consumer
electronics products and computer entertainment system in the years ahead.
Overview of Nagasaki Fab
Location: Isahaya City, Nagasaki Prefecture, Japan
Total site area: 99,000m
Clean room floor area:
Fab 1—11,120m
Fab 2—20,000m
Wafer processing capacity per month (200mm):
Fab 1—Approx. 12,000 wafers
Fab 2—Approx. 9,000 wafers*
*This does not include the processing capacity of the fab line on the lower level
of Fab 2, which is used for producing next generation semiconductor chips.
2
2
2
33
Page 36

Sony’s technology:
Transcending ages
and generations
I use a lot of Sony mobile devices in my work, like a cellular
phone and CLIÉ, the personal digital assistant, but I have even
more Sony products at home. Inside an antique wooden cabinet
in my living room are numerous Sony products, including an AV
amplifier, an Airboard location free television, a DVD player, a
CS tuner and a PlayStation 2. I don’t have a television in the
living room because I prefer to use a Cineza video projector.
Using an entire white wall as a screen, I enjoy watching everything from movies to news programs.
Alejandro M. Lopez
Mr. Alejandro M. Lopez is the
President of beacon communications k.k., an advertising company
that has produced numerous
television commercials. Here, he
shares some of his thoughts on
unique ways to use Sony products
that reflect his creativity.
An antique
cabinet is my
Sony treasure
chest
Cineza—
The artist’s
assistant
My son the
Airboard expert
When I have friends over for a visit
and my son Sora, who is three-anda-half years old, finds our conversation hard to follow, he comes to
ask me if he can use the Airboard.
I say yes, and he’s already run off
somewhere in the house with it to
watch his favorite cartoons and
movies. It just goes to show that
even young children can enjoy
using state-of-the-art technology.
I graduated from an art school and like painting in oils. Whenever I
have the time, I paint at home using my other Cineza video projector as an assistant. In the old days, Dutch and Italian painters used
mirrors and lenses to paint life-like portraits. With my Cineza, I can
project pictures from my digital still camera and video camera onto
my canvas. Cineza has a side-shot feature that prevents distortion
even when projecting at an angle. Recreating an age-old painting
technique using modern digital technology
is truly a gratifying experience.
Alejandro M. Lopez
President and Representative Director,
beacon communications k.k.
Alejandro M. Lopez joined Leo
Burnett (USA) in 1986. Since then, he
has had a diverse creative career in
North America, Europe, Latin America
and Asia. In 1997, he came to Tokyo,
where he played a key role in the
establishment of beacon communications k.k., serving as its Managing
Director and Chief Creative Officer. In
March 2004, he was appointed to his
current position.
beacon communications k.k. URL:
http://www.beaconcom.co.jp/en/
34
Page 37

Previously President of the American Chamber of Commerce in
Japan, Mr. Lance Lee currently manages a gymnastics program
for children that aims to foster self-esteem and confidence. He
is full of praise for Sony’s technology and brand.
Sony, a brand
that I can trust
I choose Sony for many reasons
My first Sony product was a color television in a wooden cabinet. Since
then, I have purchased many other products made by Sony, including a
video cassette recorder, tape cassette player and MD player. Sony
products are easy to use and built to last. Come to think of it, I’ve been
using the same Sony television at work for 15 years. I probably use my
video camera the most often, though. I use it to record business presentations and meetings. I like the stylish design of the video camera and
the wide choice of colors.
The “Lance Lee Method” for recording athletics
I bought my first Sony video camera in the early 1980s. It was quite heavy
then. I’m now on my third video camera – Handycam. As I record the
children’s movements during gymnastic classes, the video camera’s light
weight and usability are of utmost importance. When I follow their
movements with the video camera, I place it in my hand to keep it steady.
When I want to record an entire scene, I hold the camera over my head,
tilting the monitor downward so that I can watch what I’m shooting.
Lance Lee
Lance Lee
Born in 1952, Lance Lee first came to Japan
about 30 years ago. After working for an
investment company, in 1977 he became a
physical education instructor at a number of
international schools in Tokyo, including the
American School in Japan, International School of
the Sacred Heart and Aoba International School.
In 2003, he served as the President of the
American Chamber of Commerce in Japan.
Currently, he manages IGC Japan Ltd., a
gymnastics program for children, and The
Resource Group, an organization that recycles
medical equipment.
IGC Japan URL: http://www.igcjapan.com/
A quality image
The name Sony is associated with quality. Although Sony products are
sometimes a little pricey, the company’s proven track record is a sure
sign of its products’ reliability. Sony’s customer service is also very
dependable and Sony parts are readily available anywhere, so you can
keep on using Sony products without ever having to worry.
35
Page 38

At a
Glance:
Operating Performance Highlights
Electronics
http://www.sony.net/electronics/
Description of Business
The Electronics segment consists of
the following categories: Audio,
Video, Televisions, Information and
Communications, Semiconductors,
Components and Other.
Fiscal Year in Review
• Segment sales slipped 1% due to a
significant decline in intersegment
sales to the Game segment that
resulted from the outsourcing of
PlayStation 2 (PS2) game console
production in China. However, sales
to outside customers increased 5%
compared with the previous year.
• Major contributors to the growth in
sales to outside customers were
cellular phones, mainly to Sony
Ericsson, Cybershot digital still
cameras and flat panel televisions.
• The segment recorded an operating
loss, despite the rise in sales, owing
to an increase in restructuring
expenses and falling sales prices.
Principal Products
Home audio, portable audio, car audio
and car navigation systems
Fiscal Year in Review
Sales decreased 9%, owing to declining
prices for MD Walkmans, CD
Walkmans and other portable audio
products as well as a contraction in the
overall home audio market.
Principal Products
Video cameras, digital still cameras,
video decks, DVD players/recorders and
set-top boxes
Fiscal Year in Review
Sales advanced 11%, mainly due to
higher unit sales of the Cybershot
digital still camera, a consequence of
market expansion, and our full-scale
entry into the DVD recorder market
during the period.
TelevisionsVideoAudio
Principal Products
CRT televisions, projection televisions,
plasma televisions, LCD televisions, PC
projectors, computer displays and CRTs
Fiscal Year in Review
Sales declined 4%, due to a significant
decline in sales of CRT televisions. In
contrast, there was a large increase in
sales of flat panel televisions, including
plasma televisions and LCD televisions,
and Grand Wega LCD projection
televisions.
Sales and Operating Income (Loss)
(Billion ¥)
(Year ended March 31)
5,286
4,940
–1
売上高
Sales
営業利益(損失)
Operating Income (Loss)
02
4,897
41
03
–35
04
36
Sales to Outside Customers
(Billion ¥)
(Year ended March 31)
747
683
624
02 03 04
Sales to Outside Customers
(Billion ¥)
(Year ended March 31)
948
851
847
02 03 04
Sales to Outside Customers
(Billion ¥)
(Year ended March 31)
984
950
917
02 03 04
Page 39

Information
and
Communications
Principal Products
PCs, printers, personal digital assistants
(PDAs), broadcast and professional-use
audio/video/monitors and other professional-use equipment
Fiscal Year in Review
Sales decreased 0.2%. Although the
VAIO PC performed well, sales of CLIÉ
PDAs fell due to increasingly intense
competition, particularly in the U.S.
market.
Semiconductors
Principal Products
LCDs, CCDs and other semiconductors
Fiscal Year in Review
Sales climbed 24%, reflecting strong
demand for CCDs, mainly for use in
digital still cameras.
Components Other
Principal Products
Optical pickups, batteries, audio/video/
data recording media and data recording systems
Fiscal Year in Review
Sales rose 18%, mainly owing to higher
unit sales of PC optical disc drives and
lithium-ion batteries, primarily for PCs.
Principal Products
Aiwa products, entertainment robots,
cellular phones (mainly sold to Sony
Ericsson), and products and services not
included in other categories
Fiscal Year in Review
Sales increased 14%, mainly as a result
of increased sales of cellular phones,
which benefited from increased demand
for camera-equipped models in Japan
and Europe.
Sales to Outside Customers
(Billion ¥)
(Year ended March 31)
999
837
835
02 03 04
Sales to Outside Customers
(Billion ¥)
(Year ended March 31)
253
205
182
02 03 04
Sales to Outside Customers
(Billion ¥)
(Year ended March 31)
624
528
512
02 03 04
Sales to Outside Customers
(Billion ¥)
(Year ended March 31)
490
558
501
02 03 04
37
Page 40

560
–8
598
22
600
19
04
03
02
売
営
At a
Glance:
Operating Performance Highlights
Description of Business
Game consoles and software business is conducted by
Sony Computer Entertainment Inc.
Description of Business
Music business is conducted by Sony Music Entertainment Inc. (SMEI) and Sony Music Entertainment
(Japan) Inc. (SMEJ).
MusicGame
http://www.sony.net/games/ http://www.sony.net/music/
Fiscal Year in Review
• Segment sales fell 18%, as sales of hardware and soft-
ware decreased compared with the previous period.
• PS2 hardware sales decreased, owing to a decline
in PS2 unit sales and strategic price reductions for
PS2 consoles. An increase in unit sales and revenue
of PS2 software was outweighed by a decrease in
the volume and value of PlayStation software sales.
• Operating income decreased 40% owing to an
increase in research and development expenses for
future businesses and the decline in hardware sales.
• PS2 hardware production shipments:
20.1 million units.
• PS2 software production shipments: 222 million units.
Sales and Operating Income
(Billion ¥)
(Year ended March 31)
1,004
955
780
113
83
68
Sales
Operating Income
EVANESCENCE
Fiscal Year in Review
• Segment sales declined 6%.
• Sales at SMEI, on a U.S. dollar basis, were flat com-
pared with the previous period. The appreciation of
European currencies contributed to higher sales
outside the U.S., although this effect was offset by
lower sales in the U.S. Sales at SMEJ were flat amid
challenging market conditions.
• SMEI recorded operating income as it reaped the
benefits from the worldwide restructuring measures
implemented over the past two years and from a
reduction in advertising and promotion expenses.
Operating income at SMEJ increased due to a reduction in selling, general and administrative expenses,
primarily advertising and promotion expenses, and
strong sales of recordings by Japanese artists.
Sales and Operating Income (Loss)
(Billion ¥)
(Year ended March 31)
Sales
Operating Income (Loss)
38
02
03
04
Page 41

Description of Business
金
Motion pictures, television and other businesses are
conducted by Sony Pictures Entertainment Inc. (SPE).
http://www.sony.net/movies/
Description of Business
The Financial Services segment includes Sony Life
Insurance Co., Ltd. (Sony Life), Sony Assurance Inc.,
Sony Bank Inc. and Sony Finance International, Inc.
Description of Business
The Other segment includes an Internet-related
business, So-net, which is conducted by Sony
Communication Network Corporation, an in-house
information system services business, an IC card
business and other businesses.
OtherFinancial ServicesPictures
© COLUMBIA PICTURES INDUSTRIES INC.
Fiscal Year in Review
• Segment sales decreased 6% compared with the
previous year, although U.S. dollar-denominated sales
edged up 2%, representing a new record for SPE. This
increase was led by growth in television revenue.
• Television revenue rose significantly due to contribu-
tions from The King of Queens, Seinfeld and Wheel
of Fortune.
• Operating income fell 40%, despite an increase in
operating income from television, primarily owing to
the absence of profits contributed by the hit film
Spider-Man in the previous year.
Sales and Operating Income
(Billion ¥)
(Year ended March 31)
803
636
31
756
59
35
Sales
Operating Income
Fiscal Year in Review
• Segment revenue rose 11%, reflecting an improve-
ment in valuation gains and losses from investments
at Sony Life.
• Operating income soared 142%, owing to an
improvement in valuation gains and losses from
investments in the general account at Sony Life.
Financial Services Revenue and Operating Income
(Billion ¥)
(Year ended March 31)
509
537
22
594
55
23
Financial Services Revenue
Operating Income
Fiscal Year in Review
• Segment sales increased 8%, owing to higher sales
by in-house information system services business
and by the IC card business.
• Operating loss declined as a result of a one-time
gain on the sale of rights related to a portion of the
Sony Credit Card portfolio by a U.S. subsidiary.
Sales and Operating Loss
(Billion ¥)
(Year ended March 31)
–25
330
–10
Sales
Operating Loss
261
306
–18
02
03
04
02
03
04
02
03
04
39
Page 42

Financial Services
Convergence – A Key to Sony’s
With a strong foundation in semiconductor technologies,
and with the convergence of home and mobile electronics,
Sony is continuing to produce the most fascinating consumer
brand goods in the world
Sony is implementing a growth strategy for its electronics business by
refining the definition of home and mobile electronics. Semiconductors
and other key components, which support the development of new
products, are vital both for differentiating Sony’s products from those
of its competitors and sustaining growth. Through the continued
evolution of these key components and their utilization in the development of attractive new products, Sony aims to maintain its allure as
the world’s most fascinating consumer brand.
Home Electronics
Mobile Electronics
40
Page 43

Other
Broadband will accelerate the convergence of electronics
and entertainment
Undoubtedly, broadband will be at the forefront of the unfolding
digital age. The creation of seamless networks that allow the increasing interconnectivity of digital consumer electronics will lead to a
world of unparalleled consumer convenience, satisfaction and even
surprise. As one of the few companies in the world to be involved in
both the electronics and entertainment industries, Sony intends to take
advantage of its unique position to actively pursue the convergence
strategies. By utilizing these new networks, and through the development of completely original media and services, Sony aims to make
entertainment an even more inspiring experience.
Home Electronics
Mobile Electronics
Game
Constant Transformation
Entertainment
The convergence of pictures and music entertainment:
Redefining Sony as a global media and content company
Game
In addition to the convergence of its electronics and entertainment
businesses, Sony is acutely aware of the importance of transcending the
traditional boundaries of pictures, music and other areas within the
entertainment business itself. By linking up these various kinds of entertainment services, and thus creating even more attractive entertainment
content, Sony aims to position itself as the world’s leading global media
and content company.
Entertainment
Financial Services
Other
41
Page 44

Home Electronics
Ken Kutaragi, Executive Deputy President,
Corporate Executive Officer
The proliferation of broadband networks
with television as the hub
Over the past several decades, television has evolved significantly, and it
is clear that it will be the hub of the
living room in the 21st century
A large screen television is essential for enjoying broadcast programs, movies, games and
other entertainment content. Looking back at
the evolution of television, it began as a small
black and white unit. The advent of color
television brought a new level of enjoyment,
while the addition of stereo sound has reproduced a striking realism. Today, the flat panel
is making large screen televisions possible,
while the digitization of images allows for
remarkable detail. Television will always be
the hub of the living room, which today can
be transformed into an entertainment theater
or a place to enjoy games.
In the post-CRT television era, Sony is
committed to developing a digital
television that is equipped with
multiple features and acts as the
point of contact between people and
entertainment
In addition to reproducing high resolution
audio and video, digital television enables easy
access to various types of entertainment, such
as movies, music and games, through IP networks and broadcasts. Sony strongly believes
that the television will evolve to become the
main point of contact between consumers and
entertainment content. In order to be well
positioned to offer full-featured advanced
televisions, Sony has focused on developing
such innovative technologies as Wega Engine
and SXRD (Silicon X-tal Reflective Display).
Unlike any other company, the Sony Group has
an entertainment portfolio comprising motion
pictures, music and game, in addition to its
electronics business. Through the convergence
of these businesses going forward, Sony will
continue to strengthen its electronics business.
Just as the introduction of CDs
revolutionized how users listen to
music, we aim to revolutionize the
visual world
More than 20 years ago, Sony co-developed
the compact disc (CD) with Royal Philips
Electronics of the Netherlands. We created an
environment where people can easily listen to
high-quality audio, which only used to be
possible at recital halls or other live concert
venues. Looking ahead, similar changes are
about to unfold in the visual realm. As television shifts from analog to digital, the quality of
image will evolve to high-definition. Viewers
will not only enjoy true natural colors but also
be immersed in an overwhelming sense of
realism. Sony’s goal is to accelerate the visual
revolution at home through digital television.
42
Page 45

Home Electronics
The home server’s role—to enable the
enjoyment of entertainment
anywhere in the home
There will soon be a time when high resolution,
large screen, thin flat panel televisions are
common not only in the living room but also
throughout the home. The home server’s role
will be to distribute movies, music, games and
other types of entertainment to each of these
flat panel televisions. The home server will
store a variety of entertainment that can be
downloaded or streamed through the network, then broadcast and distributed to the
various consumer electronics within the
home. It will also act as a network server,
distributing digital photographs and videos
to friends anywhere in the world via the
Internet. The DVD recorder with a hard disk
drive, which was introduced in the fiscal year
ended March 31, 2004, is a precursor to the
home server with its large storage capacity.
Future DVD recorders will incorporate such
advanced technologies as Blu-ray Disc and the
new microprocessor for the broadband era,
Cell, and will evolve into a device capable of
acting as a home server. Along with multifunction digital television, it will become a
core element of broadband network systems
within the home.
Super Audio CD/DVD
DVD recorder Sugoroku
The evolution of rear-projection
television
In the fiscal year ended March 31, 2004, Sony’s
Grand Wega LCD rear-projection television,
particularly the larger models with 60 inch to
70 inch screens, was a huge success in the U.S.
market. Two key reasons for its popularity were
its larger screen and lower power consumption.
In the fiscal year ending March 31, 2005, Sony
will introduce a newly developed high resolution
digital cinema projector equipped with the newly
developed SXRD, a high resolution LCD display
device, in the U.S. market. It will be marketed as a
commercial-use projector, targeting cinemas and
multi-purpose halls, where there is a strong
demand for higher resolution images. In the
future, Sony plans to incorporate this device into
its household LCD projection televisions.
Grand Wega
Mobile Electronics
Game
Entertainment
Sony and Samsung Electronics establish S-LCD Corporation to jointly mass-produce large size LCD panels
Sony is laying the groundwork to mass-produce
large size LCD panels, a technology considered to be
one of the most important display technologies of
the post-CRT television era. Sony and Samsung
Electronics Co., Ltd., have collaborated to establish
S-LCD Corporation. The joint venture will begin
manufacturing the seventh-generation amorphous
silicon TFT LCD display panel, which is primarily
intended for large size flat panel televisions, in April
2005. The glass substrate for these seventh-generation panels measures 1,870mm x 2,200mm. Each
substrate is expected to produce six large panels for
46 inch televisions, twice as many as the preceding
generation*. These substrates, along with other
technologies, will allow for a highly efficient production process. By establishing a stable supply of
panels over the foreseeable future, Sony intends to
actively develop products for the LCD television
market, which is expected to grow steadily in the
years ahead.
* Compared to sixth-generation amorphous TFT LCD
substrates
Overview of S-LCD
Capital: 2.1 trillion won (Samsung Electronics:
50% +1 share, Sony: 50% –1 share)
Location: Tangjeong, Republic of Korea
Product: Amorphous silicon TFT LCD display panel
(principally for large screen televisions)
Capacity: 60,000 panels per month
1,100X1,250
1,200X1,300
3.5G
650X830
600X700
Comparison of different generations of glass substrates
550X650
370X470
3G
2G
1,500X1,800
5G
4G
730X920
680X880
1,870X2,200
6G
1.96 times
1.73 times
7G
1.52
times
2.99
times
2.64
times
(Unit: mm)
8G
Financial Services
Other
43
Page 46

Mobile Electronics
Shizuo Takashino, Executive Deputy President,
Corporate Executive Officer
Control the pocket, control the future:
Sony’s core concept in mobile consumer electronics
Once products are reduced to pocket
size, demand for them skyrockets
Walkman changed how people enjoy music.
Similarly, the video camera and the digital still
camera have transformed the recording of
images into something anyone can enjoy. The
conclusion is clear: In the consumer electronics sector, converting products into portable
formats can spawn entirely new markets.
Sony’s products in the forefront of the mobile
electronics market include the video camera
Handycam, the digital still camera Cybershot,
the portable audio Walkman and the VAIO
notebook PC.
In the fiscal year ended March 31, 2004,
Cybershot DSC-T1 garnered the top share in
Japan’s digital still camera market, while in
the U.S., DVD Handycam was a huge hit.
Video cameras and digital still cameras are
making large contributions not only to Sony’s
sales but also to its profitability. These accomplishments are not due to smaller size and
weight alone. By incorporating internally
manufactured key components, such as LCDs,
batteries and CCDs, Sony is also reducing
production costs while offering products that
differentiate it from competitors.
Sony’s core concept in mobile electronics is
“control the pocket, control the future.” The
Walkman is irrefutable proof that downsizing a
device to pocket size can spark explosive
growth in a product category. Sony is dedicated
to devising new ideas for mobile electronics that
can alter lifestyles through products that give
customers new forms of excitement.
Tape recorders, radios and radio cassette
players are all examples of product categories
that are generally viewed as mature. Sony is
retaining high market shares and profitability
in these markets. At the same time, Sony is
creating new markets by launching many
products incorporating revolutionary technologies. Illustrating this drive is the Hi-MD
Walkman, which went on sale in April 2004.
This product transforms the MD into a versatile
recording medium for the broadband era by
offering large storage capacity and outstanding sound quality. Other features include high
compatibility with PCs and advanced copyright
protection technology.
Delivering impressive images—
Another central role for Sony in
mobile electronics
Sony’s DVD Handycam has been a huge hit in
the U.S., as it offers the user the convenience
of being able to immediately play back recordings on a DVD player. The second model in
this series, which is even smaller than the first
and embodies a new concept for disc-based
video cameras, has already been launched in
Japan and is beginning to appear in markets
around the world. Attention is now turning
toward high-definition (HD) video cameras.
Sony is currently working toward the global
launch of this product, accelerating the
44
Page 47

Home Electronics
transition from standard-definition (SD) to HD
cameras. For digital still cameras, the focus is
on unique features with the unmistakable
“Sony touch,” such as low power consumption, large displays, slim profiles and a rotating lens. Equally important is further progress
in resolution and overall picture quality.
Chapter 2 of the VAIO business: The
quest for a world in which quality
pictures and sound can be enjoyed
easily through networks
Since its introduction, the VAIO PC has carved
out a new market as a PC with enhanced
audio and visual (AV) functions, making it easy
to enjoy video, audio and other forms of content. Today, as broadband networks are creating demand for new ways to enjoy such
content through networks, Sony has responded by taking VAIO to the next level. In
addition to the basic PC functions, VAIO is
now equipped with cutting-edge imaging
technologies that deliver a dramatic improvement in picture and sound quality, enabling it
to be enjoyed as an AV device. Moreover,
portability is enhanced, owing to a more
compact size, lighter weight and lower power
consumption. VAIO also offers the ease of
operation that users expect from a mobile
consumer electronics product. Sony is introducing network AV products that function as
portable music players, taking the VAIO brand
into new business domains.
Portable music player VAIO pocket
PC VAIO type U
Hi-MD format
Hi-MD is a next generation format that transforms
the MD into a recording medium suitable for a
variety of applications. In addition to functioning
as a conventional MD recorder, the Hi-MD
Walkman has a Hi-MD recording mode that
approximately doubles recording capacity. With a
Hi-MD disc, which holds an enormous 1 GB of
data, up to about 45 hours* of music can be
stored. The Hi-MD mode recordings are encrypted
with OpenMG for copyright security. Designed for
compatibility with a PC, the Hi-MD is also a
rewritable medium that can be used to store text,
as well as visual and many other types of data,
opening up more potential applications for this
new format.
* Recording time from a PC using ATRAC3plus at 48
kbps to a 1 GB Hi-MD disc.
Hi-MD Walkman
Mobile Electronics
Game
Entertainment
Established on October 1, 2001 as a 50-50 joint
venture between Sony Corporation and LM
Ericsson, Sony Ericsson Mobile Communications
AB combines the strengths of Sony in the areas of
consumer electronics, games, pictures and music
with Ericsson’s leading mobile telecommunications technologies. During the fiscal year ended
December 31, 2003, Sony Ericsson significantly
increased sales and became profitable. By improving supply chain management and increasing
Z1010 S700
operational efficiencies and expanding its product
portfolio, it has laid a solid foundation for the
company’s future growth.
As users increasingly demand more sophisticated ways to communicate with others, the
multi-functionality of cellular phones has evolved
rapidly. By offering a wide range of innovative
cellular phones accessories, Sony Ericsson’s
cellular phones excel in the areas of easy-to-use
mobile imaging, messaging, entertainment and
connectivity. The T610, for example, has consistently shown strong sales in all Global System for
Mobile Communications (GSM) markets and was
one of the most popular cellular phones in 2003,
winning a string of awards including the GSM
Association’s Best Cellular Phone Award. In the
Japanese market, the company bolstered its
market position through the popularity of megapixel camera phones, SO505i/iS for NTT DoCoMo
Inc., and A5404S for KDDI Corporation. In addition, Sony Ericsson’s first 3G video phone, Z1010, is
already rated as the best 3G phone in the markets
where it is sold. Sony Ericsson has also unveiled
Z500, the first camera phone equipped with true
EDGE technology which enables faster data transmission speeds. It also features push-to-talk twoway radio-style communication possibilities.
Financial Services
SO505iS A5404S
Other
45
Page 48

Game
PlayStation 2
Building on the PlayStation platform to create a new world of
computer entertainment
PlayStation: The first home-use game
console to ship a cumulative 100
million units worldwide
In May 2004, Sony Computer Entertainment
Inc. (SCE)’s PlayStation (PS) became the first
home game console to surpass the 100 million
unit mark in cumulative global production
shipments for first generation PS and PS one.
Launched in Japan in December 1994, PS
made its way to North America and Europe in
1995 and soon after to Asia, Middle East,
Africa, Oceania, and Central and South
America. Today, PS is available in nearly 120
countries and regions around the world.
Additionally, more than 7,300 PS software
titles have been marketed globally as of
March 31, 2004, with production shipments
of game software reaching a cumulative total
of 949 million units.
Cumulative Production Shipments of PlayStation Hardware by Geographic Region
(as of May 18, 2004)
Japan and Asian region 20.72 million units (Launch date: Dec. 3, 1994)
North America 39.67 million units (Launch date: Sept. 9, 1995)
Europe (PAL region) 39.61 million units (Launch date: Sept. 29, 1995)
Cumulative total worldwide 100.00 million units
*Includes combined cumulative production shipments for PlayStation and PS one.
PlayStation appeared in Japan in December 1994, and it has
gradually amassed worldwide popularity
PS one, a lighter, more compact version of the PlayStation,
debuted in 2000.
With an extensive and appealing software
lineup, PS is known to a broad range of users
around the world as the standard household
gaming platform. This year marks a full decade
since PS was first introduced. A long product
cycle and worldwide availability have enabled
PS to far surpass all preceding game platforms.
PlayStation 2: New ways to enjoy
the console as popularity continues
to soar
Launched in 2000, PlayStation 2 (PS2) had
cumulative hardware production shipments of
71.3 million units as of March 31, 2004, with
cumulative shipments of PS2 software reaching 572 million units. The fiscal year ended
March 31, 2004 was a record-breaking year
for production shipments of PS2 software,
with 222 million units shipped. A steady
stream of compelling game software is also
expected to hit the market during the current
fiscal year and beyond. Now entering its fifth
year, PS2 has become the global standard and
is, undoubtedly, the household game console
of the moment. Due to further penetration of
PS2 in the worldwide game market, both
SCE and other game software developers/
publishers expect the peak years of the PS2
software business to continue.
46
Page 49

Home Electronics
The fiscal year ended March 31, 2004 saw
a number of hit titles emerge from both SCE
and other game software developers/
publishers. One was EyeToy: Play, which was
published by SCE and shipped over 3 million
units. Also during the past fiscal year, additional software has been introduced that
makes possible new ways to enjoy the PS2
platform, including online games and software with new user interfaces.
In Japan, North America, Europe and the
Republic of Korea, the development of game
software for online gaming is continuing
apace. As of March 31, 2004, a cumulative
total of more than 3.6 million units of network adapters for PS2, which are required for
online play, had been sold worldwide. The
number of titles available with online gaming
capability has reached approximately 140
worldwide. In recent years, game software
has been extremely well received, and has
been successful at attracting many new users,
by creating features that allow users to enjoy
PS2 in many new ways including USB cameras, used with EyeToy: Play, and drum-style
controllers, used in the Taiko no Tatsujin
series created by NAMCO Ltd. These new
interfaces are also playing a major role in
attracting new PS2 users.
SCE will continue to propose various new
ways to enjoy PS2, helping it gain further
ground as the standard game platform
among a wide range of users.
PlayStation Portable (PSP), handheld
video game system, to be launched
SCE is planning to roll out a handheld video
game system called PlayStation Portable (PSP)
in Japan in late 2004. PSP is scheduled to be
shipped in the U.S. and Europe in spring 2005.
PSP has a high-grade TFT LCD screen and
will allow users to enjoy game software with
3D computer graphics on a par with PS2
anytime anywhere. PSP’s wireless networking
capabilities will give users access to online
gaming and permit various PSP units to be
linked up into a wireless network—a feature
that should greatly expand available options
for playing games. The medium chosen for PSP
content is UMD (Universal Media Disc) —Sony’s
newly developed ultra-compact optical disc.
UMD can store up to 1.8 GB of digital data
and is equipped with the latest copyright
protection technology. This allows UMD to be
used not only for encoding game software
with dynamic moving images but also for
movies, music and other digital content.
SCE intends to promote both PSP and UMD
as new entertainment platforms, giving even
more people worldwide the opportunity to
experience the joy of portable entertainment.
PlayStation Portable (PSP)
Universal Media Disc (UMD)
Generating a new computer
entertainment system
By providing advanced technologies in the
form of development tools and middleware
necessary for the development of new
computer entertainment, SCE is continuing to
enhance the environment for creating new
content and further stimulate creativities of
game creators.
SCE continues to work on further increasing the popularity of the PS and PS2 platforms.
At the same time by aggressively promoting
PSP, which is scheduled for launch in late
2004, SCE will introduce an even more extensive and more appealing lineup of software.
SCE is also dedicated to stimulating further
development and growth of the game market
and developing an entertainment market
beyond its conventional boundaries.
Proposing new modes of play—
EyeToy: Play
SCE released EyeToy: Play, a software title that
provides a whole new way to enjoy the PS2 computer entertainment system, in July 2003 first in
Europe and then, subsequently, in other regions.
Through a USB camera, which connects to the PS2
console, this software allows players to use their
hands, legs and heads to interact with the game,
by placing them on the screen. This hit title has
sold more than 3 million units worldwide, playing
a major role in attracting new users to PS2. SCE
and other game software developers/publishers
are planning to launch a stream of titles compatible with the EyeToy USB camera.
EyeToy: Play
EyeToy camera
Mobile Electronics
Game
Entertainment
Financial Services
Other
47
Page 50

Entertainment
Howard Stringer, Vice Chairman, Corporate Executive Officer
Embracing the Sony spirit, entertainment
businesses drive the digital age forward to
offer 21st century experiences
Capitalizing on the strength of Sony’s core
assets – content and devices – the entertainment businesses have embraced a convergence
philosophy and are successfully driving the
digital age forward. We are creating new
forms of content and services to deliver
consumers the 21st century entertainment
experiences they desire. At the same time, we
remain focused on current and future profitability by strengthening our core businesses
and pursuing growth opportunities, and by
continuing restructuring efforts to reduce
costs and gain efficiencies.
Our positive momentum is a true testament
to our new executive leadership at Sony Music
Entertainment Inc. (SMEI) and Sony Pictures
Entertainment Inc. (SPE). Both SMEI Chairman
and CEO Andrew Lack and SPE Chairman and
CEO Michael Lynton are utilizing their extensive
business experience, financial discipline and
creativity to evolve their companies, to develop
new opportunities and to facilitate crosscompany collaboration.
In the fiscal year ended March 31, 2004,
Sony’s entertainment divisions took steps to
improve profitability through a discerning
approach to content development and the
successful execution of cost-saving initiatives.
Significant savings were achieved through
overhead reductions, streamlined shared
services, consolidated buying and more effective marketing and promotional spending.
Moving forward, we expect to generate
additional savings by continuing to evolve
more efficient business models.
To stimulate revenue growth, Sony’s entertainment businesses are leveraging new
distribution platforms by expanding our
valuable content libraries, digitizing existing
content to license to emerging mobile and
broadband services, and creating unique content
for new and exciting channels and formats.
Sony is also fostering innovative digital content
services, such as the Connect online music store;
®
SoapCity
and Sony Music Mobile for ringtone and music
for soap opera video-on-demand;
Motion Picture & Artwork © 2004 Columbia Pictures Industries, Inc. All Rights Reserved.
Spider-Man Character ® & © 2004 Marvel Characters, Inc. All Rights Reserved.
A music store for the digital age
In May 2004, Sony launched the Connect music
store in the U.S., offering consumers an easy-touse, affordable and secure means of purchasing
music online for download to a wide variety of
Sony portable electronic devices. Customers can
choose from hundreds of thousands of music
tracks from all major and many independent
music labels. Music fans can purchase singles for
99 cents and albums starting at $9.99. In the
U.S. alone, Sony has sold more than 2.5 million
Walkman-branded devices that are already compatible with the Connect store. By the end of
2004, that number is expected to increase to
nearly 7 million. In addition to Hi-MD Walkman
digital music players, other compatible devices
include Net MD Walkman recorders, ATRAC CD
Walkman players and Network Walkman players.
This year Sony expects to introduce a Connectcompatible pocketsize hard disc drive Walkman
device that will hold up to 13,000 songs and
provide a 30-hour battery life. In Europe, the
Connect store launches in summer 2004 in
France, Germany, and the United Kingdom.
48
Page 51

Home Electronics
video downloads. In addition to generating
revenues for Sony, these services provide distribution opportunities for artists along with greater
convenience and flexibility for consumers.
Moreover, Sony’s entertainment companies
are positioning themselves for the next generation of media distribution and content creation.
For example, SPE’s home entertainment group
plans to distribute its movies in the Blu-ray Disc
MUSIC BUSINESS
A transformation is under way, driven
by talent development and distribution on emerging new platforms
Under the direction of Chairman and CEO
Andrew Lack, SMEI returned to profitability in
the fiscal year ended March 31, 2004, realizing
the benefits from worldwide restructuring
activities that included the streamlining of
manufacturing, distribution and support
functions and the consolidation of label
services. At the same time, SMEI is currently
investing resources to further cultivate U.S.
and worldwide talent development.
In addition, in December 2003 Sony and
Bertelsmann AG entered into a binding
agreement to combine their recorded music
businesses in a joint venture. The newly
formed company, to be known as Sony BMG,
will be 50% owned by each parent company.
Sony BMG will combine the recorded music
businesses of BMG and Sony Music Entertainment (but not the parent companies’ businesses
in music publishing, physical distribution and
manufacturing, or Sony Music Entertainment
Japan Inc. (SMEJ)). The merger is expected to
close in summer 2004, following receipt of
regulatory approvals in the United States and
the European Union.
Currently, Sony’s music business continues to
succeed on a global scale, supported by top
2003 releases such as Dangerously In Love by
Beyoncé; Fallen by Evanescence; In This Skin
by Jessica Simpson; and Heavier Things by
John Mayer. Some other notable current and
upcoming releases contributing to SMEI’s
format for storing high definition movies and
other digital content. Similarly, we are looking
forward to expanding the consumer experience
and generating additional revenues through
the distribution of content in the new UMD
optical disc format for Sony’s new handheld
video game system PSP which will play games,
music and video.
momentum include titles by Prince, George
Michael, Destiny’s Child, Good Charlotte,
Jennifer Lopez, System of a Down and Shakira.
SMEI is continuing to focus its resources on
Beyoncé
Beyoncé’s multi-platinum debut
solo album,
earned five 2004 Grammy
Awards, the most Grammys won
in a single year by a female artist,
including Best Contemporary R&B
Album and Best R&B Song for
“Crazy In Love.”
Prince
Celebrating the 20th anniversary
of
the public’s acclaim with a spectacular performance at the 2004
Grammy Awards, his induction
into the Rock and Roll Hall of
Fame, and a historic world tour.
Purple Rain
Dangerously In Love
, Prince recaptured
Delta Goodrem
“Born To Try,” the first single from
,
Delta Goodrem’s debut album,
Innocent Eyes
one in Australia and New Zealand.
The second single, “Lost Without
You,” debuted at number one in
Australia.
Innocent Eyes
Australian charts at number one
and spent 29 weeks there, spawning five number one singles.
PornoGraffitti
This group’s popularity is rooted in
its ability to combine pop melodies
with rich vocals. Live performances
never fail to draw enthusiastic fans.
On July 28, 2004, PornoGraffitti will
release its first double-album of
best hits.
Sony’s entertainment companies are proud
to be playing such an important role in
shaping the future of digital entertainment
for consumers. We are continuing to create
personalized entertainment experiences that
can be enjoyed anywhere at anytime –
offering consumers choice, innovation,
flexibility and control.
developing U.S. and worldwide talent. One of
the primary efforts in this ongoing project is
the newly established Sony Urban Music,
which is exclusively dedicated to nurturing
John Mayer
John Mayer’s second album,
, went to number
entered the
Heavier Things
one on Billboard’s Top 200 Albums
chart and has sold more than two
million units since its release in
September 2003.
Crystal Kay
Crystal Kay is a captivating artist who,
after debuting at age 13, is now in
her fifth year of performing. Known
for her dedication and sincerity,
Crystal has an unforgettable voice.
On June 30, 2004, SMEJ released
CK5
, an album composed mainly of
songs that commemorate the fifth
anniversary of Crystal’s debut.
, debuted at number
Mobile Electronics
Game
Entertainment
Financial Services
Other
49
Page 52

and developing urban talent on behalf of the
company’s labels and divisions. This group has
recently worked with such top artists as Lil’ Flip,
Jagged Edge and Bow Wow. The music business
also remains committed to fostering local acts
throughout the world and bringing these artists
to the international stage. Such Sony artists as
La Oreja de Van Gogh (Spain), Delta Goodrem
(Australia), Jay Chou (Taiwan) and Garou
(Canada) are achieving international acclaim.
Additionally, SMEI has intensified its efforts
to make Sony content available through a
broad array of emerging distribution platforms,
including legal digital services in the U.S. and
Europe, as well as various mobile phone
services. The music company has established
distribution agreements with a wide range of
online services and is currently working with
partners to make master ringtone versions of
its most popular hit tracks available for sale to
mobile phone customers. Currently, SMEI offers
master ringtones for sale in more than 15
countries, including the United States, the United
Kingdom, France, Belgium, Spain, Portugal,
Italy, Sweden, Hungary, Australia, Germany,
the Netherlands, Norway, Taiwan, New
Zealand and Hong Kong, with more partners
and territories being added each quarter.
SMEI is also continuing its work with the
Recording Industry Association of America
(RIAA) and the International Federation of the
Phonographic Industry (IFPI) on the industry’s
anti-piracy efforts, and has led the industry in
the development of an innovative initiative
known as the Campus Action Network
(CAN). CAN is designed to help colleges and
universities across the country launch legal
online music services and combat illegal filesharing on campus.
SMEJ has long maintained a leadership
position in the Japanese music industry
through its recording, music publishing, artist
management and other related businesses. In
the fiscal year ended March 31, 2004, although
the Japanese market experienced an overall
double-digit decline in sales, SMEJ posted
higher sales and earnings. Releases from such
leading artists as CHEMISTRY, Mika Nakashima,
ORANGE RANGE and SOUL’d OUT helped
bolster SMEJ’s record business. SMEJ’s network
service business is continuing its growth, primarily through the strength of the Chaku-Uta
®
mobile phone master ringtone download
service, which is expected to be a major
contributor to revenues moving forward.
SMEJ plays a pivotal role within the music
industry by helping protect copyrights. In an
effort to stem the industry-wide problem of
unauthorized copying of CDs, SMEJ is distributing CDs with a unique technology to control
copying, known as Labelgate CD 2.
Taking the music library to mobile
phone users
Ringtone sales have become a burgeoning market
for the music industry and a promising new
revenue stream for SMEI. Sony Music currently
offers fans clips of actual song recordings, known
as master ringtones, as well as monophonic and
polyphonic ringtones, digital voice ringers recorded
by celebrities, prepaid cards, sound effects, wallpaper images, song dedications, mobile karaoke
and imaging services. SMEI has been collaborating with wireless service partners around the
world to sell the ringtones of its most popular hit
tracks. SMEI was also the first major music company
to offer master ringtones in the U.S. through a
partnership with Sprint, one of the leading U.S.
wireless carriers. Through its Sony Music Mobile
Group, the music company supplies mobile
products and services in more than 15 countries
and develops a number of unique product
lines. Among them are Sony Music Box, a next
generation on-handset content browsing service;
RUNpics, a leading mobile imaging service; and
Front Row by Sony Music, a downloadable
service featuring news and previews of music,
artists and releases.
The Chaku-Uta® mobile phone
ringtone download service
In Japan, the rising popularity of third-generation
mobile phones is sparking rapid growth in demand
for SMEJ’s Chaku-Uta®, which allows users to use
a CD passage as a ringtone. These downloads
have grown into a ¥10 billion market just one
year after the rollout of this service. To become
the first in the world to launch a service of this
type, SMEJ drew mainly on the resources of Label
Mobile Inc., a company formed with four other
major record companies. Today, Chaku-Uta® is the
largest ringtone service in the industry.
PICTURES BUSINESS
Vision and creativity enable Sony to
build a leadership position for the
digital future
SPE Chairman and CEO Michael Lynton and
his talented team are strengthening the
motion picture, television and digital divisions
through a disciplined approach to content
development and by enhancing the value of
Sony Pictures’ vast library of films and television
50
programs. Emerging new formats and distribution channels also continue to serve as a
catalyst for SPE to explore and develop
unique business opportunities.
Under SPE Motion Picture Group Chairman
Amy Pascal, the motion picture group has
continued its strong performance by releasing a
broad portfolio of films via multiple distribution
labels including Columbia Pictures, Screen Gems
and Sony Pictures Classics, as well as Revolution
Studios. For the second consecutive year, SPE
has generated ticket sales in excess of $1 billion
in each of the U.S. and international markets.
Success in the fiscal year ended March 31, 2004
was fueled by releases such as Bad Boys II,
S.W.A.T., Anger Management, Something’s
Gotta Give and 50 First Dates. With a slate led
by the much anticipated summer 2004 release
Page 53

Home Electronics
of Spider-Man 2, SPE is poised for another
outstanding year at the box office. In addition,
SPE will continue to capitalize on the rapidly
growing worldwide home entertainment
market by generating revenue from both new
releases and its library of more than 4,000 films.
The television group had an exceptional year
in 2003. Employing a creative and economic
approach to program development, the
television production business successfully
launched Joan of Arcadia in 2003, one of the
highest-rated new shows on U.S. prime time
television. Syndication sales such as the recordsetting third cycle syndication of Seinfeld, and
the ongoing success of game shows such as
Wheel of Fortune and Jeopardy! and daytime
dramas such as the Emmy award-winning The
Young & the Restless and Days of Our Lives
also continue to contribute significantly to
SPE’s profitability.
Internationally, SPE continues to expand its
local television programming production and
to enhance the value of its international library.
Building on its investments in more than 35
networks, SPE is extending its AXN and
Animax network brands through new launches
in important territories.
Developing new revenue streams through its
digital businesses is a priority for SPE. With
nearly 1,700 films and television programs
already digitized, SPE is well-prepared to offer
its library to new distribution outlets. Moreover, SPE plans to support the launch of the
PSP portable player and the Blu-ray high
definition formats. Having established a
leading position in digital effects and animation through Sony Pictures Imageworks, SPE
looks to extend further into digital content
with Sony Pictures Animation, its new
animation unit that will develop and produce
all-computer generated feature films.
On the cutting edge of all aspects of digital
entertainment, SPE continues to work closely
with the Motion Picture Association of
America (MPAA) on efforts to combat piracy
and to protect its content around the world.
Sony Pictures Imageworks moves
forward with IMAGEMOTION™
Sony Pictures Imageworks is advancing to the
next level of digital content creation with
IMAGEMOTION™, the new proprietary performance-motion-capture system developed for the
movie
The Polar Express
directed by Robert Zemeckis. Imageworks is well
known as an award-winning visual effects and
character animation facility responsible for the
groundbreaking visual effects in such films as
Spider-Man, Spider-Man 2, Stuart Little, Bad Boys
II, Cast Away, Harry Potter and the Sorcerer’s
Stone
and the Academy Award®-winning CG-
animated short film
IMAGEMOTION™ is a revolutionary system
capable of simultaneously recording high-fidelity
facial and body motions of many actors in a
particular scene. This technology enables creation
of computer-based characters with remarkably
realistic facial expressions and human motions.
Currently, a number of projects are under development at Imageworks, many of which utilize the
IMAGEMOTION™ process. Imageworks will
continue to invent cutting-edge technologies and
produce groundbreaking visual experiences for
the next generation of digital entertainment.
, starring Tom Hanks and
The ChubbChubbs!
.
Mobile Electronics
Game
Motion Picture & Artwork © 2003 Columbia
Pictures Industries, Inc. All Rights Reserved.
Motion Picture & Artwork © 2004 Columbia
Pictures Industries, Inc. All Rights Reserved.
Spider-Man Character ® & © 2004 Marvel
Characters, Inc. All Rights Reserved.
Big Fish
Tim Burton’s
in 2003, is the heartwarming
tale of the fabled relationship
between a storytelling father
and his estranged son, who is
trying to separate fact from
fiction and come to terms
with his father’s great feats
and great failings.
Spider-Man 2
Two years have passed since
Peter Parker walked away from
his longtime love and decided
to shoulder great responsibility
as Spider-Man. In
Peter faces new challenges as
he struggles to balance his dual
identities as Spider-Man and a
college student. The relationships he holds most dear are in
danger of unraveling as he
clashes with a powerful,
multi-tentacled villain.
Big Fish
Spider-Man 2
, released
Motion Picture © 2003 Sony Pictures Imageworks Inc.
All Rights Reserved.
,
Motion Picture & Artwork © 2003 Columbia
Pictures Industries, Inc. All Rights Reserved.
Early Bloomer
Early Bloomer
animated short film, is a
comical coming-of-age tale
about an awkward, but
adorable, tadpole just
trying to fit in and keep up
with his mischievous and
playful friends.
S.W.A.T.
S.W.A.T.
is an explosive action-thriller,
inspired by the popular 1970s
television series. In the film,
an elite law enforcement unit
transporting a drug lord to
federal prison is pursued by a
ruthless and well-armed band
of mercenaries trying to free a
kingpin for a $100 million
reward.
, a CG
, a summer 2003 hit,
Joan of Arcadia
Joan of Arcadia
drama that follows sixteen-yearold Joan Girardi (Amber Tamblyn)
as she struggles with the uneasy
life of a teenager, further complicated when God visits her through
a variety of different people.
Although she initially questions
her sanity, Joan eventually follows
His advice, finding truth in the
old adage that “God works in
mysterious ways.”
Television Series © 2003, 2004 Sony
Pictures Television Inc. and CBS
Broadcasting Inc. All Rights Reserved.
allowing hundreds of thousands of online gamers to come
together in an immense 3D fantasy world for adventure, excitement and social interaction.
is an hour-long
EverQuest II
EverQuest II
currently in development by Sony
Online Entertainment Inc. (SOE).
EverQuest II
next generation of
massive-multiplayer
online gaming,
is
is the
Entertainment
Financial Services
Other
51
Page 54

Financial Services
A new financial holding company
integrating life insurance, non-life
insurance and banking functions, and
offering high added-value products and
Teruhisa Tokunaka, Executive Deputy President,
Representative Corporate Executive Officer
Sony established a financial holding
company, Sony Financial Holdings Inc., on
April 1, 2004
On April 1, 2004, Sony established Sony
Financial Holdings Inc. (SFH) to oversee the
operations of Sony Life Insurance Co., Ltd.
(Sony Life), Sony Assurance Inc. (Sony Assurance)
and Sony Bank Inc. (Sony Bank). With this
move, SFH became the first financial holding
company in Japan to integrate three financial
services under one umbrella: life insurance,
non-life insurance and banking.
Unlike other Sony Group businesses, a
growth in our financial services business brings
a concurrent increase in the volume of assets
deposited by customers. As of March 31,
2004, total assets of Sony’s Financial Services
segment stood at approximately ¥3,475.0
billion, a 20% increase compared to the end
high-quality services
of the previous fiscal year, as these businesses
continued to expand. The financial services
market in Japan is changing due to factors
such as a decreasing birth rate, a rapidly aging
population and advances in information technology. These trends are expected to generate
even greater diversity in customers’ lifestyles,
and consequently in the financial products
they require.
To respond quickly and accurately to these
changes, we decided that the Sony Group’s
financial services business needed to adopt a
holding company structure that further concentrates specialized knowledge and operational
resources believing that such a structure would
better enable the Group to develop valueadded products and services that enhance
customer convenience. Accordingly, we set up
SFH as a strategic and creative financial holding
company. The aim is to raise the corporate
value of financial services businesses by transcending the boundaries of life insurance,
non-life insurance and banking, creating a
unified platform for the diverse functions of
savings, investment, borrowings and protection.
Promoting extensive disclosure for the
financial services business
Increasing the corporate value of the
entire Sony Group by raising the value of
the financial services business
While preserving the independence of the
three financial services from Sony Corporation
as a whole, the establishment of SFH allows
the provision of a coordinated and comprehensive financial strategy. SFH is confident
that this approach will create a sound financial services business and lead to steady
growth. Accomplishing this aim will add
value to the Sony brand by linking it more
closely with security and trust in the eyes of
its customers, while at the same time producing earnings that contribute to Sony’s
consolidated performance.
SFH is also committed to extensive disclosure.
By encouraging greater understanding regarding the soundness of its management by
customers and investors alike, SFH will strive
to become an increasingly trusted provider of
financial services.
52
Page 55

Home Electronics
To reinforce and enlarge its operating foundation, the Sony Group is currently contemplating a public offering of SFH, which would
diversify SFH’s ability to procure funds to
support its growth. It would also facilitate
accurate assessment of the value of SFH’s
business, thereby likely leading to a growth in
value of the entire Sony Group.
Strengthening products and services by
integrating sales channels and delivering
comprehensive financial services that
adapt quickly to shifts in market trends
All three Sony financial services companies
have an excellent reputation among customers
for their ability to offer distinctive products and
services. Sony Life is known for its consulting
sales centered around a team of highly trained
life insurance professionals called Lifeplanners.
Sony Assurance conducts direct sales, predominantly by telephone and the Internet,
while Sony Bank serves customers mainly
through the Internet. We plan to integrate the
strengths of these companies while harnessing
Sony’s spirit of creativity and innovation. This
process will allow us to fill in gaps that exist in
the customer segments and services of each
financial services company.
This integration strategy is already being
put into practice. For instance, Sony Life’s
Lifeplanners introduce automobile insurance
services offered by Sony Assurance to their
customers. Likewise, the sales team at Sony
Assurance recommend the Lifeplanner consulting services of Sony Life. Furthermore, at Sony
Bank, Sony Life’s group credit life insurance
policies are offered to customers who apply for
housing loans from Sony Bank. SFH intends to
accelerate its integration strategy in order to
continue offering competitive, value-added
products and services that conventional
financial institutions cannot match.
Sony Finance International, Inc.
Sony Finance International, Inc. is involved in the
provision of credit card, e-commerce payment
processing and leasing operations. In 2002, the
company began issuing its eLIO-branded cards,
which were created specifically for Internet shopping
and incorporated Sony’s contactless IC card technology. Efforts to increase the number of member
merchants and affiliated partners are supporting
steady growth in the number of card members and
volume of transactions. As of March 31, 2004,
there were about 500,000 eLIO cards and 1 million
conventional credit cards, in total about 1.5 million
cards issued by Sony Finance International, Inc.
Raising the number of eLIO cards issued to 1
million by March 31, 2005 is the next goal. Making
the card even more attractive are two additional
functions: the ability to serve as e-money for the
Edy service of bitWallet, Inc.; and VISA cobranding.
My Sony Card, a credit card created for secure and
simple Internet shopping
Mobile Electronics
Game
Entertainment
Sony Life
Sony Life is guided by the slogan “Sony Life Quality.”
which expresses the company’s desire for people to
understand that, like any other product, quality is a
key element in the life insurance industry.
Customized insurance plans are formulated for
each customer by highly trained life insurance professionals called Lifeplannners, or Partners (independent
agents), who listen to the customer and offer analysis
and consulting based on the their current status, plans
and future goals. Sony Life provides policies and
protection that best match the needs of each customer over their entire lifetime, ensuring peace of
mind and well-being. In the event of an unfortunate
occurrence, coverage and other benefits are provided
in an accurate and timely manner.
While overall individual life insurance in force in
Japan is declining, Sony Life’s excellent reputation led
to a 5.8% increase in individual life insurance in force
during the fiscal year ended March 31, 2004 to
¥26,242.6 billion. Furthermore, the cancellation and
lapse rate remained low at 7.4%.
Sony Assurance
Sony Assurance offers fair and meticulously structured
individualized policies through its diversified-risk automobile insurance and cancer insurance called SURE,
both of which are sold through the Internet and over
the telephone. For the fiscal year ended March 31,
2004, steady growth in the number of policyholders
continued, resulting in a 27% increase* in net
premiums received to ¥31 billion. The number of
automobile and cancer insurance policies in force
surpassed 500,000. As a result, Sony Assurance
recorded operating income for the first time (on a
U.S. GAAP basis). Five years since its creation, Sony
Assurance is entering the next phase of its operations
based on the corporate slogan, “Feel the Difference—
A difference that will change insurance.” We are
working on creating distinctive products and services
to achieve this difference and translate it into value
for customers.
*Net premium revenues and year-on-year changes at Sony
Assurance are calculated on a U.S. GAAP basis. Therefore, these
figures differ from the results that Sony Assurance announces on
a Japanese statutory basis.
Sony Bank
In an effort to allocate, manage and invest the financial assets of customers to match their individual
needs, Sony Bank offers an investment and asset
management tool called MONEYKit through its
Internet service site. During the fiscal year ended
March 31, 2004, the number of accounts at Sony
Bank increased 77,666, or 40%, to 268,780, and
deposits rose ¥130.1 billion, or 52%, to ¥378.8
billion. Particularly noteworthy were foreign currency
deposits, a 24-hour service, which rose 2.2 times, or
¥58.6 billion, to ¥107.2 billion.
Sony Bank is dedicated to maximizing convenience
for housing loan customers. For example, Sony Bank
offers a loan that eliminates the need to visit a bank
office during the entire application and approval
process. Furthermore, housing loan customers can use
the Internet to easily change the interest rate structure
on a loan or make advance repayments. As a result,
the balance of housing loans rose ¥39.7 billion, or 2.9
times, during the fiscal year ended March 31, 2004 to
¥60.4 billion.
(as of May 2004)
Financial Services
Other
53
Page 56

Other
Internet Service Provider
The Internet environment in Japan is changing rapidly. At the end
of March 2004, out of
more than 36 million
Internet users currently
in Japan, over 14 million are using a broadband
connection.
In this climate, Sony is taking steps, through
its Internet service business So-net, to offer a
comprehensive range of broadband connection and content services.
For example, in April 2004, as part of a
service that allows consumers to view Internet
web sites on their home television, So-net has
pioneered a new way to enjoy television viewing by launching a new service for the location
free television Airboard LF-X1. By connecting
the Airboard to the Internet, this service allows
users to conveniently view a variety of content,
including news, weather forecasts, program
listings and horoscopes—even while they are
watching television.
So-net also supports NetAV*, a distinctive
feature of Airboard, which allows users to
remotely view television programs and DVD
content broadcast from their homes, even
when they are overseas.
Integrated Circuit (IC) Card Business
FeliCa, Sony’s contactless IC card
technology, is becoming an essential part
of our everyday lives
FeliCa is a contactless IC card that, when placed
over an electronic reading device, facilitates the
smooth exchange of information. “FeliCa” stems
from the word “felicity,” which literally means
“great happiness.” As its name suggests, FeliCa
was designed to make daily activities more enjoyable and convenient. Because data on the card
can be overwritten many times, the card can be
used repeatedly. In addition, the card can store
distinct information for, and be accessed independently by, various companies, making it a multiple-purpose card. It also boasts the fastest
processing speed in the IC card industry. Through
its mutual authentication and data encryption
technology, it provides a secure environment for
data transmission. Separate access rights can be
established for different companies in the card’s
memory, thus facilitating independent access by
multiple companies.
As evidence of the high value
placed upon these features, FeliCa technology is
currently being utilized by a wide range of mass
transit systems in Japan, including the Suica
commuter pass of East Japan Railway Co., Ltd. (JR
East); the ICOCA commuter pass of West Japan
Railway Co., Ltd. (JR West); and local bus services.
FeliCa has also been adopted by public transportation systems in Hong Kong, Singapore, China
and India. In particular, in Hong Kong, which was
the first location worldwide to adopt FeliCa technology, cards based on FeliCa technology can be
used in public phones and convenience stores.
FeliCa technology has also been adopted for
use in electronic payment systems for the purchase of food and beverages at stores and
shopping centers, as well as for ID and access
control for corporate offices and schools. In
Japan, FeliCa is being employed in the Edy electronic money service, which is operated by
bitWallet, Inc., and accepted at more than 9,000
convenience stores and other retail outlets nationwide. Sony Finance International, Inc., also
uses FeliCa technology for its credit card, eLIO,
which was developed exclusively for Internet
shopping. Also, in summer 2004, NTT DoCoMo
Inc., will begin selling cellular phones embedded
with an IC chip based on FeliCa technology.
Contactless IC card FeliCa
A web site service for Sony’s Airboard LF-X1 location free
television
*NetAV is a function made possible through So-net’s
Dynamic DNS service (recommended). Content viewed
through this service is intended for personal use only, and
any other use, unless permission is obtained from the
copyright holder, is strictly prohibited.
Suica* prepaid commuter pass, valid
on all JR East, Tokyo Monorail and
Tokyo Waterfront Area Rapid Transit
railway lines
Approximately 9 million cards issued
to date
*Suica is a registered trademark of JR East.
ez-link Card (Singapore)
Used on railway, subway and
buses in Singapore
Approximately 6 million cards
issued to date
Octopus Card (Hong Kong)
Octopus Watch (Hong Kong)
ICOCA* prepaid commuter
pass, valid on all JR West
railway lines
Approximately 1.3 million cards
issued to date
*ICOCA is a registered trademark of JR
West.
ANA Mileage Club Card, Edy card
(All Nippon Airways Co., Ltd.)
Can be used to convert air miles
into Edy electronic money
Can be used on railway, subway, buses,
ferries and other public transportation, as
well as for the purchase of goods and as a
form of ID
Available in card or watch form
More than 10 million cards issued to date
* Octopus Card and Octopus Watch are registered
trademarks of Octopus Cards Limited.
54
Page 57

Europe—DVD Handycam
Sony’s Advertising Around the World
To promote its products and brand,
Sony conducts advertising around
the world in a style that matches the
cultures and customs of individual
countries and regions.
Latin America—Net MD Walkman
Japan—QRIO robot
U.S.—Digital still camera
China—DVD player
55
Canada—Flat panel television
Page 58

Corporate Governance
Functions of the “Company with
Committees” system
Adoption of the “Company with Committees”
system
In June 2003, Sony adopted the “Company
with Committees” system in accordance with
the Japanese Commercial Code. The result
was the establishment of three statutory
committees, the Nominating Committee, the
Audit Committee and the Compensation
Committee, each consisting of a majority of
outside directors, and the appointment of
Corporate Executive Officers (“Shikko-yaku”).
The Board of Directors and the three statutory
committees determine the fundamental
management policies of the Sony Group and
ensure that the Group is managed appropriately
and compliance with its legal obligations with
the law, thereby enhancing corporate value.
The role of each corporate governance body
The roles of the Board of Directors and its
three statutory committees are as follows.
Board of Directors
(1) Determinates the fundamental manage-
ment policies for the Sony Group
(2) Supervises the execution of the Sony
Group’s business operations
(3) Determines the Directors organizing each
committee
(4) Appoints and dismisses Corporate
Executive Officers
Statutory Committees
Nominating Committee: Proposes the nomination and dismissal of Directors
Audit Committee: Audits the execution of
duties of Directors and Corporate Executive
Officers, determines proposals to nominate
and dismiss the independent auditors
Compensation Committee: Determines the
individual compensation of each Director and
Corporate Executive Officer
Officers with relation to capital expenditure,
equity-based business alliances and other
actions related to the execution of their
respective business operations. Using their
authority and carrying out their responsibilities
within the scope delegated to them by the
Board of Directors, these officers work toward
enhancing the Sony Group’s corporate value.
Composition of each corporate
governance body
At the Ordinary General Meeting of Shareholders held on June 22, 2004, shareholders elected
16 Directors, including eight outside Directors.
At the subsequent Board of Directors meeting,
members of the three statutory committees
and 15 Corporate Executive Officers, including
the two Representative Corporate Executive
Executive Officers (“Gyomu shikko-yakuin”):
Officers, were determined.
These officers are delegated responsibility for
carrying out business operations within specific
areas of Sony Corporation, such as its business
units, research activities and head office
functions. They act in accordance with
fundamental policies determined by the Board
of Directors and Corporate Executive Officers.
Meetings held
During the fiscal year ended March 31, 2004
(June 20, 2003 through March 31, 2004 for
Statutory Committees), the Board of Directors
met nine times, the Nominating Committee met
four times, the Audit Committee met eight times
and the Compensation Committee met six times.
Structure of New Sony Corporate Governance System
Supervision
(1) Determination of fundamental management policies for the Sony Group
(2) Supervision of execution of the Sony Group’s business operations
(3) Determination of Directors organizing each committee
(4) Appointment and dismissal of Corporate Executive Officers
Chairman of the Board: Iwao Nakatani* Vice Chairmen of the Board: Hirobumi Kawano*,
Te ruo Masaki
Nominating Committee
Proposes nomination and
dismissal of Directors, etc.
Yotaro Kobayashi*
(Chairman)
Hirobumi Kawano*
Carlos Ghosn*
Nobuyuki Idei
Kunitake Ando
Board of Directors
Audit Committee
Audits the execution of duties
of Directors and Corporate
Executive Officers, determines
proposals to nominate and
dismiss the independent
auditors, etc.
Yoshiaki Yamauchi*
(Chairman)
Sakie T. Fukushima*
Akihisa Ohnishi
Execution
Execute Sony Group business activities within the scope of authority delegated by the Board of Directors
Corporate Executive Officers
Compensation Committee
Determines the
compensation of each
Director and Corporate
Executive Officer, etc.
Akishige Okada*
(Chairman)
Yoshihiko Miyauchi*
Teruo Masaki
Corporate Executive Officers (“Shikko-yaku”):
The Board of Directors has delegated considerable authority to the Corporate Executive
56
Executive Officers / Group Executive Officers / Employees
*Outside Director
Page 59

Reasons for adoption of the “Company with
Committees” system
The adoption of the “Company with Committees”
system proceeded very smoothly due to the fact
that Sony already had nominating and compensation committees in place and had elected outside
directors. This new system was adopted in order
to strengthen our system of corporate governance,
which has the primary function of ensuring
transparency in corporate management, as well as
serving as a resource for the prompt identification
of, and response to, corporate problems. Prior to
the adoption of this system, Sony had already
taken a variety of steps to strengthen corporate
governance, including the adoption of the
executive officer system in order to separate the
roles of corporate oversight and business
execution. Sony adopted the “Company with
Committees” system, when it was first provided
as an option under law, in order to enhance the
legality of the governance system Sony had
already voluntarily established.
Te ruo Masaki, Member of the Board
Progress report on corporate governance one year after
the adoption of the “Company with Committees” system
Sony’s distinctive approach to corporate
governance
In order to further strengthen corporate
governance, regulations for the Sony Board of
Directors include requirements in addition to
those mandated by the Japanese Commercial
Code. For example, there are rules to ensure the
independence of the Board of Directors, a
supervisory body, from the execution of business
activities. There are also rules to ensure that
appropriate actions and decisions are taken by
the statutory committees.
Certain provisions in Sony’s corporate governance regulations are unique to Sony and are
based on the specific views of the company. For
example, one regulation requires that the Board
of Directors, a supervisory body, consists of
between 10 and 20 members, and that at least
five of these Directors also must be Corporate
Executive Officers. In general, a system that
stipulates a minimum number of internal directors
is unusual given the importance attached to
separating the supervisory and executive roles
within a company. Nevertheless, Sony believes
that the participation of more than just a
minimum number of internal Directors on the
Board of Directors is critical, based upon the
belief that specific areas of the executive
functions, such as accounting, finance, legal
affairs and other internal control functions,
should be directly linked to the supervisory side of
corporate governance. In the event of the
discovery of a problem related to the business
execution within a company, a framework that
completely separates corporate oversight from
business execution could increase risk, due to a
lack of communication or the existence of an
inadequate interface between the two sides. For
this reason allowing part of the internal control
functions belonging to the business execution
side, led by the Group CEO, to be an extension of
the Board of Directors, allows for the creation of
a direct link between business execution and
corporate oversight. Within this corporate
governance framework, potential problems
discovered within the scope of business execution
can be reported directly to those responsible for
corporate governance, allowing the latter to
respond more rapidly to any potential problems.
We therefore seek to avoid risks associated with
the complete separation of corporate oversight
from business execution, including the risk that
information involving executive actions is not
being properly communicated to the Directors.
Through this corporate governance system, Sony
is able to strengthen the supervisory function of
the Board of Directors and delegate greater
authority for business execution to the Corporate
Executive Officers, enabling the continued sound
and dynamic management of the Sony Group.
Changes resulting from the adoption of the
“Company with Committees” system
The adoption of this system has facilitated even
more lively deliberations among the Board of
Directors. Previously, most executive decisions
were made by the Board of Directors, the highestlevel decision making body. However, under the
new system, the Board has delegated greater
authority to Corporate Executive Officers, in the
process entrusting them with a broader range of
executive decisions. The introduction of this
system has led to the clear division of these two
corporate governance functions. Corporate
Executive Officers execute business operations by
making decisions within the scope of authority
delegated to them by the Board of Directors, and
the Board of Directors oversees their decisions. As
a result of this structure, executives responsible
for the execution of business operations are
required to explain, with even greater clarity, to
the Board of Directors the reasons behind their
business decisions.
Corporate Social Responsibility (CSR)
As a global organization, the Sony Group conducts its
business activities with due consideration of the interests of
its various stakeholders, including shareholders, customers,
employees, business partners and local communities. In
2003, Sony published the Sony Group Code of Conduct,
which establishes fundamental policies for all Sony Group
executives and employees with regard to the respect for
human rights, the safety of its products and services, the
environmental impact of its business activities and the
disclosure of information. The Sony Group will continue to
make strenuous efforts to strengthen its system of compliance
and ensure the sound conduct of all its business activities.
The Sony CSR Report 2004.
57
Page 60

New Members of the Board and Corporate Executive Officers
(As of June 22, 2004)
MEMBERS OF THE BOARD
Nobuyuki Idei
Sony Corporation
Chairman, Representative
Corporate Executive Officer
Kunitake Ando
Sony Corporation
President, Representative
Corporate Executive Officer
Te ruo Masaki
Sony Corporation
Executive Deputy President,
Corporate Executive Officer
CORPORATE EXECUTIVE OFFICERS
Howard Stringer
Sony Corporation
Vice Chairman,
Corporate Executive Officer
Ken Kutaragi
Sony Corporation
Executive Deputy President,
Corporate Executive Officer
Te ruhisa Tokunaka
President, Representative Director,
Sony Financial Holdings Inc.
Göran Lindahl
Sony Corporation
Akihisa Ohnishi
Sony Corporation
Iwao Nakatani
Director of Research,
UFJ Institute Ltd.
Akishige Okada
Chairman of the Board
(Representative Director),
Sumitomo Mitsui Financial
Group, Inc.
Hirobumi Kawano
Executive Adviser to The Tokio
Marine and Fire Insurance Co., Ltd.
Yotaro Kobayashi
Chairman of the Board, Fuji Xerox
Co., Ltd.
Carlos Ghosn
President and CEO, Nissan Motor
Co., Ltd.
Sakie T. Fukushima
Representative Director &
Regional Managing DirectorJapan, Korn/Ferry International
Yoshihiko Miyauchi
Director, Representative Executive
Officer, Chairman and CEO, ORIX
Corporation
Yoshiaki Yamauchi
Director, Sumitomo Mitsui
Financial Group, Inc.
Nobuyuki Idei
Chairman and Group CEO,
Representative Corporate
Executive Officer
Kunitake Ando
President and Global Hub
President, Representative
Corporate Executive Officer,
Officer in charge of Personal
Solutions Business Group
Howard Stringer
Vice Chairman and COO
(in charge of Entertainment
Business Group), Sony Group
Americas Representative
Shizuo Takashino
Executive Deputy President and
COO (in charge of IT & Mobile
Solutions Network Company and
Professional Solutions Network
Company)
Ken Kutaragi
Executive Deputy President and
COO (in charge of Game Business
Group, Home Electronics
Network Company (HENC) and
Semiconductor Solutions Network
Company (SSNC)), NC President,
SSNC
Te ruo Masaki
Executive Deputy President and
Group General Counsel
Katsumi Ihara
Executive Deputy President and
Group CSO & CFO
Ryoji Chubachi
Executive Deputy President and
COO (in charge of Micro Systems
Network Company (MSNC) and
EMCS), NC President, MSNC
Keiji Kimura
Senior Executive Vice President,
NC President, IT & Mobile
Solutions Network Company
Tsutomu Niimura
Executive Vice President, NC
President, HENC
Fujio Nishida
Executive Vice President, Officer
in charge of Marketing and
Corporate Communications
Takao Yuhara
Senior Vice President, Officer in
charge of Finance and Investor
Relations
Nobuyuki Oneda
Senior Vice President, Officer in
charge of TR60, Corporate
Planning & Control, Accounting
and Information Systems
Ya sunori Kirihara
Senior Vice President, Officer in
charge of Corporate Human
Resources
Nicole Seligman
Group Deputy General Counsel
58
Page 61

Consolidated Financial Information
Operating and Financial Review and Prospects . . . . . . . . . . . . . . . . . . . . . . . . . . 60
Five-Year Summary of Selected Financial Data . . . . . . . . . . . . . . . . . . . . . . . . . . . 89
Quarterly Financial and Stock Information. . . . . . . . . . . . . . . . . . . . . . . . . . . . . . 91
Segment Information . . . . . . . . . . . . . . . . . . . . . . . . . . . . . . . . . . . . . . . . . . . . . 92
Consolidated Balance Sheets . . . . . . . . . . . . . . . . . . . . . . . . . . . . . . . . . . . . . . . 96
Consolidated Statements of Income . . . . . . . . . . . . . . . . . . . . . . . . . . . . . . . . . . 98
Consolidated Statements of Cash Flows . . . . . . . . . . . . . . . . . . . . . . . . . . . . . . . 100
Consolidated Statements of Changes in Stockholders’ Equity . . . . . . . . . . . . . . . 102
The Notes to Consolidated Financial Statements and Report of Independent Accountants are in
the Consolidated Financial Information CD-ROM.
59
Page 62

Operating and Financial Review and Prospects
Sony Corporation and Consolidated Subsidiaries
OPERATING RESULTS
Operating Results for the Fiscal Year Ended
March 31, 2004 compared with the Fiscal Year
Ended March 31, 2003
OVERVIEW
Although the global economy showed some
signs of growth in the fiscal year ended March
31, 2004, the political situation, especially in
Iraq, and concern about potential terrorist
attacks led to a continued sense of uncertainty
regarding the economy. In Japan, although the
stock market showed signs of recovery, questions remained about the sustainability of
economic growth and the strength of the
recovery in consumer spending.
Despite these market conditions and the
impact of the translation of financial results into
yen, in accordance with Generally Accepted
Accounting Principles in the U.S. (“U.S. GAAP”),
the currency in which Sony’s financial statements are prepared, Sony’s sales and operating
revenue (“sales”) for the fiscal year ended
March 31, 2004 increased 0.3 percent compared with the previous fiscal year. Sales to
outside customers in the Electronics segment
increased, and revenue in the Financial Services
segment increased due to improvements in
valuation gains and losses at Sony Life Insurance
Co., Ltd. (“Sony Life”), despite a decrease in
sales in the Game, Pictures and Music segments.
Operating income decreased 46.7 percent
compared with the previous fiscal year. This
decrease was mainly due to the increase in restructuring charges in the Electronics segment,
the decrease in sales and increase in research
and development costs in the Game segment,
and the absence of profits contributed by the
breakaway performance of Spider-Man in the
previous fiscal year in the Pictures segment.
Partially offsetting the decrease in operating
income were the improvements in valuation
gains and losses from investments in the
general account at Sony Life in the Financial
Services segment, and the benefits of restructuring, a decrease in restructuring charges and
a reduction in advertising and promotion expenses in the Music segment.
On a local currency basis (regarding refer-
ences to results of operations expressed on a
local currency basis, refer to “Foreign Exchange
Fluctuations and Risk Hedging” below), Sony’s
sales for the fiscal year ended March 31, 2004
increased approximately 3 percent, and operating income decreased approximately 47
percent compared with the previous fiscal year.
RESTRUCTURING
For more detailed information about restructuring, please refer to Note 17 of Notes to the
Consolidated Financial Statements. In addition,
refer to “Trend Information” below for more
information on planned restructuring efforts.
In the fiscal year ended March 31, 2004,
Sony recorded restructuring charges of 168.1
billion yen, an increase from the 106.3 billion
yen recorded in the previous fiscal year. The
primary restructuring activities were in the
Electronics, Music and Pictures segments.
Of the total 168.1 billion yen, Sony recorded 133.4 billion yen in personnel related
costs. This expense was incurred because
9,000 people, mainly in Japan, the U.S. and
Western Europe, left the company primarily
through early retirement programs. Of the
9,000 people, 5,000 were people who left the
company in Japan.
ELECTRONICS
Restructuring charges in the Electronics segment for the fiscal year ended March 31, 2004
were 143.3 billion yen, compared to 72.5 billion
yen in the previous fiscal year, and exceeded
the 135.0 billion yen total estimated at the
beginning of the fiscal year.
In the year ended March 31, 2004, Sony
made a decision to shut down certain TV
display CRT manufacturing operations in
Japan to rationalize production facilities and
downsize its business, due to a contraction in
the market and a shift in demand from CRT
televisions to plasma and liquid crystal display
(“LCD”) panel televisions. Restructuring
charges associated with the shut down totaled
8.5 billion yen, and consisted of 3.1 billion yen
in personnel related costs and 5.3 billion yen in
non-cash equipment impairment, disposal and
other costs. Of the 8.5 billion yen in restructuring charges, 0.2 billion yen was recorded in
cost of sales; 3.1 billion yen was included in
selling, general and administrative expense,
and 5.2 billion yen was included in loss on
sale, disposal or impairment of assets, net.
In addition to the above restructuring
effort, during the year ended March 31,
2004, the Electronics segment accelerated
the implementation of headcount reduction
through early retirement programs resulting
in personnel related costs of 114.0 billion yen,
an increase of 96.4 billion yen compared to
the previous year. Of the 9,000 people who
left the company on a consolidated basis, the
majority came from the Electronics segment.
Headcount of relatively high-paid white collar
employees in Japan, the U.S. and Western
Europe was reduced through early retirement
programs while headcount increased at
manufacturing facilities in East Asia, particularly
in China.
MUSIC
Due to the continued contraction of the worldwide music market due to slow worldwide
economic growth, the saturation of the CD
market, the effects of piracy and other illegal
duplication, parallel imports, pricing pressures
and the diversification of customer preferences,
Sony has been actively repositioning the Music
segment for the future by looking to create a
more effective and profitable business model.
As a result, the Music segment has undergone
60
Page 63

a worldwide restructuring program since the
year ended March 31, 2001 to reduce staffing
and other costs through the consolidation and
rationalization of facilities worldwide.
During the year ended March 31, 2004,
Sony broadened the scope of its worldwide
restructuring of the Music segment, which
resulted in restructuring charges totaling 10.7
billion yen, compared to 22.4 billion yen in the
fiscal year ended March 31, 2003. Restructuring
activities included the shutdown of a CD
manufacturing facility in the U.S. as well as the
restructuring of the music label operations and
further rationalization of overhead functions
through staff reductions. The restructuring
charges consisted of personnel related costs of
5.1 billion yen, lease abandonment costs of
1.3 billion yen and other related costs of 4.2
billion yen including non-cash asset impairments and disposals. Most of these charges
were recorded in selling, general and administrative expense. Employees were eliminated
across various employee levels, business functions, operating units, and geographic regions
during this phase of the worldwide restructuring program.
PICTURES
Restructuring charges in the Pictures segment
for the fiscal year ended March 31, 2004 were
4.6 billion yen, compared to 0.5 billion yen in
the previous fiscal year. A variety of initiatives
were undertaken in the segment in an effort
to reduce fixed costs including the reduction of
staffing levels and the disposal of certain longlived assets. Restructuring charges consisted of
1.0 billion yen of personnel related costs, 1.7
billion yen of non-cash asset impairment and
disposal costs and 1.9 billion yen of other
restructuring costs. Among these charges, 1.5
billion yen was recorded in cost of sales, 1.3
billion yen was recorded in selling, general and
administrative expenses, and 1.7 billion yen
was recorded in loss on sale, disposal or
impairment of assets, net.
The table below summarizes major restructuring activities for which charges of over 5 billion
yen were recorded during the fiscal year ended March 31, 2004.
Segment
Electronics
Music
Nature of Restructuring
Reduction of TV display CRT
production capacity in Japan
Early retirement program
Closure of CD
manufacturing facility in
U.S., restructuring of the
music label operations, and
rationalization of overhead
functions
Costs incurred in the
fiscal year ended
March 31, 2004
8.5 billion yen
114.0 billion yen
10.7 billion yen
Additional Information
Remaining liability balance of 2.2 billion yen at March 31, 2004
will be paid or settled in the fiscal year ending March 31, 2005.
Remaining liability balance of 18.3 billion yen at March 31,
2004 will be paid in the fiscal year ending March 31, 2005.
Most of the remaining liability balance of 6.2 billion yen at
March 31, 2004 will be paid or settled during the fiscal year
ending March 31, 2005.
OPERATING PERFORMANCE
(Yen in billions)
Year ended March 31
2003 2004 change
Percent
Sales and operating revenue . . . . . . . . . . . . . . . . . . . . . . . . . . . 7,473.6 7,496.4 +0.3%
Operating income . . . . . . . . . . . . . . . . . . . . . . . . . . . . . . . . . . 185.4 98.9 –46.7
Income before income taxes . . . . . . . . . . . . . . . . . . . . . . . . . . . 247.6 144.1 –41.8
Net income . . . . . . . . . . . . . . . . . . . . . . . . . . . . . . . . . . . . . . . 115.5 88.5 –23.4
SALES
Sales for the fiscal year ended March 31, 2004
increased by 22.8 billion yen, or 0.3 percent,
to 7,496.4 billion yen compared with the previous fiscal year. A further breakdown of sales
figures is presented under “Operating Perfor-
mance by Business Segment” below.
(“Sales” in this analysis of the ratio of selling,
general and administrative expenses to sales
refers only to the “net sales” and “other operating revenue” portions of consolidated sales
and operating revenue, and excludes Financial
Service revenue. This is because Financial
Service expenses are recorded separately from
cost of sales and selling, general and adminis-
Sales and operating revenue and operating income
(Billion ¥) (Billion ¥)
8,0008,000
8,0008,0008,000
6,000
6,000
4,000
4,000
2,000
2,000
0
0
1.8%
02 03 04
Sales and operating revenue (left)
Operating income (right)
Operating margin
*Year ended March 31
2.5%
1.3%
1,200
1,200
1,000
1,000
800
800
600
600
400
400
200
200
0
0
trative expenses. Furthermore, in the analysis
of cost of sales, including research and development costs, to sales, only “net sales” are
used. This is because cost of sales is an expense associated only with net sales. All the
ratios below that pertain to business segments
are calculated with intersegment transactions
included.)
COST OF SALES AND SELLING, GENERAL
AND ADMINISTRATIVE EXPENSES
Cost of sales for the fiscal year ended March
31, 2004 increased by 78.8 billion yen, or 1.6
percent, to 5,058.2 billion yen compared with
the previous fiscal year, and increased from
72.0 percent to 73.5 percent as a percentage
of sales. Year on year, the cost of sales ratio was
unchanged at 78.8 percent in the Electronics
segment and almost unchanged from 70.2
percent to 70.1 percent in the Game segment.
61
Page 64

The cost of sales ratio decreased from 61.5
percent to 60.7 percent in the Music segment.
However, the cost of sales ratio increased from
58.2 percent to 60.0 percent in the Pictures
segment.
In the Electronics segment, the benefit of
restructuring undertaken in previous years was
offset primarily by an increase in research and
development costs during the fiscal year. In
the Game segment, the effect of increased
PlayStation 2 software sales was offset by increased research and development costs. The
cost of sales ratio in the Music segment decreased due to the benefits from restructuring
activities implemented over the past several
fiscal years. However, the cost of sales ratio in
the Pictures segment increased due to the absence of the higher margins generated by revenues from Spider-Man in the prior fiscal year.
Personnel related costs included in cost of
sales increased only 1.7 billion yen compared
with the previous fiscal year.
Research and development costs (included
in cost of sales) for the fiscal year ended March
31, 2004 increased by 71.4 billion yen, or 16.1
percent, to 514.5 billion yen compared with
the previous fiscal year, primarily due to increases
in the Electronics and Game segments. The ratio
of research and development costs to sales increased from 6.4 percent to 7.5 percent.
Research and development expenses and as a
percentage of sales
(Billion ¥) (%)
600
500
400
300
200
100
0
Percentage of sales
*Year ended March 31
* Excluding the Financial Services segment
6.1%
02 03 04
Research and development expenses
6.4%
7.5%
10
8
6
4
2
0
Selling, general and administrative expenses
for the fiscal year ended March 31, 2004 increased by 15.9 billion yen, or 0.9 percent, to
1,798.2 billion yen compared with the previous
fiscal year. The ratio of selling, general and
administrative expenses to sales increased from
25.6 percent in the previous fiscal year to 25.9
percent. Year on year, the ratio of selling,
general and administrative expenses to sales
increased from 20.3 percent to 21.8 percent in
the Electronics segment, from 18.0 percent to
21.1 percent in the Game segment, and from
34.4 percent to 35.0 percent in the Pictures
segment, while it decreased from 39.8 percent
to 35.0 percent in the Music segment.
Of the selling, general and administrative
expenses, personnel related costs in selling,
general and administrative expenses increased
by 89.7 billion yen compared with the previous
fiscal year mainly due to an increase in severance related expenses in the Electronics segment
resulting from the implementation of restructuring
initiatives. However, the increase in selling,
general and administrative expenses was partially offset by a decrease in royalty expenses,
which decreased by 20.5 billion yen compared
with the previous fiscal year due to the reversal, in the fiscal year ended March 31, 2004, of
royalty expense reserves provided for in the
previous fiscal year in the Electronics segment.
Loss on sale, disposal or impairment of
assets, net decreased 4.4 billion yen, or 11.1
percent, compared with the previous fiscal
year, to 35.5 billion yen. Losses were recorded
on the sale, disposal and impairment of CRT
production equipment in the Electronics segment, on the impairment of goodwill that resulted from the making of a manufacturing
subsidiary into a wholly owned subsidiary in
the Electronics segment, and on the commencement of reorganization proceedings
under the Corporate Reorganization Law of
Japan by Crosswave Communications Inc.
(“Crosswave”), which leased fixed assets from
a business in the Financial Services segment.
On the other hand, a one time gain was recorded in the Other segment due to the sale of
rights to a portion of the Sony Card portfolio.
Cost of sales and selling, general and administrative
expenses (SGA) as percentages of sales
(%) (%)
75
74.2
74
73
72
71
70
23.9
02 03 04
Cost of sales/sales (left)
SGA/sales (right)
*Year ended March 31
* Excluding the Financial Services segment
25.6
72.0
25.9
73.5
27
26
25
24
23
22
OPERATING INCOME
Operating income for the fiscal year ended
March 31, 2004 decreased by 86.5 billion yen,
or 46.7 percent, to 98.9 billion yen compared
with the previous fiscal year. Operating income
margin decreased from 2.5 percent to 1.3
percent. The Electronics segment recorded an
operating loss mainly due to an increase in
restructuring charges. On the other hand, the
business segments that contributed the most
to operating income, in descending order by
amount of financial impact, were the Game
and Financial Services segments.
OTHER INCOME AND EXPENSES
In the consolidated results for the fiscal year
ended March 31, 2004, other income decreased by 35.2 billion yen, or 22.4 percent, to
122.3 billion yen, while other expenses decreased by 18.2 billion yen, or 19.1 percent, to
77.1 billion yen, compared with the previous
fiscal year. The net amount of other income
and other expenses was net other income of
45.2 billion yen, a decrease of 17.0 billion yen,
or 27.4 percent, compared with the previous
fiscal year.
The decrease in other income was primarily
due to the recording, in the fiscal year ended
March 31, 2003, of a 66.5 billion yen gain on
the sale of Sony’s equity interest in Telemundo
Communications Group, Inc. and its subsidiaries
(“Telemundo”), a U.S. based Spanish language
television network and station group that was
accounted for under the equity method.
Partially offsetting the decrease in other
62
Page 65

income was a 16.1 billion yen increase in net
foreign exchange gain, from 1.9 billion yen in
the previous fiscal year to 18.1 billion yen. The
net foreign exchange gain was recorded
because the value of the yen, especially during
the second half of the fiscal year ended March
31, 2004, was higher than the value of the yen
at the time that Sony entered into foreign exchange forward contracts and foreign currency
option contracts. These contracts are entered
into by Sony to mitigate the foreign exchange
rate risk to cash flows that arises from settlements of foreign currency denominated
accounts receivable and accounts payable, as
well as foreign currency denominated transactions between consolidated subsidiaries.
Compared to the previous fiscal year, royalty
income increased 1.9 billion yen, or 5.8
percent, from 32.4 billion yen to 34.2 billion
yen. Interest and dividends received increased
by 4.3 billion yen, or 29.9 percent, to 18.8
billion yen.
The decrease in other expenses was primarily
due to a 6.7 billion yen, or 29.0 percent, decrease
to 16.5 billion yen in loss on devaluation of
securities investments compared with the previous year. During the fiscal year ended March
31, 2004, the valuation losses Sony recorded
included 10.3 billion yen recorded in regards
to securities issued by a privately held Japanese
company engaged in cable broadcasting and
other businesses which Sony accounted for
under the cost method. Compared to the
previous fiscal year, interest paid increased 0.5
billion yen, or 2.0 percent, to 27.8 billion yen.
In January 2004, FeliCa Networks Inc.
(“FeliCa Networks”) issued 11.5 billion yen in
shares (115,000 shares at 100,000 yen per
share) in a private offering. FeliCa Networks
engages in the development and licensing of
an Integrated Circuit (“IC”) chip for cellular
phones based on the contactless IC card technology “FeliCa”, which was developed by
Sony. It also operates a platform, based on
FeliCa-ready cellular phones, for use by service
providers. Sony recorded a gain of 3.4 billion
yen and also recorded deferred taxes on this
gain. This issuance reduced Sony’s ownership
interest from 100 percent to 60 percent. In
June 2004, FeliCa Networks allocated new
shares to a third party; Sony’s ownership
interest is now approximately 57 percent.
In addition to the above transaction, for the
year ended March 31, 2004, Sony recognized
1.5 billion yen of other gains on issuances of
stock by subsidiaries and equity investees
resulting in total gains of 4.9 billion yen.
These transactions were not part of a broader
corporate reorganization and the reacquisition
of such shares was not contemplated at the
time of issuance.
INCOME BEFORE INCOME TAXES
Income before income taxes for the fiscal year
ended March 31, 2004 decreased 103.6 billion
yen, or 41.8 percent, to 144.1 billion yen compared with the previous fiscal year. As mentioned above, operating income and the net
amount of other income and other expenses
decreased compared with the previous year.
INCOME TAXES
Income taxes for the fiscal year ended March
31, 2004 decreased by 28.1 billion yen, or
34.7 percent, to 52.8 billion yen, as a result of
the decrease in income before income taxes.
Income taxes decreased 91.6 billion yen, or
51.2 percent, to 87.2 billion yen, while deferred
income tax expense decreased by 63.6 billion
yen, or 64.9 percent, to 34.4 billion yen. The
effective tax rate for the fiscal year was 36.6
percent, lower than the statutory rate in Japan
due to a decrease in deferred tax liabilities on
undistributed earnings of foreign subsidiaries
and because U.S. income was taxed at a lower
rate due to utilization of tax loss and foreign
tax credit carryforwards. However, this rate
was higher than the effective tax rate of 32.6
percent in the prior fiscal year, which benefited
from a reversal in valuation allowances on
deferred tax assets by Aiwa Co., Ltd. and its
subsidiaries (“Aiwa”).
RESULTS OF AFFILIATED COMPANIES
ACCOUNTED FOR UNDER THE EQUITY
METHOD
Equity in net income of affiliated companies
during the fiscal year ended March 31, 2004 was
1.7 billion yen, an improvement over the 44.7
billion yen in losses recorded in the previous
fiscal year. Equity in net income of Sony Ericsson
Mobile Communications AB (“Sony Ericsson”),
a joint venture focused on mobile phone handsets, was 6.4 billion yen, an improvement from
the 20.8 billion yen in losses recorded in the
previous fiscal year. This improvement was due
to strong demand for Sony Ericsson’s products,
particularly in the Global System for Mobile
Communications (“GSM”) and Japanese
markets, and due to improvements in operating efficiencies at the company. Moreover, ST
Liquid Crystal Display Corporation (“ST-LCD”),
an LCD joint venture in Japan, recorded a
profit compared with a loss in the previous fiscal
year. Partially offsetting these improvements
were equity in net losses of some other affiliated companies such as Crosswave, which
commenced reorganization proceedings under
the Corporate Reorganization Law of Japan.
The equity in net loss related to Crosswave for
the fiscal year ended March 31, 2004 was 1.4
billion yen.
MINORITY INTEREST IN INCOME (LOSS)
OF CONSOLIDATED SUBSIDIARIES
In the fiscal year ended March 31, 2004,
minority interest in income of consolidated
subsidiaries decreased 4.2 billion yen, or 63.9
percent, to 2.4 billion yen. This decrease is due
to the absence of the previous year’s increase
which resulted from the reversal, in that year,
of valuation allowances on deferred tax assets
held by Aiwa, as described above, and the fact
that Sony ceased to record a minority interest
in the losses of Aiwa in that year, as a result of
taking Aiwa private. For the fiscal year ended
March 31, 2004, minority interest in income
was recorded mainly at certain television and
home entertainment subsidiaries in the
Pictures segment.
NET INCOME
Net income for the fiscal year ended March
31, 2004 decreased by 27.0 billion yen, or
23.4 percent, to 88.5 billion yen compared
with the previous fiscal year. As a percentage
of sales, net income decreased 0.3 percentage points from 1.5 percent to 1.2 percent.
Although income before income taxes decreased as described above, the year on year
change from loss to income in equity in net
income (loss) of affiliated companies partially
offset the decline in net income. Return on
stockholders’ equity decreased 1.2 percentage points from 5.0 percent to 3.8 percent.
(This ratio is calculated by dividing net income
63
Page 66

by the simple average of stockholders’ equity
at the end of the previous fiscal year and at
the end of the fiscal year ended March 31,
2004.)
Basic net income per share was 95.97 yen
compared with 125.74 yen in the previous fiscal
year, and diluted net income per share was
90.88 yen compared with 118.21 yen in the
previous fiscal year. Refer to Notes 2 and 21 of
Notes to Consolidated Financial Statements.
Net income and ROE
(Billion ¥) (%)
150
15
OPERATING PERFORMANCE BY BUSINESS SEGMENT
The following discussion is based on segment information. Sales and operating revenue in each
business segment include intersegment transactions. Refer to Note 24 of Notes to Consolidated
Financial Statements.
Business Segment Information
(Yen in billions)
Year ended March 31
Percent
Sales and operating revenue 2003 2004 change
Electronics . . . . . . . . . . . . . . . . . . . . . . . . . . . . . . . . . . . . . . . . . 4,940.5 4,897.4 – 0.9%
Game . . . . . . . . . . . . . . . . . . . . . . . . . . . . . . . . . . . . . . . . . . . . . 955.0 780.2 –18.3
Music . . . . . . . . . . . . . . . . . . . . . . . . . . . . . . . . . . . . . . . . . . . . . 597.5 559.9 –6.3
Pictures . . . . . . . . . . . . . . . . . . . . . . . . . . . . . . . . . . . . . . . . . . . 802.8 756.4 –5.8
Financial Services . . . . . . . . . . . . . . . . . . . . . . . . . . . . . . . . . . . . 537.3 593.5 +10.5
Other . . . . . . . . . . . . . . . . . . . . . . . . . . . . . . . . . . . . . . . . . . . . . 306.3 330.4 +7.9
Elimination . . . . . . . . . . . . . . . . . . . . . . . . . . . . . . . . . . . . . . . . . (665.7) (421.4) –
Consolidated . . . . . . . . . . . . . . . . . . . . . . . . . . . . . . . . . . . . . . . 7,473.6 7,496.4 +0.3
100
50
0
02 03 04
Net income
ROE
*Year ended March 31
0.7%
5.0%
Net income per share of common stock
(¥)
150
100
50
0
02 03 04
Basic
Diluted
*Year ended March 31
3.8%
10
5
Operating income (loss) 2003 2004 change
Electronics . . . . . . . . . . . . . . . . . . . . . . . . . . . . . . . . . . . . . . . . . 41.4 (35.3) –
(Yen in billions)
Year ended March 31
Percent
Game . . . . . . . . . . . . . . . . . . . . . . . . . . . . . . . . . . . . . . . . . . . . . 112.7 67.6 –40.0%
0
Music . . . . . . . . . . . . . . . . . . . . . . . . . . . . . . . . . . . . . . . . . . . . . (7.9) 19.0 –
Pictures . . . . . . . . . . . . . . . . . . . . . . . . . . . . . . . . . . . . . . . . . . . 59.0 35.2 –40.3
Financial Services . . . . . . . . . . . . . . . . . . . . . . . . . . . . . . . . . . . . 22.8 55.2 +142.4
Other . . . . . . . . . . . . . . . . . . . . . . . . . . . . . . . . . . . . . . . . . . . . . (25.0) (10.0) –
Elimination and unallocated corporate expenses . . . . . . . . . . . . . (17.5) (32.7) –
Consolidated . . . . . . . . . . . . . . . . . . . . . . . . . . . . . . . . . . . . . . . 185.4 98.9 –46.7
At the beginning of the fiscal year ended
March 31, 2004, Sony partly realigned its busi-
Share of sales and operating revenue by
business segment
(%)
ness segment configuration. Expenses incurred
4
in connection with the creation of a network
platform business have been transferred out of
the Other segment and reclassified as unallocated corporate expenses, because the expected future benefits of this business will be
spread across the Sony Group. In the Music
7
10
7
10
62
Electronics
Game
Music
Pictures
Financial Services
Other
segment, certain non-core businesses of Sony
Music Entertainment (Japan) Inc., such as
media, animation, character and cosmetics,
*Year ended March 31, 2004
* Including intersegment transactions
were transferred to the newly-established Sony
Culture Entertainment, Inc. (“SCU”) and SCU
was classified in the Other segment. In accordance with this realignment, results of the
previous fiscal year have been reclassified to
conform to the presentation for the fiscal year
ended March 31, 2004.
ELECTRONICS
Sales for the fiscal year ended March 31, 2004
decreased by 43.1 billion yen, or 0.9 percent,
to 4,897.4 billion yen compared with the
previous fiscal year. An operating loss of 35.3
billion yen was recorded compared to operating income of 41.4 billion yen in the previous
fiscal year.
64
Page 67

The year on year decrease in sales was due
to a significant decrease in intersegment sales
to the Game segment as a result of the outsourcing of PlayStation 2 game console production to third parties in China. Sales to outside
customers on a yen basis increased 4.7 percent
compared with the previous fiscal year.
Regarding sales to outside customers by
geographic area, sales on a yen basis increased
in Japan by 11 percent, in Europe by 10 percent,
and in non-Japan Asia and other geographic
areas (“Other Areas”) by 8 percent. Sales on a
yen basis in the U.S. decreased 7 percent.
In Japan, mainly due to the strong sales of
Sony Ericsson, sales of cellular phones, primarily to Sony Ericsson, increased significantly. In
addition, sales of charge coupled devices
(“CCDs”), which benefited from an expansion
in demand mainly from digital still cameras,
DVD recorders (including PSX), plasma and
LCD flat panel televisions, and broadcast- and
professional-use equipment increased. On the
other hand, sales of PCs and CRT televisions
decreased. In Europe, sales of digital still
cameras, flat panel televisions, cellular phones,
and PCs increased significantly. Sales of CRT
televisions, portable audio, Aiwa products, and
home audio, however, decreased. In Other
Areas, sales of CD-R/RW and DVD+/-R/RW
drives, digital still cameras, PCs, and video
cameras increased while sales of CRT televisions
decreased. In the U.S., a significant decrease in
the sales of CRT televisions combined with decreased sales of Aiwa products, computer displays, set-top boxes, and personal digital
assistants to cause a decline in sales, but sales
of flat panel televisions, projection televisions,
digital still cameras and PCs increased.
Sales and operating income (loss) in the
Electronics segment
(Billion ¥) (Billion ¥)
6,000
5,000
4,000
3,000
2,000
1,000
0
Sales (left)
Operating income (loss) (right)
Operating margin
* Year ended March 31
-0.0%
02 03 04
0.8%
-0.7%
1,500
1,000
500
0
-250
Performance by Product Category
Sales and operating revenue by product category discussed below represent sales to customers, which do not include intersegment
transactions. Refer to Note 24 of Notes to
Consolidated Financial Statements.
“Audio” sales decreased by 58.9 billion
yen, or 8.6 percent, to 623.6 billion yen. Sales
of home audio declined due to a contraction
of the market and increased price competition.
Regarding headphone stereos, sales declined
primarily due to falling prices, but the unit
shipments of both MD format and CD format
devices slightly exceeded their levels in the
previous year. Worldwide shipments of MD
format devices increased by approximately
40,000 units to approximately 3.36 million
units and worldwide shipments of CD format
devices increased by approximately 240,000
units to approximately 10.96 million units. On
the other hand, sales of car audio increased
due to strong sales in the European market.
“Video” sales increased by 97.0 billion yen,
or 11.4 percent, to 948.1 billion yen. In addition
to a significant increase in the sales of digital
still cameras outside of Japan, sales of DVD
recorders (including PSX) increased significantly
primarily in Japan. Worldwide shipments of
digital still cameras increased by approximately
4.4 million units to approximately 10 million
units. Worldwide shipments of DVD recorders
were approximately 20,000 units in the previous fiscal year but increased to approximately
650,000 units in the fiscal year ended March
31, 2004. Regarding home-use video cameras,
worldwide shipments of combined analog and
digital devices increased by approximately
850,000 units to approximately 6.6 million
units, but overall sales increased only slightly,
as sales in Japan and the U.S. decreased due to
increased price competition. DVD-video player
sales decreased due to pricing pressure,
although unit shipments increased.
“Televisions” sales decreased by 33.0 billion
yen, or 3.5 percent, to 917.2 billion yen. Sales
of CRT televisions decreased significantly due
to a contraction of the market and declining
prices, resulting primarily from a shift in
demand to flat panel televisions. Worldwide
shipments of CRT televisions decreased
approximately 600,000 units to approximately
9.4 million units compared with the previous
fiscal year. Sales of computer displays also decreased worldwide. On the other hand, sales
of plasma and LCD flat panel televisions increased significantly worldwide and sales of
projection televisions in the U.S. increased.
Worldwide shipments of flat panel televisions
increased approximately 480,000 units to
approximately 640,000 units.
“Information and Communications” sales
decreased by 2.0 billion yen, or 0.2 percent, to
834.8 billion yen. Despite a decrease in sales in
Japan, due to price declines in the notebook
PC market, overall sales of PCs increased as
sales in all regions outside of Japan increased.
Worldwide unit shipments of PCs increased
approximately 100,000 units to approximately
3.2 million units. Sales of personal digital assistants decreased due to a contraction of the
market and the effects of price declines. Sales
of broadcast- and professional-use products
were almost unchanged year on year as sales
in Japan increased due to the sale of equipment
installed in two new broadcasting stations,
while many broadcasters in the U.S. and other
countries outside of Japan reduced their capital
expenditures.
“Semiconductors” sales increased by 48.5
billion yen, or 23.7 percent, to 253.2 billion
yen. The increase was due to a significant increase in sales of CCDs, mainly reflecting the
expansion of the market for digital still cameras.
Regarding LCDs, sales of low temperature polisilicon LCDs for digital still cameras and cellular
phones increased significantly.
“Components” sales increased by 96.0
billion yen, or 18.2 percent, to 623.8 billion
yen. The increase was primarily due to significant
increases in sales of CD-R/RW and DVD+/-R/RW
drives, and Memory Sticks. Moreover, sales of
lithium-ion batteries increased. Sales of CD-R/
RW drives increased due to a production and
sales alliance with a third party, and sales of
DVD+/-R/RW drives increased as a result of the
expansion of the market for those devices.
Worldwide shipments of Memory Stick increased
approximately 12 million units to approximately
31 million units due to the continued, strong
demand for digital still cameras. On March 31,
2004, Sony’s cumulative shipments of Memory
Stick had reached approximately 66 million
units. Regarding lithium-ion batteries, sales for
use in digital still cameras and PCs increased.
65
Page 68

“Other” sales increased by 67.4 billion yen,
or 13.7 percent, to 557.7 billion yen. The increase resulted from a significant increase in
sales to Sony Ericsson of mobile phone handsets, reflecting an increase in the sales of Sony
Ericsson’s handsets. On the other hand, sales
of Aiwa products decreased in all regions.
In the Electronics segment, cost of sales for
the fiscal year ended March 31, 2004 decreased by 34.6 billion yen, or 0.9 percent to
3,834.6 billion yen compared with the previous
fiscal year. The cost of sales to sales ratio
remained unchanged year on year at 78.8
percent. Products that contributed to an improvement in the cost of sales to sales ratio
were PCs, which benefited from an emphasis
on profitability and an increase in the proportion of high value added models in the product
line-up, and low temperature polisilicon LCDs,
which benefited from a significant expansion
in sales. Offsetting this improvement, however,
was a significant increase in the sales of mobile
phone handsets, produced for Sony Ericsson,
which have a relatively high cost of sales to
sales ratio. Restructuring charges recorded in
cost of sales amounted to 10.1 billion yen
compared with 22.2 billion yen in the previous
year. Research and development costs increased 49.1 billion yen, or 12.9 percent, from
380.3 billion yen in the previous year to 429.4
billion yen.
Selling, general and administrative expenses
increased by 67.9 billion yen, or 6.8 percent to
1,068.7 billion yen compared with the previous
fiscal year. The primary reason for this increase
was an increase in restructuring charges. Of
the restructuring charges recorded in the
Electronics segment, the amount recorded in
selling, general and administrative expenses
increased by 86.2 billion yen from 36.4 billion
yen in the previous year to 122.6 billion yen.
Of the restructuring charges recorded in selling, general and administrative expenses, the
amount recorded for headcount reductions,
including reductions through the early retirement program, was 117.1 billion yen, an increase of 89.3 billion yen compared with the
previous fiscal year. In addition to these personnel related costs, restructuring charges were
recorded in relation to TV display CRT manufacturing facilities in Japan. In contrast to the
increase in restructuring charges, royalty ex-
penses decreased 20.4 billion yen and after
sales service expenses decreased 8.6 billion yen
compared with the previous fiscal year. The ratio of selling, general and administrative expenses to sales increased 1.5 percentage
points from 20.3 percent recorded in the previous fiscal year to 21.8 percent, due to the decrease in sales.
Loss on sale, disposal or impairment of
assets, net increased 0.3 billion yen to 29.4
billion yen compared with the previous fiscal
year. This amount includes 10.6 billion yen in
restructuring charges, which includes 5.2 billion
yen related to the TV display CRT manufacturing
facilities in Japan. The amount of restructuring
charges included in loss on sale, disposal or
impairment, net in the previous fiscal year was
13.9 billion yen.
Regarding profit performance of the segment, an operating loss was recorded for the
fiscal year due to a significant increase in restructuring charges, especially severance-related
expenses, as mentioned above. Regarding profit
performance by product, excluding restructuring
charges, compared with the previous fiscal year,
operating income was recorded in PCs compared with an operating loss in the previous
fiscal year, and a significant increase in operating income of CCDs was recorded. Losses from
Aiwa products decreased while the operating
income of CD-R/RW and DVD+/-R/RW drives,
as well as of video cameras, increased.
On the other hand, operating income of
CRT televisions decreased significantly while
operating income of optical pickups decreased
due to a sharp decline in prices. Furthermore,
personal digital assistants recorded an operating loss compared with operating income
recorded in the previous year.
Manufacturing by Geographic Area
Approximately 50 percent of the Electronics
segment’s total annual production took place
in Japan, including the production of digital
still cameras, video cameras, flat panel televisions, PCs, semiconductors and components
such as batteries and Memory Sticks. Approximately 60 percent of the annual production in
Japan was destined for other regions. China
accounted for approximately 10 percent of
total annual production, approximately 60
percent of which was destined for Japan, the
U.S. and Europe. Asia, excluding Japan and
China, accounted for approximately 15 percent
of total annual production, with approximately
60 percent destined for Japan, the U.S. and
Europe. The Americas and Europe together
accounted for the remaining approximately 25
percent of total annual production, most of
which was destined for local distribution and
sale. Until July 2003, total annual production
included the assembly of PlayStation 2 hardware for the Game segment; however, due to
the outsourcing of PlayStation 2 hardware
production to China-based third parties, this
assembly activity ceased in July 2003.
Comparison of Results on a Local Currency
Basis and Results on a Yen Basis
In the Electronics segment, the negative effect
of the appreciation of the yen against the U.S.
dollar slightly exceeded the positive effect of
the appreciation of the euro against the yen.
Sales for the fiscal year ended March 31, 2004
decreased, on a yen basis, by 0.9 percent, but
increased on a local currency basis by approximately 1 percent. In terms of operating performance on a local currency basis, an operating
loss was recorded compared to operating
profit in the previous year, but the amount of
that loss was less than on a yen basis.
Regarding sales to outside customers by
geographic area, sales on a yen basis increased
in Japan by 11 percent, in Europe by 10 percent, and in Other Areas by 8 percent. Sales on
a yen basis in the U.S decreased 7 percent.
Sales on a local currency basis increased in
every region, with sales in Japan increasing 11
percent, sales in Europe increasing 4 percent,
sales in Other Areas increasing 14 percent and
sales in the U.S. increasing 1 percent.
GAME
Sales for the fiscal year ended March 31, 2004
decreased by 174.8 billion yen, or 18.3 percent, to 780.2 billion yen compared with the
previous fiscal year. Operating income decreased by 45.1 billion yen, or 40.0 percent, to
67.6 billion yen compared with the previous
fiscal year, and the operating income margin
decreased from 11.8 percent to 8.7 percent.
Sales in the Game segment on a local currency basis decreased 18 percent, approximately
the same as on a yen basis. In regards to
66
Page 69

operating income, the positive impact of the
depreciation of the yen against the euro exceeded the negative impact of the appreciation
of the yen against the U.S. dollar, resulting in a
52 percent decrease in operating income on a
local currency basis.
By region, sales decreased in Japan, the
U.S. and Europe. In Japan, hardware sales
declined due to a strategic price reduction of
PlayStation 2 hardware, despite higher unit
sales of PlayStation 2 hardware. Software sales
in Japan also decreased due to lower unit
crease in unit sales of PlayStation 2 hardware,
a strategic price reduction of PlayStation 2
hardware and a decrease in software unit
sales. In Europe, although hardware unit sales
increased as the market penetration of
PlayStation 2 hardware continued to expand,
hardware sales declined due to a strategic
price reduction of PlayStation 2 hardware.
Software unit sales and software sales in
Europe both increased.
Total worldwide production shipments of
hardware and software were as follows:
sales. In the U.S., sales declined due to a de-
(Million units)
Year ended March 31
2003 2004 2004
Total Production Shipments of Hardware
PlayStation + PS one . . . . . . . . . . . . . . . . . . . . . . . . . . . . . . . . . . . 6.78 3.31 99.72
PlayStation 2 . . . . . . . . . . . . . . . . . . . . . . . . . . . . . . . . . . . . . . . . . 22.52 20.10 71.30
Total Production Shipments of Software*
PlayStation . . . . . . . . . . . . . . . . . . . . . . . . . . . . . . . . . . . . . . . . . . 61.00 32.00 949.00
PlayStation 2 . . . . . . . . . . . . . . . . . . . . . . . . . . . . . . . . . . . . . . . . . 189.90 222.00 572.00
* Including those both from Sony and third parties under Sony licenses.
In terms of profitability, operating income
decreased compared with the previous fiscal
year. This decrease was due to an increase in
research and development costs for future
businesses and a decrease in hardware sales.
Research and development costs increased by
21.9 billion yen to 83.4 billion yen compared
tion expenses, reflecting the decrease in hardware units sold. However, the ratio of selling,
general and administrative expenses to sales
rose compared to the previous fiscal year as
the ratio of personnel related costs and advertising and promotion expenses to sales rose
compared with the previous fiscal year.
Cumulative as
of March 31,
with the previous fiscal year. Although research and development costs for software
development increased only slightly, costs for
the development of semiconductors and
process technologies increased significantly.
Cost of sales in the Game segment decreased
due to the decrease in hardware unit sales and
reductions in the cost of producing hardware.
The cost of sales to sales ratio, however,
remained unchanged as the cost of producing
PlayStation 2 hardware decreased in line with
the decrease in hardware sales. Selling, general
and administrative expenses decreased as a
result of a decline in advertising and promo-
Sales and operating income in the Game segment
(Billion ¥) (Billion ¥)
1,200
1,000
800
600
400
200
0
Sales (left)
Operating income (right)
Operating margin
* Year ended March 31
8.3%
02 03 04
11.8%
8.7%
300
200
100
0
–100
MUSIC
Sales for the fiscal year ended March 31, 2004
decreased by 37.6 billion yen, or 6.3 percent,
to 559.9 billion yen compared with the previous fiscal year. Compared to an operating loss
of 7.9 billion yen in the previous fiscal year,
operating income of 19.0 billion yen was
recorded this year.
On a local currency basis, sales in the Music
segment were flat while the Music segment
recorded operating income as compared to an
operating loss in the previous fiscal year.
Sales at Sony Music Entertainment Inc.
(“SMEI”), a U.S. based subsidiary, were flat on
a U.S. dollar basis (refer to “Foreign Exchange
Fluctuations and Risk Hedging” below). In
terms of profitability, SMEI recorded operating
income in the fiscal year as compared to an
operating loss in the previous fiscal year. The
appreciation of European currencies against
the U.S. dollar contributed to higher sales outside of the U.S. which were offset by lower
sales in the U.S. On a worldwide basis, total
album sales at SMEI decreased due to the continued contraction of the global music industry
and the lack of hit releases. Although unit
sales in various markets such as the U.S. have
begun to reverse their downward trend, the
global music market has continued to experience an overall contraction primarily due to
piracy (i.e. unauthorized file sharing and CD
burning) and competition from other entertainment sectors.
The increase in profitability resulted in operating income at SMEI, compared to an operating loss recorded in the previous fiscal year.
The improvement in profitability primarily
resulted from the benefits realized from the
worldwide restructuring activities implemented
over the past two years to reduce costs in response to the downward trend of the market.
These activities included the rationalization of
manufacturing, distribution and support
functions including record label shared services
through elimination of redundancy. Operating
income also benefited from lower restructuring
charges as compared to the prior year. The
total cost of restructuring for the fiscal year
ended March 31, 2004 was 95 million U.S.
dollars or 10.7 billion yen, a decrease of 95
million U.S. dollars from the prior year (refer to
“Restructuring” above for details.) A third
67
Page 70

factor contributing to the improved operating
100
results were lower advertising and promotion
expenses. The above factors more than offset
the negative effect of lower worldwide album
sales. The savings realized from previously
implemented restructuring initiatives, lower
restructuring charges and the decrease in advertising and promotion expenses resulted in a
decrease in selling, general and administrative
expenses for the year and an improvement in
the ratio of selling, general and administrative
expenses to sales.
Regarding the results of Sony Music Entertainment (Japan) Inc. (“SMEJ”), sales were flat
compared with the previous year, despite the
continued contraction of the music industry.
Operating income increased 69 percent compared with the prior year due to a reduction in
selling, general and administrative expenses,
primarily advertising and promotion expenses,
and strong sales of Japanese artists’ recordings.
On a yen basis, 74 percent of the Music
segment’s sales were generated by SMEI while
26 percent were generated by SMEJ.
In December 2003, Sony and Bertelsmann
AG announced that they had signed a binding
agreement to combine their recorded music
businesses in a joint venture. The newly
formed company, which will be known as
Sony BMG, will be 50 percent owned by each
parent company. It will not include SMEI’s music publishing, physical distribution and disc
manufacturing business or SMEJ. The merger is
subject to regulatory approvals in the U.S. and
the European Union.
Sales and operating income (loss) in the Music segment
(Billion ¥) (Billion ¥)
1,200
1,000
800
600
400
200
0
Sales (left)
Operating income (loss) (right)
Operating margin
* Year ended March 31
3.7%
–1.3%
02 03 04
3.4%
300
200
100
0
–100
PICTURES
Sales for the fiscal year ended March 31, 2004
decreased by 46.4 billion yen, or 5.8 percent,
to 756.4 billion yen compared with the previous
fiscal year. Operating income decreased by
23.7 billion yen, or 40.3 percent, to 35.2 billion
yen and the operating income margin decreased from 7.3 percent to 4.7 percent. The
results in the Pictures segment consist of the
results of Sony Pictures Entertainment (“SPE”),
a U.S. based subsidiary.
On a U.S dollar basis, sales for the fiscal
year in the Pictures segment increased approximately 2 percent and operating income
decreased approximately 30 percent. The
increase in sales was primarily due to higher
television performance in the fiscal year.
Television revenues increased significantly due
to initial syndication sales of The King of
Queens and third cycle syndication sales of
Seinfeld, as well as the extension of a licensing
agreement for Wheel of Fortune. This increase
in sales was partially offset by lower theatrical
and home entertainment revenues from the
fiscal year release slate, which included such
notable titles as Bad Boys II, S.W.A.T., Anger
Management and Something’s Gotta Give,
when compared to the prior fiscal year release
slate, which included Spider-Man, the highest
grossing film in SPE’s history, Men in Black II,
xXx and Mr. Deeds. Sales for the fiscal year
release slate decreased 359 million U.S. dollars
as compared to the previous fiscal year.
Operating income for the segment decreased
significantly due to the absence of profits contributed by the record breaking performance
of Spider-Man in the previous fiscal year and,
to a lesser extent, the aggregate disappointing
performance of several films from the fiscal
year release slate including Gigli, Hollywood Ho-
micide, The Missing and Charlie’s Angels: Full
Throttle, resulting in a decrease in operating
income of 412 million U.S. dollars from the
prior fiscal year release slate. Additionally,
operating income was also negatively impacted
by a 38 million U.S. dollar increase in restructuring charges recorded in the fiscal year (refer
to “Restructuring” above for details). Partially
offsetting these decreases in operating income
was the contribution from the syndication
sales and extension of a licensing agreement
noted above, DVD sales of television library
product and an additional syndication sale of
Dawson’s Creek, resulting in a 201 million U.S.
dollar increase in operating income. Further
improving operating income was the absence
of the 66 million U.S. dollar provision recorded
in the prior year with respect to previously recorded revenue from KirchMedia, a licensee in
Germany of SPE’s feature film and television
product, and related adjustments to ultimate
film income.
As of March 31, 2004, unrecognized
license fee revenue at SPE was approximately
1.2 billion U.S. dollars. SPE expects to record
this amount in the future having entered into
contracts with television broadcasters to
provide those broadcasters with completed
motion picture and television product. The
license fee revenue will be recognized in the
year that the product is available for broadcast.
Sales and operating income in the Pictures segment
(Billion ¥) (Billion ¥)
1,2001,200
1,0001,000
800800
600600
400400
200200
00
Sales (left)
Operating income (right)
Operating margin
* Year ended March 31
4.9%
02 03 04
7.3%
4.7%
300
200
100
0
–100
FINANCIAL SERVICES
Financial Services revenue for the fiscal year
ended March 31, 2004 increased by 56.3
billion yen, or 10.5 percent, to 593.5 billion
yen compared with the previous fiscal year.
Operating income increased by 32.4 billion
yen, or 142.4 percent, to 55.2 billion yen and
the operating income margin increased to 9.3
percent compared with the 4.2 percent of the
previous fiscal year.
At Sony Life, revenue increased by 46.4
billion yen, or 9.9 percent, to 513.0 billion yen
and operating income increased by 33.6 billion
yen, or 113.3 percent, to 63.2 billion yen compared with the previous fiscal year. Revenue
increased due to improvements in valuation
gains and losses from investments in the sepa-
68
Page 71

Revenue and operating income in the Financial
Services segment
(Billion ¥) (Billion ¥)
1,200
1,000
800
600
400
200
0
Financial Services revenue (left)
Operating income (right)
Operating margin
* Year ended March 31
4.3%
02 03 04
4.2%
9.3%
300
200
100
0
–100
rate account and the general account, reflecting
strength in the equity markets. This increase occurred despite a 30.8 billion yen reduction in
revenue resulting from a change in the method
of recognizing insurance premiums received on
certain products from being recorded as revenues to being offset against the related provision for future insurance policy benefits since
the third quarter beginning October 1, 2003.
Insurance revenue decreased as a result of this
change in method of recording revenue but the
actual life insurance business remained strong
as new insurance sales increased compared
with the previous year, and the amount of
insurance-in-force at the end of the fiscal year
increased compared with the end of the previous year. Operating income at Sony Life in-
creased due to improvements in valuation gains
and losses from investments in the general account. The above mentioned change in revenue
recognition method did not have a material effect on operating income. Valuation gains and
losses from investments in the separate account
accrue directly to the account of policyholders
and, therefore, do not affect operating income.
At Sony Assurance Inc. (“Sony Assurance”),
revenue increased due to higher insurance
revenue brought about by an expansion in
automobile insurance-in-force. Operating
income was recorded during the fiscal year
compared to an operating loss in the previous
fiscal year due to the increase in insurance
revenue and an improvement in the expense
ratio (the ratio of operating expenses to
premiums) and the loss ratio (the ratio of
insurance payouts to premiums).
At Sony Finance International, Inc. (“Sony
Finance”), a leasing and credit financing
business subsidiary in Japan, revenue was
unchanged compared to the previous year as
credit financing revenue increased slightly
and leasing revenue and rent revenue decreased slightly. In terms of profitability, operating loss increased due to the recording of a
loss from the lease of certain fixed assets to
Crosswave Communications Inc., which
commenced reorganization proceedings under
the Corporate Reorganization Law of Japan,
and an increase in expenses associated with
the start, in earnest, of a credit card business.
Sony Bank Inc. (“Sony Bank”), which
started business in June 2001, recorded a loss,
as was also the case in the previous fiscal year,
but the amount of loss decreased.
* The revenue and operating income at Sony Life, Sony Assurance
and Sony Bank discussed here differ from the results that Sony
Life, Sony Assurance and Sony Bank disclose on a Japanese
statutory basis.
CONDENSED STATEMENTS OF INCOME
SEPARATING OUT THE FINANCIAL SERVICES
SEGMENT (UNAUDITED)
The following schedule shows unaudited
condensed statements of income for the
Financial Services segment and all other
segments excluding Financial Services as well
as condensed consolidated statements of
income. This presentation is not required
under U.S. GAAP, which is used in Sony’s
consolidated financial statements. However,
because the Financial Services segment is different in nature from Sony’s other segments,
Sony believes that a comparative presentation
may be useful in understanding and analyzing
Sony’s consolidated financial statements.
Transactions between the Financial Services
segment and all other segments excluding
Financial Services are eliminated in the consolidated figures shown below.
CONDENSED STATEMENTS OF INCOME SEPARATING OUT THE FINANCIAL SERVICES SEGMENT
Year ended March 31
Financial Services excluding Financial Services Consolidated
(Yen in millions) 2003 2004 2003 2004 2003 2004
All other segments
Financial Services revenue . . . . . . . . . . . . . . . . . . . . . . . . . . . . . 537,276 593,544 – – 509,398 565,752
Net sales and operating revenue . . . . . . . . . . . . . . . . . . . . . . . . – – 6,974,980 6,939,964 6,964,235 6,930,639
537,276 593,544 6,974,980 6,939,964 7,473,633 7,496,391
Costs and expenses . . . . . . . . . . . . . . . . . . . . . . . . . . . . . . . . . 514,518 538,383 6,811,292 6,896,377 7,288,193 7,397,489
Operating income . . . . . . . . . . . . . . . . . . . . . . . . . . . . . . . . . . 22,758 55,161 163,688 43,587 185,440 98,902
Other income (expenses), net . . . . . . . . . . . . . . . . . . . . . . . . . . (1,282) 1,958 67,846 52,746 62,181 45,165
Income before income taxes . . . . . . . . . . . . . . . . . . . . . . . . . . . 21,476 57,119 231,534 96,333 247,621 144,067
Income taxes and other . . . . . . . . . . . . . . . . . . . . . . . . . . . . . . 13,071 22,975 120,089 30,916 132,102 53,439
Cumulative effect of accounting changes . . . . . . . . . . . . . . . . . – – – (2,117) – (2,117)
Net income . . . . . . . . . . . . . . . . . . . . . . . . . . . . . . . . . . . . . . . 8,405 34,144 111,445 63,300 115,519 88,511
69
Page 72

OTHER
During the fiscal year, sales of the Other segment were comprised mainly of an in-house
oriented information system service business,
an advertising agency business in Japan and
Sony Communication Network Corporation
(“SCN”), an Internet-related service business
subsidiary operating mainly in Japan.
Sales for the fiscal year ended March 31,
2004 increased by 24.1 billion yen, or 7.9 percent, to 330.4 billion yen, compared with the
previous fiscal year. Of total segment sales, 53
percent were sales to outside customers. In
terms of profit performance, operating losses
for the segment decreased from 25.0 billion
yen to 10.0 billion yen.
During the fiscal year, sales increased
primarily due to an increase in sales at the
in-house oriented information system service
business, reflecting greater demand for its
services by other businesses within the Sony
Group. Regarding profit performance, the
segment recorded a loss primarily due to the
recording of expenses associated with the development of network and content technology
and services, intended to facilitate new businesses in the broadband age. Overall segment
losses decreased compared to the previous
fiscal year primarily because a U.S. subsidiary
recorded a one-time gain of 7.7 billion yen on
the sale of rights related to a portion of the
Sony Card portfolio and because software in a
discontinued professional-use video software
business had been written off in the previous
fiscal year. On the other hand, an operating
loss was recorded at SCN compared with operating income in the previous fiscal year, due to
increased expenses for subscriber acquisition.
Sales and operating loss in the Other segment
(Billion ¥) (Billion ¥)
1,200
1,000
800
600
400
200
0
Sales (left)
Operating loss (right)
Operating margin
* Year ended March 31
–7.0%
02 03 04
–8.2%
–3.0%
300
200
100
0
–100
FOREIGN EXCHANGE FLUCTUATIONS
AND RISK HEDGING
During the fiscal year ended March 31, 2004,
the average value of the yen was 112.1 yen
against the U.S. dollar, and 131.1 yen against
the euro, which was 7.3 percent higher
against the U.S. dollar and 9.7 percent lower
against the euro, respectively, compared with
the average of the previous fiscal year. Operating results on a local currency basis described
in “Overview” and “Operating Performance”
show results of sales and operating revenue
and operating income obtained by applying
the yen’s monthly average exchange rate in
the previous fiscal year to monthly local currency-denominated sales, cost of sales, and
selling, general and administrative expenses for
the fiscal year ended March 31, 2004, as if the
value of the yen had remained constant. In the
Music segment, Sony consolidates the yentranslated results of SMEI (a U.S. based
operation that aggregates the results of its
worldwide subsidiaries on a U.S. dollar basis)
and the results of SMEJ (a Japan based operation that aggregates the results of its operations in yen). In the Pictures segment, Sony
translates into yen the U.S. dollar consolidated
results of SPE (a U.S. based operation that has
worldwide subsidiaries). Therefore, analysis
and discussion of certain portions of the operating results of SMEI and SPE are specified as
being on “a U.S. dollar basis.” Results on a
local currency basis and results on a U.S. dollar
basis are not on the same basis as Sony’s
consolidated financial statements and do not
conform with U.S. GAAP. In addition, Sony
does not believe that these measures are a
substitute for U.S. GAAP measures. However,
Sony believes that local currency basis results
provide additional useful information to investors regarding operating performance.
Sony’s consolidated results are subject to
foreign currency fluctuations mainly derived
from the fact that the countries where manufacturing takes place may be different from
those where such products are sold. In order
to reduce the risk caused by such fluctuations,
Sony employs derivatives, including foreign exchange forward contracts and foreign currency
option contracts, in accordance with a consistent risk management strategy. Such derivatives are used primarily to mitigate the effect
of foreign currency exchange rate fluctuations
on cash flows generated by anticipated intercompany transactions and intercompany accounts receivable and payable denominated in
foreign currencies.
In 2001, Sony Global Treasury Services Plc
(“SGTS”) was established in London for the
purpose of providing integrated treasury services for Sony Corporation and its subsidiaries.
Sony’s policy is that Sony Corporation and all
subsidiaries with foreign exchange exposures
should enter into commitments with SGTS for
hedging their exposures. Sony Corporation
and most of its subsidiaries utilize SGTS for this
purpose. The concentration of foreign exchange exposures at SGTS means that, in effect, SGTS hedges the net foreign exchange
exposure of Sony Corporation and its subsidiaries. SGTS in turn enters into foreign exchange transactions with creditworthy
third-party financial institutions. Most of the
transactions are entered into against projected
exposures before the actual export and import
transactions take place. In particular SGTS
hedges the majority of the exposures on major
currency pairs such as U.S. dollar against Japanese yen, euro against Japanese yen and euro
against U.S. dollar, on average three months
before the actual transactions take place. In
the case of emerging market currencies, such
as Brazil, with high inflation and high interest
rates, the majority of the projected exposures
are hedged one month before the actual transactions take place due to cost effectiveness
considerations. Sony enters into foreign
70
Page 73

exchange transactions with financial institutions only for hedging purposes and does not
undertake speculative transactions.
To minimize the adverse effects of foreign
exchange fluctuations on its financial results,
particularly in the Electronics segment, Sony
seeks, when appropriate, to localize material
and parts procurement, design, and manufacturing operations in areas outside of Japan.
Changes in the fair value of derivatives designated as cash flow hedges, including foreign
exchange forward contracts and foreign currency option contracts, are initially recorded in
other comprehensive income and reclassified
into earnings when the hedged transaction
affects earnings. Foreign exchange forward
contracts, foreign currency option contracts
and other derivatives that do not qualify as
hedges are marked-to-market with changes in
value recognized in Other Income and Expenses.
The notional amounts of foreign exchange
forward contracts, currency option contracts
purchased and currency option contracts written as of March 31, 2004 were 1,348.2 billion
yen, 375.6 billion yen and 124.9 billion yen,
respectively.
ASSETS, LIABILITIES AND
STOCKHOLDERS’ EQUITY
(Regarding Assets and Liabilities refer also to “Increase in Assets and Liabilities as a Result of Consolidation of Variable Interest Entities” below.)
ASSETS
Total assets on March 31, 2004 increased by
720.1 billion yen, or 8.6 percent, to 9,090.7
billion yen, compared with the previous fiscal
year-end. Total assets on March 31, 2004 in all
segments excluding the Financial Services segment increased by 235.0 billion yen, or 4.0
percent, to 6,060.8 billion yen and total assets
on March 31, 2004 in the Financial Services
segment increased by 577.9 billion yen, or
19.9 percent, to 3,475.0 billion yen, compared
with the previous fiscal year-end. Total assets
on March 31, 2004 in all segments excluding
the Financial Services segment would have
increased by approximately 9 percent compared with the previous fiscal year-end if the
value of the yen had remained the same on
March 31, 2004 as it was on March 31, 2003.
CURRENT ASSETS
Current assets on March 31, 2004 increased
by 209.1 billion yen, or 6.6 percent, to 3,363.4
billion yen compared with the previous fiscal
year-end. Current assets on March 31, 2004 in
all segments excluding the Financial Services
segment increased by 188.5 billion yen, or 7.5
percent, to 2,692.4 billion yen.
Cash and cash equivalents in all segments
excluding Financial Services increased 154.4
billion yen, or 35.2 percent, to 592.9 billion yen
compared with the previous fiscal year. This
increase was primarily due to the issuance, in
December 2003, of 250 billion yen in euro yen
convertible bonds. The proceeds from this issuance will be applied towards investments in the
development of, and production equipment for,
key devices, such as the next generation broadband processor (for more information on cash
and cash equivalents, refer to “Liquidity Management and Commitment Lines” below).
Notes and accounts receivable, trade (net of
deductions for doubtful accounts and allowances for returns) increased 3.8 billion yen
compared with the previous fiscal year-end to
1,011.2 billion yen.
Inventories on March 31, 2004 increased by
40.8 billion yen, or 6.5 percent, to 666.5 billion
yen compared with the previous fiscal year-end.
The inventory to cost of sales turnover ratio
(based on the average of inventories at the end
of each fiscal year and previous fiscal year) decreased from 1.57 months at the end of the
previous fiscal year to 1.53 months. Sony considers this level of inventory to be appropriate in
the aggregate. During the fiscal year ended
March 31, 2004, Sony did not engage in the
kind of aggressive inventory reduction that it
engaged in during the fourth quarter of the fiscal year ended March 31, 2003.
Current assets on March 31, 2004 in the
Financial Services segment increased by 14.8
billion yen, or 2.2 percent, to 699.7 billion yen,
compared with the previous fiscal year-end.
The increase was primarily attributable to an
increase in marketable securities.
INVESTMENTS AND ADVANCES
(Also see “Investments” below.)
Investments and advances on March 31, 2004
increased by 518.8 billion yen, or 26.0 percent,
to 2,513.0 billion yen, compared with the
previous fiscal year-end.
Investments and advances on March 31,
2004 in all segments excluding the Financial
Services segment decreased by 24.4 billion
yen, or 6.4 percent, to 358.6 billion yen. This
decrease was mainly due to the recording of
an impairment loss on securities issued by a
privately held Japanese company, which Sony
accounted for under the cost method, that is
engaged in cable broadcasting and other businesses and a decrease in the amount recorded
in “investments” due to the consolidation of
an affiliated company that was formerly accounted for under the equity method as a
result of the adoption during the fiscal year
ended March 31, 2004 of Financial Accounting
Standards Board (“FASB”) Interpretation
(“FIN”) 46 (refer to Notes 6 and 7 in the Notes
to the Consolidated Financial Statements).
Investments and advances on March 31,
2004 in the Financial Services segment
increased by 543.1 billion yen, or 31.4 percent,
to 2,274.5 billion yen, compared with the
previous fiscal year-end. This increase was
primarily due to an increase in assets under
management.
PROPERTY, PLANT AND EQUIPMENT (AFTER
DEDUCTION OF ACCUMULATED DEPRECIATION)
Property, plant and equipment on March 31,
2004 increased by 86.7 billion yen, or 6.8 percent, to 1,365.0 billion yen, compared with
the previous fiscal year-end.
Property, plant and equipment on March
31, 2004 in all segments excluding the Financial Services segment increased by 91.9 billion
yen, or 7.5 percent, to 1,324.2 billion yen,
compared with the previous fiscal year-end.
The increase was mainly due to an increase in
assets resulting from the adoption of FIN 46.
Capital expenditures (part of the increase in
property, plant and equipment) for the fiscal
year ended March 31, 2004 increased by
117.0 billion yen, or 44.8 percent, to 378.3
billion yen compared with the previous fiscal
year. Capital expenditures in the Electronics
segment increased 72.4 billion yen, or 42.5
percent, to 242.7 billion yen and in the Game
segment by 59.4 billion yen, or 144.9 percent,
to 100.4 billion yen. Capital expenditures in
the semiconductor businesses (included in the
capital expenditures of both the Electronics
71
Page 74

and Game segments) amounted to 175.0
billion yen, of which investments in production
equipment for next generation broadband
microprocessors amounted to 69.0 billion yen.
Capital expenditures in the Music segment
decreased by 7.3 billion yen, or 36.2 percent,
to 12.9 billion yen, in the Pictures segment by
1.1 billion yen, or 15.8 percent to 6.0 billion
yen, and in the Other segment by 6.9 billion
yen, or 40.4 percent, to 10.1 billion yen.
Property, plant and equipment on March
31, 2004 in the Financial Services segment
decreased 5.2 billion yen, or 11.2 percent, to
40.8 billion yen compared with the previous
fiscal year-end. Capital expenditures in the
Financial Services segment increased 1.0 billion
yen, or 26.3 percent, to 4.6 billion yen.
OTHER ASSETS
Other assets on March 31, 2004 decreased by
63.5 billion yen, or 3.8 percent, to 1,592.6
billion yen, compared with the previous fiscal
year-end.
Other assets on March 31, 2004 in all segments excluding the Financial Services segment
increased by 0.1 billion yen to 1,251.9 billion
yen. Other assets on March 31, 2004 in the
Financial Services segment increased 25.2
billion yen, or 5.8 percent, to 460.0 billion yen
compared with the previous year. This was
mainly due to an increase in deferred insurance
acquisition costs at Sony Life.
Deferred tax assets on March 31, 2004 decreased by 124.9 billion yen, or 38.1 percent,
to 203.2 billion yen compared with the previous fiscal year-end. The decrease was due to
the offset between deferred tax assets and
liabilities recorded at each of the companies
within the Sony Group, as a result of the adoption of consolidated tax filing in Japan.
LIABILITIES
Total current and long-term liabilities on March
31, 2004 increased by 622.2 billion yen, or
10.3 percent, to 6,689.8 billion yen compared
with the previous fiscal year-end. Total current
and long-term liabilities on March 31, 2004 in
all segments excluding the Financial Services
segment increased by 189.6 billion yen, or 5.2
percent, to 3,855.9 billion yen. Total current
and long-term liabilities on March 31, 2004, in
the Financial Services segment increased by
515.4 billion yen, or 19.9 percent, to 3,099.8
billion yen, compared with the previous fiscal
year-end. Total liabilities on March 31, 2004 in
all segments excluding the Financial Services
segment would have increased by approximately 10 percent compared with the previous
fiscal year-end if the value of the yen had remained the same on March 31, 2004 as it was
on March 31 of the previous fiscal year.
CURRENT LIABILITIES
Current liabilities on March 31, 2004 increased
by 547.2 billion yen, or 22.5 percent, to
2,982.2 billion yen compared with the previous fiscal year-end. Current liabilities on March
31, 2004 in all segments excluding the Financial Services segment increased by 307.7 billion
yen, or 14.9 percent, to 2,373.6 billion yen.
Short-term borrowings and current portion
of long-term debt on March 31, 2004 in all
segments excluding the Financial Services
segment increased 283.1 billion yen, or 223.4
percent, to 409.8 billion yen compared with
the previous fiscal year-end. This increase was
mainly due to the shift from long-term liabilities to current liabilities of 287.8 billion yen (as
of March 31, 2004) in outstanding convertible
bonds, due for redemption on March 31,
2005, and an increase of 57.3 billion yen in
bank syndicated loans, which will reach maturity by November 2004, as a result of the
adoption of FIN 46. Partially offsetting these
items was a 52.8 billion yen repayment of
commercial paper during the fiscal year.
Notes and accounts payable, trade on
March 31, 2004 in all segments excluding the
Financial Services segment increased by 79.6
billion yen, or 11.5 percent, to 773.2 billion
yen compared with the previous fiscal yearend. This increase was particularly conspicuous
in the Electronics segment, where inventories
also increased.
Current liabilities on March 31, 2004 in the
Financial Services segment increased by 232.9
billion yen, or 56.0 percent, to 648.8 billion
yen, mainly due to the increase in deposits
from customers and interbank short-term
borrowings in the banking business. Deposits
from customers in the banking business increased by 130.1 billion yen, or 52.3 percent,
to 378.9 billion yen, due to the expansion of
the banking business.
LONG-TERM LIABILITIES
Long-term liabilities on March 31, 2004 increased by 75.0 billion yen, or 2.1 percent, to
3,707.6 billion yen compared with the previous fiscal year-end.
Long-term liabilities on March 31, 2004 in all
segments excluding the Financial Services segment decreased by 118.1 billion yen, or 7.4 percent, to 1,482.4 billion yen. This decrease was
mainly due to a 129.2 billion yen, or 26.5 percent, decrease to 358.2 billion yen of accrued
pension and severance costs primarily resulting
from an increase in pension assets due to the
rise in value of equity investment in Japan.
Long-term debt on March 31, 2004 in all
segments excluding the Financial Services segment decreased 27.7 billion yen, or 3.4 percent, to 775.2 billion yen. This was mainly due
to the shift to current liabilities of 287.8 billion
yen (as of March 31, 2004) in outstanding
convertible bonds, due for redemption on
March 31, 2005, and despite the issuance of
the 250.0 billion yen in euro yen convertible
bonds (bonds with stock acquisition rights).
Long-term liabilities on March 31, 2004 in
the Financial Services segment increased by
282.5 billion yen, or 13.0 percent, to 2,451.0
billion yen. This was due to an increase in insurance-in-force in the life insurance business
which resulted in an increase in future insurance policy benefits and other of 264.2 billion
yen, or 13.8 percent, to 2,178.6 billion yen.
TOTAL INTEREST-BEARING DEBT
Total interest-bearing debt on March 31, 2004
increased by 286.5 billion yen, or 29.7 percent,
to 1,252.7 billion yen, compared with the previous fiscal year-end. Total interest-bearing
debt on March 31, 2004 in all segments excluding the Financial Services segment increased by 255.4 billion yen, or 27.5 percent,
to 1,185.0 billion yen.
72
Page 75

Interest-bearing liabilities
(Billion ¥)
1,500
1,000
500
0
02 03 04
Short-term (Including the current portion of long-
term debt)
Long-term
* As of March 31
INCREASE IN ASSETS AND LIABILITIES
AS A RESULT OF CONSOLIDATION OF
VARIABLE INTEREST ENTITIES
Sony adopted FIN 46 on July 1, 2003. As a
result, Sony’s assets and liabilities increased as
non-cash transactions, which resulted in no
cash flows, by 95.3 billion yen and 98.0 billion
yen, respectively. Cash and cash equivalents
also increased by 1.5 billion yen. The Variable
Interest Entities (“VIEs”) consolidated by Sony
include the following:
Sony leases the headquarters of its U.S. subsidiary from a VIE. Upon consolidation of the
VIE, assets and liabilities increased by 25.3 billion yen and 27.0 billion yen, respectively. Sony
has the option to purchase the building at any
time for 26.9 billion yen during the lease term
which expires in December 2008. The debt held
by the VIE is unsecured. At the end of the lease
term, Sony has agreed to either renew the
lease, purchase the building or remarket it to a
third party on behalf of the owner.
A subsidiary in the Pictures business entered
into a joint venture agreement with a VIE for
the purpose of funding the acquisition of certain international film rights. Upon consolidation of the VIE, assets and liabilities increased
by 10.2 billion yen and 10.6 billion yen, respectively. Under the agreement, the
subsidiary’s 1.2 billion yen equity investment is
the last equity to be repaid.
Sony has utilized a VIE to erect and operate
a multi-use real estate complex in Berlin,
Germany, which was accounted for under the
equity method by Sony until June 30, 2003.
On July 1, 2003, Sony consolidated this entity.
Upon consolidation of the VIE, assets and
liabilities increased by 61.3 billion yen and 60.3
billion yen, respectively. These liabilities include
a 57.3 billion yen syndicated bank loan which
matures in November 2004. The syndicated
bank loan is secured by the multi-use real
estate complex.
Regarding further information on transactions with VIEs please refer to Notes 22 and 23
of Notes to Consolidated Financial Statements.
STOCKHOLDERS’ EQUITY
Stockholders’ equity on March 31, 2004 increased by 97.1 billion yen, or 4.3 percent, to
2,378.0 billion yen compared with the previous
fiscal year-end. Retained earnings increased
65.3 billion yen compared with the previous
fiscal year-end, and the amount of deductions
recorded in accumulated other comprehensive
income decreased 22.0 billion yen. Accumulated other comprehensive income improved
because, although foreign currency translation
adjustments (deduction from Accumulated
other comprehensive income) increased 127.9
billion yen year on year, due to the appreciation of the yen, minimum pension liability
adjustments (deduction from Accumulated
other comprehensive income) decreased 93.4
billion yen, due to an increase in pension
assets resulting from the rise in value of equity
investment in Japan, and unrealized gains on
securities increased 52.3 billion yen compared
with the previous fiscal year-end. The ratio of
stockholders’ equity to total assets decreased
1.0 percentage points from 27.2 percent to
26.2 percent.
Stockholders’ equity and stockholders’ equity ratio
(Billion ¥) (%)
2,500
2,000
1,500
1,000
500
0
Stockholders’ equity
Stockholders’ equity ratio
Stockholders’ equity ratio=Stockholders’ equity/Total assets
* As of March 31
29.0%
02 03 04
27.2%
26.2%
50
40
30
20
10
0
Stockholders’ equity per share of common stock
(¥)
3,000
2,500
2,000
1,500
1,000
500
0
02 03 04
*As of March 31
CONDENSED BALANCE SHEETS
SEPARATING OUT THE FINANCIAL
SERVICES SEGMENT (UNAUDITED)
The following schedule shows an unaudited
condensed balance sheets for the Financial
Services segment and all other segments excluding Financial Services as well as the condensed
consolidated balance sheets. This presentation
is not required under U.S. GAAP, which is used
in Sony’s consolidated financial statements.
However, because the Financial Services segment is different in nature from Sony’s other
segments, Sony believes that a comparative
presentation may be useful in understanding
and analyzing Sony’s consolidated financial
statements. Transactions between the Financial
Services segment and all other segments excluding Financial Services are eliminated in the
consolidated figures shown on the next page.
73
Page 76

CONDENSED BALANCE SHEETS SEPARATING OUT THE FINANCIAL SERVICES SEGMENT
As at March 31 All other Segments
(Yen in millions) 2003 2004 2003 2004 2003 2004
Assets
Current assets . . . . . . . . . . . . . . . . . . . . . . . . . . . . . . . . . 684,945 699,698 2,503,940 2,692,436 3,154,214 3,363,355
Cash and cash equivalents . . . . . . . . . . . . . . . . . . . . . . . . . 274,543 256,316 438,515 592,895 713,058 849,211
Marketable securities . . . . . . . . . . . . . . . . . . . . . . . . . . . . . 236,621 270,676 4,899 4,072 241,520 274,748
Notes and accounts receivable, trade . . . . . . . . . . . . . . . . . 68,188 72,273 943,073 943,590 1,007,395 1,011,189
Other . . . . . . . . . . . . . . . . . . . . . . . . . . . . . . . . . . . . . . . . . 105,593 100,433 1,117,453 1,151,879 1,192,241 1,228,207
Film costs . . . . . . . . . . . . . . . . . . . . . . . . . . . . . . . . . . . . . – – 287,778 256,740 287,778 256,740
Investments and advances . . . . . . . . . . . . . . . . . . . . . . . 1,731,415 2,274,510 383,004 358,629 1,994,123 2,512,950
Investments in Financial Services, at cost . . . . . . . . . . . – – 166,905 176,905 – –
Property, plant and equipment . . . . . . . . . . . . . . . . . . . 45,990 40,833 1,232,359 1,324,211 1,278,350 1,365,044
Other assets . . . . . . . . . . . . . . . . . . . . . . . . . . . . . . . . . . . 434,769 459,998 1,251,810 1,251,901 1,656,080 1,592,573
Deferred insurance acquisition costs . . . . . . . . . . . . . . . . . . 327,869 349,194 – – 327,869 349,194
Other . . . . . . . . . . . . . . . . . . . . . . . . . . . . . . . . . . . . . . . . . 106,900 110,804 1,251,810 1,251,901 1,328,211 1,243,379
Liabilities and stockholders’ equity
Current liabilities . . . . . . . . . . . . . . . . . . . . . . . . . . . . . . . 415,877 648,803 2,065,854 2,373,550 2,435,048 2,982,215
Short-term borrowings . . . . . . . . . . . . . . . . . . . . . . . . . . . . 72,753 86,748 126,687 409,766 158,745 475,017
Notes and accounts payable, trade . . . . . . . . . . . . . . . . . . . 5,417 7,847 693,589 773,221 697,385 778,773
Deposits from customers in the banking business . . . . . . . . 248,721 378,851 – – 248,721 378,851
Other . . . . . . . . . . . . . . . . . . . . . . . . . . . . . . . . . . . . . . . . . 88,986 175,357 1,245,578 1,190,563 1,330,197 1,349,574
Long-term liabilities . . . . . . . . . . . . . . . . . . . . . . . . . . . . . 2,168,476 2,450,969 1,600,484 1,482,378 3,632,580 3,707,587
Long-term debt . . . . . . . . . . . . . . . . . . . . . . . . . . . . . . . . . 140,908 135,811 802,911 775,233 807,439 777,649
Accrued pension and severance costs . . . . . . . . . . . . . . . . . 8,737 10,183 487,437 358,199 496,174 368,382
Future insurance policy benefits and other . . . . . . . . . . . . . 1,914,410 2,178,626 – – 1,914,410 2,178,626
Other . . . . . . . . . . . . . . . . . . . . . . . . . . . . . . . . . . . . . . . . . 104,421 126,349 310,136 348,946 414,557 382,930
Minority interest in consolidated subsidiaries . . . . . . . – – 16,288 17,554 22,022 22,858
Stockholders’ equity . . . . . . . . . . . . . . . . . . . . . . . . . . . . 312,766 375,267 2,143,170 2,187,340 2,280,895 2,378,002
Financial Services excluding Financial Services Consolidated
2,897,119 3,475,039 5,825,796 6,060,822 8,370,545 9,090,662
2,897,119 3,475,039 5,825,796 6,060,822 8,370,545 9,090,662
INVESTMENTS
Sony regularly evaluates its investment portfolio to identify other-than-temporary impairments of individual securities. Factors that are
considered by Sony in determining whether an
other-than-temporary decline in value has
occurred include: the length of time and extent to which the market value of the security
has been less than its original cost, the financial condition, operating results, business plans
and estimated future cash flows of the issuer
of the security, other specific factors affecting
the market value, deterioration of issuer’s
credit condition, sovereign risk, and whether
or not Sony is able to retain the investment for
a period of time sufficient to allow for the
anticipated recovery in market value.
In evaluating the factors for available-for-sale
securities with readily determinable fair values,
management presumes a decline in value to be
74
other-than-temporary if the fair value of the
security is 20 percent or more below its original
cost for an extended period of time (generally
a period of up to six to twelve months). The
presumption of an other-than-temporary impairment in such cases may be overcome if
there is evidence to support that the decline is
temporary in nature due to the existence of
other factors which overcome the duration or
magnitude of the decline. On the other hand,
there may be cases where impairment losses
are recognized when the decline in the fair
value of the security is not more than 20 percent or such decline has not existed for an extended period of time, as a result of considering
specific factors which may indicate the decline
in the fair value is other-than-temporary.
The assessment of whether a decline in the
value of an investment is other-than-temporary
is often judgmental in nature and involves
certain assumptions and estimates concerning
the expected operating results, business plans
and future cash flows of the issuer of the security. Accordingly, it is possible that investments
in Sony’s portfolio that have had a decline in
value that Sony currently believes to be temporary may be determined to be other-thantemporary in the future based on Sony’s
evaluation of additional information such as
continued poor operating results, future broad
declines in value of worldwide equity markets
and the effect of world wide interest rate fluctuations. As a result, unrealized losses recorded for investments may be recognized into
income in future periods.
The following table contains available for
sale and held to maturity securities, breaking
out the unrealized gains and losses by investment category.
The most significant portion of these unre-
Page 77

March 31, 2004
(Yen in millions) Cost gain loss value
Financial Services Business:
Available for sale
Debt securities
Sony Life . . . . . . . . . . . . . . . . . . . . . . . 1,581,723 54,645 1,828 1,634,540
Other . . . . . . . . . . . . . . . . . . . . . . . . . 348,443 971 232 349,182
Equity securities
Sony Life . . . . . . . . . . . . . . . . . . . . . . . 33,694 16,398 149 49,943
Other . . . . . . . . . . . . . . . . . . . . . . . . . 2,384 4,365 0 6,749
Held to maturity
Debt securities
Sony Life . . . . . . . . . . . . . . . . . . . . . . . – – – –
Other . . . . . . . . . . . . . . . . . . . . . . . . . 26,437 381 28 26,790
Total Financial Services . . . . . . . . . . . . 1,992,681 76,760 2,237 2,067,204
Non-Financial Services:
Available for sale securities . . . . . . . . . . . . . 58,946 42,768 1,749 99,965
Held to maturity securities . . . . . . . . . . . . . 2 – – 2
Total Non-Financial Services . . . . . . . . 58,948 42,768 1,749 99,967
Consolidated . . . . . . . . . . . . . . . . . . . . . . . 2,051,629 119,528 3,986 2,167,171
alized losses relate to investments held by Sony
Life. Sony Life principally invests in debt securities in various industries. Almost all of these
securities were rated “BBB” or better by Standard and Poor’s Rating Services (“S&P”),
Moody’s Investors Services, Inc. (“Moody’s”) or
others. As of March 31, 2004, Sony Life had
debt and equity securities which had gross unrealized losses of 1.8 billion yen and 0.1 billion
yen, respectively. Of the unrealized loss
amounts recorded by Sony Life, less than 1
percent relate to securities being in an unrealized loss position of greater than 12 months.
These unrealized losses related to numerous
investments, with no single investment being
in a material unrealized loss position. In addition, there was no individual security with unrealized losses that met the test discussed
above for impairment as the declines in value
were observed to be small both in amounts
and percentage, and therefore, the decline in
value for those investments was still determined to be temporary in nature. The percentage of noninvestment grade securities held by
Sony Life represents approximately 3 percent
of Sony Life’s total investment portfolio, while
the percentage of unrealized losses that relate
to those noninvestment grade securities was
approximately 7 percent of Sony Life’s total
unrealized losses as of March 31, 2004.
For fixed maturity securities with unrecog-
Unrealized Unrealized Fair market
nized losses held by Sony Life as of March 31,
2004 (1.8 billion yen), maturity dates vary as
follows:
■
Within 1 year: 9 percent
■
1 to 5 years: 54 percent
■
5 to 10 years: 37 percent
Sony also maintains long-term investment
securities issued by a number of non-public
companies. The aggregate carrying amount of
the investments in non-public companies at
March 31, 2004, which were valued at the lower
of cost or fair value, was 51.4 billion yen.
For the years ended March 31, 2002, 2003
and 2004, total impairment losses were 27.6
billion yen, 25.5 billion yen and 16.7 billion
yen of which 9.2 billion yen, 2.3 billion yen
and 0.2 billion yen, respectively, were recorded
by Sony Life in Financial Services revenue (refer
to “Financial Services” under “Operating Per-
formance by Business Segment” for the fiscal
years ended March 31, 2004 and March 31,
2003). Impairment losses other than at Sony
Life in each of the three years were reflected in
non-operating expenses and primarily relate to
the certain strategic investments in non-financial services businesses. These investments
primarily relate to the certain strategic investments in Japan, the U.S. and Europe with
which Sony has strategic relationships for the
purposes of developing and marketing new
technologies. The impairment losses were
recorded for each of the three years as these
companies failed to successfully develop and
market such technology, the operating performance of the companies was more unfavorable than previously expected and the decline
in fair value of these companies was judged as
other-than-temporary. None of these impairment losses was individually material to Sony,
except for the devaluation of securities explained in “Other Income and Expenses” for
the fiscal years ended March 31, 2004, March
31, 2003, and March 31, 2002, except for the
devaluation of securities in the cases of companies such as Candescent Technologies
Corporation, a developer of flat-screen technology and Trimedia Technologies Inc., a
developer of microprocessor technologies.
Upon determination that the value of an
investment is impaired, the value of the investment is written down to its fair value. For publicly traded investments, fair value is determined
by the closing stock price as of the date on
which the impairment determination is made.
For non-public investments, fair value is determined through the use of such methodologies
as discounted cash flows, valuation of recent
financings and comparable valuations of
similar companies. The impairment losses that
were recorded in each of the three years related to the unique facts and circumstances of
each individual investment and did not significantly impact other investments.
Sony Life and Sony Bank’s investments constitute the majority of the investments in the
Financial Services segment. Sony Life and Sony
Bank account for approximately 81 percent
and 17 percent of the investments of the
Financial Services segment, respectively.
Sony Life’s basic investment policy is to take
both expected returns and investment risks into
account in order to maintain sound asset
quality, structuring its asset management portfolio to ensure steady medium- and long-term
returns by investing assets in an efficient
manner and responding flexibly to changes in
financial conditions and the investment
environment. Moreover, Sony Life analyzes the
character of future insurance policy benefits by
utilizing Asset Liability Management (“ALM”), a
method of managing interest rate fluctuation
risk through the comprehensive identification
of the mismatches of duration and cash flows
75
Page 78

between assets and liabilities. Government
bonds and corporate bonds constitute a majority
of Sony Life’s current portfolio. Sony Life invests
in various types of government and corporate
bonds in many countries, companies and industries, to diversify associated risks. Further, as
stocks accounted for approximately 2 percent
of such securities, the financial structure of Sony
Life is not greatly influenced by stock prices.
Sony Bank operates using a similar basic investment policy as Sony Life, taking expected
returns and investment risks into account in
order to disperse associated risks, and structuring its asset portfolio to ensure steady returns
from investments. In addition, Sony Bank is
careful to match the duration of its asset
portfolio with the duration of liabilities resulting from customer deposits, in order to ensure
that significant discrepancies do not occur.
Government bonds and corporate bonds
constitute a majority of Sony Bank’s current
portfolio. Sony Bank invests in various types of
government and corporate bonds in many
countries, companies and industries, to diversify associated risks. To safeguard its assets
Sony Bank does not lend its assets to corporations or invest in equity securities.
CONTRACTUAL OBLIGATIONS, COMMITMENTS, AND CONTINGENT LIABILITIES
The following table summarizes Sony’s contractual obligations and major commitments.
Payments Due by Period
(Yen in millions) Total 1 year 1 to 3 year 3 to 5 year After 5 year
Contractual Obligations and Major Commitments:
Long-term debt (Note 11)
Capital lease obligations (Notes 8 and 11). . . . . . . . . . . . . . . . . . . . . . . . . 42,689 12,667 13,109 10,923 5,990
Other long-term debt (Note 11) . . . . . . . . . . . . . . . . . . . . . . . . . . . . . . . . 1,118,717 371,090 316,103 299,984 131,540
Minimum rental payments required under operating leases (Note 8) . . . . . . . 187,379 42,649 58,725 29,498 56,507
Purchase commitments for property, plant and equipment and
other assets (Note 23) . . . . . . . . . . . . . . . . . . . . . . . . . . . . . . . . . . . . . . . . . 20,796 20,331 462 3 –
Expected payments regarding contracts with recording artists and
other (Note 23) . . . . . . . . . . . . . . . . . . . . . . . . . . . . . . . . . . . . . . . . . . . . . . 39,073 19,470 14,759 3,708 1,136
Expected cost for the production or purchase of films and television
programming or certain rights (Note 23). . . . . . . . . . . . . . . . . . . . . . . . . . . 95,232 39,672 55,560 – –
Commitment under the joint venture agreement with Samsung
Electronics Co., Ltd. (Note 23). . . . . . . . . . . . . . . . . . . . . . . . . . . . . . . . . . . 96,285 96,285 – – –
* The total amount of expected future pension payments is not included in the above table or the total amount of commitments outstanding at March 31, 2004 discussed below as such amount is not currently
determinable. Sony expects to contribute approximately 23.0 billion yen to the Japanese pension plans and approximately 17.0 billion yen to the foreign pension plans for the year ending March 31, 2005 (Note 14).
Less than
The total amount of commitments outstanding at March 31, 2004 was 316.1 billion
yen (refer to Note 23 of Notes to Consolidated
Financial Statements). The commitments include
major purchase obligations as shown above.
In the ordinary course of business, Sony
makes commitments for the purchase of property, plant and equipment. As of March 31,
2004, such commitments outstanding were
20.8 billion yen. Most of these assets will be
used for general operating purposes.
Certain subsidiaries in the Music segment
have entered into long-term contracts with recording artists and companies for the production and/or distribution of pre-recorded music
and videos. As of March 31, 2004, the total
amount of expected payments regarding these
long-term contracts was 39.1 billion yen.
A subsidiary in the Pictures segment has
committed to fund a portion of the production
cost of completed films and is responsible for
all distribution and marketing expenses
relating to these films under a distribution
agreement with a third party. Further, certain
subsidiaries in the Pictures segment have
entered into agreements with creative talent
for the development and production of films
and television programming as well as agreements with third parties to acquire completed
films, or certain rights therein. As of March 31,
2004, the total amount of the expected cost
for the production or purchase of films and
television programming or certain rights under
the above commitments was 95.2 billion yen.
On March 8, 2004, Sony Corporation
signed an agreement with Samsung Electronics
Co., Ltd. (“Samsung”) to establish a joint
venture, named S-LCD Corporation. As of
March 31, 2004, under the joint venture
agreement, Sony is committed to fund a total
of 96.3 billion yen.
The following table summarizes Sony’s contingent liabilities.
Total Amounts of
(Yen in millions) Liabilities
Contingent Liabilities (Notes 22 and 23):
Loan guarantees to related parties . . . . . . . . . . . . . . . . . . . . . . . . . . . . . . . . . . . . . . . 19,903
Maximum potential future unrecorded obligation associated with
a joint venture in the Pictures segment . . . . . . . . . . . . . . . . . . . . . . . . . . . . . . . . . . . 17,955
Other . . . . . . . . . . . . . . . . . . . . . . . . . . . . . . . . . . . . . . . . . . . . . . . . . . . . . . . . . . . . . 22,004
Total contingent liabilities . . . . . . . . . . . . . . . . . . . . . . . . . . . . . . . . . . . . . . . . . . . . 59,862
Contingent
76
Page 79

In December 2003, Sony and Bertelsmann
AG signed a binding agreement to combine
their recorded music businesses in a joint venture. The newly formed company, which will
be known as Sony BMG, will be 50 percent
owned by each parent company. The merger is
subject to regulatory approvals in the U.S. and
European Union.
In order to fulfill its commitments, Sony
will use cash generated by its operating activities, net excess cash within the Sony group
through group finance subsidiaries such as
SGTS and raise funds from the global capital
markets and from banks when necessary.
OFF-BALANCE SHEET ARRANGEMENTS
During the fiscal year ended March 31, 2004,
Sony entered into a new accounts receivable
securitization program which provides for the
accelerated receipt of up to 500 million U.S.
dollars of cash on eligible trade accounts
receivable of Sony’s U.S. electronics subsidiary
and replaced the previous accounts receivable
securitization program which provided for the
accelerated receipt of up to 900 million U.S.
dollars. Through this program, Sony can
securitize and sell a percentage of undivided
interest in that pool of receivables to several
multi-seller commercial paper conduits owned
and operated by a bank. These securitization
transactions are accounted for as a sale in
accordance with Statement of Financial
Accounting Standards (“FAS”) No. 140,
“Accounting for Transfers and Servicing of
Financial Assets and Extinguishments of Liabilities”, because Sony has relinquished control of
the receivables. Accordingly, accounts receivable
sold under these facilities are excluded from
receivables in the accompanying consolidated
balance sheet. There were no amounts outstanding under this facility at March 31, 2004.
Sony has, from time to time, entered into
various financing arrangements with VIEs. These
arrangements include facilities which provide
for the leasing of certain property, the financing
of film production and the development and
operation of a multi-use real estate complex.
Although not a significant part of its financing
activities, Sony employs these arrangements
because they provide a diversification of funding
sources. The assets and liabilities associated with
these arrangements previously qualified for off-
balance sheet treatment. On July 1, 2003, Sony
adopted FIN 46 and accordingly, the assets and
liabilities associated with these arrangements
were consolidated. Refer to Note 22 of Notes to
Consolidated Financial Statements for more information. As a result, Sony recognized a one
time charge with no tax effect of 2.1 billion yen
for a cumulative effect of accounting change.
Additionally, Sony’s assets and liabilities increased as non-cash transactions, which resulted
in no cash flows, by 95.3 billion yen and 98.0
billion yen, respectively. Cash and cash equivalents also increased by 1.5 billion yen. For all the
VIEs in which Sony holds a significant variable
interest Sony is a primary beneficiary, and all
these VIEs are consolidated by Sony.
CASH FLOWS
(The fiscal year ended March 31, 2004 compared
with the fiscal year ended March 31, 2003.)
Operating Activities: During the fiscal year
ended March 31, 2004, Sony generated 632.6
billion yen of net cash from operating activities,
a decrease of 221.2 billion yen, or 25.9 percent
compared with the previous fiscal year. Of this
total, all segments excluding the Financial Services segment generated 401.1 billion yen of
net cash from operating activities, a decrease of
143.0 billion yen, or 26.3 percent, compared
with the previous year, and the Financial
Services segment generated 241.6 billion yen of
net cash from operating activities, a decrease of
73.1 billion yen, or 23.2 percent, compared
with the previous year.
During the fiscal year, profits from the
Game, Financial Services, Pictures and Music
segments, an increase in depreciation expenses, and an increase in notes and accounts
payable, trade, primarily due to an increase in
the procurement of raw materials and parts
reflecting the increase in sales to outside customers in the Electronics segment, contributed
to operating cash flow. Partially offsetting
these contributions were factors including an
increase in inventories in the Electronics segment and an increase in notes and accounts
receivable, trade in the Electronics and Pictures
segments. An increase in future insurance
policy benefits and other, due to an increase in
insurance-in-force, contributed to operating
cash flow in the Financial Services segment.
Compared with the previous fiscal year,
net cash provided by operating activities
decreased, due to a year on year increase in
notes and accounts receivable, trade during
the fiscal year ended March 31, 2004, compared with a year on year decrease during
the fiscal year ended March 31, 2003. The
increase in notes and accounts receivable,
trade was primarily due to an increase in sales
to outside customers, in the fourth quarter
ended March 31, 2004, of digital still cameras,
flat panel televisions and cellular phones (sold
to Sony Ericsson) in the Electronics segment,
as well as home entertainment revenues in the
Pictures segment, compared with the fourth
quarter ended March 31, 2003. Although
certain factors contributed to an increase in
operating cash flow, such as a year on year
increase, during the fiscal year ended March
31, 2004, in notes and accounts payable,
trade, compared with a year on year decrease
in the fiscal year ended March 31, 2003,
mainly due to the increase in the procurement of raw materials and parts reflecting the
increase in sales to outside customers in the
Electronics segment, these factors were offset
by factors such as an increase in inventories in
the Electronics segment during the fiscal year
ended March 31, 2004 compared with a
decrease in the fiscal year ended March 31,
2003, which decreased operating cash flow.
Investing Activities: During the fiscal year,
Sony used 761.8 billion yen of net cash in
investing activities, an increase of 55.4 billion
yen, or 7.8 percent, compared with the
previous fiscal year. Of this total, all segments
excluding the Financial Services segment used
352.5 billion yen of net cash in investing
activities, an increase of 166.6 billion yen, or
89.6 percent, compared with the previous
fiscal year, and the Financial Services segment
used 401.6 billion yen in net cash, a decrease
of 115.1 billion yen, or 22.3 percent.
During the fiscal year, purchases of fixed assets
(capital expenditures) were made, primarily due to
proactive capital expenditures in the Electronics
and Game segments mainly for next generation
broadband microprocessors and CCDs, and payments for investments and advances exceeded
proceeds in the Financial Services segment due
to an increase in assets under management
(refer to “Financial Services”).
77
Page 80

Compared with the previous fiscal year, net
cash used in investing activities increased due
to an increase in purchases of fixed assets, primarily in the Electronics and Game segments.
In all segments excluding the Financial Services
segment, the amount of payments for investments and advances decreased by 90.5 billion
yen, or 73.1 percent, to 33.3 billion yen, compared with the previous year, due to investments associated with the acquisition of
companies such as InterTrust Technologies
Corporation (“InterTrust”) and an increase in
the capital stock of Sony Ericsson in the fiscal
year ended March 31, 2003. On the other
hand, the amount of proceeds from sales and
maturities of investments and collections of
advances in the segments other than Financial
Services segment decreased 113.5 billion yen,
or 76.2 percent to 35.5 billion yen compared
with the previous fiscal year, due to the sale of
Sony’s equity interest in Telemundo in the previous fiscal year. In the Financial Services segment, net cash used in investing activities
decreased due to an increase in proceeds from
investments and advances.
In all segments excluding the Financial
Services segment, the difference between cash
generated from operating activities and cash
used in investing activities was a positive 48.6
billion yen for the fiscal year, a decrease of
309.6 billion yen, or 86.4 percent, compared
with the previous fiscal year.
Financing Activities: During the fiscal year
ended March 31, 2004, 313.3 billion yen of
net cash was provided by financing activities
(in the previous fiscal year, 93.1 billion yen of
net cash was used in financing activities). Of
the total, 153.8 billion yen of net cash was
procured through financing activities in all
segments excluding the Financial Services segment. Although 23.1 billion yen in cash was
used for the payment of dividends and 52.8
billion yen in commercial paper was repaid,
250.0 billion yen in euro yen convertible bonds
(bonds with stock acquisition rights) were
issued. In the Financial Services segment, due
to factors such as a 129.9 billion yen increase
in deposits from customers in the banking
business, net cash provided by financing
activities was 141.7 billion yen.
Accounting for all these factors and the
effect of exchange rate changes, the total
outstanding balance of cash and cash equivalents at the end of the fiscal year increased
136.2 billion yen, or 19.1 percent, to 849.2
billion yen, compared with the end of the previous fiscal year. The total outstanding balance
of cash and cash equivalents of all segments
excluding the Financial Services segment increased 154.4 billion yen, or 35.2 percent, to
592.9 billion yen and for the Financial Services
segment decreased 18.2 billion yen, or 6.6
percent, to 256.3 billion yen, compared with
the previous fiscal year.
Cash flows
(Billion ¥)
1,000
800
600
400
200
0
–200
–400
–600
–800
02 03 04
Cash flows from operating activities
Cash flows from investing activities
Cash flows from financing activities
*Year ended March 31
CONDENSED STATEMENTS OF CASH
FLOWS SEPARATING OUT THE FINANCIAL
SERVICES SEGMENT (UNAUDITED)
The following schedule shows unaudited condensed statements of cash flow for the Financial Services segment and all other segments
excluding the Financial Services segment as
well as condensed consolidated statements of
cash flow. These presentations are not required
under U.S. GAAP, which is used in Sony’s
consolidated financial statements. However,
because the Financial Services segment is different in nature from Sony’s other segments,
Sony believes that a comparative presentation
may be useful in understanding and analyzing
Sony’s consolidated financial statements.
Transactions between the Financial Services
segment and all other segments excluding the
Financial Services segment are eliminated in
the consolidated figures shown below.
Condensed Statements of Cash Flows Separating Out the Financial Services Segment
Year ended March 31 All other segments
(Yen in millions) 2003 2004 2003 2004 2003 2004
Net cash provided by operating activities . . . . . . . . . . . . . . . . . . . . . 314,764 241,627 544,051 401,090 853,788 632,635
Net cash used in investing activities . . . . . . . . . . . . . . . . . . . . . . . . . (516,663) (401,550) (185,883) (352,496) (706,425) (761,792)
Net cash provided by (used in) financing activities . . . . . . . . . . . . . . . 149,207 141,696 (251,247) 153,759 (93,134) 313,283
Effect of exchange rate changes on cash and cash equivalents . . . . . – – (24,971) (47,973) (24,971) (47,973)
Net increase (decrease) in cash and cash equivalents. . . . . . . . . . . . . (52,692) (18,227) 81,950 154,380 29,258 136,153
Cash and cash equivalents at beginning of year . . . . . . . . . . . . . . . . 327,235 274,543 356,565 438,515 683,800 713,058
Cash and cash equivalents at end of year . . . . . . . . . . . . . . . . . . . . . 274,543 256,316 438,515 592,895 713,058 849,211
Financial Services excluding Financial Services Consolidated
78
Page 81

LIQUIDITY AND CAPITAL RESOURCES
Sony’s financial policy is to secure adequate
liquidity and financing for its operations and to
maintain the strength of its balance sheet.
Sony’s mid-term fund requirements are expected to increase due to restructuring charges
and investments in research, development and
capital expenditures for key devices, including
next generation broadband microprocessors.
These increases in expenses and investments
are part of the fundamental reform plan,
Transformation 60, which is being undertaken
across the entire Sony Group and was started
in the fiscal year beginning April 1, 2003 (refer
to “Issues Facing Sony and Management’s
Responses to those Issues” and “Forecast of
Consolidated Results” below).
In regards to the funding requirements that
arise from this business strategy, working
capital needs, repayment of existing debt, and
all its other capital needs, Sony believes that it
can maintain sufficient liquidity and financial
flexibility through operating cash flow and
cash and cash equivalents, its ability to procure
necessary funds from the financial and capital
markets, its commitment lines with banks, and
other means.
Depreciation and amortization
(Billion ¥)
400
300
200
100
0
02 03 04
*Year ended March 31
* Including amortization expenses for intangible assets
and for deferred insurance acquisition costs
Capital expenditures (additions to property, plant
and equipment)
(Billion ¥)
500
400
300
200
100
0
02 03 04
*Year ended March 31
CAPITAL RESOURCES
Sony Corporation, SGTS, a Sony finance
subsidiary in the U.K., and Sony Capital
Corporation (“SCC”), a Sony finance subsidiary
in the U.S., procure funds from the financial
and capital markets.
In order to meet long-term funding requirements, Sony Corporation utilizes its access to
global equity and bond markets. In December
2003, Sony Corporation issued 250 billion yen
in euro yen zero coupon convertible bonds,
due in 2008. The purpose of the issuance was
to acquire funds for the growth strategy component of Transformation 60. Sony has a shelf
registration of 200 billion yen in the Japanese
domestic bond market, of which there was no
outstanding balance as of March 31, 2004.
In order to meet the working capital requirements of the Group, Sony maintains commercial paper (“CP”) programs and medium-term
note (“MTN”) programs through SGTS and
SCC. SGTS maintains a CP program for both
the U.S. and Euro CP markets, and a CP program in the Japanese CP market. SCC maintains a CP program in the U.S. market. As of
March 31, 2004, the total amount of these CP
programs was 1,873.4 billion yen. During the
fiscal year ended March 31, 2004, the largest
month-end outstanding balance of CP at Sony
was 200.1 billion yen in November 2003.
There was no outstanding balance of CP as of
March 31, 2004.
Regarding MTNs, SGTS maintains a Euro
MTN program, while SCC maintains a Rule
144A U.S. MTN program. The total amount of
these MTN programs as of March 31, 2004
was 845.2 billion yen, and the total outstanding balance was approximately 60.5 billion
yen. SCC maintains another Euro MTN program apart from these MTN programs shown
above, but Sony does not intend to utilize this
program for future financing requirements as
Sony intends to concentrate its Euro MTN programs at SGTS.
LIQUIDITY MANAGEMENT AND
COMMITMENT LINES
Sony defines its liquidity sources as (a) cash,
cash equivalents and time deposits, and (b)
committed lines of credit contracted with
financial institutions rated “C” or above in
Bank Financial Strength ratings from Moody’s.
Sony’s basic policy is to maintain liquidity equal
to at least 100 percent of the sum of a) the
amount of average monthly sales and b) the
amount of the largest expected monthly debt
redemption during the fiscal year. Although its
working capital needs have a general tendency
to grow in the third quarter (from October to
December), Sony believes that this policy is
sufficient to meet its working capital requirements for any given fiscal year.
On March 31, 2004, the amount of liquidity
sources, as defined by Sony, held by consolidated Sony excluding Sony Life., Sony Assurance, and Sony Bank was 1,118.0 billion yen.
Of this total, cash, cash equivalents and time
deposits were 601.1 billion yen and contracts
for commitment lines with banks rated “C” or
above totaled approximately 516.9 billion yen,
of which the unused amount was approximately 515.6 billion yen. Sony also has additional commitment lines supporting its
operational needs with some financial institutions, which have Moody’s financial strength
ratings of “C” or below, and these lines
amount to approximately 302.8 billion yen.
Refer to Note 11 of the Consolidated Financial
Statements for the total amount of commitment lines regardless of Moody’s financial
strength rating for the fiscal year ended March
31, 2004.
In general, there are no restrictions on how
Sony’s borrowings can be used except that
some borrowings may not be used to acquire
securities listed on a U.S. exchange or traded
over-the-counter in U.S., and use of such borrowing must comply with the rules and regulations issued by authorities such as the Board of
Governors of the Federal Reserve Board.
79
Page 82

In addition, there are no financial covenants
that would cause an acceleration of the obligation in the event of a downgrade in Sony’s
credit ratings, in any of Sony’s material financing agreements.
RATINGS
In order to facilitate access to global capital
markets, Sony obtains credit ratings from two
rating agencies, Moody’s and S&P. In addition,
Sony maintains a rating from Rating and
Investment Information, Inc. (“R&I”), a rating
agency in Japan, for access to the Japanese
capital market.
Sony’s current debt ratings (long-term/
short-term) are: Moody’s: A1 (outlook: negative)/P-1; S&P: A+ (outlook: negative)/A-1; and
R&I: AA/a-1+.
On June 25, 2003, Moody’s downgraded
Sony’s long-term debt rating from Aa3 to A1
(outlook: negative). R&I downgraded Sony’s
long-term debt rating from AA+ to AA on
June 16, 2003. These actions reflected the
concerns of the two agencies that Sony may
take longer than initially expected to regain its
previous level of profit and cash flow under
the severe competition, particularly in the electronics business, and deflationary pressures.
Sony’s short-term debt rating from Moody’s
and R&I has been unaffected.
Despite the downgrading of Sony’s longterm debt rating by Moody’s and R&I, Sony believes that its access to the global capital markets
will remain sufficient for its financing needs
going forward, and that it will retain its ability
to issue CP to meet its working capital needs.
Sony seeks to maintain a stable credit rating
in order to ensure financial flexibility for liquidity
and capital management, and to continue to
maintain adequate access to sufficient funding
resources in the financial and capital markets.
CASH MANAGEMENT
Sony is centralizing and working to make more
efficient its global cash management activities
through SGTS. The excess or shortage of cash
at most of its subsidiaries is invested or funded
by SGTS after having been netted out, although
Sony recognizes that fund transfer is limited in
certain countries or geographical areas due to
restrictions on capital transactions. In order to
pursue more efficient cash management, Sony
manages uneven cash distribution among its
subsidiaries directly or indirectly through SGTS
so that Sony can reduce unnecessary cash and
cash equivalents as well as borrowings as
much as possible.
The above description covers liquidity and
capital resources for consolidated Sony excluding Sony Life, Sony Assurance and Sony Bank,
each of which respectively secures liquidity on
its own.
FINANCIAL SERVICES SEGMENT
In the Financial Services segment, the management of Sony Life, Sony Assurance and Sony
Bank recognize the importance of securing
sufficient liquidity to cover the payment obligations that they take on as a result of their
ordinary course of business. These companies
abide by the regulations imposed by regulatory
authorities and establish and operate under
company guidelines that comply with these
regulations. Their purpose in doing so is to maintain sufficient cash and cash equivalents and
secure sufficient means to pay their obligations.
Sony Life currently obtains ratings from four
rating agencies: A+ by S&P, A+ by AM Best
Corporation, and AA by R&I and the Japan
Credit Rating Agency Ltd. Sony Bank obtained
an A-/A-2 rating from S&P for its long-term/
short-term debt.
THE USE OF EVA® METHODOLOGY
Aiming to advance corporate value creation
management, Sony uses EVA
cost of capital, as one of its internal evaluation
measures. The fiscal year ended March 31,
2004 marked the fourth year Sony has used
®
EVA
. EVA® is used in the Electronics, Game,
Music, and Pictures segments for various
internal evaluation measures such as setting,
monitoring and evaluating financial perfor-
®*
, which reflects
mance targets. EVA
®
is also linked to compensation. As a result, recognition of return on
invested capital and cost of capital has spread
further within each business unit and proactive
efforts have been made to improve EVA
®
.
These efforts include focusing on key businesses in order to concentrate management
resources in highly growing and profitable
areas and controlling investments and inventories to improve capital efficiency.
*EVA® (Economic Value Added) is a trademark of Stern Stewart & Co.
RESEARCH AND DEVELOPMENT
Recognizing that research and development
are indispensable for business growth, Sony is
actively pursuing various technical themes,
including technologies that support current
services and those that will create new markets.
Sony has also done away with the organizational structure in which there was an Electronics Chief Technology Officer (“CTO ”), a
Co-CTO and several CTOs for each network
company, moving to a structure in which each
business domain has a CTO. In this way, a
single individual in each business domain oversees technological advances in that domain.
■
CTO of Home Electronics
■
CTO of Device Technology
■
CTO of Semiconductor Technology
■
CTO of Material Technology
■
CTO of Information Technology
Furthermore, in accordance with the
strengthening of research and development at
the network companies, the corporate laboratories were reorganized on April 1, 2004. In an
effort to reinforce basic research and development activity in core science areas, two new
research laboratories were also established,
with the CTO of Material Technology and the
CTO of Information Technology each responsible for one.
■
Materials Laboratories
■
Information Technologies Laboratories
In addition, two independent research laboratories, Sony Computer Science Laboratories,
Inc. (fundamental research and user interface
research) and Sony-Kihara Research Center, Inc.
(three-dimensional computer graphics and
image processing technologies), are conducting
research and development in close collaboration
with each other.
80
Page 83

Research and development costs for the
fiscal year ended March 31, 2004 increased
71.4 billion yen, or 16.1 percent, to 514.5 billion
yen, compared with the previous fiscal year.
The ratio of research and development costs to
sales (excluding the Financial Services segment)
increased from 6.4 percent to 7.5 percent. The
bulk of research and development costs were
incurred in the Electronics and Game segments;
expenses in the Electronics segment increased
49.1 billion yen, or 12.9 percent, to 429.4
billion yen, and expenses in the Game segment
increased 21.9 billion yen, or 35.7 percent, to
83.4 billion yen. In the Electronics segment,
approximately 62 percent of expenses were for
the development of new product prototypes
while the remaining approximately 38 percent
were for the development of mid- to longterm new technologies in such areas as semiconductors, communications, displays and next
generation optical discs. Research and development costs in the Game segment increased
primarily in the semiconductor and hardware
field, with network technology accounting for
part of the increase in the hardware area.
NUMBERS OF EMPLOYEES
Although employees were reduced through
restructuring activities, due to an increase at
manufacturing facilities in Asia, primarily in
China, the number of employees at the end of
March 2004 was approximately 162,000, an
increase of approximately 900 from the end of
March 2003. Approximately 3,600 employees
in Japan who left Sony on March 31, 2004,
through the early retirement program and
other means, are counted as a part of this total.
REWARDING SHAREHOLDERS
Sony believes that continuously increasing
corporate value and providing dividends are
essential to rewarding shareholders. It is Sony’s
policy to utilize retained earnings, after ensuring the perpetuation of stable dividends, to
carry out various investments that contribute
to an increase in corporate value such as those
that ensure future growth and strengthen
competitiveness.
A year-end cash dividend of 12.5 yen per
share of Sony Corporation Common Stock was
approved at the Board of Directors meeting
held on April 26, 2004 and was paid on June
1, 2004. Sony Corporation has already paid an
interim dividend for Common Stock of 12.5
yen per share to each shareholder; accordingly,
the total annual cash dividend per share of
Common Stock is 25.0 yen.
Regarding shares of subsidiary tracking
stock issued in Japan by Sony Corporation,
Sony Communication Network Corporation
(“SCN”) has been working to manage its
operations so as to expand cash flow, fully
solidify its financial base and increase its
retained earnings to aggressively expand its
business to strengthen its foundation and
respond to the quickly expanding Internet market. For these reasons, SCN does not plan to
distribute earnings to SCN shareholders for the
time being. As such, Sony Corporation will
continue its policy of not paying dividends to
shareholders of the subsidiary tracking stock.
TREND INFORMATION
This section, including the Forecast of Consolidated Results, contains forward-looking state-
ments about the possible future performance
of Sony and should be read in light of the
cautionary statement on that subject, which
appears on page 3 and which applies to this
entire document.
ISSUES FACING SONY AND
MANAGEMENT’S RESPONSE TO
THOSE ISSUES
Compared with the previous fiscal year, the
global business environment in which Sony
operates has improved, with macroeconomic
indicators showing signs of recovery and
personal consumption beginning to increase.
These improvements have done little to dissipate the challenges facing Sony, however, as
competition in many of Sony’s business segments continues to intensify and price erosion,
especially in the Electronics segment, remains
persistent. Competition has intensified due to
the penetration of broadband, which has led
to an augmentation of network infrastructure,
making it easier for companies in other sectors
to enter the markets in which Sony competes.
In response to these challenges, Sony has
begun to implement Transformation 60, a
series of fundamental reforms aimed at improving operational profitability and competitiveness in anticipation of future growth. Sony
plans to implement Transformation 60 over
the three fiscal years ending March 31, 2006.
Through greater focus of management resources on strategic businesses, accelerated
reform of its manufacturing platform, headcount reductions in administrative (including
corporate) and sales functions and reductions
in the cost of non-production materials, Sony
intends to reduce fixed costs. Restructuring
charges associated with these activities are expected to amount to approximately 335 billion
yen over the three fiscal years ending March
31, 2006. The details of the restructuring plans
for the fiscal years ending March 31, 2005 and
2006 have yet to be determined in full. Sony
also aims to lay the seeds for future growth
through strategic investments in research and
development and aggressive capital expenditures in the area of semiconductors.
In the fiscal year ended March 31, 2004,
the first year of Transformation 60, Sony
recorded 168.1 billion yen in consolidated
restructuring charges, 514.5 billion yen in
consolidated research and development costs
and 175 billion yen in semiconductor capital
expenditures (total of Electronics and Game
segments). In addition to this cost-cutting and
investment for growth, each of Sony’s business
segments grappled with issues specific to that
segment. Below is a description of the issues
management believes each segment continues
to face and an explanation as to how each
segment is approaching those issues.
ELECTRONICS
Although the Electronics segment continues to
hold a very strong position in the worldwide
consumer AV products market, that position
has become increasingly threatened as a result
of the entrance of new manufacturers and
distributors. These new entrants are able to
pose a threat to Sony due to the industry shift
from analog to digital technology. In the analog era, complicated functionality of electronics products was made possible through the
combination of several complex parts, and
Sony held a competitive advantage in the design and manufacture of those parts as a result
of its accumulated expertise. In the digital era,
81
Page 84

however, complicated functionality has become
concentrated on semiconductors and other key
digital devices. Since these semiconductors and
key devices are able to be mass produced, they
have become readily available to new market
entrants, and the functionality that once commanded a high premium has become more
affordable. This has led to intense price erosion
in the end-user consumer AV products market.
To respond to these challenges, Sony is striving
to keep pace with price erosion by reducing its
manufacturing and other costs. It is seeking
to maintain the premium pricing it enjoys on
many of its end-user products by adding
functionality to those products and developing
new applications and ways of use that are
then communicated to the consumer. And it
is taking steps to increase its competitive
edge by developing high value-added semiconductors and other digital key devices inhouse. By increasing the ratio of key devices
produced in-house, Sony aims to capture the
value that has become increasingly concentrated in those devices.
In the area of semiconductors, Sony invested 69 billion yen in the fiscal year ended
March 31, 2004 and plans to invest 120 billion
yen in the fiscal year ending March 31, 2005
on semiconductor fabrication equipment built
at the 65 nanometer level of process technology. These chips will be some of the most
highly advanced on the market, and will include the new microprocessor for the broadband era, code-named Cell, as well as other
system large scale integration (“LSI”) for use in
the next generation computer entertainment
system and a variety of future consumer electronics products. Sony began developing Cell
together with IBM Corporation and Toshiba
Corporation in the spring of 2001. To ensure
efficient use of all the semiconductor production facilities in the Sony Group, Sony is also
planning to consolidate the semiconductor
fabrication facilities of the Electronics and
Game segments into one organization on July
1, 2004.
In the area of other key devices, Sony is
currently investing in 7th generation amorphous
TFT LCD panel production equipment, reflecting its belief that demand for LCD televisions
will continue to increase rapidly. Sony is investing one billion U.S. dollars in a joint venture it
has established with Samsung, named S-LCD
Corporation, and based in South Korea.
Samsung holds 50 percent plus one share of
the equity of the joint venture while Sony holds
50 percent minus one share of the equity of
the joint venture. The President and CEO
comes from Samsung while the CFO comes
from Sony. Investment in manufacturing
equipment will begin in the summer of 2004
while mass production of LCD panels is expected to begin in the second calendar quarter
of 2005. Expected production capacity is
60,000 sheets per month at the 7th generation
(1,870 mm x 2,200 mm) level of technology.
GAME
In the Game segment, PlayStation 2 has a high
share of the global game console market, and
the PlayStation 2 business, particularly the
PlayStation 2 software business, remains in its
harvest stage. However, production shipment
units of PlayStation 2 hardware are expected
to decrease in the fiscal year ending March 31,
2005. In order to ensure future growth in the
Game segment, Sony is investing, as described
above, in the research and development of
cutting-edge microprocessors and other LSIs
that will be used in the next generation computer entertainment system. Furthermore,
Sony is working to develop a new market
through its planned introduction, in the fiscal
year ending March 31, 2005, of PlayStation
Portable (“PSP”), a new handheld game system
on which a variety of content can be enjoyed.
MUSIC
In the Music segment, album sales over the
past several years have decreased due to the
worldwide contraction of the global music
industry brought on by piracy and competition
from other entertainment sectors. Although
Sony experienced improvement in a number of
key retail markets during the fiscal year ended
March 31, 2004, it continued to record declining sales on a global basis. In an effort to
maintain profitability, Sony is continuing to
implement restructuring initiatives designed to
reduce fixed costs at a rate equal to or above
the rate of the decline in sales. Sony is also
working to combat digital piracy and generate
profits through digital distribution of content,
most notably through its launch of the Connect
music store, a digital downloading service.
Finally, in an effort to achieve significant
operational efficiencies, Sony is seeking to
merge its recorded music business with BMG.
In December 2003, Sony and Bertelsmann AG
announced that they had signed a binding
agreement to combine their recorded music
businesses in a joint venture. The newly
formed company, which will be known as
Sony BMG, will be 50 percent owned by each
parent company. The merger is subject to
regulatory approvals in the U.S. and the
European Union.
PICTURES
In the Pictures segment, Sony faces intense
competition, rising advertising and promotion
expenses and a growing trend toward digital
piracy. To meet these challenges, Sony is
working to distribute a diversified portfolio of
motion pictures and capitalize on the expanding DVD home entertainment market, which is
becoming a more significant source of revenues
and profits. Additionally, to differentiate itself
in the marketplace and to proactively address
risks of digital piracy, Sony Pictures Digital is
developing broadband network strategies to
facilitate the integration between Sony’s hardware and content products and create protected revenue-generating alternatives.
FINANCIAL SERVICES
In the Financial Services segment, the value of
assets accumulated by the businesses in the
segment has grown continuously over the past
several fiscal years, resulting in a large portion
of Sony’s total assets being accounted for by
the Financial Services segment. To strengthen
asset management and risk management in
parallel with this growing asset value, enhance
disclosure of business details, and offer customers integrated financial services tailored to
their individual needs, Sony established Sony
Financial Holdings Inc. in April 2004. This company is comprised of Sony Life, Sony Assurance
and Sony Bank, and will serve to increase the
synergies between these businesses.
82
Page 85

FORECAST OF CONSOLIDATED RESULTS
Factors which may affect Sony’s financial performance include the following: market conditions, including general economic conditions,
in major areas where Sony conducts its businesses, levels of consumer spending, foreign
exchange fluctuations, Sony’s ability to continue to design, develop, manufacture, sell,
and win acceptance of its products and services, Sony’s ability to continue to implement
personnel reduction and other business reorganization initiatives, Sony’s ability to implement its network strategy, and implement
successful sales and distribution strategies in
the light of the Internet and other technological developments, Sony’s ability to devote sufficient resources to research and development,
and capital expenditures, and the success of
Sony’s joint ventures and alliances. Risks and
uncertainties also include the impact of any
future events with material unforeseen impacts.
Refer also to the “Cautionary Statement”.
Regarding the forecast of consolidated
results for the fiscal year ending March 31,
2005, sales and operating revenue is expected
to increase slightly compared with the fiscal
year ended March 31, 2004. Operating income, income before income taxes, and net
income are also expected to increase. This
forecast assumes that the yen for the fiscal
year ending March 31, 2005 will strengthen
against the U.S. dollar and the euro compared
with the fiscal year ended March 31, 2004.
During the fiscal year ending March 31,
2005, primarily in the Electronics segment,
restructuring charges of approximately 130
billion yen are expected to be incurred across
the Sony Group. 168.1 billion yen in restructuring charges were recorded in the fiscal year
ended March 31, 2004.
In April 2004, a settlement was reached in
a lawsuit between InterTrust, an equity affiliate
of Sony, and Microsoft regarding patents held
by InterTrust. In return for the provision of a
license to Microsoft, InterTrust received 440
million U.S. dollars. As a result of this settlement, Sony expects to record approximately
100 million U.S. dollars in equity in net income
of InterTrust during the fiscal year.
ELECTRONICS
Sales of products such as digital still cameras,
flat panel televisions and DVD recorders are
expected to continue to increase, resulting in an
anticipated increase in overall sales of the segment, despite an expected decrease in sales of
CRT televisions. Operating income is expected
to increase due to the increase in sales and the
benefit of restructuring activities undertaken in
the previous fiscal year, despite an anticipated
appreciation of the yen and an expected increase in research and development costs.
From the fiscal year ending March 31,
2005, research and development costs associated with process technologies, including
those technologies used in the Game segment,
which were previously recorded in the Game
segment, will be recorded in the Electronics
segment, due to the integration of the semiconductor businesses in the Electronics and
Game segments.
GAME
Although software production shipments are
expected to remain unchanged year on year,
production shipments of PS one and
PlayStation 2 hardware are expected to decrease compared with the previous year, resulting in a decrease in sales for the segment.
Although a portion of research and development costs will be recorded in the Electronics
segment, as described above and in “Research
and Development” below, operating income is
expected to decrease due to continued investment in products such as the PSP handheld
entertainment system and the next generation
computer entertainment system.
MUSIC
Sales are expected to decrease due to an anticipated continued contraction of the market
for music and a reduction in the unit price of
DVDs in the manufacturing division. However,
due to factors such as the benefits of restructuring activities already carried out, operating
income is expected to increase.
PICTURES
Sales are expected to decrease due to the absence of the significant television revenues in
the fiscal year ended March 31, 2004. However, operating income is expected to remain
unchanged primarily due to the contribution of
films scheduled for release during the year,
most notably Spider-Man 2.
FINANCIAL SERVICES
Although an increase in insurance-in-force is
expected at Sony Life, a decrease in insurance
revenue is expected due to a change, at Sony
Life, in the recognition method of insurance
premiums received on certain products from
being recorded as revenue to being offset
against the related provision for future insurance policy benefits. A decrease in operating
income is also expected because valuation
gains from marketable securities are not included in the forecast.
CAPITAL EXPENDITURES
In the fiscal year ending March 31, 2005,
capital expenditures (additions to fixed assets)
are expected to be 410 billion yen, an increase
of 8 percent compared with the previous year.
More than 90 percent of the amount is expected to be spent in the Electronics and Game
segments. Of this amount, capital expenditures
on semiconductors (in the Electronics and
Game segments) during the fiscal year are
expected to amount to 190 billion yen (actual
amount in the fiscal year ended March 31,
2004 was 175 billion yen). Of the capital expenditures on semiconductors, 120 billion yen
is expected to be spent for the installation of
semiconductor production equipment designed for next generation broadband microprocessors (actual amount in the fiscal year
ended March 31, 2004 was 69 billion yen). For
an explanation regarding fund procurement,
refer to “Capital Resources” above.
DEPRECIATION AND AMORTIZATION
In the fiscal year ending March 31, 2005,
expenses for depreciation and amortization,
which includes the amortization of intangible
assets and the amortization of deferred insurance acquisition costs, are expected to be 370
billion yen, an increase of 1 percent compared
with the previous year. Although expenses for
83
Page 86

the amortization of deferred insurance acquisition costs in the Financial Services segment are
expected to decrease, total expenses for depreciation and amortization in the Electronics
and Game segments are expected to increase.
RESEARCH AND DEVELOPMENT
Sony expects research and development costs
(total of expenses for the development of new
product prototypes and expenses for the development of mid- to long-term new technologies) for the fiscal year ending March 31, 2005
to be 550 billion yen, a 7 percent increase
compared with the fiscal year ended March
31, 2004. Research and development costs
associated with process technologies, including
those technologies used in the Game segment,
which were previously recorded in the Game
segment, will be recorded in the Electronics
segment from the fiscal year ending March 31,
2005, due to the integration of the semiconductor businesses in the Electronics and Game
segments. As a result, research and development costs in the Electronics segment are expected to increase more than 10 percent
compared with the 429.4 billion yen recorded
in the previous year. On the other hand, in the
Game segment, overall research and development costs are expected to decrease by only
10 percent compared to the 83.4 billion yen
recorded in the previous year. The relatively
small decrease is due to the fact that, although
research and development costs associated
with process technologies will decrease, research and development costs associated with
next generation semiconductor design, new
platforms such as the PSP and software are
expected to increase.
CRITICAL ACCOUNTING POLICIES
The preparation of the consolidated financial
statements in conformity with U.S. GAAP
requires management to make estimates and
assumptions that affect the reported amounts
of assets and liabilities, disclosure of contingent assets and liabilities at the date of the
financial statements and the reported amounts
of revenues and expenses during the reporting period. On an ongoing basis, Sony
evaluates its estimates which are based on
historical experience and on various other
assumptions that are believed to be reasonable under the circumstances. The results of
these evaluations form the basis for making
judgments about the carrying values of assets
and liabilities and the reported amounts of
expenses that are not readily apparent from
other sources. Actual results may differ from
these estimates under different assumptions.
Sony considers an accounting policy to be
critical if it is important to its financial condition and results, and requires significant
judgments and estimates on the part of
management in its application. Sony believes
that the following represent the critical
accounting policies of the company.
INVESTMENTS
Sony’s investments are comprised of debt and
equity securities accounted for under both the
cost and equity method of accounting. If it has
been determined that an investment has sustained an other-than-temporary decline in its
value, the investment is written down to its fair
value by a charge to earnings. Sony regularly
evaluates its investment portfolio to identify
other-than-temporary impairments of individual securities. Factors that are considered by
Sony in determining whether an other-thantemporary decline in value has occurred include:
the length of time and extent to which the
market value of the security has been less
than its original cost, the financial condition,
operating results, business plans and estimated
future cash flows of the issuer of the security,
other specific factors affecting the market value,
deterioration of credit condition of the issuers,
sovereign risk, and ability to retain the investment for a period of time sufficient to allow
for the anticipated recovery in market value.
In evaluating the factors for available-for-sale
securities whose fair values are readily determinable, management presumes a decline in
value to be other-than-temporary if the fair
value of the security is 20 percent or more
below its original cost for an extended period
of time (generally a period of up to six to twelve
months). This criteria is employed as a threshold
to identify securities which may have a decline
in value that is other-than-temporary. The presumption of an other-than-temporary impairment in such cases may be overcome if there is
evidence to support that the decline is tempo-
rary in nature due to the existence of other
factors which overcome the duration or magnitude of the decline. On the other hand, there
may be cases where impairment losses are
recognized when the decline in the fair value
of the security is not more than 20 percent or
such decline has not existed for an extended
period of time, as a result of considering specific
factors which may indicate the decline in the
fair value is other-than-temporary.
The assessment of whether a decline in the
value of an investment is other-than-temporary
often requires management judgment based
on evaluation of relevant factors. Those factors
include business plans and future cash flows
of the issuer of the security, the regulatory,
economic or technological environment of the
investee, and the general market condition of
either the geographic area or the industry in
which the investee operates. Accordingly, it is
possible that investments in Sony’s portfolio
that have had a decline in value that are currently believed to be temporary may determine
to be other-than-temporary in the future
based on Sony’s evaluation of additional information such as continued poor operating
results, future broad declines in value of
worldwide equity markets or circumstances in
market interest rate fluctuations. As a result,
unrealized losses recorded for investments may
be recognized into income in future periods.
IMPAIRMENT OF LONG-LIVED ASSETS
Sony reviews the carrying value of its longlived assets held and used and long-lived assets
to be disposed of whenever events or changes
in circumstances indicate that the carrying value
of the assets may not be recoverable. This
review is performed using estimates of future
cash flows by product category (e.g. TV display
CRTs) or entity (e.g. semiconductor manufacturing division in the U.S.). If the carrying value
of the asset is considered impaired, an impairment charge is recorded for the amount by
which the carrying value of the asset exceeds
its fair value. Fair value is determined using the
present value of estimated net cash flows or
comparable market values.
Management believes that the estimates of
future cash flows and fair value are reasonable;
however, changes in estimates resulting in
lower future cash flows and fair value due to
84
Page 87

unforeseen changes in business assumptions
could negatively affect the valuations of those
long-lived assets. These unforeseen changes
include a possible further decline in demand for
TV display CRTs due to a shift in demand from
CRT displays to LCD and plasma panel displays.
In the year ended March 31, 2003, Sony
recorded impairment charges for long-lived
assets totaling 12.4 billion yen. It included 8.1
billion yen for the impairment of semiconductor and computer display CRT manufacturing
equipment to be abandoned or to be sold in
connection with certain restructuring activities
in the Electronics segment. It also included 2.7
billion yen for the impairment of a CD manufacturing facility in the U.S., the fair value of
which was estimated by using methods such
as a survey of the local real estate market.
In the year ended March 31, 2004, Sony
recorded impairment charges for long-lived
assets totaling 16.1 billion yen. It included 5.3
billion yen for the impairment of long-lived
assets such as semiconductor and TV display
CRT manufacturing equipment to be abandoned or sold in connection with certain
restructuring activities in the Electronics
segment. It also included 3.0 billion yen for
the impairment of long-lived assets in Music
segment including a certain CD manufacturing facility to be abandoned or sold and a
recording studio and equipment to be held
and used in Japan. Fair value of these assets
is determined using estimated future discounted cash flows which are based on the
best information available.
GOODWILL AND OTHER INTANGIBLE ASSETS
Goodwill and other intangible assets that are
determined to have an indefinite life are not
amortized, but are tested for impairment in
accordance with FAS No. 142 on an annual
basis and between annual tests if an event
occurs or circumstances change that would
more likely than not reduce the fair value of
these assets below their carrying value. Such
an event would include unfavorable variances
from established business plans, significant
changes in forecasted results or volatility inherent to external markets and industries, which
are periodically reviewed by management.
Specifically, goodwill impairment is determined
using a two-step process. The first step of the
goodwill impairment test is used to identify
potential impairment by comparing the fair
value of a reporting unit (Sony’s operating
segments or one level below the operating
segments) with its carrying amount, including
goodwill. If the fair value of a reporting unit
exceeds its carrying amount, goodwill of the
reporting unit is considered not impaired and
the second step of the impairment test is
unnecessary. If the carrying amount of a reporting unit exceeds its fair value, the second step
of the goodwill impairment test is performed to
measure the amount of impairment loss, if any.
The second step of the goodwill impairment
test compares the implied fair value of the
reporting unit’s goodwill with the carrying
amount of that goodwill. If the carrying amount
of the reporting unit’s goodwill exceeds the
implied fair value of that goodwill, an impairment loss is recognized in an amount equal to
that excess. The implied fair value of goodwill is
determined in the same manner as the amount
of goodwill recognized in a business combination. That is, the fair value of the reporting unit
is allocated to all of the assets and liabilities of
that unit (including any unrecognized intangible
assets) as if the reporting unit had been acquired in a business combination and the fair
value of the reporting unit was the purchase
price paid to acquire the reporting unit. Other
intangible assets are tested for impairment by
comparing the fair value of the intangible asset
with its carrying value. If the carrying value of
the intangible asset exceeds its fair value, an
impairment loss is recognized in an amount
equal to that excess.
Determining the fair value of a reporting
unit under the first step of the goodwill impairment test and determining the fair value of
individual assets and liabilities of a reporting
unit (including unrecognized intangible assets)
under the second step of the goodwill impairment test is judgmental in nature and often
involves the use of significant estimates and
assumptions. Similarly, estimates and assumptions are used in determining the fair value of
other intangible assets. These estimates and
assumptions could significantly impact whether
or not an impairment charge is recognized as
well as the magnitude of any such charge. In
its impairment review, Sony performs internal
valuation analyses or utilizes third-party
valuations when management believes it to be
appropriate, and considers other market information that is publicly available. Estimates of
fair value are primarily determined using discounted cash flow analysis. This approach uses
significant estimates and assumptions including projected future cash flows, the timing of
such cash flows, discount rates reflecting the
risk inherent in future cash flows, perpetual
growth rates, determination of appropriate
market comparables and the determination of
whether a premium or discount should be
applied to comparables. During the year ended
March 31, 2004, Sony recorded a charge for
the impairment of goodwill of 6.0 billion yen
in the Electronics segment. This impairment
charge reflected the overall decline in the fair
value of a subsidiary within the Electronics
segment. The fair value of that reporting unit
was estimated principally using the expected
present value of future cash flows utilizing a
third party valuation.
Management believes that the estimates of
future cash flows and fair value are reasonable; however, changes in estimates resulting
in lower future cash flows and fair value due to
unforeseen changes in business assumptions
could negatively affect the valuations, which
may result in Sony recognizing impairment
charges for goodwill and other intangible
assets in the future. As of March 31, 2004, a
10 percent decrease in the fair value of each
of Sony’s reporting units would not have
resulted in a material impairment charge.
PENSION BENEFITS COSTS
Employee pension benefit costs and obligations
are dependent on certain assumptions including
discount rates, retirement rates and mortality
rates, which are based upon current statistical
data, as well as expected long-term rates of
return on plan assets and other factors. Specifically, the discount rate and expected long-term
rate of return on assets are two critical assumptions in the determination of periodic pension
costs and pension liabilities. Assumptions are
evaluated at least annually and when events
occur or circumstances change which could
have a significant effect on these critical assumptions. In accordance with U.S. GAAP, actual results that differ from the assumptions are
accumulated and amortized over future periods.
85
Page 88

Therefore, actual results generally affect recognized expenses and the recorded obligations for
pensions in future periods. While management
believes that the assumptions used are appropriate, differences in actual experience or
changes in assumptions may affect Sony’s pension obligations and future expense.
Sony’s principal pension plans are its Japanese pension plans. Foreign pension plans are
not significant individually with total assets
and pension obligations amounting to less
than 10 percent of those of the aggregate of
the Japanese plans.
Sony used a discount rate of 2.4 percent for
its Japanese pension plans as of March 31,
2004. The discount rate was determined by
using available information about rates of
return on high-quality fixed-income investments currently available and expected to be
available during the period to maturity of the
pension benefit obligation. The 2.4 percent
discount rate represents a 50 basis point increase from the 1.9 percent discount rate used
for year ended March 31, 2003 and reflects
current market interest rate conditions. For
Japanese plans, a 50 basis point increase in the
discount rate would decrease pension costs by
approximately 12.0 billion yen, compared to
the year ended March 31, 2004.
To determine the expected long-term rate
of return on pension plan assets, Sony considers the current and expected asset allocations,
as well as historical and expected long-term
rates of return on various categories of plan
assets. For Japanese pension plans, the expected long-term rate of return on pension
plan assets was 4.0 percent as of March 31,
2003 and 2004. The actual return on pension
plan assets for the year ended March 31, 2004
was 23.0 percent. Consistent with U.S. GAAP,
actual results that differ from the expected return on plan assets are accumulated and amortized as a component of pension expense over
the average future service period, thereby reducing the year-to-year volatility in pension expense. At March 31, 2003 and 2004, Sony had
unrecognized actuarial losses of 513.0 billion
yen and 328.5 billion yen, respectively, including losses related to plan assets. For the year
ended March 31, 2004, the unrecognized
actuarial loss decreased primarily due to the
improved performance of equity markets.
The unrecognized actuarial losses reflect the
overall unfavorable performance of equity
markets over the past several years and will
result in an increase in pension expense as they
are recognized.
Sony recorded a liability for the unfunded
accumulated benefit obligation for Japanese
pension plans of 308.7 billion yen and 149.4
billion yen as of March 31, 2003 and 2004,
respectively. This liability represents the excess
of the accumulated benefit obligation under
Sony’s qualified defined benefit pension plans
over the fair value of the plans’ assets. In
accordance with U.S. GAAP, this liability was
established by a charge to stockholders’ equity,
resulting in no impact to the accompanying
consolidated statements of income.
The following table illustrates the sensitivity
to a change in the discount rate and the expected return on pension plan assets, while
holding all other assumptions constant, for
Japanese pension plans as of March 31, 2004:
CHANGE IN ASSUMPTION
(Yen in billions) PBO Expense (Net of Tax)
25 basis point increase/decrease in discount rate . . . . . . . . . . . . . . –/+50.0 –/+6.0 +/–3.4
25 basis point increase/decrease in expected return on assets . . . . . – –/+1.0 +/–0.6
Pre-Tax Pension Equity
DEFERRED TAX ASSET VALUATION
Sony records a valuation allowance to reduce
the deferred tax assets to an amount that
management believes is more likely than not
to be realized. In establishing the appropriate
valuation allowance for deferred tax assets
(including deferred tax assets on tax loss carryforwards), all available evidence, both positive
and negative, is considered. Information on
historical results is supplemented by all currently available information on future years, as
realization of deferred tax assets is dependent
on whether each tax-filing unit generates
sufficient taxable income. The estimates and
assumptions used in determining future taxable income are consistent with those used in
Sony’s approved forecasts of future operations.
Although realization is not assured, management believes it is more likely than not that all
of the deferred tax assets, less valuation allowance, will be realized.
Sony applied to file its corporate income tax
return under the consolidated tax filing system
in Japan beginning with the fiscal year ended
March 31, 2004. Under the consolidated tax
filing system, the tax-filing unit consists of
Sony Corporation, the ultimate parent company of the Sony Group, and its fully owned
Japanese subsidiaries. The eventual realizability
of the tax benefit of its deferred tax assets is
dependent on whether the tax-filing unit generates sufficient taxable income in the future.
In addition, Sony is subject to local income taxes
in Japan, in which, the tax-filing unit, for purposes of local income taxes, is on a stand alone
entity basis. The eventual realizability of the tax
benefit of deferred tax assets for local income
taxes is dependent on whether Sony Corporation and each subsidiary generates sufficient
taxable income in future. As of March 31, 2004,
Sony Corporation had deferred tax assets for
local income taxes totaling 86.5 billion yen.
The eventual realizability of the tax benefit of
its deferred tax assets is dependent on whether
Sony Corporation generates sufficient taxable
income in the future. Management believes
that Sony Corporation’s historical results,
when evaluated in connection with relevant
qualitative factors and available information
concerning its business and industry, provided
substantial positive evidence, which outweighs
the negative evidence available. However, un-
86
Page 89

der recent conditions, management considers
that it is possible that Sony Corporation’s future results may yield sufficient negative evidence to support the conclusion that it is more
likely than not that Sony Corporation will not
realize the tax benefit of all these deferred tax
assets. If this is the case, subject to review of
relevant qualitative factors and uncertainties,
Sony may establish a valuation allowance
against part or all of the deferred tax assets of
Sony Corporation that would be charged to
income as an increase in tax expense.
As of March 31, 2004, the U.S. subsidiaries
of Sony had a valuation allowance of 81.0
billion yen against deferred tax assets for
federal and certain state taxes. Since the U.S.
subsidiaries did not have a sufficient history of
taxable income at this time to conclude that it
is more likely than not that the tax benefit from
these deferred tax assets would be realized, a
valuation allowance was established. Management believes this lack of sufficient earnings
history, when evaluated in connection with
relevant qualitative factors and uncertainties
concerning the U.S. subsidiaries’ businesses
and industries, provided substantial negative
evidence, which outweighs any positive evidence, regarding the eventual realizability of
the tax benefit of the deferred tax assets as of
March 31, 2004. However, under recent
conditions, management considers that it is
possible that the U.S. subsidiaries’ future
results may yield sufficient positive evidence to
support the conclusion that it is more likely
than not that the U.S. subsidiaries could realize
the tax benefit of these deferred tax assets and
that such a conclusion may be reached as early
as during the fiscal year ending March 31,
2005. If this is the case, subject to review of
relevant qualitative factors and uncertainties,
Sony may reverse part or all of the valuation
allowance that would be recognized into
income as a reduction to tax expense.
FILM ACCOUNTING
An aspect of film accounting that requires the
exercise of judgment relates to the process of
estimating the total revenues to be received
throughout a film’s life cycle. Such estimate of
a film’s ultimate revenue is important for two
reasons. First, while a film is being produced
and the related costs are being capitalized, it is
necessary for management to estimate the
ultimate revenue, less additional costs to be
incurred, including exploitation costs which are
expensed as incurred, in order to determine
whether the value of a film has been impaired
and thus requires an immediate write off of
unrecoverable film costs. Second, the amount
of film costs recognized as cost of sales for a
given film as it is exhibited in various markets
throughout its life cycle is based upon the
proportion that current period actual revenues
bear to the estimated ultimate total revenues.
Management bases its estimates of ultimate
revenue for each film on several factors including the historical performance of similar genre
films, the star power of the lead actors and
actresses, the expected number of theaters at
which the film will be released, anticipated
performance in the home entertainment,
television and other ancillary markets, and
agreements for future sales. Management
updates such estimates based on the actual
results to date of each film. For example, a film
that has resulted in lower than expected theatrical revenues in its initial weeks of release
would generally have its theatrical, home video
and distribution ultimate revenues adjusted
downward; a failure to do so would result in
the understatement of amortized film costs
for the period. Since the total film cost to be
amortized for a given film is fixed, the estimate
of ultimate revenues impacts only the timing
of film cost amortization.
FUTURE INSURANCE POLICY BENEFITS
Long-term liabilities for future policy benefits
are established in amounts adequate to meet
the estimated future obligations of policies in
force. These liabilities are computed by the net
level premium method based upon estimates
as to future investment yield, mortality, morbidity, withdrawals and other factors. Future
policy benefits are computed using interest
rates ranging from approximately 1.00 percent
to 5.50 percent. Mortality, morbidity and withdrawal assumptions for all policies are based
on either the life insurance subsidiary’s own
experience or various actuarial tables. Generally
these assumptions are “locked-in” upon the
issuance of new insurance. While management
believes that the assumptions used are appropriate, differences in actual experience or
changes in assumptions may affect Sony’s
future insurance policy benefits.
For a summary of Sony’s significant accounting policies, including the critical accounting
policies discussed above, please see Note 2 of
Notes to the Consolidated Financial Statements.
RECENTLY ADOPTED ACCOUNTING
STANDARDS
EMPLOYERS’ DISCLOSURES ABOUT PENSIONS
AND OTHER POSTRETIREMENT BENEFITS
In December 2003, the FASB revised Statement
of Financial Accounting Standards (“FAS”)
No. 132, “Employers’ Disclosures about Pensions
and Other Postretirement Benefits”, an amendment of FAS No. 87, “Employers’ Accounting
for Pensions”, FAS No. 88, “Employers’
Accounting for Settlements and Curtailments of
Defined Benefit Pension Plans and for Termination Benefits”, and FAS No. 106, “Employers’
Accounting for Postretirement Benefits Other
Than Pensions”. The new FAS No. 132 revised
employers’ disclosures about pension plans and
other postretirement benefit plans. It did not
change the measurement or recognition of
those plans required by FAS No. 87, 88 and
106. While retaining the disclosure requirements of FAS No. 132, the new FAS No. 132
requires additional disclosures about assets,
obligations, cash flows, and net periodic benefit
costs of defined benefit plans and other defined
benefit postretirement plans. The provisions of
the new FAS No. 132 are generally effective for
financial statements with fiscal years ending
after December 15, 2003, excluding the disclosure of certain information about foreign plans,
which shall be effective for fiscal years ending
after June 15, 2004. In accordance with the
transition provisions of the new FAS No. 132,
the disclosure provisions have been adopted in
the consolidated financial statements.
87
Page 90

CONSOLIDATION OF VARIABLE INTEREST ENTITIES
In January 2003, the FASB issued FIN No. 46,
“Consolidation of Variable Interest Entities – an
Interpretation of ARB No. 51”, which addresses
consolidation by a primary beneficiary of a VIE.
FIN No. 46 became effective immediately for all
new VIEs created or acquired after January 31,
2003. Sony has not entered into any new
agreements with VIEs on or after February 1,
2003. For VIEs created or acquired prior to
February 1, 2003, Sony early adopted the provisions of FIN No. 46 on July 1, 2003. Under FIN
No. 46, any difference between the net amount
added to the balance sheet and the amount of
any previously recognized interest in the VIE
shall be recognized as a cumulative effect of
accounting changes. As a result of adopting FIN
No. 46, Sony recognized a one-time charge
with no tax effect of 2.1 billion yen as a cumulative effect of accounting change in the consolidated statement of income, and Sony’s
assets and liabilities increased by 95.3 billion
yen and 98.0 billion yen, respectively. These
increases were treated as non-cash transactions
in the consolidated statements of cash flows. In
addition, cash and cash equivalents increased
by 1.5 billion yen. See Consolidated Financial
Statements Note 22 for further discussion on
the VIEs that are used by Sony.
In December 2003, the FASB issued a revision to FIN No. 46 (“FIN No. 46R”), which
replaces FIN No. 46. FIN No. 46R retains many
of the basic concepts introduced in FIN No. 46;
however, it also introduces a new scope exception for certain types of entities that qualify as
a “business” as defined in FIN No. 46R, revises
the method of calculating expected losses and
residual returns for determination of a primary
beneficiary, and includes new guidance for assessing variable interests. Sony early adopted
the provisions of FIN No. 46R upon its issuance. The adoption of FIN No. 46R did not
have an impact on Sony’s results of operations
and financial position or impact the way Sony
had previously accounted for VIEs.
IMPAIRMENT OF SECURITIES INVESTMENTS
In November 2003, the Emerging Issues Task
Force (“EITF”) reached a consensus on EITF
Issue No. 03-01, “The Meaning of Other-ThanTemporary Impairment and Its Application to
Certain Investments”. EITF Issue No. 03-01
establishes additional disclosure requirements
for each category of FAS No. 115 investments
in a loss position. In March 2004, the EITF also
reached a consensus on the additional accounting guidance for other-than-temporary
impairments and its application to debt and
equity investments. In accordance with the
new disclosure requirements under EITF Issue
No. 03-01, the disclosure in the consolidated
financial statements has been expanded to
include certain additional information regarding Sony’s securities investments.
MULTIPLE ELEMENT REVENUE ARRANGEMENTS
In November 2002, the FASB issued EITF Issue
No. 00-21, “Accounting for Revenue Arrangements with Multiple Deliverables”. EITF Issue
No. 00-21 provides guidance on when and how
to account for arrangements that involve the
delivery or performance of multiple products,
services and/or rights to use assets. Sony
adopted EITF Issue No. 00-21 on July 1, 2003.
The adoption of EITF Issue No. 00-21 did not
have a material impact on Sony’s results of
operations and financial position for the year
ended March 31, 2004.
DERIVATIVE INSTRUMENTS AND HEDGING
ACTIVITIES
In April 2003, the FASB issued FAS No. 149,
“Amendment of Statement 133 on Derivative
Instruments and Hedging Activities”. This statement amends and clarifies financial accounting
and reporting for derivative instruments, including derivative instruments embedded in
other contracts and for hedging activities
under FAS No. 133. Sony adopted FAS No. 149
on July 1, 2003. The adoption of FAS No. 149
did not have an impact on Sony’s results of
operations and financial position.
ACCOUNTING FOR ASSET RETIREMENT
OBLIGATIONS
On April 1, 2003, Sony adopted FAS No. 143,
“Accounting for Asset Retirement Obligations”,
which addresses financial accounting and
reporting for obligations associated with the
retirement of tangible long-lived assets and the
associated asset retirement costs. The adoption
of FAS No. 143 did not have a material impact
on Sony’s results of operations and financial
position for the year ended March 31, 2004.
ACCOUNTING FOR CERTAIN FINANCIAL
INSTRUMENTS WITH CHARACTERISTICS OF
BOTH LIABILITIES AND EQUITY
In May 2003, the FASB issued FAS No. 150,
“Accounting for Certain Financial Instruments
with Characteristics of both Liabilities and
Equity”. FAS No. 150 establishes standards for
how certain financial instruments with characteristics of both liabilities and equity shall be
classified and measured. Sony adopted FAS
No. 150 during the first quarter of the year
ended March 31, 2004. The adoption of FAS
No. 150 did not have an impact on Sony’s
results of operations and financial position for
the year ended March 31, 2004.
RECENT PRONOUNCEMENTS
ACCOUNTING AND REPORTING BY INSURANCE
ENTERPRISES FOR CERTAIN NONTRADITIONAL
LONG-DURATION CONTRACTS AND FOR
SEPARATE ACCOUNTS
In July 2003, the Accounting Standards Executive Committee of the American Institute of
Certified Public Accountants issued Statement
of Position (“SOP”) 03-1, “Accounting and
Reporting by Insurance Enterprises for Certain
Nontraditional Long-Duration Contracts and
for Separate accounts”. SOP 03-1 provides
guidance on accounting and reporting by
insurance enterprises for certain nontraditional
long-duration contracts and for separate
accounts. This statement shall be effective for
fiscal years beginning after December 15,
2003. Sony is currently evaluating the impact
of adopting this guidance.
88
Page 91

Five-Year Summary of Selected Financial Data
Sony Corporation and Consolidated Subsidiaries – Year ended March 31
Dollars in
Yen in millions per share
except per share amounts amounts
2000 2001 2002 2003 2004 2004
FOR THE YEAR
Sales and operating revenue . . . . . . . . . . . . . . . . . . . . . . ¥6,686,661 ¥7,314,824 ¥7,578,258 ¥7,473,633 ¥7,496,391 $72,081
Operating income. . . . . . . . . . . . . . . . . . . . . . . . . . . . . . 223,204 225,346 134,631 185,440 98,902 951
Income before income taxes . . . . . . . . . . . . . . . . . . . . . . 264,310 265,868 92,775 247,621 144,067 1,385
Income taxes . . . . . . . . . . . . . . . . . . . . . . . . . . . . . . . . . 94,644 115,534 65,211 80,831 52,774 507
Income before cumulative effect of accounting changes . . 121,835 121,227 9,332 115,519 90,628 871
Net income. . . . . . . . . . . . . . . . . . . . . . . . . . . . . . . . . . . 121,835 16,754 15,310 115,519 88,511 851
Per share data:
Common stock
Income before cumulative effect of accounting changes
—Basic . . . . . . . . . . . . . . . . . . . . . . . . . . . . . . . . ¥ 144.58 ¥ 132.64 ¥ 10.21 ¥ 125.74 ¥ 98.26 $ 0.94
—Diluted . . . . . . . . . . . . . . . . . . . . . . . . . . . . . . . 131.70 124.36 10.18 118.21 93.00 0.89
Net income
—Basic . . . . . . . . . . . . . . . . . . . . . . . . . . . . . . . . 144.58 18.33 16.72 125.74 95.97 0.92
—Diluted . . . . . . . . . . . . . . . . . . . . . . . . . . . . . . . 131.70 19.28 16.67 118.21 90.88 0.87
Cash dividends . . . . . . . . . . . . . . . . . . . . . . . . . . . . 25.00 25.00 25.00 25.00 25.00 0.24
Number of weighted-average shares for basic
per share data (thousands of shares) . . . . . . . . . . . 842,679 913,932 918,462 919,706 923,650
Subsidiary tracking stock
Net loss
—Basic . . . . . . . . . . . . . . . . . . . . . . . . . . . . . . . . – – (15.87) (41.98) (41.80) (0.40)
Cash dividends . . . . . . . . . . . . . . . . . . . . . . . . . . . . – – – – ––
Number of weighted-average shares for basic
per share data (thousands of shares) . . . . . . . . . . . – – 3,072 3,072 3,072
millions except
Depreciation and amortization* . . . . . . . . . . . . . . . . . . . ¥ 306,505 ¥ 348,268 ¥ 354,135 ¥ 351,925 ¥ 366,269 $ 3,522
Capital expenditures (additions to property, plant
and equipment) . . . . . . . . . . . . . . . . . . . . . . . . . . . . . . 435,887 465,209 326,734 261,241 378,264 3,637
Research and development expenses . . . . . . . . . . . . . . . 394,479 416,708 433,214 443,128 514,483 4,947
AT YEAR-END
Net working capital . . . . . . . . . . . . . . . . . . . . . . . . . . . . ¥ 861,674 ¥ 830,734 ¥ 778,716 ¥ 719,166 ¥ 381,140 $ 3,665
Stockholders’ equity . . . . . . . . . . . . . . . . . . . . . . . . . . . . 2,182,906 2,315,453 2,370,410 2,280,895 2,378,002 22,865
Stockholders’ equity per share attributable to
common stock . . . . . . . . . . . . . . . . . . . . . . . . . . . . . . . ¥ 2,409.36 ¥ 2,521.19 ¥ 2,570.31 ¥ 2,466.81 ¥ 2,563.67 $ 24.65
Total assets. . . . . . . . . . . . . . . . . . . . . . . . . . . . . . . . . . . ¥6,807,197 ¥7,827,966 ¥8,185,795 ¥8,370,545 ¥9,090,662 $87,410
Number of shares issued at year-end (thousands of shares):
Common stock . . . . . . . . . . . . . . . . . . . . . . . . . . . . . . 453,639 919,617 919,744 922,385 926,418
Subsidiary tracking stock . . . . . . . . . . . . . . . . . . . . . . . – – 3,072 3,072 3,072
* Including amortization expenses for intangible assets and for deferred insurance acquisition costs.
89
Page 92

Notes: 1. U.S. dollar amounts have been translated from yen, for convenience only, at the rate of ¥104=U.S.$1, the approximate Tokyo foreign exchange market rate as of March 31, 2004.
2. Per share data for the year ended March 31, 2000 have been adjusted to reflect the two-for-one stock split that has completed on May 19, 2000. However, no adjustment to reflect such
stock split has been made to the number of shares issued at year-end.
3. In January 2003, the FASB issued FIN No. 46, “Consolidation of Variable Interest Entities — an Interpretation of ARB No. 51”. FIN No. 46 addresses consolidation by a primary beneficiary
of a VIE. For VIEs created or acquired prior to February 1, 2003, Sony early adopted the provisions of FIN No. 46 on July 1, 2003. Under FIN No. 46, any difference between the net
amount added to the balance sheet and the amount of any previously recognized interest in the VIE shall be recognized as a cumulative effect of accounting changes. As a result of
adopting the original FIN No. 46, Sony recognized a one-time charge with no tax effect of ¥2,117 million ($20 million) as a cumulative effect of accounting change in the consolidated
statement of income, and Sony’s assets and liabilities increased by ¥95,255 million ($916 million) and ¥97,950 million ($942 million), respectively. These increases were treated as noncash transactions in the consolidated statement of cash flows. In addition, cash and cash equivalents increased by ¥1,521 million ($15 million). In December 2003, the FASB issued FIN
No. 46R, which replaces FIN No. 46. Sony early adopted the provisions of FIN No. 46R upon its issuance. The adoption of FIN No. 46R did not have an impact on Sony’s results of
operations and financial position or impact the way Sony had previously accounted for VIEs.
4. In November 2002, the FASB issued EITF Issue No. 00-21, “Accounting for Revenue Arrangements with Multiple Deliverables”. Sony adopted EITF Issue No. 00-21 on July 1, 2003. The
adoption of EITF Issue No. 00-21 did not have a material impact on Sony’s results of operations and financial position for the year ended March 31, 2004.
5. In May 2003, the FASB issued Statement of FAS No. 150, “Accounting for Certain Financial Instruments with Characteristics of both Liabilities and Equity”. Sony adopted FAS No. 150 on
April 1, 2003. The adoption of FAS No. 150 did not have an impact on Sony’s results of operations and financial position for the year ended March 31, 2004.
6. In June 2002, the FASB issued FAS No. 146, “Accounting for Costs Associated with Exit or Disposal Activities” which nullifies EITF Issue No.94-3, “Liability Recognition for Certain
Employee Termination Benefits and Other Costs to Exit an activity (including Certain Costs Incurred in a Restructuring)”. Sony adopted FAS No. 146 on January 1, 2003. The adoption of
this statement did not have a material effect on Sony’s results of operations and financial position.
7. On April 1, 2001, Sony adopted FAS No. 133, “Accounting for Derivative Instruments and Hedging Activities” as amended by FAS No.138, “Accounting for Certain Derivative
Instruments and Certain Hedging Activities — an Amendment of FASB statement No.133”. As a result, Sony’s operating income, income before income taxes and net income for the year
ended March 31, 2002 decreased by ¥3.0 billion, ¥3.4 billion and ¥2.2 billion, respectively. Additionally, Sony recorded a one-time non-cash after-tax unrealized gain of ¥1.1 billion in
accumulated other comprehensive income in the consolidated balance sheet, as well as an after-tax gain of ¥6.0 billion in the cumulative effect of accounting changes in the consolidated
statement of income. In April 2003, the FASB issued FAS No. 149, “Amendment of Statement 133 on Derivative Instruments and Hedging Activities”. Sony adopted FAS No. 149 on July
1, 2003. The adoption of FAS No. 149 did not have an impact on Sony’s results of operations and financial position.
8. In July 2001, the FASB issued FAS No. 142, “Goodwill and Other Intangible Assets”. Sony adopted FAS No. 142 retroactive to April 1, 2001. As a result, Sony’s operating income and
income before income taxes for the year ended March 31, 2002 increased by ¥20.1 billion and income before cumulative effect of accounting changes as well as net income for the year
ended March 31, 2002 increased by ¥18.9 billion.
9. In June 2000, the Accounting Standards Executive Committee of the American Institute of Certified Public Accountants issued Statement of Position (“SOP”) 00-2, “Accounting by
Producers or Distributors of Films”. Sony adopted SOP 00-2 retroactive to April 1, 2000. As a result, Sony’s net income for the year ended March 31, 2001 included a one-time, non-cash
charge with no tax effect of ¥101.7 billion, primarily to reduce the carrying value of its film inventory.
10. In December 1999, the Securities and Exchange Commission issued Staff Accounting Bulletin (“SAB”) No. 101, “Revenue Recognition in Financial Statements”. Sony adopted SAB No. 101
in the fourth quarter ended March 31, 2001 retroactive to April 1, 2000. As a result, a one-time no-cash cumulative effect adjustment of ¥2.8 billion was recorded in the income
statement directly above the caption of “net income” for a change in accounting principle. In December 2003, SAB No. 101 was amended by SAB No. 104, “Revenue Recognition”.
The amendment did not have an impact on Sony’s results of operations and financial position.
90
Page 93

Quarterly Financial and Stock Information
Sony Corporation and Consolidated Subsidiaries – Year ended March 31
(Unaudited)
Yen in billions except per share amounts
1st Quarter 2nd Quarter 3rd Quarter 4th Quarter
2003 2004 2003 2004 2003 2004 2003 2004
Sales and operating revenue . . . . . . . . . . . . . ¥1,721.8 ¥1,603.8 ¥1,789.7 ¥1,797.0 ¥2,307.7 ¥2,323.4 ¥1,654.4 ¥1,772.2
Operating income (loss) . . . . . . . . . . . . . . . . 51.9 16.7 50.5 33.2 199.5 158.8 (116.5) (109.8)
Income (loss) before income taxes . . . . . . . . 116.6 35.8 48.8 44.1 201.9 157.8 (119.7) (93.6)
Income taxes . . . . . . . . . . . . . . . . . . . . . . . . 53.6 25.4 (14.9) 10.3 65.5 67.6 (23.4) (50.5)
Income (loss) before cumulative effect of
accounting changes . . . . . . . . . . . . . . . . . . 57.2 1.1 44.1 35.0 125.4 92.6 (111.1) (38.2)
Net income (loss) . . . . . . . . . . . . . . . . . . . . . 57.2 1.1 44.1 32.9 125.4 92.6 (111.1) (38.2)
Per share data of common stock
Income (loss) before cumulative effect of accounting changes
—Basic . . . . . . . . . . . . . . . . . . . . . . . . . ¥ 62.23 ¥ 1.24 ¥ 47.89 ¥ 37.99 ¥ 136.19 ¥ 100.16 ¥(120.47) ¥
—Diluted . . . . . . . . . . . . . . . . . . . . . . . 57.90 1.24 44.70 35.60 126.05 93.14 (120.47) (41.23)
Net income (loss) . . . . . . . . . . . . . . . . . . .
—Basic . . . . . . . . . . . . . . . . . . . . . . . . . 62.23 1.24 47.89 35.69 136.19 100.16 (120.47) (41.23)
—Diluted . . . . . . . . . . . . . . . . . . . . . . . 57.90 1.24 44.70 33.48 126.05 93.14 (120.47) (41.23)
Depreciation and amortization*. . . . . . . . . . . ¥ 83.3 ¥ 84.3 ¥ 83.7 ¥ 87.4 ¥ 88.7 ¥ 95.2 ¥ 96.2 ¥ 99.3
Capital expenditures
(additions to fixed assets) . . . . . . . . . . . . . . 60.7 81.0 67.0 90.0 56.9 97.6 76.6 109.6
R&D expenses. . . . . . . . . . . . . . . . . . . . . . . . 97.9 114.2 108.3 136.2 105.6 123.8 131.4 140.4
Tokyo Stock Exchange price per share of common stock**:
High . . . . . . . . . . . . . . . . . . . . . . . . . . . . . ¥ 7,450 ¥ 4,190 ¥ 6,300 ¥ 4,410 ¥ 5,540 ¥ 4,200 ¥ 5,110 ¥ 4,660
Low . . . . . . . . . . . . . . . . . . . . . . . . . . . . . 5,810 2,720 4,850 3,430 4,870 3,520 4,080 3,780
New York Stock Exchange price per American Depositary Share**:
High . . . . . . . . . . . . . . . . . . . . . . . . . . . . . $ 59.70 $ 35.51 $ 53.17 $ 38.30 $ 45.29 $ 37.96 $ 43.31 $ 42.36
Low . . . . . . . . . . . . . . . . . . . . . . . . . . . . . 48.63 23.92 40.51 29.23 39.88 32.59 34.86 34.98
* Including amortization expenses for intangible assets and for deferred insurance acquisition costs.
** Stock price data are based on daily closing prices.
(41.23)
Notes: 1. U.S. dollar amounts have been translated from yen, for convenience only, at the rate of ¥104=U.S.$1, the approximate Tokyo foreign exchange market rate as of March 31, 2004.
2. In January 2003, the FASB issued FIN No. 46, “Consolidation of Variable Interest Entities — an Interpretation of ARB No. 51”. FIN No. 46 addresses consolidation by a primary beneficiary
of a VIE. For VIEs created or acquired prior to February 1, 2003, Sony early adopted the provisions of FIN No. 46 on July 1, 2003. Under FIN No. 46, any difference between the net
amount added to the balance sheet and the amount of any previously recognized interest in the VIE shall be recognized as a cumulative effect of accounting changes. As a result of
adopting the original FIN No. 46, Sony recognized a one-time charge with no tax effect of ¥2,117 million ($20 million) as a cumulative effect of accounting change in the consolidated
statement of income, and Sony’s assets and liabilities increased by ¥95,255 million ($916 million) and ¥97,950 million ($942 million), respectively. These increases were treated as noncash transactions in the consolidated statement of cash flows. In addition, cash and cash equivalents increased by ¥1,521 million ($15 million). In December 2003, the FASB issued FIN
No. 46R, which replaces FIN No. 46. Sony early adopted the provisions of FIN No. 46R upon its issuance. The adoption of FIN No. 46R did not have an impact on Sony’s results of
operations and financial position or impact the way Sony had previously accounted for VIEs.
3. In November 2002, the FASB issued EITF Issue No. 00-21, “Accounting for Revenue Arrangements with Multiple Deliverables”. Sony adopted EITF Issue No. 00-21 on July 1, 2003. The
adoption of EITF Issue No. 00-21 did not have a material impact on Sony’s results of operations and financial position for the year ended March 31, 2004.
4. In May 2003, the FASB issued Statement of FAS No. 150, “Accounting for Certain Financial Instruments with Characteristics of both Liabilities and Equity”. Sony adopted FAS No. 150 on
April 1, 2003. The adoption of FAS No. 150 did not have an impact on Sony’s results of operations and financial position for the year ended March 31, 2004.
5. In June 2002, the FASB issued FAS No. 146, “Accounting for Costs Associated with Exit or Disposal Activities” which nullifies EITF Issue No.94-3, “Liability Recognition for Certain
Employee Termination Benefits and Other Costs to Exit an activity (including Certain Costs Incurred in a Restructuring)”. Sony adopted FAS No. 146 on January 1, 2003. The adoption of
this statement did not have a material effect on Sony’s results of operations and financial position.
6. In April 2003, the FASB issued FAS No. 149, “Amendment of Statement 133 on Derivative Instruments and Hedging Activities”. Sony adopted FAS No. 149 on July 1, 2003. The adoption
of FAS No. 149 did not have an impact on Sony’s results of operations and financial position.
91
Page 94

Segment Information
Sony Corporation and Consolidated Subsidiaries – Year ended March 31
Sales and Operating Revenue by Business Segment
Yen in millions millions*
Year ended March 31 March 31
2002 2003 2004 2004
Electronics—
Customers . . . . . . . . . . . . . . . . . . . . . . . . . . . . . . . . . . . . . . . . . . . . . . . . . . ¥4,772,550 ¥4,543,313 ¥4,758,400 $45,754
Intersegment . . . . . . . . . . . . . . . . . . . . . . . . . . . . . . . . . . . . . . . . . . . . . . . . 513,631 397,137 138,995 1,336
Total . . . . . . . . . . . . . . . . . . . . . . . . . . . . . . . . . . . . . . . . . . . . . . . . . . . . . 5,286,181 4,940,450 4,897,395 47,090
Game—
Customers . . . . . . . . . . . . . . . . . . . . . . . . . . . . . . . . . . . . . . . . . . . . . . . . . . 986,529 936,274 753,732 7,247
Intersegment . . . . . . . . . . . . . . . . . . . . . . . . . . . . . . . . . . . . . . . . . . . . . . . . 17,185 18,757 26,488 255
Total . . . . . . . . . . . . . . . . . . . . . . . . . . . . . . . . . . . . . . . . . . . . . . . . . . . . . 1,003,714 955,031 780,220 7,502
Music—
Customers . . . . . . . . . . . . . . . . . . . . . . . . . . . . . . . . . . . . . . . . . . . . . . . . . . 541,418 512,908 487,457 4,687
Intersegment . . . . . . . . . . . . . . . . . . . . . . . . . . . . . . . . . . . . . . . . . . . . . . . . 58,633 84,598 72,431 697
Total . . . . . . . . . . . . . . . . . . . . . . . . . . . . . . . . . . . . . . . . . . . . . . . . . . . . . 600,051 597,506 559,888 5,384
Pictures—
Customers . . . . . . . . . . . . . . . . . . . . . . . . . . . . . . . . . . . . . . . . . . . . . . . . . . 635,841 802,770 756,370 7,273
Intersegment . . . . . . . . . . . . . . . . . . . . . . . . . . . . . . . . . . . . . . . . . . . . . . . . 0 0 00
Total . . . . . . . . . . . . . . . . . . . . . . . . . . . . . . . . . . . . . . . . . . . . . . . . . . . . . 635,841 802,770 756,370 7,273
Financial Services—
Customers . . . . . . . . . . . . . . . . . . . . . . . . . . . . . . . . . . . . . . . . . . . . . . . . . . 480,190 509,398 565,752 5,440
Intersegment . . . . . . . . . . . . . . . . . . . . . . . . . . . . . . . . . . . . . . . . . . . . . . . . 28,932 27,878 27,792 267
Total . . . . . . . . . . . . . . . . . . . . . . . . . . . . . . . . . . . . . . . . . . . . . . . . . . . . . 509,122 537,276 593,544 5,707
Other—
Customers . . . . . . . . . . . . . . . . . . . . . . . . . . . . . . . . . . . . . . . . . . . . . . . . . . 161,730 168,970 174,680 1,680
Intersegment . . . . . . . . . . . . . . . . . . . . . . . . . . . . . . . . . . . . . . . . . . . . . . . . 99,733 137,323 155,712 1,497
Total . . . . . . . . . . . . . . . . . . . . . . . . . . . . . . . . . . . . . . . . . . . . . . . . . . . . . 261,463 306,293 330,392 3,177
Elimination . . . . . . . . . . . . . . . . . . . . . . . . . . . . . . . . . . . . . . . . . . . . . . . . . . . . (718,114) (665,693) (421,418) (4,052)
Consolidated total . . . . . . . . . . . . . . . . . . . . . . . . . . . . . . . . . . . . . . . . . . . . . . ¥7,578,258 ¥7,473,633 ¥7,496,391 $72,081
* U.S. dollar amounts have been translated from yen, for convenience only, at the rate of ¥104=U.S.$1, the approximate Tokyo foreign exchange market rate as of March 31, 2004.
Electronics intersegment amounts primarily consist of transactions with the Game business.
Music intersegment amounts primarily consist of transactions with the Game and Pictures businesses.
Other intersegment amounts primarily consist of transactions with the Electronics business.
Dollars in
Year ended
92
Page 95

Electronics Sales and Operating Revenue to Customers by Product Category
Yen in millions millions*
Year ended March 31 March 31
2002 2003 2004 2004
Dollars in
Year ended
Audio . . . . . . . . . . . . . . . . . . . . . . . . . . . . . . . . . . . . . . . . . . . . . . . . . . . . . . . . ¥ 747,469¥ 682,517 ¥ 623,582 $ 5,996
15.7% 15.0% 13.1%
Video . . . . . . . . . . . . . . . . . . . . . . . . . . . . . . . . . . . . . . . . . . . . . . . . . . . . . . . . 847,311 851,064 948,111 9,116
17.8 18.8 19.9
Televisions . . . . . . . . . . . . . . . . . . . . . . . . . . . . . . . . . . . . . . . . . . . . . . . . . . . . 984,290 950,166 917,207 8,819
20.6 20.9 19.3
Information and Communications . . . . . . . . . . . . . . . . . . . . . . . . . . . . . . . . . . 998,773 836,724 834,757 8,027
20.9 18.4 17.6
Semiconductors . . . . . . . . . . . . . . . . . . . . . . . . . . . . . . . . . . . . . . . . . . . . . . . . 182,276 204,710 253,237 2,435
3.8 4.5 5.3
Components . . . . . . . . . . . . . . . . . . . . . . . . . . . . . . . . . . . . . . . . . . . . . . . . . . 511,579 527,782 623,799 5,998
10.7 11.6 13.1
Other . . . . . . . . . . . . . . . . . . . . . . . . . . . . . . . . . . . . . . . . . . . . . . . . . . . . . . . . 500,852 490,350 557,707 5,363
10.5 10.8 11.7
Total. . . . . . . . . . . . . . . . . . . . . . . . . . . . . . . . . . . . . . . . . . . . . . . . . . . . . . . . . ¥4,772,550 ¥4,543,313 ¥4,758,400 $45,754
* U.S. dollar amounts have been translated from yen, for convenience only, at the rate of ¥104=U.S.$1, the approximate Tokyo foreign exchange market rate as of March 31, 2004.
Note: The above table is a breakdown of Electronics sales and operating revenue and operating income (loss) in Sony’s business segment information. The Electronics segment is managed as a single operating
segment by Sony’s management. However, Sony believes that the information in this table is useful to investors in understanding the product categories in this business segment. In addition, commencing with the year ended March 30, 2004, Sony has partly realigned its product category configuration in the Electronics segment. The primary changes are LCD televisions and Computer displays
(transferred from “Information and Communication” to “Televisions”), and Set-top boxes (transferred from “Televisions” to “Video”). Accordingly, results of the previous years have been reclassified.
Profit or Loss by Business Segment
Yen in millions millions*
Year ended March 31 March 31
2002 2003 2004 2004
Dollars in
Year ended
Operating income (loss):
Electronics . . . . . . . . . . . . . . . . . . . . . . . . . . . . . . . . . . . . . . . . . . . . . . . . . . ¥ (1,158) ¥ 41,380 ¥ (35,298) $ (339)
Game . . . . . . . . . . . . . . . . . . . . . . . . . . . . . . . . . . . . . . . . . . . . . . . . . . . . . . 82,915 112,653 67,578 650
Music . . . . . . . . . . . . . . . . . . . . . . . . . . . . . . . . . . . . . . . . . . . . . . . . . . . . . . 22,132 (7,867) 18,995 182
Pictures . . . . . . . . . . . . . . . . . . . . . . . . . . . . . . . . . . . . . . . . . . . . . . . . . . . . . 31,266 58,971 35,230 339
Financial Services . . . . . . . . . . . . . . . . . . . . . . . . . . . . . . . . . . . . . . . . . . . . . 21,822 22,758 55,161 530
Other . . . . . . . . . . . . . . . . . . . . . . . . . . . . . . . . . . . . . . . . . . . . . . . . . . . . . . (18,249) (24,983) (10,030) (96)
Total . . . . . . . . . . . . . . . . . . . . . . . . . . . . . . . . . . . . . . . . . . . . . . . . . . . 138,728 202,912 131,636 1,266
Elimination . . . . . . . . . . . . . . . . . . . . . . . . . . . . . . . . . . . . . . . . . . . . . . . . . . 17,148 15,897 14,530 140
Unallocated amounts:
Corporate expenses. . . . . . . . . . . . . . . . . . . . . . . . . . . . . . . . . . . . . . . . . . (21,245) (33,369) (47,264) (455)
Consolidated operating income . . . . . . . . . . . . . . . . . . . . . . . . . . . . . . . . . . . . 134,631 185,440 98,902 951
Other income . . . . . . . . . . . . . . . . . . . . . . . . . . . . . . . . . . . . . . . . . . . . . . . . . . 96,328 157,528 122,290 1,176
Other expenses. . . . . . . . . . . . . . . . . . . . . . . . . . . . . . . . . . . . . . . . . . . . . . . . . (138,184) (95,347) (77,125) (742)
Consolidated income before income taxes . . . . . . . . . . . . . . . . . . . . . . . . . . . . ¥ 92,775 ¥247,621 ¥144,067 $1,385
* U.S. dollar amounts have been translated from yen, for convenience only, at the rate of ¥104=U.S.$1, the approximate Tokyo foreign exchange market rate as of March 31, 2004.
93
Page 96

Other Significant Items by Business Segment
Yen in millions millions*
Year ended March 31 March 31
2002 2003 2004 2004
Dollars in
Year ended
Depreciation and amortization:
Electronics . . . . . . . . . . . . . . . . . . . . . . . . . . . . . . . . . . . . . . . . . . . . . . . . . . . ¥211,910 ¥190,836 ¥196,185 $1,886
Game . . . . . . . . . . . . . . . . . . . . . . . . . . . . . . . . . . . . . . . . . . . . . . . . . . . . . . . 49,655 53,496 57,256 551
Music . . . . . . . . . . . . . . . . . . . . . . . . . . . . . . . . . . . . . . . . . . . . . . . . . . . . . . . 33,388 32,605 30,826 296
Pictures . . . . . . . . . . . . . . . . . . . . . . . . . . . . . . . . . . . . . . . . . . . . . . . . . . . . . . 10,619 8,552 7,844 76
Financial Services, including deferred insurance acquisition costs . . . . . . . . . . . 37,227 52,041 56,586 544
Other . . . . . . . . . . . . . . . . . . . . . . . . . . . . . . . . . . . . . . . . . . . . . . . . . . . . . . . 8,015 10,157 13,455 129
Total . . . . . . . . . . . . . . . . . . . . . . . . . . . . . . . . . . . . . . . . . . . . . . . . . . . . 350,814 347,687 362,152 3,482
Corporate . . . . . . . . . . . . . . . . . . . . . . . . . . . . . . . . . . . . . . . . . . . . . . . . . . . . 3,321 4,238 4,117 40
Consolidated total . . . . . . . . . . . . . . . . . . . . . . . . . . . . . . . . . . . . . . . . . . . . . . . . ¥354,135 ¥351,925 ¥366,269 $3,522
Capital expenditures for segment assets:
Electronics . . . . . . . . . . . . . . . . . . . . . . . . . . . . . . . . . . . . . . . . . . . . . . . . . . . ¥220,032 ¥170,323 ¥242,696 $2,334
Game . . . . . . . . . . . . . . . . . . . . . . . . . . . . . . . . . . . . . . . . . . . . . . . . . . . . . . . 47,822 40,986 100,360 965
Music . . . . . . . . . . . . . . . . . . . . . . . . . . . . . . . . . . . . . . . . . . . . . . . . . . . . . . . 20,882 20,284 12,935 124
Pictures . . . . . . . . . . . . . . . . . . . . . . . . . . . . . . . . . . . . . . . . . . . . . . . . . . . . . . 11,501 7,138 6,013 58
Financial Services . . . . . . . . . . . . . . . . . . . . . . . . . . . . . . . . . . . . . . . . . . . . . . . 16,023 3,655 4,618 44
Other . . . . . . . . . . . . . . . . . . . . . . . . . . . . . . . . . . . . . . . . . . . . . . . . . . . . . . . 5,861 16,993 10,124 97
Total . . . . . . . . . . . . . . . . . . . . . . . . . . . . . . . . . . . . . . . . . . . . . . . . . . . . 322,121 259,379 376,746 3,622
Corporate . . . . . . . . . . . . . . . . . . . . . . . . . . . . . . . . . . . . . . . . . . . . . . . . . . . 4,613 1,862 1,518 15
Consolidated total . . . . . . . . . . . . . . . . . . . . . . . . . . . . . . . . . . . . . . . . . . . . . . . . ¥326,734 ¥261,241 ¥378,264 $3,637
* U.S. dollar amounts have been translated from yen, for convenience only, at the rate of ¥104=U.S.$1, the approximate Tokyo foreign exchange market rate as of March 31, 2004.
94
Page 97

Assets by Business Segment
Yen in millions millions*
March 31 March 31
2002 2003 2004 2004
Dollars in
Total assets:
Electronics . . . . . . . . . . . . . . . . . . . . . . . . . . . . . . . . . . . . . . . . . . . . . . . . . . ¥3,089,791 ¥2,848,492 ¥2,876,490 $27,658
Game . . . . . . . . . . . . . . . . . . . . . . . . . . . . . . . . . . . . . . . . . . . . . . . . . . . . . . 722,021 673,208 684,226 6,579
Music . . . . . . . . . . . . . . . . . . . . . . . . . . . . . . . . . . . . . . . . . . . . . . . . . . . . . . 675,186 604,311 575,276 5,531
Pictures . . . . . . . . . . . . . . . . . . . . . . . . . . . . . . . . . . . . . . . . . . . . . . . . . . . . . 960,266 868,395 856,517 8,236
Financial Services . . . . . . . . . . . . . . . . . . . . . . . . . . . . . . . . . . . . . . . . . . . . . 2,482,536 2,897,119 3,475,039 33,414
Other . . . . . . . . . . . . . . . . . . . . . . . . . . . . . . . . . . . . . . . . . . . . . . . . . . . . . . 315,984 350,521 393,291 3,782
Total . . . . . . . . . . . . . . . . . . . . . . . . . . . . . . . . . . . . . . . . . . . . . . . . . . . 8,245,784 8,242,046 8,860,839 85,200
Elimination . . . . . . . . . . . . . . . . . . . . . . . . . . . . . . . . . . . . . . . . . . . . . . . . . . (268,416) (261,407) (313,245) (3,012)
Corporate assets . . . . . . . . . . . . . . . . . . . . . . . . . . . . . . . . . . . . . . . . . . . . . . 208,427 389,906 543,068 5,222
Consolidated total . . . . . . . . . . . . . . . . . . . . . . . . . . . . . . . . . . . . . . . . . . . . . . ¥8,185,795 ¥8,370,545 ¥9,090,662 $87,410
* U.S. dollar amounts have been translated from yen, for convenience only, at the rate of ¥104=U.S.$1, the approximate Tokyo foreign exchange market rate as of March 31, 2004.
Sales and Operating Revenue by Geographic Information
Yen in millions millions*
Year ended March 31 March 31
2002 2003 2004 2004
Dollars in
Year ended
Japan . . . . . . . . . . . . . . . . . . . . . . . . . . . . . . . . . . . . . . . . . . . . . . . . . . . . . . . . ¥2,248,115 ¥2,093,880 ¥2,220,747 $21,353
29.7% 28.0% 29.6%
U.S.A. . . . . . . . . . . . . . . . . . . . . . . . . . . . . . . . . . . . . . . . . . . . . . . . . . . . . . . . 2,461,523 2,403,946 2,121,110 20,395
32.5 32.2 28.3
Europe . . . . . . . . . . . . . . . . . . . . . . . . . . . . . . . . . . . . . . . . . . . . . . . . . . . . . . . 1,609,111 1,665,976 1,765,053 16,972
21.2 22.3 23.6
Other . . . . . . . . . . . . . . . . . . . . . . . . . . . . . . . . . . . . . . . . . . . . . . . . . . . . . . . . 1,259,509 1,309,831 1,389,481 13,361
16.6 17.5 18.5
Total. . . . . . . . . . . . . . . . . . . . . . . . . . . . . . . . . . . . . . . . . . . . . . . . . . . . . . . . . ¥7,578,258 ¥7,473,633 ¥7,496,391 $72,081
* U.S. dollar amounts have been translated from yen, for convenience only, at the rate of ¥104=U.S.$1, the approximate Tokyo foreign exchange market rate as of March 31, 2004.
Note: Sales and operating revenue are attributed to countries based on location of customers.
95
Page 98

Consolidated Balance Sheets
Sony Corporation and Consolidated Subsidiaries – March 31
Yen in millions (Note 3)
2003 2004 2004
Dollars in millions
ASSETS
Current assets:
Cash and cash equivalents . . . . . . . . . . . . . . . . . . . . . . . . . . . . . . . . . . . . . . . . . . . . . . . . . . ¥ 713,058 ¥ 849,211 $ 8,165
Time deposits . . . . . . . . . . . . . . . . . . . . . . . . . . . . . . . . . . . . . . . . . . . . . . . . . . . . . . . . . . . . 3,689 4,662 45
Marketable securities (Notes 7 and 11) . . . . . . . . . . . . . . . . . . . . . . . . . . . . . . . . . . . . . . . . . 241,520 274,748 2,642
Notes and accounts receivable, trade (Note 6) . . . . . . . . . . . . . . . . . . . . . . . . . . . . . . . . . . . 1,117,889 1,123,863 10,806
Allowance for doubtful accounts and sales returns . . . . . . . . . . . . . . . . . . . . . . . . . . . . . . . . (110,494) (112,674) (1,083)
Inventories (Note 4) . . . . . . . . . . . . . . . . . . . . . . . . . . . . . . . . . . . . . . . . . . . . . . . . . . . . . . . 625,727 666,507 6,409
Deferred income taxes (Note 20) . . . . . . . . . . . . . . . . . . . . . . . . . . . . . . . . . . . . . . . . . . . . . 143,999 125,532 1,207
Prepaid expenses and other current assets . . . . . . . . . . . . . . . . . . . . . . . . . . . . . . . . . . . . . . 418,826 431,506 4,149
Total current assets . . . . . . . . . . . . . . . . . . . . . . . . . . . . . . . . . . . . . . . . . . . . . . . . . . . . . 3,154,214 3,363,355 32,340
Film costs (Note 5) . . . . . . . . . . . . . . . . . . . . . . . . . . . . . . . . . . . . . . . . . . . . . . . . . . . . . . . . 287,778 256,740 2,469
Investments and advances:
Affiliated companies (Note 6) . . . . . . . . . . . . . . . . . . . . . . . . . . . . . . . . . . . . . . . . . . . . . . . . 111,510 86,253 829
Securities investments and other (Notes 7, 10 and 11) . . . . . . . . . . . . . . . . . . . . . . . . . . . . . 1,882,613 2,426,697 23,334
1,994,123 2,512,950 24,163
Property, plant and equipment (Notes 8 and 11):
Land . . . . . . . . . . . . . . . . . . . . . . . . . . . . . . . . . . . . . . . . . . . . . . . . . . . . . . . . . . . . . . . . . . . 188,365 189,785 1,825
Buildings . . . . . . . . . . . . . . . . . . . . . . . . . . . . . . . . . . . . . . . . . . . . . . . . . . . . . . . . . . . . . . . 872,228 930,983 8,952
Machinery and equipment . . . . . . . . . . . . . . . . . . . . . . . . . . . . . . . . . . . . . . . . . . . . . . . . . . 2,054,219 2,053,085 19,741
Construction in progress. . . . . . . . . . . . . . . . . . . . . . . . . . . . . . . . . . . . . . . . . . . . . . . . . . . . 60,383 98,480 947
3,175,195 3,272,333 31,465
Less—Accumulated depreciation . . . . . . . . . . . . . . . . . . . . . . . . . . . . . . . . . . . . . . . . . . . . . 1,896,845 1,907,289 18,340
1,278,350 1,365,044 13,125
Other assets:
Intangibles, net (Notes 9 and 14) . . . . . . . . . . . . . . . . . . . . . . . . . . . . . . . . . . . . . . . . . . . . . 258,624 248,010 2,385
Goodwill (Note 9) . . . . . . . . . . . . . . . . . . . . . . . . . . . . . . . . . . . . . . . . . . . . . . . . . . . . . . . . . 290,127 277,870 2,672
Deferred insurance acquisition costs (Note 10) . . . . . . . . . . . . . . . . . . . . . . . . . . . . . . . . . . . 327,869 349,194 3,358
Deferred income taxes (Note 20) . . . . . . . . . . . . . . . . . . . . . . . . . . . . . . . . . . . . . . . . . . . . . 328,091 203,203 1,954
Other . . . . . . . . . . . . . . . . . . . . . . . . . . . . . . . . . . . . . . . . . . . . . . . . . . . . . . . . . . . . . . . . . . 451,369 514,296 4,944
1,656,080 1,592,573 15,313
¥8,370,545 ¥9,090,662 $87,410
(Continued on following page.)
96
Page 99

Yen in millions (Note 3)
2003 2004 2004
Dollars in millions
LIABILITIES AND STOCKHOLDERS’ EQUITY
Current liabilities:
Short-term borrowings (Note 11) . . . . . . . . . . . . . . . . . . . . . . . . . . . . . . . . . . . . . . . . . . . . . ¥ 124,360 ¥ 91,260 $ 878
Current portion of long-term debt (Notes 8, 11 and 13) . . . . . . . . . . . . . . . . . . . . . . . . . . . . 34,385 383,757 3,690
Notes and accounts payable, trade (Note 6) . . . . . . . . . . . . . . . . . . . . . . . . . . . . . . . . . . . . . 697,385 778,773 7,488
Accounts payable, other and accrued expenses (Notes 5 and 14) . . . . . . . . . . . . . . . . . . . . . 864,188 812,175 7,809
Accrued income and other taxes. . . . . . . . . . . . . . . . . . . . . . . . . . . . . . . . . . . . . . . . . . . . . . 109,199 57,913 557
Deposits from customers in the banking business (Note 12) . . . . . . . . . . . . . . . . . . . . . . . . . 248,721 378,851 3,643
Other (Notes 20 and 23) . . . . . . . . . . . . . . . . . . . . . . . . . . . . . . . . . . . . . . . . . . . . . . . . . . . . 356,810 479,486 4,610
Total current liabilities . . . . . . . . . . . . . . . . . . . . . . . . . . . . . . . . . . . . . . . . . . . . . . . . . . . 2,435,048 2,982,215 28,675
Long-term liabilities:
Long-term debt (Notes 8, 11 and 13) . . . . . . . . . . . . . . . . . . . . . . . . . . . . . . . . . . . . . . . . . . 807,439 777,649 7,477
Accrued pension and severance costs (Note 14) . . . . . . . . . . . . . . . . . . . . . . . . . . . . . . . . . . 496,174 368,382 3,542
Deferred income taxes (Note 20) . . . . . . . . . . . . . . . . . . . . . . . . . . . . . . . . . . . . . . . . . . . . . 159,079 96,193 925
Future insurance policy benefits and other (Note 10) . . . . . . . . . . . . . . . . . . . . . . . . . . . . . . 1,914,410 2,178,626 20,948
Other . . . . . . . . . . . . . . . . . . . . . . . . . . . . . . . . . . . . . . . . . . . . . . . . . . . . . . . . . . . . . . . . . . 255,478 286,737 2,758
3,632,580 3,707,587 35,650
Minority interest in consolidated subsidiaries . . . . . . . . . . . . . . . . . . . . . . . . . . . . . . . . 22,022 22,858 220
Stockholders’ equity (Note 15):
Subsidiary tracking stock, no par value—
Authorized 100,000,000 shares, outstanding 3,072,000 shares . . . . . . . . . . . . . . . . . . . . 3,917 3,917 38
Common stock, no par value—
2003—Authorized 3,500,000,000 shares, outstanding 922,385,176 shares . . . . . . . . . . . 472,361
2004—Authorized 3,500,000,000 shares, outstanding 926,418,280 shares . . . . . . . . . . . 476,350 4,580
Additional paid-in capital . . . . . . . . . . . . . . . . . . . . . . . . . . . . . . . . . . . . . . . . . . . . . . . . . . . 984,196 992,817 9,546
Retained earnings . . . . . . . . . . . . . . . . . . . . . . . . . . . . . . . . . . . . . . . . . . . . . . . . . . . . . . . . . 1,301,740 1,367,060 13,145
Accumulated other comprehensive income—
Unrealized gains on securities (Note 7) . . . . . . . . . . . . . . . . . . . . . . . . . . . . . . . . . . . . . . . 17,658 69,950 672
Unrealized losses on derivative instruments (Note 13) . . . . . . . . . . . . . . . . . . . . . . . . . . . . (4,793) (600) (6)
Minimum pension liability adjustment (Note 14) . . . . . . . . . . . . . . . . . . . . . . . . . . . . . . . . (182,676) (89,261) (858)
Foreign currency translation adjustments . . . . . . . . . . . . . . . . . . . . . . . . . . . . . . . . . . . . . . (302,167) (430,048) (4,135)
(471,978) (449,959) (4,327)
Treasury stock, at cost (2003 – 1,573,396 shares, 2004 – 2,468,258 shares) . . . . . . . . . . . . (9,341) (12,183) (117)
2,280,895 2,378,002 22,865
Commitments and contingent liabilities (Notes 8 and 23)
¥8,370,545 ¥9,090,662 $87,410
The accompanying notes are an integral part of these statements.
* U.S. dollar amounts have been translated from yen, for convenience only, at the rate of ¥104=U.S.$1, the approximate Tokyo foreign exchange market rate as of March 31, 2004.
97
Page 100

Consolidated Statements of Income
Sony Corporation and Consolidated Subsidiaries – Year ended March 31
Yen in millions (Note 3)
2002 2003 2004 2004
Dollars in millions
Sales and operating revenue:
Net sales (Note 6) . . . . . . . . . . . . . . . . . . . . . . . . . . . . . . . . . . . . . . . . . . . . . ¥7,058,755 ¥6,916,042 ¥6,883,478 $66,187
Financial service revenue. . . . . . . . . . . . . . . . . . . . . . . . . . . . . . . . . . . . . . . . 480,190 509,398 565,752 5,440
Other operating revenue . . . . . . . . . . . . . . . . . . . . . . . . . . . . . . . . . . . . . . . 39,313 48,193 47,161 454
7,578,258 7,473,633 7,496,391 72,081
Costs and expenses:
Cost of sales (Notes 17 and 18) . . . . . . . . . . . . . . . . . . . . . . . . . . . . . . . . . . 5,239,592 4,979,421 5,058,205 48,637
Selling, general and administrative (Notes 16, 17 and 18) . . . . . . . . . . . . . . . 1,695,897 1,782,367 1,798,239 17,291
Financial service expenses . . . . . . . . . . . . . . . . . . . . . . . . . . . . . . . . . . . . . . . 458,276 486,464 505,550 4,861
Loss on sale, disposal or impairment of assets, net (Notes 9 and 17) . . . . . . . 49,862 39,941 35,495 341
7,443,627 7,288,193 7,397,489 71,130
Operating income . . . . . . . . . . . . . . . . . . . . . . . . . . . . . . . . . . . . . . . . . . . 134,631 185,440 98,902 951
Other income:
Interest and dividends (Note 6) . . . . . . . . . . . . . . . . . . . . . . . . . . . . . . . . . . . 16,021 14,441 18,756 180
Royalty income . . . . . . . . . . . . . . . . . . . . . . . . . . . . . . . . . . . . . . . . . . . . . . . 33,512 32,375 34,244 329
Foreign exchange gain, net. . . . . . . . . . . . . . . . . . . . . . . . . . . . . . . . . . . . . . – 1,928 18,059 174
Gain on sales of securities investments, net (Notes 6 and 7) . . . . . . . . . . . . . 1,398 72,552 11,774 113
Gain on issuances of stock by subsidiaries and equity investees (Note 19) . . . 503 – 4,870 47
Other . . . . . . . . . . . . . . . . . . . . . . . . . . . . . . . . . . . . . . . . . . . . . . . . . . . . . . 44,894 36,232 34,587 333
96,328 157,528 122,290 1,176
Other expenses:
Interest . . . . . . . . . . . . . . . . . . . . . . . . . . . . . . . . . . . . . . . . . . . . . . . . . . . . . 36,436 27,314 27,849 268
Loss on devaluation of securities investments . . . . . . . . . . . . . . . . . . . . . . . . 18,458 23,198 16,481 159
Foreign exchange loss, net . . . . . . . . . . . . . . . . . . . . . . . . . . . . . . . . . . . . . . 31,736 – ––
Other . . . . . . . . . . . . . . . . . . . . . . . . . . . . . . . . . . . . . . . . . . . . . . . . . . . . . . 51,554 44,835 32,795 315
138,184 95,347 77,125 742
Income before income taxes. . . . . . . . . . . . . . . . . . . . . . . . . . . . . . . . . . . 92,775 247,621 144,067 1,385
Income taxes (Note 20):
Current . . . . . . . . . . . . . . . . . . . . . . . . . . . . . . . . . . . . . . . . . . . . . . . . . . . . 114,930 178,847 87,219 838
Deferred . . . . . . . . . . . . . . . . . . . . . . . . . . . . . . . . . . . . . . . . . . . . . . . . . . . . (49,719) (98,016) (34,445) (331)
65,211 80,831 52,774 507
Income before minority interest, equity in net income of
affiliated companies and cumulative effect of accounting changes . . . 27,564 166,790 91,293 878
Minority interest in income (loss) of consolidated subsidiaries . . . . . . . . . . . . (16,240) 6,581 2,379 23
Equity in net income (loss) of affiliated companies (Note 6) . . . . . . . . . . . . . . (34,472) (44,690) 1,714 16
Income before cumulative effect of accounting changes . . . . . . . . . . . 9,332 115,519 90,628 871
Cumulative effect of accounting changes
(2002: Net of income taxes of ¥2,975 million
2004: Net of income taxes of ¥0 million) (Note 2) . . . . . . . . . . . . . . . . . . . 5,978 – (2,117) (20)
Net income . . . . . . . . . . . . . . . . . . . . . . . . . . . . . . . . . . . . . . . . . . . . . . . . . ¥ 15,310 ¥ 115,519 ¥ 88,511 $ 851
(Continued on following page.)
98
 Loading...