

Page 1

SonicOS and SonicOSX 7
Monitor Logs
Administration Guide
Page 2

Contents
System Logs 3
Viewing System Logs 3
System Log Functions 4
Display Options 5
Filtering the View 8
Auditing Logs 9
What is Configuration Auditing 9
Benefits of Configuration Auditing 9
What Information is Recorded 10
What Information is Not Recorded 10
Audit Recording in High Availability Configurations 10
Modifying and Supplementing Configuration Auditing 11
SNMP Trap Control 11
E-CLI Commands 11
Auditing Record Storage and Persistence 11
Managing the Audit Logs Table 12
Viewing Auditing Logs 12
Manually Emailing Auditing Logs 12
Exporting Auditing Logs 13
Refreshing the Auditing Logs 13
Displaying the Auditing Logs on the console 13
Auditing All Parameters During Addition 14
SonicWall Support 15
About This Document 16
SonicOS/X 7 Monitor Logs Administration Guide
Contents
2
Page 3
System Logs
NOTE: References to SonicOS/X indicate that the functionality is available in both SonicOS and
SonicOSX.
The SonicWall network security appliance maintains an Event log for tracking potential security threats.
Topics:
l Viewing System Logs
l System Log Functions
l Display Options
l Filtering the View
1
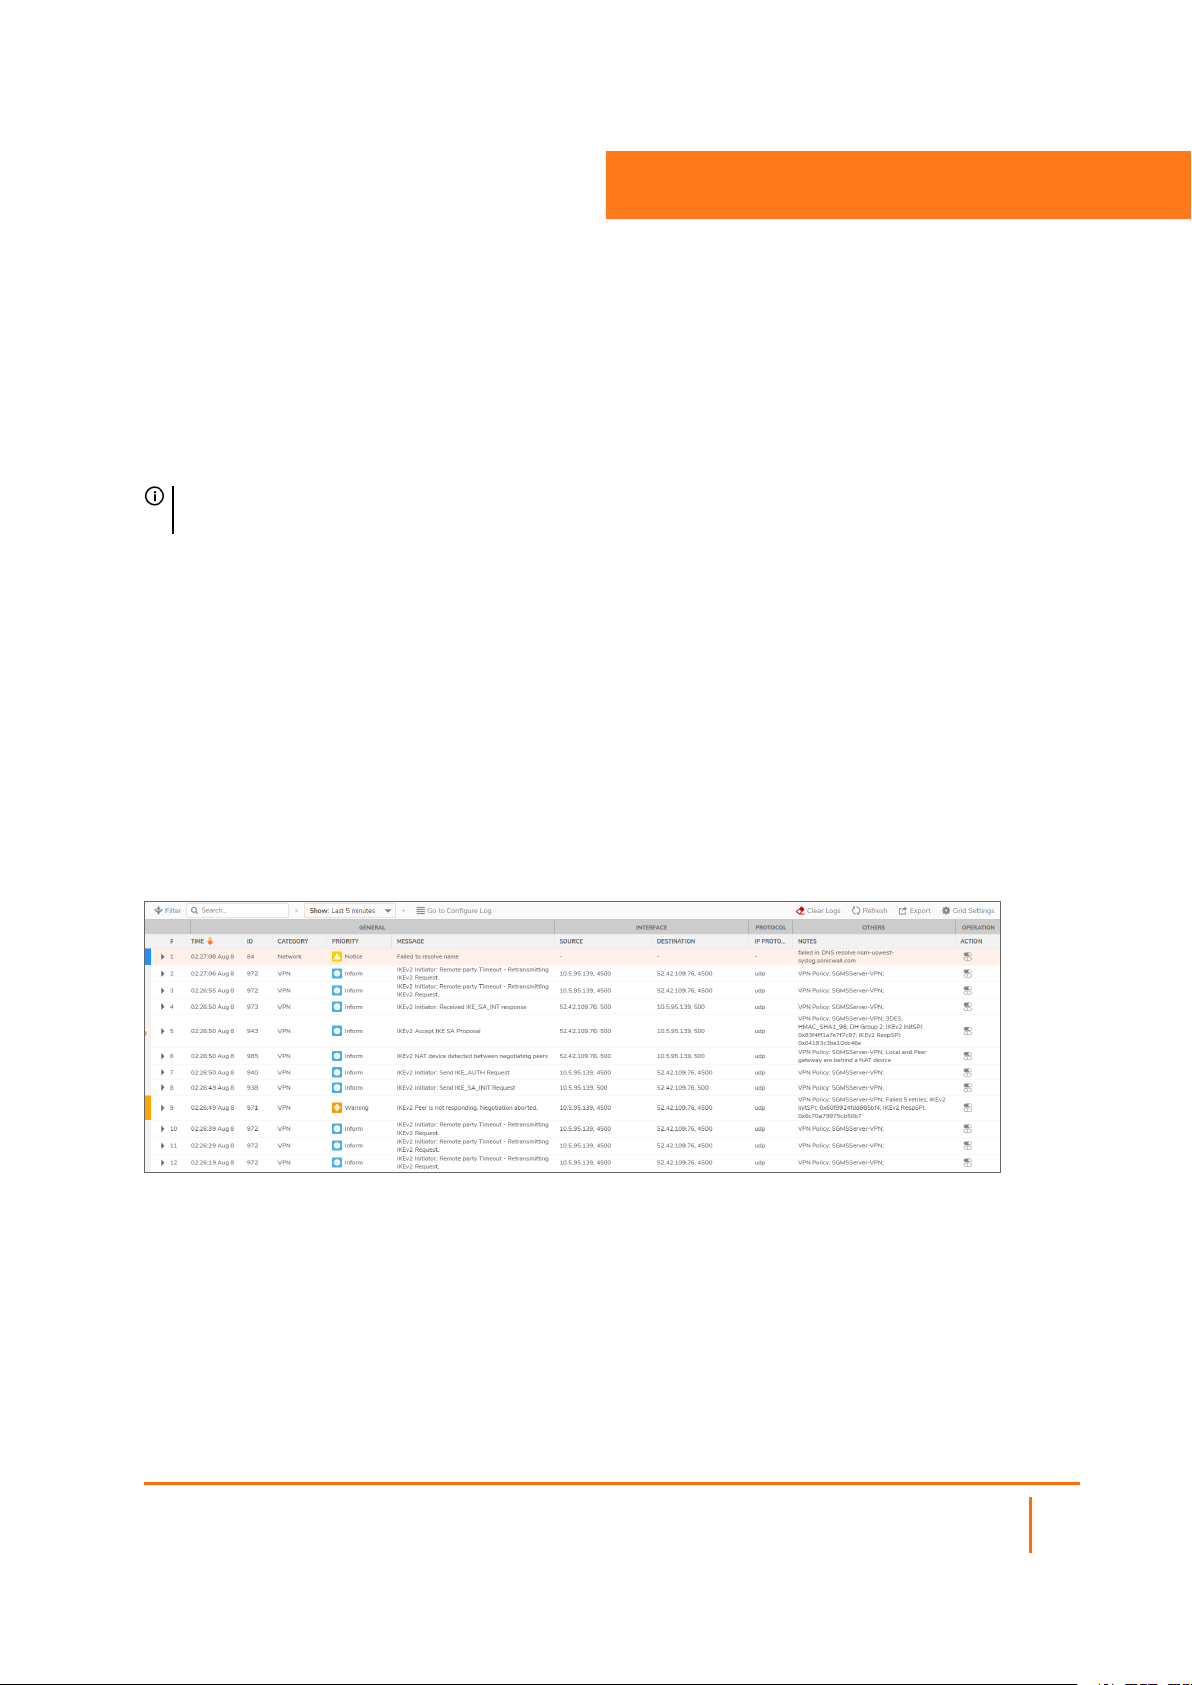
Viewing System Logs
To view system events, navigate to Monitor > Logs > System Logs page.
For a description of the:
l Functions, see System Log Functions
l Columns, see Display Options
SonicOS/X 7 Monitor Logs Administration Guide
System Logs
3
Page 4
System Log Functions
The System Log table provides numerous settings to allow you to navigate, view, and export results. Table
columns can be customized, so that you can view full data on any event, or only the data you need. Table
entries can be sorted to display in either ascending or descending order.
To sort the entries in the Event Log, click the column heading. The entries are sorted by ascending or
descending order. The arrow to the right of the column name indicates the sorting status. A down arrow
means ascending order. An up arrow indicates a descending order.
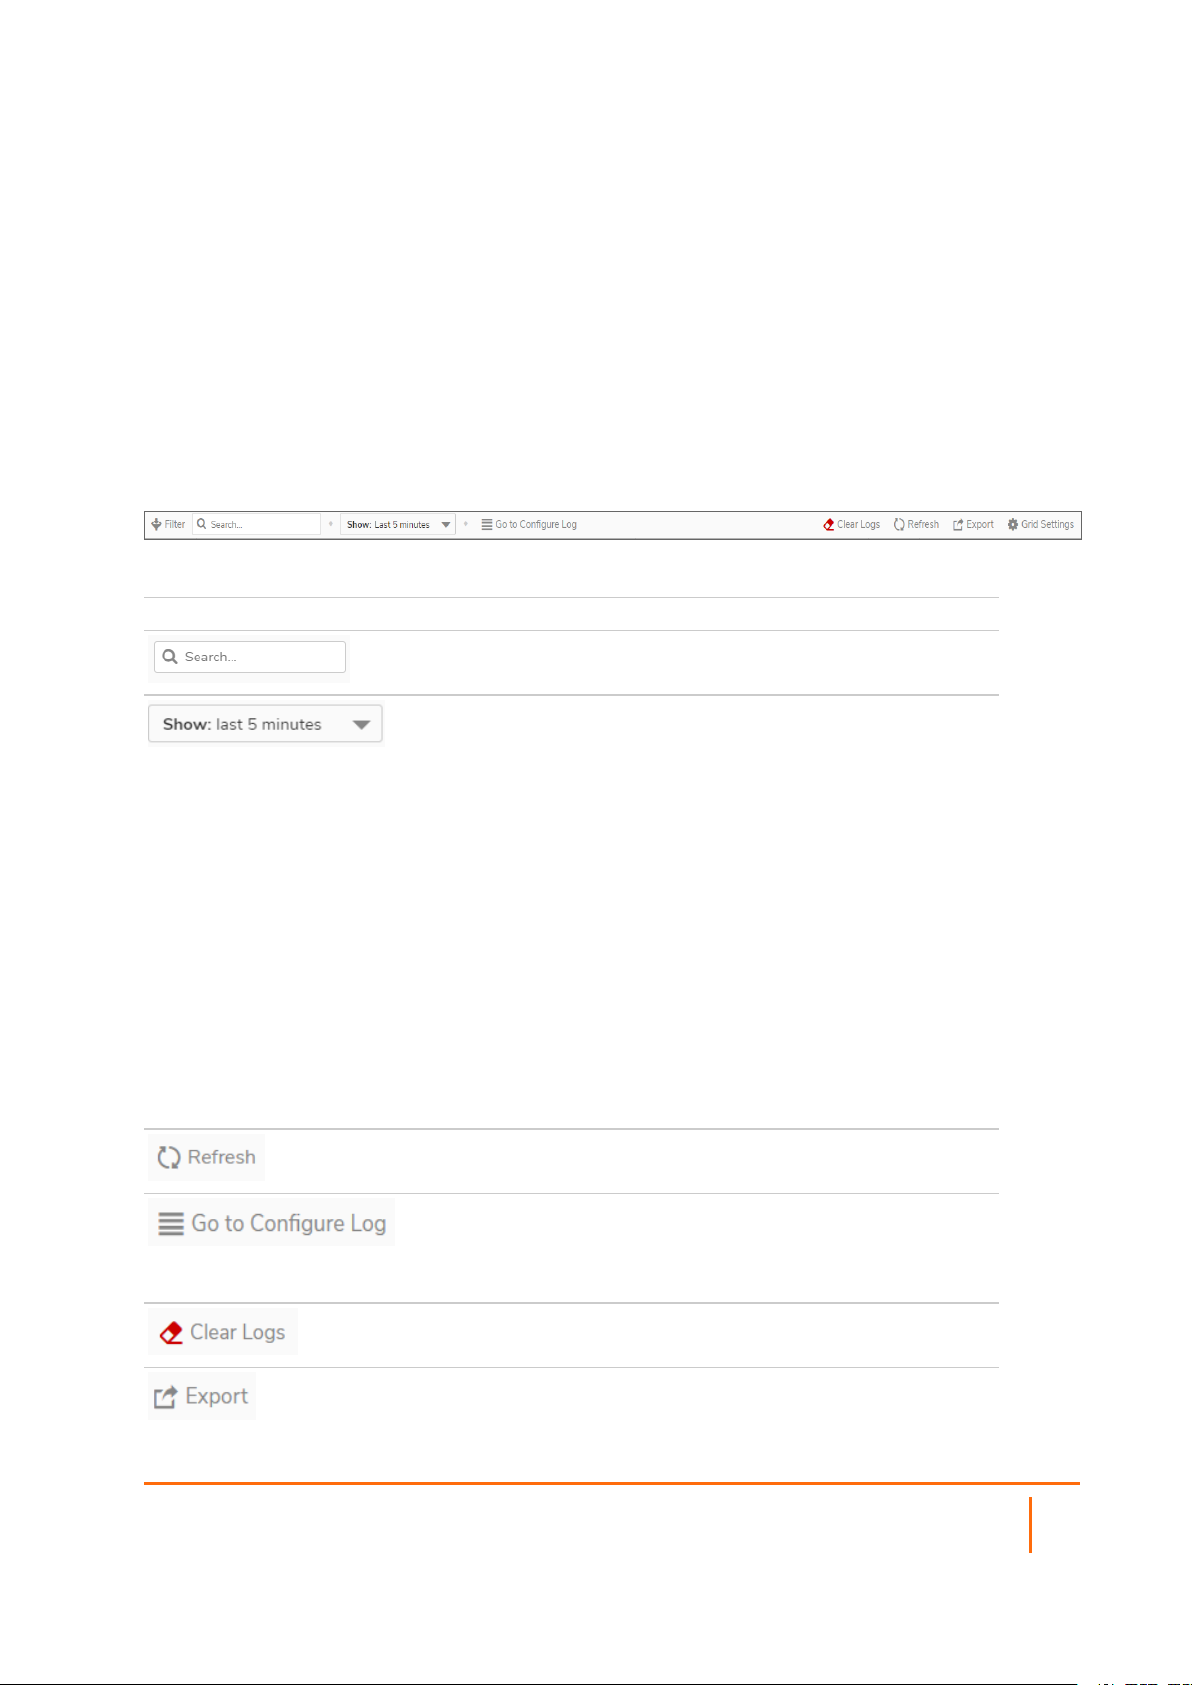
The top row of the Event Log contains various functions. Functions pertaining only to Event Logs are
described in the below table.
SYSTEM EVENT LOG FUNCTIONS
Option Function Action
Search The Event Log displays the log entries that
match the search string.
Show Select the interval for the Event Log. The
event logs from that period are displayed:
l Last 60 seconds
l Last 2 minutes
l Last 5 minutes (default)
l Last 10 minutes
l Last 15 minutes
l Last 30 minutes
l Last 60 minutes
l Last 3 hours
l Last 6 hours
l Last 12 hours
l Last 24 hours
l Last 7 days
l Last 15 days
l Last 30 days
l All entries
Refresh Click to refresh the system log data.
Configure Log Click this link and you are navigated to
Device > Log > Settings to configure the
items which needs to be tracked in the Event
Log.
Clear Logs Click to clear the logs from the table.
Export Click to export the logs in CSV, TXT files,
and email
SonicOS/X 7 Monitor Logs Administration Guide
System Logs
4
Page 5
Display Options
Customize the Events log to display as many or few columns that meet your needs.
To select which columns to display:
1.
Navigate to Monitor > Logs > System Logs.
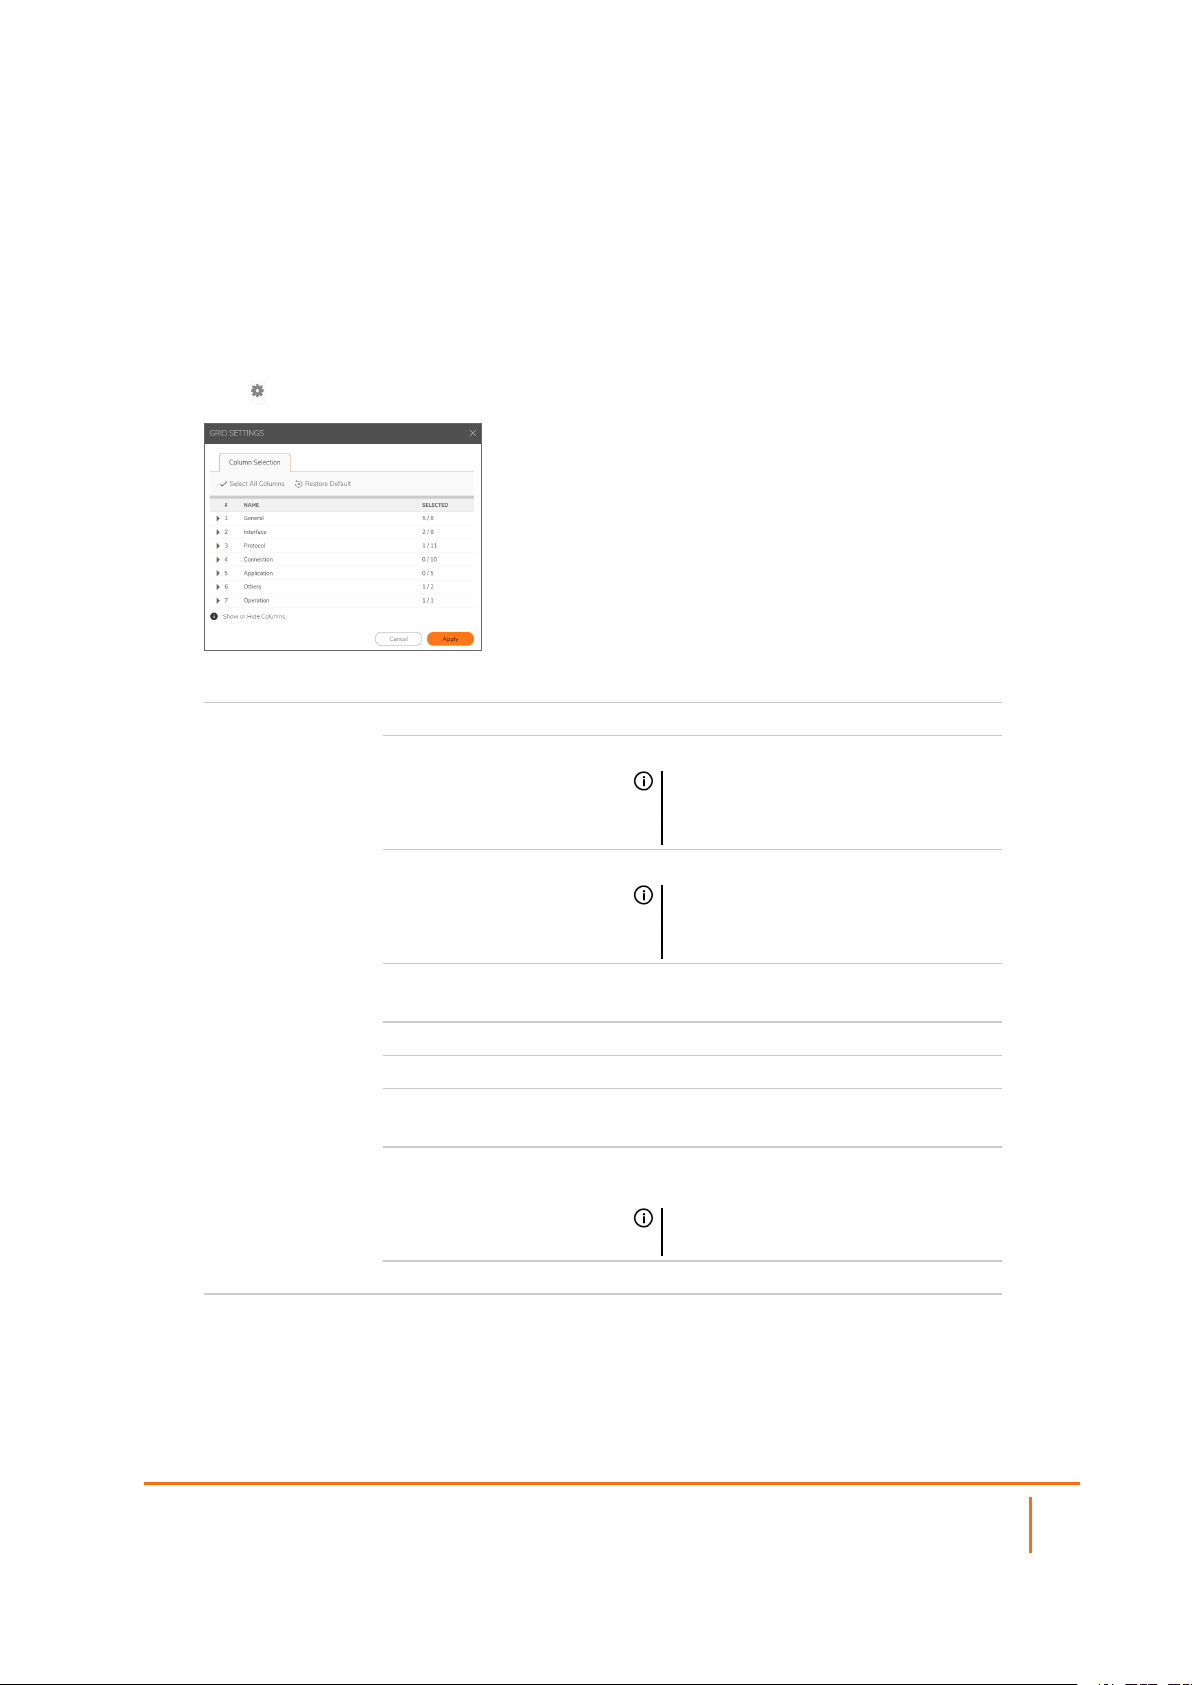
2.
Click Grid Settings icon . The Grid Settings dialog displays:
3.
Select the items you want to appear as columns in the System Log.
General General information about the log event.
Time Local date and time the event occurred.
IMPORTANT: This option is selected
by default. It is dimmed, and cannot be
deselected.
ID Identifying number for the event.
IMPORTANT: This option is selected
by default. It is dimmed, and cannot be
deselected.
Category Category of the event. This option is
selected by default.
Group Group designation of the event.
Event Name of the event.
Msg Type Type of message; usually Standard
Message String.
Priority Priority level of the event, such as Inform
(information) or Error.
IMPORTANT: This option is selected
by default.
Message Information about the event.
SonicOS/X 7 Monitor Logs Administration Guide
System Logs
5
Page 6

Interface Information about the protocol of the packet triggering the event.
Source Name of the source device, if applicable.
This option is selected by default.
Source IP IP address of the source device.
Source Port Port number of the source.
Source Interface Source network and IP address, if
applicable.
Destination Name of the destination device, if
applicable. This option is selected by
default.
Destination IP IP address of the destination device.
Destination Port Port number of the destination.
Destination Interface Destination network and IP address, if
applicable.
Protocol Information about the NAT policy in effect, if any.
Source Name Protocol source name.
Source NAT IP Source address from the Source NAT IP
address pool.
Source NAT Port Port number for the Source NAT.
In SPI Indicates whether the ingress packet is in
Stateful Packet Inspection (SPI) mode, if
applicable.
Destination Name Protocol destination name.
Destination NAT IP Destination address from the Source NAT
IP address pool.
Destination NAT Port Port number for the Destination NAT.
Out SPI Indicates whether the egress packet is in
Stateful Packet Inspection (SPI) mode, if
applicable.
IP Protocol Protocol used to send error and control
messages, if known. This option is selected
by default.
ICMP Type ICMP packet’s ICMP type, if known.
ICMP Code ICMP packet’s ICMP code, if known.
SonicOS/X 7 Monitor Logs Administration Guide
System Logs
6
Page 7

Connection Information about SPI, Access and IDP Rules, and policies, if any.
TX Bytes Number of bytes transmitted.
RX Bytes Number of bytes received.
Access Rule Name of the Access Rule triggering the
event, if any.
NAT Policy Name of the NAT policy.
VPN Policy Name of the VPN policy triggering the
event, if any.
User Name Name of the user whose action triggered
the event.
Session Time Duration of the session before the event.
Session Type Type of session triggering the event.
IDP Rule Name of the IDP Rule triggering the event,
if any.
IDP Priority Priority of the IDP Rule.
Application Information about the application being used.
HTTP OP NPCS object op requestMethod HTTP OP
code.
URL URL of the NPCS object op requestMethod
HTTP OP code.
HTTP Result HTTP result code (such as, 200, 403) of
Website hit rpkt cn1Label Packet received.
Block Category Block category that triggered the event.
Application The application being used.
Others Information about the user, session, and application, if known.
FW Action Configured firewall action. If no action has
been specified, displays N/A.
Notes Includes notes. This option is selected by
default.
Operation Action Provides option to disable the events.
4.
When done, click Apply to preserve any changes or click Restore Default to revert back to the
default settings.
You can perform the following actions on the System Logs page:
l To export the logs in CSV, TXT files, and email, click Export icon and select the required format
l To clear the logs from the table, click Clear Logs icon
l To refresh the page, click Refresh icon
l To view more details of the log, click the triangle icon of the log
SonicOS/X 7 Monitor Logs Administration Guide
7
System Logs
Page 8

Filtering the View
The Filter View input field at the top left corner of the System Log enables you to narrow your search using
drop-down options and search strings.
To filter the System Event logs:
1.
Navigate to Monitor > Logs > System Logs.
2.
Click Filter icon.
3.
Select any filtering scheme you want. Filter on just one field or you can filter on all of them. In the
General, Source and Destination fields, you can enter a partial string to filter on.
4.
Click Accept.
OR
Click Reset to clear the filters applied.
SonicOS/X 7 Monitor Logs Administration Guide
System Logs
8
Page 9

2
Auditing Logs
This section describes in detail the recording feature that collects and records information on any changes in
the security appliance configuration. To access this feature, navigate to Monitor > Logs > Auditing Logs
in the SonicOS/X web management interface.
What is Configuration Auditing
Configuration auditing is a feature that automatically records any configuration changes that an
administrator attempts from one of the available user interfaces, web management (via HTTP and HTTPS),
command line (via console or SSH), or SonicWall GMS. A configuration auditing records table is created to
record all attempted configuration changes, both successful and failed. With configuration auditing,
SonicOS/X archives the history of its configuration changes, so that the administrator or others can later
revisit and analyze the records. This feature is enabled by default for the platforms where it is available.
Benefits of Configuration Auditing
Auditing of configuration change records can be useful as described below:
l Automatic documentation of any configuration changes performed by an administrator
l Assistance in troubleshooting unexpected changes in run-time system behavior
l Visibility, continuity, and consistency where there are several administrators, either simultaneously or
consecutively. Each administrator has access to a record of changes performed or attempted by all
other administrators.
l Third party integration with Firewall Manager, SEIM systems, logging and reporting solutions
l Compliance with regulations such as SOX, FISMA, NIST, DISA STIP
SonicOS/X 7 Monitor Logs Administration Guide
Auditing Logs
9
Page 10

What Information is Recorded
Configuration auditing generates a record for every configuration change. The record includes:
l Which parameter was changed
l When the change was made
l Who made the change
l From where the change was made
l Details of the change, such as the previous and subsequent values
What Information is Not Recorded
The following are not included in the Configuration Auditing operation:
l Importing a Settings File - Configuration changes due to importing a settings file are currently not
recorded by the configuration auditing feature. Since all current settings are cleared prior to applying
imported configurations, the assumption is that all existing configurations are modified.
l WXA configuration settings — SonicOS/X does not audit any configuration changes in WAN
Acceleration. Some settings are saved on the WXA instead of the firewall, although the settings can
be configured from the SonicOS/X web management interface.
l ZEBOS settings for BGP/OSPF/RIP routing configurations — SonicOS/X stores these settings as
one long string of ZEBOS CLI commands. Records of changes made by these commands are not
duplicated in the configuration auditing operation.
l Anti-Spam Junk Store applications — Configuration settings changed through a proxy server running
a junk store are excluded from configuration auditing.
l Licensing - All aspects of system licensing are authenticated through MySonicWall, and are not
recorded through configuration auditing.
l Uploading a file from Home > Capture ATP does not audit uploading a file from the page, because
the contents of this page do not reside on the firewall.
Audit Recording in High Availability Configurations
The Configuration Auditing operation records changes individually for each device. It does not synchronize
the recorded information between appliances in an HA pair. When the active HA unit next synchronizes with
the standby HA unit, it sends configuration changes to the standby unit. The synchronization operation
information updates the auditing record of the standby device in the pair. On the standby unit, the auditing
record indicates that the configuration changes it recorded came from the active unit.
SonicOS/X 7 Monitor Logs Administration Guide
Auditing Logs
10
Page 11

Modifying and Supplementing Configuration Auditing
Configuration Auditing operations can be modified and supplemented through the following:
SNMP Trap Control
SNMP (Simple Network Management Protocol) is an Internet Standard protocol for collecting and organizing
information about managed devices on IP networks. SNMP traps allow the user to monitor security
appliance status and configuration through a Management Information Database (MIB). Configuration
auditing works in conjunction with SNMP by giving the user the option to enable a trap for each logged event
collected during a network configuration change, whether successful or failed.
E-CLI Commands
E-CLI (Enterprise Command Line Interface) commands are available for configuration auditing record
setting and display, for those administrators who like to work from the command line. You can use the
following E-CLI commands to enable or disable configuration auditing and to view records:
to work with settings:
config(C0EAE49CE84C)# log audit settings
(config-audit)# enable
(config-audit)# debug
(config-audit)# auditall
(config-audit)# commit
to show audit records:
(config-audit)# show log audit view
Auditing Record Storage and Persistence
Configuration auditing records are saved to non-volatile storage (such as flash), so that records can be
restored, if required, after a reboot. The number of records saved is directly proportional to the capability of
the device, as defined in the product matrix below. Higher-end platforms can store more records than lowerend devices. Devices with no flash or smaller flash capacity do not support configuration auditing.
All configuration auditing records, on any platform, are deleted when the appliance is rebooted with factory
defaults.
SonicOS/X 7 Monitor Logs Administration Guide
Auditing Logs
11
Page 12

Managing the Audit Logs Table
The administrator can manage the auditing records in many useful ways. The following activities are
available:
Topics:
l Viewing Auditing Logs
l Manually Emailing Auditing Logs
l Exporting Auditing Logs
l Refreshing the Auditing Logs
l Displaying the Auditing Logs on the console
l Auditing All Parameters During Addition
Viewing Auditing Logs
The Monitor > Logs > Auditing Logs page displays all the configuration auditing records. It allows a user
to view, search, and sort the records.
l The first column is expandable to display the summary of the log entry.
l There are also buttons for Select all Columns and Restore Default for ease of operation. Click
Grid Settings icon to perform the desired action.
l The user can search for a specific string pattern and highlight the matched results, if any are found.
l Failed configuration changes are marked in red.
l All columns are sortable.
Manually Emailing Auditing Logs
When a valid mail server and email address are configured, the user can click the email button on the tool
bar of the Auditing Records page to manually email auditing records at any time. The button is disabled if
either the mail server or the email address is not configured under Device > Log > Automation.
SonicOS/X 7 Monitor Logs Administration Guide
Auditing Logs
12
Page 13

The Device > Log > Automation page includes settings for configuring the SonicWall to send log files
using Email and configuring mail server settings.
Exporting Auditing Logs
There are two export options for auditing records. You can export the records as a text file or as a CSV file.
Refreshing the Auditing Logs
The Refresh button provides a way to refresh the page and display the latest auditing records, as seen
below:
Displaying the Auditing Logs on the console
Click Supplemental > Display Auditing Records on Console option to display the auditing records on
the console in a text format.
SonicOS/X 7 Monitor Logs Administration Guide
Auditing Logs
13
Page 14

Auditing All Parameters During Addition
By default, configuration auditing only logs significant changes, defined as changes where the new value of
the parameter is different from the default value. Click Supplemental > Audit Supplemental Parameter
Changes option to record all parameter changes during an addition activity, even when the new values are
the same as the default values.
SonicOS/X 7 Monitor Logs Administration Guide
Auditing Logs
14
Page 15

SonicWall Support
Technical support is available to customers who have purchased SonicWall products with a valid
maintenance contract.
The Support Portal provides self-help tools you can use to solve problems quickly and independently, 24
hours a day, 365 days a year. To access the Support Portal, go to https://www.sonicwall.com/support.
The Support Portal enables you to:
l View knowledge base articles and technical documentation
l View and participate in the Community forum discussions at
https://community.sonicwall.com/technology-and-support.
l View video tutorials
l Access https://mysonicwall.com
l Learn about SonicWall professional services
l Review SonicWall Support services and warranty information
l Register for training and certification
l Request technical support or customer service
3
To contact SonicWall Support, visit https://www.sonicwall.com/support/contact-support.
SonicOS/X 7 Monitor Logs Administration Guide
15
SonicWall Suppor t
Page 16

About This Document
NOTE: A NOTE icon indicates supporting information.
IMPORTANT: An IMPORTANT icon indicates supporting information.
TIP: A TIP icon indicates helpful information.
CAUTION: A CAUTION icon indicates potential damage to hardware or loss of data if
instructions are not followed.
WARNING: A WARNING icon indicates a potential for property damage, personal injury, or
death.
SonicOS and SonicOSXMonitor Logs Administration Guide
Updated - August 2020
Software Version - 7
232-005339-00 Rev B
Copyright © 2020 SonicWall Inc. All rights reserved.
The information in thisdocument is pr ovided in connection with SonicWalland/or its affiliates’ pr oducts. No license, express or
implied, by estoppel or otherwise, to any intellectual pr operty right is granted by this document or in connection with the sale of
products. EXCEPT AS SET F ORTH IN THE TERMS AND CONDITIONS AS SPECIF IED IN THE LICENSE AGREEMENT F OR
THIS PRODUCT, SONICWALL AND/OR ITS AFFILIATES ASSUME NO LIABILITY WHATSOEVER AND DISCLAIMS ANY
EXPRESS, IMPLIED OR STATUTORY WARRANTY RELATING TO ITS PRODUCTS INCLUDING, BUT NOT LIMITED TO,
THE IMPLIED WARRANT Y OF MERCHANTABILITY, FITNESS F OR A PARTICULAR PURPOSE, OR NON-INFRINGEMENT.
IN NO EVENT SHALL SONICWALL AND/OR ITS AFFILIATES BE LIABLE F OR ANY DIRECT, INDIRECT, CONSEQUENTIAL,
PUNITIVE, SPECIAL OR INCIDENTAL DAMAGES (INCLUDING, WITHOUT LIMITATION, DAMAGES FOR LOSS OF
PROFITS, BUSINESS INTERRUPTION OR LOSS OF INFORMATION) ARISING OUT OF THE USE OR INABILITY TO USE
THIS DOCUMENT, EVEN IF SONICWALL AND/OR ITS AFF ILIATES HAVE BEEN ADVISED OF THE POSSIBILITY OF SUCH
DAMAGES. SonicWall and/or its affiliates make no representations or warranties with r espect to the accuracy or completeness of
the contents of this document and reserves the right to make changes to specificationsand product descriptionsat any time without
notice. and/or its affiliates do not make any commitment to update the information contained in this document.
For more information, visit https://www.sonicwall.com/legal.
End User Product Agreement
To view the SonicWallEnd User Product Agreement, go to: https://www.sonicwall.com/en-us/legal/license-agreements.
Open Source Code
SonicWall Inc. is able to provide a machine-readable copy of open source code with restrictive licensessuch as GPL, LGPL, AGPL
when applicable per license requirements. To obtain a complete machine-readable copy, send your written requests, along with
certified check or money order in the amount of USD 25.00 payable to “SonicWall Inc.”, to:
General PublicLicense Source Code Request
Attn: Jennifer Anderson
1033 McCarthy Blvd
Milpitas, CA 95035
SonicOS/X 7 Monitor Logs Administration Guide
SonicWall Suppor t
16
 Loading...