

Page 1

Gray Scale Chartplotter
CODE: XSegsw12m110B820/101103
Color Chartplotter
CODE: XSegsw12c110B820/101103
USER MANUAL
Page 2

Warning!
Electronic charts displayed by the chartplotter are believed to be accurate and reliable, but they are not
intended to substitute for the official charts which should remain your main reference for all the matters related to the execution of a safe navigation.
For this reason we would like to remind you that you are required to carry on board and use the
officially published and approved nautical charts.
Caution
n Please read through this manual before the first operation. If you have any questions, please contact
the Company customer service or your local dealer.
n The chartplotter is not built water proof. Please give attention to avoid water intrusion into the
chartplotter. Water damage is not covered by the warranty.
n Extensive exposure to heat may result in damage to the chartplotter.
n Connection to the power source with reversed polarity will damage the chartplotter severely. This
damage may not be covered by the warranty.
n The chartplotter contains dangerous high voltage circuits which only experienced technicians can
handle.
n The C-MAP NT+ C-CARD are available from your local dealer.
n We will not be liable for errors contained herein, or for incidental or consequential damages in
connection with the performance or use of this material.
n Exposure of display to UV rays may shorten life of the liquid crystals used in your plotter. This
limitation is due to the current technology of the LCD displays.
Avoid overheating which may cause loss of contrast and, in extreme cases, a darkening of the screen.
Problems which occur from overheating are reversible when temperature decreases.
Cleaning procedure for the plotter screen
Cleaning of the plotter screen is a very important operation and must be done carefully. Since the
surface is covered by a antireflective coating, the procedure for cleaning all the surfaces can be performed using the following procedure: You need a tissue or lens tissue and a cleaning spray containing
Isopropanol (a normal spray cleaner sold for the PC screen, for example PolaClear by Polaroid). Fold
the tissue or lens tissue into a triangular shape, moisten the tip and use the index finger behind a corner
to move the tissue across the surface, in overlapping side to side strokes. If the tissue is too wet, a
noticeable wet film will be left in its path and you will need to repeat the process. If too dry, the tissue
wont glide easily, and may damage the surface.
4
User Manual
Page 3

Table of Content
1 Introduction ........................................................................................... 11
2 Before You Begin ........................................................................................... 17
1.1 CONVENTIONS........................................................................................ 11
1.2 FEATURES ........................................................................................... 12
1.2.1 Specifications ................................................................................. 12
1.2.1.1 Main Characteristics .......................................................... 12
1.2.1.2 Physical Characteristics..................................................... 14
1.3 BASICS ........................................................................................... 15
2.1 THE KEYBOARD...................................................................................... 17
2.1.1 Function Keys ................................................................................. 19
2.2 TURNING THE CHARTPLOTTER ON AND OFF.................................... 20
2.2.1 Turning On ...................................................................................... 20
2.2.2 Turning Off...................................................................................... 21
2.3 CHANGING BACKLIGHT AND CONTRAST ........................................... 21
2.4 SELECTING THE LANGUAGE ................................................................ 21
2.5 EXTERNAL CONNECTIONS ................................................................... 22
2.5.1 GPS Connections ........................................................................... 22
2.5.2 Autopilot Connections .................................................................... 22
2.5.3 External NMEA Connections.......................................................... 23
2.5.4 C-COM Connections ...................................................................... 24
2.5.5 External Alarm Connection............................................................. 24
2.6 ADDITIONAL C-CARDS ........................................................................... 25
2.6.1 Inserting C-CARD ........................................................................... 25
2.6.2 Removing C-CARD......................................................................... 26
2.7 THE FLOPPY DISK .................................................................................. 27
2.7.1 Inserting Floppy Disk ...................................................................... 28
2.7.2 Removing Floppy Disk.................................................................... 28
2.8 MENU OPTIONS ...................................................................................... 29
2.9 DATA ENTRY ........................................................................................... 29
3 For the New User ........................................................................................... 31
3.1 SCREEN DISPLAY CONFIGURATION ................................................... 31
3.1.1 Function Keys Customization......................................................... 31
3.1.1.1 Chart Display ..................................................................... 32
3.1.1.2 Depth Graph pages ........................................................... 34
3.1.1.3 Navigation Data page ........................................................ 34
3.1.1.4 Road page ......................................................................... 35
3.1.1.5 GPS Status page ............................................................... 35
3.1.1.6 GPS Data page.................................................................. 36
3.2 GENERAL MENU ..................................................................................... 36
3.2.1 Units Selection................................................................................ 37
3.2.2 Time & Date setting ........................................................................ 37
User Manual
5
Page 4

3.2.3 Cursor Speed.................................................................................. 37
3.3 NAVIGATING TO A SINGLE DESTINATION .......................................... 38
3.3.1 Distance and Bearing to Target ..................................................... 38
3.3.2 Time To Go..................................................................................... 38
3.3.3 Deleting Target ............................................................................... 38
3.4 NAVIGATION ON A ROUTE .................................................................... 39
3.4.1 Adding Waypoint ............................................................................ 39
3.4.2 Creating a Route ............................................................................ 39
3.4.3 Deleting Waypoint .......................................................................... 40
3.4.4 Distance and Bearing to Target ..................................................... 40
3.4.5 Time To Go..................................................................................... 40
3.4.6 Deleting Target ............................................................................... 41
3.5 C-MAP NT+ INFORMATION ..................................................................... 41
3.5.1 Display Mode .................................................................................. 41
3.5.2 Customize Map............................................................................... 42
3.5.2.1 Marine Settings .................................................................. 42
3.5.2.2 Depth Settings ................................................................... 44
3.5.2.3 Land Settings ..................................................................... 44
3.5.2.4 Chart Settings .................................................................... 45
3.5.3 Getting Automatic Info.................................................................... 46
3.5.4 Info Tree and Expanded Info Page ................................................ 47
3.5.5 Info Function ................................................................................... 48
3.5.6 Getting Port Info ............................................................................. 48
3.5.7 Getting Tide Info ............................................................................. 49
3.5.8 Find Function .................................................................................. 51
3.5.8.1 Finding Port Services ........................................................ 51
3.5.8.2 Finding Nearest Ports ........................................................ 51
Finding All Ports ................................................................ 51
Searching by name............................................................ 51
Searching by list ................................................................ 51
3.5.8.3 Finding Tide Stations ......................................................... 52
3.5.8.4 Finding Wrecks .................................................................. 52
3.5.8.5 Finding Obstructions.......................................................... 52
3.5.8.6 Finding Cursor ................................................................... 52
3.5.8.7 Finding Coordinates........................................................... 52
3.6 MAN OVERBOARD (MOB) ...................................................................... 53
3.5.8.8 Finding User Points ........................................................... 52
3.6.1 Inserting MOB .................................................................................. 53
3.6.2 Deleting MOB .................................................................................. 53
4 For the Experienced User ........................................................................................... 55
6
4.1 MORE ABOUT CREATING AND USING ROUTES ................................ 55
4.1.1 Routes ........................................................................................... 55
4.1.1.1 Selecting Route ................................................................. 55
Displaying Route................................................................ 55
Editing notes ...................................................................... 56
Hide/Show Route ............................................................... 56
Find Route ......................................................................... 56
4.1.1.2 Deleting Route ................................................................... 56
4.1.1.3 Finding information on Route: Route Report .................... 56
Changing Speed & Fuel values......................................... 56
Reversing Route ................................................................ 56
4.1.2 Waypoints ....................................................................................... 57
User Manual
Page 5

4.1.2.1 Adding Waypoint ............................................................... 57
4.1.2.2 Moving Waypoint ............................................................... 57
4.1.2.3 Deleting Waypoint ............................................................. 58
4.1.2.4 Editing Waypoint................................................................ 59
4.1.2.5 Goto ................................................................................... 61
4.1.2.6 Inserting Waypoint ............................................................. 61
4.1.2.7 Finding Waypoint ............................................................... 63
4.1.2.8 Finding info on Waypoints: User Points List page ............ 64
Viewing Waypoint in map display...................................... 64
Finding Waypoint in the User Points List page ................. 64
Deleting Waypoint ............................................................. 64
4.2 USING MARKS & EVENTS...................................................................... 65
4.2.1 Marks ........................................................................................... 65
4.2.2 Events ........................................................................................... 68
4.3 AB FUNCTION.......................................................................................... 69
4.3.1 Inserting AB .................................................................................... 69
4.3.2 Deleting AB..................................................................................... 69
4.4 EBL/VRM FUNCTION............................................................................... 69
4.4.1 Inserting EBL/VRM ......................................................................... 70
4.4.2 Deleting EBL/VRM.......................................................................... 70
4.4.3 Editing EBL/VRM............................................................................ 70
4.5 USING THE TRACK FUNCTION ............................................................. 70
4.5.1 Enabling Track Storing ................................................................... 70
4.5.2 Deleting Track ................................................................................ 70
4.5.3 Track Setting Menu ........................................................................ 71
4.6 PAN FUNCTION ....................................................................................... 72
4.6.1 Moving cursor to the Screen center ............................................... 72
4.6.2 Placing cursor on coordinates........................................................ 72
4.7 FLOPPY DISK MENU............................................................................... 72
4.7.1 Saving File ...................................................................................... 72
4.7.2 Loading File .................................................................................... 73
4.7.3 Deleting File .................................................................................... 73
Deleting all stored User Points .......................................... 64
4.2.1.1 Adding Mark ....................................................................... 65
4.2.1.2 Moving Mark ...................................................................... 65
4.2.1.3 Deleting Mark ..................................................................... 66
4.2.1.4 Editing Mark ....................................................................... 66
4.2.1.5 Goto ................................................................................... 67
4.2.1.6 Finding Mark ...................................................................... 67
4.2.1.7 Finding information on Marks: User Points List page ....... 67
4.2.2.1 Adding Event ..................................................................... 68
4.2.2.2 Deleting Event ................................................................... 68
4.2.2.3 Editing Event...................................................................... 68
4.2.2.4 Goto ................................................................................... 68
4.2.2.5 Finding Event ..................................................................... 68
4.2.2.6 Finding information on Events: User Points List page ...... 69
4.5.3.1 Selecting Active Track ....................................................... 71
4.5.3.2 Displaying Track ................................................................ 71
4.5.3.3 Selecting Line Pattern ....................................................... 71
4.5.3.4 Selecting Track memorizing type ...................................... 71
4.5.3.5 Selecting Time Step .......................................................... 71
4.5.3.6 Selecting Distance Step .................................................... 71
4.5.3.7 Delete all Tracks ................................................................ 72
User Manual
7
Page 6

4.7.4 Floppy Disk handling ...................................................................... 73
4.7.4.1 Formatting Floppy Disk...................................................... 73
4.7.4.2 Ordering the Floppy Disk Directory ................................... 73
4.7.4.3 Displaying Time ................................................................. 73
4.7.5 Change Floppy Disk ....................................................................... 74
5 Menu Settings ........................................................................................... 75
5.1 DISPLAY MENU ....................................................................................... 75
5.1.1 Auto Info ......................................................................................... 75
5.1.2 Map Orientation .............................................................................. 76
5.1.3 Screen Amplifier ............................................................................. 76
5.1.4 Course Line .................................................................................... 76
5.1.5 Coordinate System ......................................................................... 76
5.1.6 Map Datum ..................................................................................... 77
5.1.7 Fix Datum ....................................................................................... 77
5.1.8 User Points ..................................................................................... 77
5.1.9 Event Handler Type ........................................................................ 77
5.1.10Data Window Mode ........................................................................ 77
5.1.11Cursor Window ............................................................................... 77
5.1.12Position Symbol .............................................................................. 77
5.2 NAV DISPLAY MENU............................................................................... 78
5.2.1 CDI Scale........................................................................................ 78
5.2.2 Navigation Page ............................................................................. 78
5.3 ADVANCED MENU .................................................................................. 78
5.3.1 Input/Output Menu.......................................................................... 79
5.3.1.1 Port 1/Port 2/Port 3 Input................................................... 79
5.3.1.2 Port 1/Port 2/Port 3 Output ................................................ 79
5.3.1.3 Port 1/Port 2/Port 3 NMEA Output .................................... 79
5.3.1.4 Cable Wiring Pages ........................................................... 79
5.3.2 Fix & Compass Menu ..................................................................... 80
5.3.2.1 Fix Correction..................................................................... 80
5.3.2.2 Compute Correction .......................................................... 80
5.3.2.3 Correction Offset ............................................................... 80
5.3.2.4 Static Navigation ................................................................ 80
5.3.2.5 Position Filter ..................................................................... 80
5.3.2.6 Speed Filter ....................................................................... 80
5.3.2.7 Bearing ............................................................................... 81
5.3.2.8 Magnetic Variation ............................................................. 81
5.3.2.9 Calibrate Compass ............................................................ 81
5.3.3 Simulation Menu ............................................................................. 81
5.3.3.1 Speed ................................................................................. 81
5.3.3.2 Heading .............................................................................. 82
5.3.3.3 Date and Time ................................................................... 82
5.3.3.4 Cursor Control ................................................................... 82
5.3.3.5 Simulation Mode ................................................................ 82
5.3.4 Alarms Menu ................................................................................... 82
5.3.4.1 Auto Off .............................................................................. 82
5.3.4.2 Arrival Alarm ...................................................................... 82
5.3.4.3 XTE Alarm.......................................................................... 83
5.3.4.4 Guard Zone Alarm ............................................................. 83
5.3.4.5 Anchor Alarm ..................................................................... 83
5.3.4.6 Depth Alarm ....................................................................... 83
5.3.4.7 Timer Alarm Menu ............................................................. 83
8
User Manual
Page 7

Timer Alarm ....................................................................... 84
Timer Value ....................................................................... 84
Timer Direction .................................................................. 84
5.3.4.8 Grounding Alarm Menu ..................................................... 84
Grounding Alarm................................................................ 84
Grounding Depth Limit....................................................... 85
Grounding Alarm Range .................................................... 85
Grounding Alarm Report.................................................... 85
5.3.4.9 External Alarm ................................................................... 85
6 For the Technician ........................................................................................... 87
A C-Forecast ........................................................................................... 95
6.1 DIMENSIONS ........................................................................................... 87
6.2 INSTALLATION AND REMOVING........................................................... 88
6.3 EXTERNAL CONNECTORS .................................................................... 89
6.4 TROUBLESHOOTING.............................................................................. 90
6.4.1 Problems and Solutions ................................................................. 90
6.4.2 When Nothing Else Works .............................................................. 90
6.4.3 If you need assistance.................................................................... 90
6.5 SYSTEM TEST ......................................................................................... 91
6.5.1 RAM menu ...................................................................................... 91
6.5.2 DIM menu ....................................................................................... 91
6.5.3 Cartridges ....................................................................................... 92
6.5.4 Modem Test.................................................................................... 92
6.5.5 Serial Ports ..................................................................................... 92
6.5.6 External Alarm ................................................................................ 93
6.5.7 Floppy Disk ..................................................................................... 93
A.1 PRESENTATION OF DATA ..................................................................... 96
A.1.1 Presentation of weather information ............................................... 98
A.1.1.1 Viewing the information in Navigation mode ..................... 98
A.1.1.2 Viewing the weather information in Browse mode ............ 98
A.2 SYSTEM SET UP C-FORECAST ............................................................ 99
A.2.1 Installation of hardware components ............................................ 100
A.2.1.1 Electrical connection........................................................ 100
A.2.1.2 Verification of C-COM module......................................... 100
A.2.1.3 The GSM SIM-card .......................................................... 101
A.2.2 Installation of Software.................................................................. 101
A.2.2.1 Registrations of user ID ................................................... 101
A.2.2.2 Inserting the telephone N. of the C-Forecast server ....... 101
A.2.2.3 Activation of the serial port .............................................. 101
A.2.3 Transfer of Weather Data ............................................................. 102
A.2.3.1 Insert current date and time ............................................ 102
A.2.3.2 Selection of an area from which to get weather data...... 102
Inserting of point of departure ......................................... 102
Inserting heading ............................................................. 102
A.2.3.3 Selecting type of weather information to be collected .... 102
A.2.3.4 Download of data ............................................................. 102
Error messages ............................................................... 103
SIM-card PIN Error .......................................................... 103
Other Errors ..................................................................... 103
A.3 MENU SETTINGS .................................................................................. 104
A.3.1 C-Forecast SetUp menu ............................................................... 104
User Manual
9
Page 8

A.3.1.1 Display ............................................................................. 104
A.3.1.2 Wind Speed Alert............................................................. 104
A.3.1.3 Waves Height Alert .......................................................... 104
A.3.1.4 Wind Speed Unit .............................................................. 105
A.3.1.5 Wave Height Unit ............................................................. 105
A.3.1.6 User Identifier................................................................... 105
A.3.1.7 Telephone Number .......................................................... 105
A.3.1.8 Sim Pin............................................................................. 105
A.3.1.9 Max Speed ....................................................................... 105
A.3.1.10 C-COM/Modem Port ...................................................... 106
A.3.2 Download Preview......................................................................... 106
A.3.2.1 Type ................................................................................. 106
A.3.2.2 Mode and Position ........................................................... 106
A.3.2.3 Show on Chart ................................................................. 107
A.3.2.4 Course.............................................................................. 107
A.3.2.5 ETD and Date .................................................................. 107
A.3.2.6 Download Now ................................................................. 107
A.3.3 Browse ......................................................................................... 108
B C-Staff ......................................................................................... 109
C Terms ......................................................................................... 111
Analytical Index ......................................................................................... 117
B.1 C-STAFF MENU ..................................................................................... 110
B.1.1 Send Position ................................................................................ 110
B.1.2 Position Request ........................................................................... 110
10
User Manual
Page 9

1
Introduction
Congratulations on your purchase of the chartplotter!
If you have not used a position-finding instrument before and intend to use
your chartplotter for navigating, we suggest you should read this User Manual and
make sure you are familiar with its contents. The User Manual is related both to the
gray scale and color models of the chartplotter.
The User Manual is divided into three main parts. Chapter "Before You Begin" introduces you to the basic information to get you start using the chartplotter.
Chapter "For the New User" should be read first to become familiar with your new
instrument. Chapter "For the Experienced User" introduces the advanced features of
the chartplotter.
1.1 CONVENTIONS
Throughout this User Manual, the labelled keys are shown in capitals letters
enclosed between single inverted commas, for example 'MENU'; the software keys
are shown in small capitals letters enclosed between single inverted commas, for example 'E
names enclosed between inverted commas, for example 'MENU' + "ADVANCED"
+ 'ENTER' + "FIX & COMPASS" + 'ENTER' means: press the 'MENU' key,
using the Joystick to select the ADVANCED menu and press 'ENTER' to go in it;
then using the Joystick to select the FIX & COMPASS menu and press 'ENTER' to go
in it.
DIT
'.
Menu operations are in bold characters listed by keys sequence with the menu
Terms underlined, for example Target, are explained in the Appendix "Terms".
User Manual
11
Page 10

1.2 FEATURES
The chartplotter is a computer specifically designed for nautical use but, more
precisely, to ease and speed up all calculations, which so far have been done manually. If connected to a positioning instrument, the chartplotter displays the current
position, the speed, and the heading of the boat and its Track. The user information
like Waypoints, Marks and Tracks can then be stored on a Floppy Disk and can be
recalled at any time. On the screen are shown navigation data and cartographic information obtained from electronic charts of C-MAP NT+ C-CARD.
When the package containing the chartplotter is first opened, please check it
for the following contents (if any parts are missing contact the dealer the chartplotter
was purchased from):
• Power supply and I/O 8 pins cable 1,5 mt./5.9"; cable code CBC0FS0804
• Desktop brackets kit
• Two I/O 6 pins cables 1 mt./3.9"; cable code CBC0FS0603
• Fuse 2A + Fuse hlder (2pcs)
• External packaging
• User Manual
C-MAP NT+ C-CARD (cartography data cards) are available through your
local dealer. For additional information on C-MAP Cartography visit web site at
www.c-map.com.
1.2.1 SPECIFICATIONS
1.2.1.1MAIN CHARACTERISTICS
Recordable Individual points
• User Points : 5000
• Type of User Points : 16
Routes
• Routes : 3000
• Max User Points per Route: 3000
Tracking
• Tracks : 5
• Points per Track : 5000
• Step by Distance : 0.01, 0.05, 0.1, 0.5, 1, 2, 5, 10 Nm
• Step by Time : 1, 5, 10, 30 Sec, 1 Min
Cartographic Functions
• Worldwide Background
12
User Manual
Page 11

• Detailed Map by using C-MAP NT
• Coordinates System (ddd mm ss, ddd mm.mm, ddd mm.mmm, UTM, OSGB, TD)
• Map Datum
• Data Window mode
• Display Mode (Full, Simple, Fishing, Low, Custom)
• Marine
+
C-CARD
Names, Nav-Aids, Light Sectors, Attention Areas, Tides & Currents, Seabed
Type, Ports & Services, Tracks & Routes, Underwater Objects
• Depth
Depth Areas, Depth Areas Min/Max, Depth Lines & Sndgs, Depth Lines &
Sndgs Min/Max
• Land
Natural Features, Rivers & Lakes, Cultural Features, Landmarks
• Chart
Lat/Lon Grid, Chart Boundaries, Cartography, Mixing Levels, Declutter, Map
Presentation, Display Mode
Fix Functions
• WAAS
• Fix Correction (manual and automatic)
• Position Filter
• Speed Filter
• Map Orientation (North, Course)
• Fix Datum
• Compass Calibration
• Bearings True and Magnetic
• Variation user selectable
• Static Navigation
Report Functions
• Depth Graph page
• Depth Graph Full page
• Navigation Data page (change the fields)
• 3D Road page (change the fields)
• GPS Status page
• GPS Data page
• User Points List page
• About page
Special Functions
• Auto Info
User Manual
13
Page 12

• Find
Port Services, Tide Stations, Wrecks, Obstructions, Cursor, Coordinates, User
Points
• A/B Function
• EBL/VRM Function
• Navigation to Destination
• Speed Unit (Mph, Kts, Kph)
• Distance Unit (Km, Nm, Sm)
• Depth Unit (Ft, FM, Mt)
• Altitude Unit (Ft, FL, Mt)
• Date & Time Setup (Local, UTC)
• Keypad Beep selection
• Alarms Handling
Arrival Alarm, XTE Alarm, Anchor Alarm, Depth Alarm, Grounding Alarm,
Grounding Depth Limit, Grounding Alarm Range, Grounding Alarm Report
• MOB Function
• Simulation
Speed, Heading, Date, Time, Cursor Control, Simulation On/Off
Auxiliary Memory
• Floppy Disk
Interface
• Three I/O ports
1.2.1.2 PHYSICAL CHARACTERISTICS
Chartplotter size (inch/mm)
• 15"x 13.5"x 8.9" (381.5mm x 342mm x 221mm)
Chartplotter weight
• 4,5 Kg
Floppy Disk
• 3" 1/2 1.4 MB
LCD display
• Gray Scale : LCD 12.1" GRAYSCALE, polarized
• Color : LCD 12.1" TFT Color, polarized
• Resolution : 800 x 600 pixels
Power consumption
• 1.6A @10V
Power supply
• 10 - 35 Volt dc, 18 Watt
14
User Manual
Page 13
Operating Temperature Range
• From 0°C to 55°C (from 32°F to 131°F)
Memory
• Non volatile with battery back-up
Keyboard
• Backlighted, silicon rubber
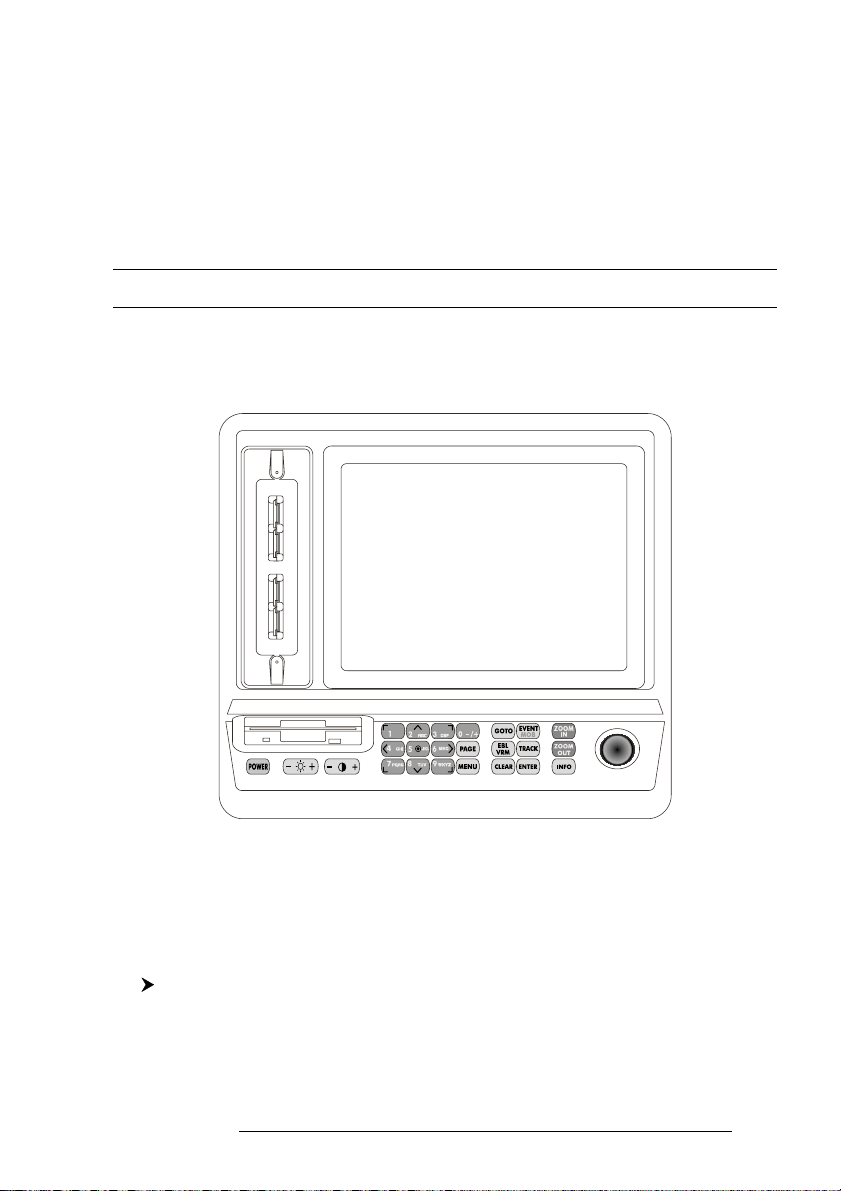
1.3 BASICS
The chartplotter is controlled by using 24 keys. There is also a Joystick to
move a cursor across the screen.
Fig. 1.3 - The chartplotter
As you press a key, a single audio beep confirms the key action; every time
the key pressed is not valid, three rapid beeps sound indicates that no response is
available. Note that it is possible to enable (On) or disable (Off) the keypad beep
following the procedure:
'MENU' + "GENERAL" + 'ENTER' + "Keypad Beep" + 'ENTER'
User Manual
15
Page 14

16
User Manual
Page 15

2
Before You Begin
This chapter provides basic information to get you start using the chartplotter;
it will help you to become familiar with the chart display and the functions of the
controls before you start using the chartplotter.
2.1 THE KEYBOARD
The key
Press and hold 'POWER' down for 1 second to turn the chartplotter On.
Press and hold 'POWER' down (once the chartplotter has been turned On) for 3
seconds turns the chartplotter Off.
The key
Press 'DISPLAY +/-' to adjust the LCD and keypad backlight.
The key
Press 'CONTRAST +/-' to adjust the LCD contrast.
The key
Numeric key or moves cursor top left corner.
The key
Numeric/letter key or moves cursor top.
The key
Numeric/letter key or moves cursor top right corner.
The key
Numeric/letter key or moves cursor left.
The key
Numeric/letter key or centers the map at the current cursor position. If
User Manual
17
Page 16
Navigate (Home) mode is set the map is already centered on the map display.
The key
Numeric/letter key or moves cursor right.
The key
Numeric/letter key or moves cursor bottom left corner.
The key
Numeric/letter key or moves cursor bottom.
The key
Numeric/letter key or moves cursor bottom right corner.
The key
Numeric key.
The key
Press 'PAGE' to select the configuration you wish among cartography and
text area, Depth Graph pages, GPS Data page, GPS Status Page, Navigation Data
page, 3D Road Data page.
The key
Press 'MENU' to select the FUNCTIONS Menu. When in Functions Menu,
moving the Joystick to the right enters a selection, moving the Joystick to the left clears
the function.
If pressing 'MENU' for 3 seconds from chart and data page allows to customize all data fields shown in the selected page.
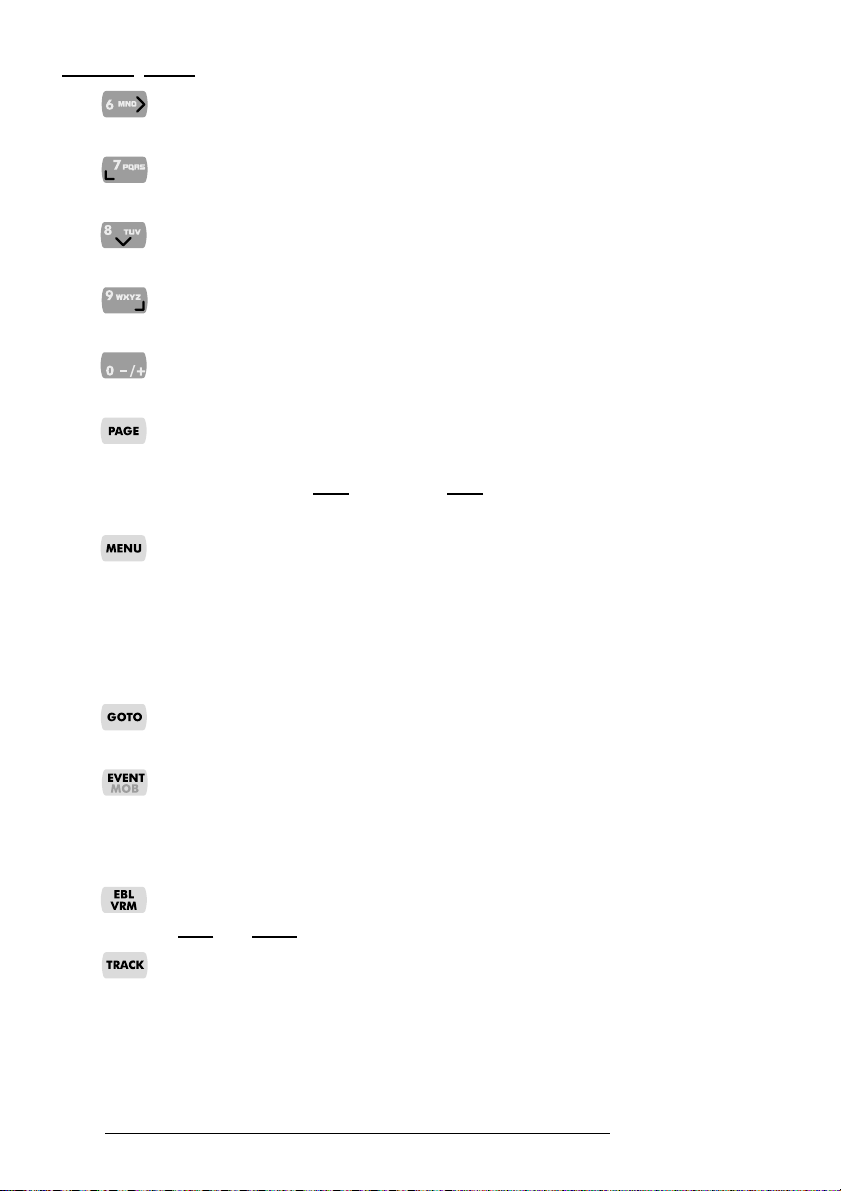
The key
Press 'GOTO' to select the Goto function.
The key
Press and release 'EVENT/MOB' to place Event marker. Long press
'EVENT/MOB' to insert the MOB (Man OverBoard); long press 'EVENT/MOB'
when the MOB is already present deletes it.
The key
Places EBL and VRM.
The key
Opens Track menu to select Track, switches Track On/Off, delete Track,
change Track color/pattern, change Track recording step, switches Track display
On/Off.
18
User Manual
Page 17

The key
Press 'CLEAR' to exit from menu or to leave a menu without making changes.
If you are not into a menu, sets the Navigate mode (Home).
The key
Press 'ENTER' to select the preferred option, to confirm selection, to create
Objects (Mark, Waypoint, A-B).
The and keys
Press 'ZOOM IN' shows more details of a smaller area, by changing the
chart scale and zooming in on your display. Press 'ZOOM OUT' to operate similarly to the 'ZOOM IN', except in reverse, changing the scale and showing a wider,
otherwise less detailed view.
The key
Press 'INFO' to select Info function.
The Joystick
The Joystick moves the cursor about on the display screen, quickly and accurately. It also scrolls the preferred option in the menu page(s).
If in Navigate (Home) mode, it allows to exit from Navigate mode.
2.1.1 FUNCTION KEYS
When the cursor is placed over any User Point or any cartographic object, a
window containing the information about the selected object is shown on a variable
location of the screen (not covering the cursor icon). At the same time some Function Keys (up to five) are shown on the bottom of the page. The Function Keys are
associated to the function that can be applied to the selected object. Each Function
Key shows a number and the name of the function.
For example when the cursor is placed over a Mark, the information window
with Coordinates, Name, Icon and all other Mark information is shown. The following Functions Keys are shown on the bottom of the map display (see the following
Fig 2.1.1).
Pressing any numerical keys from '1' to '5', the function associated to the
selected number is executed. Otherwise pressing any numerical key not active (not
associated to any function) 3 beeps will be sounded and the Function Keys are kept
shown. Pressing 'CLEAR' the Functions Keys are removed from the screen, pressing
any other key the Functions Keys will be closed and the function associated to the
pressed key will be executed.
User Manual
19
Page 18
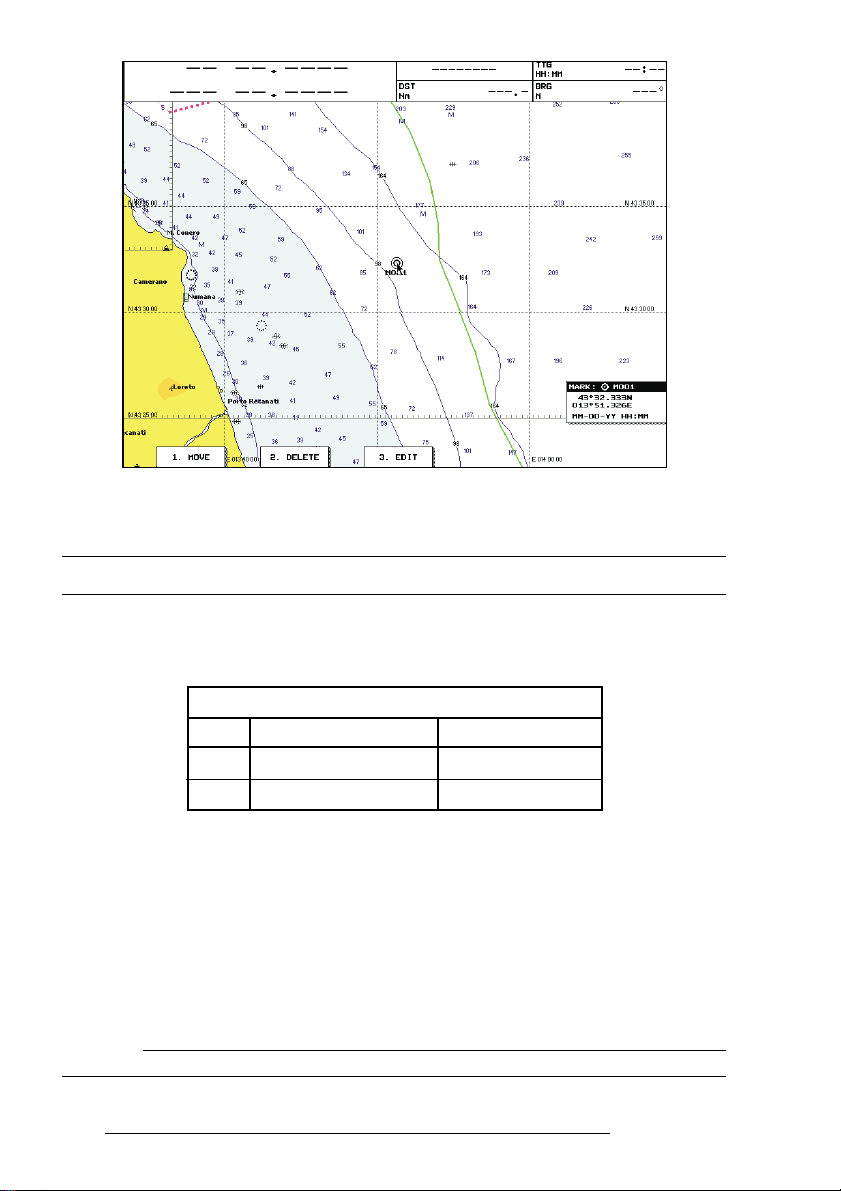
Fig. 2.1.1 - The Function Keys
POWER & I/O CONNECTOR
2.2 TURNING THE CHARTPLOTTER ON AND OFF
Before powering On the chartplotter, check for the correct voltage (10-35
volt dc) and the correct connections with the positioning instrument:
POWER & I/O CONNECTOR
PIN # CABLE WIRE COLOR FUNCTION
1 BLACK GND/COMMON
2 RED +
o
Fig. 2.2 - Power On
10-35 Vdc
2.2.1 TURNING ON
Press and hold 'POWER' for 1 second. The chartplotter emits one rapid
beep sound, and a title page is opened: the software name and version (*), the Worldwide Cartography database version and the code and version of the C-CARDs NT
inserted are shown.
Note (*)
The software version is subject to change without notice. This User Manual is valid anyway.
+
20
User Manual
Page 19

Fig. 2.2.1 - Title page
After a few seconds, the first of the two Caution Notice pages is displayed,
reminding you the chartplotter is only an aid to navigation and should be used with
appropriate prudence. The electronic charts are not intended to substitute for the
official charts. Then the cartographic screen is displayed.
2.2.2 TURNING OFF
Press 'POWER' and hold for 3 seconds: a countdown timer appears on the
screen, if you release the key before the countdown timer reaches zero, the chartplotter
will remain On.
2.3 CHANGING BACKLIGHT AND CONTRAST
You can modify the intensity of the backlight and contrast to make reading
easy and comfortable. By 'DISPLAY +/-' and 'CONTRAST +/-' it is possible to
increase or decrease the brightness: each time you press the key "+", the light value is
increased to the max value, if you press the "-", light value is decreased to the min
value.
WARNING !!!
At very low temperatures the CCFL backlight may not glow properly. Allow a few minutes for it to warm up.
2.4 SELECTING THE LANGUAGE
It is possible to select the language in which you wish information to be
displayed (for screen labels, menus and options, but it is not affect the map informa-
User Manual
21
Page 20
tion). The default setting is English.
'MENU' + "GENERAL" + 'ENTER' + "Language" + 'ENTER'
Choose the language you prefer and press 'ENTER' to confirm.
2.5 EXTERNAL CONNECTIONS
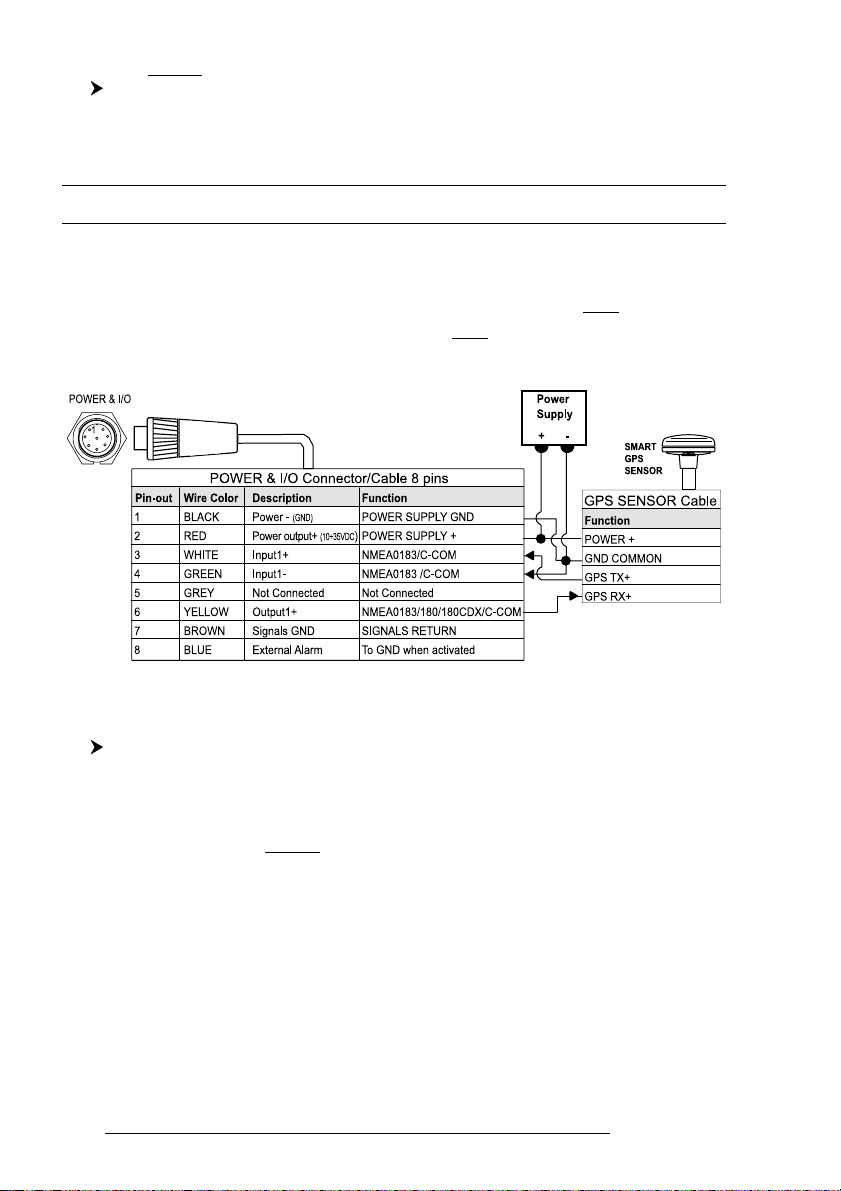
2.5.1 GPS CONNECTIONS
Select one of the three Ports available and connect the GPS wires to the
selected port signals. For example to connect the GPS to POWER & I/O connector
(serial Port 1) see the following picture:
Fig. 2.5.1 - GPS Connection on serial Port 1
Then choose your preferred setting following the procedure:
'MENU' + "ADVANCED" + 'ENTER' + "INPUT/OUTPUT" + 'ENTER' +
"Port 1 Input" + 'ENTER'
Select your preferred setting among the NMEA available settings NMEA
1200-N81-N, NMEA 4800-N81-N, NMEA 4800-N82-N, NMEA 9600-O81-N,
NMEA 9600-N81-N (the default setting is 4800-N81-N) and press 'ENTER' to confirm.
2.5.2 AUTOPILOT CONNECTIONS
Select one of the three Ports available and connect the AUTOPILOT wires
to selected port signals. For example to connect the AUTOPILOT to PORT 1
connector (serial Port 2) see the following picture:
22
User Manual
Page 21
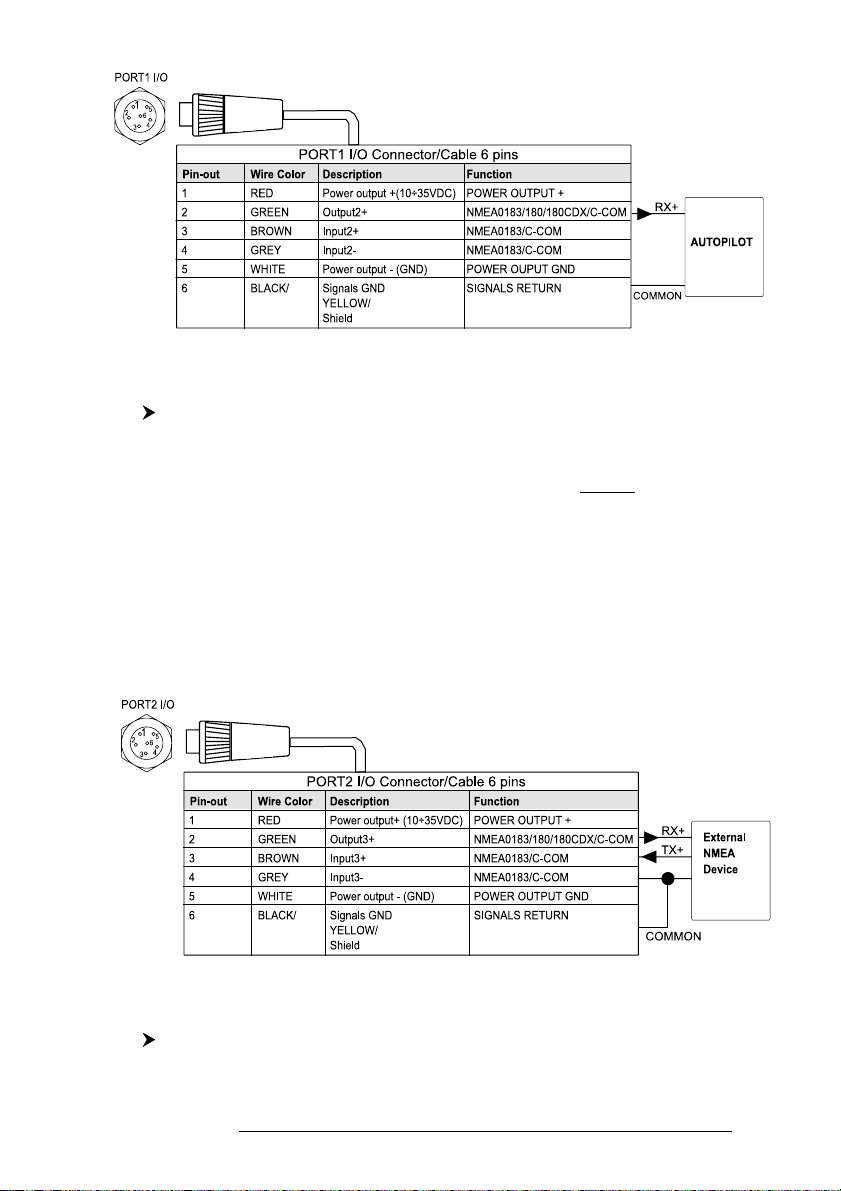
Fig. 2.5.2 - Autopilot Connections on serial Port 2
Then choose your preferred setting following the procedure:
'MENU' + "ADVANCED" + 'ENTER' + "INPUT/OUTPUT" + 'ENTER' +
"Port 2 Output" + 'ENTER'
Select your preferred setting among the NMEA available settings NMEA
0183 4800-N81-N, NMEA 0180, NMEA 0180/CDX (the default setting is NMEA
0183 4800-N81-N) and press 'ENTER' to confirm.
2.5.3 EXTERNAL NMEA CONNECTIONS
Select one of the three Ports available and connect the EXTERNAL NMEA
wires to selected port signals. For example to connect the EXTERNAL NMEA to
PORT 2 connector (serial Port 3) see the following picture:
Then choose your preferred setting for input format following the procedure:
'MENU' + "ADVANCED" + 'ENTER' + "INPUT/OUTPUT" + 'ENTER' +
"Port 3 Input" + 'ENTER'
User Manual
Fig. 2.5.3 - External NMEA Connections on serial Port 3
23
Page 22
Select your setting among the NMEA available settings NMEA 1200-N81N, NMEA 4800-N81-N, NMEA 4800-N82-N, NMEA 9600-O81-N, NMEA 9600N81-N (the default setting is 4800-N81-N) and press 'ENTER' to confirm.
Now set the output format to the same input format following the procedure:
'MENU' + "ADVANCED" + 'ENTER' + "INPUT/OUTPUT" + 'ENTER' +
"Port 3 Output" + 'ENTER'
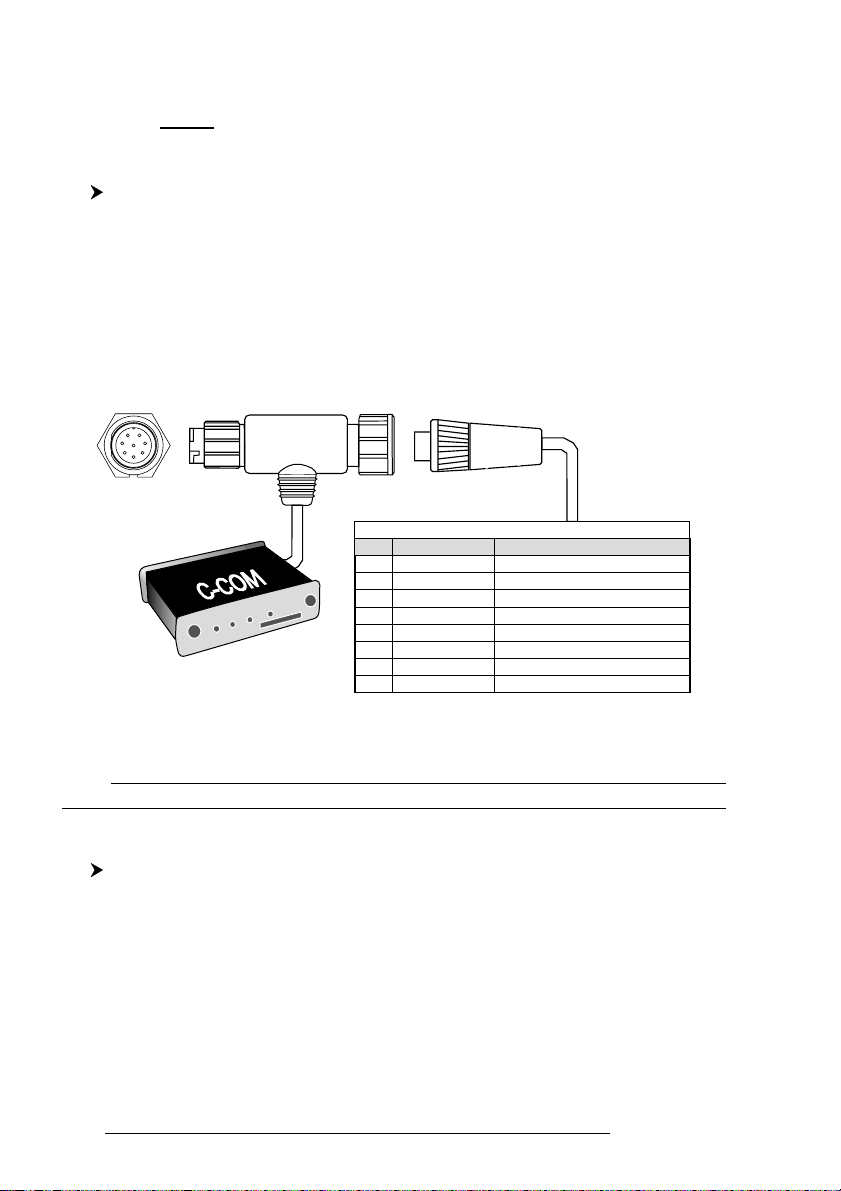
2.5.4 C-COM CONNECTIONS
To connect the modem C-COM to the chart plotter follow the procedure:
1. Connect Power & I/O as follows:
POWER & I/O
POWER & I/O CONNECTOR
WIRE COLOR FUNCTION
PIN#
BLACK GND/COMMON
1
RED PWR+ (10-35 Vdc)
2
WHITE
3
GREEN
4
GREY OUTPUT3+
5
YELLOW USED BY C-COM
6
BROWN
7
BLU OUTPUT EXTERNAL ALARM+
8
USED BY C-COM
USED BY C-COM
INPUT3+
Fig. 2.5.4 - C-COM Connection
Note
The connection is valid for the C-COM IR and C-COM RS232 too.
2. Into the Input/Output menu, set the C-COM for Port 1 as follows:
'MENU' + "ADVANCED" + 'ENTER' + "INPUT/OUTPUT" + 'ENTER' +
"Port 1 Input" + 'ENTER' + "C-COM" + 'ENTER'
Also the modem C-COM can be connected to the Port 2 and 3, in this case
set the format for the selected Port.
2.5.5 EXTERNAL ALARM CONNECTION
To connect the External Alarm device see the following picture:
24
User Manual
Page 23
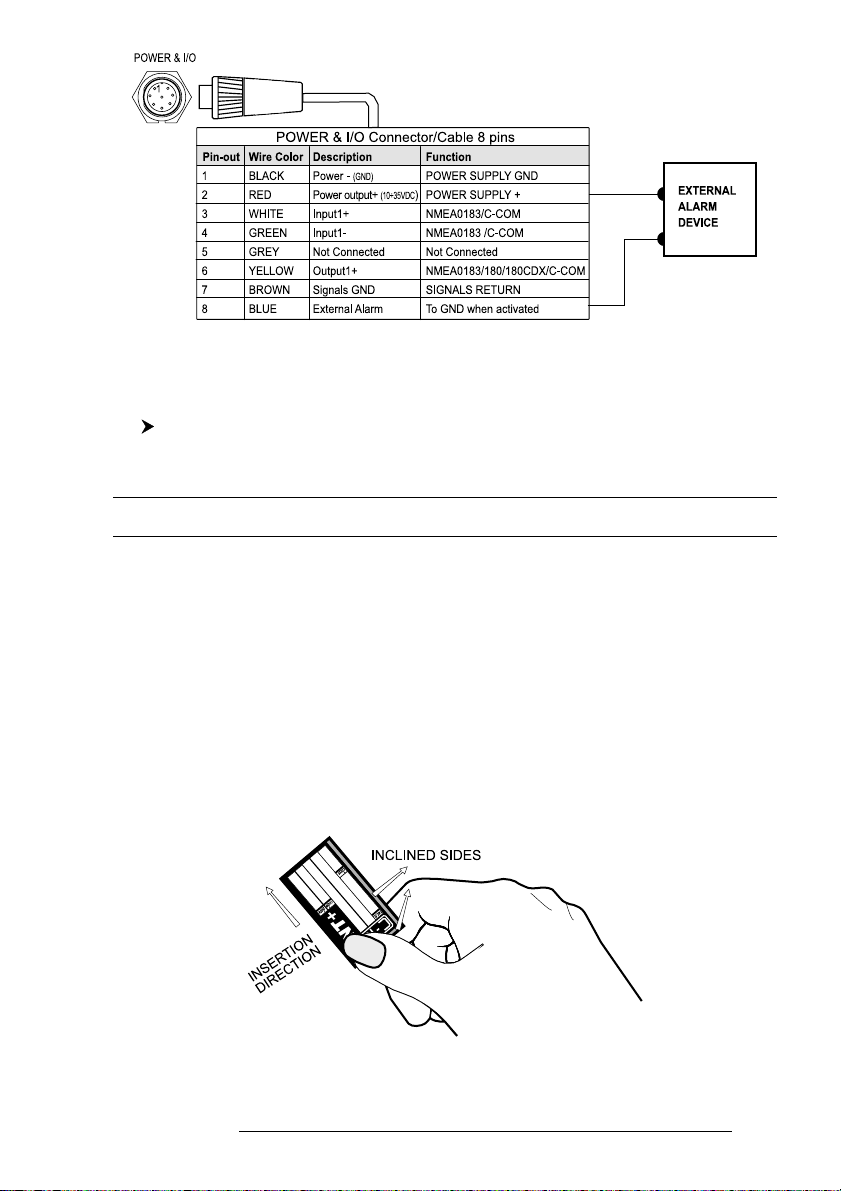
Fig. 2.5.5 - External Alarm Connection
Once the connection is active, to enable the External Alarm follow the pro-
cedure:
'MENU' + "ALARMS" + 'ENTER' + "External Alarm" + 'ENTER' + "ON" + 'ENTER'
2.6 ADDITIONAL C-CARDS
The chartplotter has a built-in world map. But during navigation you will
need to use larger scale charts with detailed information. These are available using the
C-CARDs. The chartplotter allows you to install four of them at the same time,
because there are four slots. You can insert and remove C-CARDs while a chart is
displayed; but you do not insert or remove C-CARDs while map is redrawing.
2.6.1 INSERTING C-CARD
Hold the C-CARD by the short inclined side so that you can see the C-MAP
label.
User Manual
Fig. 2.6.1 - Inserting C-CARD (I)
25
Page 24
Gently push the C-CARD into one of the available slots (1); push the C-CARD
in as far as it will go, then move it to the right (2) to hold fixed into the slot (3).
Fig. 2.6.1a - Inserting C-CARD (II)
The new cartography information will be displayed when you move the cursor into an area covered by the new charts making pan or zoom operations. The
boundary of each chart digitized in the current C-CARD is shown as a rectangle.
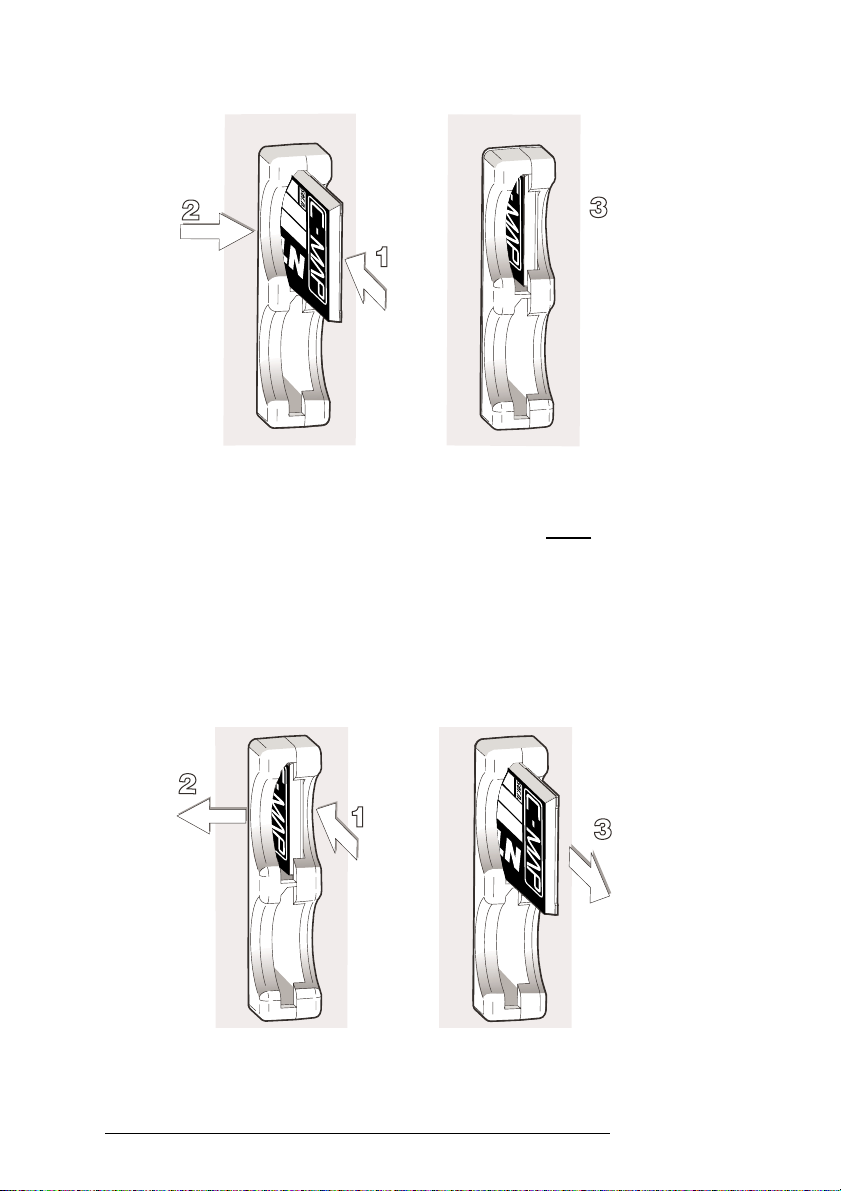
2.6.2 REMOVING C-CARD
Press lightly the C-CARD you wish to remove (1) and move it to the left (2)
until you hear a click: the C-CARD will ejected out of the slot (3).
26
Fig. 2.6.2 - Removing C-CARD
User Manual
Page 25
Note
C-MAP is continuously creating new charts and revising old ones. If you wish to receive information on the newest
availbale charts, you can write for the catalog of available C-MAP NT+ C-CARD at your dealer.
2.7 THE FLOPPY DISK
The floppy disk drive is used by the chartplotter to save user data: it is the
most convenient medium for storing and retrieving your information.
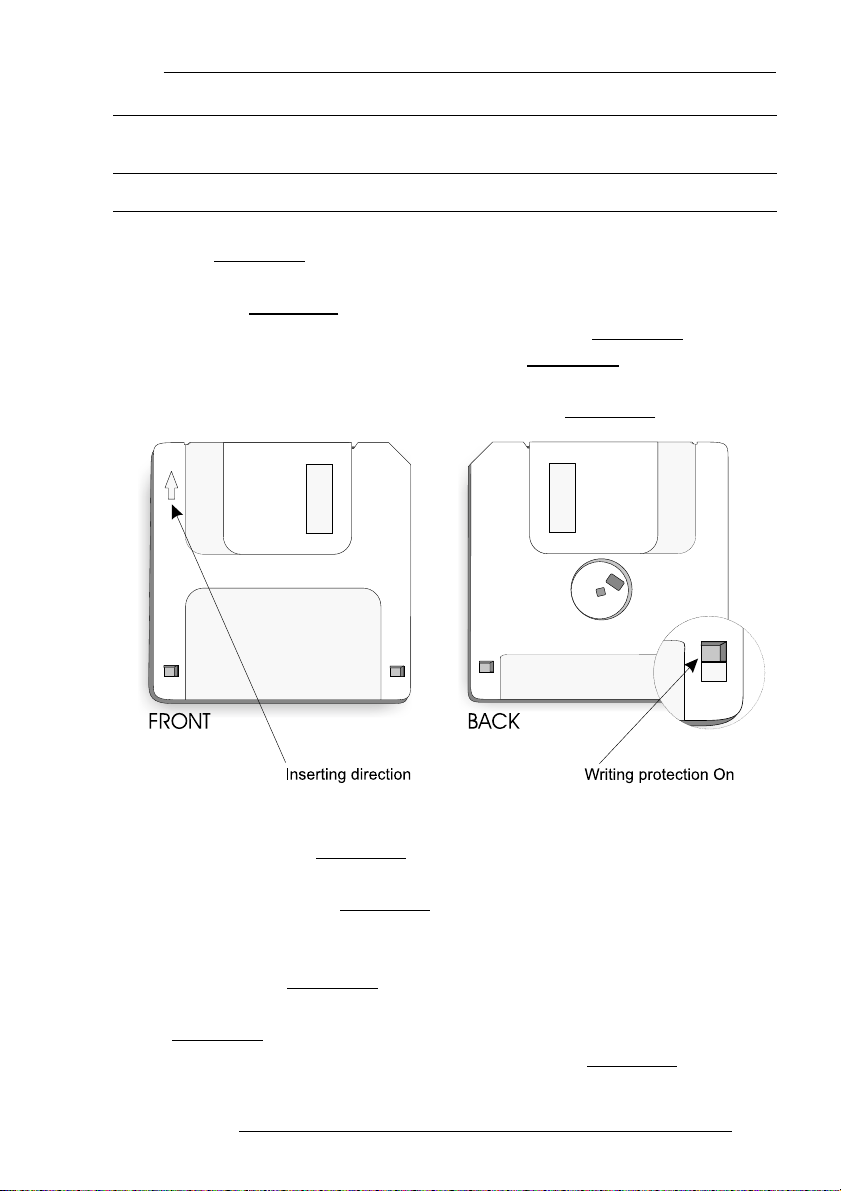
The 3.5" floppy disk has rigid plastic cover with metal shields that guard the
disk from dirt and fingerprint. You can write protect the floppy disk to preserve
the accidental storage of information on disk. The floppy disk has a write protect
notch; this notch can be covered with a built-in tab. If the write protection notch is
covered by the tab, no data can be written (saved) to the floppy disk.
Fig. 2.7 - Floppy Disk
You should store floppy disk in a safe place, away from dust, moisture, magnetism and extreme temperatures.
Be sure to label each floppy disk you use, since labels help you identify what
data is on the disk and remind you that the disk has information stored on it.
Before a new floppy disk can be used, you must format it, by selecting the
format disk option provided by the chart plotter (see Par. 4.7). This function initializes the floppy disk and prepares it for storing information. Remember that if a disk
is not blank, formatting it destroys any data already on the floppy disk.
User Manual
27
Page 26
WARNING !!!
The floppy disks must be formatted in order to be reused, considering though that with this operation all
data memorized on the floppy disk will be lost.
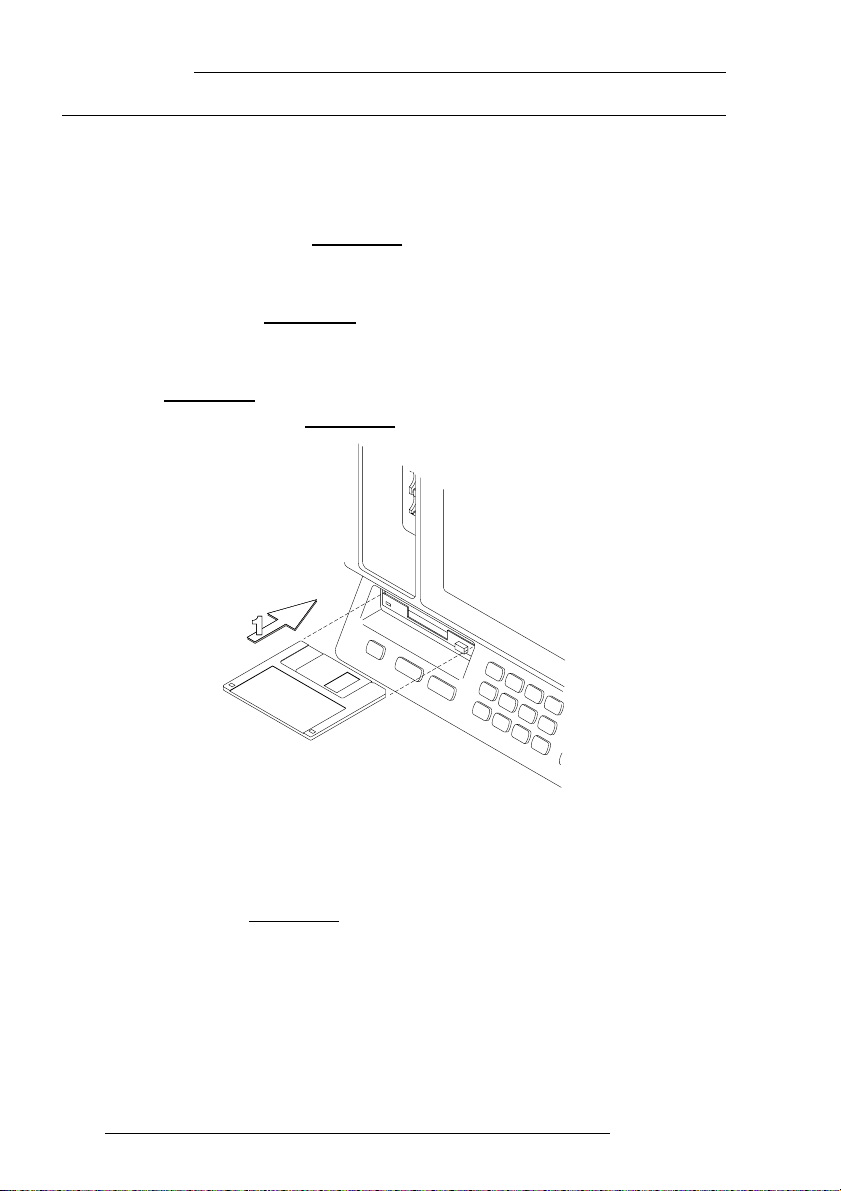
2.7.1 INSERTING FLOPPY DISK
To correctly insert the floppy disk into the drive, take the disk so that the
arrow impressed on the plastic cover faces the top and points to the drive (see Fig.
2.6.1).
Gently push the floppy disk into the drive (1): if the drive seems to offer
resistance to the disk, immediately stop and verify that nothing obstructs the transit
into the drive and make sure to have the disk correctly facing to the top. To try again
to insert the floppy disk: if there are problems, contact your dealer (never force the
disk into the drive). Insert the floppy disk into the drive until you hear a "click".
Fig. 2.7.1 - Inserting Floppy Disk
2.7.2 REMOVING FLOPPY DISK
To remove the floppy disk from the drive, press the key under the slot: the
disk will exit partially so that it is possible to extract it from the drive (2).
28
User Manual
Page 27
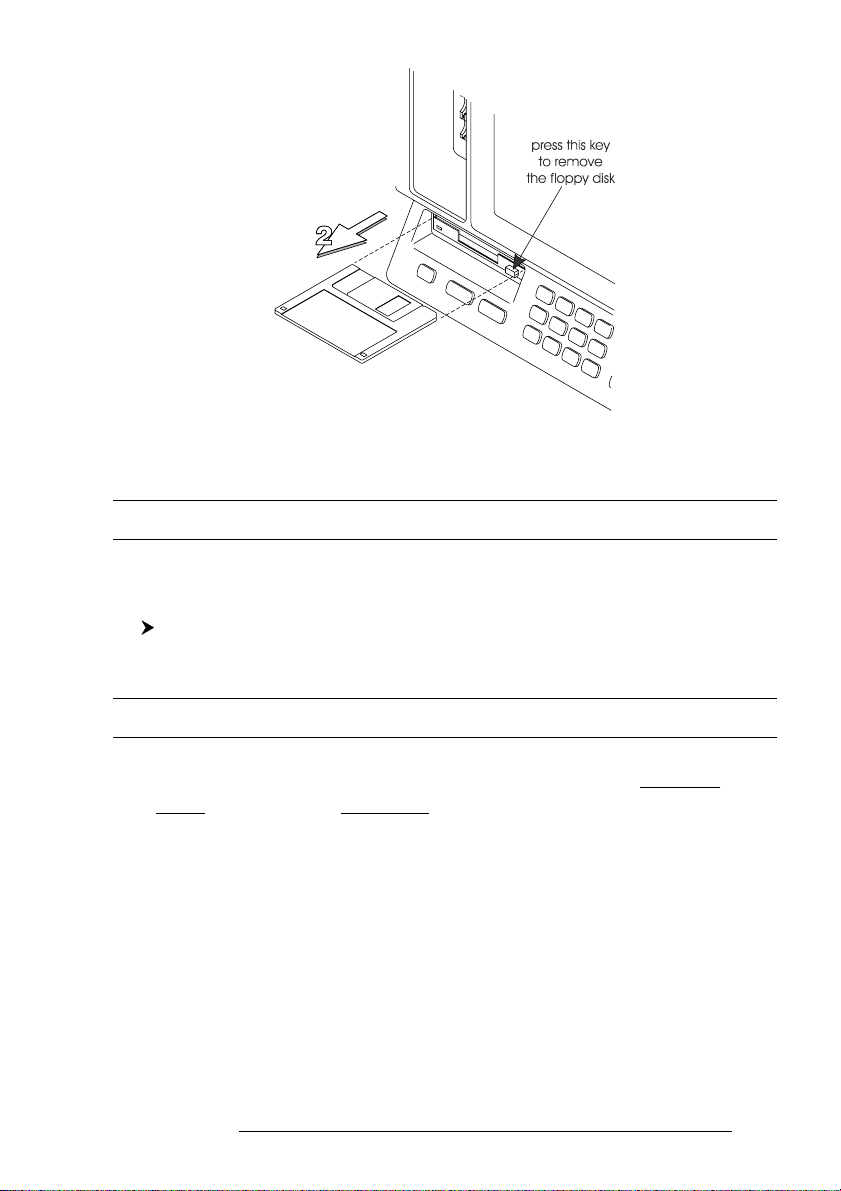
Fig. 2.7.2 - Removing Floppy Disk
2.8 MENU OPTIONS
You may select how the chartplotter displays primary information (such as
how time is displayed) from the Functions Menu.
'MENU'
2.9 DATA ENTRY
Information is keyed into the chartplotter when editing a Waypoint, enter-
ing a Route or using the Fix Correction functions. When the field is highlighted:
- Enter or edit data by pressing up/down Joystick to step through the available
characters until the preferred character is displayed.
- Press right Joystick to move the cursor to the right.
- Use left Joystick to move the cursor to the left.
User Manual
29
Page 28

30
User Manual
Page 29

3
For the New User
In order to get started using your chartplotter, you must do the following
things:
1) Your chartplotter must have been installed properly according to the in-
stallation instruction on Par. 6.2.
2) You must have performed the proper settings for use with your positioning instrument (see Par. 2.5) and inserting the C-CARD for navigating in area you
wish (see Par. 2.6).
3) You must have turned on the chartplotter and adjust the brightness and
contrast of the display (see Par. 2.2 and 2.3).
Once this is done, you can use your chartplotter for navigation.
3.1 SCREEN DISPLAY CONFIGURATION
All pages (Chart page, Depth Graph pages, Navigation Data page, 3D Road
Data page, GPS Data page, GPS Status page) are shown on full screen window. In all
data pages (Navigation Data page, 3D Road Data page, GPS Data page, GPS Status
page) five Functions Keys are always shown on the bottom of the page in order to
allow a quick way to select the other pages.
3.1.1 FUNCTION KEYS CUSTOMIZATION
In all data pages the user can customize the Function Keys. Pressing and
holding down for 1 second the numeric key '1', '2', '3', '4', '5' it will be possible to
assign a different selection to the relative Function Key.
User Manual
31
Page 30

Fig. 3.1.1 - The Function Keys customization
Move the Joystick up/down to place the selector on the preferred item; move
the Joystick to the right or press 'ENTER' to set the selected item; move the Joystick to
the left or press 'CLEAR' to close the pop-up window. The possible choices are:
CHART (Chart and data page, see Par. 3.1.1.1)
NAV(
IGATION
) (Navigation Data page, see Par. 3.1.1.3)
ROAD (3D Road page, see Par. 3.1.1.4)
STATUS (GPS Status page, see Par. 3.1.1.5)
GPS (GPS Data page, see Par. 3.1.1.6)
DEPTH 1 (Depth graph -small- page, see Par. 3.1.1.2)
DEPTH 2 (Depth graph Full page, see Par. 3.1.1.2)
The default settings for the soft keys labels are: '1. C
S
TATUS
', '5. GPS'.
HART
', '2. NAV', '3. R
OAD
', '4.
3.1.1.1Chart Display
It is very important to access the information you need as you need it and
understand what is displayed on the screen.
'PAGE' + "CHART DISPLAY" + 'ENTER'
or
'#. CHART' (if it is present, where # is 1, 2, 3, 4 or 5)
Shows the chart display and Text Area (if selected). With the following procedure:
'MENU' + "DISPLAY" + 'ENTER' + "Data Window Mode" + 'ENTER'
it is possible to customize the Text Area layout among Full Screen, Text
Area with 5 boxes and Text Area with 8 boxes.
32
User Manual
Page 31

Fig. 3.1.1.1 - Text Area layout
It is also possible to edit fields shown in every screen configuration. Edit
mode is activated directly from the chart display pressing 'MENU' for 3 seconds.
Once the Edit mode is active, the first box with the label turns in reverse video
screen. The user can choose the active box by moving the Joystick left or right. Press-
ing 'ENTER' the user can choose the data to be shown on the selected field by moving through the selections and pressing 'ENTER' again.
User Manual
Fig. 3.1.1.1a - Edit mode
33
Page 32

Note
(*) It will be shown only if the Destination is present.
Once 'ENTER' is pressed the data type is set. The selection window is closed
and the Text Area changes according to the selected data type. Press 'CLEAR' to exit
the Edit mode.
Note
The Display Menu can be selected only from the Chart Display page and the Depth Graph page in split mode.
3.1.1.2Depth Graph pages
The Depth graph can be shown in two different modes. To select the Depth
Graph in split mode:
'PAGE' + "DEPTH GRAPH" + 'ENTER'
or
'#. DEPTH 1' (if it is present, where # is 1, 2, 3, 4 or 5)
Fig. 3.1.1.2 - The Depth Graph in split mode
Otherwise selecting the Depth graph displayed at full screen:
'PAGE' + "DEPTH GRAPH FULL" + 'ENTER'
or
'#. DEPTH 2' (if it is present, where # is 1, 2, 3, 4 or 5)
Fig. 3.1.1.2a - The Depth Graph Full
3.1.1.3Navigation Data page
The Navigation Data page shows information about the most relevant navi-
34
User Manual
Page 33

gation information, the status of the received signal and ship's coordinates. It is possible to customize the information contained in the page selecting the Nav Display
menu (see Par. 5.2).
'PAGE' + "NAVIGATION DATA" + 'ENTER'
or
'#. NAV' (if it is present, where # is 1, 2, 3, 4 or 5)
Fig. 3.1.1.3 - Navigation Data Page
3.1.1.4Road page
The 3D Road Data Page shows in graphic mode navigation data. It is possible
to customize the information contained in the page selecting the Nav Display menu
(see Par. 5.2).
'PAGE' + "3D ROAD" + 'ENTER'
or
'#. ROAD' (if it is present, where # is 1, 2, 3, 4 or 5)
3.1.1.5GPS Status page
The GPS Status page shows in graphic mode GPS data.
'PAGE' + "GPS STATUS" + 'ENTER'
or
'#. STATUS' (if it is present, where # is 1, 2, 3, 4 or 5)
User Manual
Fig. 3.1.1.4 - 3D Road Data Page
35
Page 34

Fig. 3.1.1.5 - GPS Status Page
On the right side of the screen (see Fig. 3.1.1.5), there is a polar representation of the azimuth and elevation of each satellites. The circles contain a number
indicating the PRN of the satellite and they are filled when they are used for the fix
solution. On the left side there are histograms indicating the S/N ratio (SNR). The
bar is filled when the satellite is used for fix solution. When a valid fix is received, the
Lat/Lon, Date, Time, HDOP, VDOP, ALT, COG, SOG are shown in the page.
3.1.1.6GPS Data page
The GPS Data page shows the GPS data.
'PAGE' + "GPS DATA" + 'ENTER'
or
'#. GPS' (if it is present, where # is 1, 2, 3, 4 or 5)
Fig. 3.1.1.6 - GPS Data Page
3.2 GENERAL MENU
The General Menu provides access to the set up functions. Here you can
36
User Manual
Page 35

choose the language you want (see Par. 2.4), the measure units, the date and time
settings, enable or disable the Keypad Beep (see Par. 1.2) and select the Cursor Speed.
'MENU' + "GENERAL" + 'ENTER'
3.2.1 UNITS SELECTION
Allows to select the preferred unit for Distance, Speed, Depth and Altitude
(altitude of GPS Antenna on the medium sea level).
Distance & Speed Units: Nm(Nautical Miles) & Kts(knots) / Sm(statute miles) &
Mph(miles per hour) /Km(chilometres) & Kph(chilometres per hour). The default
setting is Nm & Kts.
'MENU' + "GENERAL" + 'ENTER' + "Dist&Speed Units" + 'ENTER'
Depth Unit: Ft(Feet)/FM(Fathoms)/Mt(Meters). The default setting is Ft.
'MENU' + "GENERAL" + 'ENTER' + "Depth Unit" + 'ENTER'
Altitude Unit: Ft(Feet)/FL(Flight Level)/Mt(Meters). The default setting is Ft.
'MENU' + "GENERAL" + 'ENTER' + "Altitude Unit" + 'ENTER'
3.2.2 TIME & DATE SETTING
Allows to select the preferred time and date.
Time Reference: Sets UTC or Local Time. The default setting is UTC.
'MENU' + "GENERAL" + 'ENTER' + "Time Reference" + 'ENTER'
Time Format: Sets you preferred time between 12 hour and 24 hour. The default
setting is 24 hour.
'MENU' + "GENERAL" + 'ENTER' + "Time Format" + 'ENTER'
Date Format: Sets you preferred date between MM-DD-YY (month-day-year) and
DD-MM-YY (day-month-year). The default setting is MM-DD-YY.
'MENU' + "GENERAL" + 'ENTER' + "Date Format" + 'ENTER'
3.2.3 CURSOR SPEED
Allows to select the preferred Cursor Speed among Low, Medium and High
in Chart or into a Menu:
'MENU' + "GENERAL" + 'ENTER' + "Cursor Speed" + 'ENTER'
User Manual
37
Page 36
3.3 NAVIGATING TO A SINGLE DESTINATION
3.3.1 DISTANCE AND BEARING TO TARGET
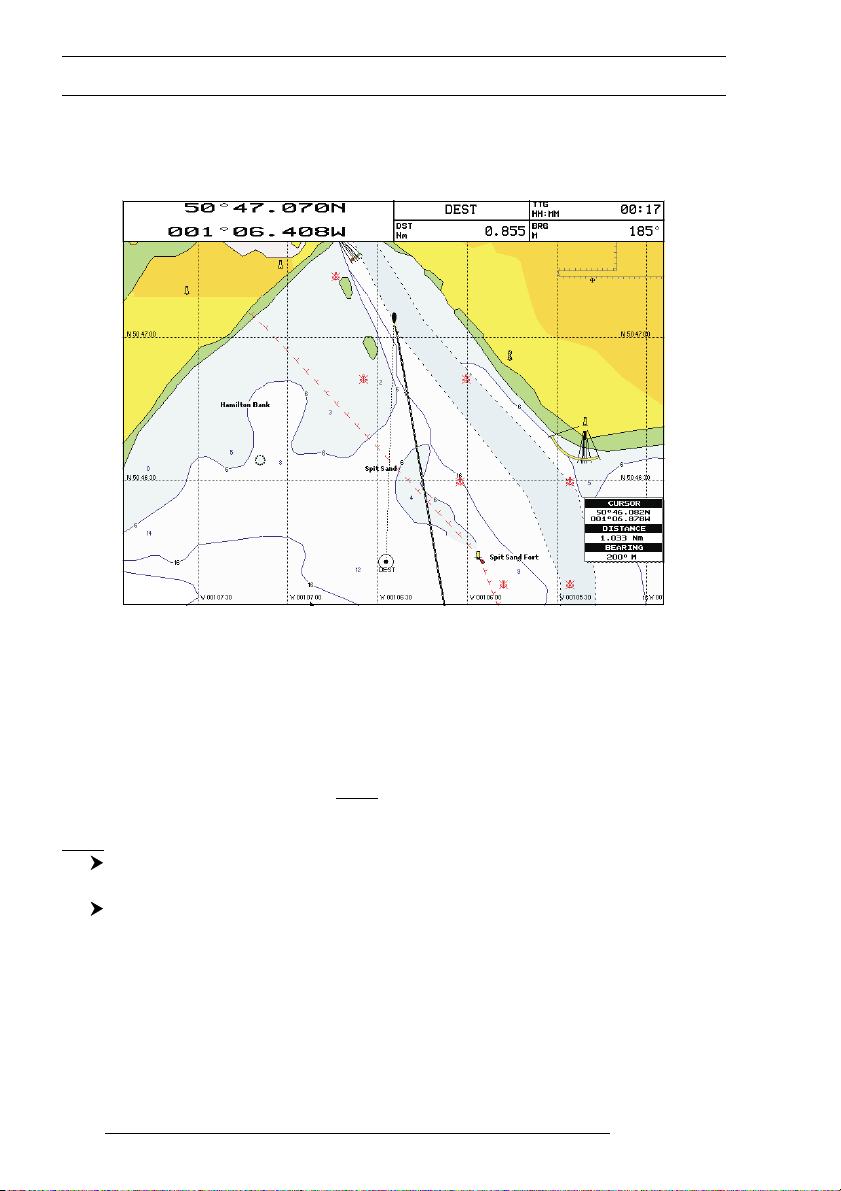
Once you have positioned the cursor on your preferred location press 'GOTO'.
Fig. 3.3.1 - Navigation to a single destination
On the screen is shown a dotted line connecting the Target with the ship's
position. When the Target is placed, all navigation data are referred to this Target.
3.3.2 TIME TO GO
When the Target is set the TTG value can be displayed in the Text Area (see
Par. 3.1.1). Otherwise select the 3D Road Page (see Par. 3.1.1.4) where you can read
TTG value (if it is selected):
'PAGE' + "3D ROAD" + 'ENTER'
or
'#. ROAD' (if it is present, where # is 1, 2, 3, 4 or 5)
3.3.3 DELETING TARGET
Place cursor on Target icon then press '1. S
firm the stop of the navigation: press '1. C
disappears from the screen.
38
ONFIRM
TOP
'. A window appears to con-
' and the symbol identifies Target
User Manual
Page 37

3.4 NAVIGATION ON A ROUTE
Sometimes it is preferable to define a series of locations, called Waypoints, in
a sequence called a Route and navigate following a Route towards its end point.
3.4.1 ADDING WAYPOINT
To create a Waypoint place the cursor on position you want, press 'ENTER', select "WAYPOINT", press 'ENTER' again. The Waypoint appears on the
screen and this becomes the first point on your first Route. An info window containing Route number, data and time, Waypoint name, symbol and Latitude/Longitude
is shown.
3.4.2 CREATING A ROUTE
Repeat the "Adding Waypoint" procedure described in the previous Par. 3.4.1.
The sequence of moving the cursor and pressing 'ENTER' is continued to create the
Route, until you have reached the last Waypoint, your final destination. Segments
connecting the Waypoints are shown and the starting point is identified by a circle
surrounding the first Waypoint of the Route:
User Manual
Fig. 3.4.2 - Route planning
39
Page 38
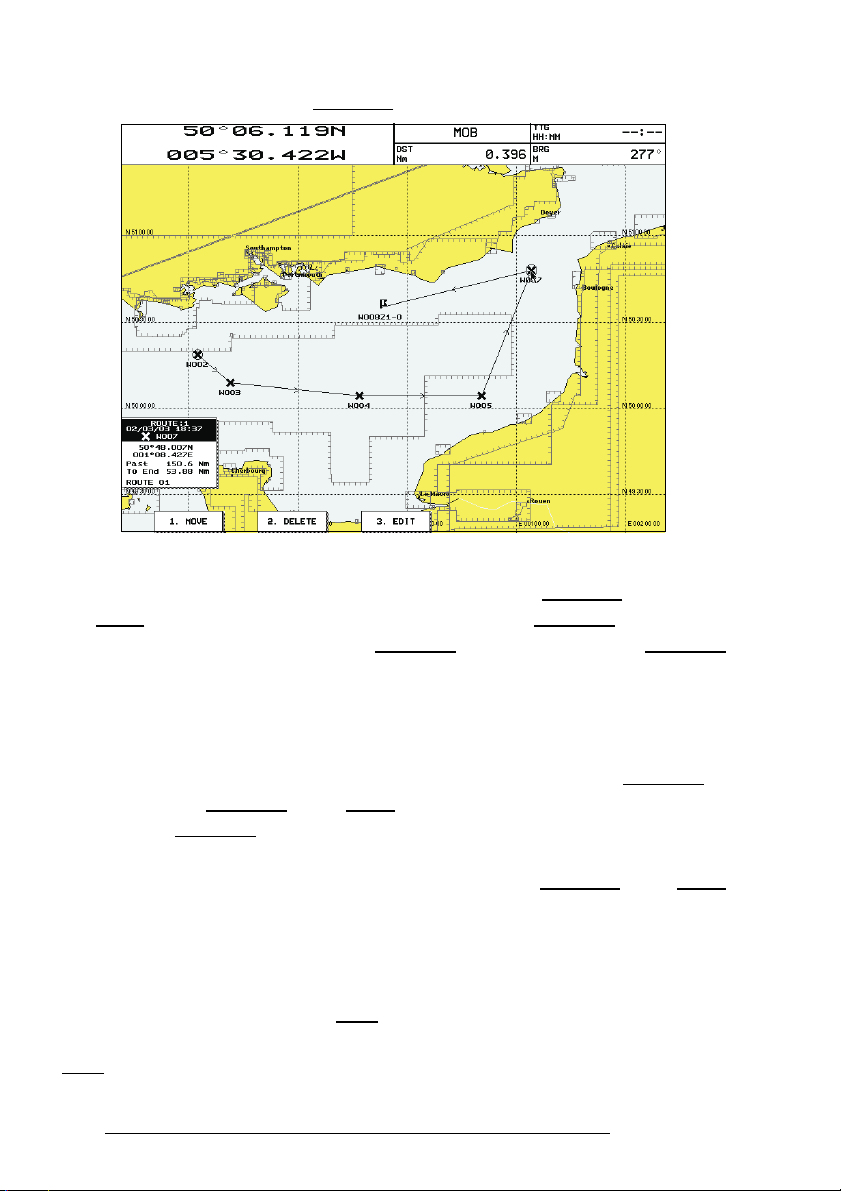
3.4.3 DELETING WAYPOINT
Place the cursor on the Waypoint to be deleted:
Fig. 3.4.3 - Deleting Waypoint
Press '2. D
in a Route: press '1. C
ELETE
'. A window is opened to advise that Waypoint is being used
ONFIRM
' ('2. C
ANCEL
' otherwise). The Waypoint is deleted and
a new line between previous and next Waypoint is shown. The deleted Waypoint
remains shaded until the screen is redrawn.
3.4.4 DISTANCE AND BEARING TO TARGET
Once you have positioned the cursor on the preferred starting Waypoint (it
could be the first Waypoint of the Route or another one) press 'GOTO'. A circle
surrounds the Waypoint symbol. A dotted line is shown, connecting the Target with
the ship's position. When the Target is placed, all navigation data are referred to this
Target. The destination will automatically switch to the next Waypoint on the Route
when you reach or pass the present destination.
3.4.5 TIME TO GO
When the Target is set the TTG value can be displayed in the Text Area (see
Par. 3.1.1). Otherwise select the 3D Road Page (see Par. 3.1.1.4) where you can read
TTG value (if it is selected):
40
User Manual
Page 39

'PAGE' + "3D ROAD" + 'ENTER'
or
'#. ROAD' (if it is present, where # is 1, 2, 3, 4 or 5)
3.4.6 DELETING TARGET
Place cursor on Target icon then press '1. S
firm the stop of the navigation: press '1. C
ONFIRM
disappears from the screen.
TOP
'. A window appears to con-
' and the symbol identifies Target
3.5 C-MAP NT+ INFORMATION
As part of C-MAPs continuous Electronic Vector Chart product
development and improvement program, C-MAP NT+, a natural evolution of
our Electronic Chart technology, has been released.
The key points of NT+ can be divided into five main categories:
1. Coverage/Price
2. Chart/Display Presentation
3. New Features/Functions
4. Accessories
5. Compatibility
Looking at the chart displayed on the screen, you will see a variety of objects
and symbols. Refer to the Cartography Reference Guide for their explanation.
The display can be customized for your personal preferences and needs (see
the following paragraphes).
3.5.1 DISPLAY MODE
'MENU' + "MAP" + 'ENTER' + "Display Mode" + 'ENTER'
To simplify the customization of the chart display, the map settings are now
re-organized in modes allowing the user to choose the preferred setting. Pre-programmed settings are user selectable from Full, Simple, Fishing, Low and Custom.
The default setting is Custom. The custom selection allows the user to customize the
chart to users preferences. The chart below shows the selections for each mode:
User Manual
41
Page 40

Setting Full Simple Fishing Low Custom
Names On On On Off On
Nav-Aids INT INT INT INT INT
Light Sectors On Off Off Off On
Attention Areas On On On Off On
Tides & Currents On On Off Off On
Seabed Type On Off On Off On
Ports & Services On On Off Off On
Tracks & Routes On Off Off Off On
Underwater Objects On Off On Off On
Depth Areas On On On Off On
Depth Areas > 0005 0005 0005 0005 00002 Mt
Depth Areas < 0030 0030 0030 0030 00009 Mt (*)
Depth Lines & Soundings On On On Off On
Depth Lines & Soundings > 0000 0000 0000 0000 00000 Mt
Depth Lines & Soundings < 9999 0005 9999 0005 00305 Mt
Rivers & Lakes On On Off Off On
Natural Features On Off Off Off On
Cultural Features On Off Off Off On
Landmarks On On Off Off On
Lat/Lon Grid On Off On Off On
Chart Boundaries On Auto Off Off On
Cartography On On Off On On
Mixing Levels On Off On Off On
Declutter Off On Off On Off
Map Presentation Marine Marine Marine Marine Marine(**)
Display Mode Normal Normal Normal Normal Normal
(Default values)
Note (*) ONLY FOR COLOR CHARTPLOTTER
The item "Depth Areas >" is present only on color chartplotter.
Note (**) ONLY FOR GRAY SCALE CHARTPLOTTER
The item "Map Presentation" is present only on gray scale chartplotter.
3.5.2 CUSTOMIZE MAP
'MENU' + "MAP" + 'ENTER' + "CUSTOMIZE MAP" + 'ENTER'
This function allows the user to customize the following selections and is
divided into the following setting menus: Marine Settings, Depth Settings, Land Settings and Chart Settings. If any of the settings are changed while in the Customize
Map mode, when exiting the chartplotter will show a prompt Do you want to
change Display Mode to Custom?. Press '1. C
Note
The Warning window appears only if Display Mode is not Custom.
3.5.2.1Marine Settings
The Marine Settings menu controls the display on the map of the marine
features.
42
ONFIRM
' to accept.
User Manual
Page 41

Names: On/Off. The default setting is On.
'MENU' + "MAP" + 'ENTER' + "CUSTOMIZE MAP" + 'ENTER' + " MARINE SETTINGS" + 'ENTER' + "Names" + 'ENTER'
Nav-Aids: US/US Simple/INT/INT Simple/Off. The default setting is INT. When
selected it affects Lights, Signals, Buoys & Beacons display.
- INT(ernational): Draws Nav-Aids using international symbology. All com-
ponents of Complex Objects are shown.
- INT(ernational) Simplified: Shows Complex Object with one icon only.
Non-complex Nav-Aids are shown using international symbology.
- US: Draw Nav-Aids using NOAA symbology. All components of Com-
plex Objects are shown.
- US Simplified: Shows Complex Object with one icon only. Non-complex
Nav-Aids are shown using NOAA symbology.
- Off: Lights, Signals, Buoys & Beacons are no longer displayed on the charts.
'MENU' + "MAP" + 'ENTER' + "CUSTOMIZE MAP" + 'ENTER' + " MARINE SETTINGS" + 'ENTER' + "Nav-Aids" + 'ENTER'
Light Sectors: On/Off. The default setting is On. Light Sectors are not displayed
when Nav-Aids option is set to Simplified or Off (the display of Light Sectors is
decided by the cartographic Library).
'MENU' + "MAP" + 'ENTER' + "CUSTOMIZE MAP" + 'ENTER' + " MARINE SETTINGS" + 'ENTER' + "Light Sectors" + 'ENTER'
Attention Areas: On/Off. The default setting is On. The Attention Areas will al-
ways be contour only when On.
'MENU' + "MAP" + 'ENTER' + "CUSTOMIZE MAP" + 'ENTER' + " MARINE SETTINGS" + 'ENTER' + "Attention Areas" + 'ENTER'
Tides & Currents: On/Off. The default setting is On.
'MENU' + "MAP" + 'ENTER' + "CUSTOMIZE MAP" + 'ENTER' + " MARINE SETTINGS" + 'ENTER' + "Tides & Currents" + 'ENTER'
Seabed Type: On/Off. The default setting is On.
'MENU' + "MAP" + 'ENTER' + "CUSTOMIZE MAP" + 'ENTER' + " MARINE SETTINGS" + 'ENTER' + "Seabed Type" + 'ENTER'
Ports & Services: On/Off. The default setting is On.
'MENU' + "MAP" + 'ENTER' + "CUSTOMIZE MAP" + 'ENTER' + " MARINE SETTINGS" + 'ENTER' + "Ports & Services" + 'ENTER'
Tracks & Routes: On/Off. The default setting is On.
User Manual
43
Page 42

'MENU' + "MAP" + 'ENTER' + "CUSTOMIZE MAP" + 'ENTER' + " MARINE SET-
TINGS" + 'ENTER' + "Tracks & Routes" + 'ENTER'
Underwater Objects: On/Off. The default setting is On.
'MENU' + "MAP" + 'ENTER' + "CUSTOMIZE MAP" + 'ENTER' + " MARINE SET-
TINGS" + 'ENTER' + "Underwater Objects" + 'ENTER'
3.5.2.2Depth Settings
The Depth Settings menu controls the display on the map of the depth informations.
Depth Areas: On/Off. The default setting is On.
'MENU' + "MAP" + 'ENTER' + "CUSTOMIZE MAP" + 'ENTER' + "DEPTH SET-
TINGS" + 'ENTER' + "Depth Areas" + 'ENTER'
Depth Areas >: Sets a min reference depth value. The default setting is 5 Ft.
'MENU' + "MAP" + 'ENTER' + "CUSTOMIZE MAP" + 'ENTER' + "DEPTH SET-
TINGS" + 'ENTER' + "Depth Areas >" + 'ENTER'
Depth Areas <: Sets a max reference depth value. The default setting is 30 Ft (*).
'MENU' + "MAP" + 'ENTER' + "CUSTOMIZE MAP" + 'ENTER' + "DEPTH SET-
TINGS" + 'ENTER' + "Depth Areas <" + 'ENTER'
Note (*) ONLY FOR COLOR CHARTPLOTTER
The item "Depth Areas <" is present only on color chartplotter.
Depth Lines & Sndgs: On/Off. The default setting is On.
'MENU' + "MAP" + 'ENTER' + "CUSTOMIZE MAP" + 'ENTER' + "DEPTH SET-
TINGS" + 'ENTER' + "Depth Lines & Sndgs" + 'ENTER'
Depth Lines & Sndgs >: Sets a min reference depth & soundings value. The default
setting is 0 Ft.
'MENU' + "MAP" + 'ENTER' + "CUSTOMIZE MAP" + 'ENTER' + "DEPTH SET-
TINGS" + 'ENTER' + "Depth Lines & Sndgs >" + 'ENTER'
Depth Lines & Sndgs <: Sets a max reference depth & soundings value. The default
setting is 09999 Ft.
'MENU' + "MAP" + 'ENTER' + "CUSTOMIZE MAP" + 'ENTER' + "DEPTH SET-
TINGS" + 'ENTER' + "Depth Lines & Sndgs <" + 'ENTER'
3.5.2.3Land Settings
The Land Settings menu controls the display on the map of the terrestrial
features.
44
User Manual
Page 43

Rivers & Lakes: On/Off. The default setting is On.
'MENU' + "MAP" + 'ENTER' + "CUSTOMIZE MAP" + 'ENTER' + "LAND SETTINGS" + 'ENTER' + "Rivers & Lakes" + 'ENTER'
Natural Features: On/Off. The default setting is On.
'MENU' + "MAP" + 'ENTER' + "CUSTOMIZE MAP" + 'ENTER' + "LAND SETTINGS" + 'ENTER' + "Natural Features" + 'ENTER'
Cultural Features: On/Off. The default setting is On.
'MENU' + "MAP" + 'ENTER' + "CUSTOMIZE MAP" + 'ENTER' + "LAND SETTINGS" + 'ENTER' + "Cultural Features" + 'ENTER'
Landmarks: On/Off. The default setting is On.
'MENU' + "MAP" + 'ENTER' + "CUSTOMIZE MAP" + 'ENTER' + "LAND SETTINGS" + 'ENTER' + "Landmarks" + 'ENTER'
3.5.2.4Chart Settings
The Chart Settings menu controls the display on the map of the chart features.
Lat/Lon Grid: On/Off. The default setting is On.
'MENU' + "MAP" + 'ENTER' + "CUSTOMIZE MAP" + 'ENTER' + "CHART SETTINGS" + 'ENTER' + "Lat/Lon Grid" + 'ENTER'
Chart Boundaries: On/Off/Auto. The default setting is On.
'MENU' + "MAP" + 'ENTER' + "CUSTOMIZE MAP" + 'ENTER' + "CHART SETTINGS" + 'ENTER' + "Chart Boundaries" + 'ENTER'
Cartography: On/Off. The default setting is On. Used to zoom-in and pan every-
where regardless the existence of data. While in "virtual cartography" (Cartography
Off) by setting Cartography On from menu, the chartplotter displays the previous
scale level with charts. Again while in Cartography On, the chartplotter will work in
the same way also when you exit from the charts coverage, panning with the cursor
or because of a ship position change. When in Cartography Off, it is also possible to
have virtual cartography between two subsequent scale levels with charts.
'MENU' + "MAP" + 'ENTER' + "CUSTOMIZE MAP" + 'ENTER' + "CHART SETTINGS" + 'ENTER' + "Cartography" + 'ENTER'
Mixing Levels: On/Off. The default setting is Off. When the map coverage at the
current zoom level does not fill the entire screen, the chartplotter draws the rest of
the map expanding the cartographic information read from, at most, two zoom levels above the current zoom level. For this reason the map is drawn three times: firstly
it draws the two levels before the current level and then the current level. The area
User Manual
45
Page 44

covered by the cartographic data read from the previous levels is identified by a dotted pattern. When the cursor is moved on an areanot covered by data of the current
level and the Cartography item is switched Off, the chartplotter zooms out to the
first level covered by cartographic data. When the Cartography item is switched On,
the cursor can be moved on the areas obtained from the previous levels but no information is provided on the objects found on that area since it is considered not suitable for navigation at that scale level.
'MENU' + "MAP" + 'ENTER' + "CUSTOMIZE MAP" + 'ENTER' + "CHART SET-
TINGS" + 'ENTER' + "Mixing Levels" + 'ENTER'
Note
The Mixing Levels function works only with the new NT+ C-CARDs. It also affects the speed of the redraw
of the screen. If this function is not used it maybe disabled.
Declutter: On/Off. The default setting is Off. When it is On removes overlapping
text (e.g. Names, Spot Soundings etc.).
'MENU' + "MAP" + 'ENTER' + "CUSTOMIZE MAP" + 'ENTER' + "CHART SET-
TINGS" + 'ENTER' + "Declutter" + 'ENTER'
Map Presentation: Marine/Terrestrial. The default setting is Marine (*).
'MENU' + "MAP" + 'ENTER' + "CUSTOMIZE MAP" + 'ENTER' + "CHART SET-
TINGS" + 'ENTER' + "Map Presentation" + 'ENTER'
Note (*) ONLY FOR GRAY SCALE CHARTPLOTTER
The item "Map Presentation" is present only on gray scale chartplotter.
Display Mode: Normal/Compressed. The default setting is Normal.
'MENU' + "MAP" + 'ENTER' + "CUSTOMIZE MAP" + 'ENTER' + "CHART SET-
TINGS" + 'ENTER' + "Display Mode" + 'ENTER'
3.5.3 GETTING AUTOMATIC INFO
The type of Automatic Info is user selectable.
'MENU' + "DISPLAY" + 'ENTER' + "Auto Info" + 'ENTER'
The possible settings are:
- Off: disabled, no automatic info shown at all.
- On Points: only on points. This is the default setting.
- On All: on all objects (points, lines, areas and text).
The Automatic Info On Points shows information when the cursor is placed
on points (as Port Services, Tides, lights, wrecks, rocks, buoys, beacons, obstructions, land markers, etc.).
The Automatic Info On All shows information when the cursor is placed on
points, on lines (as Depth contours, Traffic Separation, Territorial Sea, Cartographic
46
User Manual
Page 45

Lines etc.) on areas (Depth, Built-up, Sea, Attention, Restricted etc.) and on names
(on the beginning of the text -hot spot- or on any of the characters of the name -name
message box-).
The details on Land, Source of Data, Cartographic Area and Spot Soundings
are not shown.
Fig. 3.5.3 - Automatic Info on Points window
If you press '1. E
XPAND
' you get the information about that object. Otherwise if you press '2. EXP ALL' all available information about the cartographic point
under the cursor will be shown (see Par. 3.5.4).
3.5.4 INFO TREE AND EXPANDED INFO PAGE
This page combines the Info Tree and the Expanded Info pages; this gives the
advantage of showing the details of the object selected on the Info Tree while the
cursor is moving through the Info Trees items. The upper side of the page contains
the Info Tree and the Lower side contains the expanded information. While moving
the cursor through the Info Tree, all the relevant information of the selected object is
shown on the lower part of the page.
When the selected object is a Tide Height, pressing 'ENTER' the Tide page is
shown.Pressing 'CLEAR' the page is closed. If the information shown exceeds the
page size, the user may scroll the page down pressing '2. P
restart the Expanded Info.
User Manual
AGE DN
'. The '1. H
OME
47
'
Page 46

3.5.5 INFO FUNCTION
Place the cursor in any place you want and press:
'INFO'
to show the Info Tree and Expanded Info page (see Par. 3.5.4).
3.5.6 GETTING PORT INFO
Upon viewing the chart of a port or harbour, you will see a Port Info icon
that can be clicked on to query the available information immediately displayed with
many details. The Port Info icon is visible only if the Ports & Services option is On
(default setting).
Fig. 3.5.6 - Port Info icon
The available information is shown in the Automatic Info window where
icons of the available services are shown. To expand information about that object
press '1. E
XPAND
' and to expand all available information for that cartographic point
press '2. EXP ALL'.
48
User Manual
Page 47

Fig. 3.5.6a - Automatic Info window
3.5.7 GETTING TIDE INFO
When you will see a Tide Info icon you can click on it to query the available
information that will immediately be displayed.
Fig. 3.5.7 - Tide Info icon
User Manual
49
Page 48

Place the cursor on the Tide symbol, a Automatic Info window is opened:
Fig. 3.5.7a - Automatic Info on Tide
To display the Tide Graph page, press '1. E
XPAND
' (otherwise, press '2. E
XP
ALL' to select all available information).
Fig. 3.5.7b - Tide Graph
Using the Joystick, it is possible to move the cursor anywhere on the graph and
display the time, height (vertical cursor) and draught (horizontal cursor) on a particular graph point. Also use 'ZOOM IN' or 'ZOOM OUT' to go to previous or next
day and 'ENTER' to set date (move the Joystick up/down to insert the preferred num-
ber and use it left/right to move cursor to left/right).
Note
Tide graphs are an approximation of the tide and they should be used in conjunction with traditional tide
tables and navigational methods.
50
User Manual
Page 49

3.5.8 FIND FUNCTION
The chartplotter allows finding Port Services, Port By name, Tide Stations,
Wrecks, Obstructions, Cursor, Coordinates and User Points.
3.5.8.1Finding Port Services
To locate and display the nearest available facilities of a particular type (i.e.
the nearest Hospital, sailmaker, bank, etc.).
'MENU' +"FIND" + 'ENTER' + "PORT SERVICES" + 'ENTER'
The icons of the available services are shown.
Use the Joystick to select any facility and press 'ENTER' or '1. F
of the nearest ports (up to 10) containing the facility, will be shown on the screen.
Then choose the port you want and press 'ENTER' or '1. F
3.5.8.2Finding Nearest Ports
Shows the list of all (max 8 ports) placed near the cursor position.
'MENU' +"FIND" + 'ENTER' + "PORTS" + 'ENTER'
Use the Joystick to select the port. Press 'ENTER' or '1. F
Finding All Ports
To show the list of all ports stored on the C-CARD and to locate them on the map
follow the procedure:
'MENU' +"FIND" + 'ENTER' + "PORTS" + 'ENTER' + '2. PORTS'
Use the Joystick to select the port and 'ZOOM IN'/'ZOOM OUT' to select
next/previous page. Press 'ENTER' or '1. F
Note
A Warning message is shown if there is not C-CARD inserted or there are not ports on the C-CARD.
IND
' to locate the selected port on the map.
IND
'. The list
IND
'.
IND
' to locate it.
Searching by name
'MENU' +"FIND" + 'ENTER' + "PORTS" + 'ENTER' + '2. PORTS' + '2. NAME'
Use the Joystick to insert port name (max 15 characters). Press 'ENTER' to accept;
press 'CLEAR' to cancel name entry. If inserted name is found, the list with all ports
containing the inserted name is shown. Repeat the operation to refine search or move
through the list with Joystick. Press 'ENTER' to locate the port on the map.
Note
A Warning message is shown when the inserted name is not in the ports list.
Searching by list
'MENU' +"FIND" + 'ENTER' + "PORTS" + 'ENTER' + '2. PORTS' + '3. LIST'
Rebuild and display the complete ports list. Use the Joystick to select the port and
User Manual
51
Page 50

'ZOOM IN'/'ZOOM OUT' to select next/previous page. Press 'ENTER' or '1.
F
IND
' to locate the selected port on the map.
3.5.8.3Finding Tide Stations
Finds the nearest Tide Stations (up to 10) on the map, from the boat position
- if a valid fix is received - or from the cursor position - if the received fix position is
not good.
'MENU' +"FIND" + 'ENTER' + "TIDE STATIONS" + 'ENTER'
A new window will appear in few seconds. Choose the Tide Stations you
want and press 'ENTER' or '1. F
IND
' to display the Tide Graph page (see Par. 3.5.7b).
Press 'CLEAR' to display the Tide Station chosen.
3.5.8.4Finding Wrecks
Searches for Nearest Wrecks:
'MENU' +"FIND" + 'ENTER' + "WRECKS" + 'ENTER'
Use the Joystick to select the port and 'ZOOM IN'/'ZOOM OUT' to select
next/previous page. Press 'ENTER' or '1. F
IND
' to locate the selected Wreck on the
map.
3.5.8.5Finding Obstructions
Searches for Nearest Obstructions:
'MENU' +"FIND" + 'ENTER' + "OBSTRUCTIONS" + 'ENTER'
Use the Joystick to select the port and 'ZOOM IN'/'ZOOM OUT' to select
next/previous page. Press 'ENTER' or '1. F
IND
' to locate the selected Obstruction.
3.5.8.6Finding Cursor
Centers the cursor on the screen:
'MENU' +"FIND" + 'ENTER' + "CURSOR" + 'ENTER'
3.5.8.7Finding Coordinates
Allows to enter LAT/LON to locate a cartographic point:
'MENU' +"FIND" + 'ENTER' + "COORDINATES" + 'ENTER'
3.5.8.8Finding User Points
Searches the User Points by name:
'MENU' +"FIND" + 'ENTER' + "USER POINTS" + 'ENTER'
52
User Manual
Page 51
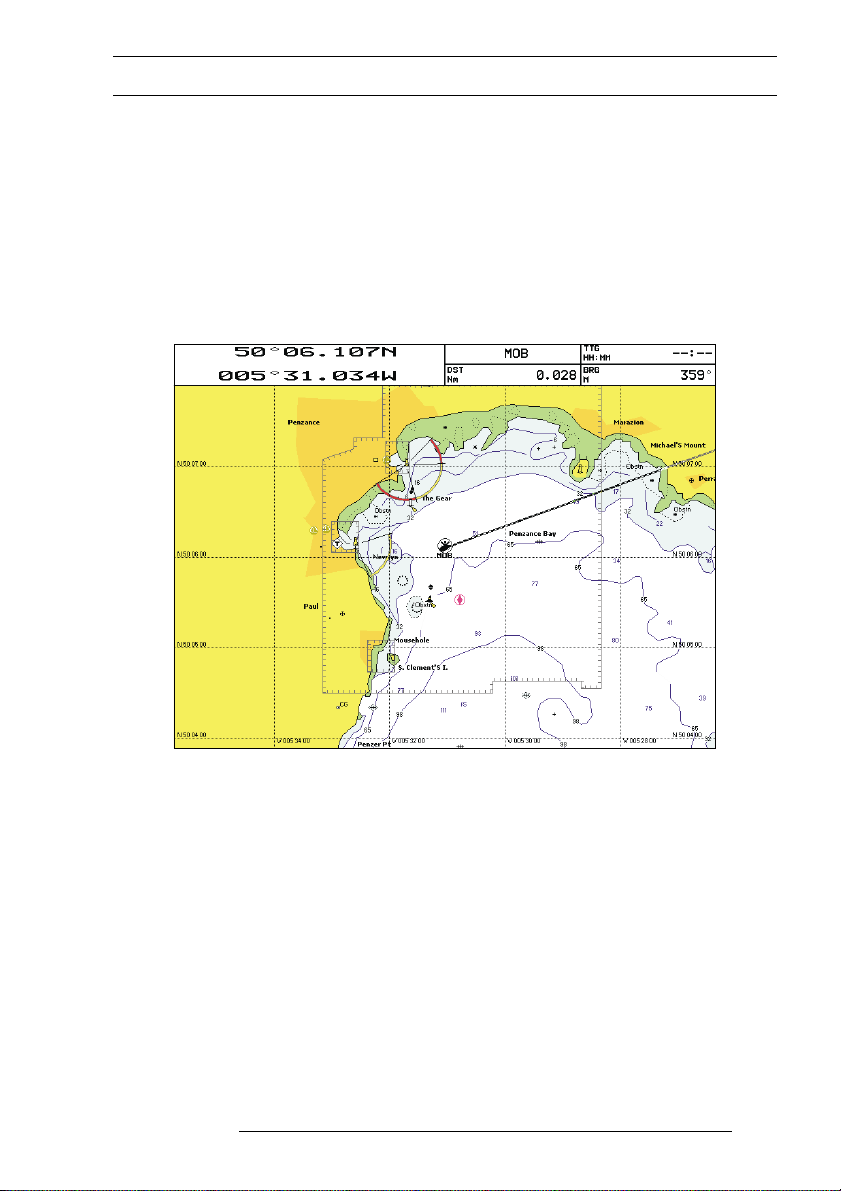
3.6 MAN OVERBOARD (MOB)
It is an important function useful in the case someone or something falls
overboard.
3.6.1 INSERTING MOB
Press 'EVENT/MOB' for 1 second to place MOB symbol at ship's coordinates: the message "MOB Activate" is shown for a few second, then disappears. Data
displayed in Text Area are related to MOB.
Fig. 3.6.1 - Man Overboard
3.6.2 DELETING MOB
Press 'EVENT/MOB' for 1 second: a window to confirm the MOB deletion
is shown, press '1. C
remains on the screen shaded until the next screen redraws.
User Manual
ONFIRM
' (or '2. C
ANCEL
' to abort operation). The MOB symbol
53
Page 52

54
User Manual
Page 53

4
For the Experienced User
Now that you are familiar with your new chartplotter, it is time to found
about a large number of advanced features that you will find helpful.
4.1 MORE ABOUT CREATING AND USING ROUTES
At anytime, you may add or delete Waypoints, see a Route summary, reverse
the direction of the Route or erase the entire Route.
4.1.1 ROUTES
The following functions are used for the Route management.
'MENU' + "ROUTE" + 'ENTER'
Note ONLY FOR COLOR CHARTPLOTTER
'MENU' + "ROUTE" + 'ENTER' + "COLOR" + 'ENTER'
It is possible to change Route color. After pressing 'ENTER' a window with 8 different colors appears. Use the
Joystick to select the Route legs color and press '1. ACCEPT' ('2. CANCEL' otherwise).
4.1.1.1Selecting Route
'MENU' + "ROUTE" + 'ENTER' + "SELECT" + 'ENTER'
Use the Joystick or the numeric keys to select the preferred Route number.
The following functions are available.
Note ONLY FOR COLOR CHARTPLOTTER
'MENU' + "ROUTE" + 'ENTER' + "SELECT" + 'ENTER' + '4. COLOR'
It is possible to change color. After pressing '4.COLOR' another window is shown: use the Joystick to choose
the preferred color (among 8 colors) for the Route. Press '1. ACCEPT' to confirm ('2. CANCEL' otherwise).
Displaying Route
'MENU' + "ROUTE" + 'ENTER' + "SELECT" + 'ENTER' + '1. SELECT'
The Route, shown by straight segments, is centered on the screen, with the cursor on
the central Waypoint.
User Manual
55
Page 54
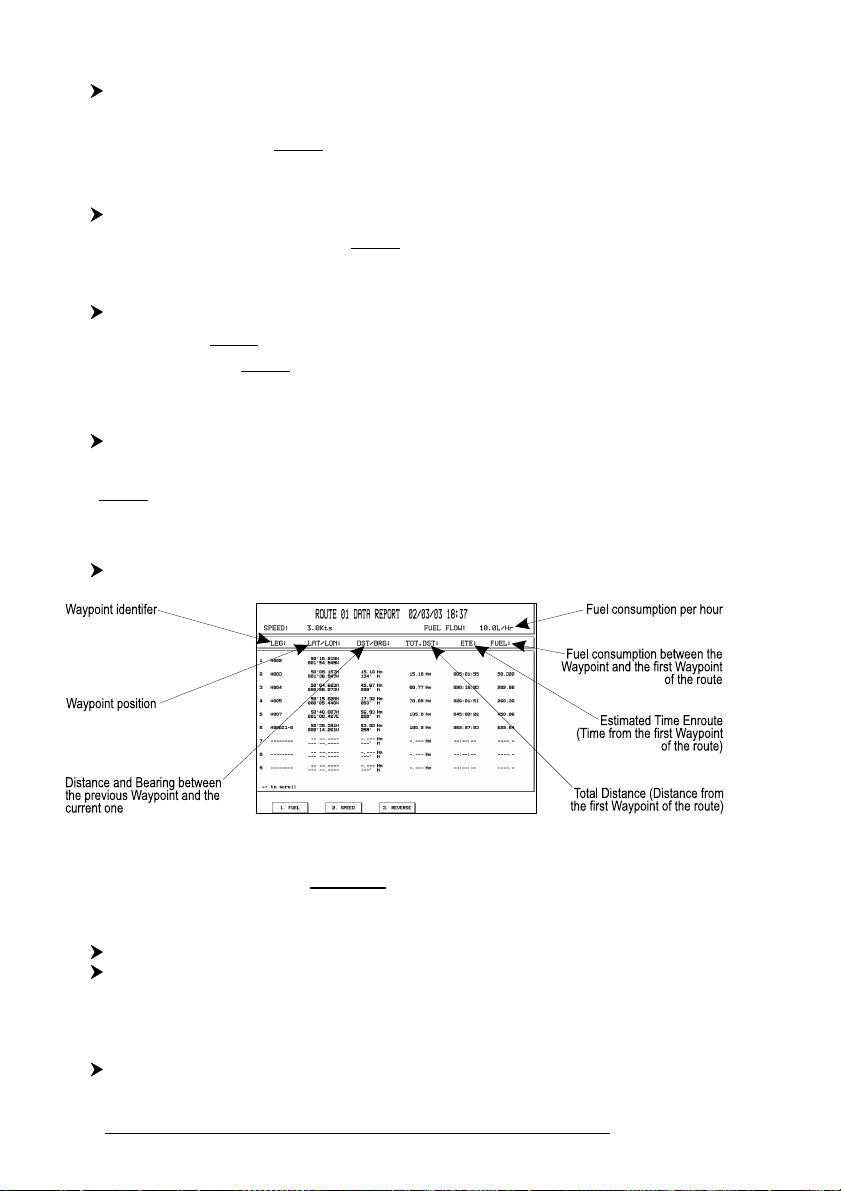
Editing notes
'MENU' + "ROUTE" + 'ENTER' + "SELECT" + 'ENTER' + '2. NOTES'
Another window is shown: use the Joystick to insert the notes (this is possible only if
you have already created a Route). Press 'ENTER' to confirm ('C
ANCEL
' otherwise).
Hide/Show Route
'MENU' + "ROUTE" + 'ENTER' + "SELECT" + 'ENTER' + '3. HIDE/SHOW'
Allows to hide or show the selected Route on the screen.
Find Route
'MENU' + "ROUTE" + 'ENTER' + "SELECT" + 'ENTER' + '5. FIND'
Allows to find the Route in the Select Route page inserting the desired number (then
to display the selected Route on the screen press '1. S
ELECT
').
4.1.1.2Deleting Route
'MENU' + "ROUTE" + 'ENTER' + "DELETE" + 'ENTER'
A window is opened: press '1. C
ONFIRM
' to delete ('2. C
ANCEL
' otherwise).
The Route remains on the screen shaded until the screen is redrawn.
4.1.1.3Finding information on Route: Route Report
'MENU' + "ROUTE" + 'ENTER' + "REPORT" + 'ENTER'
Fig. 4.1.1.3 - Route Data Report page
If there are more than 9 Waypoint shown, use the Joystick to select another page.
Changing Speed & Fuel values
'MENU' + "ROUTE" + 'ENTER' + "REPORT" + 'ENTER' + '1. FUEL'
'MENU' + "ROUTE" + 'ENTER' + "REPORT" + 'ENTER' + '2. SPEED'
Insert value by using the Joystick and pressing 'ENTER' ('CLEAR' abort operation).
Reversing Route
'MENU' + "ROUTE" + 'ENTER' + "REPORT" + 'ENTER' + '3. REVERSE'
56
User Manual
Page 55

Reversing a Route plan is most typically used to return to the point where the Route
originally started.
4.1.2 WAYPOINTS
You may add Waypoints, delete Waypoints from a Route, move any Waypoint
in the Route to another location, insert a Waypoint between two existing ones, find
any Waypoint at anytime. Every time you place the cursor on a Waypoint the following functions are available.
4.1.2.1Adding Waypoint
'ENTER' + "WAYPOINT" + 'ENTER'
The Waypoint appears on the screen on the cursor position. An info window is shown containing Route number, data and time, Waypoint name, symbol
and Latitude/Longitude, information on previous and - if the Waypoint is not the
last of the Route - also on the next Waypoint. To create a Route inserting additional
Waypoints repeat the above described sequence.
4.1.2.2Moving Waypoint
Add Waypoint ('ENTER' + "WAYPOINT" + 'ENTER') or Place cursor on existing
Waypoint
Press '1. M
the Waypoint to the new position, is shown:
OVE
'. Use the Joystick to move the cursor: a dotted line, connecting
User Manual
Fig. 4.1.2.2 - Moving Waypoint function (I)
57
Page 56

To place the Waypoint in the new position, choose the new place and press
'1. A
CCEPT
' (or '2. C
ANCEL
' otherwise).
Fig. 4.1.2.2a - Moving Waypoint function (II)
4.1.2.3Deleting Waypoint
Add Waypoint ('ENTER' + "WAYPOINT" + 'ENTER') or Place cursor on existing
Waypoint
58
Fig. 4.1.2.3 - Deleting Waypoint (I)
User Manual
Page 57
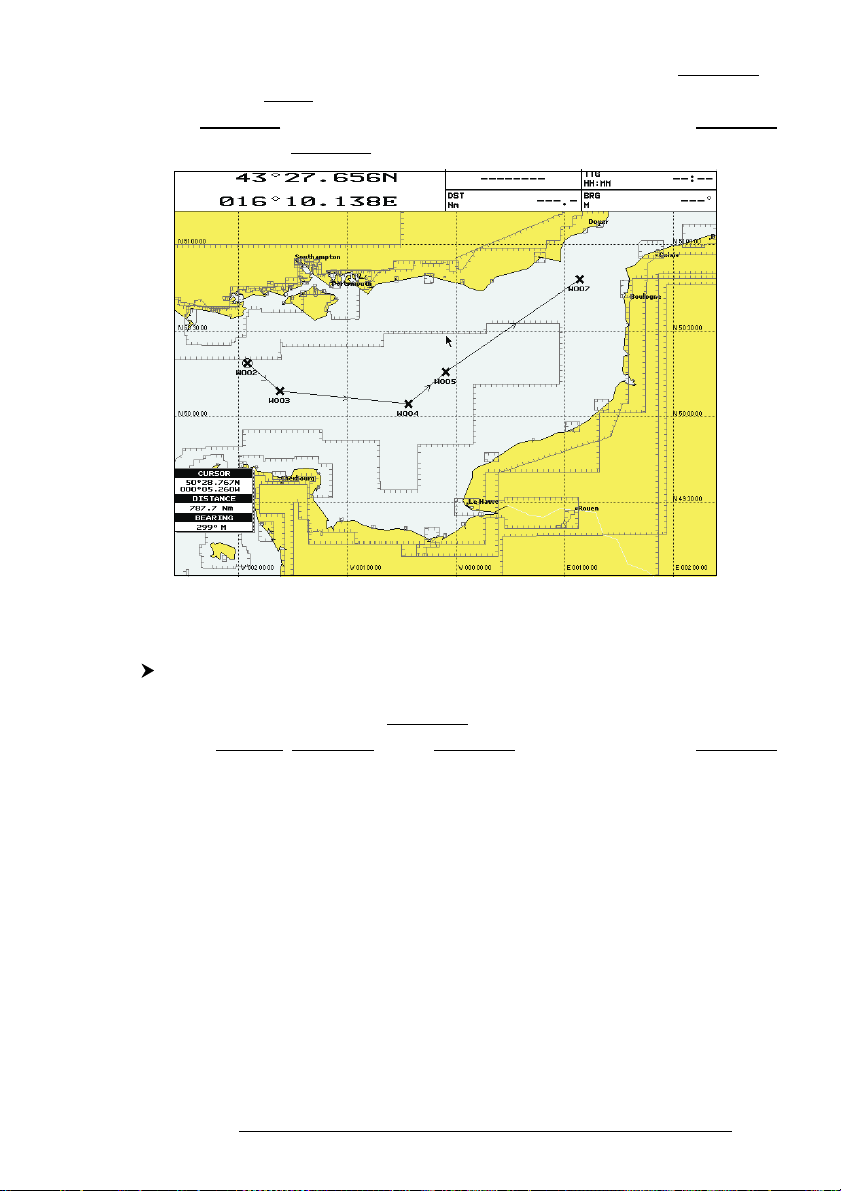
Press '2. D
currently used in a Route: press '1. C
ELETE
'. A Warning message is shown to advise that Waypoint is
ONFIRM
' to confirm deletion ('2. C
ANCEL
' otherwise). The Waypoint is deleted and a new line between previous and next Waypoint
is shown. The deleted Waypoint remains shaded until the screen is redrawn.
Fig. 4.1.2.3a - Deleting Waypoint (II)
4.1.2.4Editing Waypoint
Add Waypoint ('ENTER' + "WAYPOINT" + 'ENTER') or Place cursor on existing
Waypoint
Press '3. E
DIT
' to modify a Waypoint. A window will be shown with Name,
Symbol and Latitude/Longitude of the Waypoint, advicing about what Waypoint
data are modifiable:
User Manual
59
Page 58

Fig. 4.1.2.4 - Edit Waypoint
Use the Joystick to select the field. If you have selected Name field, press
'ENTER': use the Joystick to insert the character (8 characters max), press 'ENTER'.
If Symbol field is selected press 'ENTER', a window with 16 different symbols appears:
Fig. 4.1.2.4a - Waypoint symbols
60
User Manual
Page 59

Use the Joystick to select the Symbol and press 'ENTER'. If Coordinates field
is selected, press 'ENTER' and then use the Joystick to insert the value. The Notes field
is used to insert an alphanumeric text (max 15 characters). Then press '1. A
CCEPT
' to
confirm the data entered.
Note ONLY FOR COLOR CHARTPLOTTER
It is possible to change Waypoint color. If you have selected Color field, press 'ENTER': a window with
8 different colors appears. Use the Joystick to select the color and press 'ENTER'.
4.1.2.5Goto
Add Waypoint ('ENTER' + "WAYPOINT" + 'ENTER') or Place cursor on existing
Waypoint
Press 'GOTO': a circle encloses the Waypoint symbol. On the screen a straight
line is shown, connecting the Target with the ship's position. When the Target is
placed, all navigation data are referred to this Target.
4.1.2.6Inserting Waypoint
Every time you place the cursor on the segment connecting two existing
Waypoints of a Route the following function is available.
Place cursor on Route leg
Fig. 4.1.2.6 - Placing Waypoint between two existing ones (I)
Press '1. I
NSERT
'. The line between the two Waypoints is turned into a dotted
line: move the cursor to the new position. When the cursor is stationary for one
second or two, the line will "rubber-band", drawing a dotted line between the last
User Manual
61
Page 60

Waypoint and the cursor, and another dotted line between the cursor and the next
Waypoint:
Fig. 4.1.2.6a - Placing Waypoint between two existing ones (II)
62
Once you have positioned the cursor at new location, press '1. A
Fig. 4.1.2.6b - Placing Waypoint between two existing ones (III)
User Manual
CCEPT
':
Page 61

4.1.2.7Finding Waypoint
'MENU' + "FIND" + 'ENTER' + "USER POINTS" + 'ENTER'
A window is opened to find a stored Waypoint by entering its label:
Fig. 4.1.2.7 - Finding Waypoint function (I)
Use the Joystick to insert the name and press '1. C
ONFIRM
' ('2. C
ANCEL
' otherwise). For example, if the inserted name is W007, the cursor is placed on this Waypoint
and the info window is shown:
User Manual
Fig. 4.1.2.7a - Finding Waypoint function (II)
63
Page 62

4.1.2.8Finding information on Waypoints: User Points List page
'MENU' + "USER POINTS" + 'ENTER'
A full window is opened showing information about all stored User Points.
Move up/down the Joystick to select the User Point you wish. If the page contains
more than 11 User Points, the list continues in the next pages.
Fig. 4.1.2.8 - User Points page
Note
In the list to identify the current Target a circle encloses the User Point symbol.
Viewing Waypoint in map display
'MENU' + "USER POINTS" + 'ENTER' + '1. VIEW'
The chartplotter exits from the User Points List page and redraws the chart. The
selected point appears, with the cursor placed on it. Press 'CLEAR' to exit and return
to User Point List page.
Finding Waypoint in the User Points List page
'MENU' + "USER POINTS" + 'ENTER' + '2. FIND'
A window appears: insert the name by using the Joystick. Press 'ENTER': in the User
Points List page the chartplotter shows the Waypoint in reverse video screen.
Deleting Waypoint
'MENU' + "USER POINTS" + 'ENTER' + '3. DELETE'
A warning message is shown; press '1. C
ONFIRM
' ('2. C
ANCEL
' othewise).
Deleting all stored User Points
'MENU' + "USER POINTS" + 'ENTER' + '4. DEL ALL'
A warning message is shown, press '1. C
Note
If you try to delete any User Point used as GOTO a Warning window will appear, advicing that the User
Point belongs to an active Route and cannot be deleted.
64
ONFIRM
' ('2. C
ANCEL
' otherwise).
User Manual
Page 63

4.2 USING MARKS & EVENTS
You may place a Mark, as it is called, at your cursor position, while Event is
created at your vessel position.
4.2.1 MARKS
You may tag a location on the chart with a Mark symbol and number, which
you can record for later use. Every time you place the cursor on a Mark the following
functions are available.
4.2.1.1Adding Mark
'ENTER' + "MARK" + 'ENTER'
The new Mark appears on your cursor position. An info window containing
Mark name, symbol and Latitude/Longitude is shown.
4.2.1.2Moving Mark
Add Mark ('ENTER' + "MARK" + 'ENTER') or Place cursor on existing Mark
Press '1. M
ing the Mark with the new position is shown:
OVE
'. By moving the cursor with the Joystick, a dotted line connect-
Press '1. A
User Manual
CCEPT
Fig. 4.2.1.2 - Moving Mark function (I)
':
65
Page 64

Fig. 4.2.1.2a - Moving Mark function (II)
The Mark is placed in the new position, the "old" Mark, remains on the
screen shaded until the screen is redrawn.
4.2.1.3Deleting Mark
Add Mark ('ENTER' + "MARK" + 'ENTER') or Place cursor on existing Mark
FIRM
Press '2. D
' ('2. C
ELETE
': a window to confirm the deletion is shown. Press '1. CON-
ANCEL
' otherwise): the Mark remains on the screen shaded until the next
screen is redrawn.
4.2.1.4Editing Mark
Add Mark ('ENTER' + "MARK" + 'ENTER') or Place cursor on existing Mark
Press '3. E
DIT
'. A window appears to modify Name, Symbol, coordinates,
Dangerous status and notes of the existing Mark. Use the Joystick to select the field. If
you have selected Name field, press 'ENTER': use the Joystick to insert the character
(8 characters max), then press 'ENTER'. If Symbol field is selected press 'ENTER': a
window with 16 different symbols appears. Use the Joystick to select the symbol and
press 'ENTER'. If Coordinates field is selected, press 'ENTER' and then use the
Joystick to insert the value. The Danger field is used to switch Yes/No the Danger
status. If Danger status is Yes and the Guard Zone Alarm (see also Par. 5.3.4.4 ) is set
to any value from 0.01 to 9.99 NM and the distance between the fix position and the
selected Mark is less than Guard Zone Alarm value, a warning message is shown. The
Notes field is used to insert an alphanumeric text (max 15 characters). Then press '1.
66
User Manual
Page 65
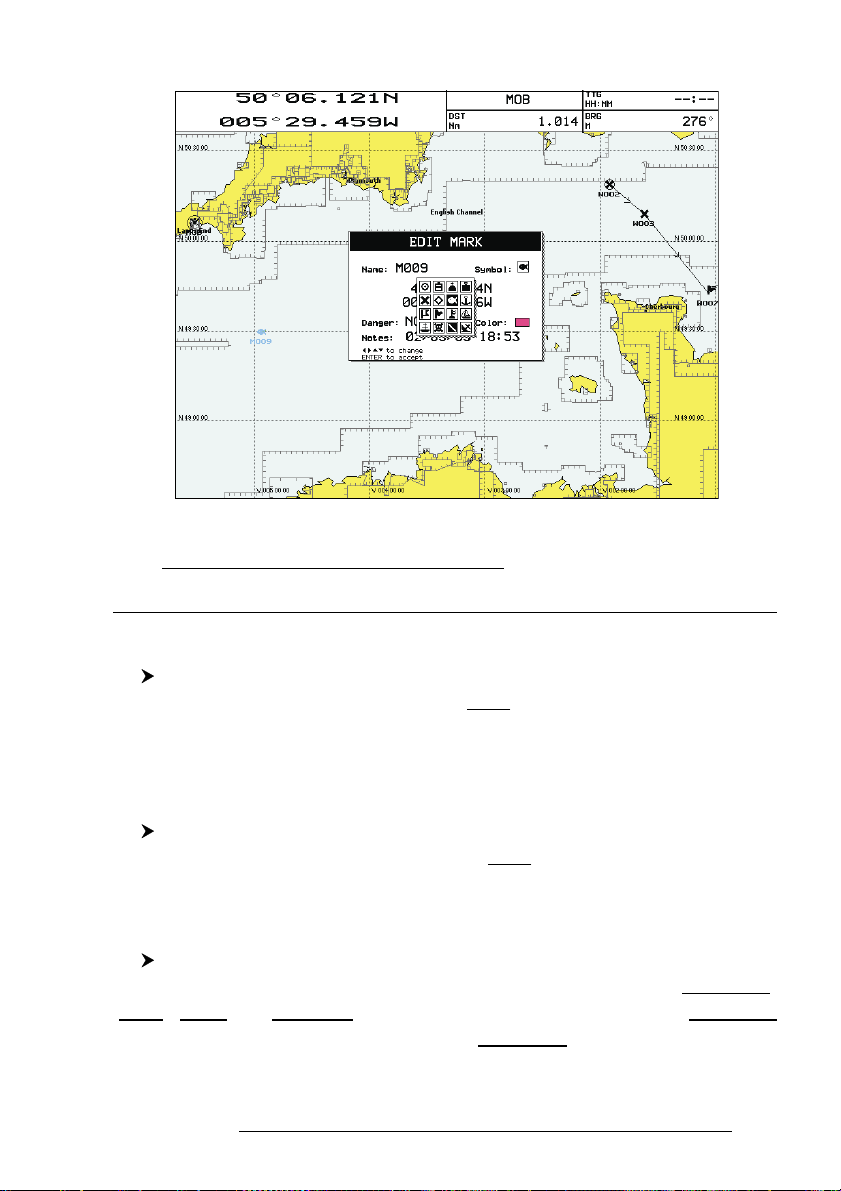
A
CCEPT
' to confirm the data entered.
Fig. 4.2.1.3 - Graphic symbol setting
Note ONLY FOR COLOR CHARTPLOTTER
It is possible to change Mark color. If you have selected Color field, press 'ENTER': a window with 8 different
colors appears. Use the Joystick to select the color and press 'ENTER'.
4.2.1.5Goto
Add Mark ('ENTER' + "MARK" + 'ENTER') or Place cursor on existing Mark
Press 'GOTO': a circle encloses the Mark symbol. A straight line is shown
on the screen connecting the Target with the ship's position. When the Target is
placed, all navigation data are referred to this Target.
4.2.1.6Finding Mark
'MENU' + "FIND" + 'ENTER' + "USER POINTS" + 'ENTER'
A window is opened to find a stored Mark by entering its label. Use the
Joystick to insert the name and press '1. C
ONFIRM
' ('1. C
ANCEL
' otherwise).
4.2.1.7Finding information on Marks: User Points List page
'MENU' + "USER POINTS" + 'ENTER'
A full window is opened showing information about all stored User Points
(Marks, Events and Waypoints). Move up/down the Joystick to select the User Point
you wish. If the page contains more than 11 User Points, the list continues in the
next pages. See Par. 4.1.2.8.
User Manual
67
Page 66

4.2.2 EVENTS
In Navigate mode you may place a location with an Event symbol and number, directly on the ship's position. Move the cursor to exit from Navigate mode;
place the cursor on an Event to access the following functions.
4.2.2.1Adding Event
'EVENT/MOB'
An Event is placed directly on the ship's position.
Note
It is possible to place an Event only if the chartplotter is making a valid position fix.
4.2.2.2Deleting Event
Place cursor on existing Event + '2. DELETE'
A window to confirm the deletion is shown. Press '1. C
otherwise): the Event remains on the screen shaded until the next screen is redrawn.
Note
If you try to delete any User Point used as GOTO a Warning window will appear, advicing that the User
Point belongs to an active Route and cannot be deleted.
4.2.2.3Editing Event
Place cursor on existing Event + '3. EDIT'
A window appears to modify Name and Symbol the existing Event.
Use the Joystick to select the field. If you have selected Name field, press 'EN-
TER': use the Joystick to insert the character (8 characters max), press 'ENTER'. If
Symbol field is selected press 'ENTER': a window with 16 different symbols appears.
Use the Joystick to select the Symbol and press 'ENTER'. The Notes field is used to
insert an alphanumeric text (max 15 characters). Then press '1. A
the data entered.
Note ONLY FOR COLOR CHARTPLOTTER
It is possible to change Event color. If you have selected Color field, press 'ENTER': a window with 8 different
colors appears. Use the Joystick to select the color and press 'ENTER'.
ONFIRM
CCEPT
' ('2. C
ANCEL
' to confirm
'
4.2.2.4Goto
Place cursor on existing Event + 'GOTO'
A circle encloses the Event symbol. A straight line is shown connecting the
Target with the ship's position. When the Target is placed, all navigation data are
referred to this Target.
4.2.2.5Finding Event
'MENU' + "FIND" + 'ENTER' + "USER POINTS" + 'ENTER'
68
User Manual
Page 67

A window is opened to find a stored Event by entering its label. Use the
Joystick to insert the name and press '1. C
ONFIRM
' ('2. C
ANCEL
' otherwise).
4.2.2.6Finding information on Events: User Points List page
'MENU' + "USER POINTS" + 'ENTER'
A full window is opened showing information about all stored User Points
(Marks, Events and Waypoints). Move up/down the Joystick to select the User Point
you wish. If the page contains more than 11 User Points, the list continues in the
next pages. See Par. 4.1.2.8.
4.3 AB FUNCTION
Selects the Range and Bearing,AB function which allows you fast and easy
measurements of distance and bearing between two points.
4.3.1 INSERTING AB
'ENTER' + "AB" + 'ENTER'
The "A" point is positioned on the cursor position. Use the Joystick to move
the cursor in the desired place and then to place the "B" point press:
'ENTER' + "AB" + 'ENTER'
A straight line connects the two points "A" and "B": a cross identifies the
beginning and the end of the "A-B" line. A window appears with the distance (DST)
and bearing (BRG) values.
4.3.2 DELETING AB
To delete the "A" and "B" points and the line press '2. C
4.4 EBL/VRM FUNCTION
The EBL option, "Electronic Bearing Line" is a dot line: the origin of the line
is cursor position.
The VRM option, "Variable Range Marker" is a circle and its radius is determined by the user. The circle's center is the cursor position.
User Manual
LEAR
'.
69
Page 68

4.4.1 INSERTING EBL/VRM
'EBL/VRM'
A dotted line and a circle appears on the screen. A window with the DST and
BRG values is shown. The origin of the line and the circle's centre is the cursor
position: use the Joystick to move the dotted line in any direction you choose; in the
same time the radius changes. Press '1. A
CCEPT
' to confirm ('2. C
ANCEL
' otherwise).
4.4.2 DELETING EBL/VRM
'EBL/VRM' + '1. ACCEPT'
Press '1. D
ELETE
' to delete the line and the circle.
4.4.3 EDITING EBL/VRM
'EBL/VRM' + '1. ACCEPT'
Press '2. E
DIT
' to modify the line direction and the circle' radius. Use the
Joystick to move the dotted line in any direction you choose; in the same time the
radius changes. Press '1. A
CCEPT
' to confirm ('2. C
ANCEL
' otherwise).
4.5 USING THE TRACK FUNCTION
The chartplotter can be set up for recording your Track as you move and for
plotting this Track on the chart.
4.5.1 ENABLING TRACK STORING
'TRACK' + "ACTIVATE" + 'ENTER'
To enable the Track storing. It is not possible to use the Track storing if you
are not receiving a valid fix.
When Track storing is activated, to disable:
'TRACK' + "DEACTIVATE" + 'ENTER'
4.5.2 DELETING TRACK
'TRACK' + "DELETE" + 'ENTER'
Deletes all the Track or part of it. '1. B
identify the start or the end point of the segment to delete.
70
EGIN
', '2. END' and '3. W
HOLE
User Manual
' allow to
Page 69

4.5.3 TRACK SETTING MENU
'TRACK' + "CONFIG" + 'ENTER'
On the screen a menu window is opened.
4.5.3.1Selecting Active Track
'TRACK' + "CONFIG" + 'ENTER' + "ACTIVE TRACK" + 'ENTER'
Pressing 'ENTER' more times selects the number of the active Track. The
default setting is 1.
4.5.3.2Displaying Track
'TRACK' + "CONFIG" + 'ENTER' + "DISPLAY MODE" + 'ENTER'
Selects the displaying of the past course Visible or Hidden. The default set-
ting is Visible.
4.5.3.3Selecting Line Pattern
'TRACK' + "CONFIG" + 'ENTER' + "LINE PATTERN" + 'ENTER'
Press 'ENTER' as many times as needed to select the pattern for the selected
Track.
Note ONLY FOR COLOR CHARTPLOTTER
It is possible to select the color for the Track. The item "Line Pattern" is changed to "Color".
4.5.3.4Selecting Track memorizing type
'TRACK' + "CONFIG" + 'ENTER' + "RECORDING MODE" + 'ENTER'
Choose Distance (the chartplotter can store a fix when the distance from its
last stored position is greater than a defined distance) or Time (the chartplotter can
store a fix after a defined time). The default setting is Time.
4.5.3.5Selecting Time Step
'TRACK' + "CONFIG" + 'ENTER' + "TIME STEP" + 'ENTER'
When the tracking function is On and the type of Track storing is Time, the
chartplotter can store a fix after a defined time. Choose among 1, 5, 10, 30 sec, 1 min.
The default setting is 1 sec.
4.5.3.6Selecting Distance Step
'TRACK' + "CONFIG" + 'ENTER' + "DISTANCE STEP" + 'ENTER'
When the tracking function is On and the type of Track storing is Distance,
you can store a fix when the distance from its last stored position is greater than a
defined distance. Choose in the range 0.01, 0.05, 0.1, 0.5, 1.0, 2.0, 5.0, 10.0 Nm (the
distance unit is selected by the user, see Par. 3.2.1). The default setting is 0.01 Nm.
User Manual
71
Page 70

4.5.3.7Delete all Tracks
'TRACK' + "CONFIG" + 'ENTER' + "DELETE ALL TRACKS" + 'ENTER'
Deletes all the stored tracks. After pressing 'ENTER' a Warning window
appears: press '1. C
ONFIRM
' (or '2. C
ANCEL
' to abort operation).
4.6 PAN FUNCTION
It is possible to select the pan function; pan allows you to shift area around
the cursor or a remote position to the centre of the screen.
4.6.1 MOVING CURSOR TO THE SCREEN CENTER
'MENU' + "FIND" + 'ENTER' + "CURSOR" + 'ENTER'
The screen is redrawn and the cursor with the location you want to see will
shift to the center of the screen.
4.6.2 PLACING CURSOR ON COORDINATES
'MENU' + "FIND" + 'ENTER' + "COORDINATES" + 'ENTER'
Press the Joystick up/down to modify coordinates and the Joystick left/right to
move cursor to left/right. Press '1. C
ONFIRM
' ('2. C
ANCEL
' otherwise).
4.7 FLOPPY DISK MENU
The chartplotter allows to copy information to a Floppy Disk. You can also
return the information to internal memory at a later time. This allows virtually
unlimited storage.
'MENU' + "FLOPPY DISK" + 'ENTER'
Note
It is possible to save and load the content of the floppy disk used with previous versions of chart plotter based
on C-MAP technology. The vice versa is not possible anyway.
4.7.1 SAVING FILE
'MENU' + "FLOPPY DISK" + 'ENTER' + '1. SAVE '
A window is opened to insert the file name and the type of data to save.
Choose the type of data to save by pressing the related '1. M
R
OUTES
' or '4. T
RACKS
'. Select the file name. At first a default name is shown: use the
72
ARKS
', '2. E
VENTS
User Manual
', '3.
Page 71

Joystick to insert the name. Press 'ENTER'.
Note
When naming a file, you may have trouble finding a name that uniquely identifies the file's contents. Dates,
for example, are often used in filenames; however, they take up several characters, leaving you with little
flexibility. The secret is to find a compromise, a point where you can combine a date with a word, creating
a unique filename. The maximum length of the filename is 8 characters. The characters may be numbers
(0, ..., 9), letters (A, ..., Z) and spaces (for example legal identifiers are "ABC", "AA", "12121212",
"A B C", "1 A 1", and so on.
4.7.2 LOADING FILE
'MENU' + "FLOPPY DISK" + 'ENTER' + '2. LOAD'
Before pressing '2. L
OAD
', choose the file name in the list shown, using the
Joystick.
4.7.3 DELETING FILE
'MENU' + "FLOPPY DISK" + 'ENTER' + '3. DELETE'
Remove old or unnecessary files to clean up your Floppy Disk. Remember
that this option permanently erases the file.
4.7.4 FLOPPY DISK HANDLING
'MENU' + "FLOPPY DISK" + 'ENTER' + '4. DISK'
4.7.4.1Formatting Floppy Disk
'MENU' + "FLOPPY DISK" + 'ENTER' + '4. DISK' + '1. FORMAT'
In order to be able to use a new Floppy Disk you must format it first: this
operation prepares the Floppy Disk to receive and store information.
4.7.4.2Ordering the Floppy Disk Directory
'MENU' + "FLOPPY DISK" + 'ENTER' + '4. DISK' + '2. SORT BY'
It is possible to order the file directory. This is possible in three different
modes:
- Press '1. N
- Press '2. T
- Press '3. T
AME
' to order by the filename;
YPE
' to order by the type of data;
IME
' to order by the time of file creation.
4.7.4.3Displaying Time
'MENU' + "FLOPPY DISK" + 'ENTER' + '4. DISK' + '3. TIME'
It is possible to enable or disable the display of Date and Time information
User Manual
73
Page 72

on the Floppy Disk page: when the Date and Time information is shown, it takes
longer to display the contents of the disk.
4.7.5 CHANGE FLOPPY DISK
'MENU' + "FLOPPY DISK" + 'ENTER' + '5. CHANGE'
Changes the Floppy Disk present into the drive. If the Floppy Disk is not
present in the slot, a warning message appears.
74
User Manual
Page 73

5
Menu Settings
There are other three menus, Display, Navigation Display and Advanced, to
handle the chartplotter information. Once you are in the Menu, use your Joystick to
highlight the item and press 'ENTER' to activate or to proceed to the next selection
menu.
5.1 DISPLAY MENU
Display Menu allows you to change how the chartplotter displays information. It is possible to select this menu only when the active page is the Chart Display
or the Depth Graph (in split mode); so firstly select one of these pages, for example
Chart Display mode.
'PAGE' + "CHART DISPLAY" + 'ENTER'
or
'#. CHART' (if it is present, where # is 1, 2, 3, 4 or 5)
Note ONLY FOR COLOR CHARTPLOTTER
It is possible to set the palette used to enhance the visibility of the screen depending on the surrounding light
condition. The possible choices are Normal, Classic, Night Vision and Sunlight. The default setting is
Normal. Normal is recommended when the chartplotter is not exposed to the direct sunlight. When this
mode is set the maps are displayed in order to use colors as similar as possible to the ones used in the original
paper charts. Classic is also recommended when the chartplotter is not exposed to the direct sunlight. The
colors used are the same colors used on NT cartography. Night Vision is recommended when the
environment is dark in order to reduce the glare of the display. The chartplotter displays maps and screen
in darker colors. Sunlight is designed to enhance the visibility of the screen when the chartplotter is exposed
to the sunlight. The maps are much brighter than in the other modes and the depth areas are filled with white
color so different depth areas are not easily distinguishable.
'MENU' + "DISPLAY" + 'ENTER' + "Palette" + 'ENTER'
5.1.1 AUTO INFO
'MENU' + "DISPLAY" + 'ENTER' + "Auto Info" + 'ENTER'
The type of Automatic Info is user selectable (see Par. 3.5.3).
User Manual
75
Page 74

5.1.2 MAP ORIENTATION
'MENU' + "DISPLAY" + 'ENTER' + "Map Orientation" + 'ENTER'
Selects orientation of your chart according to. The default setting is North
Up.
- North Up: the map is shown with North upwards.
- Track Up: the map is shown with the ship's current heading upwards. If
Track Up is selected, insert the Map Orientation Resolution angle by using the Joy-
stick up and down in the range [5, 60] degrees (the default setting is 30°).
5.1.3 SCREEN AMPLIFIER
'MENU' + "DISPLAY" + 'ENTER' + "Screen Amplifier" + 'ENTER'
The Screen Amplifier function allows, when it is On and Home mode is set,
to place map on the screen related to the fix position and direction, so the map shown
is that before the ship. The default setting is Off.
5.1.4 COURSE LINE
'MENU' + "DISPLAY" + 'ENTER' + "Course Line" + 'ENTER'
The chartplotter will display a line with a circle at the end to indicate the
position your ship will reach at the set time based on current direction of travel and
speed. This is continuously updated to account for changes. Disables (Off) or sets
time as : 2, 10, 30 min, 1, 2 hours, Infinite. The default setting is Infinite.
5.1.5 COORDINATE SYSTEM
'MENU' + "DISPLAY" + 'ENTER' + "Coordinate System" + 'ENTER'
Sets your preferred Coordinate System among ddd mm ss, ddd mm.mm, ddd
mm.mmm, UTM, OSGB, TD. The default setting is ddd mm.mmm.
If TD is selected a new TD Settings menu will be open on the screen:
'MENU' + "DISPLAY" + 'ENTER' + "COORDINATE SYSTEM" + 'ENTER' + 'TD'
+ 'ENTER"
Chain: Selects the preferred chain. The default setting is 9970.
Pair: Selects the pair of stations in the selected chain. The default setting is W X.
ASF 1/2: Sets the ASF (Additional Second Factor) for the slave in the selected chain.
The default setting is 0.
Alter: Turns On/Off the Alternate Solution in the chain. The default setting is Off.
76
User Manual
Page 75

5.1.6 MAP DATUM
'MENU' + "DISPLAY" + 'ENTER' + "Map Datum" + 'ENTER'
Selects the Map Datum. WGS 1984 is the default Map Datum.
5.1.7 FIX DATUM
'MENU' + "DISPLAY" + 'ENTER' + "Fix Datum" + 'ENTER'
Selects the Fix Datum. WGS 1984 is the default Fix Datum.
5.1.8 USER POINTS
'MENU' + "DISPLAY" + 'ENTER' + "User Points" + 'ENTER'
Sets On (icon + label), Off or Icon (only icon) the displaying of User Point.
The default setting is On.
5.1.9 EVENT HANDLER TYPE
'MENU' + "DISPLAY" + 'ENTER' + "Event Handler Type" + 'ENTER'
Selects the type as Normal or By Key: if By Key is selected it is possible to set
the desired number for the Event. The default setting is Normal.
5.1.10 DATA WINDOW MODE
'MENU' + "DISPLAY" + 'ENTER' + "Data Window Mode" + 'ENTER'
Customizes the Text Area layout among Full Screen, Text Area with 5 boxes
and Text Area with 8 boxes (see Par. 3.1.1). The default setting is 5 Boxes.
5.1.11 CURSOR WINDOW
'MENU' + "DISPLAY" + 'ENTER' + "Cursor Window" + 'ENTER'
Enables (On) or disables (Off) the display of the cursor window on the screen.
The default setting is On.
5.1.12 POSITION SYMBOL
'MENU' + "DISPLAY" + 'ENTER' + "Position Symbol" + 'ENTER'
Selects the icon of the fix position displayed on the screen between Boat and
Standard. The default setting is Boat.
User Manual
77
Page 76

5.2 NAV DISPLAY MENU
The Nav Display menu allows to select CDI Scale and Navigation Page. It is
possible to display this menu only if the Navigation Data page or the 3D Road page
has been selected; so firstly select one of this pages, for example Navigation Data
page:
'PAGE' + "NAVIGATION DATA" + 'ENTER'
or
'#. NAV' (if it is present, where # is 1, 2, 3, 4 or 5)
and then:
'MENU' + "NAV DISPLAY" + 'ENTER'
5.2.1 CDI SCALE
'PAGE' + "NAVIGATION DATA" + 'ENTER' then:
'MENU' + "NAV DISPLAY" + 'ENTER' + "CDI Scale" + 'ENTER'
Select your preferred CDI (Course Deviation Indicator) Scale among 0.2,
0.5, 1.0, 2.0, 4.0, 10.0 Nm by using the Joystick and then press 'ENTER'. The default
setting is 0.2 Nm.
5.2.2 NAVIGATION PAGE
'PAGE' + "NAVIGATION DATA" + 'ENTER' then:
'MENU' + "NAV DISPLAY" + 'ENTER' + "Navigation Page" + 'ENTER'
A new window appears with six items. Using the Joystick select the item you
want to change and press 'ENTER': another window appears, use the Joystick to select
the preferred data to display in the Navigation Data page and in 3D Road page among
BRG (Bearing), SOG (Speed Over Ground), COG (Course Over Ground), STR (Steering), CTS (Course To Steer), TRN (Turning), DTG (Distance To Go), VMG (Velocity May Good), SOA (Speed Of Advance), XTE (Cross Track Error), DRF (Drift),
SET, DPT (Depth), TEMP (Water Temperature). When finished press 'ENTER'.
The default setting is SOG, COG, DTG, CTS, XTE, STR.
5.3 ADVANCED MENU
The Advanced options are arranged in sub-menus. For example, all options
that relate to the Fix functions are in Fix & Compass sub-menu.
'MENU' + "ADVANCED" + 'ENTER'
78
User Manual
Page 77

5.3.1 INPUT/OUTPUT MENU
'MENU' + "ADVANCED" + 'ENTER' + "INPUT/OUTPUT" + 'ENTER'
5.3.1.1Port 1/Port 2/Port 3 Input
Disables (selecting Off) or sets the format for the navigation data input serial
Port1/2/3. For example to set the Port as NMEA-0183 (4800 Baud Rate, Parity None,
8 Bits Number, 1 Stop Bit and Normal Polarity) you must select 4800-N81-N. The
available choice is among (1200-N81-N), (4800-N81-N), (4800-N82-N), (9600-O81N), (9600-N81-N), C-COM (*). The default setting is (4800-N81-N).
'MENU' + "ADVANCED" + 'ENTER' + "INPUT/OUTPUT" + 'ENTER' +
"Port 1/Port 2/ Port 3 Input" + 'ENTER'
Choose your preferred setting and press 'ENTER' to confirm.
Note (*)
The option C-COM defines on which Port (both Input and Output) the C-COM modem is connected. It
is important to remark that this setting affects the Input and the Output of the selected Port. C-COM can
only be set on one Port at time.
COM to another Port, the chart plotter will show a message that warns the user about the current settings
and asks if the new settings must overwrite the previous ones.
5.3.1.2Port 1/Port 2/Port 3 Output
Disables (Off) or sets the interface as NMEA 0183, NMEA 0180, NMEA
0180/CDX.. The default setting is 0183.
'MENU' + "ADVANCED" + 'ENTER' + "INPUT/OUTPUT" + 'ENTER' +
"Port 1/Port 2/ Port 3 Output" + 'ENTER'
If C-COM was already assigned to a Port and the user tries to set the C-
5.3.1.3Port 1/Port 2/Port 3 NMEA Output
The chart plotter allows customizing the NMEA-0183 sentence transmitted
on each port. Each port can transmit a different set of sentences among: GLL, VTG,
BOD, XTE, BWC, RMA, RMB, RMC, APB, WCV, GGA, HSL, HDG. The default
setting is GLL, VTG, XTE, RMB, RMC, APB On and BOD, BWC, RMA, WCV,
GGA, HSL , HDG Off.
'MENU' + "ADVANCED" + 'ENTER' + "INPUT/OUTPUT" + 'ENTER' + "Port 1/
Port 2/Port 3 NMEA Output" + 'ENTER'
5.3.1.4Cable Wiring Pages
Shows a window containing the inteface cable wiring. See Par. 6.3 and 6.4.
'MENU' + "ADVANCED" + 'ENTER' + "INPUT/OUTPUT" + 'ENTER' + "Cable
Wiring" + 'ENTER' + "Power I/O" + 'ENTER'
'MENU' + "ADVANCED" + 'ENTER' + "INPUT/OUTPUT" + 'ENTER' + "Cable
Wiring" + 'ENTER' + "Port 1 - GPS Sensor" + 'ENTER'
'MENU' + "ADVANCED" + 'ENTER' + "INPUT/OUTPUT" + 'ENTER' + "Cable
Wiring" + 'ENTER' + "Port 2 - GPS Sensor" + 'ENTER'
User Manual
79
Page 78

5.3.2 FIX & COMPASS MENU
'MENU' + "ADVANCED" + 'ENTER' + "FIX & COMPASS" + 'ENTER'
The Fix & Comapss sub-menu contains options relating to GPS data input
and display.
5.3.2.1Fix Correction
'MENU' + "ADVANCED" + 'ENTER' + "FIX & COMPASS" + 'ENTER' + "Fix correction" + 'ENTER'
Turns On/Off the Correction from the positioning system. If the new Correction is calculated, but the Correction is not enabled, the ship's position is not
changed. The default setting is Off.
5.3.2.2Compute Correction
'MENU' + "ADVANCED" + 'ENTER' + "FIX & COMPASS" + 'ENTER' +
"Compute correction" + 'ENTER'
Corrects fixes from the positioning instrument. By placing the cursor on the
ship's real position and selecting this option, the error is calculated and internally
memorized for appropriate correction, but not applied.
5.3.2.3Correction Offset
'MENU' + "ADVANCED" + 'ENTER' + "FIX & COMPASS" + 'ENTER' + "Correction
Offset" + 'ENTER'
Manual correction of fix position.
5.3.2.4Static Navigation
'MENU' + "ADVANCED" + 'ENTER' + "FIX & COMPASS" + 'ENTER' +
"Static Navigation" + 'ENTER'
Sets up a threshold for the speed. When the speed received from the positioning device is under that threshold, the chartplotter displays zero speed. The default
value is 0.1 Knots.
5.3.2.5Position Filter
'MENU' + "ADVANCED" + 'ENTER' + "FIX & COMPASS" + 'ENTER' + "Position
Filter" + 'ENTER'
Turns On/Off the Position Filter. In case of a jittering fix this option makes
the ship' position more stable and the track smoother. The default setting is Off.
5.3.2.6Speed Filter
'MENU' + "ADVANCED" + 'ENTER' + "FIX & COMPASS" + 'ENTER' + "Speed
Filter" + 'ENTER'
80
User Manual
Page 79

Turns On/Off the Speed Filter. When it is On, you can filter the speed of the
ship, to optimize it. The default setting is Off.
5.3.2.7Bearing
'MENU' + "ADVANCED" + 'ENTER' + "FIX & COMPASS" + 'ENTER' + "Bearing"
+ 'ENTER'
Selects either degrees magnetic, Auto Mag, or True. If magnetic readings are
selected the variation is computed automatically for every zone as soon as the chart is
displayed. The default setting is Auto Mag.
5.3.2.8Magnetic Variation
'MENU' + "ADVANCED" + 'ENTER' + "FIX & COMPASS" + 'ENTER' +
"Magnetic Variation" + 'ENTER'
It is possible to calculate the Magnetic Variation in an Automatic or manual
mode, by inserting the step for calculation of Magnetic Variation. The default setting is Automatic.
5.3.2.9Calibrate Compass
'MENU' + "ADVANCED" + 'ENTER' + "FIX & COMPASS" + 'ENTER' +
"CALIBRATE COMPASS" + 'ENTER'
The variation table is used to match magnetic value readout on the chartplotter
comparable with the value given by the compass of the boat. In other words, since
the compass of the boat must be compensated (due to the iron masses, ...), we use the
same values given by the chartplotter. This means that, for example, if the BRG to
the next Waypoint readout in the chartplotter display is "X" Mag degree, if you steer
the boat reading "X" Mag degree from the compass, you are driving well toward the
next Waypoint.
5.3.3 SIMULATION MENU
'MENU' + "ADVANCED" + 'ENTER' + "SIMULATION MODE" + 'ENTER'
The built-in Simulator function allows you to become proficient in the use
of the chartplotter. No current position fix is required because the chartplotter simulates position data internally.
5.3.3.1Speed
'MENU' + "ADVANCED" + 'ENTER' + "SIMULATION MODE" + 'ENTER' +
"Speed" + 'ENTER'
To start the simulator you can insert the Speed value. Using the Joystick select
the preferred Speed and press 'ENTER'. The default setting is 01.0 Kts.
User Manual
81
Page 80

5.3.3.2Heading
'MENU' + "ADVANCED" + 'ENTER' + "SIMULATION MODE" + 'ENTER' +
"Heading" + 'ENTER'
To start the simulator you can insert the Heading value. Using the Joystick
select the preferred Heading and press 'ENTER'. The default setting is 000° M.
5.3.3.3Date and Time
'MENU' + "ADVANCED" + 'ENTER' + "SIMULATION MODE" + 'ENTER' + "Date"
+ 'ENTER'
'MENU' + "ADVANCED" + 'ENTER' + "SIMULATION MODE" + 'ENTER' +
"Time" + 'ENTER'
Using the Joystick insert the preferred Date and Time and press 'ENTER'.
5.3.3.4Cursor Control
'MENU' + "ADVANCED" + 'ENTER' + "SIMULATION MODE" + 'ENTER' + "Cursor Control" + 'ENTER'
Enables (On)/disables (Off) the cursor control. The default setting is Off.
5.3.3.5Simulation Mode
Once the settings are selected, turn on the Simulator:
'MENU' + "ADVANCED" + 'ENTER' + "SIMULATION MODE" + 'ENTER' + "Simulation Mode" + 'ENTER' + "On" + 'ENTER'
To turn On the Simulation select Off. The default setting is Off.
5.3.4 ALARMS MENU
The chartplotter provides alarm settings for various functions. Here you can
set the system for your navigational requirements.
'MENU' + "ADVANCED" + 'ENTER' + "ALARMS" + 'ENTER'
5.3.4.1Auto Off
'MENU' + "ADVANCED" + 'ENTER' + "ALARMS" + 'ENTER' + "Auto Off" +
'ENTER'
You can enable (On) or disable (Off) the automatic shutdown of the alarms
when the alarm condition disappears. The default setting is On.
5.3.4.2Arrival Alarm
'MENU' + "ADVANCED" + 'ENTER' + "ALARMS" + 'ENTER' + "Arrival Alarm" +
'ENTER'
Specifies the radius of a circle around the Waypoint of a Route: when your
vessel reaches this circle the alarm sounds. After pressing 'ENTER' a box will appear
82
User Manual
Page 81

with Off (00). Using the Joystick select the number preferred and press 'ENTER'. The
default setting is 1.00 Nm.
5.3.4.3XTE Alarm
'MENU' + "ADVANCED" + 'ENTER' + "ALARMS" + 'ENTER' + "XTE Alarm" +
'ENTER'
Specifies the distance your Cross Track Error (XTE) can vary before the
sound of an alarm or disables the XTE Alarm (Off). After pressing 'ENTER' a box
will appear with 00. Using the Joystick select the number preferred and press 'EN-
TER'. The default setting is Off (00).
5.3.4.4Guard Zone Alarm
'MENU' + "ADVANCED" + 'ENTER' + "ALARMS" + 'ENTER' + "Guard Zone
Alarm" + 'ENTER'
The Guardian Zone Alarm is activated when the fix position gets closer than
a given range to any User Point. It is possible to set the alarm range (or disable it). To
insert the desired value use the Joystick, then press 'ENTER' to confirm. The default
setting is Off.
5.3.4.5Anchor Alarm
'MENU' + "ADVANCED" + 'ENTER' + "ALARMS" + 'ENTER' + "Anchor Alarm" +
'ENTER'
This function allows inserting of the limit of anchor dragging: beyond that,
the alarm is activated. The chartplotter computes the distance between the current
GPS position and the GPS position saved at the activation of the anchor alarm in the
menu. If the computed distance exceeds the value set in the menu, the chartplotter
shows the alarm message and starts the acoustic alarm. After pressing 'ENTER' a
box will appear with 00. Using the Joystick select the number preferred and press
'ENTER'. The default setting is Off (00).
5.3.4.6Depth Alarm
'MENU' + "ADVANCED" + 'ENTER' + "ALARMS" + 'ENTER' + "Depth Alarm" +
'ENTER'
Specifies the depth or disables the Depth Alarm. After pressing 'ENTER' a
box will appear with 00. Using the Joystick select the number preferred and press
'ENTER'. The default setting is Off (00).
5.3.4.7Timer Alarm Menu
'MENU' + "ADVANCED" + 'ENTER' + "ALARMS" + 'ENTER' + "Timer Alarm" +
'ENTER'
User Manual
83
Page 82

The Timer Alarm is activated when the defined time is expired. The Timer
Value and the counter direction can be set by the user.
Timer Alarm
'MENU' + "ADVANCED" + 'ENTER' + "ALARMS" + 'ENTER' + "Timer Alarm" +
'ENTER' + "Timer Alarm" + 'ENTER'
Starts (On) or Stops (Off) the Timer Alarm counter.
Timer Value
'MENU' + "ADVANCED" + 'ENTER' + "ALARMS" + 'ENTER' + "Timer Alarm" +
'ENTER' + "Timer Value" + 'ENTER'
Enter the Timer Value (Hours Minutes Seconds Range 00:00:01 - 23:59:59).
Timer Direction
'MENU' + "ADVANCED" + 'ENTER' + "ALARMS" + 'ENTER' + "Timer Alarm" +
'ENTER' + "Timer Direction" + 'ENTER'
Set the Timer Direction UP or DOWN: when Timer Direction is set UP, the timer
start from zero and increases it's value; the alarm is activated when the timer reaches
the Timer Value entered by the user. When Timer Direction is set DOWN, the
count-down starts from the value set by the user and decreases it's value. The Alarm
is activated when the Timer value goes to zero.
5.3.4.8Grounding Alarm Menu
'MENU' + "ADVANCED" + 'ENTER' + "ALARMS" + 'ENTER' + "Grounding Alarm"
+ 'ENTER'
Grounding Alarm
'MENU' + "ADVANCED" + 'ENTER' + "ALARMS" + 'ENTER' + "Grounding Alarm"
+ 'ENTER' + "Grounding Alarm" + 'ENTER'
The chartplotter is provided with a function that, by querying the map's data, verifies potential danger to navigation due to shallow water, land, rocks, obstructions
and shoreline constructions. The maps are scanned periodically (every 10 seconds).
When the Grounding Alarm is active, the chartplotter scans an area in front of the
boat. This area is identified by a triangle drawn in front of the boat icon whose
direction is determined by the current boat heading. The length of the triangle is user
selectable and its angle is 30 degrees. If any of the above objects are found, the
chartplotter notifies the danger on a dedicated warning message box in the Grounding Alarm Report page (see Par. 5.2.8). The Grounding Alarm is switched Off by
default after a Master Reset. Once the Grounding Alarm has been activated, a warning message is shown.
84
User Manual
Page 83

Note
The Grounding Alarm function only operates with the new NT+ C-CARDs. It also affects the speed of
the redraw of the screen. If this function is not used it maybe disabled.
Grounding Depth Limit
'MENU' + "ADVANCED" + 'ENTER' + "ALARMS" + 'ENTER' + "Grounding Alarm"
+ 'ENTER' + "Grounding Depth Limit" + 'ENTER'
The user can enter the minimum depth.
Grounding Alarm Range
'MENU' + "ADVANCED" + 'ENTER' + "ALARMS" + 'ENTER' + "Grounding Alarm"
+ 'ENTER' + "Grounding Alarm Range" + 'ENTER'
Allows setting the length of the sector to be detected among 0.25, 0.5, 1.0 Nm. The
default setting is 0.25 Nm. When any of the searched objects is found in the scanned
area, a tick marker is printed on the relative box in the Grounding Alarm Report
page (see Par. 5.2.8) to identify which dangerous objects have been currently detected.
Grounding Alarm Report
'MENU' + "ADVANCED" + 'ENTER' + "ALARMS" + 'ENTER' + "Grounding Alarm"
+ 'ENTER' + "Grounding Alarm Report" + 'ENTER'
Allows displaying the report of the dangerous objects currently detected.
5.3.4.9External Alarm
'MENU' + "ADVANCED" + 'ENTER' + "ALARMS" + 'ENTER' + "External Alarm"
+ 'ENTER'
Allows triggering an external alarm device. You can enable (On) or disable
(Off) the External Alarm. The default setting is On.
User Manual
85
Page 84

86
User Manual
Page 85
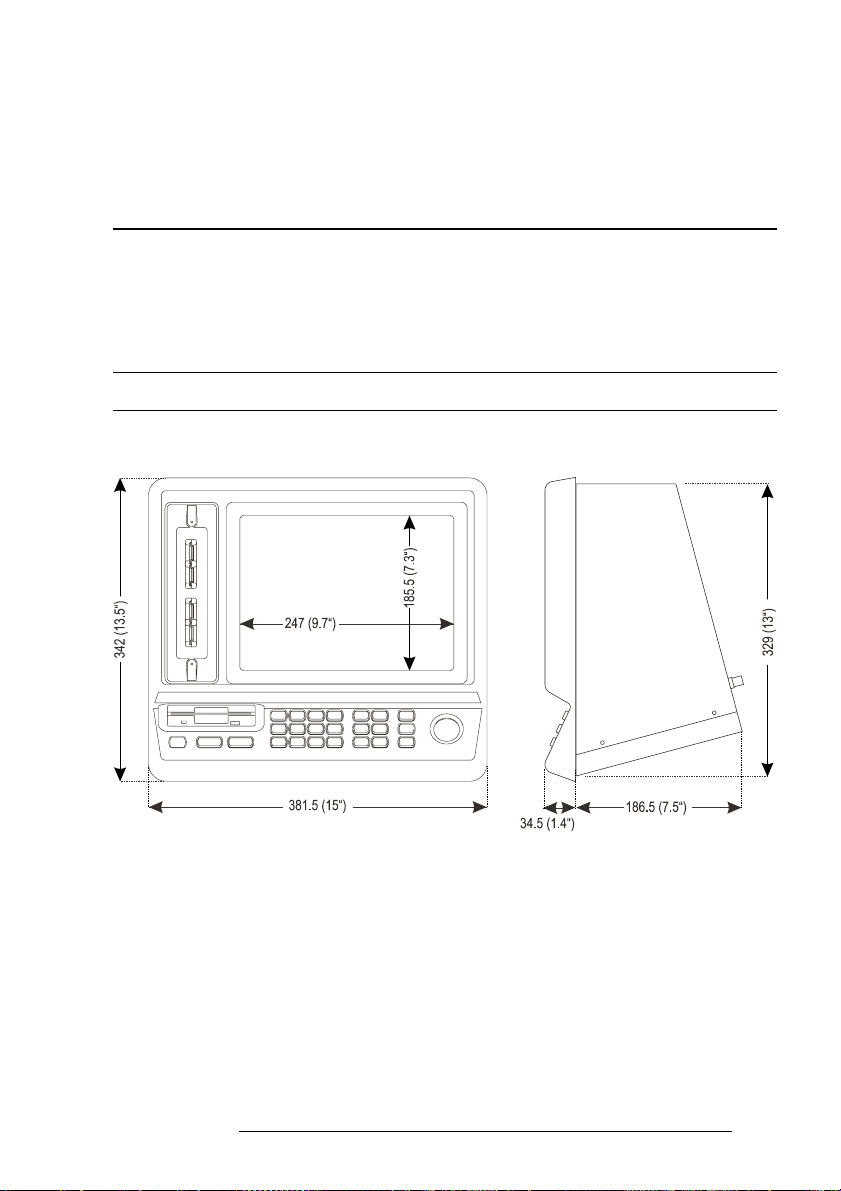
6
For the Technician
6.1 DIMENSIONS
User Manual
87
Page 86

6.2 INSTALLATION AND REMOVING
88
User Manual
Page 87
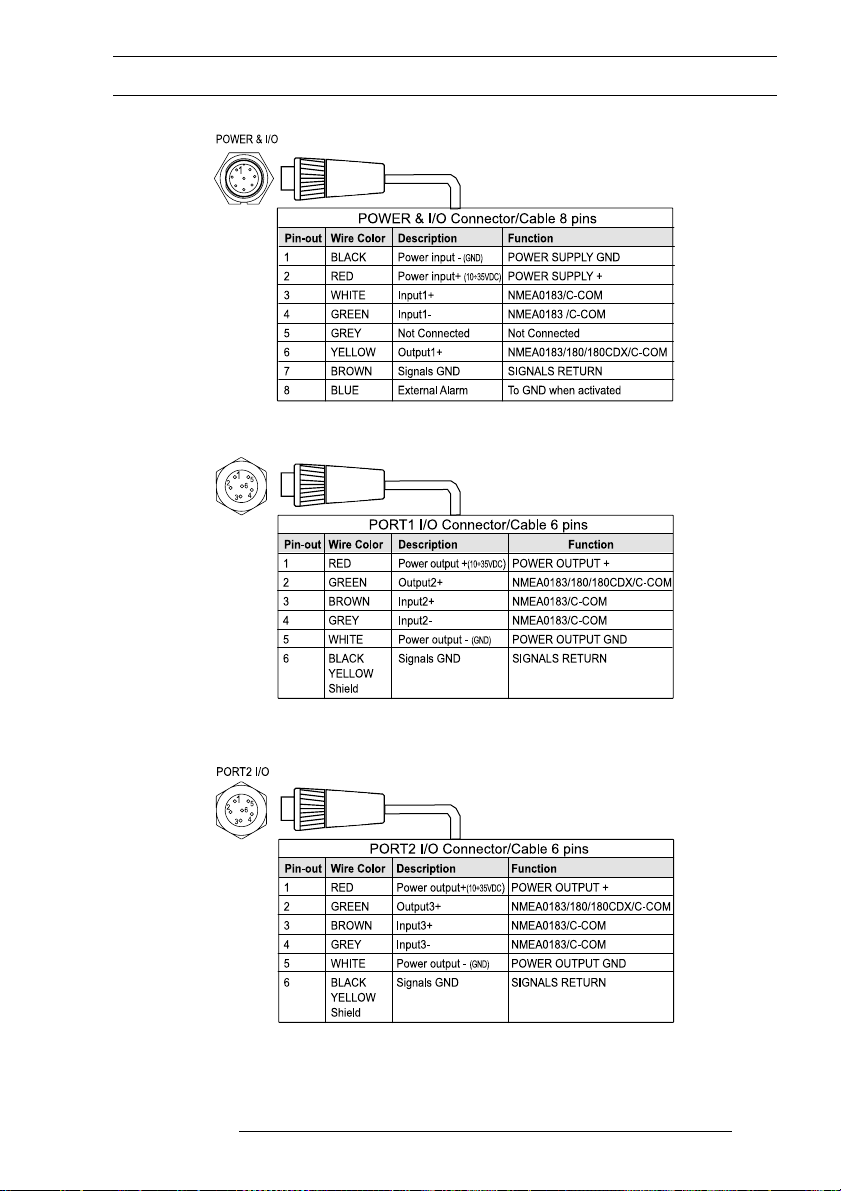
6.3 EXTERNAL CONNECTORS
Fig. 6.3 - POWER & I/O connector
User Manual
Fig. 6.3a - PORT 1 connector
Fig. 6.3b - PORT 2 connector
89
Page 88

6.4 TROUBLESHOOTING
The following is a brief guide to some of the problems you may experience
while using the chartplotter with common solutions.
6.4.1 PROBLEMS AND SOLUTIONS
The chartplotter does not turn On Make sure that the correct voltage (10-35 volt
dc) is present. Check also that the polarity is correct. Refer to the Par. 2.2.
The chartplotter does not turn Off If, after a 'POWER' pressure (for at least 3
seconds) the chartplotter does not turn Off, then turn Off the voltage.
The chartplotter does not respond to any command Try to turn Off, and then
turn On. If the problem persists, erase the memory (see Par. 6.5.1).
The chartplotter does not get a valid fix Make sure that no metal obstacle is placed
around the chartplotter acting as a shield for the antenna. If, after 15 minutes, the
chartplotter does not get the fix, turn it Off and On again.
The chartplotter screen becames very dark after a long exposure to direct sunlight
Control the contrast (see Par. 2.3).
6.4.2 WHEN NOTHING ELSE WORKS
The list above should allow you to solve most of the operating problems you
are likely to encounter. Simply disconnecting the chartplotter from power for a moment may solve your problem as well.
If this does not help, you can try one additional memory clear option. This is
a factory default RAM Clear that should only be tried after all other attempts have
been made. When using the RAM Clear feature, you will loose all user stored information and the chartplotter will default to factory settings. Before this step, you have
the option of saving user Marks, Track history and Routes to a Floppy Disk (this is
an optional purchase from your dealer). To perform a RAM Clear see Par. 6.5.1.
6.4.3 IF YOU NEED ASSISTANCE
If you still need assistance, call your local dealer, reporting the Software Re-
90
User Manual
Page 89

lease and Cartography information available in the About page.
'MENU' + "ADVANCED" + 'ENTER' + "About..." + 'ENTER'
Note
The information shown on this page depends on the software running on the chartplotter and on the C-CARDs
inserted.
6.5 SYSTEM TEST
If you have connected your position-finding device according to the instructions, and chosen the proper menu selection for your device, and are still having
problems with your chartplotter, the extended auto-test should help determine the
problem. Make sure the chartplotter is turned Off. While pressing and holding any
other key, turn the chartplotter On. A new menu will appear on the display. Use the
Joystick to select the preferred test: this will display in reverse video and with the
relative menu window. To choice the test press 'ENTER'. To exit from any submenu
press 'CLEAR'. To exit from the System Test turn Off the chartplotter.
6.5.1 RAM menu
This test verifies the integrity of the memories and if preferred during this
test all the internal memory can be erased and the default setting restored.
n RAM Test
To verify the integrity of the RAM. If on the screen the message "ERROR"
appears, the RAM is physically damaged.
n RAM Clear
To clear internal memory. If the chartplotter exhibits unusual behaviour, or appears to be malfunctioning, it may be possible to correct the problem by clearing
RAM.
This operation will erase all Marks, Events, Routes, stored track plots and destinations. It will also return all selections (Input Data Format, Autopilot selection,
etc.) to original default values. To confirm to clear RAM press 'ENTER' again
(but if at this time you do not wish to clear RAM press 'CLEAR').
6.5.2 DIM menu
To select the preferred value for contrast and backlight.
User Manual
91
Page 90

n Contrast
Each time you pressed the Joystick to right, the screen will decrease brightness,
instead of to left it will increase brightness.
n Backlight
To set the backlight. Operates in similar mode as Contrast.
6.5.3 CARTRIDGES
To check the C-CARD and its connector.
n Background ROM
To test the WorldWideBackground. If there is not a malfunction, the code of the
Background and the message "OK" are shown.
n C-CARD Test
To test the C-CARD. There are three possible situations:
1. if there is a C-CARD inserted in the slot and there is not a malfunction, the
name of the C-CARD zone and the message "OK" are shown.
2. if there is a C-CARD inserted in the slot, but it is a damaged C-CARD, the
name of the C-CARD zone and the message "Faulty" are shown.
3. if there is not any C-CARD inserted in the slot, the message "not present" is
shown.
n C-CARD Connector
Indicates if there is a malfunction in the connector. It is used only in production.
6.5.4 MODEM TEST
To check the Modem connections.
6.5.5 SERIAL PORTS
If you are having problems receiving data from the position-finding instru-
ment, this test should help determine the problem.
n Change Parameters
Allows to change the parameters of the serial interface. This menu allows to
select the Port (Signal Source) between Port 1, Port 2 or Port 3 , the Baud Rate
between 4800 or 9600, the Data Bits (Word Length) between 7 or 8, the Parity
92
User Manual
Page 91

between even, odd or none, the Stop Bits between 1 or 2. Default settings are:
Port = Port 2, Baud Rate = 4800, Data Bits = 8, Parity = odd, Stop Bits = 1.
n Input Data Display
Allows the chartplotter to act as a computer terminal and display the incoming
data exactly as it received. If the data displayed on the screen is unrecognizable,
you may have selected the wrong input parameters for your particular receiver.
Check your receiver manual to be sure that you have selected the proper interface format. If the screen is blank, you may have a broken connection and no data
is being received. Use 'ZOOM IN' to stop (or continue after pause) data displaying, 'ENTER' to show data in hex or ASCII mode (normal or small) and 'CLEAR'
to exit.
6.5.6 EXTERNAL ALARM
To check the External Alarm signal.
6.5.7 FLOPPY DISK
To check the Floppy Disk handling.
User Manual
93
Page 92

94
User Manual
Page 93

A
C-Forecast
C-Forecast is an innovative meteorological forecasting system with the ability to visualise the weather forecast, for a given area, directly on to the area related
cartography on a chart plotter. The weather data is transferred very quickly to the
plotter thanks to C-COM, a device for data-transfer via GSM developed by C-MAP.
In order to access the C-Forecast it is necessary to set up a subscription. The
only other cost will be the GSM-call to the remote weather report server, normally
lasting less then a minute.
With C-Forecast it is possible to receive weather information regarding the
wind, speed and direction, as well as the height of the waves in the area. The weather
data will be superimposed on to the C-MAP NT+ cartography and visualised directly
on the plotter screen.
In order to access the C-Forecast, the plotter must have the necessary software to make the connection, through the GSM-modem (C-COM), with the weather
data server.
The area covered by the weather information is determined by either the
actual position and heading, given by the onboard GPS, or co-ordinates entered manually by the user. The user variable features can be pre-set through the C-Forecast
menu on the plotter (see Fig. A) together with the level of detail. To see the area
covered by the C-Forecast, please refer to the c-forecast.c-map.com web site.
The weather forecast is covering a period of 48-hours, within which the user
can collect the information for any period of 6 hours (example: at 2 PM on the 21st of
March 2002 a user's request a weather forecast, the forecast will cover the period for
the following 6 hours based on the predicted weather situation at the time of collection, ending at 8 PM on the 21st of March 2002). The weather information on the
C-Forecast server is revised every hour, covering the following 48 hours.
User Manual
95
Page 94

Fig. A - Preview of the area covered by the requested weather forecast
The coverage of the weather forecast in each instant is determined by the maxi-
mum speed of the boat given at the time of subscription (see Fig. A and table Aa below).
COVERAGE OF THE FORECASTING AREA
Maximum Speed(Knt) Width in Degree Travel Distance (Nm)
5 160 30
10 150 60
15 140 90
20 130 120
25 120 150
30 110 180
35 100 210
40 90 240
Fig. Aa - Table of the area covered by the forecast
A.1 PRESENTATION OF DATA
The information received from the weather data server consists of two type
of information which will be shown on the plotter screen, represented by two different icons, one relating to wind and the other to waves.
The icon for wind is a circle with an arrow pointing towards the center where
the arrow represents the direction of the wind, it will show a number this represents
speed (shown in units according to measurements pre-set by the user - see the left
column in Fig. A.1). It is possible to pre-set an upper limit for the wind speed and
connect this limit to an alarm which will alert and request navigator action (see the
right column in Fig. A.1).
96
User Manual
Page 95

Note ONLY FOR COLOR CHARTPLOTTER
The colour of the wind icon will change to red when the wind speed limit has been reached (preset by the user in the menu).
Fig. A.1 - Wind icon in condition: normal (left) and condition alarm (right)
The icon for the waves is a circle with a number representing the height of
the waves (shown in units according to measurements preset by the user), see the left
column of Fig. A.1a. It is possible to preset an upper limit for the height of the
waves, and connect this limit to an alarm which will alert and request navigator
action (see the right column in Fig. A.1a).
Note ONLY FOR COLOR CHARTPLOTTER
The colour of the wave height icon will change to red when the height limit has been reached (preset by the user in the menu).
Fig. A.1a - Icon for waves, condition: normal (left) and for alarm (right)
The weather information received from the C-Forecast server is saved in the
chart plotter's memory. The information can be accessed and used in two ways, by
using the chart plotter in navigation mode or in browse mode (see Fig. A.1.1).
For every point for which forecast data have been collected, the information
saved to memory contains the data for the subsequent 6 hours from the time of
collection. The area covered by the data in each instants is determined by the maximum speed of the boat indicated at the time of subscription.
Every point for which weather data have been received, the predictions will
cover the maximum travel distance, if departure happens at the same time as receipt
of the weather data, and the travel speed is at the maximum speed for the full 6 hours.
The significance of this is that there is no need for collecting further information
from the C-Forecast server, until the end of the 6th hour covered by every circle. As
you can see from Fig. A.1b, from the time of collection, the travel time covered is
reduced by an hour until the last hour where you will have to collect a new prediction covering the following 6 hours.
Hours of Navigation Hours covered by the forecast
a
1
a
2
a
3
a
4
a
5
a
6
Fig. A.1b - Table of hours covered area by the weather forecast
6
5
4
3
2
1
User Manual
97
Page 96
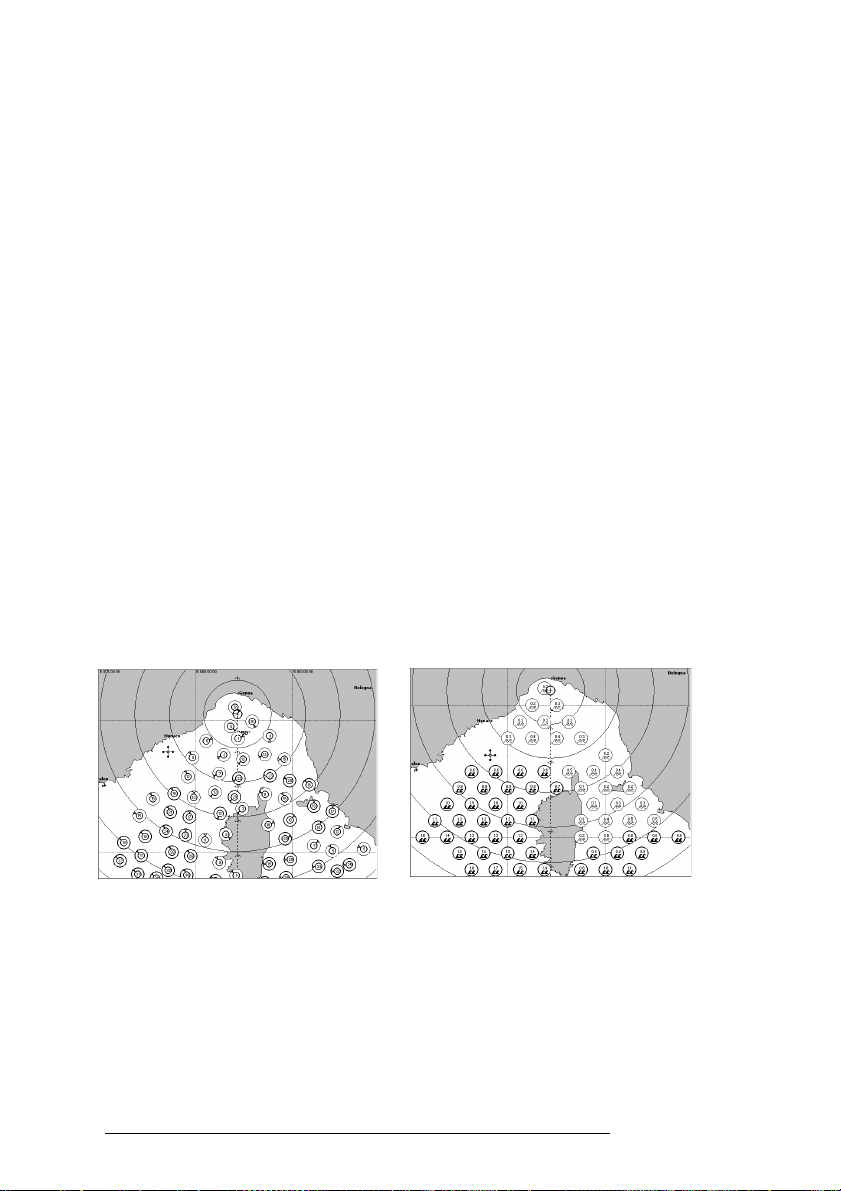
A.1.1 PRESENTATION OF WEATHER INFORMATION
A.1.1.1 Viewing the information in Navigation mode
The Navigation mode allows the user to view on screen the weather information superimposed directly onto the cartography (the wind or the waves not
both simultaneously), the area shown is relative to the position of the boat (plotted
by the onboard GPS, or in simulation mode given by the simulator). The data is
relative to the time of day and information received or simulated. The type of information shown on the screen depends on the option chosen by the user in the menu:
Video settings - the 3 options are: no information, wind or waves.
The information shown is presented as a serie of icons - wind or waves.
The amount of icons presented on screen, depend on the position from where
the information was collected and the maximum travel speed.
- Example 1:If the boat is traveling at maximum speed all the icons will show up on
the screen.
- Example 2:If the boat is laying still without moving position, no icons will show.
If the boat travels at maximum speed and reaches the area covered by the
information of the 6th hour, the related '6th hour information' will be available on
screen. However if the boat arrived at the same area covered by the 6th hour information, after the 6th hour, no information would shown, - the information saved in
memory is regarded not up-to-date by the plotter after the 6th hour and discarded,
and new weather information will have to be collected from the C-Forecast server.
Fig. A.1.1.1 - Mode Navigation: icons showing wind (left) and icons for waves (right)
A.1.1.2 Viewing the weather information in Browse mode
The Browse mode allows the user to view on screen (superimposed onto the
cartography) the information related to wind or waves. The user can directly choose
the time and area covered in order to evaluate the situation at the time of arrival in
the area.
98
User Manual
Page 97
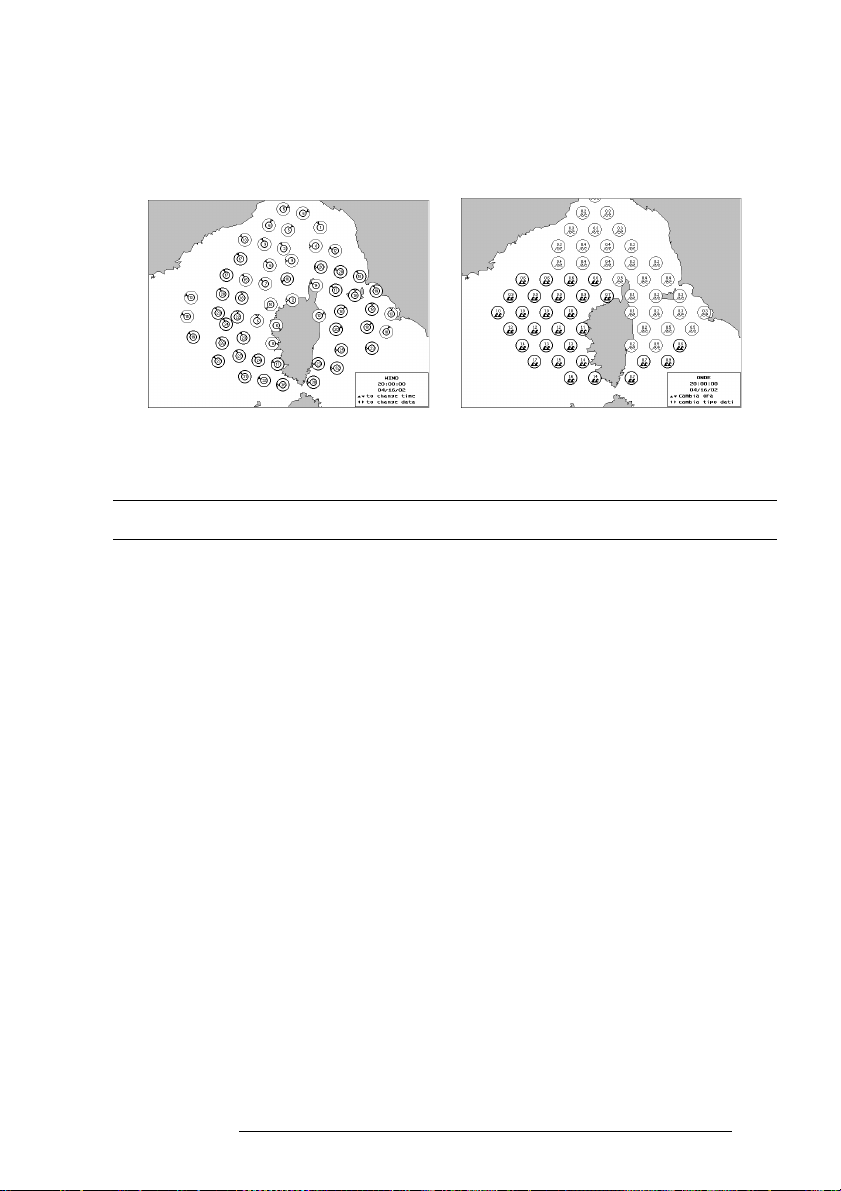
To activate the Browse mode, simply choose in the menu - preview. As soon
as the user has activated Browse mode, the cartography centers on the point to which
weather information have been collected and saved. It is possible to use the cursor to
move the view around the area covered by the 6 hours weather forecast and change
the view between wind and waves.
Fig. A.1.1.2 - Mode Browse: icons for wind (left) and icons for waves (right)
A.2 SYSTEM SET UP C-FORECAST
To set-up and access the C-Forecast weather forecasting system a serie of
steps must be completed, please read the following carefully:
- Sign up for subscription with C-Forecast. Contact the local reseller or contact
directly your local C-MAP office.
- Connect the chart plotter with the C-COM module.
- Insert the GSM SIM cart into the C-COM module (SIM-card not included).
- The chart plotter has two serial connections ports for exchange of data. Choose
one of these to make the connection to the C-COM module.
- Open set-up in the menu of the chart plotter and insert the identification code of
the subscription, included in the subscription documentation received from
C-MAP.
- Insert also the telephone number for the C-Forecast server, included in the subscription documentation received from C-MAP.
- Remember to insert the SIM PIN number (received together with the SIM-card).
When the above steps have been completed, it will immediately be possible
to receive weather information from the C-Forecast server in the following way:
- Insert the position from where the boat will depart (manually or by use of the
GPS).
User Manual
99
Page 98

- Insert the direction in which the boat will travel.
- Insert the date and time of departure (ETA).
- Start the transfer of weather information.
A.2.1 INSTALLATION OF HARDWARE COMPONENTS
A.2.1.1 Electrical connection
The data connection between the C-COM module and the chart plotter is
done by using a serial port (it is possible on some chart plotter to a port of your
choice). To make the electrical connection refer to Par. 2.5.4.
A.2.1.2 Verification of C-COM module
The Modem Test (can also read; SYSTEM TEST *) makes it possible to test
the and verify a connection between the C-COM and the chart plotter.
Note (*)
To start the SYSTEM TEST switch on the chart plotter using POWER and any other key.
The Modem Test controls that there is a communication between the chart
plotter and the C-COM by for a short time transmitting a serie of diagnostic commands to the C-COM and verify the result.
If the chart plotter is build with two serial ports, it is possible to choose
which port to use for connection with the C-COM module.
The diagnostic screen for Modem Test, will show the following information:
a. MODEM OK: #
b. MODEM ERROR: #
c. MODEM TIMEOUT ERROR: #
a. If the number (#) by the MODEM OK is different to 0, it is an indication that the
connection between the chart plotter and the C-COM module is established and the
C-COM is responding correctly. No problems have been found.
b. If the number (#) by the MODEM OK is different to 0, it shows that the connection to the C-COM module has not been made - the C-COM module may be defect.
c. If the number (#) by the MODEM TIMEOUT ERROR is different to 0, it shows
that the C-COM module is responding but the link to the chart plotter has not been
made.
The error may be for one of the following reasons:
100
User Manual
Page 99

- The C-COM is not connected or not connected correctly to the chart plotter.
- The C-COM module has not got a power supply.
- The serial port to which the link between the C-COM and the chart plotter is
made, is not the correct port, to which the C-COM should be connected.
A.2.1.3 The GSM SIM-card
The GSM SIM-card must be of a type which will allow data transfer. The
SIM-card must be inserted into the SIM-slot in the C-COM module. If the GSM SIMcard need a PIN-code inserted, for the SIM-card to be activated, then this can be done
in the C-Forecast operation menu. The chart plotter does not accept deactivation of
the PIN-code.
A.2.2 INSTALLATION OF SOFTWARE
A.2.2.1 Registrations of user ID
The user identification number is a string of 16 characters and numbers ########-####-####. The character - is not a part of the code and is only used to make
the code more legible and is not to be inserted.
The code is supplied together with the subscription documents from C-MAP.
The registration code can only be used in one (1) chart plotter. The C-Forecast server
will associate the code and the chart plotter in which the code was first used. During
the connection start-up, the C-Forecast server will compare the registration information and the code identifying the chart plotter and will only connect to a known
chart plotter.
Note
The Registration Code is contained in the chart plotter and after insertion can not be changed by the user.
However if the user whish to change the subscription, for the reason of change to an other chart plotter (for
example: change to and other model or change because of faulty chart) it is nessesary to contact C-MAP
directly in order to transfer the subscription to the new chart plotter.
A.2.2.2 Inserting the telephone number of the C-Forecast server
The telephone number through which the C-COM will make the connection with the C-Forecast server must be inserted in the menu part - C-Forecast set-up.
A.2.2.3 Activation of the serial port
Some chart plotters are build with more than one serial port, it is therefor
necessary to choose which port is to be used. The user can do this in the menu part C-Forecast set-up.
User Manual
101
Page 100

A.2.3 TRANSFER OF WEATHER DATA
Before the data transfer can start, it is necessary to insert: Time of departure
(ETD), current position (PO) manually or obtained from the GPS and the heading.
All the data transfer function are available in the menu - C-Forecast, Preview download.
A.2.3.1 Insert current date and time
Normally the chart plotter will receive date and time through the build in or
attached GPS, or in simulation mode - manually. In case it is necessary to insert the
date and time manually, before collection of data from C-Forecast, it is done in the
menu - C-forecast, preview, date and time (ETD).
If the date and time are not inserted the server can not provide any information or the transferred information may be of no value for navigation.
A.2.3.2 Selection of an area from which to get weather data
The area covered by the weather data is variable according to the type of
subscription, the point of departure and the heading.
Inserting of point of departure
The point of departure can be set by the user either directly from the GPS - actual or
simulated position, by using cursor position or by inserting the numeric co-ordinates
manually.
Inserting heading
The heading will represents the central line of the area covered by the weather information. The heading, is normally received from the GPS, but can manually be modified by the user.
A.2.3.3 Selecting type of weather information to be collected
It is possible to select the type of data to be collected from the options below:
- Wind: only the direction and pressure/speed
- Waves: only height
- Wind + Waves: both the above
A.2.3.4 Download of data
If the previous options/settings have been carried out, it is now possible to
download the weather information using the menu item - C-Forecast; download preview.
102
User Manual
 Loading...