

Page 1
- 1 -
SVS-880/1010
OPERATION MANUAL
Page 2
- 2 -
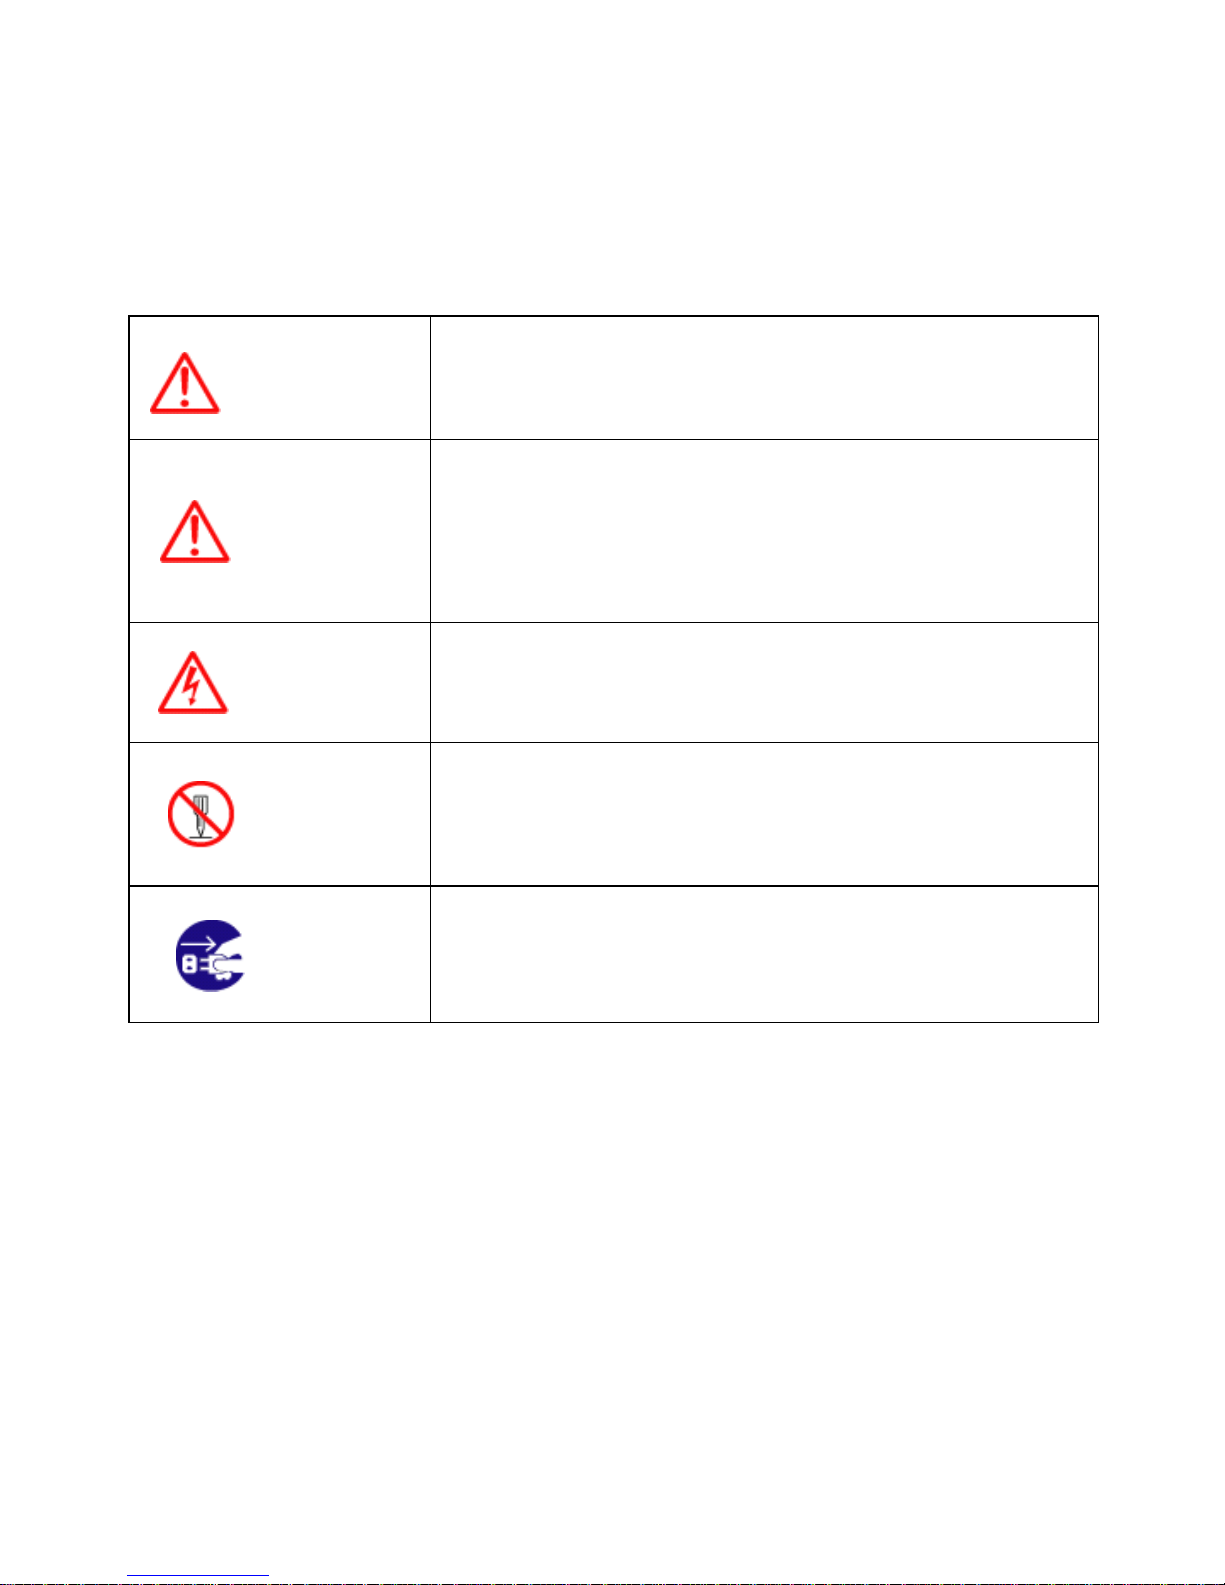
Pictorials
This manual uses the following symbols for easy understanding safety instructions. Always
follow these instructions carefully.
WARNING
Always follow this safety instruction to prevent death or
injury.
CAUTION
Follow this safety instruction to avoid possible injury or
damage to your property.
Symbol “△” is a CAUTION or WARNING label indicating the
safety instruction.
WARNING
This symbol is an Electrical Shock WARNING label.
Symbol is an instruction that you must not violate.
(This symbol instructs NOT to disassemble the system
components)
Symbol is an operation instruction that you must follow.
(This symbol shows the main power OFF instruction.)
Page 3

- 3 -
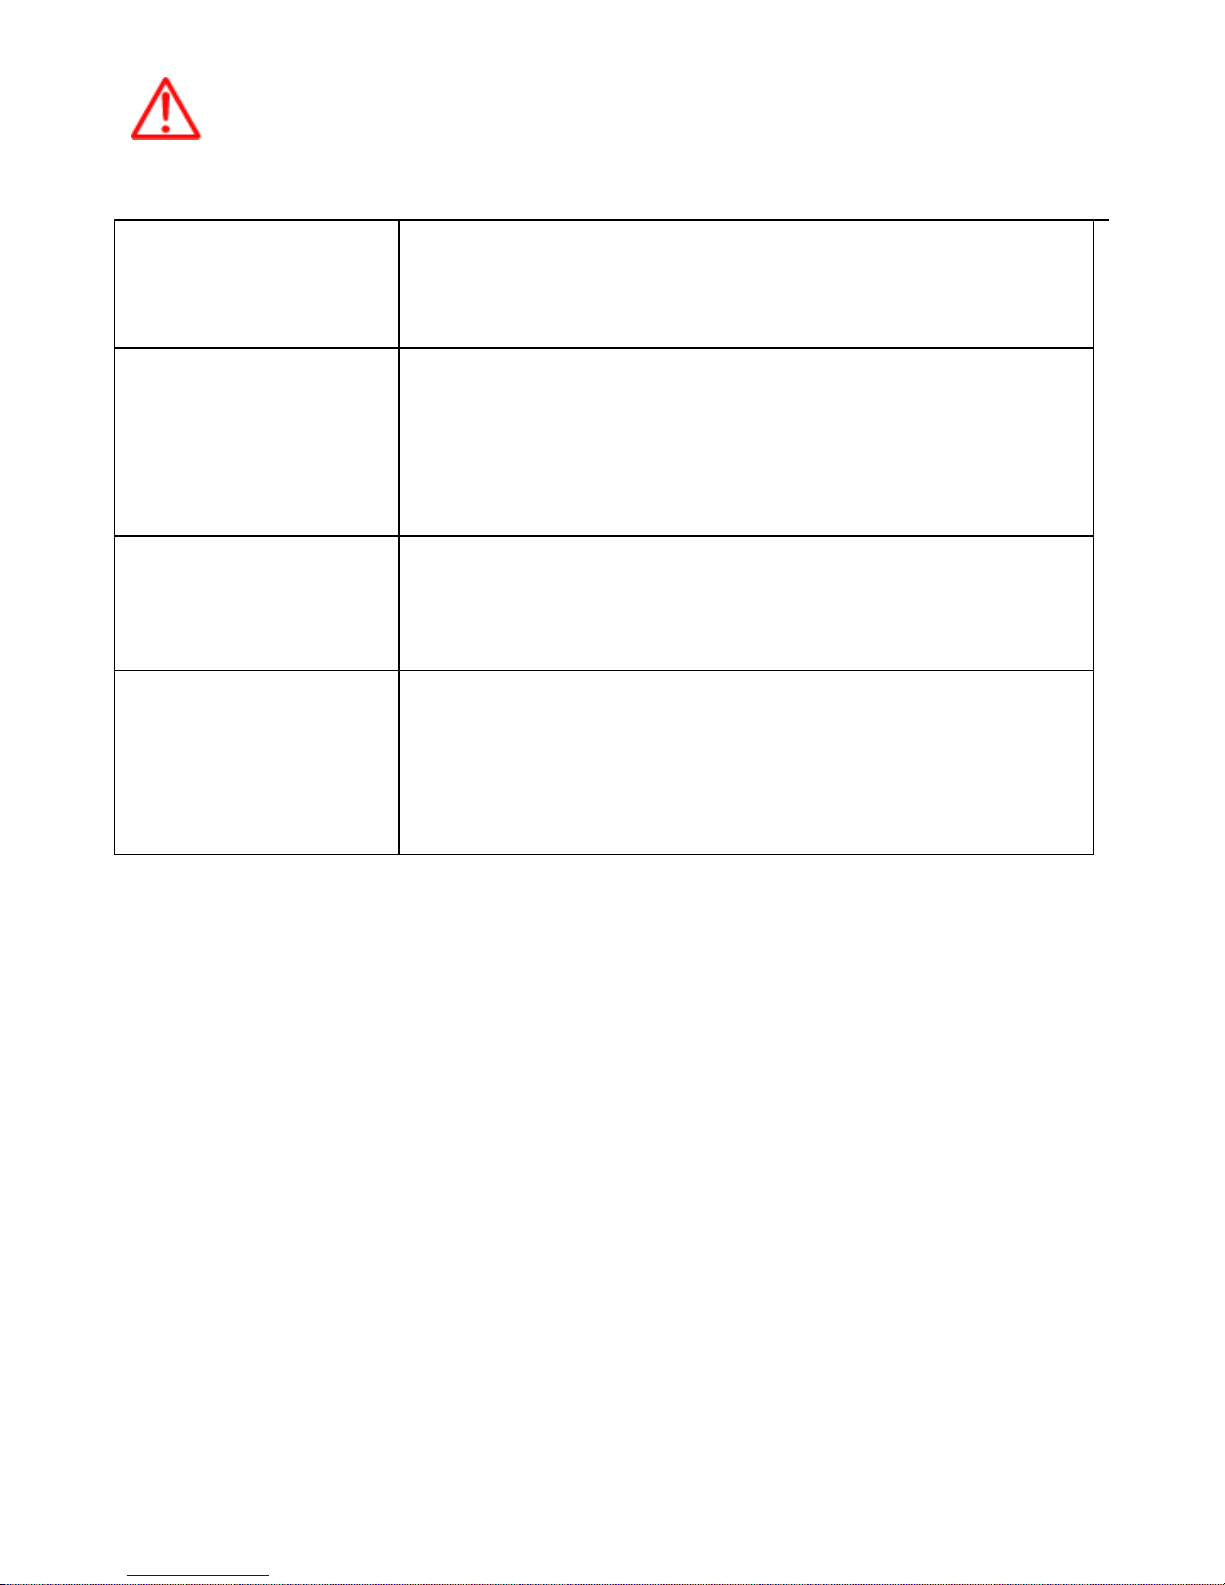
WARNING <For System Operators>
Always follow this instruction to prevent death or personal injury.
Turn power
off
During
abnormality.
If smoke or a small of burning occurs, a fire or an electrical
short circuit may result. Turn the power switch OFF and
shut down the power supply immediately. Never try to
repair the system yourself. Call for service.
Do not open
Cabinet.
High voltage exists in the instrument. Contact with voltage
may cause possible injury or death.
Do not touch
back
side of the
equipment.
Harmful line voltage is present on back side of the
equipment. Never try to touch back side while power is
turned on.
Avoid
excessive
shock
to display
unit.
The LCD display module contains a liquid. Do not apply
any mechanical shock to the display. If the display broken,
liquid may leak and injure your skin and eyes.
Do not use
with poor
ventilation.
If you cover this unit or use in an enclosed place, it may
malfunction or become damaged as a result of overheating.
Use only where there is sufficient ventilation.
Page 4

- 4 -
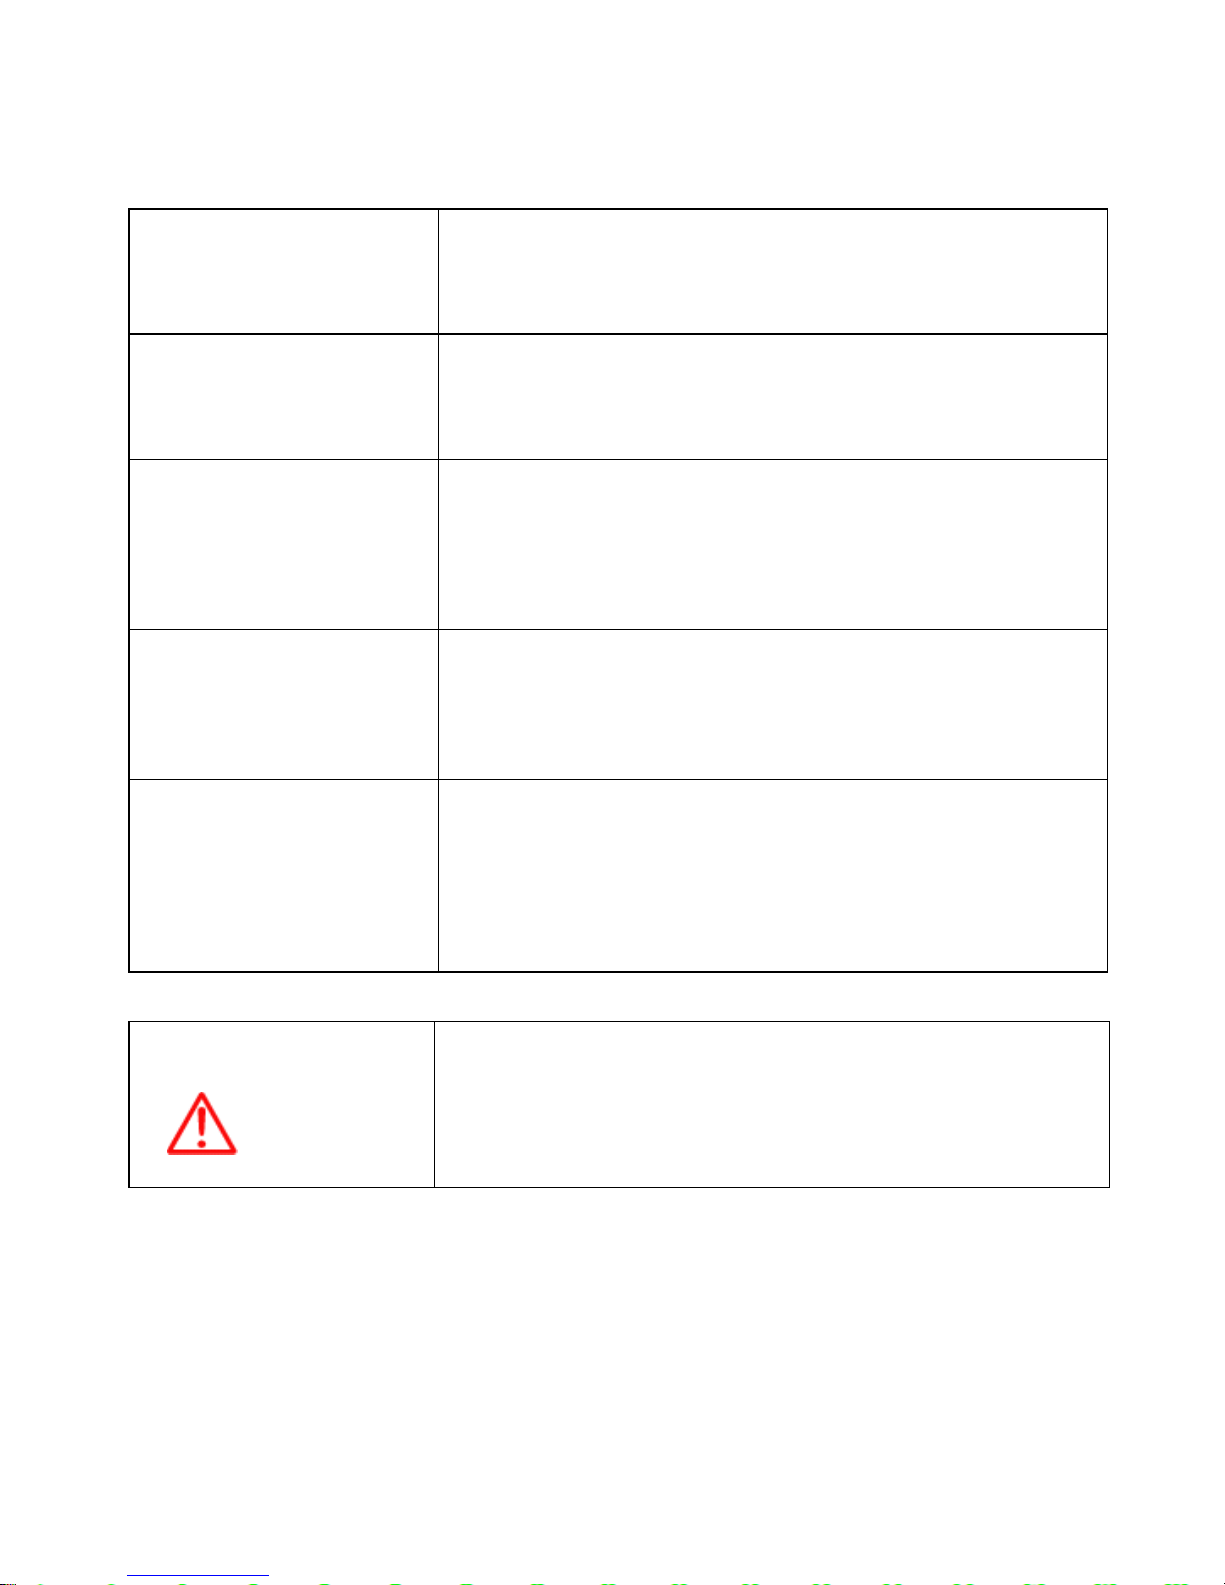
Installation Cautions <For service Personnel>
Follow installation instructions to avoid personal injury and system malfunction.
Installation in
rigid location.
Mount your SVS-1010/880/770 on a rigid frame or base to prevent your
unit from working loose.
Use correct
Installation
materials.
Use the installation materials provided in the standard accessory pack
only. If you use hardware of insufficient strength, your system may
loosen causing damaged.
Keep away from
direct sunlight.
Keep your system out of direct sunlight as it may become damaged by
overheating.
Keep away from
water.
Take care not to get water on or in your unit as it may be damaged
and/or cause an electrical shock.
Keep away from
heat source.
Keep your system away from other heat source as it may malfunction,
be damaged, or burn.
Use correct
power source.
Operate your system within the specified power voltage. An incorrect
power supply may cause
Page 5
- 5 -
Maintenance Cautions<For Maintenance Personnel>
Use the following safety precaution internal inspection.
Discharge
capacitors.
High voltage may be retained in the capacitors if the high-tension
circuits several minutes after you have turned the power switch off.
Check that
power is OFF
To prevent an electrical injury due to erroneous power switching, make
sure that the main power supply and the system power switch are both
in the off position. Additionally, attach a safety label showing that
service is in progress.
Avoid EMI.
Take care not to damage the ESDs (Electrostatic Sensitive Devices)
by static electricity from carpet and cloths.
Avoid dust.
Wear a safety mask so as not to breathe in dust during inspection or
cleaning inside your system instruments.
Page 6
- 6 -
Operation Notes <For operators>
Observe the following operation notes, otherwise the system failure or deterioration can result. And
periodical inspection and maintenance are required for keeping the system in an optimum condition.
Backup important
data.
The waypoint and other registered data may become
unreadable by unexpected failure. We recommend recording
this data separately.
Use correct
transducer only.
If you use incorrect transducer, the transmitter circuit may be
damaged due to a matching error. Consult is for system
information.
Check transducer
Connection before
power on
Do not turn the power switch ON if the transducer is
disconnected or if it is not inserted into the water. If done,
the transducer or transmitter circuit may be damaged.
Always clean the
transducer
Since transducer performance can drop due to accumulated
bottom growth, keep the transducer clean. Never paint
transducer surface.
Transducer must
be installed by
authorized
personnel.
Consult us for transducer installation by authorized
personnel.
WARNING
This product is designed to assist navigation.
When you are sailing, use the certified chart from the
Government or IMO.
Page 7

- 7 -
SVS-1010/880/770 Series
Welcome
The SVS-1010/880/770 Series Color LCD Chart plotter & Fishfider Systems employs the latest in
proven technology to provide accurate fish & bottom information. The Plotter functions of SVS1010/880/770 series are totally dependent upon the capability of the navigation source to provide
accurate position information. This device is only an aid to navigation. It should be used in conjunction
with all other navigation accuracy. For safety, always resolve any uncertainty before continuing
navigation.
CAUTION
There is no direct relationship between the color of water areas and their depth. The navigator shall
always query the area for depth information and use the official paper chart.
CAUTION
The performances of LCD displays are degraded by continuous direct exposure to ultraviolet rays.
Locate your SVS-1010/880/770 series Display away from direct sunlight. When not in use. Keep the
display covered.
DISPLAY BREAKAGE WARNING
The LCD display module contains a liquid. If the display is broken and the liquid contacts your skin,
wash it off immediately in running water for 15 minutes. If the liquid contacts your eyes, immediately
flush your eyes with running water for 15 minutes. Contact a physician if any abnormal symptom is
experienced.
Page 8

- 8 -
INDICATION NOTICE
*: It is important or warning notice on front of article
#: It is only functions for the SVS-1010CF/SVS-880CF/SVS770CF on front of article.
[ ]: Keyboard.
Page 9
- 9 -
SVS-1010/880/770 series Introduction
Fix Text Below, so that Words Do Not Separated Strangely at End of each Line.
For centuries, sailors have been searching for a reliable and precise method of travelling the world’s
waterways. From celestial navigating to the modern navigation techniques as Loran, Decca navigator,
Omega or Transit Satnav, each system has had its problems with weather, range and reliability.
Without doubt, the “Global Positioning System”, or GPS for short, is the most significant advance in
navigation: it provides the navigator a position 24 hours a day, 365 days a year in any weather
condition. GPS is a satellite based navigation system which provides suitably equipped users with
accurate position, velocity and time data. Originally the GPS, developed by the U.S. Department of
Defense, was conceived for military purposes, but now it is used in a host of civilian applications.
GPS navigation uses satellite signals to determine your position in relation to a set of satellites orbiting
the earth. The GPS constellation of satellites continuously sends radio signals, containing the precise
position for each satellite back to earth. By knowing the position of 3 or 4 satellites and calculating
various time differences between transmitted signals, the GPS receiver can determine its present
position anywhere on earth, and thanks to continuous updates, calculate speed and course
information.
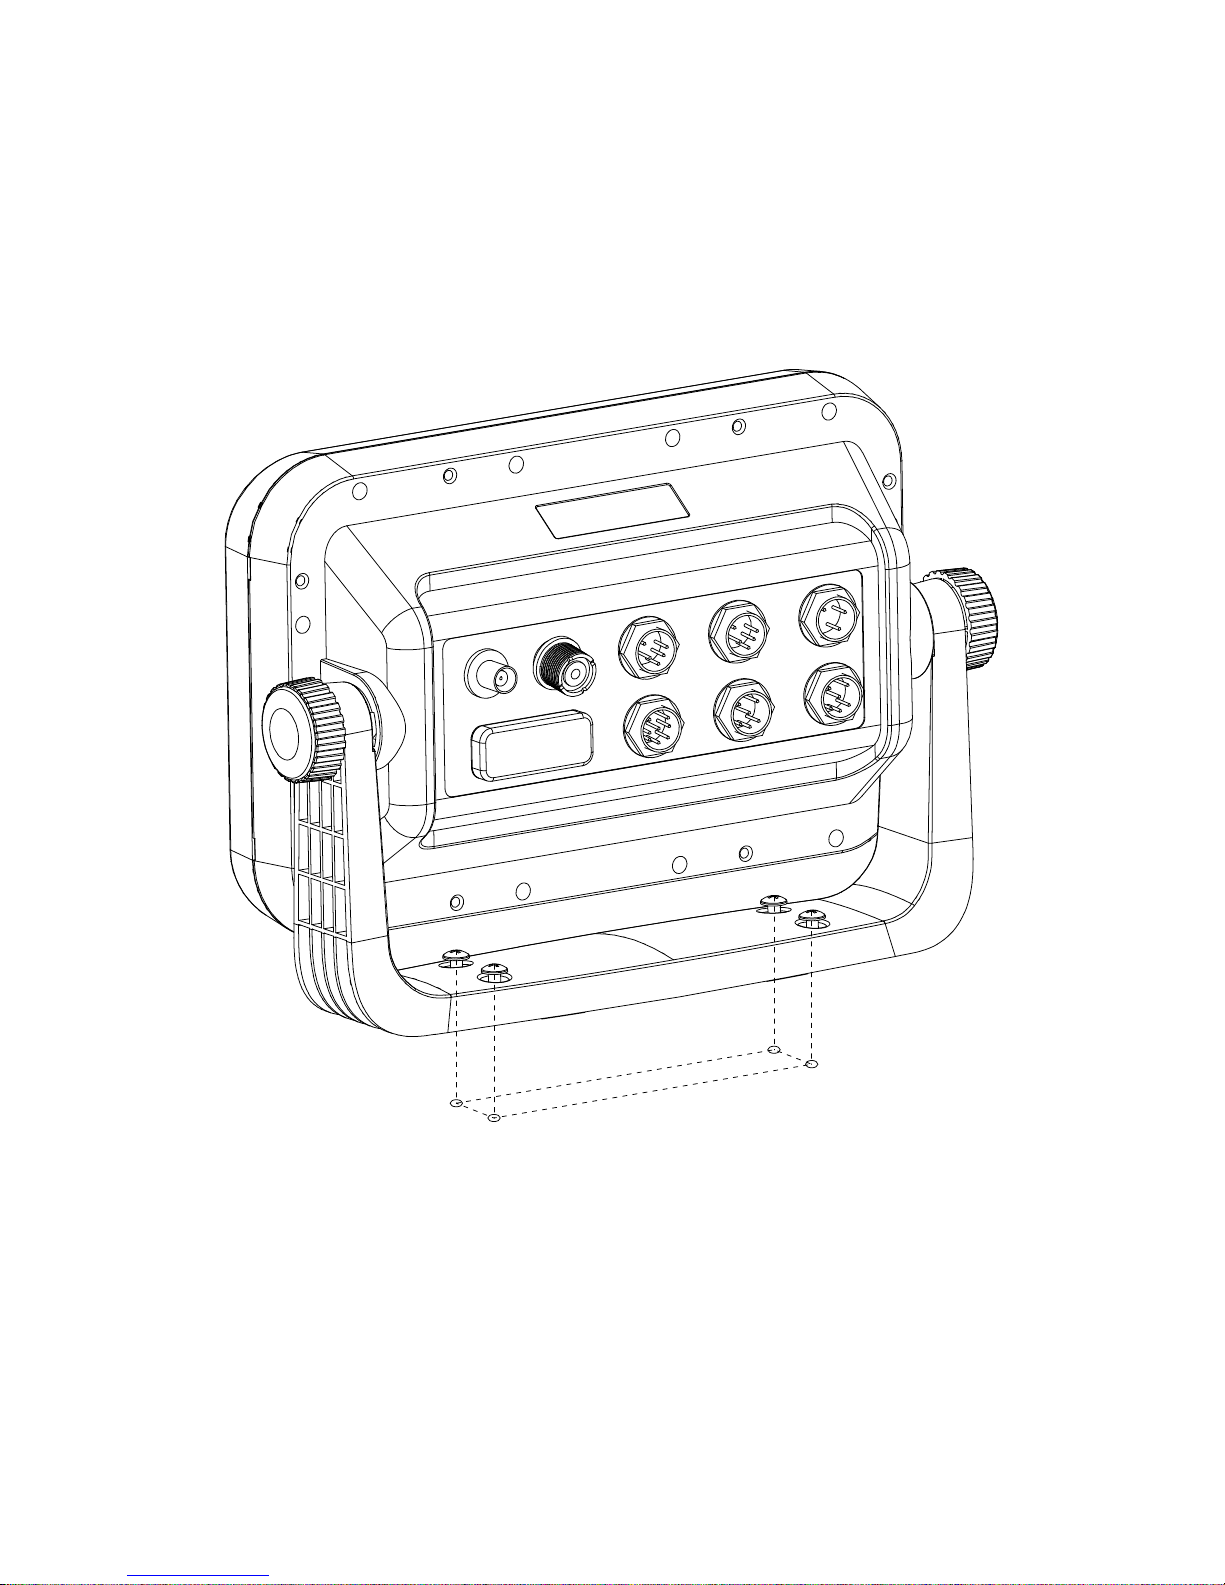
Display Unit Installation
Temporarily install the mounting bracket on the Genesis display unit and place the unit at the selected
location.
CAUTION
The Smart4/5 series display unit is unstable when the mounting bracket is not secured. Hold the unit in
place at all times.
Check the suitability of the location and make any adjustments. When all is satisfactory, use the holes
in the mounting bracket as a guide and mark the holes locations on the mounting surface.
Drill a 1/4 in. diameter hole at each marked location. Mount the SVS series display bracket using bolts
Page 10
- 10 -
through the mounting surface. Place large flat washers on the opposite side of the mounting surface
from the bracket and then install lock washers and nuts. Tighten securely.
Install the display unit into the mounting bracket. Check alignment and operation of the pivots and
security of the mounting. Make any adjustments necessary to prevent binding and assure even
meshing of the pivot locking washers. It is advised to remove the display unit and store it in a safe
place to prevent damage during the rest of the installation process.
[Mounting Bracket]
Page 11
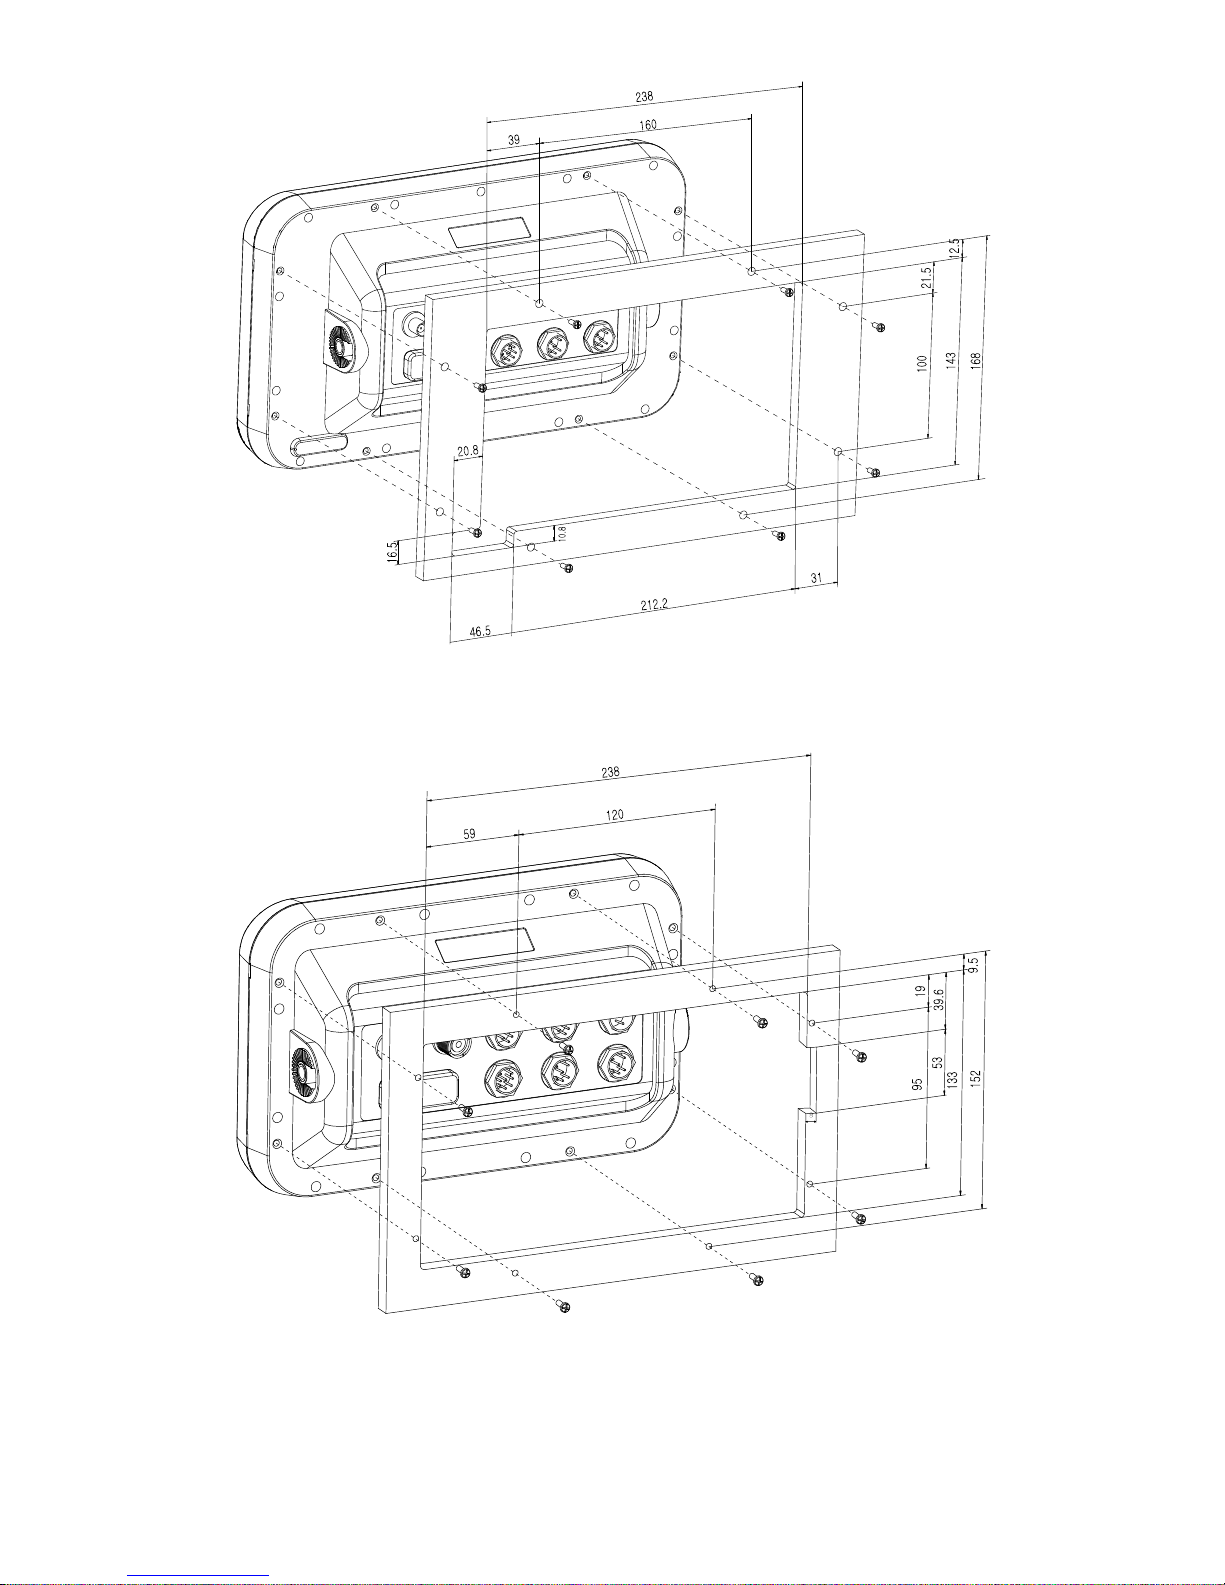
- 11 -
[SVS-1010 series Flush Mounting]
[SVS-770/880 series Flush Mounting]
Page 12
- 12 -
SVS-1010/880/770 series Introduction
HOW GPS WORKS
Currently, the GPS constellation consists of 26 orbiting satellites (including 3 spares), but this number
will increase in the future.
The GPS receiver computes an accurate position by calculating the distance to the GPS satellites that
orbit the earth. Signals are required from 3 satellites for two dimensional (2D) position calculation
whilst 4 satellites are required for three dimensional (3D) position calculation.
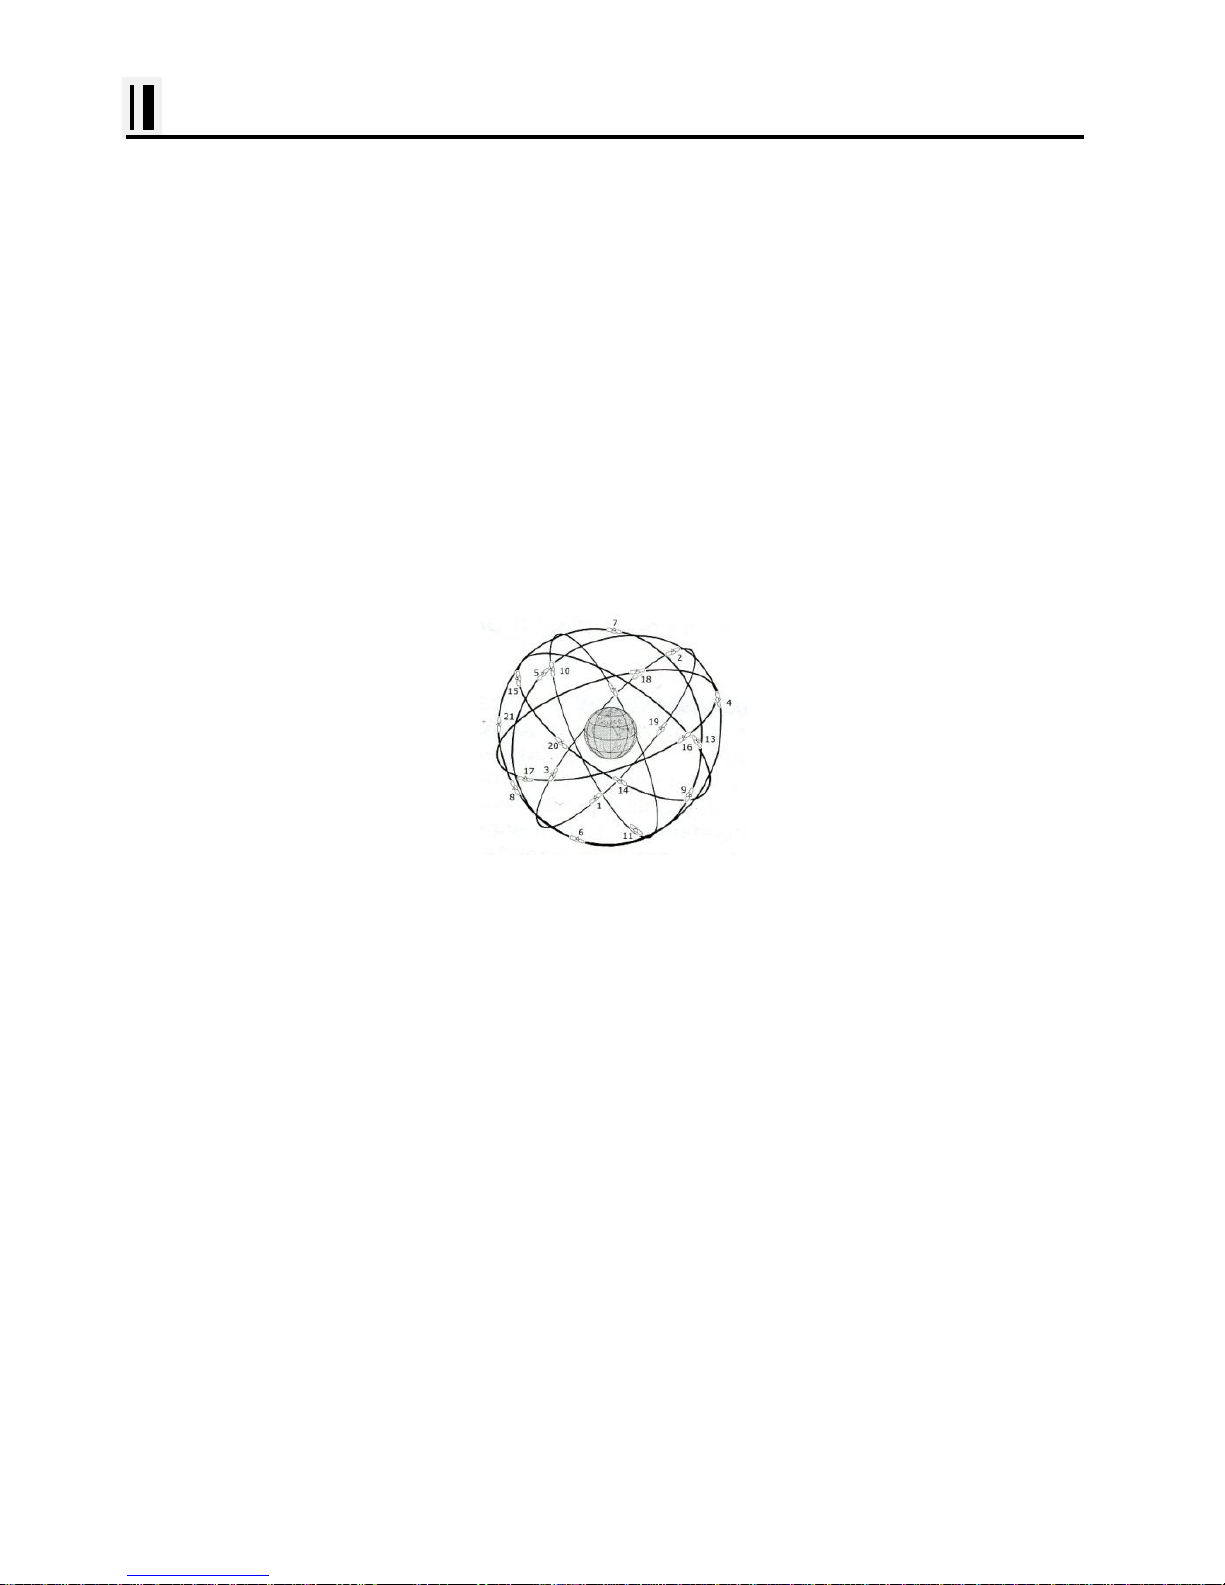
As mentioned earlier, GPS satellites are not geostationary, but they are orbiting the earth as illustrated
on the following figure:
[The GPS constellation]
Note that position is repeatedly fixed through the following three steps while any 3 satellites are in line
of sight.
The position calculation procedure is indicated in the following three steps:
1. GPS satellites continuously transmit their own precise orbital data and the GPS receiver computes
their locations by receiving this data.
2. In this receiving process, the GPS receiver measures very accurate distances to the satellites, using
the "Spread Spectrum Modulation" method. Excellence in GPS's position-fixing accuracy is mainly due
to this technology.
3. When the satellite locations and their distances are known, the GPS receiver fixes its own position
by triangulation:
Page 13
- 13 -
SVS-1010/880/770 series Introduction
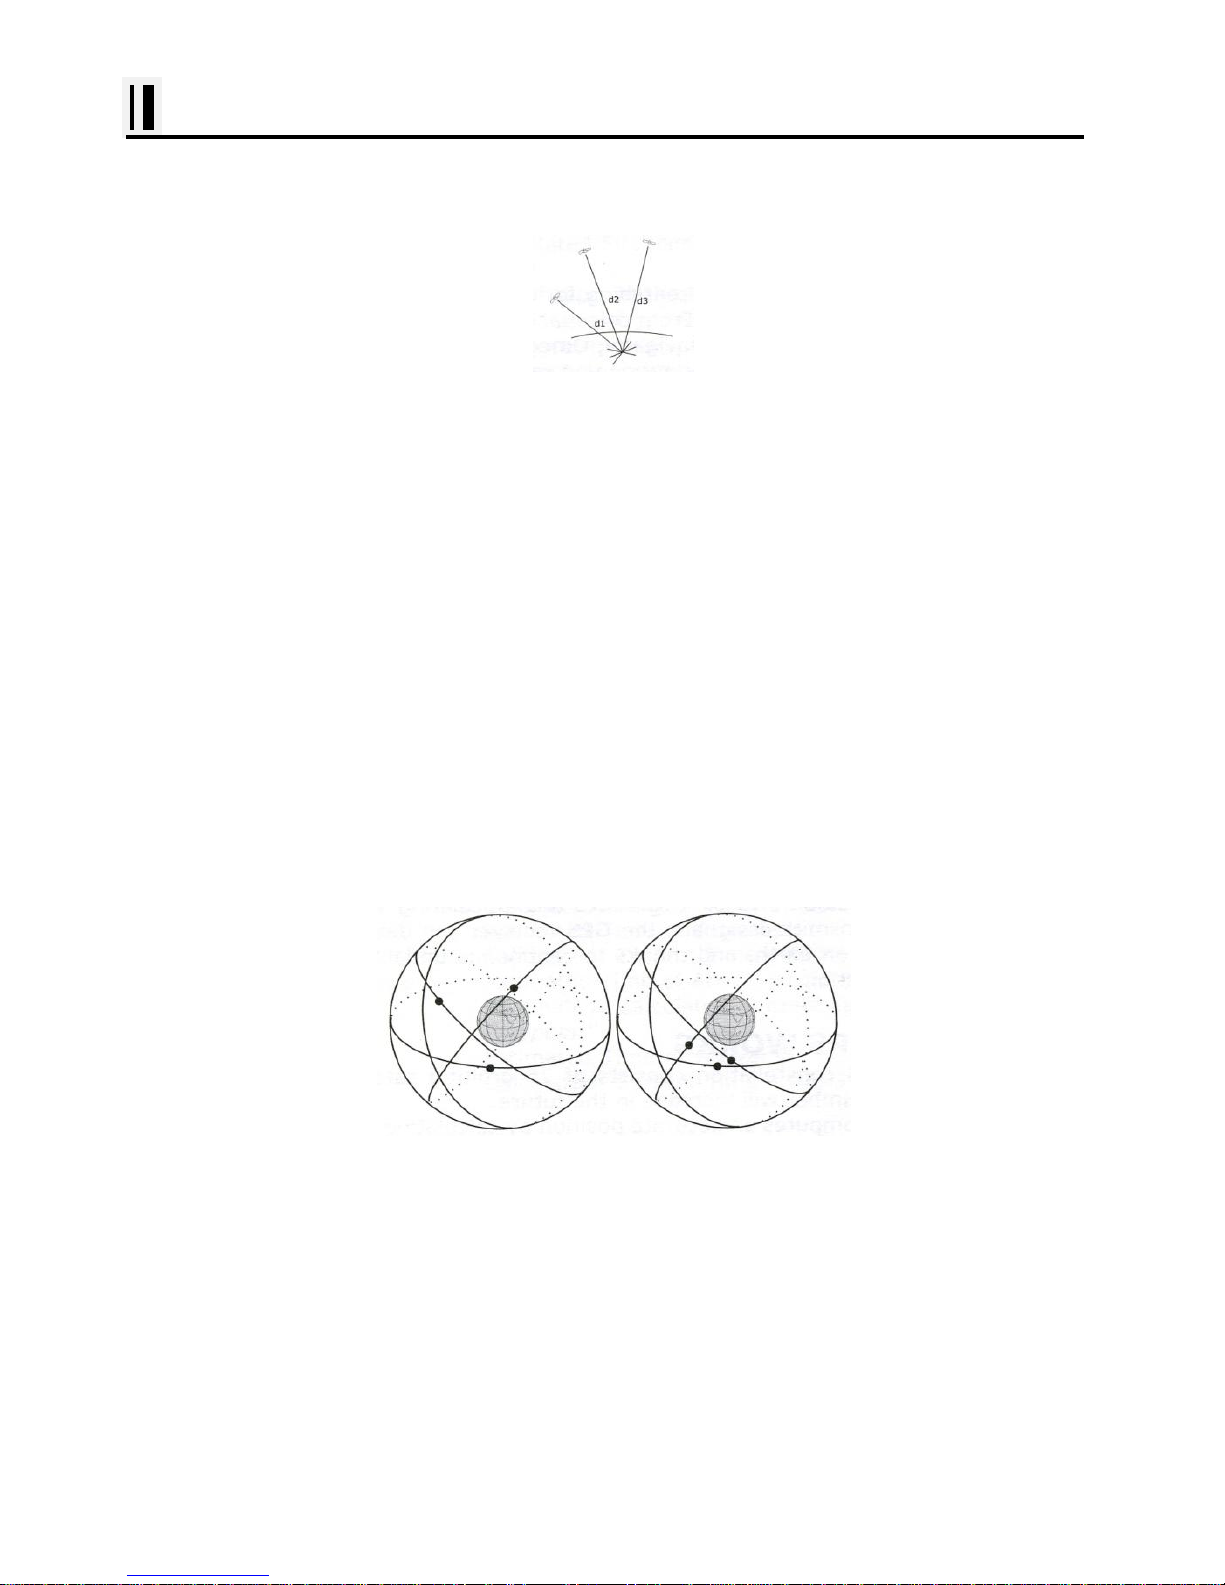
[The GPS position calculation]
As illustrated in the previous figure, the position is calculated as the meeting point of three
Spheres, which are drawn around the three satellites with diameters d1, d2 and d3.
Position Fixing Accuracy: HDOP
The GPS fix accuracy is due to the locations of 3 satellites in the sky. High accuracy is obtainable
when the satellites are widely scattered in the sky; on the
Contrary, accuracy is reduced when the satellites have gathered in a narrow space. In the following
figure, in both cases it is possible to obtain the GPS fix, but in the left case the accuracy will be higher
than the right:
[HDOP]
The index for position-fixing accuracy is called HDOP ("Horizontal Dilution of Precision"). The smaller
the HDOP value, the more accurately the position can be fixed.
Page 14

- 14 -
SVS-1010/880/770 series Introduction
#Sonar - How it works-
The SVS-1010/880/770CF sonar consists of a transceiver display unit and a dual frequency
transducer. An electronic signal pulse is generated in the transmitter section of the display unit.
When coupled to the transducer, this signal is converted into an ultrasonic signal and is transmitted
toward the bottom. The signal travels through the water until it strikes an object or the bottom. It is
reflected back, hits the transducer surface, and is reconverted into an electronic signal by the
transducer. Then it is amplified in the receiver section, processed in the main logic section, and
displayed, as an image on a LCD screen. (Picture 3)
When your boat travels from point A to point B as shown in Picture 1, the beam of the transducer
installed on your boat showed a cross-sectional view in the water.
Picture 2 indicates a cutaway view under the water when your boat moves from A to point B.
The screen shows the latest scan data at its right position. After the next
scan, the previous data is moved to the left and the latest scan data is
shown at the right position. When your boat moves from point A to point
B, the screen shows the scan data as shown in Picture 3.
Page 15

- 15 -
Installation of GPS ANTENA
The installation of the GPS ANTENNA.
The GPS ANT must be installed at the highest area of the boat and the easiest place to receive the
signal from the satellites. If there are obstacles around the GPS ANT, it isn't able to receive all signals.
The receiving time could be longer or the receiving power would be weaker. Please, follow the
instruction for your installation.
1. Keep from a metal.
2. Over 4m away from a MF/HF ANT, VHF or HF whip ANT.
3. Over 1.5m higher than MF/HF ANT.
4. Over 1m away from a receiving ANT.
5. Don't put the GPS ANT into the range of radar's beam. (Range: 30°~40°)
6. Over 1m away from the scanner of the radar.
7. Over 5m away from the ANT of the Inmarsat.
8. Over 3m away from the ANT of the roof.
9. Over 2m away from the engine.
10. Over 0.5m away from the metal surface.
※Warning: Not less than 0.5m away from the metal surface.
If the environment can't be satisfied from 1 to 10, have NO. 10 satisfied and consider the others.
Page 16

- 16 -
Installation of the Transducer
A careful installation will assure maximum performance from your new SVS1010/880/770 series.
Display Unit Location
Select a location for your Display unit that provides easy viewing from all likely operators’ positions.
The display unit is designed to be mounted on either a console or from an overhead surface. The
Display unit is also designed for flush mounting using six threaded holes on the rear panel. Locate the
display in an area with protection from the elements and avoid direct sunlight on the viewing window.
Also, consider access to the rear panel of the unit for connecting power and cables to the various
remote sensors. The mounting surface must be flat and solid to support the unit and prevent vibration.
There should be access to the inside of the surface to permit through bolt fastening for the mounting
bracket.
Display Unit Installation
Temporarily install the mounting bracket on the SVS-1010/880/770 series display unit and place the
unit at the selected location.
CAUTION
The Display unit is unstable when the mounting bracket is not secured. Hold the unit in place
at all times.
Check the suitability of the location and make any adjustments. When all is satisfactory, use the holes
in the mounting bracket as a guide and mark the holes locations on the mounting surface.
Page 17

- 17 -
Installation of the Transducer
Drill a 1/4 in. diameter hole at each marked location. Mount the Display unit bracket using bolts
through the mounting surface. Place large flat washers on the opposite side of the mounting surface
from the bracket and then install lock washers and nuts. Tighten securely.
Install the display unit into the mounting bracket. Check alignment and operation of the pivots and
security of the mounting. Make any adjustments necessary to prevent binding and assure even
meshing of the pivot locking washers. It is advised to remove the display unit and store it in a safe
place to prevent damage during the rest of the installation process.
Power Connection
Power is supplied to the Unit through a connector on the rear panel of the display unit.
Route the power cable from the Unit location to the ship’s power distribution panel.
Connect the black wire to a battery negative (-) terminal of the power panel.
Connect the white wire to a fused battery positive (+) terminal of the power panel (12 to 24 Vdc
nominal). If a fused terminal is not available, install an in-line fuse holder.
Transducer Connection
There are many transducers available which may be used to expand the capabilities of the SVS1010/880/770 Sonar Unit. Connectors for these accessories are provided on the rear panel of the
Sonar Unit.
See table on following page for list of optional transducers
Page 18

- 18 -
SVS-1010/880/770 Transducer Options
Model #
Beam Angles
Type
Hole Size
250/50/200ST-CX
45º @ 50kHz
11º @ 200kHz
Plastic transom mount w/
depth, spd, temp.
N/A
1700/50/200T-CX
45º @ 50kHz
11º @ 200kHz
Bronze thru hull depth &
temp.
7/8"
500/50/200ST-CX
45º @ 50kHz
11º @ 200kHz
Bronze thru hull depth,
speed, & temperature
2"
P319/50/200T-ES
45º @ 50kHz
12º @ 200kHz
Plastic thru-hull flush mount
with temp
2"
B-60-0 - CX
(for 0º to 7º hull dead
rise)
45º @ 50kHz
12º @ 200kHz
Bronze thru Hull, Tilted
Element Flush Mount, Depth
& Temperature Only
2.375"
B-60-12 - CX
(for 8º to 15º hull dead
rise)
45º @ 50kHz
12º @ 200kHz
Bronze thru Hull, Tilted
Element Flush Mount, Depth
& Temperature Only
2.375"
B-60-20 - CX
(for 16º to 24º hull dead
rise)
45º @ 50kHz
12º @ 200kHz
Bronze thru Hull, Tilted
Element Flush Mount, Depth
& Temperature Only
2.375"
810-15
15ft Transducer Extension Cable
810-30
30ft Transducer Extension Cable
Digital A Cable
Adapter Cable for use with All Dual Freq. CVS-106 Versions
*All SVS Transducers come with a Conxall (Model #CX-128) 8 pin Conn. On the end of the
transducer cable
Page 19

- 19 -
Installation of the Transducer
Installing the Transducer Cable-
Thru-Hull and transom-Mount Installation
Cable, with the connector attached, is supplied with the transducer. During the installation, do not cut
the transducer cable or remove the connector. Do not try shorten or splice the cable. The
transducer cable includes several wires, along with shielding and insulation. If the cable is cut, it
cannot be repaired. (Cutting the cable will also void the warranty.) During installation, if you need to
drill any holes for the cable, they must be large enough to accept the connector. (3/4" or 19mm)
This will allow you to complete the installation without cutting the wire.
1st) For a transom-mount installation - Route the cable up and over the top edge of transom. Secure
the cable using cable clamps. (These clamps are available from your local marine equipment supplier.)
If you do not want to expose the cable on the deck, you may drill a new hole (3/4" or 19mm) through
the transom for the cable. (Remember - this hole must be large enough to accept the cable with the
connector attached. Do not cut the cable!) To seal the opening, use a feed-thru cap where the cable
passes through the transom.
2nd) For either type of installation - Run the cable through the interior of the boat.
3rd) Be careful not to tear the cable jacket when passing it through bulkheads and other parts of
your boat. Secure the cable in place using Nylon Wire Ties. Coil the extra cable and tie it out of the
way.
4th) If transducer cable is not long enough, 15 & 30 foot extension cables are available from SI-TEX
When you attach the extension cable, be sure that the connections are tight and watertight. Use Dow
Corning DC-4 or an equivalent sealing compound to protect the connector assemblies.
Page 20

- 20 -
Installation of the Transducer
Installing the Power Cable-
1st) The 6-foot power cable supplied with the display unit should reach the source of DC power.
Connect the power leads directly to the main battery isolation switch or breaker, or route the power
leads to the DC power distribution panel. At the power source, connect the red wire to the positive
terminal (+), and the black wire to the negative terminal (-). The negative terminal may also be called
"ground" or "earth." (The display unit is internally protected if you accidentally reverse the polarity of
the power wires.)
2nd) Attach the red or positive wire to a 5 amp circuit breaker. If the unit is connected directly to the
boat's battery, include a 2amp in-line fuse. (In-line fuses are available at most marine supply stores.)
3rd) To prevent any interference or electrical noise, separate the Sonar power wiring as much as
possible from other devices. See the section on "EMC Installation Guidelines."
4th) If you need to extend the power wiring by more than 10 feet, use a larger wire size. This will
allow the wires to deliver the correct voltage in spite of the longer wire distance. For runs of 20 to 35
feet, use #14 AWG wire. If you need to extend the power wiring, be sure all electrical connections
are solid and durable. Insulate all connections using heat-shrink tubing or electrical tape. You may use
crimp connectors or a terminal strip, but be sure to use good-quality marine-grade parts.
5th) Plug in the power cable at the rear of the display unit.
6th) When you press the Power button, the display unit should turn on. If the unit will not turn on and
you suspect that you may have reversed the power connections, check the DC power lines all the way
back to the battery. If the polarity is not correct, reconnect the leads properly and try again.
(The display unit is internally protected if you accidentally reverse the polarity of the power wires.)
Page 21

- 21 -
Installation of the Transducer
Installing a Thru-Hull Transducer
Follow these instructions if you are installing the thru-hull transducer.
1st) Once you have decided where to install the transducer, drill the hole for the part. Begin by
drilling a small pilot hole (1/8" or 3mm) from the inside of the hull. (This small hole can be filled easily if
the mounting location is not suitable.) Before you drill the hole, be sure you will be able to reach the
large nut on the top of the transducer, once it has been mounted. Also be sure there will be enough
clearance for the cable. If there is a strake or other feature on the hull, drill from the outside of the hull
instead.
2nd) Drill a larger hole from the outside of the hull using the appropriate size hole saw or paddle bit
for the selected transducer.
3rd) Uncoil the transducer cable. Remove the large hex nut from the housing and slide it over the end
of the cable.
4th) Thread the cable through the hole to the inside of the hull. Never pull or carry the transducer in
place by pulling on the transducer cable.
5th) Apply a thin layer of sealant (1/8"" or 3mm) to the transducer between the upper flat surface of
the transducer and the faring block. Use a high quality marine sealant suitable for underwater use.
(Caution do not use 3M 5200) Also apply a thin layer up the side walls. This should cover all of the
threads where the part will touch the hull material, plus an additional 1/4""(6mm). This will seal the
threads for the large hex nut.
6th) Push the transducer housing (with the sealant applied) into the hole from the outside of the hull.
Twist the housing slightly to squeeze out any excess sealant and to get a good seal. Be sure that the
transducer is aligned so that the correct part of the unit is toward the bow of the vessel. Hold or prop
the transducer in place temporarily.
Page 22
- 22 -
Installation of the Transducer
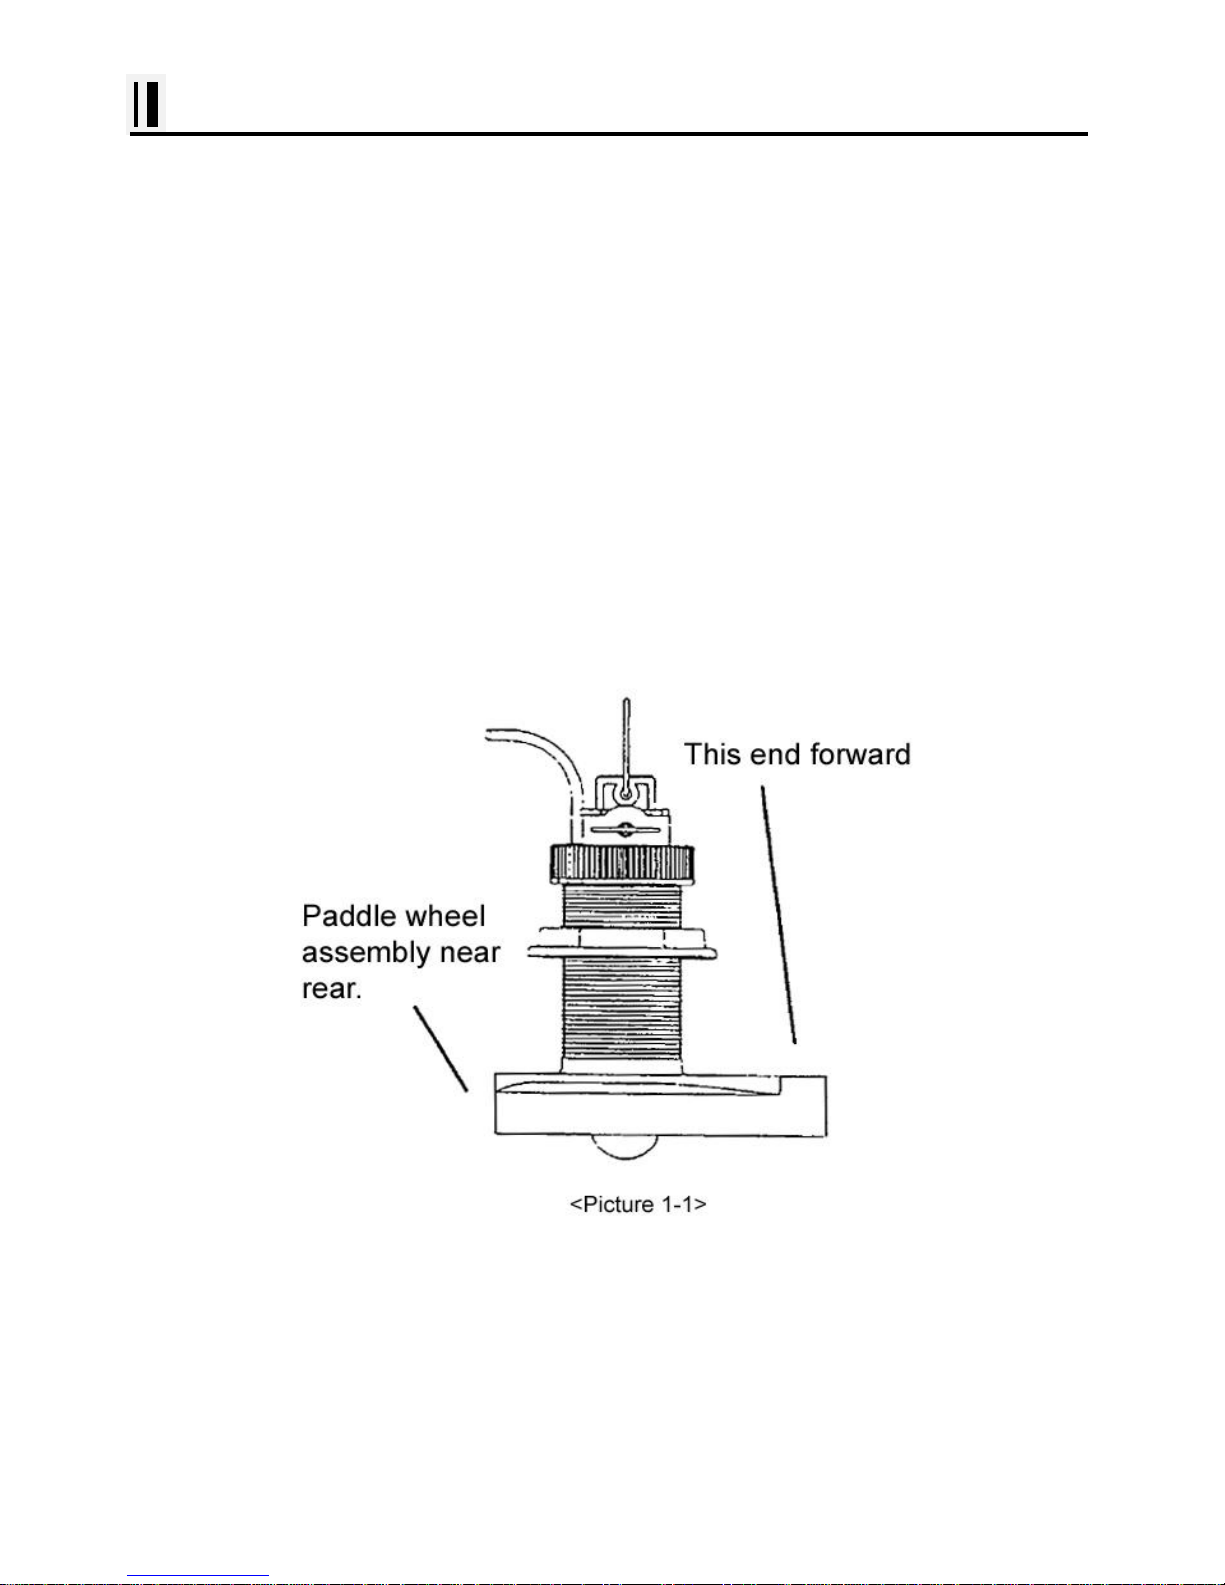
7th) Go to the inside of the hull and slide the hex nut over the end of the cable. Fit the hex nut over
the end of the transducer and tighten it. (On a vessel with a wooden hull, do not tighten the nut
completely right away. Allow some time for the wood to swell after the vessel is put in the water. Be
sure that the correct end of the transducer is pointing forward see Picture 1-1
8th) Remove any excess sealant from the outside of the unit to assure smooth water flow over the
face of the transducer.
9th) As soon as the boat is placed in the water, check for leaks. Check again within 3 to 5 hours.
(You may not be able to see a small leak right away.) If there are any leaks, you must repeat the
installation procedure.
Page 23
- 23 -
Installation of the Transducer
Positioning the Transom-Mount Transducer
Follow these instructions if you are installing the transom-mount transducer.
Begin by finding the best location for the mounting bracket. Here are the rules:
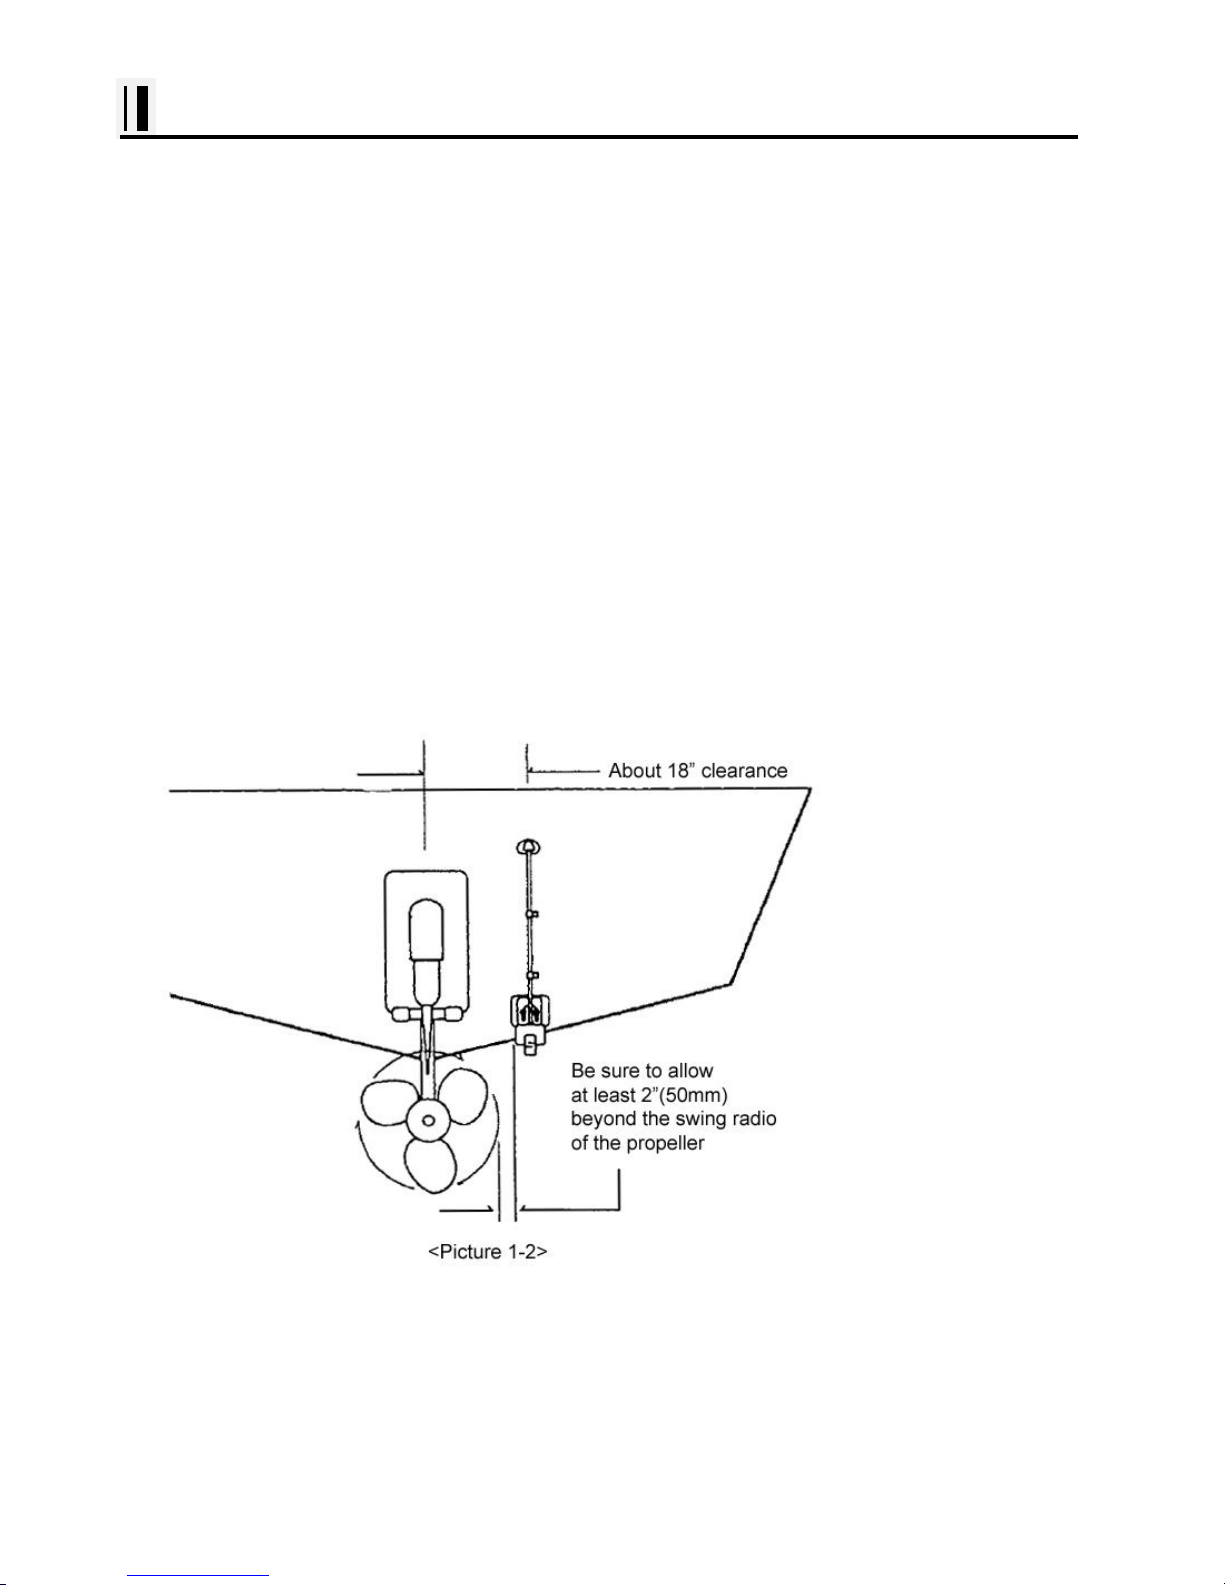
If your boat has one propeller (outboard or inboard-outboard), mount the transducer about 18"(455mm)
to the side of the centerline of the boat. See Picture 1-2 Choose the side that is on the down stroke of
the propeller. (This is usually the starboard side of the boat.) This will reduce any interference cause
by air bubbles.
If your boat has twin propellers (outboard or inboard-outboard), place the transducer near the
centerline of the boat.
If the propeller can be turned to steer the boat, allow at least 2"(50mm) beyond the swing radius of the
propeller. This will prevent the propeller from damaging the transducer when it is turned.
Do not mount the transducer behind any hull fittings, intakes, or other parts which extend from the hull.
These may cause turbulence or air bubbles.
If the boat will be carried
on a trailer, be sure the
transducer will not hit any
rollers, bunks or fittings
on the trailer.
Page 24

- 24 -
Installation of the Transducer
Mounting the Transom-Mount Transducer
Follow these instructions if you are installing the transom-mount transducer.
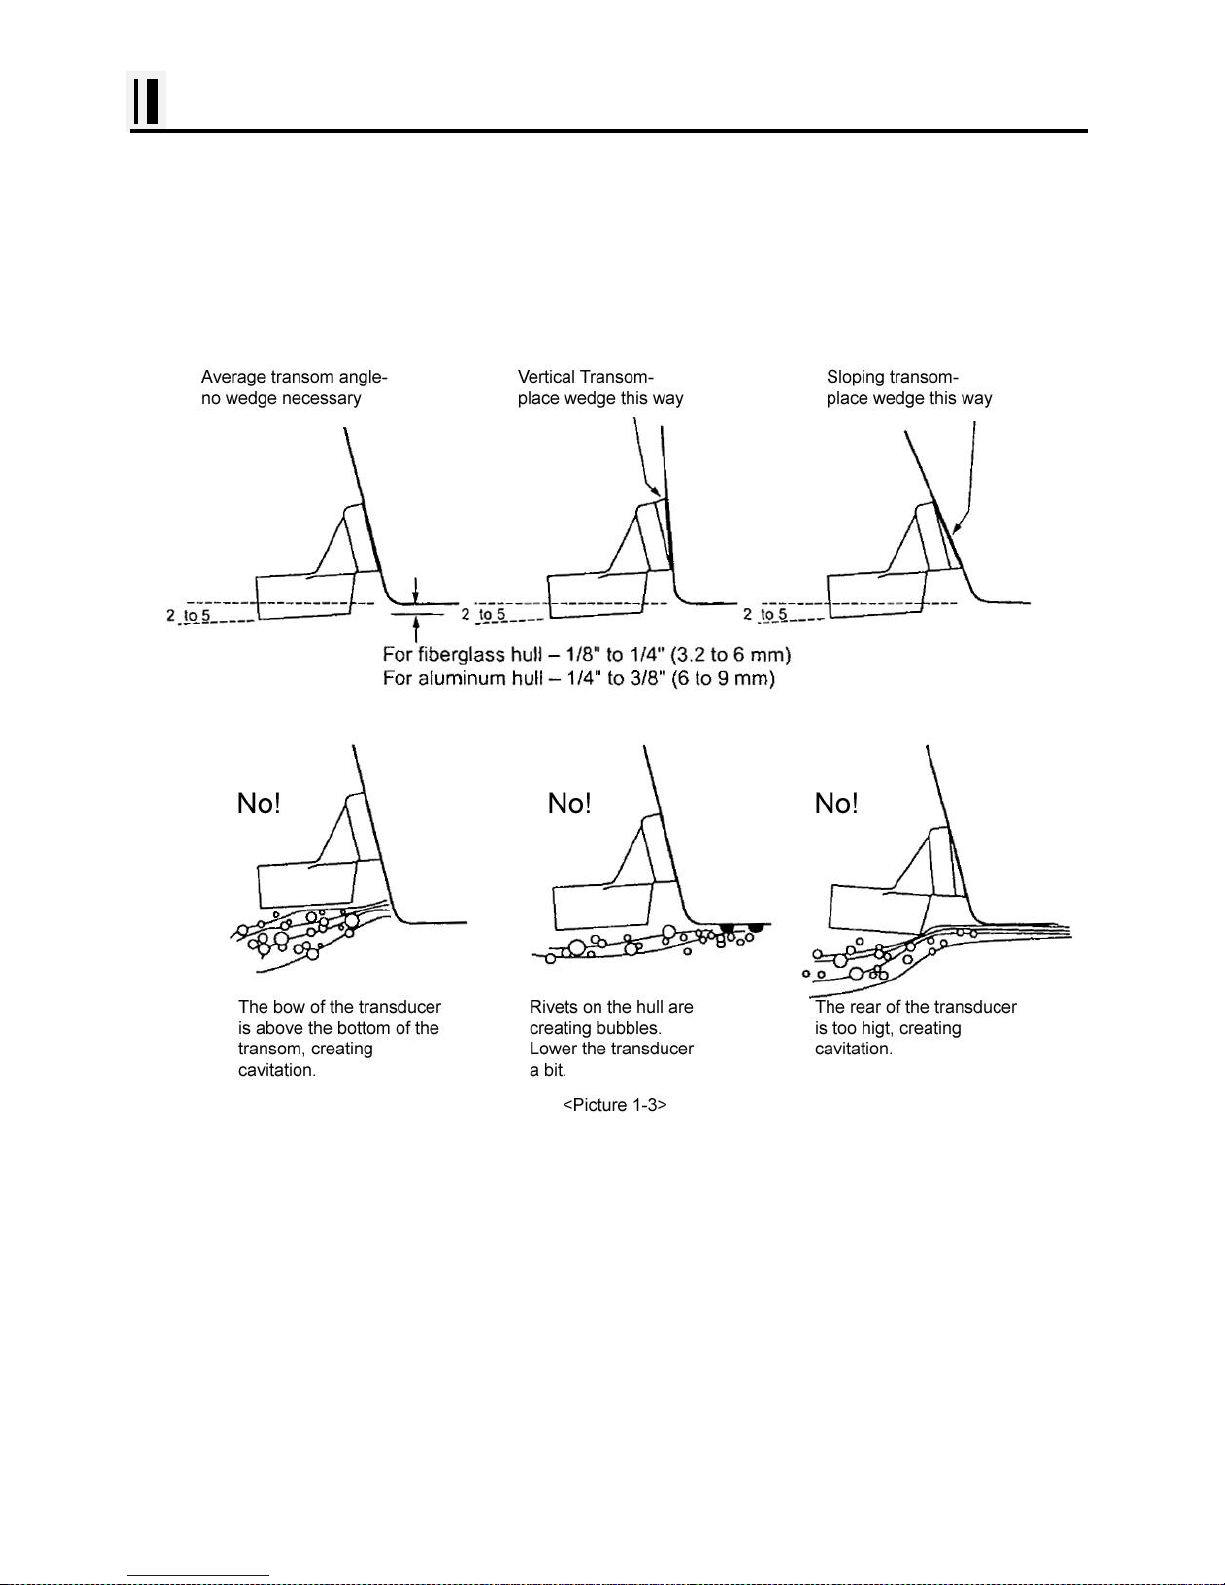
1st). On a boat with a fiberglass hull, the leading edge of the transducer should extend 1/8""(3.2mm) to
1/4""(6mm) below the bottom edge of the hull. See picture 1-3. On an aluminum hull, the transducer
should extend a bit more - 1/4"(6mm) to 3/8"(9mm). If the boat will be operated at high speeds, the
transducer may be mounted closer to the centerline of the hull.
2nd) The lower surface of the transducer should tilt down toward the rear at a slight angle (2° to 5°).
The mounting bracket includes a wedge. Depending on the angle of the transom on your boat, you
may need this wedge to get the correct angle for the bottom of the transducer.
3rd) Looking at the rear of the boat, be sure the bracket is vertical (perpendicular to the water line).
4th) Hold the bracket (and the wedge, if used) against the transom and trace the position of the screw
slots.
5th) Remove the bracket. The screws in the outer slots should be placed about 1/4"(6mm) up from
the bottom of each slot. The screw in the center slot should be placed 1/4" (6mm) down from the top.
(This will allow you to adjust the bracket up or down a bit.)
Drill pilot holes 3/4""(19mm) deep. Use a 9/64" (3.5mm) drill bit. To prevent drilling too deeply, wrap
masking tape around the drill bit about 7/8" (22mm) from the tip. Drill in only as far as the tape marker.
If you are attaching the bracket to a fiberglass hull, you can minimize any surface cracking of the gel
coat. Before drilling each pilot hole, drill a shallow hole (chamfer) at each location about 1/16" (1.5mm)
deep. Use a 1/4"(6mm) drill bit.
6th) Attach the bracket to the hull using the pinhead screw with flat washers. Before you tighten the
screws, apply a good-quality marine sealant to the pilot hole. This will protect the hull from water
penetration. Do not tighten the screws completely yet.
Page 25
- 25 -
Installation of the Transducer
7th) Tilt the transducer in the brackets until it is positioned as illustrated in Picture 1-3
8th) Once the bracket is in the correct position, you can tighten the screws.
Page 26
- 26 -
Getting Started
1. The Keyboard
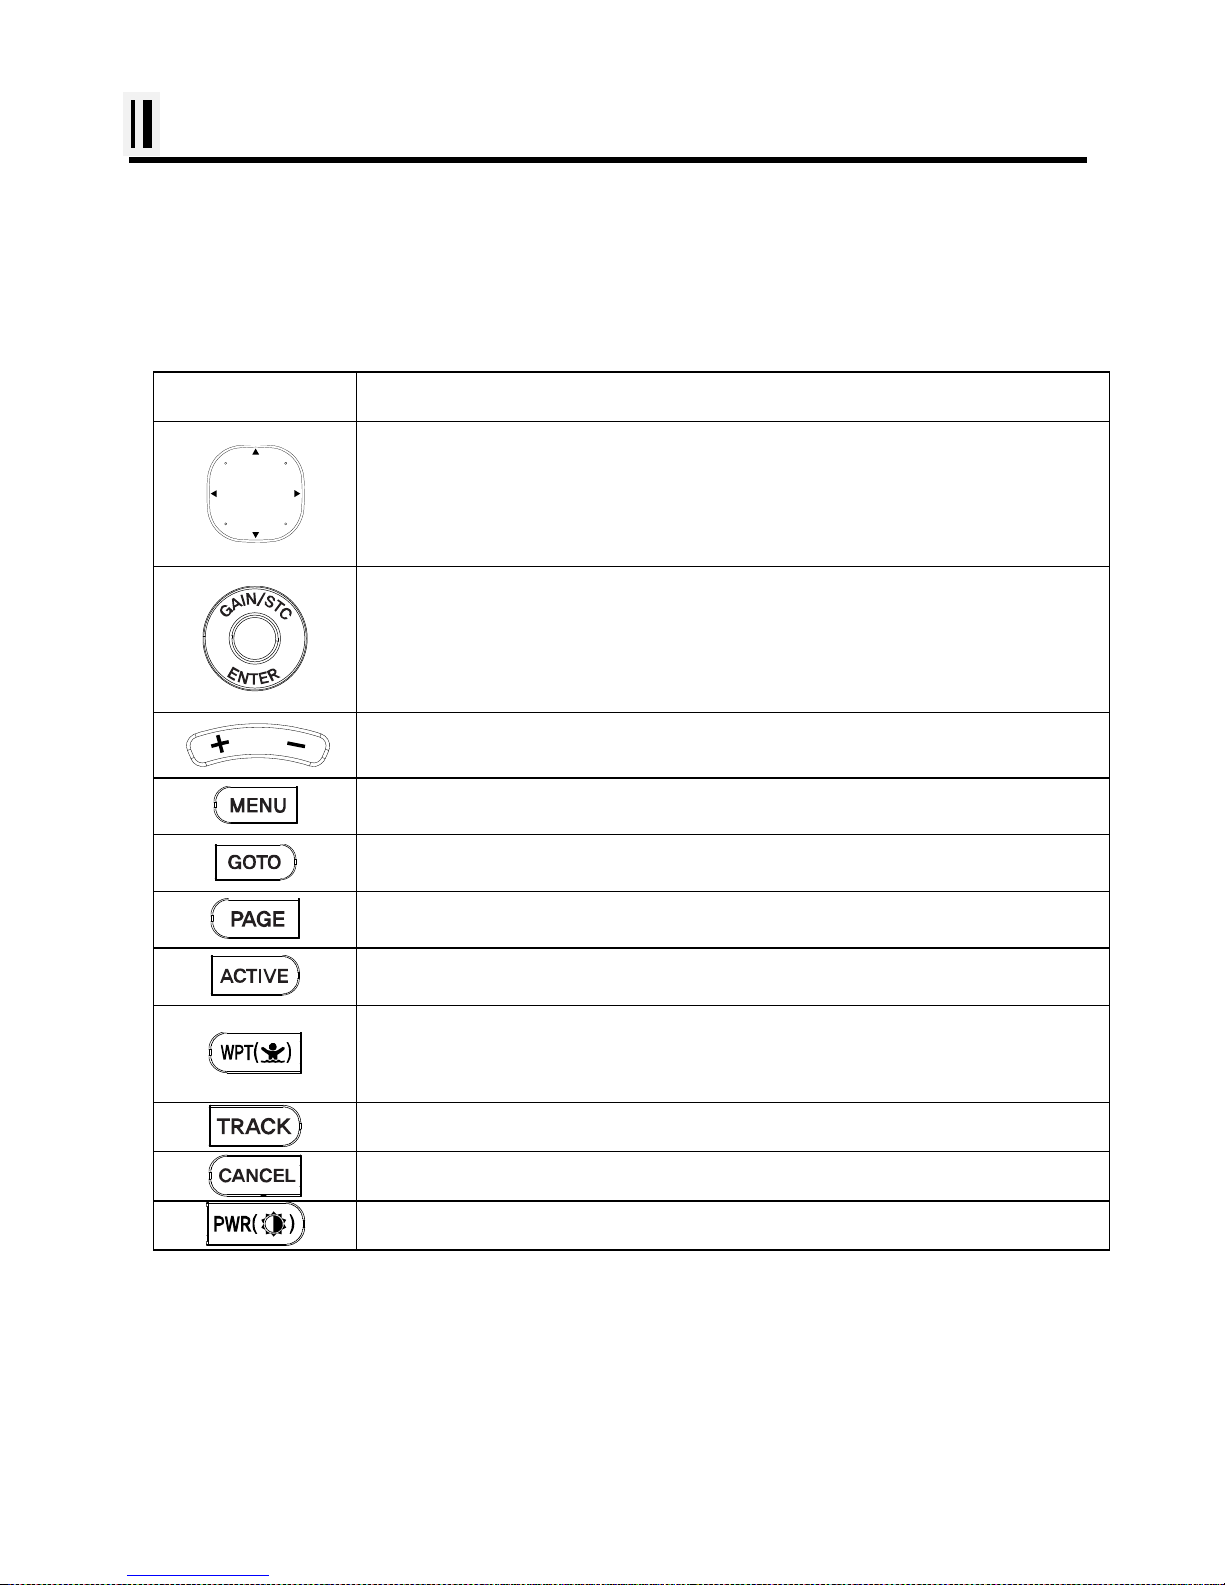
1.1. Model: SVS-1010C/SVS-880C/SVS-770C
KEY
Description
use this to select menu items, move the on-screen cursor
Rotary: use this to select menu items
Button: push the end of the everything to confirm a selection or entry
Change the chart of scale
Open the menu
Select the Goto function
Select the configuration & modification you wish.
Select the activated section
Press to place a waypoint and access the waypoint option.
Press and hold to place a MOB marker at your current position.
Start and stop AIS tracks & Vessel tracks.
Cancel the setting or exists from the menu
Power “on/off”, brightness and day/night mode.
Page 27
- 27 -
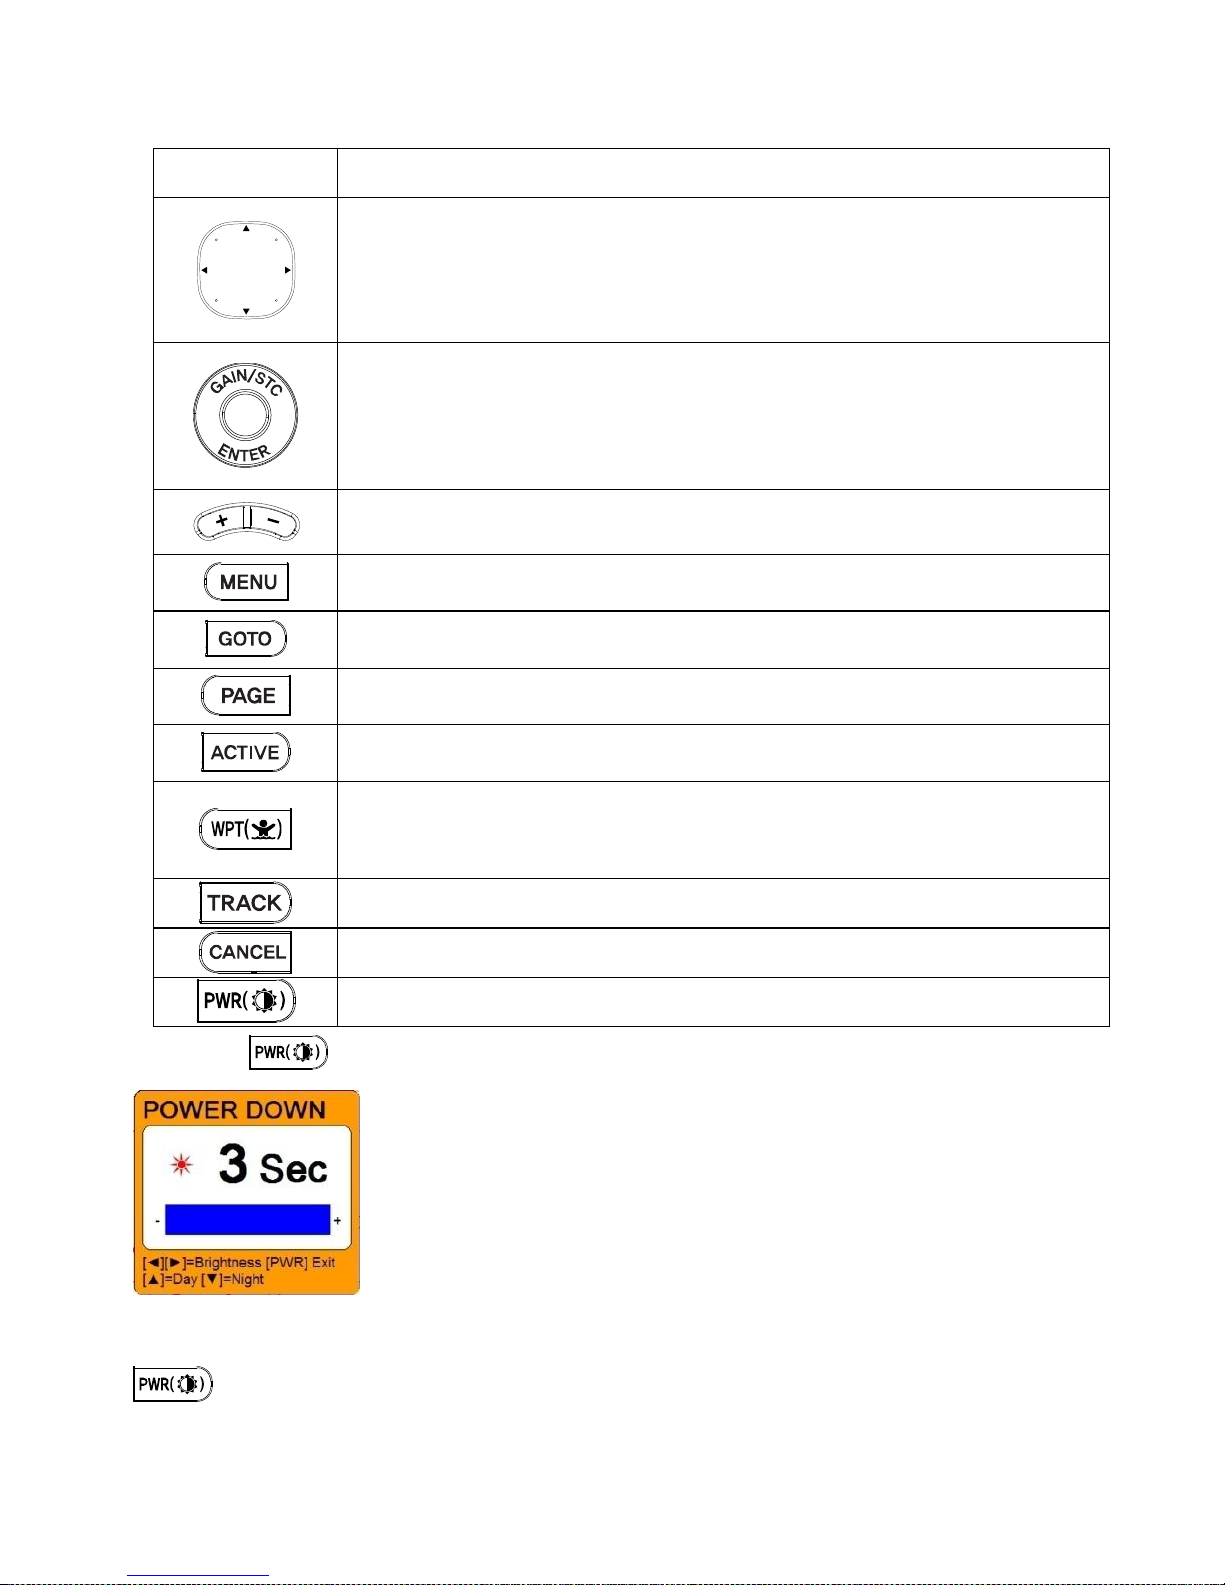
1.2 Model: SVS-1010CF/SVS-880CF/SVS-770CF
1.3. How to use
(Fig.1.1)
1.3.1. Turn on
Switch on.
KEY
Description
use this to select menu items, move the on-screen cursor and Choosing the
frequency
Rotary: use this to select menu items and Adjustment of gain & STC level with
turning.
Button: push the end of the everything to confirm a selection or entry
Change the chart of scale and Setting up the depth range
Open the menu
Select the Goto function
Select the configuration & modification you wish.
Select the activated section
Press to place a waypoint and access the waypoint option.
Press and hold to place a MOB marker at your current position.
Start and stop AIS tracks & Vessel tracks.
Cancel the setting or exists from the menu
Power “on/off”, brightness and day/night mode.
Page 28

- 28 -
1.3.2 Turn off
Keep pressing to switch off.
1.3.3. Adjust brightness
Pressing (Fig.1.1) and controlling the brightness with [◀] [▶].
1.3.4. Use day/night mode
Pressing (Fig.1.1) and changing the day and night with [▲][▼].
Page 29
- 29 -
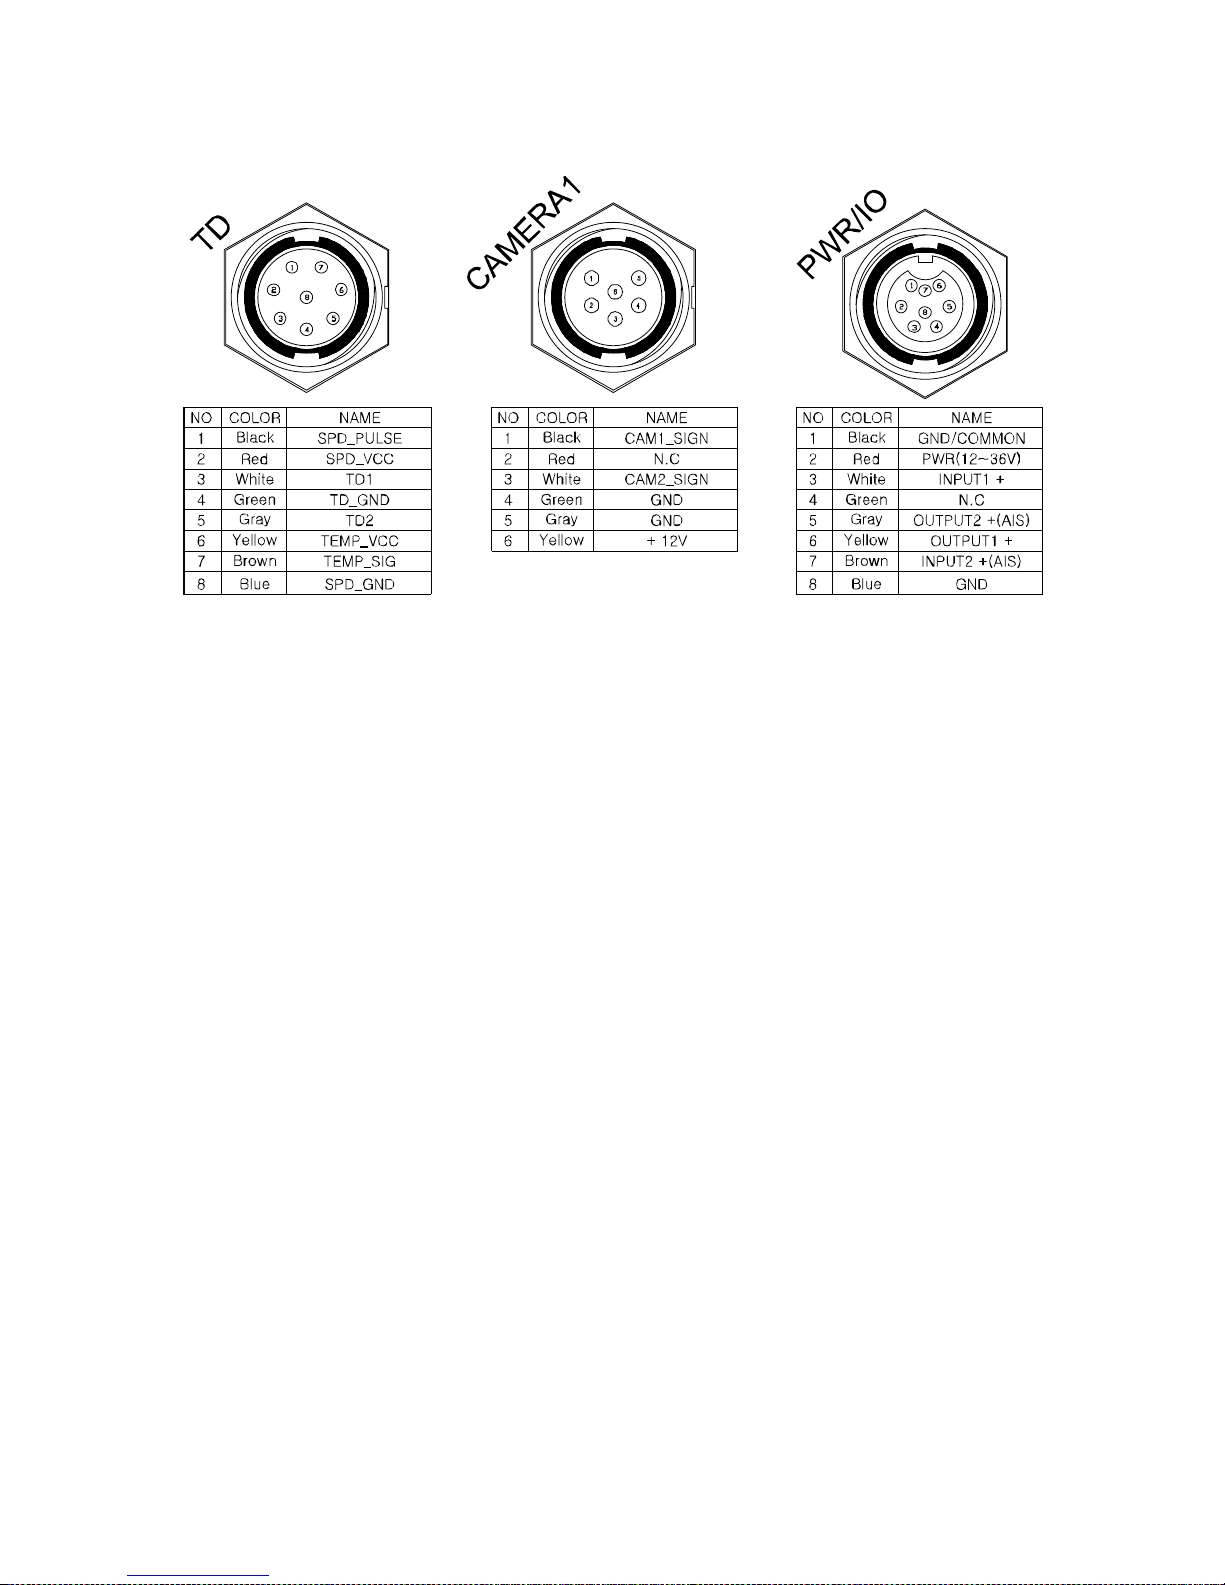
2. Specification of the connectors
Page 30
- 30 -
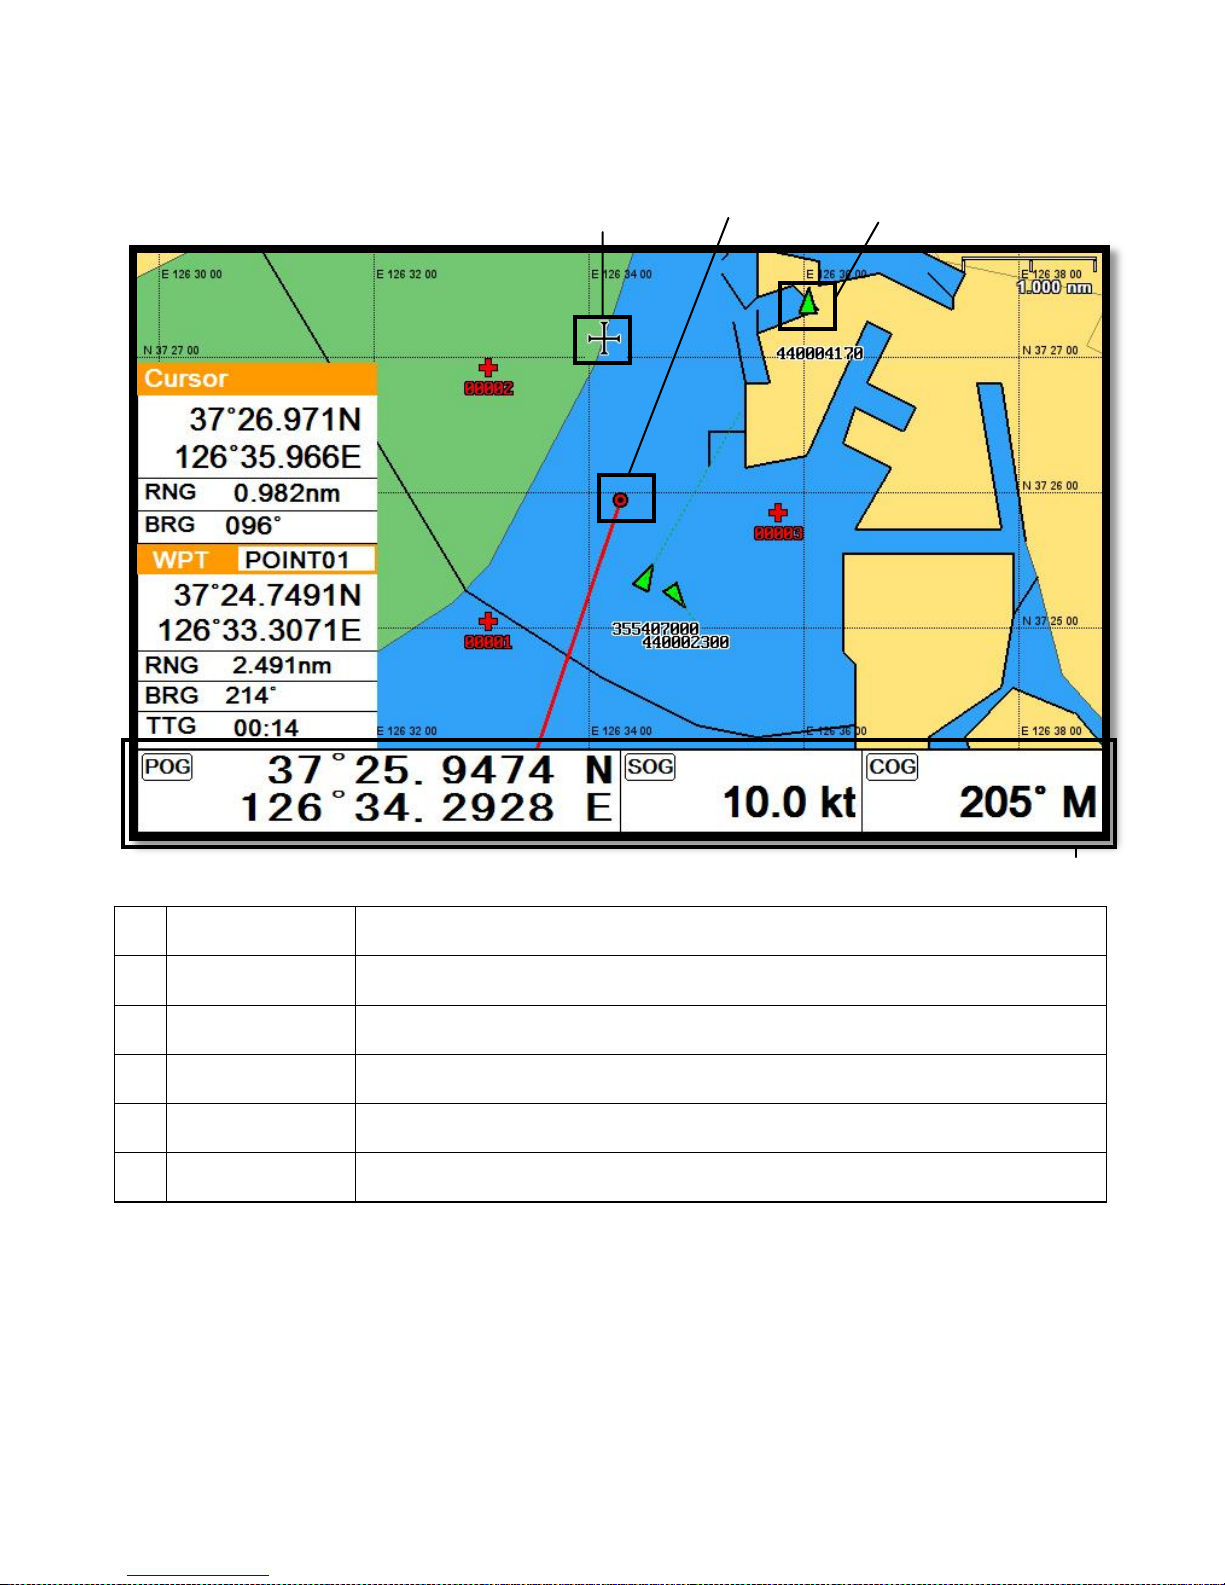
3. Screen Overview
3.1. Chart plotter page
①
Vessel icon
The present position.
②
Cursor
Showing the cursor icon.
③
AIS target
Showing the received AIS target.
④
Data bar
Showing various data on the top or bottom.
⑤
Cursor INFO
The information of the cursor.
⑥
WPT INFO
The information of WPT such as LAT/LOT, Range, etc.
④ ③ ②
⑤
⑥
①
Page 31

- 31 -
3.2. Sonar page
.
①
Palette
Showing the chosen colors.
②
Depth bar
The current depth.
③
Low Frequency
Showing 50KHz.
④
High Frequency
Showing 200KHz.
⑤
LF INFO
The information of Low Frequency, 50KHz.
⑥
HF INFO
The information of High Frequency, 200KHz.
⑦
Data bar
Showing various data on the top or bottom
⑦ ③ ④ ⑤ ⑥ ① ②
Page 32

- 32 -
3.3. Navigation Data page
3.3.1. Navigation Data Type1
3.3.2. Navigation Data Type2
Page 33

- 33 -
3.4. Highway page
①
WPT name
The current WPT name.
②
Direction of steer
The best direction of the steering.
③
WPT icon
The remaining distance of the WPT.
④
Vessel
The out of the range from the best.
⑤
XTE Range
The range of the XTE alarm.
⑥
Navigation Data
The information of the various data.
①
②
⑥ ③ ④
⑤
Page 34

- 34 -
3.5. Steering page
①
WPT name
Name of the WPT.
②
Direction of steer
The best direction of the steering.
③
WPT icon
Showing the WPT and the bearing
④
Navigation Data
Information of the various data.
①
② ④ ③
Page 35

- 35 -
3.6. GPS Status page
①
Receiver status
The current GPS status.
②
Position of SAT.
Position of the satellites.
③
SNB Graph
Showing the WPT and the bearing.
④
Navigation Data
Information of the various data.
* Colors of the GPS status
Black:
Tracked, but no signal
Blue:
Tracked, but not used, Satellite
Green:
Used Satellite
Light Blue:
SBAS Satellite
④ ① ②
③
Page 36

- 36 -
4. Data bar
Showing various data on the top or bottom.
4.1. Mode
▶[MENU]->Advance->Setup->Customizing->Data bar->Mode
Data bar has three meanings as below.
4.1.1. GPS
Showing the largest LAT/LON.
4.1.2. HY
Showing the LAT/LOT, SOG, COG and user data.
4.1.3. NAV
You can view detailed information about the navigation data.
4.1.4. Customizing
Showing various data as what the user wants.
▶[MENU]->Advance->Setup->Customizing->Data bar->Edit
Page 37

- 37 -
(Fig.1.2.1)
The data bar is coming as (Fig.1.2.1), and choose the frame with [◀][▶].
Four frames are available as (Fig 1.2.2).
(Fig.1.2.2)
When choosing the frame, setting up in each box as (Fig.1.2.3).
(Fig.1.2.3)
Page 38

- 38 -
When finishing the set up, press to exit.
(*Please, refer “Customizing” for further question.)
4.2. Display
▶[MENU]->Advance->Setup->Customizing->Data bar->Display
Setting the data bar, “Shown/Hidden”.
4.3. Position
▶[MENU]->Advance->Setup->Customizing->Data bar->Position
Setting the data bar position on the top or bottom.
5. Cursor
5.1. Calling the cursor
Press [◀][▶][▼][▲] on the chart, the cursor comes out.
5.2. Moving
Press [◀][▶][▼][▲], the cursor is moving to the direction.
Press [◀][▼] together, the cursor is moving to “↙”.
Press [▶][▼] together, the cursor is moving to “↘”.
Press [◀][▲] together, the cursor is moving to “↖”.
Press [▶][▲] together, the cursor is moving to “↗”.
5.3. Removing the cursor
Press to remove the cursor.
5.4. Cursor information window
①
Latitude/Longitude
LAT/LON of the cursor.
①
②
③
Page 39

- 39 -
②
Range
Distance between the cursor and the present position.
③
Bearing
Bearing from the present position to the cursor.
5.5. Cursor information window shown/hidden
▶MENU->Advance->Setup->Customizing->INFO window->Cursor
Cursor information window “Shown/Hidden”.
6. Page
▶ [PAGE]
Choosing the various pages that set up pages or customized.
Move the red box to choose the page.
(Fig.1.3)
6.1. Page mode
▶[MENU]->Advance->Setup->Customizing->Page mode
Two ways to choose the page.
6.1.1. Standard
With seeing the set up page, choosing the page or modifying.
6.1.2. Flip
Showing the set up pages in order.
Selected (red color)
Page 40

- 40 -
(* In Flip mode, modifying the order is available.)
6.2. Modify
After choosing the page in (Fig1.3), keep pressing until the window comes out as
(Fig.1.3.1).
(Fig.1.3.1)
Choosing the frame with [◀][▶].
Two frames as (Fig 1.3.2).
(Fig.1.3.2)
After choosing the box, choose the page as (Fig.1.3.3).
(Fig.1.3.3)
When finishing, press to exit.
Page 41

- 41 -
7. Active
▶[ACTIVE]
When pressing [ACTIVE], the red box moves to chart plotter or sonar.
(*All key functions change to chart plotter or sonar)
Selected (red color)
Page 42

- 42 -
8. Navigation Data
Navigation data is available in Navigation data page, Steering page, Highway page as (Fig.1.5).
(Fig.1.5)
8.1. Type
▶[MENU]->Advance->Setup->Customizing->Navigation data->Type
Two types of Navigation data pages.
8.1.1. Type1
Large LAT/LON as (Fig.1.6.1).
(*Editing the LAT/LON is unavailable)
8.1.2. Type2
Various data as (Fig.1.6.2).
(Fig.1.6.1) (Fig.1.6.2)
8.2. Edit
(*If there is no navigation data on the page, editing the navigation data is unavailable)
▶[MENU]->Advance->Setup->Customizing->Navigation data->Edit
After finishing as (Fig.1.6.3), press to exit.
(*Please, refer “Customizing” for further question)
Page 43

- 43 -
(Fig.1.6.3)
Page 44

- 44 -
9. MOB
If a person or missing an object overboard and you need to get present position, use the MOB function.
9.1. Inputting
Keep pressing until the window comes out as [Fig.10.1] and then “MOB” comes out with
alarm.
9.2. Exiting the alarm
When alarming, press to cancel the alarm.
9.3. Removing
While MOB is setting, press again and you may remove the “MOB”.
(*MOB is not stored in the flash memory)
Page 45

- 45 -
10. Memory Card
10.1. SVS-1010 series
Inserting the SD & micro SD as (Fig.1.7.1).
(Fig.1.7.1)
10.2. SVS-880/770 series
Inserting the SD & micro SD as (Fig.1.7.2).
(Fig.1.7.2)
Page 46

- 46 -
11. Save User data
▶[MENU]->User data->Save User data
User data is stored in the external Micro SD. So if you want to save the user data, a micro SD must be
inserted in the slot.
(*User data is in “...\HY\User Data\”)
11.1. WPT
WPT can be stored in a micro SD.
When storing, give it a name and you will be able to store many WPT’ in the micro SD.
11.2. Route
Route can be stored in a micro SD.
When storing, give it a name and you will be able to store many routes in the micro SD.
11.3. Track
11.3.1. Type1
Track can be stored in a micro SD.
When storing, give it a name and you will be able to store many tracks in the micro SD.
11.3.2. Type2
Track can be stored in a micro SD.
Index will be a standard in Type2. After choosing the index, stored it.
11.4. User Line
Page 47

- 47 -
User Line can be stored in a micro SD.
When storing, give it a name and you will be able to store many user lines in the micro SD.
11.5. User Name
User Name can be stored in a micro SD.
When storing, give it a name and you will be able to store many user names in the micro SD.
Page 48

- 48 -
12. Load User data
▶[MENU]->User data->Load User data
User data loads from the stored micro SD. If you need to load the user data, the stored micro SD must
be inserted in the slot.
(*User data is in “...\HY\User Data\”)
12.1. WPT
WPT loads from the stored micro SD.
All of WPT in the micro SD show on the list. Choose one of them and it will show.
There are two ways to load WPT.
First, showing the stored WPT as well as the existing on the sceen. After loading the stored, you will
see the window and press .
Second, showing only stored WPT. After loading the stored, press [ENTER].
12.2. Route
Route loads from the stored micro SD.
All of route in the micro SD show on the list. Choose one of them and it will show.
Page 49

- 49 -
12.3.Track
12.3.1. Type1
Track loads from the stored micro SD.
All of track in the micro SD show on the list. Choose one of them and it will show.
12.3.2. Type2
Track loads from the stored micro SD.
Index will be a standard in Type2. After choosing the index, stored it.
12.4. User Line
User line loads from the stored micro SD.
All of user line in the micro SD show on the list. Choose one of them and it will show.
12.5. User Name
User name loads from the stored micro SD.
All of user name in the micro SD show on the list. Choose one of them and it will show.
Page 50

- 50 -
Chart plotter getting started
1. GOTO
1.1. Goto type1
1.1.1. Setting
▶[MENU]->Navigation->Goto type->type1
Setting GOTO and creating a route at the same time.
Move the cursor to the position where you want to go and press [ENTER].
(*While navigating, WPT can be added in the route)
1.1.1.2. Exit/Store
If you want to exit, remove the cursor and press [GOTO]. The window to store or not store shows up.
Choose one of them to exit.
(*If you have one WPT in the route, the WPT will be stored. If you have more than two, all of WPT and
the route will be stored together)
1.2. Goto type2
1.2.1. Setting
▶[MENU]->Navigation->Goto type->type2
Direct GOTO where you want to go. Only one destination is available.
1.2.2. Exit/Store
If you want to exit, remove the cursor and press [GOTO]. The window to store or not to store shows up.
Choose one of them to exit.
1.2.3. Changing
While navigating, you can change a new destination. Move the cursor and press [GOTO] for the new
destination.
Page 51

- 51 -
2. WPT
2.1. List
▶[MENU]->User data->WPT->List
Editing, creating, erasing and navigating are available on the WPT list.
①
List
Showing all of the stored WPT.
②
Name
Name of the WPT.
③
Symbol
Symbol of the WPT.
④
Color
Color of the WPT.
⑤
Latitude/Longitude
LAT/LOT of the WPT.
⑥
Depth
Depth of the WPT.
⑦
Bearing
Bearing between the WPT and the present position.
⑧
Range
Distance between the WPT and the present position.
⑨
Date & Time
Date and time of the WPT when stored
2.2. Setting the WPT symbol
▶[MENU]->WPT Symbol
①
②
③ ④ ⑤ ⑥ ⑦
⑧
⑨
Selected (blue color)
Page 52

- 52 -
Choose the symbol and press [ENTER].
The chosen symbol will show when inputting WPT.
2.3. Setting WPT Color
▶[MENU]->WPT Color
Choose the color and press [ENTER].
The chosen color will show when inputting WPT.
2.4. Creating
2.4.1. Creating on the list
▶[MENU]->User data->WPT->List->[+]
Adding WPT with pressing .
Selected (red color)
Selected (red color)
Page 53

- 53 -
(*When adding, LAT/LON shows the present position and current symbol/color show for the WPT)
2.4.1. Inputting on the chart
Call the cursor and move the position where you want, and press .
(*The current symbol/color show for the WPT)
2.5. Erasing
2.5.1. Erasing on the list
▶[MENU]->User data->WPT->List->[-]
Choose the WPT you want to erase and press .
2.5.2. Erasing on the chart
Call the cursor and put it on the WPT, and press [ENTER].
Page 54

- 54 -
2.6 Erasing all of WPT
▶[MENU]->User data->WPT->List->[PAGE]
On the WPT list, press .
2.7. Moving the WPT
1. Call the cursor and move it on the WPT, and press [ENTER].
2. Choose “Move”.
3. Move the WPT to the position where you want to move, and press [ENTER].
2.8. Navigating
2.8.1. Navigating on the list
▶[MENU]->User data->WPT->List->[GOTO]
Choose the WPT on the list and press .
2.8.2. Navigating on the chart
Call the cursor and move it on the WPT, and press [ENTER]. Choose “GOTO” to start.
Page 55

- 55 -
2.9. Sorting
▶[MENU]->User data->WPT->List->[MENU]
Sorting the order of WPT’s on the list.
Page 56

- 56 -
2.10. Editing
▶[MENU]->User data->WPT->List
Editing the WPT on the list.
1. Choose the WPT as the blue and press [ENTER].
2. Choose the item as the green and you may begin to edit.
3. After finishing, press to exit.
Edit Selected (green color)
WPT Selected (Blue color)
Page 57

- 57 -
3. Route
3.1. List
▶[MENU]->User data->Route->List
①
List
Showing the stored WPT
②
Name
Name of the route
③
Number of WPT
Number of WPT in the route
④
Total distance
Total distance of the route
⑤
Display
Shown/Hidden the route on the chart
⑥
Date & Time
Date and time of the WPT when stored
⑦
Start WPT
The beginning of the route
⑧
End WPT
The end of the route
①
② ③ ④ ⑤ ⑥ ⑦ ⑧
Page 58

- 58 -
3.2. Route detail
▶[MENU]->User data->Route->List->[PAGE]
①
List
Showing the stored WPT
②
Name
Name of the WPT
③
Symbol
Symbol of the WPT
④
Color
Color of the WPT
⑤
Latitude/Longitude
LAT/LOT of the WPT
⑥
Depth
Depth of the WPT
⑦
Bearing
Bearing between the WPT and the present position
⑧
Range
Distance between the WPT and the present position
⑨
Date & Time
Date and time of the WPT when stored
①
②
③ ④ ⑤ ⑥ ⑦ ⑧ ⑨
Page 59

- 59 -
3.3. Creating
Two ways to create route
The first uses “GOTO type1” and the second is “Creating new route” on the list.
3.3.1. Using “GOTO”
Use “GOTO type1” and create a route. Press [ENTER] to start.
Press to exit and choose “Store” if needed.
3.3.2. Creating new route on the list
▶MENU->User data->Route->List
Press on the list to create a route.
Selected (Blue color)
Page 60

- 60 -
3.4. Edit
▶MENU->User data->Route->List
Choose the route on the list to edit.
3.5. Detail edit
▶[MENU]->User data->Route->List->[PAGE]
Choose the route on the list and press . The window of Route detail shows.
3.5.1. Adding WPT
Two ways to add WPT
3.5.1.1. Adding the stored WPT
▶[MENU]->User data->Route->List->[PAGE]->[MENU]
(Fig.2.1)
Press on the Route detail and you may add the stored WPT as (Fig.2.1).
Page 61

- 61 -
3.5.2.1. Adding new WPT
Press on Rout detail and you may add new WPT.
3.5.3. Erasing WPT
Choose the WPT and press .
3.6. Navigating
▶[MENU]->User data->Route->List->[GOTO]
Choose the route on Route list and press .
3.7. Erasing
Choose the route and press .
4. Track
The maximum point is 50,000.
Two ways to manage the track memory. The first is to manage the total 50,000 points by colors. The
second is to divide 50,000 points in five rooms, and you can store 10,000 points for the maximum in
each room.
Tracking has two types, “by time and by distance”.
4.1. Track on/off
▶[MENU]->Track
Shown/Hidden track.
4.2. Choosing the track
4.2.1. By time
▶[MENU]->User data->Track->Track Setup->Record Setup->Time
Tracking by the set time.
4.2.2. Setting the time interval
▶[MENU]->User data->Track->Track Setup->Time Interval
Setting the time interval.
4.2.3. By distance
▶[MENU]->User data->Track->Track Setup->Record Setup->Distance
Tracking by the set distance.
Page 62

- 62 -
4.2.4. Setting the distance interval
▶[MENU]->User data->Track->Track Setup->DIST Interval
Setting the distance interval.
4.3. Setting the thickness
▶[MENU]->User data->Track->Track Setup->Thickness
Setting the track thickness.
4.4. Track Color
▶[MENU]->Track Color
Choose the color and press [ENTER].
(* The number next the color shows the number point of the track color)
4.5. Track type
4.5.1. Type1
▶[MENU]->User data->Track->Track Setup->Type1
4.5.1.1. Erasing
▶[MENU]->User data->Track->Erase
Selected (red color)
Page 63

- 63 -
Choose the color and press [ENTER].
(*The number next the color shows the number point of the track color.)
4.5.1.2. Erasing all of track
▶[MENU]->User data->Track->Erase
Press .
4.5.2. Type2
▶[MENU]->User data->Track->Track Setup->Type2
4.5.2.1. Select index
▶[MENU]->User data->Track->Select Index
Five sections in the index. The maximum is 10,000 points in each section.
In Type2, storing, loading and erasing are available to manage in each section.
4.5.2.2. List
Showing the information of each section.
(Fig.2.2)
①
List
Showing the track room
①
②
③ ④ ⑤ ⑥ ⑦
⑧
Page 64

- 64 -
②
Number of Point
Total track point in the track room
③
Date Time
Date and time of the track room when stored
④
Color
Color of the track room
⑤
On/Off
Shown the track On/OFF.
⑥
Display
Show/Hidden the track room
⑦
Start Point
The beginning of the track room
⑧
End Point
The end of the track room
4.5.2.3. Erasing
Choose the track room on the list and press .
Page 65

- 65 -
5. Measuring the distance and bearing
Measuring two points, “A” and “B”.
1. Call the cursor and move it on the point, “A”.
2. Move the cursor on the point, “B”.
3. The cursor windows provide the distance and bearing between A and B.
4. Press to exit.
6. User Line
Adding lines directly on the chart.
1. Call the cursor.
2. Press [ENTER] and “User Line” shows.
3. Move the cursor to the beginning point and press [ENTER].
4. Keep moving the cursor and press [ENTER] each time.
5. Press to exit.
A point
B point
Range
Bearin
Page 66

- 66 -
7. User Name
Adding a place name directly on the chart.
1. Call the cursor and move it to the point.
2. Press [ENTER] and choose “User Name”.
4. Inputting letters with [◀][▶][▼][▲].
5. Press to exit.
8. Correction Offset
When the chart position is wrong, making it correct.
1. Call the cursor and move it to the correct position.
2. Press [ENTER] and choose “Correction Offset”.
Start point
Page 67

- 67 -
(* The maximum range of Correction Offset is 5nm.)
Page 68

- 68 -
Chart plotter operation
1. Map Orientation
▶[MENU]->Advance->Map Setup->Map Orientation
1.1. True Motion
▶[MENU]->Advance->Map Setup->Map Orientation->True motion
The True Motion is in the way the vessel position is presented. In True Motion mode, the vessel icon
moves over the map while the map remains stationary.
(* It is not available to operate on Course up and Head up.)
1.2. North Up/South Up/East Up/West Up
▶[MENU]->Advance->Map Setup->Map Orientation->Up mode
They setting the vessel present position remains fixed in the center of the Main Screen while the map
moves under it.
1.3. Course Up
▶[MENU]->Advance->Map Setup->Map Orientation->Up mode
The Course Up mode screen orientation is determined by whether or not navigation is in progress.
During navigation vessel present position is in the center of the Screen and the course line to the
destination is straight up. As your present position changes, the map moves under the stationary
vessel icon.
(*If navigation is stopped, the Main Screen appears as Head up.)
1.4. Head Up
▶[MENU]->Advance->Map Setup->Map Orientation->Up mode
For Head Up mode, vessel present position is fixed in the center of the Main Screen and vessel
heading is upward. As your present position changes, the map moves under the vessel icon.
Page 69

- 69 -
2. Map setup
▶[MENU]->Advance->Map Setup
2.1. Map orientation
2.1.1. True motion
You can select “True motion”
(☞ the default setting is OFF.)
2.1.2. Up mode
You can select “Map Orientation”
(☞ the default setting is North Up.)
2.2. User Data Display
setting up shown/hide the user data on the display.
2.3. INFO Display
Setting up shown/hide common item between the HY-MAP, C-MAP and Navionics on the display.
2.4. Map scale
Setting up the map scale on the display.
2.5. Palette
It is possible to the palette used to enhance the visibility of the screen depending on the surround light
condition. The possible choices are listed in the table below:
2.5.1. Normal
It set the maps are displayed in ordered to use colors as similar as possible to the ones used in the
original paper charts.
2.5.2. Sunlight
It is designed to enhance the visibility of the screen when SVS series is exposed to the sunlight. The
maps are much brighter than in the other displays.
2.5.3. NOAA
Allows setting NOAA paper chart colors presentation.
(*It is available NOAA menu on C-MAP.)
Page 70

- 70 -
2.6. LAT. Modification
Though GPS information is accurate, there could be an error in the chart at latitude. The error can be
modified in the chart latitude modification.
2.7. LON. Modification
Though GPS information is accurate, there could be an error in the chart at longitude. The error can
be modified in the chart longitude modification.
2.8. Chart
Select the chart among Navionics and C-MAP.
2.9-1. C-Map (*only for *C-MAP mode.)
2. 9-1.1. SAT. Image
Setting up the overlay Satellite Image on the C-MAP.
(☞ the default setting is shown.)
2.9-1.2. Font & Symbols
On charts it is possible to set the size of all names and symbols drawn on the charts, selecting
between Normal size and large size.
(☞ the default setting is normal.).
2.9-1.3. Mixing Level
When the map coverage at the current zoom level does not fill the entire screen, the chart plotter
draws the rest of the map expanding the cartographic information read from, at most, two zoom levels
above the current zoom level. For this reason the map is drawn three times; firstly it draws the two
levels before the current level and then the current level. The area covered by the cartographic data
read from the previous levels is identified by a dotted pattern. When the cursor is moved area not
covered by data of the currents level the chart plotter zooms out to the first level covered by
cartographic data. The default setting is ON.
(☞ the default setting is on.)
2.9-1.4. Perspective View
Chart data may be projected in perspective mode during navigation. This function allows setting the
panoramic View of the chart.
Page 71

- 71 -
As the upper side of the map is more compressed than the lower side, a wider map area is visible. The
perspective view allows showing more chart information immediately ahead and around the cursor.
(☞ the default setting is off.)
2.9-1.5. Chart Boundaries
Sets ON/OFF the displaying of the chart boundaries, which represents the boundaries of the charts
available on the chart plotter. Selecting Auto instead, if we are in background charts only the first chart
levels contained in the C-CARD are displayed, if we are in a charts level contained in the C-CARD the
next four charts level are displayed.
(☞ the default setting is auto.)
2.9-1.6. Multi Language
Select language for name of the place, lighthouse or buoy.
(☞ the default setting is English.)
2.9-1.7. Quick View
It is available to set up. Place the cursor on buoys or icons on the C-MAP, the information window is
shown up automatically.
(☞ the default setting is hidden.)
2.9-2. Navionics (*only for *Navionics mode.)
2.9-2.1. Display
2.9-2.1.1. Easy View
Easy view increases text size and reduces the number of cartography items displayed to make the
chart application more readable.
2.9-2.1.2. Seabed Type
Setting up the seabed on the display.
Page 72

- 72 -
2.9-2.1.3. Dynamic Tide & Current
The electronic charts may allow animation of the tide information tide stations.
Animated current information is available in the chart application wherever a diamond-shaped symbol
with a "T" or “C” is displayed:
This symbol identifies tide stations and the availability of tide & current information for the location.
When you select a tide station symbol the chart context menu is displayed, which provides the
animate option.
When you select Animate the animate menu is displayed and the diamond–shaped symbols are
replaced with dynamic tide bar which indicates the predicted tide height for the actual time and date:
Tide animation.
• Tide height is indicated by a gauge. The gauge is comprised of 8 levels, which are set according to
the absolute minimum / maximum values of that particular day.
• The color of the arrow on the tide gauges indicates changes in the tide height:
– Red: increasing tide & current height.
– Blue: decreasing tide & current height.
The animation can be viewed continuously or incrementally at a time interval that you specify. You can
also set the date for the animation, and start or restart the animation at any point within a 24-hour
period. If the system does not have a valid date and time the date used will be midday for the system
default date.
2.9-2.1.4. Chart Boundaries
Sets ON/OFF the displaying of the chart boundaries, which represents the boundaries of the charts
available on the chart plotter.
2.9-2.1.5. Language
Select language for name of the place, lighthouse or buoy.
2.9-2.2. Safety Depth
Allows you to display the depth areas corresponding to the safety contour desired. Available options
are:
Off: No depth area displayed.
Page 73

- 73 -
Other numeric depth values: The areas with depths up to value selected are displayed in shades going
from darker blue (for lower depths) to lighter blue (for higher depths). The areas whose depths are
over the selected value, and therefore navigable under safety conditions, will be displayed in white.
The dry line areas are displayed in green.
2.9-2.3. Contours Depth
Used to select the display of depth contours.
Available options:
-5m: display depth contours up to 5 meters (16 feet)
-10m: display depth contours up to 10 meters (33 feet)
-20m: display depth contours up to 20 meters (66 feet)
-All: all depth contours are displayed
2.9-2.4. Chart Details
The chart detail setting determines the amount of cartographic detail
Shown in the chart application.
Selecting the Low option for the Chart Detail hides the following cartographic objects.
2.9-2.5. Presentation Type
Is used for the selection of the symbols and colors of the navigation chart "look and feel"; either U.S.
or International "paper chart" presentation types can be selected.
2.9-2.6. Community Edits
Setting up the community edits on the display.
2.9-2.7. Rocks Limit
Setting up the rocks limit.
2.9-2.8. Zoom Mode
You can choose the zoom mode.
2.9-2.9. Sonar Charts
Setting up the sonar charts on the display.
3. Vessel
3.1. Vessel Icon Size
Page 74

- 74 -
The size of the present position is adjustable from 0 to 9. The biggest size is ‘0’.
(☞ the default setting is 9.)
3.2. Heading Line
The length of the heading line is adjustable from 50 until 300. The bigger the number, the longer the
line. The heading line is used in modes of the true motion and the north up.
(☞ the default setting is 270.)
3.3. Vessel style (Circle/Arrow/Vessel)
Select the vessel symbol among Circle, Arrow and vessel.
(☞ the default setting is circle.)
3.4. Orient. Resolution
Sets you preferred Rolling Road Scale.
(☞ the default setting is 0.)
4. Cursor Icon
Select the cursor icon between Cross to Arrow.
(☞ the default setting is Cross.)
5. Alarm
5.1. Navigation
5.1. 1. Arrival Alarm:
When you approach into the waypoint range, it gives you a notice with alarm.
(☞ the default setting is OFF.)
5.1.2. Arrival Radius:
It is to adjust the range of arrival from your waypoint. If you have a route, it changes to the next
waypoint automatically.
(☞ the default setting is 0.05nm.)
5.1.3. XTE Alarm:
If you are out of the course, it gives you a notice with alarm.
(☞ the default setting is OFF.)
5.1.4. XTE Radius:
Page 75

- 75 -
It is to adjust the range of the off course.
(☞ the default setting is 0.25nm.)
5.2. Anchor
5.2.1. Anchor Alarm:
It is necessary when your vessel anchors.
(☞ the default setting is OFF.)
5.2.2. Anchor Radius:
If you vessel is out of the range of the anchor, it gives you notice with alarm.
(☞ the default setting is 0.05nm.)
5.3. Interval
5.3.1. Interval Alarm:
It alarms every time you set.
(☞ the default setting is OFF.)
5.3.2. Interval Time
The time is available from one minute until sixty minutes.
(☞ the default setting is 3 min.)
5.4 User Line
5.4.1. User Line Alarm
It alarms if it breaks into the setting area.
(☞ the default setting is OFF.)
5.4.2. User Line Radius
It sets the range of the course alarm.
(☞ the default setting is 0.05nm.)
Page 76

- 76 -
AIS getting started
1. What is AIS?
AIS is an Automatic Identification System. It has been introduced to improve the safety of navigation
by assisting in the efficient operation of ship to ship, ship reporting and VTS applications. The system
should enable operators to obtain information from the ship automatically, requiring a minimum of
involvement of ship’s personnel, and should have a high level of availability.
Connecting to the chart plotter an AIS receiver, vessels with AIS transponder within VHF range are
displayed on screen giving he skipper or navigator a visual interpretation of the data of nearby vessels.
This improves safety, and specifically for collision avoidance reasons.
2. AIS system definitions
CPA
Closest Point of Approach is the closest distance that will be achieved between
your vessel and the tracked target, based on your vessel’s speed and direction
and the target’s speed and direction.
TCPA
Time to Closest Point of Approach is the time remaining until the CPA will occur.
Name
Name of ship, 20 characters.
MMSI
Maritime Mobile Service Identity.
MMSI number
A unique 9 digit number that is assigned to DSC radio station. It primarily registers
the boat information in the U.S. Coast Guard’s national distress database for use
in emergency situations.
Target
It is a vessel equipped with AIS. Information about the targets is being received by
AIS Receiver and displayed on the screen.
Active Target
Target located within the Activation Range. Active target is represented by oriented
triangle with COG and Heading vectors. Rate of turn may also be displayed.
Selected
Target
Target selected with cursor. Can view AIS information window.
Dangerous
Target detected by CPA or TCPA Alarm. Dangerous target is Active Target by
definition. For better visibility Dangerous Target symbol is charged from basic color
Page 77

- 77 -
Target
to red color.
Sleeping
Target
Target located outside the Activation Range. Sleeping target is represented by a
small oriented triangle.
Lost Target
When the AIS info is not received from that vessel. The presentation will be
marked X on the target.
3. AIS information window
Press [ENTER] key for Target info. It shows Information of “AIS INFO” window.
(Fig.3.1)
Page 78

- 78 -
4. Quick INFO on AIS target
Choose “AIS information window” on (Fig.3.1) and AIS data shows under the AIS target.
(*Up to four kinds of data is available to choose in Quick INFO)
Page 79

- 79 -
AIS operation
▶[MENU]->AIS
1. AIS On/Off
Turns the display of AIS targets overlay on the screen on or off.
(☞ the default setting is on.)
2. List
2.1. List
(Fig.3.2)
①
Name
Name of the AIS target
②
MMSI
MMSI of the AIS target
③
Range
Distance between the AIS target and the present position
④
BRG
Bearing between the AIS target and the present position
①
② ③ ④
Selected (blue color)
Page 80

- 80 -
2.2. Detail
Choose the AIS target and press [ENTER].
2.3. Goto
Choose the AIS target and press .
Page 81

- 81 -
2.4. Sort
Press to choose how to sort on (Fig.3.2).
3. Display radius
Displays range rings centered on your current position.
(☞ the default setting is OFF.)
4. AIS target size
Choose the size of AIS target.
(☞ the default setting is Large.)
5. Display vessels by Color
Different types of AIS transmissions can be selected to display different colors of icons on the chart
Page 82

- 82 -
display.
6. Display vessels by Type
Different types of AIS transmissions can be selected to display different types of icons on the chart
display.
7. Filter AIS types
This function allows you to turn on or off reception from different types of AIS transmissions, for
instance if you only wanted to view Class B vessels on the chart display then select Class B On and all
the others Off.
8. Alarm
8.1. CPA Alarm
The CPA alarm is the closest approach alarm; this allows you to set a distance when the alarm will
sound if a vessel comes within that distance.
(☞ the default setting is OFF.)
8.2. CPA Range
The values allowed are from 0.1nm to 10nm.
(☞ the default setting is OFF.)
8.3. TCPA Alarm
The TCPA alarm is the time that a vessel will take to be in the same position as you currently are.
(☞ the default setting is OFF.)
8.4. TCPA Range
The values allowed are from 1 to 50 min.
(☞ the default setting is 1 min.)
8.5. Radius Alarm
When any AIS target breaks into the radius, alarm will sound.
8.6. Radius
The values allowed are from 0.1nm to 10nm.
(☞ the default setting is OFF.)
8.7. Ignore Vessels if Speed Less
Page 83

- 83 -
If you want the alarms to ignore vessels that are travelling at less than a particular speed then switch
ON.
8.8. Speed less than
The values allowed are from 0.1kt to 9.9kt.
9. Set up AIS outs etc
9.1. Mark vessels as lost after
Setting the time for “Lost target”.
(☞ the default setting is 7min.)
9.2. Remove lost vessels after
If the updating AIS target is unavailable in the set time, erasing the AIS target on the screen...
(☞ the default setting is 10min.)
9.3. Vessel target
It is available to setup the own vessel’s AIS target display on the screen.
(☞ the default setting is on.)
10. Others
10.1. Labels on vessels
This menu controls what details are displayed alongside the vessels icons on the chart display.
10.2. Cursor Box info
When you move the cursor in chart mode over an AIS target a box appears showing details of that
vessel.
10.3. Messages List
This window displays lists of specific AIS messages, such as Safety Messages that the unit has
received. Scrolling down the list and highlighting a message allows you to see the contents by
pressing the [ENTER] key. Whilst in the main list pressing the [MENU] key when a message is
highlighted will erase that message, pressing the [►] [◄] keys will allow you to view any other pages
of messages.
★ AIS SART Messages
If an AIS SART message is received it will immediately be displayed on whatever screen you are
Page 84

- 84 -
viewing. If the “Status” shows “Test” then no further action is required as it is just a test transmission. If
the “ Status” shows “Active” it will also show the MMSI, Name and position, the SART icon should now
be displayed on your chart screen at that location. Monitor your VHF radio on Channel 16 and
establish whether any other station has received this SART message, if not take the appropriate action.
10.4. Test View
Showing the text of the SART Message.
(☞ the default setting is off.)
10.5. Fishing net
10.5.1. Fishing net
Display the programmed Fishing net AIS target.
(☞ the default setting is off.)
10.5.2. Select name
Program the name of Fishing Net
10.5.3. Alarm
The alarm goes off when no Fishing net AIS target is in setting range.
(☞ the default setting is off.)
10.5.4. Alarm Radius
Setup the Fishing net alarm range.
(☞ the default setting is 0.05nm.)
Page 85

- 85 -
Page 86

- 86 -
#Sonar getting started
1. Choosing the frequency
In dual frequency mode, choose the frequency with the [▲][▼].
(*The chosen frequency shows in red)
2. Auto/Manual Gain
Press [ENTER] to choose” AUTO/Manual” of Gain.
3. Gain/STC
Choose “Gain” and “STC” with [◀][▶].
4. Controlling Gain
1. Choose the frequency.
2. Choose the gain.
3. Twisting the rotary key to control the gain.
Selected
Page 87

- 87 -
5. Controlling STC
1. Choose the frequency.
2. Choose the STC.
3. Twisting the rotary key to control the STC.
6. Mode
▶[MENU]->Mode
Choose one of Three Sonar Modes
6.1. Normal
Normal mode (with Auto Range active) displays the sounder image with the surface at the top of the
screen and the sea bottom in the lower part of the screen. The depth scale indicates the depth range
appearing in the display. Bottom contours and fish echoes are displayed at the depths where they are
detected. If the depth Range is set manually to a value less than actual water depth, sea bottom
echoes are not displayed, but all other echoes within the Range setting are displayed.
6.2. Bottom Zoom
Bottom Zoom magnifies the sounder display from the sea bottom toward the surface for a short
Page 88

- 88 -
distance. The sea bottom contour is displayed and additional contour lines are added at intervals
above the sea bottom to aid in determining distances of echoes near the bottom. Use the Sounder
Menu to set the magnified Bottom Range from 2.5 to 20m (10 to 60ft.). Default setting is 10m (40ft.). If
the depth Range is set manually, the setting must place the sea bottom echo in the lower portion of the
screen for Bottom Zoom to be effective.
6.3. Bottom Lock
Bottom Lock divides the Sonar main screen image for the selected Sonar into two sections. The left
hand section displays a Normal Mode image. The right hand section of the screen displays the Sonar
image relative to the sea bottom. The sea bottom appears as a straight line with the Sonar image
magnified for a short distance toward the surface. A scale
Appears on the right side for estimating distances of echoes near the bottom. Use the Sonar Manu to
set the magnified Bottom range from 2.5 to 20m (10 to 60ft.). Default setting is 10m (40ft.). If the depth
Range is set manually, the setting must place the sea bottom echo in the
Lower portion of the screen for Bottom Lock to be effective.
Sonar modes are selectable for single frequency or dual and some functions, for example bottom
Page 89

- 89 -
zoom or lock.
7. VRM
▶ [WPT]
The VRM (movable marker) shown by the green line can be moved up and down.
It is convenient to measure the depth by aligning with the target such as school of fish.
Page 90

- 90 -
[Fig.2.1]
#Sonar operation
1. Menu
▶ [MENU]
1.1. User data
It is same as Chart plotter. PLS refer the Chart plotter operation manual.
1.2. Deep Depth Range
Smart4/5 selects the best condition for measuring the depth automatically in the environment of the
sea.
(☞ the default setting is Auto)
1.3. Shift
A user selects this function to see more detailed bottom of the sea. When you turn up the shift, the
range of Fish finder shall go up from the shift range. For example, if you raise 5m of shift at 20m range,
the surface shall start 5m and the bottom range shall be 25m.
(☞ the default setting is 0m.)
1.4. Mode
Fish finder modes are selectable for single frequency or dual and some functions.
1.5. Bottom Zoom Range
Select the range of the bottom zoom or lock. It is necessary to modify the bottom.
(☞ the default setting is 10m.)
1.6. Fish symbol
Fish symbol with sizes and levels show for targets.
(*Fish symbol is only for reference. This could be different from the real.)
1.7. Fish size
Setup to display of the size of fish.
(☞ the default setting is off.)
1.8. Interference Rejection
Page 91

- 91 -
When there are other boats around you, your Fish finder could receive interference. The steps of the
function are from off to level 2. The bigger number, the more rejection.
(☞ the default setting is OFF.)
1.9. Noise Rejection
Your Fish finder could be disturbed by the engine noise. This function can reject the noise from the
engine or other machinery instruments.
(☞ the default setting is OFF.)
2. Advanced Menu
▶ [MENU] -> Advance
2.1. Display
2.1.1. A-scope
A-scope shows the research under the water by a scope to see the environment under the water.
(☞ the default setting is OFF.)
2.1.2. Image Speed:
Select the speed of Fish finder image from 4X until 1/32X.
(☞ the default setting is 1X.)
2.1.3. White Line
If it is necessary to see fish on the bottom. The color of the bottom changes into white or black to
make the bottom easier to see.
(☞ the default setting is OFF.)
2.1.4. Depth
Shown/Hidden the depth range on the screen.
(☞ the default setting is shown.)
2.1.5. Depth Font
Select the depth range font size on the screen.
(☞ the default setting is Large.)
2.1.6. TEMP
Show/Hide the temperature on the screen.
Page 92

- 92 -
(☞ the default setting is hidden.)
2.1.7. TEMP Font
Select the temperature font size on the screen.
(☞ the default setting is Large.)
2.1.8. Image Filtering
This function is reduction of the noise.
(☞ the default setting is on.)
2.2. Color
2.2.1. Color Level
This function adjusts the colors. Make it upper level, the color becomes darker.
(☞ the default setting is OFF.)
2.2.2. Color Rejection
There are 16 color levels for Fish finder. The color bar is on the left of the Fish finder. If the level is
higher, the color of the bar is deleted one by one.
2.2.3. Screen Color
Select he back ground color of the Fish finder for your convenience.
2.3. Pulse
Select the pulse of the output from the transducer. Levels are among Low, Medium and High, which
depends upon the depth. Low is proper to research precise a fish school but it is not suitable to
measure a deep depth. High is opposite from Low.
(☞ the default setting is Medium.)
2.4. Output Power
Select the output from the installed transducer. Levels are from off to 3. It should be careful about the
depth. If you set high level in a shallow depth, the Fish finder screen turns to red. You see nothing
expect red on the screen.
(☞ the default setting is 3.)
2.5. Alarm
2.5.1. Depth
Page 93

- 93 -
2.5.1.1. Deep Depth Alarm
It alarms when the set deep depth is out of the range.
(☞ the default setting is OFF.)
2.5.1.2. Deep Depth Range
Setup the range of deep depth alarm
(☞ the default setting is 0M.)
2.5.1.3. Shallow alarm
It alarms when the set shallow depth is out of the range.
(☞ the default setting is OFF.)
2.5.1.4. Shallow range
Setup the range of shallow depth alarm
(☞ the default setting is 0M.)
2.5.2. TEMP (Temperature)
2.5.2.1. High alarm
It alarms when the set high temperature is out of the range.
(☞ the default setting is OFF.)
2.5.2.2. High Range
It alarms when the set high temperature is out of the range.
(☞ the default setting is 0.)
2.5.2.3. Low alarm
It alarms when the set low temperature is out of the range.
(☞ the default setting is OFF.)
2.5.2.4. Low range
It alarms when the set low temperature is out of the range.
(☞ the default setting is 0.)
2.5.3. Fish-School
2.5.3.1. Alarm
It alrams when it detects school of fish.
It will detect school of fish depend on set depth, range and level of the sonar.
(☞ the default setting is OFF.)
2.5.3.2. Fish-school Depth
If the alram is on, It is available to setup the depth of the Fish-school
(☞ the default setting is 10m.)
2.5.3.3. Alarm range
If the the alram is on, It is available to setup the Range(hight) of the Fish-school.(The bar, next of
Page 94

- 94 -
display is shown)
(☞ the default setting is 50m.)
2.5.3.4. Alarm Interval
If the the alram is on, It is available to setup the alarm interval.
(☞ the default setting is middle)
2.5.3.5. Color Level
If the alarm is on, you are able to choose the color level.
2.6. Water Temp
The error of water temp value can be corrected.
(Setting:-10.0~10.0℃,-10~10°F)
(☞The default setting is 0.)
2.7. TD Setup
Choosing the frequency of the TD.
2.8. Speed Source
Switch the Sensor/NMEA.
- Inside Sensor: Use the built-in speed meter for sensor.
- NMEA: Use the external input value for NMEA.
(☞The default setting is NEMA.)
.
Page 95

- 95 -
.
Page 96

- 96 -
General operation
1. GPS
It is available to control and confirm information in GPS receiver.
1.1. Coordinate System
It sets coordinate system of GPS or Loran.
(☞The default setting is GPS.)
1.2. Datum
It shows GPS Datum. WGS-84, which is the worldwide standard, is only available.
(☞ the default setting is WGS-84.)
1.3. LAT. Modification
There could be a receiving signal error from satellites. If it is on the latitude, modify in the latitude
modification.
1.4. LOT. Modification
There could be a receiving signal error from satellites. If it is on the longitude, modify in the longitude
modification.
1.5. POG filtering
Step 1(OFF) ~59(MAX) the POG Filter. When it is on (over step 1), you can filter the POG of the
vessel, to optimize it.
(☞ the default setting is incorrect every the country.)
1.6. COG filtering
Step 1(OFF) ~119(MAX) the COG Filter. When it is on (over step 1), you can filter the COG of the
vessel, to optimize it.
(☞ the default setting is incorrect every the country.)
1.7. SOG filtering
Step 1(OFF) ~119(MAX) the SOG Filter. When it is on (over step 1), you can filter the SOG of the
vessel, to optimize it.
Page 97

- 97 -
(☞ the default setting is incorrect every the country.)
1.8. LAT/LON Unit
It is to select the number of the unit for Lat/Lon.
(☞ the default setting is 4 units.)
1.9. Receiving Port
It is to select Inter receiver Internal, External and AIS.
(☞ the default setting is Internal.)
2. Setup
It is available to set the menu or units for user’s visual confidence.
2.1. Unit
2.1.1. DIST/Speed
Select desired unit of measure for distance and speed. Choose from: nautical mile/knots (nm/kt),
kilometer/kilometers per hour (km/kmh), yard/knot (yd/kt).
1nm = 1.852km, 1kt /h= 1.852km/h, less than 1nm display in yard and over 1nm display in mile
(☞ the default setting is Nm/Kt.)
2.1.2. Depth
Select desired unit of measure for depth of water. Choose from: meter (M), foot (ft), fathom (fm), Italian
Fathom (fm), Japanese fathom (Jfm).
1m = 3.281ft = 0.549fm = 0.609lfm = 0.660jfm
(☞ the default setting is Meter.)
2.1.3. TEMP
Select desired unit of measure for temperature of water. Choose from: Celsius (℃), or Fahrenheit (℉).
cf) 1℃ = +32℉
2.2. Compass
2.2.1. BRG
There is a difference degree where you are in the earth. This function is to modify the error from true
and Magnetic.
(☞ the default setting is Auto)
Page 98

- 98 -
2.2.2. Variation
There could be a difference between the magnetic compass and the GPS compass. An error depends
upon your area.
2.3. Time & Date
2.3.1. Reference
Available to adjust the correct local time by UTC time from the GPS.
(☞ the default setting is incorrect every the country.)
2.3.2. Time Format
Chooses time between 12 hour and 24 hour.
(☞ the default setting is 12 hour.)
2.3.3. Date Format
Sets you preferred date among YY-MM-DD, MM-DD-YY or DD-MM-YY.
(☞ the default setting is YY-MM-DD.)
2.3.4. Month format
Sets the preferred date between Character and Number.
2.3.5. Calendar setup
2.3.5.1. Week starts on
You can select the first day of week.
(☞ the default setting is SUN.)
2.3.5.2. Color Saturday
You can setup the color of Saturday.
2.3.5.3. Color Sunday
You can setup the color of Sunday.
2.4 Input/output
2.4.1. Output Sentences
The chart plotter allows customizing the NMEA-0183 sentence.
Page 99

- 99 -
DESCRIPTIONS
CONTENTS OF DATA FIELD
DEFAULT
$GPGGA
Global Positioning System Fix Data
ON
$GPVTG
Course and Ground Speed
ON
$GPZDA
Time and Date
OFF
$GPRMB
Recommended minimum navigation information
OFF
$GPRMC
Recommended Minimum Specific GPS/TRANSIT DATA
OFF
$GPAPB
Heading/track controller (Autopilot) sentence B
ON
$GPXTE
Cross-track error, measured
OFF
$GPBOD
Bearing, origin to destination
OFF
$GPBWC
Bearing and distance to waypoint
ON
$SYPLT
Samyoung autopilot
OFF
2.4.2. Transmit
Available to adjust transmit speed of input/output in each ports.
2.4.3. Buzzer
It is can be buzzer on/off.
(☞ the default setting is on.)
2.4.4. Backlight time out
It is the screen sets the time to sleep mode.
(☞ the default setting is off.)
2.4.5. Customizing
2.4.5.1. Data bar
2.4.5.1.1. Display
Setting up shown/hide the data bar on the display.
(☞ the default setting is shown.)
2.4.5.1.2. Position
Setting up the position of data bar on the display.
(☞ the default setting is down.)
2.4.5.1.3. Edit
Page 100

- 100 -
It customizes the data bar information.
2.4.5.1.4 Mode
It is available to set up the data bar.
- Customizing: It is selectable and modifiable the data bar by user.
- Fix mode: It is fixed data bar by default. It is not available selectable and modifiable the data bar by
user.
(☞ the default is User mode.)
2.4.5.2. Navigation Data
2.4.5.2.1. Type
It is a select the navigation data type.
(☞ the default setting is Type1.)
2.4.5.2.2. Edit
It customizes the Navigation data section except activated the sonar section.
2.4.5.3. Sidebar
2.4.5.3.1. Display
Shown/Hidden “Sidebar”...
(☞ the default setting is off.)
2.4.5.3.2. Position
Choosing the position of “Sidebar” on the right or left.
(☞ the default setting is left.)
2.4.5.3.3. Edit
Editing “Sidebar”.
2.4.5.4. Menu
2.4.5.4.1. Type
Two kinds of Menu, “HGP” and “Smart”.
(☞ the default setting is smart.)
2.4.5.4.2. Color
Changing the menu color.
(☞ the default setting is orange.)
2.4.5.5. INFO Window
2.4.5.5.1 WPT
While navigating, shown/hide “WPT information”.
(☞ the default setting is shown.)
2.4.5.5.2 Cursor
When the cursor is on the screen, shown/hide the cursor window.
(☞ the default setting is shown.)
 Loading...