

Page 1

CHART PLOTTER NAME DESCRIPTION SOFTWARE
COLOR MAX 5E 5" Sunlight Readable Vertical Color Display S4egSW5vc
COLOR MAX 5I 5" Sunlight Readable Vertical Color Display S4igSW5vc
COLOR MAX WIDE E GPS 7" Sunlight Readable Wide Color Display S4egSW7wc
COLOR MAX WIDE I GPS 7" Sunlight Readable Wide Color Display S4igSW7wc
COLOR MAX SEALINK E 7" Sunlight Readable WVGA Color Display S4egSW8wc
COLOR MAX SEALINK I 7" Sunlight Readable WVGA Color Display S4igSW8wc
COLOR MAX 6 5.6" Sunlight Readable Color Display S3egSW7c
COLOR MAX PRO 11" Sunlight Readable Color Display S5egSW11c
COLOR MAX 15 15" Color Display S5egSW15c
EXPLORER II Plus Controller for Color Display S5egSWctcj
External Smart GPS Receiver
Internal GPS Receiver
External Smart GPS Receiver
Internal GPS Receiver
External Smart GPS Receiver & Video Input
Internal GPS Receiver & Video Input
External GPS Receiver
External Smart GPS Receiver & Video Input
External Smart GPS Receiver & Video Input
External Smart GPS Receiver
Copyright 2007 Seiwa - Hong Kong
All rights reserved. No part of this publication may be reproduced or distributed in any form or by any means, or stored in
a database or retrieval system, without prior written permission of the publisher.
User Manual
code: (L1123-201107e)
Page 2

Important Information
WARNING
Electronic charts displayed by the chart plotter are believed to be accurate and
reliable, but they are not intended to replace official charts which should remain
your main reference for all the matters related to the execution of a safe navigation. For this reason we would like to remind you that you are required to carry on
board and use the officially published and approved nautical charts.
CAUTION
♦ Please read through this manual before the first operation. If you have any
questions, please contact the Company's customer service or your local
dealer.
♦ The chart plotter is not built water proof. Please give attention to avoid
water intrusion into the chart plotter. Water damage is not covered by the
warranty.
♦ Extensive exposure to heat may result in damage to the chart plotter.
♦ Connection to the power source with reversed polarity will damage the chart
plotter severely. This damage is not covered by the warranty.
♦ The chart plotter contains dangerous high voltage circuits which only expe-
rienced technicians MUST handle.
♦ The C-MAP C-CARDs are available from your local dealer.
♦ Exposure of the display to UV rays may shorten the life of the liquid crystals
used in your plotter. This limitation is due to the current technology of the
LCD displays.
♦ Avoid overheating which may cause loss of contrast and, in extreme cases,
a darkening of the screen. Problems which occur from overheating are reversible when temperature decreases.
CLEANING PROCEDURE FOR THE PLOTTER SCREEN
Cleaning your chart plotter screen is a very important operation and must be
done carefully, as the window's surface is covered with and antireflective coating.
The following is the cleaning procedure: you use a tissue or lens tissue and a
cleaning spray containing Isopropanol (a normal spray cleaner sold for the PC
screen, for example PolaClear by Polaroid). Fold the tissue or lens tissue into a
triangular shape, moisten the tip and use the index finger behind a corner to
move the tissue across the surface, in overlapping side to side strokes. If the
tissue is too wet, a noticeable wet film will be left in its path and you will need to
repeat the process. If too dry, the tissue won’t glide easily, and may damage the
surface.
NOTE We will not be liable for errors contained herein, or for incidental or
4 User Manual
consequential damages in connection with the performance or use of this
material.
Page 3

Contents
Important Information ................................................................................. 4
WARNING ................................................................................. 4
CAUTION ................................................................................. 4
CLEANING PROCEDURE FOR THE PLOTTER SCREEN .................................................. 4
About this User Manual ............................................................................... 11
INTRODUCTION ............................................................................... 11
CONVENTIONS USED ............................................................................... 11
HOW THIS USER MANUAL IS ORGANIZED ............................................................. 11
IF YOU NEED ASSISTANCE ............................................................................... 12
1. Getting Started ............................................................................... 13
1.1 THE KEYBOARD ............................................................................... 13
Joystick (Cursor key) ............................................................................... 13
Dedicated Keys ............................................................................... 13
Software Keys Customization ........................................................................ 14
1.2 SWITCHING ON/OFF ............................................................................... 14
Switching On ............................................................................... 15
Switching Off ............................................................................... 15
1.3 CHANGING BACKLIGHT AND CONTRAST ......................................................... 15
1.4 SELECTING THE LANGUAGE ......................................................................... 15
1.5 C-MAP CARTOGRAPHY INFORMATION ............................................................ 15
1.6 USING C-MAP C-CARDS ............................................................................... 16
1.7 SIMULATION MODE ............................................................................... 16
1.8 CONTROLLING THE DISPLAY ........................................................................ 16
Changing Display Mode ............................................................................... 16
Moving around the Chart and Changing Chart Scale ......................................... 19
Finding Your Boat Position ............................................................................ 19
Selecting Screen Amplifier ............................................................................ 19
Selecting Map Orientation ............................................................................ 19
1.9 NAVIGATION TO A SINGLE DESTINATION ....................................................... 20
1.10 RANGE/BEARING FUNCTION ......................................................................... 20
Inserting R/B ............................................................................... 20
Deleting R/B ............................................................................... 20
Editing R/B ............................................................................... 20
1.11 MAN OVERBOARD (MOB) ............................................................................. 20
Inserting MOB ............................................................................... 20
Selecting Auto Info on MOB .......................................................................... 21
Deleting MOB ............................................................................... 21
2. Operations ............................................................................... 23
2.1 USER POINTS: MARKS, EVENTS AND WAYPOINTS ........................................... 23
Creating Waypoint ............................................................................... 23
Creating Mark ............................................................................... 23
Creating Event ............................................................................... 23
Editing User Point ............................................................................... 23
Deleting User Point ............................................................................... 23
Moving User Point ............................................................................... 23
Locating User Point on Map ........................................................................... 24
Sending/Receiving User Point ........................................................................ 24
Selecting User Points List page ...................................................................... 24
2.2 ROUTES ............................................................................... 24
Selecting Active Route ............................................................................... 24
User Manual
5
Page 4

Creating a Route ............................................................................... 24
Inserting notes on Route .............................................................................. 25
Hiding or Showing Route .............................................................................. 25
Selecting Route Color ............................................................................... 25
Deleting Route ............................................................................... 25
Following a Route (Activate the Navigation) .................................................... 25
Inserting Waypoint ............................................................................... 25
Reversing Route ............................................................................... 25
Selecting Route Report page ......................................................................... 26
Sending Route ............................................................................... 26
Receiving Route ............................................................................... 26
2.3 GOTO FUNCTION ............................................................................... 26
Navigation to Waypoint ............................................................................... 26
Deleting destination ............................................................................... 26
2.4 USING TRACK ............................................................................... 26
Setting up a Track Step ............................................................................... 27
Selecting Track Color ............................................................................... 27
Displaying Track ............................................................................... 27
Activating/Deactivating Track Recording ......................................................... 27
Clearing Track ............................................................................... 28
Selecting Track Number ............................................................................... 28
TRACK TO ROUTE FUNCTION ........................................................................ 28
Track To Route ............................................................................... 28
2.5 DATA WINDOW CUSTOMIZATION ON CHART PAGE .......................................... 28
2.6 INFO ............................................................................... 29
2.7 PORT & TIDE INFO ............................................................................... 31
2.8 FIND FUNCTION ............................................................................... 33
2.9 ALARMS ............................................................................... 35
Advanced menu ............................................................................... 28
Setting Automatic Info ............................................................................... 29
Selecting Automatic Info .............................................................................. 29
Displaying Expanded Info page (Full Info) ....................................................... 29
Info on objects with Pictures ......................................................................... 29
Info Tree and Expanded Info page ................................................................. 30
Quick Info on Lakes ............................................................................... 30
Full Info on Lakes ............................................................................... 31
Getting Port Info ............................................................................... 31
Getting Tide Info ............................................................................... 32
Finding Nearest Port Services ........................................................................ 33
Finding Nearest Port By Name ....................................................................... 33
Finding Nearest Port By Distance ................................................................... 34
Finding Nearest Tide Station ......................................................................... 34
Finding Nearest Wrecks ............................................................................... 34
Finding Nearest Obstructions ........................................................................ 34
Finding Cursor ............................................................................... 34
Finding Nearest Lakes Information ................................................................. 34
Finding Nearest Lakes By Name .................................................................... 35
Finding Nearest Points Of Interest ................................................................. 35
Finding Coordinates ............................................................................... 35
Finding User Points ............................................................................... 35
Auto Off ............................................................................... 35
Arrival Alarm ............................................................................... 35
XTE Alarm ............................................................................... 35
Anchor Alarm ............................................................................... 36
Depth Alarm ............................................................................... 36
Heading Alarm ............................................................................... 36
Grounding Alarm ............................................................................... 36
Grounding Depth Limit ............................................................................... 36
Grounding Alarm Range ............................................................................... 36
Grounding Alarm Report ............................................................................... 36
6 User Manual
Page 5

External Alarm ............................................................................... 36
Timer Alarm Menu ............................................................................... 37
2.10 USER C-CARD ............................................................................... 37
User C-CARD page ............................................................................... 37
Formatting User C-CARD .............................................................................. 37
Saving File on User C-CARD .......................................................................... 37
Loading File from User C-CARD ..................................................................... 38
Deleting File from User C-CARD ..................................................................... 38
Selecting Slot ............................................................................... 38
Reading User C-CARD directory ..................................................................... 38
Sorting User C-CARD directory ...................................................................... 38
3. User Setting Up ............................................................................... 39
3.1 GENERAL MENU ............................................................................... 39
3.2 MAP MENU ............................................................................... 39
Zoom Type ............................................................................... 39
Fonts & Symbols ............................................................................... 39
Perspective View ............................................................................... 40
Dynamic Nav-Aids ............................................................................... 40
Map Orientation ............................................................................... 40
Mixing Levels ............................................................................... 41
Safety Status Bar (DSI = Data Safety Indicator) .............................................. 41
Palette ............................................................................... 42
Currents Prediction ............................................................................... 42
3.3 OTHER MAP CONFIGURATIONS ..................................................................... 42
Display Mode ............................................................................... 42
Marine Settings ............................................................................... 43
Depth Settings ............................................................................... 44
Land Settings ............................................................................... 44
Chart Settings ............................................................................... 44
Underwater Objects Settings ........................................................................ 44
3.4 DISPLAY MENU ............................................................................... 45
3.5 VIDEO INPUT MENU ............................................................................... 45
3.6 NAV DISPLAY MENU ............................................................................... 46
3.7 ADVANCED MENU ............................................................................... 46
3.7.1 Input/Output Setup menu .................................................................. 46
GPS Connection ............................................................................... 46
GPS Setup Menu ............................................................................... 46
Autopilot Connection ......................................................................... 47
External NMEA Connection ................................................................. 47
C-COM GSM Plus Connection .............................................................. 47
Output Sentences ............................................................................. 47
NMEA-0183 Output Talker ID .............................................................. 47
External Signal ............................................................................... 48
Cable Wiring page ............................................................................. 48
Power I/O Cable Wiring page .............................................................. 48
GPS Cable Wiring page ...................................................................... 48
AUX In I/O Cable Wiring page ............................................................. 48
Send/Receive Routes & Marks ............................................................. 48
3.7.2 C-Link menu ............................................................................... 48
3.7.3 Fix & Compass menu ......................................................................... 49
3.7.4 C-Staff menu ............................................................................... 49
3.8 AIS ............................................................................... 49
3.8.1 AIS System Definitions ...................................................................... 50
3.8.2 AIS Menu ............................................................................... 51
3.8.3 To set the chart plotter for receiving AIS .............................................. 51
3.8.4 Quick Info on AIS Target .................................................................... 51
3.9 C-WEATHER SERVICE ............................................................................... 51
3.9.1 C-WEATHER SERVICE Menu ............................................................... 52
Download ............................................................................... 52
User Manual
7
Page 6

Copy From User C-CARD .................................................................... 53
Forecast ............................................................................... 53
Real Time View ............................................................................... 53
3.10 DSC ............................................................................... 53
3.11 FISH FINDER ............................................................................... 56
3.12 RADAR ............................................................................... 56
3.13 SYSTEM INFORMATION ............................................................................... 57
3.14 WORLD BACKGROUND CHARTS .................................................................... 57
4. C-LINK ............................................................................... 59
4.1 HOW C-LINK SYSTEM WORKS ....................................................................... 59
4.2 C-LINK SERIAL CONNECTION ....................................................................... 59
5. C-LINK NAVIGATION DATA TRANSFER ............................................................ 61
5.1 OPERATIONS ............................................................................... 61
5.2 QUICK INFO ............................................................................... 64
6. GPS ............................................................................... 65
6.1 How GPS works ............................................................................... 65
7. Maintenance ............................................................................... 67
7.1 SYSTEM TEST ............................................................................... 67
Terms ............................................................................... 69
COLOR MAX 5I & COLOR MAX 5E .......................................................................... 75
FEATURES & FUNCTIONS ............................................................................... 75
TECHNICAL SPECIFICATIONS .............................................................................. 75
INSERTING/REMOVING PROCEDURE .................................................................... 76
CHART PLOTTER DIMENSIONS ............................................................................ 76
INSTALLATION AND REMOVING ........................................................................... 77
EXTERNAL WIRING ............................................................................... 77
TYPICAL CONNECTIONS ............................................................................... 78
Type of Data ............................................................................... 53
3.10.1 Distress Call and Position Request ....................................................... 54
3.10.2 DSC Menu ............................................................................... 54
Log ............................................................................... 54
Directory ............................................................................... 55
3.10.3 Quick Info on DSC Icons .................................................................... 56
Worldwide Background Update ...................................................................... 57
Introductive Elements ............................................................................... 61
Master Chart Plotter ............................................................................... 62
Slave Chart Plotter ............................................................................... 62
C-Link Navigation Data: Acquisition and Display ............................................... 63
Graphical Representation on Map Display ........................................................ 63
Route Data Report ............................................................................... 63
Route Navigation: Quick Info on the Destination .............................................. 64
Quick info on Single Destination .................................................................... 64
6.1.1 Position Fixing Accuracy: HDOP ........................................................... 66
7.1.1 RAM Menu ............................................................................... 67
7.1.2 DIM Menu ............................................................................... 67
7.1.3 Cartridges ............................................................................... 67
7.1.4 Modem test ............................................................................... 68
7.1.5 Serial Ports ............................................................................... 68
7.1.6 External Alarm ............................................................................... 68
7.1.7 Display Settings ............................................................................... 68
Inserting the C-CARD ............................................................................... 76
Removing the C-CARD ............................................................................... 76
GPS Connection FOR COLOR MAX 5E (EXTERNAL GPS RECEIVER) .............................. 78
Autopilot Connection ............................................................................... 78
8 User Manual
Page 7

External NMEA Connection ........................................................................... 78
External Alarm Connection ........................................................................... 79
C-COM GSM Plus Connection ........................................................................ 79
COLOR MAX WIDE E GPS & COLOR MAX WIDE I GPS ............................................ 81
FEATURES & FUNCTIONS ............................................................................... 81
TECHNICAL SPECIFICATIONS .............................................................................. 81
INSERTING/REMOVING PROCEDURE .................................................................... 82
Inserting the C-CARD ............................................................................... 82
Removing the C-CARD ............................................................................... 82
CHART PLOTTER DIMENSIONS ............................................................................ 82
INSTALLATION AND REMOVING ........................................................................... 83
EXTERNAL WIRING ............................................................................... 83
TYPICAL CONNECTIONS ............................................................................... 84
GPS Connection FOR COLOR MAX WIDE E GPS (EXTERNAL GPS RECEIVER) .................. 84
Autopilot Connection ............................................................................... 84
External NMEA Connection ........................................................................... 84
C-COM GSM Plus Connection ........................................................................ 85
Beacon Receiver Connection FOR COLOR MAX WIDE I GPS (INTERNAL GPS RECEIVER).. 85
COLOR MAX SEALINK I & COLOR MAX SEALINK E ................................................ 87
FEATURES & FUNCTIONS ............................................................................... 87
TECHNICAL SPECIFICATIONS .............................................................................. 87
INSERTING/REMOVING PROCEDURE .................................................................... 88
CHART PLOTTER DIMENSIONS ............................................................................ 89
INSTALLATION AND REMOVING ........................................................................... 89
EXTERNAL WIRING ............................................................................... 90
TYPICAL CONNECTIONS ............................................................................... 91
GPS Connection ............................................................................... 91
Autopilot Connection ............................................................................... 91
External NMEA Connection ........................................................................... 92
External Alarm Connection ........................................................................... 92
C-COM GSM PLUS Connection ....................................................................... 92
COLOR MAX 6 ............................................................................... 93
FEATURES & FUNCTIONS ............................................................................... 93
TECHNICAL SPECIFICATIONS .............................................................................. 93
INSERTING/REMOVING PROCEDURE .................................................................... 94
Inserting the C-CARD ............................................................................... 94
Removing the C-CARD ............................................................................... 94
CHART PLOTTER DIMENSIONS ............................................................................ 94
INSTALLATION AND REMOVING ........................................................................... 95
EXTERNAL WIRING ............................................................................... 95
TYPICAL CONNECTIONS ............................................................................... 95
Autopilot Connection ............................................................................... 95
GPS Connection ............................................................................... 96
External NMEA Connection ........................................................................... 96
C-COM GSM Plus Connection ........................................................................ 96
Beacon Receiver Connection ......................................................................... 97
COLOR MAX PRO ............................................................................... 99
FEATURES & FUNCTIONS ............................................................................... 99
TECHNICAL SPECIFICATIONS .............................................................................. 99
INSERTING/REMOVING PROCEDURE .................................................................. 100
Inserting the C-CARD ............................................................................. 100
Removing the C-CARD ............................................................................. 100
CHART PLOTTER DIMENSIONS .......................................................................... 101
INSTALLATION AND REMOVING ......................................................................... 101
EXTERNAL WIRING ............................................................................. 102
TYPICAL CONNECTIONS ............................................................................. 102
User Manual
9
Page 8

GPS Connection ............................................................................. 102
Autopilot Connection ............................................................................. 103
External NMEA Connection ......................................................................... 103
External Alarm Connection ......................................................................... 104
C-COM GSM PLUS Connection ..................................................................... 104
COLOR MAX 15 ............................................................................. 105
FEATURES & FUNCTIONS ............................................................................. 105
TECHNICAL SPECIFICATIONS ............................................................................ 105
INSERTING/REMOVING PROCEDURE .................................................................. 106
Inserting the C-CARD ............................................................................. 106
Removing the C-CARD ............................................................................. 106
CHART PLOTTER DIMENSIONS .......................................................................... 106
INSTALLATION AND REMOVING ......................................................................... 107
EXTERNAL WIRING ............................................................................. 107
TYPICAL CONNECTIONS ............................................................................. 108
GPS Connection ............................................................................. 108
Autopilot Connection ............................................................................. 108
External NMEA Connection ......................................................................... 108
External Alarm Connection ......................................................................... 108
C-COM GSM PLUS Connection ..................................................................... 108
EXPLORER II Plus ............................................................................. 109
FEATURES & FUNCTIONS ............................................................................. 109
TECHNICAL SPECIFICATIONS ............................................................................ 109
INSERTING/REMOVING PROCEDURE .................................................................. 110
Inserting the C-CARD ............................................................................. 110
Removing the C-CARD ............................................................................. 110
CONTROLLER DIMENSIONS ............................................................................. 110
INSTALLATION AND REMOVING ......................................................................... 111
EXTERNAL WIRING ............................................................................. 111
TYPICAL CONNECTIONS ............................................................................. 112
GPS Connection ............................................................................. 112
Autopilot Connection ............................................................................. 112
External NMEA Connection ......................................................................... 113
External Alarm Connection ......................................................................... 113
C-COM GSM PLUS Connection ..................................................................... 114
Installing the Smart GPS External COLOR MAX WIDE E GPS/COLOR MAX SEALINK E/
COLOR MAX 6/COLOR MAX PRO/COLOR MAX 15/EXPLORER II Plus ................... 115
Installing ............................................................................. 115
Dimensions ............................................................................. 116
Analytical Index ............................................................................. 117
CERTIFICATE OF LIMITED WARRANTY ................................................................ 120
10 User Manual
Page 9

About this User Manual
INTRODUCTION
The chart plotter is a state-of-the-art computerized electronic chart system,
designed as a sophisticated navigation aid. User friendly operations make the
chart plotter easy to operate. All calculations and information necessary for
the navigation are performed and displayed on the screen quickly and accurately providing all of the facilities of a conventional GPS but with the added
benefit of a powerful electronic chart display. The cartographic information is
obtained from C-MAP C-CARD (cartography data cards) that are available
through your local dealer. For additional information on C-MAP Cartography
visit web site at www.c-map.com.
CONVENTIONS USED
Throughout this User Manual, the labelled keys are shown in capital letters enclosed in square brackets, for example [ENTER]; the software keys are shown in
small capital letters enclosed in square brackets, for example [EDIT].
Menu operations are in bold characters listed by keys sequence with the menu
names enclosed between inverted commas, for example [MENU] + "MAP" +
[ENTER] means: press the [MENU] key, using the cursor key select the Map
menu and then press [ENTER].
Any menu operation and function activation in this User Manual is related to all
color chart plotter models. Whenever needed, a note has been added for other
different models.
HOW THIS USER MANUAL IS ORGANIZED
♦ CHAPTER 1: Getting Started
Overview of the controls and how to start using the chart plotter.
♦♦
♦ CHAPTER 2: Operations
♦♦
Description of the operation procedures of the chart plotter in detail.
♦ CHAPTER 3: User Setting Up
Set up of the chart plotter, the charting preferences and the GPS options.
♦ CHAPTER 4: C-LINK
C-Link system is a feature needed to share the same cartographic data
between two chart plotter units linked via serial I/O port.
♦ CHAPTER 5: C-LINK NAVIGATION DATA TRANSFER
This function allows transferring C-LINK navigation data (hereinafter
“C-Link navigation data”) between two chart plotters linked through
the C-LINK system.
♦ CHAPTER 6: GPS
GPS antenna and set up of the hardware configuration.
♦ CHAPTER 7: Maintenance
User maintenance guidelines.
♦ Terms
List of the terms and abbreviations used in the User Manual.
User Manual
11
Page 10

♦ COLOR MAX 5E/COLOR MAX 5I
Introduction to the basic information on COLOR MAX 5E/COLOR MAX 5I
chart plotter, its features and use. Installation of the chart plotter.
♦ COLOR MAX WIDE E GPS/COLOR MAX WIDE I GPS
Introduction to the basic information on COLOR MAX WIDE E GPS/
COLOR MAX WIDE I GPS chart plotter, its features and use. Installation
of the chart plotter.
♦ COLOR MAX SEALINK I/COLOR MAX SEALINK E
Introduction to the basic information on COLOR MAX SEALINK I/COLOR
MAX SEALINK E chart plotter, its features and use. Installation of the
chart plotter.
♦ COLOR MAX 6
Introduction to the basic information on COLOR MAX 6 chart plotter, its
features and use. Installation of the chart plotter.
♦ COLOR MAX PRO
Introduction to the basic information on COLOR MAX PRO chart plotter,
its features and use. Installation of the chart plotter.
♦ COLOR MAX 15
Introduction to the basic information on COLOR MAX 15 chart plotter,
its features and use. Installation of the chart plotter.
♦ EXPLORER II Plus
Introduction to the basic information on EXPLORER II Plus controller, its
features and use. Installation of the controller.
♦ INSTALLING THE EXTERNAL SMART GPS
Introduction to the basic information on External Smart GPS Antenna
and its installation.
Analytical Index is at the end of this User Manual.
IF YOU NEED ASSISTANCE
If your chart plotter does not operate properly, please refer to Chapter 7. Most
common operating difficulties can be diagnosed using these tests.
If you still need assistance, call your local dealer, reporting the information available in the System Information page.
12 User Manual
Page 11

1. Getting Started
This chapter provides basic information to get you started using the chart plotter;
it will help you in becoming familiar with the chart display and the functions of the
controls before you start using the chart plotter.
1.1 THE KEYBOARD
Joystick (Cursor key)
Moves the cursor on the display screen quickly and accurately and in the menu
page(s) scrolls the desired option. If in Navigate (Home) mode, it allows to exit
from navigate mode.
Dedicated Keys
[POWER] ♦ keep it pressed for one second to turn On the chart plotter
[MOB] ♦ inserts the MOB (Man OverBoard) on the ship's position
[CLEAR] ♦ exits from menu or leaves a menu without making changes
[ENTER] ♦ places Marks, Waypoints, destination and selects R/B; confirms
[MENU] ♦ opens the Map menu
[ZOOM IN] ♦ shows more details of a smaller area
[ZOOM OUT] ♦ shows a wider, less detailed area
COLOR MAX 15/COLOR MAX PRO:
[GOTO] ♦ selects the Goto function (instead of [ENTER])
[DATA] ♦ selects the configuration among cartography and text area
[INFO] ♦ selects the Info function
COLOR MAX PRO:
Numeric Keys
The numeric/alphanumeric keys allow to make easy the numbers/names inserting. Pressing the key the first time, the first letter is inserted, the second time the
second letter, the third time the third letter, the fourth time the number is inserted. After a few seconds from the number/letter inserting, the character is
confirmed and the cursor is moved on the next position. The numbers/names
inserting is possible using the cursor key too.
COLOR MAX 15:
[EVENT] ♦ places Event at vessel's position (instead of [ENTER])
♦ keep it pressed for three seconds to turn Off the chart plotter
♦ press it to adjust the backlight and contrast of the display
♦ if you are not into a menu, sets the Navigate (Home) mode: the
cursor is centered on ship's position
selection
♦ if pressed twice selects the Functions menu
♦ when in chart and data page, keep it pressed for three seconds
to customize data fields of the text area
User Manual
13
Page 12

[MARK] ♦ places Mark at the cursor position (instead of [ENTER])
[ROUTE] ♦ places Waypoint at the cursor position (instead of [ENTER])
[TRACK] ♦ selects the Track menu
Software Keys
The software keys (soft keys) have different functions according to the modes of
operation: their labels for the current functions, located on the front panel, are
shown on the screen right above the keys. Also they are used from the chart
screen or from the data pages to select one of the data pages available to allow
faster access to the page selection executable from the Main Menu.
When the chart page is selected, the soft key labels are not shown. By pressing
one of the four soft keys their labels for the current functions are shown on the
screen immediately above the soft keys. When the soft key labels are shown, by
pressing the associated soft key the relative function is executed. By pressing
[CLEAR] the four soft key labels disappear.
Software Keys Customization
Note that when the soft keys labels are shown the user can customize them.
Pressing and holding down any of the four soft key shows a pop-up window on the
top of the soft key pressed that contains all possible data pages assignable to the
soft key pressed. Move the cursor key up/down to place the selector on the
desired item; move the cursor key to the right or press [ENTER] to set the selected item; move the cursor key to the left or press [CLEAR] to close the pop-up
window. The possible choices are:
♦ CHART [CHART] (Chart and data page)
♦ NAVIGATION [NAV] (Navigation data page)
♦ 3D ROAD [ROAD] (3D Road page)
♦ GPS STATUS [STATUS] (GPS Status page)
♦ GPS DATA [GPS] (GPS data page)
♦ DEPTH [DEPTH 1] (Depth page)
♦ DEPTH FULL [DEPTH 2] (Depth Full page)
♦ WIND DATA [WINDDTA] (Wind Data page)
♦ MARK [MARK] (Mark place)
♦ EVENT [EVENT] (Event place)
♦ WAYPOINT [WAYPOINT] (Waypoint place)
♦ TRACK [TRACK] (Track storing activated/deactivated)
COLOR MAX 15/COLOR MAX PRO:
♦ VIDEOCAMERA 1 [VIDEO 1] (Full screen video image 1)
♦ VIDEOCAMERA 2 [VIDEO 2] (Full screen video image 2)
COLOR MAX SEALINK I/COLOR MAX SEALINK E:
♦ FULL SCREEN VIDEO [VIDEO] (Full screen video image)
NOTE When the Fish Finder or Radar* is connected, any soft key can be assigned
(*) ONLY FOR COLOR MAX PRO/COLOR MAX WIDE E/COLOR MAX WIDE I/EXPLORER II Plus/COLOR MAX
any of the Fish Finder or Radar* pages. See the Fish Finder or Radar* User
Manual for more information.
15/COLOR MAX SEALINK I/COLOR MAX SEALINK E
1.2 SWITCHING ON/OFF
Before powering On the chart plotter, check for the correct voltage (10-35 volt
dc) and the correct connections with the positioning instrument.
14 User Manual
Page 13

Switching On
The chart plotter shows you the logo screen, Caution Notice and then the chart
screen in sequence. The chart plotter will then perform a short self test procedure
that checks all internal memory and the C-CARD (if installed), and then displays
any failure detected on the screen.
COLOR MAX 15:
NOTE The default resolution is 800x600 (manufactory condition or after a CLEAR
[POWER] for 1 second
RAM operation). If connected to a monitor without a different resolution, it is
possible that the image is not shown. So you should set the proper resolution
for the monitor in use (see the monitor manual and the Par. 7.1.7).
Switching Off
A countdown timer appears on the screen, if you release the key before the
countdown timer reaches zero, the chart plotter will remain On.
[POWER] for 3 seconds
1.3 CHANGING BACKLIGHT AND CONTRAST
You can change the level of backlight and contrast for the screen.
EXPLORER II PLUS:
Now you return to the chart screen with the new backlight and contrast levels retained.
[POWER] + use [BRIGHT-]/[BRIGHT+] to adjust backlight levels and/or use
[CONTR-]/[CONTR+] to adjust contrast levels + [ENTER]
[POWER] + use [KEY-]/[KEY+] to adjust keys light levels + [ENTER]
1.4 SELECTING THE LANGUAGE
It is possible to select the language in which you wish information to be displayed (for
screen labels, menus and options, but it does not affect the map information).
[MENU] + [MENU] + "GENERAL" + [ENTER'] + "Language" + [ENTER] +
select the language you want + [ENTER]
1.5 C-MAP CARTOGRAPHY INFORMATION
MAX is a major evolution of the NT/NT+ product technology. Key points are:
New Data Features
♦ Tides and Currents (intuitive arrows show direction and strength)
♦ World Background Charts with terrestrial data
♦ Value Added Data (Pictures and Diagrams, Land Data)
♦ Enhanced Port Info
New Presentation Features
♦ Clear View (advanced legibility techniques providing more chart data
on the screen)
♦ Clear Info (sophisticated "Human Dictionary" to translate Nav-Aid ab-
breviations found on paper charts)
♦ Dynamic Nav-Aids (an innovative and dynamic presentation mode)
♦ Flexi-Zoom (increased Under and Over Zoom between chart levels, re-
sulting in optimal scale display for any situation)
♦ Dynamic Elevation Data (optimized palettes for chart plotters with 256
or more colors; includes new NOAA palette for US market)
♦ Perspective View ("Real World" perspective view of the chart, updated
real-time during navigation)
User Manual
15
Page 14

MAX and NT/NT+ C-CARD coexistence
♦ When NT
gets data from both charts (depending on the current position).
♦ When NT
+
data and MAX data cover different areas, the chart plotter
+
data and MAX data cover the same area, the chart plotter
gets data only from MAX chart.
1.6 USING C-MAP C-CARDS
The chart plotter has a built-in world map that can be used for Route planning. To
use the chart plotter as a navigation aid, charts with detailed information for the
area you wish to navigate are required. This chart cartridge is called C-CARD. See
the Chapter related to your chart plotter for inserting/removing C-CARD procedure.
NOTE During normal operations the C-CARD should not be removed since the chart
plotter may lock up.
1.7 SIMULATION MODE
The built-in Simulator function allows you to become proficient in the use of the
chart plotter. It simulates the reception of the navigation data (Lat/Lon, Course,
Speed, date, time). The simulated ship's position is placed at the current cursor
position by the time the simulation is activated. To start the Simulator:
You might insert the Speed, Heading, date and time values:
To select the Cursor Control in Chart page use the cursor up/down to adjust the
Speed and the cursor left/right to adjust the Course:
Place the cursor at your desired position + [MENU] + [MENU] + "ADVANCED"
+ [ENTER] + "SIMULATION MODE" + [ENTER] + "SIMULATION MODE" +
[ENTER] + "ON" + [ENTER]
[MENU] + [MENU] + "ADVANCED" + [ENTER] + "SIMULATION MODE"
+ [ENTER] + "SPEED"/"HEADING"/"DATE"/"TIME" + [ENTER] + enter val-
ues + [ENTER]
[MENU] + [MENU] + "ADVANCED" + [ENTER] + "SIMULATION MODE" +
[ENTER] + "CURSOR CONTROL" + [ENTER] + "ON" + [ENTER]
1.8 CONTROLLING THE DISPLAY
This paragraph describes how to change the display mode and how to move
around the chart by changing the chart scale.
Changing Display Mode
COLOR MAX 15/COLOR MAX PRO:
The selected page appears on the screen.
NOTE When the Fish Finder or Radar* is connected, other displaying pages are
(*) ONLY FOR COLOR MAX PRO/COLOR MAX WIDE E/COLOR MAX WIDE I/EXPLORER II Plus/COLOR MAX
COLOR MAX 5I/COLOR MAX 5E:
The page configuration may be different in the boxes position.
COLOR MAX 15/COLOR MAX PRO:
If you have selected a Video Input (see Par. 3.4.1), in the Chart page a window with
the picture captured from the video signal source is shown.
16 User Manual
[MENU] + [MENU] + "PAGE" + [ENTER] + select the desired page + [ENTER]
[DATA] + select the desired page + [ENTER]
available too. See the Fish Finder or Radar* User Manual for more information.
15/COLOR MAX SEALINK I/COLOR MAX SEALINK E
Page 15
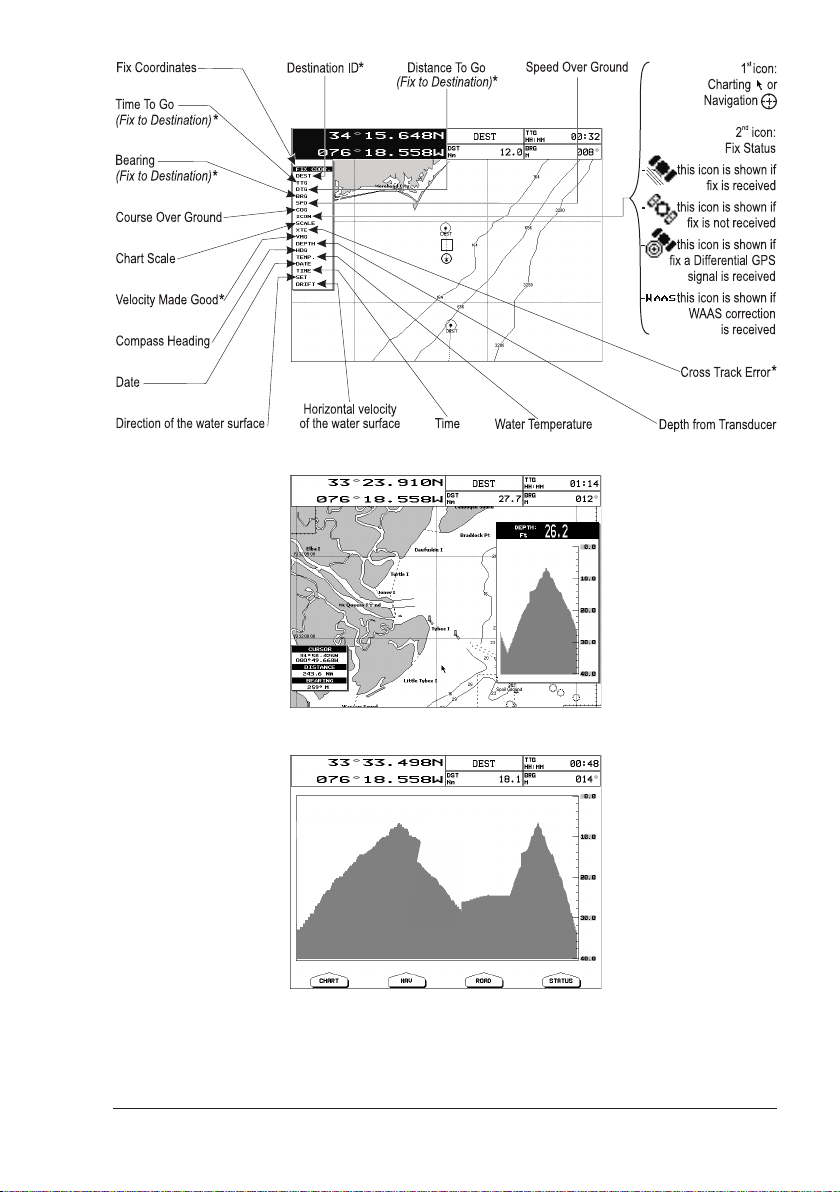
Fig.1.8 - Example of Charts and Text Area shown on the screen
Fig. 1.8a - Example of Depth Graph page
Fig. 1.8b - Example of Depth Graph Full page
User Manual
17
Page 16
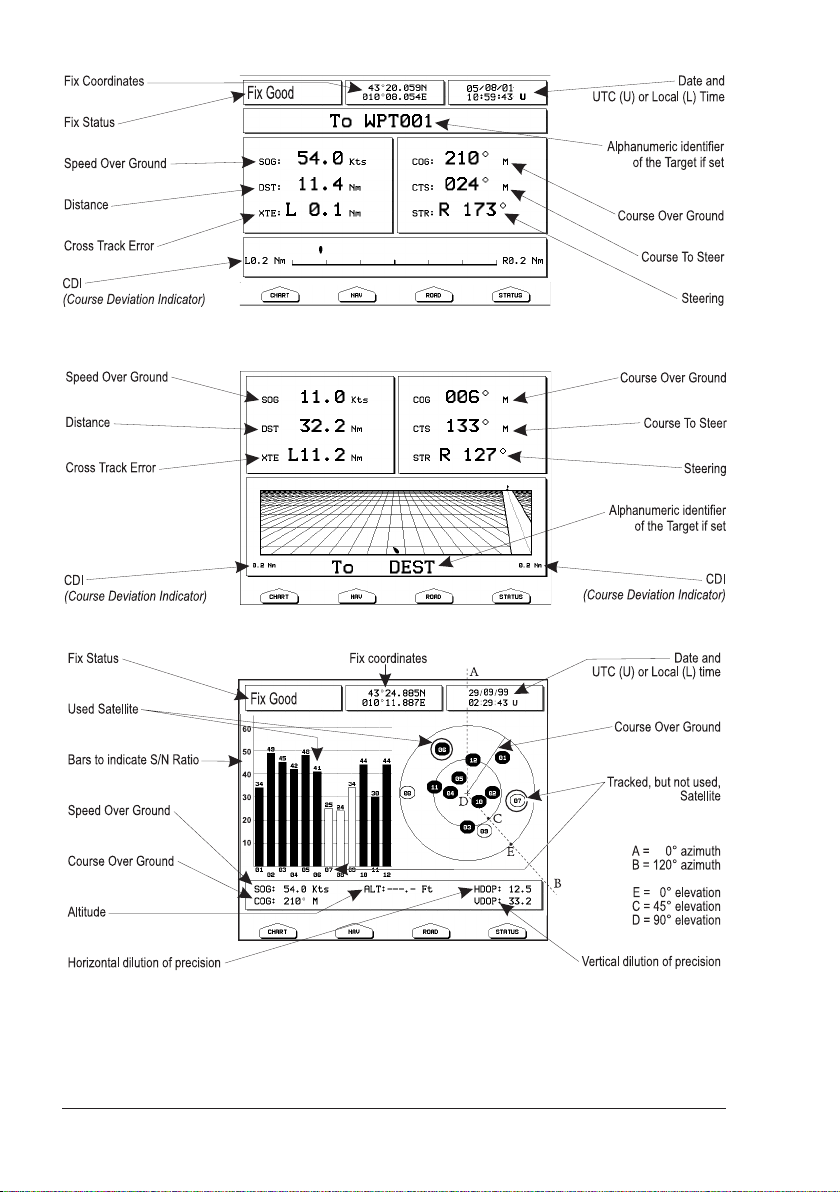
Fig. 1.8c - Example of Navigation Data page
Fig. 1.8d - Example of 3D Road page
Fig. 1.8e - Example of GPS Status page
18 User Manual
Page 17
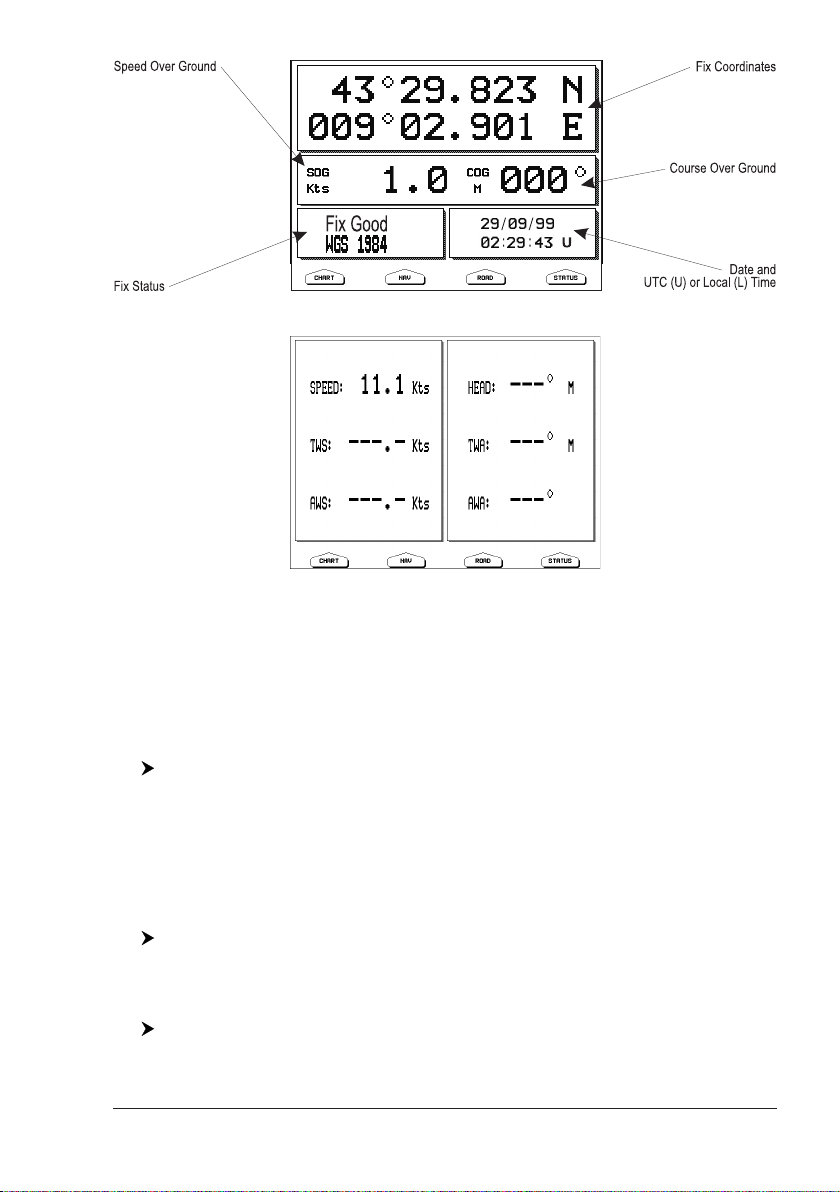
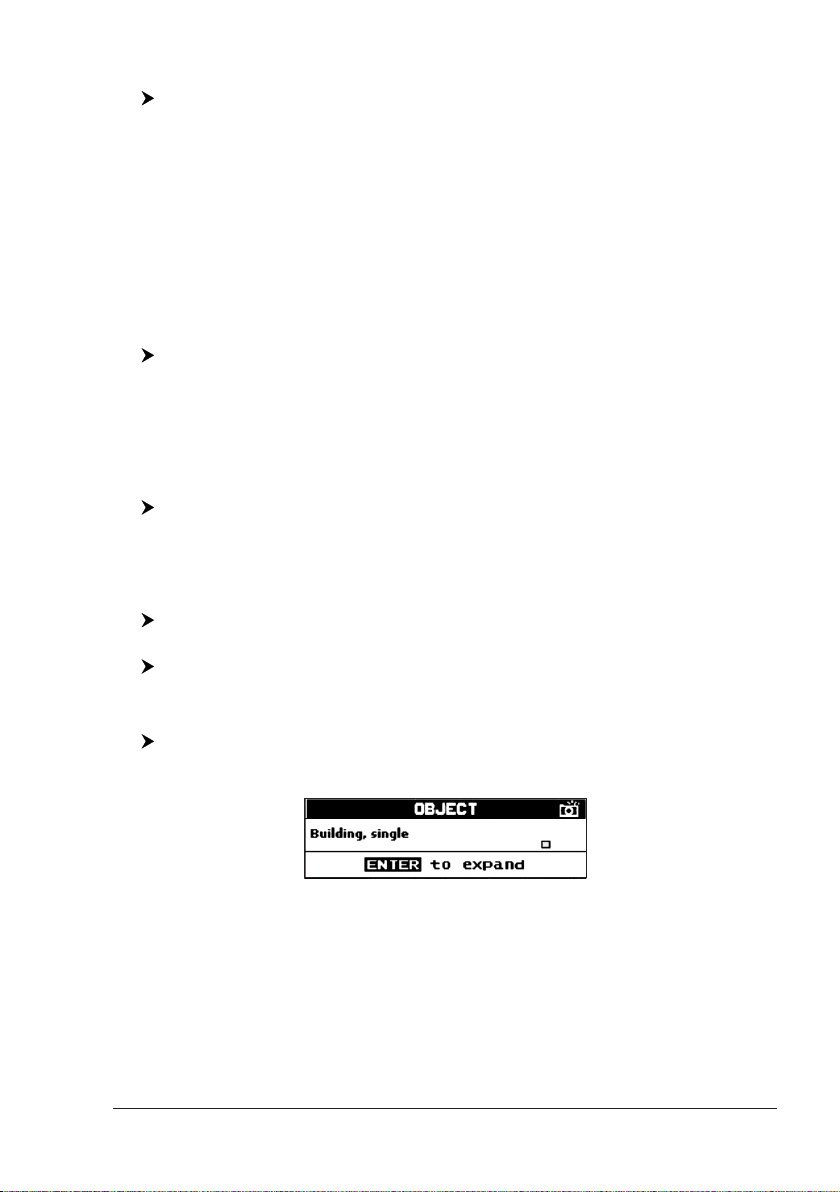
Fig. 1.8f - Example of GPS Data page
Fig. 1.8g - Example of Wind Data page
Moving around the Chart and Changing Chart Scale
Use the cursor key to move around the chart. Also use [ZOOM IN] and [ZOOM OUT]
to change the chart scale so that a smaller or larger area is shown on the chart.
Finding Your Boat Position
The most common use of the chart plotter is to show your ship's current location.
You can lock the cursor to the ship's position using:
The Home function locks the cursor to the ship and updates the display as the
[CLEAR]
ship moves.
To release the cursor from the Home Mode, use the cursor key to move the cursor
away from the ship's current position.
Selecting Screen Amplifier
In Home mode the Screen Amplifier function sets up the charts on the navigation
direction (course) in order to display more map details in front of the vessel’s position.
[CLEAR] + [MENU] + [MENU] + "DISPLAY" + [ENTER] + "SCREEN AMPLIFIER" + [ENTER] + "ON" + [ENTER]
Selecting Map Orientation
To select the orientation of your chart according to:
The available choices are North Up (the map is shown with North upwards), Head
User Manual
[MENU] + "MAP ORIENTATION" + [ENTER]
19
Page 18

Up (the map is shown with the ship's current heading upwards) and Track Up (the
map is shown with the currently selected course leg upwards).
If Head Up or Track Up has been selected, the Resolution angle can be set:
The Resolution angle, which may be selected in the range [5–60] degrees, defines
the maximum variation of the reference angle after which the map changes its orientation.
[MENU] + "MAP ORIENTATION" + [ENTER] + "HEAD UP" or "TRACK UP" +
[ENTER] + use cursor to insert values + [ENTER]
1.9 NAVIGATION TO A SINGLE DESTINATION
To place the destination at cursor coordinates and activates navigation to it:
You are now navigating to the destination drawn as a Mark with a circle around it,
labelled "DEST". A straight line is shown on the screen connecting the destination
with the ship's position. All navigation data is referred to this destination.
COLOR MAX 15/COLOR MAX PRO:
Place the cursor on location to navigate to + [ENTER] + "GOTO" + [ENTER]
Place the cursor on location to navigate to + [GOTO]
1.10 RANGE/BEARING FUNCTION
The Range/Bearing function allows to measure the Lat/Lon coordinates between
two points on the Chart page.
Inserting R/B
A dotted line and a circle appears on the screen. A window containing the distance
and bearing values is shown. The origin of the line and the circle's centre is the cursor
position: use the cursor key to move the dotted line in any direction you choose; in
the same time the radius changes. Press [ACCEPT] to confirm ([CANCEL] otherwise).
[ENTER] + "R/B" + [ENTER]
Deleting R/B
Deletes the line and the circle.
Place the cursor on existing R/B + [DELETE]
Editing R/B
Modifies the line direction and the circle radius. Use the cursor key to move the
dotted line in any direction you choose; in the same time the radius changes.
Press [ACCEPT] to confirm ([CANCEL] otherwise).
Place the cursor on existing R/B + [EDIT]
1.11 MAN OVERBOARD (MOB)
If a person or object is lost overboard and you need to return to the location, use MOB
(Man OverBoard) function. To activate the MOB function, a valid GPS fix must be available.
Inserting MOB
If MOB is already placed removes the existing MOB and places a new one.
Once inserted, the system performs the following operations:
[MOB] + [CONFIRM]
1. places the MOB icon at ship's position
2. stops navigation to an existing destination (if present)
3. sets the MOB as destination
20 User Manual
Page 19

Selecting Auto Info on MOB
An information window appears, showing the bearing and distance to the MOB position.
Place the cursor on MOB symbol
Deleting MOB
[MOB] + [CONFIRM]
User Manual
21
Page 20

22 User Manual
Page 21

2. Operations
2.1 USER POINTS: MARKS, EVENTS AND WAYPOINTS
A User Point is an object that you can place on the charts to mark a specific point.
The chart plotter features three types of User Points: Marks, Events and Waypoints. A Waypoint is created entering a Route, a Mark can be created on the
cursor's position while an Event is created on ship's position.
Creating Waypoint
See Creating a Route.
Creating Mark
The new Mark appears on your cursor's position if not in Home mode.
COLOR MAX 15:
The new Mark appears on your cursor's position.
[ENTER] + "MARK" + [ENTER]
[MARK]
Creating Event
The new Event appears on your ship's position if in Home Mode.
COLOR MAX 15:
The new Event appears on your ship's position.
[ENTER] + "MARK" + [ENTER]
[EVENT]
Editing User Point
To allow to modify name, symbol, color and position (not for Event) of the User Point.
The User Point appears on the selected position with the new symbol and color.
NOTE To select the User Point presentation:
If in Chart page:
Place the cursor on the desired User Point + [EDIT] + use the cursor key to
modify Name/Symbol/Lat-Lon (not for Event)/Color + [ACCEPT]
[MENU] + [MENU] + "DISPLAY" + [ENTER] + "USER POINTS" + [ENTER]
There are three possible choices: by selecting OFF the User Point is not shown
on the screen, otherwise by selecting ON it is shown on the Chart page shown
with symbol and name; by selecting Icon only the User Point symbol is shown.
Deleting User Point
If in Chart page:
Place the cursor on the desired User Point + [DELETE] + [CONFIRM]
If in User Points List page:
[MENU] + [MENU] + "USER POINTS" + [ENTER] + "LIST" + [ENTER] + use
The User Point is deleted.
It is also possible to delete all stored User Points. If in User Points List page:
the cursor to select the row with the desired User Point +[DELETE] + [CONFIRM]
[MENU] + [MENU] + "USER POINTS" + [ENTER] + "LIST" + [ENTER] + [DEL
ALL] + [CONFIRM]
Moving User Point
Place the cursor on the desired User Point + [MOVE] + move the cursor to the
desired position + [ENTER]
User Manual
23
Page 22

The User Point is placed on the screen at the new position.
Locating User Point on Map
If in Chart page:
[MENU] + "FIND" + [ENTER] + "USER POINTS" + [ENTER] + use the cursor
to insert name of the User Point to show on map + [ENTER]
If in User Points List page:
[MENU] + [MENU] + "USER POINTS" + [ENTER] + "LIST" + [ENTER] + use
the cursor to select the row with the desired User Point + [V
IEW]
The User Points List is closed and the map is centered on the selected User Point.
Sending/Receiving User Point
To send all User Points to an external device through the serial port:
To read User Points from the NMEA input port:
[MENU] + [MENU] + "USER POINTS" + [ENTER] + "SEND" + [ENTER]
[MENU] + [MENU] + "USER POINTS" + [ENTER] + "RECEIVE" + [ENTER]
Selecting User Points List page
To give information and allow the editing of all stored User Points:
In this page it is possible to find the User Point by entering its name:
NOTE It is not possible to edit/remove/move a Waypoint if it belongs to the active
[MENU] + [MENU] + "USER POINTS" + [ENTER] + "LIST" + [ENTER]
[MENU] + [MENU] + "USER POINTS" + [ENTER] + "LIST" + [ENTER] +
[FIND] + [ENTER] + use the cursor to insert name + [ENTER]
Route.
2.2 ROUTES
A Route is made by placing a series of Waypoints or by linking existing Marks. Among
the available Routes only one can be the Active Route, that is shown on the screen by
straight lines and arrows to indicate the direction; the first Waypoint of this Route is
surrounded by a circle. The Active Route (sometimes called current) is the working
Route: it can be edited by adding, removing or moving Waypoints.
Selecting Active Route
[MENU] + [MENU] + "ROUTE" + [ENTER] + "SELECT" + [ENTER] + use the
cursor key to highlight the Route + [SELECT]
The Route, shown by straight segments, is centered on the screen, with the cursor on the central Waypoint. This will then allow you to quickly work out which
Route you have selected.
When you want to create a new Route, select an open Route position in the list
using the above procedure.
Creating a Route
To create a new Route:
COLOR MAX 15:
This places the first Waypoint of the new Route on your cursor position. If a Mark
is present under the cursor position, the Mark is linked to the Route. To place the
next Waypoints of the Route repeat the above procedure.
The following functions work on the Active Route.
24 User Manual
Place the cursor + [ENTER] + "WAYPOINT" + [ENTER]
Place the cursor + [ROUTE]
Page 23

Inserting notes on Route
To insert a comment on the selected Route:
Another window is shown: use the cursor key to insert the notes (this is possible only
if you have already created a Route). Press [ENTER] to confirm ([CANCEL] otherwise).
[MENU] + [MENU] + "ROUTE" + [ENTER] + "SELECT" + [ENTER] + use the
cursor key to highlight the Route + [NOTES]
Hiding or Showing Route
To hide or show the selected Route on the screen:
[MENU] + [MENU] + "ROUTE" + [ENTER] + "SELECT" + [ENTER] + use the
cursor key to highlight the Route + [H
IDE]/[SHOW]
Selecting Route Color
To select Route legs color among the eight available colors:
The Route is drawn on the screen in the selected color. It is possible to select a
different color for any Route.
If in Route menu page:
[MENU] + [MENU] + "ROUTE" + [ENTER] + "COLOR" + [ENTER] + use the
cursor key to select color + [A
CCEPT]
If in Select Route menu:
[MENU] + [MENU] + "ROUTE" + [ENTER] + "SELECT" + [ENTER] + use the
cursor key to highlight the Route + [C
color + [ACCEPT]
OLOR] + use the cursor key to select
Deleting Route
If in Route menu:
The Route legs and Waypoints are deleted. The Marks linked to the Route are not
[MENU] + [MENU] + "ROUTE" + [ENTER] + "DELETE" + [ENTER] + [ACCEPT]
deleted. If the destination is placed on the Route, that Route cannot be deleted.
Following a Route (Activate the Navigation)
With the Route shown on the Chart page, move the cursor to the starting Waypoint in the Route and press [ENTER], select "GOTO" and press [ENTER] again.
COLOR MAX 15/COLOR MAX PRO:
move the cursor to the starting Waypoint in the Route and press [GOTO].
The destination is placed on the Waypoint of the selected Route and you are now
navigating to it.
Inserting Waypoint
To insert a new Waypoint between two existing ones:
The new Waypoint is placed.
To add a new Waypoint to the last Waypoint of the Route:
COLOR MAX 15:
Place the cursor on the desired Route leg + [INSERT] + move the cursor to the
new position + [ENTER]
Place the cursor + [ENTER] + "WAYPOINT" + [ENTER]
Place the cursor + [ROUTE]
Reversing Route
To generate a new route reversing an existing one.
User Manual
If in Route Data Report page:
25
Page 24

The Route is then followed in reverse order, with Waypoints renumbered accord-
[MENU] + [MENU] + "ROUTE" + [ENTER] + "REPORT" + [ENTER] + [REVERSE]
ingly. If the destination is placed on the Route, that Route cannot be reversed.
Selecting Route Report page
To give information on Waypoints belonging to the selected Route:
In this page it is possible to modify the Speed and Fuel consumption values:
[MENU] + [MENU] + "ROUTE" + [ENTER] + "REPORT" + [ENTER]
[MENU] + [MENU] + "ROUTE" + [ENTER] + "REPORT" + [ENTER] + [SPEED]/
[FUEL] + use the cursor to insert values + [ENTER]
Sending Route
To transmit the Active Route information onto the NMEA output port.
The NMEA WPL & RTE messages are sent to the output port.
[MENU] + [MENU] + "ROUTE" + [ENTER] + "SEND" + [ENTER]
Receiving Route
To save Route information received from the NMEA input port.
The received route is saved on the Active route, overwriting it. The NMEA WPL &
RTE messages are sent to the input port.
[MENU] + [MENU] + "ROUTE" + [ENTER] + "RECEIVE" + [ENTER]
2.3 GOTO FUNCTION
This functions allows you to place the destination point and immediately start
navigating to it.
Navigation to Waypoint
or simply:
COLOR MAX 15/COLOR MAX PRO:
A circle surrounds the Waypoint symbol. A dotted line is shown, connecting the
destination with the ship's position. When the destination is placed, all navigation
data are referred to it.
Place the cursor on the desired Waypoint + [ENTER] + "GOTO" + [ENTER]
Place the cursor on the desired Waypoint + [GOTO]
Place the cursor on the desired Waypoint + [GOTO]
Deleting destination
If the destination has been placed, to stop the navigation to the Waypoint:
NOTE If you press [N
Otherwise when the cursor is placed on a generic position on the chart:
NOTE If you press [S
The symbol that identifies the destination disappears from the screen, but the
Waypoint remains.
Place the cursor on destination icon + [STOP]
Waypoint in the Route.
[ENTER] + "GOTO" + [ENTER] + [STOP]
EXT]/[PREV] the destination icon is moved on the next/previous
TART], the destination icon is moved on the new cursor position.
2.4 USING TRACK
A very useful feature of the chart plotter, is the ability to store and display exactly
26 User Manual
Page 25

where the boat has been. This feature, referred to as Tracking, can provide invaluable information about the effect of tide and wind influence on the boat's
progress as well as giving an indication of the helmsman's performance.
When full storing capacity has been reached, the oldest points are deleted and
overwritten by the newest ones.
Setting up a Track Step
Before you use the Track function, it is important to specify the Track step unit: if
you select Distance, the Track point is placed when the distance from its last
stored position is greater than the defined distance; if Time, the Track point is
placed after the defined time.
COLOR MAX 15:
You can select the Track step Time [1, 5, 10, 30 sec, 1 min] or distance [0.01,
0.05, 0.1, 0.5, 1.0, 2.0, 5.0, 10.0] Nm. Setting a short time/distance interval
between Track points is best suited to navigate within a close or complex environment, a greater time/distance interval is best suited to a long voyage.
To select the interval at which the Track points are placed.
If you have selected Distance:
COLOR MAX 15:
If you have selected Time:
COLOR MAX 15:
[MENU] + [MENU] + "TRACK" + [ENTER] + "CONFIG" + [ENTER] + "STEP
UNIT" + [ENTER]
[TRACK] + "CONFIG" + [ENTER] + "STEP UNIT" + [ENTER]
[MENU] + [MENU] + "TRACK" + [ENTER] + "CONFIG" + [ENTER] + "DISTANCE STEP" + [ENTER]
[TRACK] + "CONFIG" + [ENTER] + "DISTANCE STEP" + [ENTER]
[MENU] + [MENU] + "TRACK" + [ENTER] + "CONFIG" + [ENTER] + "TIME
STEP" + [ENTER]
[TRACK] + "CONFIG" + [ENTER] + "TIME STEP" + [ENTER]
Selecting Track Color
You can select among 8 different line colors that you choose for the Track:
COLOR MAX 15:
The same Track can be saved with any color.
[MENU] + [MENU] + "TRACK" + [ENTER] + "CONFIG" + [ENTER] + "COLOR"
+ [ENTER]
[TRACK] + "CONFIG" + [ENTER] + "COLOR" + [ENTER]
Displaying Track
To enable or disable the Track displaying on the map screen:
COLOR MAX 15:
[MENU] + [MENU] + "TRACK" + [ENTER] + "CONFIG" + [ENTER] + "DISPLAY MODE" + [ENTER] + "VISIBLE"/"HIDDEN" + [ENTER]
[TRACK] + "CONFIG" + [ENTER] + "DISPLAY MODE" + [ENTER] + "VISIBLE"/"HIDDEN" + [ENTER]
Activating/Deactivating Track Recording
To activate or deactivate the Tracking of the vessel while the vessel is moving:
User Manual
[MENU] + [MENU] + "TRACK" + [ENTER] + "ACTIVATE"/"DEACTIVATE"
+ [ENTER]
27
Page 26

COLOR MAX 15:
[TRACK] + "ACTIVATE"/"DEACTIVATE" + [ENTER]
Clearing Track
All the Track or part of it can be cleared from the screen:
COLOR MAX 15:
[BEGIN], [END] and [WHOLE] allow to identify the start or the end point of the segment to delete.
[MENU] + [MENU] + "TRACK" + [ENTER] + "DELETE" + [ENTER]
[TRACK] + "DELETE" + [ENTER]
Selecting Track Number
The chart plotter has the capability to store up to 5 Tracks. To select a Track:
COLOR MAX 15:
[MENU] + [MENU] + "TRACK" + [ENTER] + "CONFIG" + [ENTER] + "ACTIVE
TRACK" + [ENTER] + use the cursor key to select the number + [ENTER]
[TRACK] + "CONFIG" + [ENTER] + "ACTIVE TRACK" + [ENTER] + use the
cursor key to select the number + [ENTER]
TRACK TO ROUTE FUNCTION
This function creates a Route from a pre-recorded Track. To select this menu:
COLOR MAX 15:
A new window appears on the screen with the following options.
Track To Route
Executes the function that converts the given Track into a Route.
COLOR MAX 15:
[MENU] + [MENU] + "TRACK" + [ENTER] + "TRACK TO ROUTE" + [ENTER]
[TRACK] + "TRACK TO ROUTE" + [ENTER]
[MENU] + [MENU] + "TRACK" + [ENTER] + "TRACK TO ROUTE" + [ENTER] +
"TRACK TO ROUTE" + [ENTER]
[TRACK] + "TRACK TO ROUTE" + [ENTER] + "TRACK TO ROUTE" + [ENTER]
Advanced menu
Allows setting the parameters used by the function Track To Route.
COLOR MAX 15:
A new window appears on the screen. The possible choices are listed in the table
below:
Select Track No. : Selects the Track input number.
Select Route No. : Selects the Route output number.
Off Course : Sets the conversion accuracy.
Dist Waypoints : Sets the minimum distance between Waypoints.
[MENU] + [MENU] + "TRACK" + [ENTER] + "TRACK TO ROUTE" + [ENTER] +
"ADVANCED" + [ENTER]
[TRACK] + "TRACK TO ROUTE" + [ENTER] + "ADVANCED" + [ENTER]
2.5 DATA WINDOW CUSTOMIZATION ON CHART PAGE
It is possible to customize the Text Area layout among OFF, Text Area with a
variable number of boxes (the number depending on the chart plotter type):
28 User Manual
[MENU] + [MENU] + "DISPLAY" + [ENTER] + "DATA WINDOW MODE" +
[ENTER]
Page 27
It is also possible to edit fields shown in every screen configuration. Edit mode is
activated directly from the chart display pressing
[MENU] hold for 3 seconds + use the cursor key to select data window to
customize + [ENTER] + use the cursor key to choose selection + [ENTER]
Once [ENTER] is pressed the data type is set. The selection window is closed and
the Text Area changes according to the selected data type. Press [CLEAR] to exit
the edit mode.
2.6 INFO
Placing the cursor on cartographic objects the information related to the object
nearby is shown.
Setting Automatic Info
Automatic Info allows you to get the information on any cartographic object just
by placing the cursor on it. You can select the type of it:
The possible settings are Off (no automatic info shown at all), On Points (only on
points e.g. Rocks, Buoys, Lights, Tide Stations) and On All (on all objects, points,
lines and areas).
NOTE Choosing "On All" the Automatic Info will be shown most of the times the
[MENU] + [MENU] + "DISPLAY" + [ENTER] + "Auto Info" + [ENTER]
cursor is moved.
Selecting Automatic Info
The pop-up window with the basic info of the objects is displayed. To get full
details of the object press [EXPAND].
Move the cursor on the object
Displaying Expanded Info page (Full Info)
To show the Expanded Info page:
COLOR MAX 15/COLOR MAX PRO:
Place the cursor on objects + [MENU] + "INFO" + [ENTER]
Place the cursor on objects + [INFO]
Info on objects with Pictures
To get the information on objects with pictures.
On the Quick Info, if at least one of the objects found has one or more pictures
associated, there will be a camera icon on the top bar of the window.
On the Full Info, there will be the small camera icon on a corner of the square
containing the object icon or a big photo icon centered on the square for the
object without icon.
Move the cursor on the object
Fig. 2.6 - Example of Quick Info on objects with picture
User Manual
29
Page 28
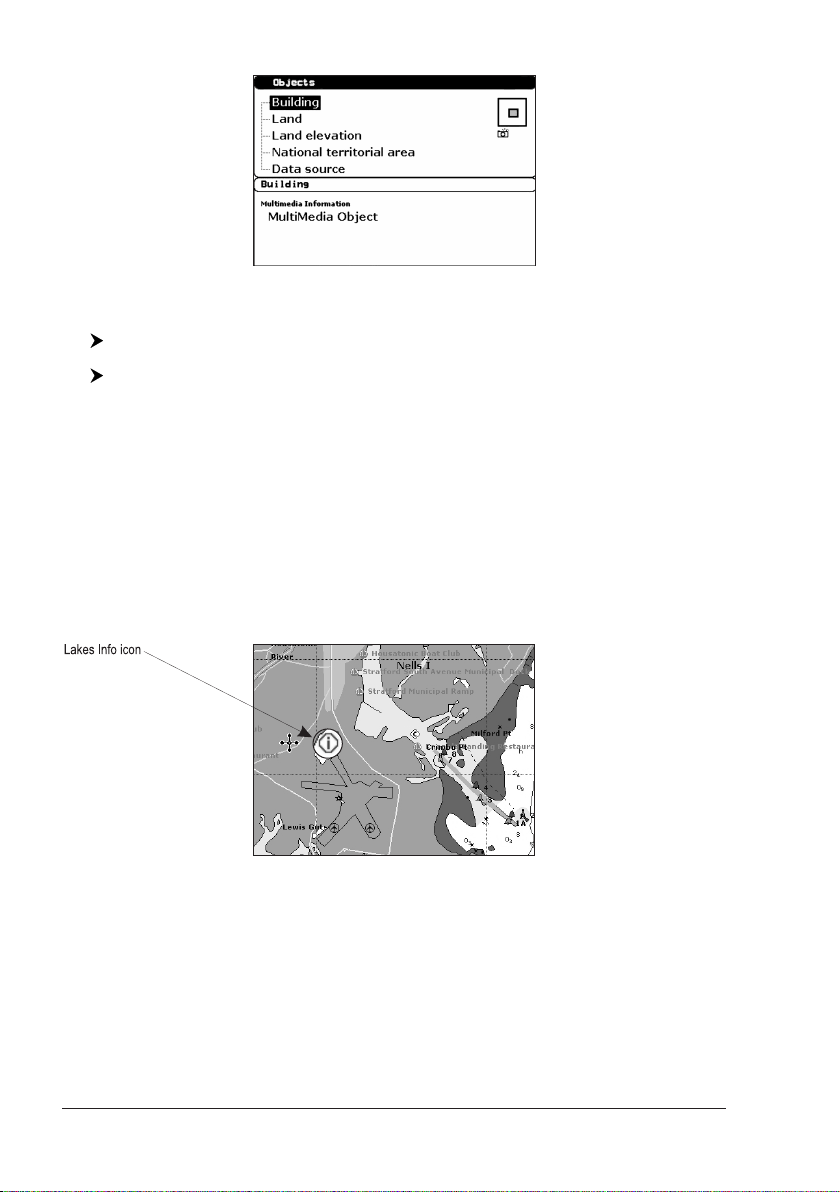
Fig. 2.6a - Example of Full Info on objects window with picture icon
To see pictures:
To change size:
Press [PICTURE] when the object with a picture is highlighted
Press [ENTER] when the picture is shown.
Info Tree and Expanded Info page
The upper side of the page contains the Info Tree and the Lower side contains the
expanded information. While moving the cursor through the Info Tree, all the relevant information of the selected object is shown on the lower part of the page. By
pressing [CLEAR] the page is closed. If the information shown on the Lower part
of the page exceeds the page size, you may scroll the page using [PAGE DN]. Use
[HOME] to get back to the first page. When the selected object is a Tide Station, by
pressing [ENTER] the Tide page is shown.
Quick Info on Lakes
Upon viewing the chart of a lake, you will click on to query the available information
immediately displayed with many details. For example, see the following picture:
Fig. 2.6b - Example of Lakes info
When the cursor is placed over the icon, the icons of the available services are
shown:
30 User Manual
Page 29
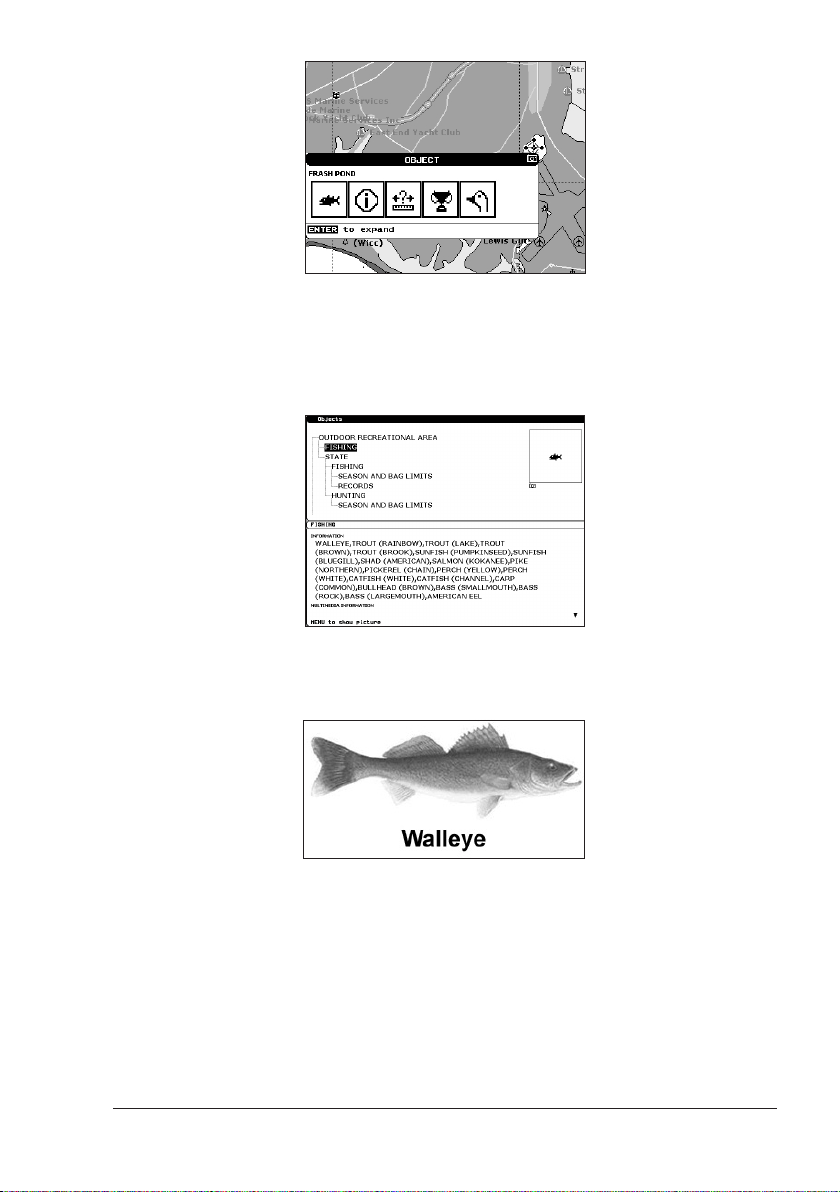
Fig. 2.6c - Quick Info: available services
If you press [ENTER] all available information about the cartographic point under
the cursor will be shown. See the next paragraph.
Full Info on Lakes
The following is an example of Full Info on Lakes:
Fig. 2.6d - Example of Full Info page
To see the "Fishing" object press [MENU] (when the "Fishing" object is highlighted). On the screen appears:
Fig. 2.6e - Example of picture associated to the Fishing object
2.7 PORT & TIDE INFO
Getting Port Info
The object Port Marina contains the information about the services available on
the selected Port Marina and the area around it. To get info on Port Marinas, move
the cursor on the Port Info icon.
User Manual
31
Page 30
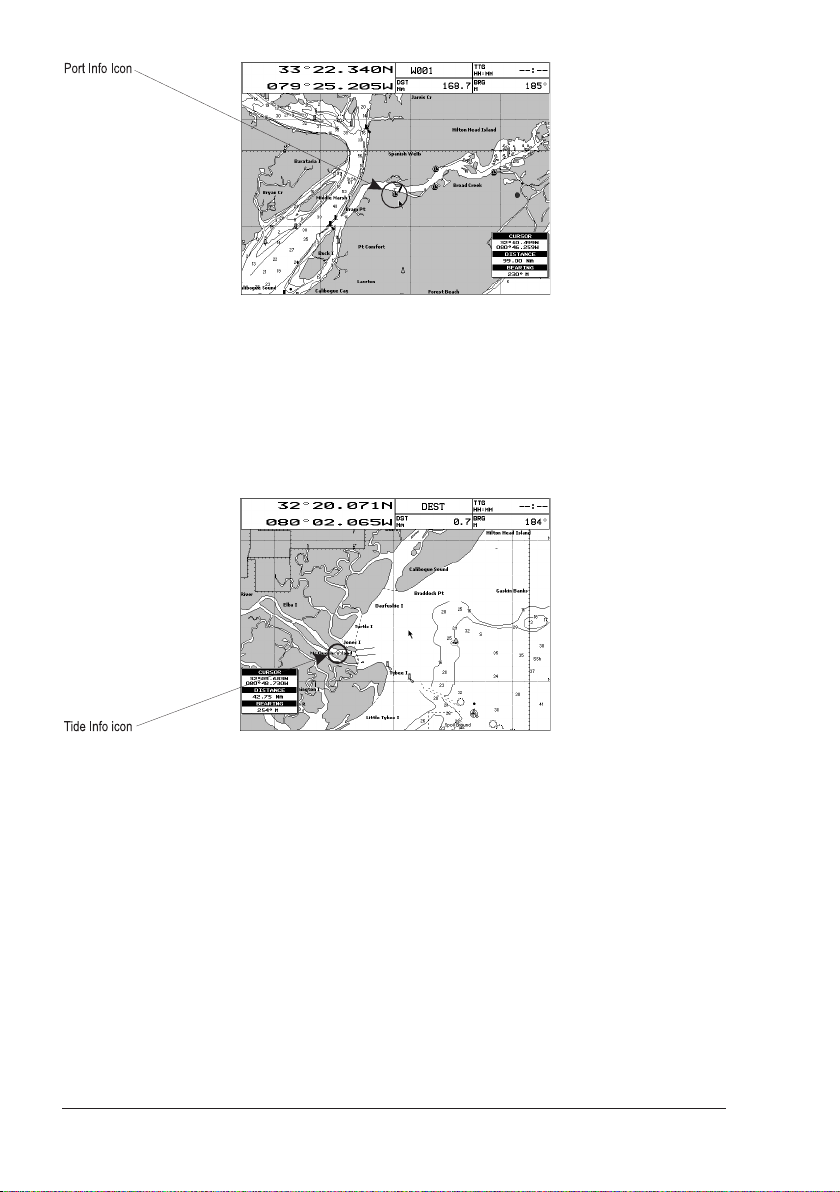
Fig.2.7 - Port Info icon
The available information is shown in the Automatic Info window where icons of
the available services are shown. To expand information about that object press
[EXPAND] and to expand all available information and get the details on each service of the Port Marina for that cartographic point press [EXP ALL].
NOTE Port Info icon is visible only if the Ports + Services option is On (see Par. 4.1).
Getting Tide Info
By placing the cursor over the Tide Station icon
Fig. 2.7a - Tide Info icon
the chart plotter pops-up the relative automatic info window and allows displaying
a graphical page with the tides prediction of the selected object.
Press [EXPAND] to display the Tide Graph page (otherwise, press [EXP ALL] to select
all available information). It shows the Tide height variations during the 24 hours
at any given day.
32 User Manual
Page 31

Fig. 2.7b - Tide Graph page
This screen shows that day's Tide Height graph for the area where the Tidal
symbol was located. Using [ZOOM IN] and [ZOOM OUT] it is possible to display
future or past tides. If you wish to quickly display the tide for a specific date,
press [ENTER] and enter the required date using the cursor key followed by
[ENTER] once the date is set. Using [MENU] it is possible to change time selecting
between Standard and Daylight saving. To simplify reading the graph, the chart
plotter displays a moveable Vertical and Horizontal slider which can be moved
using the cursor key. Using the up/down cursor key, move the horizontal slider to
correspond with the draft of your boat. Using the Vertical slider you can then read
the times at which the graph dips below the horizontal line i.e. the times when
you will be in danger of grounding.
NOTE Tide graph is an approximation of the tide and they should be used in
conjunction with traditional tide tables and navigational methods. The Tide
height value represents the variation relative to the "Mean Lower Water"
value.
2.8 FIND FUNCTION
The Find function allows searching for the nearest Port, Port Services, Tide Stations, Wrecks, Obstructions, Points Of Interest and Lakes loaded on the C-CARD.
When the Find function is activated a list of available objects to search is shown.
Also the Find function allows to center the screen over a selected User Point, on
the Cursor position or at desired Coordinates.
NOTE Activating the Find function a Warning message is shown if there is no C-CARD
Finding Nearest Port Services
To show the nearest port services of a particular type (i.e. the nearest Hospital,
sailmaker, bank, etc.).
The icons list of the available services is shown. Use the cursor key to select any
facility and press [ENTER] or [FIND]. By selecting one of the facilities the list of the
nearest ports (up to 10) in which this port facility is present, will be shown.
inserted.
[MENU] + "FIND" + [ENTER] + "PORT SERVICES" + [ENTER]
Finding Nearest Port By Name
To select the Port By Name function:
Shows the list of all ports stored on the C-CARD in alphabetical order and allows
to search port by name to locate the port on the map.
User Manual
[MENU] + "FIND" + [ENTER] + "PORT BY NAME" + [ENTER]
33
Page 32

Finding Nearest Port By Distance
To select the Port By Distance function:
Shows the list of all ports stored on the C-CARD in closest distance order and
allows to locate the port on the map.
[MENU] + "FIND" + [ENTER] + "PORT BY DISTANCE" + [ENTER]
Finding Nearest Tide Station
To show the nearest Tide Stations to the boat position (or to the cursor position if
the position fix is not received).
After a few seconds a window appears. Choose the Tide Station you want and
press [ENTER] or [FIND] to display the Tide Graph page. Press [CLEAR] to display
the Tide Station chosen.
[MENU] + "FIND" + [ENTER] + "TIDE STATIONS" + [ENTER]
Finding Nearest Wrecks
To show the Nearest Wrecks loaded in the C-CARD:
Choose the Wrecks you prefer and press [ENTER] or [FIND] to locate the selected
Wreck on the map.
[MENU] + "FIND" + [ENTER] + "WRECKS" + [ENTER]
Finding Nearest Obstructions
To show the Nearest Obstructions loaded in the C-CARD:
Choose the Obstructions you prefer and press [ENTER] or [FIND] to locate the
selected Obstruction on the map.
[MENU] + "FIND" + [ENTER] + "OBSTRUCTIONS" + [ENTER]
Finding Cursor
To center the cursor on the screen:
[MENU] + "FIND" + [ENTER] + "CURSOR" + [ENTER]
Finding Nearest Lakes Information
Searches for Nearest Lakes Info:
It founds the Outdoor Recreational Area objects. See the following picture:
[MENU] + "FIND" + [ENTER] + "LAKES INFO" + [ENTER]
Fig. 2.8 - Outdoor Recreational Area objects
Use the cursor key to select any objects and press [ENTER]. The list of the nearest lakes containing the facility will be shown on the screen.
34 User Manual
Page 33

Fig. 2.8a - Nearest Lakes list
Then choose the lake you want and press [ENTER]: the Full Info page is shown.
Finding Nearest Lakes By Name
To select the lakes By Name function:
Shows the list of all lakes stored on the C-CARD in alphabetic order. Pressing
[MENU] to insert the Lake name.
[MENU] + "FIND" + [ENTER] + "LAKES BY NAME" + [ENTER]
Finding Nearest Points Of Interest
Searches for Nearest Points Of Interest:
A sub-menu is opened to find different categories of Points Of Interest.
[MENU] + "FIND" + [ENTER] + "POINTS OF INTEREST" + [ENTER]
Finding Coordinates
To center the map at given coordinates:
[MENU] + "FIND" + [ENTER] +"COORDINATES" + [ENTER] + use the cursor
to insert coordinates + [CLEAR]
Finding User Points
To search the User Point by name:
[MENU] + "FIND" + [ENTER] + "USER POINTS" + [ENTER] + use the cursor
to insert name of the Waypoint to show on map + [ENTER]
2.9 ALARMS
The chart plotter provides alarms for various functions. You can enter the desired
alarm range for each function.
Auto Off
To set the automatic shutdown of the alarms when the alarm condition disappears.
[MENU] + [MENU] + "ALARMS" + [ENTER] + "AUTO OFF" + [ENTER]
Arrival Alarm
To set an acoustic alarm to sound when the vessel is approaching the destination.
[MENU] + [MENU] + "ALARMS" + [ENTER] + "ARRIVAL ALARM" + [ENTER]
XTE Alarm
To set an acoustic alarm to sound when the vessel is deviating from a defined course.
User Manual
[MENU] + [MENU] + "ALARMS" + [ENTER] + "XTE ALARM" + [ENTER]
35
Page 34

Anchor Alarm
To set an alarm to sound when the ship moves off the current ship's position location.
NOTE By the time the Anchor Alarm is set the current ship's position is saved as
[MENU] + [MENU] + "ALARMS" + [ENTER] + "ANCHOR ALARM" + [ENTER]
origin position. The alarm goes off when the ship moves away from the origin
position more than the entered alarm range.
Depth Alarm
To set an acoustic alarm to sound when the received depth value (from the depth
transducer) is too shallow.
[MENU] + [MENU] + "ALARMS" + [ENTER] + "DEPTH ALARM" + [ENTER]
Heading Alarm
To activate the Heading Alarm:
[MENU] + [MENU] + "ALARMS" + [ENTER] + "HEADING ALARM" + [ENTER]
Grounding Alarm
To verify potential danger to navigation such as shallow water (depth areas),
intertidal areas, land, rocks, obstructions and shoreline constructions. The maps
are scanned every 10 seconds.
If any of the above objects are found, the chart plotter notifies the danger on a
dedicated warning message box. The active "Grounding Alarms" are shown in the
Grounding Alarm Report page.
To activate the Grounding Alarm:
[MENU] + [MENU] + "ALARMS" + [ENTER] + "GROUNDING ALARM" +
[ENTER]
The chart plotter scans a sector in front of the boat. The direction is determined
by the current boat heading. You can select the length and its angle is 30 degrees.
The Grounding Alarm is switched Off by default after a Master Reset.
Grounding Depth Limit
To enter the minimum depth:
[MENU] + [MENU] + "ALARMS" + [ENTER] + "GROUNDING DEPTH LIMIT"
+ [ENTER]
Grounding Alarm Range
To set the length of the sector to be detected among 0.25, 0.5, 1.0 Nm.
[MENU] + [MENU] + "ALARMS" + [ENTER] + "GROUNDING ALARM RANGE"
+ [ENTER]
Grounding Alarm Report
To display the report of the dangerous objects currently detected.
When any of the searched objects is found in the scanned area, a tick marker is
printed on the relative box to identify which dangerous objects have been currently
detected. Once the alarm condition is no longer present, the relative tick marker is
removed.
NOTE The alarm "No data available" is shown when no specific cartographic data are
COLOR MAX 5I/COLOR MAX 5E/COLOR MAX 15/COLOR MAX PRO:
[MENU] + [MENU] + "ALARMS" + [ENTER] + "GROUNDING ALARM REPORT"
+ [ENTER]
found on the C-CARD or when no C-CARD is inserted.
External Alarm
When any alarm condition occurs the pin is switched from High Impedance to
ground. This signal can be used by an external device (as a hooter or buzzer).
36 User Manual
Page 35

[MENU] + [MENU] + "ALARMS" + [ENTER] + "EXTERNAL ALARM" + [ENTER]
COLOR MAX 15:
Timer Alarm Menu
The Timer Alarm is activated when the defined time is expired. The Timer Value
and the counter direction can be set by the user.
The possible choices are listed in the table below:
[MENU] + [MENU] + "ALARMS" + [ENTER] + "TIMER ALARM" + [ENTER]
Timer Alarm : Starts (On) or Stops (Off) the Timer Alarm counter.
Timer Value : Enter the Timer Value (Hours Minutes Seconds Range 00:00:01 - 23:59:59).
Timer Reset : Reset the Timer Value.
Timer Direction : Set the Timer Direction UP or DOWN: when Timer Direction is set UP, the timer start from zero
and increases its value; the alarm is activated when the timer reaches the Timer Value entered
by the user. When Timer Direction is set DOWN, the count-down starts from the value set by the
user and decreases it's value. The Alarm is activated when the Timer value goes to zero.
2.10 USER C-CARD
The chart plotter allows to back up Marks, Routes and Tracks to a User C-CARD.
You can also restore the data to internal memory at a later time. This allows
virtually unlimited storage. The User C-CARD data storage is organized as a file
system.
User C-CARD page
To display the content of a User C-CARD inserted into the C-CARD slot of your
chart plotter:
[MENU] + [MENU] + "USER C-CARD" + [ENTER]
Fig.2.10 - User C-CARD Menu
Formatting User C-CARD
In order to be able to use a new User C-CARD you must format it first. This
operation prepares the User C-CARD to receive and store information:
[MENU] + [MENU] + "USER C-CARD" + [ENTER] + [CARTRIDGE] + [FORMAT]
NOTE When a User C-CARD is formatted, all data saved on it will be deleted.
Saving File on User C-CARD
[MENU] + [MENU] + "USER C-CARD" + [ENTER] + [SAVE] + select the file
type to insert by using related soft key + insert the file name and type +
When a certain type of data (Mark, Events, Route, Track) is saved, a new file is
created on a User C-CARD. The file contains all points of the selected type currently stored in the internal memory.
User Manual
[ENTER]
37
Page 36

♦ Save Marks : to create a new file containing all Marks stored in the chart
plotter
♦ Save Events: to create a new file containing all Events stored in the chart
plotter
♦ Save Routes: to create a new file containing all Waypoints belonging to the
selected Route (Route number is required)
♦ Save Tracks : to create a new file containing all Track points belonging to
the selected Track (Track number is required)
NOTE When naming a file, you may have trouble finding a name that uniquely identifies
the file's contents. Dates, for example, are often used in filenames; however,
they take up several characters, leaving you with little flexibility. The secret is
to find a compromise, a point where you can combine a date with a word, creating
a unique filename. The maximum length of the filename is 8 characters. The
characters may be numbers (0, ..., 9), letters (A, ..., Z) and spaces (for example
legal identifiers are "ABC", "AA", "12121212", "A B C", "1 A 1", and so on.
Loading File from User C-CARD
[MENU] + [MENU] + "USER C-CARD" + [ENTER] + Select the file name in the
list + [L
The Load function copies the content of the selected file from User C-CARD to the
internal memory of the chart plotter. If the selected file contains Marks/Events
already present in the chart plotter memory, they are non duplicated. It is required to insert the number of the Route/Track on which loading data: if the
Route/Track is not empty, it is overwritten.
OAD]
Deleting File from User C-CARD
To remove files.
NOTE Remember that this option permanently erases the file.
COLOR MAX 6/EXPLORER II PLUS/COLOR MAX 15/COLOR MAX SEALINK I/
COLOR MAX SEALINK E/COLOR MAX PRO:
[MENU] + [MENU] + "USER C-CARD" + [ENTER] + [DELETE] + [CONFIRM]
Selecting Slot
To select the preferred slot where to insert the User C-CARD. If the User C-CARD
is not present in the selected slot, a warning message appears.
[MENU] + [MENU] + "USER C-CARD" + [ENTER] + [CARTRIDGE] + [SLOT]
Reading User C-CARD directory
To show the list of the files present on the User C-CARD inserted into the slot:
[MENU] + [MENU] + "USER C-CARD" + [ENTER] + [CARTRIDGE] + [READ]
Sorting User C-CARD directory
To order the file directory:
This is possible in three different modes:
[MENU] + [MENU] + "USER C-CARD" + [ENTER] + [CARTRIDGE] + [SORT BY]
♦ Name : to order by the filename press [NAME]
♦ Time : to order by the time of file creation press [TIME]
♦ Type : to order by the type of data press [TYPE]
38 User Manual
Page 37

3. User Setting Up
3.1 GENERAL MENU
To set the general settings:
The possible selections are listed in the table below:
Language : Selects the language for screen labels, menus and options; the map information remain on
Dist & Speed Unit : Selects the unit for Distance and Speed among Nm & Kts, Sm & Mph, Km & Kph.
Depth unit : Selects the unit among Ft, FM and Mt.
Altitude Units : Selects the unit among Ft, FL and Mt.
Temperature Units : Selects the unit among °C and °F.
Time Reference : Allows switching between UTC or local time, by entering the Local Time offset.
Time Format : Selects the format for the time between 12 and 24 hours.
Date Format : Selects the Date Format between MM-DD-YY (month-day-year) and DD-MM-YY (day-
Nav-Aids Presentation : Allows to set the Nav Aids presentation as US (Draw Nav-Aids using NOAA symbology) or
Keypad Beep : Enables or disables the single audio beeps emitted any time the chart plotter keypad is
Cursor Speed : Selects the Cursor Speed among Low, Medium or High in Chart page or into menu.
3.2 MAP MENU
[MENU] + [MENU] + "GENERAL" + [ENTER].
the language as in the official paper charts .
month-year).
INTERNATIONAL (Draws Nav-Aids using international symbology). When selected it
affects Lights, Signals, Buoys & Beacons display.
pressed. If the incorrect key is pressed or the function required cannot be executed, the chart
plotter emits three beeps.
ZOOM TYPE
Allows larger expansion or compression of the chart scale while zooming in or out.
Zoom Type has two options; STANDARD (default) or FLEXI-ZOOM. When in FLEXIZOOM mode, a short [ZOOM...] push causes a change of chart, whilst a long
[ZOOM...] push (press and hold) causes a pop-up window to be displayed on a
corner of the screen. The window shows the current Zoom Factor. By pressing
[ZOOM IN]/[ZOOM OUT] the map is expanded or compressed according to the
zoom factor selected. The Window is automatically closed if [ZOOM...] is not
pressed for 2 seconds and the selected zoom factor will be used at the next zoom
in/out.
[MENU] + "ZOOM TYPE" + [ENTER]
FONTS & SYMBOLS
On MAX charts it is possible to set the size of all names and symbols drawn on the
charts, selecting between Normal size (the regular characters size) and Large
size.
User Manual
[MENU] + "FONTS & SYMBOLS" + [ENTER]
39
Page 38

NORMAL size
Fig. 3.2 - Example of Normal size font (on the left side) and Large size font (on the right side) settings
LARGE size
PERSPECTIVE VIEW
Chart data may be projected in perspective mode during navigation. This function
allows setting the panoramic View of the chart. As the upper side of the map is more
compressed than the lower side, a wider map area is visible. The perspective view
allows showing more chart information immediately ahead and around the cursor.
[MENU] + "PERSPECTIVE VIEW" + [ENTER]
Fig. 3.2a - Perspective View
DYNAMIC NAV-AIDS
This function allows settings blinking lights on Nav-Aids. The blinking period and
color of each Nav-aid is read from the Nav-Aid attributes available on the data
cartridge. When the ship is inside the Nav-Aid nominal range, the light of the NavAid will start blinking.
NOTE When Dynamic Nav-Aids option is set to On, when the flashing light is Off, or
[MENU] + "DYNAMIC NAV-AIDS" + [ENTER]
when fix position is out of the sector, the light color is displayed by using a
faint light color.
MAP ORIENTATION
The possible choices are listed in the table below:
North Up : The map is shown with North upwards.
Head Up : The map is shown with the ship's current heading upwards. If Head Up is selected, it is possible
40 User Manual
[MENU] + "MAP ORIENTATION" + [ENTER].
to set the Map Orientation Resolution angle in the range [5, 60] degrees.
Page 39

Track Up : The map is shown with the currently selected course leg upwards. If Track Up is selected, it is
possible to set the Map Orientation Resolution angle in the range [5, 60] degrees.
MIXING LEVELS
When the map coverage at the current zoom level does not fill the entire screen,
the chart plotter draws the rest of the map expanding the cartographic information read from, at most, two zoom levels above the current zoom level. For this
reason the map is drawn three times: firstly it draws the two levels before the
current level and then the current level. The area covered by the cartographic
data read from the previous levels is identified by a dotted pattern. When the
cursor is moved on an area not covered by data of the current level the chart
plotter zooms out to the first level covered by cartographic data.
NOTE The Mixing Levels function works only with the new C-CARDs. It also affects
[MENU] + "MIXING LEVELS" + [ENTER]
the speed of the redraw of the screen. If this function is not used it may be
disabled.
SAFETY STATUS BAR (DSI = DATA SAFETY INDICATOR)
The possible choices are listed in the table below:
On : The Safety Status Bar is shown.
Off : The Safety Status Bar is not shown.
Icon : The Safety Status Bar is not shown, but a Warning alarm Icon is shown in the bottom right corner
When Safety Status Bar is On, a status bar with six boxes showing the status of
certain functions is displayed. Any warning or alarm condition is identified by the
red color to indicate possible risk.
[MENU] + "SAFETY STATUS BAR" + [ENTER]
of the display when an item controlled by the DSI (Data Safety Indicator) is under an alarm
condition. The Warning Icon remains displayed until the alarm condition persists. By placing the
cursor over this Icon, a quick help message is shown next to the Icon, allowing to show the Safety
Status Bar. In this case - when the Safety Status Bar is opened via Warning alarm Icon - it is
possible to obtain information about each “active” Safety Status box (the red ones): it is possible
to select them by cursor movement left/right, and a list of active alarms is shown underneath the
selected box. By pressing [CLEAR], the Safety Status Bar is removed from the screen.
Fig. 3.2b - Safety Status Bar
Boxes definition is as follows:
Zoom
♦ Normal: when the chart is displayed at normal scale.
♦ U. Zoom: red when the chart is under-zoomed out more than twice
normal scale, gray otherwise.
♦ O. Zoom: red when the chart is over-zoomed in more than twice nor-
mal scale, gray otherwise.
♦ C. Lock: red when the chart is zoomed in more than twice normal scale,
gray otherwise.
Best Map
Red when a more detailed chart is available under the cursor position.
User Manual
41
Page 40

Data Off
Red when at least one of the following objects or layers is turned off (by the
user): Depths/soundings; Wrecks/obstructions; Tracks/routes; Attention areas; Nav-Aids.
Declutter
Displays red when clearing overlapping objects.
Dangers
Red when “Guardian Technology” detects one of the following objects: Land,
Intertidal, Depth Area, Rocks, Obstructions, Shoreline Constructions, Fishing
Facility, Wrecks, Dragged area, Diffusion area, Mooring facilities, Pingos and
Production installations.
Cautions
Red when “Guardian Technology” detects cautionary or restricted area.
PALETTE
It is possible to set the palette used to enhance the visibility of the screen depending on the surrounding light condition. The possible choices are listed in the
table below:
Normal : It is recommended when the chart plotter is not exposed to the direct sunlight. When this mode
Sunlight : It is designed to enhance the visibility of the screen when the chart plotter is exposed to the
Night Vision : It is recommended when the environment is dark in order to reduce the glare of the display. The
NOAA : Allows setting NOAA paper chart colors presentation.
[MENU] + "PALETTE" + [ENTER].
is set the maps are displayed in order to use colors as similar as possible to the ones used in the
original paper charts.
sunlight. The maps are much brighter than in the other modes and the depth areas are filled with
white color so different depth areas are not easily distinguishable.
chart plotter displays maps and screen in darker colors.
CURRENTS PREDICTION
A window is shown on the low-left side of the chart. It is possible to see the
variation of the Tidal arrows on the selected area at any given time. Press the
dedicated keys to set the date and time manually, to decrease time and to increase time.
[MENU] + "CURRENTS PREDICTION" + [ENTER].
3.3 OTHER MAP CONFIGURATIONS
Allows the user to customize the following selections and is divided into: Marine
Settings, Depth Settings, Land Settings, Chart Settings and Underwater Objects
Settings.
[MENU] + "OTHER MAP CONFIGURATIONS" + [ENTER].
DISPLAY MODE
[MENU] + "OTHER MAP CONFIGURATIONS" + [ENTER] + "DISPLAY MODE"
Selects from a predefined table what cartographic objects are displayed and which
display options are set. Pre-programmed settings are user selectable from Full,
Medium, Low, Radar, Tides, Custom. The table below shows the selections for
each mode:
+ [ENTER].
42 User Manual
Page 41

Setting Full Medium Low Radar Tides Custom
Place Names On On On On On On
Name Tags On Off Off Off Off Off
Nav Aids & Light Sectors On No Sector No Sector No Sector Off On
Attention Areas On On Off Off Off On
Tides & Currents On Off Off Off On On
Seabed Type On Off Off Off Off On
Ports & Services On On Off On Off On
Tracks & Routes On Off Off Off Off On
Depth Range Min 0 Mt 0 Mt 0 Mt 0 Mt 0 Mt 0 Mt
Depth Range Max 9999 Mt 9999 Mt 9999 Mt 9999 Mt 9999 Mt 9999 Mt
Land Elevations On On Off Off Off On
Land Elevation Values On Off Off Off Off On
Roads On Off Off Off Off On
POI On Off Off Off Off On
Lat/Lon Grid On Off Off Off Off On
Chart Boundaries On Auto Off Off Off Auto
Value-Added Data On Off Off Off Off On
Chart Lock On On On On On On
Underwater Objects Limit 9999 Mt 10 Mt 10 Mt 10 Mt 10 Mt 10 Mt
Rocks Icon+Depth Icon Icon Icon Icon Icon
Obstructions Icon+Depth Icon Icon Icon Icon Icon
Diffusers Icon+Depth Icon Icon Icon Icon Icon
Wrecks Icon+Depth Icon Icon Icon Icon Icon
(Default values)
MARINE SETTINGS
To control the display on the map of the marine features.
Place Names : Sets On/Off the displaying of the Names (local area names).
Name Tags : Sets On/Off the displaying of a tag for particular chart objects that either includes the Name
Nav-Aids & Light Sectors: Sets On/Off/No Sector the graphical presentation of Lights, Signals, Buoys and Beacons.
Attention Areas : Sets On/Off the displaying of Attention Areas (areas in which special attention by the
Tides & Currents : Sets On/Off the displaying of the Tides and Currents. The new worldwide database with
of the chart object or the Depth of an Underwater chart object. Available for Buoys, Towers,
Beacons and Port Marinas.
If No Sector is selected Nav-Aids are shown, Light Sectors are hidden
mariner is required, because of natural or man-made hazards, or sailing regulations and
restrictions. Moreover a special symbol (!) is placed inside the area selecting On option.
This is valid also for the categories: FISHING FACILITY, MARINE FARM/CULTURE,
MILITARY PRACTICE AREA, RESTRICTED AREA, SEAPLANE LANDING AREA. When
the area is small, it is identified only by the boundary).
tidal stream information is now available with MAX C-CARDs. When data/time is available,
Tidal stream arrows are shown on the charts, indicating the direction and strength of the
Tide. If no data/time is available from the GPS or the chart plotter is not in Simulation mode,
the icon on the map is generic one.The color of the arrow denotes the strength of the current
as follows:
0 to 0.1 kn -
0.2 to 1.0 kn -
1.1 to 2.0 kn -
2.1 to 3.0 kn -
3.1 to 9.9 kn -
When the chart plotter receives a valid position fix, the Tide icons are shown on the charts
on the basis of the current date and time: the screen displays and changes arrows as date/
Seabed Type : Sets On/Off the displaying of the Seabed Type.
Ports & Services : Sets On/Off the displaying of the Ports and Services (areas along shore with facilities for
User Manual
time changes.
mooring, downloading and uploading of ships, generally sheltered from waves and winds.
Port installations are piers, wharves, pontoons, dry docks, cranes...).
Yellow
Yellow
Orange
Orange
Red
43
Page 42

Tracks & Routes : Sets On/Off the displaying of the Tracks and Routes (recommended and established
routes for ships at sea, including traffic separation schemes, deep water routes).
DEPTH SETTINGS
To control the display on the map of the depth informations.
Depth Range Min : Sets a minimum reference for the Depth Areas. The default setting is 0 Mt.
Depth Range Max : Sets a maximum reference for the Depth Areas. The default setting is 9.999 Mt.
LAND SETTINGS
To control the display on the map of the terrestrial features.
Land Elevations : Sets On/Off the Land Elevation display.
Land Elevations Values : Sets On/Off the displaying of the Land Elevations Values.
Roads : Sets On/Off the displaying of the Roads.
POIs : Sets On/Off the displaying of Points Of Interest.
CHART SETTINGS
To control the display on the map of the chart features.
Lat/Lon Grid : Sets On/Off the displaying of the grid of parallels (of Latitude) and meridians (of Longitude) drawn
Chart Boundaries : Sets On/Off the displaying of the Chart Boundaries, which represents the boundaries of the charts
Value-Added Data : Sets On/Off the displaying of the Value Added Data. The Value Added Data (VAD) is a collection
Chart Lock (*) : Sets On/Off the Chart Lock option. When Chart Lock is On, the available zoom scales are only
NOTE* When an empty level is entered, the message “No cartographic coverage” is
shown on a window in a corner of the map display. The warning message is
always displayed as long as the current zoom has no data coverage.
on the map.
available on the chart plotter. Selecting Auto instead, if we are in background charts only the first
chart levels contained in the C-CARD are displayed, if we are in a charts level contained in the
C-CARD the next four charts level are displayed.
of additional cartographic objects which are not present on the original paper chart (from which
the electronic chart derives). These objects have been obtained from other sources (that C-MAP
believes to be reliable) and then merged to the electronic charts in order to provide more
information useful for the navigation.VAD object can be any cartographic objects and it can be
distinguished from the official-chart-objects from the Quick Info. A dedicated icon is shown on the
Quick Info window to indicate that the object queried is a VAD. The same icon is also shown on
the Full Info page and in addition the extended text Value Added Data is shown on the details of
the VAD object.
the ones containing cartographic data. Instead when Chart Lock is Off, it is possible to zoom down
into zoom scales not covered by cartographic data after the last available zoom scale covered by
cartographic data. The DSI window, if present, will show “NO CHART”, when an empty level is
entered in the location of map expansion mode.
UNDERWATER OBJECTS SETTINGS
To control the display on the Underwater Objects.
Underwater Objects Limit : Selects the max depth value to display Underwater Objects. If value is set to 0 Mt, the
Rocks : Sets Off/Icon/Icon+Depth* the displaying of the Rocks. The default setting is Icon.
Obstructions : Sets Off/Icon/Icon+Depth* the displaying of the Obstructions. The default setting is Icon.
Diffusers : Sets Off/Icon/Icon+Depth* the displaying of Diffusers. The default setting is Icon.
Wrecks : Sets Off/Icon/Icon+Depth* the displaying of Wrecks. The default setting is Icon.
NOTE* Choose the options: OFF (the object is not visible independently of the
selected “Underwater Object Depth Value”); ICON (the object icon is visible
without tags, in the range selected from “Underwater Object Depth Value”
44 User Manual
Underwater Objects are not shown on the charts.If value is more than 0 Mt (i.e. 10 Mt),
in the Range from 0 Mt to the selected value the Underwater Objects are displayed
according to their default setting (shown here below). The default setting is 10 Mt.
Page 43

option); ICON+DEPTH (the object icon and tag is visible, in the range selected
from “Underwater Object Depth Value” option).
3.4 DISPLAY MENU
To allow you to change how the chart plotter displays information. It is possible to
select this menu only from the Chart Display page or the Depth Graph page in
split mode.
Auto Info : Allows displaying information on cartographic object when the cursor is placed on it. The
Screen Amplifier : In Home mode the Screen Amplifier (Look Ahead) function sets up the charts on the navigation
Course Line : Selects the value among Off/2/10/30 Min/1/2 hours/Infinite.The Course Line is a graphical
Ship Icon Mode : Sets the Ship Icon Mode between Steady or Blinking. When Ship Icon Mode is Blinking, the ship
Coordinates System: If TD is selected as Coordinate System, a new menu appears on the screen to set Chain, Pair,
Map Datum : Allows selecting any Geodetic Datum reference from the over 100 available on the chart plotter.
Fix Datum : Sets the datum reference used by the GPS receiver connected to (or integrated in) the chart
External WPT : The coordinates of a Waypoint, received from a GPS connected to the chart plotter, can be
User Points : Sets On (icon + label), Off or Icon (only icon) the displaying of User Point.
Symbol Size : Sets Normal or Small the icon of User Point.
Data Window Mode : Customizes the Text Area layout: it is possible to customize the Text Area layout among Full
Cursor Window : Enables or disables the display of the cursor window on the screen.
COLOR MAX 15:
Event Handler Type: Selects the type as Normal or By Key. Selecting Normal allows placing the Event with a
Position Symbol : Selects the icon of the fix position displayed on the screen between Boat and Standard. The
[MENU] + [MENU] + "DISPLAY" + [ENTER]
Automatic Info On Points shows information when the cursor is placed on points (as Port
Services, Tides, lights, wrecks, rocks, buoys, beacons, obstructions, land markers, etc.). The
Automatic Info On All shows information when the cursor is placed on points, on lines (as Depth
contours, Traffic Separation, Territorial Sea, Cartographic Lines etc.) on areas (Depth, Built-up,
Sea, Attention, Restricted etc.) and on names (on the beginning of the text -hot spot- or on any
of the characters of the name -name message box-). The details on Land, Source of Data,
Cartographic Area and Spot Soundings are not shown.
direction (course) in order to display more map details in front of the vessel’s position.
indication of the direction in which the Vessel is heading. The Course Line origin is the vessel’s
position so the time line movement is synchronized with the vessels Icon. Course Line "course"
is given by the value of COG (Course Over Ground) and its length is proportional to the SOG
(Speed Over Ground).
icon (and the heading line) blinks every 1 second, otherwise when it is Steady the Ship Icon (and
the heading line) does not blink.
ASF 1/2, Alternate Solution.
Map Datum selection switches to the selected reference datum applying the datum offsets
stored with the charts.
plotter so that the chart plotter converts the position received from the GPS to the Map Datum
currently selected in the menu in order to match the position from the GPS with the position on
the charts. You must know what datum reference is used by the GPS and set it in the Fix Datum option.
stored into the chart plotter, if the GPS is NMEA-0183 protocol compatible and support the
$BWC sentence (this symbol remains on the screen for 30 seconds). You may save it by placing
a Waypoint or a Mark onto that symbol. As soon as the chart plotter receives another $BWC
sentence with the coordinates of a new Waypoint, the symbol moves to the new point.
Screen, Vertical, Text Area with 5 boxes and Text Area with 8 boxes (for Text Area with 5 boxes
and Text Area with 8 boxes you can select between Small or Large boxes size).
default name; selecting By Key allows setting the desired number for the Event. The default
setting is Normal.
default setting is Boat.
3.5 VIDEO INPUT MENU
By accessing this menu it is possible to see images on the chart plotter display
captured from an external video signal source, if connected to the chart plotter.
Not all color chart plotters are connectable to the external video signal. Please
make sure that your chart plotter is equipped with a video input connection port.
User Manual
45
Page 44

NOTE If the Video Input signals is not detected (E.g. the video Camera is not
connected to the Video Input connector), the VIDEO INPUT menu item must
be grayed out.
COLOR MAX SEALINK I/COLOR MAX SEALINK E:
[MENU] + [MENU] + "DISPLAY" + [ENTER] + "VIDEO INPUT" + [ENTER]
Full Screen Video : Shows the image from the camera in full screen mode.
COLOR MAX 15/COLOR MAX PRO:
Allows the "picture-in-picture" functionality, so a Video Input image can be shown
on a window and placed over the other Video Input image at full screen.
[DATA] + "VIDEO INPUT" + [ENTER]
Full Screen Video 1 : Shows the image from the video camera 1 at full screen.
Full Screen Video 2 : Shows the image from the video camera 2 at full screen.
Full Screen Video 1 + Video 2 : Shows the image from the video camera 1 at full screen with the image from the video
Full Screen Video 2 + Video 1 : Shows the image from the video camera 2 at full screen with the image from the video
camera 2 on a rectangular window placed on the upper-left corner of the screen.
camera 1 on a rectangular window placed on the upper-left corner of the screen.
3.6 NAV DISPLAY MENU
Allows selecting CDI Scale and Navigation Page fields. It is possible to display this
menu only if the Navigation Data page or the 3D Road page has been selected.
[MENU] + "NAV DISPLAY" + [ENTER]
CDI scale : Selects the CDI (Course Deviation Indicator) Scale among 0.2, 0.5, 1.0, 2.0, 4.0, 10.0 Nm.
Navigation Page : A new window appears with six items. Select the item you want to change and press [ENTER]:
another window appears, select the fields to display in the Navigation Data page or in 3D Road page
among BRG (Bearing), COG (Course Over Ground), DST (Distance to Destination), SOG (Speed
Over Ground), STR (Steering), VMG (Velocity Made Good), XTE (Cross Track Error), DRF (Drift),
SET (Direction of the Current), DPT (Depth), TEMP (Water Temperature), TTG (Time To Go).
3.7 ADVANCED MENU
The Advanced options are arranged in sub-menus.
3.7.1 Input/Output Setup menu
[MENU] + [MENU] + "ADVANCED" + [ENTER]
After every software upgrade the RAM is cleared and the chart plotter re starts
with the usual default settings. Please go to the Input/output menu and set
the proper input format once again.
WARNING
COLOR MAX 6/COLOR MAX 5E/COLOR MAX WIDE E GPS/COLOR MAX
SEALINK E/EXPLORER II PLUS/COLOR MAX 15/COLOR MAX PRO:
GPS Connection
Connects the GPS to the GPS Port (serial Port 3). To choose your preferred
setting follow the procedure:
[MENU] + [MENU] + "ADVANCED" + [ENTER] + "Input/Output" + [ENTER]
+ "Port 3 Input" + [ENTER] + "NMEA-4800-N81-N" + [ENTER]
GPS Setup Menu
To set your preferred configuration for the connected GPS.
Internal GPS : COLR MAX WIDE I GPS: Enables or disables the Internal GPS.
Restart GPS : Restarts all GPS processes. Once executed, the message "Done" is shown.
Diff. Corr. Source : Sets what kind of Differential Correction will be used by the GPS between WAAS and RTCM
46 User Manual
(beacon correction).
Page 45

Navigation Speed : Sets the Navigation Speed among Low Speed, Medium Speed and High Speed.
Autopilot Connection
Connect the Autopilot to the serial Port 1, 2 and 3.
EXPLORER II Plus/COLOR MAX 15/COLOR MAX PRO:
Connect the Autopilot to the serial Port 1, 2, 3, 4 or 5.
[MENU] + [MENU] + "ADVANCED" + [ENTER] + "Input/Output" + [ENTER]
+ "Port 1/2/3 Output" + [ENTER]. Then choose your preferred setting among
the NMEA available settings NMEA 0183 4800-N81-N, NMEA 0180, NMEA
0180/CDX) and press [ENTER] to confirm.
[MENU] + [MENU] + "ADVANCED" + [ENTER] + "Input/Output" + [ENTER]
+ "Port 1/2/3/4/5 Output" + [ENTER]. Then choose your preferred setting
among the NMEA available settings NMEA 0183 4800-N81-N, NMEA 0180,
NMEA 0180/CDX) and press [ENTER] to confirm.
External NMEA Connection
Connect the External NMEA to the serial Port 1, 2 and 3.
EXPLORER II Plus/COLOR MAX 15/COLOR MAX PRO:
Connect the External NMEA to the serial Port 1, 2, 3, 4 or 5.
[MENU] + [MENU] + "ADVANCED" + [ENTER] + "Input/Output" + [ENTER] +
"Port 1/2/3 Input" + [ENTER]. Then choose your preferred setting among the
NMEA available settings NMEA 1200-N81-N, NMEA 4800-N81-N, NMEA 4800N82-N, NMEA 9600-N81-N, NMEA 38400-N81-N and press [ENTER] to confirm.
[MENU] + [MENU] + "ADVANCED" + [ENTER] + "Input/Output" + [ENTER]
+ "Port 1/2/3/4/5 Input" + [ENTER]. Then choose your preferred setting
among the NMEA available settings NMEA 1200-N81-N, NMEA 4800-N81-N,
NMEA 4800-N82-N, NMEA 9600-N81-N, NMEA 38400-N81-N and press
[ENTER] to confirm.
C-COM GSM Plus Connection
To connect the modem C-COM to the chart plotter follow the procedure:
The modem C-COM can be connected also to the Port 2, 3 (EXPLORER II Plus/
COLOR MAX 15/COLOR MAX PRO: it is possible to select the Port 4 and 5 too),
in this case select the format on the used port.
NOTE The connection is valid for the C-COM IR and C-COM RS232 too.
[MENU] + [MENU] + "ADVANCED" + [ENTER] + "Input/Output" + [ENTER]
+ "Port 1 Input" + [ENTER] + "C-COM" + [ENTER]
Output Sentences
The chart plotter allows customizing the NMEA-0183 sentence transmitted on
each port. Each port can transmit a different set of sentences among: GLL, VTG,
BOD, XTE, BWC, RMA, RMB, RMC, APB, WCV, GGA, HSC, HDG:
[MENU] + [MENU] + "ADVANCED" + [ENTER] + "Input/Output" + [ENTER]
+ "Port 1/2/3 Output Sentences" + [ENTER]
EXPLORER II Plus/COLOR MAX 15/COLOR MAX PRO:
[MENU] + [MENU] + "ADVANCED" + [ENTER] + "Input/Output" + [ENTER]
+ "Port 1/2/3/4/5 Output Sentences" + [ENTER]
NMEA-0183 Output Talker ID
The Talker Id is the 2 characters following the “$” char (Start of sentence) in a
NMEA-0183 sentence that identifies the type of instrument that sends the string.
The chartplotter allows selecting one of the following Talker identifier: II (Integrated Instrument); GP (GPS); EC (Electronic Chart System-ECS); RA (Radar
and/or Radar Plotting); SD (Sounder Depth). The selected Talker ID is applied to
User Manual
47
Page 46

all sentences sent by the chartplotter from all Ports.
To select the Talker ID follow the procedure:
[MENU] + [MENU] + "ADVANCED" + [ENTER] + "Input/Output" + [ENTER]
+ "NMEA-0183 Output Talker ID" + [ENTER] + "II/GP/EC/RA/SD" + [ENTER]
COLOR MAX WIDE E GPS/COLOR MAX WIDE I GPS/COLOR MAX SEALINK
I/COLOR MAX SEALINK E/EXPLORER II Plus/COLOR MAX 15/COLOR MAX
PRO:
External Signal
Sets the External Output:
Then choose your preferred setting among External Alarm (when activated, this
pin goes to GND level. It is used to command an external buzzer), Radar Power
On (it is command switch for the Radar. It must be used in conjunction with the
Radar Junction box device) and Off.
COLOR MAX WIDE E GPS/COLOR MAX WIDE I GPS/COLOR MAX 6/
COLOR MAX SEALINK I/COLOR MAX SEALINK E:
[MENU] + [MENU] + "ADVANCED" + [ENTER] + "Input/Output" + [ENTER]
+ "External Signal" + [ENTER]
Cable Wiring page
Shows a window containing the cable wiring related to the quick disconnect bracket:
EXPLORER II Plus/COLOR MAX 5I/COLOR MAX 5E/COLOR MAX 15/COLOR
MAX PRO:
[MENU] + [MENU] + "ADVANCED" + [ENTER] + "Input/Output"+ [ENTER]
+ "Cable Wiring" + [ENTER]
Power I/O Cable Wiring page
Shows a window containing the Power I/O cable wiring.
EXPLORER II Plus/COLOR MAX 5E/COLOR MAX WIDE E GPS/
COLOR MAX SEALINK E/COLOR MAX 15/COLOR MAX PRO:
[MENU] + [MENU] + "ADVANCED" + [ENTER] + "Input/Output"+ [ENTER]
+ "Cable Wiring" + [ENTER] + "Power I/O Cable Wiring" + [ENTER]
GPS Cable Wiring page
Shows a window containing the GPS cable wiring.
EXPLORER II Plus/COLOR MAX 15/COLOR MAX PRO:
[MENU] + [MENU] + "ADVANCED" + [ENTER] + "Input/Output"+ [ENTER]
+ "Cable Wiring" + [ENTER] + "GPS Cable Wiring" + [ENTER]
AUX In I/O Cable Wiring page
Shows a window containing the AUX IN I/O cable wiring.
[MENU] + [MENU] + "ADVANCED" + [ENTER] + "Input/Output"+ [ENTER]
+ "Cable Wiring" + [ENTER] + "AUX In I/O Cable Wiring" + [ENTER]
Send/Receive Routes & Marks
Sets the desired port used for transferring User Points and Routes functions:
EXPLORER II Plus/COLOR MAX 15/COLOR MAX PRO:
[MENU] + [MENU] + "ADVANCED" + [ENTER] + "Input/Output" + [ENTER]
+ "SEND ROUTES & MARKS" + [ENTER] + "Port 1/2/3" + [ENTER]
[MENU] + [MENU] + "ADVANCED" + [ENTER] + "Input/Output" + [ENTER]
+ "SEND ROUTES & MARKS" + [ENTER] + "Port 1/2/3/4/5" + [ENTER]
3.7.2 C-Link menu
Select the Primary or Secondary Station (see the dedicated Chapter):
48 User Manual
[MENU] + [MENU] + "ADVANCED" + [ENTER] + "C-LINK" +
[ENTER] + "Secondary Station/Primary Station" + [ENTER]
Page 47

3.7.3 Fix & Compass menu
To handle the functions related to navigation and to set the reference heading
information such as bearing angles (True or Magnetic), the Magnetic Variation
source and to enter Compass Calibration values.
[MENU] + [MENU] + "ADVANCED" + [ENTER] + "FIX & COMPASS" + [ENTER]
Fix Correction : Turns On/Off the Correction from the positioning system. If the new Correction is calculated,
Compute Correction : Corrects fixes from the positioning instrument. By placing the cursor on the ship's real position
Correction Offset : Manual correction of fix position.
Static Navigation : Sets up a threshold for the speed. When the speed received from the positioning device is
Position Filter : Selects Low/Medium/High/Off the Position Filter. In case of a jittering fix this option makes the
Speed Filter : Selects Low/Medium/High/Off the Speed Filter. When it is On, you can filter the speed of the ship,
Bearing : Selects either degrees magnetic, Auto Mag, or True. If magnetic readings are selected the
Magnetic Variation : It is possible to calculate the Magnetic Variation in an Automatic or manual mode, by inserting
Calibrate Compass : The variation table is used to match magnetic value readout on the chartplotter comparable
but the Correction is not enabled, the ship's position is not changed.
and selecting this option, the error is calculated and internally memorized for appropriate
correction, but not applied.
under that threshold, the chartplotter displays zero speed.
ship's position more stable and the track smoother.
to optimize it.
variation is computed automatically for every zone as soon as the chart is displayed.
the step for calculation of Magnetic Variation.
with the value given by the compass of the boat. In other words, since the compass of the boat
must be compensated (due to the iron masses, ...), we use the same values given by the
chartplotter. This means that, for example, if the BRG to the next Waypoint readout in the
chartplotter display is "X" Mag degree, if you steer the boat reading "X" Mag degree from the
compass, you are driving well toward the next Waypoint.
3.7.4 C-Staff menu
The C-Staff functions are based on STAFF Concept® (Satellite Tracking Aided Fleet
Fishing). The STAFF Concept® is designed for professional fishing purpose to allow monitoring the position of the vessels of a fleet from each vessel (the fleet
may have up to 20 vessels max).
For more information see the specific User Manual.
[MENU] + [MENU] + "ADVANCED" + [ENTER] + "C-STAFF" + [ENTER]
3.8 AIS
AIS is an Automatic Identification System. It has been introduced to improve the
safety of navigation by assisting in the efficient operation of ship-to ship, ship
reporting and VTS applications. The system should enable operators to obtain
information from the ship automatically, requiring a minimum of involvement of
ship’s personnel, and should have a high level of availability. AIS transponders
installed on IMO vessels use VHF frequencies to:
♦ Transmit details of their own vessel
♦ Receive details from other vessels or navigation aids within VHF range.
Information being transmitted from vessels over 300 tons that, due to recent
worldwide legislation, are required to fit Class “A” AIS transponders.
Connecting to the chart plotter an AIS receiver (please contact your local dealer),
vessels with AIS transponder within VHF range are displayed on screen giving the
skipper or navigator a visual interpretation of the data of nearby vessels. This
improves safety, and specifically for collision avoidance reasons.
User Manual
49
Page 48

3.8.1 AIS System Definitions
♦ Target
It is a vessel equipped with AIS. Information about the Targets is being
received by AIS Receiver and displayed on the screen.
♦ CPA
Closest Point of Approach is the closest distance that will be achieved between your vessel and the tracked Target, based on your vessel’s speed
and direction and the Target’s speed and direction.
♦ CPA Limit
This is the distance from your vessel that a Target may reach before a
Target is deemed a threat.
♦ CPA Alarm
Occurs if CPA is less or equal to CPA Limit. This test is done for active
Targets only.
♦ TCPA
Time to closest Point of Approach is the time remaining until the CPA will
occur.
♦ TCPA Limit
This is the time remaining before the CPA is reached.
♦ TCPA Alarm
Occurs if TCPA is less or equal to TCPA Limit. This test is done for active
Targets only and if CPA value is less or equal to CPA Limit.
♦ Radio Call Sign
International call sign assigned to vessel, often used on voice radio.
♦ Name
Name of ship, 20 characters.
♦ MMSI
Maritime Mobile Service Identity.
♦ MMSI number
A unique 9 digit number that is assigned to a DSC radio station. It primarily registers the boat information in the U.S. Coast Guard’s national distress database for use in emergency situations.
♦ Active Target
Target located within the Activation Range. Active Target is represented by
oriented triangle with COG and Heading vectors. Rate of turn may also be
displayed.
♦ Dangerous Target
Target detected by CPA or TCPA Alarm. Dangerous Target is Active Target
by definition. For better visibility Dangerous Target symbol is flashing.
♦ Sleeping Target
Target located outside the Activation Range. Sleeping Target is represented
by a small oriented triangle.
♦ Lost Target
When the AIS info is not received from that vessel for 3.5 minutes. The
presentation will be a flashing black triangle with a cross through.
♦ Activation Range
Range around your boat where Targets become active. AIS Target become
active within this range. Activation Range should be greater than CPA Limit
by definition.
NOTE A Target is removed from the screen if data is not received for 10 minutes.
The maximum number of tracked Targets is 100.
Depending on the scale the presentation of the Targets change to remove
clutter on the screen.
This information is updated every 3 seconds to 6 minutes depending on speed
and rate of turn, enabling the track of the vessels in range to be plotted.
50 User Manual
Page 49

Fig. 3.8.1 - AIS Symbols
3.8.2 AIS Menu
To configure the chart plotter to receive AIS data, follow the procedure:
Display : Turns ON or OFF the display of AIS targets overlay on the cartography. The default setting is
Activation Range : Defines the range from the fix within which the AIS Target becomes active. The values allowed
CPA Alarm : Turns ON or OFF the alarm. The default setting is ON.
CPA Limit : The values allowed are from 0.1 to 10 Nm. The default setting is 0.5 Nm.
TCPA Alarm : Turns ON or OFF the alarm. The default setting is ON.
TCPA Limit : The values allowed are from 1 to 30 min. The default setting is 10 min.
[MENU] + [MENU] + "ADVANCED" + [ENTER] + "AIS" + [ENTER]
ON.
are from 0.1 to 20 Nm. The default setting is 5 Nm.
3.8.3 To set the chart plotter for receiving AIS
Make sure that the AIS receiver is properly connected to the chart plotter.
The chart plotter reads the AIS NMEA message VMD, type 1, 2, 3 and 5.
Select the used serial port and transmission speed by following the procedure:
[MENU] + [MENU] + "ADVANCED" + [ENTER] + "INPUT/OUTPUT" + [ENTER]
+ "Port n Input" + [ENTER] + "AIS 38400" + [ENTER]
Where: n = Port 1/Port 2/Port 3 (also Port 4/Port 5 for EXPLORER II Plus/
COLOR MAX 15/COLOR MAX PRO)
3.8.4 Quick Info on AIS Target
By placing the cursor over a AIS Target icon, the following information is displayed:
♦ Vessel Name
♦ MMSI number
♦ Radio Call Sign
♦ SOG
♦ COG
♦ CPA and TCPA values
NOTE The selected AIS Target icon is surrounded by a square frame when user
places the cursor over the icon.
3.9 C-WEATHER SERVICE
C-Weather Service is an innovative meteorological forecasting system with the ability
to visualize the weather forecast, overlaying it on cartography. The weather data is
held on C-MAP’s weather server, which can be accessed via a C-COM modem connected to the chart plotter or by using the C-MAP personal Suite (or the DPS - Dealer
Programming System) saving the weather data on a User C-CARD. The weather data
are overlaid on a map page as layers. The Weather format data available are:
User Manual
51
Page 50

Data Type Display
WIND (Speed & Dir) 0
WAVE (Height & Dir) 1
TEMPERATURE (C°) 18°
HUMIDITY (%) 30
VISIBILITY (m) 20
WEATHER TYPE: Sun
WEATHER TYPE: Rain
WEATHER TYPE: Fog
WEATHER TYPE: Snow
WEATHER TYPE: Clouds
WEATHER TYPE: Partly Cloudy
WEATHER TYPE: Thunderstorm
Fig. 3.9 - Weather data package
NOTE Please check with Local C-MAP Office for the actual C-WEATHER coverage of
your area.
3.9.1 C-WEATHER SERVICE Menu
To select the menu:
It opens a sub-menu with the following options.
[MENU] + [MENU] + "C-WEATHER SERVICE" + [ENTER]
♦ Download
♦ Copy From User C-CARD
♦ Forecast
♦ Real Time View
♦ Type of Data
Download
[MENU] + [MENU] + "C-WEATHER SERVICE" + [ENTER] + "DOWNLOAD" +
Allows to connect the software to the C-MAP weather server and to download
C-MAP weather data directly via C-COM. It activates the following sub-menu:
Select Country to Call : Allows the selection of the country to call. The whole telephone number set is automatically
SIM Pin : Allows inserting of the PIN of the SIM.
Download Area : Allows the weather download: a squared grey area, where the weather data will be
52 User Manual
[ENTER]
updated after every download.
downloaded, is centered on cursor position. See the following picture.
Fig. 3.9.1 - Download Area
Page 51

Press [LOAD] to activate the C-Weather Download: the whole data package
(see the previous "Weather data package" table) is downloaded. [STOP] allows to
interrupt the data download.
At the end of the operation press [EXIT] to close the window.
Copy From User C-CARD
[MENU] + [MENU] + "C-WEATHER SERVICE" + [ENTER] + "COPY FROM
USER C-CARD" + [ENTER]
Allows the whole data package C-Weather loading from the User C-CARD.
Forecast
[MENU] + [MENU] + "C-WEATHER SERVICE" + [ENTER] + "FORECAST" +
[ENTER]
Allows selecting the Layer of specific weather data to be displayed on the screen
and to change date and time of the forecast preview.
The following functions are available:
♦ Panning: default usage of the cursor key is the normal panning function.
♦ Zoom in/out: zoom in/out functions are allowed as usual by using
[ZOOM IN]/[ZOOM OUT].
♦ Set of date and time: [DATE ] to modify date and time values.
♦ Layer selection: [LAYER] to cycle of the weather layers.
♦ Exit: [EXIT] or [CLEAR] to close the weather prediction page.
Real Time View
[MENU] + [MENU] + "C-WEATHER SERVICE" + [ENTER] + "REAL TIME VIEW"
+ [ENTER]
The following selections are available:
♦ Real Time View On: the data is shown (the area of the download) at
the current date and time (received from the GPS).
♦ Real Time View Off: the Weather data is not displayed.
The layer displayed is the one selected into the previous menu item.
Type of Data
[MENU] + [MENU] + "C-WEATHER SERVICE" + [ENTER] + "TYPE OF DATA"
Allows selecting the type of data, see the previous Fig. 3.9.
+ [ENTER]
3.10 DSC
The chart plotter must be interfaced with a DSC VHF radio.
The DSC (Digital Selective Calling) is a method of establishing a VHF radio call; it
is used to announce urgent maritime safety information broadcasts. This system
allows mariners to instantly send Distress Call or/and Position Request to the
other vessels equipped with a DSC transceiver within range of the transmission.
The Distress Call, that allows to receive a position of the vessel in distress, and
the Position Request, a great feature for anyone wanting to know the location of
another vessel - for example you buddy that is catching fish, or finding the location of a person you are cruising with, are performed by an external device, the
DSC VHF radio. The chart plotter interfaced with a DSC VHF radio prompts the
user to see the GPS position of the vessel in distress and also allows for easy
navigation to the vessel.
The Distress Call and the Position Request icons that are displaying on the screen,
are shown in the following table:
User Manual
WARNING
53
Page 52

Position Request icon
P
Distress Call icon
Fig. 3.10 - Distress Call and Position Request icons
NOTE The label can be the MMSI or the corresponding vessel's name. If in the DSC
Directory the MMSI has been associated to its relative vessel name, the
vessel's name is shown in the label instead of the MMSI.
D
3.10.1 Distress Call and Position Request
During a distress situation, a vessel that is equipped with a DSC VHF radio and
connected to a GPS, has the capability to transmit a DSC Distress Call with GPS
Position.
When the VHF radio receives a DSC Distress Call, the position information of the
vessel in distress is transferred to the chart plotter. The chart plotter logs the
Distress Call into the DSC Log and also marks the position of the vessel in distress
on the Chart page. A pop-up screen advises the user that a Distress Call has been
received. Within the pop-up screen it asks the user if he would like to view the call
on the Chart page or exit the pop-up screen. By selecting the item "VIEW ON
CHART" and press [ENTER] two options are shown:
♦ GoTo Vessel
Activates the navigation to the Distress Call or Position Request icon. The
chart plotter changes the map scale to allow showing the Distress Call (or
Position Request) icon and the vessel’s icon simultaneously on the screen.
The chart plotter then verifies if there are obstructions (land or low water)
between the two positions. If obstructions are found the chart plotter shows
a pop-up screen saying that the navigation to the Distress Call cannot be
set automatically and the user must define a route to avoid the obstacles.
♦ Stay on View
Exits the pop-up screen and remains on the selected map screen.
3.10.2 DSC Menu
To select the menu:
It opens a sub-menu with the following options.
[MENU] + [MENU] + "ADVANCED" + [ENTER] + "DSC" + [ENTER]
♦ Log
♦ Directory
Log
[MENU] + [MENU] + "ADVANCED" + [ENTER] + "DSC" + [ENTER] + "LOG"
Selecting Log shows the Distress Call Log page or Position Request Log page (it
depends which of the two was selected):
54 User Manual
+ [ENTER]
Page 53

03-03-01
08:31 PM
03-04-01
00:11 PM
03-04-01
09:31 PM
33°30.505 N
118°18.529 W
33°34.167 N
118°21.864 W
33°31.211 N
118°29.151 W
0080457645
ROY
0023244524
BOBI
0056477743
NO
YES
NO
Fig. 3.10.1 - Example of DSC Log page
To set the navigation on the selected DSC point follow the procedure:
or simply:
Place the cursor on DSC point + [ENTER] + "GOTO" + [ENTER]
Place the cursor on DSC point + [GOTO]
COLOR MAX 15/COLOR MAX PRO:
Place the cursor on DSC point + [GOTO]
Other available functions are:
Locate : Centers the map on the selected DSC position.
Clr-One : Deletes selected DSC position.
Clr-All : Deletes all entries
Hide/Show : Allows hiding/showing the selected DSC position on the chart display.
Position Request/Distress Call : Shows Position Request/Distress Call page. When Position Request page is
active this message changes to Distress Call.
Directory
[MENU] + [MENU] + "ADVANCED" + [ENTER] + "DSC" + [ENTER] + "DIREC-
Selects the DSC Directory page. From this page the user can assign the Vessel
Name, Contact Name and Phone number to any MMSI (Maritime Mobile Service
Identity) so that, when a DSC Distress Call or Position Request is received, the
name of the vessel is displayed in place of the MMSI number - a unique number
that is assigned to a DSC radio station for use in emergency situations:
TORY" + [ENTER]
SCORPION
STRIKE 99
JUPITER
SARA
0046712433 ERICH SMITH
0036612458
JIMMY PAGE
0036612459
ROBERT PIO
0063412123
SUSANNE
12372133456
22832178345
22114433001
44332211001
Fig. 3.10.1a - Example of Directory Log page
Edit : Edit the fields of any existing entry in the Directory: Vessel Name, MMSI number, contact and phone number.
Add : Add a new entry to the Directory.
User Manual
55
Page 54

Delete : Delete the selected entry.
Delete All: Deletes all entries in the page.
3.10.3 Quick Info on DSC Icons
Placing the cursor on the Distress Call or Position Request icon, the following
information is displayed:
♦ Vessel Name/MMSI Number
♦ Position
♦ Date and Time
♦ Distance and Bearing from current vessel's position
Pressing [ENTER] it is possible, by selecting "DELETE" deletes the DSC icon from
the DSC Log page, otherwise by selecting "DSC LOG" the DSC Log page is shown.
3.11 FISH FINDER
The chart plotter combined with the sonar performance of the Fish Finder is one
of the most advanced marine navigation system available. To select the Fish Finder
menu, first select one of the four page related to the Fish Finder:
COLOR MAX 15/COLOR MAX PRO:
[MENU] + [MENU] + "PAGE" + [ENTER] + "FISH FINDER" + [ENTER] + se-
lect the desired page + [ENTER]
[DATA] + "FISH FINDER" + [ENTER] + select the desired page + [ENTER]
Once the Fish Finder page is selected, access the Fish Finder menu by pressing:
For more information see the specific User Manual.
[MENU]
NOTE The Fish Finder display page is available only if the Fish Finder is connected
and powered On.
COLOR MAX PRO/COLOR MAX WIDE E/COLOR MAX WIDE I/
COLOR MAX SEALINK I/COLOR MAX SEALINK E/EXPLORER II PLUS/
COLOR MAX 15:
3.12 RADAR
The Radar consists of a scanner unit which illuminates targets with microwave
energy and then collects the echoes from those targets. The scanner unit includes
the Radar antenna, transmitter, receiver and necessary electronics. The scanner
unit is connected to a chart plotter equipped with software capable of displaying
the Radar functions. To select the Radar menu, first select one of the four page
related to the Radar:
COLOR MAX 15/COLOR MAX PRO:
Once the Radar page is selected, access the Radar menu by pressing:
For more information see the specific User Manual.
NOTE The Radar display page is available only if the Radar is connected and powered
[MENU] + [MENU] + "PAGE" + [ENTER] + "RADAR" + [ENTER] + select the
desired page + [ENTER]
[DATA] + "RADAR" + [ENTER] + select the desired page + [ENTER]
[MENU]
On.
56 User Manual
Page 55

3.13 SYSTEM INFORMATION
To see details about the software and cartography data installed.
Opens the System Information page.
[MENU] + [MENU] + "About..." + [ENTER]
3.14 WORLD BACKGROUND CHARTS
The internal background charts can be updated to include the MAX A and B level
charts which provide improved marine data, rivers, lakes, terrestrial data (major
streets , highways , railways, etc...), Nav-Aids, depth areas, territorial water areas, etc... by reading them from a special data C-CARDs (contact your local dealer).
All units must have the Worldwide Background upload function that is activated
from the system.
Worldwide Background Update
The System Update menu is entered from the About page. To select this menu
follow the procedure:
Plug the special data C-CARD + [MENU] + [MENU] + "About..." + [ENTER] +
[MENU] + "Update Worldwide Cartography" + [ENTER]
User Manual
57
Page 56

58 User Manual
Page 57

4. C-LINK
C-Link system is a feature which allows to sharing the same cartographic data
between two Chart Plotter units linked via serial I/O port.
In order to activate C-Link function, a “MAX data C-CARD” (called REGULAR
C-CARD) must be inserted into one of the two chart plotters and a special MAX
data C-CARD (called MIRROR C-CARD) must be inserted on the other chart plotter.
The two MAX data C-CARDs must have the same code and revision. So, the
MIRROR C-CARD can be utilized only on a chart plotter linked to another chart
plotter provided with the equivalent REGULAR C-CARD.
It is important to point out that the two chart plotters must have the update
software versions that allow C-Link function.
4.1 HOW C-LINK SYSTEM WORKS
When the chart plotter is powered up, it switches into the “Stand-Alone Mode”. In
this work mode, the chart plotter unit periodically scans all the available C-CARD
slots searching for MIRROR C-CARDs. When one or more MIRROR C-CARD is
found (in one or both chart plotters) a special connection is established between
the chart plotters to enable the MIRROR C-CARDs. If a regular C-CARD which has
previously activated a MIRROR C-CARD is removed, even the MIRRORs C-CARD
will be not read anymore on the other unit.
4.2 C-LINK SERIAL CONNECTION
The two chart plotters should be connected via serial ports. Any of the available
ports can be used, the software will recognize automatically the serial ports used.
A typical connection is as follows:
Chart Plotter 1 Chart Plotter 2
TX —————> RX
RX <————— TX
GND <————> GND
User Manual
59
Page 58

60 User Manual
Page 59

5. C-LINK NAVIGATION
DATA TRANSFER
This function allows transferring C-Link Navigation Data (Route Name, Destination
ID & Position, Next Waypoint ID & Position, Total Route length, Fuel Consumption
Rate, ETA, TTG etc.) between two chart plotters linked through the C-Link system.
The chart plotters can be set to operate in two modes:
♦ MASTER mode (Primary Chart Plotter)
♦ SLAVE mode (Secondary Chart Plotter)
When the navigation is activated on the Master chart plotter, the C-Link navigation
data will be continuously sent to the Slave until the navigation is active.
If the Master is navigating to a Single Destination, the Slave will show the
Destination position and activate the navigation to it.
If the Master is navigating to a Route, the Slave will show the Route Leg composed
by the Destination and the Waypoint after the Destination (Next Waypoint) and
activate the navigation to it.
Any variation to the current C-Link Navigation Data will be transferred from the
Master to the Slave.
The Slave will be provided with a few dedicated pages to show the C-Link Navigation
Data received from the Master.
5.1 OPERATIONS
INTRODUCTIVE ELEMENTS
It is important remark, once more, that this function does not transfer the whole
route but just the information relative to the navigation. Such information will be
removed from the Slave chart plotter as soon as the navigation is terminated.
C-Link navigation data is exchanged by using two NMEA-0183 C-MAP proprietary
sentences: $PCMPN,1 and $PCMPN,2.
When the navigation is activated on the Master, it starts outputting the C-Link
Navigation Data. If the Slave is connected, all C-Link Navigation Data received
are stored in its memory and the navigation is started.
The information sent by the Master consists of the following values:
♦ Navigation mode (To Single Destination/to a Route)
♦ Route Name*
♦ Destination ID
♦ Destination Position
♦ Next Waypoint ID*
♦ Range from Destination to next Waypoint*
♦ Bearing from Destination to next Waypoint*
♦ Route Length*
♦ Distance from Destination to Last Route Waypoint*
♦ Remaining Route Legs*
♦ Planned Cruising Speed
♦ Average Fuel Consumption
♦ Initial Fuel Load
C-Link Navigation Data can refer to:
User Manual
61
Page 60

♦ Single Destination navigation
♦ Route Following navigation
Values identified by * are sent only for Route Following navigation.
The Destination Icon, Navigation leg (Fix Position to Destination), the Next Waypoint
Icon and all other relevant C-Link Navigation Data will be shown on the Slave
chart plotter. Any variation of the C-Link Navigation Data on the Master will be
communicated to the Slave so to keep data aligned on both devices.
MASTER CHART PLOTTER
Operating mode
To select the Master mode follow the procedure:
[MENU] + [MENU] + "ADVANCED" + [ENTER] + "C-LINK" +
[ENTER] + "Primary Station" + [ENTER]
Master mode is the default factory setting. All regular chart plotters functions are
allowed. As soon as the Destination is placed, the Master chart plotter will start
transmitting all C-Link Navigation Data.
In Master mode the C-Link Navigation Data received from the NMEA port is ignored.
So, if the two chart plotters are both operating in Master mode, the C-Link
Navigation Data sent by the other chart plotter never processed.
Under such condition if the navigation is activated on one of the two chart plotters,
a warning message will be shown to notify that the C-Link navigation data will be
ignored by the other chart plotter.
SLAVE CHART PLOTTER
Operating mode
To select the Slave mode follow the procedure:
When Slave mode is set, the chart plotter cannot manipulate the C-Link Navigation
Data anymore.
Stop current navigation
If the navigation was already active, it will be disabled as soon as Slave mode is
set. An appropriate warning message will be shown to notify that the Navigation
is already active and to confirm whether Slave mode can be set.
[MENU] + [MENU] + "ADVANCED" + [ENTER] + "C-LINK" +
[ENTER] + "Secondary Station" + [ENTER]
Inhibit Navigation operation
As soon as Slave mode is set, the Destination cannot be placed anymore either
the C-Link Navigation Data is received from the Master or not. Also, when the
C-Link Navigation Data is received from the Master, it will not be allowed to
deactivate the Navigation.
Inhibit Route following
While navigating to the route received from the Master the Destination is reached
(either applying distance or perpendicular criteria), the Destination will not be
moved to the next Waypoint on the Route.
MOB handling
If the Navigation to the external Destination is active and [MOB] is pressed on
the Slave chart plotter, the MOB is placed but the navigation to the MOB is not
activated.
Notes
While navigating to the external Destination the operating mode is switched to
Master mode, the navigation to the external Destination will be terminated. An
62 User Manual
Page 61

appropriate warning message will be shown to notify that the Navigation to the
external Destination is active and to confirm whether Slave mode can be set.
Setting Slave mode, the C-Link Navigation Data will be deleted.
The C-Link Navigation Data are deleted at Power Off.
C-LINK NAVIGATION DATA: ACQUISITION AND DISPLAY
As soon as the C-Link Navigation Data is received, the Slave parses the information
received and executes the relative actions depending on its current working status.
Note When the Navigation to the external Destination is activated, the Slave Chart
Plotter will show all relevant C-Link Navigation Data exactly like when the
Destination is not the external one (Destination Name, DST and BRG to
Destination, calculate XTE, calculate TTG etc). These values will be displayed all
places where required and they will be used to format NMEA-0183 output data.
GRAPHICAL REPRESENTATION ON MAP DISPLAY
Fig. 5.1 - Graphical Displaying
ROUTE DATA REPORT
When the Navigation to the External Route is received, it will be possible to display
the information related to the External Route by entering the Route Data Report.
Fig. 5.1a - External route on Route Data Report
♦ External Route : Name of the External Route (from
$PCMPN,0)
♦ Cruising Speed : Planned Cruising Speed (from $PCMPN,1)
♦ Total Route length : Length from First to Last Wpt (from
$PCMPN,1)
♦ Waypoints in Route : No. of Wpts in the Route (from $PCMPN,1)
♦ Remaining Waypoints : No. of Wpts from Dest to Last Wpt (from
$PCMPN,1)
♦ Fuel Consumption Rate : Planned Fuel Consumption Rate (from
$PCMPN,1)
User Manual
63
Page 62

♦ Total Fuel Consumption : Calculated Fuel consumption to navigate
the whole Route
♦ Initial Fuel Load : Volume of Fuel available before the
navigation was started (Liters)
♦ Remaining Fuel : Volume of Fuel available (Liters)
♦ Distance to Destination : Distance from Ship to Destination
(calculated)
♦ Distance to Next Wpt : Distance to travel from ship to the Wpt
after the Destination (calculated: Distance
to Dest + Next Route Leg length)
♦ Distance to Last Wpt : Distance to travel from ship to the End of
the Route (calculated: Distance to Dest
+Distance From Dest to last Wpt received
from $PCMPN,1)
♦ TTG To Destination : Estimated Time to travel the “Distance to
Last Wpt” (calculated using Cruising
Speed)
♦ TTG To Next Wpt : Estimated Time to travel the “Distance to
Next Waypoint” (calculated using Cruising
Speed)
♦ TTG to Last Wpt : Estimated Time to travel the “Distance to
Last Wpt” (calculated using Cruising
Speed)
♦ ETA to Destination : Estimate Time of Arrival to the Destination
Point (calculated: Current Time + “TTG
To Destination”)
♦ ETA to Next Waypoint : Estimate Time of Arrival to the Waypoint
after the Destination (calculated: Current
Time + “TTG To Next Waypoint”)
♦ ETA to Last Wpt : Estimate Time of Arrival to the End of the
Route (calculated: Current Time + “TTG
To Last Wpt”)
5.2 QUICK INFO
Route Navigation: Quick Info on the Destination
Fig. 5.2 - Quick Info on Destination
Quick info on Single Destination
Fig. 5.2a - Quick Info on Single Destination
64 User Manual
Page 63

6. GPS
For centuries, sailors have been searching for a reliable and precise method of travelling
the world's waterways. From celestial navigating to the modern navigation techniques
as Loran, Decca Navigator, Omega or Transit Satnav, each system has had its problems
with weather, range and reliability. Without doubt, the "Global Positioning System", or
GPS for short, is the most significant advance in navigation: it gives the navigator a
position 24 hours a day, 365 days a year in any weather condition.
GPS is a satellite based navigation system which provides suitably equipped users
with accurate position, velocity and time data.
Originally the GPS, developed by the U.S. Department of Defense, was conceived for
military purposes, but now it is used in a host of civilian applications.
GPS navigation uses satellite signals to determine your position in relation to a set of
satellites orbiting the earth. The GPS constellation of satellites continuously send
radio signals, containing the precise position for each satellite back to earth. By
knowing the position of 3 or 4 satellites and calculating various time differences
between transmitted signals, the GPS receiver can determine its present position
anywhere on earth, and thanks to continuous updates, calculate speed and course
information.
6.1 HOW GPS WORKS
Currently, the GPS constellation consists of 26 orbiting satellites (including 3
spares), but this number will increase in the future.
The GPS receiver computes an accurate position by calculating the distance to the
GPS satellites that orbit the earth. Signals are required from 3 satellites for two
dimensional (2D) position calculation whilst 4 satellites are required for three
dimensional (3D) position calculation.
As mentioned earlier, GPS satellites are not geostationary, but they are orbiting
the earth as illustrated on the following figure:
7
10
5
15
21
20
3
17
8
6
Fig. 6.1 - The GPS constellation
2
18
14
1
11
4
19
13
16
9
Note that position is repeatedly fixed through the following three steps while any
3 satellites are in line of sight.
The position calculation procedure is indicated in the following three steps:
1. GPS satellites continuously transmit their own precise orbital data and
the GPS receiver computes their locations by receiving this data.
2. In this receiving process, the GPS receiver measures very accurate
distances to the satellites, using the "Spread Spectrum Modulation"
method. Excellence in GPS's position-fixing accuracy is mainly due to
User Manual
65
Page 64

this technology.
3. When the satellite locations and their distances are known, the GPS
receiver fixes its own position by triangulation:
d2
d3
d1
Fig. 6.1a - The GPS position calculation
As illustrated in the previous figure, the position is calculated as the meeting point of three
spheres which are drawn around the three satellites with diameters d1, d2 and d3.
6.1.1 Position Fixing Accuracy: HDOP
The GPS fix accuracy is due to the locations of 3 satellites in the sky. High accuracy is obtainable when the satellites are widely scattered in the sky; on the
contrary, accuracy is reduced when the satellites have gathered in a narrow space.
In the following figure, in both cases it is possible to obtain the GPS fix, but in the
left case the accuracy will be higher than the right:
Fig. 6.1.1 - HDOP
The index for position-fixing accuracy is called HDOP ("Horizontal Dilution Of Precision"). The smaller the HDOP value, the more accurately the position can be
fixed.
66 User Manual
Page 65

7. Maintenance
This chapter gives information on routine maintenance and problem solving associated with the chart plotter.
7.1 SYSTEM TEST
If you have connected your position-finding device according to the instructions,
and chosen the proper menu selection for your device, and are still having problems with your chart plotter, the extended auto-test should help determine the
problem. Make sure the chart plotter is turned Off. While pressing and holding
any other key, turn the chart plotter On. A new menu will appear on the display.
Use the cursor key to select the desired test: this will display in reverse video. To
choose the test press [ENTER]. To exit from any submenu press [CLEAR]. To exit
from the System Test turn Off the chart plotter.
7.1.1 RAM Menu
RAM Test: Verifies the integrity of the RAM chips. If on the screen the message
"ERROR" appears, the RAM is physically damaged.
COLOR MAX 15:
The RAM Test is not available.
RAM Clear: Clears internal memory. If the chart plotter exhibits unusual behaviour, or appears to be malfunctioning, it may be possible to correct the problem
by clearing RAM. This operation will erase all Marks, Routes, stored Track plots
and destinations. It will also return all selections (Input Data Format, Autopilot
selection, etc.) to original default values. Before this step, you have the option of
saving user Marks, Track history and Routes to a User C-CARD (this is an optional
purchase from your dealer). To confirm to clear RAM press [ENTER] again (but if
this time you do not wish to clear RAM press [CLEAR]).
7.1.2 DIM Menu
Contrast: Each time you press the cursor key to right, the screen will decrease
brightness, when you press the left key the brightness will increase.
Backlight: Sets the backlight. It operates in similar mode as Contrast.
7.1.3 Cartridges
Internal DataBase Test: Tests the WorldWideBackground.
C-CARD Test: Tests the C-CARD. There are four possible situations:
♦ If there is a C-CARD inserted in the slot and there is not a malfunction,
the name of the C-CARD zone and the message "OK" are shown
♦ If there is a C-CARD inserted in the slot, but it is damaged C-CARD, the
name of the C-CARD zone and/or the message "Faulty" are shown
♦ If there is not any C-CARD inserted in the slot, the message "not present"
is shown
♦ If there is a User C-CARD inserted in the slot, the message "USER
C-CARD" is shown
C-CARD Connector: While a C-CARD is inserted in the slot, if the counter increases, there is a malfunction reading it.
User Manual
67
Page 66

7.1.4 Modem test
Checks the Modem connections. Press [ENTER] to select the desired Port related
to the connections made, to the Port to which the Modem C-COM is connected.
7.1.5 Serial Ports
Change parameters: Changes the parameters of the serial interface. This menu
allows to select the Port (Signal Source), the Baud Rate between 4800 or 9600,
the Data Bits (Word Length) between 7 or 8, the Parity between even, odd or
none, the Stop Bits between 1 or 2.
Input Data Display: Allows the chart plotter to act as a computer terminal and
display the incoming data exactly as it is received. If the data displayed on the
screen is unrecognizable, you may have selected the wrong input parameters for
your particular receiver. Check your receiver manual to be sure that you have
selected the proper interface format. If the screen is blank, the connection may
be interrupted, and no data is being received. Use [PAGE] to stop (or continue
after pause) data displaying, [ENTER] to show data in hex or ASCII mode (normal
or small) and [CLEAR] to exit.
COLOR MAX 5E/COLOR MAX 5I/COLOR MAX 15/COLOR MAX PRO:
7.1.6 External Alarm
To check the External Alarm signal.
EXPLORER II Plus:
7.1.7 Display Settings
To select the display resolution.
Resolution: Sets the resolution among: 1024x768, 800x600, 640x480 (default).
Horizontal Size: Allows entering the actual horizontal size of the screen. The
value can be entered either in centimeters or inches (the default is 30.5 cm). The
unit of measure is user selectable (see Screen Size Unit option). If the unit of
measure is changed, the value is converted.
Screen Size Unit: Allows entering the screen size unit among cm and inch.
Centimeters is the default unit.
Apply settings: Sets the values Resolution and Horizontal size. When this function is executed the following message are shown: "The Display settings will be
applied after power off. Do you want to restart the unit now?". If the display will
not be visible, shut off the chart plotter again then power it up keeping pressed
[ZOOM-IN] to set default resolution 640x480. Choosing "YES", the chart plotter
will be restarted and the new settings applied. Choosing "NO" the new settings
will be applied only next time the chart plotter is powered up. Choosing "ABORT"
will discarded all changes and nothing will be applied. The original values of Resolution and Horizontal Size are restored and displayed.
NOTE It is possible to restore the lowest screen resolution (640x480) by pressing
and holding [ZOOM-IN] while the chart plotter is switched to ON. This is useful
when the image is not shown on the screen for example as effect of changing
the display or display not compatible with the set resolution.
68 User Manual
Page 67

Terms
♦ ALT = Altitude
Altitude of GPS Antenna on the medium sea level.
♦ Alter = Alternate Solution (TD Coordinates System)
Parameter selected by the user that is applicated in the conversion of TD
values to geographical coordinates Lat/Lon. It defines which of the two possible solutions can be used.
♦ Arrival Time
The estimated time of day you will reach your destination, based on your
current Speed and Track from GPS.
♦ ASF = Additional Secondary phase Factor (TD Coordinates System)
Correction to TD values which can be inserted by the user.
♦ Azimuth
The angular measurement from the horizon to a satellite or another object.
♦ AWD = Apparent Wind Direction
The Direction from which the Wind appears to blow relative to a moving point
(also called Relative Wind Direction).
♦ AWS = Apparent Wind Speed
The Speed at which the Wind appears to blow relative to a moving point (also
called Relative Wind Speed).
♦ Beacon
A prominent, specially constructed object forming a conspicuous vertical mark
as a fixed aid to navigation.
♦ Bearings
To select either degrees magnetic or degrees true. If magnetic readings are
selected the variation is computed automatically for every zone as soon as the
chart is displayed.
♦ Buoy
A floating object moored to the sea bottom in a particular (charted) place, as
an aid to navigation.
♦ Buoys and Beacons
Buoys and Beacons are used to indicate to mariners recommended or established routes, underwater dangers, restrictions and regulations. They can be
lighted or not and are colored according to their international code.
♦ BRG = Bearing
It is the angle between the North (True or Magnetic) and a destination.The
horizontal direction of one terrestrial point from another referring to the North
(True or Magnetic). It is often used to indicate the direction to follow to reach
the destination.
♦ Chain (Loran-C GRI)
The Loran chains are groups of transmitting stations that use timed radio
pulse transmissions. In each of these chains there is a master station and two
or more slave or secondary stations. Stations belonging to a same chain transmit
pulses in timing groups: a different time base identifies each chain. The time
base of each chain is the Group Repetition Interval or GRI. This GRI identifies
the chain in unique mode. For example the GRI = 4990 identifies the chain of
Central Pacific zone.
♦ COG = Course Over Ground
Direction of the path over ground actually followed by a vessel.
User Manual
69
Page 68

♦ Course Line (Time Line)
The Course Line is a graphical indication of the direction in which the Vessel is
heading. The Course Line origin is the vessel’s position so the time line movement is synchronized with the vessels Icon. Course Line "course" is given by
the value of COG (Course Over Ground) and its length is proportional to the
SOG (Speed Over Ground).
♦ CTS = Course To Steer
The optimum direction the boat should be steered in order to efficiently make
headway back to the course line while also proceeding toward the destination
Waypoint.
♦ Cultural Features
Any man-made topographic feature as built-up area, buildings, roads.
♦ Data Window Mode
To customize the Text Area layout among Full Screen, Text Area with 3 boxes
and Text Area with 6 boxes
♦ Datum
The Latitude and Longitude lines printed on any map are based on certain
models of the shape of the earth: these models are called Datum or Coordinate Systems. There are many different Datum in use, each one gives different Lat/Lon positions for an identical point on the surface of the earth (see
also Map Datum and Fix Datum).
♦ Dead Reckoning
It is the procedure to determine the current position of a vessel by applying to
the last known position the way that has been made (since the last known
position was received). This procedure is normally based on the last received
GPS position, Speed and Course or to the last received GPS position, Log
Speed and Heading.
♦ Default
It indicates the original factory setting for any menu selection. The default
values are set after a Master Reset (RAM Clear).
♦ Depth Area
Depth Areas are the sea areas included in the user selectable range of minimum and maximum depth limits. The sea area that is beyond the selected
range is filled by an uniform white color, the sea area that is inside the selected range is filled by ordinary multicolor shading. The Spot Soundings and
Depth Contours are displayed on the range only.
♦ Depth Line
(Also called Bathymetric Line) It is the imaginary line connecting points of
equal water depth.
♦ Destination
In order to tag on the chart the point, towards which the ship is Heading, you
can use a special mark, called destination. When the destination is placed, all
navigation data referred to this point.
♦ DGPS = Differential GPS
Provides even greater positioning accuracy than standard GPS.
♦ DPT = Depth from Trasducer
Water Depth below the Trasducer. The Distance from the Depth Transducer to
the ground.
♦ DST = Distance
The geographical distance between two points on the map. It is possible to
select the unit among Nm, Sm and Km.
♦ ETA = Estimated Time of Arrival
The predicted time of reaching a destination or Waypoint
70 User Manual
Page 69

♦ File
Collection of information (of the same type) stored on a User C-CARD. Each
file must have a unique name, ideally one that describes its contents. Filenames
are kept in a directory on each User C-CARD.
♦ Fix
It is the current position of the vessel provided by the GPS (connected to the
chart plotter or built-in) or other positioning systems.
♦ Fix Status
It indicates the quality of the position fix signal.
♦ Fuel Consumption Rate
It represents the estimated fuel consumption rate (per hour) of an engine
boat referred to its relative estimated cruising speed.
♦ GNSS = Global Navigation Satellite System
It is the name used to indicate any single or combined navigation system
based on satellites. The current available satellites systems are: GPS, GLONASS
and the combined GPS and GLONASS.
♦ Goto
It is the function that defines the destination point and activates the navigation to it. The destination can be placed on any location of the map, an existing
Mark point or on a pre-defined Route.
♦ GPS = Global Positioning System
It is a satellite based navigation system operated by the US Department of
Defense. It gives the navigator a position 24 hours a day, 365 days a year
under any weather conditions.
♦ HDG = Heading
The horizontal direction in which a ship actually points or heads in any moment (see also COG).
♦ HDOP = Horizontal Dilution Of Precision
It is a parameter indicating the precision of the positioning system (GPS). The
smaller HDOP value indicates higher position accurately.
♦ Home mode
All operations refer to the ship's position.
♦ Landmarks
Landmarks are any prominent object such as monument, building, silo, tower,
mast, ..., on land which can be used in determining a location or a direction.
♦ Latitude
The angular distance North or South of the equator measured by lines encircling the earth parallel to the equator in degrees from 0° to 90°.
♦ LAT/LON
Coordinate system using Latitude and Longitude coordinates to define a position on earth.
♦ Lat/Lon Grid
It is the grid of parallels (of Latitude) and meridians (of Longitude) drawn on
the map.
♦ LOG Speed
Speed of the vessel relative to the water, provided by an instrument with a submerged transducer for measuring the distance/speed travelled by the vessel.
♦ Longitude
The angular distance East or West of the prime meridian (Greenwich meridian)
as measured by lines perpendicular to the parallels and converging at the
poles from 0° to 180°.
♦ Loran
It is a positioning system which determines the current position of the vessel
User Manual
71
Page 70

by measuring the difference in the times of reception of synchronized radio
pulse signals transmitted by two or more fixed stations.
♦ Magnetic Deviation
The value, expressed in degrees East or West that indicates the direction in
which the north indicator on the compass card is offset from the magnetic
north (the difference expressed in degrees East or West between the compass
north and the magnetic north).
♦ Magnetic Variation
The angle between the magnetic and geographic meridians at any place, expressed in degrees West or East to indicate the direction of magnetic North
from true North. It changes from point to point, and (at the same point) with
time.
♦ Mark
Reference point related to cursor position. Typically it represents by an icon
and label under Mark.
♦ Natural Features
Any topographic feature formed by the action of natural processes: coastlines,
relief, glaciers.
♦ Navigate mode
Operating mode (called also Home mode): all operations refer to the ship's
position. Navigate or Navigation mode is also used to indicate that the destination is placed.
♦ NMEA-0183
The NMEA-0183 Data Interface Standard was developed by the National Marine Electronics Association of America. It is an international standard that
enables equipment from many different manufactures to be connected together and share information.
♦ OSGB = Ordinance Survey of Great Britain
A coordinate system describing only Great Britain charts. Generally used with
GBR36 datum, which also describes only Great Britain charts. This coordinate
system cannot be used in any other part of the world.
♦ Pair
The two selectable secondary stations, of a Loran-C chain, which are used to
calculate the TD (Time Difference) position of a point in the map area covered
by the selected Loran-C chain.
♦ Pictures & Diagrams
The MAX data format allows assigning one or more image to any cartographic
object. These Pictures are typically used to facilitate the identification of cartographic objects or places around the map: they can be the landscape layout
nearby a harbour, the shape of a bridge or of a buoy etc. On some objects,
such as bridges, the image associated can represent the Diagram representing the shape of the objects and the various characteristics (length, height,
type of bridge etc.).
72 User Manual
Page 71

♦ Port Info
The Port Info function is a combination of a Port Info database containing all the
relevant Safety and Navigational information normally found in good pilot books
and a presentation software which displays special Port Facility Symbols.
♦ Ports + Services
Areas along shore with facilities for mooring, downloading and uploading of
ships, generally sheltered from waves and winds. Port installations are piers,
wharves, pontoons, dry docks, cranes... .
♦ Route
Sequence of Waypoints connected by segments (Route Legs). Among the available Routes, only one is the Active Route, which is shown by a straight line and
arrows to indicate the direction.
♦ RTCM = Radio Technical Commission for Maritime Services
The data format created by the Radio Technical Commission Maritime to transmit Differential GPS corrections.
♦ SCALE
It allows the display of Map Scale (magnitude of the reference scale expressed
in the actual unit of measure) and the current Map Datum.
♦ SNR = Signal to Noise Ratio
It is the ratio between the magnitude of a radio signal and the magnitude of
the noise (that is, the interferences). The SRN is expressed in decibels and it
is associated to the GPS satellites signal quality.
♦ SOG = Speed Over Ground
The current velocity at which the vessel is travelling, relative to a ground
location. The SOG is normally provided by the GPS sensor.
♦ SPD = Speed Through Water
The speed of the vessel relative to the water.
♦ Spot Sounding
It is the depth of the water in a specific and charted position. It is represented
on the map by its own value expressed in the current depth unit.
♦ STR = Steering
The difference between COG and CTS. If COG is 25° and CTS is 30°, then STR
is 5° Right.
♦ TD = Time Difference
Loran positions are determined by precise timing of the intervals between
reception of pulses transmitted by pairs of stations in the selected chain. Between any two stations a ship must be located somewhere along a line of
possible positions where the measured Time Difference, TD, between arrival
of pulses from those stations would be observed. The TD is measured from
the time of reception of the master station signal to the time of reception of
the slave station signal (see also Pair).
♦ Tide
The periodic rise and fall of the surface of oceans, bays, etc., due principally to
the gravitational interactions between the Moon and Earth.
♦ Tide Info
The Tide Info feature is the combination of a new tide heights database that
will be included within new C-CARDs and new features which calculate the tide
graph for all primary and secondary ports world-wide. This function can calculate the tide heights for any past or future date and as a by-product of this
calculation will also display the Maximum and Minimum Tide height and time
for the day selected plus the times of Sunrise and Sunset. At some chart
levels, the chart plotter will display a new Tide Diamond Symbol for every Port
or tide point in the database covered by that particular C-CARD.
User Manual
73
Page 72

♦ Tracks + Routes
Recommended and established routes for ships at sea, including traffic separation schemes, deep water routes.
♦ TRN = Turning
The difference between COG and BRG. If COG is 80° and BRG is 75°, TRN is 5° Left.
♦ TTG = Time To Go
The estimated time needed to reach your destination, based on your current
speed and the distance to destination.
♦ TWD = True Wind Direction
Direction of the Wind relative to a fixed point on the earth.
♦ TWS = True Wind Speed
Velocity of the Wind relative to a fixed point on the earth.
♦ Underwater Objects
Objects like obstruction, wreck, cable…
♦ User Point
Object you place on the chart identified by its coordinates and displayed on
the screen with a reference symbol (see Mark, Waypoint).
♦ UTC = Universal Time Coordinated
A time scale based on the rotation of the earth that is used by most broadcast
time services.
♦ UTM = Universal Transverse Mercator
Metric Grid system used on most large and intermediate scale land topographic charts and maps.
♦ Variation
The angle between the magnetic and geographic meridians at any place, expressed in degrees West or East to indicate the direction of magnetic North
from true North. It changes from point to point, and (at the same point) with
time.
♦ VMG= Velocity Made Good
It is the destination closing Velocity. The VMG is calculated using the current
speed of the vessel (SOG) and the difference between the current vessel
course and the bearing to the destination.
♦ WAAS = Wide Area Augmentation System
The Federal Aviation Administration (FAA), in cooperation with other DOT organizations and DOD, is augmenting the GPS/SPS with a satellite-based augmentation system, the WAAS. It will provide a signal-in-space to WAAS users to
support en route through precision approach navigation. After achieving initial
operational capability, the WAAS will then be incrementally improved over the
next years to expand the area of coverage, increase the availability of precision
approaches, increase signal redundancy and reduce operational restrictions.
♦ Waypoint
Any point to which one intends to navigate. A sequence of Waypoints makes
up a Route plan.
♦ WGS-84 = World Geodetic System 1984
Coordinates System or Datum developed by the Defense Mapping Agency
(DMA). It is the default geodetic Datum used by the chart plotter and the GPS.
♦ Zoom-In
Shows more detail in a smaller area.
♦ Zoom-Out
Operates similarly to zoom -in, but in the reverse, showing a wider but less
detailed view.
♦ XTE = Cross Track Error
The distance from the ship's present position to the closest point on a line
between the origin and destinations Waypoints of the navigation.
74 User Manual
Page 73

COLOR MAX 5I & COLOR MAX 5E
FEATURES & FUNCTIONS
♦ Direct sunlight viewable color LCD vertical display
♦ Worldwide Built-in Cartography showing C-MAP detail up to 2.0 NM
♦ Positional information from GPS
♦ GPS Signal Status page
♦ Navigation Data pages
♦ 500 Waypoints/Marks and 25 Routes (50 Waypoints max per Route)
♦ 1000 Track Points
♦ Create, Move, Insert, Edit or Erase Waypoint
♦ Create, Move, Edit or Erase Mark
♦ Navigation to Goto
♦ Create, Save, Name, Edit or Follow a Route
♦ Route Data Report and User Points (Marks/Waypoints) List pages
♦ Find Ports Services, Ports By Name, Ports By Distance, Tide Stations,
Wrecks, Obstructions, Cursor, POIs, Lakes By Name, Lakes Informa-
tions, Coordinates or User Points
♦ Display Tide info and Tide Graph page
♦ Automatic Info on cartographic objects or User Points
♦ Display vessel's position, direction and Track
♦ Alarms Handling
♦ Man OverBoard (MOB) to navigate back to a missing person or object
♦ Simulation Mode with cursor control
TECHNICAL SPECIFICATIONS
♦ Power consumption : 0.5A max @ 12V
♦ Interface : NMEA-0183
♦ Autopilot Interface : NMEA-0180, NMEA-0180/CDX, NMEA-
0183
♦ Display : Sun Light Viewable Color LCD (active area 5")
♦ Display Resolution : 240 x 320 pixels
♦ Cartography : C-MAP C-CARD
♦ Operating temperature range : 32/131 °F (0/+55 °C)
♦ Memory : Non volatile
User Manual
75
Page 74

♦ Keyboard : Silicon rubber, backlight
♦ Weight : 540 gr. (with external bracket)
460 gr. (without external bracket)
When the package containing the chart plotter is opened for the first time after
purchase, please make sure that the following contents are present (if any item is
missing, please contact your local dealer):
♦ Bracket
♦ Chart plotter's protective cover
♦ Power supply and I/O cable CBC0FS0804
♦ Fuse 2 Amp. + fuseholder
♦ User Manual
♦ Flush mounting kit + Cutting template (COLOR MAX 5E)
♦ Smart DGPS WAAS Receiver with cable 15 mt/45 feet (COLOR MAX 5E)
INSERTING/REMOVING PROCEDURE
Inserting the C-CARD
Remove the front cover as explained in the following picture. Hold the C-CARD by
the long inclined side so that you can see the C-MAP label. Gently push the C-CARD
into the slot; push the C-CARD in as far as it will go to hold fixed into the slot and
place the front cover again.
date
code
ser.n
class
A
Removing the C-CARD
Remove the front cover and the C-CARD remove out of the slot.
CHART PLOTTER DIMENSIONS
90.4mm [3.6”]
32.4mm [1.27”]
31mm [1.22”]
76 User Manual
GRAY parts are present ONLY on chart plotter WITH GPSINTERNAL
149.5mm [5.8”]
76.3mm
[3.0”]
[4.0”]
[5.0”]
101.7mm
127.2mm
155.5mm [6.1”]
188.4mm [7.4”]
Page 75

INSTALLATION AND REMOVING
GPS CONNECTOR
POWER & I/O CONNECTOR
Bracket installation for COLOR MAX 5I/COLOR MAX 5E
Flush mount installation for COLOR MAX 5E
EXTERNAL WIRING
*GRAY parts are present ONLY on
chart plotter WITH GPSEXTERNAL
MINI B
USB connector
PIN
1
2
3
4
5
6
7
8
COLOR MAX 5I/COLOR MAX 5E External Wiring
User Manual
SMART GPS
POWER & I/O CONNECTOR
CABLE COLOR
FUNCTION
BLACK
PWR-/GND/COMMON
RED
PWR + (10-35 Vdc)
WHITE
INPUT1+
GREEN
COMMON
GRAY
OUTPUT2+
YELLOW
OUTPUT1+
BROWN
INPUT2+
BLUE
EXT. ALARM SIGNAL (toGND when ON)
sensor
PIN
1
2
3
4
5
6
GPS CONNECTOR
CABLE COLOR
RED
GREEN
BROWN
NC
NC
BLACK/YELLOW/SHIELD
FUNCTION
+10-35Vdc
OUTPUT3+
INPUT3+
GND COMMON
77
Page 76

TYPICAL CONNECTIONS
AUTOPILOT
POWER & I/O CABLE
POWER & I/O CABLE
AUTOPILOT
EXTERNAL
NMEA
DEVICE
POWER & I/O CABLE
EXTERNAL
NMEA
DEVICE
POWER & I/O CABLE
GPS Connection FOR COLOR MAX 5E (EXTERNAL GPS RECEIVER)
GPS Connection on Port 3
Autopilot Connection
POWER
& I/O
1
POWER & I/O CABLE
PIN CABLE COLOR FUNCTION
1
BLACK
2
RED
3
WHITE
GREEN
4
YELLOW
6
PWR -/GND/COMMON
PWR + (10-35 Vdc)
INPUT 1+
COMMON
OUTPUT 1+
Autopilot Connection on Port 1
POWER SUPPLY
-
+
COMMON
RX+
POWER
& I/O
1
POWER & I/O CABLE
PIN CABLE COLOR FUNCTION
1
BLACK
2
RED
5
GRAY
BROWN
7
Autopilot Connection on Port 2
External NMEA Connection
POWER & I/O
1
POWER & I/O
1
POWER & I/O CABLE
PIN CABLE COLOR FUNCTION
1
BLACK
2
RED
3
WHITE
GREEN
4
YELLOW
6
External NMEA Connection on Port 1
POWER & I/O CABLE
PIN CABLE COLOR FUNCTION
1
BLACK
2
RED
5
GRAY
BROWN
7
External NMEA Connection on Port 2
PWR -/GND/COMMON
PWR + (10-35 Vdc)
OUTPUT 2+
INPUT 2+
PWR -/GND/COMMON
PWR + (10-35 Vdc)
INPUT 1+
COMMON
OUTPUT 1+
PWR -/GND/COMMON
PWR + (10-35 Vdc)
OUTPUT 2+
INPUT 2+
POWER SUPPLY
-
+
POWER SUPPLY
-
+
+
-
POWER SUPPLY
-
+
COMMON
RX+
COMMON
TX+
RX+
COMMON
RX+
TX+
EXTERNAL
NMEA
DEVICE
EXTERNAL
NMEA
DEVICE
78 User Manual
Page 77

External Alarm Connection
POWER & I/O CABLE
POWER & I/O CONNECTOR
POWER & I/O
1
PIN CABLE COLOR FUNCTION
1
1
BLACK
2
2
RED
8
8
BLUE
External Alarm Connection
C-COM GSM Plus Connection
POWER & I/O
C-COM Connection
POWER & I/O CABLE
PWR -/GND/COMMON
PWR + (10-35 Vdc)
OUTPUT EXTERNAL ALARM+
POWER SUPPLY
-
+
(Open Collector)
PIN CABLE COLOR FUNCTION
1
2
3
4
5
6
7
8
Current MAX 300mA
POWER & I/O CONNECTOR
BLACK
RED
WHITE
GREEN
GRAY
YELLOW
BROWN
BLUE
PWR-/GND/COMMON
PWR+ (10-35 Vdc)
Used by C-COM
Used by C-COM
OUTPUT2+
Used by C-COM
INPUT2+
OUTPUT EXTERNAL ALARM+
+
-
User Manual
79
Page 78

80 User Manual
Page 79

COLOR MAX WIDE E GPS &
COLOR MAX WIDE I GPS
FEATURES & FUNCTIONS
♦ Direct sunlight viewable color LCD 16/9 display
♦ Worldwide Built-in Cartography showing C-MAP detail up to 2.0 NM
♦ Positional information from GPS
♦ GPS Signal Status page
♦ Navigation Data pages
♦ 500 Waypoints/Marks and 25 Routes (50 Waypoints max per Route)
♦ 1000 Track Points
♦ Create, Move, Insert, Edit or Erase Waypoint
♦ Create, Move, Edit or Erase Mark
♦ Navigation to Goto
♦ Create, Save, Name, Edit or Follow a Route
♦ Route Data Report and User Points (Marks/Waypoints) List pages
♦ Find Ports Services, Ports By Name, Ports By Distance, Tide Stations,
Wrecks, Obstructions, Cursor, POIs, Lakes By Name, Lakes Informations, Coordinates or User Points
♦ Display Tide info and Tide Graph page
♦ Automatic Info on cartographic objects or User Points
♦ Display vessel's position, direction and Track
♦ Alarms Handling
♦ Man OverBoard (MOB) to navigate back to a missing person or object
♦ Simulation Mode with cursor control
TECHNICAL SPECIFICATIONS
♦ Power consumption : 0.5A max @ 12V
♦ Interface : NMEA0183
♦ Autopilot Interface : NMEA-0180, NMEA-0180/CDX, NMEA-
♦ Display : Sun Light Viewable Color LCD (active area 7")
♦ Display Resolution : 480 x 234 pixels
♦ Cartography : C-MAP C-CARD
♦ Operating temperature range : 32/131 °F (0/+55 °C)
♦ Memory : Non volatile with battery back-up
♦ Keyboard : Silicon rubber, backlight
♦ Weight : 1,1 Kg
0183
User Manual
81
Page 80

When the package containing the chart plotter is opened for the first time after
purchase, please make sure that the following contents are present (if any item is
missing, please contact your local dealer):
♦ External quick disconnect bracket and I/O cable 1,5 mt/5.9 feet
♦ Chart plotter's protective cover
♦ Fuse 2 Amp. + fuseholder
♦ User Manual
♦ Flush mounting kit (COLOR MAX WIDE E GPS)
♦ Smart DGPS WAAS Receiver with cable 15 mt/45 feet (COLOR MAX WIDE E GPS)
INSERTING/REMOVING PROCEDURE
Inserting the C-CARD
Open the door, hold the C-CARD by the long side so that you can see the "C-MAP"
label and gently push the C-CARD into the door slot (1). Close the door pushing
the C-CARD in as far as it will go to hold fixed into the chart plotter slot (2). When
finished the door must be right closed as shown in the picture (3).
Removing the C-CARD
To remove the C-CARD inserted in the chart plotter open the door (1). The C-CARD
will eject out of the chart plotter slot remaining fixed into the door (2). Then
remove the C-CARD from the slot (3).
CHART PLOTTER DIMENSIONS
118.5mm [4.7”]
94.5mm [3.7”]
48.5mm [1.9”]
203.5mm [8”]
[2.1”]
52.5mm
82 User Manual
GRAY parts are present ONLY on chart plotter WITH GPSINTERNAL
241mm [9.5”]
154mm [6.1”]
[3.4”]
177.8mm [7”]
86.5mm
151mm [5.9”]
Page 81

INSTALLATION AND REMOVING
QUICK DISCONNECT BRACKET CABLE
DESCRIPTION
WIRE COLOR
BLACK
RED
WHITE
GREEN
YELLOW
BROWN
GRAY
ORANGE
PINK
BLUE
PWR-/GND/COMMON
POWER+ 10-35Vdc
INPUT 1+
COMMON
OUTPUT 1+
INPUT 2+
OUTPUT 2+
INPUT 3+
OUTPUT 3+
COMMON
QUICK DISCONNECT BRACKET CABLE
DESCRIPTION
WIRE COLOR
BLACK
RED
WHITE
GREEN
YELLOW
BROWN
GRAY
ORANGE
PINK
BLUE
PWR-/GND/COMMON
POWER+ 10-35Vdc
INPUT 1+
COMMON
OUTPUT 1+
INPUT 2+
OUTPUT 2+
RTCM 104 INPUT
OUTPUT 3+
COMMON
GRAY parts are present ONLY on chart plotter WITH GPSINTERNAL
[3.9"]
126mm [5"]
100mm
211mm [8.3"]
220mm [8.7"]
Flush mount installation for COLOR MAX WIDE E GPS and
Bracket installation for COLOR MAX WIDE E GPS/COLOR MAX WIDE I GPS
EXTERNAL WIRING
115mm [4.5”]
45mm [1.8”]
User Manual
External Wiring for COLOR MAX WIDE E GPS
External Wiring forCOLOR MAX WIDE I GPS
83
Page 82

TYPICAL CONNECTIONS
GPS Connection COLOR MAX WIDE E GPS
QUICK DISCONNECT BRACKET CABLE
WIRE COLOR
BLACK
RED
WHITE
GREEN
YELLOW
BROWN
GRAY
ORANGE
PINK
BLUE
DIFFERENTIAL
FUNCTION
RTCM 104 OUTPUT+
SIGNAL RETURN
BEACON
RECEIVER
DESCRIPTION
PWR-/GND/COMMON
POWER +10-35Vdc
INPUT 1+
COMMON
OUTPUT 1+
INPUT 2+
OUTPUT 2+
INPUT 3+
OUTPUT 3+
COMMON
Autopilot Connection
QUICK DISCONNECT BRACKET CABLE
WIRE COLOR
BLACK
RED
WHITE
GREEN
YELLOW
BROWN
GRAY
ORANGE
PINK
BLUE
DESCRIPTION
PWR-/GND/COMMON
POWER+ 10-35Vdc
INPUT 1+
COMMON
OUTPUT 1+
INPUT 2+
OUTPUT 2+
INPUT 3+
OUTPUT 3+
COMMON
WIRE COLOR
RED
BROWN
GREEN
WHITE
BLACK/YELLOW/SHIELD
GPS Connections on Port 3
FUNCTION
NMEA0183/180/180CDX/INPUT+
SIGNAL RETURN
Autopilot Connections on Port 2
POWER
+
SUPPLY
GPS POWER
SWITCH
SMART GPS
SENSOR
SMART GPS SENSOR CABLE
FUNCTION
POWER +10-35 Vdc
GPS NMEA0183 OUTPUT+
GPS NMEA0183 INPUT+
RTCM 104 INPUT+
GND/SIGNAL RETURN
AUTOPILOT DEVICE
External NMEA Connection
QUICK DISCONNECT BRACKET CABLE
WIRE COLOR
BLACK
RED
WHITE
GREEN
YELLOW
BROWN
GRAY
ORANGE
PINK
BLUE
84 User Manual
DESCRIPTION
PWR-/GND/COMMON
POWER+ 10-35Vdc
INPUT 1+
COMMON
OUTPUT 1+
INPUT 2+
OUTPUT 2+
INPUT 3+
OUTPUT 3+
COMMON
FUNCTION
NMEA0183 OUTPUT+
NMEA0183 INPUT+
SIGNAL RETURN
External NMEA Connections on Port 1
NMEA0183 DEVICE
Page 83

C-COM GSM Plus Connection
To connect the modem C-COM to the chart plotter with quick disconnect bracket
follow the procedure:
1. Cut the C-COM cable about 1.96" [5 cm] from the "T" connector:
C-COM Cable
2. Connect the wires to the quick disconnect bracket cable as follows:
QUICK DISCONNECT BRACKET CABLE
BLACK
RED
WHITE
GREEN
YELLOW
DESCRIPTIONWIRE COLOR
POWER GND
POWER +10-35Vdc
INPUT 1+
COMMON
OUTPUT 1+
FUNCTION
POWER SUPPLY GND
POWER SUPPLY+
C-COM
C-COM
C-COM
C-COM GSM Plus CABLE
WIRE COLOR
BLACK
RED
WHITE
GREEN
YELLOW
FUNCTION
GND
POWER SUPPLY+
C-COM TX+
C-COM TXC-COM RX+
Connection for the Port 1
Beacon Receiver Connection COLOR MAX WIDE I GPS (Internal GPS Receiver)
QUICK DISCONNECT BRACKET CABLE
WIRE COLOR
BLACK
RED
WHITE
GREEN
YELLOW
BROWN
GRAY
ORANGE
PINK
BLUE
NOTE For COLOR MAX WIDE E GPS: To connect a Differential Beacon Receiver see
DESCRIPTION
GND/COMMON
POWER+ 10-35Vdc
INPUT 1+
COMMON
OUTPUT 1+
INPUT 2+
OUTPUT 2+
INPUT 3+
OUTPUT 3+
COMMON
previous figure "GPS Connection COLOR MAX WIDE E GPS (External Smart GPS
Receiver)".
DIFFERENTIAL BEACON RECEIVER
FUNCTION
RTCM 104 OUTPUT+
SIGNAL RETURN
User Manual
85
Page 84

86 User Manual
Page 85

COLOR MAX SEALINK I &
COLOR MAX SEALINK E
FEATURES & FUNCTIONS
♦ Direct sunlight viewable color LCD 16/9 display WVGA (800x480) resolution
♦ Worldwide Built-in Cartography showing C-MAP detail up to 2.0 NM
♦ Positional information from GPS
♦ GPS Signal Status page
♦ Navigation Data pages
♦ 500 Waypoints/Marks and 25 Routes (50 Waypoints max per Route)
♦ 1000 Track Points
♦ Create, Move, Insert, Edit or Erase Waypoint
♦ Create, Move, Edit or Erase Mark
♦ Navigation to Goto
♦ Create, Save, Name, Edit or Follow a Route
♦ Route Data Report and User Points (Marks/Waypoints) List pages
♦ Find Ports Services, Ports By Name, Ports By Distance, Tide Stations,
Wrecks, Obstructions, Cursor, POIs, Lakes By Name, Lakes Informations, Coordinates or User Points
♦ Display Tide info and Tide Graph page
♦ Automatic Info on cartographic objects or User Points
♦ Display vessel's position, direction and Track
♦ Alarms Handling
♦ Man OverBoard (MOB) to navigate back to a missing person or object
♦ Simulation Mode with cursor control
♦ Video Input option
TECHNICAL SPECIFICATIONS
♦ Power consumption (with internal GPS) : 1A max @ 12V
♦ Power consumption (no external GPS connected): 0.9A max @ 12V
♦ Interface : NMEA0183
♦ Autopilot Interface : NMEA-0180, NMEA-0180/
CDX, NMEA-0183
♦ Video Input : PAL or NTSC video signals
automatically selected
♦ Display : Sun Light Viewable Color
LCD (active area 7" wide)
User Manual
87
Page 86

♦ Display Resolution : 800 x 480 pixels
♦ Cartography : C-MAP C-CARD
♦ Operating temperature range : 32/131 °F (0/+55 °C)
♦ Memory : Non volatile
♦ Keyboard : Silicon rubber, backlight
♦ Weight : 1,1 Kg
When the package containing the chart plotter is opened for the first time after
purchase, please make sure that the following contents are present (if any item is
missing, please contact your local dealer):
♦ External bracket and I/O cable 1,5 mt/5.9 feet
♦ AUX IN I/O cable 1,5 mt/5.9 feet
♦ Video Input cable
♦ Chart plotter's protective cover
♦ Fuse 2 Amp. + fuseholder
♦ User Manual
♦ Flush mounting kit + cutting template (COLOR MAX SEALINK E)
♦ Smart DGPS WAAS Receiver with cable 15 mt/45 feet (COLOR MAX SEALINK E)
INSERTING/REMOVING PROCEDURE
Remove the front cover as explained in the following pictures. Hold the C-CARD
by the long inclined side so that you can see the C-MAP label. Gently push the
C-CARD into the slot; push the C-CARD in as far as it will go to hold fixed into the
slot and place the front cover again.
TO UNLOCK FRONT MASK PULL HERE
Removing the front cover
88 User Manual
Page 87

Placing the front cover
CHART PLOTTER DIMENSIONS
37.7mm [1.5”]
34.7mm
[1.4”]
69.8mm [2.8”]
56.5mm
[2.2”]
192.5mm [7.6”]
277.5mm [10.9”]
153.5mm [6.04”]
[3.6”]
91.4mm
177.7mm [7”]
INSERT IN THE SLOT
185.5mm [7.3”]
190.5mm [7.5”]
PROTECTIVE COVER
INSTALLATION AND REMOVING
302mm [11.9”]
232.8mm [9.2”]
120mm [4.7”]
154.8mm [6.1”]
272mm [10.7”]
Flush Installation
User Manual
100mm [3.9”]
59.5mm
MAX
14mm
89
[2.3”]
[0.6”]
Page 88

75mm [3”] 75mm [3”]
EXTERNAL WIRING
277.5mm [10.9”]
Bracket Installation
50mm
[1.6”]
40mm
6.5mm [0.3”]
[0.3”]
7.3mm
[2”]
POWER & I/O CONNECTOR/CABLE
PIN
WIRE COLOR FUNCTION
1
BLACK
2
RED
3
WHITE
4
GREEN
5
GRAY
6
YELLOW
7
BROWN
8
BLUE
A
AUX-IN I/O CONNECTOR/CABLE
PIN
WIRE COLOR
1
BLACK
2
RED
3
WHITE
4
GREEN
5
GRAY
6
YELLOW
7
BROWN
8
BLUE
FUNCTION
PWR-/GND/COMMON
POWER OUTPUT+ (10-35 Vdc)
INPUT 4+
COMMON
OUTPUT 5+
OUTPUT 4+
INPUT 5+
EXTERNAL ALARM OUTPUT 2+
PWR-/GND/COMMON
POWER INPUT+ (10-35 Vdc)
INPUT 1+
COMMON
OUTPUT 2+
OUTPUT 1+
INPUT 2+
EXTERNAL ALARM OUTPUT 1+
B
VIDEO INPUT
CONNECTOR
PIN
FUNCTION
1
CAM CONNECTORS
PIN-OUT (ON UNIT)
3
2
1
GND/COMMON
2
PWR + (10-35Vdc)
3
SIGNAL +
USB Port
C
PIN
D
1
2
3
4
5
6
E
SMART GPS
SENSOR
GPS CONNECTOR/CABLE
WIRE COLOR FUNCTION
RED
GREEN
BROWN
NC
NC
BLACK/YELLOW/SHIELD
F
POWER OUTPUT + (10-35 Vdc)
OUTPUT 3+
INPUT 3+
GND/SIGNAL RETURN
90 User Manual
Page 89

TYPICAL CONNECTIONS
POWER & I/O CABLE
GPS SENSOR CABLE
POWER & I/O CABLE
GPS SENSOR CABLE
GPS SENSOR CABLE
POWER & I/O CABLE
POWER & I/O CABLE
GPS Connection
1
POWER & I/O
POWER & I/O CABLE
PIN
WIRE COLOR
1
BLACK
2
RED
3
WHITE
4
GREEN
6
YELLOW
FUNCTION
PWR-/GND/COMMON
POWER INPUT+ (10-35 Vdc)
INPUT 1+
COMMON
OUTPUT 1+
POWER SUPPLY
-
+
-
+
GPS on Port 1
WIRE COLOR
RED
GREEN
BROWN
BLACK/YELLOW/SHIELD
GPS SENSOR CABLE
SMART GPS
SENSOR
FUNCTION
POWER OUTPUT+ (10-35 Vdc)
GPS RX+
GPS TX+
GND COMMON
1
POWER & I/O
POWER & I/O CABLE
PIN
WIRE COLOR
1
BLACK
2
RED
5
GRAY
7
BROWN
1
2
6
3
GPS
ANTENNA
5
4
FUNCTION
PWR-/GND/COMMON
POWER INPUT+ (10-35 Vdc)
OUTPUT 2+
INPUT 2+
Autopilot Connection
1
POWER & I/O
POWER & I/O CABLE
PIN
WIRE COLOR
1
BLACK
2
RED
3
WHITE
4
GREEN
6
YELLOW
1
POWER & I/O
PIN
WIRE COLOR
1
BLACK
2
RED
5
GRAY
7
BROWN
FUNCTION
PWR-/GND/COMMON
POWER INPUT+ (10-35 Vdc)
INPUT 1+
COMMON
OUTPUT 1+
POWER & I/O CABLE
FUNCTION
PWR-/GND/COMMON
POWER INPUT+ (10-35 Vdc)
OUTPUT 2+
INPUT 2+
POWER SUPPLY
-
GPS on Port 2
WIRE COLOR
PIN
RED
1
GREEN
2
BROWN
3
BLACK/YELLOW/SHIELD
6
GPS on Port 3
POWER SUPPLY
-
Autopilot on Port 1
POWER SUPPLY
-
Autopilot on Port 2
+
GPS SENSOR CABLE
FUNCTION
POWER OUTPUT+ (10-35 Vdc)
GPS RX+
GPS TX+
GND COMMON
+
+
WIRE COLOR
RED
GREEN
BROWN
BLACK/YELLOW/SHIELD
GPS SENSOR CABLE
COMMON
RX+
COMMON
RX+
SMART GPS
SENSOR
FUNCTION
POWER OUTPUT+ (10-35 Vdc)
GPS RX+
GPS TX+
GND COMMON
SMART GPS
SENSOR
AUTOPILOT
AUTOPILOT
User Manual
91
Page 90

External NMEA Connection
POWER & I/O CABLE
POWER & I/O CABLE
POWER & I/O CABLE
POWER & I/O CONNECTOR
1
POWER & I/O
POWER & I/O CABLE
PIN
WIRE COLOR
1
BLACK
2
RED
3
WHITE
4
GREEN
6
YELLOW
FUNCTION
PWR-/GND/COMMON
POWER INPUT+ (10-35 Vdc)
INPUT 1+
COMMON
OUTPUT 1+
POWER SUPPLY
+
-
External NMEA on Port 1
1
POWER & I/O
POWER SUPPLY
POWER & I/O CABLE
PIN
WIRE COLOR
1
BLACK
2
RED
5
GRAY
7
BROWN
FUNCTION
PWR-/GND/COMMON
POWER INPUT+ (10-35 Vdc)
OUTPUT 2+
INPUT 2+
External NMEA on Port 2
External Alarm Connection
POWER & I/O
1
PIN CABLE COLOR FUNCTION
1
1
BLACK
2
2
RED
8
8
BLUE
+
-
+
-
POWER & I/O CABLE
PWR -/GND/COMMON
PWR + (10-35 Vdc)
OUTPUT EXTERNAL ALARM+
COMMON
TX+
RX+
COMMON
RX+
TX+
(Open Collector)
EXTERNAL
EXTERNAL
POWER SUPPLY
-
+
Current MAX 300mA
NMEA
DEVICE
NMEA
DEVICE
+
-
External Alarm Connection
C-COM GSM PLUS Connection
POWER & I/O
C-COM Connection
92 User Manual
POWER & I/O CONNECTOR
PIN CABLE COLOR FUNCTION
1
BLACK
2
RED
3
WHITE
GREEN
4
GRAY
5
YELLOW
6
BROWN
7
BLUE
8
PWR-/GND/COMMON
PWR+ (10-35 Vdc)
Used by C-COM
Used by C-COM
OUTPUT2+
Used by C-COM
INPUT2+
OUTPUT EXTERNAL ALARM+
Page 91

COLOR MAX 6
POWER
MOB
MENU
CLEAR
ENTER
ZOOM
ZOOM
OUT
IN
FEATURES & FUNCTIONS
♦ Direct sunlight viewable LCD
♦ Worldwide Built-in Cartography showing C-MAP detail up to 2.0 NM
♦ Positional information from GPS
♦ GPS Signal Status page
♦ Navigation Data pages
♦ 500 Waypoints/Marks and 25 Routes (50 Waypoints max per Route)
♦ 1000 Track Points
♦ Create, Move, Insert, Edit or Erase Waypoint
♦ Create, Move, Edit or Erase Mark
♦ Navigation to Goto
♦ Create, Save, Name, Edit or Follow a Route
♦ Route Data Report and User Points (Marks/Waypoints) List pages
♦ Find Ports Services, Ports By Name, Ports By Distance, Tide Stations,
Wrecks, Obstructions, Cursor, POIs, Lakes By Name, Lakes Informations, Coordinates or User Points
♦ Display Tide info and Tide Graph page
♦ Automatic Info on cartographic objects or User Points
♦ Display vessel's position, direction and Track
♦ Alarms Handling
♦ Man OverBoard (MOB) to navigate back to a missing person or object
♦ Simulation Mode with cursor control
TECHNICAL SPECIFICATIONS
♦ Power consumption : 650mA @ 12V
♦ Interface : NMEA0183
♦ Autopilot Interface : NMEA-0180, NMEA-0180/CDX, NMEA-
0183
♦ Display : Color Sun Light Viewable LCD
(active area 5.6" - 113.28 x 84.71)
♦ Display Resolution : 320 x 240 pixels
♦ Cartography : C-MAP C-CARD
♦ Operating temperature range : 32/131 °F (0/+55 °C)
♦ Memory : Non volatile with battery back-up
User Manual
93
Page 92

♦ Keyboard : Silicon rubber, backlight
♦ Weight : 950 gr.
When the package containing the chart plotter is opened for the first time after
purchase, please make sure that the following contents are present (if any item is
missing, please contact your local dealer):
♦ Quick disconnect bracket
♦ Chart plotter's protective cover
♦ Fuse 2 Amp. + fuseholder
♦ User Manual
♦ Flush mounting kit
♦ Smart DGPS WAAS Receiver with cable 15 mt/45 feet
INSERTING/REMOVING PROCEDURE
Inserting the C-CARD
Hold the C-CARD by the short inclined side so that you can see the C-MAP label.
Gently push the C-CARD into one of the two slots (1); push the C-CARD in as far
as it will go, then move it to the bottom (2) to hold fixed into the slot (3).
Removing the C-CARD
Press lightly the C-CARD you wish to remove (1) and move it to the top (2) until
you hear a click: the C-CARD will eject out of the slot (3).
CHART PLOTTER DIMENSIONS
113 [4.4”]
50 [2”]
209.5 [8.3”]
For DISPLAY dimensions
please refer to the
previous paragraph
191.5 [7.5”]
39 [1.5”]
94 User Manual
“”TECHNICAL
SPECIFICATIONS
149 [5.9”]
Page 93

INSTALLATION AND REMOVING
1
128 [5”]
113 [4.5”]
2
80 [3.2”]
185 [7.3”]
From left to right: Flush mount installation, Bracket installation and removing
115 [4.5”]
45 [1.8”]
To remove the chart plotter press the bracket button (1) as indicated in the previous figure and then eject to the top the chart plotter (2).
EXTERNAL WIRING
External Wiring
TYPICAL CONNECTIONS
Autopilot Connection
User Manual
Autopilot Connections on Port 2
95
Page 94

GPS Connection
QUICK DISCONNECT BRACKET CABLE
BLACK
RED
WHITE
GREEN
YELLOW
BROWN
GRAY
ORANGE
PINK
BLUE
DESCRIPTIONWIRE COLOR
GND/COMMON
POWER +10-35Vdc
INPUT1+
INPUT1OUTPUT1+
INPUT2+
OUTPUT2+
INPUT3+
OUTPUT3+
SIGNAL - (common/return)
FUNCTION
POWER SUPPLY GND
POWER SUPPLY+
NMEA0183/C-COM
NMEA0183/C-COM
NMEA0183/180/180CDX/C-COM
NMEA0183/C-COM
NMEA0183/180/180CDX/C-COM
NMEA0183/C-COM
NMEA0183/180/180CDX/C-COM
SIGNALS RETURN
POWER
SUPPLY
GPS POWER
+
SWITCH
SMART GPS
SENSOR
DIFFERENTIAL
BEACON
RECEIVER
FUNCTION
RTCM 104 OUTPUT+
SIGNAL RETURN
GPS Connections on Port 3
SMART GPS SENSOR CABLE
WIRE COLOR
RED
BROWN
GREEN
WHITE
BLACK/YELLOW/SHIELD
FUNCTION
POWER +10-35 Vdc
GPS NMEA0183 OUTPUT+
GPS NMEA0183 INPUT+
RTCM 104 INPUT+
GND/SIGNAL RETURN
External NMEA Connection
External NMEA Connections on Port 1
C-COM GSM Plus Connection
To connect the modem C-COM to the chart plotter with quick disconnect bracket
follow the procedure:
1. Cut the C-COM cable about about 1.96" [5 cm] from the "T" connector:
2. Connect the wires to the quick disconnect bracket cable as follows:
96 User Manual
Page 95

Connection for the Port 1
Beacon Receiver Connection
To connect a Differential Beacon Receiver see previous figure "GPS Connections
on Port 3".
User Manual
97
Page 96

98 User Manual
Page 97

COLOR MAX PRO
FEATURES & FUNCTIONS
♦ Direct sunlight viewable color 11" LCD display
♦ Worldwide Built-in Cartography showing C-MAP detail up to 2.0 NM
♦ Positional information from GPS
♦ GPS Signal Status page
♦ Navigation Data pages
♦ Wind Data pages
♦ 1000 Waypoints/Marks and 50 Routes (50 Waypoints max per Route)
♦ 5000 Track Points
♦ Create, Move, Insert, Edit or Erase Waypoint
♦ Create, Move, Edit or Erase Mark
♦ Navigation to Goto
♦ Create, Save, Name, Edit or Follow a Route
♦ Route Data Report and User Points (Marks/Waypoints) List pages
♦ Find Ports Services, Ports By Name, Ports By Distance, Tide Stations,
Wrecks, Obstructions, Cursor, POIs, Lakes By Name, Lakes Informations, Coordinates or User Points
♦ Display Tide info and Tide Graph page
♦ Automatic Info on cartographic objects or User Points
♦ Display vessel's position, direction and Track
♦ Alarms Handling
♦ Man OverBoard (MOB) to navigate back to a missing person or object
♦ Simulation Mode with cursor control
♦ Video Input option
♦ Video Output option
TECHNICAL SPECIFICATIONS
♦ Power consumption : 1.3A max @ 12V
♦ Power consumption : 1.5A max @ 12V (with camera connected)
♦ Interface : NMEA0183
♦ Autopilot Interface : NMEA-0180, NMEA-0180/CDX, NMEA-
0183
User Manual
99
Page 98

♦ Video Input : PAL or NTSC video signals automati-
cally selected
♦ Video Output : VGA compatible (optional adapter cable)
♦ Display : TFT transmissive LCD (active area 10.4")
♦ Display Resolution : 800 x 600 pixels
♦ Cartography : C-MAP C-CARD
♦ Operating temperature range : 32/131 °F (0/+55 °C)
♦ Memory : Non volatile
♦ Keyboard : Silicon rubber, backlight
♦ Weight : 1,6 Kg
When the package containing the chart plotter is opened for the first time after
purchase, please make sure that the following contents are present (if any item is
missing, please contact your local dealer):
♦ External bracket and I/O cable 1,5 mt/5.9 feet
♦ AUX IN I/O cable 1,5 mt/5.9 feet
♦ Video Input cable (2 pcs)
♦ Video Output cable
♦ Chart plotter's protective cover
♦ Fuse 2 Amp. + fuseholder
♦ User Manual
♦ Flush mounting kit + cutting template
♦ Smart DGPS WAAS Receiver with cable 15 mt/45 feet
INSERTING/REMOVING PROCEDURE
Inserting the C-CARD
Hold the C-CARD by the short inclined side so that you can see the C-MAP label.
Open the door, gently push the C-CARD into one of the two slots; push the C-CARD
in as far as it will go, then close the door to hold fixed into the slot.
Removing the C-CARD
Open the door and remove the C-CARD out of one of the two slots (as shown in
the right side of the previous picture).
100 User Manual
Page 99

CHART PLOTTER DIMENSIONS
128mm 5”[]
53mm 2.1”[]
329mm 13”[]
261mm [10.3”]
40mm [1.6”]
140mm [5.5”]
45mm [1.8”]
INSTALLATION AND REMOVING
VIDEOIN2
VIDEOIN1
T
U
O
A
VG
I/O
&
R
PW
I/O
X
AU
T
AN
S
P
G
40mm
[1.6”]
140mm [5.5”]
211.2mm [8.3”]
[6.2”]
158.4mm
264mm [10.4”]
VIDEOIN1
UT
O
225mm [8.56”]
221mm [8.7”]
230.5mm [9.1”]
VIDEOIN2
175mm [6.9”]
User Manual
101
Page 100

EXTERNAL WIRING
POWER & I/O CABLE
GPS SENSOR CABLE
POWER & I/O CABLE
GPS SENSOR CABLE
AUX-IN I/O CONNECTOR/CABLE
PIN
WIRE COLOR FUNCTION
1
BLACK
2
RED
3
WHITE
4
GREEN
5
GRAY
6
YELLOW
7
BROWN
8
BLUE
PIN
WIRE COLOR FUNCTION
1
RED
2
GREEN
3
BROWN
4
NC
5
NC
6
BLACK/YELLOW/SHIELD
GND/COMMON
POWER OUTPUT+
INPUT 4+
COMMON
OUTPUT 5+
OUTPUT 4+
INPUT 5+
EXTERNAL ALARM OUTPUT+
SMART
GPS
SENSOR
(10-35 Vdc)
GPS CONNECTOR/CABLE
POWER OUTPUT+ (10-35 Vdc)
OUTPUT 3+
INPUT 3+
GND/SIGNAL RETURN
TYPICAL CONNECTIONS
GPS Connection
1
POWER & I/O
POWER & I/O CABLE
PIN
WIRE COLOR
1
BLACK
2
RED
3
WHITE
4
GREEN
6
YELLOW
FUNCTION
PWR-/GND/COMMON
POWER INPUT+ (10-35 Vdc)
INPUT 1+
COMMON
OUTPUT 1+
POWER SUPPLY
-
+
-
POWER & I/O CONNECTOR/CABLE
PIN
WIRE COLOR FUNCTION
1
BLACK
2
RED
3
WHITE
4
GREEN
5
GRAY
6
YELLOW
7
BROWN
8
BLUE
VIDEO OUTPUT
CONNECTOR
PIN FUNCTION
1 GND
2 VCC
3R
4G
5B
6 HSYNC
7 VSYNC
8 N.C.
9 BRIGHT. CONTROL
GND/COMMON
POWER INPUT+ (10-35 Vdc)
INPUT 1+
COMMON
OUTPUT 2+
OUTPUT 1+
INPUT 2+
EXTERNAL ALARM OUTPUT+
USB Port
Mini B
CAM CONNECTORS
PIN-OUT (ON UNIT)
3
2
1
+
WIRE COLOR
RED
GREEN
BROWN
BLACK/YELLOW/SHIELD
VIDEO INPUT
CONNECTOR
PIN
FUNCTION
1
GND/COMMON
2
PWR + (10-35Vdc)
3
SIGNAL +
SMART GPS
SENSOR
GPS SENSOR CABLE
FUNCTION
POWER OUTPUT+ (10-35 Vdc)
GPS RX+
GPS TX+
GND COMMON
GPS on Port 1
1
POWER & I/O
POWER & I/O CABLE
PIN
WIRE COLOR
1
BLACK
2
RED
5
GRAY
7
BROWN
FUNCTION
PWR-/GND/COMMON
POWER INPUT+ (10-35 Vdc)
OUTPUT 2+
INPUT 2+
POWER SUPPLY
+
-
WIRE COLOR
RED
GREEN
BROWN
BLACK/YELLOW/SHIELD
GPS SENSOR CABLE
SMART GPS
SENSOR
FUNCTION
POWER OUTPUT+ (10-35 Vdc)
GPS RX+
GPS TX+
GND COMMON
GPS on Port 2
102 User Manual
 Loading...