

Page 1

CHART PLOTTER NAME DESCRIPTION SOFTWARE
EC5E 5" Sunlight Readable Vertical Color Display S4x2SW5vc
EC5
I 5" Sunlight Readable Vertical Color Display S4x2SW5vc
FE 5" Sunlight Readable Vertical Color Display S4x2SW5vc
EC5
FI 5" Sunlight Readable Vertical Color Display S4x2SW5vc
EC5
EC7
E 7" Sunlight Readable WVGA Color Display S4x2SW8wc
I 7" Sunlight Readable WVGA Color Display S4x2SW8wc
EC7
FE 7" Sunlight Readable WVGA Color Display S4x2SW8wc
EC7
EC7
FI 7" Sunlight Readable WVGA Color Display S4x2SW8wc
EC11 11" Sunlight Readable Color Display S5e2SW11c
External Smart GPS Receiver
Internal GPS Receiver
External Smart GPS Receiver & Internal FF
Internal GPS Receiver & Internal FF
External Smart GPS Receiver & Video Input
Internal GPS Receiver & Video Input
External Smart GPS Receiver & Video Input & Internal FF
Internal GPS Receiver & Video Input & Internal FF
External Smart GPS Receiver & Video Input
Copyright 2009 Seiwa - Hong Kong
All rights reserved. No part of this publication may be reproduced or distributed in any form or by any means, or stored in
a database or retrieval system, without prior written permission of the publisher.
User Manual
code: (A1607-011209e)
Page 2

Important Information
WARNING
Electronic charts displayed by the chart plotter are believed to be accurate and
reliable, but they are not intended to replace official charts which should remain
your main reference for all the matters related to the execution of a safe navigation. For this reason we would like to remind you that you are required to carry on
board and use the officially published and approved nautical charts.
CAUTION
♦ Please read through this manual before the first operation. If you have any
questions, please contact the Company's customer service or your local
dealer.
♦ The chart plotter is not built water proof. Please give attention to avoid
water intrusion into the chart plotter. Water damage is not covered by the
warranty.
♦ Extensive exposure to heat may result in damage to the chart plotter.
♦ Connection to the power source with reversed polarity will damage the chart
plotter severely. This damage is not covered by the warranty.
♦ The chart plotter contains dangerous high voltage circuits which only expe-
rienced technicians MUST handle.
♦ The C-MAP BY JEPPESEN DATA MEDIA are available from your local dealer.
♦ Exposure of the display to UV rays may shorten the life of the liquid crystals
used in your plotter. This limitation is due to the current technology of the
LCD displays.
♦ Avoid overheating which may cause loss of contrast and, in extreme cases,
a darkening of the screen. Problems which occur from overheating are reversible when temperature decreases.
Please be aware that the serial ports are not opto-isolated and then the
external device is electrically connected to the chart plotter. This allows the
connection of high speed devices, like Radar or Fish Finder. If you are
connecting a NMEA0183 device and you would like to isolate it from the chart
plotter, you have to add the opto-isolator externally.
WARNING ON SERIAL PORTS CONNECTION
CLEANING PROCEDURE FOR THE PLOTTER SCREEN
Cleaning your chart plotter screen is a very important operation and must be
done carefully , as the window's surface is covered with and antireflective coating.
The following is the cleaning procedure: you use a tissue or lens tissue and a
cleaning spray containing Isopropanol (a normal spray cleaner sold for the PC
screen, for example PolaClear by Polaroid). Fold the tissue or lens tissue into a
triangular shape, moisten the tip and use the index finger behind a corner to
move the tissue across the surface, in overlapping side to side strokes. If the
tissue is too wet, a noticeable wet film will be left in its path and you will need to
repeat the process. If too dry, the tissue won’t glide easily, and may damage the
surface.
NOTE We will not be liable for errors contained herein, or for incidental or
4 User Manual
consequential damages in connection with the performance or use of this
material.
Page 3

Contents
Important Information ................................................................................. 4
WARNING ................................................................................. 4
CAUTION ................................................................................. 4
CLEANING PROCEDURE FOR THE PLOTTER SCREEN .................................................. 4
About this User Manual ............................................................................... 11
INTRODUCTION ............................................................................... 11
CONVENTIONS USED ............................................................................... 11
MANUAL LAYOUT ............................................................................... 11
IF YOU NEED ASSISTANCE ............................................................................... 12
1. Getting Started ...............................................................................13
1.1 THE KEYBOARD ............................................................................... 13
Joystick (Cursor key) ............................................................................... 13
Dedicated Keys ............................................................................... 13
Software Keys ............................................................................... 14
Software Keys Customization ........................................................................ 14
Alphanumeric Input Procedure ...................................................................... 15
1.2 SWITCHING ON/OFF ............................................................................... 15
Switching On ............................................................................... 15
Switching Off ............................................................................... 15
1.3 FIRST SETUP PAGE ............................................................................... 15
1.4 CHANGING BACKLIGHT AND CONTRAST......................................................... 16
1.5 SELECTING THE LANGUAGE ......................................................................... 17
1.6 SELECTING THE CHART LANGUAGE ............................................................... 17
1.7 C-MAP BY JEPPESEN MAX CARTOGRAPHY INFORMATION ...................................... 17
Data Features ............................................................................... 17
Presentation Features ............................................................................... 18
Cartographic Data related Features................................................................ 18
1.8 USING C-MAP BY JEPPESEN DATA MEDIA ........................................................... 19
1.9 SIMULATION MODE ............................................................................... 19
1.10CONTROLLING THE DISPLAY ........................................................................ 19
Changing Display Mode ............................................................................... 19
Moving around the Chart and Changing Chart Scale ......................................... 22
Finding Your Boat Position ............................................................................ 22
Selecting Screen Amplifier ............................................................................ 22
Selecting Map Orientation ............................................................................ 22
1.11NAVIGATION TO A SINGLE DESTINATION....................................................... 23
1.12RANGE/BEARING FUNCTION ......................................................................... 23
Inserting R/B ............................................................................... 23
Deleting R/B ............................................................................... 23
Editing R/B ............................................................................... 23
1.13MAN OVERBOARD (MOB) ............................................................................. 23
Inserting MOB ............................................................................... 23
Selecting Auto Info on MOB .......................................................................... 23
Deleting MOB ............................................................................... 23
2. Operations ............................................................................... 25
2.1 USER POINTS: MARKS, EVENTS AND WAYPOINTS ........................................... 25
Creating Waypoint ............................................................................... 25
Creating Mark ............................................................................... 25
User Manual
5
Page 4

Creating Event ............................................................................... 25
Editing User Point ............................................................................... 25
Deleting User Point ............................................................................... 25
Moving User Point ............................................................................... 26
Locating User Point on Map........................................................................... 26
Sending/Receiving User Point........................................................................ 26
Selecting User Points List page ...................................................................... 26
2.2 ROUTES ............................................................................... 27
Selecting Active Route ............................................................................... 27
Creating a Route ............................................................................... 27
Inserting notes on Route .............................................................................. 27
Hiding or Showing Route .............................................................................. 27
Selecting Route Color ............................................................................... 27
Deleting Route ............................................................................... 28
Following a Route (Activate the Navigation) .................................................... 28
Inserting Waypoint ............................................................................... 28
Reversing Route ............................................................................... 28
Selecting Route Report page ......................................................................... 28
Sending Route ............................................................................... 29
Receiving Route ............................................................................... 29
Safe Route Checking ............................................................................... 29
2.3 GOTO FUNCTION ............................................................................... 30
Navigation to Waypoint ............................................................................... 30
Deleting destination ............................................................................... 30
2.4 USING TRACK ............................................................................... 30
Setting up a Track Step ............................................................................... 31
Selecting Track Color ............................................................................... 31
Displaying Track ............................................................................... 31
Activating/Deactivating Track Recording ......................................................... 31
Clearing Track ............................................................................... 31
Selecting Track Number ............................................................................... 32
TRACK TO ROUTE FUNCTION ........................................................................ 32
Track To Route ............................................................................... 32
Select Track Number ......................................................................... 32
2.5 DATA WINDOW CUSTOMIZATION ON CHART PAGE .......................................... 32
2.6 INFO ............................................................................... 33
2.7 PORT & TIDE INFO ............................................................................... 36
2.8 FIND FUNCTION ............................................................................... 37
Select Route Number ......................................................................... 32
Setting Automatic Info ............................................................................... 33
Selecting Automatic Info .............................................................................. 33
Displaying Expanded Info page (Full Info) ....................................................... 33
Info on objects with Pictures ......................................................................... 33
Info Tree and Expanded Info page ................................................................. 34
Quick Info on Lakes ............................................................................... 34
Full Info on Lakes ............................................................................... 35
Getting Port Info ............................................................................... 36
Getting Tide Info ............................................................................... 36
Finding Nearest Port Services........................................................................ 38
Finding Nearest Port By Name....................................................................... 38
Finding Nearest Port By Distance ................................................................... 38
Finding Nearest Tide Station ......................................................................... 38
Finding Nearest Wrecks ............................................................................... 38
Finding Nearest Obstructions ........................................................................ 38
Finding Nearest Lakes Information................................................................. 38
Finding Nearest Lakes By Name .................................................................... 39
Finding Nearest Points Of Interest ................................................................. 39
Finding Cursor ............................................................................... 39
Finding Coordinates ............................................................................... 39
Finding User Points ............................................................................... 39
6 User Manual
Page 5

2.9 ALARMS ............................................................................... 39
Auto Off ............................................................................... 39
Arrival Alarm ............................................................................... 39
XTE Alarm ............................................................................... 40
Anchor Alarm ............................................................................... 40
Depth Alarm ............................................................................... 40
HDOP Alarm ............................................................................... 40
Heading Alarm ............................................................................... 40
Grounding Alarm ............................................................................... 40
Grounding Alarm Range ............................................................................... 41
Grounding Alarm Report............................................................................... 41
External Alarm ............................................................................... 41
2.10USER MEDIA: Save & Load Menu................................................................... 41
USER MEDIA page ............................................................................... 41
Formatting USER MEDIA .............................................................................. 42
Saving File on USER MEDIA .......................................................................... 42
Loading File from USER MEDIA ...................................................................... 42
Deleting File from USER MEDIA ..................................................................... 43
Reading USER MEDIA directory ..................................................................... 43
Sorting USER MEDIA directory ...................................................................... 43
3. User Setting Up ...............................................................................45
3.1 GENERAL Options MENU............................................................................... 45
3.2 MAP Options Menu ............................................................................... 45
Zoom Type ............................................................................... 45
Fonts & Symbols ............................................................................... 45
Perspective View ............................................................................... 46
Dynamic Nav-Aids ............................................................................... 46
Map Orientation ............................................................................... 46
Mixing Levels ............................................................................... 47
Safety Status Bar (DSI = Data Safety Indicator).............................................. 47
Palette ............................................................................... 48
Satellite Imagery ............................................................................... 48
Currents Prediction ............................................................................... 48
3.3 OTHER MAP CONFIGURATIONS ..................................................................... 49
Display Mode ............................................................................... 49
Marine Settings ............................................................................... 49
Depth Settings ............................................................................... 50
Land Settings ............................................................................... 50
Chart Settings ............................................................................... 50
Underwater Objects Settings ........................................................................ 50
3.4 DISPLAY OPTIONS MENU ............................................................................. 51
3.5 VIDEO MODE ............................................................................... 52
3.5.1 Add Video menu ............................................................................... 52
3.5.2 Video Input menu ............................................................................. 52
3.6 ADVANCED OPTIONS MENU.......................................................................... 52
3.6.1 Input/Output menu ........................................................................... 52
GPS Connection ............................................................................... 53
GPS Setup Menu ............................................................................... 53
Fish Finder Transmission .................................................................... 53
Autopilot Connection ......................................................................... 53
External NMEA Connection ................................................................. 53
C-COM GSM Plus Connection .............................................................. 53
Output Sentences ............................................................................. 54
NMEA-0183 Output Talker ID.............................................................. 54
External Signal ............................................................................... 54
Cable Wiring pages............................................................................ 54
Send/Receive Routes & Marks ............................................................. 54
3.6.2 C-Link menu ............................................................................... 55
3.6.3 Fix & Compass menu ......................................................................... 55
User Manual
7
Page 6

3.7 AIS ............................................................................... 55
3.7.1 AIS System Definitions ...................................................................... 56
3.7.2 To set the chart plotter for receiving AIS .............................................. 57
3.7.3 AIS Menu ............................................................................... 57
3.7.4 Quick Info on AIS Target .................................................................... 57
3.8 C-WEATHER SERVICE ............................................................................... 58
3.8.1 C-WEATHER SERVICE Menu ............................................................... 58
Copy from USER MEDIA ..................................................................... 58
Download ............................................................................... 58
Forecast ............................................................................... 59
Real Time View ............................................................................... 59
3.9 DSC ............................................................................... 60
3.10FISH FINDER ............................................................................... 62
3.11RADAR ............................................................................... 62
3.12SYSTEM INFORMATION ............................................................................... 62
4. C-LINK ............................................................................... 63
4.1 HOW C-LINK SYSTEM WORKS ....................................................................... 63
4.2 C-LINK SERIAL CONNECTION ....................................................................... 63
4.3 C-LINK NAVIGATION DATA TRANSFER ........................................................... 63
4.4 OPERATIONS ............................................................................... 64
4.5 QUICK INFO ............................................................................... 67
5. FISH FINDER FOR EC5fe/EC5fi/EC7fe/EC7fi .................................................... 69
5.1 SETTING THE INTERNAL FISH FINDER ON ...................................................... 69
5.2 UNDERSTANDING THE FISH FINDER PAGE ..................................................... 69
5.3 DISPLAYING THE FISH FINDER PAGE ............................................................. 72
5.4 ZOOM MODES ............................................................................... 76
5.5 SOUNDER ADJUSTMENTS WITH SOFT KEYS .................................................... 77
5.6 FISH FINDER SETUP MENU ........................................................................... 77
Type of Data ............................................................................... 59
3.9.1 Distress Call and Position Request ....................................................... 60
3.9.2 DSC Log page ............................................................................... 61
3.9.3 DSC Directory page ........................................................................... 61
3.9.4 Quick Info on DSC Icons .................................................................... 62
Introductive Elements ............................................................................... 64
Master Chart Plotter ............................................................................... 64
Slave Chart Plotter ............................................................................... 65
C-Link Navigation Data: Acquisition and Display............................................... 65
Graphical Representation on Map Display........................................................ 65
Route Data Report ............................................................................... 66
Route Navigation: Quick Info on the Destination .............................................. 67
Quick info on Single Destination .................................................................... 67
5.2.2 Understanding the Echogram display ................................................... 71
5.3.1 How to select the Fish Finder page ....................................................... 72
Selection by Soft Key......................................................................... 72
5.3.2 Fish Finder Full page .......................................................................... 73
5.3.3 Dual Frequency page ......................................................................... 74
5.3.4 Zoom page ............................................................................... 74
5.3.5 Chart/Fish page ............................................................................... 75
5.3.6 Fish Finder and Radar pages ............................................................... 75
5.4.1 The Bottom Lock Zoom ...................................................................... 76
5.4.2 The Marker Zoom.............................................................................. 76
5.6.1 Preset Mode ............................................................................... 78
5.6.2 Gain Mode ............................................................................... 78
5.6.3 Range Mode ............................................................................... 78
5.6.4 Depth ............................................................................... 78
5.6.5 Shift ............................................................................... 78
5.6.6 Bottom Range ............................................................................... 78
5.6.7 Frequency ............................................................................... 78
8 User Manual
Page 7

5.6.8 Interference Rejection ....................................................................... 78
5.6.9 Sensitivity Menu ............................................................................... 79
5.6.10 Display Setup Menu ........................................................................... 79
5.6.11 Transducer Setup Menu ..................................................................... 79
5.6.12 Alarms Menu ............................................................................... 80
5.6.13 Save & Load Menu ............................................................................ 80
5.7 TRANSDUCERS ............................................................................... 80
6. GPS ............................................................................... 81
6.1 HOW GPS WORKS ............................................................................... 81
6.1.1 Position Fixing Accuracy: HDOP ........................................................... 82
7. Maintenance ............................................................................... 83
7.1 SYSTEM TEST ............................................................................... 83
7.1.1 RAM Menu ............................................................................... 83
7.1.2 DIM Menu ............................................................................... 83
7.1.3 Media ............................................................................... 83
7.1.4 Modem test ............................................................................... 83
7.1.5 Serial Ports ............................................................................... 84
7.1.6 External Alarm ............................................................................... 84
Terms ............................................................................... 85
EC5e/EC5i ............................................................................... 91
FEATURES & FUNCTIONS ............................................................................... 91
TECHNICAL SPECIFICATIONS .............................................................................. 92
INSERTING/REMOVING PROCEDURE .................................................................... 93
Inserting the MEDIA ............................................................................... 93
Removing the MEDIA ............................................................................... 93
CHART PLOTTER DIMENSIONS ............................................................................ 93
INSTALLATION AND REMOVING ........................................................................... 93
EXTERNAL WIRING ............................................................................... 94
TYPICAL CONNECTIONS ............................................................................... 95
EC5fe/EC5fi ...............................................................................97
FEATURES & FUNCTIONS ............................................................................... 97
TECHNICAL SPECIFICATIONS .............................................................................. 98
FF MODULE 600W-50-200KHz TECHNICAL SPECIFICATIONS ................................... 98
INSERTING/REMOVING PROCEDURE .................................................................... 99
Inserting the MEDIA ............................................................................... 99
Removing the MEDIA ............................................................................... 99
CHART PLOTTER DIMENSIONS ............................................................................ 99
INSTALLATION AND REMOVING ........................................................................... 99
EXTERNAL WIRING ............................................................................. 100
TYPICAL CONNECTIONS ............................................................................. 101
EC7e/EC7i ............................................................................. 103
FEATURES & FUNCTIONS ............................................................................. 103
TECHNICAL SPECIFICATIONS ............................................................................ 104
INSERTING/REMOVING PROCEDURE .................................................................. 105
Inserting the MEDIA ............................................................................. 105
Removing the MEDIA ............................................................................. 105
CHART PLOTTER DIMENSIONS .......................................................................... 105
INSTALLATION AND REMOVING ......................................................................... 105
EXTERNAL WIRING ............................................................................. 106
TYPICAL CONNECTIONS ............................................................................. 107
EC7fe/EC7fi ............................................................................. 109
FEATURES & FUNCTIONS ............................................................................. 109
TECHNICAL SPECIFICATIONS ............................................................................ 110
User Manual
9
Page 8

FF MODULE 600W-50-200KHz TECHNICAL SPECIFICATIONS ................................. 110
INSERTING/REMOVING PROCEDURE .................................................................. 111
Inserting the MEDIA ............................................................................. 111
Removing the MEDIA ............................................................................. 111
CHART PLOTTER DIMENSIONS .......................................................................... 111
INSTALLATION AND REMOVING ......................................................................... 112
EXTERNAL WIRING ............................................................................. 112
TYPICAL CONNECTIONS ............................................................................. 113
EC11 ............................................................................. 115
FEATURES & FUNCTIONS ............................................................................. 115
TECHNICAL SPECIFICATIONS ............................................................................ 116
INSERTING/REMOVING PROCEDURE .................................................................. 116
Inserting the MEDIA ............................................................................. 116
Removing the MEDIA ............................................................................. 117
CHART PLOTTER DIMENSIONS .......................................................................... 117
INSTALLATION AND REMOVING ......................................................................... 117
EXTERNAL WIRING ............................................................................. 118
TYPICAL CONNECTIONS ............................................................................. 118
GPS Connection ............................................................................. 118
Autopilot Connection ............................................................................. 119
External NMEA Connection ......................................................................... 119
External Alarm Connection ......................................................................... 120
C-COM GSM PLUS Connection ..................................................................... 120
Installing the Smart GPS External EC5e/EC5fe/EC7e/EC7fe/EC11.................. 121
INSTALLING ............................................................................. 121
DIMENSIONS ............................................................................. 122
Analytical Index ............................................................................. 123
CERTIFICATE OF LIMITED WARRANTY................................................................ 128
10 User Manual
Page 9

About this User Manual
INTRODUCTION
The chart plotter is a state-of-the-art computerized electronic chart system, designed as a sophisticated navigation aid. User friendly operations make the chart
plotter easy to operate. All calculations and information necessary for the navigation are performed and displayed on the screen quickly and accurately providing
all of the facilities of a conventional GPS but with the added benefit of a powerful
electronic chart display. The cartographic information is obtained from C-MAP BY
JEPPESEN DATA MEDIA that are available through your local dealer.
For additional information on C-MAP BY JEPPESEN Cartography visit web site at
www.jeppesen.com.
CONVENTIONS USED
Throughout this User Manual, the labelled keys are shown in capital letters enclosed in square brackets, for example [ENTER]; the software and functions keys
are shown in small letters enclosed in square brackets, for example [Edit].
Menu operations are in bold characters listed by keys sequence with the menu
names enclosed between inverted commas, for example [MENU] + "Alarms" +
[ENTER] means: press the [MENU] key, using the cursor key select the Alarms
menu and then press [ENTER].
Any menu operation and function activation in this User Manual is related to all
chart plotter models. Whenever needed, a note has been added for different
models.
MANUAL LAYOUT
♦ CHAPTER 1: Getting Started
Overview of the controls and how to start using the chart plotter.
♦♦
♦ CHAPTER 2: Operations
♦♦
Description of the operation procedures of the chart plotter in detail.
♦ CHAPTER 3: User Setting Up
Set up of the chart plotter, the charting preferences and the GPS options.
♦ CHAPTER 4: C-LINK
C-Link system is a feature used to share the same cartographic data
between two chart plotter units linked via serial I/O port.
♦ CHAPTER 5: FISH FINDER (EC5FE/EC5FI/EC7FE/EC7FI)
Introduction to the basic information on the internal Fish Finder, its
features and use.
♦ CHAPTER 6: GPS
GPS antenna and set up of the hardware configuration.
♦ CHAPTER 7: Maintenance
User maintenance guidelines.
♦ Terms
List of the terms and abbreviations used in the User Manual.
♦ EC5E/EC5I
Introduction to the basic information on EC5E/EC5I chart plotter, its
features and use. Installation of the chart plotter.
User Manual
11
Page 10

♦ EC5FE/EC5FI
Introduction to the basic information on EC5FE/EC5FI chart plotter with
internal Fish Finder , its features and use. Installation of the chart plotter.
♦ EC7E/EC7I
Introduction to the basic information on EC7E/EC7I chart plotter, its
features and use. Installation of the chart plotter.
♦ EC7FE/EC7FI
Introduction to the basic information on EC7FE/EC7FI chart plotter with
internal Fish Finder , its features and use. Installation of the chart plotter.
♦ EC11
Introduction to the basic information on EC11 chart plotter, its features
and use. Installation of the chart plotter.
♦ INSTALLING THE EXTERNAL SMART GPS (EC5E/EC5FE/EC7E/EC7 FE/EC11)
Introduction to the basic information on External Smart GPS Antenna
and its installation.
Analytical Index is at the end of this User Manual.
IF YOU NEED ASSISTANCE
If your chart plotter does not operate properly, please refer to Chapter 7. Most
common operating difficulties can be diagnosed using these tests.
If you still need assistance, call your local dealer, reporting the information available in the System Information page.
12 User Manual
Page 11
1. Getting Started
This chapter provides basic information to get you started using the chart plotter;
it will help you in becoming familiar with the chart display and the functions of the
controls before you start using the chart plotter.
1.1 THE KEYBOARD
Joystick (Cursor key)
Moves the cursor on the display screen quickly and accurately and in the menu
page(s) scrolls the desired option. If in Navigate (Home) mode, it allows to exit
from Navigate mode.
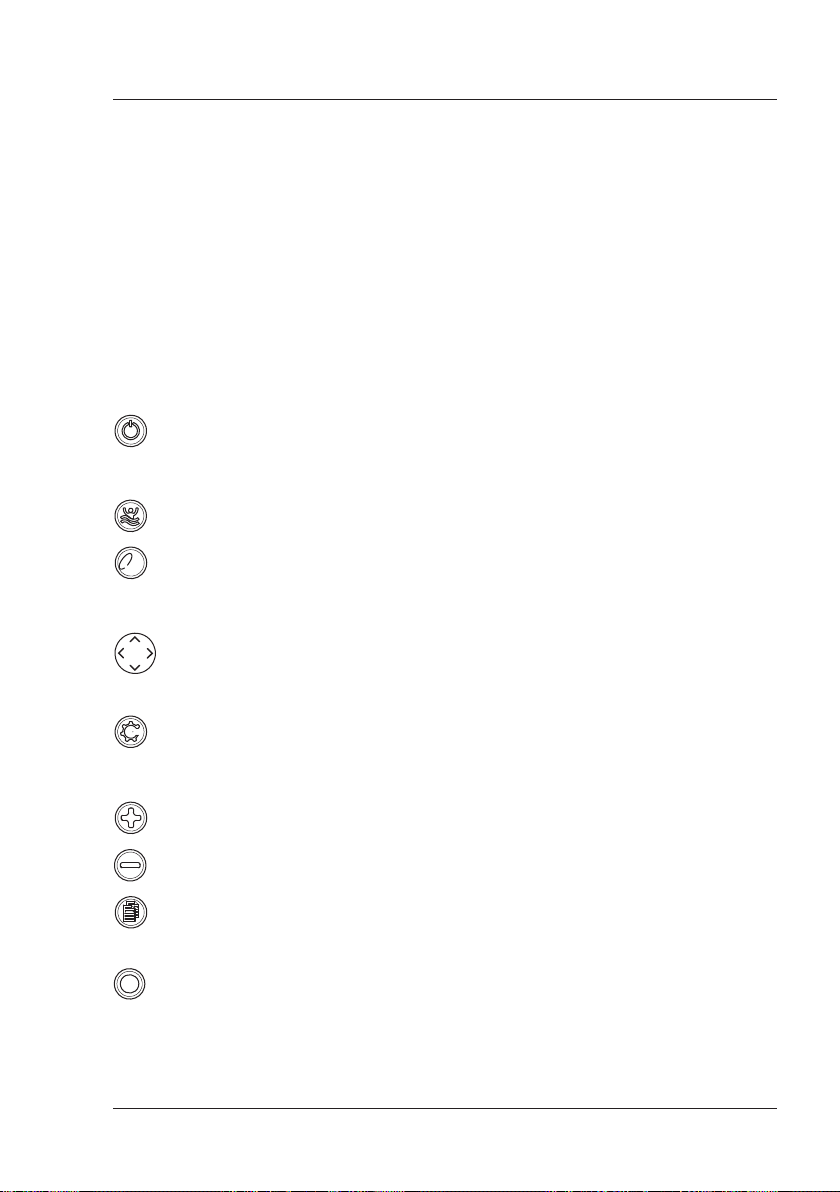
Dedicated Keys
[POWER] ♦ keep it pressed for 1 second to turn On the chart plotter
♦ keep it pressed for 3 seconds to turn Off the chart plotter
♦ press it to adjust the backlight and contrast of the display
[MOB] ♦ inserts the MOB (Man OverBoard) on the ship's position
[CLEAR] ♦ exits from menu or leaves a menu without making changes
clear
♦ if you are not into a menu, sets the Navigate (Home) mode:
the cursor is centered on ship's position
[ENTER] ♦ places Marks, Waypoints, destination (Goto) and selects R/B
♦ confirms selection
menu
[MENU] ♦ opens the main Menu
♦ when in chart and data page, keep it pressed for 3 seconds
to customize data fields of the text area
[ZOOM IN] ♦ shows more details of a smaller area
[ZOOM OUT]♦ shows a wider, less detailed area
[PAGE] ♦ selects the preferred screen configuration
EC11:
data
[DATA] ♦ opens the User Data menu (Route, Tr ack, User Points, Save &
Load)
User Manual
13
Page 12

Software Keys
The software keys (soft keys) have different functions according to the modes of
operation: their labels for the current functions, located on the front panel, are
shown on the screen right above the keys. Also they are used from the chart
screen or from the data pages to select one of the data pages available to allow
faster access to the page selection.
When the chart page is selected, the soft key labels are not shown. By pressing
one of the four soft keys their labels for the current functions are shown on the
screen immediately above the soft keys. When the soft key labels are shown, by
pressing the associated soft key the relative function is executed. By pressing
[CLEAR] the four soft key labels disappear.
Software Keys Customization
Note that when the soft keys labels are shown the user can customize them.
Pressing and holding down any of the four soft key shows a pop-up window on the
top of the soft key pressed that contains all possible data pages assignable to the
soft key pressed. Move the cursor key up/down to place the selector on the
desired item; move the cursor key to the right or press [ENTER] to set the
selected item; move the cursor key to the left or press [CLEAR] to close the popup window. The possible choices are:
♦ CHART [Chart] (Chart Display page)
♦ NAVIGATION [Nav Data] (Navigation Data page)
♦ 3D ROAD [3D Road] (3D Road page)
♦ GPS STATUS [Status] (GPS Status page)
♦ WIND DATA
♦ GAUGES [Gauges] (Gauges page)
♦ DEPTH FULL [Depth 1] (Depth Graph Full page)
♦ DEPTH [Depth 2] (Depth Graph page)
♦ FISH FINDER [FF Std] (Fish Finder Full page)
♦ FISH FINDER [FF Dual] (Fish Finder Dual Frequency page)
♦ FISH FINDER [FF Splt] (Fish Finder Zoom page)
♦ FISH FINDER [FF+Map] (Fish Finder and Chart page)
♦ RADAR
♦ RADAR
♦ RADAR
♦ RADAR
♦ RADAR
♦ ADD VIDEOCAMERA
♦ ADD VIDEOCAMERA 1
♦ ADD VIDEOCAMERA 2
♦ VIDEOCAMERA
♦ VIDEOCAMERA 1
♦ VIDEOCAMERA 2
♦ MARK [Mark] (Mark place)
♦ EVENT [Event] (Event place)
♦ WAYPOINT [Waypoint] (Waypoint place)
♦ TRACK [Track] (Track storing activated/deactivated)
NOTE1AVAILABLE FOR EC7E/EC7I/EC7FE/EC7FI/EC11.
NOTE2AVAILABLE FOR EC11.
NOTE3AVAILABLE FOR EC7E/EC7I/EC7FE/EC7FI.
1
1
1
1
1
1
3
[WindData] (Wind Data page)
[Rd Std] (Radar Full page)
[Rd+Map] (Radar and Chart page)
[Rd+FF] (Radar and Fish Finder page)
[Rd+Data] (Radar and data page)
[Combo 4] (Radar, Fish finder , Chart and data page)
3
[AddVid] (Add screen video image)
2
[AddVid1] (Add screen video image 1)
2
[AddVid2] (Add screen video image 2)
[Video] (Full screen video image)
2
[Video 1] (Full screen video image 1)
2
[Video 2] (Full screen video image 2)
14 User Manual
Page 13

Alphanumeric Input Procedure
When editing a Waypoint (see the following picture) or when entering menu information, insert data by using the visual alphabetical table shown:
Fig. 1.1 - Example of Visual Alphabetical table
The table shows all the characters usable. Use the cursor key to go through the
available characters and select the requested one. The four soft keys are now
activated to:
♦ [Save] :to save when the entry is complete. After pressing [Save] the
Soft Keys disappear: press [Accept] to end the input procedure
♦ [Change] : to switch between numeric/non-numeric digits
♦ [Previous]: to go back to previous page
♦ [Next] : to move to next page
1.2 SWITCHING ON/OFF
Before powering On the chart plotter, check for the correct voltage (10-35 volt
dc) and the correct connections with the positioning instrument.
Switching On
In the opening page, underneath the SI-TEX logo, you will find the software version and type. The next page is the First Setup page (see Par. 1.3) which is
activated only when the chart plotter is turned on for the first time and after a
Master reset. Then the chart plotter will automatically show the Jeppesen warning
page and the GPS Status page. Pressing [CLEAR] at this stage to activate the
cartography page.
[POWER] for 1 second
Switching Off
A countdown timer appears on the screen, if you release the key before the
countdown timer reaches zero, the chart plotter will remain On.
[POWER] for 3 seconds
1.3 FIRST SETUP PAGE
This menu allows you to configure the chart plotter and the external devices the
first time the chart plotter is powered On. This information can be changed at any
time either from the General Options menu (see Par. 3.1) or by resetting the chart
plotter. Select the correct setup option and press [ENTER], when complete press
[OK] to exit.
User Manual
15
Page 14
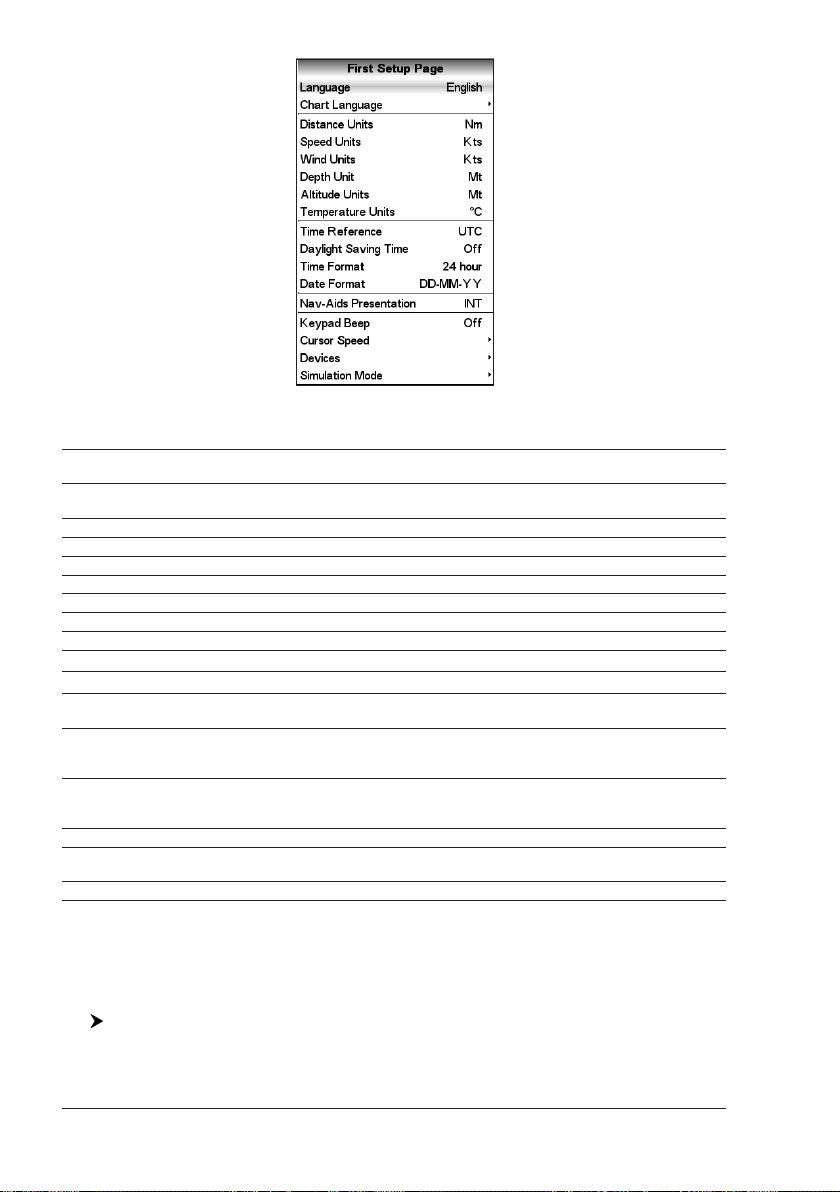
Fig. 1.3 - First Setup page menu
The possible selections are listed in the table below:
Language : The map information will still be displayed in the language of the official digitalized paper
Chart Language : Selects a sub-menu with two items: Language to set the language to display chart
Distance Units : Selects the unit for Distance among Nm, Sm, Km.
Speed Units : Selects the unit for Speed among Kts, Mph, Kph.
Wind Units : Selects the unit for Wind among Kts, Kph, Mph, m/s, Bft.
Depth Units : Selects the unit among Ft, FM and Mt.
Altitude Units : Selects the unit among Ft, FL and Mt.
Temperature Units : Selects the unit among °C and °F.
Time Reference : Allows switching between UTC or local time, by entering the Local Time offset.
Daylight Saving Time : Sets On/Off the Daylight Saving Time.
Time Format : Selects the format for the time between 12 and 24 hours.
Date Format : Selects the Date Format between MM-DD-YY (month-day-year) and DD-MM-YY (day-
Nav-Aids Presentation : Allows to set the Nav Aids presentation as US (Draw Nav-Aids using NOAA symbology) or
Keypad Beep : Enables or disables the single audio beeps emitted any time the chart plotter keypad is
Cursor Speed : Selects the Cursor Speed among Low, Medium or High in Chart page or into menu.
Devices : Allows to setup the devices that needs a dedicated port as C-Com, BBFF 50/200*, radar**
Simulation Mode : Allows to setup the simulation data before use the Simulation function.
NOTE* ONLY FOR EC11/EC5E/EC5I/EC7E/EC7 I
NOTE**ONLY FOR EC11/EC7E/EC7I/EC7FE/EC7FI
chart
information and Mode to define how objects are translated.
month-year).
INTERNATIONAL (Draws Nav-Aids using international symbology). When selected it
affects Lights, Signals, Buoys & Beacons display.
pressed. If the incorrect key is pressed or the function required cannot be executed, the chart
plotter emits three beeps.
and AIS 38400.
1.4 CHANGING BACKLIGHT AND CONTRAST
You can change the level of backlight and contrast for the screen.
Now you return to the chart screen with the new light levels retained.
16 User Manual
[POWER] + use [Bright-]/[Bright+] to adjust backlight levels and/or use
[Contr-]/[Contr+] to adjust contrast levels + [ENTER]
Page 15

1.5 SELECTING THE LANGUAGE
It is possible to set the language to display menus, data pages, warning/alarm
messages, full/quick info, list of objects found by find/nearest function, and on
charts (such as place’s names, buoy’s names and so on).
To select the language you want:
NOTE If the selected language is not available on cartographic data, English
[MENU] + "General Options" + [ENTER'] + "Language" + [ENTER] + select
the language you want + [ENTER]
language is used instead.
If you have accidentaly selected an unknown language, and you are not able
to select your preferred language please see Chapter 7 "Maintenance" for a
RAM Clear operation: the chart plotter will also return all selections, in
particular language, to original default values.
CAUTION
1.6 SELECTING THE CHART LANGUAGE
[MENU] + "General Options" + [ENTER'] + "Chart Language" + [ENTER] +
select the language you want + [ENTER]
The possible choices are listed in the table below:
Language: Allows setting the language to display chart information. The language is chosen among the list
Mode: Defines how objects are translated. It is possible to choose between the three following options:
NOTE a. When User Interface Language is changed, Chart Language settings are set
b. If the cartographic data is changed (for example the DATA MEDIA is
of languages available on the cartographic data (DATA MEDIA or embedded charts).
Off Uses the same Language used for LANGUAGE. If the selected language is not
present on the objects information, English is used instead;
English Always uses English;
Local Uses the first Local language present on data. If no Local language is available,
English is used instead.
as follows: MODE is set to Off and Chart Language is set as the User
Interface Language selection if available on the chart data, otherwise is set
to English.
removed or replaced), Chart Language settings should be verified and if
necessary changed.
1.7 C-MAP BY JEPPESEN MAX CARTOGRAPHY
INFORMATION
MAX is a major evolution of the product technology. Key points are:
Data Features
♦ ISO Certification (electronic chart production process with quality
certification)
♦ Extra Large Coverage (all the C-MAP BY JEPPESEN electronic chart de-
tail and a huge coverage without having to change data media)
♦ Official data source (data based on use of official data sources)
♦ Detailed World Background (worldwide background chart with details)
♦ Depths & Land Elevation (color shading of sea depth and land alti-
tude for improved chart reading)
♦ Bathymetric & Spot Soundings (additional Data Base with depth
and bathy information for an extraordinary view of the seabed depth)
♦ Detailed Port Plan (complete port and marina charts with detail)
♦ Search & Find (quickly locates chart contents and objects)
User Manual
17
Page 16

♦ Tides Preview (dynamic simulation of tides)
♦ Dynamic Currents (current arrows dynamically display direction and
speed)
♦ Dynamic Nav-Aids (displays Nav-Aids in true color and with real in-
terval lighting)
♦ Port Info (all the information of the available services in the ports and
how to contact them)
♦ Enhanced Port Info & Roads (details of the available facilities and
services in ports and surrounding areas)
♦ Object Info (indicates restricted area details and related information)
♦ Quick Info (full information on objects, buoys, wrecks, shoals and
Nav-Aids)
♦ Photos & Diagrams (high definition pictures of ports, piers, bridge
diagrams and nav-aids)
♦ Multilanguage Support (displays charts in the local character set)
♦ True-Type Font (improves text on chart for optimal reading)
Presentation Features
♦ Clear View (advanced legibility techniques providing more chart data
on the screen)
♦ Clear Info (sophisticated "Human Dictionary" to translate Nav-Aid ab-
breviations found on paper charts)
♦ Dynamic Nav-Aids (an innovative and dynamic presentation mode)
♦ Flexi-Zoom (increased Under and Over Zoom between chart levels,
resulting in optimal scale display for any situation)
♦ Dynamic Elevation Data (optimized palettes including the NOAA color
palette)
♦ Perspective View ("Real World" perspective view of the chart, up-
dated real-time during navigation)
♦ Smooth-Zoom (smooth transition of cartographic levels)
♦ Enhanced Turbo-Zoom (extra fast cartography level change display-
ing the most important cartographic objects)
♦ Enhanced Mixing Levels (seamless data presentation)
♦ Off-line redraw (cartography level transition without image
construction)
Cartographic Data related Features
♦ Guardian Alarm (automatic control and alarm over obstacles on charts
in front of your boat)
♦ Safety Toolbar (interactive alarm system for situational awareness on
screen)
♦ Safety Route Check (sophisticated function checking dangerous ob-
jects along your navigation route)
18 User Manual
Page 17
1.8 USING C-MAP BY JEPPESEN DATA MEDIA
The chart plotter has a built-in world map. To use the chart plotter as a navigation
aid, DATA MEDIA with detailed information for the area you wish to navigate are
required. See the technical details of your chart plotter for inserting/removing DATA
MEDIA procedure.
NOTE During normal operations the DATA MEDIA should not be removed since the
chart plotter may lock up.
1.9 SIMULATION MODE
The built-in Simulator function allows you to become proficient in the use of the
chart plotter. It simulates the reception of the navigation data (Lat/Lon, Course,
Speed, date, time). The simulated ship's position is placed at the current cursor
position by the time the simulation is activated. To start the Simulator:
Place the cursor at your desired position + [MENU] + "Advanced Options" +
[ENTER'] + "Simulation Mode" + [ENTER] + "Simulation Mode" + [ENTER]
+ "On" + [ENTER]
You might insert the Speed, Heading, date and time values:
[MENU] + "Advanced Options" + [ENTER'] + "Simulation Mode" + [ENTER]
+ "Speed"/"Heading"/"Date"/"Time" + [ENTER] + enter values + [ENTER]
To select the Cursor Control in Chart page use the cursor up/down to adjust the
Speed and the cursor left/right to adjust the Course:
[MENU] + "Advanced Options" + [ENTER'] + "Simulation Mode" + [ENTER]
+ "Cursor Control" + [ENTER] + "On" + [ENTER]
1.10 CONTROLLING THE DISPLAY
This paragraph describes how to change the display mode and how to move
around the chart by changing the chart scale.
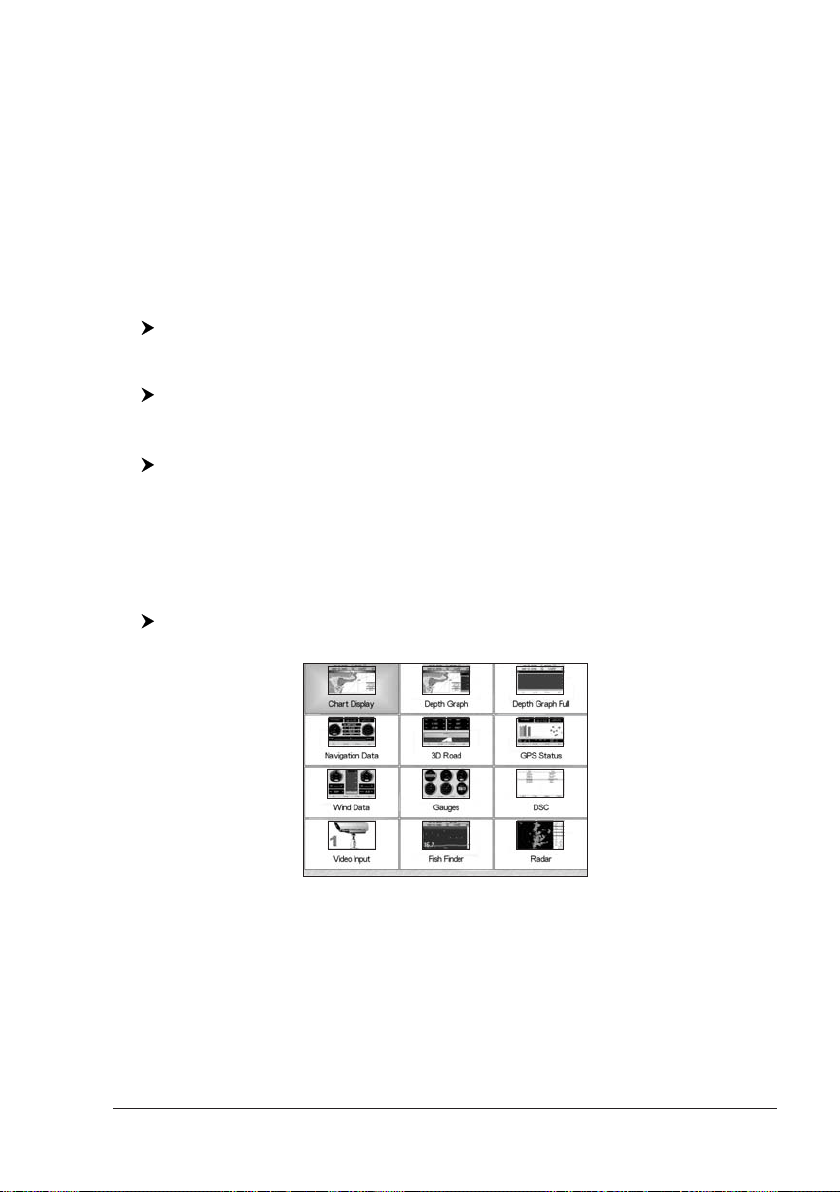
Changing Display Mode
An icons menu appears on the screen: it shows the available pages.
[PAGE]
Fig. 1.10 - Example of Page selection menu on EC11
Move the cursor to select the page you want and the press [ENTER]: the selected
page (or another icons menu1) appears.
In the following figures examples of pages are shown. Please notice that for some
chart plotters the boxes position may differ depending on the configuration chosen.
User Manual
19
Page 18
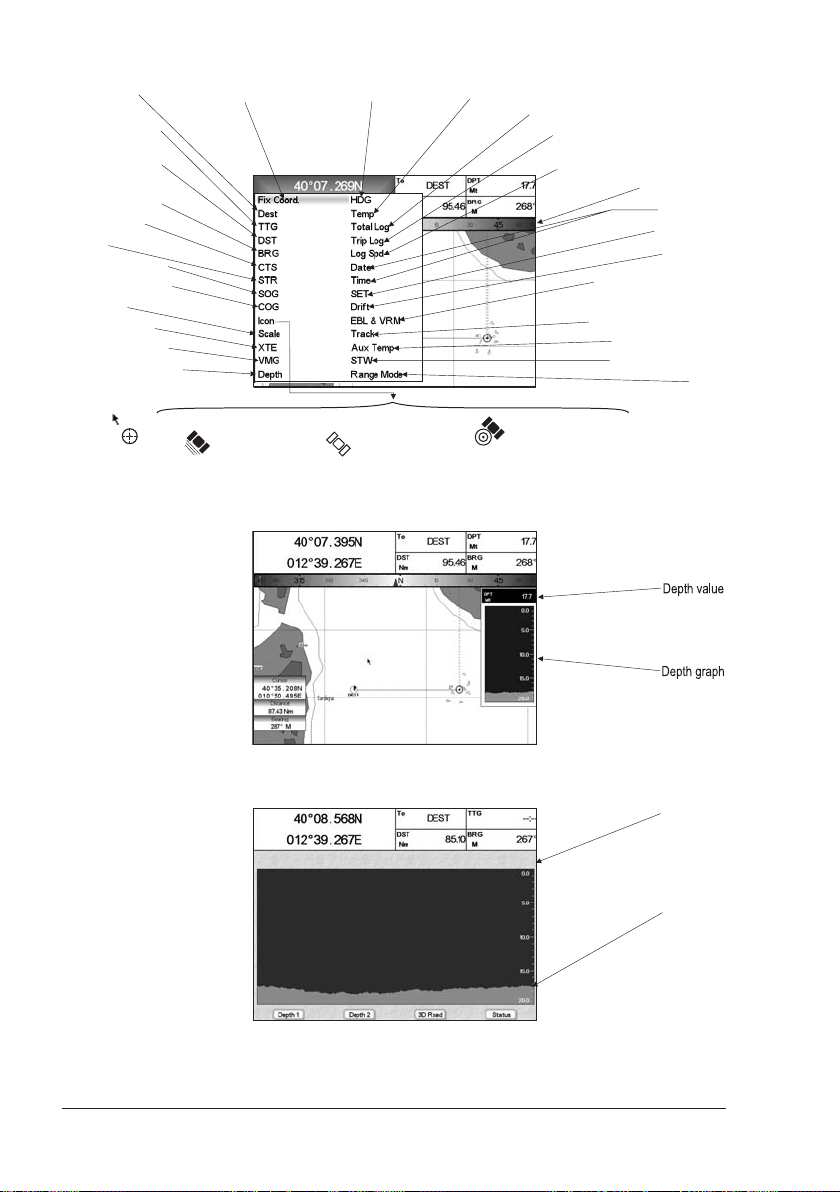
Destination ID
Time To Go
(Fix to Destination)
Distance To Go
(Fix to Destination)
Bearing
(Fix to Destination)
Course to steer
Steering
Speed Over Ground
Course Over Ground
Chart Scale
Cross Track Error
Velocity Made Good
Depth from Transducer
st
1 icon:
Charting or
...
Navigation
......
nd
2 icon: Fix Status
Fix Coordinates
- this icon is shown
if fix is received
Fig. 1.10a - Example of Chart Display page
Compass Heading
- this icon is shown if
fix is not received
Water Temperature
Total distance the vessel has travelled
Distance the vessel has travelled
since the trip log was reset
Ship Speed relative to the water
Track status, free memory
- this icon is shown
if fix a Differential
GPS signal is received
Visual COG Bar
Date & Time
Drift direction
Drift speed
Electronic bearing line &
Variable Range Maker
Auxiliary Temperature
Speed Through Water
Radar
WAAS
- this icon
is shown if WAAS
correction is received
Fig. 1.10b - Example of Depth Graph page
Depth graph
Depth value
Fig. 1.10c - Example of Depth Graph Full page
20 User Manual
Page 19
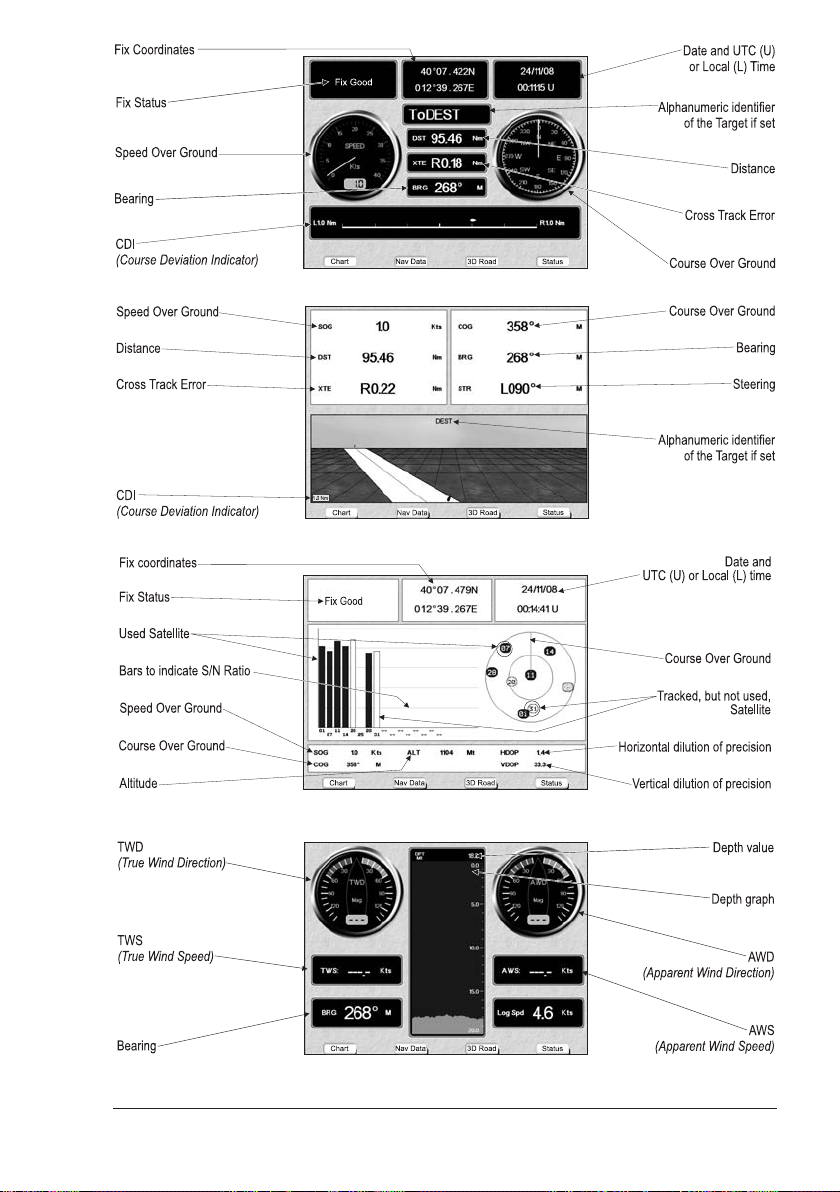
Fig. 1.10d - Example of Navigation Data page
Fig. 1.10e - Example of 3D Road page
Fig. 1.10f - Example of GPS Status page
User Manual
Fig. 1.10g - Example of Wind Data page
1
21
Page 20
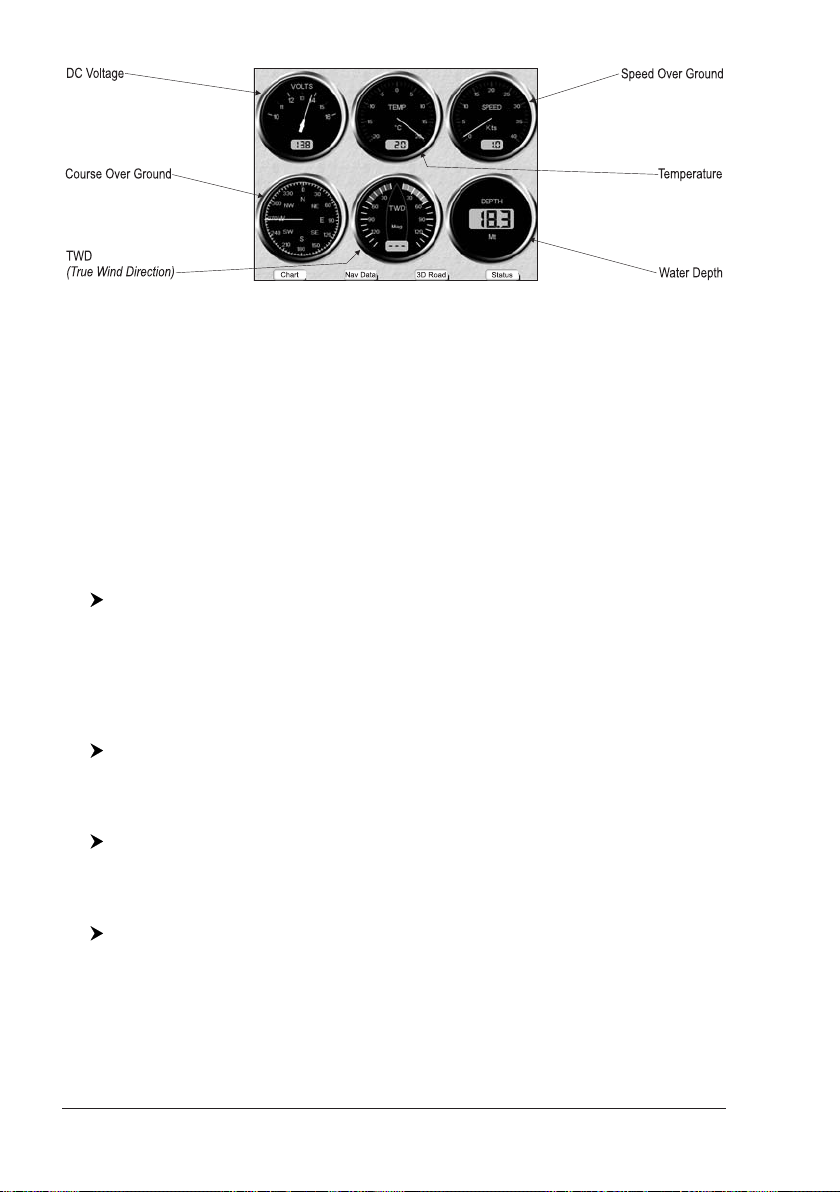
Fig. 1.10h - Example of Gauges page
NOTE1NOT AVAILABLE FOR EC5E/EC5I/EC5FE/EC5FI.
NOTE2The numbers of analogue instruments may be different.
2
Moving around the Chart and Changing Chart Scale
Use the cursor key to move around the chart. Also use [ZOOM IN] and [ZOOM
OUT] to change the chart scale so that a smaller or larger area is shown on the chart.
Now it is possible to change smoothly the zoom level avoiding the big jump between
levels.
Finding Your Boat Position
The most common use of the chart plotter is to show your ship's current location.
You can lock the cursor to the ship's position using:
The Home function locks the cursor to the ship and updates the display as the
[CLEAR]
ship moves. To release the cursor from the Home Mode, use the cursor key to
move the cursor away from the ship's current position.
Selecting Screen Amplifier
In Home mode the Screen Amplifier function sets up the charts on the navigation
direction (course) in order to display more map details in front of the ship’s position.
[CLEAR] + [MENU] + "Display Options" + [ENTER] + "Screen Amplifier" +
[ENTER] + "On" + [ENTER]
Selecting Map Orientation
To select the orientation of your chart according to:
The available choices are North Up (the map is shown with North upwards), Head
Up (the map is shown with the ship's current heading upwards) and T rack Up (the
map is shown with the currently selected course leg upwards).
If Head Up or Track Up has been selected, the Resolution angle can be set:
The Resolution angle, which may be selected in the range [5 – 60] degrees,
defines the maximum variation of the reference angle after which the map changes
its orientation.
[MENU] + "Map Options" + [ENTER] + "Map Orientation" + [ENTER]
[MENU] + "Map Options" + [ENTER] + "Map Orientation" + [ENTER] + "Head
Up" or "Track Up" + [ENTER] + use cursor to insert values + [ENTER]
22 User Manual
Page 21

1.11 NAVIGATION TO A SINGLE DESTINATION
To place the destination at cursor coordinates and activates navigation to it:
You are now navigating to the destination dr awn as a Mark with a circle around it,
labelled "DEST". A straight line is shown on the screen connecting the destination
with the ship's position. All navigation data is referred to this destination.
Place the cursor on location to navigate to + [ENTER] + "GOTO" + [ENTER]
1.12 RANGE/BEARING FUNCTION
The Range/Bearing function allows to measure the Lat/Lon coordinates between
two points on the Chart page.
Inserting R/B
A dotted line and a circle appears on the screen. A window containing the distance
and bearing values is shown. The origin of the line and the circle's centre is the
cursor position: use the cursor key to move the dotted line in any direction you
choose; in the same time the radius changes. Press [Accept] to confirm ([Cancel]
otherwise).
[ENTER] + "R/B" + [ENTER]
Deleting R/B
Deletes the line and the circle.
Place the cursor on existing R/B + [Delete]
Editing R/B
Modifies the line direction and the circle radius. Use the cursor key to move the
dotted line in any direction you choose; in the same time the radius changes.
Press [Accept] to confirm ([Cancel] otherwise).
Place the cursor on existing R/B + [Edit]
1.13 MAN OVERBOARD (MOB)
If a person or object is lost overboard and you need to return to the location, use
the MOB (Man OverBoard) function.
To activate the MOB function, a valid GPS fix must be available.
Inserting MOB
If MOB is already placed removes the existing MOB and places a new one.
Once inserted, the system performs the following operations:
[MOB]
1. places the MOB icon at ship's position
2. stops navigation to an existing destination (if present)
3. sets the MOB as destination
Selecting Auto Info on MOB
An information window appears, showing the bearing and distance to the MOB
position.
Place the cursor on MOB symbol
Deleting MOB
[MOB] + [Confirm]
User Manual
23
Page 22

24 User Manual
Page 23

2. Operations
2.1 USER POINTS: MARKS, EVENTS AND WAYPOINTS
A User Point is an object that you can place on the charts to mark a specific point.
The chart plotter features three types of User Points: Marks, Events and W aypoints.
A Waypoint is created entering a Route, a Mark can be created on the cursor's
position while an Event is created on ship's position.
Creating Waypoint
See Creating a Route.
Creating Mark
The new Mark appears on your cursor's position if not in Home mode.
[ENTER] + "MARK" + [ENTER]
Creating Event
The new Event appears on your ship's position if in Home Mode.
[ENTER] + "MARK" + [ENTER]
Editing User Point
To allow to modify name, symbol, color and position (not for Event) of the User
Point.
The User Point appears on the selected position with the new symbol and color.
NOTE To select the User Point presentation:
If in Chart page:
Place the cursor on the desired User Point + [Edit] + use the cursor key to
modify Name/Symbol/Lat-Lon (not for Event)/Color + [Accept]
[MENU] + "Display Options" + [ENTER] + "User Points" + [ENTER]
There are three possible choices: by selecting Off the User Point is not shown
on the screen, otherwise by selecting On it is shown on the Chart page shown
with symbol and name; by selecting Icon only the User Point symbol is shown.
Deleting User Point
If in Chart page:
Place the cursor on the desired User Point + [Delete] + [Accept]
If in User Points List page:
[MENU] + "User Points" + [ENTER] + "List" + [ENTER] + use the cursor to
select the row with the desired User Point +[Delete] + [Yes]
EC11:
The User Point is deleted.
[DATA] + "User Points" + [ENTER] + "List" + [ENTER] + use the cursor to
select the row with the desired User Point +[Delete] + [Yes]
It is also possible to delete all stored User Points. If in User Points List page:
EC11:
User Manual
[MENU] + "User Points" + [ENTER] + "List" + [ENTER]+[Delete] + [Del All]
+ [Yes]
[DATA] + "User Points" + [ENTER] + "List" + [ENTER]+[Delete] + [Del All]
+ [Yes]
25
Page 24

Moving User Point
Place the cursor on the desired User Point + [Move] + move the cursor to
the desired position + [Accept]
The User Point is placed on the screen at the new position.
Locating User Point on Map
If in Chart page:
[ENTER] + "Find" + [ENTER] + "User Points" + [ENTER] + insert name of
the User Point to show on map + [SAVE]
The map is centered on the selected User Point.
If in User Points List page:
[MENU] + "User Points" + [ENTER] + "List" + [ENTER] + use the cursor to
select the row with the desired User Point + [ENTER]
EC11:
[DATA] + "User Points" + [ENTER] + "List" + [ENTER] + use the cursor to
select the row with the desired User Point + [ENTER]
Otherwise:
[MENU] + "User Points" + [ENTER] + "List" + [ENTER] + [Find] + insert
name of the User Point to show on map + [Save]
EC11:
[DATA] + "User Points" + [ENTER] + "List" + [ENTER] + [Find] + insert
name of the User Point to show on map + [Save]
The split displayed map is centered on the selected User Point.
Sending/Receiving User Point
To send all User Points to an external device through the serial port:
EC11:
[MENU] + "User Points" + [ENTER] + "Send" + [ENTER]
[DATA] + "User Points" + [ENTER] + "Send" + [ENTER]
To read User Points from the NMEA input port:
[MENU] + "User Points" + [ENTER] + "Receive" + [ENTER]
EC11:
[DATA] + "User Points" + [ENTER] + "Receive" + [ENTER]
Selecting User Points List page
To give information and allow the editing of all stored User Points:
EC11:
From this page it is possible the creation of a Route with User Points:
EC11:
It is possible to link the User Point to the selected Route. If the selected User Point
is already linked to the Route, the same procedure is used to disconnect it from
Route:
EC11:
26 User Manual
[MENU] + "User Points" + [ENTER] + "List" + [ENTER]
[DATA] + "User Points" + [ENTER] + "List" + [ENTER]
[MENU] + "User Points" + [ENTER] + "List" + [ENTER] + [Route] + use the
cursor key to highlight the Route + [Select]
[DATA] + "User Points" + [ENTER] + "List" + [ENTER] + [Route] + use the
cursor key to highlight the Route + [Select]
[MENU] + "User Points" + [ENTER] + "List" + [ENTER] + [Route+]
[DATA] + "User Points" + [ENTER] + "List" + [ENTER] + [Route+]
Page 25

2.2 ROUTES
A Route is made by placing a series of Waypoints or by linking existing Marks.
Among the available Routes only one can be the Active Route, that is shown on
the screen by straight lines and arrows to indicate the direction; the first Waypoint
of this Route is surrounded by a circle. The Active Route (sometimes called current) is the working Route: it can be edited by adding, removing or moving
Waypoints.
Selecting Active Route
[MENU] + "Route" + [ENTER] + "Select" + [ENTER] + use the cursor key to
highlight the Route + [Select]
EC11:
[DATA] + "Route" + [ENTER] + "Select" + [ENTER] + use the cursor key to
highlight the Route + [Select]
The Route, shown by straight segments, is centered on the screen, with the cursor on the central Waypoint. This will then allow you to quickly work out which
Route you have selected.
When you want to create a new Route, select an open Route position in the list
using the above procedure.
Creating a Route
To create a new Route:
This places the first Waypoint of the new Route on your cursor position. If a Mark
is present under the cursor position, the Mark is linked to the Route. To place the
next Waypoints of the Route repeat the above procedure.
The following functions work on the Active Route.
Place the cursor + [ENTER] + "WAYPOINT" + [ENTER]
Inserting notes on Route
To insert a comment on the selected Route:
EC11:
Another window is shown: use the cursor key to insert the notes (this is possible only
if you have already created a Route). Press [ENTER] to confirm ([CANCEL] otherwise).
[MENU] + "Route" + [ENTER] + "Select" + [ENTER] + use the cursor key to
highlight the Route + [Notes]
[DATA] + "Route" + [ENTER] + "Select" + [ENTER] + use the cursor key to
highlight the Route + [Notes]
Hiding or Showing Route
To hide or show the selected Route on the screen:
EC11:
[MENU] + "Route" + [ENTER] + "Select" + [ENTER] + use the cursor key to
highlight the Route + [Hide]/[Show]
[DATA] + "Route" + [ENTER] + "Select" + [ENTER] + use the cursor key to
highlight the Route + [Hide]/[Show]
Selecting Route Color
To select Route legs color among the eight available colors:
EC11:
User Manual
If in Route menu page:
[MENU] + "Route" + [ENTER] + "Color" + [ENTER] + use the cursor key to
select color + [Accept]
[DATA] + "Route" + [ENTER] + "Color" + [ENTER] + use the cursor key to
select color + [Accept]
27
Page 26

If in Select Route menu:
[MENU] + "Route" + [ENTER] + "Select" + [ENTER] + use the cursor key to
highlight the Route + [Color] + use the cursor key to select color + [Accept]
EC11:
[DATA] + "Route" + [ENTER] + "Select" + [ENTER] + use the cursor key to
highlight the Route + [Color] + use the cursor key to select color + [Accept]
The Route is drawn on the screen in the selected color. It is possible to select a
different color for any Route.
Deleting Route
If in Route menu:
[MENU] + "Route" + [ENTER] + "Delete" + [ENTER] + [Accept]
EC11:
The Route legs and Waypoints are deleted. The Marks linked to the Route are not
[DATA] + "Route" + [ENTER] + "Delete" + [ENTER] + [Accept]
deleted. If the destination is placed on the Route, that Route cannot be deleted.
Following a Route (Activate the Navigation)
With the Route shown on the Chart page, move the cursor to the starting Wa ypoint
in the Route and press [ENTER], select "GOTO" and press [ENTER] again.
The destination is placed on the Waypoint of the selected Route and you are now
navigating to it.
Inserting Waypoint
To insert a new Waypoint between two existing ones:
The new Waypoint is placed.
To add a new Waypoint to the last Waypoint of the Route:
Place the cursor on the desired Route leg + [Insert] + move the cursor to
the new position + [ENTER]
Place the cursor + [ENTER] + "WAYPOINT" + [ENTER]
Reversing Route
To generate a new route reversing an existing one.
EC11:
The Route is then followed in reverse order, with Waypoints renumbered accordingly. If the destination is placed on the Route, that Route cannot be reversed.
If in Route Data Report page:
[MENU] + "Route" + [ENTER] + "Report" + [ENTER] + [Reverse]
[DATA] + "Route" + [ENTER] + "Report" + [ENTER] + [Reverse]
Selecting Route Report page
To give information on Waypoints belonging to the selected Route:
EC11:
In this page it is possible to modify the Speed and Fuel consumption values:
EC11:
28 User Manual
[MENU] + "Route" + [ENTER] + "Report" + [ENTER]
[DATA] + "Route" + [ENTER] + "Report" + [ENTER]
[MENU] + "Route" + [ENTER] + "Report" + [ENTER] + [Speed]/[Fuel] +
use the cursor to insert values + [ENTER]
[DATA] + "Route" + [ENTER] + "Report" + [ENTER] + [Speed]/[Fuel] + use
the cursor to insert values + [ENTER]
Page 27

Sending Route
To transmit the Active Route information onto the NMEA output port.
EC11:
The NMEA WPL & RTE messages are sent to the output port.
[MENU] + "Route" + [ENTER] + "Send" + [ENTER]
[DATA] + "Route" + [ENTER] + "Send" + [ENTER]
Receiving Route
To save Route information received from the NMEA input port.
EC11:
The received route is saved on the Active route, overwriting it. The NMEA WPL &
RTE messages are sent to the input port.
[MENU] + "Route" + [ENTER] + "Receive" + [ENTER]
[DATA] + "Route" + [ENTER] + "Receive" + [ENTER]
Safe Route Checking
This function checks the presence of particular cartographic objects (see the list
below) on a range set by the user for all Route legs:
♦ Land Areas
♦ Shallow Water
♦ Intertidal Areas
♦ Rocks
♦ Wrecks
♦ Obstructions
♦ Shoreline Constructions
♦ Fishing Facility
♦ Dredged Areas
♦ Diffusers
♦ Mooring/Warping Facility
♦ Production Installation
♦ Pingos
♦ No Data Available
If any of these alarm conditions is detected, then the chart plotter highlights the
list of dangerous objects and the correspondant dangerous Route leg. The Route
leg is then drawn in a different color.
It is possible to make the Safe Route Check from menu following the procedure:
EC11:
or:
The list of the dangerous objects found on the charts crossed by the Route is
shown in the Route check report.
[MENU] + "Route" + [ENTER] + "Route Check Report" + [ENTER]
[DATA] + "Route" + [ENTER] + "Route Check Report" + [ENTER]
Place the cursor on the desired Route leg + [Check]
It is also possible to activate this function in automatic mode:
[MENU] + "Route" + [ENTER] + "Automatic Route Check" + [ENTER] + "On"
+ [ENTER]
EC11:
[DATA] + "Route" + [ENTER] + "Automatic Route Check" + [ENTER] + "On"
+ [ENTER]
If Automatic Route Check is activated, the modified Route legs are checked
everytime a Waypoint is added, inserted, edited or moved.
User Manual
29
Page 28

Before activating the function, you could change the function parameters, as the
width and the depth of the detected area and the research accuracy.
To select the width of the detected area aside the Route:
[MENU] + "Route" + [ENTER] + "Route Width" + [ENTER] + insert the desired
value + [ENTER]
EC11:
[DATA] + "Route" + [ENTER] + "Route Width" + [ENTER] + insert the desired
value + [ENTER]
NOTE Safe Route width value represents half the total width checked by the
function.
To select the depth of the detected area aside the Route:
[MENU] + "Route" + [ENTER] + "Route Depth" + [ENTER] + insert the desired
value + [ENTER]
EC11:
[DATA] + "Route" + [ENTER] + "Route Depth" + [ENTER] + insert the desired
value + [ENTER]
It also possible to select the accuracy for the Route check, among Minimum, Low,
Medium, High and Maximum:
[MENU] + "Route" + [ENTER] + "Route Check Accuracy" + [ENTER]
EC11:
[DATA] + "Route" + [ENTER] + "Route Check Accuracy" + [ENTER]
2.3 GOTO FUNCTION
This functions allows you to place the destination point and immediately start
navigating to it.
Navigation to Waypoint
or simply:
A circle surrounds the Waypoint symbol. A dotted line is shown, connecting the
destination with the ship's position. When the destination is placed, all navigation
data are referred to it.
Place the cursor on the desired Waypoint + [ENTER] + "GOTO" + [ENTER]
Place the cursor on the desired Waypoint + [Goto]
Deleting destination
If the destination has been placed, to stop the navigation to the Waypoint:
NOTE If you press [Next]/[Prev] the destination icon is moved on the next/previous
Otherwise when the cursor is placed on a generic position on the chart:
NOTE If you press [Start], the destination icon is moved on the new cursor position.
The symbol that identifies the destination disappears from the screen, but the
Waypoint remains.
Place the cursor on destination icon + [Stop]
Waypoint in the Route.
[ENTER] + "GOTO" + [ENTER] + [Stop]
2.4 USING TRACK
A very useful feature of the chart plotter, is the ability to store and display exactly
30 User Manual
Page 29

where the boat has been. This feature, referred to as Tracking, can provide invaluable information about the effect of tide and wind influence on the boat's
progress as well as giving an indication of the helmsman's performance.
When full storing capacity has been reached, the oldest points are deleted and
overwritten by the newest ones.
Setting up a Track Step
Before you use the Track function, it is important to specify the Tr ack step unit: if
you select Distance, the Track point is placed when the distance from its last
stored position is greater than the defined distance; if Time, the Track point is
placed after the defined time.
[MENU] + "Track" + [ENTER] + "Config" + [ENTER] + "Step Unit" + [ENTER]
EC11:
You can select the Track step Time [1, 5, 10, 30 sec, 1 min] or distance [0.01,
[DATA] + "Track" + [ENTER] + "Config" + [ENTER] + "Step Unit" + [ENTER]
0.05, 0.1, 0.5, 1.0, 2.0, 5.0, 10.0] Nm. Setting a short time/distance interval
between T rack points is best suited to navigate within a close or complex en vironment, a greater time/distance interval is best suited to a long voyage.
To select the interval at which the Track points are placed.
If you have selected Distance:
[MENU] + "Track" + [ENTER] + "Config" + [ENTER] + "Distance Step" +
[ENTER]
EC11:
[DATA] + "Track" + [ENTER] + "Config" + [ENTER] + "Distance Step" +
[ENTER]
If you have selected Time:
[MENU] + "Track" + [ENTER] + "Config" + [ENTER] + "Time Step" + [ENTER]
EC11:
[DATA] + "Track" + [ENTER] + "Config" + [ENTER] + "Time Step" + [ENTER]
Selecting Track Color
You can select 8 different line colors that you choose for the Track:
EC11:
The same Track can be saved with any color.
[MENU] + "Track" + [ENTER] + "Config" + [ENTER] + "Color" + [ENTER]
[DATA] + "Track" + [ENTER] + "Config" + [ENTER] + "Color" + [ENTER]
Displaying Track
To enable or disable the Track displaying on the map screen:
EC11:
[MENU] + "Track" + [ENTER] + "Config" + [ENTER] + "Display Mode" +
[ENTER] + "Visible"/"Hidden" + [ENTER]
[DATA] + "Track" + [ENTER] + "Config" + [ENTER] + "Display Mode" +
[ENTER] + "Visible"/"Hidden" + [ENTER]
Activating/Deactivating Track Recording
To activate or deactivate the Tracking of the vessel while the vessel is moving:
EC11:
[MENU] + "Track" + [ENTER] + "Activate"/"Deactivate" + [ENTER]
[DATA] + "Track" + [ENTER] + "Activate"/"Deactivate" + [ENTER]
Clearing Track
All the Track or part of it can be cleared from the screen:
User Manual
31
Page 30

[MENU] + "Track" + [ENTER] + "Delete" + [ENTER]
EC11:
[BEGIN], [END] and [WHOLE] allow to identify the start or the end point of the
[DATA] + "Track" + [ENTER] + "Delete" + [ENTER]
segment to delete.
Selecting Track Number
The chart plotter has the capability to store up to 5 Tracks. To select a Track:
EC11:
[MENU] + "Track" + [ENTER] + "Config" + [ENTER] + "Active Track" +
[ENTER] + use the cursor key to select the number + [ENTER]
[DATA] + "Track" + [ENTER] + "Config" + [ENTER] + "Active Track" +
[ENTER] + use the cursor key to select the number + [ENTER]
TRACK TO ROUTE FUNCTION
This function creates a Route from a pre-recorded Track. To select this menu:
EC11:
A new window appears on the screen with the following options.
Track To Route
Executes the function that converts the given Track into a Route.
EC11:
Select Track Number
Selects the Track input number:
EC11:
[MENU] + "Track" + [ENTER] + "Track To Route" + [ENTER]
[DATA] + "Track" + [ENTER] + "Track To Route" + [ENTER]
[MENU] + "Track" + [ENTER] + "Track To Route" + [ENTER] + "Track To
Route" + [ENTER]
[DATA] + "Track" + [ENTER] + "Track To Route" + [ENTER] + "Track To
Route" + [ENTER]
[MENU] + "Track" + [ENTER] + "Track To Route" + [ENTER] + "Select Track
No." + [ENTER]
[DATA] + "Track" + [ENTER] + "Track To Route" + [ENTER] + "Select Track
No." + [ENTER]
Select Route Number
Selects the Route output number:
EC11:
[MENU] + "Track" + [ENTER] + "Track To Route" + [ENTER] + "Select Route
No." + [ENTER]
[DATA] + "Track" + [ENTER] + "Track To Route" + [ENTER] + "Select Route
No." + [ENTER]
2.5 DATA WINDOW CUSTOMIZATION ON CHART PAGE
It is possible to customize the Text Area layout among a Text Area with a v ariable
number of boxes (the number depending on the chart plotter type):
It is also possible to edit fields shown in every screen configuration. Edit mode is
activated directly from the chart display following the procedure:
32 User Manual
[MENU] + "Display Options" + [ENTER] + "Data Window Mode" + [ENTER]
[MENU] hold for 3 seconds + use the cursor key to select data window to
customize + [ENTER] + use the cursor key to choose selection + [ENTER]
Page 31

Once [ENTER] is pressed the data type is set. The selection window is closed and
the T ext Area changes according to the selected data type. Press [CLEAR] to exit
the edit mode.
2.6 INFO
Placing the cursor on cartographic objects the information related to the object
nearby is shown.
Setting Automatic Info
Automatic Info allows you to get the information on any cartographic object just
by placing the cursor on it. You can select the type of it:
The possible settings are Off (no automatic info shown at all), On Points (only on
points e.g. Rocks, Buoys, Lights, Tide Stations) and On All (on all objects, points,
lines and areas).
NOTE Choosing "On All" the Automatic Info will be shown most of the times the
[MENU] + "Display Options" + [ENTER] + "Auto Info" + [ENTER]
cursor is moved.
Selecting Automatic Info
The pop-up window with the basic info of the objects is displayed. To get full
details of the object press [Expand].
Move the cursor on the object
Displaying Expanded Info page (Full Info)
To show the Expanded Info page:
Place the cursor on objects + [ENTER] + "Info" + [ENTER]
Info on objects with Pictures
To get the information on objects with pictures:
On the Quick Info, if at least one of the objects found has one or more pictures
associated, there is a camera icon:
Press [Expand] to see the Full Info page, there is the small camera icon on a
corner of the square containing the object icon (or a big photo icon centered on
the square for the object without icon):
Move the cursor on the object
Fig. 2.6 - Example of Quick Info on objects with picture
User Manual
33
Page 32

Fig. 2.6a - Example of Full Info on objects window with picture icon
To see pictures:
Press [Picture] when the object with a picture is highlighted
Fig. 2.6b - Example of picture
To change picture size:
Press [ENTER] when the picture is shown
Info Tree and Expanded Info page
The upper side of the page contains the Info T ree and the Lower side contains the
expanded information. While moving the cursor through the Info Tree, all the
relevant information of the selected object is shown on the lower part of the page.
By pressing [CLEAR] the page is closed. If the information shown on the Lower
part of the page exceeds the page size, you may scroll the page using [Page Dn].
Use [Home] to get back to the first page. When the selected object is a Tide
Station, by pressing [ENTER] the Tide page is shown.
Quick Info on Lakes
Upon viewing the chart of a lake, you will click on to query the available information immediately displayed with many details. For example, see the following
picture:
34 User Manual
Page 33

Fig. 2.6c - Example of Lakes info
When the cursor is placed over the icon, the icons of the available services are
shown:
Fig. 2.6d - Quick Info: available services
If you press [Expand] all available information about the cartographic point under the cursor will be shown. See the next paragraph.
Full Info on Lakes
The following is an example of Full Info on Lakes:
Fig. 2.6e - Example of Full Info page
To see the "Fishing" object press [Picture] (when the "Fishing" object is highlighted). On the screen appears:
User Manual
35
Page 34

Fig. 2.6f - Example of picture associated to the Fishing object
2.7 PORT & TIDE INFO
Getting Port Info
The object Port Marina contains the information about the services available on
the selected Port Marina and the area around it. To get info on Port Marinas, move
the cursor on the Port Info icon.
Fig.2.7 - Port Info icon
The available information is shown in the Automatic Info window where icons of
the available services are shown. To expand information about that object press
[Expand] and to expand all available information and get the details on each
service of the Port Marina for that cartographic point press [Exp All].
NOTE Port Info icon is visible only if the Ports & Services option is On (see Par. 4.1).
Getting Tide Info
Fig. 2.7a - Tide Info icon
36 User Manual
Page 35

By placing the cursor over the Tide Station icon the chart plotter pops-up the
relative automatic info window and allows displaying a graphical page with the
tides prediction of the selected object. Press [Expand]:
Fig. 2.7b - Tide information page
Press [ENTER] to display the Tide Graph page. It shows the Tide height variations during the 24 hours at any given day.
Fig. 2.7c - Tide Graph page
This screen shows that day's Tide Height graph for the area where the Tidal
symbol was located. Using [ZOOM IN] and [ZOOM OUT] it is possible to display
future or past tides. If you wish to quickly display the tide for a specific date,
press [ENTER] and enter the required date.To simplify reading the graph, the
chart plotter displays a moveable Vertical and Horizontal slider which can be moved
using the cursor key. Using the up/down cursor key, move the horizontal slider to
correspond with the draft of your boat. Using the Vertical slider you can then read
the times at which the graph dips below the horizontal line i.e. the times when
you will be in danger of grounding.
NOTE Tide graph is an approximation of the tide and they should be used in
conjunction with traditional tide tables and navigational methods. The Tide
height value represents the variation relative to the "Mean Lower Water"
value.
2.8 FIND FUNCTION
The Find function allows searching for the nearest Port, Port Services, Tide Stations, Wrecks, Obstructions, Points Of Interest and Lakes loaded on the DATA
MEDIA. When the Find function is activated a list of available objects to search is
shown. Also the Find function allows to center the screen over a selected User
Point, on the Cursor position or at desired Coordinates.
User Manual
37
Page 36

NOTE Activating the Find function a Warning message is shown if there is no DATA
MEDIA inserted.
Finding Nearest Port Services
To show the nearest port services of a particular type (i.e. the nearest Hospital,
sailmaker, bank, etc.).
The icons list of the available services is shown. Use the cursor key to select any
facility and press [ENTER] or [Find]. By selecting one of the facilities the list of
the nearest ports (up to 10) in which this port facility is present, will be shown.
[ENTER] + "Find" + [ENTER] + "Port Services" + [ENTER]
Finding Nearest Port By Name
To select the Port By Name function:
Shows the list of all ports stored on the DATA MEDIA in alphabetical order and
allows to search port by name to locate the port on the map.
[ENTER] + "Find" + [ENTER] + "Port by Name" + [ENTER]
Finding Nearest Port By Distance
To select the Port By Distance function:
Shows the list of all ports stored on the DATA MEDIA in closest distance order and
allows to locate the port on the map.
[ENTER] + "Find" + [ENTER] + "Port by Distance" + [ENTER]
Finding Nearest Tide Station
T o show the nearest Tide Stations to the boat position (or to the cursor position if
the position fix is not received).
After a few seconds a window appears. Choose the Tide Station you want and
press [ENTER] or [Find] to display the Tide Graph page. Press [CLEAR] to
display the Tide Station chosen.
[ENTER] + "Find" + [ENTER] + "Tide Stations" + [ENTER]
Finding Nearest Wrecks
To show the Nearest Wrecks loaded in the DATA MEDIA:
Choose the Wrecks you prefer and press [ENTER] or [Find] to locate the se-
lected Wreck on the map.
[ENTER] + "Find" + [ENTER] + "Wrecks" + [ENTER]
Finding Nearest Obstructions
To show the Nearest Obstructions loaded in the DATA MEDIA:
Choose the Obstructions you prefer and press [ENTER] or [Find] to locate the
selected Obstruction on the map.
[ENTER] + "Find" + [ENTER] + "Obstructions" + [ENTER]
Finding Nearest Lakes Information
Searches for Nearest Lakes Info:
This function is used to found the Outdoor Recreational Area objects (see the left
side of the following Fig. 2.8). Use the cursor key to select any objects and press
[ENTER]. The list of the nearest lakes containing the facility will be shown on the
screen (see the right side of the following Fig. 2.8):
38 User Manual
[ENTER] + "Find" + [ENTER] + "Lakes Info" + [ENTER]
Page 37

Fig. 2.8 - Outdoor Recreational Area objects (left) and nearest Lakes list (right)
Then choose the lake you want and press [ENTER]: the Full Info page is shown.
Finding Nearest Lakes By Name
To select the lakes By Name function:
Shows the list of all lakes stored on the DATA MEDIA in alphabetic order. Pressing
[MENU] to insert the Lake name.
[ENTER] + "Find" + [ENTER] + "Lakes by Name" + [ENTER]
Finding Nearest Points Of Interest
Searches for nearest Points Of Interest:
A sub-menu is opened to find different categories of Points Of Interest.
[ENTER] + "Find" + [ENTER] + "Points Of Interest" + [ENTER]
Finding Cursor
To center the cursor on the screen:
[ENTER] + "Find" + [ENTER] + "Cursor" + [ENTER]
Finding Coordinates
To center the map at given coordinates:
[ENTER] + "Find" + [ENTER] +"Coordinates" + [ENTER] + use the cursor to
insert coordinates + [CLEAR]
Finding User Points
To search the User Point by name:
[ENTER] + "Find" + [ENTER] + "User Points" + [ENTER] + use the cursor to
insert name of the Waypoint to show on map + [ENTER]
2.9 ALARMS
The chart plotter provides alarms for various functions. You can enter the desired
alarm range for each function.
Auto Off
To set the automatic shutdown of the alarms when the alarm condition disappears.
EC11:
[MENU] + "Alarms" + [ENTER] + "Auto Off" + [ENTER]
[DATA] + "Alarms" + [ENTER] + "Auto Off" + [ENTER]
Arrival Alarm
T o set an acoustic alarm to sound when the vessel is approaching the destination.
User Manual
39
Page 38

[MENU] + "Alarms" + [ENTER] + "Arrival Alarm" + [ENTER]
EC11:
[DATA] + "Alarms" + [ENTER] + "Arrival Alarm" + [ENTER]
XTE Alarm
To set an acoustic alarm to sound when the vessel is deviating from a defined
course.
[MENU] + "Alarms" + [ENTER] + "XTE Alarm" + [ENTER]
EC11:
[DATA] + "Alarms" + [ENTER] + "XTE Alarm" + [ENTER]
Anchor Alarm
To set an alarm to sound when the ship moves off the current ship's position
location.
[MENU] + "Alarms" + [ENTER] + "Anchor Alarm" + [ENTER]
EC11:
[DATA] + "Alarms" + [ENTER] + "Anchor Alarm" + [ENTER]
NOTE By the time the Anchor Alarm is set the current ship's position is saved as
origin position. The alarm goes off when the ship moves away from the origin
position more than the entered alarm range.
Depth Alarm
This function is used to set an acoustic alarm automatically triggered when the
depth value read by the depth transducer is too shallow.
[MENU] + "Alarms" + [ENTER] + "Depth Alarm" + [ENTER]
EC11:
[DATA] + "Alarms" + [ENTER] + "Depth Alarm" + [ENTER]
HDOP Alarm
This function is used to show a warning when the received HDOP value exceeds
the Alarm Limit for more than 2 seconds. The default setting is 4 seconds.To
activate the HDOP Alarm:
EC11:
[MENU] + "Alarms" + [ENTER] + "HDOP Alarm" + [ENTER]
[DATA] + "Alarms" + [ENTER] + "HDOP Alarm" + [ENTER]
Heading Alarm
This function is used to show a warning when the HDG sentence is not received
from a magnetic sensor reading.
[MENU] + "Alarms" + [ENTER] + "Heading Alarm" + [ENTER]
EC11:
[DATA] + "Alarms" + [ENTER] + "Heading Alarm" + [ENTER]
Grounding Alarm
To verify potential danger to navigation such as shallow water (depth areas),
intertidal areas, land, rocks, obstructions and shoreline constructions. The maps
are scanned every 10 seconds.
If any of the above objects are found, the chart plotter notifies the danger on a
dedicated warning message box. The active "Grounding Alarms" are shown in the
Grounding Alarm Report page. To activate the Grounding Alarm:
EC11:
40 User Manual
[MENU] + "Alarms" + [ENTER] + "Grounding Alarm" + [ENTER]
[DATA] + "Alarms" + [ENTER] + "Grounding Alarm" + [ENTER]
Page 39

The chart plotter scans a sector in front of the boat. The direction is determined
by the current boat heading. You can select the length and its angle is 30 degrees.
The Grounding Alarm is switched Off by default after a Master Reset.
Grounding Alarm Range
To set the length of the sector to be detected among 0.25, 0.5, 1.0 Nm.
EC11:
[MENU] + "Alarms" + [ENTER] + "Grounding Alarm Range" + [ENTER]
[DATA] + "Alarms" + [ENTER] + "Grounding Alarm Range" + [ENTER]
Grounding Alarm Report
To display the report of the dangerous objects currently detected.
EC11:
When any of the searched objects is found in the scanned area, a tick marker is
printed on the relative box to identify which dangerous objects have been currently detected. Once the alarm condition is no longer present, the relative tick
marker is removed.
NOTE The alarm "No data available" is shown when no specific cartographic data are
EC7E/EC7I/EC7FE/EC7FI/EC11:
[MENU] + "Alarms" + [ENTER] + "Grounding Alarm Report" + [ENTER]
[DATA] + "Alarms" + [ENTER] + "Grounding Alarm Report" + [ENTER]
found on the DATA MEDIA or when no DATA MEDIA is inserted.
External Alarm
When any alarm condition occurs the pin is switched from High Impedance to
ground. This signal can be used by an external device (as a hooter or buzzer).
EC11:
[MENU] + "Alarms" + [ENTER] + "External Alarm" + [ENTER]
[DATA] + "Alarms" + [ENTER] + "External Alarm" + [ENTER]
2.10 USER MEDIA: SAVE & LOAD MENU
The chart plotter allows to back up Marks, Routes and Tracks to a USER MEDIA.
You can also restore the data to internal memory at a later time. This allows
virtually unlimited storage. The USER MEDIA data storage is organized as a file
system.
USER MEDIA page
T o display the content of a USER MEDIA inserted into the MEDIA slot of your chart
plotter:
EC11:
User Manual
[MENU] + "Save & Load" + [ENTER]
[DATA] + "Save & Load" + [ENTER]
41
Page 40

Fig. 2.10 - USER MEDIA Menu
Formatting USER MEDIA
In order to be able to use a new USER MEDIA you must format it first. This
operation prepares the USER MEDIA to receive and store information:
EC11:
NOTE When a USER MEDIA is formatted, all data saved on it will be deleted.
[MENU] + "Save & Load" + [ENTER] + [Media] + [Format]
[DATA] + "Save & Load" + [ENTER] + [Media] + [Format]
Saving File on USER MEDIA
[MENU] + "Save & Load" + [ENTER] + [Save] + select the file type to be
added by using related soft key + insert the file name and type + [ENTER]
EC11:
[DATA] + "Save & Load" + [ENTER] + [Save] + select the file type to be
added by using related soft key + insert the file name and type + [ENTER]
When a certain type of data (Mark, Events, Route, Track) is saved, a new file is
created on a USER MEDIA. The file contains all points of the selected type currently stored in the internal memory.
♦ Save Marks : to create a new file containing all Marks stored in the chart
plotter
♦ Save Events: to create a new file containing all Events stored in the chart
plotter
♦ Save Routes: to create a new file containing all Waypoints belonging to the
selected Route (Route number is required)
♦ Save Tracks : to create a new file containing all Track points belonging to
the selected Track (Track number is required)
NOTE When naming a file, you may have trouble finding a name that uniquely identifies
the file's contents. Dates, for example, are often used in filenames; however,
they take up several characters, leaving you with little flexibility. The secret is
to find a compromise, a point where you can combine a date with a word, creating
a unique filename. The maximum length of the filename is 8 characters. The
characters may be numbers (0, ..., 9), letters (A, ..., Z) and spaces (for example
legal identifiers are "ABC", "AA", "12121212", "A B C", "1 A 1", and so on.
Loading File from USER MEDIA
[MENU] + "Save & Load" + [ENTER] + Select the file name in the list +
[Load]
EC11:
The Load function copies the content of the selected file from USER MEDIA to the
[DATA] + "Save & Load" + [ENTER] + Select the file name in the list +
[Load]
42 User Manual
Page 41

internal memory of the chart plotter. If the selected file contains Marks/Events
already present in the chart plotter memory, they are non duplicated. It is required to insert the number of the Route/Track on which loading data: if the
Route/Track is not empty, it is overwritten.
Deleting File from USER MEDIA
To remove files.
EC11:
NOTE Remember that this option permanently erases the file.
[MENU] + "Save & Load" + [ENTER] + [Delete] + [Confirm]
[DATA] + "Save & Load" + [ENTER] + [Delete] + [Confirm]
Reading USER MEDIA directory
To show the list of the files present on the USER MEDIA inserted into the slot:
EC11:
[MENU] + "Save & Load" + [ENTER] + [Media] + [Read]
[DATA] + "Save & Load" + [ENTER] + [Media] + [Read]
Sorting USER MEDIA directory
To order the file directory:
EC11:
This is possible in three different modes:
[MENU] + "Save & Load" + [ENTER] + [Media] + [Sort By]
[DATA] + "Save & Load" + [ENTER] + [Media] + [Sort By]
♦ Name : to order by the filename press [Name]
♦ Time : to order by the time of file creation press [Time]
♦ Type : to order by the type of data press [Type]
User Manual
43
Page 42

44 User Manual
Page 43

3. User Setting Up
3.1 GENERAL OPTIONS MENU
To set the general settings:
The possible selections are listed in the table below:
Language : Selects the language for screen labels, menus and options; the map information remain on
Chart Language : Selects a sub-menu with two items: Language to set the language to display chart
Distance Units : Selects the unit for Distance among Nm, Sm, Km.
Speed Units : Selects the unit for Speed among Kts, Mph, Kph.
Wind Units : Selects the unit for Wind among Kts, Kph, Mph, m/s, Bft.
Depth Units : Selects the unit among Ft, FM and Mt.
Altitude Units : Selects the unit among Ft, FL and Mt.
Temperature Units : Selects the unit among °C and °F.
Time Reference : Allows switching between UTC or local time, by entering the Local Time offset.
Daylight Saving Time : Sets On/Off the Daylight Saving Time.
Time Format : Selects the format for the time between 12 and 24 hours.
Date Format : Selects the Date Format between MM-DD-YY (month-day-year) and DD-MM-YY (day-
Nav-Aids Presentation : Allows to set the Nav Aids presentation as US (Draw Nav-Aids using NOAA symbology) or
Keypad Beep : Enables or disables the single audio beeps emitted any time the chart plotter keypad is
Cursor Speed : Selects the Cursor Speed among Low, Medium or High in Chart page or into menu.
[MENU] + "General Options" + [ENTER]
the language as in the official paper charts .
information and Mode to define how objects are translated.
month-year).
INTERNATIONAL (Draws Nav-Aids using international symbology). When selected it
affects Lights, Signals, Buoys & Beacons display.
pressed. If the incorrect key is pressed or the function required cannot be executed, the chart
plotter emits three beeps.
3.2 MAP OPTIONS MENU
Zoom Type
Allows larger expansion or compression of the chart scale while zooming in or out.
Zoom Type has two options; Standard (default) or Flexi-Zoom. When in FlexiZoom mode, a short [ZOOM...] push causes a change of chart, whilst a long
[ZOOM...] push (press and hold) causes a pop-up window to be displayed on a
corner of the screen. The window shows the current Zoom Factor. By pressing
[ZOOM IN]/[ZOOM OUT] the map is expanded or compressed according to the
zoom factor selected. The Window is automatically closed if [ZOOM...] is not
pressed for 2 seconds and the selected zoom factor will be used at the next zoom
in/out.
Fonts & Symbols
It is possible to set the size of all names and symbols drawn on the charts,
selecting between Normal size (the regular characters size) and Large size.
User Manual
[MENU] + "Map Options" + [ENTER] + "Zoom Type" + [ENTER]
[MENU] + "Map Options" + [ENTER] + "Fonts & Symbols" + [ENTER]
45
Page 44

Fig. 3.2 - Example of Normal size font (on the left side) and Large size font (on the right side) settings
Perspective View
Chart data may be projected in perspective mode during navigation. This function
allows setting the panoramic view of the chart. As the upper side of the map is
more compressed than the lower side, a wider map area is visible. The perspective view allows showing more chart information immediately ahead and around
the cursor.
[MENU] + "Map Options" + [ENTER] + "Perspective View" + [ENTER]
Fig. 3.2a - Perspective View
Dynamic Nav-Aids
This function allows settings blinking lights on Nav-Aids. The blinking period and
color of each Nav-aid is read from the Nav-Aid attributes available on the data
cartridge. When the ship is inside the Nav-Aid nominal range, the light of the NavAid will start blinking.
NOTE When Dynamic Nav-Aids option is set to On, when the flashing light is Off, or
[MENU] + "Map Options" + [ENTER] + "Dynamic Nav-Aids" + [ENTER]
when fix position is out of the sector, the light color is displayed by using a
faint light color.
Map Orientation
The possible choices are listed in the table below:
North Up : The map is shown with North upwards.
Head Up : The map is shown with the ship's current heading upwards. If Head Up is selected, it is possible
Track Up : The map is shown with the currently selected course leg upwards. If Track Up is selected, it is
46 User Manual
[MENU] + "Map Options" + [ENTER] + "Map Orientation" + [ENTER]
to set the Map Orientation Resolution angle in the range [5, 60] degrees.
possible to set the Map Orientation Resolution angle in the range [5, 60] degrees.
Page 45

Mixing Levels
When the map coverage at the current zoom level does not fill the entire screen,
the chart plotter draws the rest of the map expanding the cartographic information read from, at most, two zoom levels above the current zoom level. For this
reason the map is drawn three times: firstly it draws the two levels before the
current level and then the current level. The area covered by the cartographic
data read from the previous levels is identified by a dotted pattern. When the
cursor is moved on an area not covered by data of the current level the chart
plotter zooms out to the first level covered by cartographic data.
NOTE The Mixing Levels function affects the speed of the redraw of the screen. If
[MENU] + "Map Options" + [ENTER] + "Mixing Levels" + [ENTER]
this function is not used it may be disabled.
Safety Status Bar (DSI = DATA SAFETY INDICATOR)
The possible choices are listed in the table below:
On : The Safety Status Bar is shown.
Off : The Safety Status Bar is not shown.
Icon : The Safety Status Bar is not shown, but a Warning alarm Icon is shown in the bottom right corner
When Safety Status Bar is On, a status bar with six boxes showing the status of
certain functions is displayed. Any warning or alarm condition is identified by the
red color to indicate possible risk.
[MENU] + "Map Options" + [ENTER] + "Safety Status Bar" + [ENTER]
of the display when an item controlled by the DSI (Data Safety Indicator) is under an alarm
condition. The Warning Icon remains displayed until the alarm condition persists. By placing the
cursor over this Icon, a quick help message is shown next to the Icon, allowing to show the Safety
Status Bar. In this case - when the Safety Status Bar is opened via Warning alarm Icon - it is
possible to obtain information about each “active” Safety Status box (the red ones): it is possible
to select them by cursor movement left/right, and a list of active alarms is shown underneath the
selected box. By pressing [CLEAR], the Safety Status Bar is removed from the screen.
Fig. 3.2b - Safety Status Bar
Boxes definition is as follows:
Zoom
♦ Normal: when the chart is displayed at normal scale.
User Manual
47
Page 46

♦ U. Zoom: red when the chart is under-zoomed out more than twice
normal scale, gray otherwise.
♦ O. Zoom: red when the chart is over-zoomed in more than twice nor-
mal scale, gray otherwise.
♦ C. Lock: red when the chart is zoomed in more than twice normal scale,
gray otherwise.
Best Map
Red when a more detailed chart is available under the cursor position.
Data Off
Red when at least one of the following objects or layers is turned off (by the
user): Depths/soundings; Wrecks/obstructions; Tracks/routes; Attention areas; Nav-Aids.
Declutter
Displays red when clearing overlapping objects.
Dangers
Red when “Guardian Technology” detects one of the following objects: Land,
Intertidal, Depth Area, Rocks, Obstructions, Shoreline Constructions, Fishing
Facility, Wrecks, Dragged area, Diffusion area, Mooring facilities, Pingos and
Production installations.
Cautions
Red when “Guardian Technology” detects cautionary or restricted area.
Palette
It is possible to set the palette used to enhance the visibility of the screen depending on the surrounding light condition. The possible choices are listed in the
table below:
Normal : It is recommended when the chart plotter is not exposed to the direct sunlight. When this mode
Sunlight : It is designed to enhance the visibility of the screen when the chart plotter is exposed to the
Night Vision : It is recommended when the environment is dark in order to reduce the glare of the display. The
NOAA : Allows setting NOAA paper chart colors presentation.
[MENU] + "Map Options" + [ENTER] + "Palette" + [ENTER]
is set the maps are displayed in order to use colors as similar as possible to the ones used in the
original paper charts.
sunlight. The maps are much brighter than in the other modes and the depth areas are filled with
white color so different depth areas are not easily distinguishable.
chart plotter displays maps and screen in darker colors.
Satellite Imagery
It is possible to overlay the Satellite image for background map. When it is set
On, the Palette is set to Normal to display the proper colors.
[MENU] + "Map Options" + [ENTER] + "Satellite Imagery" + [ENTER]
Currents Prediction
A window is shown on the low-left side of the chart. It is possible to see the
variation of the Tidal arrows on the selected area at any given time. Press the
dedicated Soft Keys to set the date and time manually (press [Set]), to decrease
time (press [Decr]) and to increase time (press [Incr]).
48 User Manual
[MENU] + "Map Options" + [ENTER] + "Currents Prediction" + [ENTER]
Page 47

3.3 OTHER MAP CONFIGURATIONS
Allows the user to customize the following selections and is divided into: Marine
Settings, Depth Settings, Land Settings, Chart Settings and Underwater Settings.
[MENU] + "Map Options" + [ENTER] + "Other Map Configurations" + [ENTER]
Display Mode
[MENU] + "Map Options" + [ENTER] + "Other Map Configurations" + [ENTER]
+ "Display Mode" + [ENTER]
Selects from a predefined table what cartographic objects are displayed and which
display options are set. Pre-programmed settings are user selectable from Full,
Medium, Low, Radar, Tides, Custom. The table below shows the selections for
each mode:
Setting Full Medium Low Radar Tides Custom
Place Names On On On On On On
Name T ags On Off Off Off Off Off
Nav Aids & Light Sectors On No Sector No Sector No Sector Off On
Attention Areas On On Off Off Off On
Tides & Currents On Off Off Off On On
Seabed Type On Off Off Off Off On
Ports & Services On On Off On Off On
Tr acks & R outes On Off Off Off Off On
Depth Range Min 0 Mt 0 Mt 0 Mt 0 Mt 0 Mt 0 Mt
Depth Range Max 9999 Mt 9999 Mt 9999 Mt 9999 Mt 9999 Mt 10 Mt
Land Elevations On On Off Off Off On
Land Elevation Values On Off Off Off Off On
Roads On Off Off Off Off On
POI On Off Off Off Off On
Lat/Lon Grid On Off Off Off Off On
Chart Boundaries O n Auto Off Off Off Off
Value-Added Data On Off Off Off Off On
Chart Lock On On On On On On
Underwater Objects Limit 304 Mt 10 Mt 10 Mt 10 Mt 10 Mt 10 Mt
Rocks Icon+Depth Icon Icon Icon Icon Icon
Obstructions Icon+Depth Icon Icon Icon Icon Icon
Diffusers Icon+Depth Icon Icon Icon Icon Icon
Wrecks Icon+Depth Icon Icon Icon Icon Icon
(Default values)
Marine Settings
To control the display on the map of the marine features.
Place Names : Sets On/Off the displaying of the Names (local area names).
Name Tags : Sets On/Off the displaying of a tag for particular chart objects that either includes the Name
Nav-Aids & Light Sectors: Sets On/Off/No Sector the graphical presentation of Lights, Signals, Buoys and Beacons.
Attention Areas : Sets On/Off the displaying of Attention Areas (areas in which special attention by the
Tides & Currents : Sets On/Off the displaying of the Tides and Currents. When data/time is available, Tidal
of the chart object or the Depth of an Underwater chart object. Available for Buoys, Towers,
Beacons and Port Marinas.
If No Sector is selected Nav-Aids are shown, Light Sectors are hidden
mariner is required, because of natural or man-made hazards, or sailing regulations and
restrictions. Moreover a special symbol (!) is placed inside the area selecting On option.
This is valid also for the categories: FISHING FACILITY, MARINE FARM/CULTURE,
MILITARY PRACTICE AREA, RESTRICTED AREA, SEAPLANE LANDING AREA. When
the area is small, it is identified only by the boundary).
stream arrows are shown on the charts, indicating the direction and strength of the Tide.
If no data/time is available from the GPS or the chart plotter is not in Simulation mode,
the icon on the map is generic one. The color of the arrow denotes the strength of the
current as follows:
User Manual
49
Page 48

0 to 0.1 kn -
0.2 to 1.0 kn -
1.1 to 2.0 kn -
2.1 to 3.0 kn -
3.1 to 9.9 kn -
When the chart plotter receives a valid position fix, the Tide icons are shown on the
charts on the basis of the current date and time: the screen displays and changes arrows
Seabed Type : Sets On/Off the displaying of the Seabed Type.
Ports & Services : Sets On/Off the displaying of the Ports and Services (areas along shore with facilities for
Tracks & Routes : Sets On/Off the displaying of the Tracks and Routes (recommended and established
as date/time changes.
mooring, downloading and uploading of ships, generally sheltered from waves and winds.
Port installations are piers, wharves, pontoons, dry docks, cranes...).
routes for ships at sea, including traffic separation schemes, deep water routes).
Yellow
Yellow
Orange
Orange
Red
Depth Settings
To control the display on the map of the depth informations.
Depth Range Min : Sets a minimum reference for the Depth Areas. The default setting is 0 Mt.
Depth Range Max : Sets a maximum reference for the Depth Areas. The default setting is 9.999 Mt.
Land Settings
To control the display on the map of the terrestrial features.
Land Elevations : Sets On/Off the Land Elevation display.
Land Elevations Values : Sets On/Off the displaying of the Land Elevations Values.
Roads : Sets On/Off the displaying of the Roads.
POIs : Sets On/Off the displaying of Points Of Interest.
Chart Settings
To control the display on the map of the chart features.
Lat/Lon Grid : Sets On/Off the displaying of the grid of parallels (of Latitude) and meridians (of Longitude) drawn
Chart Boundaries : Sets On/Off the displaying of the Chart Boundaries, which represents the boundaries of the charts
Value-Added Data : Sets On/Off the displaying of the Value Added Data (VAD), a collection of additional cartographic
Chart Lock (*) : Sets On/Off the Chart Lock option. When Chart Lock is On, the available zoom scales are only
NOTE* When an empty level is entered, the message “No cartographic coverage” is
shown on a window in a corner of the map display. The warning message is
always displayed as long as the current zoom has no data coverage.
on the map.
available on the chart plotter. Selecting Auto instead, if we are in background charts only the first
chart levels contained in the DATA MEDIA are displayed, if we are in a charts level contained in
the DATA MEDIA the next four charts level are displayed.
objects which are not present on the original paper chart (from which the electronic chart derives).
These objects have been obtained from other sources and then merged to the electronic charts
in order to provide more information useful for the navigation. VAD object can be any cartographic
objects and it can be distinguished from the official-chart-objects from the Quick Info. A dedicated
icon is shown on the Quick Info window to indicate that the object queried is a VAD. The same
icon is also shown on the Full Info page and in addition the extended text Value Added Data is
shown on the details of the VAD object.
the ones containing cartographic data. Instead when Chart Lock is Off, it is possible to zoom down
into zoom scales not covered by cartographic data after the last available zoom scale covered by
cartographic data. The DSI window, if present, will show “NO CHART”, when an empty level is
entered in the location of map expansion mode.
Underwater Objects Settings
To control the display on the Underwater Objects.
50 User Manual
Page 49

Underwater Objects Limit : Selects the max depth value to display Underwater Objects. If value is set to 0 Mt, the
Rocks : Sets Off/Icon/Icon+Depth* the displaying of the Rocks. The default setting is Icon.
Obstructions : Sets Off/Icon/Icon+Depth* the displaying of the Obstructions. The default setting is Icon.
Diffusers : Sets Off/Icon/Icon+Depth* the displaying of Diffusers. The default setting is Icon.
Wrecks : Sets Off/Icon/Icon+Depth* the displaying of Wrecks. The default setting is Icon.
NOTE* Choose the options: OFF (the object is not visible independently of the
selected “Underwater Object Depth Value”); ICON (the object icon is visible
without tags, in the range selected from “Underwater Object Depth Value”
option); ICON+DEPTH (the object icon and tag is visible, in the range selected
from “Underwater Object Depth Value” option).
Underwater Objects are not shown on the charts. If value is more than 0 Mt (i.e. 10 Mt),
in the Range from 0 Mt to the selected value the Underwater Objects are displayed
according to their default setting (shown here below). The default setting is 10 Mt.
3.4 DISPLAY OPTIONS MENU
To allow you to change how the chart plotter displays information.
Auto Info : Displays information on cartographic object when the cursor is placed on it. The Automatic Info
Screen Amplifier : In Home mode the Screen Amplifier (Look Ahead) function sets up the charts on the navigation
Course Line : Selects the value among Off/2/10/30 Min/1/2 hours/Infinite. The Course Line is a graphical
Ship Icon Mode : Sets the Ship Icon Mode between Steady or Blinking. When Ship Icon Mode is Blinking, the ship
Coordinate System : Selects the Coordinate System among ddd mm ss (degrees, minutes and seconds), ddd
Map Datum : Allows selecting any Geodetic Datum reference from the over 100 available on the chart plotter.
Fix Datum : Sets the datum reference used by the GPS receiver connected to (or integrated in) the chart
External WPT : The coordinates of a Waypoint, received from a GPS connected to the chart plotter, can be
User Points : Sets On (icon + label), Off or Icon (only icon) the displaying of User Point.
Symbol Size : Sets Normal or Small the icon of User Point.
Data Window Mode : Customizes the Text Area layout: it is possible to customize the Text Area layout among Full
Cursor Window : Enables or disables the display of the cursor window on the screen.
Visual COG Bar : Enables or disables the display of the COG Bar, that shows the COG like a traditional compass.
[MENU] + "Display Options" + [ENTER]
On Points shows information when the cursor is placed on points (as Port Services, Tides, lights,
wrecks, rocks, buoys, beacons, obstructions, land markers, etc.). The Automatic Info On All
shows information when the cursor is placed on points, on lines (as Depth contours, Traffic
Separation, Territorial Sea, Cartographic Lines etc.) on areas (Depth, Built-up, Sea, Attention,
Restricted etc.) and on names (on the beginning of the text -hot spot- or on any of the characters
of the name -name message box-). The details on Land, Source of Data, Cartographic Area and
Spot Soundings are not shown.
direction (course) in order to display more map details in front of the vessel’s position.
indication of the direction in which the Vessel is heading. The Course Line origin is the vessel’s
position so the time line movement is synchronized with the vessels Icon. Course Line "course"
is given by the value of COG (Course Over Ground) and its length is proportional to the SOG
(Speed Over Ground).
icon (and the heading line) blinks every 1 second, otherwise when it is Steady the Ship Icon (and
the heading line) does not blink.
mm.mm (degrees, minutes and hundredths of minute), ddd mm.mmm (degrees, minutes and
thousandths of minute), UTM, OSGB, TD (allows conversion from GPS coordinates in LoranC coordinates and vice versa). If TD is selected as Coordinate System, a new menu appears
on the screen to set Chain, Pair, ASF 1/2, Alternate Solution.
Map Datum selection switches to the selected reference datum applying the datum offsets
stored with the charts.
plotter so that the chart plotter converts the position received from the GPS to the Map Datum
currently selected in the menu in order to match the position from the GPS with the position on
the charts. You must know what datum reference is used by the GPS and set it in the Fix Datum
option.
stored into the chart plotter, if the GPS is NMEA-0183 protocol compatible and support the
$BWC sentence (this symbol remains on the screen for 30 seconds). You may save it by placing
a Waypoint or a Mark onto that symbol. As soon as the chart plotter receives another $BWC
sentence with the coordinates of a new Waypoint, the symbol moves to the new point.
Screen, Vertical, Text Area with 5 boxes and Text Area with 8 boxes (for Text Area with 5 boxes
and Text Area with 8 boxes you can select between Small or Large boxes size).
User Manual
51
Page 50

EC7E/EC7I/EC7FE/EC7FI/EC11:
3.5 VIDEO MODE
This function allows to see a video input picture on the chart plotter screen. This is
allowed only if an external video signal source is connected to the chart plotter.
NOTE Once the Video Mode is active use the following keys to adjust video settings:
press and immediately release [POWER], use the [Contr+]/[Contr-] and
[Bright+]/[Bright-] soft keys to adjust contrast and backlight
cursor up/down to adjust brightness and left/right to adjust colors, press
[ZOOM IN]/[ZOOM OUT] to adjust hue phase. Pressing any other key exits
from Video Mode.
. Move the
3.5.1 Add Video menu
[MENU] +"Add Video1" + [ENTER]
Video 1: Shows the image from the video camera 1 on a rectangular window, by moving the cursor keys you could
Video 2 : Shows the image from the video camera 2 on a rectangular window, by moving the cursor keys you could
NOTE1 FOR EC7I/EC7E/EC7FI/EC7FI: it is available only one video camera, so after selecting
select where this window is placed.
select where this window is placed.
Add Video, the screen shows the image from the video camera on a window.
3.5.2 Video Input menu
EC11:
Full Screen Video 1 : Shows the image from the video camera 1 at full screen.
Full Screen Video 2 : Shows the image from the video camera 2 at full screen.
Full Screen Video 1 + Video 2 : Shows the image from the video camera 1 at full screen and the image from the video
Full Screen Video 2 + Video 1 : Shows the image from the video camera 2 at full screen and the image from the video
Radar/FF/Chart/Video 1 : Shows the image from the video camera 1 on a rectangular window, in the left top
Radar/FF/Chart/Video 2 : Shows the image from the video camera 2 on a rectangular window, in the left top
EC7I/EC7E/EC7FI/EC7FI:
Full Screen Video : Shows the image from the video camera at full screen.
Chart / Video : Shows the chart at full screen and the image from the video camera on a window
Radar/FF/Chart/Video : Shows the image from the video camera on a rectangular window, in the left top
[PAGE] +"Video Input" + [ENTER]
camera 2 on a window which can be moved up/down and/or left/right using the cursor
key, to select where the window is placed.
camera 1 on a window which can be moved up/down and/or left/right using the cursor
key, to select where the window is placed.
corner, with Radar, Fish Finder and Chart.
corner, with Radar, Fish Finder and Chart.
[MENU] +"PAGE" + [ENTER] + "Video Input" + [ENTER]
which can be moved up/down and/or left/right using the cursor key, to select where
the window is placed.
corner, with Radar, Fish Finder and Chart.
3.6 ADVANCED OPTIONS MENU
The Advanced Options are arranged in sub-menus.
3.6.1 Input/Output menu
52 User Manual
[MENU] + "Advanced Options" + [ENTER]
WARNING
After every software upgrade the RAM is cleared and the chart plotter re starts
with the usual default settings. Please go to the Input/output menu and set
the proper input format once again.
Page 51

EC5E/EC5FE/EC7E/EC7FE/EC11:
GPS Connection
Connect the GPS to the GPS Port (serial Port 3). To choose your preferred setting
follow the procedure:
[MENU] + "Advanced Options" + [ENTER] + "Input/Output" + [ENTER] +
"Port 3 Input" + [ENTER] + "NMEA-4800-N81-N" + [ENTER]
GPS Setup Menu
To set your preferred configuration for the connected GPS.
Internal GPS
Restart GPS : Restarts all GPS processes. Once executed, the message "Done" is shown.
Diff. Corr. Source : Sets what kind of Differential Correction will be used by the GPS between WAAS and RTCM
Navigation Speed : Sets the Navigation Speed among Low Speed, Medium Speed and High Speed.
NOTE1AVAILABLE FOR EC5I/EC5FI/EC7I/EC7FI.
EC5FE/EC5FI/EC7FE/EC7FI:
1
: Enables or disables the Internal GPS.
(beacon correction).
Fish Finder Transmission
The internal Fish Finder is connected directly to the Port 2. To switch the internal
Fish Finder transmission On/Off follow the procedure:
[MENU] + "Advanced Options" + [ENTER] + "Input/Output" + [ENTER] +
"FF Transmission" + [ENTER] + "On"/"Off" + [ENTER]
Autopilot Connection
Connect the Autopilot to the serial Port n:
Where:
[MENU] + "Advanced Options" + [ENTER] + "Input/Output" + [ENTER] +
"Port n Output" + [ENTER]. Then choose your preferred setting among the
NMEA available settings NMEA 0183 4800-N81-N, NMEA 0180, NMEA 0180/
CDX) and press [ENTER] to confirm.
n = 1/2/3 for EC5 E/EC5I
n = 1/3 for EC5FE/EC5FI
n = 1/2/3/4/5 for EC7E/EC7I/EC11
n = 1/3/4/5 for EC7 FE/EC7FI
External NMEA Connection
Connect the External NMEA to the serial Port n:
Where:
[MENU] + "Advanced Options" + [ENTER] + "Input/Output" + [ENTER] +
"Port n Input" + [ENTER]. Then choose your preferred setting among the
NMEA available settings NMEA 1200-N81-N, NMEA 4800-N81-N, NMEA 4800N82-N, NMEA 9600-N81-N, NMEA 38400-N81-N and press [ENTER] to confirm.
n = 1/2/3 for EC5 E/EC5I
n = 1/3 for EC5FE/EC5FI
n = 1/2/3/4/5 for EC7E/EC7I/EC11
n = 1/3/4/5 for EC7 FE/EC7FI
C-COM GSM Plus Connection
To connect the modem C-COM to the chart plotter follow the procedure:
The modem C-COM can be connected also to the Port 2 (except for EC5FE/EC5FI/
EC7FE/EC7FI), Port 3 and Port 4/5 (except for EC5E/EC5I/EC5FE/EC5FI), in this
case select the format on the used port.
NOTE The connection is valid for the C-COM IR and C-COM RS232 too.
User Manual
[MENU] + "Advanced Options" + [ENTER] + "Input/Output" + [ENTER] +
"Port 1 Input" + [ENTER] + "C-COM" + [ENTER]
53
Page 52

Output Sentences
The chart plotter allows customizing the NMEA-0183 sentence transmitted on
each port. Each port can transmit a different set of sentences among: GLL, VTG,
BOD, XTE, BWC, RMA, RMB, RMC, APB, WCV, GGA, HSC, HDG, MWV:
[MENU] + "Advanced Options" + [ENTER] + "Input/Output" + [ENTER] +
"Port n Output Sentences" + [ENTER]
Where:
n = 1/2/3 for EC5E/EC5I
n = 1/3 for EC5 FE/EC5FI
n = 1/2/3/4/5 for EC7E/EC7I/EC11
n = 1/3/4/5 for EC7FE/EC7FI
NMEA-0183 Output Talker ID
The Talker Id is the 2 characters following the “$” char (Start of sentence) in a
NMEA-0183 sentence that identifies the type of instrument that sends the string.
The chart plotter allows selecting one of the following Talker identifier: II (Integrated Instrument); GP (GPS); EC (Electronic Chart System-ECS); RA (Radar
and/or Radar Plotting); SD (Sounder Depth). The selected Talker ID is applied to
all sentences sent by the chart plotter from all Ports.
To select the Talker ID follow the procedure:
[MENU] + "Advanced Options" + [ENTER] + "Input/Output" + [ENTER] +
"NMEA-0183 Output Talker ID" + [ENTER] + "II/GP/EC/RA/SD" + [ENTER]
EC7E/EC7I/EC7FE/EC7FI/EC11:
External Signal
Sets the External Output:
Then choose your preferred setting among External Alarm (when activated, this
pin goes to GND level. It is used to command an external buzzer), External Power
(it is command switch for the Radar. It must be used in conjunction with the Radar
Junction box device) and Off.
[MENU] + "Advanced Options" + [ENTER] + "Input/Output" + [ENTER] +
"External Signal" + [ENTER]
Cable Wiring pages
This menu allows you select the Cable Wiring page preferred:
Power I/O Cable Wiring
Quick Disconnect Cable Wiring3: Shows a window containing the quick disconnect bracket cable wiring.
GPS Cable Wiring
AUX In I/O Cable Wiring
NOTE1AVAILABLE FOR EC11.
NOTE2AVAILABLE FOR EC7E/EC7I/EC7FE/EC7FI/EC11.
NOTE3AVAILABLE FOR EC5E/EC5I/EC5FE/EC5FI/EC7E/EC7I/EC7FE/EC7FI.
[MENU] + "Advanced Options" + [ENTER] + "Input/Output"+ [ENTER] +
"Cable Wiring" + [ENTER]
1
: Shows a window containing the Power I/O cable wiring.
1
: Shows a window containing the GPS cable wiring.
2
: Shows a window containing the AUX IN I/O cable wiring.
Send/Receive Routes & Marks
Sets the desired port used for transferring User Points and Routes functions:
Where:
54 User Manual
[MENU] + "Advanced Options" + [ENTER] + "Input/Output" + [ENTER] +
"Send/Rec Rts & Mrks" + [ENTER] + "Port n" + [ENTER]
n = 1/2/3 for EC5E/EC5I
n = 1/3 for EC5 FE/EC5FI
Page 53

n = 1/2/3/4/5 for EC7E/EC7I/EC11
n = 1/3/4/5 for EC7 FE/EC7FI
3.6.2 C-Link menu
Select the Primary or Secondary Station (see the dedicated Chapter):
[MENU] + "Advanced Options" + [ENTER] + "C-Link" + [ENTER] + "Secondary Station/Primary Station" + [ENTER]
3.6.3 Fix & Compass menu
To handle the functions related to navigation and to set the reference heading
information such as bearing angles (True or Magnetic), the Magnetic Variation
source and to enter Compass Calibration values.
Fix Correction : Turns On/Off the Correction from the positioning system. If the new Correction is calculated,
Compute Correction : Corrects fixes from the positioning instrument. By placing the cursor on the ship's real position
Correction Offset : Manual correction of fix position.
Static Navigation
Position Filter : Turns On/Off the Position Filter. In case of a jittering fix this option makes the ship's position
Speed Filter : Turns On/Off the S p e e d F i l t e r . Wh e n i t i s O n , y o u c a n fi l t e r t h e s p e e d o f th e s h i p , t o o p t i m i ze i t .
Bearing : Selects either degrees magnetic, Auto Mag, or True. If magnetic readings are selected the
Magnetic Variation : It is possible to calculate the Magnetic Variation in an Automatic or manual mode, by inserting
Calibrate Compass : The variation table is used to match magnetic value readout on the chart plotter comparable
NOTE1AVAILABLE FOR EC11.
[MENU] + "Advanced Options" + [ENTER] + "Fix & Compass" + [ENTER]
but the Correction is not enabled, the ship's position is not changed.
and selecting this option, the error is calculated and internally memorized for appropriate
correction, but not applied.
1
: Sets up a threshold for the speed. When the speed received from the positioning device is
under that threshold, the chart plotter displays zero speed.
more stable and the track smoother.
variation is computed automatically for every zone as soon as the chart is displayed.
the step for calculation of Magnetic Variation.
with the value given by the compass of the boat. In other words, since the compass of the boat
must be compensated (due to the iron masses, ...), we use the same values given by the chart
plotter. This means that, for example, if the BRG to the next Waypoint readout in the chart
plotter display is "X" Mag degree, if you steer the boat reading "X" Mag degree from the
compass, you are driving well toward the next Waypoint.
3.7 AIS
AIS is an Automatic Identification System. It has been introduced to improve the
safety of navigation by assisting in the efficient operation of ship-to ship, ship
reporting and VTS applications. The system should enable operators to obtain
information from the ship automatically, requiring a minimum of involvement of
ship’s personnel, and should have a high level of availability. AIS transponders
installed on IMO vessels use VHF frequencies to:
♦ Transmit details of their own vessel
♦ Receive details from other vessels or navigation aids within VHF range.
Information being transmitted from vessels over 300 tons that, due to recent
worldwide legislation, are required to fit Class “A” AIS transponders.
Connecting to the chart plotter an AIS receiver (please contact your local dealer),
vessels with AIS transponder within VHF range are displayed on screen giving the
skipper or navigator a visual interpretation of the data of nearby vessels. This
improves safety, and specifically for collision avoidance reasons.
User Manual
55
Page 54

3.7.1 AIS System Definitions
♦ Target
It is a vessel equipped with AIS. Information about the Targets is being
received by AIS Receiver and displayed on the screen.
♦ CPA
Closest Point of Approach is the closest distance that will be achieved between your vessel and the tracked Target, based on your vessel’s speed
and direction and the Target’s speed and direction.
♦ CPA Limit
This is the distance from your vessel that a Target may reach before a
Target is deemed a threat.
♦ CPA Alarm
Occurs if CPA is less or equal to CPA Limit. This test is done for active
Targets only.
♦ TCPA
Time to closest Point of Approach is the time remaining until the CPA will
occur.
♦ TCPA Limit
This is the time remaining before the CPA is reached.
♦ TCPA Alarm
Occurs if TCPA is less or equal to TCPA Limit. This test is done for active
Targets only and if CPA value is less or equal to CPA Limit.
♦ Radio Call Sign
International call sign assigned to vessel, often used on voice radio.
♦ Name
Name of ship, 20 characters.
♦ MMSI
Maritime Mobile Service Identity.
♦ MMSI number
A unique 9 digit number that is assigned to a DSC radio station. It primarily registers the boat information in the U.S. Coast Guard’s national distress database for use in emergency situations.
♦ Active Target
Target located within the Activation Range. Active Target is represented by oriented triangle with COG and Heading vectors. Rate of turn may also be displayed.
♦ Dangerous Target
Target detected by CPA or TCPA Alarm. Dangerous Target is Active Target
by definition. For better visibility Dangerous Target symbol is flashing.
♦ Sleeping Target
T arget located outside the Activation R ange. Sleeping T arget is represented
by a small oriented triangle.
♦ Lost Target
When the AIS info is not received from that vessel for 3.5 minutes. The
presentation will be a flashing black triangle with a cross through.
♦ Activation Range
Range around your boat where Targets become active. AIS Target become
active within this range. Activation Range should be greater than CPA Limit
by definition.
NOTE A Target is removed from the screen if data is not received for 10 minutes.
The maximum number of tracked Targets is 200.
Depending on the scale the presentation of the Targets change to remove
clutter on the screen.
This information is updated every 3 seconds to 6 minutes depending on speed
and rate of turn, enabling the track of the vessels in range to be plotted.
56 User Manual
Page 55

Fig. 3.7.1 - AIS Symbols
3.7.2 To set the chart plotter for receiving AIS
Make sure that the AIS receiver is properly connected to the chart plotter.
The chart plotter reads the AIS NMEA message VMD, type 1, 2, 3 and 5.
Select the used serial port and transmission speed by following the procedure:
[MENU] + "Advanced Options" + [ENTER] + "Input/Output" + [ENTER] +
"Port n Input" + [ENTER] + "AIS 38400" + [ENTER]
Where:
n = 1/2/3 for EC5E
n = 1/2 for EC5I
n = 1/3 for EC5FE
n = 1 for EC5FI
n = 1/2/3/4/5 for EC7E/EC11
n = 1/2/4/5 for EC7I
n = 1/3/4/5 for EC7FE
n = 1/4/5 for EC7FI
3.7.3 AIS Menu
To configure the chart plotter to receive AIS data, follow the procedure:
EC11:
Display : Turns Off the display of AIS targets overlay on the cartography or defines the range from the
CPA Alarm : Turns Off the alarm or defines the CPA Limit (the values allowed are from 0.1 to 10 Nm). The
TCPA Alarm : Turns Off the alarm or defines the TCPA Limit (The values allowed are from 1 to 30 min). The
AIS Report : Shows the AIS List page which contains basic information of the Target ship with the ability to
NOTE The AIS menu could be selected only if the AIS has been selected as external
[MENU] + "AIS" + [ENTER]
[DATA] + "AIS" + [ENTER]
fix within which the AIS Target becomes active. The values allowed are from 0.1 to 20 Nm. The
default setting is 5 Nm.
default setting is Off.
default setting is Off.
select a Target ship and locate it on the chart.
device, see the previous Par. 3.7.2.
3.7.4 Quick Info on AIS Target
By placing the cursor over a AIS Target icon, the following information is displayed:
♦ Vessel Name
♦ MMSI number
♦ Radio Call Sign
♦ SOG
♦ COG
♦ CPA and TCPA values
NOTE The selected AIS Target icon is surrounded by a square frame when user
User Manual
places the cursor over the icon.
57
Page 56

3.8 C-WEATHER SERVICE
C-W eather Service is an innovative meteorological forecasting system with the ability
to visualize the weather forecast, overlaying it on cartography. The weather data is
held on Jeppesen Marine’s weather server, which can be accessed via a C-COM
modem connected to the chart plotter or by using the PC Planner (or the DPS Dealer Programming System) saving the weather data on a USER MEDIA. The weather
data are overlaid on a map page as layers. The Weather format data available are:
Data Type Display
WIND (Speed & Dir) 0
WAVE (Height & Dir) 1
TEMPERATURE (C°) 18°
HUMIDITY (%) 30
VISIBILITY (m) 20
WEATHER TYPE: Sun
WEATHER TYPE: Rain
WEATHER TYPE: Fog
WEATHER TYPE: Snow
WEATHER TYPE: Clouds
WEATHER TYPE: Partly Cloudy
WEATHER TYPE: Thunderstorm
Fig. 3.8 - Weather data package
NOTE Refer to Par. 3.1 General Options menu for selecting the desired unit of
3.8.1 C-WEATHER SERVICE Menu
To select the menu:
EC11:
It opens a sub-menu with the following options.
measure.
[MENU] + "C-Weather" + [ENTER]
[DATA] + "C-Weather" + [ENTER]
♦ Copy from USER MEDIA
♦ Download
♦ Forecast
♦ Real Time View
♦ Type of Data
Copy from USER MEDIA
[MENU] + "C-Weather" + [ENTER] + "Copy from USER MEDIA" + [ENTER]
EC11:
[DATA] + "C-Weather" + [ENTER] + "Copy from USER MEDIA" + [ENTER]
Allows the whole data package C-Weather loading from the USER MEDIA.
Download
[MENU] + "C-Weather" + [ENTER] + "Download" + [ENTER]
EC11:
Allows to connect the software to the Jeppesen Marine weather server and to
download Jeppesen Marine weather data directly via C-COM. It activates the following sub-menu:
58 User Manual
[DATA] + "C-Weather" + [ENTER] + "Download" + [ENTER]
Page 57

Select Country to Call : Allows the selection of the country to call.
Telephone Number : Allows the insertion of the number.
SIM Pin : Allows inserting of the PIN of the SIM.
Download Area : Allows the weather download: a squared grey area, where the weather data will be
downloaded, is centered on cursor position. See the following picture.
Fig. 3.8.1 - Download Area
Press [Load] to activate the C-Weather Download: the whole data package
(see the previous "Weather data package" table) are downloaded. At the end of
the operation press [Exit] to close the window.
Forecast
[MENU] + "C-Weather" + [ENTER] + "Forecast" + [ENTER]
EC11:
Allows selecting the Layer of specific weather data to be displayed on the screen
[DATA] + "C-Weather" + [ENTER] + "Forecast" + [ENTER]
and to change date and time of the forecast preview.
The following functions are available:
♦ Panning: default usage of the cursor key is the normal panning function.
♦ Zoom in/out: zoom in/out functions are allowed as usual by using
[ZOOM IN]/[ZOOM OUT].
♦ Set of date and time: [Date/Time] to modify date and time values.
♦ Layer selection: [Type] to cycle of the weather layers.
♦ Exit: [Exit] or [CLEAR] to close the weather prediction page.
Real Time View
[MENU] + "C-Weather" + [ENTER] + "Real Time View" + [ENTER]
EC11:
The following selections are available:
[DATA] + "C-Weather" + [ENTER] + "Real Time View" + [ENTER]
♦ Real Time View On: the data is shown (the area of the download) at
the current date and time (received from the GPS).
♦ Real Time View Off : the Weather data is not displayed.
The layer displayed is the one selected into the previous menu item.
Type of Data
[MENU] + "C-Weather" + [ENTER] + "Type od Data" + [ENTER]
EC11:
Allows selecting the type of data, see the previous Fig. 3.8.
[DATA] + "C-Weather" + [ENTER] + "Type od Data" + [ENTER]
User Manual
59
Page 58

EC7E/EC7I/EC7FE/EC7FI/EC11:
3.9 DSC
The chart plotter must be interfaced with a DSC VHF radio.
The DSC (Digital Selective Calling) is a method of establishing a VHF radio call; it
is used to announce urgent maritime safety information broadcasts. This system
allows mariners to instantly send Distress Call or/and Position Request to the
other vessels equipped with a DSC transceiver within range of the transmission.
The Distress Call, that allows to receive a position of the vessel in distress, and
the Position Request, a great feature for anyone wanting to know the location of
another vessel - for example you buddy that is catching fish, or finding the location of a person you are cruising with, are performed by an external device, the
DSC VHF radio. The chart plotter interfaced with a DSC VHF radio prompts the
user to see the GPS position of the vessel in distress and also allows for easy
navigation to the vessel.
The Distress Call and the Position Request icons that are displaying on the screen,
are shown in the following table:
WARNING
Position Request icon
Distress Call icon
Fig. 3.9 - Distress Call and Position Request icons
NOTE The label can be the MMSI or the corresponding vessel's name. If in the DSC
Directory the MMSI has been associated to its relative vessel name, the
vessel's name is shown in the label instead of the MMSI.
P
D
3.9.1 Distress Call and Position Request
During a distress situation, a vessel that is equipped with a DSC VHF radio and
connected to a GPS, has the capability to transmit a DSC Distress Call with GPS
Position.
When the VHF radio receives a DSC Distress Call, the position information of the
vessel in distress is transferred to the chart plotter. The chart plotter logs the
Distress Call into the DSC Log and also marks the position of the vessel in distress
on the Chart page. A pop-up screen advises the user that a Distress Call has been
received. Within the pop-up screen it asks the user if he would like to view the call
on the Chart page or exit the pop-up screen. By selecting the item "VIEW ON
CHART" and press [ENTER] two options are shown:
♦ GoTo Vessel
Activates the navigation to the Distress Call or Position Request icon. The
chart plotter changes the map scale to allow showing the Distress Call (or
Position Request) icon and the vessel’s icon simultaneously on the screen.
The chart plotter then verifies if there are obstructions (land or low water)
between the two positions. If obstructions are found the chart plotter shows
a pop-up screen saying that the navigation to the Distress Call cannot be
set automatically and the user must define a route to avoid the obstacles.
♦ Stay on View
Exits the pop-up screen and remains on the selected map screen.
60 User Manual
Page 59

3.9.2 DSC Log page
To select the DSC Log page:
Selecting Log shows the Distress Call Log page or Position Request Log page (it
depends which of the two was selected).
The Log page allows to:
To show Position Request/Distress Call page press [ENTER].
[PAGE] + "DSC" + [ENTER] + select the DSC Log page + [ENTER]
Fig. 3.9.2 - Example of DSC Log page
♦ Locate : to center the map on the selected DSC position press [Locate]
♦ Clear One : to delete selected DSC position press [Clr-One]
♦ Clear All : to delete all entries press [Clr-All]
♦ Hide/Show : to allow hiding/showing the selected DSC position on the chart
display press [Hide]
3.9.3 DSC Directory page
To select the DSC Directory page:
From this page the user can assign the Vessel Name, Contact Name and Phone
number to any MMSI (Maritime Mobile Service Identity) so that, when a DSC
Distress Call or Position Request is received, the name of the vessel is displayed
in place of the MMSI number - a unique number that is assigned to a DSC radio
station for use in emergency situations.
[PAGE] + "DSC" + [ENTER] + select the DSC Directory page + [ENTER]
Fig. 3.9.3 - Example of Directory page
The Directory page allows to:
♦ Edit : to edit the fields of any existing entry in the Directory, Vessel
Name, MMSI number, contact and phone number press [Edit]
User Manual
61
Page 60

♦ Add : to add a new entry to the Directory press [Add]
♦ Delete : to delete the selected entry press [Delete]
♦ Delete All : to delete all entries in the page press [Del All]
3.9.4 Quick Info on DSC Icons
Placing the cursor on the Distress Call or Position Request icon, the following
information is displayed:
♦ Vessel Name/MMSI Number
♦ Position
♦ Date and Time
♦ Distance and Bearing from current vessel's position
Pressing [ENTER] it is possible, by selecting "DELETE" deletes the DSC icon from
the DSC Log page, otherwise by selecting "DSC LOG" the DSC Log page is shown.
3.10 FISH FINDER
The chart plotter combined with the sonar performance of the Fish Finder is one
of the most advanced marine navigation system available.
To select the Fish Finder menu, first select one of the pages related to the Fish
Finder:
Once the Fish Finder page is selected, access the Fish Finder menu by pressing:
[PAGE] + "Fish Finder" + [ENTER] + select the desired page + [ENTER]
[MENU]
NOTE O
NOTE O
NLY FOR EC5FE/EC5FI/EC7FE/EC7FI: The Fish Finder display page is
available only if the Fish Finder transmission is turned On. See the Cap. 5.
NLY FOR EC11/EC5E/EC5I/EC7E/EC7I: The Fish Finder display page is
available only if the Fish Finder is connected and powered On. See the Fish
Finder User Manual for more information.
EC7E/EC7I/EC7FE/EC7FI/EC11:
3.11 RADAR
The Radar consists of a scanner unit which illuminates targets with microwave
energy and then collects the echoes from those targets. The scanner unit includes
the Radar antenna, transmitter, receiver and necessary electronics. The scanner
unit is connected to a chart plotter equipped with software capable of displaying
the Radar functions.
To select the Radar menu, first select one of the pages related to the Radar:
[PAGE] + "Radar" + [ENTER] + select the desired page + [ENTER]
Once the Radar page is selected, access the Radar menu by pressing:
For more information see the specific User Manual.
[MENU]
NOTE The Radar display page is available only if the Radar is connected and powered
On.
3.12 SYSTEM INFORMATION
To see details about the software and cartography data installed.
Opens the System Information page.
62 User Manual
[MENU] + "About..." + [ENTER]
Page 61

4. C-LINK
C-Link system is a feature which allows to sharing the same cartographic data
between two Chart Plotter units linked via serial I/O port.
In order to activate C-Link function, a “MAX MAP MEDIA” (called REGULAR MEDIA)
must be inserted into one of the two chart plotters and a special MAX MAP MEDIA
(called MIRROR MEDIA) must be inserted on the other chart plotter.
The two MAX MAP MEDIA must have the same code and revision. So, the MIRROR MEDIA can be utilized only on a chart plotter linked to another chart plotter
provided with the equivalent REGULAR MEDIA.
It is important to point out that the two chart plotters must have the update
software versions that allow C-Link function.
4.1 HOW C-LINK SYSTEM WORKS
When the chart plotter is powered up, it switches into the “Stand-Alone Mode” . In
this work mode, the chart plotter unit periodically scans all the available MEDIA
slots searching for MIRROR MEDIA. When one or more MIRROR MEDIA is found
(in one or both chart plotters) a special connection is established between the
chart plotters to enable the MIRROR MEDIA. If a regular MEDIA which has previously activated a MIRROR MEDIA is removed, even the MIRRORs MEDIA will be
not read anymore on the other unit.
4.2 C-LINK SERIAL CONNECTION
The two chart plotters should be connected via serial ports. Any of the available
ports can be used, the software will recognize automatically the serial ports used.
A typical connection is as follows:
Chart Plotter 1 Chart Plotter 2
TX —————> RX
RX <————— TX
GND <————> GND
4.3 C-LINK NAVIGATION DATA TRANSFER
This function allows transferring C-Link Navigation Data (Route Name, Destination ID & Position, Next Waypoint ID & Position, Total Route length, Fuel Consumption Rate, ETA, TTG etc.) between two chart plotters linked through the
C-Link system.
The chart plotters can be set to operate in two modes:
♦ MASTER mode (Primary Chart Plotter)
♦ SLAVE mode (Secondary Chart Plotter)
When the navigation is activated on the Master chart plotter, the C-Link navigation data will be continuously sent to the Slave until the navigation is active.
If the Master is navigating to a Single Destination, the Slave will show the Destination position and activate the navigation to it.
If the Master is navigating to a Route, the Slave will show the Route Leg composed by the Destination and the Waypoint after the Destination (Next Waypoint)
and activate the navigation to it.
Any variation to the current C-Link Navigation Data will be transferred from the
Master to the Slave.
User Manual
63
Page 62

The Slave will be provided with a few dedicated pages to show the C-Link Navigation Data received from the Master.
4.4 OPERATIONS
INTRODUCTIVE ELEMENTS
It is important remark, once more, that this function does not transfer the whole
route but just the information relative to the navigation. Such information will be
removed from the Slave chart plotter as soon as the navigation is terminated.
C-Link navigation data is exchanged by using two NMEA-0183 C-MAP proprietary
sentences: $PCMPN,1 and $PCMPN,2.
When the navigation is activated on the Master, it starts outputting the C-Link
Navigation Data. If the Slave is connected, all C-Link Navigation Data received
are stored in its memory and the navigation is started.
The information sent by the Master consists of the following values:
♦ N avigation mode (To Single Destination/to a Route)
♦ Route Name*
♦ Destination ID
♦ Destination Position
♦ Next Waypoint ID*
♦ Range from Destination to next Waypoint*
♦ Bearing from Destination to next Waypoint*
♦ Route Length*
♦ Distance from Destination to Last Route Waypoint*
♦ Remaining Route Legs*
♦ Planned Cruising Speed
♦ Average Fuel Consumption
♦ Initial Fuel Load
C-Link Navigation Data can refer to:
♦ Single Destination navigation
♦ Route Following navigation
Values identified by * are sent only for Route Following navigation.
The Destination Icon, Navigation leg (Fix Position to Destination), the Next Waypoint
Icon and all other relevant C-Link Navigation Data will be shown on the Slave
chart plotter. Any variation of the C-Link Navigation Data on the Master will be
communicated to the Slave so to keep data aligned on both devices.
MASTER CHART PLOTTER
Operating mode
To select the Master mode follow the procedure:
Master mode is the default factory setting. All regular chart plotters functions are
allowed. As soon as the Destination is placed, the Master chart plotter will start
transmitting all C-Link Navigation Data.
In Master mode the C-Link Navigation Data received from the NMEA port is ignored. So, if the two chart plotters are both operating in Master mode, the C-Link
Navigation Data sent by the other chart plotter never processed.
Under such condition if the navigation is activated on one of the two chart plotters, a warning message will be shown to notify that the C-Link navigation data
will be ignored by the other chart plotter.
64 User Manual
[MENU] + "Advanced Options" + [ENTER] + "C-Link" + [ENTER] + "Primary
Station" + [ENTER]
Page 63

SLAVE CHART PLOTTER
Operating mode
To select the Slave mode follow the procedure:
When Slave mode is set, the chart plotter cannot manipulate the C-Link Navigation Data anymore.
Stop current navigation
If the navigation was already active, it will be disabled as soon as Slave mode is
set. An appropriate warning message will be shown to notify that the Navigation
is already active and to confirm whether Slave mode can be set.
Inhibit Navigation operation
As soon as Slave mode is set, the Destination cannot be placed anymore either
the C-Link Navigation Data is received from the Master or not. Also, when the
C-Link Navigation Data is received from the Master, it will not be allowed to deactivate the Navigation.
Inhibit Route following
While navigating to the route received from the Master the Destination is reached
(either applying distance or perpendicular criteria), the Destination will not be
moved to the next Waypoint on the Route.
MOB handling
If the Navigation to the external Destination is active and [MOB] is pressed on the
Slave chart plotter, the MOB is placed but the navigation to the MOB is not activated.
Notes
While navigating to the external Destination the operating mode is switched to
Master mode, the navigation to the external Destination will be terminated. An
appropriate warning message will be shown to notify that the Navigation to the
external Destination is active and to confirm whether Slave mode can be set.
Setting Slave mode, the C-Link Navigation Data will be deleted.
[MENU] + "Advanced Options" + [ENTER] + "C-Link" + [ENTER] + "Secondary
Station" + [ENTER]
The C-Link Navigation Data are deleted at Power Off.
C-LINK NAVIGATION DATA: ACQUISITION AND DISPLAY
As soon as the C-Link Navigation Data is received, the Slave parses the information
received and executes the relative actions depending on its current working status.
Note When the Navigation to the external Destination is activated, the Slave Chart
Plotter will show all relevant C-Link Navigation Data exactly like when the
Destination is not the external one (Destination Name, DST and BRG to
Destination, calculate XTE, calculate TTG etc). These values will be displayed all
places where required and they will be used to format NMEA-0183 output data.
GRAPHICAL REPRESENTATION ON MAP DISPLAY
Fig. 4.4 - Graphical Displaying
User Manual
65
Page 64

ROUTE DATA REPORT
When the Navigation to the External Route is received, it will be possible to display the information related to the External Route by entering the Route Data
Report.
Fig. 4.4a - External route on Route Data Report
♦ External Route : Name of the External Route (from
$PCMPN,0)
♦ Cruising Speed : Planned Cruising Speed (from $PCMPN,1)
♦ Total Route length : Length from First to Last Wpt (from
$PCMPN,1)
♦ Waypoints in Route : No. of Wpts in the Route (from $PCMPN,1)
♦ Remaining Waypoints : No. of Wpts from Dest to Last Wpt (from
$PCMPN,1)
♦ Fuel Consumption Rate : Planned Fuel Consumption Rate (from
$PCMPN,1)
♦ Total Fuel Consumption : Calculated Fuel consumption to navigate
the whole Route
♦ Initial Fuel Load : Volume of Fuel available before the navi-
gation was started (Liters)
♦ Remaining Fuel :Volume of Fuel available (Liters)
♦ Distance to Destination : Distance from Ship to Destination (calcu-
lated)
♦ Distance to Next Wpt : Distance to travel from ship to the Wpt
after the Destination (calculated: Distance
to Dest + Next Route Leg length)
♦ Distance to Last Wpt : Distance to travel from ship to the End of
the Route (calculated: Distance to Dest
+Distance From Dest to last Wpt received
from $PCMPN,1)
♦ TTG T o Destination : Estimated Time to travel the “Distance to
Last Wpt” (calculated using Cruising
Speed)
♦ TTG T o Next Wpt : Estimated Time to travel the “Distance to
Next Waypoint” (calculated using Cruis-
ing Speed)
♦ TTG to Last Wpt : Estimated Time to travel the “Distance to
Last Wpt” (calculated using Cruising
Speed)
66 User Manual
Page 65

♦ ETA to Destination : Estimate Time of Arrival to the Destina-
tion Point (calculated: Current Time +
“TTG To Destination”)
♦ ETA to Next Waypoint :Estimate Time of Arrival to the Waypoint
after the Destination (calculated: Current
Time + “TTG To Next Waypoint”)
♦ ETA to Last Wpt :Estimate Time of Arrival to the End of the
Route (calculated: Current Time + “TTG
To Last Wpt”)
4.5 QUICK INFO
Route Navigation: Quick Info on the Destination
Fig. 4.5 - Quick Info on Destination
Quick info on Single Destination
Fig. 4.5a - Quick Info on Single Destination
User Manual
67
Page 66

68 User Manual
Page 67

5. FISH FINDER
EC5FE/EC5FI/EC7FE/EC7FI
The Fish Finder consists of a high power transmitter, sensitive receiver and a
transducer. The Fish Finder sends an electrical pulse to the transducer which
contains an element that converts the pulse into acoustic (sound) wave which is
sent through the water. As this wave travels from the transducer to the bottom, it
may strike fish, structures, thermoclines (temperature changes in the water).
When the wave strikes an object(s) a certain amount of the wave is reflected back
to the transducer depending on the composition and shape of the object. When
the reflected wave is returned to the transducer it is converted into a voltage and
is amplified by the receiver, processed and sent to the display. The speed of sound
in water is roughly 4800 ft./sec, so the time lapse between the transmitted signal
and the received echo can be measured and the distance to the object determined.
Fig. 5 - Fish Finder working principle
5.1 SETTING THE INTERNAL FISH FINDER ON
The Fish Finder driver is embedded on the chart plotter: it is connected directly to
the dedicated serial Port2.
To switch the internal Fish Finder transmission On follow the procedure:
NOTE It is not possible to connect any external Fish Finder unit to the chart plotter.
[MENU] + "Advanced Options" + [ENTER] + "Input/Output" + [ENTER] +
"FF Transmission" + [ENTER] + "On" + [ENTER]
5.2 UNDERSTANDING THE FISH FINDER PAGE
The display on chart plotters shows a history of time of the echoes received by
the transducer. The chart plotters have a menu that allows adjustments to receiver sensitivity, depth range and scrolling speed of the Fish Finder display.
User Manual
69
Page 68

1
Warning message
Echogram window
2
Color Bar
3
4
Digital Depth
5
Water temperature
6
Alarm Bar
Depth ruler
7
8
Variable Depth Marker (VDM)
Zoom Bar
9
A-Scope
10
Operating Frequency
11
1
2
3
4
5
Fig. 5.2 - The Fish Finder page
The following is a short description of terms listed in the previous Fig. 5.2:
Warning Message
Flashing label "Simulation" when the echo sounder is in Simulation mode.
Echogram window
Graphic presentation of sonar soundings recorded as a continuous profile
scrolling across the screen from right to left. Such recordings represent the
image of the water beneath your boat, items appear as they pass under your
transducer; the items on the right side of the screen are closer to you than
those on the left. The correct interpretation of the Echogram allows retrieving
useful information about what is under the boat. See the following Par. 5.2.2
for more information.
6
7
8
9
10
6
11
Color Bar
Colored scale located on the left side of the screen that shows the colors used
in the Echogram to represent the echoes strength. The color on the top of the
bar represents the maximum sonar strength, while the color on the bottom of
the bar represents the minimum sonar strength.
Digital Depth
Readout of the current bottom depth.
Water Temperature
Readout of the current water temperature returned by the TEMP 1 sensor
included into specific transducers.
Alarm Bar
Bar located on the right side of the Depth Ruler, showing the shallow water
and deep water alarm values. The alarm is triggered when depth is outside
the range.
Depth Ruler
Vertical graduated bar located along the right side of the screen. It is a scale
which reflects the depth of the area being displayed.
70 User Manual
Page 69

Variable Depth Marker (VDM)
Horizontal line on to the Echogram window with a depth label. The up/down
cursor keys can move it up and down. The label displays the depth of the
cursor position. It can be moved to any location pinpointing the depth of a
target.
Zoom Bar
Bar located on the left side of the Depth Ruler, showing the portion of the
Echogram currently represented in the zoomed window (on the left part of
the screen). It is turned On selecting the Echo Sounder Split page.
A-Scope
A real time representation of fish and bottom features passing through the
beam of the transducer. It is drawn as horizontal lines whose length and hue
is proportional to the sonar strength returned. When the default palette is
selected, the strongest sonar returns will be shown as the color displayed of
the top of Color Bar while the weakest as the bottom color.
Operating Frequency
Readout of the selected operating frequency.
5.2.2 Understanding the Echogram display
The main elements that can be easily distinguished into an Echogram are:
1
Fishes
Thermoclines
2
White Line
3
4
Surface Clutter
Structures
5
Bottom Echo Profile
6
1
2
3
4
5
6
Fig. 5.2.2 - The Fish Finder Echogram
Fishes
Fishes are represented as arcs because of the cone angle of the transducer.
In fact as the boat passes over the fish the leading edge of the cone strikes
the fish, causing a display pixel to be turned on. As the boat passes over the
fish, the distance to the fish decreases turning each pixel on at a shallower
depth on the display. When the boat is directly over the fish, the first half of
the arch is formed and since the fish is closer to the boat, the signal is stronger
and the arch is thicker. As the boat moves away from the fish, the distance
increases and the pixels appear at progressively deeper depths forming the
remaining half of the arch.
Thermoclines
Are the zones where two layers of different water temperatures meet. The
greater the temperature differential, the thicker the thermocline is shown on
the screen. Thermoclines are represented as horizontal stripes of noise. They
are very important for fishing since often many species of game fish like to
suspend in, just above, or just below the thermoclines.
User Manual
71
Page 70

White Line
The White Line shows the difference between hard, soft bottoms and even
distinguishes between fishes and structures located near the bottom. In this
way it is easier to tell the difference between a hard and soft bottom and even
to distinguish fishes and structures located nearby the bottom. For example,
a soft, muddy or weedy bottom returns a weaker echo that is shown with a
narrow white line while a hard bottom returns a strong echo that causes a
wide white bottom line.
Surface Clutter
Appears like noise at the top of the screen extending many feet below the
surface. It’s caused by many things, including air bubbles, bait fish, plankton
and algae.
Structures
Generally, the term “structure” is used to identify objects like wrecks and
weeds rising from the bottom.
Bottom Echo Profile
Bottom profile recorded by the Fish Finder. When the echo sounder is set in
auto-range mode it is automatically kept in the lower half of the screen.
Other Elements
Large anchoring cables are returned by the echo sounder as very long and narrow
arcs on the screen.
5.3 DISPLAYING THE FISH FINDER PAGE
This section will take you through the frequently used operations and assist you
to customize the look of the chart plotter using the Fish Finder.
5.3.1 How to select the Fish Finder page
The Page Selection menu allows you to change the Fish Finder page displayed. To
access this menu:
[PAGE] + "Fish Finder" + [ENTER]
Fig. 5.3.1 - Example of Fish Finder Page selection on EC7FE
The menu now shows the selections related to the Fish Finder. Move the cursor to
select the desired item and then press [ENTER].
Selection by Soft Key
Any soft key can be assigned any of the Fish Finder pages (see Par. 1.1). In the
picture below, the four soft keys are customized to select any Fish Finder pages:
72 User Manual
Page 71

FF Std
Fig. 5.3.2 - Example of Fish Finder page selection using Soft Keys
FF Dual
FF Splt
FF+Map
5.3.2 Fish Finder Full page
To display the Fish Finder Full Page Echogram, follow this procedure:
NOTE The frequency displayed depends on the selection done in the Frequency item
The MENU key
Pressing [MENU] activates the Fish Finder Setup menu (see Par. 5.6). Pressing
[MENU] subsequent times toggles between the Fish Finder Setup menu and the
Functions menu.
The Cursor key
Moving the Cursor key up/down adjusts the Variable Depth Marker (VDM) up or
down on the screen.
The ENTER key
Pressing [ENTER] activates the Sensitivity menu (see Par. 5.6.9) that allows
tuning the Gain, the Surface Noise Filter and the STC.
[PAGE] + "Fish Finder" + [ENTER] + "Full" + [ENTER]
Fig. 5.3.2 - Example of 200kHz Fish Finder Full page
(see Par 5.6.7).
Fig. 5.3.2a - Sensitivity sub-menu
Pressing [CLEAR] turns off the Sensitivity menu.
User Manual
73
Page 72

The CLEAR key
By pressing [CLEAR] the Variable Depth Marker (VDM) is hidden.
The ZOOM IN and ZOOM OUT keys
From this page pressing [ZOOM IN] once changes to Zoom 2X, pressing
[ZOOM IN] twice changes to Zoom 4X, while pressing [ZOOM OUT] reverts to
Zoom 2X and no zoom.
5.3.3 Dual Frequency page
To display the Fish Finder Dual Echogram, follow this procedure:
The Cursor key
Moving the cursor to the right or the left moves the Variable Depth Mark er (VDM)
between the 50 and 200kHz displays. Moving the cursor up or down will move the
VDM up and down. Press [CLEAR] to hide the VDM.
The ZOOM IN and ZOOM OUT keys
From this page pressing [ZOOM IN] once changes to Zoom 2X, pressing [ZOOM
IN] twice changes to Zoom 4X, while pressing [ZOOM OUT] reverts to Z oom 2X
and no zoom.
[PAGE] + "Fish Finder" + [ENTER] + "Dual Frequency" + [ENTER]
Fig. 5.3.3 - Fish Finder Dual Frequency mode
5.3.4 Zoom page
To display the zoomed Fish Finder page on the left half of the screen and the
unzoomed Fish Finder Echogram on the right half of the screen, follow this
procedure:
The Depth Cursor is shown only on the unzoomed Fish Finder Echogram.
The ZOOM IN and ZOOM OUT keys
When in this page pressing [ZOOM IN] changes to Zoom 4X, pressing [ZOOM
OUT] changes to Zoom 2X.
74 User Manual
[PAGE] + "Fish Finder" + [ENTER] + "Zoom" + [ENTER]
Fig. 5.3.4 - Fish Finder Zoom Page
Page 73

5.3.5 Chart/Fish page
To display the Chart page on the left half of the screen and the Fish Finder
Echogram on the right half of the screen, follow this procedure:
[PAGE] + "Fish Finder" + [ENTER] + "Chart/Fish" + [ENTER]
Fig. 5.3.5 - Fish Finder Chart/Fish page
The MENU key (to change the active window)
When in Chart/Fish mode pressing [MENU]:
♦ if the focus (the active window) in on the Chart, the Functions menu is
shown. Pressing again [MENU] opens the Fish Finder Setup menu and
moves the focus to the Fish Finder.
♦ if the focus (the active window) in on the Fish Finder, the Fish Finder
Setup menu is shown. Pressing again [MENU] opens the Functions
menu and moves the focus to the Chart.
NOTE When focus is on the Chart page, all keys work in cartography standard mode.
EC7FE/EC7FI:
5.3.6 Fish Finder and Radar pages
To display the Radar page on the left half of the screen and the Fish Finder
Echogram on the right half of the screen, follow this procedure:
[PAGE] + "Fish Finder" + [ENTER] + "Radar/FF" + [ENTER]
Fig. 5.3.6 - Radar/FF page
Otherwise to display the Radar and Fish Finder Combo pages, follow this procedure:
[PAGE] + "Fish Finder" + [ENTER] + "Radar/FF/Chart/Nav" + [ENTER]
User Manual
75
Page 74

Fig. 5.3.6a - Radar/FF/Chart/Nav page
The other Fish Finder Combo page has the Video window instead of the Navigation window:
[PAGE] + "Fish Finder" + [ENTER] + "Radar/FF/Chart/Video" + [ENTER]
Fig. 5.3.6b - Radar/FF/Chart/Video page
When in Split/Combo pages, the active view is highlighted by a focus (Yellow
frame). The keyboard commands are related to that focused view. To move the
focus press [MENU] twice.
5.4 ZOOM MODES
5.4.1 The Bottom Lock Zoom
The Bottom Lock Zoom mode is activated when the Fish Finder is in Auto R ange or
Bottom Lock mode (see Par. 5.6.3) and the Variable Depth Marker (VDM) is not
displayed on the screen.
In Bottom Lock Zoom mode the Fish Finder Echogram is automatically moved up/
down as to keep the Bottom Line always visible in the lower half of the screen.
NOTE Moving the Cursor key up/down displays the Variable Depth Marker (VDM)
switching the Fish Finder in Marker Zoom mode.
5.4.2 The Marker Zoom
The Marker Zoom mode is activated either when the Fish Finder is in Manual Range
mode (see Par. 5.6.3) or the Depth Cursor is displayed on the screen.
In Marker Zoom mode the Fish Finder Echogram position is controlled by moving the
Variable Depth Marker (VDM) and pressing and holding [ENTER] for 1 second on the
selected position. Moving the Variable Depth Marker (VDM) over the top or below the
bottom of the screen, automatically moves up/down the current zoomed Echogram
view and re-position the Variable Depth Marker (VDM) at the center of the screen.
NOTE Pressing [CLEAR] hides the Depth Cursor and if the Fish Finder is in Auto
76 User Manual
Range or Bottom Lock mode switches into Bottom Lock Zoom mode.
Page 75

5.5 SOUNDER ADJUSTMENTS WITH SOFT KEYS
When the Fish Finder page is active, by pressing one of the soft keys, the main
functions to adjust the Fish Finder are shown on the soft keys labels on the
screen. The soft keys labels disappear by pressing [CLEAR].
The Gain Soft Key
By pressing [Gain] the Gain changes between Auto Gain and Manual Gain.
If Manual Gain, use the cursor left/right to adjust it: a bar with the % symbol is
displayed on the screen above the [Gain] label.
If Auto Gain, use the cursor left/right to adjust the Gain Offset: a bar with the %
symbol is displayed on the screen above the [Gain] label.
The STC Soft Key
The [STC] changes the STC value between Off/Short/Mid/Long/Custom. The current value of STC is shown on a window right over the [STC] label.
The Range Soft Key
By pressing [Range] the window switches to the next Range status: Manual,
Bottom Lock and Auto.
If Manual, use the cursor up/down to adjust the Depth value by 10Ft time and use
the cursor left/right to adjust the Shift. When in meters the step is 2m and it
increases to 10m when the key is pressed for more than 1 second.
If Bottom Lock, use the cursor up/down to adjust the Bottom Range value by 10Ft
at a time. If Auto Range, the range value is set automatically and it cannot be
changed by the user.
The Freq Soft Key
Pressing [Freq] selects the Frequency to which the Sensitivity parameters are
applied.
This option is available in all Fish Finder pages except the Dual Frequency page.
The Int.Rej. Soft Key
Pressing [Int.Rej.] selects a filter to remove interference from other Fish Finders.
This option is available only in the Dual Frequency page.
5.6 FISH FINDER SETUP MENU
The Fish Finder Setup menu provides access to additional functions, setup and
layout/data field options. From the Fish Finder page, access this menu by pressing:
User Manual
[MENU]
Fig. 5.6 - Fish Finder Setup menu
77
Page 76

5.6.1 Preset Mode
Preset modes are pre-defined settings of the Fish Finder operating parameters.
You can use them to quickly set the Fish Finder in the most commonly used
operating modes. These are Cruise (sets the Fish Finder in full auto mode with the
sensitivity settings optimized for displaying at best the bottom) and Fish (sets the
Fish Finder in full auto mode with the sensitivity setting optimized for target
searching). See the following table.
[MENU] + "Preset Mode" + [ENTER]
Fish : Gain Mode = Auto, Range Mode = Auto, Frequency = do not change, Shift = 0, STC = Short if
Cruise : Gain Mode = Auto, Range Mode = Auto, Frequency = do not change, Shift = 0, STC = Short if
Freq=200kHz and Mid if Freq=50kHz, Scrolling Speed = 10, Fish Symbols = Echo, A-Scope = On,
Surface Noise Filter = Off.
Freq=200kHz and Mid if Freq=50kHz, Scrolling Speed = 10, Fish Symbols = Echo, A-Scope = On,
Surface Noise Filter = 4.
5.6.2 Gain Mode
Selects Auto or Manual.
[MENU] + "Gain Mode" + [ENTER]
5.6.3 Range Mode
Selects among Manual, Auto Range and Bottom Lock. When in Manual Range
Mode it is possible to set Shift (the offset from the surface) (see Par. 5.6.5) and
Depth (see Par. 5.6.4) on which the Fish Finder shall operate. When in Auto
Range Mode the Fish Finder determines automatically the range as to keep the
bottom visible in the lower left of the screen. In this mode, Shift is always set to
0. In Bottom Lock Mode the Fish Finder automatically tracks the range around
the bottom specified by the Bottom Range value.
[MENU] + "Range Mode" + [ENTER]
5.6.4 Depth
This option is available only when Range Mode is Manual and it is disabled in Auto
Range and Bottom Lock Mode.
[MENU] + "Depth" + [ENTER]
5.6.5 Shift
This option is available only when Range Mode is Manual and it is disabled in Auto
Range and Bottom Lock Mode.
[MENU] + "Shift" + [ENTER]
NOTE The bottom Range, Depth, Shift will apply to the currently selected frequency.
5.6.6 Bottom Range
This option is available when Range Mode is Bottom Lock.
[MENU] + "Bottom Range" + [ENTER]
5.6.7 Frequency
Allows you to choose the frequency between Auto, 50 kHz or 200 kHz when single
frequency page is selected.
[MENU] + "Frequency" + [ENTER]
5.6.8 Interference Rejection
Selects a filter to remove interference from other Fish Finders.
78 User Manual
[MENU] + "Interf Reject" + [ENTER]
Page 77

5.6.9 Sensitivity Menu
The Sensitivity menu is accessible both from the Fish Finder Setup menu and by
pressing [ENTER] when in Fish Finder pages. All settings in the Sensitivity menu
are related to the Frequency selected.
[MENU] + "Sensitivity Menu" + [ENTER]
Frequency
Gain : Allows you to control the Gain of the unit's receiver. To see more details on the screen, increase
STC : Sensitivity Time Constant: it is a time varying gain curve which attenuates the sonar receiver gain
STC Length : If STC is Custom, it is possible to change the Length of the Sensitivity Time Constant.
STC Strenth : If STC is Custom, it is possible to change the Strength of the Sensitivity Time Constant.
Surf Noise Filter
NOTE1The Frequency value is only displayed: to select the desired frequency see the
NOTE
1
: ONLY IN THE DUAL FREQUENCY PAGE Allows you to select the Frequency to which the Sensitivity
parameters are applied.
the receiver sensitivity by selecting a higher gain percentage. If there is too much detail or if the
screen is cluttered, lowering the sensitivity may increase the clarity of the display.
in shallow water, increasing the gain gradually as the depth increases. This is for the purpose of
filtering out surface clutter.
2
: This function implements an advanced time varying filter that allows suppressing the surface
clutter efficiently while leaving fish targets visible.
previous Par. 5.6.7.
2
Thus imposing the capability of the Fish Finder to correctly detect the weakest
echoes coming from a very deep bottom.
5.6.10 Display Setup Menu
The Display Setup Menu allows you to change the color scheme of the Fish Finder
display, adjusts the chart scrolling rate, enables or disables the White Line and
allows determining the graphical representation of fishes.
Color Settings : Allows you to change the color scheme of the Fish Finder display. The available colors are Blue
Scrolling Speed : Adjusts the chart scrolling rate. Note that the scrolling rate is limited by the sound speed and the
White Line : Controls how the chart plotter displays information about the bottom type (hard or soft).
Fish Symbols : Allows determining the graphical representation of underwater suspended targets: Echo/Echo+Icon/
Water Temperature: Allows you to choose the Water Temperature label displayed over the echogram between Primary
[MENU] + "Display Setup" + [ENTER]
Background, White Background, Black Background, Gray Scale and Reversed Gray Scale.
depth according with the following relation: the deeper the setting, the slower the scrolling rate.
100% is the maximum possible.
Echo+Icon+Depth/Echo+Depth/Icon/Icon+Depth. The Fish icons displayed are among four
different shapes depending on the size of the Target (Small, Med, Big, Huge).
and External.
5.6.11 Transducer Setup Menu
The Transducer Setup menu contains settings that does not require frequent
changes.
Keel Offset : It is the transducer depth offset from the surface. This makes it possible to measure
Calibrate Sound Speed : Allows calibrating the value of Sound Speed in the water, depending on the water
Calibrate Water Speed : Allows calibrating the value of Water Speed sensor. The calibration value, in the
Calibrate Water Temperature : Allows the calibration on the Water Temperature sensor. Using the readings from a
Calibrate Aux Temperature : Allows the calibration of the Aux Temperature sensor. Using the readings from a
Restore Defaults : Restores the default values
User Manual
[MENU] + "Transducer Setup" + [ENTER]
depth from the surface instead of from the transducer's location.
temperature and salinity.
range between -10% to +10%, will be applied to the water speed from the transducer.
precise temperature measuring device, insert here a positive/negative offset to
display right value on Fish Finder screens.
precise temperature measuring device, insert here a positive/negative offset to
display right value on FF screens.
79
Page 78

5.6.12 Alarms Menu
The Alarms menu allows you to define additional sonar alarm settings for Fish
Alarm, Shallow Alarm, Depth Alarm and Temperature Upper/Lower/Rate.
[MENU] + "Alarms" + [ENTER]
Shallow Water : Triggers an alarm when depth becomes shallower than the value set.
Deep Water : Triggers an alarm when depth becomes deeper than the value set.
High Water Temp : Triggers an alarm when the transducer reports a temperature (from TEMP 1 sensor) above the
Low Water Temp : Triggers an alarm when the transducer reports a temperature (from TEMP 1 sensor) below the
Water Temp Rate : Triggers an alarm when the transducer reports a temperature (from TEMP 1 sensor) variation rate
Fish Alarm : The options for Fish Alarm set the size of the fishes that, if detected by the unit, switches an alarm
value set.
value set.
above the value set.
to sound. These options are: Off, Small, Medium, Big and Huge. The alarm sounds if the set size
(or bigger) is detected.
5.6.13 Save & Load Menu
Insert the USER MEDIA into the slot, then follow the procedure:
Load Settings from USER MEDIA: Load the complete settings from the USER MEDIA and changes the active menu
Save Settings to USER MEDIA : This is useful to avoid the user having to retune up Fish Finder after a Clear RAM
Restore Current Preset Defaults : Restores the default values only for the current presets (see Par. 5.6.1, Preset
[MENU] + "Save & Load" + [ENTER]
settings.
operation or a software update.
Mode) and does not affect the other presets.
5.7 TRANSDUCERS
The transducer is a device that transmits and receives sound waves into the
water. The active component inside the transducer is commonly referred to as an
element but actually is a piezoelectric ceramic material.
Please refer to your dealer and/or installer to choose your transducer. Si-Tex
suggest transducers.
80 User Manual
Page 79

6. GPS
For centuries, sailors have been searching for a reliable and precise method of
travelling the world's waterways. From celestial navigating to the modern navigation techniques as Loran, Decca Navigator, Omega or Transit Satnav, each system
has had its problems with weather, range and reliability. Without doubt, the "Glo-
bal Positioning System", or GPS for short, is the most significant advance in navigation: it gives the navigator a position 24 hours a day, 365 days a year in any
weather condition.
GPS is a satellite based navigation system which provides suitably equipped users
with accurate position, velocity and time data.
Originally the GPS, developed by the U.S. Department of Defence, was conceived
for military purposes, but now it is used in a host of civilian applications.
GPS navigation uses satellite signals to determine your position in relation to a set
of satellites orbiting the earth. The GPS constellation of satellites continuously
send radio signals, containing the precise position for each satellite back to earth.
By knowing the position of 3 or 4 satellites and calculating various time differences between transmitted signals, the GPS receiver can determine its present
position anywhere on earth, and thanks to continuous updates, calculate speed
and course information.
6.1 HOW GPS WORKS
Currently, the GPS constellation consists of 26 orbiting satellites (including 3
spares), but this number will increase in the future.
The GPS receiver computes an accurate position by calculating the distance to the
GPS satellites that orbit the earth. Signals are required from 3 satellites for two
dimensional (2D) position calculation whilst 4 satellites are required for three
dimensional (3D) position calculation.
As mentioned earlier, GPS satellites are not geostationary, but they are orbiting
the earth as illustrated on the following figure:
7
10
5
15
21
20
3
17
8
6
Fig. 6.1 - The GPS constellation
2
18
14
1
11
4
19
13
16
9
Note that position is repeatedly fixed through the following three steps while any
3 satellites are in line of sight.
The position calculation procedure is indicated in the following three steps:
1. GPS satellites continuously transmit their own precise orbital data and
the GPS receiver computes their locations by receiving this data.
2. In this receiving process, the GPS receiver measures very accurate
distances to the satellites, using the "Spread Spectrum Modulation"
User Manual
81
Page 80

method. Excellence in GPS's position-fixing accuracy is mainly due to
this technology.
3. When the satellite locations and their distances are known, the GPS
receiver fixes its own position by triangulation:
d2
d3
d1
Fig. 6.1a - The GPS position calculation
As illustrated in the previous figure, the position is calculated as the meeting point of three
spheres which are drawn around the three satellites with diameters d1, d2 and d3.
6.1.1 Position Fixing Accuracy: HDOP
The GPS fix accuracy is due to the locations of 3 satellites in the sky. High accuracy is obtainable when the satellites are widely scattered in the sky; on the
contrary , accuracy is reduced when the satellites have gathered in a narrow space.
In the following figure, in both cases it is possible to obtain the GPS fix, but in the
left case the accuracy will be higher than the right:
Fig. 6.1.1 - HDOP
The index for position-fixing accuracy is called HDOP ("Horizontal Dilution Of Precision"). The smaller the HDOP value, the more accurately the position can be
fixed.
82 User Manual
Page 81

7. Maintenance
This chapter gives information on routine maintenance and problem solving associated with the chart plotter.
7.1 SYSTEM TEST
If you have connected your position-finding device according to the instructions,
and chosen the proper menu selection for your device, and are still having problems with your chart plotter, the extended auto-test should help determine the
problem. Make sure the chart plotter is turned Off. While pressing and holding
any other key, turn the chart plotter On. A new menu will appear on the display.
Use the cursor key to select the desired test: this will display in reverse video. To
choose the test press [ENTER]. To exit from any submenu press [CLEAR]. To
exit from the System Test turn Off the chart plotter.
7.1.1 RAM Menu
RAM test: Verifies the integrity of the RAM chips. If on the screen the message
"ERROR" appears, the RAM is physically damaged.
RAM clear: Clears internal memory. If the chart plotter exhibits unusual behaviour, or appears to be malfunctioning, it may be possible to correct the problem
by clearing RAM. This operation will erase all Marks, Routes, stored Track plots
and destinations. It will also return all selections (Input Data Format, Autopilot
selection, etc.) to original default values. Before this step, you have the option of
saving user Marks, Track history and Routes to a User MEDIA (this is an optional
purchase from your dealer). To confirm to clear RAM press [ENTER] again (but if
this time you do not wish to clear RAM press [CLEAR]).
7.1.2 DIM Menu
Contrast: Each time you press the cursor key to right, the screen will decrease
brightness, when you press the left key the brightness will increase.
Backlight: Sets the backlight. It operates in similar mode as Contrast.
7.1.3 Media
Data Base Test: Tests the Worldwide Background.
MEDIA Test: Tests the MEDIA. There are four possible situations:
♦ If there is a MEDIA inserted in the slot and there is not a malfunction,
the name of the MEDIA zone and the message "OK" are shown
♦ If there is a MEDIA inserted in the slot, but it is damaged MEDIA, the
name of the MEDIA zone and/or the message "Faulty" are shown
♦ If there is not any MEDIA inserted in the slot, the message "not present"
is shown
♦ If there is a USER MEDIA inserted in the slot, the message "USER MED IA"
is shown
MEDIA Connector: While a MEDIA is inserted in the slot, if the counter increases,
there is a malfunction reading it.
7.1.4 Modem test
Checks the Modem connections. Press [ENTER] to select the desired Port related
to the connections made, to the Port to which the Modem C-COM is connected.
User Manual
83
Page 82

7.1.5 Serial Ports
Change parameters: Changes the parameters of the serial interface. This menu
allows to select the Port (Signal Source), the Baud Rate between 300 or 115200,
the Data Bits (Word Length) between 7 or 8, the Parity between even, odd or
none, the Stop Bits between 1 or 2.
Input Data Display: Allows the chart plotter to act as a computer terminal and
display the incoming data exactly as it is received. If the data displayed on the
screen is unrecognizable, you may have selected the wrong input parameters for
your particular receiver. Check your receiver manual to be sure that you have
selected the proper interface format. If the screen is blank, the connection may
be interrupted, and no data is being received. Use [PAGE] to stop (or continue
after pause) data displaying, [ENTER] to show data in hex or ASCII mode (normal or small) and [CLEAR] to exit.
EC7E/EC7FE/EC11:
7.1.6 External Alarm
To check the External Alarm signal.
84 User Manual
Page 83

Terms
♦ ALT = Altitude
Altitude of GPS Antenna on the medium sea level.
♦ Alter = Alternate Solution (TD Coordinates System)
Parameter selected by the user that is applied in the conversion of TD values
to geographical coordinates Lat/Lon. It defines which of the two possible solutions can be used.
♦ Arrival Time
Estimated time of day you will reach your destination, based on your current
Speed and Track from GPS.
♦ ASF = Additional Secondary phase Factor (TD Coordinates System)
Correction to TD values which can be inserted by the user.
♦ Azimuth
Angular measurement from the horizon to a satellite or another object.
♦ AWD = Apparent Wind Direction
Direction from which the Wind appears to blow relative to a moving point (also
called Relative Wind Direction).
♦ AWS = Apparent Wind Speed
Speed at which the Wind appears to blow relative to a moving point (also
called Relative Wind Speed).
♦ Beacon
A prominent, specially constructed object forming a conspicuous vertical mark
as a fixed aid to navigation.
♦ Buoy
A floating object moored to the sea bottom in a particular (charted) place, as
an aid to navigation.
♦ Buoys and Beacons
Buoys and Beacons are used to indicate to mariners recommended or established routes, underwater dangers, restrictions and regulations. They can be
lighted or not and are colored according to their international code.
♦ BRG = Bearing
Angle between the North (True or Magnetic) and a destination. The horizontal
direction of one terrestrial point from another referring to the North (True or
Magnetic). It is often used to indicate the direction to follow to reach the
destination.
♦ Chain (Loran-C GRI)
Groups of transmitting stations that use timed radio pulse transmissions. In
each of these chains there is a master station and two or more slave or secondary stations. Stations belonging to a same chain transmit pulses in timing
groups: a different time base identifies each chain. The time base of each
chain is the Group Repetition Interval or GRI. This GRI identifies the chain in
unique mode. For example the GRI = 4990 identifies the chain of Central
Pacific zone.
♦ COG = Course Over Ground
Direction of the path over ground actually followed by a vessel.
♦ Course Line (Time Line)
Graphical indication of the direction in which the Vessel is heading. The Course
Line origin is the vessel’s position so the time line movement is synchronized
with the vessels Icon. Course Line "course" is given by the value of COG
User Manual
85
Page 84

(Course Over Ground) and its length is proportional to the SOG (Speed Over
Ground).
♦ CTS = Course To Steer
Optimum direction the boat should be steered in order to efficiently make
headway back to the courseline while also proceeding toward the destination
Waypoint.
♦ Cultural Features
Any man-made topographic feature as built-up area, buildings, roads.
♦ Datum
The Latitude and Longitude lines printed on any map are based on certain
models of the shape of the earth: these models are called Datum or Coordinate Systems. There are many different Datum in use, each one gives different Lat/Lon positions for an identical point on the surface of the earth (see
also Map Datum and Fix Datum).
♦ Dead Reckoning
Procedure to determine the current position of a vessel by applying to the last
known position the way that has been made (since the last known position
was received). This procedure is normally based on the last received GPS
position, Speed and Course or to the last received GPS position, Log Speed
and Heading.
♦ Default
Original factory setting for any menu selection. The default values are set
after a Master Reset (RAM Clear).
♦ Depth Area
Sea areas included in the user selectable range of minimum and maximum
depth limits. The sea area that is beyond the selected range is filled by an
uniform white color, the sea area that is inside the selected range is filled by
ordinary multicolor shading. The Spot Soundings and Depth Contours are displayed on the range only.
♦ Depth Line
(Also called Bathymetric Line) Imaginary line connecting points of equal water
depth.
♦ Destination
In order to tag on the chart the point, towards which the ship is Heading, you
can use a special mark, called destination. When the destination is placed, all
navigation data referred to this point.
♦ DGPS = Differential GPS
Provides even greater positioning accuracy than standard GPS.
♦ DPT = Depth from Transducer
Water Depth below the Transducer. The Distance from the Depth Transducer to
the ground.
♦ DST = Distance
Geographical distance between two points on the map. It is possible to select
the unit among Nm, Sm and Km.
♦ ETA = Estimated Time of Arrival
Predicted time of reaching a destination or Waypoint
♦ File
Collection of information (of the same type) stored on a USER MEDIA. Each
file must have a unique name, ideally one that describes its contents. Filenames
are kept in a directory on each USER MEDIA.
♦ Fix
Current position of the vessel provided by the GPS (connected to the chart
plotter or built-in) or other positioning systems.
86 User Manual
Page 85

♦ Fix Status
Indicates the quality of the position fix signal.
♦ Fuel Consumption Rate
Estimated fuel consumption rate (per hour) of an engine boat referred to its
relative estimated cruising speed.
♦ GNSS = Global Navigation Satellite System
Any single or combined navigation system based on satellites. The current
available satellites systems are: GPS, GLONASS and the combined GPS and
GLONASS.
♦ Goto
Function that defines the destination point and activates the navigation to it.
The destination can be placed on any location of the map, an existing Mark
point or on a predefined Route.
♦ GPS = Global Positioning System
Satellite based navigation system operated by the US Department of Defence.
It gives the navigator a position 24 hours a day, 365 days a year under any
weather conditions.
♦ HDG = Heading
Horizontal direction in which a ship actually points or heads in any moment
(see also COG).
♦ HDOP = Horizontal Dilution Of Precision
Precision of the positioning system (GPS). The smaller HDOP value indicates
higher position accurately.
♦ Home mode
All operations refer to the ship's position.
♦ Landmarks
Landmarks are any prominent object such as monument, building, silo, tower,
mast, ..., on land which can be used in determining a location or a direction.
♦ Latitude
Angular distance North or South of the equator measured by lines encircling
the earth parallel to the equator in degrees from 0° to 90°.
♦ LAT/LON
Coordinate system using Latitude and Longitude coordinates to define a position on earth.
♦ Lat/Lon Grid
Grid of parallels (of Latitude) and meridians (of Longitude) drawn on the map.
♦ LOG Speed
Speed of the vessel relative to the water, provided by an instrument with a submerged transducer for measuring the distance/speed travelled by the vessel.
♦ Longitude
Angular distance East or West of the prime meridian (Greenwich meridian) as
measured by lines perpendicular to the parallels and converging at the poles
from 0° to 180°.
♦ Loran
Positioning system which determines the current position of the vessel by
measuring the difference in the times of reception of synchronized radio pulse
signals transmitted by two or more fixed stations.
♦ Magnetic Deviation
Value, expressed in degrees East or West that indicates the direction in which
the north indicator on the compass card is offset from the magnetic north (the
difference expressed in degrees East or West between the compass north and
the magnetic north).
♦ Magnetic Variation
Angle between the magnetic and geographic meridians at any place, expressed
User Manual
87
Page 86

in degrees West or East to indicate the direction of magnetic North from true
North. It changes from point to point, and (at the same point) with time.
♦ Mark
Reference point related to cursor position. Typically it represents by an icon
and label under Mark.
♦ Natural Features
Any topographic feature formed by the action of natural processes: coastlines,
relief, glaciers.
♦ Navigate mode
Operating mode (called also Home mode): all operations refer to the ship's
position. Navigate or Navigation mode is also used to indicate that the destination is placed.
♦ NMEA-0183
The NMEA-0183 Data Interface Standard was developed by the National Marine Electronics Association of America. It is an international standard that
enables equipment from many different manufactures to be connected together and share information.
♦ OSGB = Ordinance Survey of Great Britain
Coordinate system describing only Great Britain charts. Generally used with
GBR36 datum, which also describes only Great Britain charts. This coordinate
system cannot be used in any other part of the world.
♦ Pair
The two selectable secondary stations, of a Loran-C chain, which are used to
calculate the TD (Time Difference) position of a point in the map area covered
by the selected Loran-C chain.
♦ Pictures & Diagrams
The MAX data format allows assigning one or more image to any cartographic
object. These Pictures are typically used to facilitate the identification of cartographic objects or places around the map: they can be the landscape layout
nearby a harbour, the shape of a bridge or of a buoy etc. On some objects,
such as bridges, the image associated can represent the Diagram representing the shape of the objects and the various characteristics (length, height,
type of bridge etc.).
♦ Port Info
Port Info function is a combination of a Port Info database containing all the
relevant Safety and Navigational information normally found in good pilot books
and a presentation software which displays special Port Facility Symbols.
♦ Ports & Services
Areas along shore with facilities for mooring, downloading and uploading of
ships, generally sheltered from waves and winds. Port installations are piers,
wharves, pontoons, dry docks, cranes... .
♦ Route
Sequence of Waypoints connected by segments (Route Legs). Among the av ailable Routes, only one is the Active Route, which is shown by a straight line and
88 User Manual
Page 87

arrows to indicate the direction.
♦ RTCM = Radio Technical Commission for Maritime Services
Data format created by the Radio Technical Commission Maritime to transmit
Differential GPS corrections.
♦ SCALE
Allows the display of Map Scale (magnitude of the reference scale expressed
in the actual unit of measure) and the current Map Datum.
♦ SNR = Signal to Noise Ratio
Ratio between the magnitude of a radio signal and the magnitude of the noise
(that is, the interferences). The SRN is expressed in decibels and it is associated to the GPS satellites signal quality.
♦ SOG = Speed Over Ground
Current velocity at which the vessel is travelling, relative to a ground location.
The SOG is normally provided by the GPS sensor.
♦ Spot Sounding
Depth of the water in a specific and charted position. It is represented on the
map by its own value expressed in the current depth unit.
♦ STR = Steering
Difference between COG and CTS. If COG is 25° and CTS is 30°, then STR is
5° Right.
♦ STW = Speed Through Water
Speed of the vessel relative to the water.
♦ TD = Time Difference
Loran positions are determined by precise timing of the intervals between
reception of pulses transmitted by pairs of stations in the selected chain. Between any two stations a ship must be located somewhere along a line of
possible positions where the measured Time Difference, TD, between arrival
of pulses from those stations would be observed. The TD is measured from
the time of reception of the master station signal to the time of reception of
the slave station signal (see also Pair).
♦ Tide
Periodic rise and fall of the surface of oceans, bays, etc. , due principally to the
gravitational interactions between the Moon and Earth.
♦ Tide Info
Calculates the tide heights for any past or future date and as a by-product of
this calculation will also display the Maximum and Minimum Tide height and
time for the day selected plus the times of Sunrise and Sunset. At some chart
levels, the chart plotter will display a new Tide Diamond Symbol for every Port
or tide point in the database covered by that particular DATA MEDIA.
♦ Tracks & Routes
Recommended and established routes for ships at sea, including traffic separation schemes, deep water routes.
♦ TRN = Turning
Difference between COG and BRG. If COG is 80° and BRG is 75°, TRN is 5° Left.
♦ TTG = Time To Go
Estimated time needed to reach your destination, based on your current speed
and the distance to destination.
♦ TWD = True Wind Direction
Direction of the Wind relative to a fixed point on the earth.
♦ TWS = True Wind Speed
Velocity of the Wind relative to a fixed point on the earth.
♦ Underwater Objects
Objects like obstruction, wreck, cable…
User Manual
89
Page 88

♦ User Point
Object you place on the chart identified by its coordinates and displayed on
the screen with a reference symbol (see Mark, Waypoint).
♦ UTC = Universal Time Coordinated
Time scale based on the rotation of the earth that is used by most broadcast
time services.
♦ UTM = Universal Transverse Mercator
Metric Grid system used on most large and intermediate scale land topographic charts and maps.
♦ Variation
Angle between the magnetic and geographic meridians at any place, expressed
in degrees West or East to indicate the direction of magnetic North from true
North. It changes from point to point, and (at the same point) with time.
♦ VMG= Velocity Made Good
Destination closing Velocity. The VMG is calculated using the current speed of
the vessel (SOG) and the difference between the current vessel course and
the bearing to the destination.
♦ WAAS = Wide Area Augmentation System
The Federal Aviation Administration (FAA), in cooperation with other DOT organizations and DOD, is augmenting the GPS/SPS with a satellite-based augmentation system, the WAAS. It will provide a signal-in-space to WAA S users to
support en route through precision approach navigation. After achieving initial
operational capability, the WAAS will then be incrementally improved over the
next years to expand the area of coverage, increase the availability of precision
approaches, increase signal redundancy and reduce operational restrictions.
♦ Waypoint
Any point to which one intends to navigate. A sequence of Waypoints makes
up a Route plan.
♦ WGS-84 = World Geodetic System 1984
Coordinates System or Datum developed by the Defence Mapping Agency
(DMA). It is the default geodetic Datum used by the chart plotter and the GPS.
♦ Zoom-In
Shows more detail in a smaller area.
♦ Zoom-Out
Operates similarly to zoom -in, but in the reverse, showing a wider but less
detailed view.
♦ XTE = Cross Track Error
Distance from the ship's present position to the closest point on a line
between the origin and destinations Waypoints of the navigation.
90 User Manual
Page 89

EC5E/EC5I
menu
clear
FEATURES & FUNCTIONS
♦ Direct sunlight viewable color 5" LCD vertical display
♦ Worldwide Built-in Cartography showing C-MAP BY JEPPESEN detail up to
2.0 NM
♦ "C-MAP BY JEPPESEN" MAX electronic charts, object-oriented chart sys-
tem with enhanced functionality including:
Guardian alarm, Safety Status Bar, Safe Route Checking
Perspective View
Satellite Image Coverage
Turbo and Smooth Zoom
Multilanguage
Enhanced Port Information database
Tides & Currents data
Photos & Diagrams
Automatic Information on all chart objects and User Points
Find function for Ports Services, Ports By Name, Ports By Distance,
Tide Stations, Wrecks, Obstructions, Lakes Information, Lakes By
Name, Points Of Interest, Cursor, Coordinates and User Points
♦ Positional information from GPS
♦ Depth Graph pages
♦ Navigation Data page
♦ 3D Road page
♦ GPS Status page
♦ Gauges pages
♦ AIS Report List page
♦ Fish Finder pages
♦ 5000 Waypoints/Marks and 25 Routes (200 Waypoints max per Route)
1
User Manual
91
Page 90

♦ 5000 Track Points
♦ Create, Move, Insert, Edit, Delete, Send, Receive Waypoint
♦ Create, Move, Edit, Delete, Send, Receive Mark/Event
♦ N avigation to Goto
♦ Create, Save, Name, Edit, Delete, Send, Receive or Follow a Route
♦ Route Data Report and User Points (Marks/Waypoints) List pages
♦ Display vessel's position, direction and Track
♦ Alarms Handling (Auto Off, Arrival Alarm, XTE Alarm, Anchor Alarm,
Depth Alarm, HDOP Alarm, Heading Alarm, Grounding Alarm)
♦ Man OverBoard (MOB) to navigate back to a missing person or object
♦ C-Link and C-Weather Service
♦ R-B function
♦ Simulation Mode with cursor control
NOTE1If Fish Finder connnected.
TECHNICAL SPECIFICATIONS
♦ Operating Voltage :10 - 35 Volt dc
♦ Power consumption :0.6A max @ 12V (7.2W Max)
♦ Interface :NMEA-0183
♦ Autopilot Interface : NMEA-0180, NMEA-0180/CDX, NMEA-
♦ Display : Sun Light Viewable Color LCD (active area 5")
♦ Display Resolution :240 x 320 pixels
♦ MEDIA :SD Card
♦ Cartography :C-MAP BY JEPPESEN DATA MEDIA
♦ Operating temperature range : 32/131 °F (0/+55 °C)
♦ Memory :Non volatile
♦ Keyboard :Silicon rubber, backlight
♦ Weight :580 gr. (EC5I)
0183
560 gr. (EC5E)
When the package containing the chart plotter is opened for the first time after
purchase, please make sure that the following contents are present (if any item is
missing, please contact your local dealer):
♦ Quick Disconnect Bracket
♦ Chart plotter's protective cover
♦ Fuse 2 Amp. + fuseholder
♦ User Manual
♦ Flush mounting kit + Cutting template (EC5E)
♦ Smart DGPS WAAS Receiver with cable 15 mt/45 feet (EC5E)
92 User Manual
Page 91

INSERTING/REMOVING PROCEDURE
Inserting the MEDIA
Open the door. Hold the MEDIA by the short side. Gently push the MEDIA into the
slot; press the MEDIA in as far as it will go to hold fixed into the slot.
Removing the MEDIA
Open the door, press in on the MEDIA and remove the MEDIA out of the slot.
CHART PLOTTER DIMENSIONS
INSTALLATION AND REMOVING
Bracket installation
User Manual
93
Page 92

EXTERNAL WIRING
QUICK DISCONNECT BRACKET CABLE
BLACK
RED
WHITE
GREEN
YELLOW
BROWN
GRAY
ORANGE
PINK
BLUE
Flush mount installation
DESCRIPTIONWIRE COLOR
GND/COMMON
POWER +10-35Vdc
INPUT1+
SIGNAL RETURNOUTPUT1+
INPUT2+
OUTPUT2+
INPUT3+
OUTPUT3+
SIGNAL RETURN-
External Wiring for EC5E
External Wiring for EC5I
FUNCTION
POWER SUPPLY GND
POWER SUPPLY+
NMEA0183/C-COM
SIGNAL RETURN
NMEA0183/180/180CDX/C-COM
NMEA0183/C-COM
NMEA0183/180/180CDX/C-COM
NMEA0183/C-COM
NMEA0183/180/180CDX/C-COM
SIGNAL RETURN
94 User Manual
Page 93

TYPICAL CONNECTIONS
GPS Connection on Port 3 for EC5E
QUICK DISCONNECT BRACKET CABLE
BLACK
RED
WHITE
GREEN
YELLOW
BROWN
GRAY
ORANGE
PINK
BLUE
DESCRIPTIONWIRE COLOR
POWER GND
POWER +10-35Vdc
INPUT1+
SIGNAL RETURNOUTPUT1+
INPUT2+
OUTPUT2+
INPUT3+
OUTPUT3+
SIGNAL RETURN-
FUNCTION
POWER SUPPLY GND
POWER SUPPLY+
NMEA0183/C-COM
SIGNAL RETURN
NMEA0183/180/180CDX/C-COM
NMEA0183/C-COM
NMEA0183/180/180CDX/C-COM
NMEA0183/C-COM
NMEA0183/180/180CDX/C-COM
SIGNAL RETURN
Autopilot Connection on Port 2
AUTOPILOT DEVICE
FUNCTION
NMEA0183/180/180CDX/INPUT+
SIGNAL RETURN
BLACK
RED
WHITE
GREEN
YELLOW
BROWN
GRAY
ORANGE
PINK
BLUE
User Manual
QUICK DISCONNECT BRACKET CABLE
DESCRIPTIONWIRE COLOR
POWER GND
POWER +10-35Vdc
INPUT1+
SIGNAL RETURNOUTPUT1+
INPUT2+
OUTPUT2+
INPUT3+
OUTPUT3+
SIGNAL RETURN-
FUNCTION
POWER SUPPLY GND
POWER SUPPLY+
NMEA0183/C-COM
SIGNAL RETURN
NMEA0183/180/180CDX/C-COM
NMEA0183/C-COM
NMEA0183/180/180CDX/C-COM
NMEA0183/C-COM
NMEA0183/180/180CDX/C-COM
SIGNAL RETURN
External NMEA Connection on Port 1
NMEA0183
DEVICE
FUNCTION
NMEA0183 OUTPUT+
NMEA0183 INPUT+
SIGNAL RETURN
95
Page 94

QUICK DISCONNECT BRACKET CABLE
BLACK
RED
WHITE
GREEN
YELLOW
DESCRIPTIONWIRE COLOR
POWER GND
POWER +10-35Vdc
INPUT1+
SIGNAL RETURNOUTPUT1+
FUNCTION
POWER SUPPLY GND
POWER SUPPLY+
C-COM
SIGNAL RETURN
C-COM
C-COM GSM Plus CABLE
WIRE COLOR
BLACK
RED
WHITE
GREEN
YELLOW
C-COM Connection on Port 1
FUNCTION
GND
POWER SUPPLY+
C-COM TX+
C-COM TXC-COM RX+
96 User Manual
Page 95

EC5FE/EC5FI
menu
clear
FEATURES & FUNCTIONS
♦ Direct sunlight viewable color 5" LCD vertical display
♦ Worldwide Built-in Cartography showing C-MAP BY JEPPESEN detail up to
2.0 NM
♦ "C-MAP BY JEPPESEN" MAX electronic charts, object-oriented chart sys-
tem with enhanced functionality including:
Guardian alarm, Safety Status Bar, Safe Route Checking
Perspective View
Satellite Image Coverage
Turbo and Smooth Zoom
Multilanguage
Enhanced Port Information database
Tides & Currents data
Photos & Diagrams
Automatic Information on all chart objects and User Points
Find function for Ports Services, Ports By Name, Ports By Distance,
Tide Stations, Wrecks, Obstructions, Lakes Information, Lakes By
Name, Points Of Interest, Cursor, Coordinates and User Points
♦ Positional information from GPS
♦ Depth Graph pages
♦ Navigation Data page
♦ 3D Road page
♦ GPS Status page
♦ Gauges pages
♦ AIS Report List page
♦ Fish Finder pages
♦ 5000 Waypoints/Marks and 25 Routes (200 Waypoints max per Route)
♦ 5000 Track Points
User Manual
97
Page 96

♦ Create, Move, Insert, Edit, Delete, Send, Receive Waypoint
♦ Create, Move, Edit, Delete, Send, Receive Mark/Event
♦ N avigation to Goto
♦ Create, Save, Name, Edit, Delete, Send, Receive or Follow a Route
♦ Route Data Report and User Points (Marks/Waypoints) List pages
♦ Display vessel's position, direction and Track
♦ Alarms Handling (Auto Off, Arrival Alarm, XTE Alarm, Anchor Alarm,
Depth Alarm, HDOP Alarm, Heading Alarm, Grounding Alarm)
♦ Man OverBoard (MOB) to navigate back to a missing person or object
♦ C-Link and C-Weather Service
♦ R-B function
♦ Simulation Mode with cursor control
♦ Internal Fish Finder
TECHNICAL SPECIFICATIONS
♦ Operating Voltage :10 - 35 Volt dc
♦ Power consumption : 12W average; 24W peak (with FF on)
♦ Interface : NMEA-0183
♦ Autopilot Interface :NMEA-0180, NMEA-0180/CDX, NMEA-
0183
♦ Display : Sun Light Viewable Color LCD (active area 5")
♦ Display Resolution :240 x 320 pixels
♦ MEDIA :SD Card
♦ Cartography : C-MAP BY JEPPESEN DATA MEDIA
♦ Operating temperature range : 32/131 °F (0/+55 °C)
♦ Memory : Non volatile
♦ Keyboard :Silicon rubber, backlight
♦ Weight :700 gr. (EC5FI)
680 gr. (EC5FE)
FF MODULE 600W-50-200KHZ
TECHNICAL SPECIFICATIONS
♦ Power Output : 600W (4800Wpp), 50/200KHz Dual Frequency
♦ Max Depth :213m (700Ft) at 200kHz, 457m(1500Ft) at 50kHz
♦ Automatic Recognition of the AIRMAR "X-DUCER ID" transducers for best
performance
♦ Advanced Digital Signal Processing
♦ Speed & Temperature Sensor (if available on transducer)
♦ Alarms (shallow water, depth, Fish, temp)
♦ Trip Log, Fish Symbols
♦ STC, Interference Rejection, Automatic noise reduction
♦ A-scope, White Line, Zoom x2/x4
♦ Auto range/gain/frequency/shift/ping rate
When the package containing the chart plotter is opened for the first time after
purchase, please make sure that the following contents are present (if any item is
missing, please contact your local dealer):
♦ Quick Disconnect Bracket
♦ Chart plotter's protective cover
♦ Fuse 3 Amp. + fuseholder
♦ User Manual
♦ Flush mounting kit + Cutting template
♦ Smart DGPS WAAS Receiver with cable 15 mt/45 feet (EC5FE)
98 User Manual
Page 97

INSERTING/REMOVING PROCEDURE
Inserting the MEDIA
Open the door. Hold the MEDIA by the short side. Gently push the MEDIA into the
slot; press the MEDIA in as far as it will go to hold fixed into the slot.
Removing the MEDIA
Open the door, press in on the MEDIA and remove the MEDIA out of the slot.
CHART PLOTTER DIMENSIONS
INSTALLATION AND REMOVING
Bracket installation
User Manual
99
Page 98

EXTERNAL WIRING
Flush mount installation
External Wiring for EC5FE
External Wiring for EC5FI
100 User Manual
Page 99

TYPICAL CONNECTIONS
GPS Connection on Port 3 for EC5FE
User Manual
Autopilot Connection on Port 1 for EC5FE
Autopilot Connection on Port 1 for EC5FI
101
Page 100

External NMEA Connection on Port 1 for EC5FE
External NMEA Connection on Port 1 for EC5FI
QUICK DISCONNECT BRACKET CABLE
BLACK
RED
WHITE
GREEN
YELLOW
DESCRIPTIONWIRE COLOR
POWER GND
POWER +10-35Vdc
INPUT1+
SIGNAL RETURNOUTPUT1+
FUNCTION
POWER SUPPLY GND
POWER SUPPLY+
C-COM
SIGNAL RETURN
C-COM
C-COM Connection on Port 1
C-COM GSM Plus CABLE
WIRE COLOR
BLACK
RED
WHITE
GREEN
YELLOW
FUNCTION
GND
POWER SUPPLY+
C-COM TX+
C-COM TXC-COM RX+
102 User Manual
 Loading...