

Page 1
Operator manual
TECHNOLOGY FOR SUSTAINABLE FISHERIES
www.simrad.com
Simrad ES70
Fish nding echo sounder
Page 2

Page 3

Fishndingechosounder
Thismanualprovidesyouwithbasicinformationrequired
tousetheSimradES70Fishndingechosounder.For
detailedoperationalinformation,refertotheSimradES70
Referencemanualandthecontextsensitiveon-linehelp.
SimradES70
Operatormanual
Release1.0.0
3February2010
343539/A
©
KongsbergMaritimeAS
Page 4

Revisionstatus
Documentno:343539/ISBN-13:978-82-8066-118-0/Revision:A
Rev.A01.02.2010
Firstversion.
Licenseinformation
WhenyouhaveobtainedthenecessarylicensestooperatetheES70,westronglyadvicethatyouwrite
downthehardwareIDandthelicensecodesonthispage.
Function
HardwareID:N/A
Licensecode
Licensecode
Licensecode
Copyright
©2010KongsbergMaritimeAS
TheinformationcontainedinthisdocumentremainsthesolepropertyofKongsbergMaritimeAS.Nopart
ofthisdocumentmaybecopiedorreproducedinanyformorbyanymeans,andtheinformationcontained
withinitisnottobecommunicatedtoathirdparty,withoutthepriorwrittenconsentofKongsberg
MaritimeAS.Thedocument,oranypartofit,maynotbetranslatedtoanyotherlanguagewithoutthe
writtenapprovalfromKongsbergMaritimeAS.
Purpose
Code
Disclaimer
KongsbergMaritimeASendeavourstoensurethatallinformationinthisdocumentiscorrectandfairly
stated,butdoesnotacceptliabilityforanyerrorsoromissions.
Warning
Theequipmenttowhichthismanualappliesmustonlybeusedforthepurposeforwhichit
wasdesigned.Improperuseormaintenancemaycausedamagetotheequipmentand/orinjury
topersonnel.Theusermustbefamiliarwiththecontentsoftheappropriatemanualsbefore
attemptingtoinstall,operateorworkontheequipment.
KongsbergMaritimeASdisclaimsanyresponsibilityfordamageorinjurycausedbyimproper
installation,useormaintenanceoftheequipment.
Supportinformation
Ifyourequiremaintenanceorrepair,contactyourlocaldealer.Y oucanalsocontactususingthefollowing
address:contact@simrad.com.Ifyouneedinformationaboutourotherproducts,visitourwebsite.On
thewebsiteyouwillalsondalistofourdealersanddistributors.
KongsbergMaritimeAS
www.kongsberg.com
Page 5

Operatormanual
Tableofcontents
ABOUTTHISMANUAL.......................................................7
SIMRADES70...................................................................9
Important..................................................................................................................9
Systemoverview....................................................................................................10
Keyfacts....................................................................................................10
Mainunits..................................................................................................10
Simpliedsystemdiagrams.........................................................................12
GETTINGSTARTED..........................................................13
PowerOn/Offprocedures.......................................................................................13
Usingthetrackball..................................................................................................15
Startingnormaloperation.......................................................................................15
Howtochooseoperationalmode.................................................................16
Howtocheckthetransceiverandtransducersettings.....................................16
Howtocheckthebottomdetectorsettings....................................................17
Howtocheckthecolourscalesettings.........................................................17
Howtocheckthesizedistributionandshpositionsettings..........................18
Howtochecktheechogramsettings.............................................................19
Howtochecktherangesettings...................................................................21
Echosounderpresentations....................................................................................22
TitleBar..................................................................................................................23
Taskbar...................................................................................................................24
Themenusystem....................................................................................................24
Menuhierarchy..........................................................................................24
Menubuttons..............................................................................................25
DISPLAYVIEWS..............................................................28
Displayorganisation...............................................................................................28
TitleBar..................................................................................................................30
Logoandproductname...............................................................................31
Operationbuttons.......................................................................................31
Informationpaneicons................................................................................32
Navigationalinformation.............................................................................34
Functionbuttons.........................................................................................35
Replaybar...............................................................................................................36
Mainmenu..............................................................................................................37
Echograms..............................................................................................................37
Surfaceechogram.......................................................................................37
Bottomechogram.......................................................................................38
Pelagicechogram........................................................................................39
343539/A
3
Page 6

SimradES70
Trawlechogram..........................................................................................40
Lines,markersandannotationsintheechograms..........................................40
Informationpanes...................................................................................................43
Aboutinformationpanes.............................................................................43
Depthinformationpane...............................................................................44
Biomassinformationpane...........................................................................44
BottomHardnessinformationpane..............................................................45
ColourScaleinformationpane.....................................................................45
SizeDistributioninformationpane...............................................................46
FishPositioninformationpane....................................................................48
EchoPositioninformationpane...................................................................48
Zoominformationpane...............................................................................49
Historyinformationpane.............................................................................50
Taskbar...................................................................................................................51
Screencaptures.......................................................................................................52
OPERATIONALPROCEDURES..........................................53
Operation................................................................................................................54
Howtochangethepingrate........................................................................54
Howtosaveanechogram............................................................................56
Howtosaverawechogramdata...................................................................57
Howtoplaybackechogramsequences.........................................................59
Views......................................................................................................................59
Howtochangethesizeofthepresentationelds...........................................60
Howtoselectpresentationlayout.................................................................60
Howtochangethecolourscaleandpresentationpalette................................60
Howtochangethenumberofcoloursintheechogram..................................61
Echogram................................................................................................................61
Howtoselectechogrampresentation...........................................................62
Howtoestablishhorizontalmarkers.............................................................62
Howtoestablishverticalmarkers.................................................................63
HowtoselectTVGgain..............................................................................63
Howtoremoveinterferenceandvessel’sownnoisefromthe
echograms..................................................................................................64
Howtoeasieridentifythebottom................................................................65
Ranges....................................................................................................................65
Howtochoosetheverticalrange.................................................................65
Howtochoosethestartrange......................................................................66
Bottomdetection....................................................................................................67
Howtodenemaximumandminimumdepth...............................................67
Sizedistribution,biomassandshdensity............................................................68
Howtomonitortheshsizedistribution......................................................68
Howtoadjusttheshlengthforcorrectcalculations.....................................69
4
343539/A
Page 7

Operatormanual
Howtomonitorthecurrentbiomass.............................................................69
Gain........................................................................................................................70
Howtoadjustthesignalgain.......................................................................70
HowtoadjusttheTVGgain........................................................................71
Powerandpulseduration.......................................................................................71
Howtochoosepassivemode.......................................................................72
Howtochangetheoutputpower..................................................................72
Howtoadjustthepulseduration..................................................................73
THEMENUSYSTEM.........................................................74
Aboutmenusandbuttons.......................................................................................74
Buttontypes............................................................................................................75
Mainmenu..............................................................................................................77
Operationmenu......................................................................................................78
Displaymenu..........................................................................................................79
Setupmenu.............................................................................................................80
Activemenu...........................................................................................................81
ECHOSOUNDERTHEORY.................................................82
Aboutbiomass........................................................................................................82
AboutTVGgain.....................................................................................................83
Aboutdynamicrangeanddisplaypresentation.....................................................84
Aboutoutputpower................................................................................................85
Aboutpulseduration..............................................................................................85
Aboutbottomslopes...............................................................................................87
Aboutrangeselection.............................................................................................87
Upperechogram:Surface............................................................................88
Lowerechogram:Bottomexpansion............................................................88
Aboutbottomlines.................................................................................................89
Bottomline................................................................................................89
Whiteline..................................................................................................90
Hardnessline..............................................................................................90
343539/A
5
Page 8

SimradES70
6
343539/A
Page 9

Aboutthismanual
Aboutthismanual
Thepurposeofthismanual
Thepurposeofthismanualistopresentthedescriptionsandproceduresrequiredto
operatetheSimradES70Fishndingechosoundersysteminasafeandefcientmanner.
Itisnotpossibletodescribeallfunctionsandparametersindetail.Itisthereforealso
importantthatyoustudytheotherdocumentsthatareprovidedwithyouechosounder.
Gettoknowyourechosounder!
YourSimradES70echosounderisanadvanceandaccurateinstrumentdevelopedto
helpyoundsh.Itisstilleasytouseassoonasyouhavefamiliarizedyourselfwith
themenusystemandthewayyouchangeparametersTheechosoundercomprisesthe
followingmainparts:
•Acolourdisplay
•Acomputer
•Oneormoretransceiverunits
•Oneormoretransducers
Thismanualwillfocusontheoperationalproceduresandsometheory.Foradditional
details,seetheSimradES70Referencemanualandthecontextsensitiveon-linehelp.
Click“Help”!
InstalledonyourSimradES70Fishndingechosounderyouwillndacomprehensive
on-linehelpsystem.Youmaynotnditinyourlanguage,buteverythingyoucanread
intheES70Referencemanualcanalsobefoundinthecontextsensitiveon-linehelp.To
accessthisinformationclick[?]ontheTitleBar,orthe[?]buttoninoneofthedialogs.
Notethatwhenyouopenthehelpsystemitwillplaceitselfonthetopoftheechogram!
Note
WindowsNT,Windows2000,WindowsXP ,WindowsV ista,Windows7andWindowsare
eitherregisteredtrademarksortrademarksofMicrosoftCorporationintheUnitedStates
and/orothercountries.
343539/A
7
Page 10

SimradES70
References
ThefollowingusermanualshavebeenprovidedfortheSimradES70Fishndingecho
sounder.EnglishmanualsareprovidedwiththeES70whenitisshipped.Manualsin
otherlanguagesmaybedownloadedfromw
w w . s i m r a d . c o m .
•SimradES70Referencemanual[338106]
•SimradES70Operatormanual[343522]
•SimradES70Installationmanual[343539]
8
343539/A
Page 11

SimradES70
ThepurposeofthischapteristoprovideanoveralldescriptionoftheES70Fishnding
echosoundersystemanditsmainfeatures.
Topics
•Importantonpage9
•Systemoverviewonpage10
SimradES70
Important
Aswithallotheradvancedinstruments,thereareafewimportantthingsthatyoumustbe
awareof.
Whentheechosounderisnotused
WhenyoudonotusetheES70,switchoffthedisplayandthecomputer.Y oumayswitch
ofthetransceivertoo.
Whendockingyourvessel
ItisveryimportantthatnoonetriestousetheES70whenthevesselisindrydock.If
thetransducerisactivatedwhenoutofwateritmaybedamagedbeyondrepair.To
ensurethatthiscannothappen,removethepowersupplytotheeitherthecomputeror
thetransceiver-orboth!Youmayalsoremovecircuitbreakers.Dothisb
vesselisplacedinthedrydock!
Ifsomethingbreaksdown
Ifyoubelievethatsomethinghasbrokendown,contactyourlocaldealer.Hewillbe
abletoassist.
Whenyouswitchofftheechosounder
e f o r e the
YoumustNEVERswitchofftheechosounderbymeansoftheon/offswitchonthe
computer.YoumustALWA YSexittheES70applicationbyclickingtheExitbuttonon
theTitleBar.Ifyoupowerdownthesounderbymeansofthecomputerswitchyoumay
damagetheES70applicationandtheelectronicinterfaceparametersfortheexternal
devices.
343539/A
9
Page 12

SimradES70
Systemoverview
ThissectionprovidesthekeyfactsabouttheES70Fishndingechosoundersystem,as
wellasabriefintroductiontothemainunits.
Keyfacts
TheSimradES70Fishndingechosounderisdesignedfortheprofessionalshery
communityimplementingthelatestinnovations.Echosoundersrangingfromrelatively
low-costsinglebeamtolargemulti-frequencysystemscontainingseveralsplit-beam
channelscanberealised.
•TheSimradES70Fishndingechosoundersystemisexibleandeasytosetup
duetoitsmodulardesign.
•Menusanddialogsareoperatedusingastandardcomputermouseoratrackball.
•Additionaluserinputcanbefacilitatedusingastandardcomputerkeyboard.
•TheES70supportslargecolourdisplaymonitors.
•TheES70usestheMicrosoftWindows®operatingsystem.ItcompliestoWindows
XP®andWindows7®.
•TheES70providesyouwithanawardwinninguserinterface.Menusystem,dialogs
andstructurehavebeencreatedusinginnovativedesign,andinclosecooperation
withcustomers.
•Astore/replayfunctionreducestheneedforechogramprintoutonpaper.The
unprocessedtransducersignalisrecordedontheinternalharddisk.Duringreplay,
thissignalisinjectedintotheES70processingsoftwareasifitarriveddirectlyfrom
thetransceiver.
Mainunits
ThebasicES70Fishndingechosounderconsistsof:
•Display
•Computer(TheES70MarineComputermaybeprovided)
•OneormoreGeneralPurposeTransceiver(GPT)units
•Oneormorestandardsinglebeamtransducers
•Oneormoresplit-beamtransducers
Colourdisplay
Astandardcommercialcolourdisplayisused.Thedisplayunitisnormallynotprovided
bySimrad.Severalcommercialtypesandsizesareavailable.
ES70MarineComputer
SimradcansupplytheES70MarineComputerfortheES70Fishndingechosounder
system.
10
343539/A
Page 13
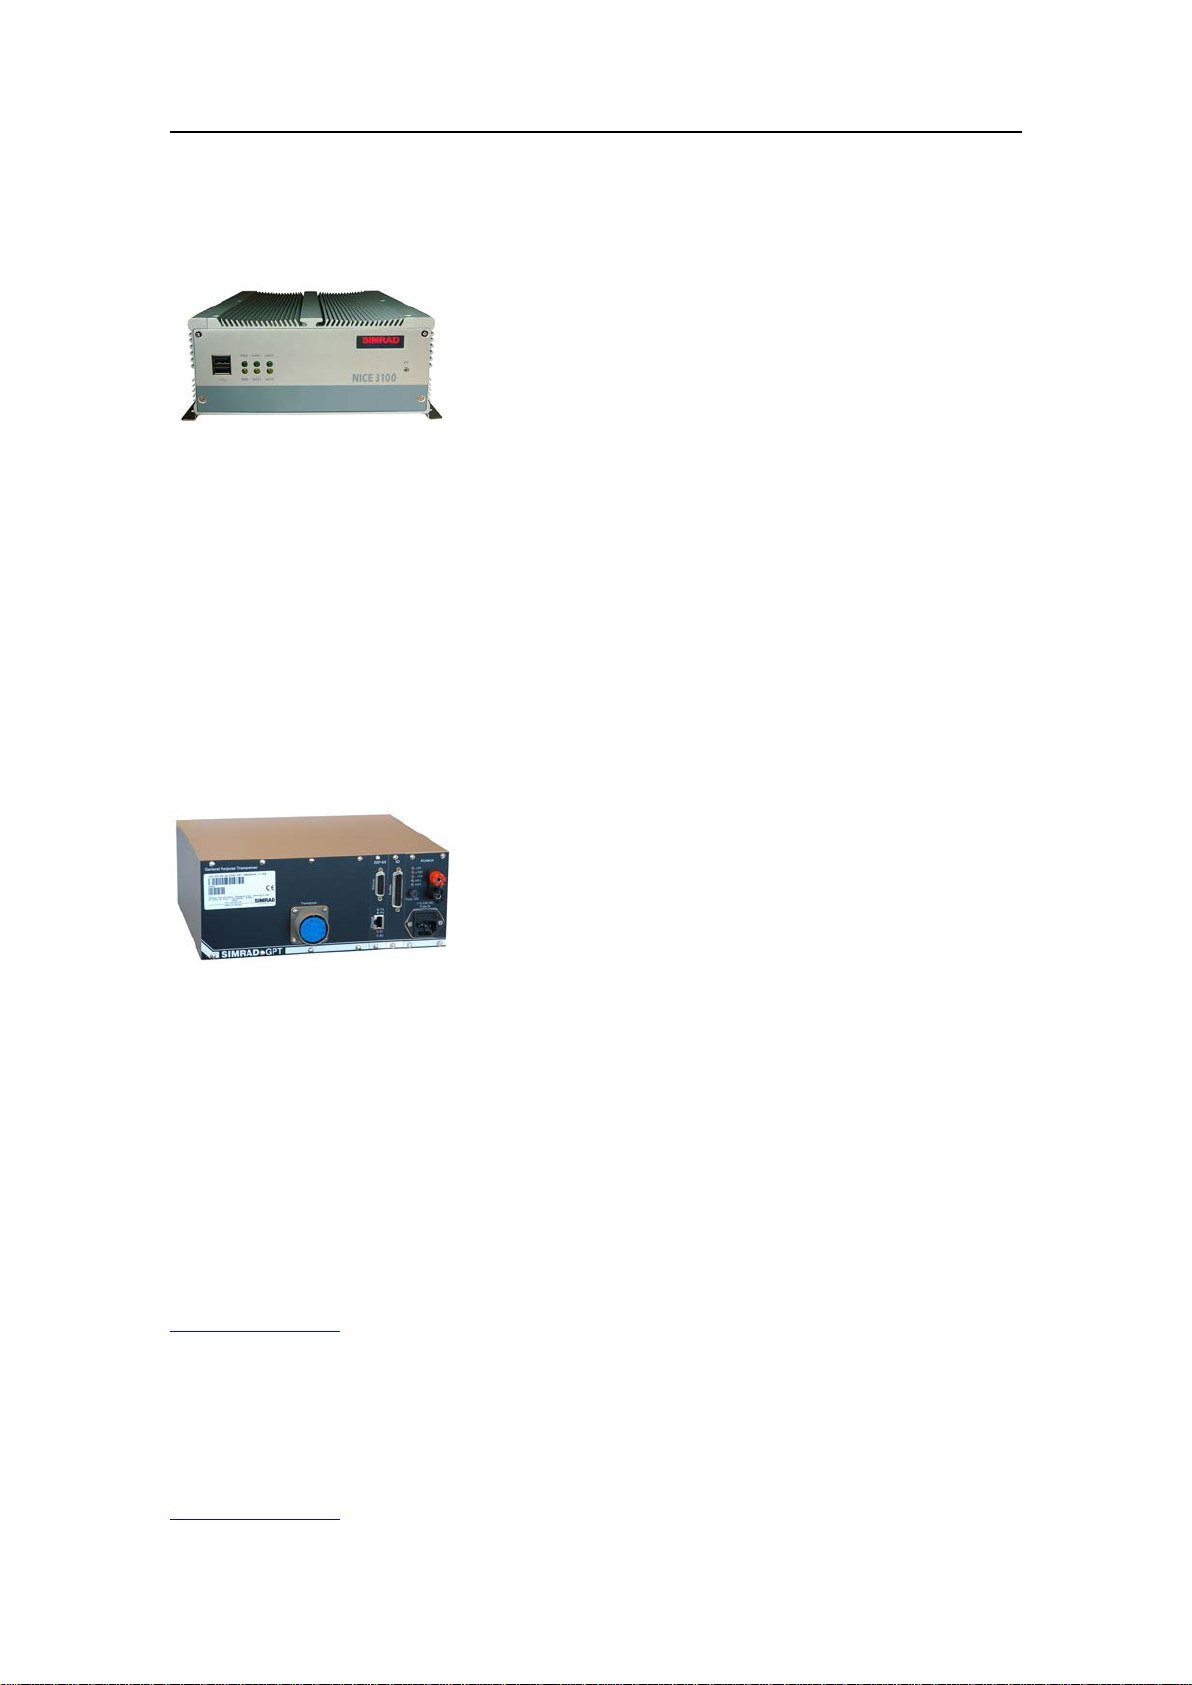
SimradES70
Figure1ES70MarineComputer
Acommercialcomputermayalsobeused.Itmustcomplytotherequirement
specicationslaidoutbyMicrosoftfortheiroperatingsystems.Itmustalsoprovidethe
necessaryinterfacefacilities(seriallinesandEthernetconnections)thatyoursystemwill
needtocommunicatewithexternalsensors(measuringdevices)andperipheralsystems.
GeneralPurposeTransceiver(GPT)
TheGeneralPurposeTransceiver(GPT)containstransmitterandreceiverelectronics.
Thereceiversaredesignedforlownoise,andtheycanhandleinputsignalsspanninga
verylargeinstantaneousdynamicamplituderangeof150dB.Alltargetsarecorrectly
measuredanddisplayed.
Figure2GeneralPurposeTransceiver(GPT)
AtwistedpairEthernetcableconnectstheGeneralPurposeTransceiver(GPT)tothe
computer.ThedistancebetweenthecomputerandtheGeneralPurposeTransceivercan
beextendeduptomaximum100meters.
Ifmorethanonetransceiverisused,asmallEthernetswitchisrequiredtoconnectthe
GeneralPurposeTransceiverstothecomputer.
Standardsinglebeamtransducer
TheES70mustbeconnectedtooneormoretransducers.
Awiderangeofoperationalfrequenciesareavailable.
FormoreinformationaboutthesinglebeamtransducersprovidedbySimrad,consult
w w . s i m r a d . c o m .
w
Split–beamtransducer
TheES70canbeusedwithSimrad’sadvancedsplit-beamtransducers.Thesetransducers
areavailableatfrequenciesrangingfrom18to200kHz.
Formoreinformationaboutthesplit–beamtransducersprovidedbySimrad,consult
w w . s i m r a d . c o m .
w
343539/A
11
Page 14
SimradES70
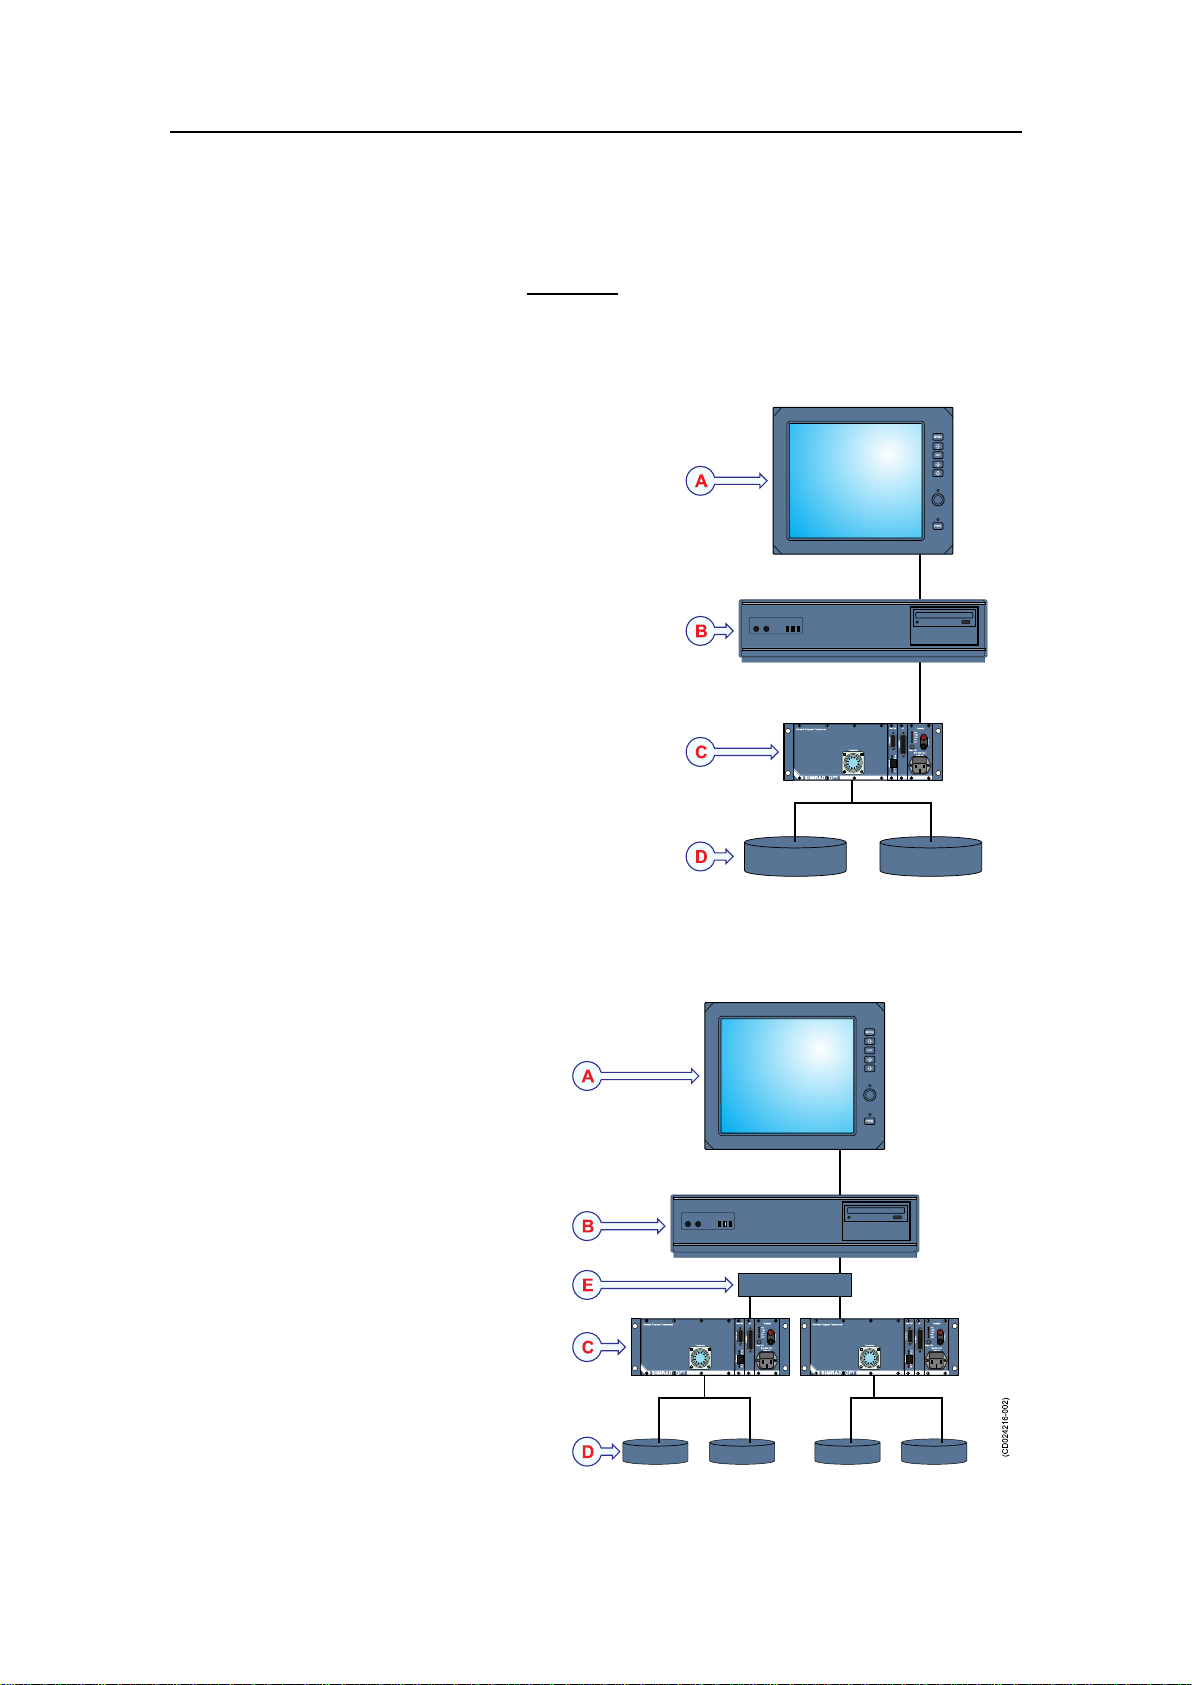
Simpliedsystemdiagrams
Thesystemdiagramsprovidedshowe
x a m p l e s onhowaES70systemmaybesetup.
Figure3SystemdiagramwithasingleGeneralPurposeTransceiver
ADisplayUnit
BProcessorUnit(computer)
CGeneralPurposeTransceiver(GPT)
DTransducer(s)
Figure4SystemdiagramwithtwoGeneralPurposeTransceivers
ADisplayUnit
BProcessorUnit(computer)
CGeneralPurposeTransceiver
(GPT)
DTransducer(s)
EEthernetswitch
12
343539/A
Page 15

Gettingstarted
ThischapterdescribeshowtogetstartedwiththebasicoperationoftheES70Fish
ndingechosounder.
Note
ThischapterassumesthattheES70Fishndingechosounderhasatleastonefrequency
channel(transceiverandtransducer)readilyconnected.Ifthisisnotthecase,observe
theprocedure.
Gettingstarted
TherelevantprocedureislocatedintheES70Referencemanual.
Topics
•PowerOn/Offproceduresonpage13
•Usingthetrackballonpage15
•Startingnormaloperationonpage15
•Echosounderpresentationsonpage22
•TitleBaronpage23
•Taskbaronpage24
•Themenusystemonpage24
PowerOn/Offprocedures
Note
Makesurethatyouhavesufcientwaterbelowthehullb e f o r e youpoweruptheecho
sounder.Ifyoustarttheechosounderwiththetransducerinair ,youmaydamageit
beyondrepair!
HowtopoweruptheES70echosounder
1PoweruptheGeneralPurposeTransceiver(GPT)unit.
2Powerupthecomputerandthedisplay.
3WaituntiltheES70programstartsonthecomputer.
343539/A
13
Page 16
SimradES70
WhentheES70starts,youmayseeadialogrequestingpermissiontoupgradethe
rmwareonthetransceiver.Thishappensifthermwareonthetransceiverisolder
thanthermwareprovidedasapartoftheES70software.Sincefunctionality
ontheES70maydependonthermwareinthetransceiver,clickY estoupgrade
thetransceiver.
Duringtheprograminitialisation,adialogappearstoletyouchoosefromthecurrent
usersettingsavailableontheES70.Thedialogisonlyvisibleafewseconds.Y ou
donotneedtomakeachoicehere.Y oucanselectusersettingatanytimebymeans
oftheUserSettingdialogontheMainmenu.
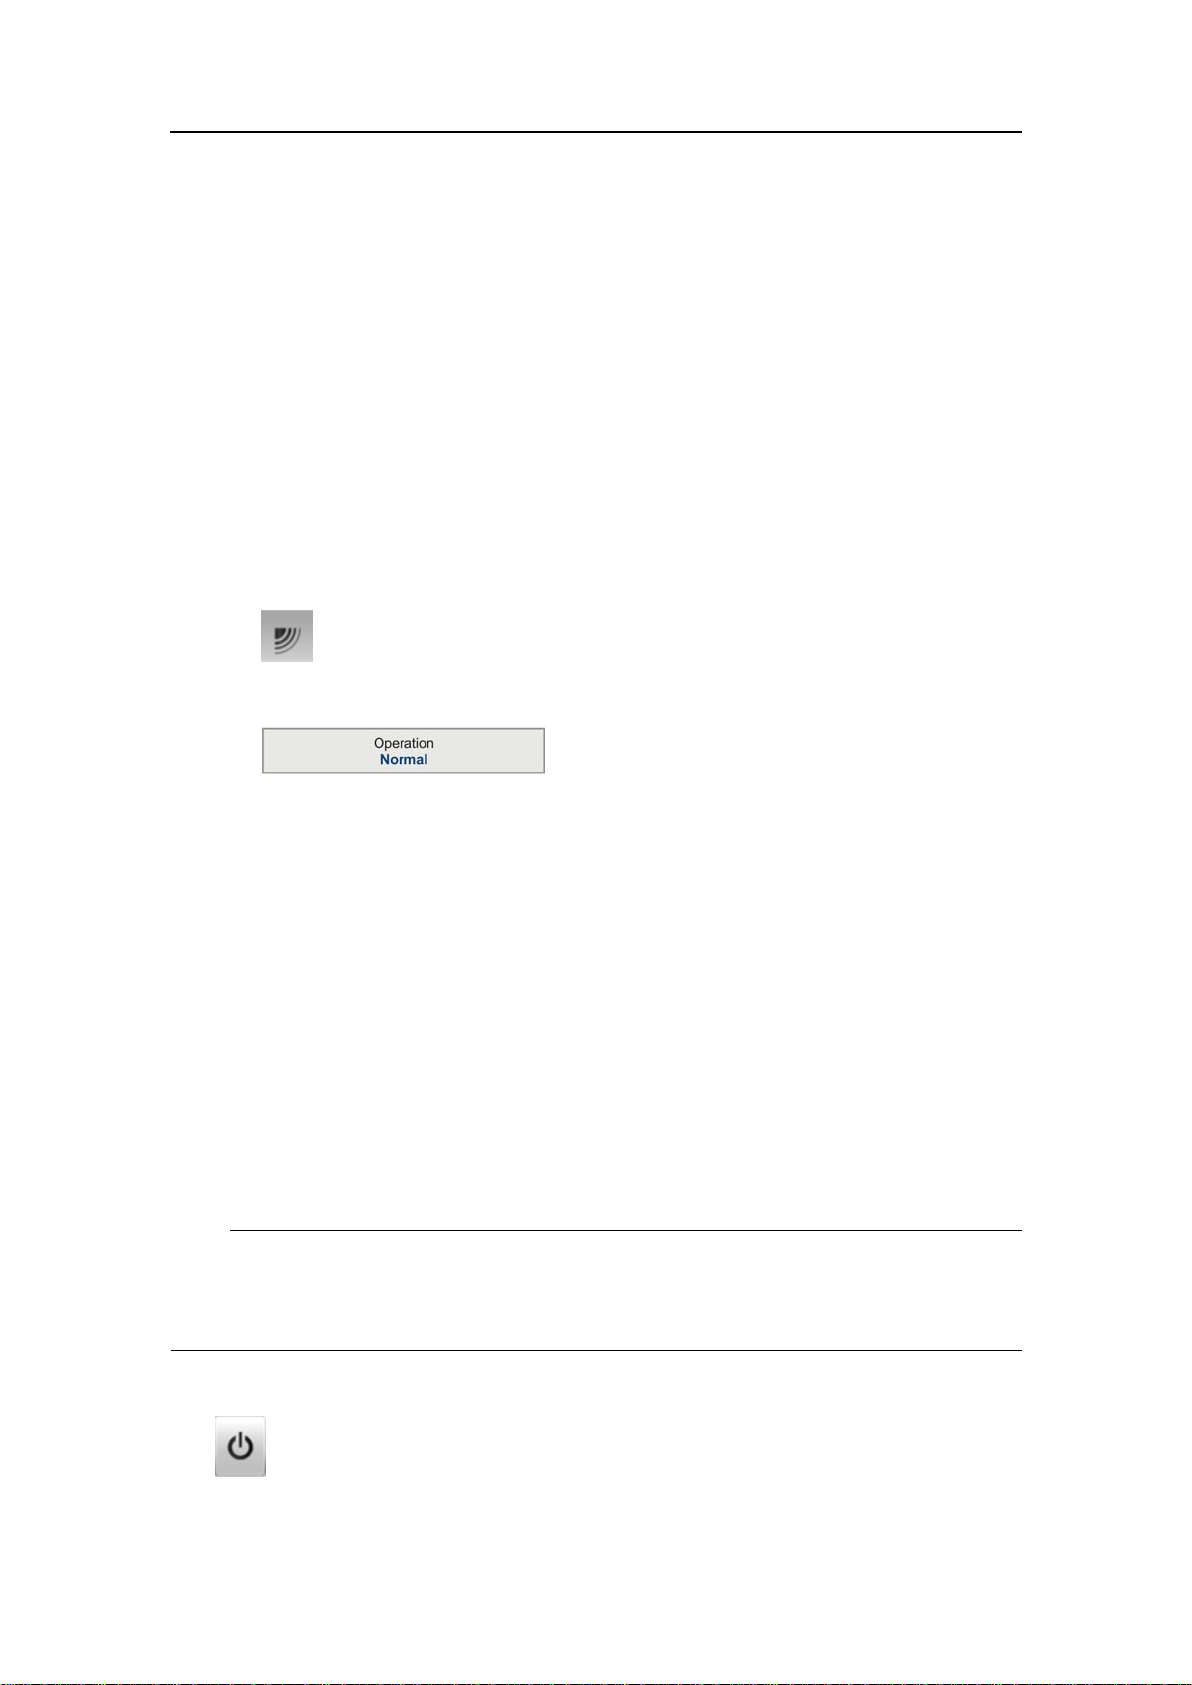
4Chooseoperationalmode:
aObservetheMainmenuontherighthandsideoftheES70presentation.
bClicktheOperationmenuicontoopentheOperationmenu.
cClicktheOperationbutton,andselectNormal.
5OnthePingbutton,clickthesymbolontherighthandsidetostartpinging.
6ObservethattheES70starts.
•TheES70startsupusingthesameoperationalparametersasthelasttimeyou
usedit.Iftheseparametersareacceptable,continueoperation.Ifyouwishtoalter
basicoperationalparameters,seesectionStartingnormaloperationonpage15.
•WhentheES70starts,itisveryimportantthatitdetectsthebottomcorrectly.
Inmostcasesthiswilltakeplaceautomatically.However,wehaveexperienced
thatlargeschoolsofshordifcultbottomconditionshavedeceivedtheES70to
displaythewrongdepth.Inthesecasesthesoundermaydisplaythebottomat
0,0meters,orwithanyotherabnormalvalue.InordertoaidtheES70tolocate
thecorrectdepth,observethededicatedprocedure.SeeHowtodenemaximum
andminimumdepthonpage67.
HowtopowerofftheES70echosounder
Note
YoumustNEVERswitchofftheechosounderonlybymeansoftheon/offswitchon
thecomputer .Thismaydamagethesoftwareortheinterfaceparametersforexternal
devices.YoumustALWAYSusethisprocedure.
1ClicktheExitbuttonontheTitleBarinthetoprightcorneroftheES70presentation.
2ObservethattheES70applicationclosesdown.
14
343539/A
Page 17
Gettingstarted
3Ifthecomputerdoesnotswitchitselfoffautomatically,usethefunctionality
providedbytheoperatingsystemtoswitchitoffmanually.
4Switchoffthepowertothedisplayandtothetransceiver(s).
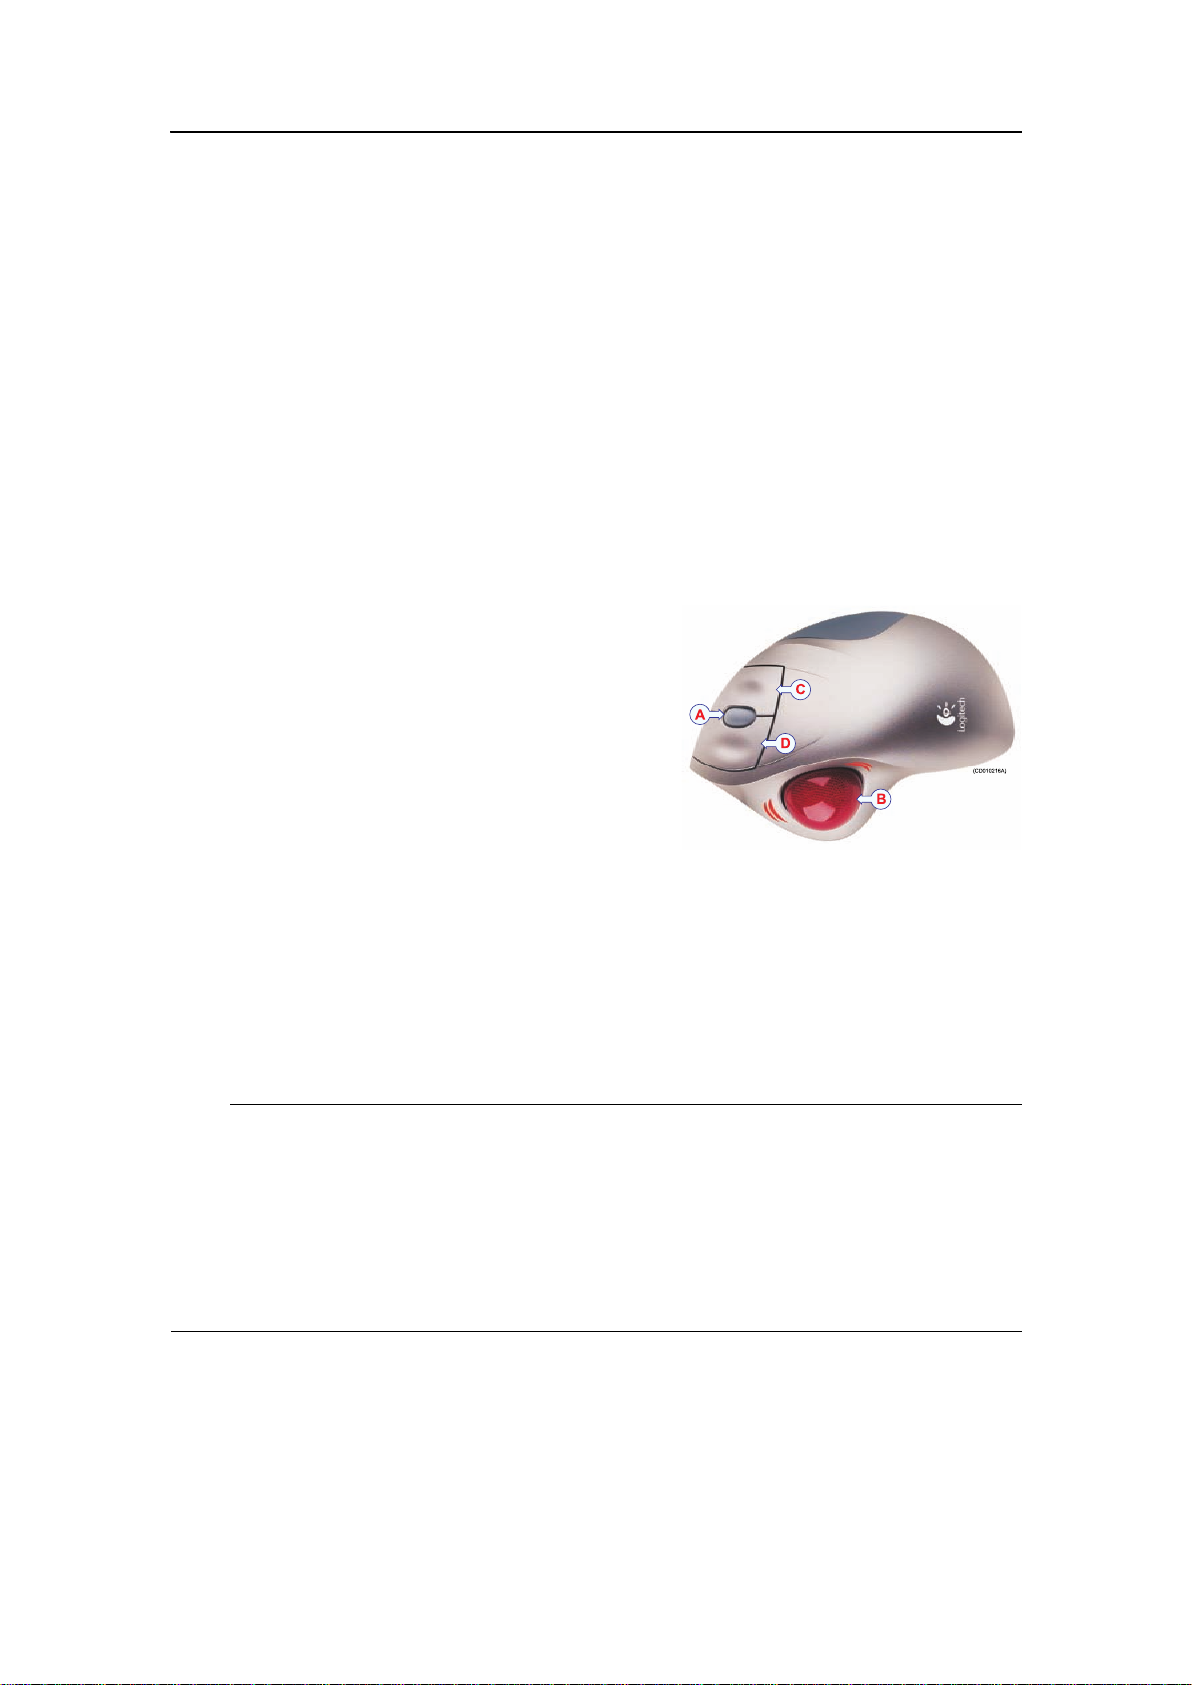
Usingthetrackball
AllES70functionsarecontrolledwiththetrackball.Thistrackballisconnectedtothe
computer,andbymeansofthebuttonsandthewheelyoucancontrolallthedialogsand
parametersettings.Astandardcomputermousecanalsobeused.Ifyouwishtousea
mouse,werecommendthatyoundoneequippedwithacontrolwheel.
AControlwheel
BTrackball
CRightmousebutton
DLeftmousebutton
Startingnormaloperation
OnceyouhavepowereduptheES70andthedisplay,youarereadytostarttheactual
operation.Whenyouhavechosenoperationalmode,theechosounderstartsusingits
previoussetupparameters.
Note
Iftheseparametersareacceptableyoudonotneedtocarryouttheremainingprocedures
inthissection.
TheseprocedurebelowassumesthattheES70Fishndingechosounderhasatleast
onefrequencychannel(transceiverandtransducer)readilyconnected.Ifthisisnot
thecase,observetheprocedure.
TherelevantprocedureislocatedintheES70Referencemanual.
1Chooseoperationalmode
2Checkthetransceiverandtransducersettings
3Checkthebottomdetectorsettings
4Checkthecolourscalesettings
5Checkthesizedistributionandshpositionsettings
343539/A
15
Page 18
SimradES70
6Checktheechogramsettings
7Checktherangesettings
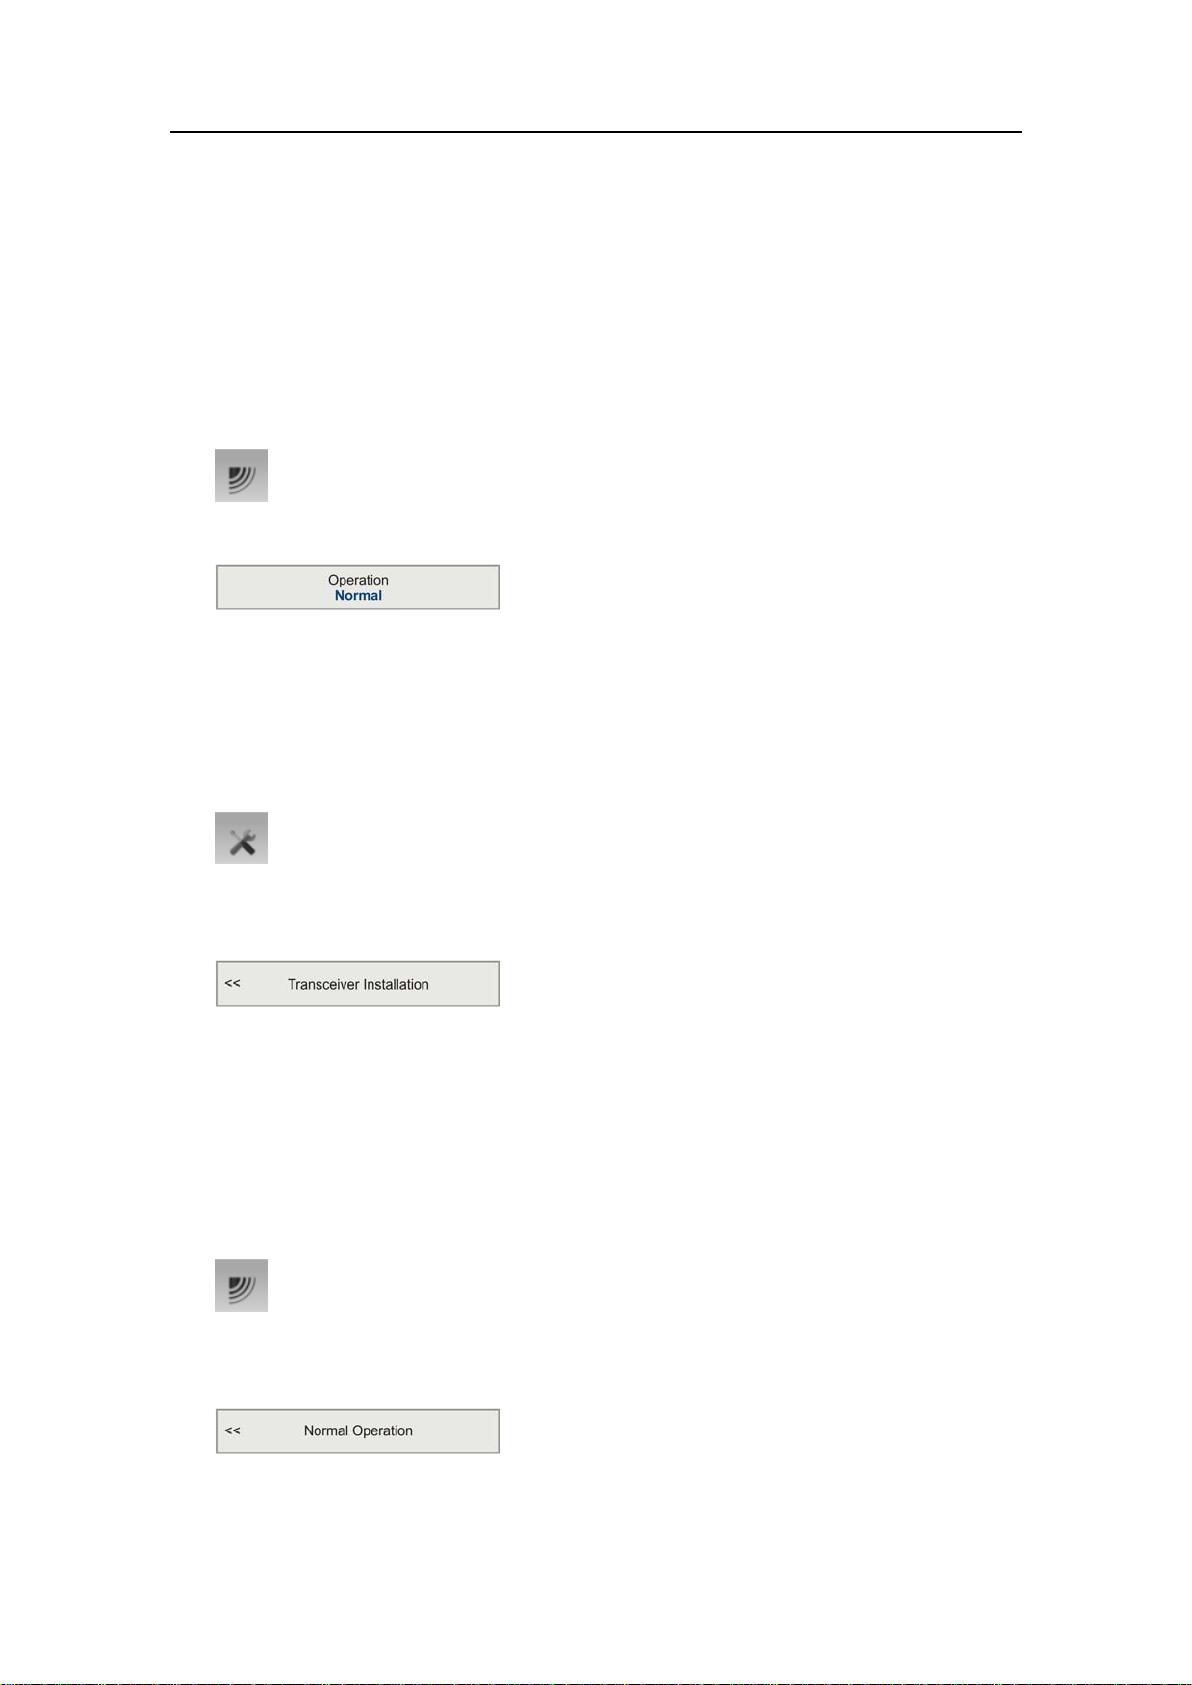
Howtochooseoperationalmode
1ObservetheMainmenuontherighthandsideoftheES70presentation.
2ClicktheOperationmenuicontoopentheOperationmenu.
3ClicktheOperationbutton,andselectNormal.
Howtocheckthetransceiverandtransducersettings
1Observethatthecurrentlyconnectedtransducer(s)areshownastabsontheT askbar.
Eachtransducernamealsoidentiestheoperationalfrequency.
2ClicktheSetupicontoopentheSetupmenu.
→Setupmenuonpage80
3OntheSetupmenu,clickInstallation,andthenT ransceiverInstallation.
ObservethattheTransceiverInstallationdialogopens.Thisdialogisusedto
controlthecommunicationbetweentheES70computerandthetransceiver(s)and
transducer(s).
4Checkthatallapplicabletransceiversandtransducersareconnectedandoperational.
Foreachtransceiver,thisisindicatedbythegreenlabelwithtext“Installed”.
5ClickOKtosavethesettingsandclosethedialog.
6ClicktheOperationicontoopentheOperationmenu.
→Operationmenuonpage78
7OntheOperationmenu,clickNormalOperation.
ObservethattheNormalOperationdialogopens.Thisdialogisusedtodene
variousparametersassociatedwiththetransceiver.Thesesettingsinclude
16
343539/A
Page 19
transceivermode,thedepthofthetransducersurface,thetransmitpower,andthe
pulseduration.NotethatthisdialogisnotavailableinReplaymode.
8Foreachchannel(transceiver/transducercombination):
aSetModetoActive.
bSetPulseLengthtoAuto.
TheES70willautomaticallychoosethebestpulsedurationtottheoperational
frequency,modeandcurrentdepth.Thepulsedurationdenestheresolution.
→Aboutpulsedurationonpage85
cSetPowertomaximum.
dCheckthattheDepthvalueissetcorrectly.
Thisisthedepthofthetransducerfacerelativetothewatersurface.Apositive
valueofforexample5metersmeansthatthetransducerislocated5meters
belowtheseasurface.Foraccuratedepthreadings,thisDepthvaluemustbe
setupcorrectly.
Gettingstarted
9ClickOKtosavethesettingsandclosethedialog.
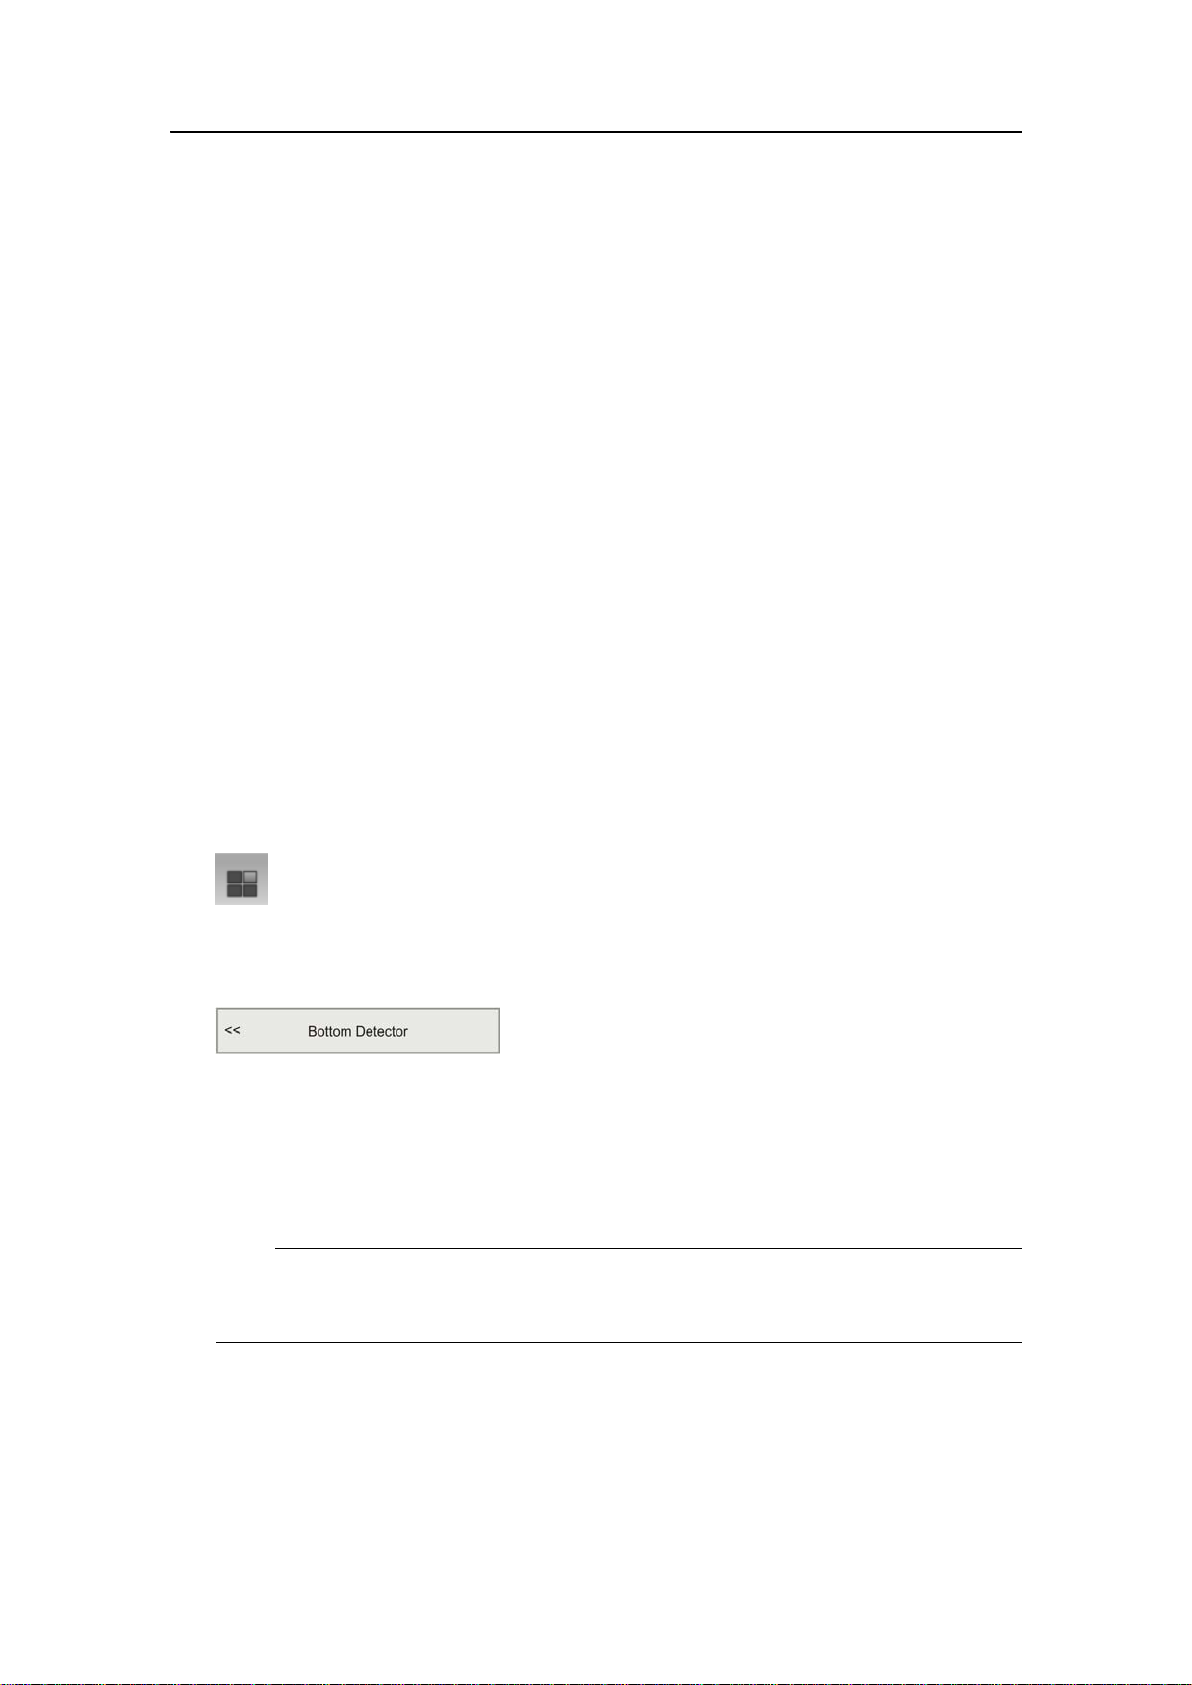
Howtocheckthebottomdetectorsettings
1ClicktheActiveicontoopentheActivemenu.
→Activemenuonpage81
2OntheActivemenu,clickBottomDetector.
ObservethattheBottomDetectordialogopens.Thisdialogisusedtodenevarious
parametersassociatedwiththebottomdetection.Theseincludethedepthrange,
wheretheES70searchesforthebottom.
3SetMinimumDepthandMaximumDepthtovaluestforthedepthatyourcurrent
location.
Note
SettingbothMinimumDepthandMaximumDepthto0mwillturnoffbottom
detection.
4ClickOKtosavethesettingsandclosethedialog.
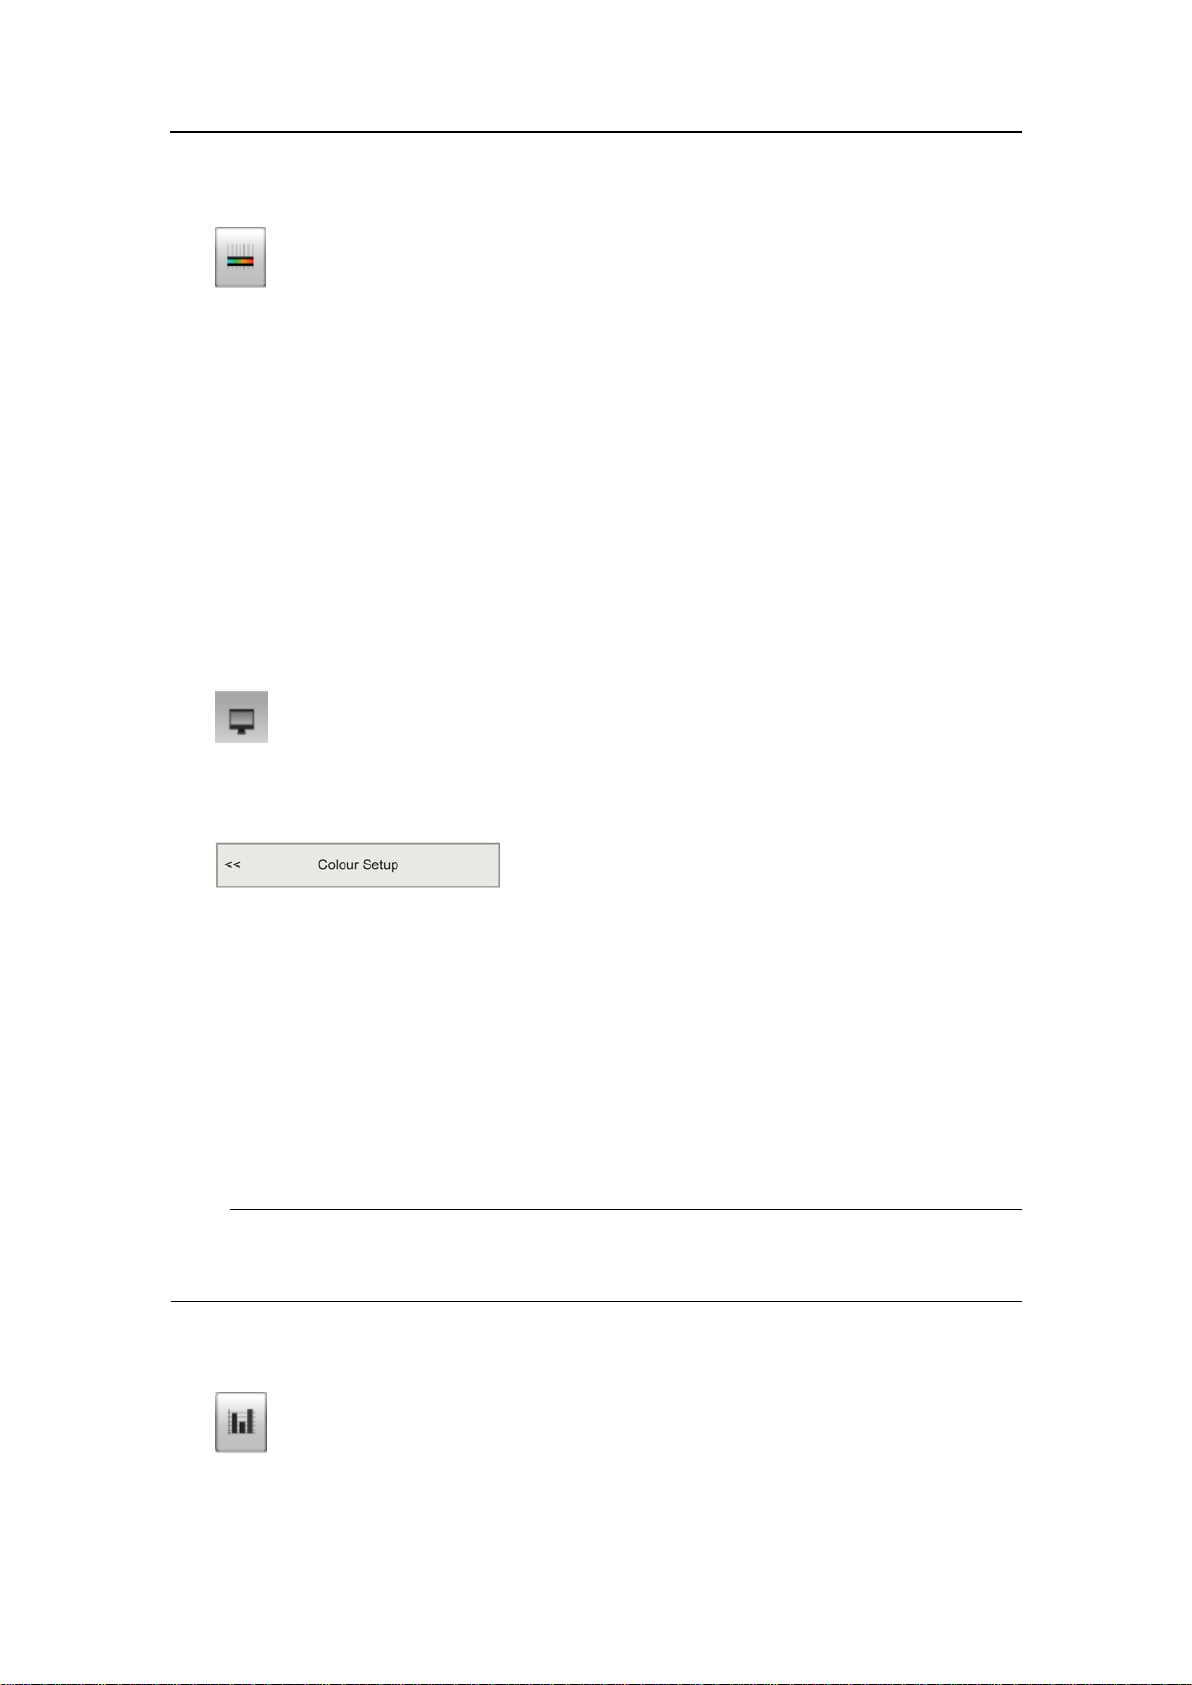
Howtocheckthecolourscalesettings
1ClicktheColourScaleiconontheTitleBartoopentheColourScaleinformation
pane.
343539/A
17
Page 20
SimradES70
→ColourScaleinformationpaneonpage45
2Observethatthecurrentcolourscaleisshown.
Youcanlterouttheweakestechoesbymanuallymodifyingthecolourthreshold.
aClicktheColourScaleiconontheTitleBartoopentheColourScaleinformation
pane.
bMovethecursortotheleftsideofthecolourscale.
Observethatthecursorchangesshapetoadualarrowline.
cClickontheleftedgeofthecolourscale,anddragtheedgetowardsright.
dObservethattheweakestcoloursareremovedfromthecolourscale,andthus
alsotheweakestechoesfromtheechogrampresentation.
3ClicktheDisplayicontoopentheDisplaymenu.
→Displaymenuonpage79
4OntheDisplaymenu,clickColourSetup.
ObservethattheColourSetupdialogopens.Thisdialogisusedtodenewhich
colourscaletouseontheES70presentations.Youcantesttheoptionsbymaking
aselection,andclickingApply.Theresultingcolourscaleisimmediatelyshown
intheColourScaleinformationpane.
Whenthecolourscaleuses12colours,eachcolouralwaysrepresentsa3dBvalue
range.Using12coloursthusenablesmappingofa36dBvaluerangetocolours.
5ClickOKtoacceptthedefaultsettingsandclosethedialog.
Howtocheckthesizedistributionandshpositionsettings
Note
Sizedistributionandshpositioninformationpanesareonlyavailableifyouusea
splitbeamechosoundersystem!
1ClicktheSizeDistributioniconontheTitleBartoopentheSizeDistribution
informationpane.
TheSizeDistributioninformationpaneshowsahistogramofthesingleshechoes
detectedintheechogram.Foranaccuratex-axisvalue,placethecursoronavertical
18
343539/A
Page 21

Gettingstarted
barinthehistogram,andreadthevaluefromthelabel.TheabbreviationTSis
commonlyused.Itmeans“TargetStrength”,andthisisameasureofhowstrong
echotheindividualshesinthecurrentechogramgenerate.Theechostrength
indicatesthesizeoftheshes.TheSizeDistributioninformationpanethusprovides
amathematicalestimateofthesizesofallthechosenshspeciesintheechogram.
→SizeDistributioninformationpaneonpage46
Tochangetheshspecies,usetheFishSelectdialogopenedontheSetupmenu.
2IntheSizeDistributioninformationpane,clicktheSetupiconinthetoprightcorner
toopentheSizeDistributiondialog.
TheSizeDistributiondialogallowsyoutoshapethesizedistributionhistogram
toyourownrequirements.Y oucansetupthemode,theupperandlowerlimits,
theaccuracy,andtheverticalresolution.
3ClickOKtosavethesettingsandclosethedialog.
4ClicktheFishPositioniconontheTitleBartoopentheFishPositioninformation
pane.
TheFishPositioninformationpaneshowsthepositionwithinthebeamofthe
detectedsingleechoesforthecurrentping(largestcircles)andthethreeprevious
ping(smallercircles).Thecoloursindicatetheechostrength.
→FishPositioninformationpaneonpage48
Howtochecktheechogramsettings
1ObservetheES70echogram.
Ifyouhavetwoormorechannels(transducers/frequencies),observethetabson
theTaskbar.
→Displayorganisationonpage28
2Clickoneofthetransducertabs.Observethatonlytheechogramfromtheselected
frequencychannelisshown.
Bydefault,twoechogramsareshownforeachfrequencychannel.Thetop
echogramissurfacerelated,whilethebottomechogramisbottomrelated.Several
echogramtypesareprovided.
•Surface:Theechogramisrelatedtotheseasurface.Startdepth(upperechogram
boundary)andverticalrange(acrossechogram)aremanuallyselectedbythe
StartDepthandRangebuttonsontheMainmenu.
•Bottom:Theechogramisrelatedtothedetectedbottom.Stopdepth(lower
echogramboundary)andverticalrangearemanuallyselectedbytheStartDepth
andRangebuttonsontheMainmenu.Theechogramisonlydrawnforpings
havingasuccessfulbottomdetection.
343539/A
19
Page 22
SimradES70
•Pelagic:ThisechogramisnearlyidenticaltotheSurfaceechogram.However,
thebiomasscalculationsarenotrestrictedbythebottomdetection.Thismeans
thatthebottomechowillbeincludedincalculationsifitappearswithinthe
chosenrange.
Example:Ifyouareinvestigatingalargeschoolofpelagicsh,settheStart
RangeandRangetoenclosetheschool.Iftheschoolislargeenough,aSurface
echogrammaymistakeitforbottom,andthebiomassreadingswillbewrong.
ThePelagicechogramwillhoweverdisregardthebottomdetection,andgivea
correctestimateofthebiomass.
•Trawl:Trawlsensorsystemscommunicateheadropedepthand
headrope-to-footropedistancetotheES70atregularintervals.Theechogram
coverstheverticalopeningofthetrawlincludingasmallmarginateachside.
Theheadropeandfootropemarginsareidentical.Thebiomasscalculationsare
notrestrictedbythebottomdetection.
3Movethecursorovertheechogram.
Observethatarectangular“tooltip”labelisshown.Itprovidesinformationabout
theechoesatthecursor’spresentposition.Whichinformationtoincludeinthelabel
isdenedintheDisplayOptionsdialog.
4ClicktheHorizontaltab.Observethattheechogramchannelsareshownhorizontally.
5ClicktheV erticaltab.Observethattheechogramchannelsareshownvertically.
6Clickononeoftheechograms.
Observethattheechogramthenappearswithathickborderline.Theechogramyou
haveselectedisnowthe“active”echogram.AnychangesmadeintheEchogram
dialogwillbydefaultonlyapplytothisechogram.
→Echogramsonpage37
7OntheActivemenu,clickEchogram.
ObservethattheEchogramdialogopens.Thisdialogisusedtocontrolthe
appearanceoftheactiveechogram.
8IntheEchogramdialog,checkthattheLinestabisshown.
TheLinestabintheEchogramdialogallowsyoutochangetheappearanceofthe
bottomline.Youcanaddanextrabottomline,andinadditiontothisyoucanenable
eitherawhitelineorahardnessindicatorline.Thetaboffersseveralhorizontal
informationlines,andyoucanchoosetheverticalscaleoftheechogram.Finally,
theLinestabofferstimeordistancemarkers,andyoucanenableannotations.
9ClickBottomlineandWhitelinetoenablethese.Observethechangesonthe
echogram.
10ClicktheEchogramtab.
TheEchogramtabintheEchogramdialogallowsyoutoselectwhichTVGcurveto
usefortheechogram.Y oucanchoosefromseveralstandardcurves,ormakeyour
own.Thetabalsoallowsyoutochoosewhichtypeofechogramyouwishtodisplay.
→AboutTVGgainonpage83
20
343539/A
Page 23
11ChangetheEchogramT ypetoseethevariations.
12ClicktheHorizontalAxistab.
TheHorizontalAxistabintheEchogramdialogallowsyoutochoosethehorizontal
scaleoftheechogram.Thiscontrolshow“fast”theechogrammovesfromright
towardsleftacrossthedisplay.
13Trythevariousoptionstoseethevariationsontheechogram.
14ClickOKtosavethecurrentsettingsandclosethedialog.
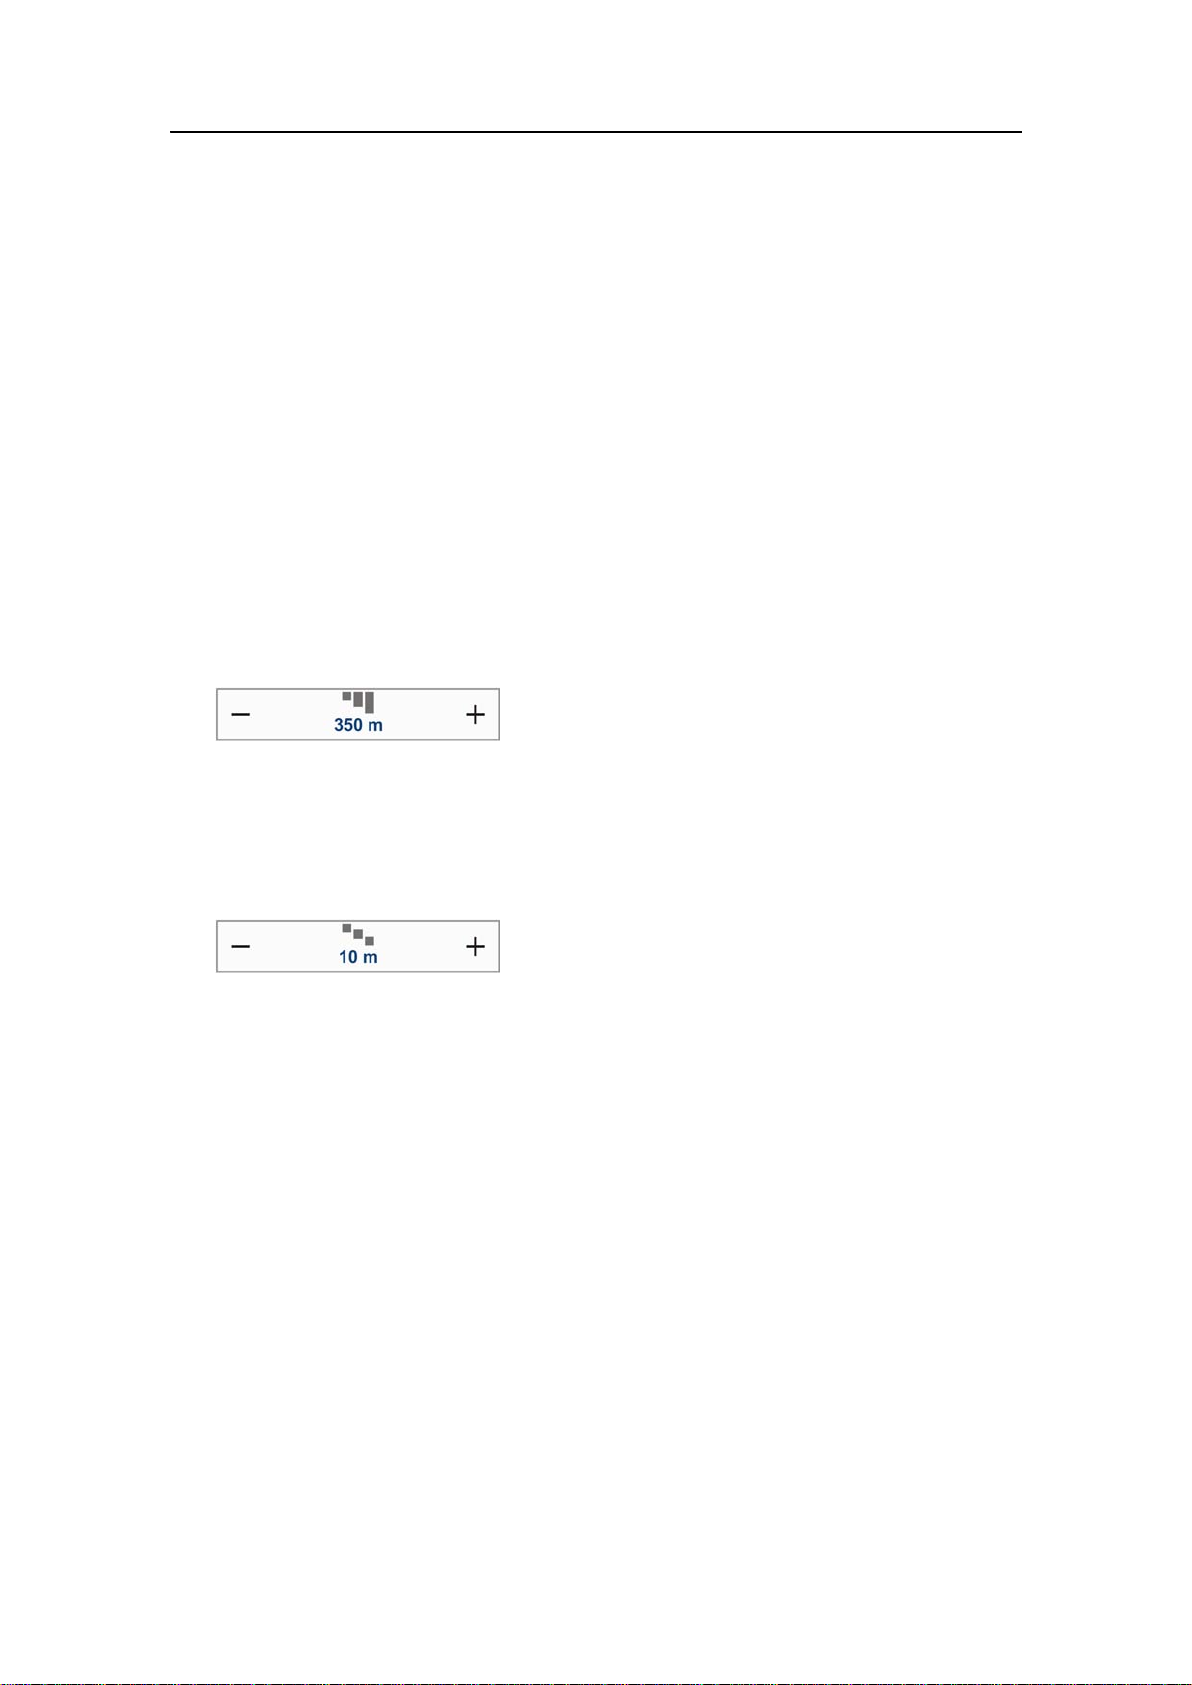
Howtochecktherangesettings
1Observetheverticalrangeoftheechograms.
Notethattheverticalrangeissetupdifferentlydependingontheechogramtype.
2Clickinasurfacerelatedechogramtomakeit“active”.
3ObservetheRangebuttonontheMainmenu.
Gettingstarted
TheRangefunctionallowsyoutospecifytheverticalrangeofthewatercolumn
coveredbytheechogram.Therangeisdenedfromaselectedstartrange,and
downtoavaluebeneaththecurrentbottomdepth.Thevalueshownandselectedis
bydefaultappliedonlytothecurrentlyselectedechogram.
4ObservetheStartRangebuttonontheMainmenu.
StartRangeallowsyoutospecifythestartdepthoftheechogram,thatisfrom
whichdepthinthewatercolumnthepresentationshallstart.Thevalueshownand
selectedisappliedtothecurrentlyselectedechogramtype.
Example:Inasurfaceechogram,settheStartRangevalueto0meters.Thiswill
maketheechogramstartfromtheseasurface(providedthatthetransduceroffset
hasbeendened).SetRangetothecurrentdepthplus20meters.Theechogramwill
nowshowtheareafromtheseasurfaceanddownto20meters“below”thebottom.
Thebottomcontouriseasilydetectedwhenthedepthchanges.
Example:Inasurfaceechogram,settheStartRangevalueto10meters.Thiswill
maketheechogramstartfrom10metersbelowtheseasurface(providedthatthe
transduceroffsethasbeendened).SetRangetothecurrentdepthplus20meters.
Theechogramwillnowshowtheareafrom10metersbelowtheseasurface,and
downto10meters“below”thebottom.Thebottomcontouriseasilydetected
whenthedepthchanges.
5SetRangetoAuto,andsetStartRangeto0.
Observethechangesmadetothesurfacerelatedechogram.
6Clickinabottomrelatedechogramtomakeit“active”.
7ObservetheRangeandStartRangebuttonsontheMainmenu.
343539/A
21
Page 24
SimradES70
Example:Inabottomechogram,settheStartRangevalueto–5meters.This
willmaketheechogramstartfrom5metersabovethebottom.SetRangetothe5
metersplus10=15meters.Theechogramwillnowshowtheareafrom5meters
abovethedepth,anddownto10meters“below”thebottom.Thebottomcontour
willappearasaatline.
8SetRangeto15,andsetStartRangeto5.
Observethechangesmadetothebottomrelatedechogram.
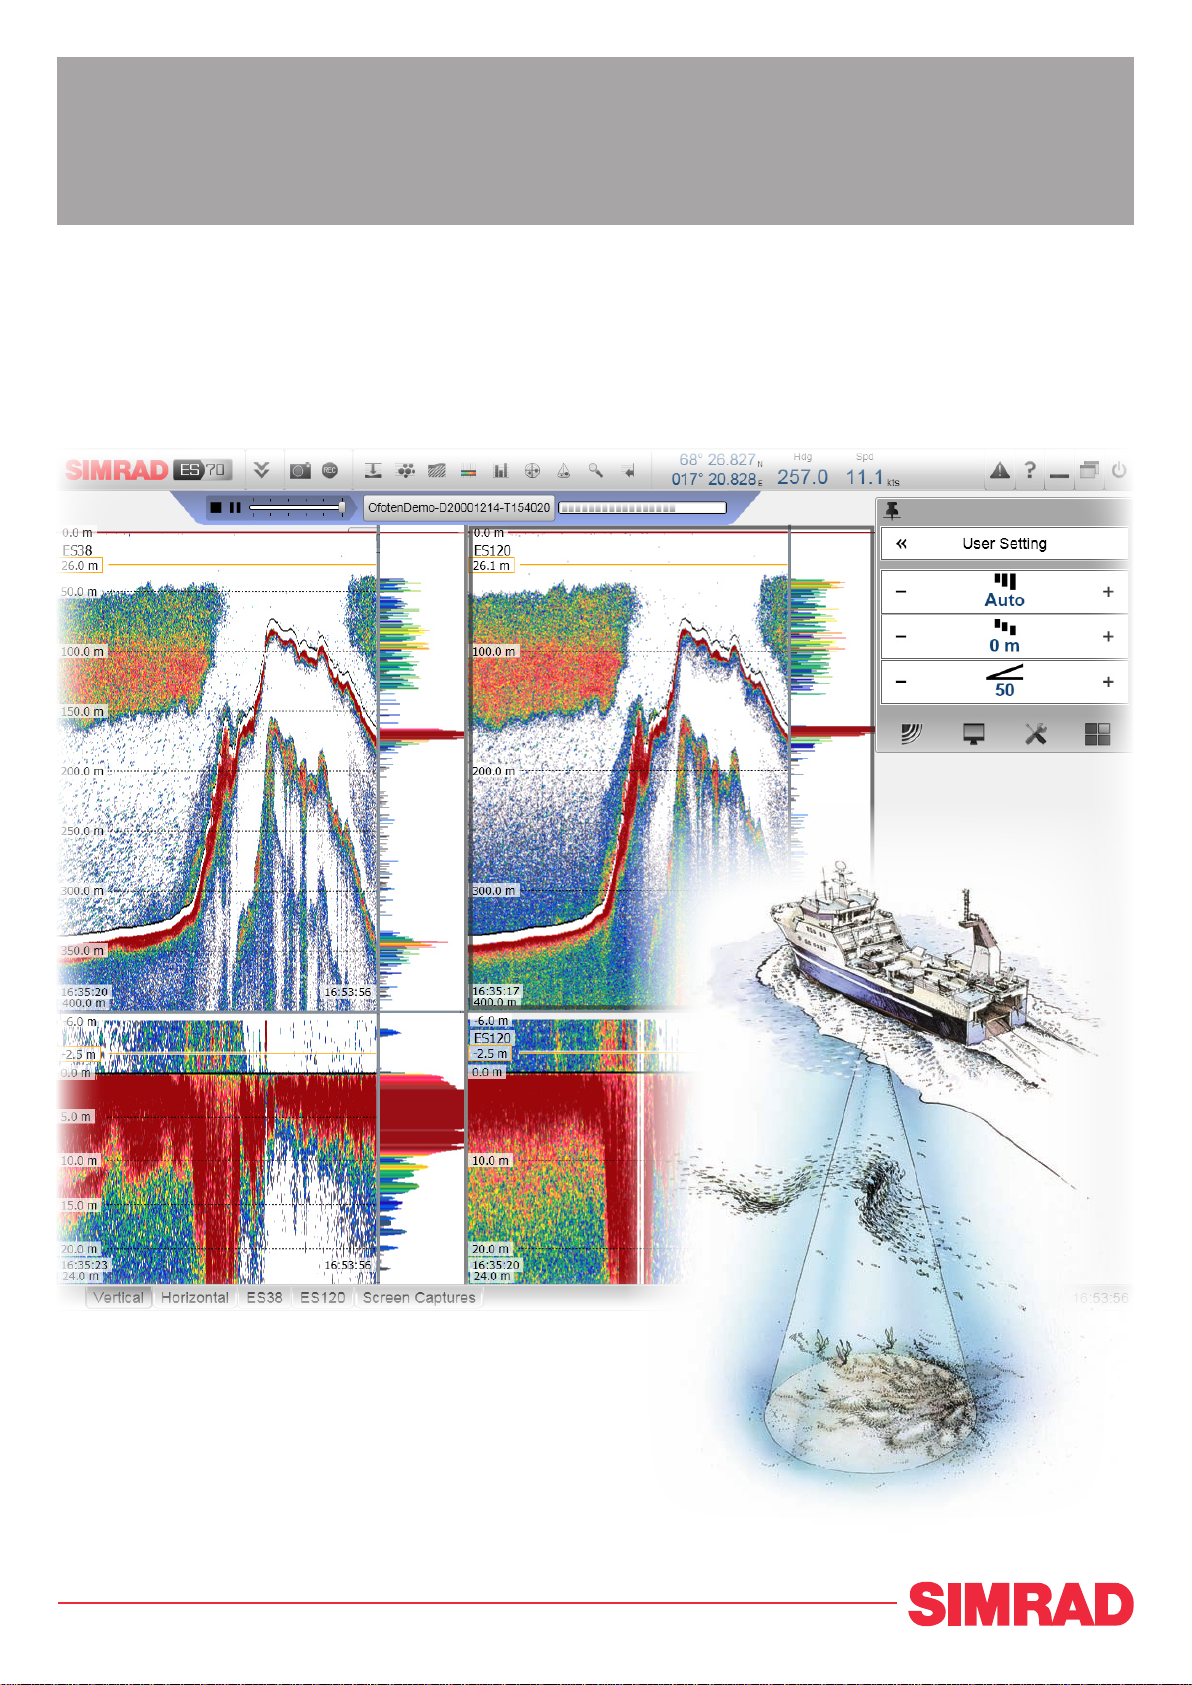
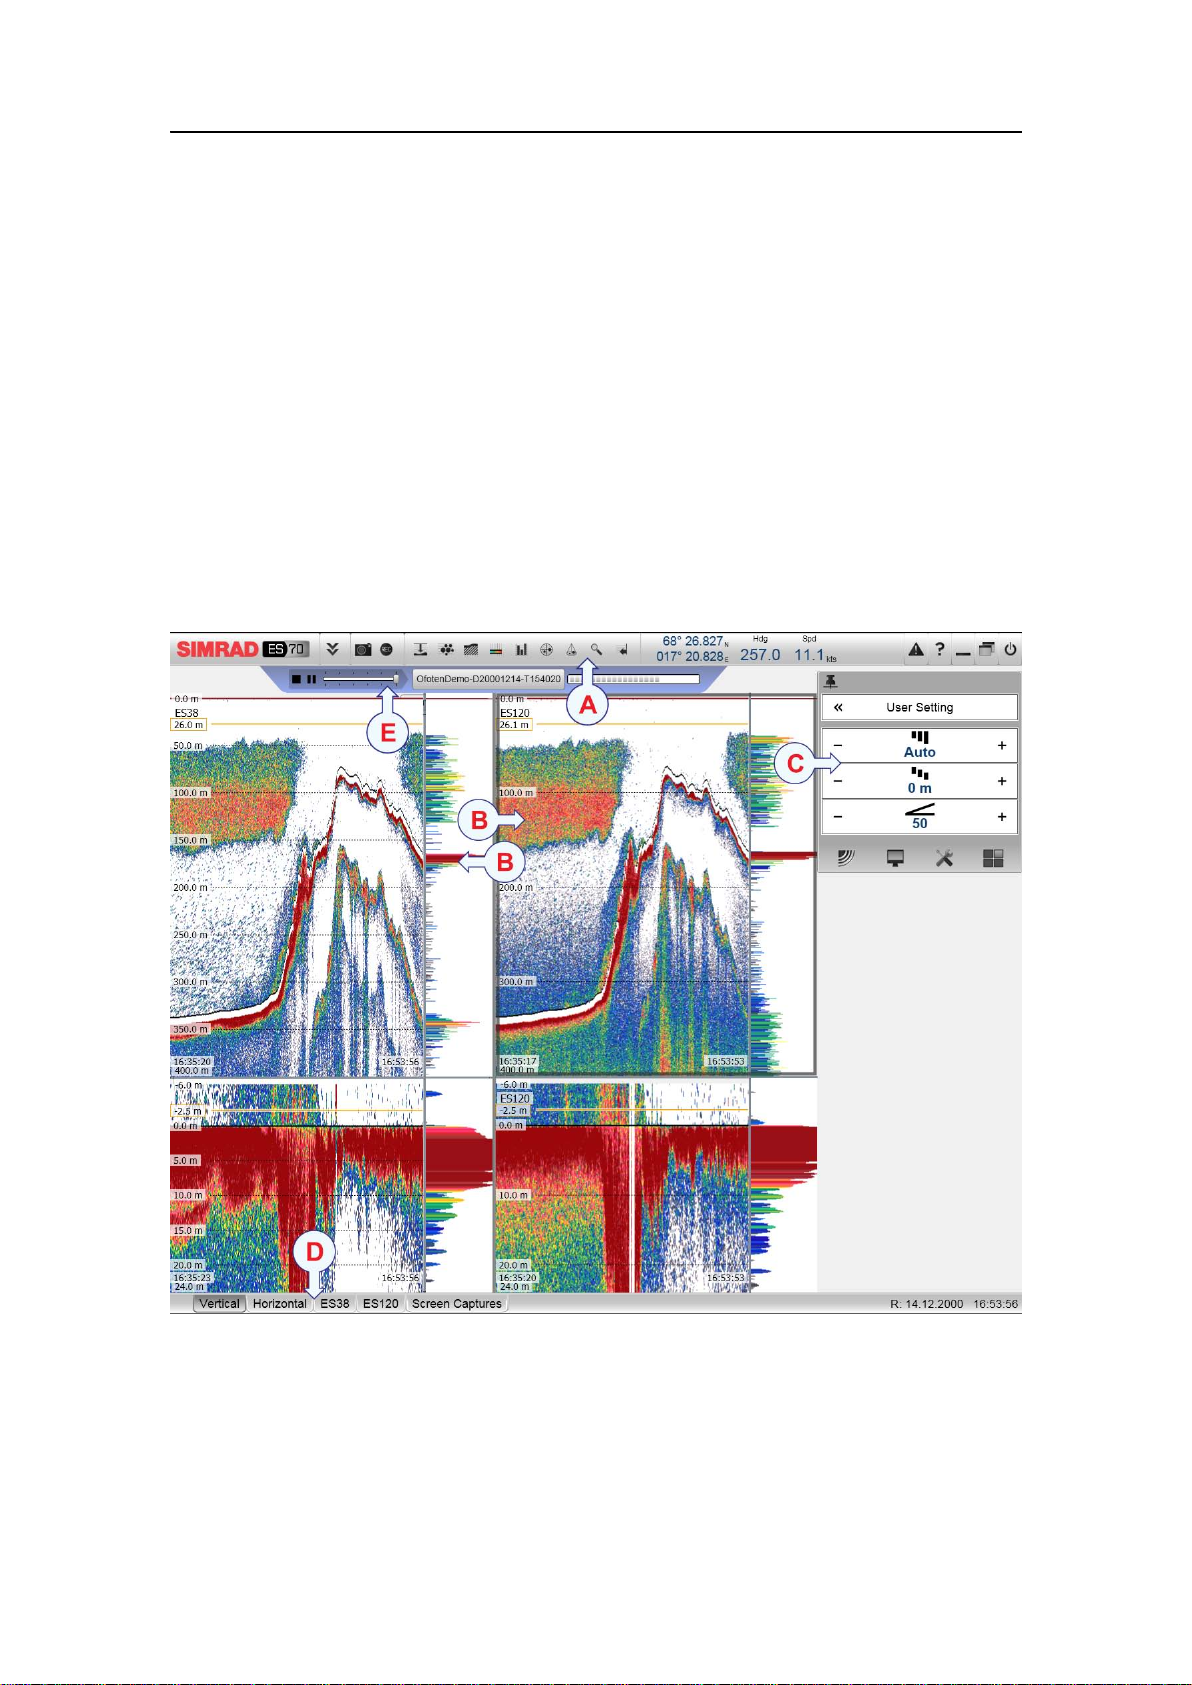
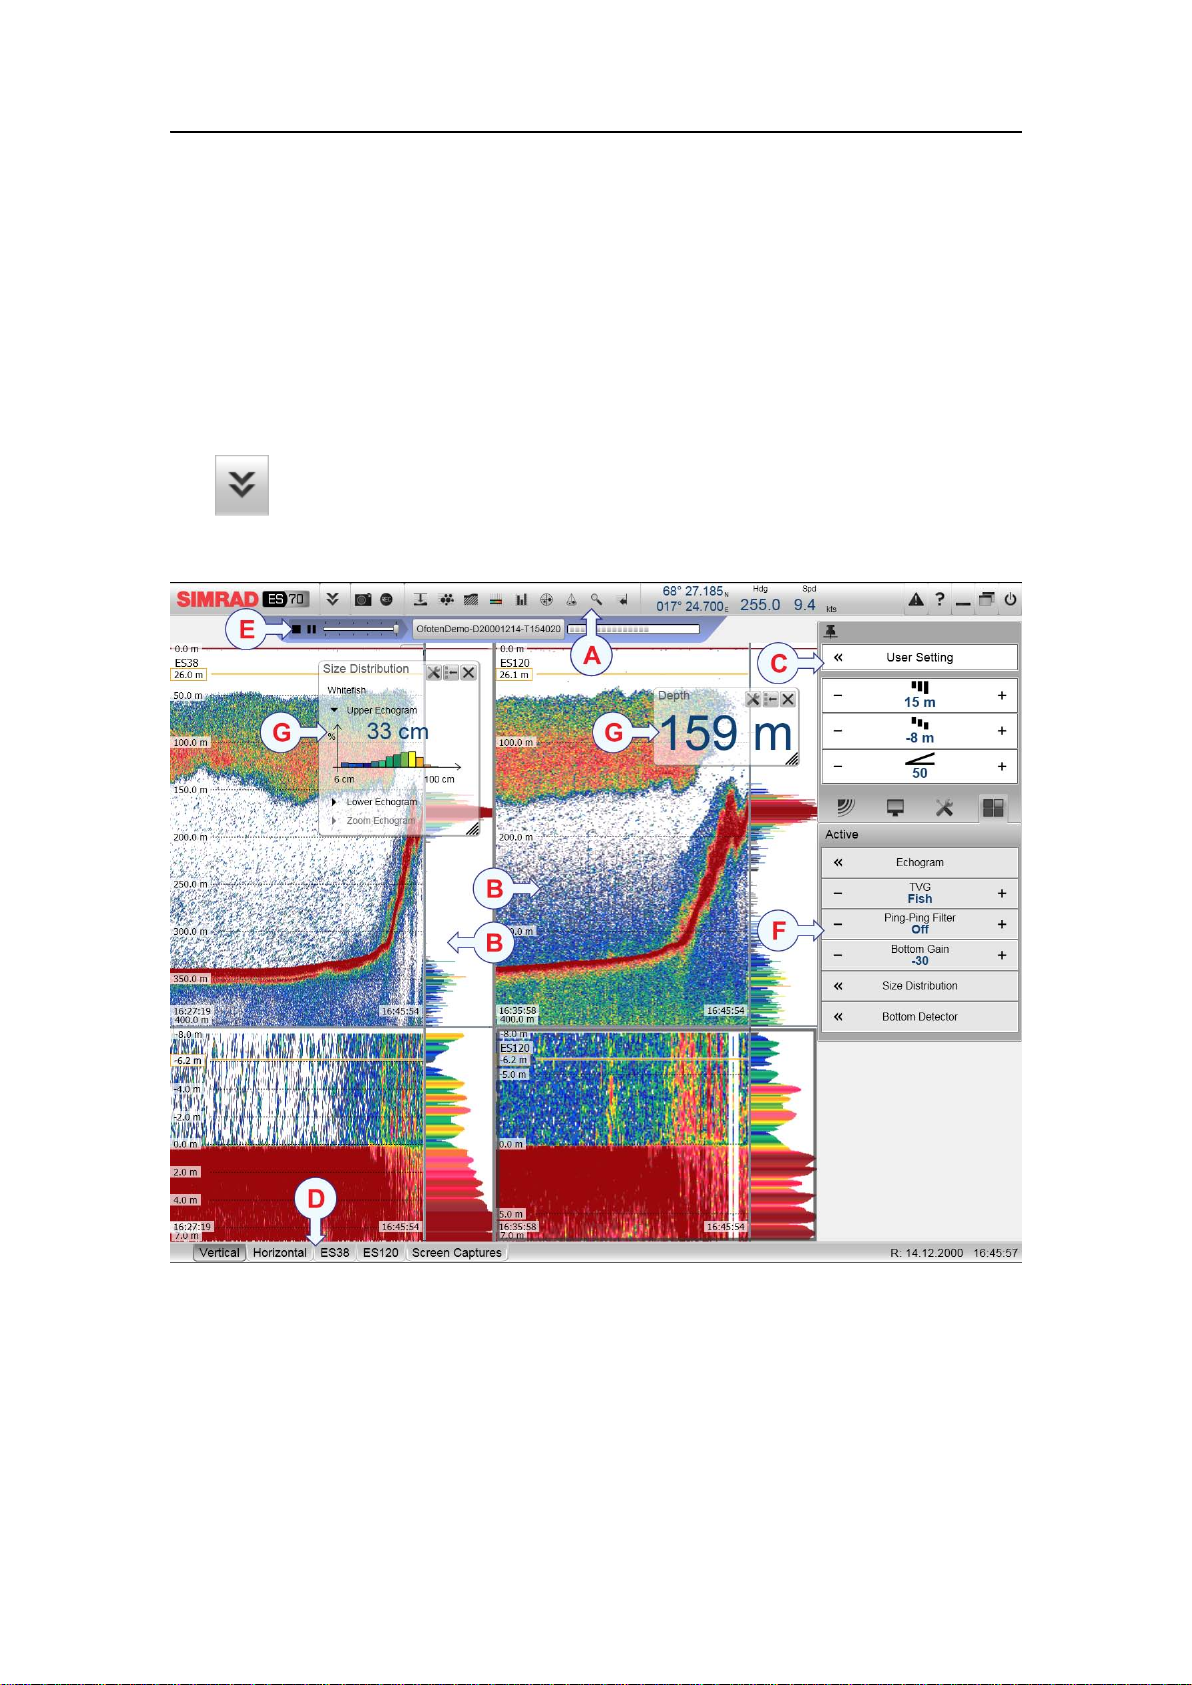
Echosounderpresentations
ThissectiondescribestheoveralllayoutofthepresentationprovidedbytheES70echo
sounder.
Theexampleshowsadualfrequencyechosounderusingtwosplit-beamtransducers(38
and120kHz).ThescreencapturehasbeenmadewhileinReplaymode.
ATitleBar
TheTitleBarcontainsiconstoopenthevariousinformationpanes,aswellas
buttonstoinitiatespecicfunctions.
BEchogram(s)
22
343539/A
Page 25
OneormoreEchogramisdisplayedusingthelargestportionofthescreen.The
presentationlayoutiscontrolledbythefunctionbuttonsontheStatusbar.Youcan
displayindividualechogramsforeachfrequencyinuse,oryoucanlayoutthe
presentationofallfrequencieseitherhorizontallyorvertically.
AdditionalinformationpanesmaybeselectedontheTitleBarusingtherelevant
icons.
CMainmenu
Themenusystemisbydefaultlocatedattherightsideofthedisplaypresentation.
Themainmenuisalwaysvisible,butmaybehiddenfromview.Toopena
sub-menu,clickoneoftheiconsatthebottomofthemainmenu.
DT askbar
TheTaskbarstretchesacrosstheentirepresentationwidthatthebottomofthe
display.Ontheleftside,dedicatedfunctionbuttonsallowsyoutocontrolthe
presentationlayout.
EReplaybar
Gettingstarted
TheReplaybarcontrolstheplaybackwheninReplaymode.Itisonlyvisible
inthismode.
Foramoredetaileddescriptionoftheechogrampresentationsandthedisplayviews,
seeDisplayviewsonpage28.
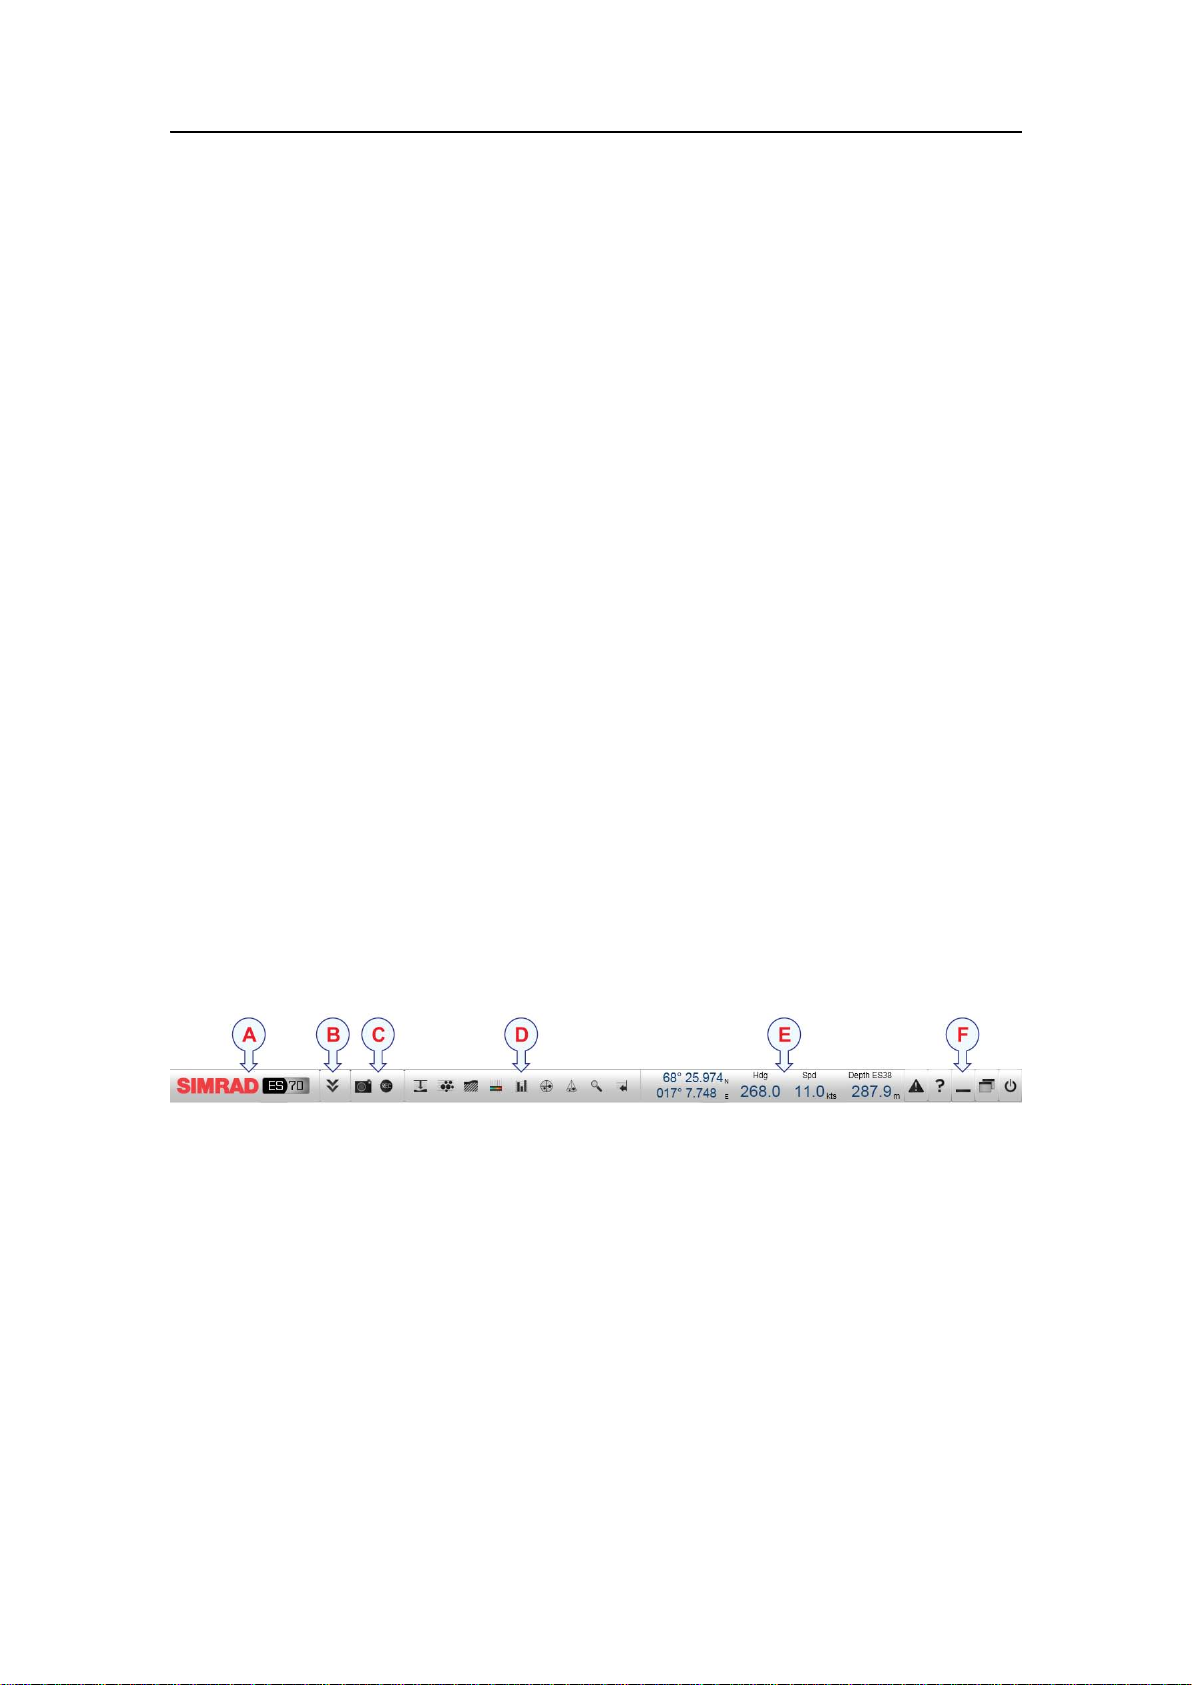
TitleBar
TheES70TitleBarislocatedonthetopofthedisplaypresentation,anditisstretched
fromthefarlefttothefarrightside.
ABrandandproductnameidentication
BOperationbutton;Menu
COperationbuttons;ScreencaptureandRecord
DIconstoopeninformationpanes
ENavigationalinformation
FFunctionbuttons(Messages,Helpandoperatingsystemfunctions)
TitleBarelements
•Brandandproductname:Thiselementidentiesthemanufacturerandtheproduct.
→Logoandproductnameonpage31
•Operation:Thesebuttonsareusedtocontrolbasicoperationalfunctions.
→Operationbuttonsonpage31
343539/A
23
Page 26
SimradES70
•Informationpanes:Theiconsareusedtoopenandclosededicatedinformationpanes.
→Informationpaneiconsonpage32
•Navigation:Thesearenotbuttons,butinformationeldsprovidingcurrentdata
relatedtothevesselmovements.
→Navigationalinformationonpage34
•Function:Thesebuttonsareusedtocontrolbasicfunctionssuchasscreencaptures,
help,menuappearance
→Functionbuttonsonpage35
FormoredetailedinformationabouttheTitleBar,seeTitleBaronpage30.
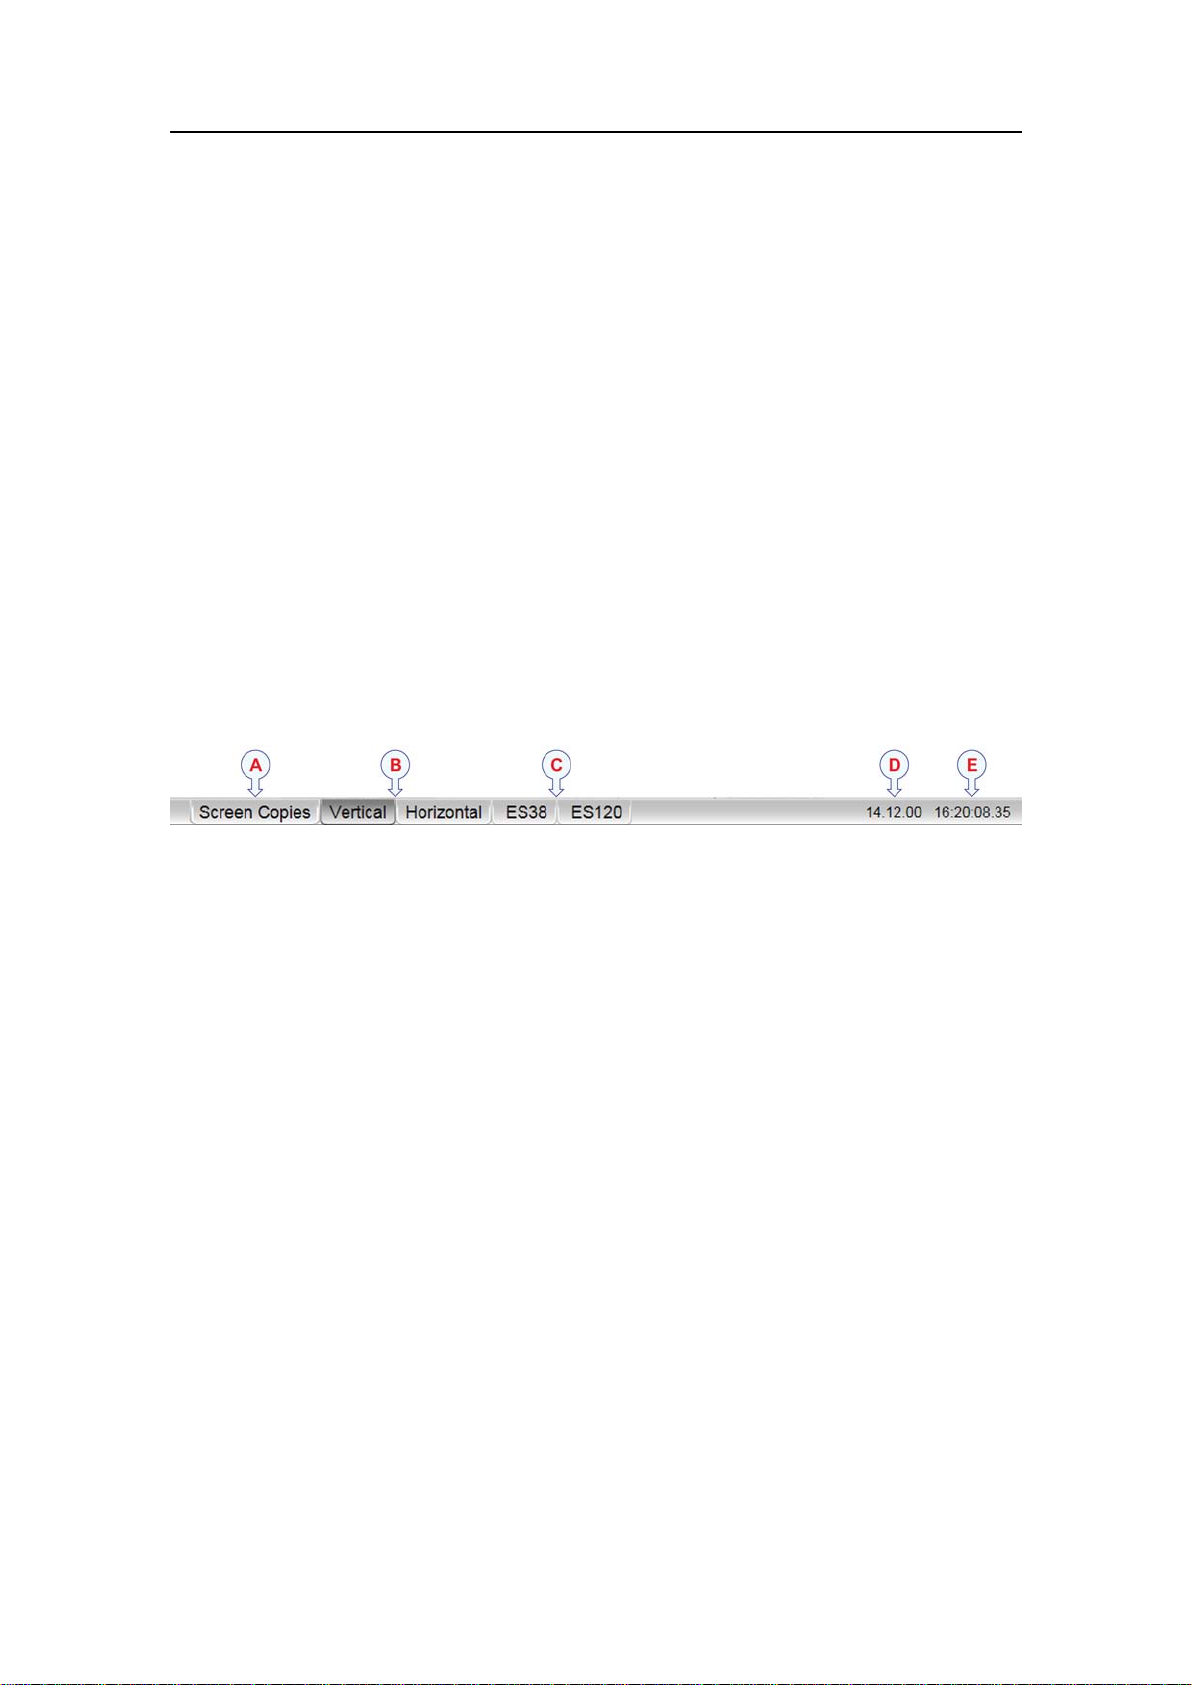
Taskbar
TheT askbarislocatedatthebottomofthedisplay.TheT askbarcontainstabstocontrol
theechogrampresentations,aswellastimeanddateinformation.
AEchogrambrowser
BPresentationformat
CTransducer/echogrampresentation
DDate
ETime
Formoreinformation,seeT askbaronpage51.
Themenusystem
Thissectionprovidesashortintroductiontothemenusystem,andexplainsthebasic
useoftheES70menubuttons.
Formoreinformationaboutthemenusystem,seeThemenusystemonpage74.
Menuhierarchy
ThemenusystemontheES70isbydefaultplacedontherighthandsideofthedisplay
presentation.Y oucanhowevereasilymovethemenutotheleftsideusingtheDisplay
Optionsdialog,orhideitfromviewwiththeMenubuttonontheTitleBar.Themain
menuisshort,andthefoursub-menusareopenedbyclickingonthefouricons.
24
343539/A
Page 27
Themainmenuprovidesalimitednumberofkey
functions,whilethesub-menusofferawiderrangeof
parameters.
Menuhierarchy
1TheMainmenuprovidestheparametersmostfrequentlyusedduringnormal
operation.
2TheOperationmenucontrolsthemainoperationalparameters.
Gettingstarted
3TheDisplaymenucontrolsthevisualaspectsofthesystem,suchasparameters
relatedtothedisplaypresentation.
4TheSetupmenuallowsyoutocontrolthecongurationofthesignalprocessing,as
wellassysteminstallationandmaintenance,andtheinterfacestoperipheraldevices.
5TheActivemenuhasitscontentlinkedtothecurrentactiveitem(vieworobject).
Useittoaccessspecialfeaturesavailablefortheselecteditem.
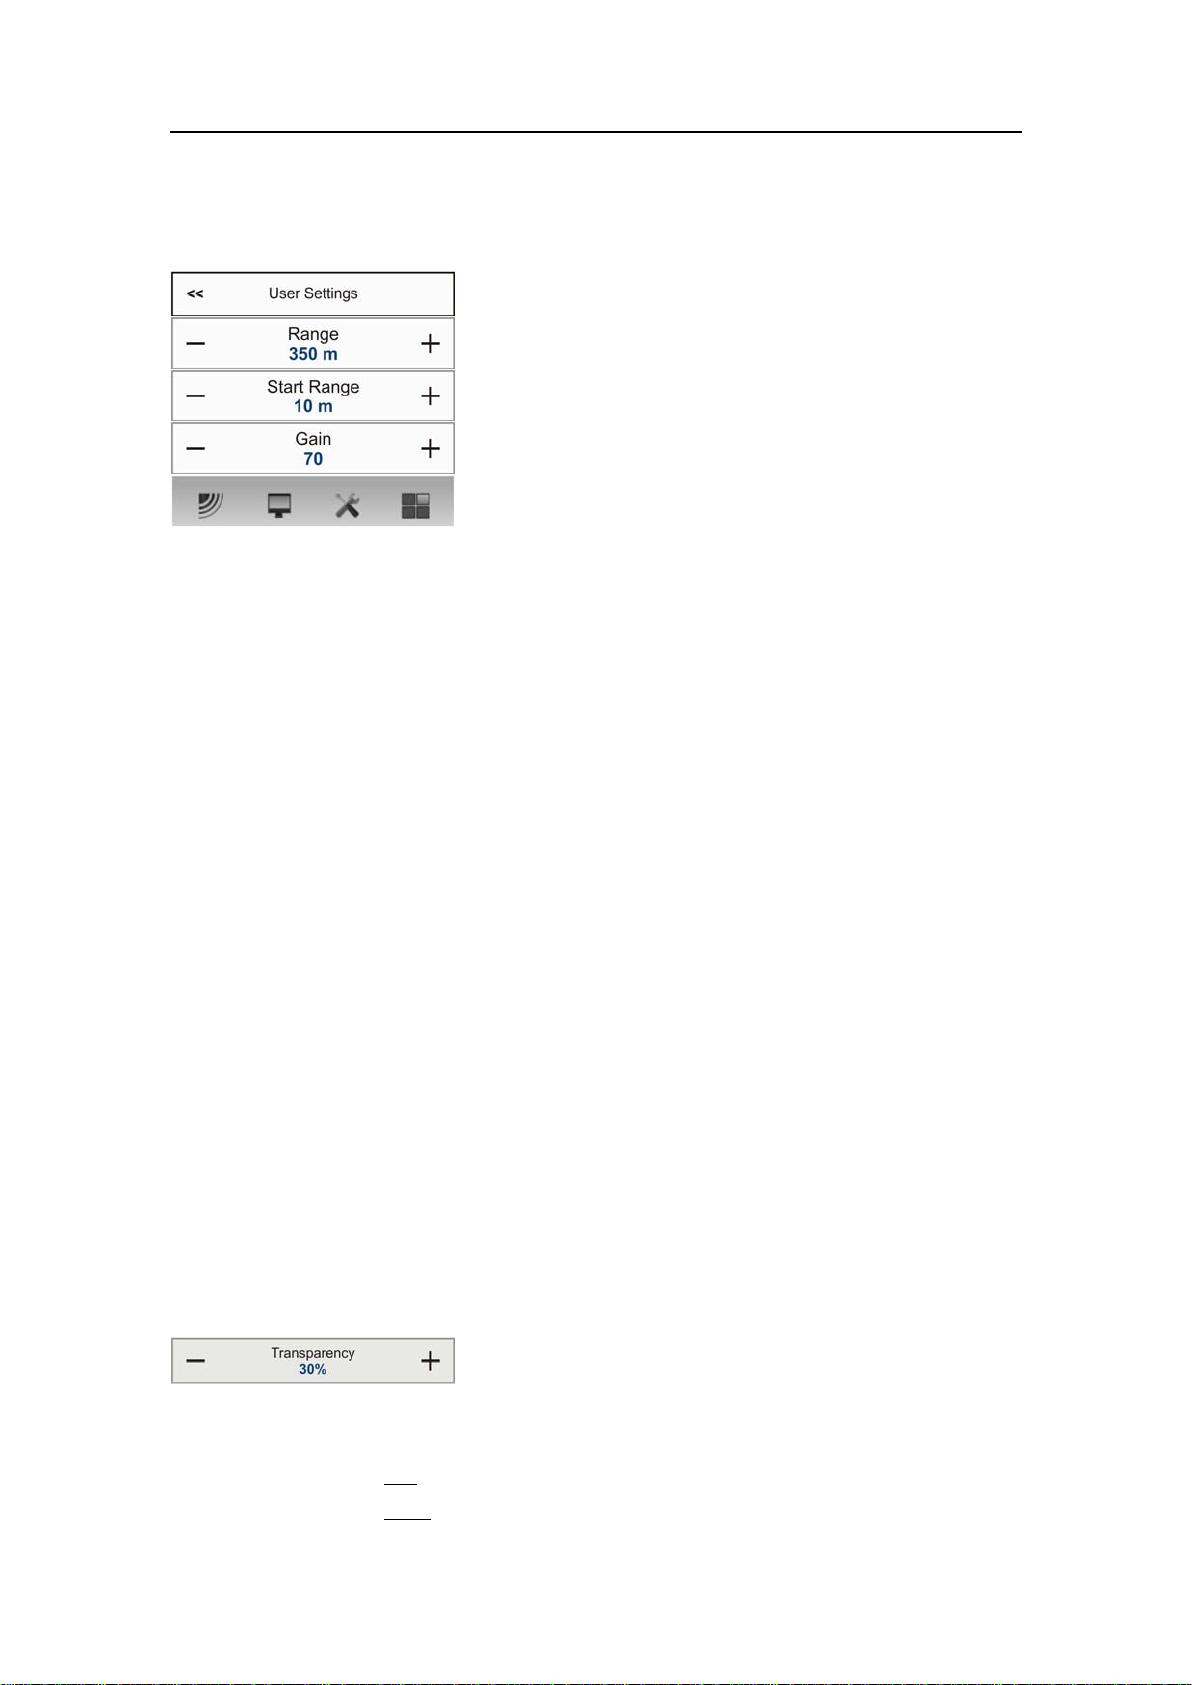
Menubuttons
Eachmenucontainsseveralcommandbuttons.Eachbuttonshowsthefunctionofthe
button,someofthemalsodisplaysthecurrentparametersetting.Themajorityofthe
buttonsineachmenueldhavethesefunctions:
•Youcanincreaseanddecreaseparametervaluesbyclickingthebutton.
•Youcanchangeparametervaluesbymovingthecursorsideways.
•Youcanchangeparametervaluesbymeansofthescrollwheelonthemouseor
trackball.
•Youcanenterparametervaluesfromthekeyboard(ifyouhaveone).
•Youcanselectparametervaluefromthebutton’ssub-menu.
•Youcanopenadedicateddialog.
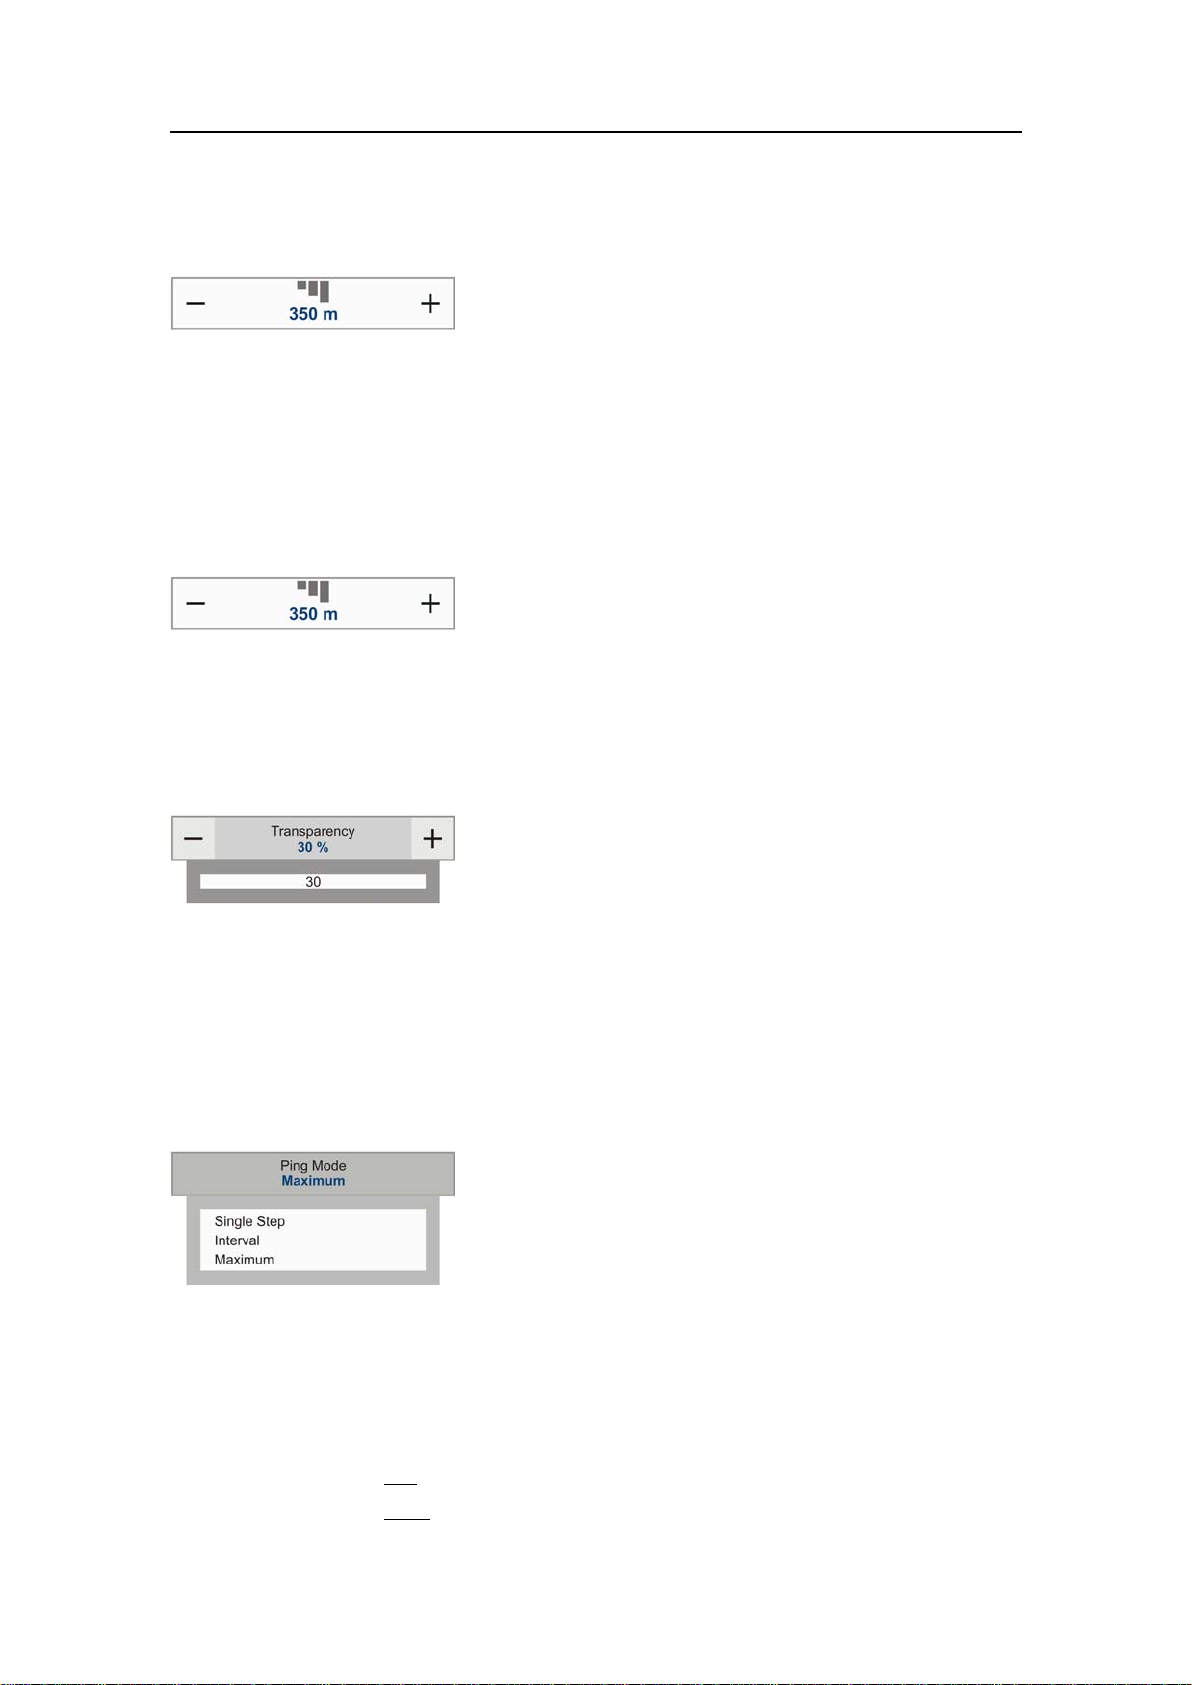
Howtoselectanumericalparameterusingthe+/-buttons
1Movethecursortoeithersideofthebutton,andobservethatthebackgroundcolour
changes.
aClickonthel
bClickonther
343539/A
e f t sideofthebuttontodecreasethenumericalvalue.
i g h t sideofthebuttontoincreasethenumericalvalue.
25
Page 28
SimradES70
Howtoselectanumericalparameterbymovingthecursorhorizontally
1Placethecursoronthemiddleofthebutton.
2Clickandholdtheleftmousebuttondepressed.
3Movethecursorhorizontally:lefttodecreasetheparametervalue,orrightto
increaseit.
4Releasethemousebuttonwhentherequestedvalueisshown.
Howtoselectanumericalparameterbymeansofthescrollwheel
1Placethecursoronthemiddleofthebutton.
2Spinthescrollwheelineitherdirectiontoincreaseordecreasetheparametervalue.
3Releasethescrollwheelwhentherequestedvalueisshown.
Howtoselectanumericalparameterusingthekeyboard
1Clickthemiddlesectionofthebuttontoopenatexteld.
2Enterthenumericalvalueintothetexteld.
Ifthenumericalvalueexceedsthepermittedrangefortheparameter,theframein
thetexteldwillbered.Y ouwillthennotbeabletoenterthevalue.
3PresstheEnterkey.
Howtoselectaparameterusingasub-menu
1Clickthemiddlesectionofthebuttontoopenasub-menu,thenclicktherequested
parametervalue.
Thechosenvalueisapplied,andthesub-menuisautomaticallyclosed.
2Wheneverapplicable,youcanalsoaccessthesub-menubyclickingtheleftand
rightsideofthebutton,butthismethodwillnotshowyouthemenuchoices.
aClickonthel
bClickonther
e f t sideofthebuttontoselectalowersub-menuchoice.
i g h t sideofthebuttontoselectahighersub-menuchoice.
26
343539/A
Page 29

Howtoselectparametersusingadialog
1Clickanywhereonthebuttontoopenaseparatedialog.
Gettingstarted
343539/A
27
Page 30

SimradES70
Displayviews
ThischapterprovidesabriefoverviewoftheinformationdisplayedbytheES70Fish
ndingechosounder,andhowitisorganised.
Topics
•Displayorganisationonpage28
•TitleBaronpage30
•Replaybaronpage36
•Mainmenuonpage37
•Echogramsonpage37
•Informationpanesonpage43
•Taskbaronpage51
•Screencapturesonpage52
Displayorganisation
AtypicalES70Fishndingechosounderdisplaypresentationisshown.
ATitleBar
TheTitleBaridentiesthelogo,andprovidesseveralconsandbuttons.Theseare
usedtohideorretrievethemenusystemandtheinformationpanes,andtoenable
basicsystemfunctions.
→TitleBaronpage30
→Informationpanesonpage43
BEchogram(/s)
TheEchogram(s)takesupthelargestpartoftheechosounderwindow.
Bydefault,youwillhavetwoechogramsforeachfrequencychannel(transducer).
Thesecanbepresentedhorizontallywithoneovertheother,ornexttoeachother,
bymeansofthetabsontheT askbar(D).
→Taskbaronpage51
Youcanmodifythesizeoftheechogramsbymovingtheboundarylinesbetween
theechograms.Clickonaboundaryline,holdthebuttondepressed,andmovethe
linehorizontallyorvertically.
28
343539/A
Page 31
Ifyouclickinanechogram,theechogramisselectedtobe“active”.The“active”
echogramisidentiedwithathickborder.Ifyouchangeparametersrelatedtothe
echogram,thesearebydefaultonlyappliedtothe“active”echogram.
CMainmenu
TheMainmenuisbydefaultlocatedontherighthandsideoftheechosounder
presentation.Toopenanyofthesub-menus,clicktheicons.Tohideorretrievethe
Mainmenu,clicktheMenubuttonontheTitleBar.
→Mainmenuonpage37
Displayviews
DT askbar
TheT askbarislocatedatthebottomoftheechosounderpresentation.
→Taskbaronpage51
EReplaybar
DuringreplayadedicatedReplaybarisshownbelowtheTitleBar.TheReplaybar
allowsyoutoretrievesavedles,andtocontroltheplayback.
→Replaybaronpage36.
343539/A
29
Page 32

SimradES70
FSub-menus
Foursub-menusmaybeopenedfromthefouriconsinthebottomoftheMainmenu.
→Mainmenuonpage37
GInformationpanes
YoucanchoosefromseveralInformationpanestoprovideyouwithadditionaldata.
ThesepanesareselectedfromthebuttonsontheTitleBar.Thepanescanbemoved
aroundontheechogrampresentation,andyoucanchangetheirsizes.Thepanesare
transparent,soechograminformationdisplayedbehindthemarenotlost.
→Informationpanesonpage43
TitleBar
TheES70TitleBarislocatedonthetopofthedisplaypresentation,anditisstretched
fromthefarlefttothefarrightside.
ABrandandproductnameidentication
BOperationbutton;Menu
COperationbuttons;ScreencaptureandRecord
DIconstoopeninformationpanes
ENavigationalinformation
FFunctionbuttons(Messages,Helpandoperatingsystemfunctions)
TitleBarelements
•Brandandproductname:Thiselementidentiesthemanufacturerandtheproduct.
→Logoandproductnameonpage31
•Operation:Thesebuttonsareusedtocontrolbasicoperationalfunctions.
→Operationbuttonsonpage31
•Informationpanes:Theiconsareusedtoopenandclosededicatedinformationpanes.
→Informationpaneiconsonpage32
•Navigation:Thesearenotbuttons,butinformationeldsprovidingcurrentdata
relatedtothevesselmovements.
→Navigationalinformationonpage34
30
343539/A
Page 33

•Function:Thesebuttonsareusedtocontrolbasicfunctionssuchasscreencaptures,
help,menuappearance
→Functionbuttonsonpage35
Logoandproductname
TheSimradlogoandtheproductname(ES70)isshown.
Double-clicktheSimradlogotoreducethesizeoftheES70presentation.Double-click
onemoretimetorestoretheoriginalsize.
Operationbuttons
Menubutton
Displayviews
ClickonceontheMenubuttontohidethemenu,andonemoretimetobringitback
again.Whenthemenuishidden,itwilltemporarilybeshownontheleftandrighthand
sideofthedisplayifyoumovethecursortothatposition.
→Mainmenuonpage37
→Themenusystemonpage74
Screencapturebutton
Clickthisbuttononcetocreateascreencaptureofthecurrentechogrampresentation.To
viewtherecordedimage,clickScreenCaptureontheT askbartoopentheimagebrowser.
→Howtosaveanechogramonpage56
→Screencapturesonpage52
Recordbutton
Clickthisbuttontostartandstoprecording.
TherecordingfunctionissetupusingtheparametersavailableontheRecordbutton
ontheOperationmenu.
→Howtosaverawechogramdataonpage57
343539/A
31
Page 34

SimradES70
Informationpaneicons
TheSimradES70offersseverali
n f o r m a t i o n p a n e s toprovideadditionalanddetailed
datafromtheechogram.Thepanesareopenedandclosedusingthepanebuttonson
theTitleBar.
Inordertoopenaninformationpane,youmustrstclickinanechogrampresentationto
makeit“active”.Bydoingthisyouselectfrequencychannel(transducer).Inmostcases,
thedataintheinformationpaneyouopenwillonlybevalidfortheselectedechogram.
Note
Someoftheinformationpanesareoptional.Theyarethusnotavailableforuseunlessa
licencecodeisavailable.Inordertoobtainalicence,consultyourlocaldealer .
Depth
ClickthisbuttontoopenandclosetheDepthinformationpane.Thispaneprovidesthe
currentdepthasmeasuredbytheselectedtransducer.
→Depthinformationpaneonpage44
Biomass
ClickthisbuttontoopenandclosetheBiomassinformationpane.Thispaneprovidesthe
currentbiomassascalculatedbytheechosounderbasedonthecurrentechogram.
[1]
→Biomassinformationpaneonpage44
BottomHardness
ClickthisbuttontoopenandclosetheBottomHardnessinformationpane.Thispane
providesthebottomhardnessinthecurrentechogram.
[2]
→BottomHardnessinformationpaneonpage45
1.Biomassisanoptionalfunction.InordertoactivatetheBiomassinformationpane,youmustobtaina
licence.
2.Bottomhardnessisanoptionalfunction.InordertoactivatetheBottomHardnessinformationpane,
youmustobtainalicence.
32
343539/A
Page 35

Displayviews
ColourScale
ClickthisbuttontoopenandclosetheColourScaleinformationpane.Thispaneshows
youthecoloursyouarepresentlyusinginyourechogrampresentation.Y oucanalso
manuallymodifythecolourscaletolteroutweakechoes.
→ColourScaleinformationpaneonpage45
SizeDistribution
ClickthisbuttontoopenandclosetheSizeDistributioninformationpane.Thispane
showsyouthecoloursyouarepresentlyusinginyourechogrampresentation.
[3]
→SizeDistributioninformationpaneonpage46.
FishPosition
ClickthisbuttontoopenandclosetheFishPositioninformationpane.Thispaneshows
youthepositionwithinthebeamofthedetectedsingleechoes.
[4]
→FishPositioninformationpaneonpage48
EchoPosition
ClickthisbuttontoopenandclosetheEchoPositioninformationpane.Thispaneshows
youthepositionwithinthebeamofthedetectedsingleechoes.
[5]
→EchoPositioninformationpaneonpage48
3.TheSizeDistributioninformationpaneisonlyavailableifyourES70isequippedwithoneormore
splitbeamtransceivers.
4.TheFishPositioninformationpaneisonlyavailableifyourES70isequippedwithoneormoresplit
beamtransceivers.
5.TheEchoPositioninformationpaneisonlyavailableifyourES70isequippedwithoneormoresplit
beamtransceivers.
343539/A
33
Page 36

SimradES70
Zoom
ClickthisbuttontoopenandclosetheZoominformationpane.Thispaneallowsyou
tozoominonaselectedareaofthecurrentechogram.
→Zoominformationpaneonpage49
History
ClickthisbuttontoopenandclosetheHistorypane.Thispaneallowsyoutoviewthe
previouslysavedechogramsforthecurrentlyactiveechogram.
→Historyinformationpaneonpage50
Navigationalinformation
Thesearenotbuttons,buteldsprovidingusefulinformationrelatedtothevessel
movements.Y oucanchoosewhichinformationtobedisplayedifyouopentheDisplay
OptionsdialogfromtheDisplaysub-menu.
Note
ThisnavigationalinformationontheTitleBarmustnotbeusedfornavigation!
Geographicallocation
ProvidedthataGPSsystemisconnectedtotheES70,thiseldontheTitleBarwill
displaythevessel’sgeographicalpositioninlongitudeandlatitude.
ThecommunicationwiththeexternalGPSsystemissetupusingtheNavigationbutton
ontheSetupmenu.
Vesselheading
ProvidedthataGPSorcompasssystemisconnectedtotheES70,thiseldontheTitle
Barwilldisplaythevessel’scurrentheading.
34
343539/A
Page 37

Displayviews
ThecommunicationwiththeexternalGPSsystem,headingsensororgyrocompassisset
upusingtheNavigationbuttonontheSetupmenu.
Vesselspeed
ProvidedthataGPSorspeedlogsystemisconnectedtotheES70,thiseldontheTitle
Barwilldisplaythevessel’scurrentspeed.
ThecommunicationwiththeexternalGPSsystemorspeedsensorissetupusingthe
NavigationbuttonontheSetupmenu.
Watertemperature
ProvidedthatatemperaturesensorisconnectedtotheES70,thiseldontheTitleBar
willdisplaythewatertemperature.
Note
ThisfunctionalityisnotimplementedinSWversion1.0.0.
Depth
ThecurrentdepthforeachofthetransducersconnectedtotheES70canbeshown.
Functionbuttons
ThevefunctionbuttonsarelocatedonthefarrightsideoftheTitleBar.
Messagebutton
ThisMessagebuttonwillindicatewhentheES70systemhasissuedamessage.Clickthe
buttontoopentheMessagedialog.Ifyouholdthemousecursoroverthebutton,atooltip
rectanglewillprovidealistofthemessagesthatyouhavenotacknowledged.
Helpbutton
343539/A
35
Page 38

SimradES70
ClickthisbuttontoopentheES70contextsensitiveon-linehelp.Thebuttonopens
thehelpsystemonitsstartpage.
Minimizebutton
ClickthisbuttontominimizetheES70displaypresentation.Thisisanoperatingsystem
function.
Resizebutton
ClickthisbuttontochangethesizeoftheES70displaypresentation.Thisisanoperating
systemfunction.
Exitbutton
ClickthisbuttontoclosetheES70program.
→PowerOn/Offproceduresonpage13
Replaybar
TheReplayBarisautomaticallyactivatedonceyouselectReplaymode.Thebaris
positioneddirectlybelowtheTitleBar.
AStop:Clickthisbuttontostoptheplayback.
BPlay/Pause:Clickthisbuttontostarttheplayback,ortopauseit.
CReplayspeed:Clickthisslidertoadjustthereplayspeed.
DFileselect:Thisbuttonshowswhichleyouarecurrentlyplaying,Clickthebutton
toopentheReplaydialog.
EProgress:Thisbarshowsyouthereplayprogressofthecurrentle.Ifyouhave
chosentoloopthereplayle(s),thegreenindicatorswillstartfromlefteverytime
thestartoftheleappears.
36
343539/A
Page 39
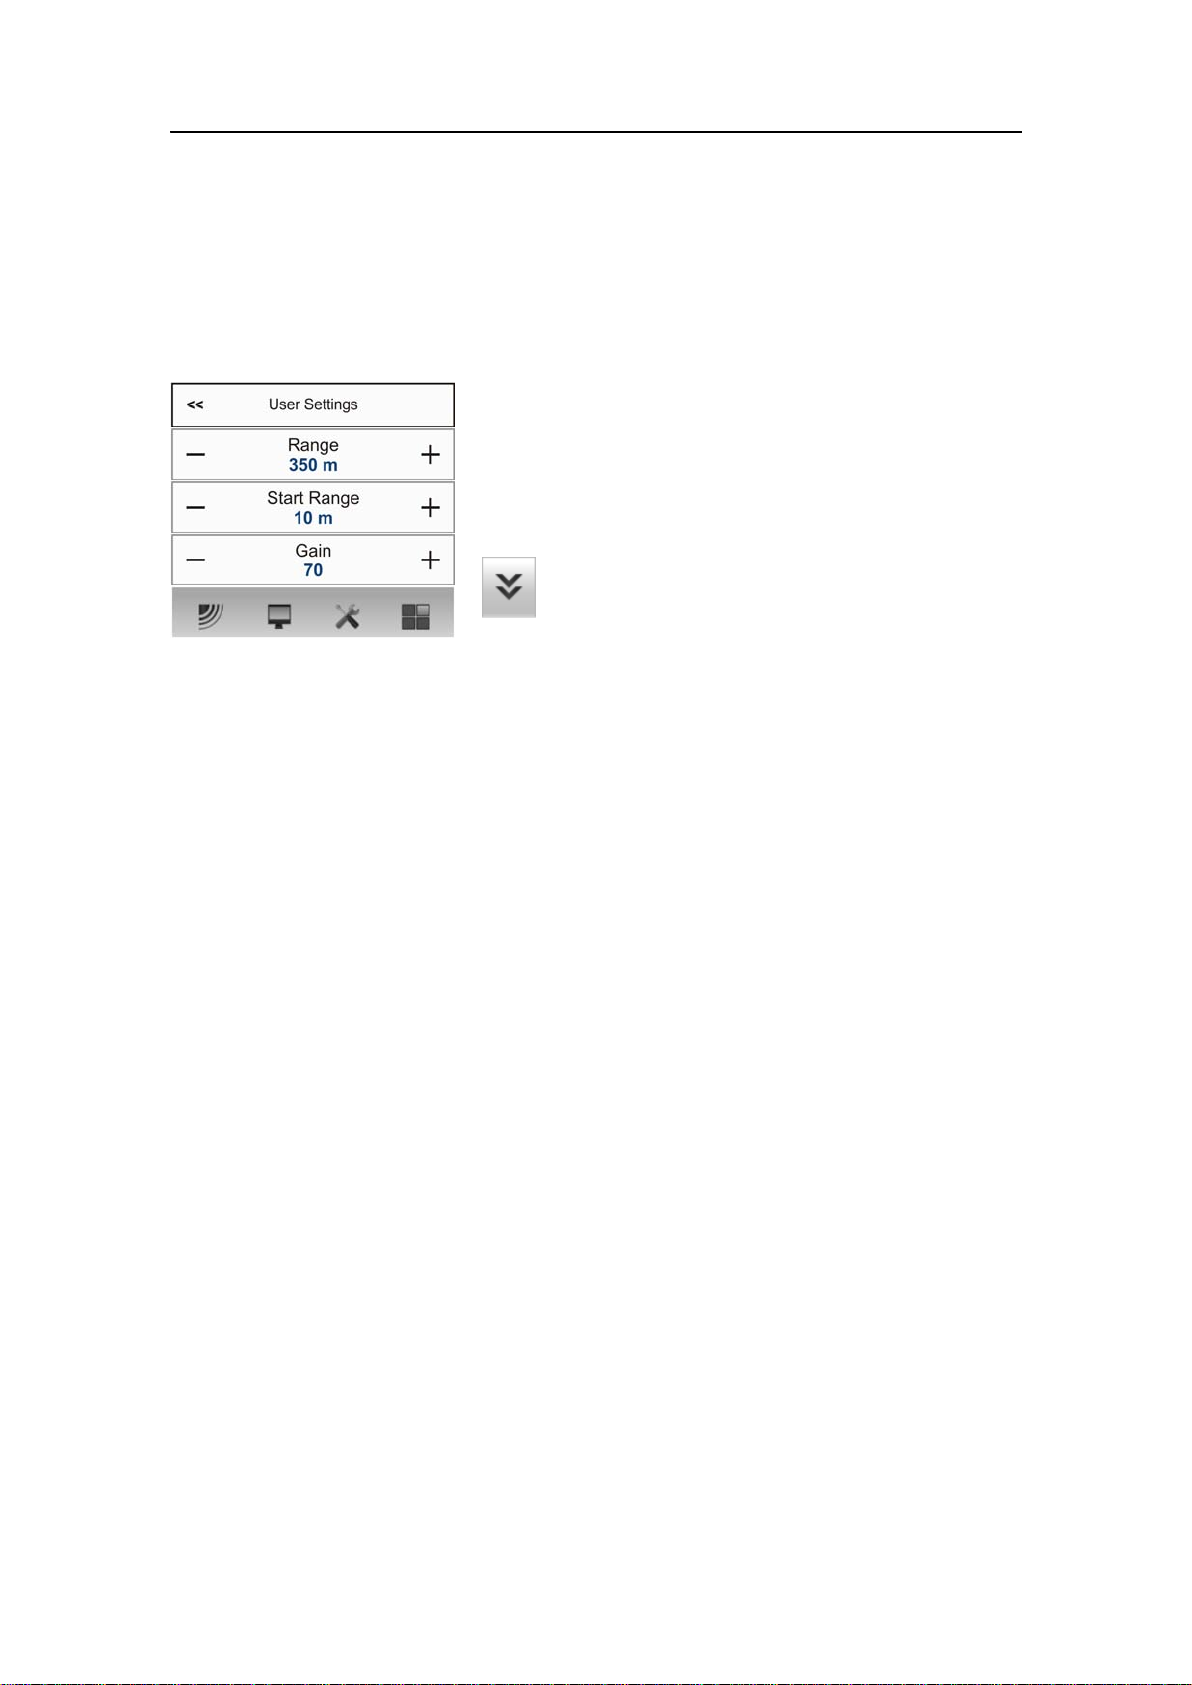
Mainmenu
Themainmenuisbydefaultlocatedontherighthandsideoftheechosounder
presentation.
Themainmenuprovidesalimitednumberofkey
functions,whilethesub-menusofferawiderrangeof
parameters.
YoucanhidethemenubyclickingtheMenubuttonon
theTitleBar.
YoucanplacethemenuontheleftsideoftheES70presentationbymeansoftheMenu
ontherightsideoptionintheDisplayOptionsdialog.
Displayviews
Menuhierarchy
1TheMainmenuprovidestheparametersmostfrequentlyusedduringnormal
operation.
2TheOperationmenucontrolsthemainoperationalparameters.
3TheDisplaymenucontrolsthevisualaspectsofthesystem,suchasparameters
relatedtothedisplaypresentation.
4TheSetupmenuallowsyoutocontrolthecongurationofthesignalprocessing,as
wellassysteminstallationandmaintenance,andtheinterfacestoperipheraldevices.
5TheActivemenuhasitscontentlinkedtothecurrentactiveitem(vieworobject).
Useittoaccessspecialfeaturesavailablefortheselecteditem.
Formoreinformationaboutthemenusystem,seeThemenusystemonpage74.
Echograms
Surfaceechogram
Thisechogramisrelatedtotheseasurface.Startdepth(upperechogramboundary)and
verticalrange(acrossechogram)aremanuallyselectedbytheStartDepthandRange
buttonsontheMainmenu.
343539/A
37
Page 40

SimradES70
AThisisthestartdepthoftheechogram.
Inasurfaceechogramitisnormallysetup
withStartRange=0,ortoasmallvalueto
starttheechogramimmediatelyunderthe
keel.
BThisisthebottom.
Thetotalechogramrange(A)to(F)isdened
withtheRangebuttonontheMainmenu.
Unlessspecicconditionsapply,oryouwish
tocontroltherangemanually,useRange=
Auto.
Example:Inasurfaceechogram,settheStart
Rangevalueto0meters.Thiswillmakethe
echogramstartfromtheseasurface(provided
thatthetransduceroffsethasbeendened).
SetRangetothecurrentdepthplus20meters.
Theechogramwillnowshowtheareafrom
theseasurfaceanddownto20meters
“below”thebottom.Thebottomcontouris
easilydetectedwhenthedepthchanges.
CThistextidentiesthetransducerusedtocreatetheechogram.
DThisisthescopeview.
Thisviewpresentsindividualcolourlines.Thecolourandlengthofeachline
reectsthereceivedechoamplitude.
EBydefault,the“pingtime”andthedepthrangeisshowninthebottomleftsideof
theechogram.Inthebottomrightcorner,the“pingtime”isthesameascurrent.
ThisinformationcanbechangedusingtheoptionsontheHorizontalAxistabinthe
Echogramdialog.
FThisisthelowerendofthedepthrange.Itisnormallyafewmetersbelowthe
bottomcontour,dependingonthechosenrange.
Bottomechogram
Thisechogramisrelatedtothedetectedbottom.Stopdepth(lowerechogramboundary)
andverticalrangearemanuallyselectedbytheStartDepthandRangebuttonsonthe
Mainmenu.Theechogramisonlydrawnforpingshavingasuccessfulbottomdetection.
38
343539/A
Page 41

AThisisthestartdepthoftheechogram.
Inabottomechogramitisnormallyitisset
upwithStartRangesettoarelativesmall
negativevalue.Thevaluedeneshowmany
meterabovethebottomtheechogramwill
start.
BThisisthebottom.
Sincetheechogramisrelatedtothisbottom,itappearstobeat.Fishescloseto
thebottomistheneasytosee.
Therangefromthestartdepthabovethebottomanddowntosomedistancebelow
theactualbottomisdenedwiththeRangebuttonontheMainmenu.
Example:Inabottomechogram,settheStartRangevalueto–5meters.This
willmaketheechogramstartfrom5metersabovethebottom.SetRangetothe5
metersplus10=15meters.Theechogramwillnowshowtheareafrom5meters
abovethedepth,anddownto10meters“below”thebottom.Thebottomcontour
willappearasaatline.
Displayviews
CThistextidentiesthetransducerusedtocreatetheechogram.
DThisisthescopeview.
Thisviewpresentsindividualcolourlines.Thecolourandlengthofeachline
reectsthereceivedechoamplitude.
EBydefault,the“pingtime”andthedepthrangeisshowninthebottomleftsideof
theechogram.Inthebottomrightcorner,the“pingtime”isthesameascurrent.
ThisinformationcanbechangedusingtheoptionsontheHorizontalAxistabinthe
Echogramdialog.
FThisisthelowerendofthedepthrange.Itisnormallyafewmetersbelowthe
bottomcontour,dependingonthechosenrange.
Pelagicechogram
Thepelagicechogramappearsverysimilartothesurfaceechogram.However,the
biomasscalculationsarenotlimitedbythebottomdetection.
Example:Inapelagicechogram,settheStartRangevalueto20meters.Thiswillmake
theechogramstartfrom20metersbelowtheseasurface(providedthatthetransducer
offsethasbeendened).SetRangeto40meters.Theechogramwillnowshowthearea
from20metersbelowtheseasurface,anddownto60metersbelowthetransducer.
Providedthatthedepthislargerthan60meters,thebottomcontourisnotshown.
343539/A
39
Page 42

SimradES70
Trawlechogram
Trawlsensorsystemscommunicateheadropedepthandheadrope-to-footropedistance
totheES70atregularintervals.Theechogramcoverstheverticalopeningofthe
trawlincludingasmallmarginateachside.Theheadropeandfootropemarginsare
identical.TheirsizeisselectedintheT rawldialog.Theheadrope-to-footropedistance
canbemanuallysetintheT rawldialogfortrawlsensorsystemsnotmeasuringthe
trawlopening,orwhenthemeasuredheadrope-to-footropedistanceisunreliable.The
echogramisonlydrawnwhentrawlpositioninformationisavailable.Thebiomass
calculationsarenotlimitedbythebottomdetection.
Lines,markersandannotationsintheechograms
TheechogramsprovidedbytheES70maycontainadditionalinformation.
Bottomline
Thebottomcontourmaybeenhancedbyaddingabottomline.Thisisdoneinthe
EchogramdialogontheActivemenu.
→Howtoestablishhorizontalmarkersonpage62
→Bottomlineonpage89
Whiteline
Thebottomcontourmayalsobeenhancedbyaddingawhiteline.
Thewhitelineisanextrathickwhitelinethatis
addedtojustbelowthebottom.Thewhiteline
willnotremoveinformation,itwillsimply“push”
theinformationfurtherdowninordertomakethe
bottomeasiertosee.
ThewhitelineisenabledintheEchogramdialogontheActivemenu.Itcannotbe
usedsimultaneouslywiththehardnessline.
→Howtoestablishhorizontalmarkersonpage62
→Whitelineonpage90
Hardnessline
Thebottomhardnessmaybemonitoredusingthehardnessline.
40
343539/A
Page 43
Thehardnesslineisanextrathickcolourcoded
linethatisaddedtojustbelowthebottom.The
linewillnotremoveinformation,itwillsimply
“push”theinformationfurtherdowninorderto
makethebottomeasiertosee.Thecolourcoding
containsthehardnessinformation.
Thehardnesslinecannotbeusedsimultaneously
withthewhiteline.
ThehardnesslineisenabledintheEchogramdialog.
→BottomHardnessinformationpaneonpage45
→Howtoestablishhorizontalmarkersonpage62
Displayviews
→Hardnesslineonpage90
Trawlline
Wheneveravailableandconnected,trawlsystems(PIandITI)communicateheadrope
depthand/orheadrope-to-footropedistancetotheES70atregularintervals.The
informationfromthesesensorsaredrawnashorizontallinesontheES70echogram.
ThetrawllineisenabledintheEchogramdialogontheActivemenu.
→Howtoestablishhorizontalmarkersonpage62
VariableDepthline
Whenenabledahorizontaldepthlineisplacedwhereveryouclickintheechogram.This
istypicallyusedtomeasurethewaterdepth,thedepthofaschool,orevensinglesh.
Youcanclickontheline,andthendragitupor
down.
ThevariabledepthlineisenabledintheEchogram
dialogontheActivemenu.
→Howtoestablishhorizontalmarkersonpage62
343539/A
41
Page 44

SimradES70
RangeOtherlines
ThisfeatureisusedwhenyousetupyourES70withbothasurfacerelatedandbottom
relatedechogramshownsimultaneously.
Whenenabled,twohorizontallinesinthesurface
echogramindicatetherangeselectedinthebottom
echogram.
Therangeotherlinesfunctionisenabledinthe
EchogramdialogontheActivemenu.
→Howtoestablishhorizontalmarkersonpage62
Biomassline
Thebiomassmaybemonitoredusingthebiomassline.
Thebiomasslineisanextrathickbrightly
colouredlinethatisaddedtotheechogram.The
linewillidentifythevariationsinbiomass.To
adjusttheview,usethescale.
ThebiomasslineisenabledintheEchogram
dialog.
→Biomassinformationpaneonpage44
→Howtoestablishhorizontalmarkersonpage62
Rangescales
RangescalesintheechogramcanbeenabledintheEchogramdialog.
→Howtoestablishhorizontalmarkersonpage62
Verticalticks
WhenenabledintheEchogramdialog,thisfunctionplacesverticalmarkersonthe
echogram.
42
343539/A
Page 45

Displayviews
•Time:Thisoptionplacesashortverticallineisdrawnintheupperpartofthe
echogramonceeveryspeciednumberofminutes.
•Distance:Thisoptioninsertsashortverticallineisdrawnintheupperpartofthe
echogramonceeveryspeciednumberofnauticalmiles.
Annotations
Annotationsmaybeaddedtotheechogramtopinpointspecialechoes,specialevents,
etc.AnnotationcanbeenteredmanuallyusingtheAnnotationdialog,ortheycanbe
importedfromperipheraldevices.
Inordertoseetheannotationsontheechogram,theymustbeenabledintheEchogram
dialog.
Informationpanes
TheSimradES70offersseverali
datafromtheechogram.Thepanesareopenedandclosedusingthepanebuttonson
theTitleBar.
Note
Someoftheinformationpanesareoptional.Theyarethusnotavailableforuseunlessa
licencecodeisavailable.Inordertoobtainalicence,consultyourlocaldealer .
Aboutinformationpanes
Inordertoopenaninformationpane,youmustrstclickinanechogrampresentationto
makeit“active”.Bydoingthisyouselectfrequencychannel(transducer).Inmostcases,
thedataintheinformationpaneyouopenwillonlybevalidfortheselectedechogram.
Youcanchangethesizeoftheinformationpanetosuityourpreferences,andyoucan
moveitwithintheechogrampresentationitisvalidfor.Tochangeitssize,clickonthe
shadedareainthebottomrightcorner,holdthemousebuttondepressed,anddragto
requestedsize.Tomoveaninformationpane,justclickinsideit,holdthemousebutton
depressed,andmoveittorequestedposition.
n f o r m a t i o n p a n e s toprovideadditionalanddetailed
Theinformationpanesaretransparent,soyoucansafelyplaceapaneontopofthe
echogramwithoutlosingtheinformationbehindit.Thedegreeoftransparencyis
controlledbytheT ransparencybuttonontheDisplaymenu.
Allinformationpanesareprovidedwithsmallbuttonsinthetoprightcorner.
343539/A
43
Page 46

SimradES70
•Thetoprightbuttonclosestheinformationpane.Notethatyoucanalsoclosethe
paneifyouclickonemoretimeonitsbuttonontheTitleBar.
•Theotherbuttonwillrestoretheinformationpanetoitsoriginalsizeandlocation.
•Someoftheinformationpanesareprovidedwitha“tool”button.Thisbuttonsopens
adialogrelevanttotheinformationshowninthepane.
Depthinformationpane
TheDepthinformationpanedisplaysthecurrentdepthforthechosentransducerand
frequency.
TheToolintheinformationpanebuttonopensthe
BottomDetectordialog.Thisdialogisalsoavailable
fromtheActivemenu.
Toopenthisinformationpane,clicktheDepthiconontheTitleBar.
Biomassinformationpane
TheBiomassinformationpanedisplaysthecurrentbiomasscalculatedforthecurrentset
ofechogram.Onlythebiomasscalculatedforthecurrenttransducerfrequencyisshown.
Note
Biomassisanoptionalfunction.InordertoactivatetheBiomassinformationpane,
youmustobtainalicence.
Echogram:Youcanseebiomassfromthreedifferent
sources.
•UpperEchogram:Thisbiomassvalueiscalculated
fromtheshechoesfromthetopechogramfor
thechosenchannel.Bydefault,thisisasurface
echogram.
•LowerEchogram:Thisbiomassvalueiscalculated
fromtheshechoesfromthebottomechogramfor
thechosenchannel.Bydefault,thisisabottom
echogram.
•Zoom:Thisbiomassvalueiscalculatedfromthesh
echoesfromthecurrentlyzoomedarea.
44
343539/A
Page 47

Toopenthisinformationpane,clicktheBiomassiconontheTitleBar.
Relatedtopics
•Biomasslineonpage42
•Howtomonitorthecurrentbiomassonpage69
•Aboutbiomassonpage82
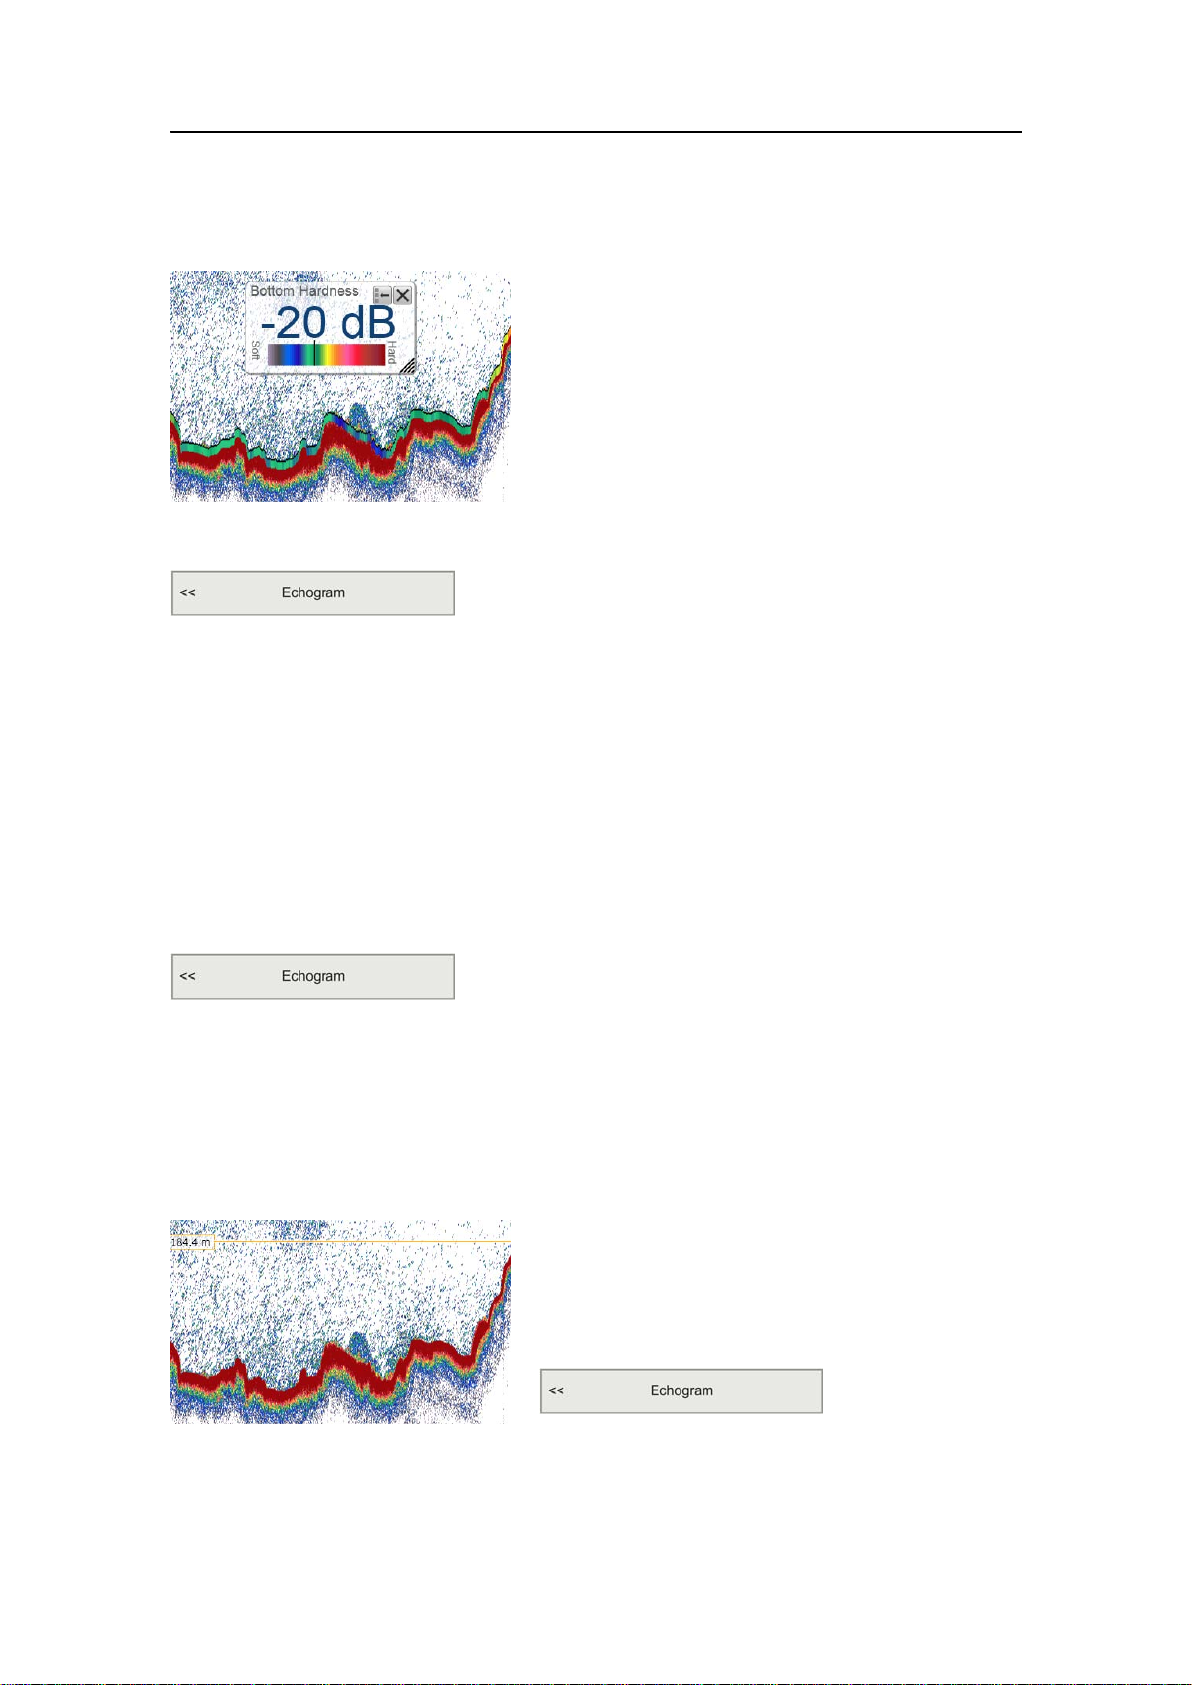
BottomHardnessinformationpane
TheBottomHardnessinformationpanedisplaysthecurrentbottomhardnesscalculated
usingthebottomechostrengthinthecurrentechogram.
Displayviews
Note
Bottomhardnessisanoptionalfunction.InordertoactivatetheBottomHardness
informationpane,youmustobtainalicence.
Theverticallineinthehardnesscolourscalepositions
thecurrentping.Thehardnessofthecurrentpingisalso
shownwiththenumericalvalue.
Thebottomhardnesscanalsobeindicatedbyenabling
thebottomhardnesslineintheEchogramdialog.
Thislineusesthesamecolourcodingastheinformationpane,butplacesthisasathick
lineimmediatelyunderthebottomlineintheechogram.
→Hardnesslineonpage90
Toopenthisinformationpane,clicktheBottomHardnessiconontheTitleBar.
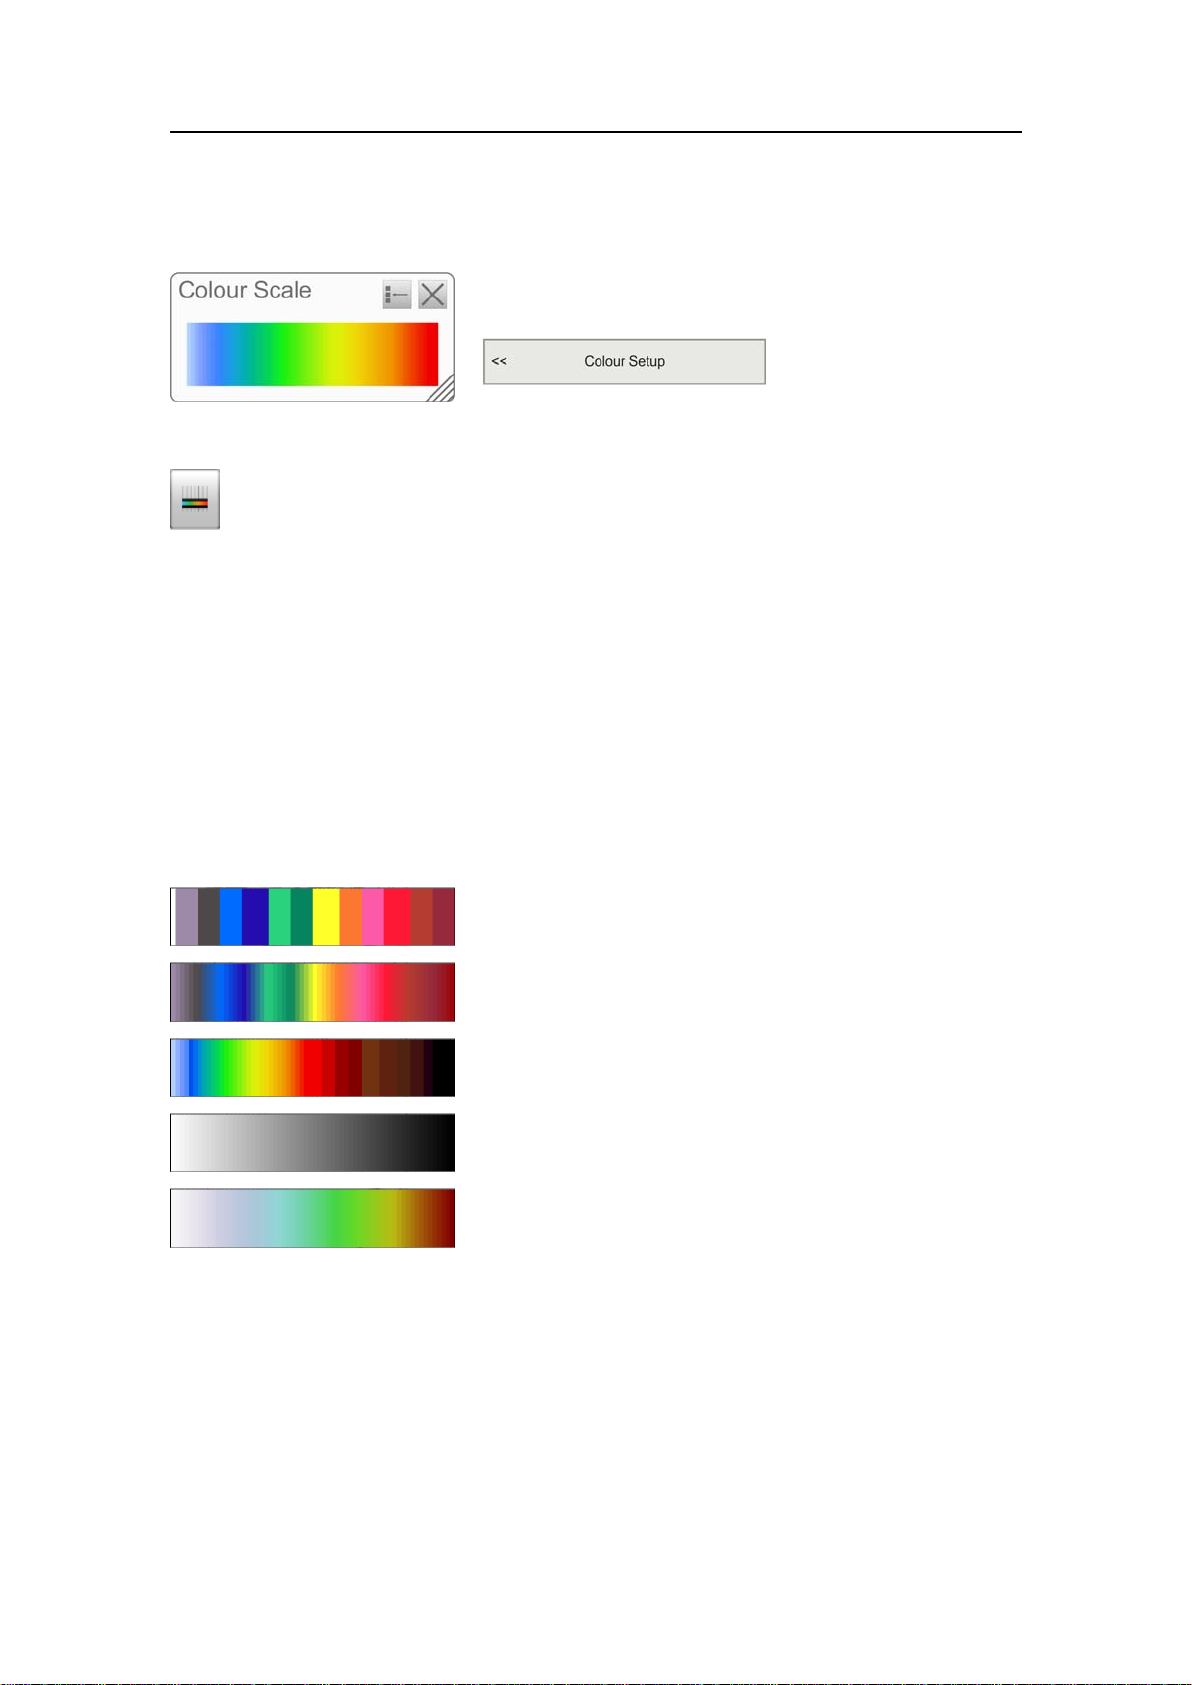
ColourScaleinformationpane
TheColourScalepanedisplaysthecurrentcolourscaleyouareusingfortheechogram
presentation.
343539/A
45
Page 48
SimradES70
Tochangethecolourscale,clickColourSetuponthe
Displaymenu.
Toopenthisinformationpane,clicktheColourScaleiconontheTitleBar.
Youcanlterouttheweakestechoesbymanuallymodifyingthecolourthreshold.
1ClicktheColourScaleiconontheTitleBartoopentheColourScaleinformation
pane.
2Movethecursortotheleftsideofthecolourscale.
Observethatthecursorchangesshapetoadualarrowline.
3Clickontheleftedgeofthecolourscale,anddragtheedgetowardsright.
4Observethattheweakestcoloursareremovedfromthecolourscale,andthusalso
theweakestechoesfromtheechogrampresentation.
Figure5Colourscalesusing12and64colours
12colours
64colours,Echosounder
64colours,Sonar
64colours,Greyscale
64colours,BI500colours
Relatedtopics
•Howtochangethecolourscaleandpresentationpaletteonpage60
•Howtochangethenumberofcoloursintheechogramonpage61
SizeDistributioninformationpane
TheSizeDistributionpaneprovidesavisualindicationonhowlargetheshesinthe
echogramare.Onlytheshesdetectedbythecurrenttransducerfrequencyareshown.
46
343539/A
Page 49

Displayviews
Note
TheSizeDistributioninformationpaneisonlyavailableifyourES70isequippedwith
oneormoresplitbeamtransceivers.
Toopenthisinformationpane,clicktheSizeDistribution
iconontheTitleBar.
TheSizeDistributioninformationpaneshowsa
histogramofthesingleshechoesdetectedinthe
echogram.Foranaccuratex-axisvalue,placethecursor
onaverticalbarinthehistogram,andreadthevalue
fromthelabel.TheabbreviationTSiscommonlyused.
Itmeans“TargetStrength”,andthisisameasureof
howstrongechotheindividualshesinthecurrent
echogramgenerate.Theechostrengthindicatesthesize
oftheshes.TheSizeDistributioninformationpanethus
providesamathematicalestimateofthesizesofallthe
chosenshspeciesintheechogram.
→SizeDistributioninformationpaneonpage46
Tochangetheshspecies,usetheFishSelectdialog
openedontheSetupmenu.
ThefollowinginformationisprovidedintheSizeDistributioninformationpane.
•Fishspecies:Thecurrentshspecies,asselectedintheFishSelectdialog,isshown.
•Echogram:Youcanseesizedistributionhistogramsfromthreedifferentsources.
–UpperEchogram:Thishistogramiscreatedbasedonshechoesfromthetop
echogramforthechosenchannel.
Bydefault,thisisasurfaceechogram.
–LowerEchogram:Thishistogramiscreatedbasedonshechoesfromthebottom
echogramforthechosenchannel.
Bydefault,thisisabottomechogram.
Ifyouhaveselectedonlyasmallverticalrangeclosetobottom,thehistogram
maybeempty.Thisbecausetheshvolumeissmallduetothelimitedrange
selected,andbecausethetargetstrengthalgorithmmusttakeintoconsideration
otherbottomechoesthansh.
–ZoomEchogram:Thishistogramiscreatedbasedonshechoesfromthecurrently
zoomedarea.
343539/A
47
Page 50

SimradES70
•Meanvalue:Thelargenumberaboveeachhistogramisthemeanvaluefromthe
tallestbar.TheunitreectsthemodechosenintheSizeDistributiondialog.
Tochangethesettingsinthehistogram,clickSizeDistributionontheActivemenu.
Relatedtopics
•Howtomonitortheshsizedistributiononpage68
FishPositioninformationpane
TheFishPositioninformationpaneshowsthepositionwithinthebeamofthedetected
singleechoesforthecurrentping(largestcircles)andthethreepreviousping(smaller
circles).Thecoloursindicatetheechostrength.
Note
TheFishPositioninformationpaneisonlyavailable
ifyourES70isequippedwithoneormoresplitbeam
transceivers.
Source:Thisisthesourceoftheshposition
information.Intheexample,thesurfaceechogramis
usedtodeterminethelatestshpositions.
Toopenthisinformationpane,clicktheFishPositioniconontheTitleBar.
EchoPositioninformationpane
TheEchoPositionpaneshowsthepositionwithinthebeamofthedetectedsingleechoes
forthecurrentping(largestcircles)andthethreepreviousping(smallercircles).
48
343539/A
Page 51

Displayviews
Note
TheEchoPositioninformationpaneisonlyavailable
ifyourES70isequippedwithoneormoresplitbeam
transceivers.
Toopenthisinformationpane,clicktheEchoPosition
iconontheTitleBar.
ThisisbasicallythesameviewastheFishPosition.
howevertheechoesarehereviewedfromthesideand
notfromabove.
Source:Thisisthesourceoftheechoposition
information.Intheexample,thesurfaceechogramis
usedtodeterminethelatestechopositions.
Zoominformationpane
TheZoominformationpaneallowsyoutozoominonachosenareaonthecurrent
echogram.
OncetheZoominformationpaneisopened,the
zoomedareaisvisibleasadottedrectangleonthe
echogram.Youcanchangethiszoomedareatoany
sizeandshape,theechoesinsidethezoomedareawill
alwaysbeshownintheZoominformationpane.
AreaFixedT oV essel:Whentherectangularzoomed
areaisestablished,itcaneitherfollowtheechogram
whileitmovestowardstheleft,oritcanstayput.
WhenAreaFixedT oV esselisactive,thezoomedarea
willbepermanentlypositionedontheechogram.The
echoeswillthenrunthroughthearea,andthusalso
throughtheZoominformationpane.
Toopenthisinformationpane,clicktheZoomiconontheTitleBar.
343539/A
49
Page 52

SimradES70
Figure6Zoomexample
AZoominformationpane
BZoomedarearectangle
Inthisexample,thezoomedarearectangle
ispositioneddirectlyabovetheZoom
informationpane.Ifyouclickonanyofthe
fourcornersoftherectangle,youcandragit
toanysizeandshape.
Historyinformationpane
TheHistoryinformationpanedoesnotusethesamepresentationmethodastheother
panes.Thefunctionallowsyoutoviewpreviouslyrecordedechogramsequences.In
ordertodothis,thecurrent“active”echogramissplitintwo,andtheleftsideisused
todisplaytherecordedhistory.
ClicktheHistoryiconontheTitleBartoenablethisfunction.
Thisfunctionisusedtostoreechogramsonbitmapformat.TheES70willcontinuously
saveechogrampicturestoitsinternalharddisk.Thesecanberecalledonthedisplay.
TheinformationintheHistorypresentationisthesameasontheoriginalechogram
presentation.
Thenumberofhistorylesislimited.Afterreachingthemaximumnumberofles,the
newestechogrampictureoverwritestheoldestone.Thehistoryfunctionstillallowsyou
toquicklylookthroughechogrampicturescoveringseveralhours.
50
343539/A
Page 53

Figure7Historypresentation
ATheoriginal“active”echogram
presentation
BTheoriginalscopeviewpresentation
CTheHistorypresentation
DClickthisbuttonanddragsidewaysto
scrollthroughtherecordedimages
Thehorizontalwidthofthehistorypresentationcanbeadjustedbyclickingtheright
border,anddraggingitsideways.
Displayviews
Taskbar
TheT askbarislocatedatthebottomofthedisplay.TheT askbarcontainstabstocontrol
theechogrampresentations,aswellastimeanddateinformation.
TheTaskbarcontainsthefollowinginformation:
AScreenCaptures:Thistabhidesthecurrent“live”echogramsfromview,andallows
youtoseetheechogramimagesyouhavepreviouslysavedusingtheScreenCapture
buttonontheTitleBar.Theechogramsarepresentedinagraphicbrowser.Youcan
openanyoftheimagesforacloserstudy ,oryoucanaccessthelesdirectlyby
clickingtheOpenImageFolderbutton.
→Operationbuttonsonpage31
→Screencapturesonpage52
BPresentationformatIfonlyoneactivefrequencychannelisinuse,youwillhave
onlyoneechogram.Thesetabsarethennotshown.
•V ertical:Thistabplacesyourcurrentechogramsnexttoeachotherinavertical
presentation.
•Horizontal:Thistabplacesyourcurrentechogramsontopofeachotherina
horizontalpresentation.
CTransducerpresentationThesetabswillreecttheactualtransducersusedbythe
echosounder.Thetwotransducersshownherearejustanexample.Ifonlyone
transducerisinuse,youwillhaveonlyoneechogram.Thesetabsarethennot
shown.
343539/A
51
Page 54

SimradES70
•ES38:Thistaballocatestheechosounderpresentationtoonlyshowthe
echogramfromthistransducer.
•ES120:Thistaballocatestheechosounderpresentationtoonlyshowthe
echogramfromthistransducer.
DDate:Thiseldonthestatusbarpresentsthecurrentdate.Notethatduringreplay ,
thedateofthereplayleisshown.An“R”isdisplayedinfrontofthedateto
identifythis.
ETime:Thiseldonthestatusbarpresentsthecurrenttime.Notethatduringreplay,
thetimesinthereplayleisshown.
Relatedtopics
•Howtoselectpresentationlayoutonpage60
Screencaptures
TheES70providesabuilt-inscreencapturefunction,andabrowsertoviewthesaved
images.
Figure8Screencapturebrowser
Tosaveanechogram,clicktheScreenCapturebuttonontheTitleBar.
Toviewtherecordedimage,clickScreenCaptureontheTaskbartoopentheimage
browser.
ClickOpenImageFoldertoopentheoperatingsystemfoldercontainingtheles.This
folderoffersoperatingsystemfunctionalitytoproviderenaming,copying,printing
anddeletingles.
52
343539/A
Page 55

Operationalprocedures
Operationalprocedures
Thischaptercontainsseveraloperationalproceduresexplaininghowyoucanputyour
ES70Fishndingechosoundertouse.
Note
TheseproceduresassumethatyouarefairlyfamiliarwiththeMicrosoftWindows
operatingsystem.PhrasesandterminologyareconsistentwiththeMicrosoftstyleguide.
Theproceduresalsoassumethatyouoperatetheechosounderwithamouseortrackball.
Topics
•Gettingstarted
–PowerOn/Offproceduresonpage13
–Howtochooseoperationalmodeonpage16
–Howtocheckthetransceiverandtransducersettingsonpage16
–Howtocheckthebottomdetectorsettingsonpage17
–Howtocheckthecolourscalesettingsonpage17
–Howtocheckthesizedistributionandshpositionsettingsonpage18
–Howtochecktheechogramsettingsonpage19
–Howtochecktherangesettingsonpage21
•Operation
–Howtochangethepingrateonpage54
–Howtosaveanechogramonpage56
–Howtosaverawechogramdataonpage57
–Howtoplaybackechogramsequencesonpage59
•Views
–Howtochangethesizeofthepresentationeldsonpage60
–Howtoselectpresentationlayoutonpage60
–Howtochangethecolourscaleandpresentationpaletteonpage60
–Howtochangethenumberofcoloursintheechogramonpage61
343539/A
53
Page 56

SimradES70
•Echograms
–Howtoselectechogrampresentationonpage62
–Howtoestablishhorizontalmarkersonpage62
–Howtoestablishverticalmarkersonpage63
–HowtoselectTVGgainonpage63
–Howtoremoveinterferenceandvessel’ sownnoisefromtheechogramsonpage64
–Howtoeasieridentifythebottomonpage65
•Range
–Howtochoosetheverticalrangeonpage65
–Howtochoosethestartrangeonpage66
•Bottomdetection
–Howtodenemaximumandminimumdepthonpage67
•Sizedistribution,biomassandshdensity
–Howtomonitortheshsizedistributiononpage68
–Howtoadjusttheshlengthforcorrectcalculationsonpage69
–Howtomonitorthecurrentbiomassonpage69
•Gain
–Howtoadjustthesignalgainonpage70
–HowtoadjusttheTVGgainonpage71
•Powerandpulseduration
–Howtochoosepassivemodeonpage72
–Howtochangetheoutputpoweronpage72
–Howtoadjustthepulsedurationonpage73
Arethereanyproceduresmissing?Areyouperforminganoperationthatwehavenot
explained?Writeane-mailtos
includetheprocedureinthenextversionofthismanual.
i m r a d . s u p p o r t @ s i m r a d . c o m andask.W emaythen
Operation
Theseproceduresarerelatedtothebasicuseoftheechosounder.
Howtochangethepingrate
ThePingrateistheparameterthatcontrolshowoftentheechosoundershalltransmit
acousticenergy(a“ping”)intothewater.
Ifyouobserveapelagicechoonthesounder,anditseemstofollowthebottomcontour,
itmayinfactbeafalseechofromtheprevioustransmission(“ping”).Theonlyway
toremovethisfalseechoistoreducethepingrate.Ifyoudothis,alltheechoesfrom
thepreviouspingwillhavedisappearedbeforeyoutransmitthenext.Onoldpaper
54
343539/A
Page 57

Operationalprocedures
basedechosoundersthepenspentalongtimeontherearsideofthepapertray,andthat
reducedthepingrate.TheES70isal
o t faster,andyoumaysendoutapingevenbefore
theenergyfromthepreviouspinghasdisappeared.
1ClicktheOperationiconundertheMainmenutoopentheOperationsub-menu.
2ClickPing,andselectOn.
Thetwoiconsprovidedbythisbuttoncanalsobeusedtoenableordisable
transmission.
•Thelefticon(darkrectangle)is“Off”.
•Therighticonis“On”.ItisalsousedtoinitiatesinglepingswhenSingleStep
modeisselected.
3Howtochoosemaximumpingrate:
aClickPingMode,andselectMaximum.
ThiswillmaketheES70pingwithmaximumspeed.Thetimebetweeneach
pingisautomaticallydeterminedbythecurrentdepthandpulseduration.
4Howtodeneapinginterval:
aClickPingMode,andselectInterval.
bClickPingInterval,andselectthetime(inmilliseconds)betweeneachping.
5Howtotransmitsinglepings:
aClickPingMode,andselectSingleStep.
bToinitiateasingleping,clickonceontherighthandicononthePingbutton.
343539/A
55
Page 58
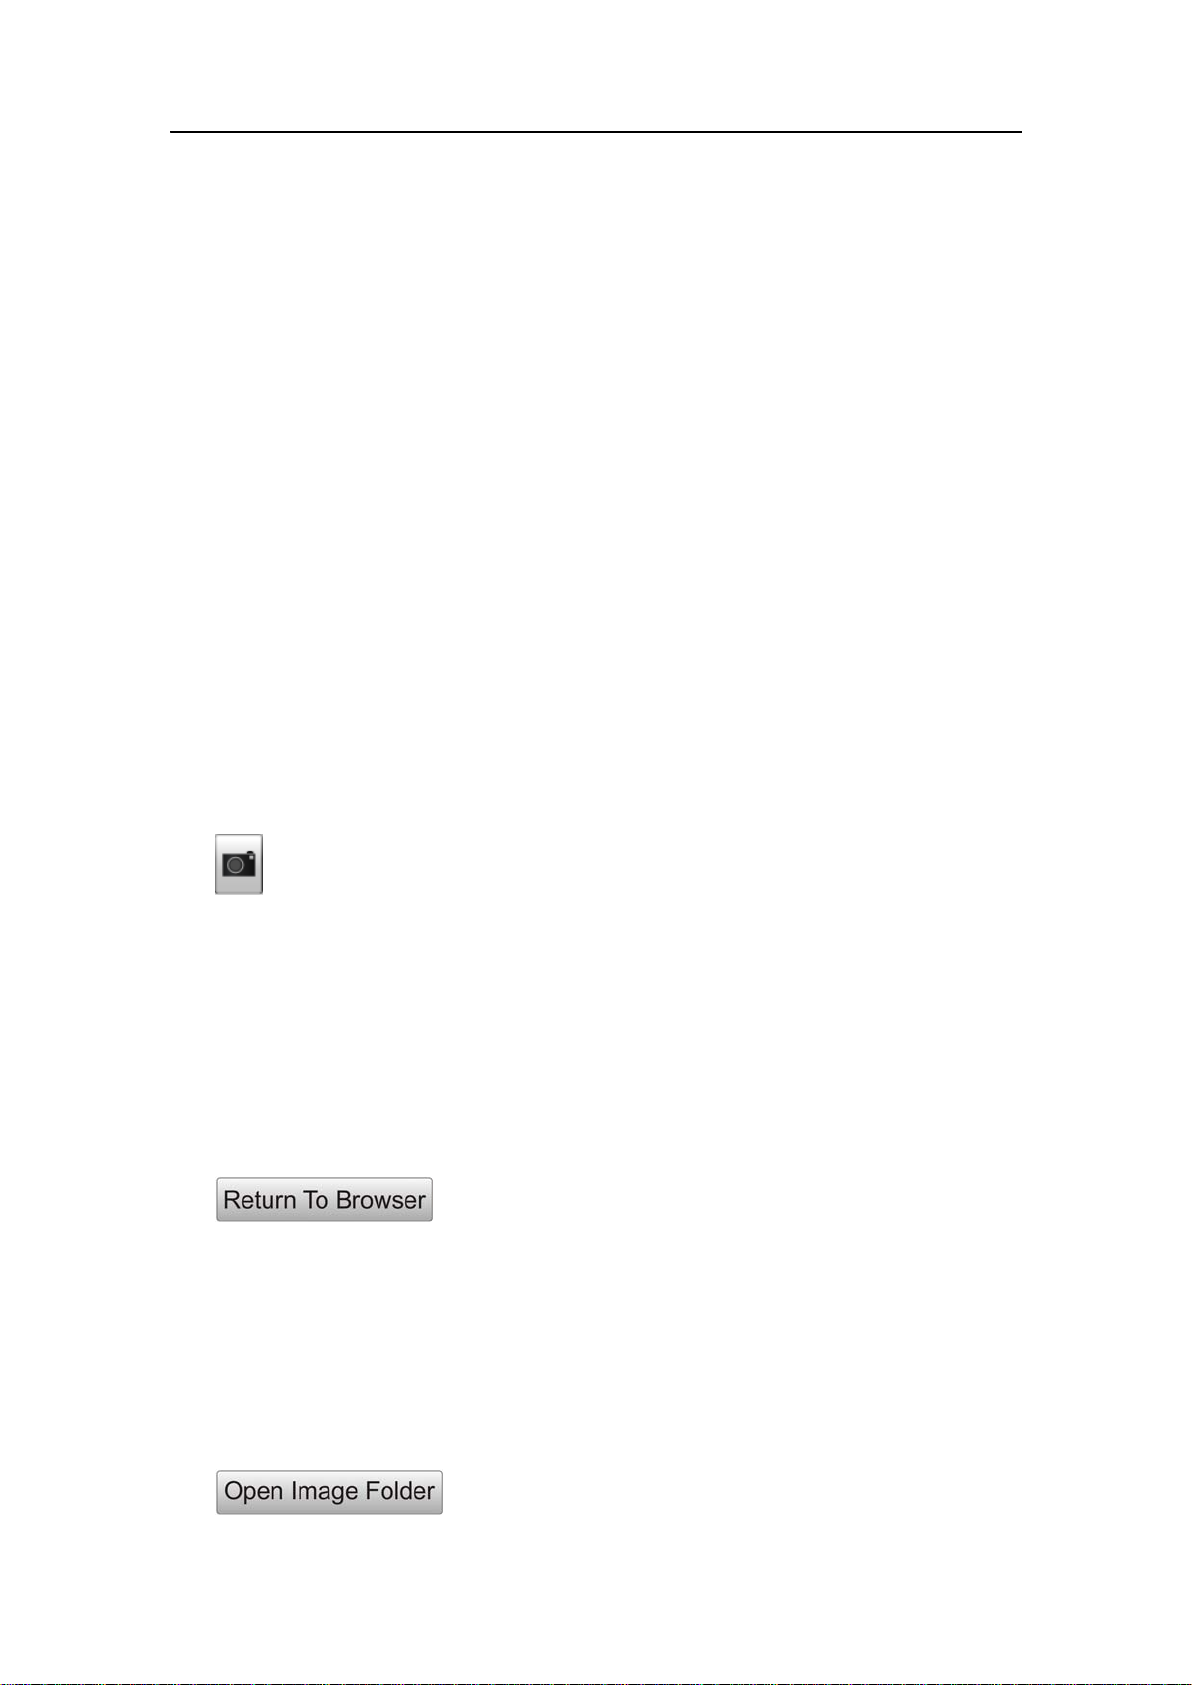
SimradES70
Howtosaveanechogram
Twowaystosaveechograms
•YoucanusetheScreenCapturebuttonontheTitleBar.Everytimeyouclickthis
buttonthecurrentechogramissavedasaJPGle.
Theadvantagewiththismethodisthatthelesaresmallindividualimagesandeasy
toscrollthrough.However,theimagesarexed,whatwasrecordedintherstplace
cannotbealtered.
•YoucanusetheRecordbuttonontheTitleBar,orontheDisplaymenu,tosaveraw
datasequences.
Everytimeyouinitiatethisfunctionyoustartarecordingprocesswhichsavesthe
sequenceofrawdatafromthetransceiver.Thissequencecanbereplayedlater.
Theadvantagewiththisfunction–savingrawdatasequences–isthatallthe
informationpresentedduringtherecordingaresaved.Thismeansthatyoucanchange
parameterslikeTVG,range,etc.duringtheplayback.However,thelesarelarge,
andplaybackmaybeatimeconsumingtask.
→Howtosaverawechogramdataonpage57
Howtosavesingleechograms
1ClicktheScreenCapturebuttonontheTitleBartosavethecurrentechogram.
Howtoretrieveasavedechogram
1OntheT askbar,clickScreenCaptures.
Observethatthebuilt-inimagebrowserstarts.Allthecurrentlysavedechogram
imagesareshownasminiatures.
→Operationbuttonsonpage31
2Double-clickontheminiatureyouwishtosee.
3ClickReturnToBrowsertoclosetheimage.
Howtocopyanddeleteechogramles
1OntheT askbar,clickScreenCaptures.
Observethatthebuilt-inimagebrowserstarts.Allthecurrentlysavedechogram
imagesareshownasminiatures.
→Operationbuttonsonpage31
2Intheimagebrowser,clickOpenImageFolder.
56
343539/A
Page 59

3Tocopyale:
aConnectaUSBmemorydevicetooneofthecomputer’sUSBsockets.
bSelectthele.
cRight-clicktoopentheshort-cutmenu.
dClickSendtoandselectthememorydevice.
4Todeleteale:
aSelectthele.
bRight-clicktoopentheshort-cutmenu.
cClickDelete.
5Toprintale:
aSelectthele.
bRight-clicktoopentheshort-cutmenu.
Operationalprocedures
cClickPrint.
Notethatthisfunctionwillsendtheimagetothedefaultprinterusingdefaultprint
parameters.Ifyouwishtoapplymorecontroltotheprintingprocess,youmustcopy
theechogramimagetoanothercomputer,andopenitwithasuitableeditor.
Howtosaverawechogramdata
Twowaystosaveechograms
•YoucanusetheScreenCapturebuttonontheTitleBar.Everytimeyouclickthis
buttonthecurrentechogramissavedasaJPGle.
Theadvantagewiththismethodisthatthelesaresmallindividualimagesandeasy
toscrollthrough.However,theimagesarexed,whatwasrecordedintherstplace
cannotbealtered.
•YoucanusetheRecordbuttonontheTitleBar,orontheDisplaymenu,tosaveraw
datasequences.
Everytimeyouinitiatethisfunctionyoustartarecordingprocesswhichsavesthe
sequenceofrawdatafromthetransceiver.Thissequencecanbereplayedlater.
Theadvantagewiththisfunction–savingrawdatasequences–isthatallthe
informationpresentedduringtherecordingaresaved.Thismeansthatyoucanchange
parameterslikeTVG,range,etc.duringtheplayback.However,thelesarelarge,
andplaybackmaybeatimeconsumingtask.
→Howtosaverawechogramdataonpage57
Thisprocedureexplainshowtostorerawechogramdata.Eachsequenceofrawdata
–oftenregardedasa“line”duringasurvey–containsasetofechogramdatasaved
ondigitalformat.Oncesaved,youcanplaybackthisdatajustasifitwas“normal”
echogramdata.
343539/A
57
Page 60

SimradES70
Procedure
Note
Rawdatalesareverylarge.Ifyouwishtorecordlargeamountsofechogramrawdata,
makesurethatyouhaveenoughspaceonyouharddisk.
1ClicktheOperationiconundertheMainmenutoopentheOperationsub-menu.
2ClickRecordtoopenthesub-menu.
3ClickFileOutputtoopentheFileOutputdialog.
4IntheFileOutputdialog;
aOntheDirectorytab,denetheleoutputdirectory.
bOntheRawDatatab,clickSaveRawDatatoenablethisexport.
Rawdataaretheechodatareceiveddirectlyfromtheoutputofthetransceiver.
ThedatacanlaterbereplayedontheES70.Thedatacontainsampledata,echo
soundercongurationdata,navigationdata(NMEAformat)andannotations
(ifany).
cDeneanyotherparameterstotyourrequirements.
5ClickOKtosavethecurrentsettingsandclosethedialog.
6Tostartrecording,youhavetwochoices:
aIntheRecordbutton,selectOn.
bOntheTitleBar,clicktheRecordbutton.
Whenactivated,theRecordbuttonisred.
→Operationbuttonsonpage31
7Tostoprecording,youhavetwochoices:
aIntheRecordbutton,selectOff.
bOntheTitleBar,clicktheRecordbutton.
58
343539/A
Page 61

Operationalprocedures
Whennotactivated,theRecordbuttonisblack.
→Operationbuttonsonpage31
Howtoplaybackechogramsequences
Youcansaveechogramsitwoways.Bitmapimagesaresavedcontinuously,andthese
canberecalledbymeansoftheScreenCapturebuttonontheTaskbar.Echogram
sequencesarerecordedusingtheRecordfunctionontheOperationmenu.These
sequencesareplayedbackbyplacingtheES70inReplaymode.
1ClicktheOperationiconundertheMainmenutoopentheOperationsub-menu.
2ClicktheOperationbuttontoopenitssub-menu.
3ClickReplayFiletoopentheReplayFiledialog.
TheReplaydialogisusedtondthelestobereplayed.Thelenamesare
generatedautomatically,andeachleisidentiedwiththetimeanddateitwas
made.
Ifyouwishtorunthereplaycontinuously,clickLoopintheReplayFiledialog.
4IntheOperationsub-menu,clickReplaytoselectthefunction.
ObservethattheReplaybaropens.
→Replaybaronpage36
5ClickthestartbuttonintheReplaybartostarttheplayback.
6Tostoptheplayback,clickthestopbuttonintheReplaybar,orgobacktoNormal
mode.
Views
Theseproceduresexplainhowtocontrolthepresentationsonthedisplay.
Relatedtopics
•Aboutrangeselectiononpage87
343539/A
59
Page 62

SimradES70
•Aboutdynamicrangeanddisplaypresentationonpage84
Howtochangethesizeofthepresentationelds
Youcanmodifythesizeofeachindividualeldintheechosounderpresentation.The
contentinaeldthatchangessizewillautomaticallyadjusttotakefulladvantageof
thespaceavailable.Bymeansofthisfunctionalityyoucanforexampleincreasethe
charactersizeofthedepthvalue.
1Movethecursortotheborderlinebetweentwoelds.Observethatthemarker
changesform;itwillappearastwoparallellineswitharrowspointingout.
2Clickontheleftmousebutton,andkeepitdepressed.
3Movethemouse–orrollthecontrolwheel–andobservethattheborderlinemoves.
4Releasethemousebutton.
Howtoselectpresentationlayout
Youechosoundermaybesetupwithoneormorefrequencies(channels).TheLayout
dialogandtheT askbarallowsyoutocontrolwhichchannelsyoucanseeonthedisplay,
andhowtheyarepresented.
1ClicktheDisplayiconundertheMainmenutoopentheDisplaysub-menu.
2ClickLayouttoopentheLayoutdialog.
TheLayoutdialoglistsallyouractivechannels,Y oucanenableordisablethe
presentationofindividualchannels.
3Inordertocontrolthehorizontalorverticalpresentationwhenyouhavetwoor
moreechograms,usethebuttonsontheT askbar.
•Horizontalforahorizontalpresentation
•Verticalforaverticalpresentation
•[Transducername]toseeonlytheechogramforthechosentransducer
→Taskbaronpage51
Howtochangethecolourscaleandpresentationpalette
Bydefaultyouhave64or12coloursavailabletopresenttheechograms,andaselection
ofpalettes.ThecolourscalecanberetrievedanytimebyclickingtheColourScale
iconontheTitleBar.
WhichcolourscaletouseisdenedintheColourSetupdialogontheDisplaysub-menu.
→TitleBaronpage30
60
343539/A
Page 63

Operationalprocedures
→ColourScaleinformationpaneonpage45
1ClicktheDisplayiconundertheMainmenutoopentheDisplaysub-menu.
2ClickColourSetuptoopentheColourSetupdialog.
3Selectpaletteandechogramcolourstosuityourrequirements
4ClickOKtosavethecurrentsettingsandclosethedialog.
Howtochangethenumberofcoloursintheechogram
Bydefaultyouhave64or12coloursavailabletopresenttheechograms,andaselection
ofpalettes.ThecolourscalecanberetrievedanytimebyclickingtheColourScale
iconontheTitleBar.
WhichcolourscaletouseisdenedintheColourSetupdialogontheDisplaysub-menu.
→TitleBaronpage30
→ColourScaleinformationpaneonpage45
Youcanlterouttheweakestechoesbymanuallymodifyingthecolourthreshold.
1ClicktheColourScaleiconontheTitleBartoopentheColourScaleinformation
pane.
2Movethecursortotheleftsideofthecolourscale.
Observethatthecursorchangesshapetoadualarrowline.
3Clickontheleftedgeofthecolourscale,anddragtheedgetowardsright.
4Observethattheweakestcoloursareremovedfromthecolourscale,andthusalso
theweakestechoesfromtheechogrampresentation.
Echogram
Theseproceduresexplainthevariousparameterscontrollingtheechogram.
Relatedtopics
•Aboutrangeselectiononpage87
•Aboutdynamicrangeanddisplaypresentationonpage84
•Aboutbottomslopesonpage87
•AboutTVGgainonpage83
•Aboutbottomlinesonpage89
343539/A
61
Page 64

SimradES70
Howtoselectechogrampresentation
OntheES70youcanchoosefromseveralechogrampresentations.
1ClicktheActiveiconundertheMainmenutoopentheActivesub-menu.
2ClickEchogramtoopentheEchogramdialog.
3OntheEchogramtab,chooseEchogramT ype.
Thefollowingechogramtypesareavailable:
•Surface:Theechogramisrelatedtotheseasurface.Startdepth(upperechogram
boundary)andverticalrange(acrossechogram)aremanuallyselectedbythe
StartDepthandRangebuttonsontheMainmenu.
•Bottom:Theechogramisrelatedtothedetectedbottom.Stopdepth(lower
echogramboundary)andverticalrangearemanuallyselectedbytheStartDepth
andRangebuttonsontheMainmenu.Theechogramisonlydrawnforpings
havingasuccessfulbottomdetection.
•Pelagic:ThisechogramisnearlyidenticaltotheSurfaceechogram.However,
thebiomasscalculationsarenotrestrictedbythebottomdetection.Thismeans
thatthebottomechowillbeincludedincalculationsifitappearswithinthe
chosenrange.
Example:Ifyouareinvestigatingalargeschoolofpelagicsh,settheStart
RangeandRangetoenclosetheschool.Iftheschoolislargeenough,aSurface
echogrammaymistakeitforbottom,andthebiomassreadingswillbewrong.
ThePelagicechogramwillhoweverdisregardthebottomdetection,andgivea
correctestimateofthebiomass.
•T rawl:Trawlsensorsystemscommunicateheadropedepthand
headrope-to-footropedistancetotheES70atregularintervals.Theechogram
coverstheverticalopeningofthetrawlincludingasmallmarginateachside.
Theheadropeandfootropemarginsareidentical.Thebiomasscalculationsare
notrestrictedbythebottomdetection.
Note
Thechosenechogramtypewillonlyapplytothecurrentlyselected“active”
echogram.Ifyouwishthechangestoapplytoallsimilarechograms,clickApply
ToAll.
4ClickOKtosavethecurrentsettingsandclosethedialog.
Howtoestablishhorizontalmarkers
Arangeofhorizontalmarkerscanbeenabledordisabled.
1ClicktheActiveiconundertheMainmenutoopentheActivesub-menu.
62
343539/A
Page 65

Operationalprocedures
2ClickEchogramtoopentheEchogramdialog.
3OntheLinestab,observethevariousmarkersthatcanbeenabled.
•BottomLine
•WhiteLine
•HardnessLine
•TrawlLines
•VariableDepthline
•RangeOtherlines
•Biomassline
•Scalelines
→Lines,markersandannotationsintheechogramsonpage40
4Enablethelinesyouwishtosee.
NotethattheWhiteLineandtheHardnessLinecannotbeusedsimultaneously.
5ClickOKtosavethecurrentsettingsandclosethedialog.
Howtoestablishverticalmarkers
Arangeofverticalmarkerscanbeenabledordisabled.
1ClicktheActiveiconundertheMainmenutoopentheActivesub-menu.
2ClickEchogramtoopentheEchogramdialog.
3OntheLinestab,observethevariousverticalmarkersthatcanbeenabled.
•Time
•Distance
•Annotations
TheannotationsarecontrolledontheAnnotationdialog,buttoplacethe
annotationsontheechogram,youmustenablethemintheEchogramdialog.
→Lines,markersandannotationsintheechogramsonpage40
4Enabletheverticalmarkersyouwishtosee.
5ClickOKtosavethecurrentsettingsandclosethedialog.
HowtoselectTVGgain
IntheEchogramdialogyoucanchoosewhichTVGgainyouwishtouse.
TheTVGcanbechosenusingtheEchogramdialog(describedhere),orwiththeTVG
buttonontheActivesub-menu.
→HowtoadjusttheTVGgainonpage71.
1ClicktheActiveiconundertheMainmenutoopentheActivesub-menu.
343539/A
63
Page 66

SimradES70
2ClickEchogramtoopentheEchogramdialog.
3OntheEchogramtab,observethevariousTVGsettingsthatcanbeapplied.
•Power(NoTVG):TVGgainisnotimplemented.Thissettingishardlyeverused.
•School(20logTVG):Thisgainsettingprovidesthelargestamplicationcloseto
thebottom.Ithasbeendesignedtoprovidethebestechoesfromschools.
•Fish(40logTVG):Thisgainsettingprovidesloweramplicationclosetothe
bottom.Ithasbeendesignedtoprovidethebestechoesfromsinglesh.
•T argets(40logTVG):Basically,thissettingusesthesameTVGamplicationas
Fish,butadditionallteringisimplemented.Onlyechoesdetectedandinterpreted
assingleshareshown.Theechoesarecompensatedfortheirphysicalposition
inthebeam(beamcompensation).Thismeansthatshintheouterregionofthe
beamareadjustedtocorrectsizeeventhoughtheirechoesareweaker.
[6]
•T argetMix(40logTVG):Basically,thissettingusesthesameTVGamplication
asFish,butadditionalbeamcompensationisimplemented.Echoesdetected
andinterpretedassingleshareadjustedtotheircorrectsizeaccordingtotheir
physicalpositioninthebeam.
[7]
•User(V ariableTVG):ThissettingallowsyoutodeneyourownTVGsetting.
→AboutTVGgainonpage83
4ChooseyourTVGsetting.
Notethatthechangesmadeinthistabwillbedefaultonlybeappliedtothe
currentlyselected“active”echogram(identiedwithathickborder).Ifyouwish
toapplythechangestoalltheotherechogramsofthesametype(forexampleall
bottomrelatedechograms,clickApplyToAll.
5ClickOKtosavethecurrentsettingsandclosethedialog.
Howtoremoveinterferenceandvessel’sownnoisefrom
theechograms
TheActivesub–menuoffersadedicatedltertoremoveinterferenceandnoisefrom
yourownvessel.Thislterhasbeendevelopedforoursonars,andhasprovento
beveryuseful.
1ClicktheActiveiconundertheMainmenutoopentheActivesub-menu.
2ClickPing-PingFilter,andmaketheadjustmentstotyourrequirements.
•Off:Noltering
6.NotethatthisT argets(40logTVG)settingisonlyfunctionalwithsplitbeamtransducers.
7.NotethatthisT argetMix(40logTVG)settingisonlyfunctionalwithsplitbeamtransducers.
64
343539/A
Page 67

Operationalprocedures
•2of3:Forthecurrentechopixeltobeshown,theechopixelfromatleastoneof
thetwopreviouspingsmusthaveacolourvaluedifferentfromthebackground.
•2of2:Forthecurrentechopixeltobeshown,theechopixelfromtheprevious
pingmusthaveacolourvaluedifferentfromthebackgroundtobeshown.
•3of3:Forthecurrentechopixeltobeshown,theechopixelfromthetwo
previouspingsmusthaveacolourvaluedifferentfromthebackgroundtobe
shown.
Howtoeasieridentifythebottom
TheEchogramdialogallowsyoutoenablebottomlineorwhitelinetoeasieridentify
thebottom.
1ClicktheActiveiconundertheMainmenutoopentheActivesub-menu.
2ClickEchogramtoopentheEchogramdialog.
3OntheLinestab,observethevariouslinesthatcanbeapplied.
→Aboutbottomlinesonpage89
4ClickOKtosavethecurrentsettingsandclosethedialog.
Ranges
Theseproceduresexplainhowtochangetheverticalrange,thatishowtocontrolthe
depthtobeshownbytheechogram.
Relatedtopics
•Aboutrangeselectiononpage87
•Aboutbottomslopesonpage87
•Aboutbottomlinesonpage89
Howtochoosetheverticalrange
TheverticalrangeiscontrolledbytheRangebuttonontheMainmenu.
Forexamplesettings,seeHowtochoosethestartrangeonpage66.
1Method1:
aClick[+]or[-]toadjusttherangemanually.
2Method2:
aClickthemiddleofthebuttontoopenit.
343539/A
65
Page 68

SimradES70
bClickanyrangevalue(includingAutowhenavailable)toselectit.
Howtochoosethestartrange
TheverticalstartrangeiscontrolledbytheStartRangebuttonontheMainmenu.
1Method1:
aClick[+]or[-]toadjustthestartrangemanually.
2Method2:
aClickthemiddleofthebutton,holdthemousebuttondepressed,anddrag
sideways.
3Method3canonlybeusedifyouhaveakeyboard:
aClickthemiddleofthebuttontoopenit.
bEnteranyvaluefromthekeyboard.
Example:Inasurfaceechogram,settheStartRangevalueto0meters.Thiswillmake
theechogramstartfromtheseasurface(providedthatthetransduceroffsethasbeen
dened).SetRangetothecurrentdepthplus20meters.Theechogramwillnowshow
theareafromtheseasurfaceanddownto20meters“below”thebottom.Thebottom
contouriseasilydetectedwhenthedepthchanges.
Example:Inabottomechogram,settheStartRangevalueto–5meters.Thiswillmake
theechogramstartfrom5metersabovethebottom.SetRangetothe5metersplus10=
15meters.Theechogramwillnowshowtheareafrom5metersabovethedepth,and
downto10meters“below”thebottom.Thebottomcontourwillappearasaatline.
Example:Inasurfaceechogram,settheStartRangevalueto10meters.Thiswillmake
theechogramstartfrom10metersbelowtheseasurface(providedthatthetransducer
offsethasbeendened).SetRangetothecurrentdepthplus20meters.Theechogram
willnowshowtheareafrom10metersbelowtheseasurface,anddownto10meters
“below”thebottom.Thebottomcontouriseasilydetectedwhenthedepthchanges.
66
343539/A
Page 69

Operationalprocedures
Example:Inapelagicechogram,settheStartRangevalueto20meters.Thiswillmake
theechogramstartfrom20metersbelowtheseasurface(providedthatthetransducer
offsethasbeendened).SetRangeto40meters.Theechogramwillnowshowthearea
from20metersbelowtheseasurface,anddownto60metersbelowthetransducer.
Providedthatthedepthislargerthan60meters,thebottomcontourisnotshown.
Bottomdetection
Theseproceduresexplainhowyoucancontrolthebottomdetection.
Relatedtopics
•Aboutrangeselectiononpage87
•Aboutbottomslopesonpage87
Howtodenemaximumandminimumdepth
WhenyouusetheES70itisveryimportantthattheechosounderdetectsand“locks”on
thecorrectdepth.Normallythiswillhappenautomatically,butcertainseaorbottom
conditions,ortheappearanceoflargeschoolsofsh,may“fool”thesounder.Whenthe
bottomisundetectedyouwillread0.00metersdepth,oranyothererroneousvalue.In
ordertoguidetheES70tolocatethecorrectdepth,youmaysometimesndituseful
tofollowthisprocedure.
1ClicktheActiveiconundertheMainmenutoopentheActivesub-menu.
2ClickBottomDetectortoopentheBottomDetectordialog.
3EnteraMinimumDepth.
Thissettingeliminatesallunwantedbottomdetectionsfromthetransducersurface
anddowntothedeneddepth.Afalsebottomdetectionwithinthisareawould
causeerroneousdepthread-outandincorrectbottomexpansion.
4EnteraMaximumDepth.
Setthisdepthtoapproximately50%morethantheexpecteddepth.Iftheecho
soundershouldloosebottomdetectionduetoairorotherdisturbances,itwilltryto
relocatethedepthwithintheminimumandmaximumdepthsyouhavedened.Do
notexaggerate.Ifyouforexampleenter5000metersandthebottomtrackislost,
theechosounderwillsearchtheentiredepthfornewbottomlock.Thiswilltakea
lotoftime,andalotofinformationwillbelostduringthesearch,especiallyduring
roughseaconditionswithairbeingforcedunderthehull.
5ClickOKtosavethecurrentsettingsandclosethedialog.
343539/A
67
Page 70

SimradES70
Ifyousetmaximumdepthtoavalueidenticalorsmallerthantheminimumvalue,the
bottomdetectionalgorithmwillbedisabled.Theechosounderwillthennotbeableto
detectthebottomatall,andthedisplayeddepthwillbe0.00m
Sizedistribution,biomassandshdensity
Ifyouusea“splitbeam”transduceronyourES70theechosounderwillyouprovideyou
withinformationaboutthesizedistributionanddensityoftheshbeneaththehull.
Relatedtopics
•Aboutbiomassonpage82
Howtomonitortheshsizedistribution
ThesizedistributionispresentedusingtheSizeDistributioninformationpane.
→SizeDistributioninformationpaneonpage46
1ClicktheSizeDistributioniconontheTitleBartoopentheinformationbar.
2Tochangethesizeoftheinformationpane,clickinthebottomrightcorner,hold
themousebuttondepressed,anddrag.
3Clickonthehistogramtitlestoseetherelevantpresentations.
4Tochangethepresentationparameters:
aClickthetoolbuttoninthetoprightcorneroftheinformationpanetoopen
theSizeDistributiondialog.
ThedialogcanalsobeopenedfromtheActivesub-menu.
bMakethenecessaryadjustments.
cClickOKtosavethecurrentsettingsandclosethedialog.
5Tochangetheshspecies:
aClicktheSetupiconundertheMainmenutoopentheSetupsub-menu.
bClickFishSelecttoopentheFishSelectdialog.
cMakethenecessaryadjustments.
dClickOKtosavethecurrentsettingsandclosethedialog.
68
343539/A
Page 71

Operationalprocedures
Howtoadjusttheshlengthforcorrectcalculations
TheES70measuresandrecordsthetargetstrength(TS).Theresearchersatthe
NorwegianInstituteforFisheryResearchhavecompiledasetofalgorithmsbasedon
extensivetestingwiththevariousspecies,andtheseareusedbytheES70tocalculatethe
lengthoftheshbasedonitstargetstrength.However,thetargetstrengthdiffersbetween
thevariousspecies.Ifyoundoutthatthelengthoftheshyouhavecaughtdiffers
fromtheinitialpresentation,youcanadjustthealgorithmsusedtocalculatethelength.
1ClicktheSetupiconundertheMainmenutoopentheSetupsub-menu.
2ClickFishSelecttoopentheFishSelectdialog.
3Makethenecessaryadjustments.
4ClickOKtosavethecurrentsettingsandclosethedialog.
Note
Payspecialattentiontomackerel,asthisshhasaverylowtargetstrength.Mackerel
canoftenbemistakenforsmallbait.Ifyoushformackerel,werecommendthatyou
use120kHzor200kHzechosounderfrequencies,asthemackerelshowslargestecho
strengthforthesefrequencies.
Howtomonitorthecurrentbiomass
ThebiomassispresentedusingtheSizeDistributioninformationpane,and/orenabling
thebiomasslineintheechogrampresentation.
→Biomasslineonpage42
→Biomassinformationpaneonpage44
Informationpane
1ClicktheSizeDistributioniconontheTitleBartoopentheinformationbar.
2Tochangethesizeoftheinformationpane,clickinthebottomrightcorner,hold
themousebuttondepressed,anddrag.
3Clickonthehistogramtitlestoseetherelevantpresentations.
Biomassline
1ClicktheActiveiconundertheMainmenutoopentheActivesub-menu.
343539/A
69
Page 72

SimradES70
2ClickEchogramtoopentheEchogramdialog.
3OntheLinestab,observethatthebiomasscanbeenabledordisabled,andthatyou
candeneascaleforit.
4Makethenecessaryadjustments.
5ClickOKtosavethecurrentsettingsandclosethedialog.
Gain
Theseproceduresexplainhowyoucanadjustthegainintheechosounder.Thiscontrols
how“powerful”theechoesareshownintheechogram.TheES70usestwoprinciples
forgain;signalamplicationandtimevariedgain(TVG).
•Howtoadjustthesignalgainonpage70
•HowtoadjusttheTVGgainonpage71
Relatedtopics
•AboutTVGgainonpage83
•Aboutdynamicrangeanddisplaypresentationonpage84
Howtoadjustthesignalgain
1ObservetheGainbuttonontheMainmenu.
2Method1:
aClick[+]or[-]tochoosegain.
3Method2:
aClickthemiddleoftheGainbutton,holdthemousebuttondepressed.
bdragthecursorleftorrighttoincreaseordecreasethegain.
4Method3canonlybeusedifyouhaveakeyboard:
aClickthemiddleoftheGainbuttontoopenthesub-menu.
bEntertherequestedgainvaluebetween20and120.
70
343539/A
Page 73

Operationalprocedures
HowtoadjusttheTVGgain
TVGmeansTimeV ariedGain.ThewholeideawithTVGisthatechoesfromshshall
havethesameecholevel(colour)independentoftheirdepths.TheES70hasaTVG
rangedownto15000meters,whichforallpracticalpurposesisunlimited.TheES70
doesnothaveaTVGcompensatedreceiverlikemostotherechosounders.Inthe
ES70theTVGisimplementedinsoftwareaftertheechoesfromthereceiver(s)have
beenconvertedtodigitalformat.Inordertomakethisworkthereceivermusthave
verylargedynamicrange.
TheTVGcanbechosenusingtheEchogramdialog,orwiththeTVGbuttononthe
Activesub-menu(describedhere).
→HowtoselectTVGgainonpage63
1ClicktheActiveiconundertheMainmenutoopentheActivesub-menu.
2LocatetheTVGbutton.
3Method1:
aClick[+]or[-]tochooseTVGsetting.
4Method2:
aClickthemiddleoftheTVGbuttontoopenthesub-menu.
bClickonanyTVGsettingtoselectit.
Powerandpulseduration
Theseproceduresexplainhowtocontroltheechosounder’soutputpowerand
transmissionpulseduration.
Relatedtopics
•Aboutoutputpoweronpage85
•Aboutpulsedurationonpage85
343539/A
71
Page 74
SimradES70
Howtochoosepassivemode
Inordertocheckhowmuchnoisetheechosounderisreceiving,setittopassivemode.
Thismeansthattheechosounderisnottransmittingsoundpulsesintothewater,it
isonly“listening”.
1ClicktheOperationiconundertheMainmenutoopentheOperationsub-menu.
2ClickNormalOperationtoopentheNormalOperationdialog.
3Fortherelevanttransducerchannel,setModetoPassive.
4ClickOKtosavethecurrentsettingsandclosethedialog.
Note
TheT estmodeisonlyprovidedfortroubleshootingandtestpurposes.
Howtochangetheoutputpower
Fromtimetotimeitmaybeusefultoreducetheechosounder’soutputpower.Areduced
poweroutputmayprovebenecialifyouarelookingforsingleshesorschoolsnearthe
surface,ifyouworkinveryshallowwaters,ifyouarebotheredwithfalseechoesdueto
reverberation,orifyousimplyfeelthattheechoesaretoostrong.
1ClicktheOperationiconundertheMainmenutoopentheOperationsub-menu.
2ClickNormalOperationtoopentheNormalOperationdialog.
3Fortherelevanttransducerchannel,setPower[W]torequestedvalue.
→Aboutoutputpoweronpage85
4ClickOKtosavethecurrentsettingsandclosethedialog.
Note
Ifyouincreasetheoutputpower ,makesurethatyoudonotchoosemorepowerthanyour
transducercanhandle.Withacorrectsetupwiththetransducerregisteredintheecho
soundersoftwareyouaresafeguardedagainstthis.However ,ifyouuseathirdparty
transducerthatisnotknownbytheechosoundersoftware,youmayinictpermanent
damageifyouincreasetheoutputtobeyondthetransducer’ scapabilities.
72
343539/A
Page 75
Operationalprocedures
Howtoadjustthepulseduration
Thelengthofyourtransmittedpulseisveryimportanttohowyoucandetectsh.A
shortpulsedurationgivesyouaveryneverticalresolution.Thisallowsyoutodetect
scatteredsh,andyoucanndthosethatmovenearthebottom.Alongpulseduration
throwsalotmoreenergyintothewater,andthedigitalltersusedbythereceiverare
narrower.TheselterswillreducetheES70’ssensitivityfornoise,butthelengthofthe
transmittedpulsewillgiveyoustrongerechoes.Withthelters,alongerpulseduration
willprovidelongerrange,butreducedverticalresolution.
1ClicktheOperationiconundertheMainmenutoopentheOperationsub-menu.
2ClickNormalOperationtoopentheNormalOperationdialog.
3Fortherelevanttransducerchannel,setPulseLengthtorequestedvalue.
Forgeneraluse,werecommendthatthepulsedurationissettoAuto.
→Aboutpulsedurationonpage85
4ClickOKtosavethecurrentsettingsandclosethedialog.
343539/A
73
Page 76

SimradES70
Themenusystem
MenunavigationemployedbyES70Fishndingechosoundersystemissimilartothe
otherKongsbergMaritimeapplicationswhichfollowthenewuserinterfacestandards
developedbyKongsbergMaritime.Themainmenuisbydefaultlocatedattherightside
ofthescreen.Bymeansofdedicatediconsatthebottomofthemainmenu,youcan
opentherelevantsub-menus.Menuchoicesshownindarkcoloursarenotavailablefor
thecurrentoperationoroperationalmode.
Topics
•Aboutmenusandbuttonsonpage74
•Buttontypesonpage75
•Mainmenuonpage77
•Operationmenuonpage78
•Displaymenuonpage79
•Setupmenuonpage80
•Activemenuonpage81
Aboutmenusandbuttons
TheoperationalnavigationontheES70isdesignedbymeansofmenusandcommand
buttons.
Menuhierarchy
1TheMainmenuprovidestheparametersmostfrequentlyusedduringnormal
operation.
2TheOperationmenucontrolsthemainoperationalparameters.
3TheDisplaymenucontrolsthevisualaspectsofthesystem,suchasparameters
relatedtothedisplaypresentation.
4TheSetupmenuallowsyoutocontrolthecongurationofthesignalprocessing,as
wellassysteminstallationandmaintenance,andtheinterfacestoperipheraldevices.
5TheActivemenuhasitscontentlinkedtothecurrentactiveitem(vieworobject).
Useittoaccessspecialfeaturesavailablefortheselecteditem.
74
343539/A
Page 77
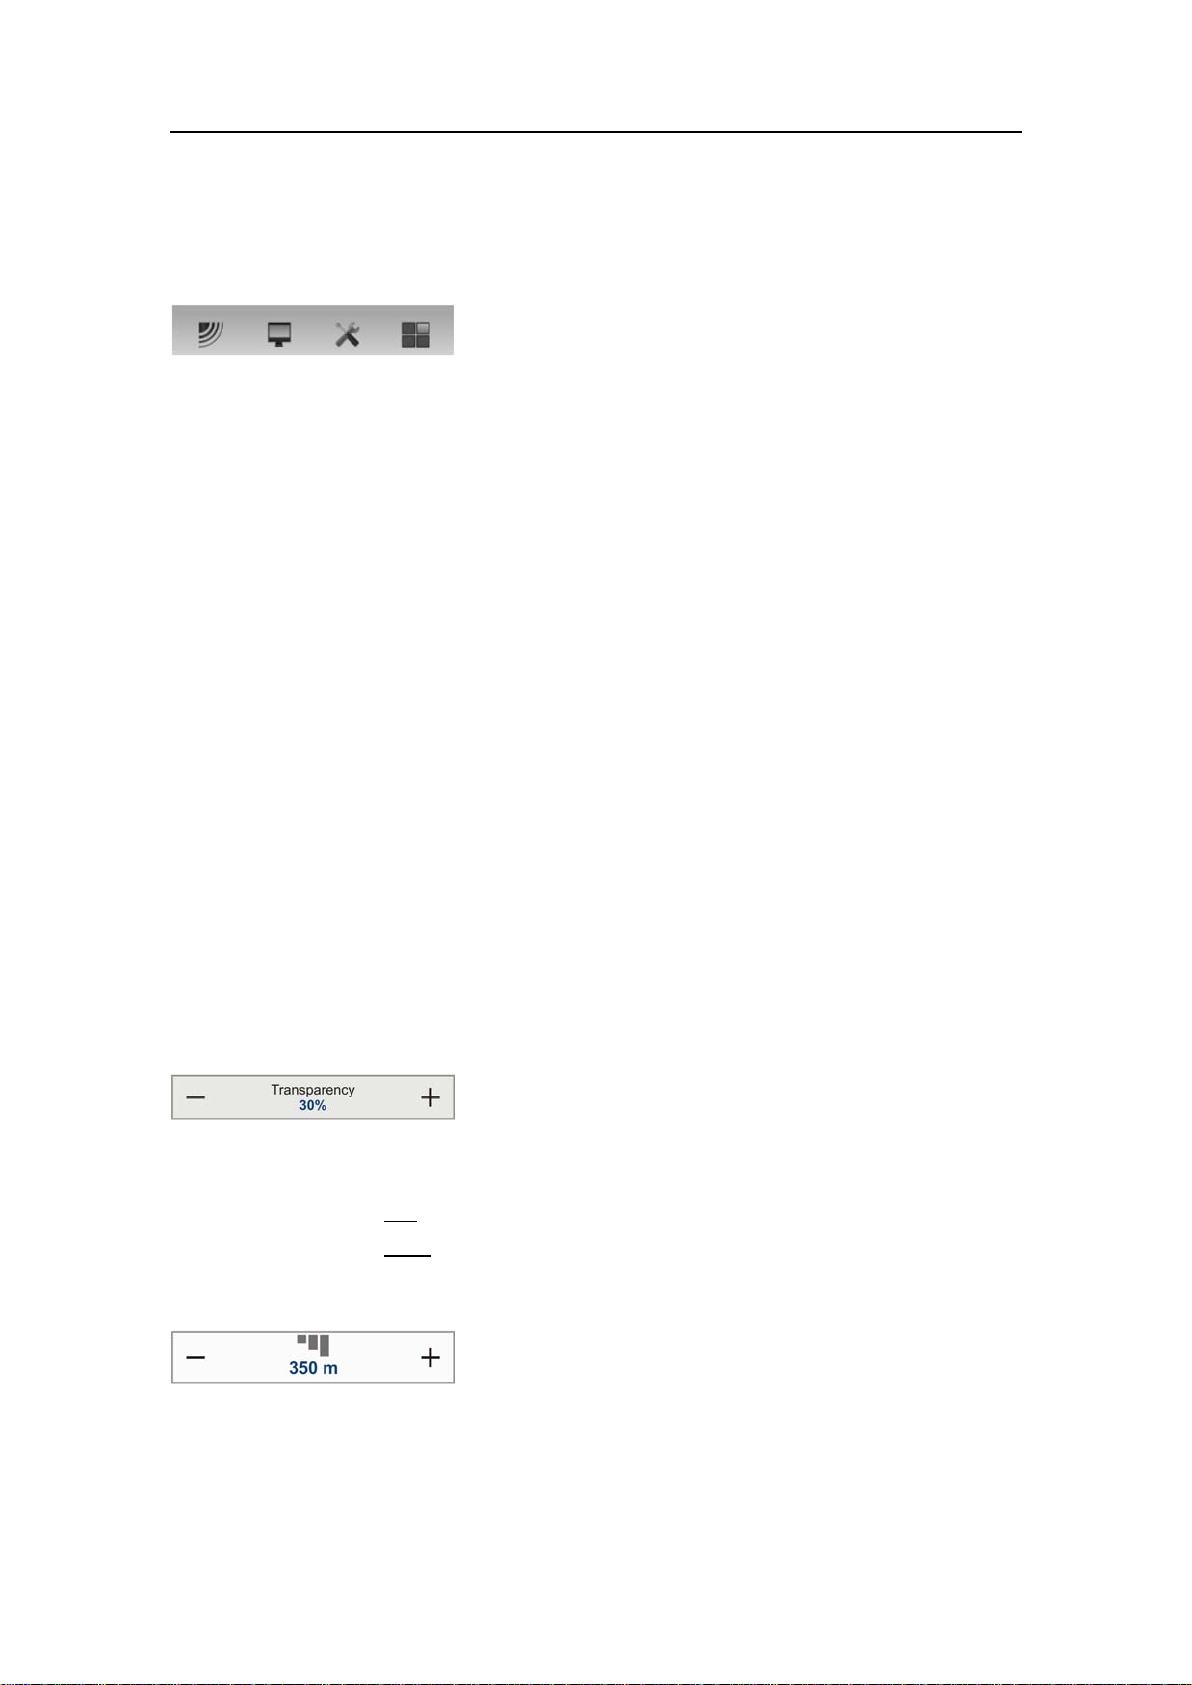
Figure9Thesub-menuicons
Sub-menuicons(fromleft)
•Operationmenu
•Displaymenu
•Setupmenu
•Activemenu
Buttontypes
Themenusystem
Eachmenucontainsseveralcommandbuttons.Eachbuttonshowsthefunctionofthe
button,someofthemalsodisplaysthecurrentparametersetting.Themajorityofthe
buttonsineachmenueldhavethesefunctions:
•Youcanincreaseanddecreaseparametervaluesbyclickingthebutton.
•Youcanchangeparametervaluesbymovingthecursorsideways.
•Youcanchangeparametervaluesbymeansofthescrollwheelonthemouseor
trackball.
•Youcanenterparametervaluesfromthekeyboard(ifyouhaveone).
•Youcanselectparametervaluefromthebutton’ssub-menu.
•Youcanopenadedicateddialog.
Howtoselectanumericalparameterusingthe+/-buttons
1Movethecursortoeithersideofthebutton,andobservethatthebackgroundcolour
changes.
aClickonthel
bClickonther
e f t sideofthebuttontodecreasethenumericalvalue.
i g h t sideofthebuttontoincreasethenumericalvalue.
Howtoselectanumericalparameterbymovingthecursorhorizontally
1Placethecursoronthemiddleofthebutton.
2Clickandholdtheleftmousebuttondepressed.
3Movethecursorhorizontally:lefttodecreasetheparametervalue,orrightto
increaseit.
343539/A
75
Page 78
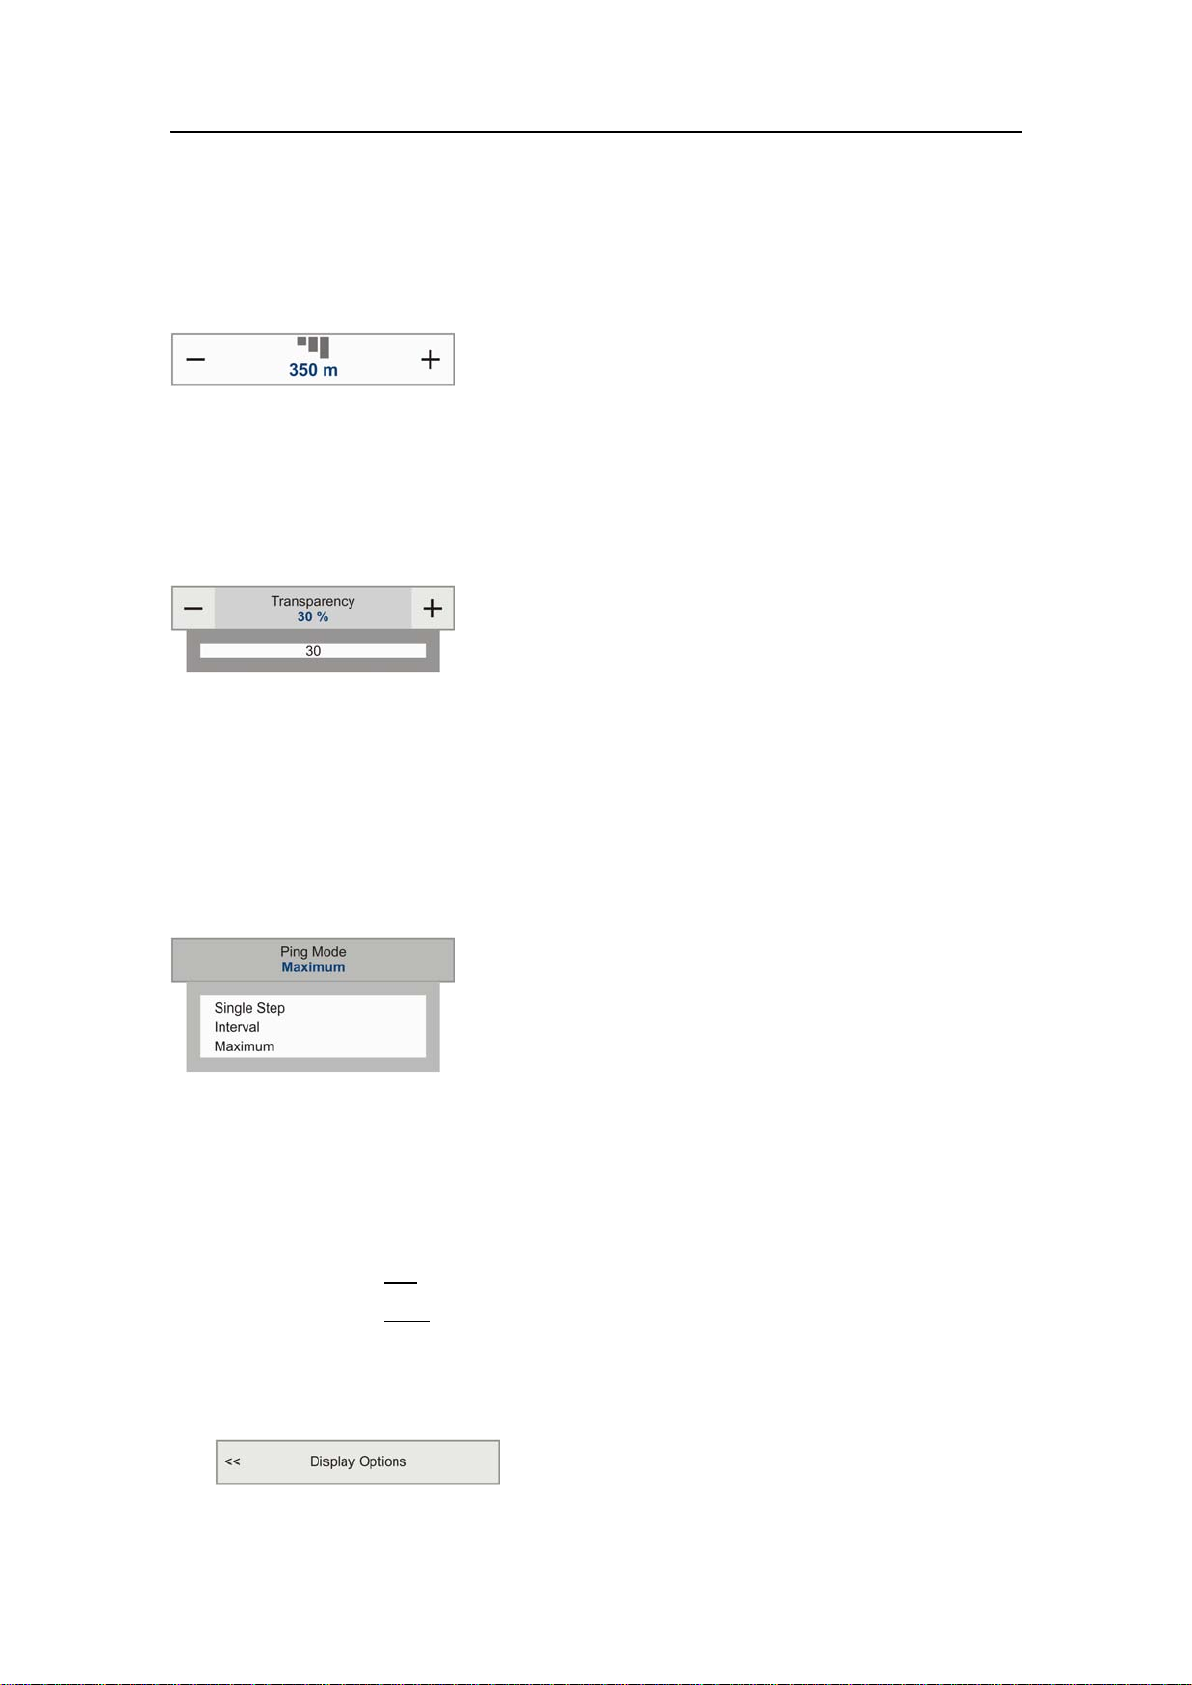
SimradES70
4Releasethemousebuttonwhentherequestedvalueisshown.
Howtoselectanumericalparameterbymeansofthescrollwheel
1Placethecursoronthemiddleofthebutton.
2Spinthescrollwheelineitherdirectiontoincreaseordecreasetheparametervalue.
3Releasethescrollwheelwhentherequestedvalueisshown.
Howtoselectanumericalparameterusingthekeyboard
1Clickthemiddlesectionofthebuttontoopenatexteld.
2Enterthenumericalvalueintothetexteld.
Ifthenumericalvalueexceedsthepermittedrangefortheparameter,theframein
thetexteldwillbered.Y ouwillthennotbeabletoenterthevalue.
3PresstheEnterkey.
Howtoselectaparameterusingasub-menu
1Clickthemiddlesectionofthebuttontoopenasub-menu,thenclicktherequested
parametervalue.
Thechosenvalueisapplied,andthesub-menuisautomaticallyclosed.
2Wheneverapplicable,youcanalsoaccessthesub-menubyclickingtheleftand
rightsideofthebutton,butthismethodwillnotshowyouthemenuchoices.
aClickonthel
e f t sideofthebuttontoselectalowersub-menuchoice.
bClickonther
i g h t sideofthebuttontoselectahighersub-menuchoice.
Howtoselectparametersusingadialog
1Clickanywhereonthebuttontoopenaseparatedialog.
76
343539/A
Page 79
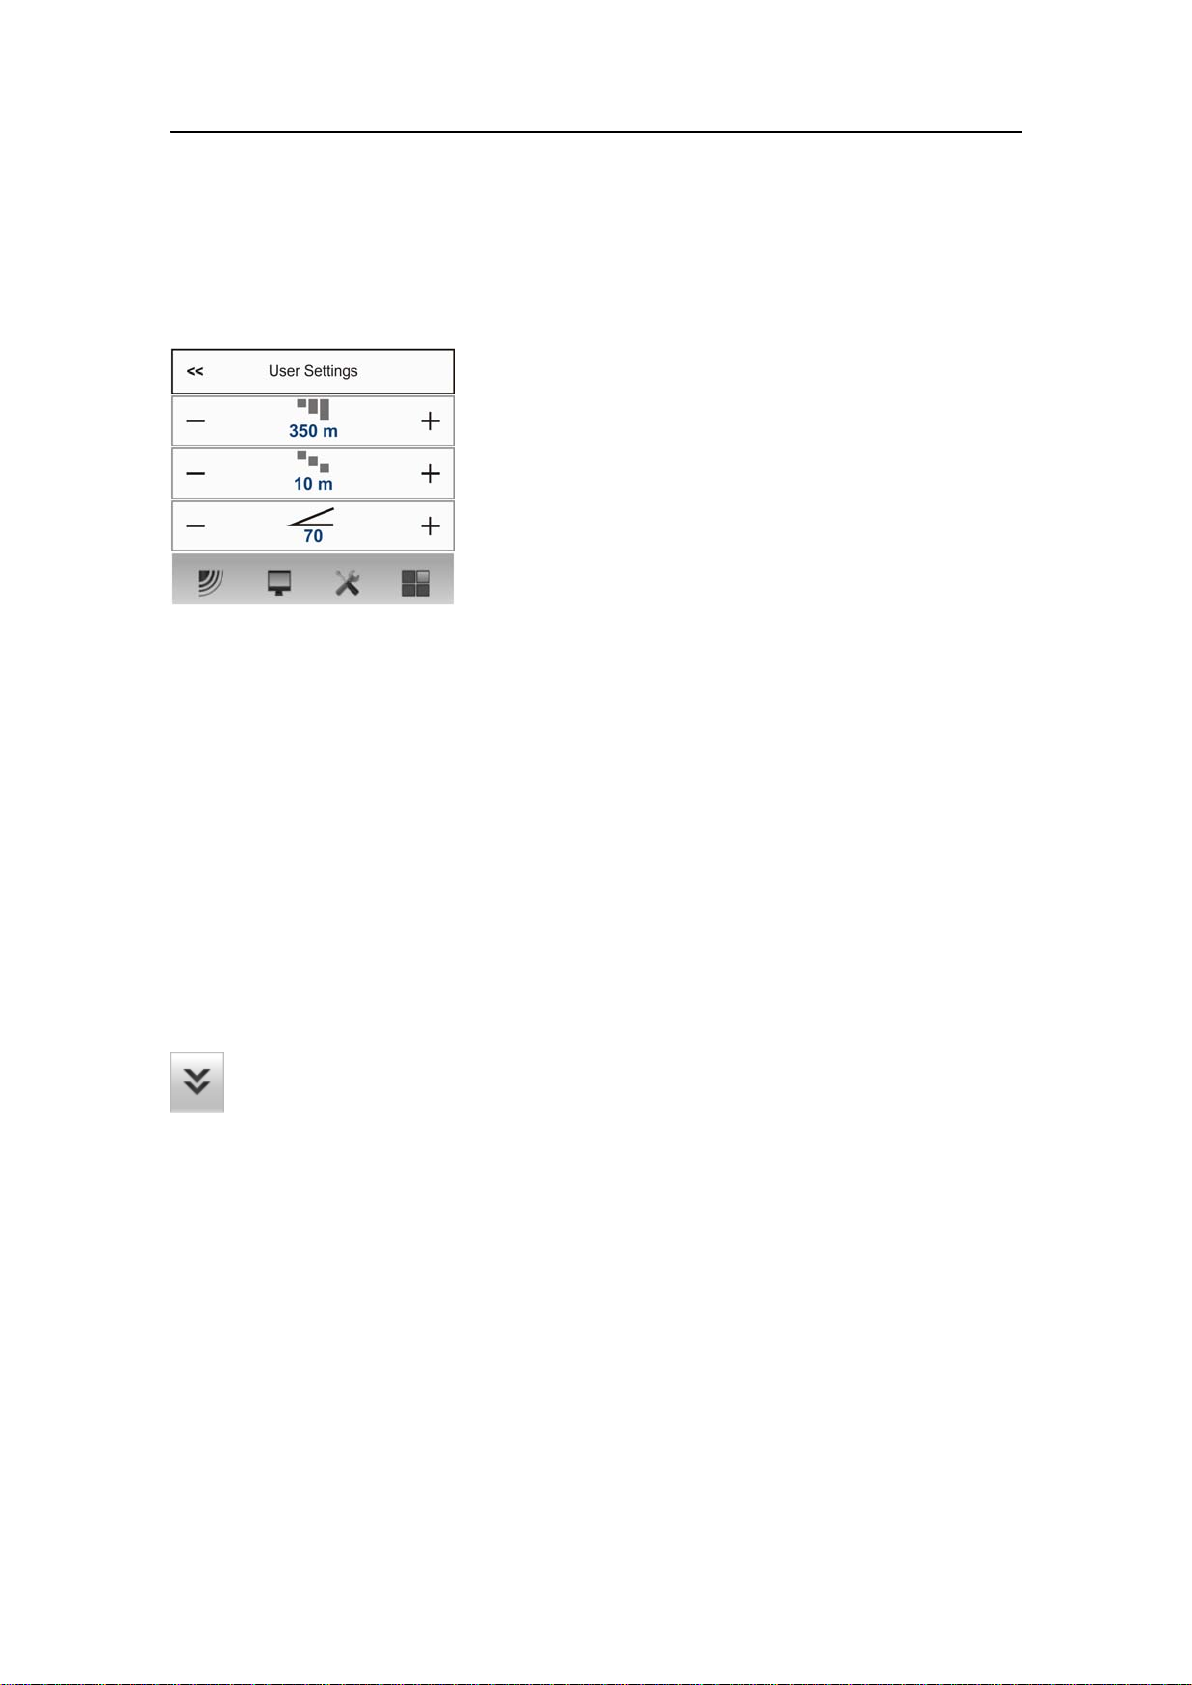
Mainmenu
ThefollowingfunctionsandparametersareavailablefromtheMainmenu.
•TheUserSettingsdialogallowsyoutosavethe
currentusersettings(parameterselections),andto
retrievepreviouslysavedfactoryorusersettings.
•TheRangefunctionallowsyoutospecifythevertical
rangeofthewatercolumncoveredbytheechogram.
Therangeisdenedfromaselectedstartrange,and
downtoavaluebeneaththecurrentbottomdepth.
Thevalueshownandselectedisbydefaultapplied
onlytothecurrentlyselectedechogram.
•StartRangeallowsyoutospecifythestartdepthof
ThebottomoftheMain
menuholdstheiconsforthe
sub-menus.Clickonone
oftheseiconstoopenthe
requestedsub-menu.Note
thatthemenusystemmaybe
hiddenfromviewifyouclick
theMenubuttonontheT ask
bar.
theechogram,thatisfromwhichdepthinthewater
columnthepresentationshallstart.Thevalueshown
andselectedisappliedtothecurrentlyselected
echogramtype.
•ThepurposeoftheGainfunctionistoadjustthe
echolevelintheechogrampresentations.
Themenusystem
Menubutton
ClickonceontheMenubuttontohidethemenu,andonemoretimetobringitback
again.Whenthemenuishidden,itwilltemporarilybeshownontheleftandrighthand
sideofthedisplayifyoumovethecursortothatposition.
343539/A
77
Page 80

SimradES70
Operationmenu
ThefollowingfunctionsandparametersareavailablefromtheOperationmenu.
•ThepurposeoftheOperationfunctionistocontrol
theoperationalmodeoftheES70.Y oucansetitto
Normal,ReplayorInactive.
•ThepurposeofthePingfunctionistoenableor
disabletheES70audiotransmissionsintothewater
(“pinging”).
•ThePingModefunctionisusedtocontrolhowoften
theES70shalltransmitsitsenergyintothewater.
•UsethePingIntervalfunctiontochoosethetime(in
HowtoopentheOperation
menu
1Clickonceontheicon
undertheMainmenuto
opentheOperationmenu
milliseconds)betweeneachtransmission(ping)when
PingModeissettoInterval.
•ThepurposeoftheNormalOperationdialogis
toprovideanoverviewofthecurrenttransceiver
parameters,andtoprovideyouwiththeabilityto
changethem.
2Clickonemoretime
ontheicontoclosethe
menu.
•TheRecordfunctionallowsyoutorecordthe
unprocessedtransducersignals,andsavethemonthe
internalharddisk.Thelescanlaterbecopiedor
movedtootherrecordablemedia.
78
343539/A
Page 81
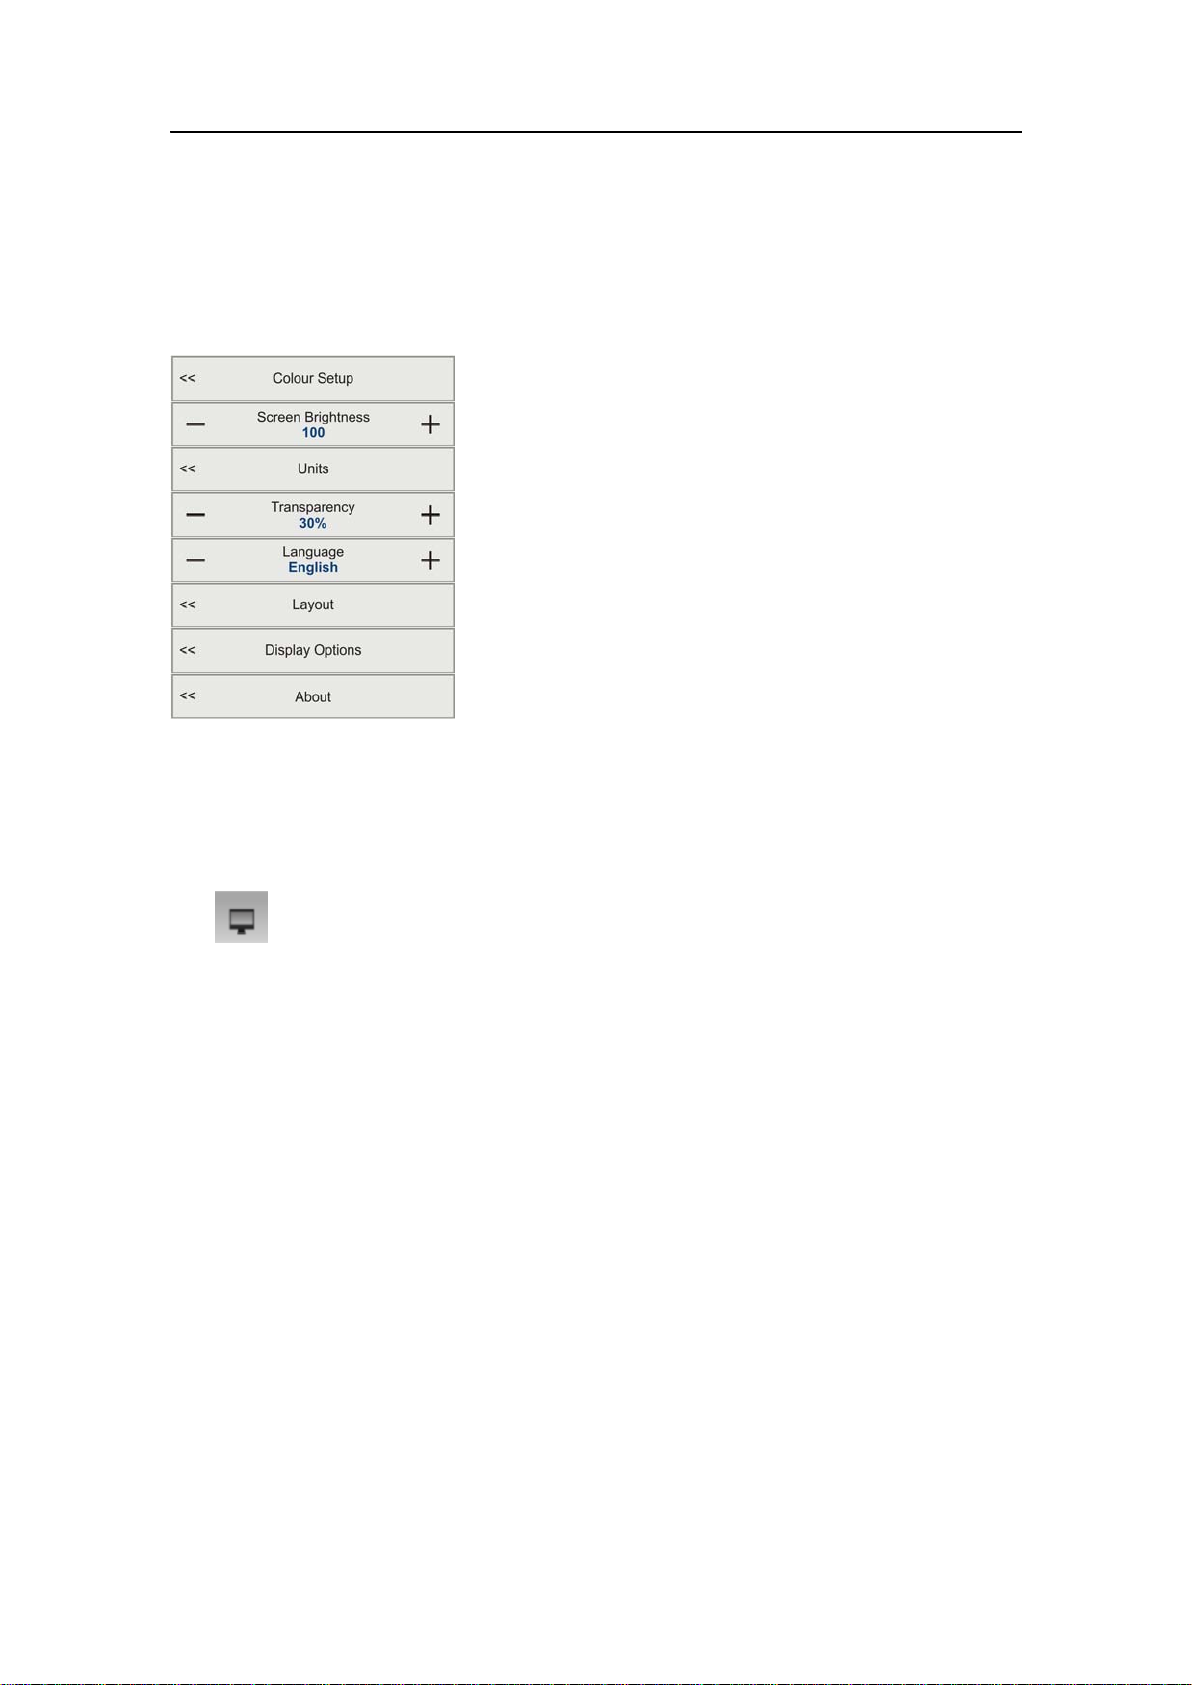
Displaymenu
ThefollowingfunctionsandparametersareavailablefromtheDisplaymenu.
•ThepurposeoftheColourSetupdialogistocontrol
thepresentationcoloursusedbytheES70.
•ThepurposeoftheScreenBrightnessfunctionis
toadjusttheintensityofthelightgivenoffbythe
display.
•ThepurposeoftheUnitsdialogistocontroltheunit
ofmeasurementsusedbytheES70.
•ThepurposeoftheT ransparencyfunctionisto
adjusthowmuchyouareabletoseethroughthe
informationpanes.
•ThepurposeoftheLanguagefunctionistoselectthe
languagetobeusedonthemenus.
Themenusystem
HowtoopentheDisplay
menu
1Clickonceontheicon
undertheMainmenuto
opentheDisplaymenu
2Clickonemoretime
ontheicontoclosethe
menu.
•ThepurposeoftheLayoutdialogistoarrangethe
locationoftheechogramsonthepresentation,orto
temporarilyhideanyofthem.
•ThepurposeoftheDisplayOptionsdialogisto
controlthelocationofthemenu,whichinformation
tobeprovidedonthetitlebarandthetaskbar,and
whichtooltipstodisplay.
•ThepurposeoftheAboutdialogisshowthecurrent
softwareversion.
343539/A
79
Page 82

SimradES70
Setupmenu
ThefollowingfunctionsandparametersareavailablefromtheSetupmenu.
•ThepurposeoftheSynchronizationdialogistosetup
theES70tooperatealone,orasamasterorslavein
asynchronizedsystem.Synchronizationisrequired
inordertoavoidinterferenceiftheES70isused
simultaneouslywithotherhydroacousticinstruments
withinthesamefrequencyrange.
•ThepurposeoftheAnnotationdialogistoallow
youtoentercommentsandannotationsintothe
echograms.
•TheparametersintheFishSelectdialogallowsyou
tomodifytheshsizedistributionmanually.
•TheNavigationdialogcontrolshowtheES70
receivesinformationfromexternalsensors.
HowtoopentheSetup
menu
1Clickonceontheicon
undertheMainmenuto
opentheSetupmenu
•TheTrawldialogallowsyoutoenterthemain
parametersrelatedtothetrawl.Trawlinformationis
usedfordisplayofupperandlowertrawllineinthe
echogram.Allreceivedspeeddataarestoredtole
whenrecordingofrawdatatoleisenabled.
2Clickonemoretime
ontheicontoclosethe
menu.
•ThepurposeoftheEthernetOutputdialogisdene
communicationparametersfortheEK500datagram
outputontheEthernetport.
•TheDepthOutputdialogisusedtosetupthe
outputofdepthdatafromtheES70toadedicated
communicationportonaspeciedformat.
•TheInstallationbuttonopensasub-menuwithfour
choices.Y oucandeneenvironmentparameters
relatedtotheseaconditions,setuptheinputsand
outputsfromantoperipheraldevices,setupthe
transceiver,andadministratethesoftwarelicenses.
80
343539/A
Page 83

Activemenu
ThefollowingfunctionsandparametersareavailablefromtheActivemenu.
•TheEchogramdialogallowsyoutosetupthe
parameterscontrollingtheechogrampresentation.
Thethreetabscontrolthehorizontallines,the
echogramtypewithappliedTVG,andhowfastthe
echogrammovesacrossthedisplay.
•ThepurposeoftheTVGbuttonistoallowyouto
changetheTVGcurveforthereceivedechoes.
•ThePing-PingFilterreducesunwantednoiseand
echoesfromtheechogrampresentation.
Themenusystem
HowtoopentheActive
menu
1Clickonceontheicon
undertheMainmenuto
opentheActivemenu
2Clickonemoretime
ontheicontoclosethe
menu.
•TheBottomGainsettingcontrolsthegainb
detectedbottomdepth.
•TheSizeDistributiondialogallowsyoutosetupthe
parametersforthehistogrampresentedintheSize
Distributioninformationpane.
•ThepurposeoftheBottomDetectordialogisusedto
denetheupperandlowerdepthlimitsmostlikelyto
beusedduringtheES70operation.
e l o w the
343539/A
81
Page 84

SimradES70
Echosoundertheory
Whenyouuseanechosoundertherearesomebasicknowledgethatyoumayndit
usefultopossess.
Topics
•Aboutbiomassonpage82
•AboutTVGgainonpage83
•Aboutdynamicrangeanddisplaypresentationonpage84
•Aboutoutputpoweronpage85
•Aboutpulsedurationonpage85
•Aboutbottomslopesonpage87
•Aboutrangeselectiononpage87
•Aboutbottomlinesonpage89
Aboutbiomass
ProvidedthatyouuseanES70withasplitbeamtransducer,orhaveavalidbiomass
licenseonasinglebeamtransceiver,youwillhaveaccesstotheBiomassinformation
pane.
Thisbiomassvalueisanindicatortohowmuchshyoucurrentlyhaveinthecurrent
echogram,orinthezoomedarea.Everysingleshwillemitanecho,andthesum
ofalltheseregisteredechoesarepresentedasanumber.Smallerorganismssuchas
planktonwillalsoemitechoes,butthesearesoweakthattheywillhardlyinuenceon
thetotalbiomass.
ES70recordsallthetargetsfromthesmallestplanktontothelargestwhale,andprovides
thesendingsasanumber.Forallpracticalpurposesthisnumberwillprovideyouwith
informationabouttheshabundancetoallowyoutodecideifitpaysofftostartshing.
Youmustalsoconsiderifthisnumberisaresultoflargeamountsofplanktonorbait,or
ifthereisrealshbelowthekeel.Thenumberprovidedtodisplayshabundanceis
relative,andaftersomeuseyourexperiencewillbeavaluablefactorwhenthedecision
ismade.
82
343539/A
Page 85

Echosoundertheory
Thebiomassvalueisalsousedbytheresearchestocalculatehowmuchshthereisin
theocean.Thenalresultisbyfarthevalueprovidedsolelybytheechosounder,as
thenumbersaresubjecttonumerouscalculationsandadjustmentsmadebyexperienced
scientists.Othermeanstoestablishthenalresultaretrawlingandcatchdatafromthe
sherycommunity.Youmayhaveseenthatthisbiomassvaluecanbeverylarge.
Note
IfyouhaveotherechosoundersorsonarrunningasynchronouswiththeES70,theES70
willalsomeasurethetransmitpulsefromthesecondarysystem.Thatwilleffectively
ruinthebiomasscalculations.YoucanremovetheinterferenceusingthePingFilter
functionintheEchogramdialog,buttheES70receiverwillstillpickupthetransmit
pulseandimplementitinthecalculations.Afullsynchronizationofthevariousacoustic
instrumentsisrequired.Ifyourownvesselproducesexcessivenoisethiswillalsobe
takenintothebiomasscalculationsandprovideyouwithinaccurateinformation.
Relatedtopics
•Biomassinformationpaneonpage44
AboutTVGgain
TVGmeansTimeV ariedGain.WhenTVGisusedinanechosounder,wealsosome
timesrefertoitasdepthvariablegain.
Becausethestrengthoftheechoeswillbecomeweakerwithincreasingdepth,theecho
sounderwillautomaticallyamplifythedeepestechoesmorethantheshallowerechoes.
Infact,thegainwillincreaseproportionaltohowlongtheechosounder“waits”forthe
echoes.WhenyouchoosetheTVGsettingyoucaneitherswitchitoff(whichwedoNOT
recommended),oryoucanchoosesettingsSchoolGain(20logR)orFishGain(40logR).
Thevarioussettingscontrolthegainalgorithms,howmuchgaintobeappliedwhen
thedepthincreases.WhenyouchoosetheFishGain(40logR)setting,youwillapply
moregainthanifyouchoosetheSchoolGain(20logR)setting.Thisissimplybecause
individualshesemitsmallerechoesthanaschool,andthismakesthemmoredifcultto
detect.IntheequationthecharacterRmeans“Range”.
343539/A
83
Page 86

SimradES70
Theillustrationshowshowthegainclose
tothebottom(B)islargerthanjustbelow
thetransducer(A).Theechoesfromthesh
closetothebottomwillthenbeshownwith
thesamestrengthasechoesfrompelagic
TheleftvesselusestheSchoolGain(20log
R)setting.Thiswillcausesingleshestobe
shownsmallerandsmallerwithincreasing
depth,eventhoughtheymaybeofidentical
size.TherightvesselusestheFishGain(40
logR)setting,andthatwillmakeidentical
sizedshtoappearwithidenticalsize
independentofthesize.
Whenyouarelookingforschoolsthesewilllltheentirebeam,justasthebottom
normallydoes.Alotofgainisthennotnecessary.TheSchoolGain(20logR)setting
willprovideanacceptableechostrength.WhenyouusetheFishGain(40logR)setting
youwillseethatthebottomechoisverystrong.Thepresentationwillusestronger
colourswithincreasingdepth.
Aboutdynamicrangeanddisplay presentation
TheES70echosounderhasadynamicrangeof140dB.Thismeansthatthesoundercan
receivebothverystrongandveryweakechoes.Actually,theES70willdetectechoes
fromplanktontowhales,bottomonalldepths,andpresenttheinformationfreefrom
distortion.Asacomparison,ouroldechosoundersES380andET100hadadynamic
rangeofapproximately65dB.
Naturally,wecannotpresentalltheseechoesonthedisplaysimultaneously,asthis
wouldcreateamessofcolours.
When12coloursareused,wecreatea36dBsectionandgiveeachcoloura3dB
strength.Everycolour(3dB)therepresentad
12colours(A)thiswillbea36dBcolourrangefromgreytobrown.Greyisusedfor
theweakestechoes,whilethestrongestechoesarebrown.Allechoesstrongerthan
brownwillstillbebrown,whileechoesweakerthangreywillnotbeshown.Theold
papersoundershadadynamicrangeof12dBintheirprintoutsusingthe“colours”
fromlightgreytoblack.ThedynamicrangeintheES70colourpresentationisthusa
lotlarger;24dBor250times.
o u b l i n g oftheechostrength.Withthe
84
343539/A
Page 87

Echosoundertheory
Aboutoutputpower
Theechosounder’stransducerconvertstheelectricalinputpowertoacousticenergy
transmittedintothewater.InthemajorityofthetransducersmanufacturedbySimrad
thetransducer’spowerefciencyisbetween50and75%.Thismeansthatbetween50
and75%oftheinputpoweristransmittedasacousticenergy.Transducersfromother
manufacturersmayhaveaslowas15%powerefciency.Naturally ,itisveryimportant
thatyoucheckthisparameterwhenyouwishtopurchaseatransducer.
Theechosounder’soutputpowerisameasurementonhowmuchcurrenttheamplier
cansenddowntothetransducer.Themaximumpowerislimitedbythetransduceryou
have,andhowmuchpoweritmayacceptfromthetransmitterforconversiontoacoustic
energy.Ifyousendtoomuchpowerintothetransducer,youmayinictpermanent
andunrepairabledamage.
Thesourcelevel(SL)isameasurementonhowmuchacousticenergythatisinfactsent
outbythetransducer,howhigh“volume”itwillemit.Thesourcelevelismeasuredas
“soundpressure”onemeterbelowthetransducerface,anditisgivenidBre.1µPa.
Inordertoknowhowmuchpoweryoucanuseyoumustknowwhatkindoftransducer
youareusing.ProvidedthattheechosounderhasbeeninstalledwithaSimrad
transducer,andyouknowwhattypeitis,thisisnoproblem.Allnecessaryparameters
aboutthetransducerarethenknownbytheechosounder,andthesoftwareinthesounder
willensurethatyoudonotoutputtoomuchpower.Ifyouuseathirdpartytransducer
youmustmanuallycheckthattheoutputpowerdoesnotexceedthepowerrating.
Ifthetransducerreceivestoomuchpowerfromtheechosounder,itwillalsocavitate.
Thisisaphysicalphenomenoncausingtheappearanceofgasbubblesimmediately
belowthetransducerface.Whenthishappenshardlyanyenergyissentintothewater.
Thecavitationdependsonthepowerappliedandthephysicalsizeofthetransducerface.
Transducerswithalargefacecanacceptmorepower.
Relatedtopics
•Howtochangetheoutputpoweronpage72
Aboutpulseduration
Theechosounder’spulsedurationisameasurementforh
o w l o n g theacousticpulselasts.
Thepulsedurationcanbeadjustedaccordingtothecurrentdepthandwhatkindofsh
youarelookingfor.Thedeeperyouwishtosee,thelongerpulsedurationshouldbe
used.RememberthatinES70echosounder,thepulsedurationandthebandwidthis
mutuallydependant.
•Longpulse-lotsofacousticenergy-narrowbandwidth-lesssensitivefornoise
fromownvesselandenvironment
•Shortpulse-lessacousticenergy-widebandwidth-moresensitivefornoisefrom
ownvesselandenvironment
343539/A
85
Page 88

SimradES70
Apulsedurationof1mScovers1,5meters
inthewater,andthiscorrespondstoatarget
separationofapproximately75cm.Thisisa
typicalpulsedurationthatyoumaywelluse
downto250to300meters.Ifyouworkin
deeperwatersusealongerpulseduration,if
itisshallower,useashorterpulseduration.
Tryoutdifferentvalues,andseekoutthe
pulsedurationthatprovidesyouwiththe
clearestechopresentationwithminimum
noise,butwithmaximumshdetectionand
separation.
Theleftvesselusesalongpulseduration(C).Asyoucansee,thiscausestheechoes
fromthetwoshes(A)and(B)tomerge.Therightvesselusesashorterpulseduration,
andthetwosheswillthenappearastwoseparateechoesontheechogram.Thus,
shortpulseswillprovidethebestresolutionandseparationofindividualshes,butthe
echosounderismoresensitivetonoise.
Thespeedofsoundinwaterisapproximately1500m/s.Thelengthofa1mSsound
pulsewillthusbeapproximately1,5meter.Withtheechosounderyoucanthenadjust
thesoundpulsefrom7,5cm(0.05mS)to24m(16mS)dependingoftheoperational
frequency.Thisisanimportantfactorfortheappearanceofsingleshes.
•Whentheverticaldistancebetweentoshes,orthedistancebetweenashandthe
bottom,ismorethanthedistancecoveredbyahalfpulseduration,theechoeswillbe
presentedastwoseparateechoes.Theshabovethebottomwillbeidentied.
•Ifthedistancebetweentwoindividualshes,orthedistancebetweenasinglesh
andthebottom,islessthanthedistancecoveredbyahalfpulseduration,theecho
willbepresentedasoneecho.Theechofromtheshclosetothebottomwillbe
mergedwiththebottomecho.
Alloperationalfrequencieshavedifferentpulsedurations.Thedifferencebetweenfor
examplea50kHzanda38kHztransducerishowevernotlarge:
•A50kHztransducercanbeusedwithpulsedurationsfrom0,12mSto2mS
•A38kHztransducercanbeusedwithpulsedurationsfrom0,26mSto4mS.
Basically,boththesefrequencieswillprovideyouwiththesamedetectionability.A
50kHztransducermayprovidebetterresolutioninshallowwaters,whilethe38kHz
transducermayprovidelongerrangeondeeperwaters.Onthe38kHztransducerthe
shortestpulsedurationis0,26mS.Thisresultsina40cmsoundpulseanda20cm
shseparation.
Relatedtopics
•Howtoadjustthepulsedurationonpage73
86
343539/A
Page 89

Aboutbottomslopes
“Bottomslopes”isawellknownphenomenonwithechosounders.
Theedgeofthebeam(A)hitsthebottom
rst,andstartstogiveanecho.Thebottom
detectorintheechosoundermeasuresthe
strongestecho,detectswhatitthinksisthe
bottom,andstartsthewhiteline(C).The
areaabovethebottomdetection(B)willbe
maskedoff,andeventhoughitmaycontain
shthesewillnotbevisiblebecausethe
echofromthebottomisstrongerthanthose
fromthesh.Theestimateddepth(C)will
beshown.
Echosoundertheory
Ontheechosounderthephenomenonwillappearbycausingthebottomline(E)tobe
distorted.Alltheechoesabovethewhitelineherearereallyapartofthebottom.
TominimizethisphenomenonontheES70youcanopentheBottomDetectordialogby
right-clickingthedepthpresentation,andthenchangethesettingforBackstepMinimum
Level.Byincreasingthenumber(morenegative!)thebottomdetectorwillbecomemore
sensitive,andthebottomwillbedetectedearlier.Ontheechogramthewhitelinewill
“climb”uptheslope.Makesurethatyoudonotincreasethesensitivitytoomuch,asthis
willhaveaneffectontheshdetectiononaatbottom.Ourexperienceshowthata
sensitivityofapproximately-75dBcanbeusedsafely.
Anothermethodforminimizingthisphenomenonistouseatransducerwithnarrow
beam,ortoincreasethepulseduration.
Aboutrangeselection
Foreveryfrequency(channel)youwishtopresentontheechosounderdisplay,youare
providedwithtwoechograms.
343539/A
87
Page 90
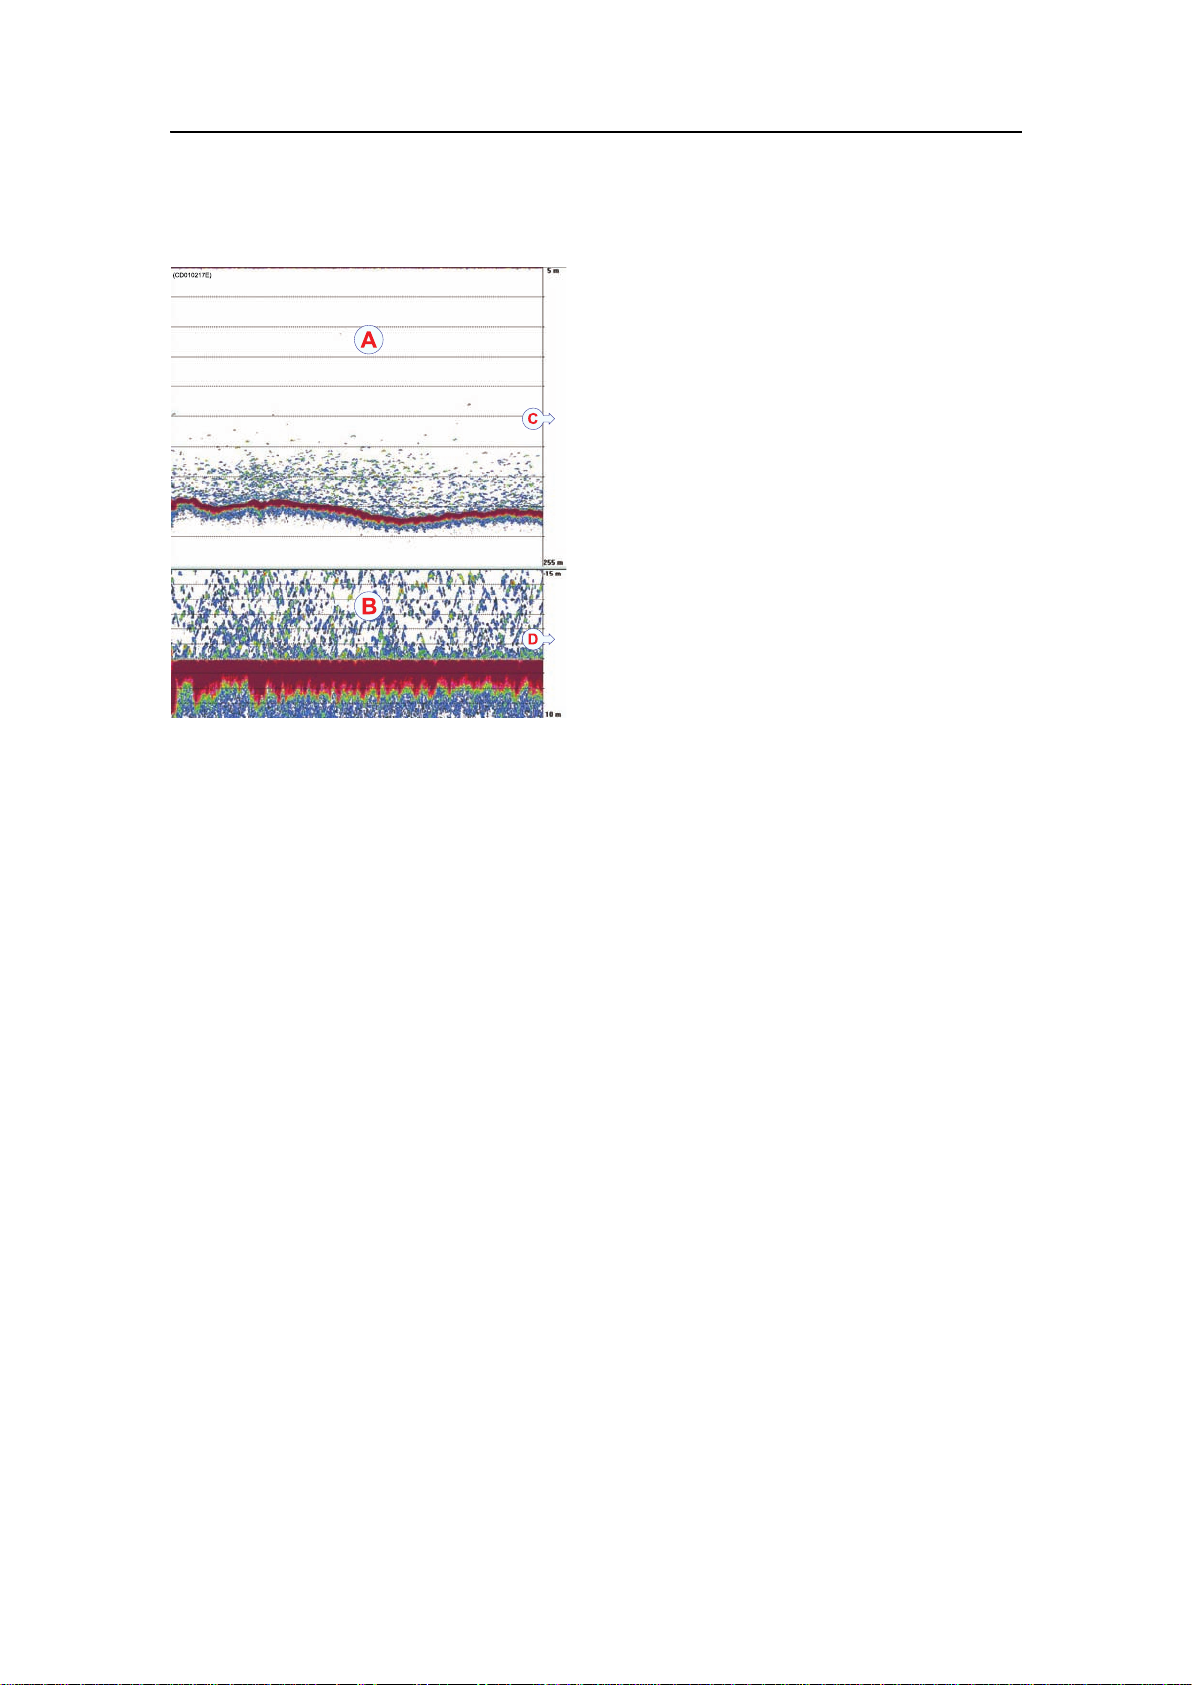
SimradES70
AUpperechogram(surfacerelated)
BLowerechogram(bottomrelated)
CScopeviewforupperechogram
DScopeviewforlowerechogram
Normally,theupperechogramwillshow
theentiredepthrangefromtheseasurface
anddowntothebottom,whilethelower
echogramshowsabottomexpansion.This
isamagnicationoftheareajustaboveand
belowthebottom.
Youarefreetochooseanypresentationyou
wantinanyoftheechograms.
Todothis,opentheEchogramdialogonthe
Activemenu.
Upperechogram:Surface
Whenyouneedtoestablishaverticaldepthrange,whynotlettheechosounderchooseit
foryou.Onthemainmenu,setRangetoAuto.
Youcanalsodeneyourowndepthrange.Toestablishadepthrangefromthesurface
anddowntothebottom,setRangetoasuitabledepth,andStartRangeto0(zero)meters.
Aphasedareamayalsobeestablished.Thisisusedwhenyouwishtoconcentrateon
acertainandlimiteddepthrangeIfyouforexamplendsaschoolofsh150meters
belowthesurface,youcansetuptheechosoundertoshowthisschoolwithoutalso
providedinformationfromthewatercolumnoverandunderit.Tosetthisup,setStart
Rangetoafewmetersabovetheschool,andRangetoafewmetersbelowit.
Ifyouarebotheredbyinterferencefromasonarusingthesameoperationalfrequency,
trytosetStartRangeto10to20meters.Youwillthenavoidthenoisewhenboth
systemstransmitsimultaneously.
Lowerechogram:Bottomexpansion
Themajorityofourusersprefertousethelowerechogram(B)forbottomexpansion.
Thisisthedefaultsetting.
Whenyouusebottomexpansion,thewatersurfaceisnotthereferenceanylonger,but
thebottomis.Itisalways0.Thatmeansthatthebottominthisechogramwillalwaysbe
at,eventhoughitmayvaryintheupperechogram.Tochooseaverticaldepthrangefor
thebottomexpansion,setRangetoapositivevalue.Thisisthetotalverticalrangeof
88
343539/A
Page 91

Echosoundertheory
theechogram.Then,setStartRangetoanegativevalue.Thisistheechogram’sstart
heightabovethebottom.Inthisechogrampositivedepthisbelowthebottom,while
negativedepthisabove.
Typicalsettingsmaybe:
•Range=15m
•Startrange=–10m
Thisprovidesyouwitha15metershighphasedareastartingat10metersabovethe
bottomto5metersbelowit.
Aboutbottomlines
Itisveryimportantthattheechosounderdetectsandrecognizesthebottom.Thisis
becausethebottomisusedasreferenceforallmeasurementsandpresentations.and
alsoforeveryonelookingforbottomsh.
Whenyouwishtostudythebottomexpansionyoumayaddanextrabottomlineora
whiteline.
Toinvestigatethebottomhardness,youcanenablethehardnessline.Thishardnessline
cannotbeusedsimultaneouslywiththewhiteline.
Relatedtopics
•Lines,markersandannotationsintheechogramsonpage40
•Howtoeasieridentifythebottomonpage65
Bottomline
Thebottomlineisadarklinethatisaddedjustabovethebottomtomakeiteasiertosee.
ThebottomlineisenabledintheEchogramdialog.
ABottomlineandwhiteline
switchedoff
BBottomlineisactivated
CWhitelineisactivated
343539/A
89
Page 92

SimradES70
Whiteline
Thewhitelineisanextrathickwhitelinethatisaddedtojustbelowthebottom.The
whitelinewillnotremoveinformation,itwillsimply“push”theinformationfurther
downinordertomakethebottomeasiertosee.
Mostusersnditpracticaltousethewhitelineallthetime.Iftheechosoundershould
loosebottomtrack–forexampleduetotheappearanceofalargeschoolofsh–you
willimmediatelyseethisonthewhiteline.
ThewhitelineisenabledintheEchogramdialog.
Hardnessline
Thehardnesslineisanextrathickcolourcodedlinethatisaddedtojustbelowthe
bottom.Thelinewillnotremoveinformation,itwillsimply“push”theinformation
furtherdowninordertomakethebottomeasiertosee.
Thecolourcodingcontainstheinformationabout
thebottomhardness.Thecolourscaleusedisthe
sameasintheBottomHardnessinformationpane.
→BottomHardnessinformationpaneonpage45
ThewhitelineisenabledintheEchogramdialog.
90
343539/A
Page 93

Index
Index
A
About
bottomline,89
bottomslopes,87
depthvariablegain,83
displaypresentation,84
dynamicrange,84
ES70,9
outputpower,85
pelagicechogram,87
pulseduration,85
TVG,83
whiteline,89
Activemenu
options,81
B
Basic
use,82
Biomass
description,82
show,69
Bottomecho
adjustlevel,68
Bottomexpansion
description,88
Bottomline
description,89
procedure,65
Bottomslopes
description,87
Boundarylines
change,60
Buttons
’Activemenu,81
Displaymenu,79
Mainmenu,77
Operationmenu,78
Setupmenu,80
C
Choices
Activemenu,81
Displaymenu,79
Mainmenu,77
Operationmenu,78
Setupmenu,80
Colour
threshold,18,46,61
Colourpalette
change,60
Colourscale
change,60
Colours
presentation,61
Commands
Activemenu,81
Displaymenu,79
Mainmenu,77
Operationmenu,78
Setupmenu,80
Computermouse
description,15
Controlwheel
mouse,15
trackball,15
Copy
savedechogram,56
D
Delete
savedechogram,56
Depthpresentation
changefontsize,60
Depthvariablegain
description,83
Description
biomass,82
bottomexpansion,88
bottomline,89
bottomslopes,87
displaypresentation,84
dynamicrange,84
echogrampresentation,22
shabundance,82
mainmenu,24
outputpower,85
pulseduration,85
Rangeselection,87
trackball,15
TVG,83
whiteline,89
Dialog
Layout,60
Display
changeeldsize,60
Displayelds
changesize,60
Displaylayout
select,60
Displaymenu
options,79
Displaypresentation
description,84
Displayviews,28
Distancemarker
echogram,43
Dynamicrange
description,84
E
Echogram
bottom,87
colourpalette,60
colourscale,60
colours,61
description,22
distancemarker,43
pelagic,87
presentationsetup,62
retrieve,56
store,56
storesequence,57
timemarker,43
Echogramimage
delete,56
Echogramsequence
playback,59
F
Filter
interference
reduce,64
vesselnoise
reduce,64
Fishabundance
description,82
Fishsize
adjust,69
Fontsize
depthpresentation,60
G
Gain
adjustsignal,70
adjustTVG,71
setup,63
GainTVG
description,83
setup,63
Gettingstarted,13
H
History
procedure,56
Horizontal
markerlines
setup,62
Statusbar,51
343539/A
91
Page 94

SimradES70
Howto
adjustbottomecholevel,68
adjustsignalgain,70
adjustTVGgain,71
bottomlinesetup,65
changedepth
presentationfont,60
changeechogramcolour
palette,60
changeechogramcolour
scale,60
changeechogram
colours,61
changepingrate,54
changepulseduration,73
changesizeofdisplay
eld,60
denemaximumdepth,67
deneminimumdepth,67
echogram
setup,62
shsizeadjustment,69
interference
reduce,64
markerlines
setup,62
playback
echogramsequence,59
selectpassivemode,72
selectpresentation
layout,60
selectverticalrange,65–66
setoutputpower,72
showbiomass,69
showshsize
distribution,68
storechogram
sequences,57
storeechogram,56
trackball,15
TVGgain
setup,63
usethemenubuttons,
25,75
vesselnoise
reduce,64
I
Important
ifsomethingbreaks
down,9
information,9
switchingofftheecho
sounder,9
whendocking,9
whentheechosounder
isnotused,9
Interference
reduce,64
Introduction,7
K
Kildenivå
description,85
L
Layout
dialog,60
presentation
select,60
Longpulse
procedure,73
M
Mainmenu
description,24
options,77
Markerlines
horisontal,62
vertical,63
Maximumdepth
dene,67
Menu
description,24
Menubuttons
howtouse,25,75
Menusystem,74
description,24
Minimumdepth
dene,67
Mode
passive,72
Mouse
description,15
N
Numberofcolours
change,61
O
Off
procedure,14
On
procedure,13
OpenImageFolder,56
Operation
Pingrate,54
Operationmenu
options,78
Options
Activemenu,81
Displaymenu,79
Mainmenu,77
Operationmenu,78
Setupmenu,80
Outputpower
description,85
procedure,72
P
Palette
change,60
Passivemode
procedure,72
Phasedarea
description,87
Pinginterval
change,54
Pingrate
change,54
Playback
echogramsequence,59
Power
outputadjustment,72
Powerefciency
description,85
Poweroff
procedure,14
Poweron
procedure,13
Poweroutput
description,85
Presentation
description,22
echogram
setup,62
select,60
Presentationcolours
change,60–61
Presentationpalette
change,60
Principle
outputpower,85
pulseduration,85
TVG,83
Procedure
adjustbottomecholevel,68
adjustsignalgain,70
adjustTVGgain,71
changedepth
presentationfont,60
changeechogramcolour
palette,60
changeechogramcolour
scale,60
changeechogram
colours,61
changepingrate,54
92
343539/A
Page 95

Index
changepulseduration,73
changesizeofdisplay
eld,60
collection,53
denemaximumdepth,67
deneminimumdepth,67
echogram
setup,62
History,56
interference
reduce,64
markerlines
setup,62
playback
echogramsequence,59
poweroff,14
poweron,13
selectpassivemode,72
selectpresentation
layout,60
selectverticalrange,65–66
setoutputpower,72
showbiomass,69
showshsize
distribution,68
storechogram
sequences,57
storeechogram,56
trackball,15
TVGgain
setup,63
verticalmarkerlines
setup,63
vesselnoise
reduce,64
whitelinesetup,65
Procedyre
shsizeadjustment,69
Pulseduration
description,85
procedure,73
Purpose,thismanual,7
R
Range
select,65–66
Rangeselection
description,87
Retrieve
echogram,56
S
Save
echogram,56
echogramsequence,57
ScreenCaptures,56
Screencopies
Statusbar,51
Sequence
echogram
playback,59
storeechogram,57
Setupmenu
options,80
Shortpulse
procedure,73
Signalgain
adjust,70
Sizedistribution
show,68
SL(Sourcelevel)
description,85
Slopesonthebottom
description,87
Sourcelevel
description,85
Statusbar
Horizontal,51
Screencopies,51
Transducer,52
Vertical,51
Store
echogram,56
echogramsequence,57
Switchoff
procedure,14
Switchon
procedure,13
T
Threshold
colour,18,46,61
Timemarker
echogram,43
TimeV ariedGain(TVG)
description,83
Trackball
description,15
Transducer
Statusbar,52
Transmitpulse
length,73
Transmitterpower
description,85
TVG
description,83
TVGgain
adjust,71
setup,63
U
Use
basic,82
V
Vertical
Statusbar,51
Verticalmarkerlines
setup,63
Vesselnoise
reduce,64
View
savedechogram,56
W
Whiteline
description,89
procedure,65
343539/A
93
Page 96

ISBN-13:978-82-8066-118-0
©
2010KongsbergMaritimeAS
 Loading...