

Page 1

Reference manual
Simrad ES60
Fish nding
echo sounder
M A X I M I Z I N G Y O U R P E R F O R M A N C E A T S E A
www.SIMRAD.com
Page 2

Page 3

857-160970
Simrad ES60
Fish finding echo sounder
Reference manual
Page 4

Document revisions
Rev Date Written by Checked by Approved by
Rev.H
25.09.06 RBr AJ AJ
Removed information about installation.
About this document
© 2006 Simrad Horten AS.
ISBN 82-8066-028-3
The information contained in this document is subject to change without prior notice.
Simrad Horten AS shall not be liable for errors contained herein, or for incidental or
consequential damages in connection with the furnishing, performance, or use of this
document.
All rights reserved. No part of this work covered by the copyright hereon may be
reproduced or otherwise copied without prior permission from Simrad Horten AS.
Simrad AS
Strandpromenaden 50
Box 111
N-3191 Horten
Telephone: +47 33 03 40 00
Facsimile: +47 33 04 29 87
M A X I M I Z I N G Y O U R P E R F O R M A N C E A T S E A
Page 5

Chapters
1 System description
This chapter presents a general description of the echo sounder system. Refer
to page 1.
2Displayviews
This chapter explains the layout of the echo sounderdisplay presentation.Refer
to page 12.
3 Getting started
This chapter provides an operational example to get you started with the
operation. Refer to page 26.
4 Operational procedures
Reference manual
This chapter provides specific procedures for common tasks. Refer to page 37.
5 Reference guide
This chapter explains the menus and dialogue boxes in detail. Refer to page 57.
857-160970 / Rev.H
I
Page 6

Simrad ES60
Table of contents
SYSTEM DESCRIPTION 1......................................
Introduction 1..................................................
System overview 2..............................................
Key facts 2...............................................
Main units 2..............................................
Wave propagation 4..............................................
Bottom echo 6..................................................
Split--beam operation 8...........................................
Observation range 10..............................................
DISPLAY VIEWS 12..............................................
Introduction 12..................................................
Display organisation 13............................................
Main view 13..............................................
Moving the boundary lines 14.................................
Direct access to dialogue boxes 15.............................
Menu bar 16.....................................................
Header view 17..................................................
Echo frames 18..................................................
Overview 18...............................................
Single Echo 18.............................................
Echogram and Range 19.....................................
Scope 20..................................................
Test presentation for passive or test mode 20.....................
Status bar 21....................................................
History and printer views 22........................................
Overview 22...............................................
Display example 23.........................................
Printer example 23..........................................
GETTING STARTED 26...........................................
Introduction 26..................................................
Before you start 27...............................................
Start--up 28.....................................................
Overview 28...............................................
Power-up procedure 28......................................
The menu system 28........................................
Transceiver inspection 28.....................................
II
857-160970 / Rev.H
Page 7

Reference manual
Environmental parameters 28..................................
Navigation interface 29......................................
Additional interfaces 29......................................
Operation 30....................................................
Overview 30...............................................
Selecting operational mode 30.................................
Transceiver settings 30.......................................
Bottom detector settings 31...................................
Colour scale 31.............................................
Single Echo view 31........................................
Echogram and Range view 32.................................
Scope view 34.............................................
Data storage 35..................................................
Overview 35...............................................
Define storage parameters 35..................................
Start and stop data storage 35..................................
OPERATIONAL PROCEDURES 37................................
Overview 37....................................................
Power on/off 38..................................................
Power on 38...............................................
Power off 38...............................................
Basic operations 40...............................................
Overview 40...............................................
Changing the echogram settings 40.............................
Changing the range 40.......................................
Changing the vertical resolution 40.............................
Changing the transmit power 41...............................
Setting minimum and maximum depth 41........................
Enabling the depth alarms 42..................................
Adding annotations 42.......................................
Transceiver installation 44..........................................
Overview 44...............................................
To install a channel 44.......................................
To uninstall a channel 44.....................................
To modify an IP address 45...................................
Restart the echo sounder 45...................................
Record and playback 46...........................................
Overview 46...............................................
Record 46.................................................
857-160970 / Rev.H
III
Page 8

Simrad ES60
Playback 48...............................................
History 48.................................................
Software installation and upgrades 51.................................
Overview 51...............................................
Software installation procedure 51..............................
Software upgrade procedure 52................................
Un-installation procedure 52..................................
Software on a third party computer 52...........................
Size distribution 54...............................................
Purpose 54................................................
Procedure 54...............................................
Adjusting to obtain correct fish length 56........................
REFERENCE GUIDE 57...........................................
Overview 57....................................................
Menus 58.......................................................
Main menu 58.............................................
File menu 59...............................................
View menu 60.............................................
Options menu 61...........................................
Install menu 63.............................................
Help menu 65..............................................
Status Bar 66....................................................
Dialogue boxes 68................................................
Introduction 68.............................................
Advanced Navigation 69.....................................
Advanced Transceiver 71.....................................
Annotation 73..............................................
BI 500 76.................................................
Bottom Detector 78.........................................
Bottom Range 80...........................................
Colour Scale 81............................................
Depth Output 83............................................
Echo Trace 84..............................................
Echogram 85..............................................
Environment 89............................................
Shutdown 90..............................................
Factory settings 91..........................................
Fish select 92..............................................
Heave Sensor 93............................................
IV
857-160970 / Rev.H
Page 9

Reference manual
History 95.................................................
IP Address 96..............................................
Language 98...............................................
Layout 99.................................................
Navigation Interface 100......................................
Operation 102...............................................
Printer and History 105.......................................
Print Setup 107..............................................
Purse Seine 109.............................................
Replay 110.................................................
RS-232 Setup 112...........................................
Store 113..................................................
Surface Range 115...........................................
Temperature Sensor 116.......................................
Transceiver Installation 117....................................
Transceiver Settings 119......................................
Trawl Interface 122..........................................
Trawl Range 124............................................
857-160970 / Rev.H
V
Page 10

SYSTEM DESCRIPTION
Introduction
This chapter provides a brief introduction to the Simrad ES60
fishery echo sounder system.
Related topics
→ Overview, page 2
→ ES60 System drawing, page 3
→ Wave propagation, page 4
→ Bottom echo, page 6
→ Split-beam operation, page 8
→ Observation range, page 10
System description
Important notice
Windows NT, Windows 2000, Windows XP and Windows are
either registered trademarks or trademarks of Microsoft
Corporation in the United States and/or other countries.
Echosounder software version
This manual complies to echo sounder software version
1.5.0.75.
857-160970 / Rev.H
1
Page 11

Simrad ES60
System overview
Key facts
The Simrad ES60 echo sounders is designed for the professional
fishery community implementing the latest innovations.
• The ES60 system is flexible and easy to configure due to the
modular design.
• Echo sounders ranging from relatively low-cost single beam
to large multi-frequency systems containing several
split-beam channels can be realised.
• Menus and dialogue boxes are operated by a standard mouse
or a roller ball.
• Large colour liquid crystal displays (LCD) are used. A
standard computer mouse may be used.
• The ES60 uses the Microsoft Windows® display interface.
Operation is to a large extent self-explanatory. Getting started
is easy if you are familiar with standard Microsoft
Windows® programs.
• A store/replay function reduces the need for echogram
printout on paper. The unprocessed transducer signal is
recorded on the internal harddisk. During replay, this signal
is injected into the ES60 processing software as if it arrived
directly from the transceiver.
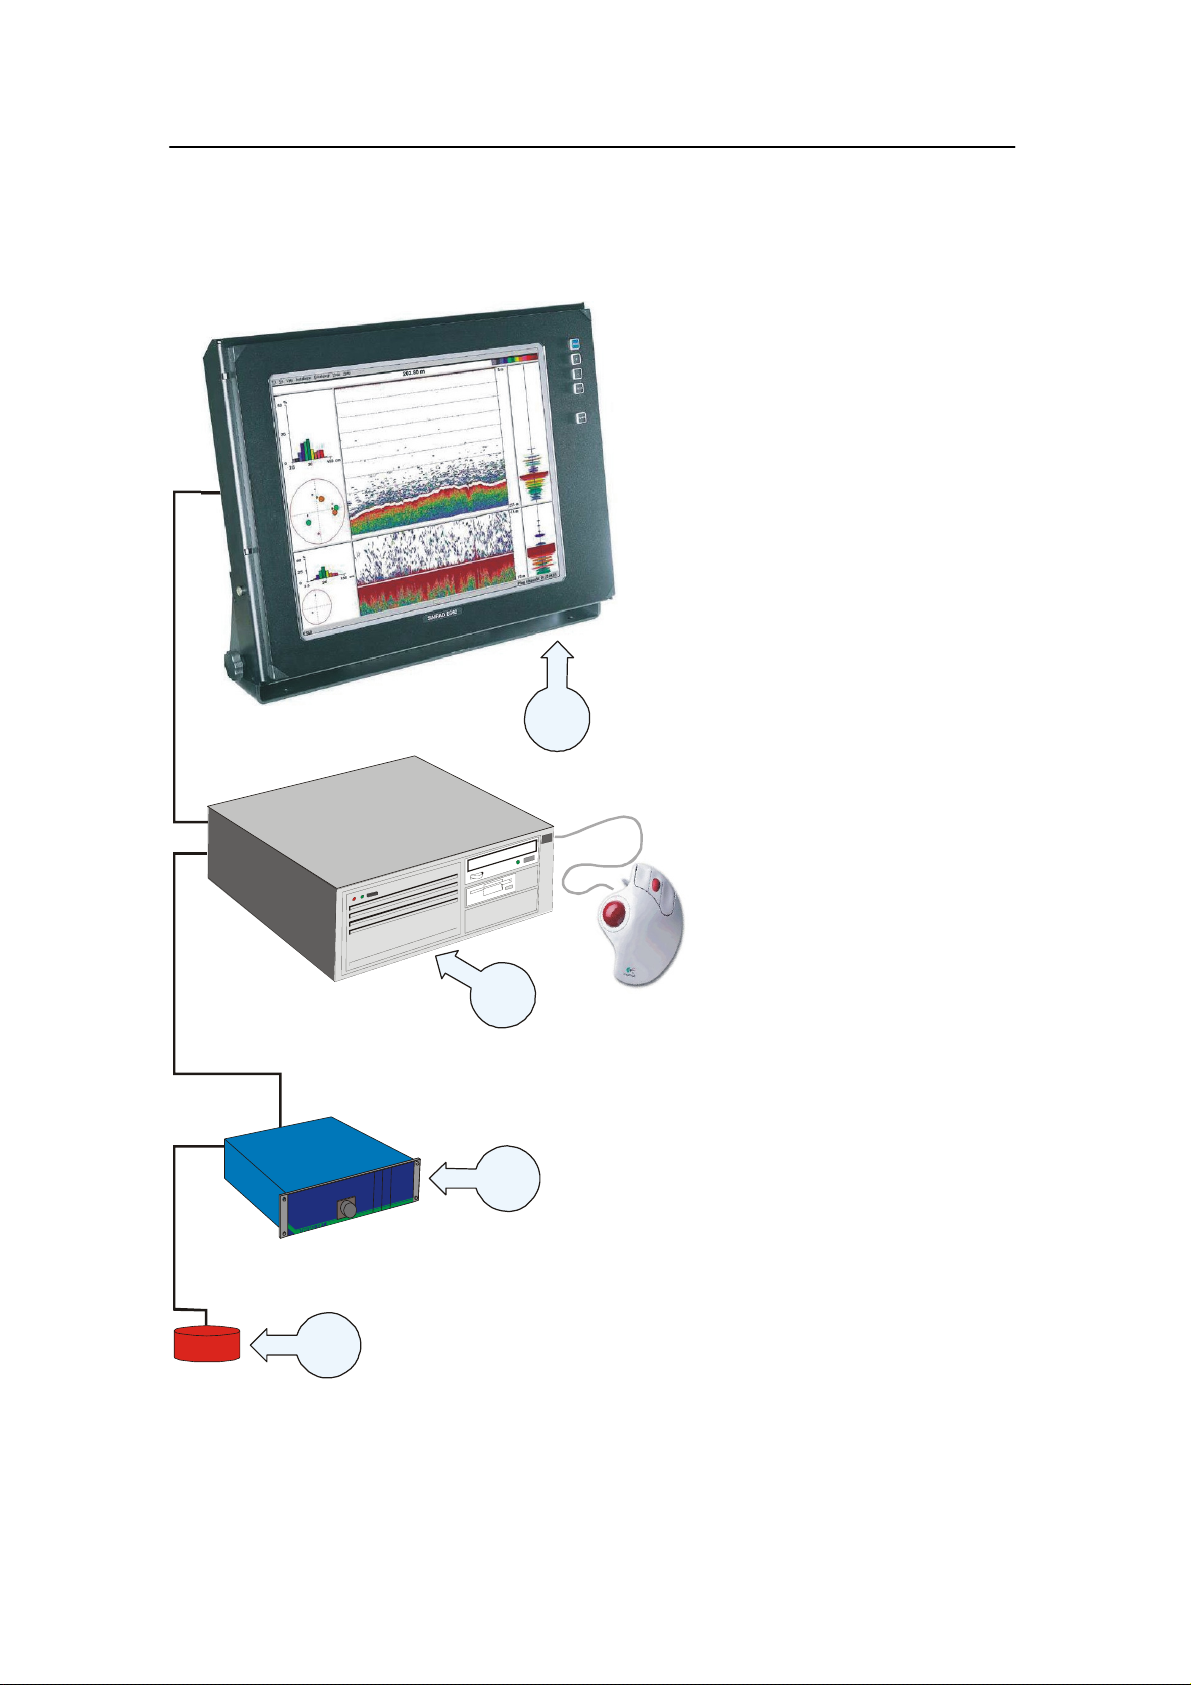
Main units
The standard version of the ES60 echo sounder consists of the
following units:
• a display unit (several sizes are available)
• a Processing Unit (personal computer)
• a General Purpose Transceiver (different types are available)
• a transducer (a wide range of frequencies are available)
Up to four frequency channels can be installed in a single
system. High-power single-beam and split-beam transducers are
available at operating frequencies ranging from 12 to 200 kHz.
2
857-160970 / Rev.H
Page 12
System description
A
System diagram:
(A) = LCD monitor
(B)=ProcessorUnit
(C) = General Purpose
Transceiver (GPT)
(D) = Transducer
D
B
C
(CD102000)
857-160970 / Rev.H
3
Page 13
Simrad ES60
Wave propagation
The velocity of sound wave propagation in the sea varies
slightly with temperature, salinity and pressure. The velocity
varies between 1440 and 1520 m/s in shallow sea water, while a
velocity around 1480 m/s can be expected at 1000 m depth. In
shallow fresh water the velocity is approximately 1430 m/s.
A good average value to be used in the Environment dialogue
box is 1470 m/s.
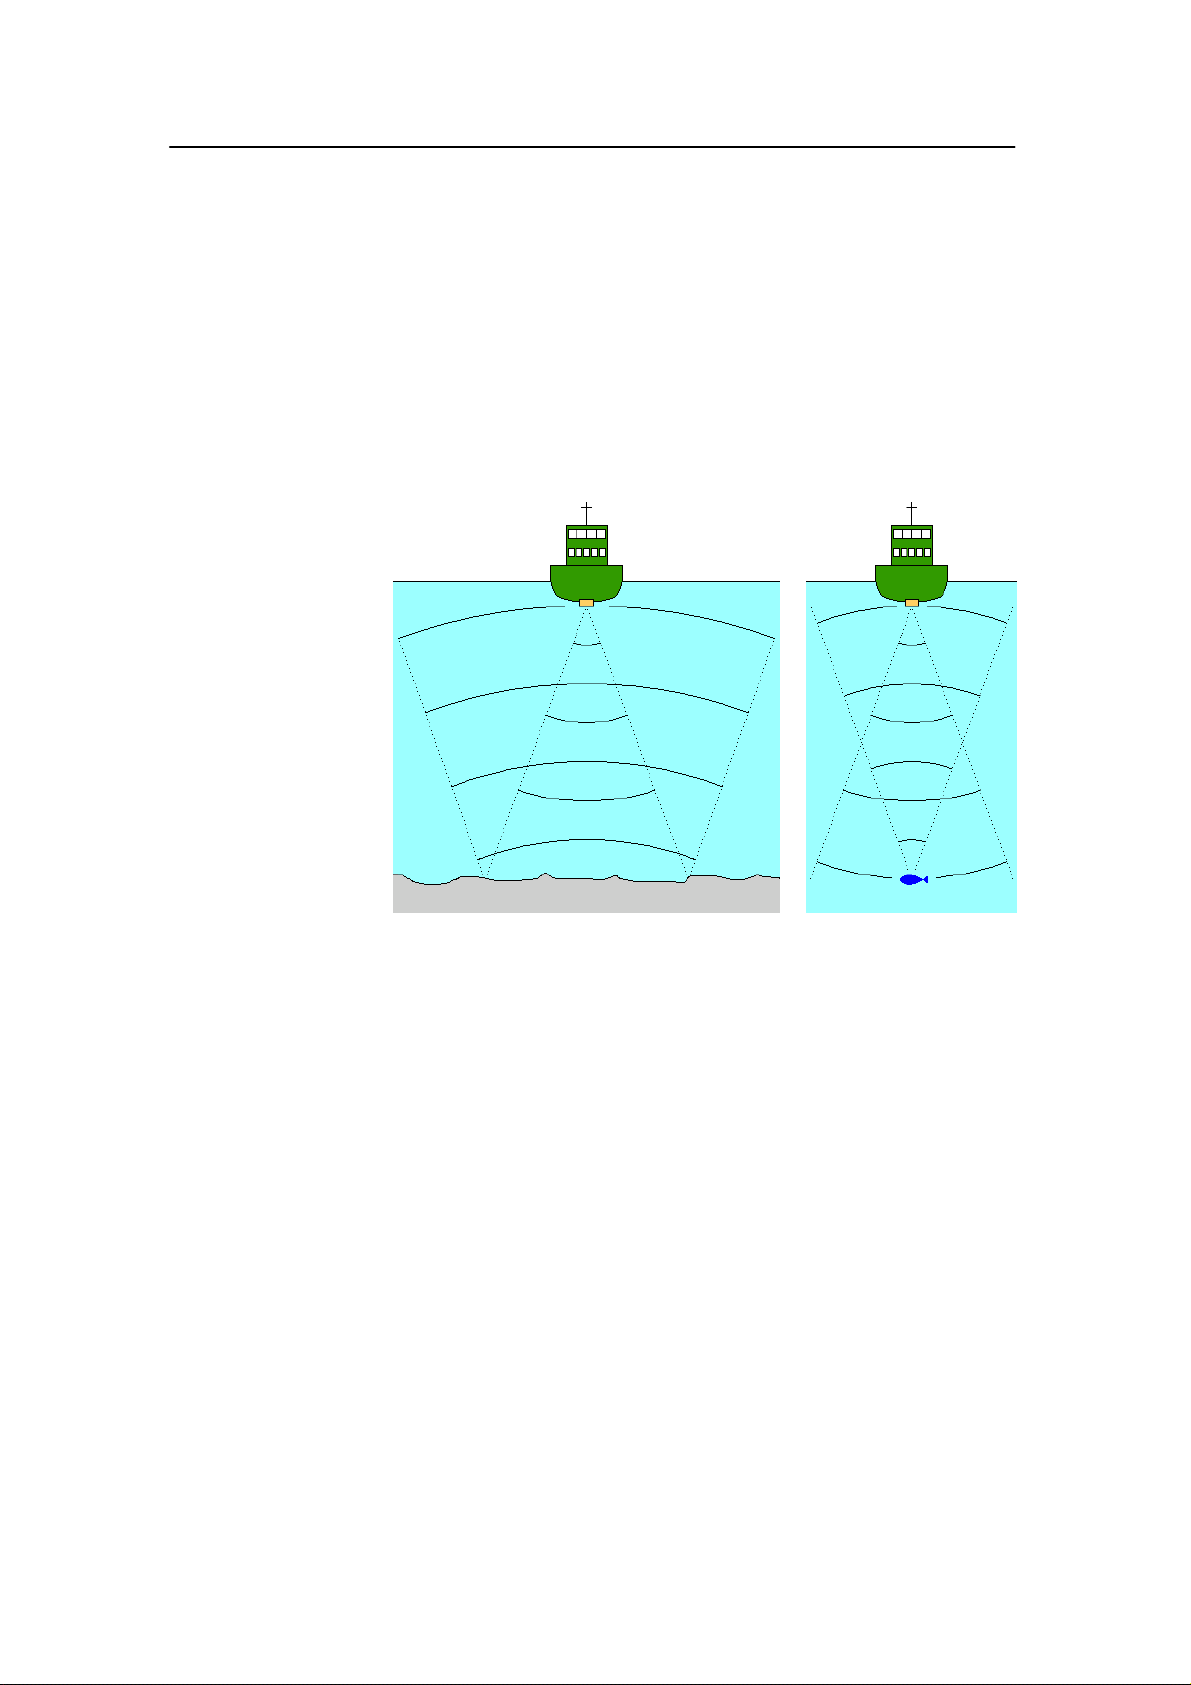
Figure 1 The
wave propagation
principles
The ES60 transmits high energy sound wave pulses into the sea.
A flat bottom reflects the transmitted wave as if it were a mirror.
The propagating energy is spread over a larger and larger area as
it travels down to the bottom and up again. The energy is spread
over a four times larger area every time the travel distance
doubles.
A large school of fish reflects sound waves similarly. This type
of spreading is referred to as square-law or 20 log TVG (Time
Varying Gain) spreading.
The situation is slightly different when observing the echoes
from individual fish. The transmitted wave undergoes
square-law spreading when travelling from the surface and
down to the fish. The swim bladder of the fish scatters a small
fraction of the arriving energy in all directions. Travelling from
the fish and back towards the surface the scattered wave
undergoes another square-law spreading. The combined effect is
referred to as quad-law or 40 log TVG spreading.
In the echo sounder’s Echogram dialogue box 20 log TVG
spreading is called School Gain and Bottom Gain, while 40 log
TVG spreading is called F i sh Gain.
4
857-160970 / Rev.H
Page 14

System description
Propagation losses due to absorption are much higher in sea
water than in fresh water. Absorption also increases with
frequency. At 38 kHz the absorption is 0.5 dB/km in fresh water
and 10 dB/km in sea water. At 200 kHz the absorption is 10
dB/km in fresh water and 50 dB/km in salt water. The echo
sounder must know which water type is present in order to
compensate for these losses correctly.
(The dB (decibel) unit has long traditions in underwater
acoustics and other fields in physics. It is a logarithmic measure
for the ratio between two quantities).
Related topics
→ Environment, page 89
→ Echogram, page 85
857-160970 / Rev.H
5
Page 15
Simrad ES60
Bottom echo
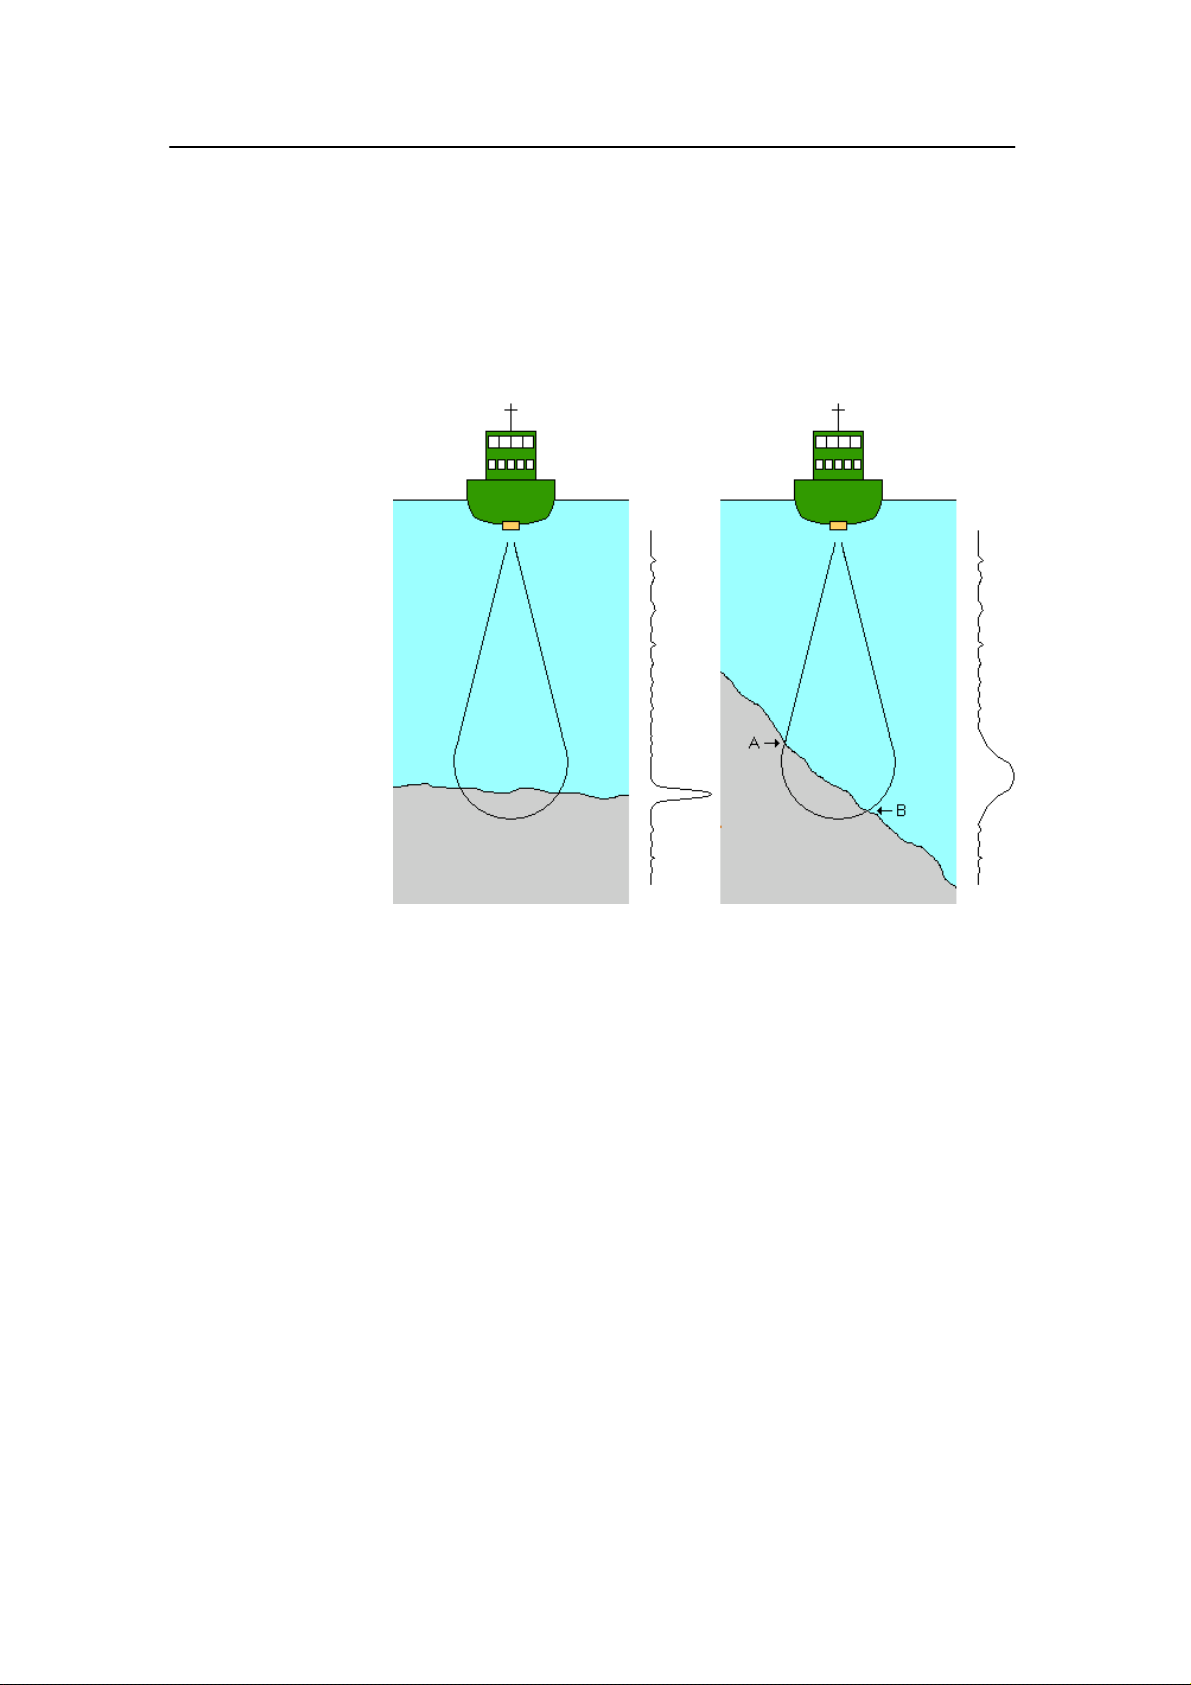
Figure 2
Bottom echo
A hard flat bottom reflects the transmitted signal as if it were a
mirror. The transmitted pulse hits the illuminated bottom area at
nearly the same instant, and the echo from different parts of this
area arrive back at the surface also at nearly the same instant.
The received echo signal is basically an attenuated copy of the
short transmit pulse. The echo signal from a sloped bottom is
characterised by having a longer duration and a slower rise and
fall time. The transmitted pulse first hits the slope at point A,
and as time elapses the reflection point travels along the slope
towards point B. Many locations do not have a solid hard
bottom. Frequently, the bottom is composed of layers of mud,
clay and sand which can be observed as coloured bands on the
echo sounder display.
The bottom detection algorithm is implemented solely in
software, and separate algorithms are run for each frequency
channel. The algorithm is designed with emphasis on reliability
in the sense that erroneous depth detections are never output.
Whenever the quality of a detection is questionable the
algorithm outputs a depth of 0.00 to indicate that no reliable
detection was obtained. The ES60 algorithm is designed to
handle a number of difficult situations. The algorithm maintains
bottom lock for a discontinuous jump in bottom depth. It avoids
false bottom detections on a dense school of fish. The algorithm
chooses the upper boundary of the first layer when the bottom
consists of layers.
6
857-160970 / Rev.H
Page 16

System description
The bottom detection algorithm locks to the first good bottom
return. The depth at point A rather than the depth along the
transducer axis will be output for a sloped bottom. The detected
depth value is always smaller than the depth along the
transducer axis implying that a safety margin is automatically
included.
857-160970 / Rev.H
7
Page 17
Simrad ES60
Split-beam operation
The ES60 uses the split-beam technique for assessment of the
size distribution of individual fish. A split-beam transducer is
electrically divided into four quadrants. All four quadrants are
excited in parallel during transmission. However, the received
signal from each quadrant is separately amplified in a
four-channel matched receiver allowing the direction of arrival
of an echo to be determined.
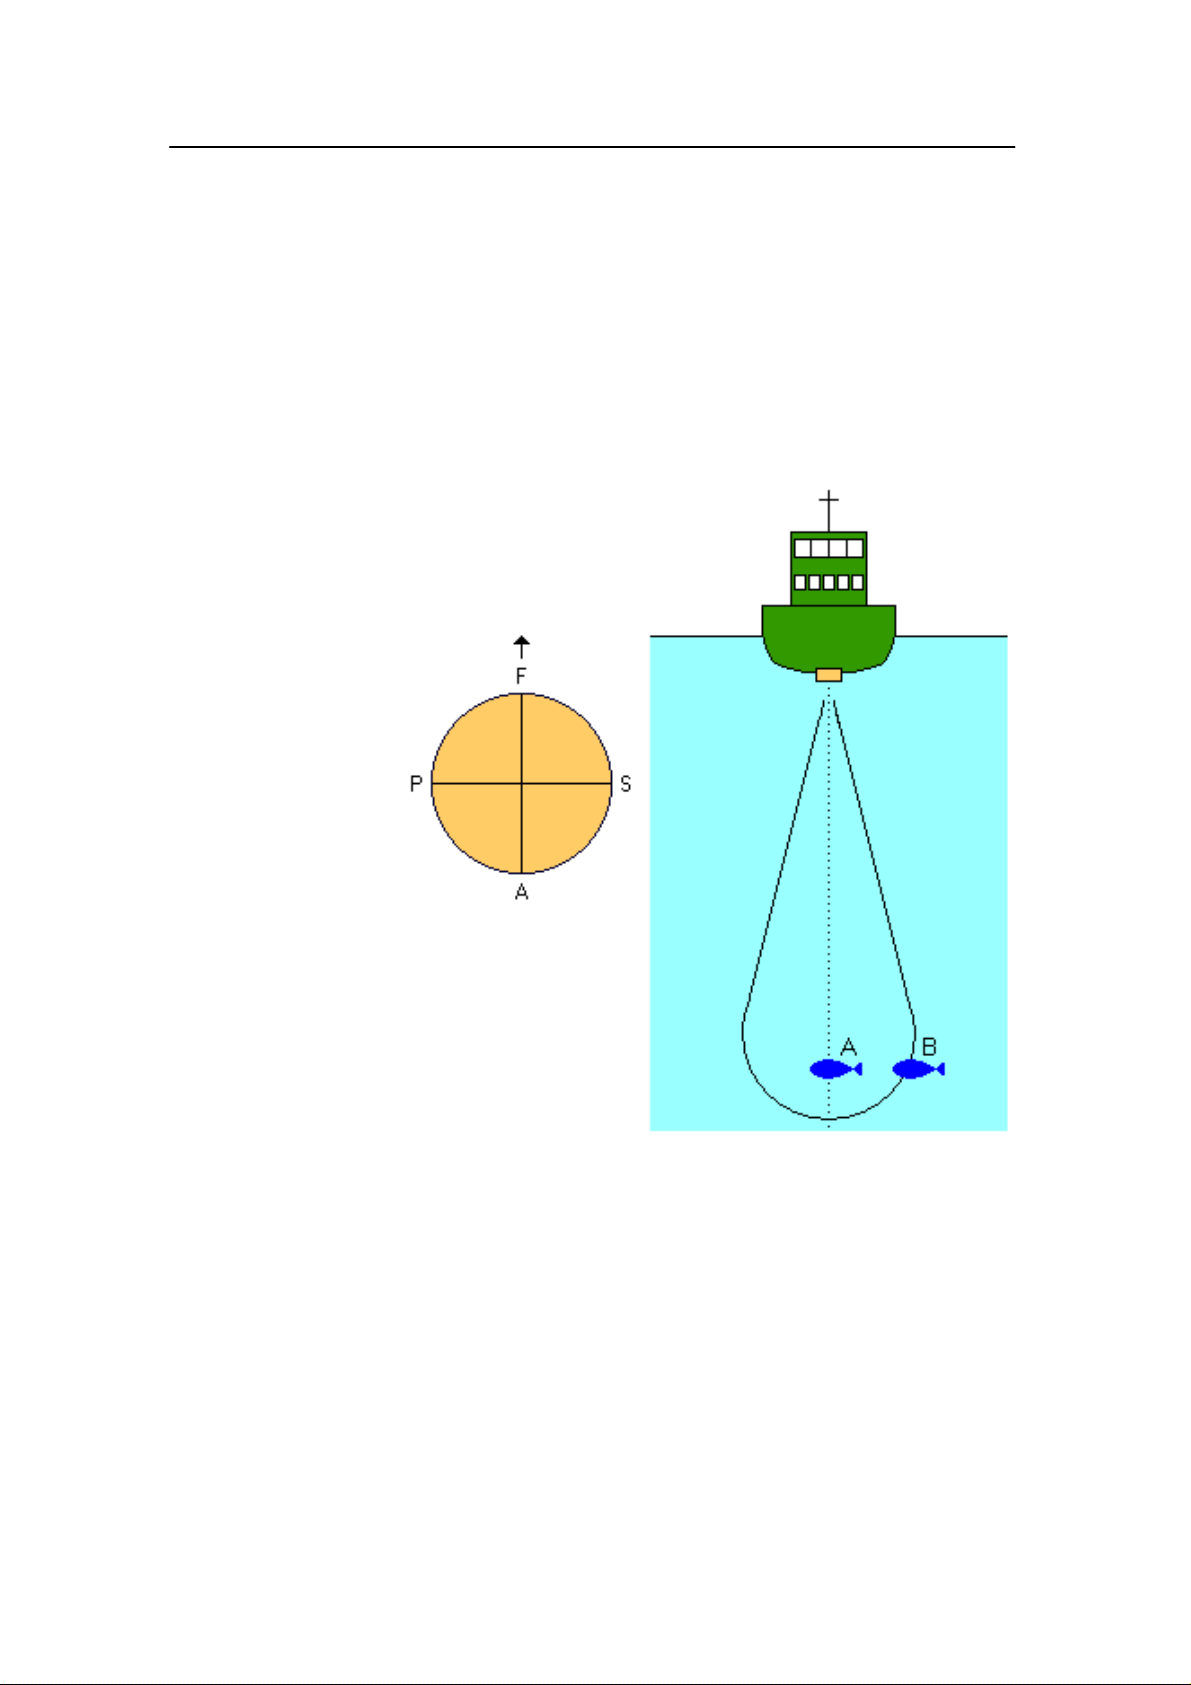
Figure 3 Split-beam principles
An acoustic wave front propagating towards the transducer
arrives at the four quadrants at different times causing the phase
angle of the electrical output signal from the quadrants to differ.
The fore-and-aft angle is determined from the electrical phase
difference between the fore and the aft transducer halves, and
the athwartships angle is determined from the starboard and port
signals.
Fish A is positioned along the transducer axis where the
transducer has its maximum sensitivity, while Fish B is
positioned towards the edge of the beam where the sensitivity is
lower. Evidently, the echo signal from Fish A will be stronger
than the signal from Fish B even though they are of the same
size and at the same depth. Hence, determining fish size from
8
857-160970 / Rev.H
Page 18

System description
the received echo strength alone will not be too successful. A
split-beam echo sounder measures the position of the fish within
the beam. The sounder corrects for the difference in transducer
sensitivity and computes the true size of the fish.
The split-beam measurement technique only works for echoes
originating from one single fish since the electrical phase will be
random if echoes from multiple individuals at different positions
in the beam are received simultaneously.
Consequently, measurement of fish size inside a school of fish
tends to be unreliable.
857-160970 / Rev.H
9
Page 19
Simrad ES60
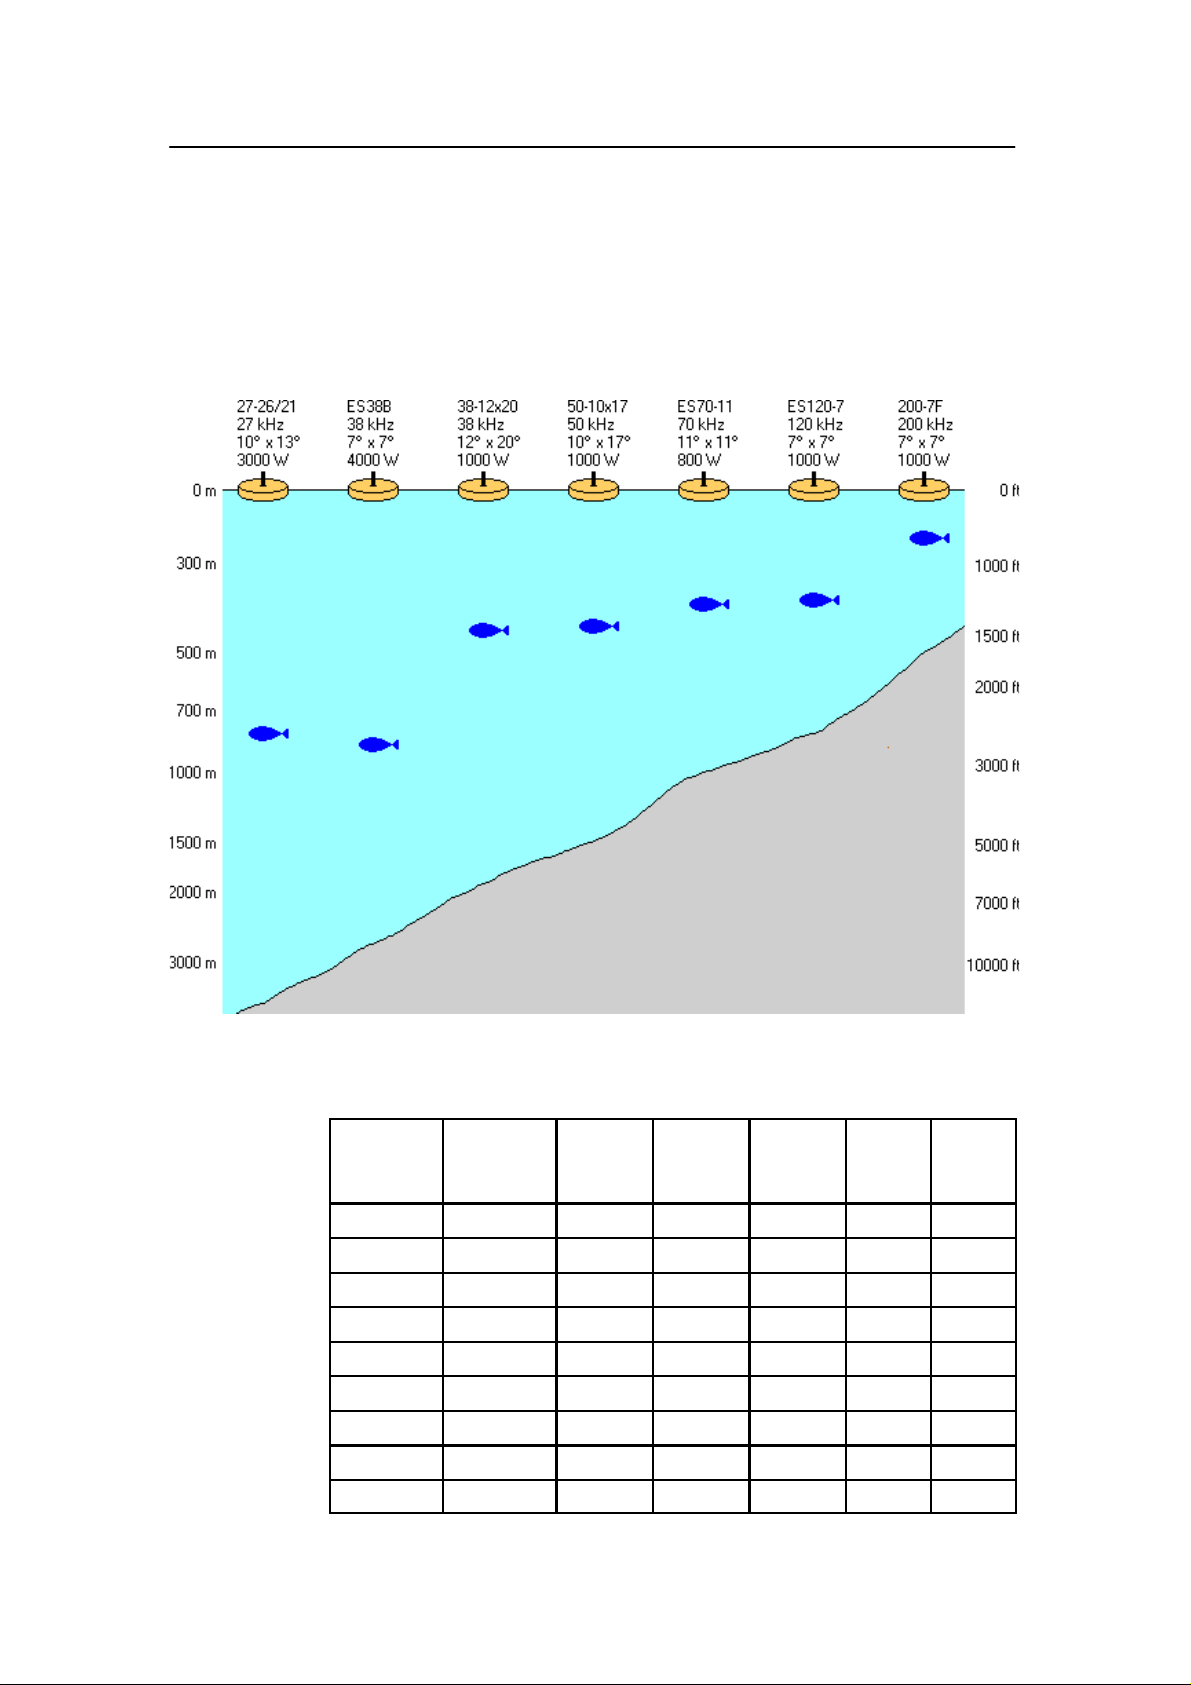
Observation range
Absorption increases dramatically with frequency in salt water.
For maximum observation range you should select a low
operating frequency, a large transducer and the maximum
transmit power.
10
Figure 4 Observation range
Maximum detection depth
Transducer Frequency,
kHz
12--16 12 16.40 193 2000 850 10000
ES 18 18 8.21 382 2000 1100 7000
27--26 27 8.18 387 3000 1100 4400
38/200D 38 4.09 766 1000 500 2100
38--9 38 4.09 766 1500 800 2600
38--7 38 4.09 766 2000 950 2800
50/200D 50 2.05 1493 1000 500 1500
50--7 50 2.05 1493 2000 700 1900
ES70--11 70 2.05 1526 800 450 1100
Pulse
duration,
ms
Band
width,
Hz
Transmit
power,
W
Range
fish,
m
857-160970 / Rev.H
Range
bottom,
m
Page 20

System description
Transducer Range
120--25 120 1.02 3026 1000 390 800
ES120--7 120 1.02 3026 1000 440 850
50/200D 200 1.03 3088 1000 280 550
ES200--7 200 1.03 3088 1000 270 550
Frequency,
kHz
Pulse
duration,
ms
Band
width,
Hz
Transmit
power,
W
Range
fish,
m
bottom,
m
Typical observation ranges are shown in the figure. Using the
Simrad 27-26/21 transducer (27 kHz, 10x13 degrees, 3000 W)
you can observe a 60 centimeter cod down to 800 meters, and
bottom detection works down to 3800 meters. However, with
the Simrad 200-7F transducer (200 kHz, 7x7 degrees, 1000 W)
you can only observe that same cod down to 260 meters, and
bottom detection becomes unreliable below 500 meters.
These range calculations assume a normal sea water salinity
(3.5%) and temperature (+10 degC), an average bottom (surface
backscattering strength = -20 dB) and a noise level typical for a
moving vessel.
857-160970 / Rev.H
11
Page 21

Simrad ES60
DISPLAY VIEWS
Introduction
This chapter provides a brief overview of the information
displayed by the ES60, and how it is organised.
Related topics
→ Display layout and main view, page 13
→ Moving boundary lines, page 14
→ Direct access to dialog boxes, page 15
→ Menu bar, page 16
→ Header view, page 17
→ Echo frames, page 18
→ Status bar, page 21
→ History and printer views, page 22
12
857-160970 / Rev.H
Page 22
Display organisation
Main view
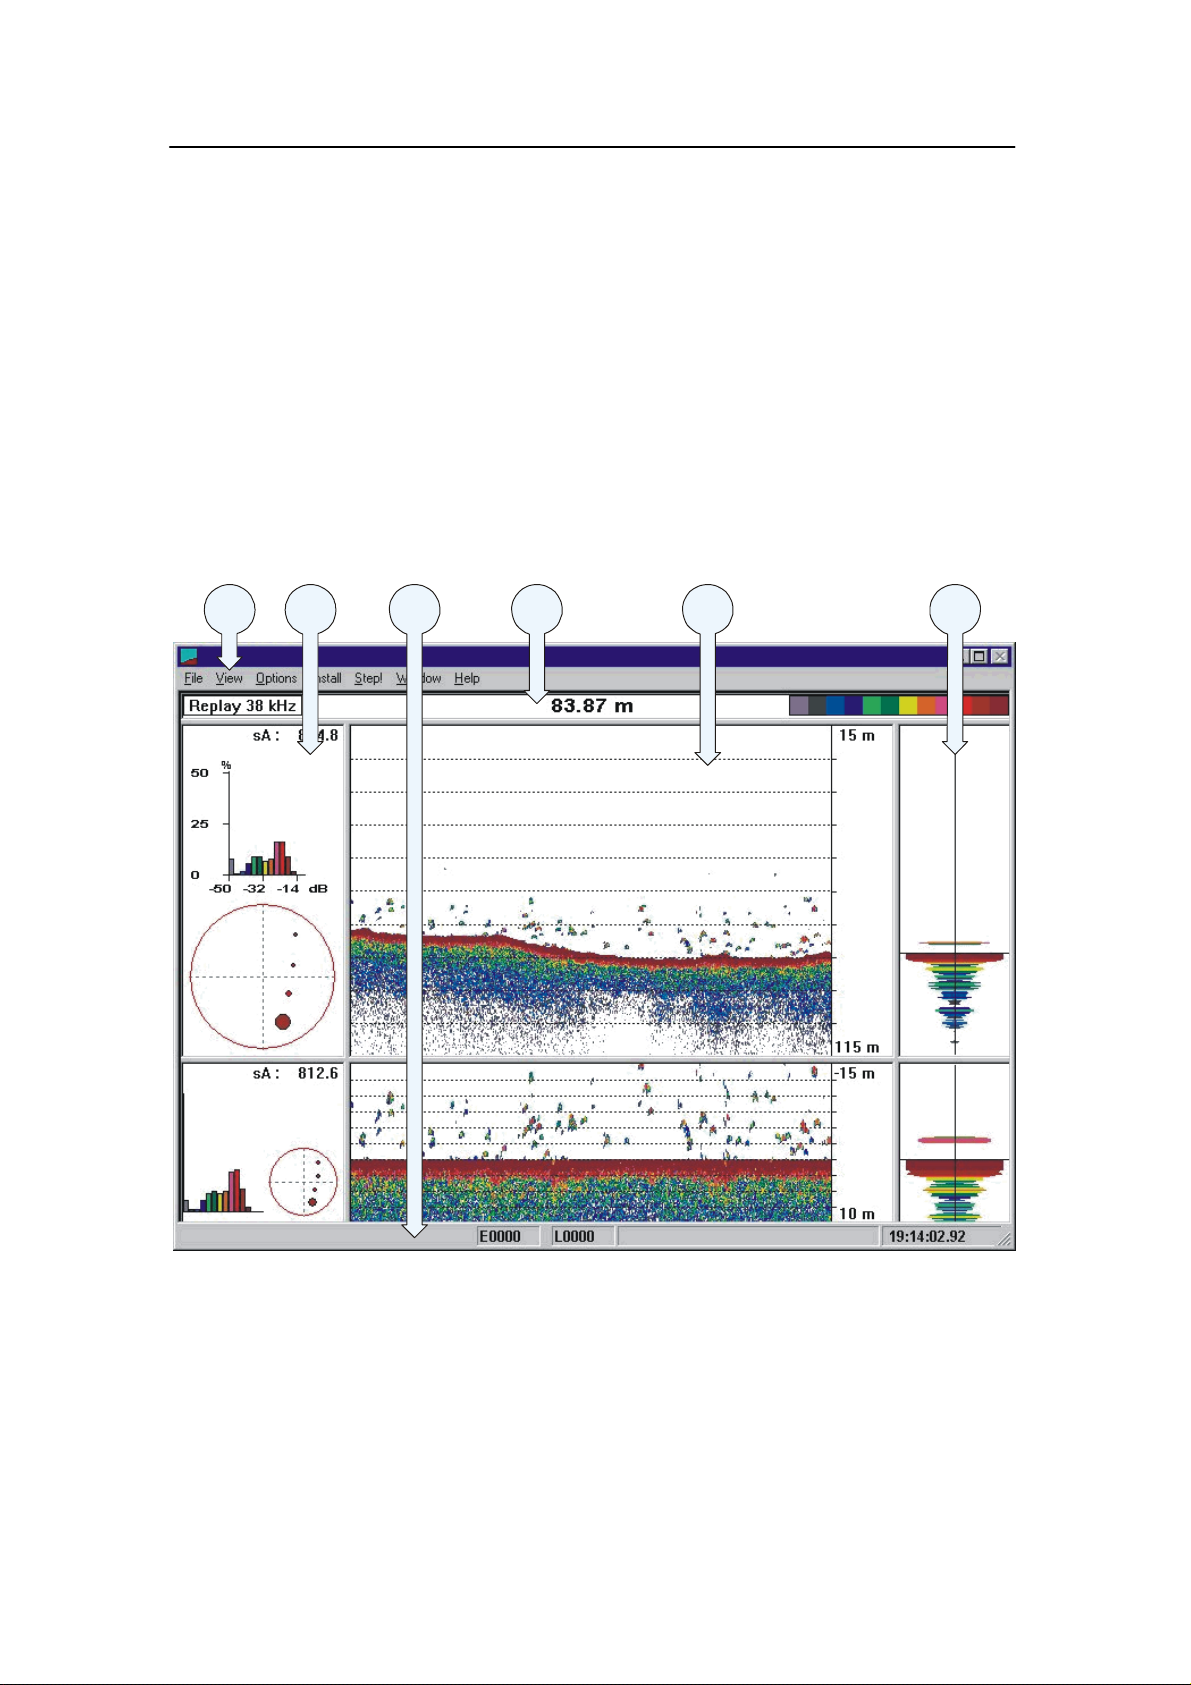
The ES60 display is organised as follows (from top):
• Menu bar
• For each transceiver channel:
- Two echo frames
• Status bar
A single channel display is shown below as an example.
Display views
AB
C
DEF
857-160970 / Rev.H
(CD10202)
(A) Main menu (B) Header view
(C) Echogram and range view (D) Scope view
(E) Single echo view (F) Status bar
13
Page 23

Simrad ES60
Menu
The Menu bar contains the echo sounder’s main menu. A
single click on one of the menu names will provide a new
drop-down menu where additional choices can be made.
Header
For each channel, the Header view contains the current
operational mode and frequency, the current depth, and the
colour scale.
Echo frames
The Echo frame takes up the largest part of the echo sounder
window. Each Echo frame contains (from left) a Single Echo
view, an Echogram and Range view and a Scope view.
The Echo frame view is are also described in more detail in the
Getting started chapter.
Status bar
The Status bar presents the current event and line numbers,
current time, and other information provided by the echo
sounder.
Moving the boundary lines
You can modify the vertical size of the echograms by moving
the horizontal boundary line between the two echograms.
To do this:
1 Position the cursor at the boundary line.
2 Press the left mouse button.
3 Drag the cursor up or down vertically while keeping the
left mouse button pressed.
4 Release the left mouse button.
Using the same operation, you can modify other boundary lines
on the display;
• The horizontal line between the upper Echo frame and the
Header view
14
• The vertical line between the Echogram and Range view
and the Scope view
• the vertical line between the Echogram and Range view and
the Single Echo view.
857-160970 / Rev.H
Page 24

Display views
Direct access to dialogue boxes
Several dialogue boxes are directly accessed from the various
views on the display.
Position the cursor, and right-click on the...
• Mode and frequency information in the Header view to
open the Transceiver Settings dialogue box.
• Depth value in the Header view to open the Bottom
Detector dialogue box.
• Colour scale in the Header view to open the Colour Scale
dialogue box.
• Range fieldintheEchogram and Range view to open one
of the Range dialogue boxes, depending of the current
echogram type.
• Echogram field in the Echogram and Range view to open
the Echogram dialogue box.
• Single Echo view to open the Echo Trace dialogue box.
Related topics
→ Menu bar, page 16
→ Header view, page 17
→ Echo frames, page 18
→ Status bar, page 21
→ Getting started; Operation, page 30
→ Bottom Detector, page 78
→ Colour Scale, page 81
→ Echogram, page 85
→ Bottom Range, page 80
→ Surface Range, page 115
→ Transceiver settings, page 119
→ Echo Trace, page 84
857-160970 / Rev.H
15
Page 25
Simrad ES60
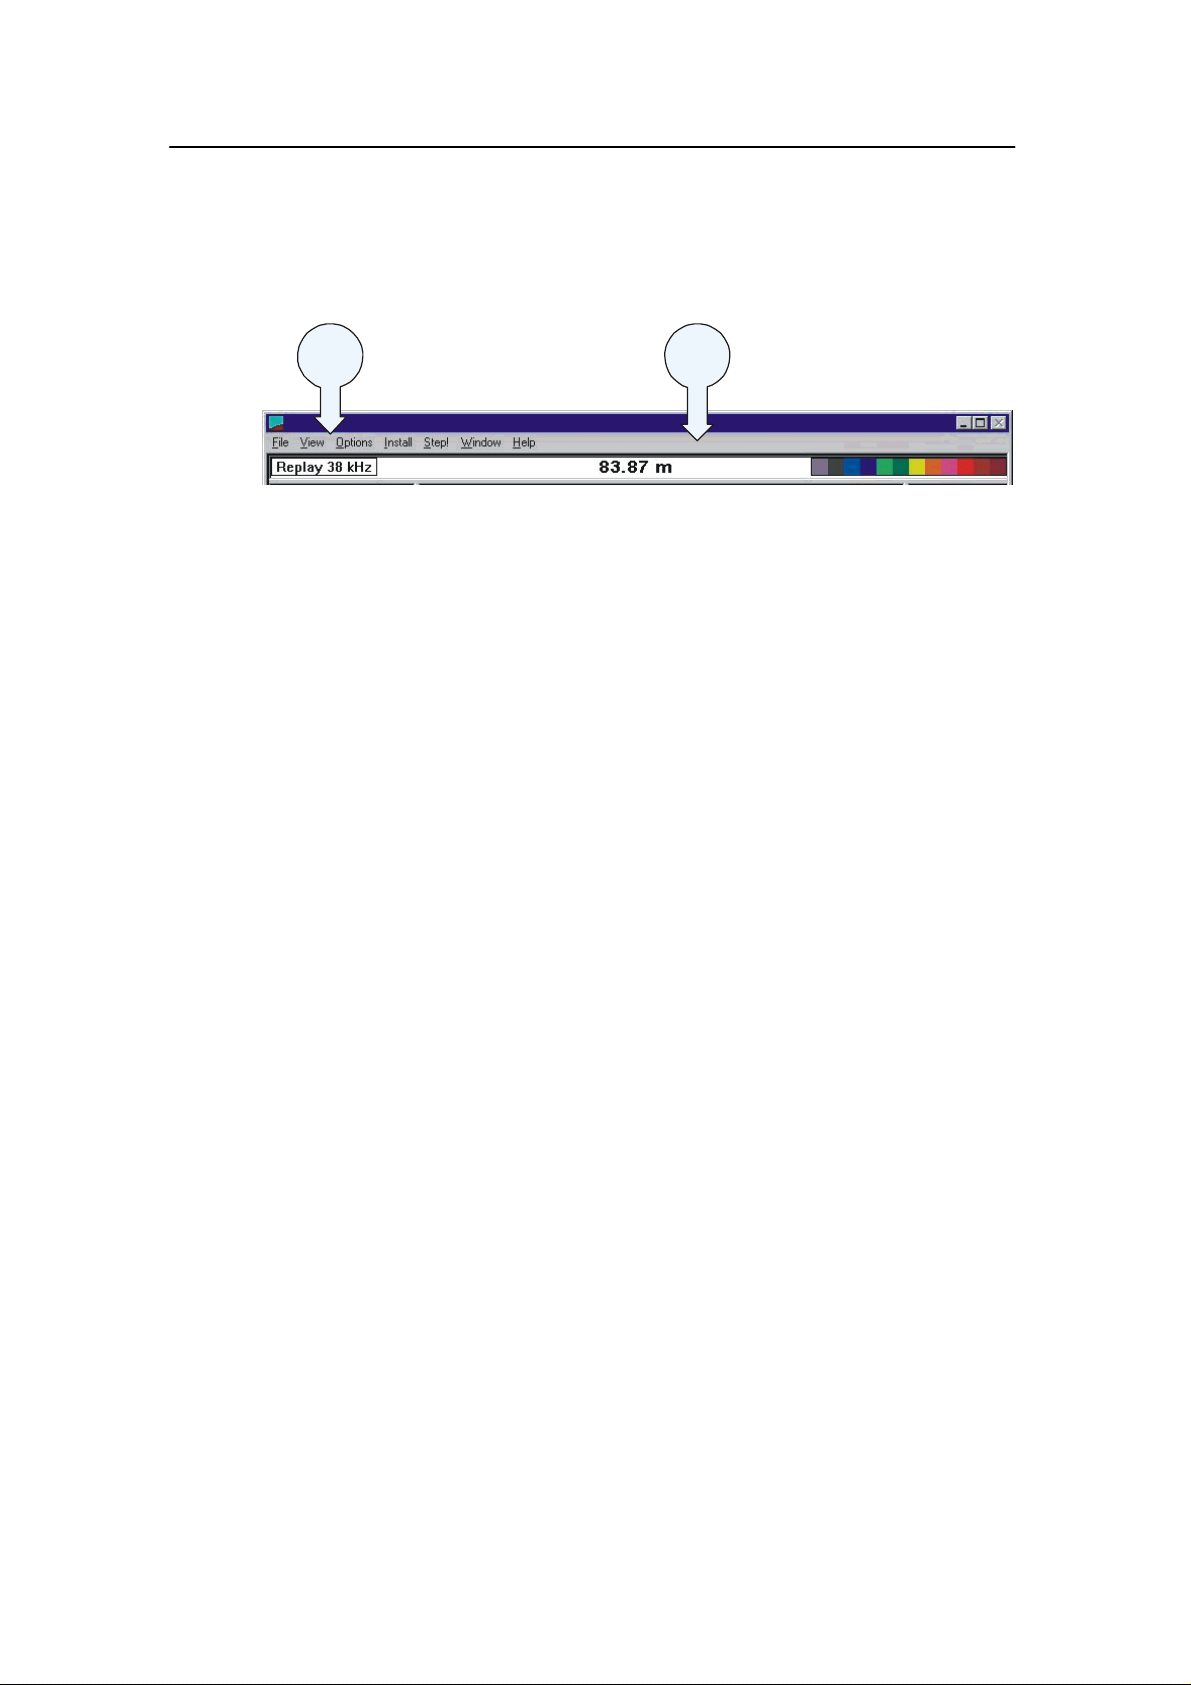
Menu bar
The ES60 Menu bar contains the Main menu.
AB
(CD10204)
(A) Main menu
(B) Menu bar
The main menu has the following options:
• File
• View
• Options
• Install
• Step!
• Help
To operate, click on the menu name and observe the drop-down
menu. Select a new item on the drop-down menu by clicking on
the command. Commands shown with light grey colour are
unavailable in the present configuration or operational mode.
The menus are all explained in the Reference Guide.
Related topics
→ Main menu, page 58
→ Reference guide, page 57
16
857-160970 / Rev.H
Page 26
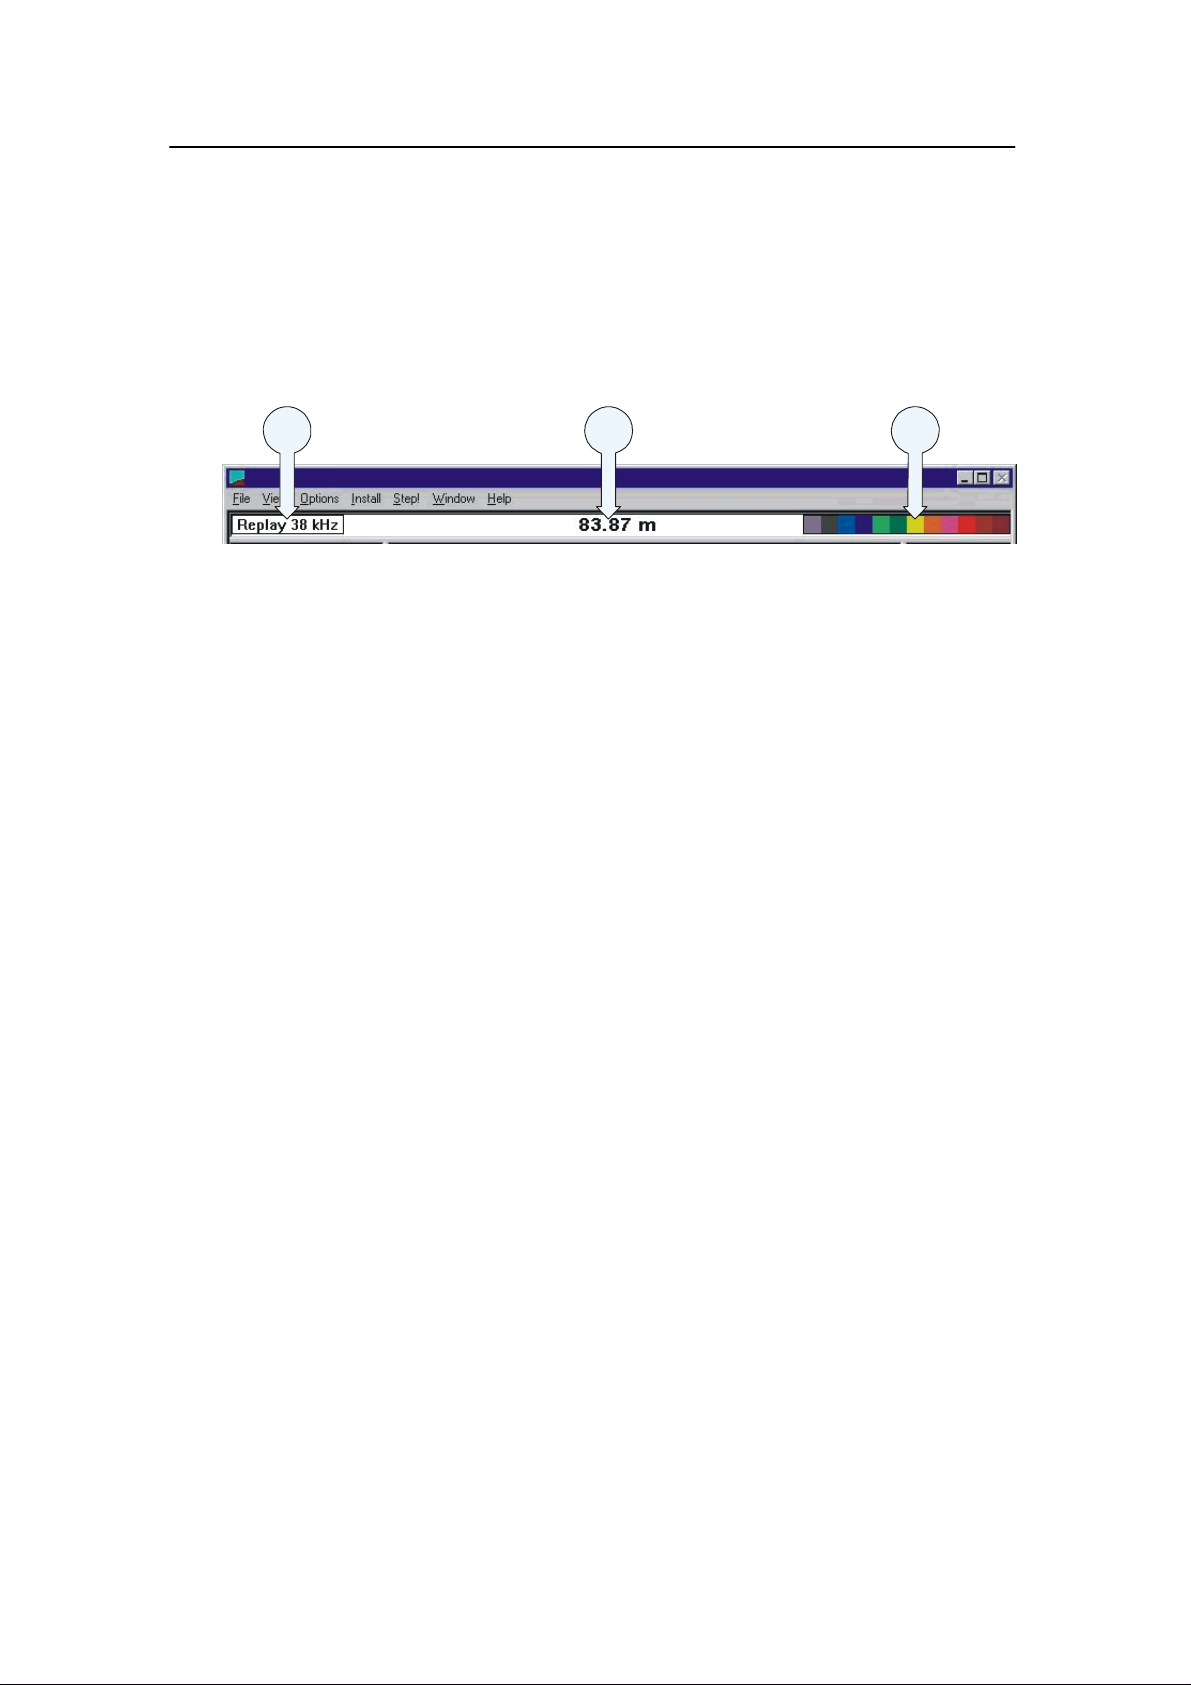
Header view
Display views
The ES60 Header view is shown directly above the two Echo
frames. The top Header view is thus located just below the
Menu bar. The Header view contains the following
information.
AB
(A) Transceiver settings: Current mode and frequency
(B) Bottom detection: Current depth
(C) Colour Scale
The Header view is a part of the channel. If more than one
channel is displayed, the Header view is duplicated as well.
The Header view provides direct access to the following
dialogue boxes:
• Right-click in the Transceiver settings field (on the Mode
and frequency information) to open the Transceiver
Settings dialogue box.
• Right-click in the Bottom detection field (on the Depth
value) to open the Bottom Detector dialogue box.
• Right-click on the Colour scale to open the
dialogue box.
Colour Scale
C
(CD10205)
857-160970 / Rev.H
Related topics
→ Transceiver Settings, page 119
→ Bottom Detector, page 78
→ Colour Scale, page 81
17
Page 27
Simrad ES60
Echo frames
Overview
The ES60 Echo frames are the main information bearer on the
echo sounder display. The Echo frames are usually presented in
pairs with two echo frames for each channel.
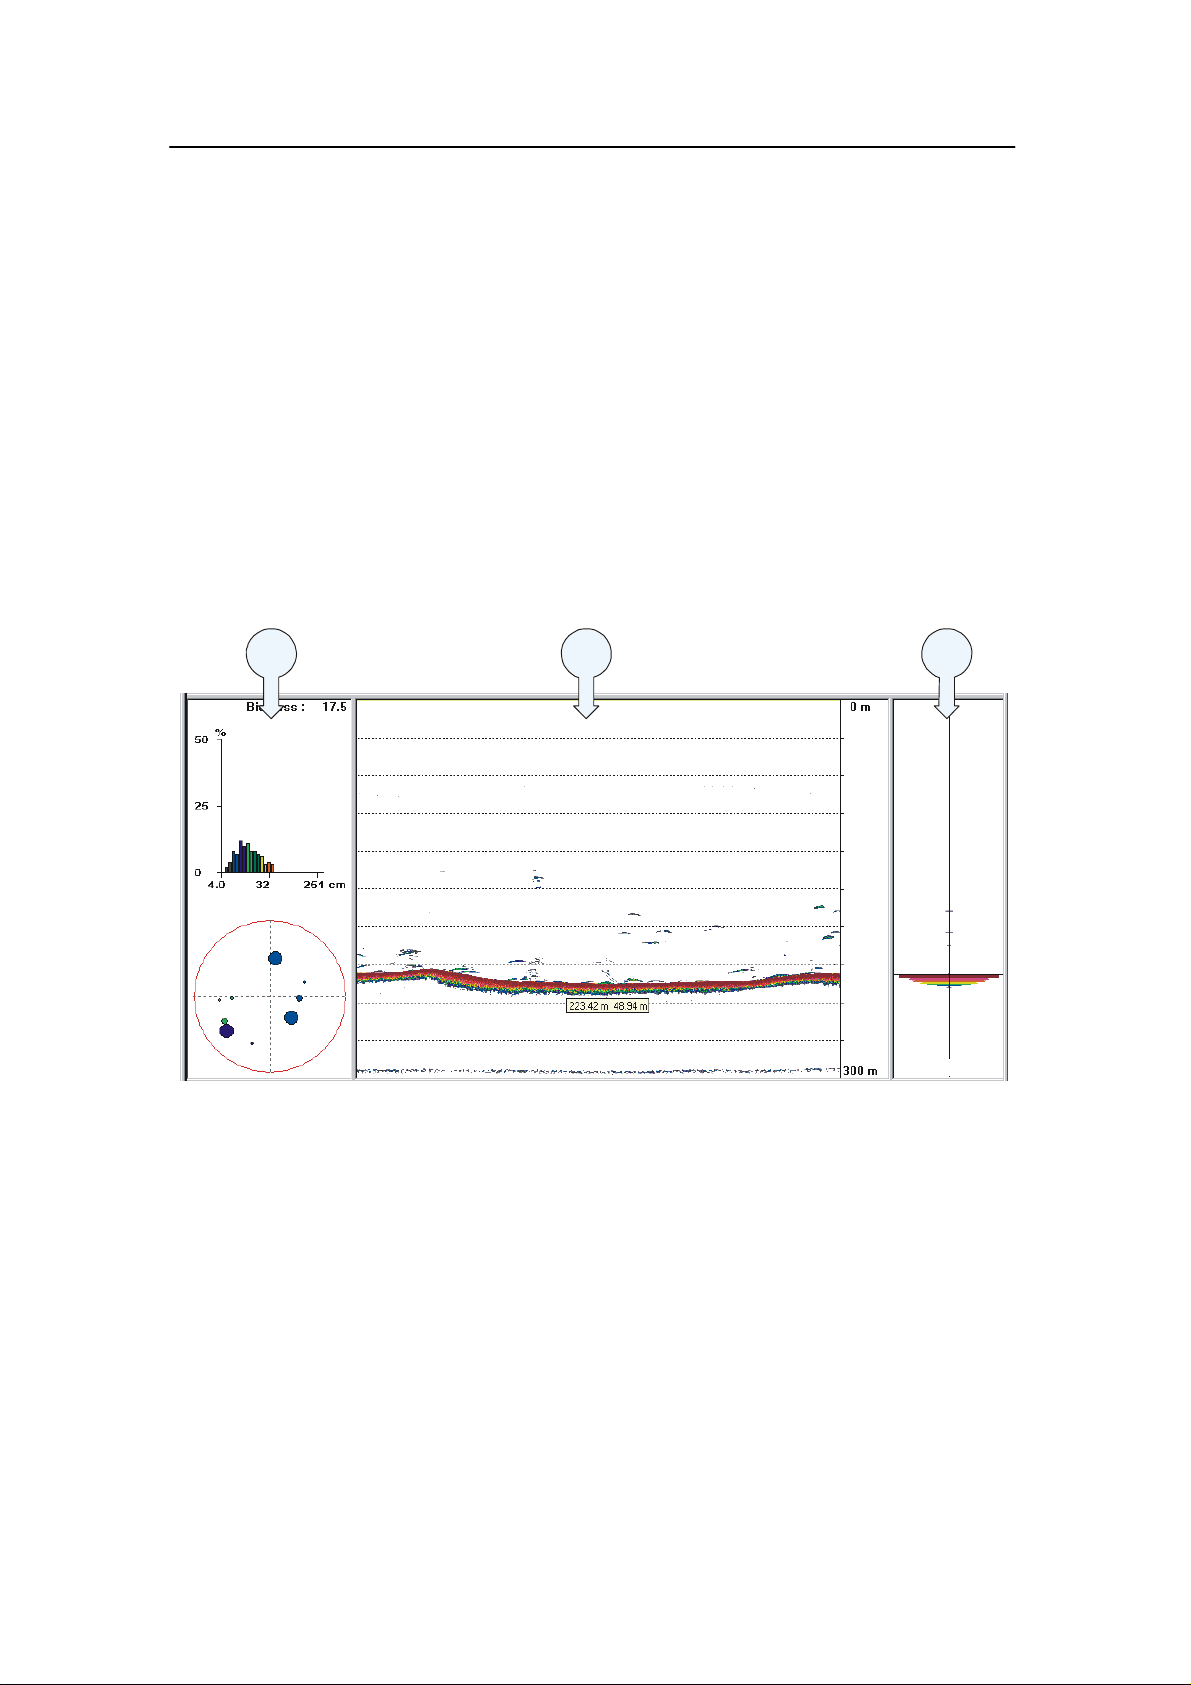
The Echo frame contains the following views:
(A) Single echo view
(B) Echogram and Range view
(C) Scope view
Note that the Single Echo view is only available in split-beam
versions of the echo sounder.
AB
Single Echo
The Single Echo view contains information on detection of
single echoes. Two plots are visible in this view:
• The top plot shows a histogram of the fish size distribution
for the single echoes detected in the echogram.
C
(CD10206)
18
• The bottom plot shows the position within the beam of the
detected single echoes for the current ping (largest circles)
and the three previous ping (smaller circles).
• The upper right corner of the view shows the Biomass value
calculated from the total biomass of fish, plancton etc from
the current echogram.
Note that the colours used to display this information are
determined from the settings in the Colour Scale.
857-160970 / Rev.H
Page 28

Display views
If you place the cursor in the coordinate system, a small yellow
label will appear to give you a detailed readout of the target
strength in dB at the cursor’s position. This target strength
indicates the fish length (in cm or inches) or fish weight (in kg).
Related topics
→ Getting started, page 31.
→ Colour Scale, page 81.
Echogram and Range
The Echogram and Range view consists of an Echogram field
to the left and a Range field to the right. These are separated by
the vertical range axis. The Echogram field contains
information about the acoustical values, while the Range field is
used for specifying the range used in the Echogram field. The
settings in the Colour Scale is used to present the information.
In the echogram field, the presentation can be of different views.
This can be selected in echogram dialogue bok as 1x, 3x, 5x, or
all. Fore examle: If a 20 tranducer system; all selected, 20
echogram in the echogram filed.
When you place the cursor in the Echogram field, you can use
the mouse wheel to modify the gain setting, and hence the
display colour sensitivity. Each click of the wheel corresponds
to a 1 dB change. The same gain setting is available from the
Colour Scale dialogue box.
Whenever the cursor is located within the Echogram field, a
small yellow label is visible. The label provides the following
information:
• Left: Depth at the cursor position
• Middle: Diameter coverage from the transducer beam
• Right: Current gain setting
To change the range, you can also use the mouse wheel. Place
the cursor inside the Range fieldtodothis:
• In a surface related echogram you will modify the range,
while for a bottom related echogram, you will change the
start range.
• If you press the left mouse button while you use the mouse
wheel, the surface echogram will change its start value, while
the bottom related echogram will change its range.
857-160970 / Rev.H
Related topics
→ Getting started, page 32
→ Colour Scale, page 81
19
Page 29

Simrad ES60
Scope
The Scope view is the rightmost view and shows a oscilloscope
view of the last ping corresponding to the settings in the
Echogram view.
This view draws a range of horizontal symmetrical colour lines.
The distance from the vertical centre axis and the line colour
reflects the received echo amplitude. A black horizontal line
across the view indicates the current bottom view.
Channel:
Test presentation for passive or test mode
Passive:
Background Noise: yyy.y dBW
Receiver Amplitude: xxx.x dBW
Alongship angle: z.zz deg
Athwarthship Angle: z.zz deg
The background noise shown is the median of 20 equidistance
power samples in the total range of the current ping. The
receiver and the two angles (alongship and athwarthship) are
sampled at 100 m depth. During replay, you may find that this
depth setting is not availbale because the depth is less than 100
m. The receiver amplitude is then set to a minimum (235 dBW),
and the angles are set to zero.
20
857-160970 / Rev.H
Page 30
Status bar
Display views
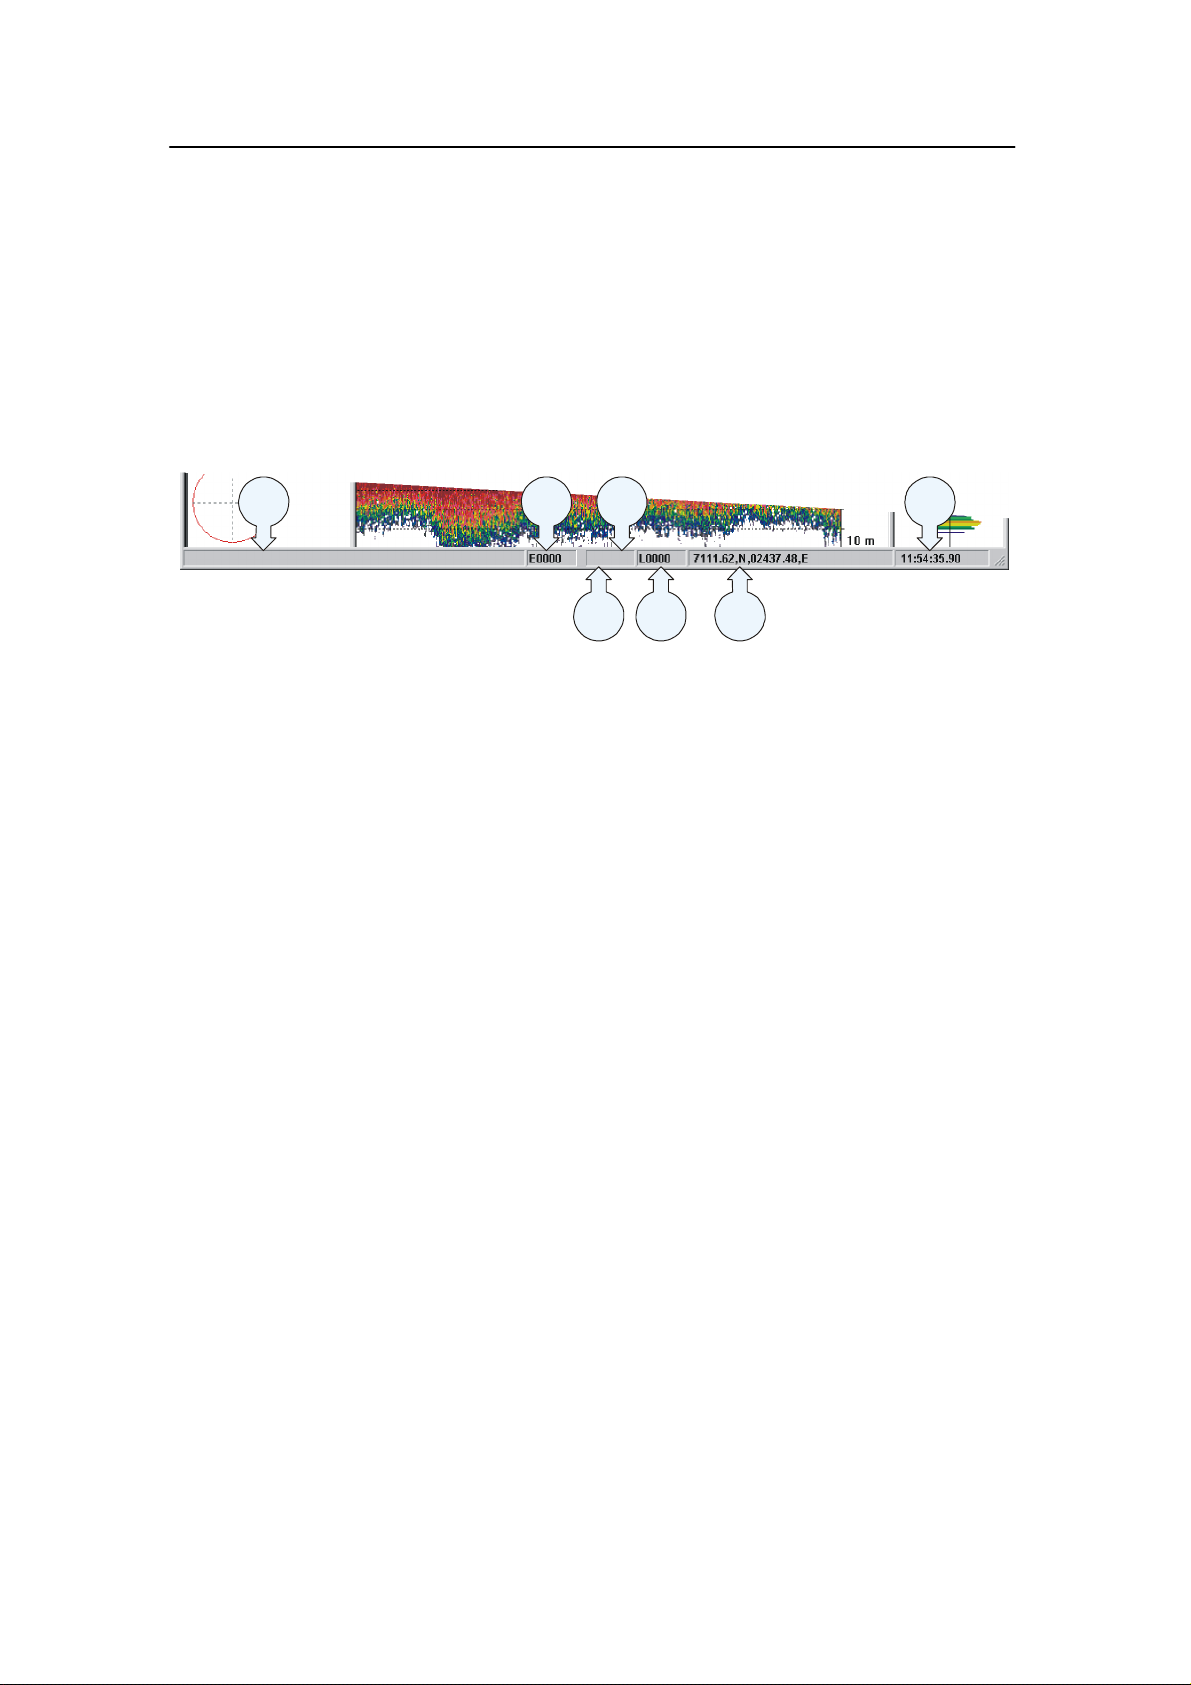
The ES60 Status bar is located at the bottom of the display. It
contains the following information:
Note that the water temperature read-out will only be available
if a sensor is connected to the echo sounder. Also, navigational
information requires that the applicable position information is
connected to the echo sounder.
(CD10208)
AB
(A) Information applicable f or the current operation
(B) Event number
(C) Printer logo (when printer is active)
(D) Current temperature
(E) Storage line number
(F) Navigational information (latitude and longitude)
(G) Time
Related topics
→ Status bar, page 66
C
D
E
F
G
857-160970 / Rev.H
21
Page 31

Simrad ES60
History and printer views
Overview
The echogram information provided on the display will differ
slightly from the information provided on the printer and in the
History files. This is because the annotation settings differ
between the two media.
The annotations provided for display output are controlled by
the Annotations dialogue box. When enabled in the Prister
and History dialogue box, the annotations will also be sent to
the printer and to the History files.
The Printer and History dialogue box also enables additional
annotations to be printed.
The most important difference is that the annotations added to
the echogram will only show in full on the printer and in the
History dialogue box. To demonstrate this difference, refer to
the two illustrations.
Related topics
→ History, page 95
→ Annotations, page 73
→ Printer and History, page 105
22
857-160970 / Rev.H
Page 32

Figure 5
Display
presentation
Display views
Display example
The first illustration shows an excerpt of the display view as it
appears during normal operation when several annotations have
been added.
The annotations are not displayed with all the information they
contain, they are merely added as vertical red lines.
The next illustration shows how the History window presents
the same echogram.
Printer example
A printout from the echo sounder is shown below.
From the top left corner, you can see the following annotations.
(1) A depth annotation. This information will automatically
appear at regular intervals, and whenever you change the echo
sounder’s depth range.
(2) An external annotation with the text “This is an ATS
annotation”. This annotation has been imported on the serial line
from the navigation system.
(3) Two annotations with navigational information. This
information appears with regular intervals when enabled from
the Printer and History dialogue box.
857-160970 / Rev.H
23
Page 33

Simrad ES60
2
1
3
4
6
5
7
8
9
(CD10210)
24
Figure 6 History and printer presentation
(4) One Event annotation with both navigational and time
information added. This annotation is controlled by the
parameters in the
on the printer output and in the History when you press the
Event number in the Status bar.
(5) One annotation with navigational information. This is
identical to item 3.
(6) One Tex t annotation with the text “Test in Horten”. This text
is entered in the Annotation dialogue box. You will need a
keyboard connected to your echo sounder to do this.
(7) Two annotations with navigational information. This is
identical to item 3.
Annotation dialogue box. It will only appear
857-160970 / Rev.H
Page 34

Display views
(8) One Event annotation with no additional information added.
The number shown (”0006”) is the event number. The
annotation appears on the printer output and in the History when
you press the Event number in the Status bar .
(9) One depth annotation. This is similar to item (1).
(Others) Several other annotations to provide examples.
To ad d Te xt , Time and Event annotation, you must open the
Annotation dialogue box. This box is accessed from the File
menu.
Additional text to the printer and History window is controlled
by the parameters in the
Printer and History dialogue box. This
box is accessed from the File menu.
857-160970 / Rev.H
25
Page 35

Simrad ES60
GETTING STARTED
Introduction
This chapter will guide you through the main operations of the
ES60 by the use of an operational example. The intention with
this chapter is to provide you with an overview of the main
functions in the echo sounder, and to demonstrate how the ES60
may be used in a realistic operational situation.
Related topics
→ Before you start, page 27
→ Start-up, page 28
→ Operation, page 30
→ Data storage, page 35
→ Operational procedures, page 37
26
857-160970 / Rev.H
Page 36

Before you start
Before you start the ES60, make sure that the necessary
hardware items are correctly installed and connected. The
transducer(s) must also be defined in the ES60 software on the
computer.
Related topics
→ ES60 Installation manual
Getting started
857-160970 / Rev.H
27
Page 37

Simrad ES60
Start-up
Overview
This chapter provides the basic procedure required to power up
the echo sounder and start the pinging.
Power-up procedure
After these initial preparations you can open the ES60 program
on the computer. The
detail in the Operational procedures chapter.
“power on” procedure is described in
The menu system
The menu system is based on the Microsoft Windows®
commercial standard interface. An overall explanation of the
menu system with a description of the various views are
presented in the Display views chapter.
Transceiver inspection
First, we need to check that the transceiver (or transceivers) are
connected.
Open the Install menu, choose the Transceiver command to
open the Transceiver Installation Mode dialogue box. In this
dialogue, press the Inspect button to open the Transceiver
Settings dialogue box.
You may now check that the transceivers are installed correctly.
Active transceivers appear in green text in the Frequency
Channel Selection box.
Click the Cancel button to finish.
If none of the transceivers listed appear in green text, check the
connections and re-install the transceiver(s).
Environmental parameters
To obtain correct values for the various acoustical parameters
calculated by the ES60 program, it is important that you provide
the ES60 program with accurate parameters describing the
environment; sea temperature, salinity and sound velocity.
These values are defined in the Environment dialogue box.
28
Open the Install menu, choose the Environment command to
open the Environment dialogue box.
Unless the default values are acceptable, you must select Fresh
or Salt water, and enter the current sound velocity. This
information is used to calculate depth and absorption
coefficient.
Click OK when you have finished.
857-160970 / Rev.H
Page 38

Getting started
Navigation interface
To link acoustical data with navigational data the ES60 must be
able to receive data provided by a GPS or another positioning
system. The Navigation Interface dialogue box is used to
define the parameters to achieve this.
Open the Install menu, choose the Navigation command to
open the Navigation Interface dialogue box.
Specify how the ES60 will receive navigational data. Since the
NMEA standard has been implemented, you only need to
choose between NMEA or ASCII.
If ZDA clock is available, the PC system clock can automatic be
synchronised with ZDA input. Then choose “Automatic Set
Clock”.
Click OK when you have made the setting.
Additional interfaces
Additional interfaces have been provided for other peripheral
systems.
• If you need to link recorded acoustical data with trawl
position data, choose the Trawl command on the Install
menu to specify the trawl position interface.
• If you need to connect your ES60 to a purse seine system,
choose the Purse seine command on the Install menu to
specify the purse seine system interface.
If you want to use a heave or a temperature sensor, choose the
Heave and Temperature commands on the Install menu to
specify these interfaces.
Related topics
→ Power on/off procedure, page 38
→ Display views, introduction, page 12
→ Frequency channels installation procedure, page 44
→ Transceiver Installation, page 117
→ Transceiver Settings, page 119
857-160970 / Rev.H
→ Environment, page 89
→ Navigation Interface, page 100
→ Heave Sensor, page 93
→ Temperature Sensor, page 116
→ Trawl Interface, page 122
→ Purse Seine, page 109
29
Page 39

Simrad ES60
Operation
Overview
This chapter describes a few of the most common functions used
during normal operation.
Selecting operational mode
You are now ready to start the actual operation of the ES60 echo
sounder. The first thing to do is to choose operational mode.
Open the File menu, choose Operation to open the Operation
dialogue box. In the Mode group, click Normal for normal
mode.
(You may alternatively click Replay for replay mode, but you
must then also click Files to choose a replay file. Note that
operating in replay mode will restrict you from changing certain
parameters during operation.)
Next, you need to define the ping rate. To do this, locate the
Ping Rate group box, and set the ping rate to Interval for
manual setting of the ping interval. For this exercise, set the
ping interval time to 1 second, and click OK to finish.
The echo sounder will now start pinging, and after a few
moments the echogram field on the display will present a new
echo line. The various fields on the display are explained in
detail in the Display views chapter.
Transceiver settings
The operational mode and the transceiver frequency are
displayed to the far left in the Header view. A dedicated
dialogue box - Transceiver Settings -isusedtodefinevarious
parameters associated with the transceiver. These settings
include transceiver mode, the depth of the transducer surface,
the transmit power, and the pulse length.
To open this dialogue box, position the cursor over the mode
and frequency information in the Header view, and click the
right
mouse button. Specify the estimated depth of the
transducer surface, and set Transmit Power to its maximum
value. Set the Pulse Length to a medium value of 1.024 ms (for
38 kHz), and click OK to accept the settings.
30
The chosen pulse length will result in an acceptable resolution
of approximately 0.75 m, and acceptable signal-to-noise ratios at
the depths considered in this example.
857-160970 / Rev.H
Page 40

Getting started
Note that if you operate in Replay mode, the transceiver settings
can not be changed.
Additional information about the transceiver settings are
available if you press the Advanced buttonintheTransceiver
Settings dialogue box.
Bottom detector settings
The Header view on the display is also used to present the
current depth. The Bottom Detector dialogue box is used to
define various parameters associated with the bottom detection.
These include the depth range, where the ES60 searches for the
bottom.
In our example we will assume that the depth will vary between
30 and 200 meters. Therefore, set Minimum Depth to 30 m and
Maximum Depth to 200 m. Click OK to accept the settings.
Note Setting both Minimum Depth and Maximum Depth to 0 m will
turn off bottom detection.
Colour scale
The Colour Scale field is used to display the colour scale for
mapping acoustical values. These colours are used in the Single
Echo and Echogram and Range views. Each colour always
represents a 3 dB value range. Using all 12 colours in the colour
scale thus enables mapping of a 36 dB value range to colours.
Position the cursor over the colour scale, click the right mouse
button to open the Colour Scale dialogue box. Accept the
default settings and click OK.
Single Echo view
The Single Echo view on the display contains information on
detection of single echoes. Two plots are visible in this view.
• One plot shows a histogram of the TS distribution for the
single echoes detected in the Echogram and Range view. For
an accurate x-axis value, place the cursor inside the
coordinate system, and read the value from the displayed
label.
857-160970 / Rev.H
• The other plot shows the position within the beam of the
detected single echoes for the current ping (largest circles)
and the three previous ping (smaller circles).
31
Page 41

Simrad ES60
• The upper right corner of the view shows the sAvalue
calculated using the integration values in the Echogram and
Range view.
Position the cursor in the Single Echo view, click the right
mouse button to open the Echo Trace dialogue box.
Click the TS Detection button to open the TS Detection
Parameters
dialogue box.
The TS Detection Parameters dialogue box contains
parameters used by the ES60 program to detect single echoes.
These parameters are essential for determining which echoes are
accepted as single echoes. Thus, if fish abundance estimation is
based solely on single echo detection, this estimate may be
affected by the choice of single echo detection parameters.
If you choose to store raw acoustical data during a survey, you
can later change the single echo detection parameters using
Replay mode. This allows you to examine the sensitivity of the
fish abundance estimation to the value of the single echo
detection parameters.
Click OK to accept the default settings and to exit the TS
Detection Parameters dialogue box. Click OK once more to
exit the Echo Trace dialogue box.
Echogram and Range view
The Echogram and Range view consists of an Echogram field
to the left and a Range field to the right. These are separated by
the range axis. The Echogram field contains information about
the acoustical values, while the Range fieldisusedfor
specifying the range used in the Echogram field.
Echogram field
The Echogram field is used to display acoustical values for
each ping. The settings in the Colour Scale are used to
determine the colour sensitivity in the echogram.
Position the cursor in the Echogram field, and click the right
mouse button to open the Echogram dialogue box.
The Echogram dialogue box allows you to define the area of
interest for the echogram. Your choice will affect the meaning
and the options in the Range fieldintheEchogram view. You
can also choose the TVG function used to calculate the
acoustical values.
32
In this example, choose Surface – Manual to enable a surface
related echogram. Then, choose the School gain TVG function
for calculating sV-values. Finally, click OK to accept the
settings.
857-160970 / Rev.H
Page 42

Getting started
Range field
The Range field allows you to read and specify the range used
in the Echogram field. The current range is displayed on the
range axis. In the Range dialogue box you can define the area of
interest for the echogram.
Position the cursor in the Range field, click the right mouse
button. Observe a dialogue box referring to either Surface or
Bottom depending on your choice in the Echogram dialogue
box.
In this case, check that you have the Surface Range dialogue
open.
Set Range to 200 m and Start Relative Surface to0m,then
click OK to accept the settings.
Comments to the Echogram and Range view
Two echograms are shown for each Channel. The second
echogram for the present Channel maybeusedinthecurrent
example to show the distribution of fish close to the bottom.
• Use the Echogram dialogue in the second Echogram view
to set the Echogram to Bottom and choose the School gain
TVG function for calculating SV-values.
• Use the corresponding Bottom Range dialogue to set Range
to 20 m and Stop Relative Bottom to 5 m for the echogram
to show values calculated from 15 m above the detected
bottom to 5 m below the bottom.
Remember that the area of interest defined in the Echogram
view is also used for the Single Echo Detection view limits.
When you place the cursor in the Echogram field, you can use
the mouse wheel to modify the receiver gain level, and hence
the display colour sensitivity. Each click of the wheel
corresponds to a 1 dB change. The same colour sensitivity
setting is available from the Color Scale dialogue box.
Whenever the cursor is located within the Echogram field, a
small yellow label is visible. The label provides the following
information:
• Left: Depth at the cursor position
• Middle: Diameter coverage at the transducer beam at the
current cursor position
857-160970 / Rev.H
• Right: Current gain setting
To change the range, you can also use the mouse wheel. Place
the cursor inside the Range fieldtodothis:
33
Page 43

Simrad ES60
• In a surface related echogram you will modify the range,
while for a bottom related echogram, you will change the
start range.
• If you press the left mouse button while using the mouse
wheel, the surface echogram will change its start value, while
the bottom related echogram will change its range.
Scope view
The Scope view is the rightmost view and shows a scope view
of the last ping corresponding to the settings in the Echogram
view.
This view draws a range of horizontal symmetrical colour lines.
The distance from the vertical center axis and the line colour
reflects the received echo amplitude. A black horizontal line
across the view indicates the current bottom view.
Related topics
→ Display views, introduction, page 12
→ Transceiver Settings, page 119
→ Advanced Transceiver, page 71
→ Bottom Detector, page 78
→ Colour Scale, page 81
→ Echogram, page 85
→ Surface Range, page 115
→ Echo Trace, page 84
34
857-160970 / Rev.H
Page 44

Data storage
Getting started
Overview
This chapter presents a brief description of the data storage
functionality.
Note that you can not perform all the operations described here
if your echo sounder does not have a keyboard.
Define storage parameters
It will often be beneficial to store some of the echo information
recorded during an operation. This allows you to change certain
parameter settings when operating in replay mode at a later
time.
Open the File menu, choose Store to open the Store dialogue
box.
Note Note that Store is not available when operating in Replay mode.
The Store dialogue box allows you to set various parameters
associated with data storage. You can define a specific directory,
and limit the file sizes.
Click Browse in the Survey box. Browse to the desired
directory for file storage, or enter the directory name directly
into the text box. If the directory does not exists it will be
created.
Click the Save Raw Data check box to save raw data. Define
maximum file sizes by entering the desired value in the Max
File Size box, and click OK to accept the settings.
When Save Raw Data is checked, the raw unprocessed
transceiver data containing amplitude and angle information for
the split beam transducers will be recorded.
Start and stop data storage
To start and stop data storing, use the Line field in the Status
bar.TheLine field is marked LXXXX and shows the current
survey line number.
857-160970 / Rev.H
Position the cursor over the Line field in the Status bar and
click the left mouse button. Observe that the survey line number
increments, and that the line colour changes from black to red.
35
Page 45

Simrad ES60
To stop data recording click the Line field again.
The red colour indicates that data recording is active. When the
recording stops, the colour is changed back to black. The file
names used for the stored data are determined by the survey line
number and the date and time when recording started. A new
file is created for each new survey line number.
Note that the depth range used for data collection and data
storing is determined from the maximum range settings in the
Echogram view, the bottom detection settings, and the settings
in the BI500 dialogue box.
Related topics
→ Store, page 113.
36
857-160970 / Rev.H
Page 46

OPERATIONAL PROCEDURES
Overview
This chapter contains a number of specific procedures to be
used with your ES60 echo sounder.
Topics
→ Power on/off, page 38
→ Basic operations, page 40
→ Transceiver installation, page 44
→ Record and playback, page 46
→ Software installation and upgrade, page 51
→ Size distribution, page 54.
Operational procedures
857-160970 / Rev.H
37
Page 47

Simrad ES60
Power on/off
Use the following procedures to switch the ES60 echo sounder
on and off.
Power on
It is assumed that the echo sounder’s hardware and software are
properly installed and configured.
1 Switch power on.
- The location of the power switches are individually
assigned. The computer has its own power switch. The
transceiver(s) must be connected to separate power
supplies, and should have a remote power switch.
2 Observe the hardware test messages and operating system
start-up messages.
- It takes a couple of minutes before the echo sounder
window appears on the display.
The echo sounder memorises all its settings when power is
switched off.
If pinging does not start you must check the settings in the
following dialogue boxes:
• Operation
• Layout
• Transceiver Settings
• Transceiver Installation
If you are not successful you should use this procedure:
1 Check the Transceiver Installation dialogue box.
2 All frequency channels must be properly installed.
3 Select Factory settings in the
Options menu.
Power off
To switch off the ES60 echo sounder, observe the following
procedure.
1 Select Shutdown on the File menu.
38
2 Allow the computer to close all the echo sounder software
applications.
- The computer power is switched off.
3 Switch off power.
4 Switch off the power on the General Purpose Transceiver
and other peripherals (if any).
857-160970 / Rev.H
Page 48

Related topics
→ Operation, page 102
→ Layout, page 99
→ Transceiver Settings, page 119
→ Transceiver Installation, page 117
→ Options menu, page 61
Operational procedures
857-160970 / Rev.H
39
Page 49

Simrad ES60
Basic operations
Overview
This chapter presents a number of common procedures
frequently carried out on the ES60 echo sounder.
Changing the echogram settings
To change the echogram settings:
1 Position the cursor in the Echogram field.
2 Click the right
3 Observe the
mouse button.
Echogram dialogue box.
4 Make the required changes.
Related topics
→ Echogram, page 85
Changing the range
To change the range:
1 Position the cursor in the Range field.
2 Click the right mouse button.
3 Observe the Bottom Range or Surface Range dialogue
box.
4 Make the required changes
or:
1 Place the cursor in the Range field.
2 Use the mouse wheel to change the range.
40
Related topics
→ Bottom Range, page 80
→ Surface Range, page 115
Changing the vertical resolution
The vertical resolution of the echogram increases with a shorter
pulse length.
For example, a pulse length of 1.024 millisecond gives a vertical
resolution of 19.2 cm, whereas a pulse length of 0.256
millisecond gives a vertical resolution of 4.8 cm. If the vertical
distance between two echoes is less than this, the two echoes
will be shown as one
857-160970 / Rev.H
Page 50

Operational procedures
To change the pulse length:
1 Position the cursor over the frequency information in the
Header view, and click the right mouse button.
-TheTransceiver Settings dialogue box opens.
2 Move the pulse length slider to the desired pulse length
value.
3 Click Ok.
A small value gives the best resolution, while larger values are
mostly used for navigation and fishing in deep waters.
Related topics
→ Header view, page 17
→ Transceiver Settings, page 119
Changing the transmit power
To change the transmit power:
1 Position the cursor over the frequency information in the
Header view, and click the right mouse button.
-TheTransceiver Settings dialogue box opens.
2 Move the transmit power slider to the desired value.
3 Click Ok.
Related topics
→ Header view, page 17
→ Transceiver Settings, page 119
Setting minimum and maximum depth
Setting the minimum and maximum depth controls where the
echo sounder will search for bottom lock.
Note Setting both Minimum Depth and Maximum Depth to 0 m will
turn off bottom detection.
857-160970 / Rev.H
1 Position the cursor over the depth information in the
Header view, and click the right
mouse button.
-TheBottom detector dialogue box opens.
2 Set minimum and maximum depth to the desired values.
3 Click Ok.
41
Page 51

Simrad ES60
Related topics
→ Header view, page 17
→ Bottom Detector, page 78
Enabling the depth alarms
You can set individual alarms for minimum and maximum
depth. You can also enable an alarm to sound off if the bottom
track is lost.
1 Position the cursor over the depth field in the Header
view, and click the right mouse button.
-TheBottom detector dialogue box opens.
2 Set the values for minimum and maximum depth alarm.
3 Enable the alarms by ticking the appropriate boxes.
4 Enable the BottomLostWarningif required.
5 Click Ok.
Related topics
→ Header view, page 17
→ Bottom Detector, page 78
Adding annotations
You can add several different annotations to the displayed and
printed information. All annotations are automatically
displayed, while you need to enable the annotations to be
printed.
Enable annotations to be printed
1 Select Print on the File menu.
-The
2 Under Text to printer, click Annotation.
3 Click OK to exit.
The annotations will be printed until this procedure is repeated.
Printer and History dialogue box opens.
42
Enter annotations
Three different annotations may be controlled from the
Annotations dialogue box.
1 Select Annotation on the
File menu.
-TheAnnotation dialogue box opens.
2 To enter a single text annotation to the display:
857-160970 / Rev.H
Page 52

Operational procedures
a Enter the desired annotation text into the Te x t box. A
keyboard must be connected to the echo sounder to
allow this.
b Click OK.
c The text you entered is displayed immediately, but it
will not be repeated.
3 To add the current time as an annotation:
a Under Time, click Active.
b Enter the desired interval (in seconds) between the
annotations.
c Click OK.
d The annotation will be repeated at the chosen interval
until it is switched off.
4 To add an event annotation:
a Under Event, select a start number.
b Click Increase or Decrease to count the Event number
up or down.
c Click Add Time if you wish the event annotation to
include the current time.
d Click Add Navigation if you wish the event annotation
to include the current position.
e Click the Event buttonontheStatus bar every time
you wish the annotation to be added to the display
and/or print.
Enable external annotations
The echo sounder will accept external text annotations when
these are input on the serial line. This function is permanently
enabled.
Related topics
→ Annotation, page 73
→ Printer and History, page 105
857-160970 / Rev.H
→ Annotation format, page 74
43
Page 53

Simrad ES60
Transceiver installation
Overview
Use the following procedures to install, modify or delete
frequency channels from the echo sounder set-up.
General Purpose Transceivers (GPT) physically connected to the
echo sounder’s Ethernet interface are identified automatically by
the system. When you open the Transceiver Installation
dialogue box from the Install menu, a list will be provided.
The ISA bus is also searched for PC Transceiver plug-in boards,
and these are displayed in the same list.
A single frequency transceiver occupies one entry in the list, and
a dual frequency transceiver occupies two. Each entry is
identified as a frequency channel, and the line displays the
parameters for the channel. Entries in the frequency channel list
are shown in black, green or red colour identifying its current
status.
To install a channel
1 Select Transceiver on the Install menu.
2 Select Modify in the Transceiver Installation Mode
dialogue box.
-TheTransceiver Installation dialogue box opens, and
you are allowed to make changes.
3 Click the desired entry (one of the black colour line
alternatives) in the Frequency Channel Selection list.
4 Assign a transducer by selecting a transducer name in the
Transducer Selection list.
5 Click OK to accept the choice and exit the dialogue box.
6 Restart the echo sounder as described below.
To uninstall a channel
1 Select Transceiver on the Install menu.
2 Select Modify in the Transceiver Installation Mode
dialogue box.
-TheTransceiver Installation dialogue box opens, and
you are allowed to make changes.
44
3 Click the desired entry in the Frequency Channel
Selection list.
4 Select the alternative NONE in the Transducer Selection
list.
857-160970 / Rev.H
Page 54

Operational procedures
5 Click OK to accept the choice and exit the dialogue box.
6 Restart the echo sounder as described below.
To modify an IP address
This procedure allows you to modify the IP address of the
currently selected General Purpose Transceiver (GPT).
1 Select Transceiver on the Install menu.
2 Select Modify in the Transceiver Installation Mode
dialogue box.
-TheTransceiver Installation dialogue box opens, and
you are allowed to make changes.
3 Select the General Purpose Transceiver (GPT) you wish to
modify.
4 Click the Set New GPT IP Address button.
-TheIP Address dialogue box opens.
5 Enter the new IP address.
- The significance of the address numbers is described
with the IP Address dialogue box.
6 Click OK to accept the choice and exit the dialogue box.
7 Click OK to exit the Transceiver Installation dialogue
box.
8 Restart the echo sounder as described below.
Related topics
→ Transceiver Installation, page 117
→ IP Address, page 96
Restart the echo sounder
Whenever a change has been made to any of the frequency
channels, you must restart the echo sounder.
1 Select Operation on the File menu.
-TheOperation dialogue box opens.
2 Select Normal operation, and click OK.
857-160970 / Rev.H
Related topics
→ Operation, page 102
45
Page 55

Simrad ES60
Record and playback
Overview
You can set up the echo sounder to record the unprocessed
transducer signals on the internal harddisk or other recordable
media. This recorded signal may later be injected into the echo
sounder’s processing software as if it arrived directly from the
transceiver.
During this replay, you may experiment with some of the echo
sounder settings.
This feature is useful during training and demonstration. It is
also useful for memorising a particularly interesting observation
at the fishing grounds.
You can also use the built-in History functiontorecord
echogram data.
Record
Preparations
The recording is prepared as follows.
1 Select Store on the File menu.
- Observe the Store dialogue box appear.
2 Select the complete path of the survey directory.
- The directory is selected when you click the OK
button. Click the Browse button if you wish to navigate
through the disk directories. A new directory is created
if the requested does not exist.
3 Select if you wish to save raw and/or output data.
- Raw data: The unprocessed transceiver data are stored
in standard computer files. These files contain all the
necessary data for reconstruction of the situation during
the real survey. Thus the data include amplitude, phase,
navigation data, annotation input etc. The echo sounder
program reads these files during replay.
- Output data: This is the processed output data;
navigational data, bottom detections, annotations etc
- xyz data: This is processed and interpolated xyz data
in ASCII format. Note that navigation input must be
available.
46
4 Select the initial line number.
5 Enter the maximum size of each replay file.
6 Click Ok.
857-160970 / Rev.H
Page 56

Operational procedures
Start recording
Use the Line fieldintheStatus bar to start the recording.
1 Position the cursor over the Line field.
2 Press the left mouse button.
The line number increments, and the Line field is presented
with a red colour.
Stop recording
To stop the recording:
1 Click the Line field once again.
- The original colour is restored.
Size of stored raw data
The total size of raw data files stored on disk during operation
depends on several user selections. From these selections you
may estimate approximately the total amount of raw data stored
in a given time period for each installed channel using the
following equation:
X =(B bytes per sample) S ((8 S R) / (c S tau samples per ping))
S (M ping per sec) S 24 S (3600 sec per day) S (K days)
Where:
X = Total amount of stored raw data in bytes for one channel
B = 4 (Given by the echo sounder)
R = Maximum range in meters (User set)
c = Sound speed in water in meters per sec (User set)
tau = Pulse duration in seconds (User set)
M = Ping rate in ping per seconds (User set)
K = Number of operating/storage days (User set)
Thus, you can affect the amount of stored raw data by changing
e.g. the range, pulse duration, and ping rate settings.
Example:
With range = 10 m, pulse length = 256 µS, 15 pings per second
and sound velocity = 1500 m/s, the storage requirement will be
45 Mb per hour. If you increase the range to 80 m, and reduce
the ping rate to 7 pings per second, the storage requirement will
be 60 Mb per hour.
857-160970 / Rev.H
Related topics
→ Store, page 113
→ Status bar and Line field, page 66
47
Page 57

Simrad ES60
Playback
When replaying the recorded signal, the ping rate is not limited
by the speed of sound in water. Hence, a higher ping rate is
possible during replay than during normal operation.
The playback is started as follows:
1 Select Operation on the File menu.
- Observe the Operation dialogue box appear.
2 Click Replay.
3 Click Files...
- Observe the Replay dialogue box appear.
4 Select survey with the standard file selection dialogue.
5 Click on the file(s) you wish to replay.
- Observe that the currently selected file(s) appear in the
Selected files list box.
6 Click Loop if you wish the replay to loop through the
selected file(s) endlessly.
7 Click Save Output Data if you wish to record the file(s)
in processed format during playback.
- The files are stored with the same name and in the
same location as the raw data files, but with the file
extension *.OUT
8 Click OK to return to the Operation dialogue box.
9 In the Operation dialogue box, click OK to start the
playback.
If you do not select Loop, the replay is stopped when the last
recorded ping has been processed.
Related topics
→ Operation, page 102.
→ Replay, page 110.
History
The History function is used to store echograms on bitmap
format. The echo sounder may continuously save echogram
pictures to the internal harddisk or an other recordable media.
These can later be recalled on the display. The information in
the History window is the same as on the printer.
48
The horizontal width of each echogram picture roughly
corresponds to the the half width of the display. The number of
history files is limited. After reaching the maximum number of
files, the newest echogram picture overwrites the oldest one.
The history function allows you to quickly look through
echogram pictures covering several hours.
857-160970 / Rev.H
Page 58

Operational procedures
Record
To st ar t History recording:
1 Select Operation on the File menu.
- Observe the Operation dialogue box appear.
2 Click Save in the History field.
3 Click Browse to select disk directory.
4 Click Ok to start the recording.
To st op History recording:
1 Select Operation on the File menu.
- Observe the Operation dialogue box appear.
2 De-select Save.
3 Click Ok.
Playback
To view the information recorded by the History function:
1 Select History on the View menu.
2 Browse the information in the History dialogue box.
The information provided by the History view is presented in a
separate window. The echo sounder will operate normally in the
background. However, you will not have access to any of the
menues as long as the History window is open. When you wish
to focus on the echo sounder operation, close or minimize the
History window.
Print the current History information
To print the current view in the History window:
1 Select History on the View menu.
2 Press the printer symbol in the bottom right corner to print
a single history file.
- Note that only the file presented on the display is
printed.
Print multiple History files
857-160970 / Rev.H
To print several images recorded by the History function,
follow this procedure.
Note that a keyboard is required.
1 Select History on the View menu.
2 Browse the information in the History dialogue box until
you find the images you wish to print.
49
Page 59

Simrad ES60
A
(CD5639A)
B
(A) Press to print current view
(B) Press to print multiple views
3 Press the left printer icon (with the + sign) in the lower
right corner of the History window.
4 Press the Ctrl key on the keyboard and the left mouse
button simultanously to select the images to be printed.
50
5 Press the right mouse button, observe the shortcut menu.
6 On the shortcut menu, select Print.
7 Press Cancel to close the dialogue box.
Related topics
→ History window, page 22
→ History, page 95
→ Status bar; page 66
→ Operation; page 102
857-160970 / Rev.H
Page 60

Software installation and upgrades
Overview
The echo sounder is initially delivered with all necessary
software installed and configured. Software upgrades are useful
if your echo sounder fails, and you suspect a software error. An
upgrade is also required whenever the echo sounder software is
modified.
The computer should automatically detect the insertion of the
CD-ROM and open the Installation program dialogue box. If
this is not the case, you must manually run the Setup.exe
program on the CD-ROM’s root directory.
When the echo sounder software is upgraded, the software will
automatically detect the presence of General Purpose
Transceiver(s), but you will need to check that the correct
transducer(s) are enabled.
Operational procedures
Whenever new echo sounder software is installed, you will need
to define all serial lines, transducer(s) and transceiver(s).
Related topics
→ Transceiver installation procedure, page 44.
Software installation procedure
Use this procedure if you need to install the software on a new
computer. Note that minimum hardware and software
requirements must be met by the computer.
1 Connect a keyboard to the echo sounder., or start the
On-screen keyboard application (normally located under
Accessories and A ccessibility).
2 Switch on the echo sounder.
3 Insert the software CD.
4 Observe the Installation program dialogue box open.
5 If your Processor Unit is equipped with a built-in PCT
transceiver, you must enter the correct values for I/O,
DMA and IRQ. These values are given on the CD cover.
857-160970 / Rev.H
6 Press Complete installation.
7 Allow the echo sounder installation to run. Follow the
instructions provided.
8 When requested, enter the license number.
- This number is located on the CD cover. This number
is unique for each individual echo sounder.
51
Page 61

Simrad ES60
9 Click OK when prompted to reboot the system.
Software upgrade procedure
1 Connect a keyboard to the echo sounder., or start the
On-screen keyboard application (normally located under
Accessories and A ccessibility).
2 Switch on the echo sounder.
3 Insert the software CD.
4 Observe the Installation program dialogue box open.
5 Press Update installation.
6 Allow the echo sounder installation to run. Follow the
instructions provided.
7 When requested, enter the license number.
- This number is located on the CD cover. This number
is unique for each individual echo sounder.
Un-installation procedure
Use this procedure if you need to remove all the echo sounder
software from the computer. Note that all data in the ES60
directory will be erased.
1 Power up the computer.
2 Insert the ES60 CD-ROM.
3 Observe the Installation program dialogue box open.
4 Press Uninstall.
5 Allow the echo sounder un-installation program to run.
Follow the instructions provided.
Software on a third party computer
The ES60 may operate with a locally purchased computer,
provided that this computer meets the minuimum requirements
defined by Simrad Horten. If in doubt, consult your dealer.
To install the software and operate the echo sounder from a third
party computer, you will need to set up the computer correctly,
and you will need a separate licence number.
52
How to set up the computer
This procedure assumes that you are familiar to the operating
system. DO NOT attempt to set up the computer if you are
unfamiliar with the settings described here, but consult your
dealer.
857-160970 / Rev.H
Page 62

Operational procedures
1 Open the Control Panel to access the Network
connections.
2 Open the Local area connection.
3 Press Properties.
- Observe the Local Area Connection Properties
dialogue box appear.
4 Select the General tab, and click on Internet Protocol
(TCP/IP)
5 Press Properties.
- Observe the Internet Protocol (TCP/IP) Properties
dialogue box appear.
6 Click Use the following IP address, and enter the
following IP address: 157.237.14.12
- The Subnet mask will automatically be set to
255.255.0.0.
7 Click OK to accept the choice and to close the Internet
Protocol (TCP/IP) Properties dialogue box.
8 Click OK in the remaining dialogue boxes until all are
closed.
9 Restart the computer.
857-160970 / Rev.H
53
Page 63

Simrad ES60
Size distribution
Purpose
If your ES60 is equipped with a splitbeam transducer, this
procedure will provide you with the means to establish size
distribution of anchovies and other pelagic schooled fish such as
herring, capelin, sardines, horse mackerel, pilchard and tuna.
Procedure
Observe the following procedure to enable size distribution.
1 Set up two echo frames.
2 Right-click in each echo frame to open the Echogram
dialogue box, and observe the following settings:
a Top frame:
- Echogram: Surface-Manual
- Bottom: White line
- Variable depth: On
- Range other: On
- Gain: School
- Ping filtering: Medium
b Bottom frame:
- Echogram: Surface-Manual
- Bottom: White line
- Variable depth: On
- Range other: Off
-Gain:Fish
- Ping filtering: Medium
3 Right-click on top of the mode and frequency information
in the Header view to open the Transceiver Settings
dialogue box. Make the following settings:
- Pulse length: 0,1 ms (or shortest)
- Transmit power: 1 kW (or maximum)
4 Right-click on the depth value in the Header view to open
the Bottom Detector dialogue box. Make the following
settings:
- Minimum depth: 0 m
- Maximum depth: 500 m (If the current depth is deeper
than 500 m, det the maximum depth to 50% more than
the current depth.
- Alarms and warnings: Off
- Backstep minimum level: -50 dB
54
857-160970 / Rev.H
Page 64

Operational procedures
- Bottom smoothing: On
- Alternative bottom detector: Off
5 Right-click on the colour bar in the Header view to open
the Colour Scale dialogue box. Make the following
settings:
- No TVG: 70
- School gain: 70 (or less, depending on fish size)
- Fish gain: 70 (or less, depending on fish size)
- Bottom gain: 60
- Limit regulation gain: Off
These settings will bring up two echo frames similar to the one
provided below.
857-160970 / Rev.H
In the window, set the following ranges:
6 Right-click in the upper Range fieldtoopentheSurface
Range dialogue box. Set the upper window from 0 to 100
meter.
7 Right-click in the lower Range fieldtoopentheSurface
Range dialogue box. Set the range to 25 to 75 meter, or
around the depth of the school.
8 Read the estimated size in the lower Single Echo View.
55
Page 65

Simrad ES60
Adjusting to obtain correct fish length
Once an actual catch has been landed, you can adjust the echo
sounder reading to obtain correct fish size.
1 On the Install menu, select Fish to open the Fish Select
dialogue box.
2 Use the appropriate sliders to adjust the fish length.
56
857-160970 / Rev.H
Page 66

REFERENCE GUIDE
Overview
This chapter describes the menus and dialogue boxes in detail.
Related topics
→ Echo sounder menus, page 58
→ Dialogue boxes, page 68
→ Status bar, page 66
Reference guide
857-160970 / Rev.H
57
Page 67

Simrad ES60
Menus
Main menu
The Main menu contains the following options:
→ File, page 59
→ View, page 60
→ Options, page 61
→ Install, page 63
→ Step, described below .
→ Help, page 65
Note that a number of dialogue boxes are accessed directly
using right-click on certain display fields.
Step!
In single-step mode you command the echo sounder to perform
one ping at a time by left-clicking the Step command. This
command does not activate any separate menus or dialogue
boxes.
See the Operation dialogue box for further details.
Related topics
→ Direct access to dialogue boxes, page 15
→ Operation, page 102
58
857-160970 / Rev.H
Page 68

Reference guide
File menu
The following commands are available on the File menu:
→ Operation, page 102
→ Store, page 113
→ Annotation, page 73
→ Print, page 105
→ Shutdown, page 90.
Operation
This command option opens the Operation dialogue box. Use
these parameters to set echo sounder ping mode parameters;
normal/replay, ping interval etc.
Store
This command option opens the Store dialogue box. Use this
dialogue box to record data.
Annotation
This option opens the Annotation dialogue box. In this dialogue
box you can enter an annotation text message to be printed on
the echogram and/or saved to the current file.
Print
This command option opens the Printer and History dialogue
box. Use it to set printer parameters controlling echogram
printout on paper.
Shutdown
Select this command to terminate the echo sounder program.
Note You must always use this command before you turn off power!
857-160970 / Rev.H
59
Page 69

Simrad ES60
View menu
The View menu contains the following options:
→ Layout, page 99
→ History, page 95
Layout
This command opens the Layout dialogue box. Use it to modify
the layout of frequency channels on the display.
History
This command opens the History dialogue box. This is used to
activate a dialogue for viewing previously recorded echograms.
60
857-160970 / Rev.H
Page 70

Reference guide
Options menu
The following commands are available on the Options menu:
→ Language, page 98
→ Depth unit, see below
→ Temperature unit, see below
→ Palette, see below
→ Beeper, see below
→ Save settings, see below
→ Restore settings, see below
→ Factory Settings, page 91
Language
This entry opens the Language dialogue box for language
selection.
Depth unit
All depth values are expressed in meters, English feet (1 ft =
0.3048 m), nautical fathoms (1 ftm = 1.852 m) or Italian Passi
Braccia (1 pb = 1.65 m). The Depth Unit entry activates a
submenu to select one of these alternatives.
Temperature unit
Water temperature is shown in degrees Celsius or degrees
Fahrenheit on the Status Bar.TheTemperature Unit entry
activates a submenu to select one of the two alternatives.
Palette
Different light intensities on the display are provided according
to IMO (International Maritime Organisation)
recommendations. A bright display is required on a sunny
summer day, and a low light intensity is required at night in
order not to ruin the night vision of the crew at the bridge of the
vessel. The Palette entry activates a submenu to select the
display brightness.
Beeper
This entry activates a submenu to control when the audible
warning signal is active to alert about status messages and
alarms. No dialogues are provided.
857-160970 / Rev.H
Save settings
The echo sounder memorises all its parameter settings between
power is turned off until it is turned on again at a later time. The
Save Settings entry writes a snapshot of all parameter settings
into static memory. No dialogues are provided.
61
Page 71

Simrad ES60
Restore settings
This entry reads parameter settings from static memory into the
echo sounder application. No dialogues are provided.
Factory settings
This entry copies the default factory settings back into the
sounder. A proper clean-up of the complete menu system is
sometimes required in order to escape from unintentional
deadlocks. A dedicated dialogue box is used to acknowledge the
function.
62
857-160970 / Rev.H
Page 72

Reference guide
Install menu
The following commands are available on the Install menu:
→ Transceiver, page 117
→ Environment, page 89
→ Navigation, page 100
→ Trawl, page 122
→ Purse Seine, page 109
→ Heave, page 93
→ Temperature, page 116
→ Fish, page 92
→ BI500, page 76
Transceiver
This command opens the Transceiver Installation dialogue box.
Use this to install a new transceiver, and to assign a transducer
to each frequency channel.
Environment
Select this command to open the Environment dialogue box.
The settings here are used to select salt or fresh water
absorption, and to enter the sound velocity value.
Navigation
This command opens the Navigation Interface dialogue box. In
this box, you can select communication parameters for the
NMEA interface, and select input/output telegrams.
Trawl
This command option opens the Trawl Interface dialogue box.
Use these parameters to select trawl instrumentation
communication parameters; input/output telegrams.
Purse seine
This command option opens the Purse Seine dialogue box. Use
these parameters to select trawl instrumentation communication
parameters; input/output telegrams.
Heave
This command opens the Heave Sensor dialogue box. It is used
to select heave input source; analogue or RS-232.
857-160970 / Rev.H
Temperature
This command option opens the Temperature Sensor dialogue
box.
Fish
This command option opens the Fish Select dialogue box.
63
Page 73

Simrad ES60
BI500
This command option opens the BI500 dialogue box.
64
857-160970 / Rev.H
Page 74

Reference guide
Help menu
The Help menu contains the following options:
• Contents
• About the echo sounder
Contents
This command opens the on-line user manual. This user manual
is an HTML based document compiled to the CHM format
designed by Microsoftt.
The content of the on-line user manual is identical to the first
chapters in the printed manual.
The on-line manual is also accessed directly as context sensitive
help from the various dialogue boxes used throughout the echo
sounder software.
About the echo sounder
This command opens the About box. This box is for
information only. It provides the current software version and
the copyright information.
857-160970 / Rev.H
65
Page 75

Simrad ES60
Status Bar
The Status Bar at the bottom of the screen displays status
messages, event number, printer active symbol, water
temperature, navigational data (latitude and longitude) and time
of day.
(CD10208)
AB
The following information is provided on the Status bar:
(A) Information - Various messages are displayed in this field;
warnings, status, information text.
(B) Event - This field implements a push button for generating
an annotation of the “event” type. The event number is
automatically incremented or decremented by one for each new
event. The current event number is displayed.
(C) Printer - A printer symbol is displayed whenever echogram
printing is active. Printing is delayed until the echogram page
has been completed.
(D) Temperature - Water temperature is displayed in degrees
Celsius or in degrees Fahrenheit provided a temperature sensor
is connected to the system.
C
D
E
F
G
66
(E) Storage line number - This field acts as a toggle button. A
left-click starts a recording, and another left-click terminates the
recording. The line number is automatically incremented by one
every time you start the recording. The current line number is
displayed on the button facea, and it is shown with red colour
during recording. The recording is controlled by the Store
dialogue box.
(F) Navigational data - Geographical latitude and longitude
from the navigation receiver is displayed.
(G) Time - Local time of day is displayed. A small popup
window showing the current date appears when positioning the
cursor inside the time field. During replay, this field is used as a
timer.
857-160970 / Rev.H
Page 76

Related topics
→ Recording procedure, page 46
→ Store, page 113
→ Print and History, pages 105
→ Print Setup, page 107
Reference guide
857-160970 / Rev.H
67
Page 77

Simrad ES60
Dialogue boxes
Introduction
The following chapters describe in detail all the dialogue boxes used in the ES60 echo
sounder. The dialogue boxes are presented in alphabetical order.
→ Advanced Navigation, page 69
→ Advanced Transceiver, page 71
→ Annotation, page 73
→ BI500, page 76
→ Bottom Detector, page 78
→ Bottom Range, page 80
→ Colour Scale, page 81
→ Depth Output, page 83
→ Echo Trace, page 84
→ Echogram, page 85
→ Environment, page 89
→ Exit, page 59
→ Factory Settings, page 91
→ Fish Select, page 92
→ Heave Sensor, page 93
→ History, page 95
→ IP Address, page 96
→ Language, page 98
→ Layout, page 99
→ Navigation Interface, page 100
→ Operation, page 102
→ Printer and History, page 105
→ Print Setup, page 107
→ Purse Seine, page 109
→ Replay, page 110
→ RS-232 Setup, page 112
→ Store, page 113
→ Surface Range, page 115
→ Temperature Sensor, page 116
→ Transceiver Installation, page 117
→ Transceiver Settings, page 119
→ Trawl Interface, page 122
→ Trawl Range, page 124
68
857-160970 / Rev.H
Page 78

Reference manual
Advanced Navigation
The Advanced Navigation dialogue box is accessed from the
Navigation Interface dialogue box. The Navigation Interface
dialogue box is in turn available from the Install menu.
857-160970 / Rev.H
NMEA Sentence
These boxes specify which type of NMEA navigation sentence
should be automatically interpreted.
All means that any GLL, GGA and GXA sentences are
interpreted.
ASCII Setup
Use this protocol if you wish to receive data on ASCII format.
Decoding is based on a user specified datagram identification.
The information substring within the datagram may be
identified by specifying the position of the start field, the
number of fields to be extracted and the field separator.
69
Page 79

Simrad ES60
No. of fields - Identify the total number of fields in the ASCII
message.
Start field - Identify which of the fields in the message is the
start field.
Field separator - Identify which ASCII character is used to
separate the fields in the message.
Terminator - Identify which character is used to terminate the
message.
Related topics
→ Navigation Interface, page 100
70
857-160970 / Rev.H
Page 80
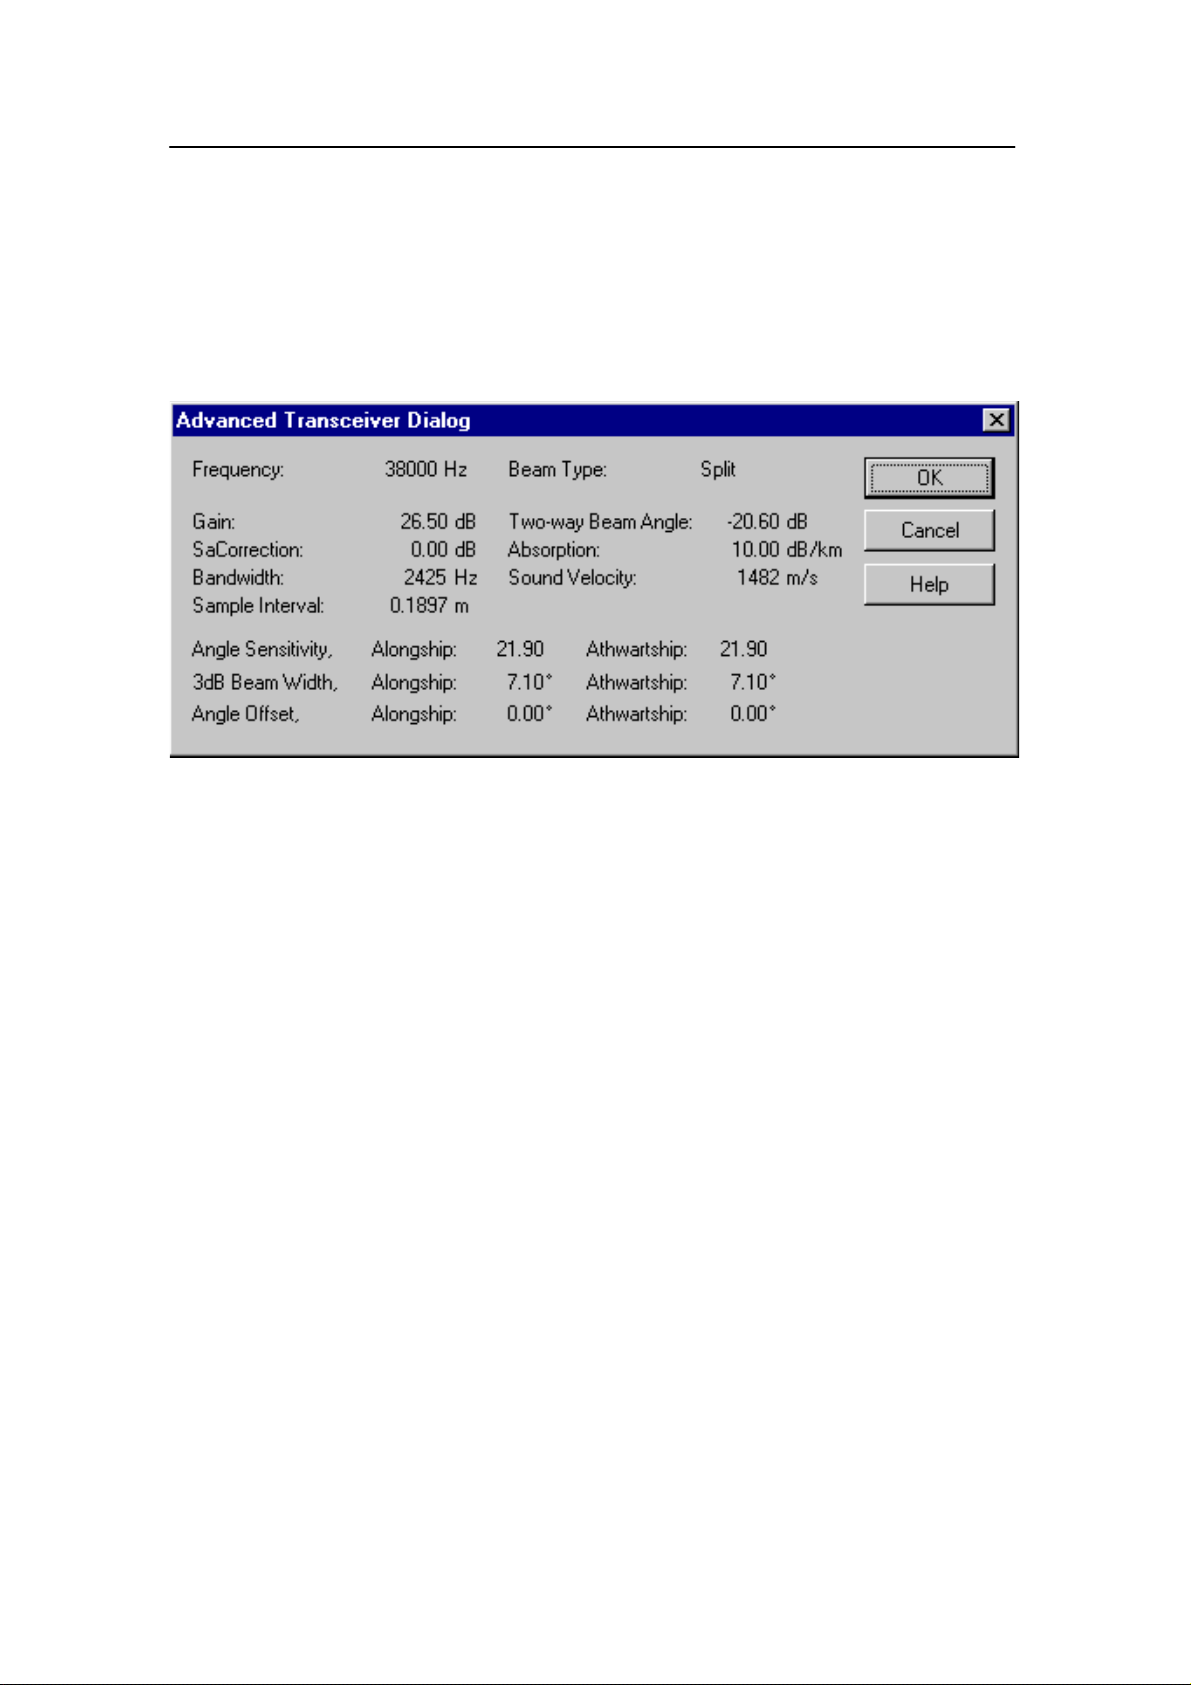
Reference manual
Advanced Transceiver
This dialogue box is accessed from the Transceiver Settings
dialogue box. It displays detailed numeric information
characterising the channel. This includes transducer parameters,
exact transmit frequency and receiver processing parameters.
Parameters
The parameters shown in this dialogue box are determined
during the transceiver installation procedure.
The descriptions are included for information only. You do not
need to understand these parameters to operate the echo sounder.
Frequency [Hz] - This is the nominal resonant frequency for
the transducer.
Beam type - Three different transducer beam types are
available: Single, Split and Triple. If your system is capable of
operating a Split- or Triple beam transducer, it will also be able
to measure the position of a target in the beam. The echo
sounder can then compensate for the known beam pattern to
obtain a true target strength.
Gain [dB] - The transducer gain presented by calculating the
directivity multiplied with the transducer’s efficiency. The value
is obtained during system calibration. If no calibration takes
place, the manufacturer’s default setting is used.
Two -wa y b ea m a ng le [d B] - This is a key transducer
parameter. The value describes the solid angle at the apex of the
ideal conical beam.
857-160970 / Rev.H
Sa Correction [dB] - This parameter is determined during the
calibration process. The value represents the correction required
to the Sv constant to harmonize the TS and sA measurements.
71
Page 81

Simrad ES60
Absorption [dB/km] - This value describes the absorption of
sound in the water. The default values are computed according
to Francois and Garrison, Journal of Acoustic Society,
December 1982. The most important environmental variable
affecting this parameter is found in the Environment dialogue
box.
Bandwidth [Hz] - This is the resulting system bandwidth of the
analogue and digital filters in the echo sounder receiver. The
bandwidth is a function of the selected pulselength at a given
frequency.
Sound velocity [m/s] - The speed of the sound through the
water varies with temperature, salinity and pressure. The
soundings provided by the ES60 are compensated for this.
Sample interval [m] - This value is always 1/4 of the current
pulse length. In distance, the sample interval will be expressed
as (sound velocity multiplied with pulse length) divided by
eight.
Angle sensitivity - In order to convert the raw angle samples
into mechanical degrees for fore-and-aft and athwartship
directions, this parameter is required. It represents the ratio of
electrical degrees to mechanical degrees for the current
transducer. This ratio is not used with single beam transducers,
and the value is set to 0.
3dB beam width [degrees] - This value presents the 3 dB
beamwidth of the current transducer in the fore-and-aft and
athwartship directions. The value is estimated during
calibration. If no calibration takes place, the default value is
used.
Angle offset [degrees] - This is the offset angle from the
acoustical axis. The value is estimated during calibration. If no
calibration takes place, the value 0 is used.
Related topics
→ Transceiver Settings, page 119.
72
857-160970 / Rev.H
Page 82

Reference manual
Annotation
The Annotation dialogue box is opened from the File menu.
The ES60 echo sounder supports these different types of
annotation:
• Te x t - use this function to enter your own text.
• Time - use this annotation to automatically generate a time
marker at specified intervals.
• Event - use this annotation to generate an event number with
optional addition of time and/or navigation.
• External - this function allows automatic annotation from an
external source.
Note that the Te xt annotation is only available if you have a
keyboard connected to the echo sounder.
An annotation telegram is written into the replay data file and
the output data file. The annotation message is only shown
inside the history window and on the echogram printout.
857-160970 / Rev.H
73
Page 83

Simrad ES60
Text
The annotation text is entered here. Note that you need to have a
keyboard connected to the echo sounder. The text can be entered
freely, for example ”Dangerous wreck”. When you press the
OK button the text is written into the echogram. The next time
you open the Annotation dialogue box, the text is cleared, and
you must enter new information.
Time
Click Active to activate automatic time annotation. Enter the
desired time interval between the annotations. When activated,
the sounder automatically generates annotations containing the
current time at the chosen interval.
Event
Each event annotation is identified with an individual event
number. The event annotation is then generated every time an
event is generated. The event number is initially chosen here,
and thereafter automatically incremented or decremented every
time a new event is generated.
To generate an event, click Event in the Status bar.
The Event annotation can include current time and/or current
longitude and latitude. Click applicable Add Time or Add
Navigation to select. Without time or position data selected, the
annotation message will simply contain the event number.
External events
External annotations may be input via the serial port for
navigation as an NMEA telegram. The Annotation dialogue
box does not support direct control of this function.
The external annotation has the following format:
$??ATS,thisisatest<CR><LF>
The telegram header consists of:
1 the $ character
2 two letters ?? (disregarded by the echo sounder, identifies
the sender of the telegram)
3 three letters ATS (Annotation Text String - identifies the
type of NMEA telegram).
74
4 a comma (NMEA separation character).
5 Text string (The echo sounder handles the string as an
ordinary text. You can not use commas in the text string.)
857-160970 / Rev.H
Page 84

Reference manual
6 A carriage-return and line-feed pair completes the
telegram.
The ASCII telegram with the external annotation must be
connected to the same serial line as the navigation system.
Related topics
→ Status Bar, page 66
857-160970 / Rev.H
75
Page 85
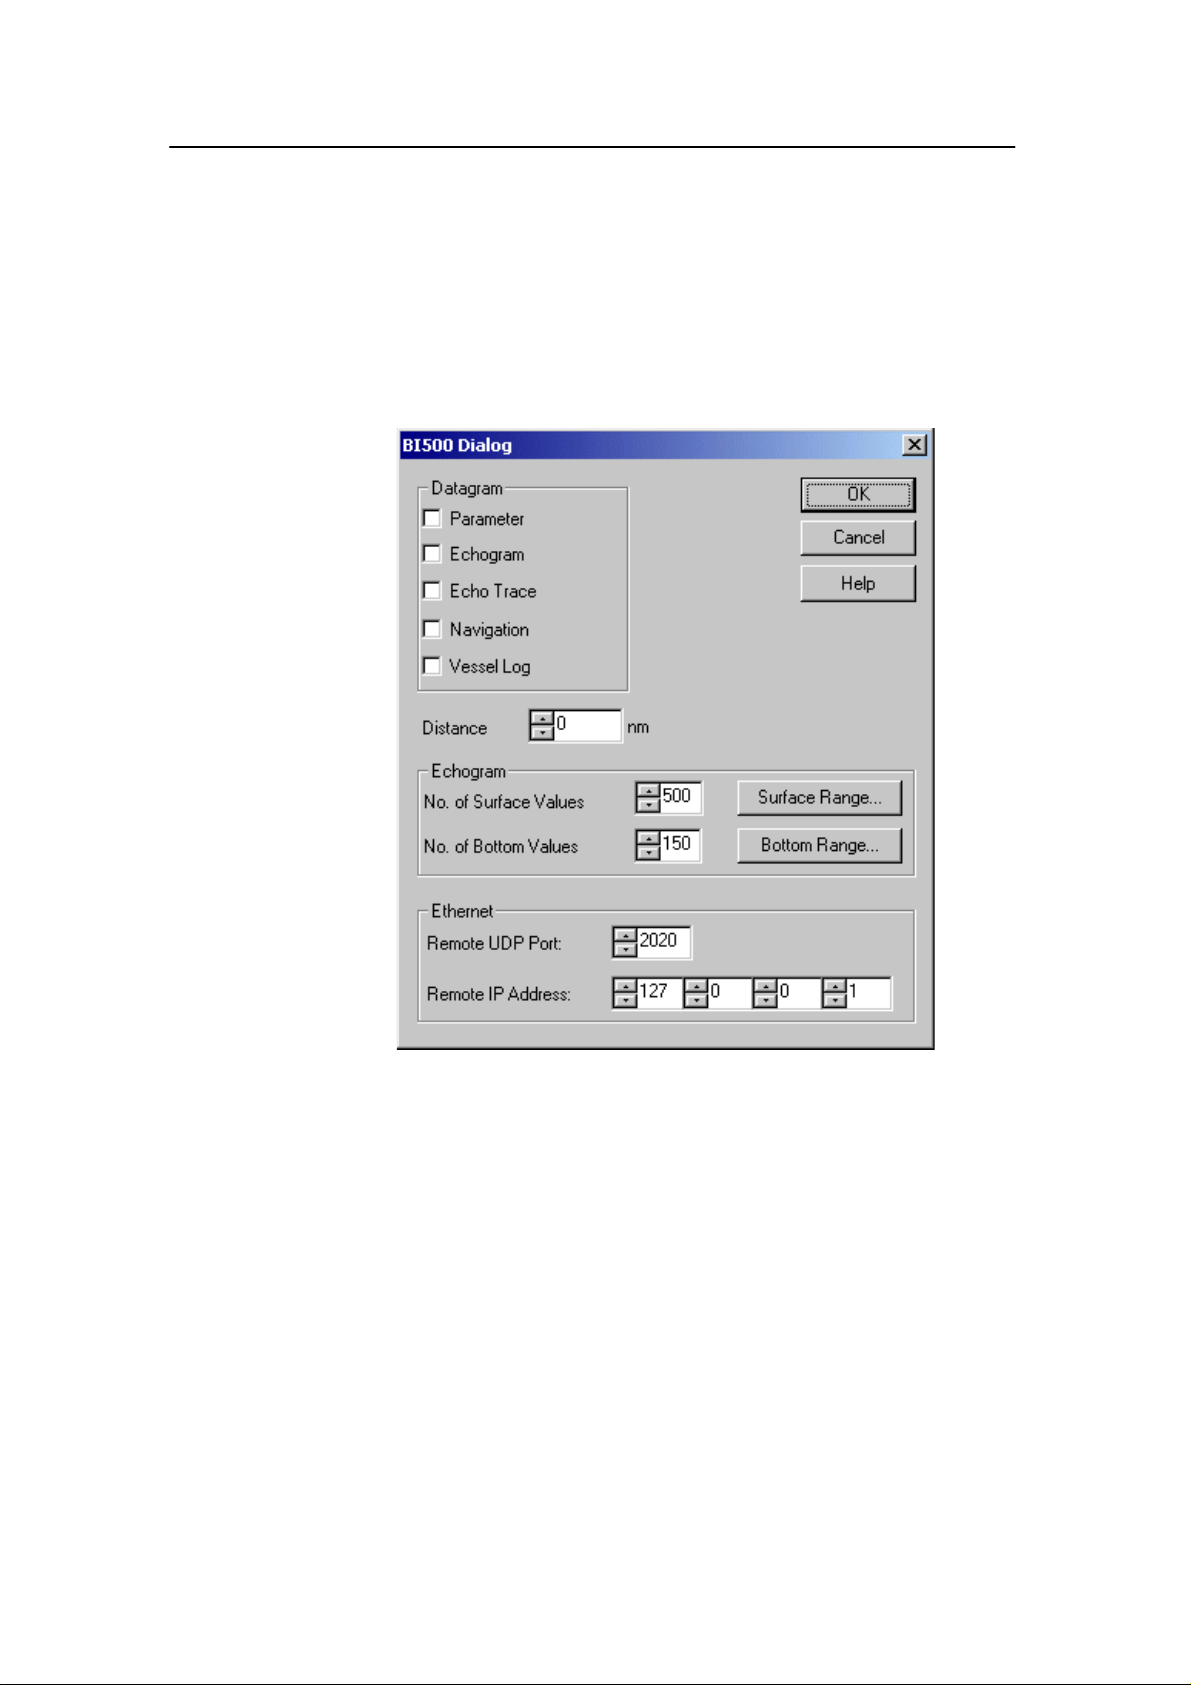
Simrad ES60
BI 500
The BI 500 dialogue box is opened from the Install menu.
The ES60 echo sounder may communicate on an ethernet line
with the BI 500 post-processing software. This dialogue box is
used to set up the parameters for this communication, and to
define which information the BI 500 shall receive.
76
Datagram
You can specify which datagrams to be transmitted to the BI
500 computer:
Parameter- Check this box if you want to transmit parameter
data. The parameters required by BI 500 are sound velocity,
frequency, pulse length and transducer type.
Echogram - Check this box if you want to transmit echogram
data (surface and/or bottom related). Note that this data is
required by the BI 500.
Echo Trace - Check this box if you want to transmit echo trace
data.
Navigation - Check this box if you want to transmit the
Navigation datagrams selected in the Navigation Interface
dialogue box. Navigational data is required if you intend to use
the map function in BI 500.
857-160970 / Rev.H
Page 86

Reference manual
Vessel Log - Check this box if you want to transmit VesselLog
datagrams. This datagram is required by BI 500 and is
automatically generated based on the vessel speed.
You will normally transmit all the datagrams when operating
ES60 together with BI 500. If you do not use the BI 500, do not
export any datagrams.
The Echogram, Echo trace and Vessel log datagrams are
identical to the corresponding datagrams transmitted by the
Simrad EK500 echo sounder.
Distance
Use this parameter to (re)set the internal log distance counter.
The current value of the log distance counter is shown at the
time the BI 500 dialogue box was opened.
Echogram
You can here specify the layout of the echogram datagram.
No. of Surface Values - this value defines the number of
surface based echogram values to be filled into the echogram
datagram. This number should be 500 (default) when operating
with the BI 500 post-processing software.
No.ofBottomValues-this value defines the number of bottom
based echogram values to be filled into the echogram datagram.
This number should be 150 (default) when operating with the BI
500 post-processing software.
Surface Range - Click this button to enter the Surface Range
dialogue box. Here you specify the operating range for the
surface echogram.
Bottom Range - click this button to enter the Bottom Range
dialogue box. Here you specify the operating range for the
bottom echogram.
Ethernet
These parameters are used to define the Ethernet connection
with the BI 500 computer.
The Remote UDP Port and the Remote IP Address specified
must correspond to the UDP port number and Internet address
used by the BI 500 computer.
857-160970 / Rev.H
Related topics
→ Surface Range, page 115
→ Bottom Range, page 80
→ Navigation Interface, page 100
77
Page 87

Simrad ES60
Bottom Detector
The Bottom Detector dialogue box is opened when you
right-click on the numeric depth value in the Header view on
the display.
78
This dialogue box is used to define the upper and lower depth
limits most likely to be used during the echo sounder operation.
These limits may be used to obtain ”bottom lock” on the depth
when the echo sounder is pinging. The sounder needs this lock
to locate the correct depth, and to stay on it during the
operation, even though the depth changes continuously.
The dialogue box is also used to set alarms to notify you if
maximum or minimum depths are exceeded.
Parameters
Minimum Depth - The bottom detector starts the search for the
bottom echo at this depth. The detector will fail in shallow
water if you select a too large depth value, and the tail of the
transmitting pulse may cause problems if a too small value is
set.
857-160970 / Rev.H
Page 88

Reference manual
Maximum Depth - The search for the bottom echo extends
down to this depth whenever bottom track is lost. Enter a
slightly larger depth value than the deepest spot you expect to
visit in order to avoid annoyingly long ping intervals every time
bottom track is lost. A depth value of either 0 or less than the
minimum depth disables the bottom detector.
Bottom Lost Warning - A warning is activated whenever
bottom track is lost. The warning is presented as a message in
the Status bar andasanaudiosignal.
Min. Depth Alarm - An alarm is activated whenever the
detected bottom depth is smaller than the chosen alarm
threshold. The warning is presented as a pop-up message and as
an audio signal. When the depth value is set to 0, this function is
disabled.
Max. Depth Alarm - An alarm is activated whenever the
detected bottom depth exceeds the alarm threshold The warning
is presented as a message on the display and as an audio signal.
When the depth value is set to 0, this function is disabled.
Backstep Min. Level - After the estimated depth of the bottom
detector, the detected depth is automatically adjusted by
stepping back according to the value of the setting you have
chosen. This allows the ES60 to verify that the correct bottom
depth has been located. If the value you enter is too large (close
to 0 dB) the adjustments will be very small.
The default value is -50 dB.
Bottom Smoothing - If bottom track is lost, the detected
bottom depth is repeated for a maximum of three consecutive
pings.
Alternative Bottom Detector - This bottom detector resembles
the Simrad ES 380 bottom detector algorithm. This function
may be useful in a steep bottom slope situation.
857-160970 / Rev.H
79
Page 89

Simrad ES60
Bottom Range
The Bottom Range dialogue box opens if you click the right
mouse button in the range field in the Echogram and Range
view while operating with a Bottom Range echogram.
The different echograms are explained in the Echogram
dialogue box.
80
Range - This parameter controls the vertical depth range across
the echogram.
Stop Relative Bottom - This parameter controls the depth offset
at the lower boundary of the echogram relative to the detected
bottom; positive values downwards.
Note that you can also change the range using the mouse wheel.
This is described in the Echo frames chapter.
Related topics
→ Echogram, page 85
857-160970 / Rev.H
Page 90

Reference manual
Colour Scale
The Colour Scale dialogue box is opened when you right-click
on the colour scale in the Header view.
This dialogue controls the mapping of echo strength into one out
of 12 colours, light blue for weak signals and dark brown for
strong signals. Each discrete colour represents a 3 dB range of
echo signal strength implying that the next colour is selected
every time the echo strength doubles.
857-160970 / Rev.H
Parameters
A high numeric value displays weak echo signals properly while
the stronger signals saturate into dark brown colour. A low
numeric value displays strong echo signals properly. Weak
signals below the lower limit of the colour scale are not
displayed (the display background colour is used).
School Gain - This parameter controls the display sensitivity of
the echo sounder down to the detected bottom depth when
School Gain is selected in the Echogram dialogue box. A
numeric value of 70 sets the lower limit of the echogram colour
scale equal to a volume backscattering strength of -70 dB.
Fish Gain - This parameter controls the display sensitivity of
the echo sounder down to the detected bottom depth when Fish
Gain is selected in the Echogram dialogue box. A numeric
value of 50 sets the lower limit of the echogram colour scale
equal to a target strength of -50 dB.
81
Page 91

Simrad ES60
Limit gain regulation - Due to the high dynamic range in the
ES60 echo sounder, invidious gain settings may result in
unwanted noise. This will also cause the fish size estimates to be
erroneous. This gain regulation setting will limit the receiver
gain to maximum 100 dB. The limitation will prevent the echo
sounder from saturation.
Bottom Gain - This parameter controls the display sensitivity
of the echo sounder below the detected bottom depth. A
numeric value of 70 sets the lower limit of the echogram colour
scale equal to a surface backscattering strength of -70 dB.
No TVG - This parameter controls the display sensitivity of the
echo sounder when No TVG is selected in the Echogram
dialogue box. A numeric value of 70 sets the lower limit of the
echogram colour scale equal to a measured input level of -70
dB.
Removing colours
By left-clicking on the colours in the colour rectangle in the
upper right-hand corner of the screen, the selected colour will
become the weakest colour shown in the Echogram and Single
Echo views.
To restore the colour range, click on the removed colour’s
position.
Note that this is a display function only. It does not have any
effect on the sounder’s performance. It will however affect the
recordings made by the History function.
Related topics
→ Echogram, page 85
82
857-160970 / Rev.H
Page 92

Reference manual
Depth Output
The Depth Output dialogue box is called from the Heave
Sensor, Trawl Interface and Navigation Interface dialogue
boxes. These are in turn accessed from the Install menu.
It allows you to control the depth data output.
Parameters
Depth output - Check to enable the depth output.
Checksum - A checksum may optionally be appended to the
NMEA output telegrams (according to the NMEA standard).
Channel - NMEA depth telegrams are only output from one
channel at a time. Select channel from the list of installed
frequency channels.
The GPT uses its Ethernet address for unique identification, and
the PCT uses its ISA bus parameters; IO address, DMA channel
and IRQ number. The channel number identifies individual
channels within a multi-channel transceiver.
Telegram - The echo sounder can output three different types of
NMEA depth telegrams. However, only one telegram type at a
time can be generated. You can select the telegram type here.
• The $SDDBS telegram contains the depth below the surface.
• The $SDDBT telegram contains the depth below the
transducer.
• The $SDDPT telegram contains the depth below the
transducer and the distance between the transducer and the
waterline.
The ES60 can also output the EA 500/EK500 compatible depth
telegrams; D1, D2 etc. Output for Atlas echo sounders are also
provided.
857-160970 / Rev.H
Related topics
→ Trawl Interface, page 122
→ Heace Sensor, page 93
→ Navigation Interface, page 100
83
Page 93

Simrad ES60
Echo Trace
The Echo Trace dialogue box is opened if you right-click in the
Single Echo view on the display.
For each detection of a single fish the ES60 estimates the target
strength. Approximate formulas are used to convert target
strength to fish length and weight. Cod and other species with a
swim bladder are assumed. The statistical distribution of fish
size and the position of the fish inside the transducer beam are
plotted. These plots include fish detected within the vertical
depth range of the associated echogram. The size plot, the
position plot and the echogram use identical colour scale.
Presentation
Histogram - The frequency distribution of fish size is plotted;
12 size cells, 3 dB per cell. Total range plotted is 36 dB. Smaller
fish and larger fish are disregarded.
Echo trace - The position of the fish inside the transducer beam
is plotted. Only the three strongest detections are shown. A
circle shows the 6 dB beamwidth of the transducer.
Both - Fish size distribution and fish position are both plotted.
Scale
Length - The unit along the horizontal axis of the size
distribution histogram is fish length in centimeters or inches.
Weight - The unit along the horizontal axis of the size
distribution histogram is fish weight in kg.
TS - The unit along the horizontal axis of the size distribution
histogram is target strength in dB.
84
857-160970 / Rev.H
Page 94

Reference manual
Echogram
The Echogram dialogue box is opened by right-clicking on the
echogram in the Echogram and Range view on the display.
This dialogue is used to control the type and presentation of the
echograms.
857-160970 / Rev.H
Echogram
Surface - Manual - The echogram is related to the sea surface.
Start depth (at the upper echogram boundary) and vertical range
(across the echogram) are manually selected in the Surface
Range dialogue box.
Surface - Auto Range - The echogram is related to the sea
surface. Start depth is manually selected in the Surface Range
dialogue box. The ES60 performs automatic adjustment of the
vertical range keeping the bottom echo inside the visible
echogram.
85
Page 95

Simrad ES60
Surface - Auto Start - The echogram is related to the sea
surface. Vertical range is manually selected in the Surface
Range dialogue box. The ES60 performs automatic adjustment
of the start depth keeping the bottom echo inside the visible
echogram.
Bottom - The echogram is related to the detected bottom. Stop
depth (lower echogram boundary) and vertical range are
manually selected in the Bottom Range dialogue box. The
echogram is only drawn for pings having a successful bottom
detection.
Tra w l - Trawl sensor systems communicate headrope depth and
headrope-to-footrope distance to the ES60 at regular intervals.
The echogram covers the vertical opening of the trawl including
a small margin at each side. The headrope and footrope margins
are identical. Their size is selected in the Trawl Range dialogue
box. The headrope-to-footrope distance can be manually set in
the Trawl Interface dialogue box for trawl sensor systems not
measuring the trawl opening, or when the measured
headrope-to-footrope distance is unreliable. The echogram is
only drawn when trawl position information is available.
Port/starboard - Define if the current sidescan transducer is
mounted on the port or starboard side of the vessel.
Range view - The echogram will display both the water column
and the bottom. Valid for both single and dual systems.
Across view - If a vertical transducer is available, the bottom
echogram will expand (hiding the water column). The extent of
expansion (in metres) is set by the vertical depth. Valid for both
single and dual systems.
Import - It is possible to display both port and starboard
sidescan echograms in the same view. When opening the
echogram dialogue for one transducer channel, select the other
transducer channel to be imported in the drop-down list, then
click the Import box. This function is only valid for dual
systems.
Horizontal Depth Lines
Scale - Equidistant horizontal scale lines are drawn inside the
echogram in the current foreground colour; black during day
and white during night. A maximum of 50 scale lines can be
drawn. No scale lines are drawn when the scale line count is set
to zero.
86
Each echogram will be labeled with a number placed on the TX
pulse in each channel.
857-160970 / Rev.H
Page 96

Reference manual
Show echograms - In mode 1x to 5x the centre echograms can
be chosen by selecting the transducer number in the waterfall
view. Example: If 3x is chosen and echogram 5 is centre, the
echograms 4 and 6 will be displayed in each side of echogram 5.
Bottom:
• On - The detected bottom depth is shown as a thin line in the
echogram. The line is drawn in the current foreground
colour; black during day and white during night.
• Off - The bottom line is switched off.
• White Line - A band in the current background colour is
drawn below the detected bottom depth.
Variable Depth - When enabled a horizontal depth line is
placed wherever you click in the Echogram view. The depth of
the line is displayed at the left end of it. In the History diagram
the depth for each ping is displayed individually.
Tra w l - Headrope and footrope depth are indicated by two red
lines in the echogram. Continuous lines are drawn when the
current depth values are available, and dotted lines are drawn
for a period of two minutes when this information is not
available. No lines are drawn after two minutes.
Range other - Two horizontal lines indicate the range presented
in the lower echo frame.
Purse Seine - The depth of the purse seine sensor is indicated.
Vertical Markers
Event - A vertical line is drawn when a new event is generated.
Minute - A short vertical line is drawn in the upper part of the
echogram once every minute.
New Range - A vertical line is drawn when the range is
changed. The old range is written on the screen as an
annotation.
Gain
No - No TVG is applied. The echogram displays the input
power level at the transducer terminals. This echogram type is
used for special purposes when TVG is not applicable or
required..
School - The echogram displays volume backscattering strength
above the detected bottom, and surface backscattering strength
below the detected bottom. Volume backscattering strength is
suitable when observing a school of fish, and surface
backscattering strength is suitable when studying the properties
of the bottom.
857-160970 / Rev.H
87
Page 97

Simrad ES60
Fish - The echogram displays target strength above the detected
bottom and surface backscattering strength below the detected
bottom. Target strength is suitable when observing individual
fish, and surface backscattering strength is suitable when
studying the properties of the bottom.
RCG (Reverberation Controlled Gain)
Apply this filter to enhance the detection of single fish on a
background of reverberation or noise.
Ping Filter
The ping-to-ping filter ”cleans up” the echogram by removing
random noise spikes with no correlation with the previous ping.
The function will thus make echoes appear more stable.
The ping filtering effect may be varied using the three different
settings provided, or it may be switched off.
Weak - Only two pings are correlated
Medium - Four pings are correlated
Strong - Eight pings are correlated.
Related topics
→ Surface Range, page 115
→ Bottom Range, page 80
→ Trawl Range, page 124
→ Trawl Interface, page 122
88
857-160970 / Rev.H
Page 98
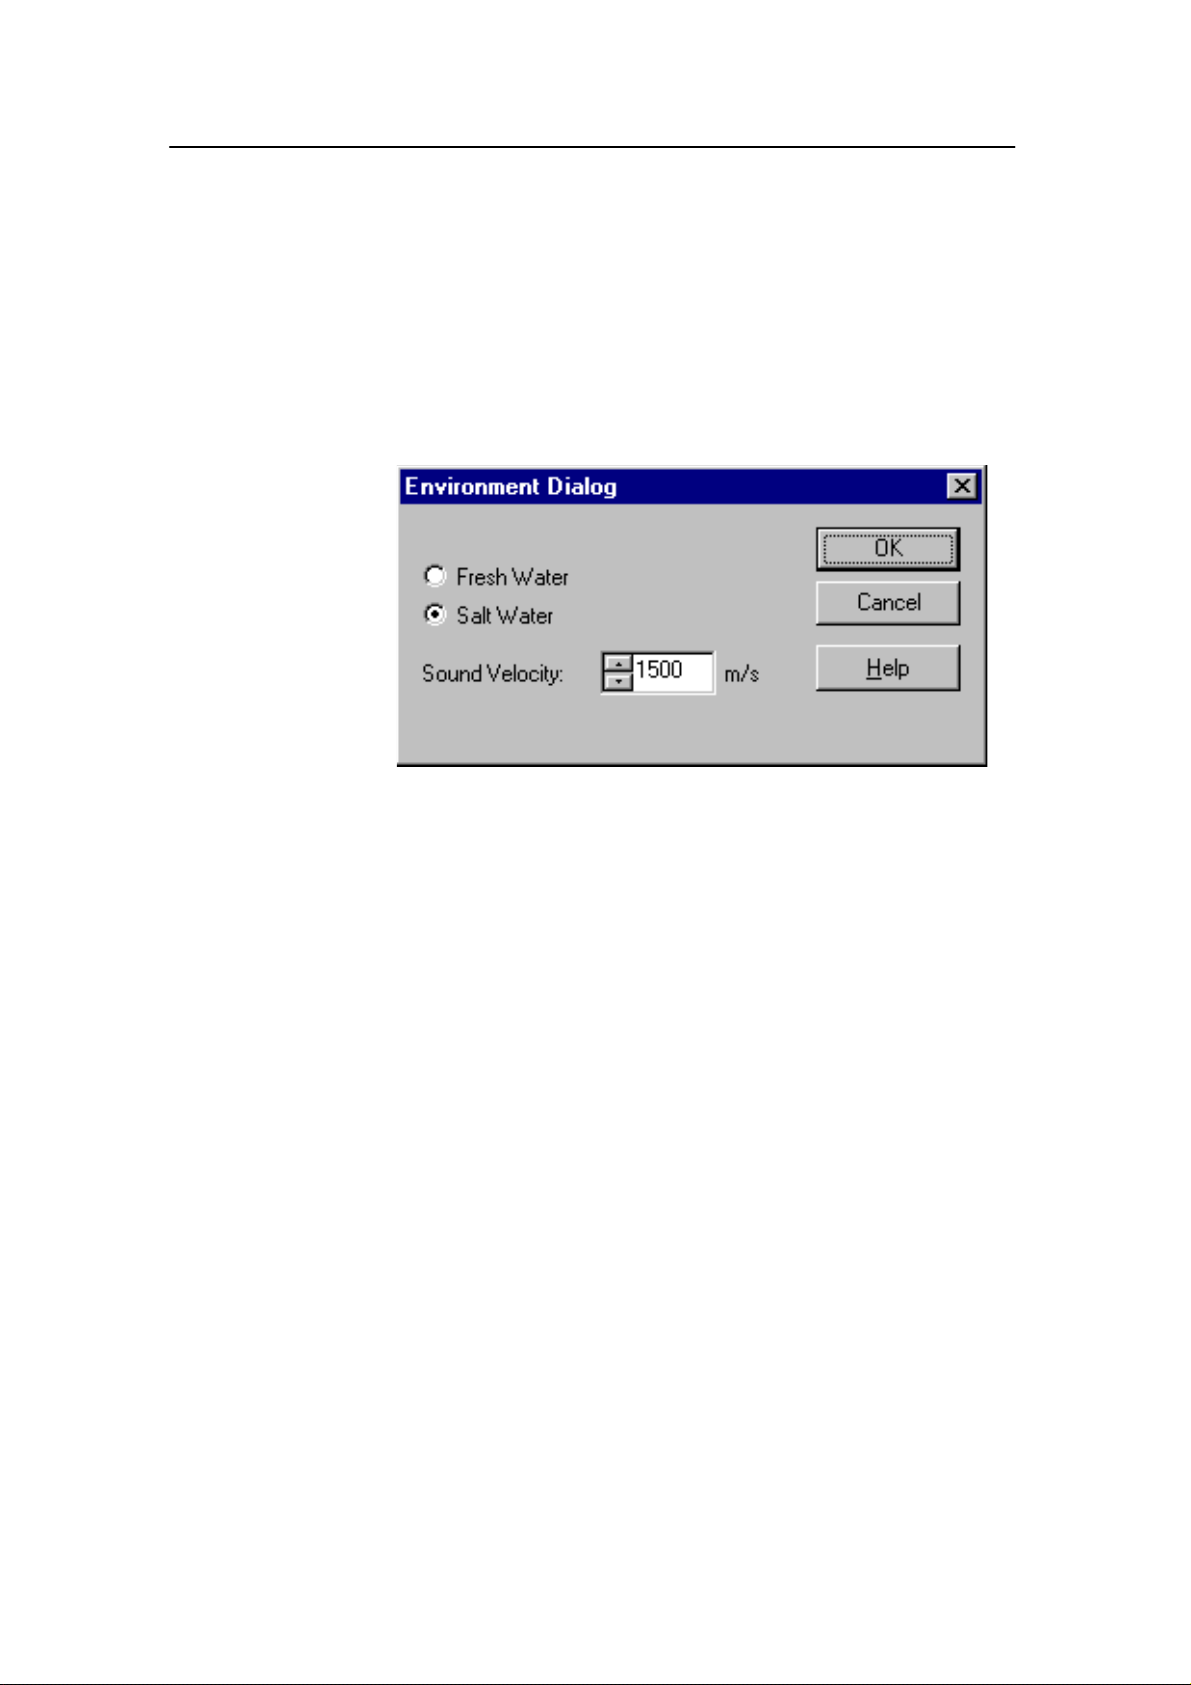
Reference manual
Environment
The Environment dialogue box is available from the Install
menu.
Many other echo sounders are calibrated to a sound velocity of
1500 m/s. If the ES60 is used together with other sounders it is
advantageous to adjust the sound velocity on the ES60 as well,
in order to have the same depth readings.
Salt Water / Fresh Water - Propagation losses due to
absorption are much higher in sea water than in fresh water.
Correct compensation for these losses therefore relies on the
echo sounder knowing which water type is present.
Sound Velocity - For accurate measurement of bottom depth the
correct sound velocity must be entered. Normally, 1470 m/s is a
good average value.
Related topics
857-160970 / Rev.H
89
Page 99

Simrad ES60
Shutdown
The Shutdown command is available from the File menu.
Select this command to terminate the echo sounder program.
Note You must always use this command before you turn off power!
Related topics
→ File, page 59
90
857-160970 / Rev.H
Page 100

Reference manual
Factory settings
The Factory Settings dialogue box is accessed from the
Options menu. It does not provide specific parameters, but
simply allows you to acknowledge the chosen function.
Restoring factory settings is normally used only if you need to
restore the echo sounder after long time use, or if you have
made a number of incorrect selections in the menus or dialogue
boxes and wish to correct these fast.
When selected, this function will first stop the echo sounder
operation.
Second, all the personalized settings you have entered will be
removed. These include all the parameters you have chosen for
the operation, as well as changes you have made with the echo
sounder screen layout. The settings made for communication
(serial lines) and installation (transceivers and transducers) are
not affected. The only way to restore the operational settings is
to enter them all one more time.
Third, the echo sounder is restarted using the default settings
chosen by Simrad Horten. These are considered generic, and
they are the same settings as when you first switched on the
echo sounder.
857-160970 / Rev.H
91
 Loading...