

Page 1

SIGLENT
SVA1000X Series
Spectrum Analyzer
User Manual
UM0701X-E01A
SVA1000X User Manual I
Page 2

SIGLENT
Guaranty and Declaration
Copyright
SIGLENT TECHNOLOGIES CO., LTD All Rights Reserved.
Trademark Information
SIGLENT is the registered trademark of SIGLENT TECHNOLOGIES CO., LTD
Declaration
SIGLENT products are protected by patent law worldwide
SIGLENT reserves the right to modify or change parts of or all the
specifications or pricing policies at company’s sole decision.
Information in this publication replaces all previously corresponding material.
Any way of copying, extracting or translating the contents of this manual is not
allowed without the permission of SIGLENT.
SIGLENT will not be responsible for losses caused by either incidental or
consequential in connection with the furnishing, use or performance of this
manual as well as any information contained.
Product Certification
SIGLENT guarantees this product conforms to the national and industrial
standards in China as well as the ISO9001: 2008 standard and the ISO14001:
2004 standard. Other international standard conformance certification is in
progress.
SVA1000X User Manual II
Page 3

SIGLENT
General Safety Summary
Carefully read the following safety precautions to avoid any personal injury or damage to
the instrument and any products connected to it. To avoid potential hazards, please use the
instrument as specified.
Use Proper AC Power Line
Only the power cord designed for the instrument and authorized by the local country
should be used.
Ground the Instrument
The instrument is grounded through the protective earth conductor of the power line. To
avoid electric shock, please make sure the instrument is grounded correctly before
connecting its input or output terminals.
Connect the Probe Correctly.
If a probe is used, do not connect the ground lead to high voltage since it has an isobaric
electric potential as the ground.
Look Over All Terminals’ Ratings
To avoid fire or electric shock, please look over all ratings and sign instruction of the
instrument. Before connecting the instrument, please read the manual carefully to gain
more information about the ratings.
Use Proper Overvoltage Protection
Make sure that no over-voltage (such as that caused by a thunderstorm) can reach the
product, or else the operator might be exposed to danger of electrical shock.
Electrostatic Prevention
Operate the instrument in an electrostatic discharge protective area environment to avoid
damages induced by static discharge. Always ground both the internal and external
conductors of the cable to release static before connecting.
Maintain Proper Ventilation
Inadequate ventilation may cause increasing of the instrument’s temperature, which will
eventually damage the instrument. So keep well ventilated and inspect the intake and fan
regularly.
Avoid Exposed Circuit or Components
Do not touch exposed contacts or components when the power is on.
Do Not Operate Without Covers
Do not operate the instrument with covers or panels removed.
Use Only the Specified Fuse.
Keep Product Surfaces Clean and Dry.
To avoid the influence of dust and/or moisture in the air, please keep the surface of the
device clean and dry.
Do Not Operate in Wet Conditions.
In order to avoid short circuiting to the interior of the device or electric shock, please do not
operate the instrument in a humid environment.
Do Not Operate in an Explosive Atmosphere.
In order to avoid damage to the device or personal injury, it is important to operate the
device away from an explosive atmosphere.
SVA1000X User Manual III
Page 4
SIGLENT
Safety Terms and Symbols
Terms on the product. These terms may appear on the product:
DANGER Indicates direct injuries or hazards that may happen.
WARNING Indicates potential injuries or hazards that may happen.
CAUTION Indicates potential damages to the instrument or other property that may
happen.
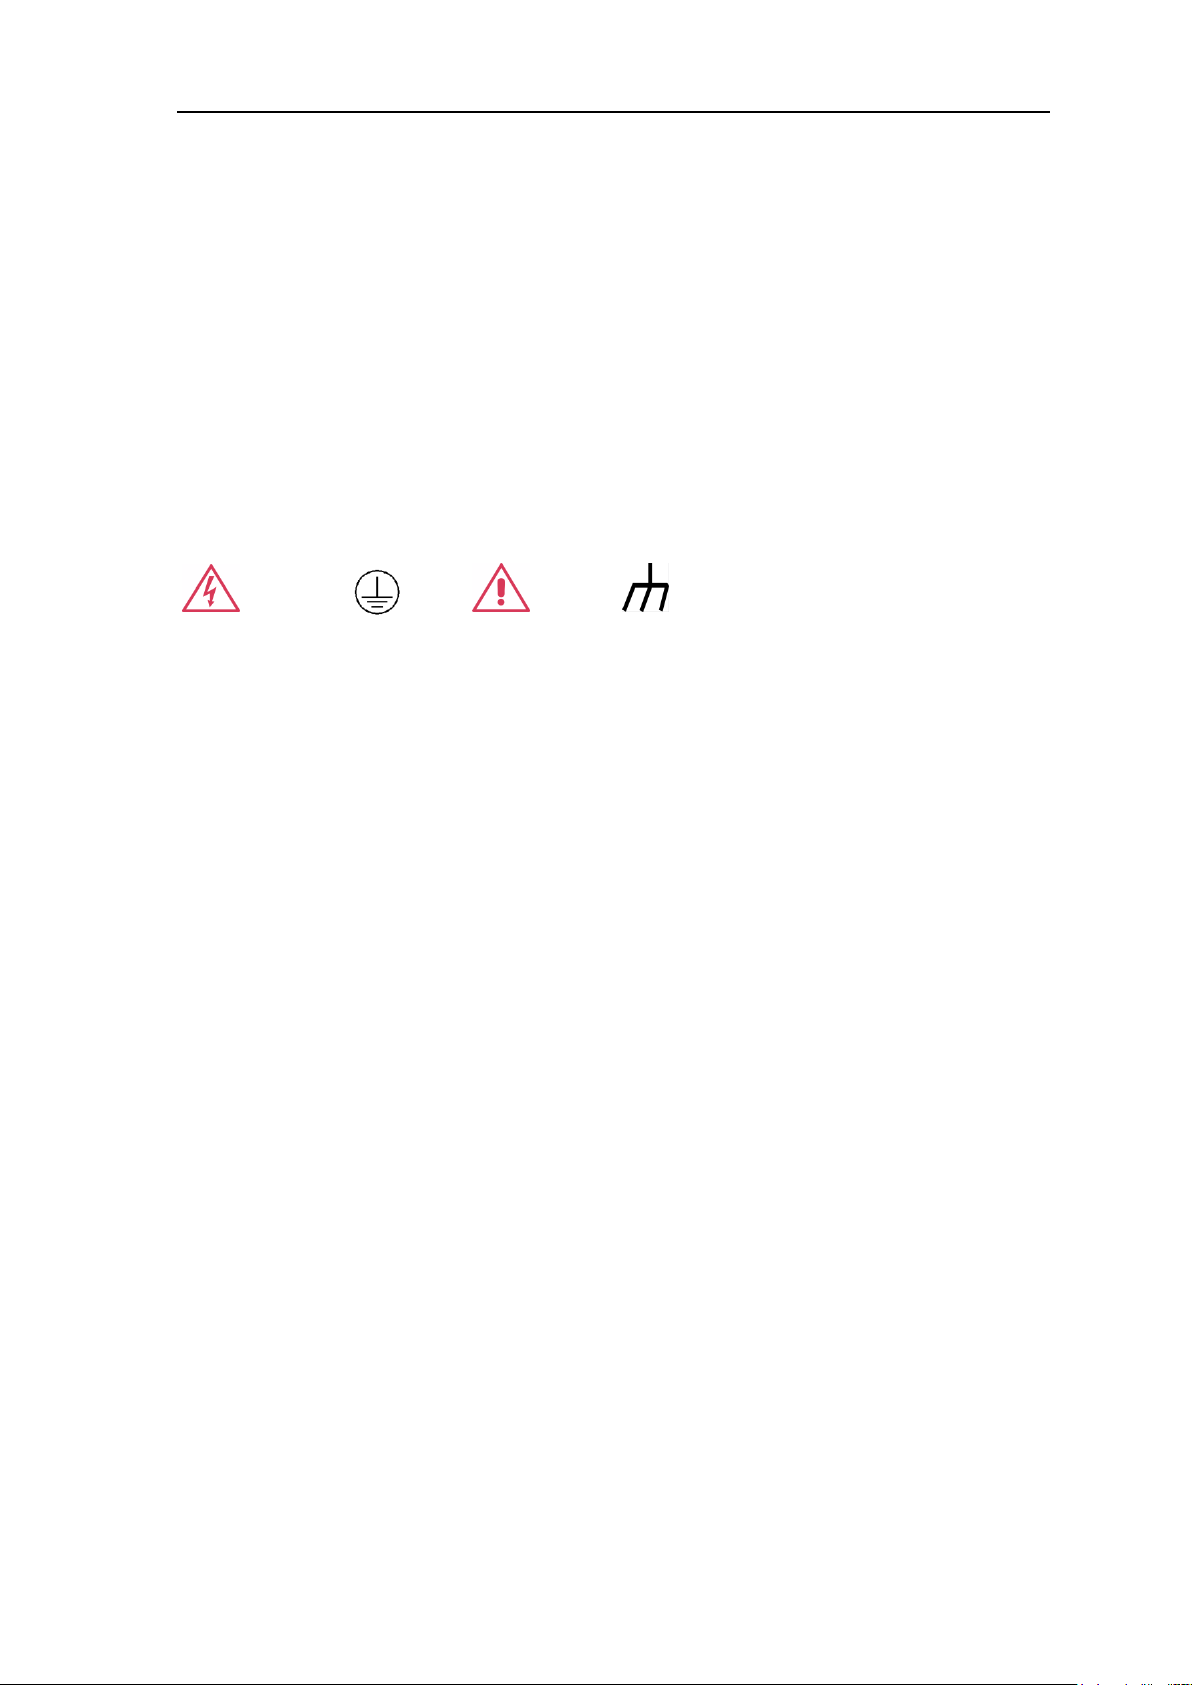
Symbols on the product. These symbols may appear on the product:
Hazardous Protective Warning Earth Chassis
Voltage Ground Ground
SVA1000X User Manual IV
Page 5

SIGLENT
SVA1000X Series Spectrum Analyzer Overview
The SIGLENT SVA1000X series spectrum analyzer has a frequency range from 9 kHz to 1.5 GHz;
it is light-weight and small size, with a user friendly interface, concise style of display, reliable
measurement precision and plenty of RF measurement functions. It is ideal for RF transmission
monitoring and characterization as well as research and development, education, production, and
maintenance.
Features and Benefits
All-Digital IF Technology
Frequency Range from 9 kHz to 1.5 GHz
Up to 1.5 GHz Tracking Generator
Vector Network Analyzer (Opt.)
Distance-to-Fault (Opt.)
Modulation Analysis (Opt.)
Advanced Measurement Kit (Opt.)
EMI Filter and Quasi Peak Detector Kit (Opt.)
10.1 inch WVGA(1024x600) Display, Multi-Touch Screen
Web Browser Remote Control on PC and Mobile Terminals
SVA1000X User Manual V
Page 6

SIGLENT
Contents
General Safety Summary ................................................................................................................ III
Safety Terms and Symbols .............................................................................................................. IV
SVA1000X Series Spectrum Analyzer Overview .............................................................................. V
Chapter 1 Quick Start ................................................................................................................. 2
1.1 General Inspection ..................................................................................................... 2
1.2 Preparing for Use ....................................................................................................... 2
1.2.1 Adjust the Supporting Legs ................................................................................ 2
1.2.2 Connect to AC Power Supply ............................................................................. 3
1.3 The Front Panel ......................................................................................................... 3
1.3.1 Front Panel Function Keys ................................................................................. 4
1.3.2 Front Panel Key Backlight .................................................................................. 5
1.3.3 Using the Numeric Keyboard ............................................................................. 5
1.3.4 Front Panel Connectors ..................................................................................... 6
1.4 Rear Panel ................................................................................................................. 8
1.5 User Interface .......................................................................................................... 10
1.6 Firmware Operation ................................................................................................. 12
1.6.1 Check System Information ............................................................................... 12
1.6.2 Load Option ...................................................................................................... 12
1.6.3 Firmware Upgrade............................................................................................ 12
1.7 Mode ........................................................................................................................ 13
1.8 Touch Operation....................................................................................................... 13
1.9 Remote Control ........................................................................................................ 13
1.10 Using Built-in Help ................................................................................................... 14
Chapter 2 Front Panel Operation ............................................................................................. 15
2.1 Basic Settings .......................................................................................................... 16
2.1.1 Frequency ........................................................................................................ 16
2.1.2 Span ................................................................................................................. 19
2.1.3 Amplitude ......................................................................................................... 21
2.1.4 Auto Tune ......................................................................................................... 25
2.2 Sweep and Function ................................................................................................ 27
2.2.1 BW .................................................................................................................... 27
2.2.2 Trace ................................................................................................................ 29
2.2.3 Detect ............................................................................................................... 31
2.2.4 Sweep .............................................................................................................. 32
2.2.5 Trigger .............................................................................................................. 34
2.2.6 Limit .................................................................................................................. 35
2.2.7 TG (Tracking Generator) .................................................................................. 37
2.2.8 Demod .............................................................................................................. 39
2.3 Marker ...................................................................................................................... 41
2.3.1 Marker .............................................................................................................. 41
2.3.2 Marker -> .......................................................................................................... 43
2.3.3 Marker Fn ......................................................................................................... 44
SVA1000X User Manual VI
Page 7

SIGLENT
2.3.4 Peak ................................................................................................................. 47
2.4 Measurement ........................................................................................................... 49
2.4.1 Meas ................................................................................................................. 49
2.4.2 Meas setup ....................................................................................................... 50
2.5 System ..................................................................................................................... 57
2.5.1 System ............................................................................................................. 57
2.5.2 Display .............................................................................................................. 59
2.5.3 File .................................................................................................................... 60
2.6 Mode Setup .............................................................................................................. 63
2.6.1 Spectrum Analyzer ........................................................................................... 63
2.6.2 Digital Modulation Analysis .............................................................................. 63
2.6.3 Analog Modulation Analysis ............................................................................. 67
2.6.4 Distance-to-fault ............................................................................................... 70
2.6.5 Vector Network Analysis ................................................................................... 72
2.7 Shortcut Key ............................................................................................................ 75
2.7.1 Preset ............................................................................................................... 75
2.7.2 Couple .............................................................................................................. 78
2.7.3 Help .................................................................................................................. 78
2.7.4 Save ................................................................................................................. 79
Chapter 3 Programming Overview ........................................................................................... 80
3.1 Remotely Operating the Analyzer ............................................................................ 80
3.1.1 USB: Connecting the Analyzer via the USB Device port ................................. 80
3.1.2 LAN: Connecting the Analyzer via the LAN port .............................................. 80
3.1.3 GPIB: Connecting the Analyzer via the USB-Host port.................................... 81
3.2 Build Communication ............................................................................................... 82
3.2.1 Build Communication Using VISA .................................................................... 82
3.2.2 Build Communication Using Sockets/Telnet .................................................... 84
3.3 Remote Control Capabilities .................................................................................... 85
3.3.1 User-defined Programming .............................................................................. 85
3.3.2 Send SCPI Commands via NI MAX ................................................................. 85
3.3.3 EasySpectrum Software ................................................................................... 87
3.3.4 Web Control ..................................................................................................... 88
Chapter 4 Service and Support ................................................................................................ 89
4.1 Service Summary..................................................................................................... 89
4.2 Troubleshooting ....................................................................................................... 89
4.3 Contact Us ............................................................................................................... 91
SVA1000X User Manual VII
Page 8
SIGLENT
Chapter 1 Quick Start
1.1 General Inspection
1. Inspect the shipping container
Keep the damaged shipping container or cushioning material until the contents of the shipment
have been completely checked and the instrument has passed both electrical and mechanical
tests.
The consigner or carrier will be responsible for damages to the instrument resulting from
shipment. SIGLENT will not provide free maintenance or replacement.
2. Inspect the instrument
If the instrument is found to be damaged, defective or fails in electrical or mechanical tests,
please contact SIGLENT.
3. Check the accessories
Please check the accessories according to the packing list. If the accessories are incomplete
or damaged, please contact your SIGLENT sales representative.
1.2 Preparing for Use
1.2.1 Adjust the Supporting Legs
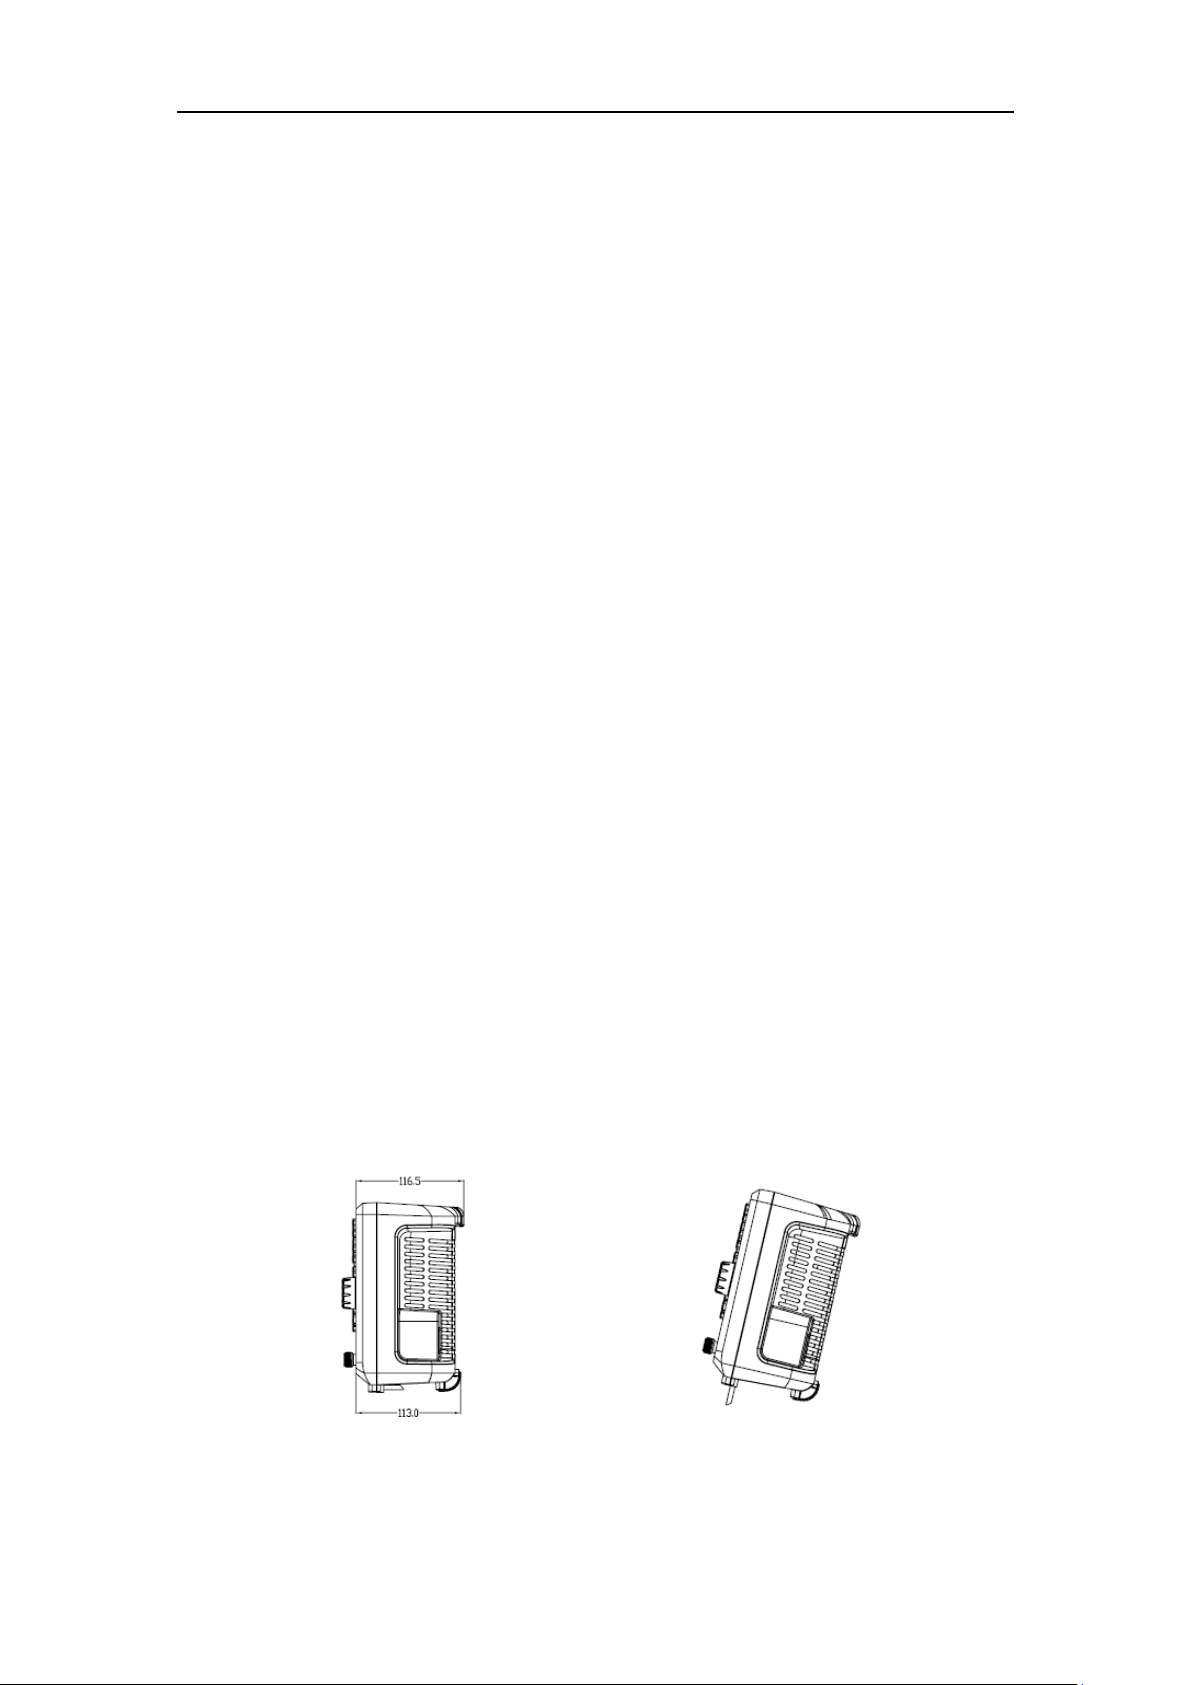
Adjust the supporting legs properly to use them as stands to tilt the analyzer upwards for
stable placement as well as easier operation and observation of the instrument display.
Figure 1-1 before adjusting Figure1-2 after adjusting
SVA1000X User Manual 2
Page 9
SIGLENT
NO.
Description
NO.
Description
1
User Graphical Interface, touch support
7
RF Input, VNA port 2
2
Menu Control Keys
8
TG Output, VNA port 1
3
Function Keys
9
3.5 mm Earphone interface
4
Knob
10
USB Host
5
Numeric / Letter Keyboard
11
Power Switch
6
Arrow Keys
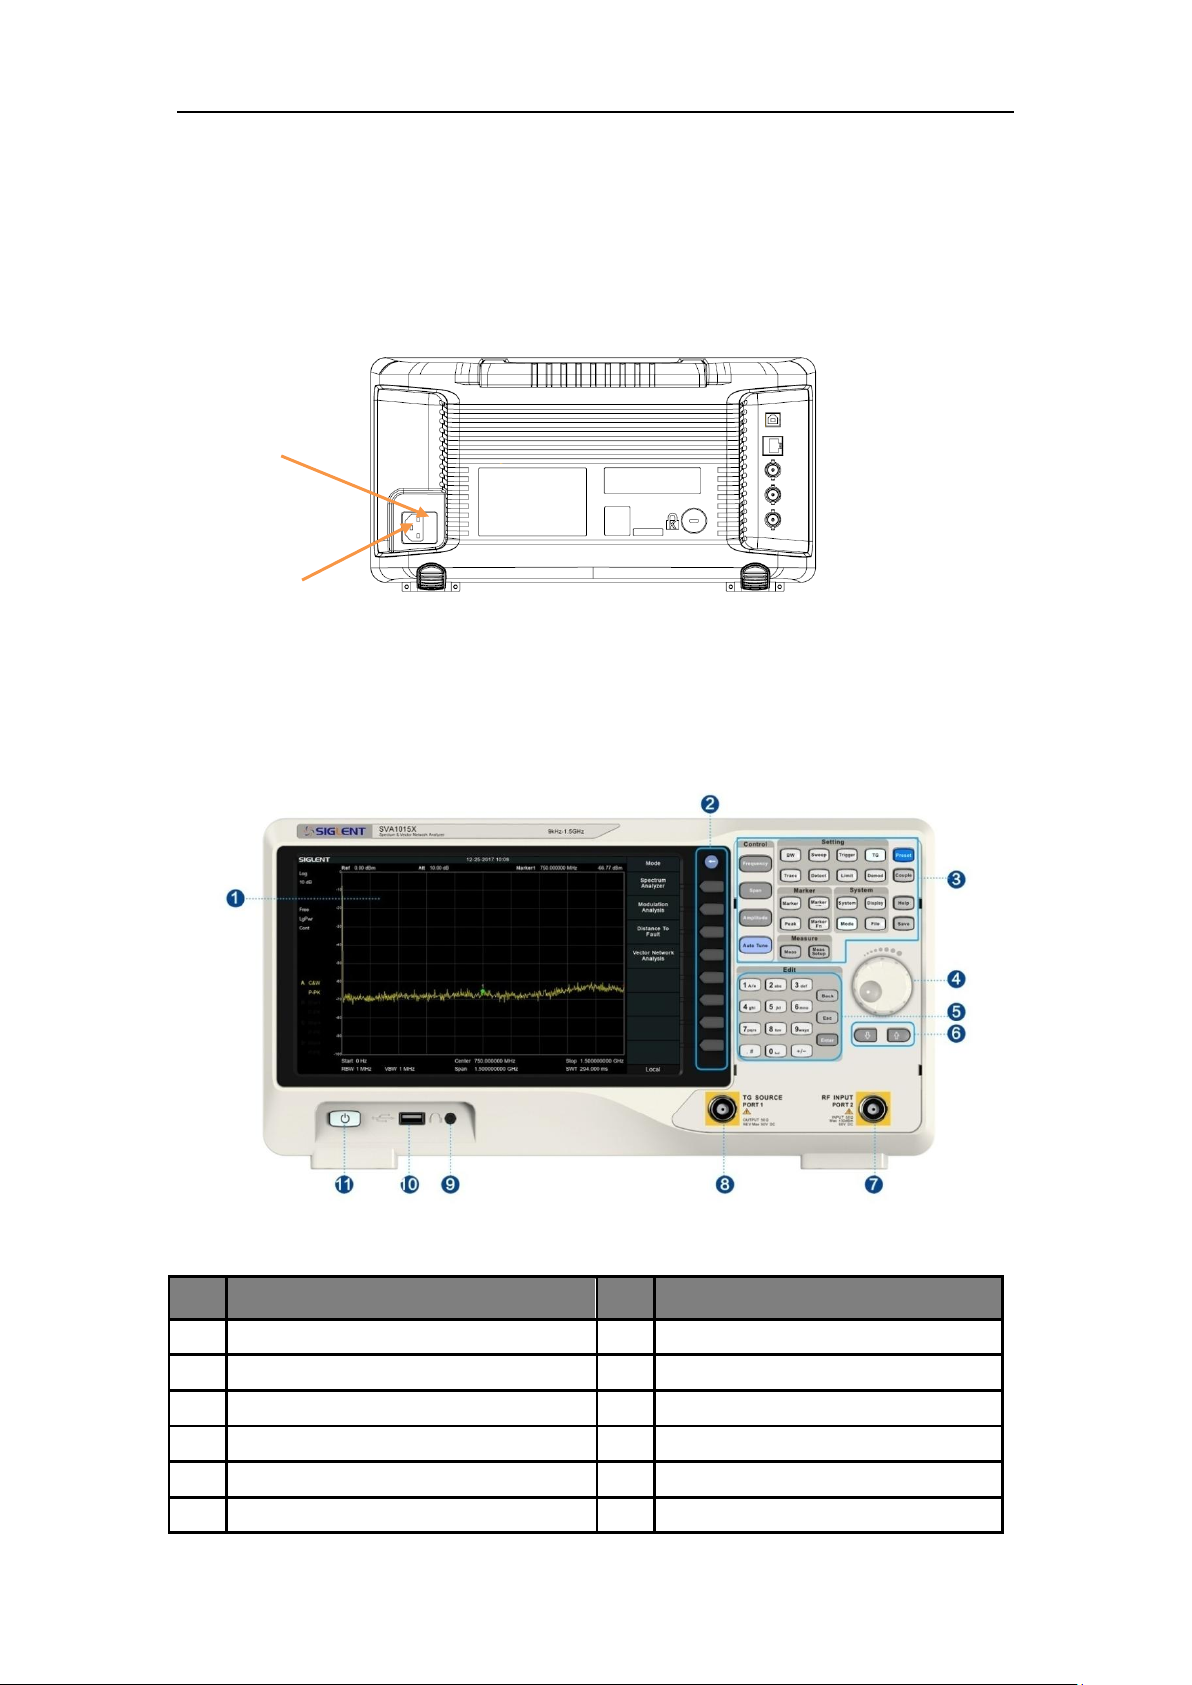
The Plug
Fuse holder
1.2.2 Connect to AC Power Supply
The analyzer accepts 100-240V, 50/60/440Hz AC power supply. Please use the provided
power cord to connect the instrument to the power source as shown in the figure below. Before
powering on, make sure the analyzer is protected by a fuse.
Figure 1-3 Power Cord Connection
1.3 The Front Panel
Figure 1-4 the Front Panel
Table 1-1 Front Panel Description
SVA1000X User Manual 3
Page 10
SIGLENT
Control Keys
Description
Frequency
Set the parameters of frequency, and Peak→CF, CF→Step.
Span
Set the parameters of span, and X-scale (Log-Linear) setup.
Amplitude
Set the parameters of amplitude, including Ref Level, Attenuator, Preamp, etc.;
and Correction setup.
Auto Tune
Scan the full span rapidly and move the biggest signal to center freq, and
automatically sets the optimal parameters according to the signal.
Control Keys
Description
BW
Set the parameters of RBW and VBW, Average Type (Log power, Power,
Voltage), and Filter Type (-3 dB Gauss\ -6 dB EMI).
Trace
Select Trace, Trace setup and Trace math.
Sweep
Set the parameters of sweep, and EMI QPD Dwell Time.
Detect
Select the detector type for each trace independently.
Trigger
Select triggers in Free Trigger, Video Trigger and External Trigger.
Limit
Set the Pass\Fail Limit.
TG
Set the parameters of tracking generator. Including TG Level, TG Level offset
Normalization setup. The backlight LED is on when TG source is working.
Demod
Set the demodulation parameters of the AM and FM for audio listening.
Marker Keys
Description
Marker
Set the Markers and Marker Table.
Marker->
Set other system parameters on the basis of the current marker value.
Marker Fn
Special functions of the marker such as noise marker, N dB bandwidth
measurement and frequency counter.
Peak
Search for the peak signal, peak search configuration and peak table.
Meas Keys
Description
Meas
In spectrum analyzer mode, selects the Advanced Measurement function.
In non-spectrum analyzer mode, select corresponding settings.
Meas Setup
Set the measurement parameters.
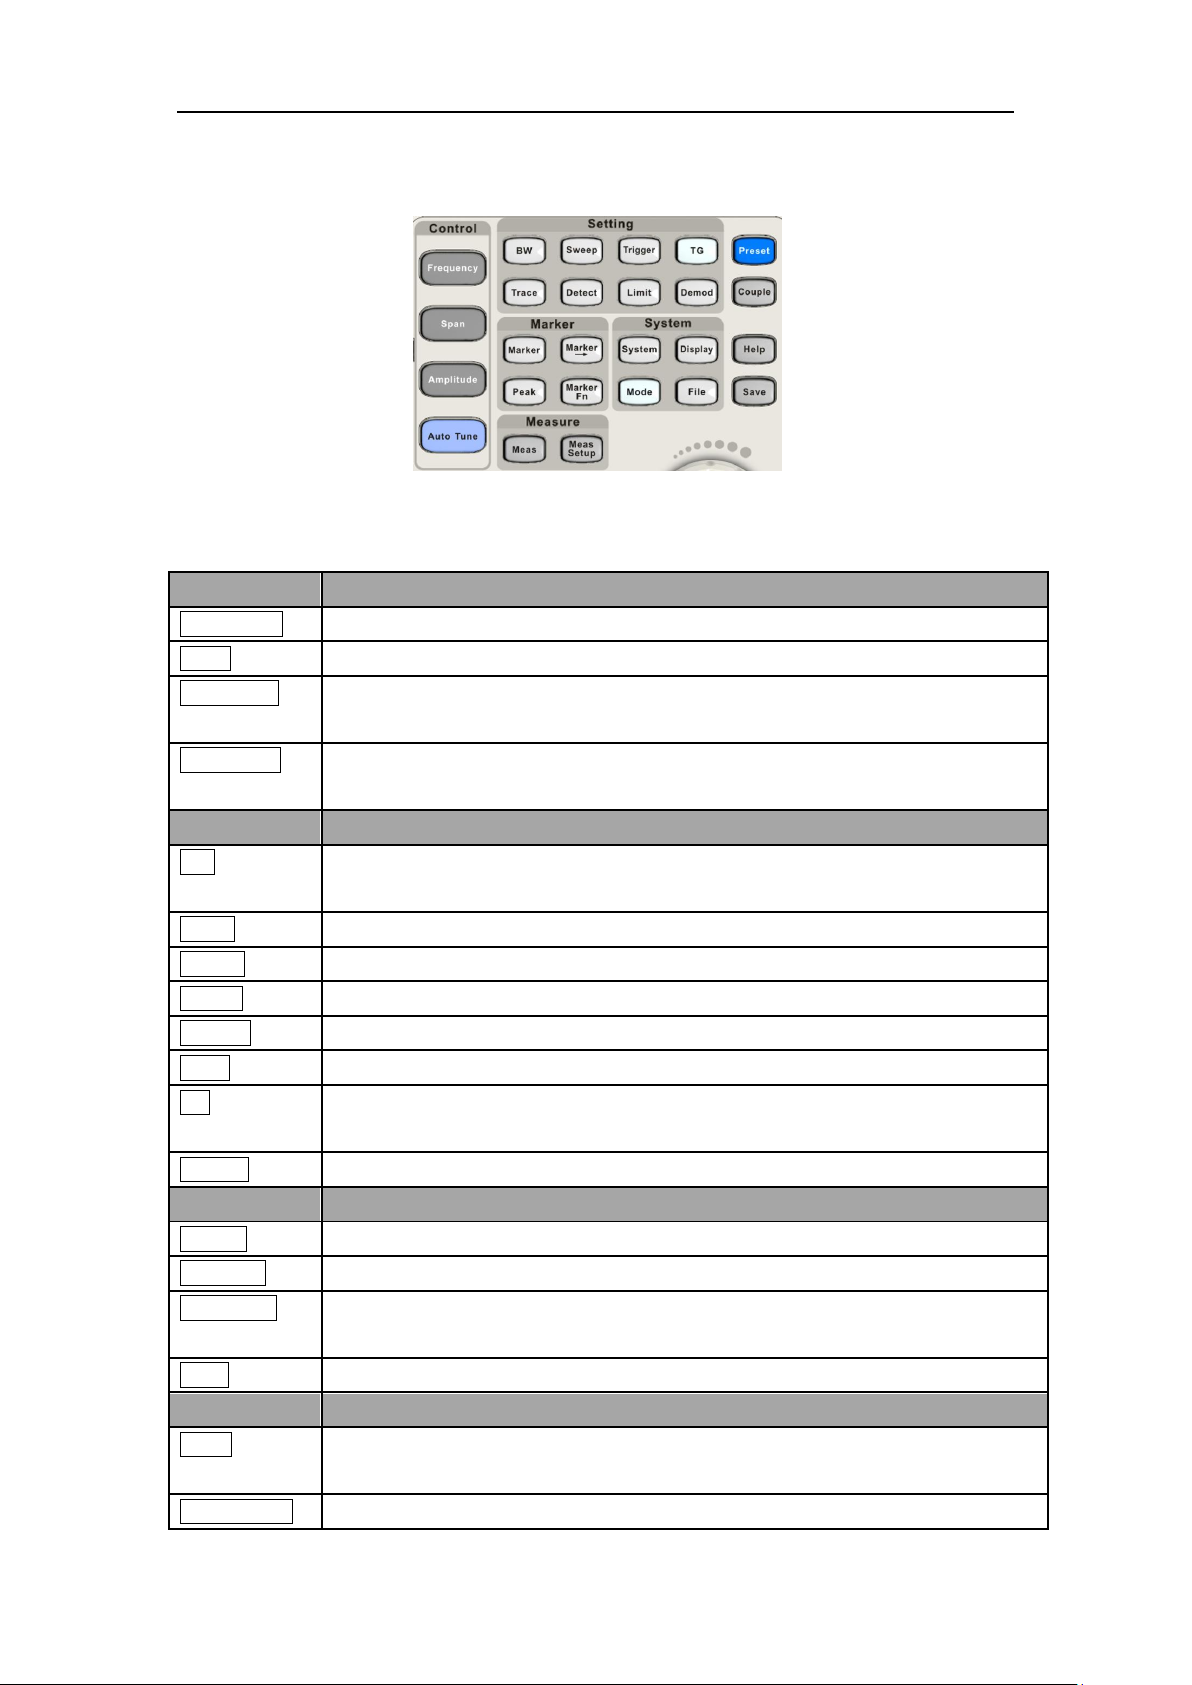
1.3.1 Front Panel Function Keys
Figure 1-5 Function Keys area
Table 1-2 Function keys description
SVA1000X User Manual 4
Page 11
SIGLENT
System Keys
Description
System
Set the system parameters.
Mode
Select the working mode between spectrum analyzer and other modes.
Display
Set the display parameters.
File
Use the file system and files.
Shortcut Keys
Description
Preset
Sets the system to certain status.
Couple
Set the parameters of some functions between auto and manual.
Help
Turn on the built-in help.
Save
Save Shortcut Key.
1.3.2 Front Panel Key Backlight
The on/off state and the color of the backlights of some keys at the front panel indicate the
working state of the analyzer. The states are as listed below.
1. Power Switch
Flash on and off alternatively, in a “breathing” state: indicate the unit is in stand-by.
Constant on: indicates the instrument is in normal operating state.
2. Mode
When the function is Spectrum Analyzer, the backlight turns off. When in another mode, the
backlight turns on.
3. TG
When the TG source is on, the backlight of TG turns on. When the TG is output is disabled the
backlight is off.
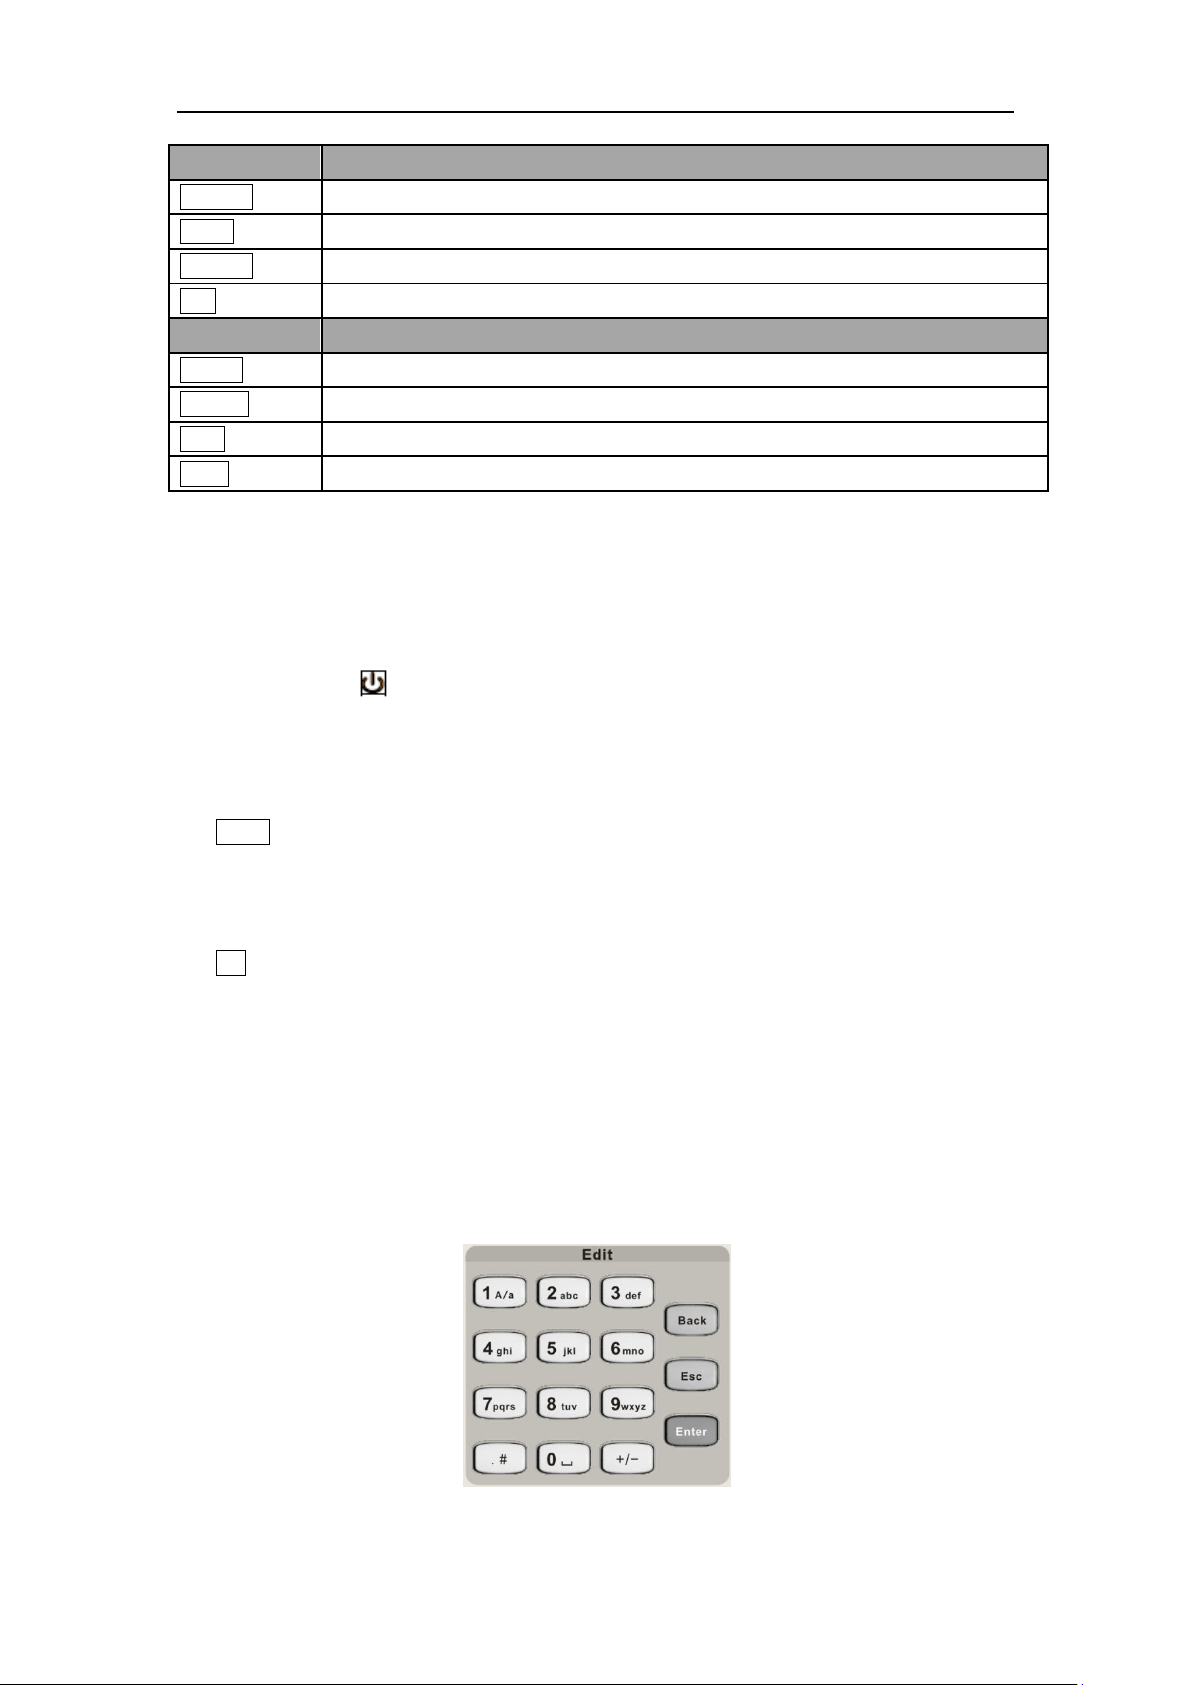
1.3.3 Using the Numeric Keyboard
The analyzer provides a numeric keyboard at the front panel. The numeric keyboard supports
English uppercase/lowercase characters, numbers and common symbols (including decimal
point, #, space and +/-) and are mainly used to edit file or folder names and set parameters.
Figure 1-6 Numeric Keyboards
SVA1000X User Manual 5
Page 12
SIGLENT
1 2 3
1. +/-
In the number input mode, this key sets the sign of number. In file input mode, this toggles the
character type between numbers and letters.
2. 1 A/a
In the number input mode, this key enters the number “1”. In file input mode, this toggles the
between upper and lowercase letters.
3. . #
In number input mode, this key enters a decimal point. In English input mode, this key enters
special characters (!, -, (, etc..).
4. Back
In parameter editing, press this key to delete the character to the left of the cursor.
5. Esc
During the parameter editing process, press this key to clear the inputs in the active
function area. Press again to exit parameter input mode.
When the instrument is in remote mode (being controlled by a computer), use this key to
return to local mode. This will unlock the front panel.
6. Enter
In parameter editing, the system will complete the input and insert a default unit for the
parameter.
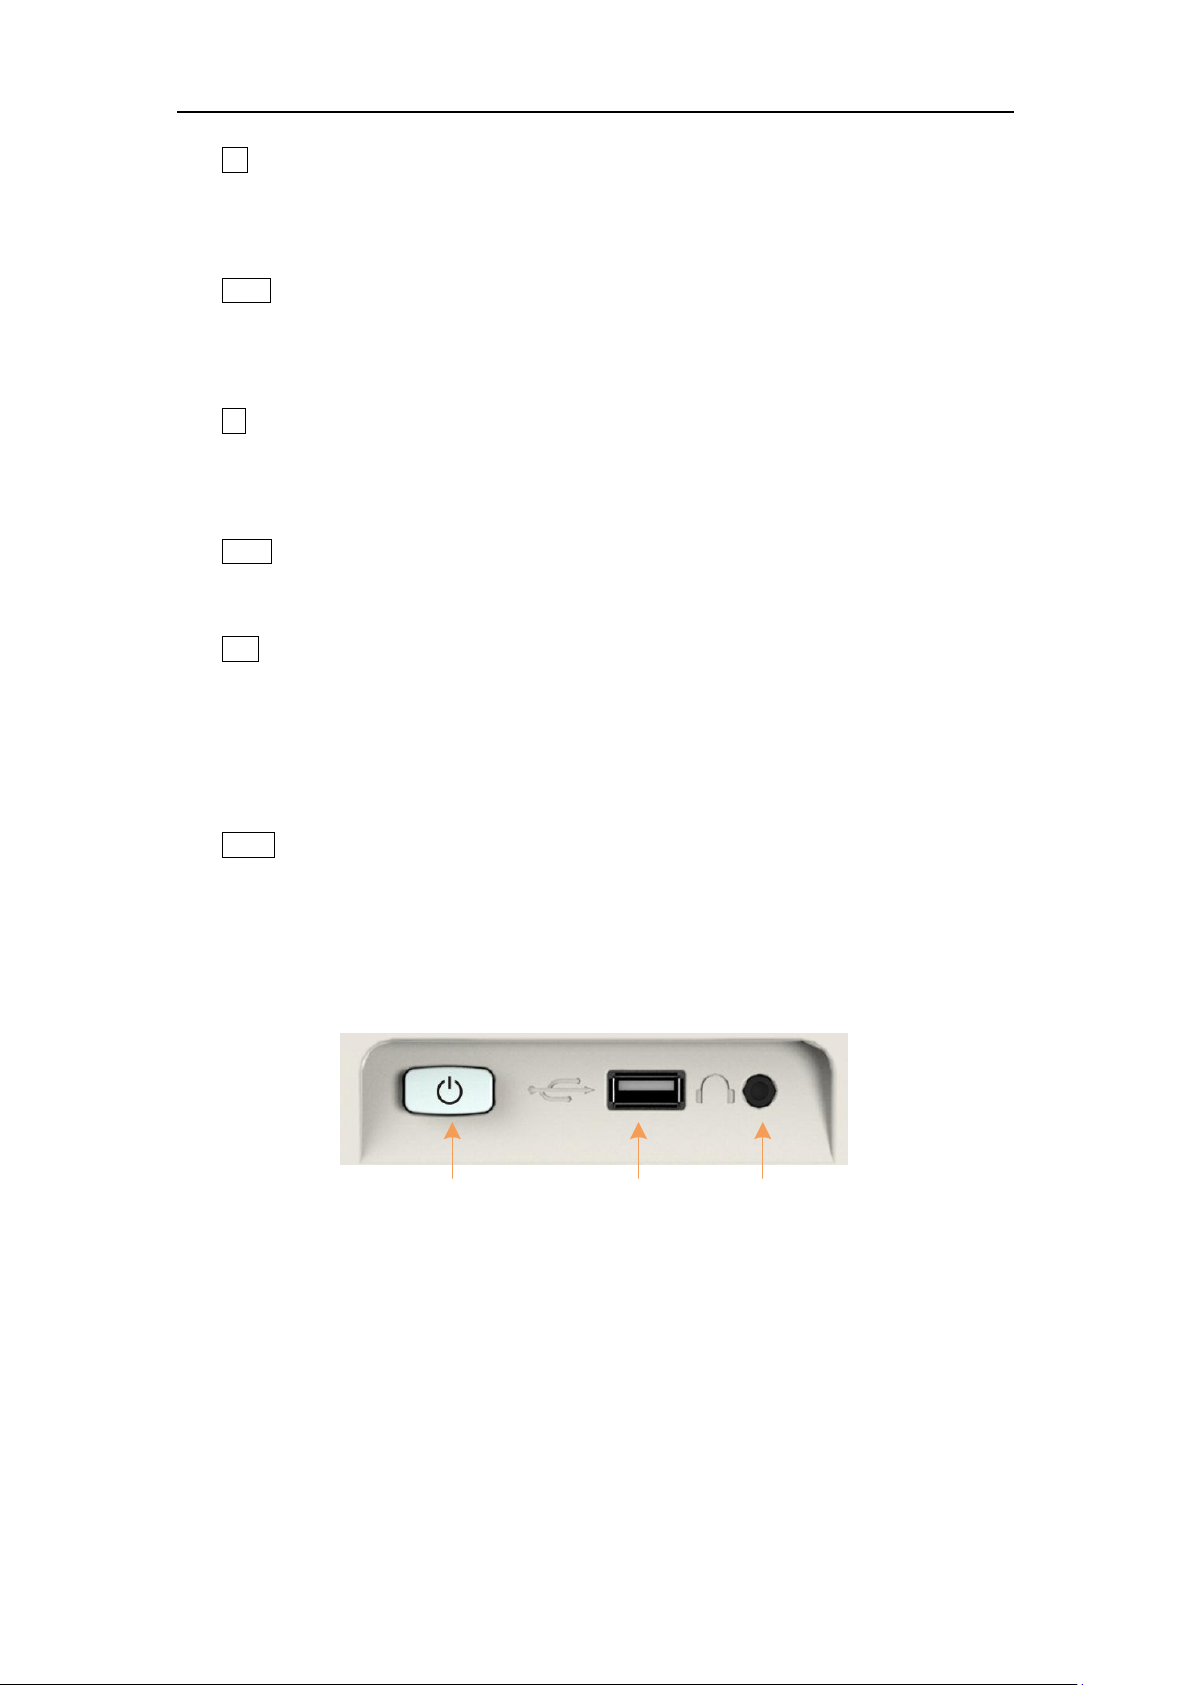
1.3.4 Front Panel Connectors
Figure 1-7 Front Panel Connectors (1)
1. Power Switch
Power on / Power down the instrument
2. USB Host
The analyzer can serve as a “host” device to connect external USB devices. This
interface is available for USB storage devices, the SIGLENT GPIB-USB adapter, wireless
or wired mouse and keyboard, and the SIGLENT Ecal electronic calibration module for
the SVA model instruments.
SVA1000X User Manual 6
Page 13
SIGLENT
CAUTION
Protect your hearing. Please turn the volume down to zero before using the
earphone. Gradually turn the volume up to a comfortable level after putting
in the earphone.
4 5
CAUTION
To avoid damage to the tracking generator, the reverse DC voltage cannot
exceed 50 V
CAUTION
To avoid damage to the instrument, the RF input signal must meet the
following: The DC voltage component and the maximum continuous power
of the AC (RF) signal component cannot exceed 50 V and +30 dBm
respectively.
Read and write functions for an external USB storage device or store the contents
currently displayed on the screen in the USB storage device in .png or .jpg or .bmp
format.
3. Earphone Jack
The analyzer can demodulate AM and FM signals. Insert a 3.5 mm earphone into to the jack to
acquire the audio output of the demodulated signal. You can turn on or off the earphone output
and adjust the volume via Demod ->Volume.
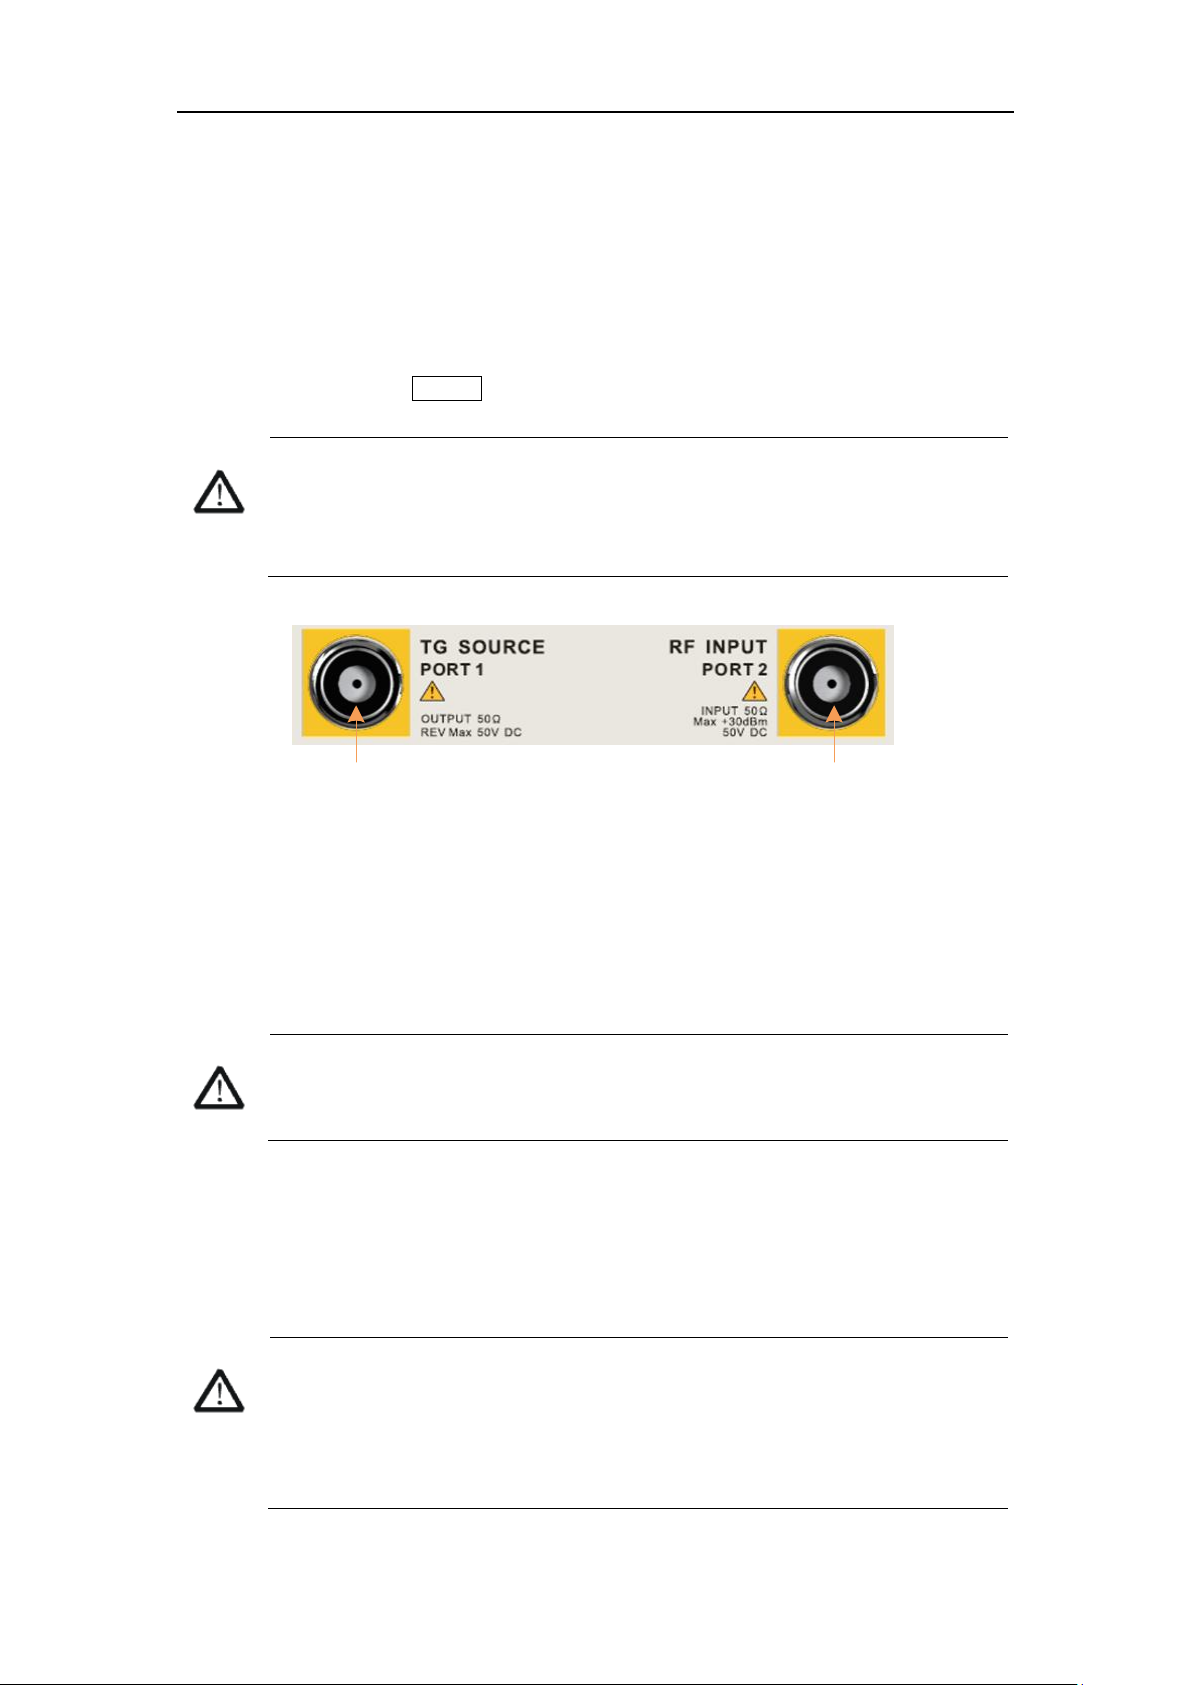
Figure 1-8 Front Panel Connectors (2)
4. TG SOURCE, VNA PORT 1
The TG SOURCE can be connected to a device-under-test (DUT) through a cable with a
male N-type male connector.
In the VNA mode, this port is used as the single port of S11 and the output port of S21.
5. RF INPUT, VNA PORT 2
The RF INPUT can be connected to the DUT through a cable with a male N-type
connector
In the VNA mode, this port is used as the input port for S21 measurements.
SVA1000X User Manual 7
Page 14
SIGLENT
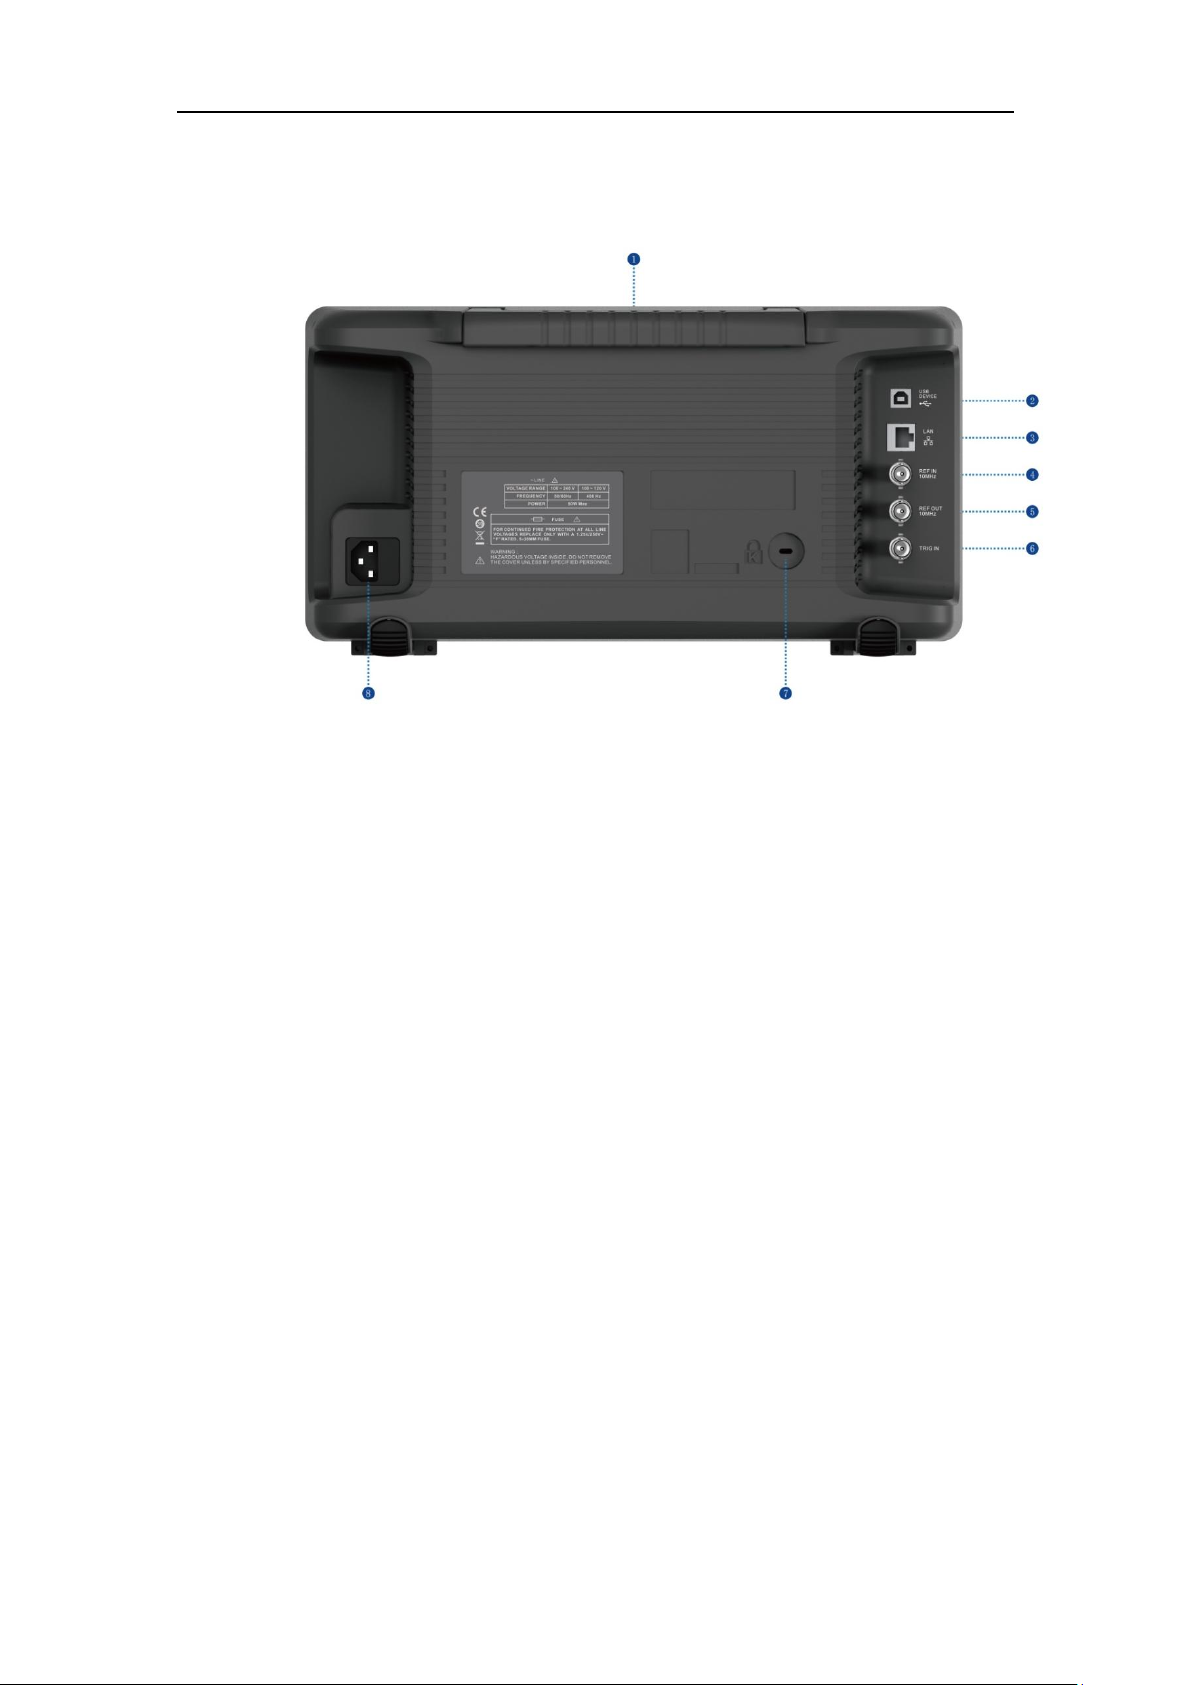
1.4 Rear Panel
Figure 1-9 Rear Panel
1. Handle
Pull up the handle vertically for easy carrying of the instrument. When you do not need the
handle, press it down.
2. USB Device Interface
The analyzer can serve as a “slave” device to connect external USB devices. Through this
interface, a PC can be connected to control the analyzer.
3. LAN Interface
Through this interface, the analyzer can be connected to your local-area-network (LAN) for
remote control.
4. REF IN 10 MHz
The analyzer can use the internal or an external reference source.
When a 10 MHz external clock signal is received through the [10 MHz IN] connector, this
signal is used as the external reference source and “Ext Ref” is displayed in the status
bar of the user interface. When the external reference is lost or not connected, the
instrument switches to its internal reference source automatically and “Ext Ref” on the
screen disappears.
The [10 MHz IN] and [10 MHz OUT] connectors are usually used to build synchronization
among multiple instruments.
SVA1000X User Manual 8
Page 15

SIGLENT
5. REF OUT 10 MHz
The analyzer can use the internal or an external reference source.
When an internal reference source is used, the [10 MHz OUT] connector can output a 10
MHz clock signal generated by the analyzer. This signal can be used to synchronize other
instruments.
The [10 MHz OUT] and [10 MHz IN] connectors are usually used to build synchronization
among multiple instruments.
6. Trigger in
In external trigger mode, the analyzer will update the trace scan after the Trigger In connector
receives an external trigger signal that meets the trigger input specifications.
7. Security Lock Hole
If needed, you can use a security lock(purchased separately) to lock the analyzer to a desired
location.
8. AC Power Supply and Fuse
The analyzer accepts 100-240V, 50/60/440Hz AC power. Please use the power cord provided
as accessories to connect the instrument. Before power on, make sure the analyzer is
protected by the proper input fuse.
SVA1000X User Manual 9
Page 16
SIGLENT
21
1 2 3 4 5 976 10
17
41
40
38
37
39
36
35
34
33
32
31
30
29
28 27 25 24 23 22 20 19 18
1614
131211
8
15
26
42
45
43
44
NO.
Name
Description
1
SIGLENT
SIGLENT logo
2
Ref
Reference level
3
UNCAL
When the sweep time is less than the auto couple time,
the measure result may have decreased accuracy, The
display will indicate uncalibrated using the letters
“UNCAL”
4
EXT REF
Valid Ext 10 MHz reference clock detected indicator
5
Att
Attenuator Value
6
Day and time
System time
7
Pass/Fail status
Limit Pass/Fail status
8
Marker
Current active marker
9
Trace
Active trace
10
Marker instruction
current marker, touch to open a new marker
11
Marker x value
Unit: frequency, frequency delta or time
12
State indication
Auto Tune: Automatically sets the optimal parameters
according to the characteristics of the signal
Waiting for Trigger: waiting for trigger
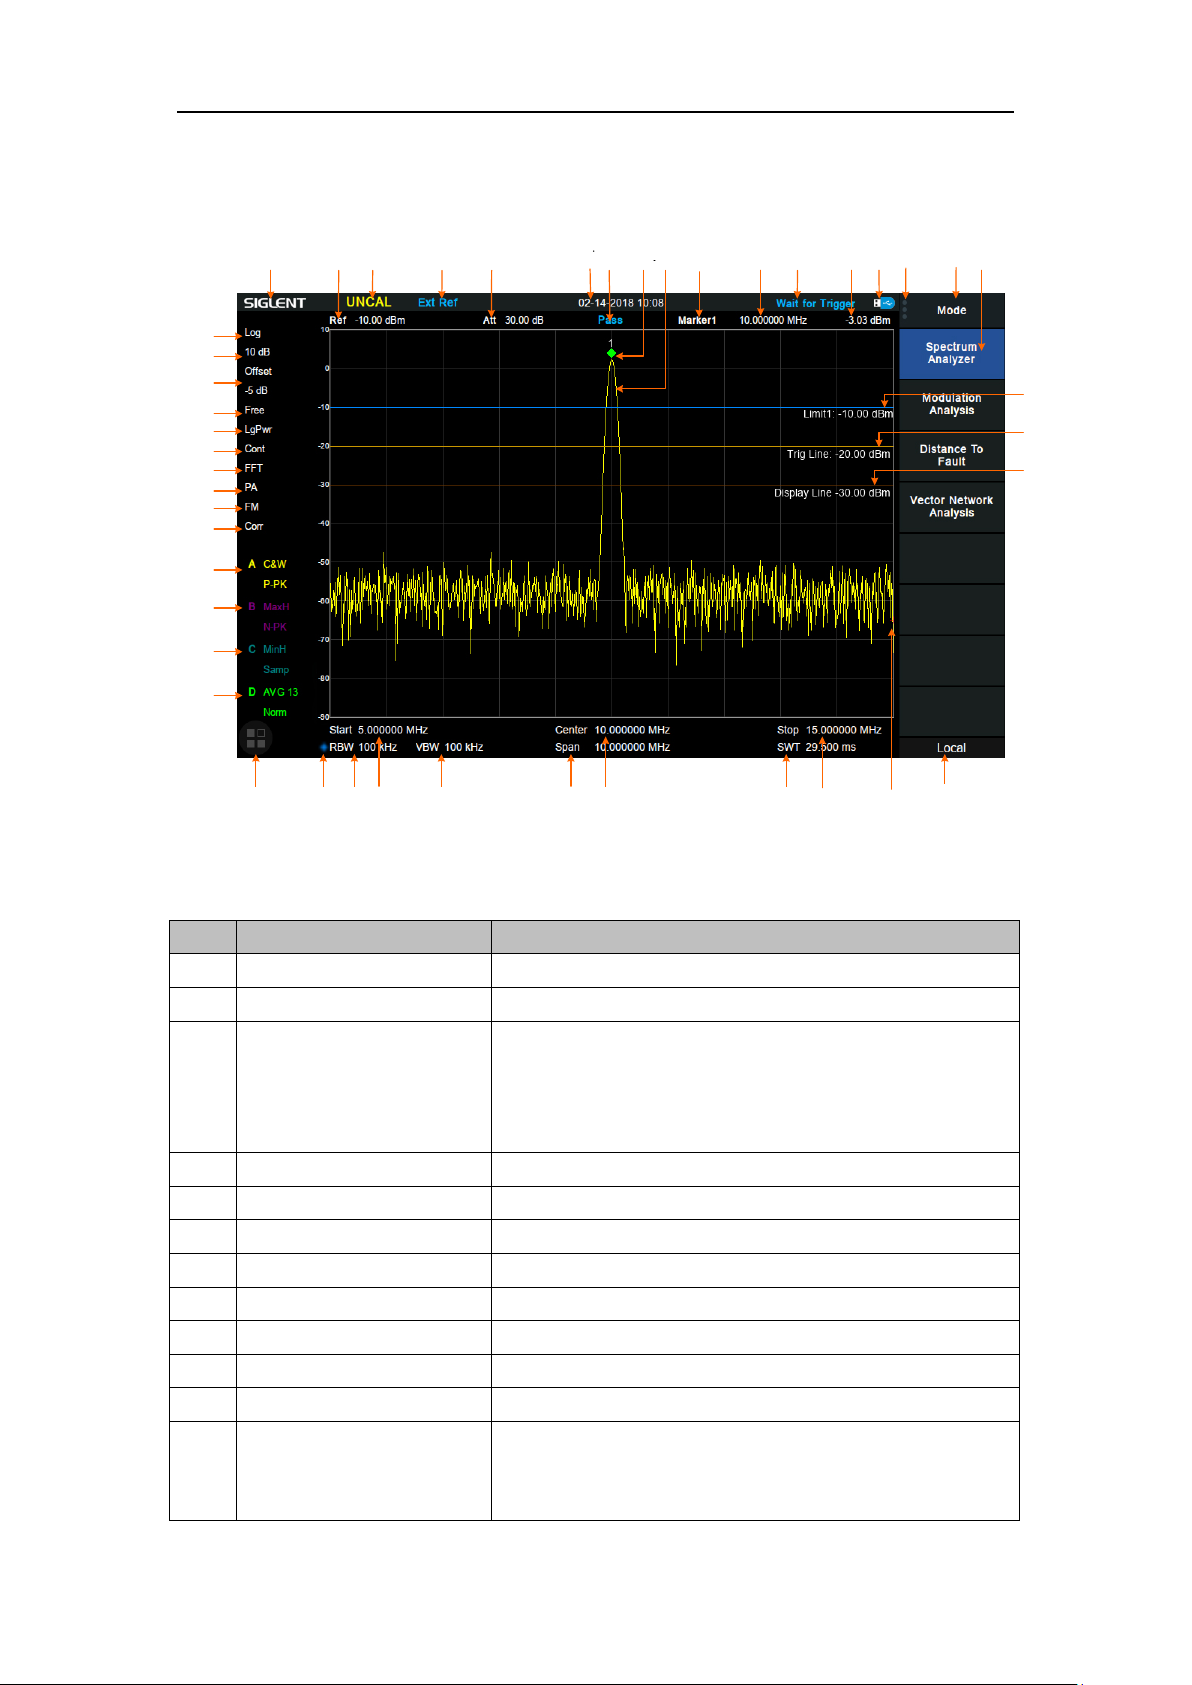
1.5 User Interface
Figure 1-10 User Interface
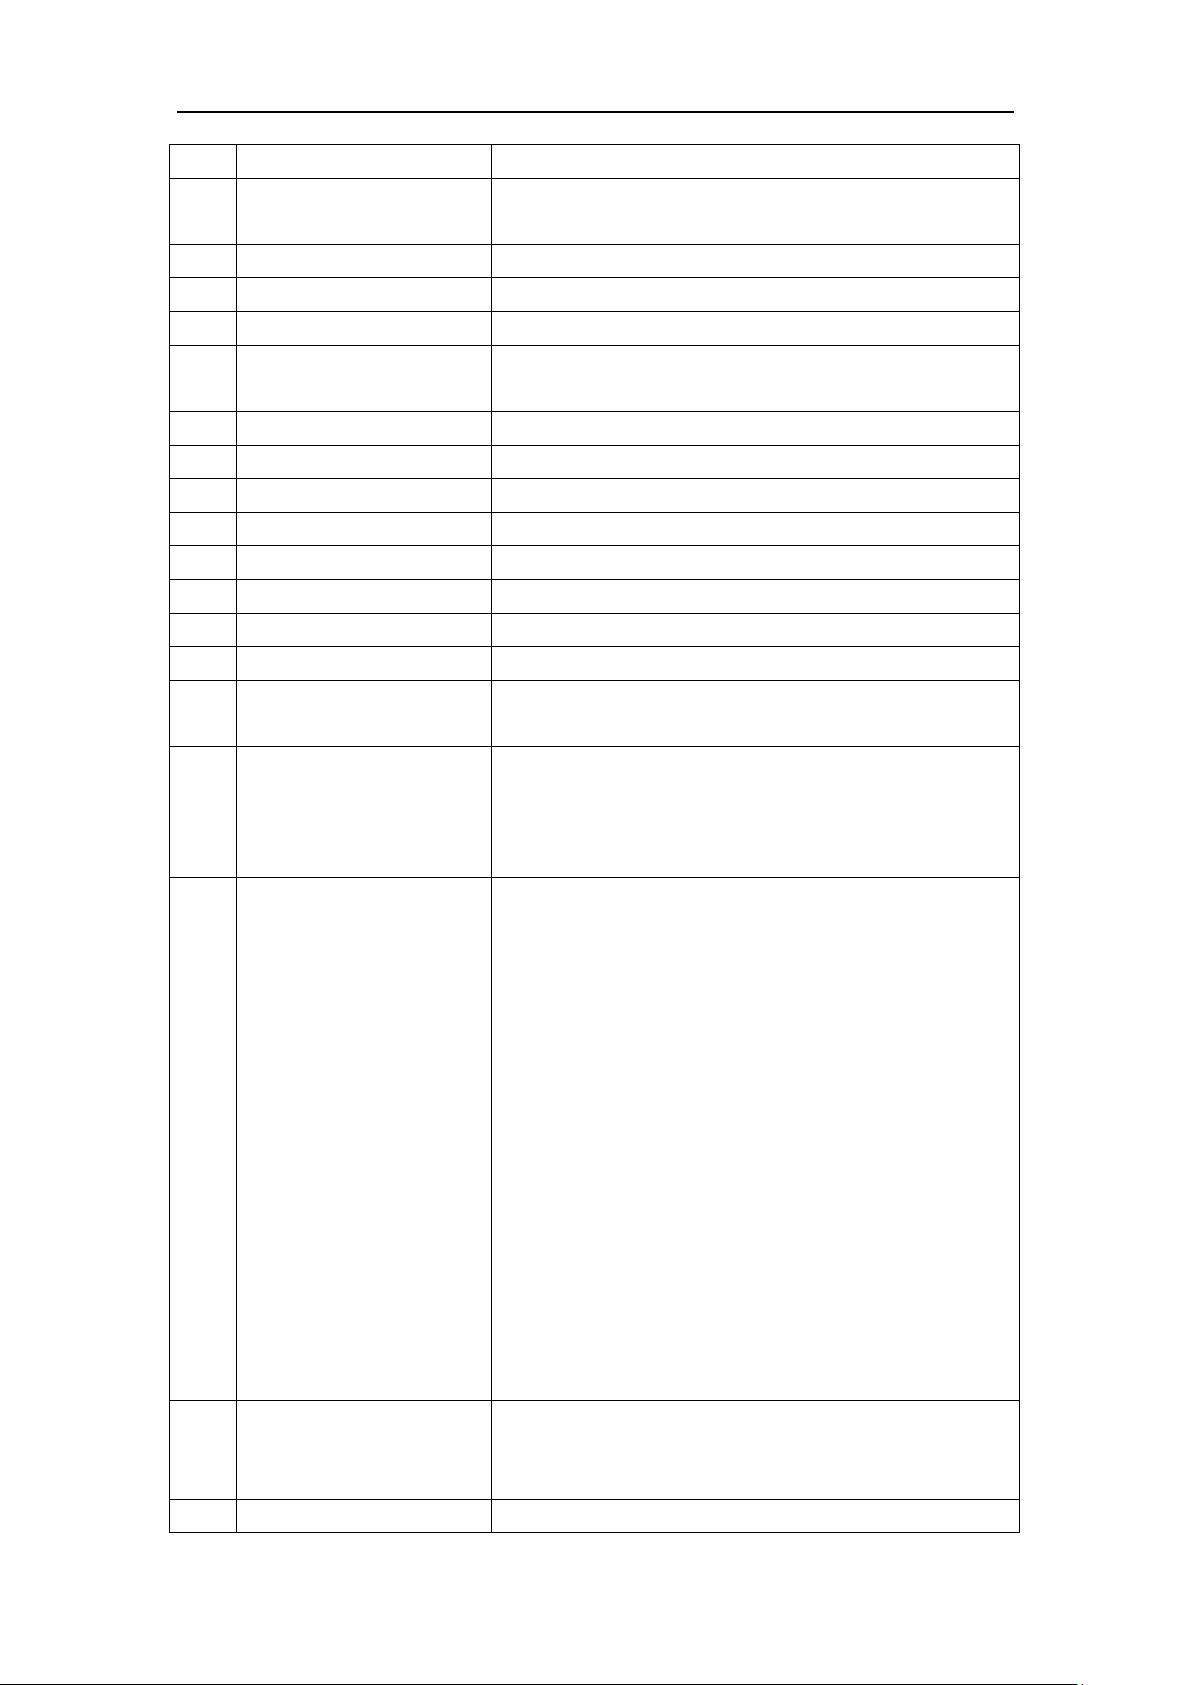
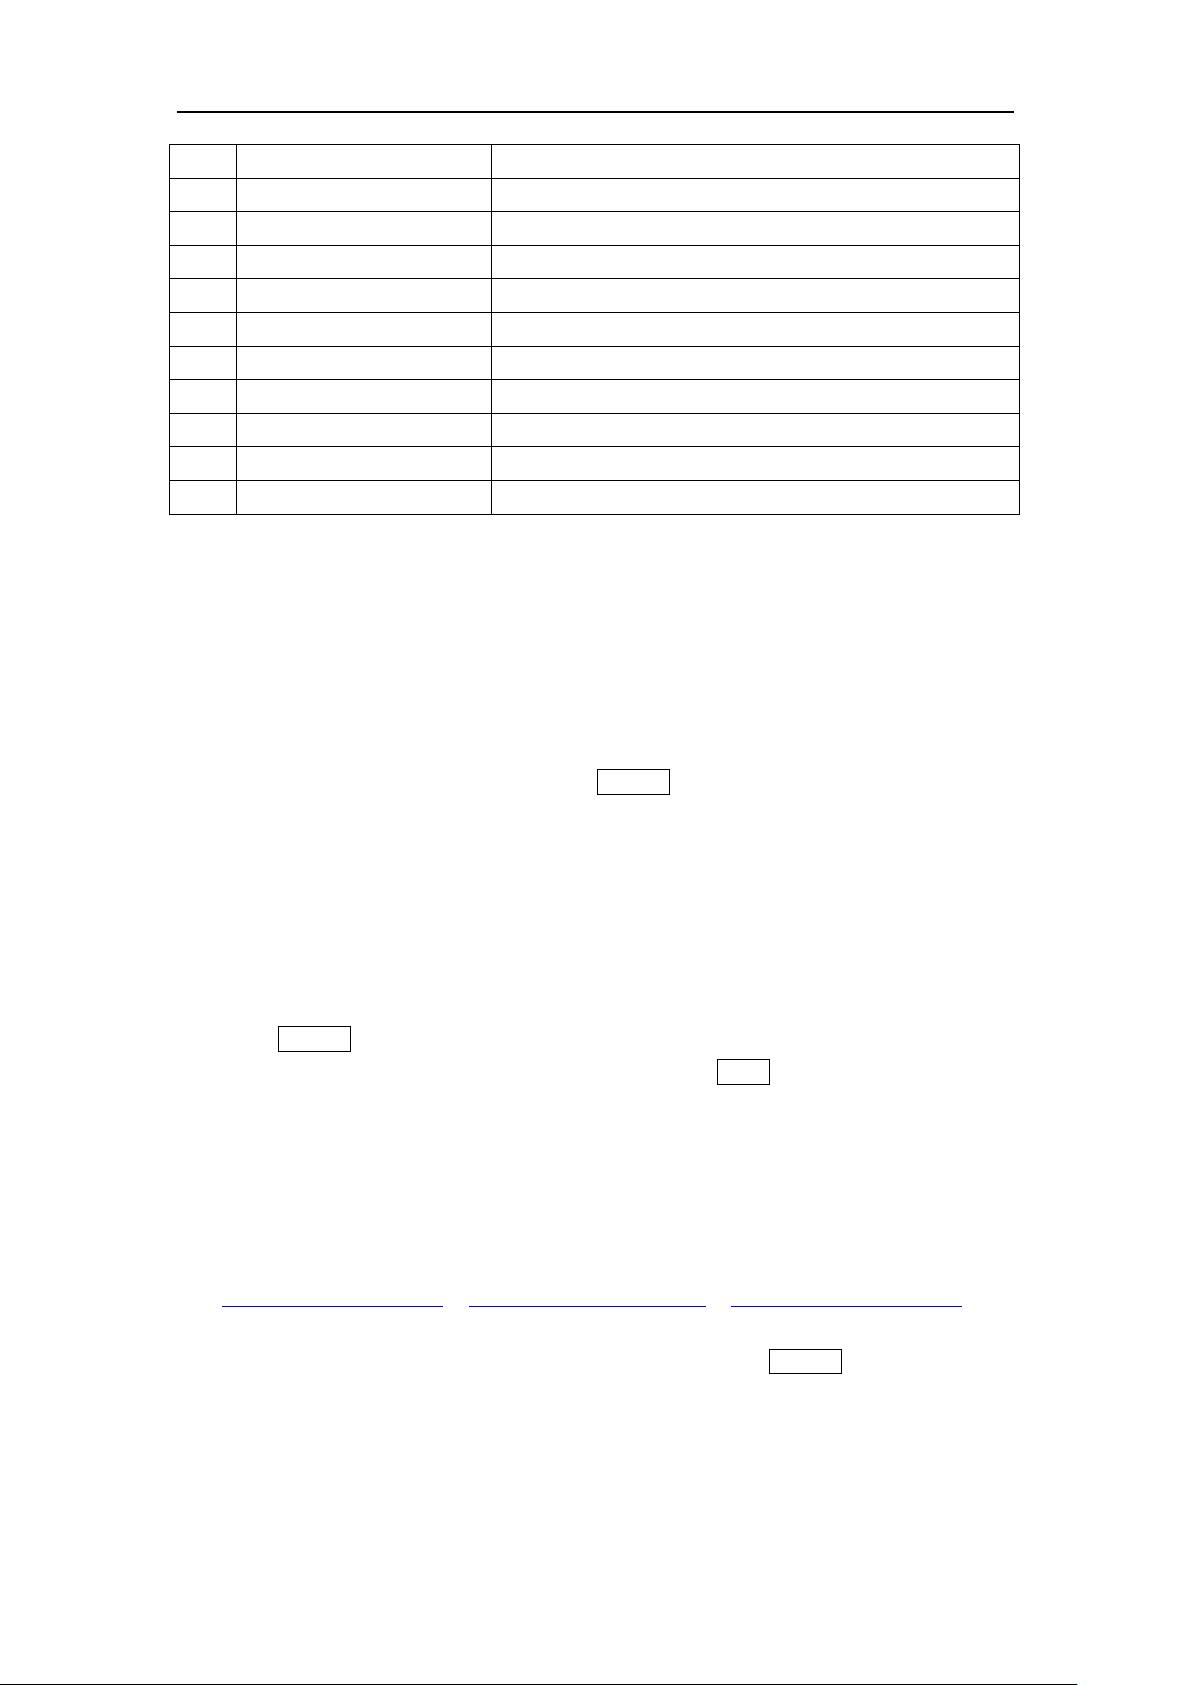
Table 1-3 User Interface labels
SVA1000X User Manual 10
Page 17
SIGLENT
13
Marker y value
Amplitude value or amplitude delta value
14
USB storage device
identification
The identification is displayed when a USB flash drive is
inserted
15
Main menu touch logo
Clicking this button will bring up the main menu
16
Menu title
Function of the current menu.
17
Menu items
Menu items of the current function
18
Operation status
Local is local mode, Remote is remote mode, Upgrade
means the instrument is upgrading
19
Sweep progress indication
Indicates the currently scanned frequency position
20
Stop frequency
Stop frequency value
21
Sweep time
Time duration of a single sweep
22
Center frequency
Center frequency value
23
Span
Span value
24
VBW
Video bandwidth
25
Start frequency
The first frequency of a sweep
26
RBW
Resolution bandwidth
27
Manually instructions
When it appears, this parameter is not automatically
coupled but manually configured
28
Touch assistant
Click to open the commonly used functions for
measurement, such as peak search.
Touch Assist can be moved to any position on the screen
and it can be turned off in the DISPLAY menu
29
30
31
32
Trace status
Set the trace A\B\C\D parameters.
Trace mode:
C&W: Clear Write
MaxH: Max Hold
MinH: Min Hold
View: View
AVG: Video average and times.
Detect type:
P-PK: Positive peak
N-PK: Positive peak
Samp: Sample
Norm: Normal
AVG: average
Q-PK: Quasi-peak
33
Correction
When present, indicates that there is a user-configured
amplitude correction table being mathematically applied
to the displayed trace data
34
AM or FM
AM or FM demodulation activated
SVA1000X User Manual 11
Page 18
SIGLENT
35
PA
Enable or disable the Preamplifier
36
FFT
Sweep mode is FFT
37
Single or Continue
Sweep mode single or continuous
38
Average type
Log power\Power\Voltage power
39
Trigger type
Free\Video\External trigger
40
Ref offset
34:Ref offset identification;35:Ref offset value
41
Scale/Div
Scale value
42
Scale type
Logarithm or linearity
43
Limit line
Limit Pass/Fail level
44
Trigger level
Video trigger level
45
Display line
Reference display line
1.6 Firmware Operation
1.6.1 Check System Information
Users can get the system information by press System->“System Info”, including
Product Model, Serial and Host ID
Software Version and hardware Version
Option Information
1.6.2 Load Option
Refer to the procedures below to activate the options you have purchased.
1. Press System->“System Info”->“Load Option”
2. Enter the license key in the onscreen window. Press Enter to confirm your input and
terminate the license key input.
1.6.3 Firmware Upgrade
Follow this procedure to update the instrument firmware:
1. Download the firmware package from an official SIGLENT website.
www.siglentamerica.com, http://www.siglent.com/ens, https://www.siglenteu.com
2. Extract and copy the .ADS file into the root directory of a USB stick.
3. Plug the USB stick into the USB Host connector. Press System->“System Info”->
“Firmware Update”; find the .ADS file in USB stick.
4. Press the ‘Load’, the analyzer will perform the update process automatically.
The upgrade procedure will take several minutes. Once the upgrade is completed, please
follow the instruction to reboot.
Any interruption during the update process will result in update failure and system data
SVA1000X User Manual 12
Page 19

SIGLENT
loss.
This is not covered under the warranty and the user will bear repair costs and
shipping.
Do not remove the USB storage device until the update is finished.
1.7 Mode
The analyzer offers a variety of operating modes. They can be purchased separately. They
can be selected via the Mode key:
Spectrum Analyzer
Modulation Analysis (AMA/DMA)
Vector Network Analysis (VNA)
Distance-To-Fault (DTF)
Front panel key menus may be different in different modes.
1.8 Touch Operation
The analyzer has a 10.1 inch multi-touch screen and supports various gesture operations.
Including:
Press or click on the upper-right-corner of the screen to enter the main menu
Swipe up and down or left and right in the waveform area to change the X-axis center
coordinate or Y-axis reference level
Perform two-points scaling in the waveform area to change the X-axis span
Click on a screen parameter or menu for parameter selection or editing;
Open and drag the marker;
Use auxiliary shortcuts to perform common operations.
You can turn the touch screen function on and off via Display->’Touch Settings’.
1.9 Remote Control
The analyzer supports communication with computers via USB, LAN, and GPIB-USB
interfaces. By using these interfaces, in combination with programming languages and/or
NI-VISA software, users can remotely control the analyzer based on a SCPI (Standard
Commands for Programmable Instruments) compliant command set, Labview and IVI
(Interchangeable Virtual Instrument), to interoperate with other programmable instruments.
You can also remote monitor and control the analyzer in Web Browser or EasySpectrum.
For more details, refer to the ‘Programming Guide’ or contact your nearest SIGLENT office.
SVA1000X User Manual 13
Page 20
SIGLENT
1.10 Using Built-in Help
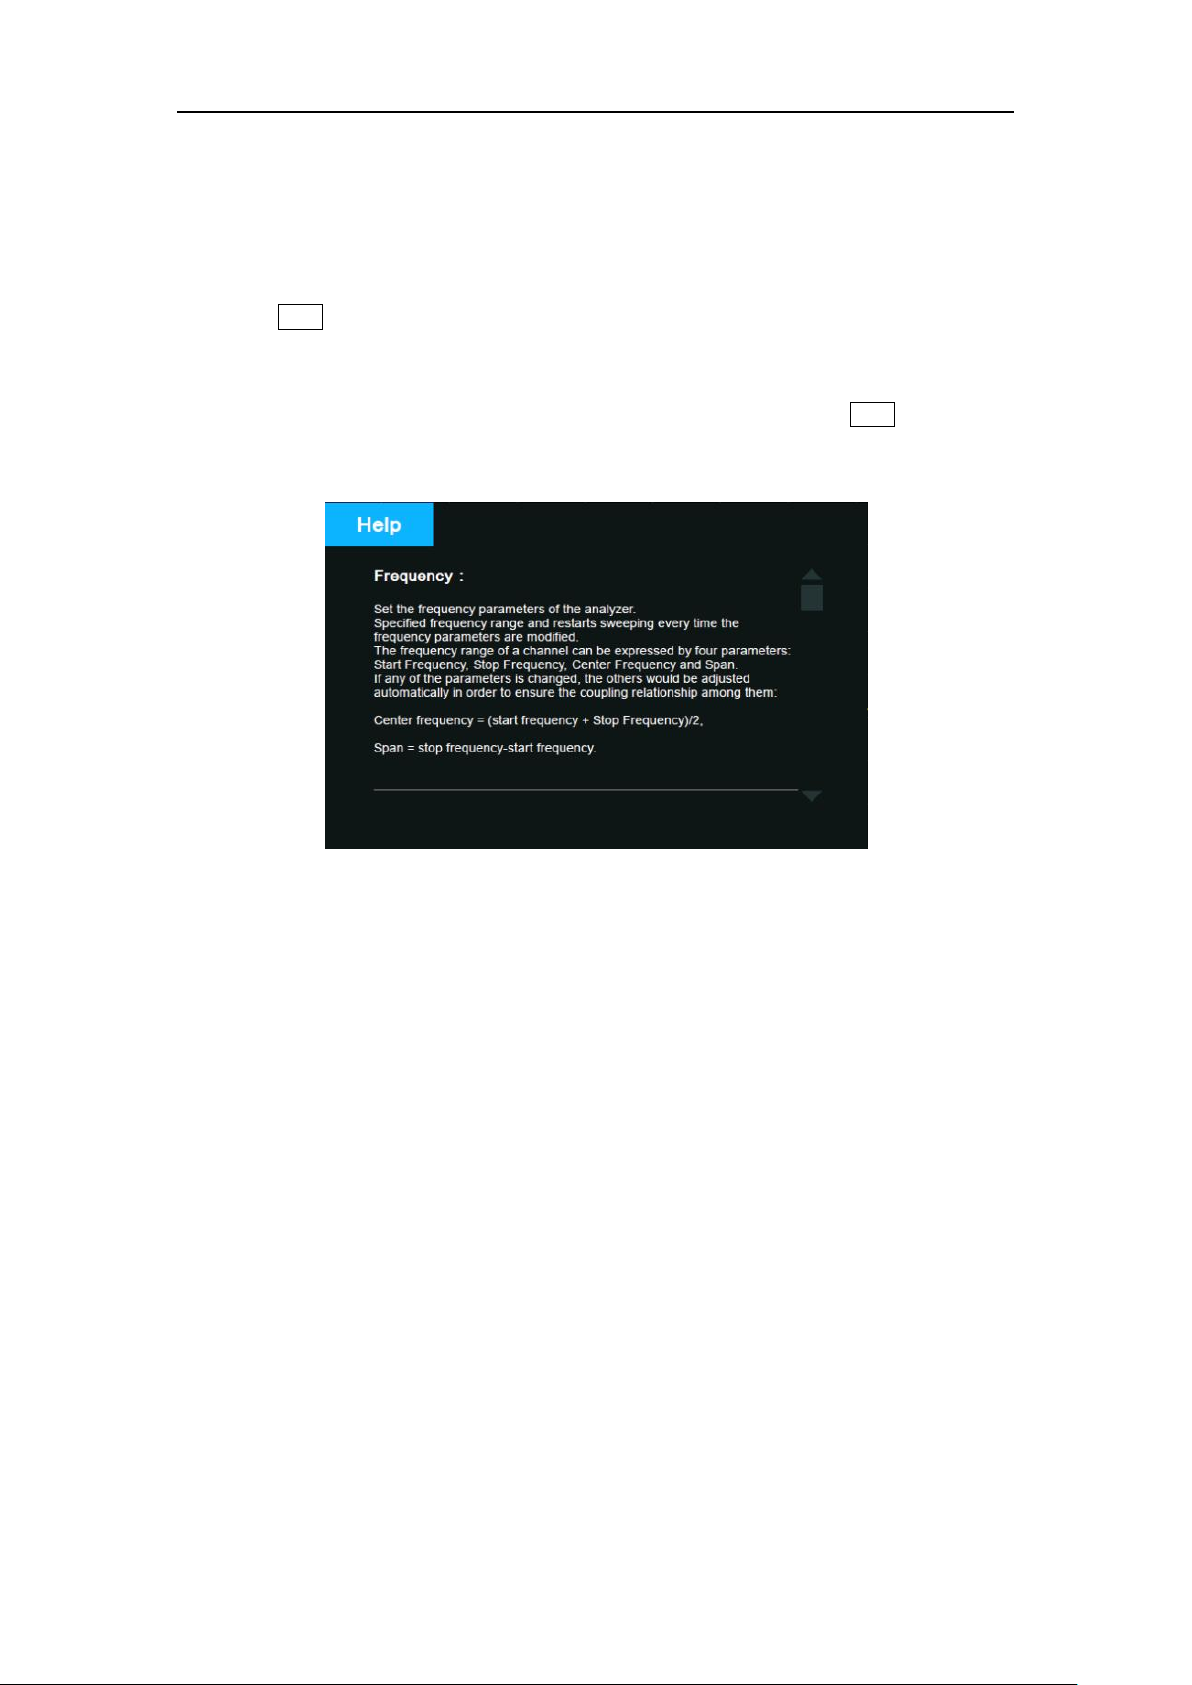
The built-in help system provides information about every function key at the front panel and
every menu soft key.
Press Help and a prompt about how to obtain help information will be shown at the center
of the screen. Then, press the key that you want to get help of and the relevant help
information will be shown at the center of the screen.
When the help information show at the center of the screen. Press the Help button; it will
close the help information.
Figure 1-11 help information
SVA1000X User Manual 14
Page 21

SIGLENT
Chapter 2 Front Panel Operation
This chapter describes in detail the function keys at the front panel and the associated
functions.
Subjects in this chapter:
Basic Settings
Sweep and Function
Marker
Measurement
System
Mode Setup
Shortcut keys
SVA1000X User Manual 15
Page 22
SIGLENT
startstopspan
stopstartcenter
fff
)/2f(ff
span
f
Parameter
Explanation
Default
Full Span/2
Range
Zero Span, 0 Hz ~ Full Span
Nonzero Span, 50 Hz ~ (Full Span -50Hz)
Available Units
GHz\MHz\kHz\Hz
Knob Step
Span > 0, step = Span/200, min 1 Hz
Span = 0, step = RBW/100
Direction Key Step
Freq step
Related to
Start Freq, Stop Freq
2.1 Basic Settings
2.1.1 Frequency
Set the frequency parameters and functions of the analyzer. The sweep will restart every time
the frequency parameters are modified.
The frequency range of a channel can be expressed by three groups of parameters: Start
Frequency, Center Frequency and Stop Frequency. If any of the parameters change, the
others will be adjusted automatically in order to ensure the coupling relationship among them
, Where
is the span
2.1.1.1 Center Frequency
Set the programmed frequency to the center of the display. The center frequency and span
values are displayed at the lower left and right sides of the grid respectively. Please pay
attention to the following points:
The start and stop frequencies will vary with changes to the center frequency when the span is
constant.
In Zero Span, the start frequency, stop frequency and center frequency are always set to the
same value.
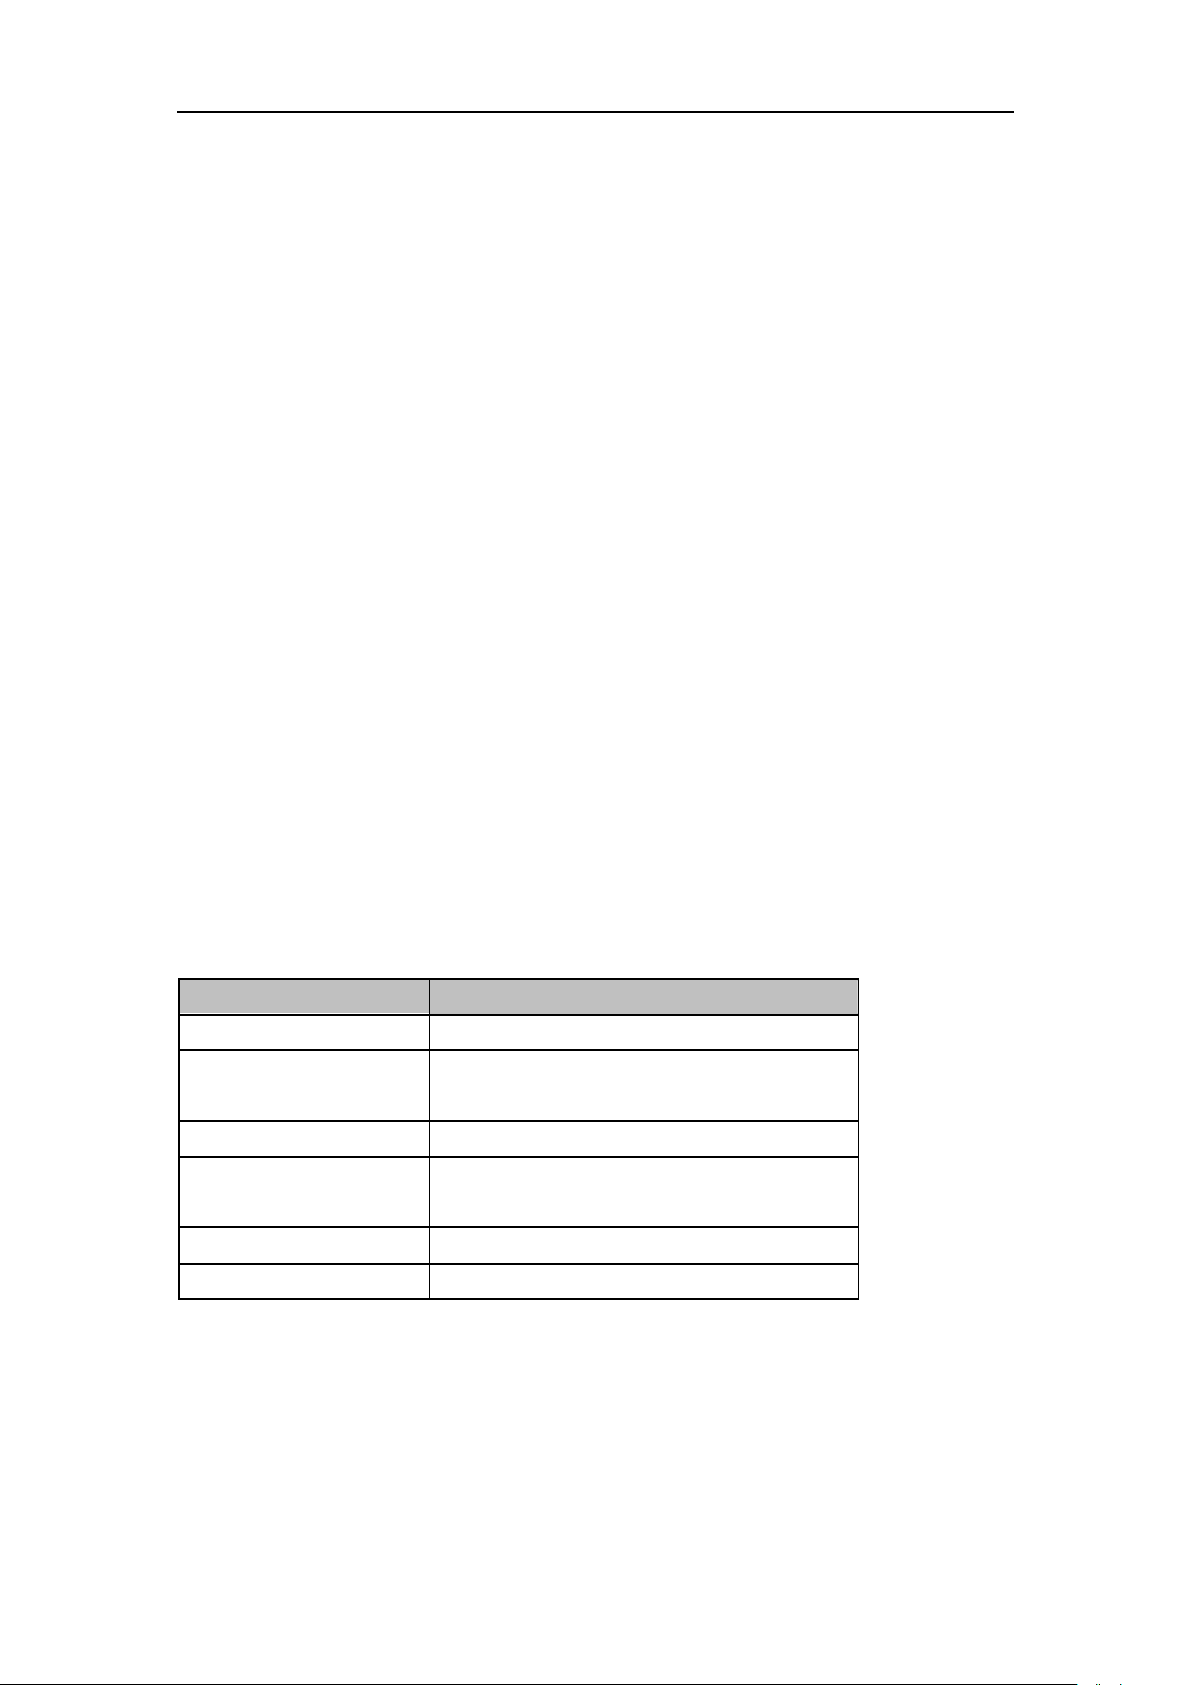
Table 2-1 Center Frequency
2.1.1.2 Start Frequency
Set the start frequency of the current sweep. The start and stop frequencies are displayed at
the lower right sides of the grid respectively. Please pay attention to the following points:
The span and center frequency vary with the start frequency when the Span does not
reach the minimum (The parameters vary with the span, please refer to “Span”);
SVA1000X User Manual 16
Page 23
SIGLENT
Parameter
Explanation
Default
0 GHz
Range
Zero Span, 0 Hz ~ Full Span
Nonzero Span, 0 Hz ~ (Full Span-100Hz)
Unit
GHz, MHz, kHz, Hz
Knob Step
Span > 0, step = Span/200, min 1 Hz
Span = 0, step = RBW/100
Direction Key Step
Freq step
Related to
Center Freq, Span
Parameter
Explanation
Default
Full Span
Range
Zero Span: 0 Hz ~ Full Span
Nonzero Span: 100 Hz ~ Full Span
Unit
GHz\MHz\kHz\Hz
Knob Step
Span > 0, step = Span/200, min 1 Hz
Span = 0, step = RBW/100
Direction Key Step
Freq step
Related to
Center Freq, Span
In Zero Span, the start frequency, stop frequency and center frequency are always the
same value.
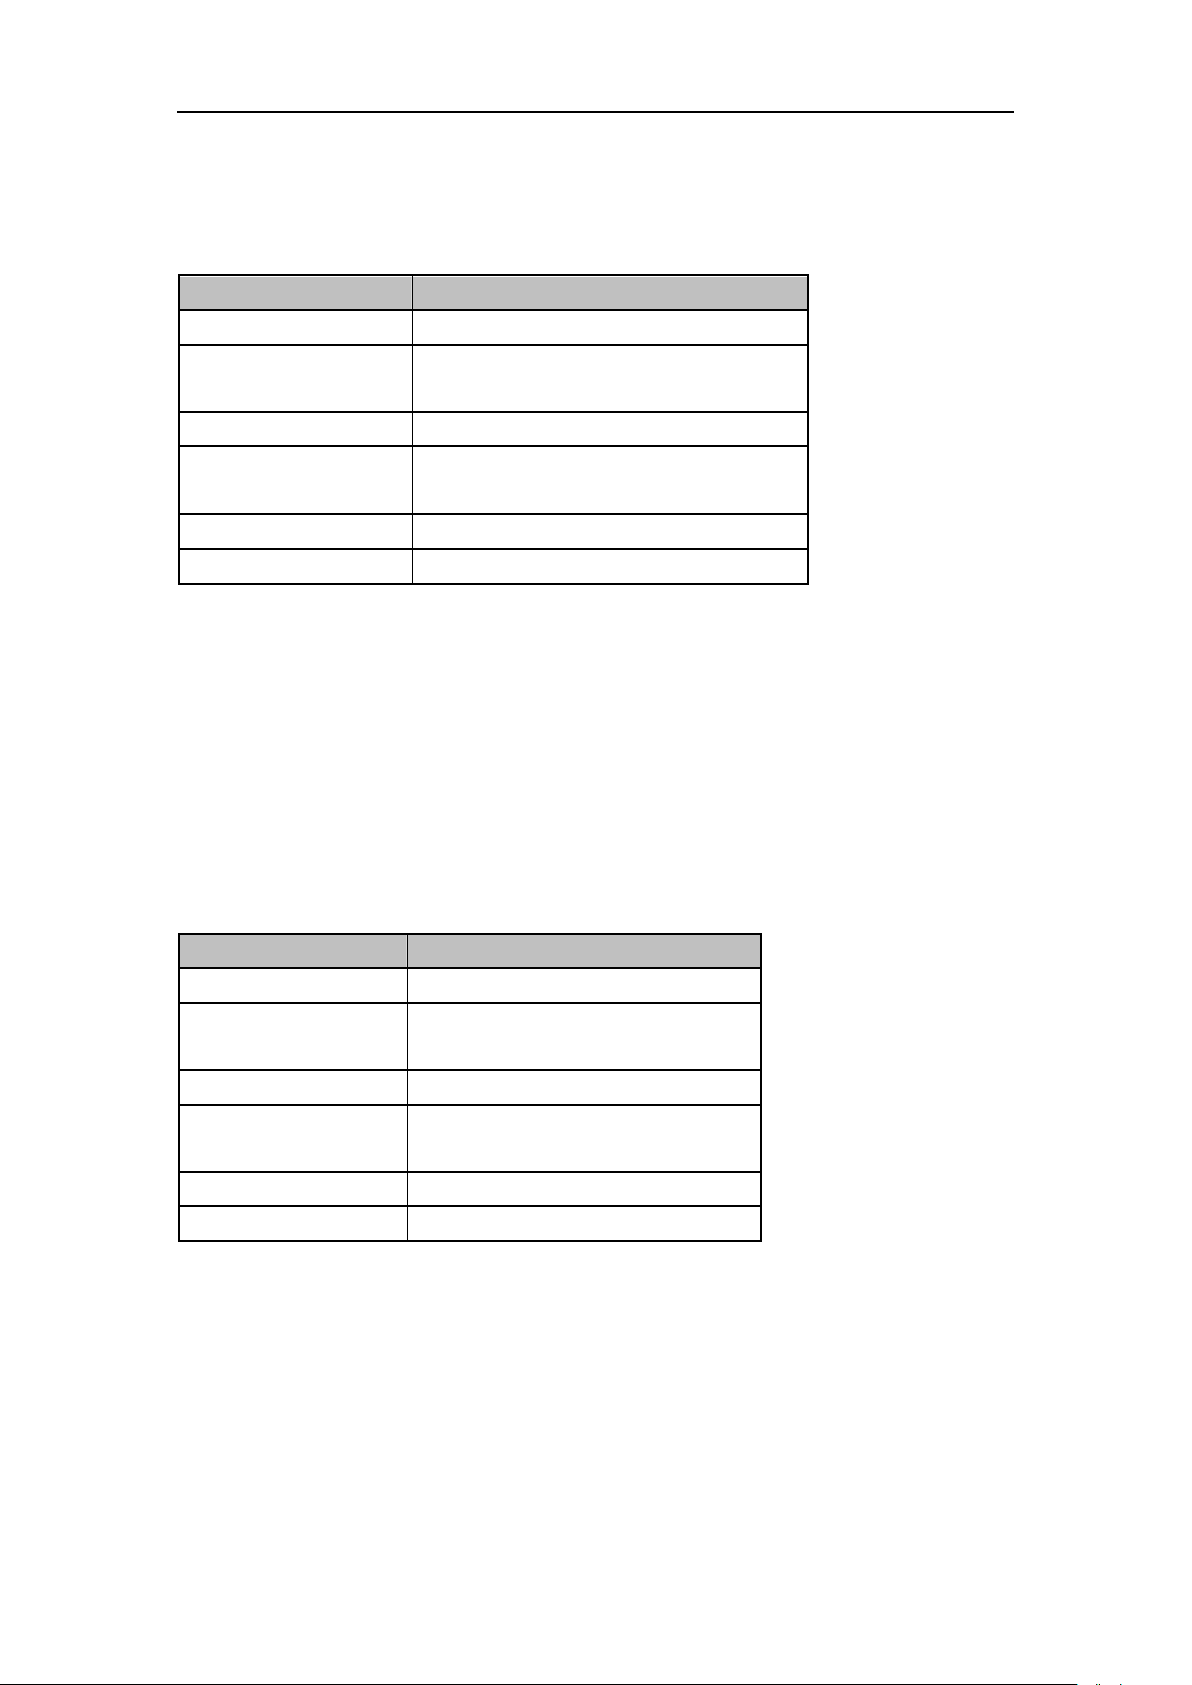
Table 2-2 Start Frequency
2.1.1.3 Stop Frequency
Set the stop frequency of the current sweep. The start and stop frequencies are displayed at
the lower right sides of the grid respectively. Please pay attention to the following points:
The span and center frequency vary with the stop frequency. The change of the span will affect
other system parameters. For more details, please refer to “Span”.
In Zero Span, the start frequency, stop frequency and center frequency are always the same
value.
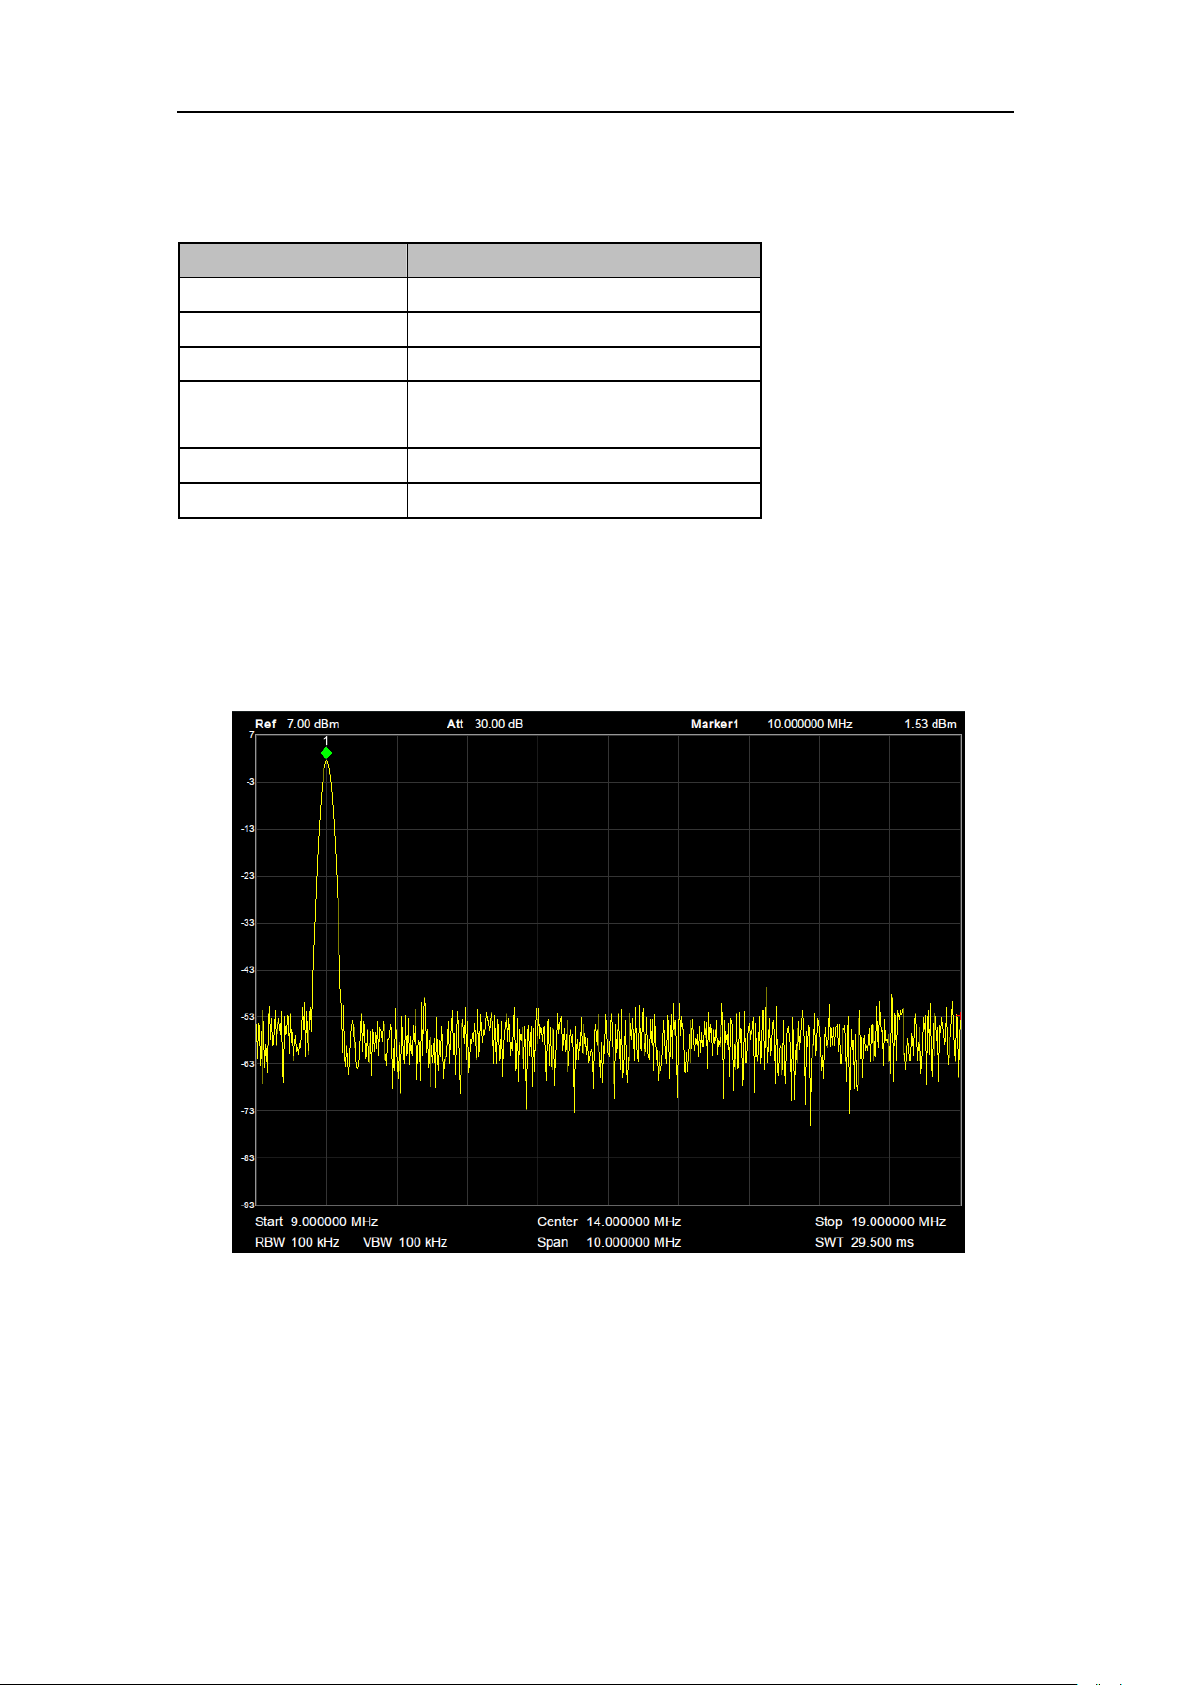
Table 2-3 Stop Frequency
2.1.1.4 Freq Step
Set the step size for incrementing/decrementing the center frequency, start frequency and stop
frequency when sung the arrow keys. Please pay attention to the following points:
At a fixed step change the value of the center frequency can reach the purpose and
continuous measurement channel switch.
There are two kinds of frequency step modes:Auto and Manual. In Auto mode, the Freq step
is 1/10 of the span in Non-zero span or equals the RBW while in Zero Span. In Manual mode,
SVA1000X User Manual 17
Page 24
SIGLENT
Parameter
Explanation
Default
Full Span/10
Range
1Hz ~ Full Span
Unit
GHz, MHz, kHz, Hz
Knob Step
Span > 0, Step = Span/200, min 1 Hz
Span = 0, Step = 100
Direction Key Step
1-2-5 sequence step
Relation
RBW, Span and related parameters
you can set the step using the numeric keys.
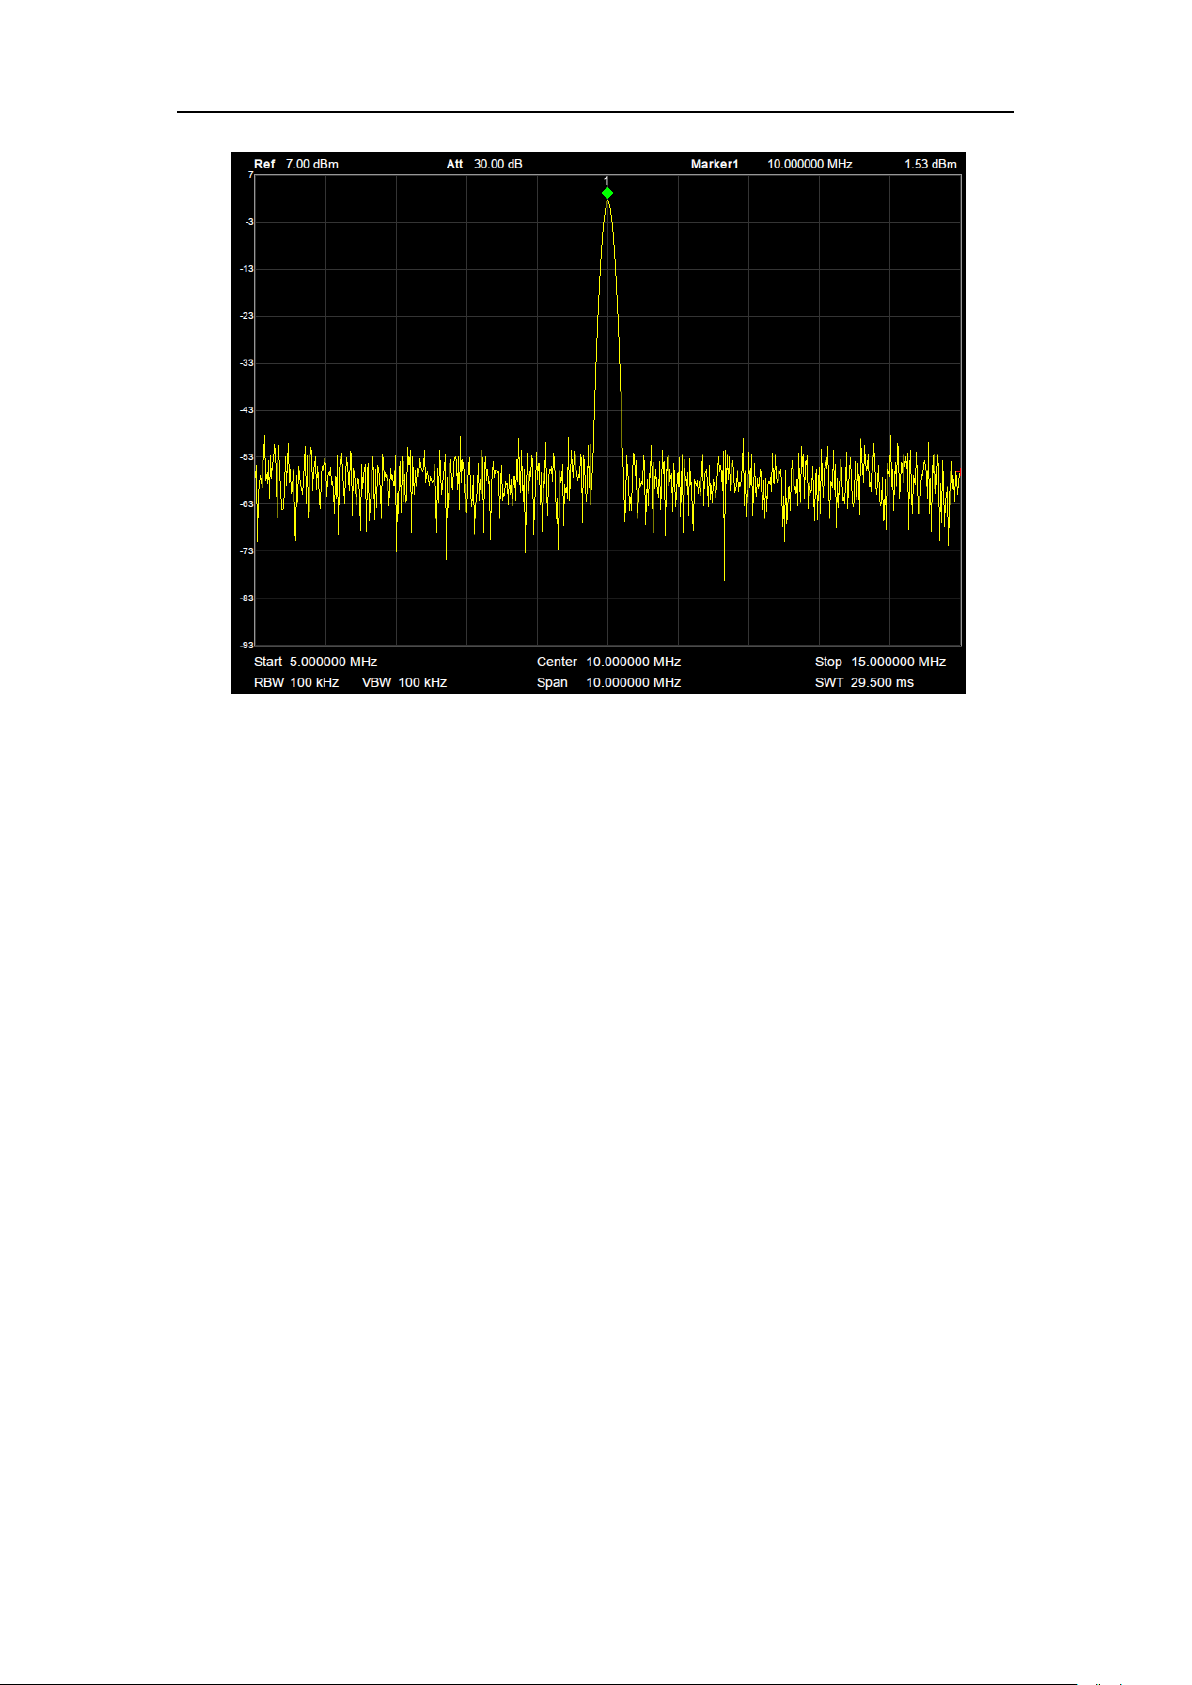
Table 2-4 Frequency step
2.1.1.5 Peak -> CF
Executes a peak search and sets the center frequency (CF) of the display to the frequency of
the current peak. The function is invalid in Zero Span.
SVA1000X User Manual 18
Figure 2-1 before Peak -> CF
Page 25
SIGLENT
Figure 2-2 after Peak -> CF
2.1.1.6 CF -> Step
Set the current center frequency as the CF step. At this point, the CF step will switch to
“Manual” mode automatically. This function is usually used with channel switching. Take a
harmonic waveform measurement for example: locate a signal at the center frequency (CF) of
the display and execute CF->Step. Then press the down direction key continuously to
measure each order of harmonic in sequence
2.1.2 Span
Set the span of the analyzer. Any change to this parameter will affect the frequency
parameters and restart the sweep.
2.1.2.1 Span
Set the frequency range of the current sweep. The center frequency and span are displayed at
the low left and right sides of the grid respectively. Please pay attention to the following points:
The start and stop frequency vary with the span when the center frequency is constant.
In manual span mode, the span can be set down to 100 Hz and up-to the full span described in
Specifications. When the span is set to the maximum, the analyzer enters full span mode.
Modifying the span in non-zero span modes may cause an automatic change in both CF step
and RBW if they are in Auto mode. Besides, the charge of RBW may influence VBW (in Auto
VBW mode).
Variation in the span, RBW or VBW would cause a change in the sweep time.
SVA1000X User Manual 19
Page 26
SIGLENT
Parameter
Explanation
Default
Maximum bandwidth
Range
0 Hz ~ 3.2GHz
Unit
GHz, MHz, kHz, Hz
Knob Step
Span/200, Min = 1 Hz
Direction Key Step
In 1-2-5 sequence
Related to
Start Freq, Stop Freq, Freq Step, RBW,
Sweep time
In non-zero span, neither “Video” trigger nor “1/time” readout function is valid.
Table 2-5 Span
Note: 0 Hz is available only in zero span.
2.1.2.2 Full Span
Set the span of the analyzer to the maximum frequency span available.
2.1.2.3 Zero Span
Set the span of the analyzer to 0Hz. Both the start and stop frequencies will equal the center
frequency and the horizontal axis will denote time. The analyzer measures the time domain
characteristics of the amplitude of the corresponding frequency point on the input signal.
Please pay attention to the following points:
The following functions are invalid in Zero span: Peak ->CF, Signal Track, Zoom In and Zoom
Out.
Frequency: Peak->CF;
SPAN: Zoom In and Zoom Out;
Marker->: M ->CF, M->CF step, M->Start Freq, M->Stop Freq, M->CF and M->Span;
Marker: Frequency, Period and 1/Time(valid in Delta marker type);
2.1.2.4 Zoom In
Set the span to half of its current value. At this point, the signal on the screen is zoomed in to
observe signal details.
2.1.2.5 Zoom Out
Set the span to twice the current value. At this point, the signal on the screen is zoomed out to
gain more information about the nearby spectrum.
2.1.2.6 Last Span
Set the span to the previous span setting.
SVA1000X User Manual 20
Page 27
SIGLENT
Parameter
Explanation
Default
0 dBm
Range
-100 dBm ~ 20 dBm
2.1.2.7 X-Scale
Set the scale type of X-axis to Linear (Lin) or Logarithmic (Log) scale.
In Log scale type, the frequency scale of X-axis is displayed in the logarithmic form.
If the scale type of X-axis is in the logarithmic type form, the scale type will be switched into Lin
when turning on measurements (Meas).
Figure 2-3 Logarithmic X Scale
2.1.3 Amplitude
Set the amplitude parameters of the analyzer. Through modifying these parameters, signals
under measurement can be displayed in a proper mode for easier observation and minimum
error.
2.1.3.1 Ref Level
Set the maximum power or voltage that can be currently displayed in the trace window. The
value is displayed at the upper left corner of the screen grid.
The maximum reference (Ref) level available is affected by the maximum mixing level; input
attenuation is adjusted under a constant maximum mixing level in order to fulfill the following
condition:
Ref <= ATT - PA - 20dBm, where ATT = Attenuation value, PA = Preamplifier value
Table 2-6 Ref Level
SVA1000X User Manual 21
Page 28
SIGLENT
Unit
dBm, dBmV, dBuV, V, W
Knob Step
In Log scale mode, step = Scale/10
In Lin scale mode, step = 0.1 dB
Direction Key Step
In Log scale mode, step = Scale
In Lin scale mode, step = 1 dB
Related to
Attenuator, Preamp, Ref Offset
Parameter
Explanation
Default
20 dB
Range
0 ~ 31 dB
Unit
dB
Knob Step
1 dB
Direction Key Step
5 dB
Related to
Preamp, Ref level
2.1.3.2 Attenuator
Sets the value for the internal attenuator of the RF input.
Input attenuation can be set up for automatic and manual using two kinds of patterns.
Automatic mode: The instrument sets the attenuation value according to the state of
preamplifier and value of the current reference level automatic adjustment.
The maximum input attenuation can be set to 31 dB. When setting parameters do not
meet the above formula, you can adjust the reference level.
Table 2-7 Attenuator
2.1.3.3 RF Preamp
Control the state of the internal preamplifier (PA) located in the RF input signal path. When the
signal-under-measurement is small, turning on the preamplifier can reduce the displayed noise
level and aid in distinguishing small signals from the noise.
The corresponding icon “PA” will appear at the left side of the screen when the preamplifier is
turned on.
2.1.3.4 Units
Set the unit of the Y-axis to dBm, dBmV, dBuV, Volts (RMS) and Watts. The default is dBm.
The conversion relationships between units are as follows.
SVA1000X User Manual 22
Page 29
SIGLENT
Parameter
Explanation
Default
10 dB
Range
1 dB ~ 20 dB
Unit
dB
Knob Step
1 dB
Direction Key Step
1-2-5 sequence
Related to
Scale Type
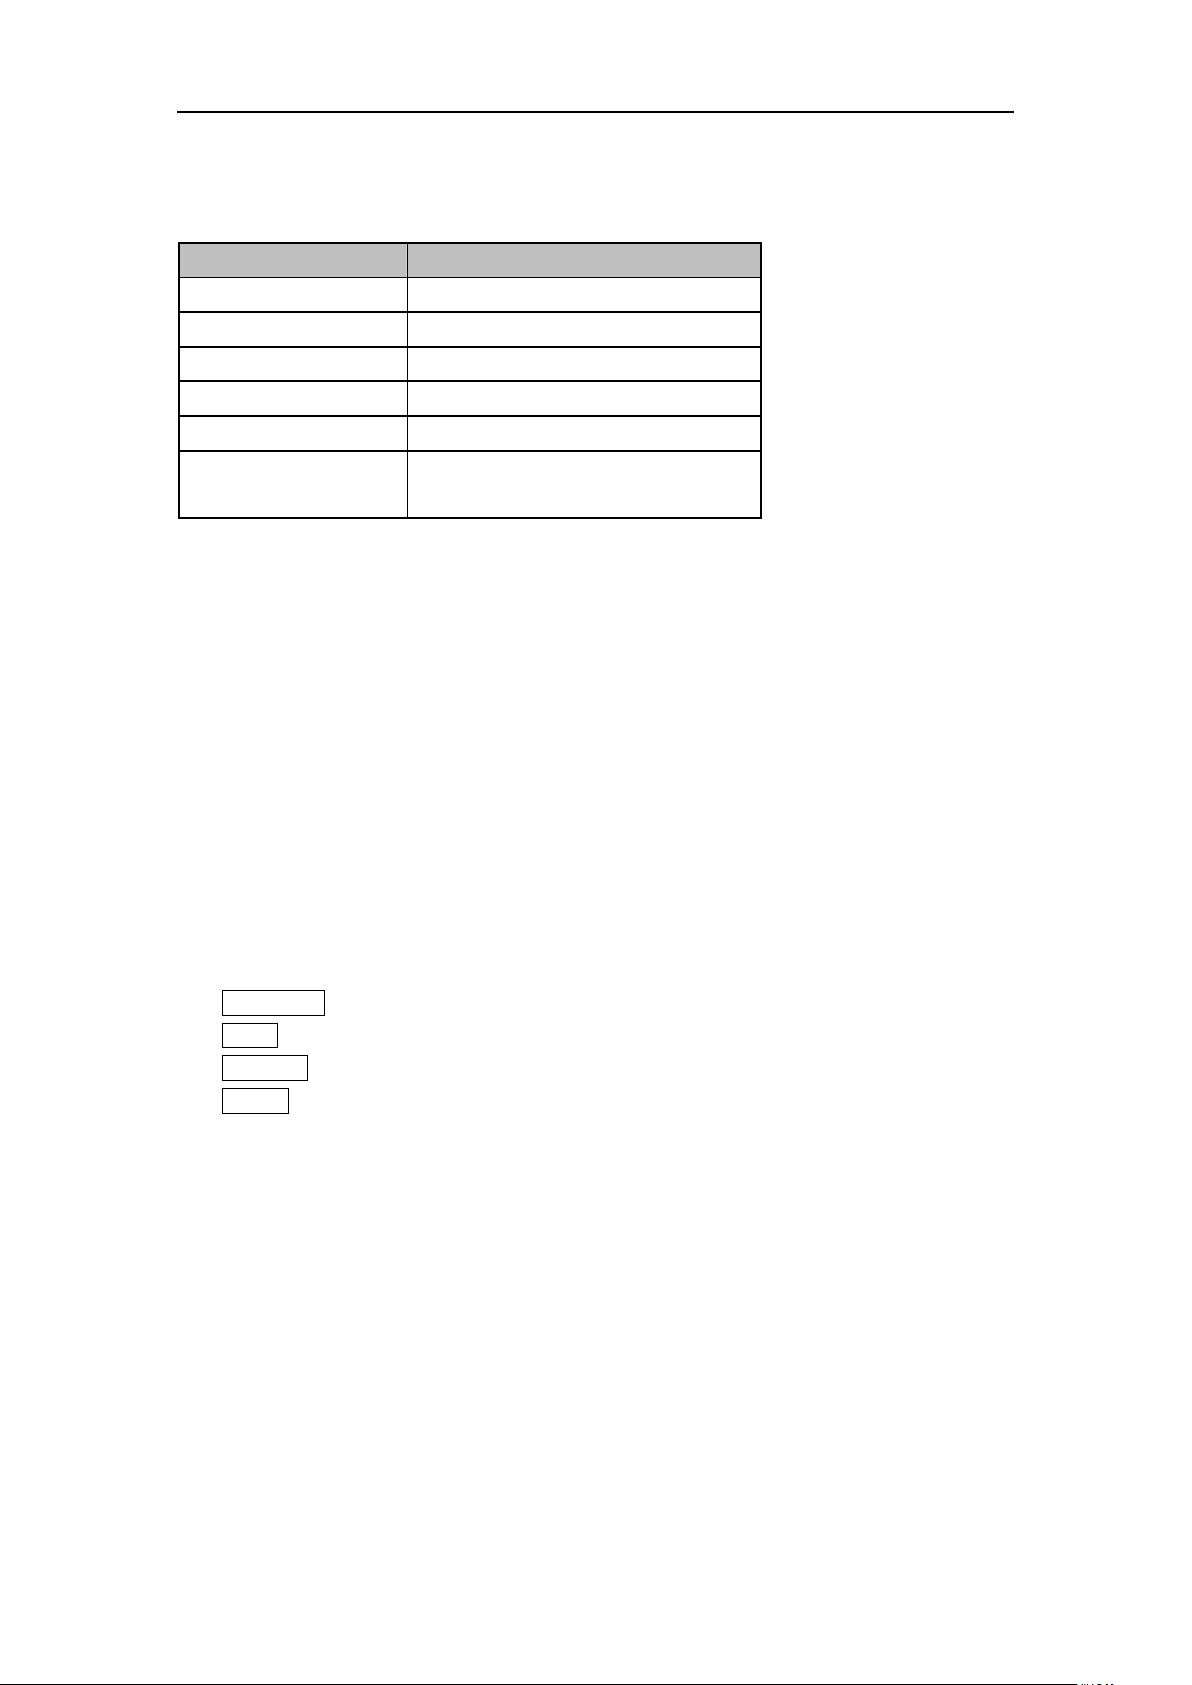
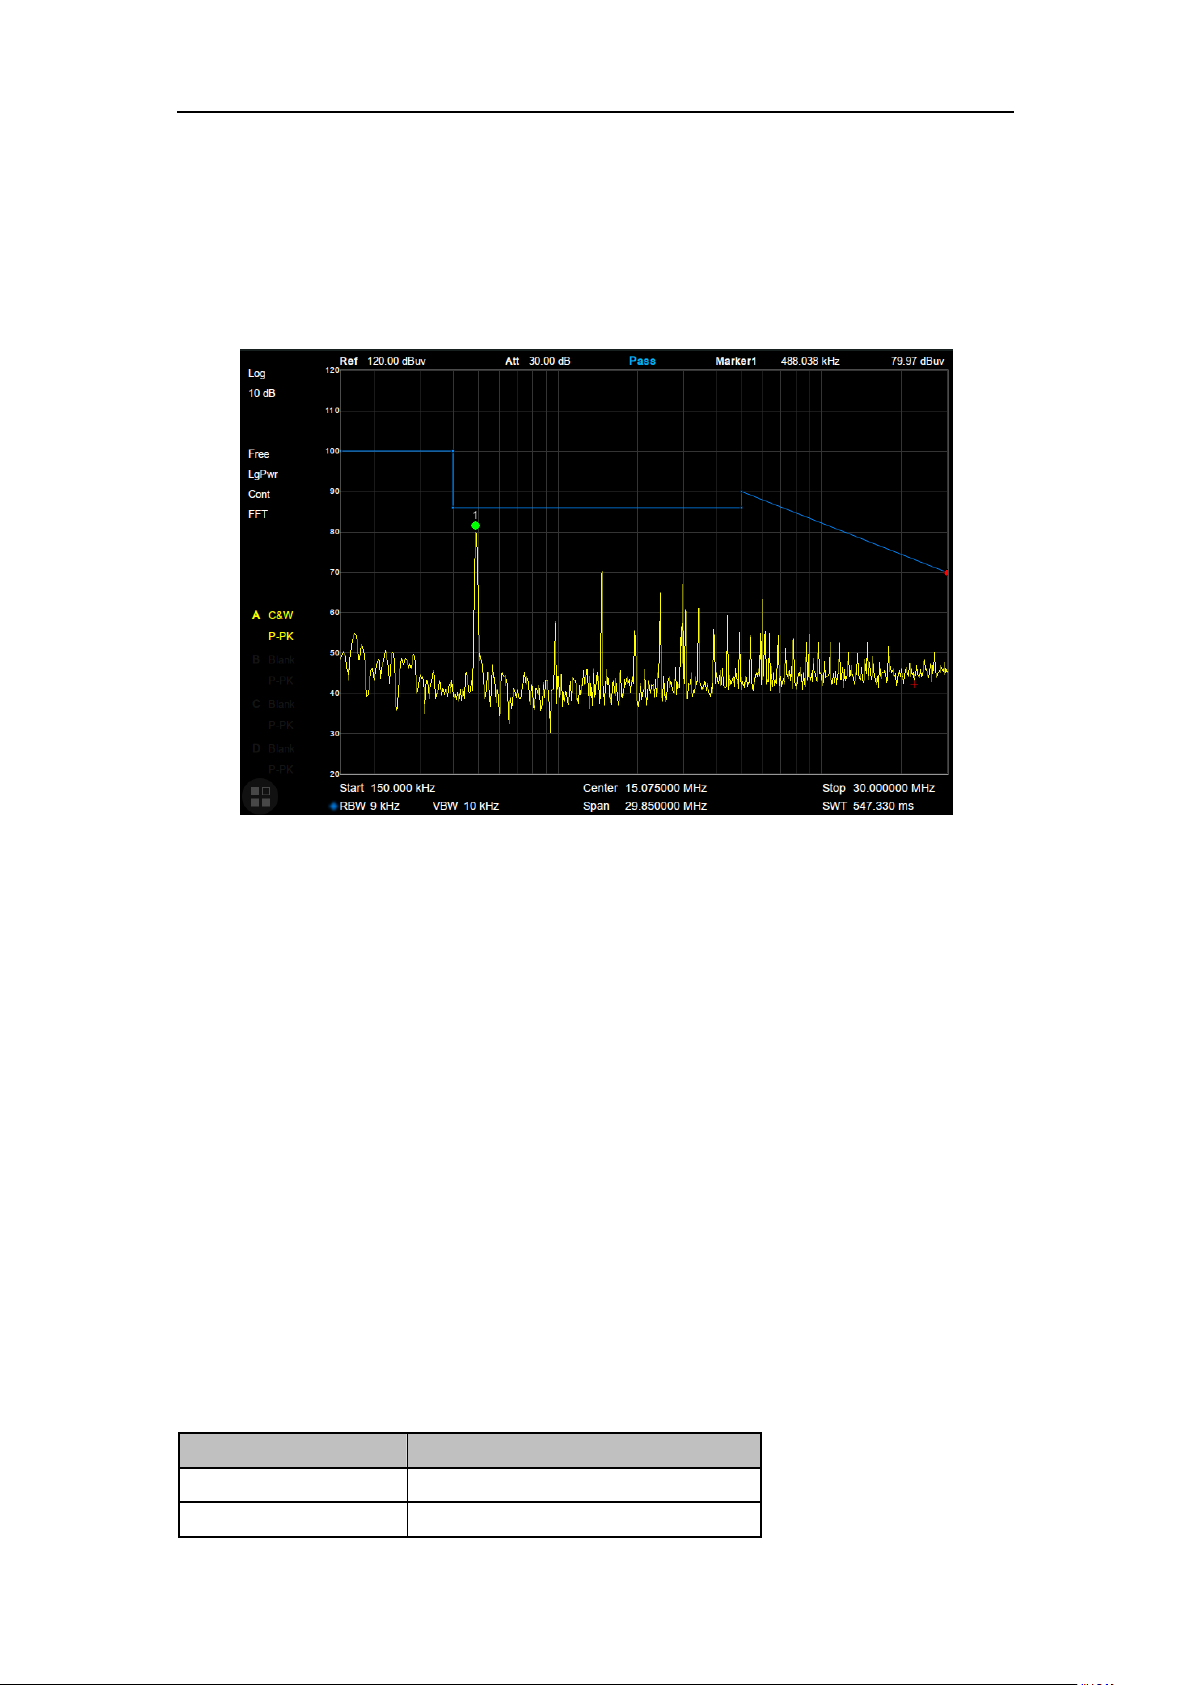
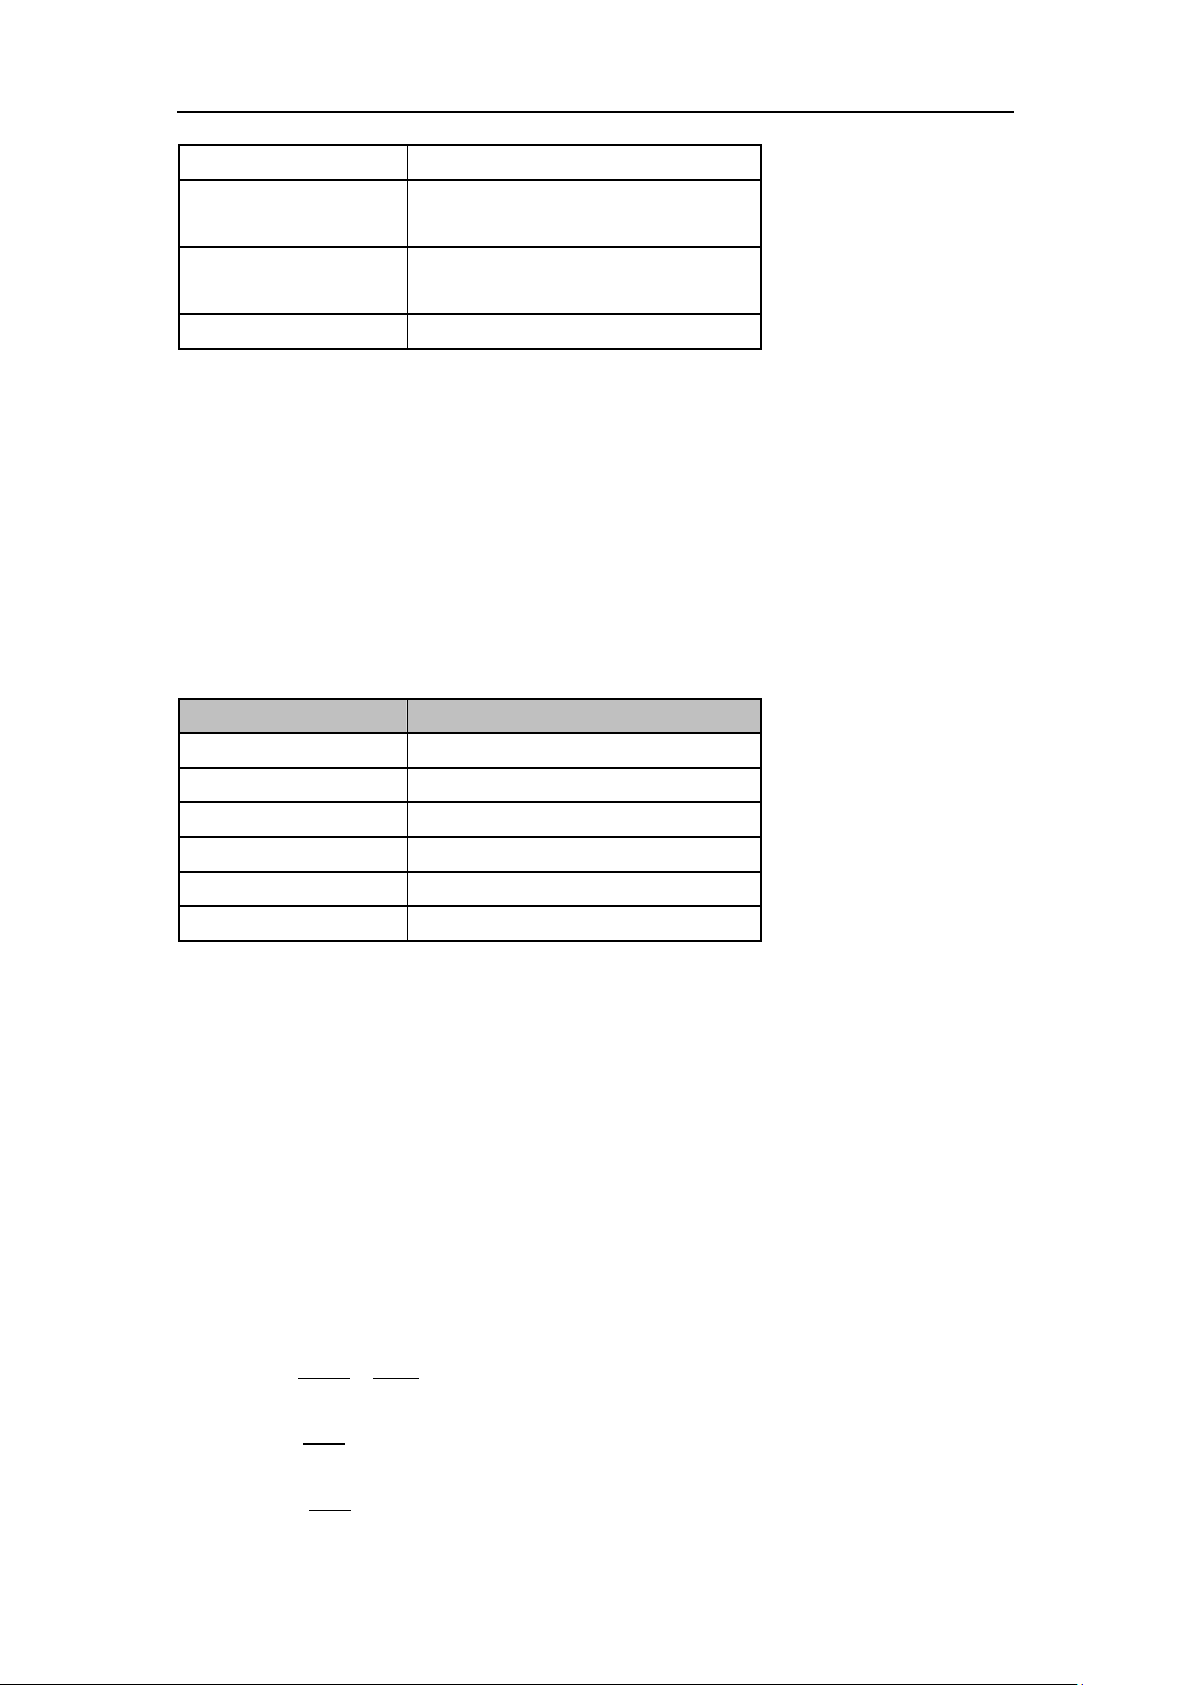
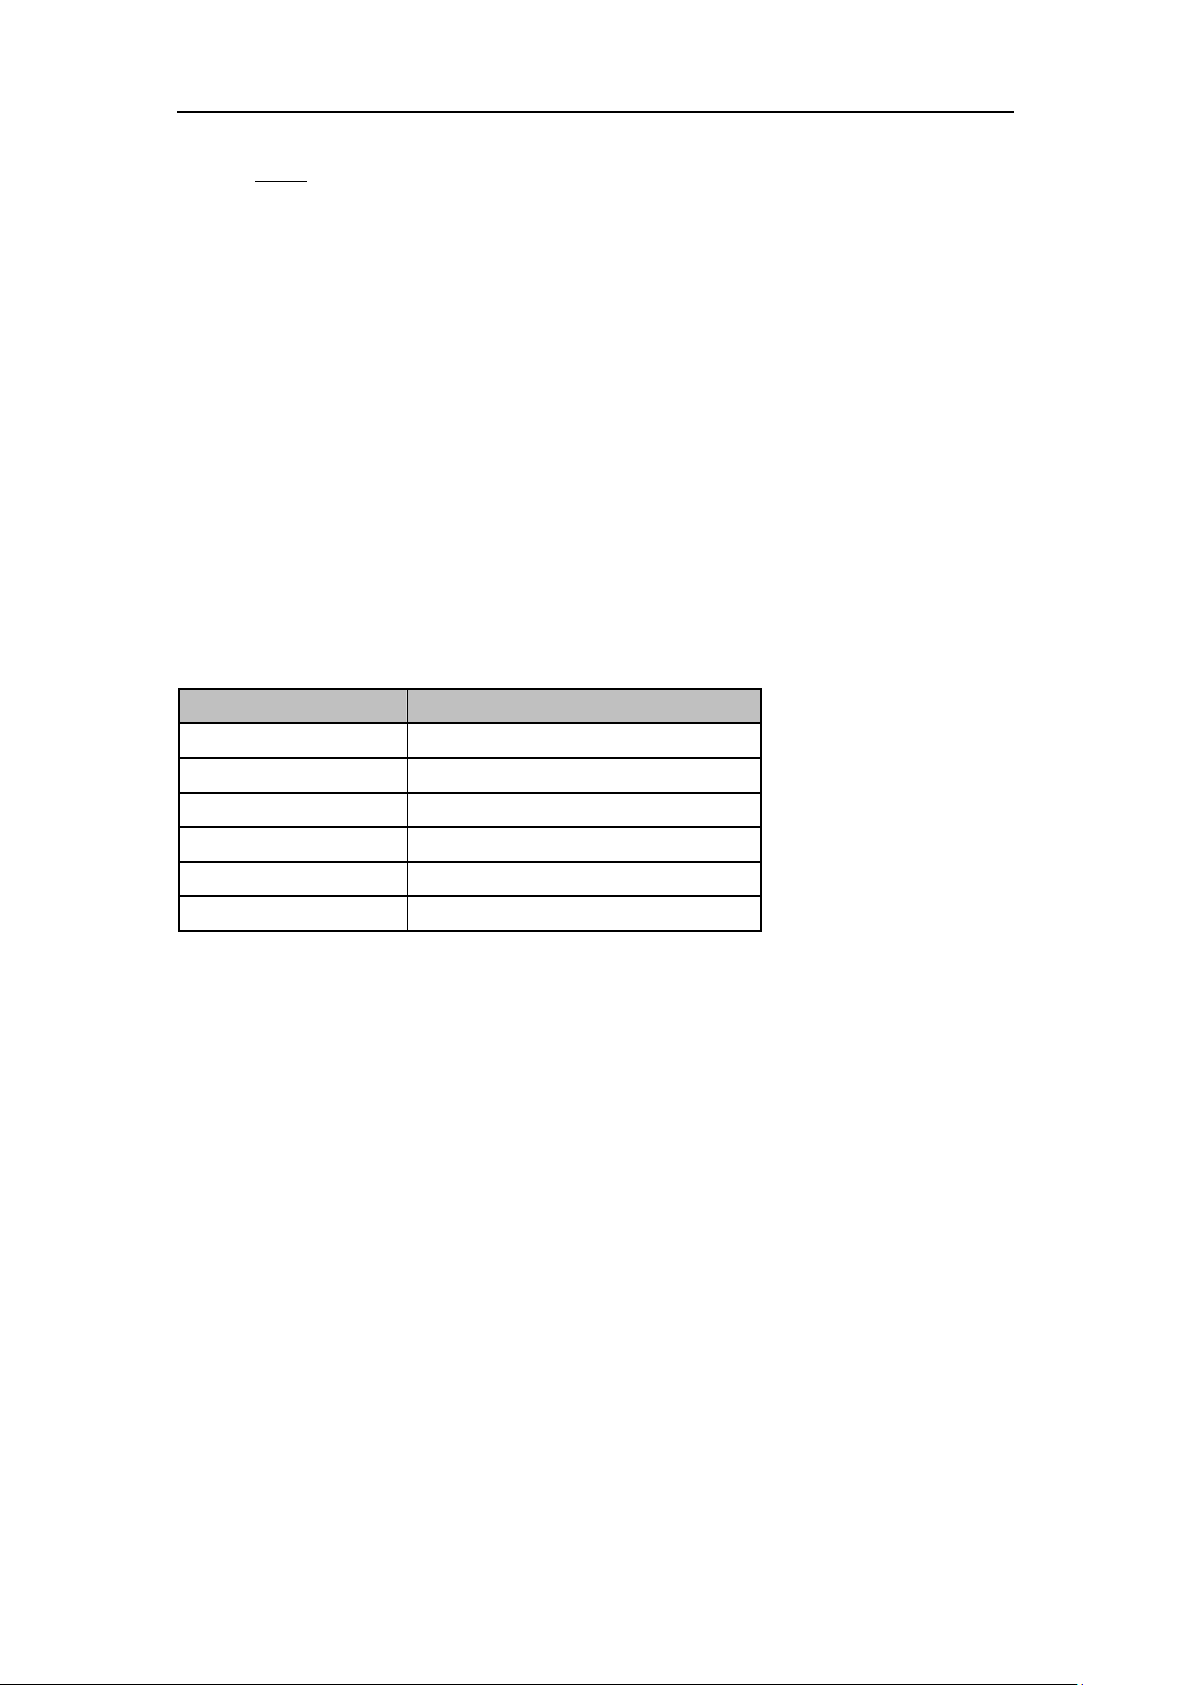
Where, R denotes the reference impedance. The default value is 50Ω and can be adjusted by
pressing “Correction -> RF input”. The “75 Ω” impedance is just a numeric value, not a real
impedance. Setting the RF input to 75 Ω will not change the actual input impedance. A 75 Ω
feed-through adapter is required to match 75 Ω circuits to the 50 Ω input of the SVA.
2.1.3.5 Scale
Set the logarithmic units per vertical grid division on the display. This function is only available
when the scale type is set to “log”. Please pay attention to the following points:
By changing the scale, the displayed amplitude range is adjusted
The Minimum range: Reference level –10 × current scale value
The Maximum range: The reference level.
Table 2-8 Scale
2.1.3.6 Scale Type
Set the scale type of the Y-axis to Lin or Log. The default is Log.
In Lin mode, the vertical Scale value cannot be changed. The Display area is set for
reference level of 0%. Please pay attention to the following points;
In Log scale type, the Y-axis denotes the logarithmic coordinate; the value shown at the
top of the grid is the reference level and each grid represents the scale value. The unit of
Y-axis will automatically switch to the default unit (dBm) in Log scale type is changed from
Lin to Log;
In Lin scale type, the Y-axis denotes the liner coordinate; the values shown at the top of
the grid and the bottom of the grid are the reference level and the scale setting function is
invalid. The unit of Y-axis will automatically switch to the default unit (Volts) in Lin scale
type when the scale type is charged from Log to Lin.
2.1.3.7 Ref Offset
Assign an offset to the reference level to compensate for gains or losses generated between
the device under measurement and the analyzer.
SVA1000X User Manual 23
Page 30
SIGLENT
Parameter
Explanation
Default
0 dB
Range
-100 dB ~ 100 dB
Unit
dB
Knob Step
Not support
Direction Key Step
Not support
Function
Explanation
Correction
Select the correction factor on or off.
Add Point
Add a point into correction table.
Point Num
Select a point to edit by point num.
Frequency
Edit the frequency value for the current selected point.
Amplitude
Edit the amplitude value for the current selected point.
Del Point
Delete the selected correction point.
Del All
Clear all data of the correction table.
Save/Load
Save or load correction data. You can save the current correction
data into or load correction data from a specified file.
The change of this value changes both the reference level readout and the amplitude readout
of the marker; but does not impact the position of traces on the screen.
Table 2-9 Ref Offset
2.1.3.8 Correction
Correct the displayed amplitude to compensate for gains or losses from external devices such
as antennas and cables. When using this function, you can view the correction data table and
save or load the current correction data. When amplitude correction is enabled, both the trace
and related measurement results will be mathematically corrected. Positive correction values
are added to the measured values. Negative (-) correction values are subtracted from the
measured values.
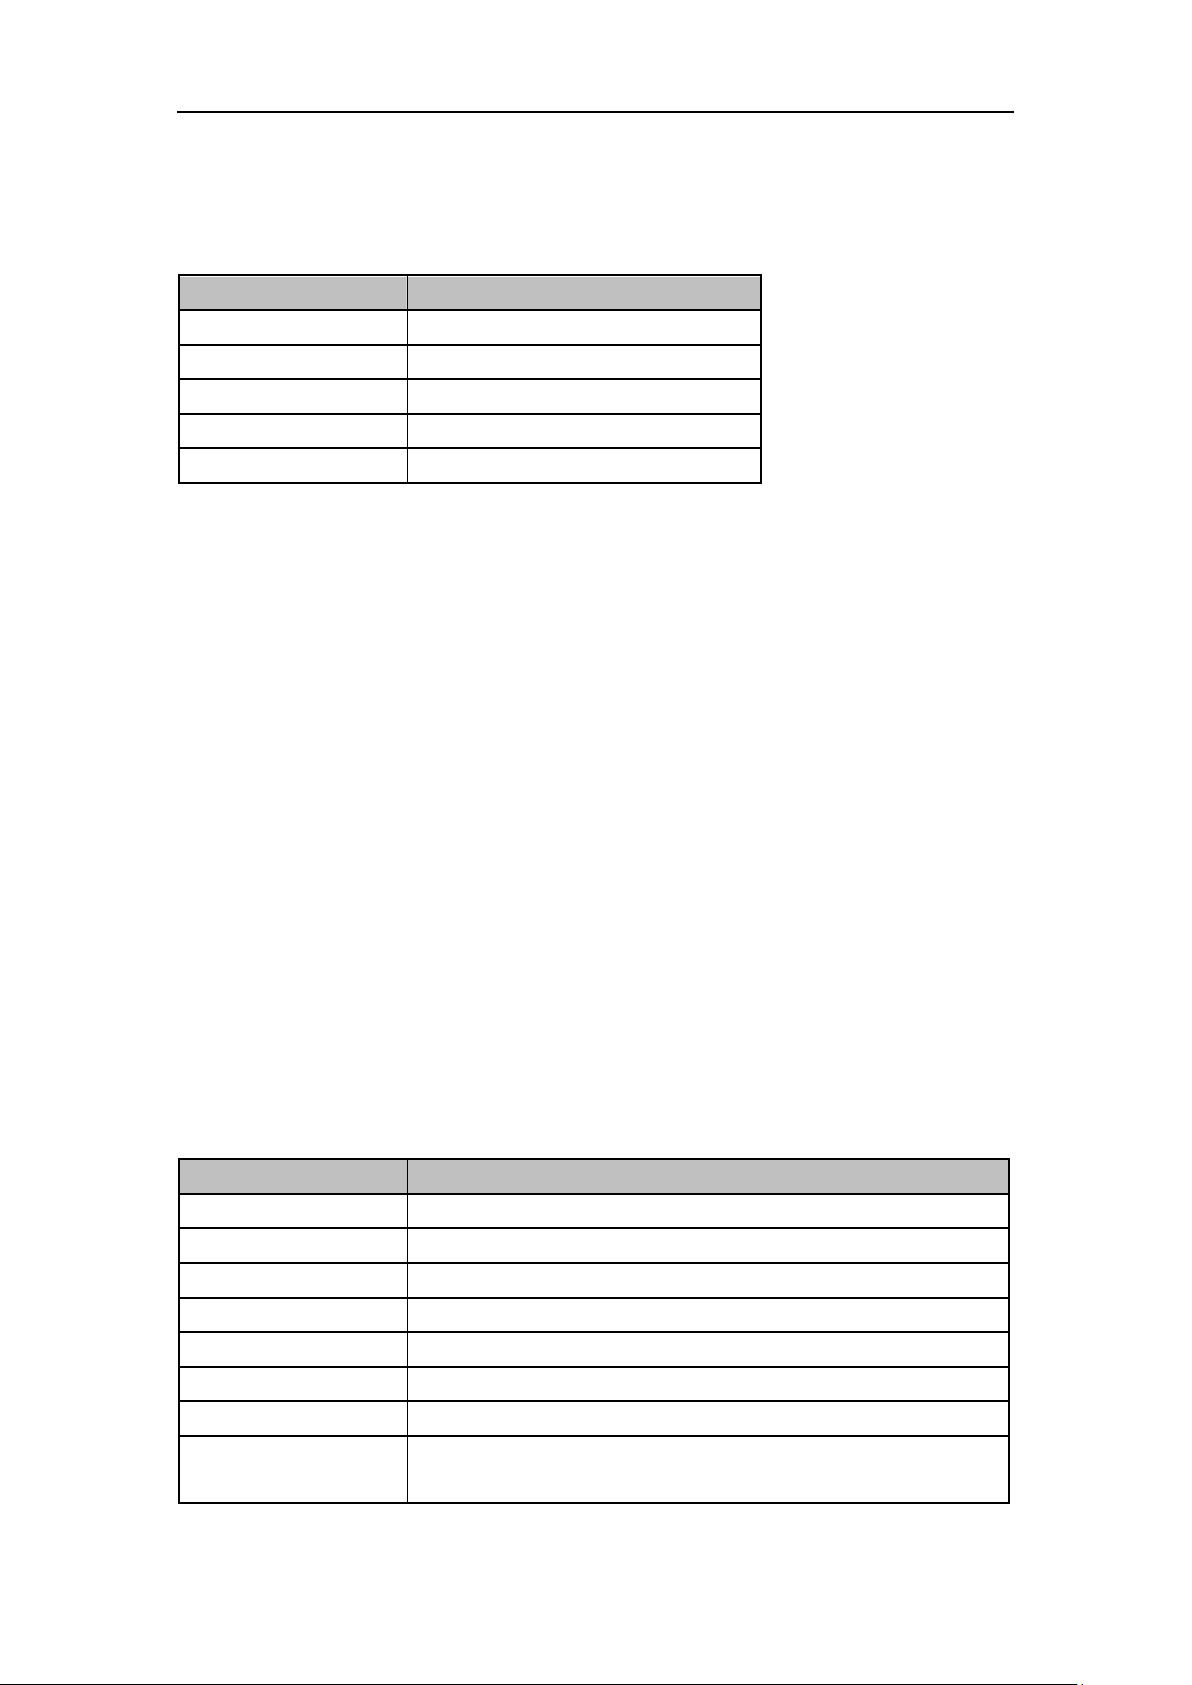
1. RF Input
Set the input impedance for numeric voltage-to-power conversions. To measure a 75 Ω device,
you should use a 75 Ω to 50 Ω adapters to connect the analyzer with the system-under-test
and then set the input impedance to 75 Ω.
2. Apply Correction
Enable or disable amplitude corrections. Default is Off. The analyzer provides four correction
factors that can be created and edited separately, but they can be applied independently in any
combination.
Table 2-10 Edit Correction table
SVA1000X User Manual 24
Page 31
SIGLENT
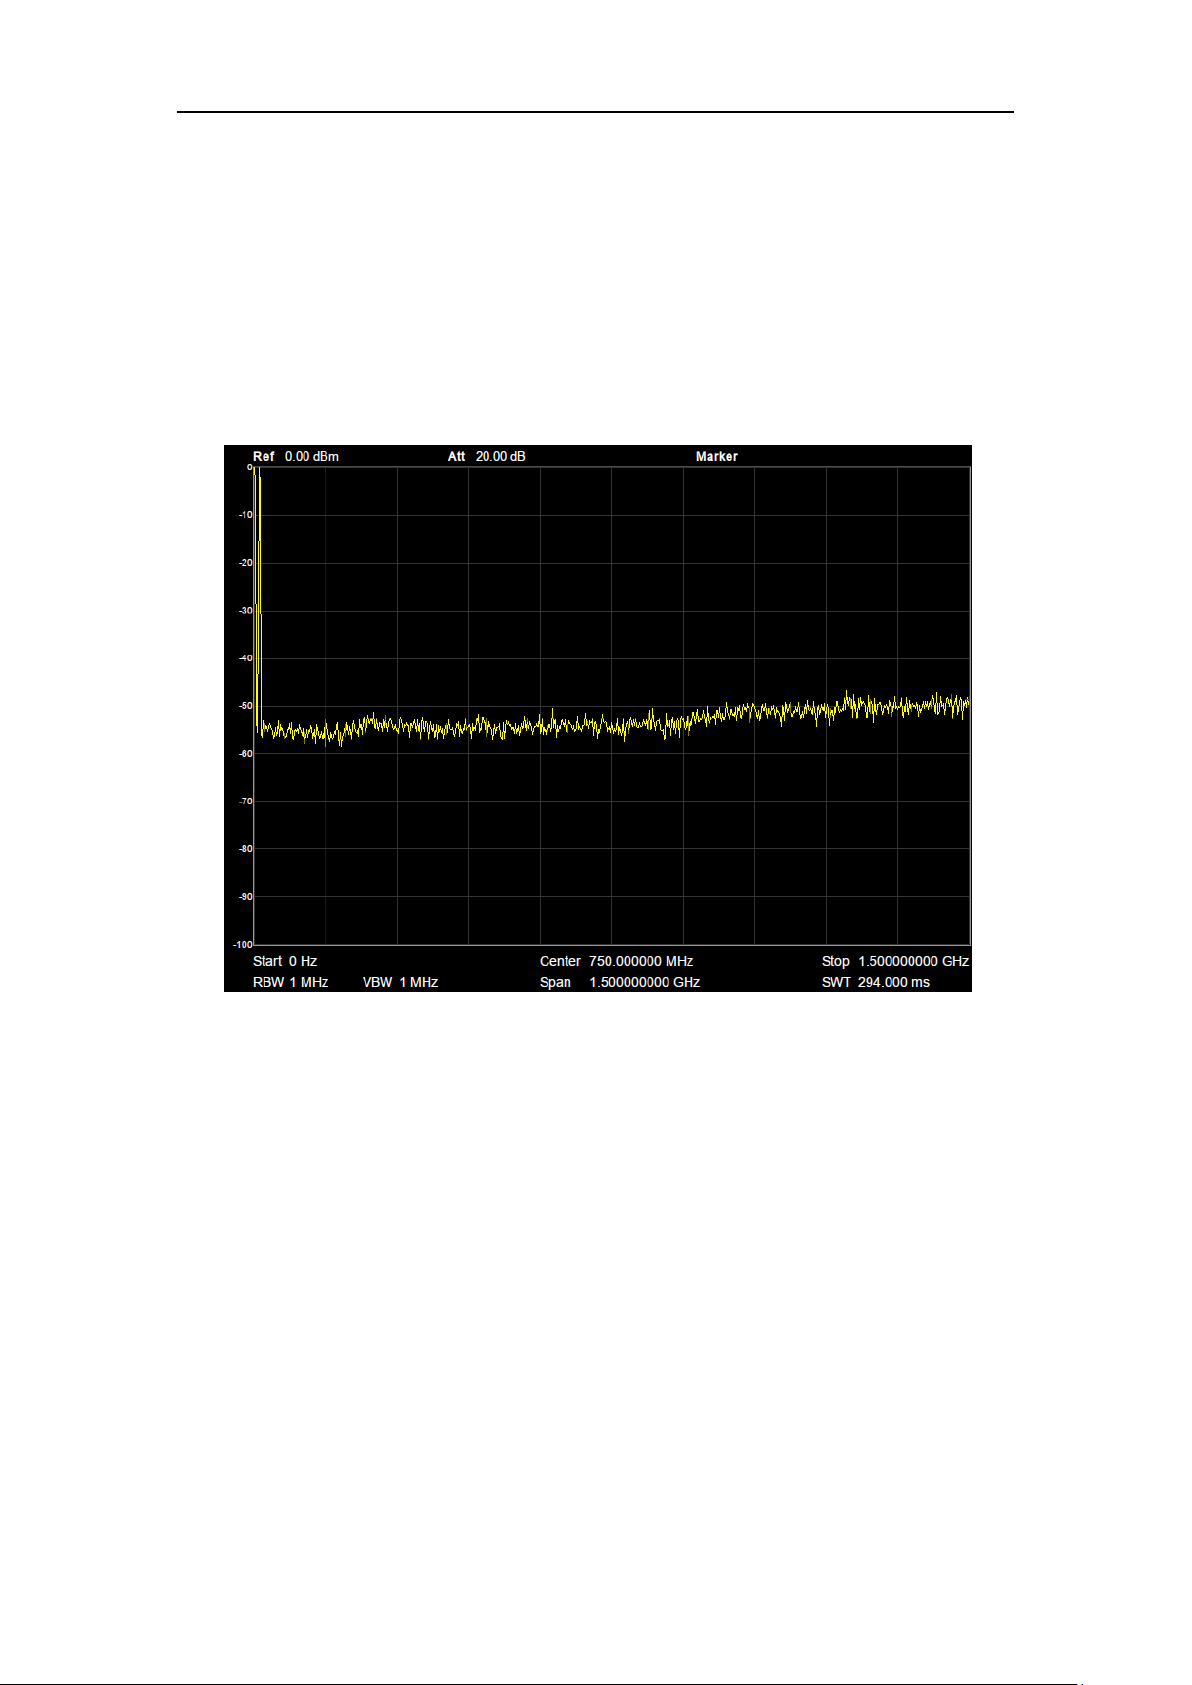
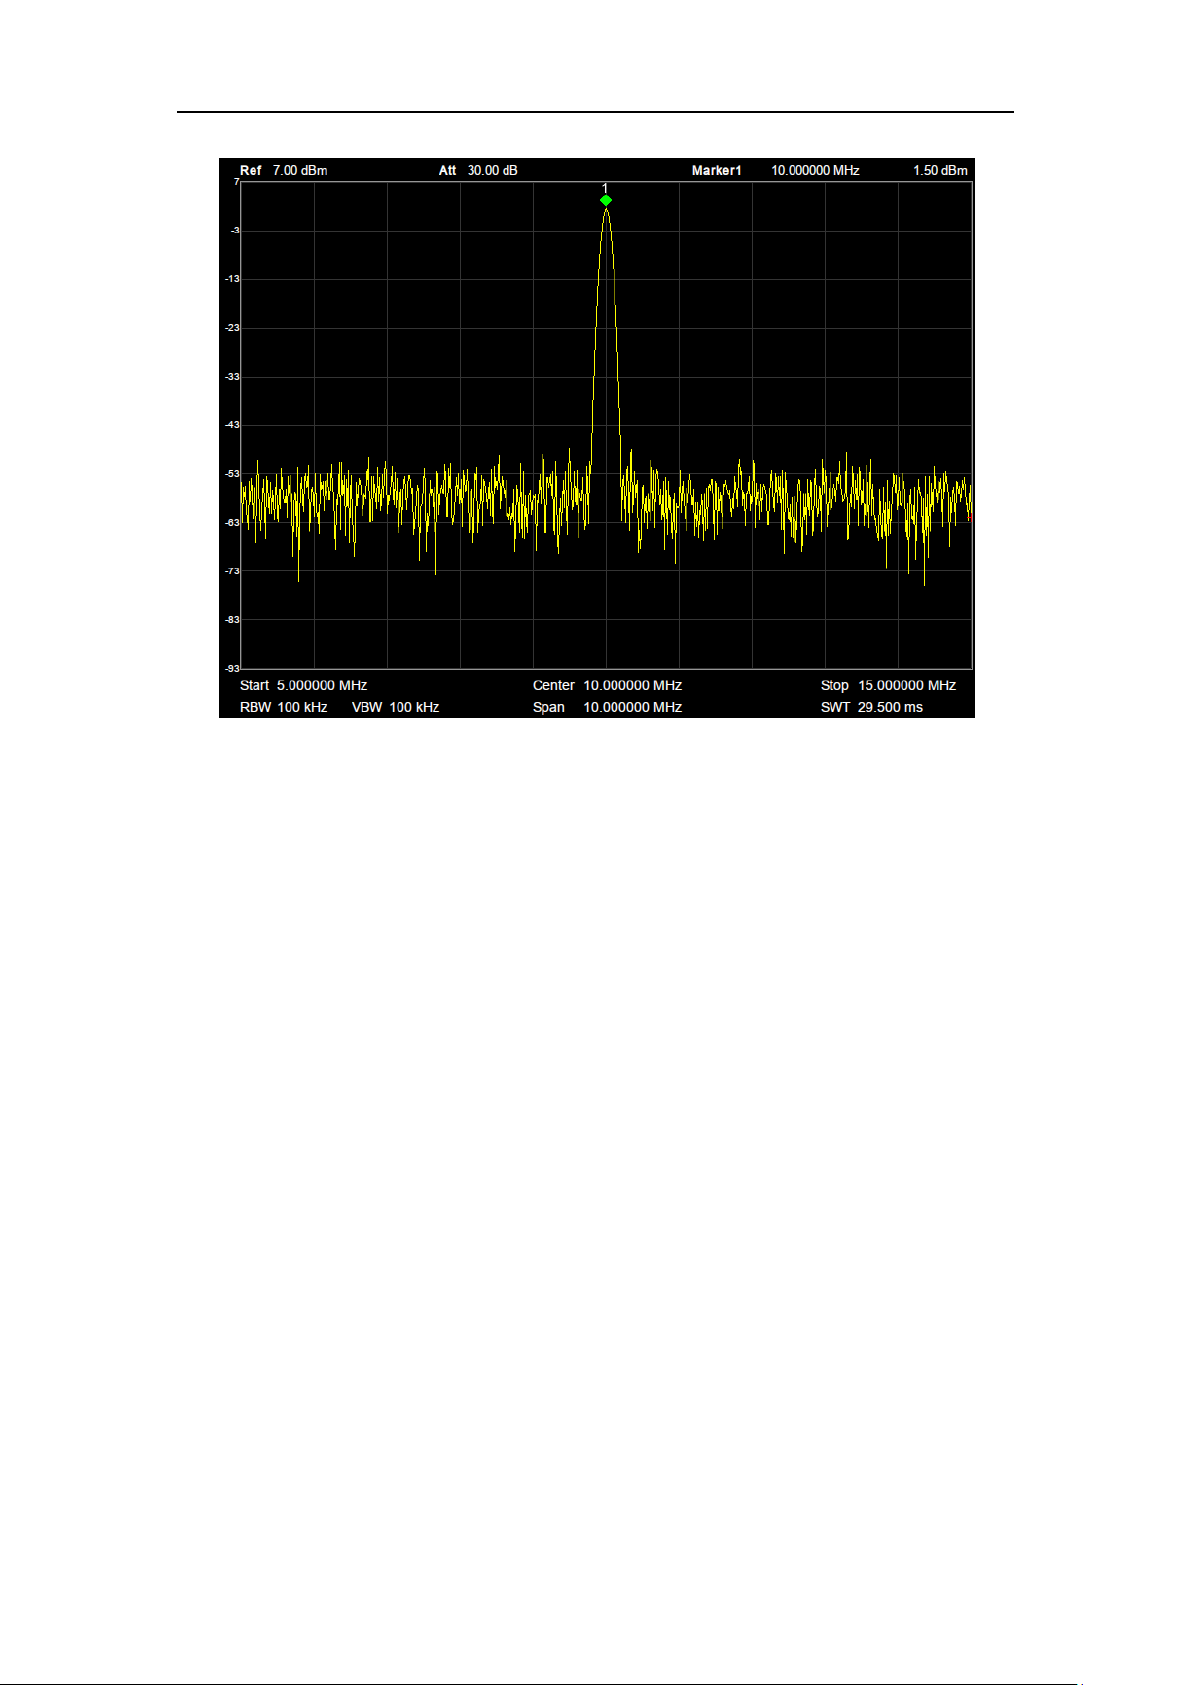
2.1.4 Auto Tune
The analyzer will search for signals automatically throughout the full frequency range and
adjust the frequency and amplitude settings for optimum display of the strongest signal.
In the process of auto search, The “Auto Tune” is shown in the status bar on the screen
until the search is finished.
Some parameters such as the reference level, scale, input attenuation and maximum
mixing level may be changed during the auto search.
Figure 2-4 before Auto Tune
SVA1000X User Manual 25
Page 32
SIGLENT
Figure 2-5 after Auto Tune
SVA1000X User Manual 26
Page 33
SIGLENT
Parameter
Explanation
Default
1 MHz
Range
1 Hz ~ 1 MHz
Unit
MHz, kHz, Hz
Knob Step
in 1, 3, 10 sequence
Direction Key Step
in 1, 3, 10 sequence
Relation
Span, RBW, VBW, Sweep Time
Parameter
Explanation
Default
1 MHz
Range
1 Hz ~ 3 MHz
Unit
MHz, kHz, Hz
Knob Step
in 1, 3, 10 sequence
2.2 Sweep and Function
2.2.1 BW
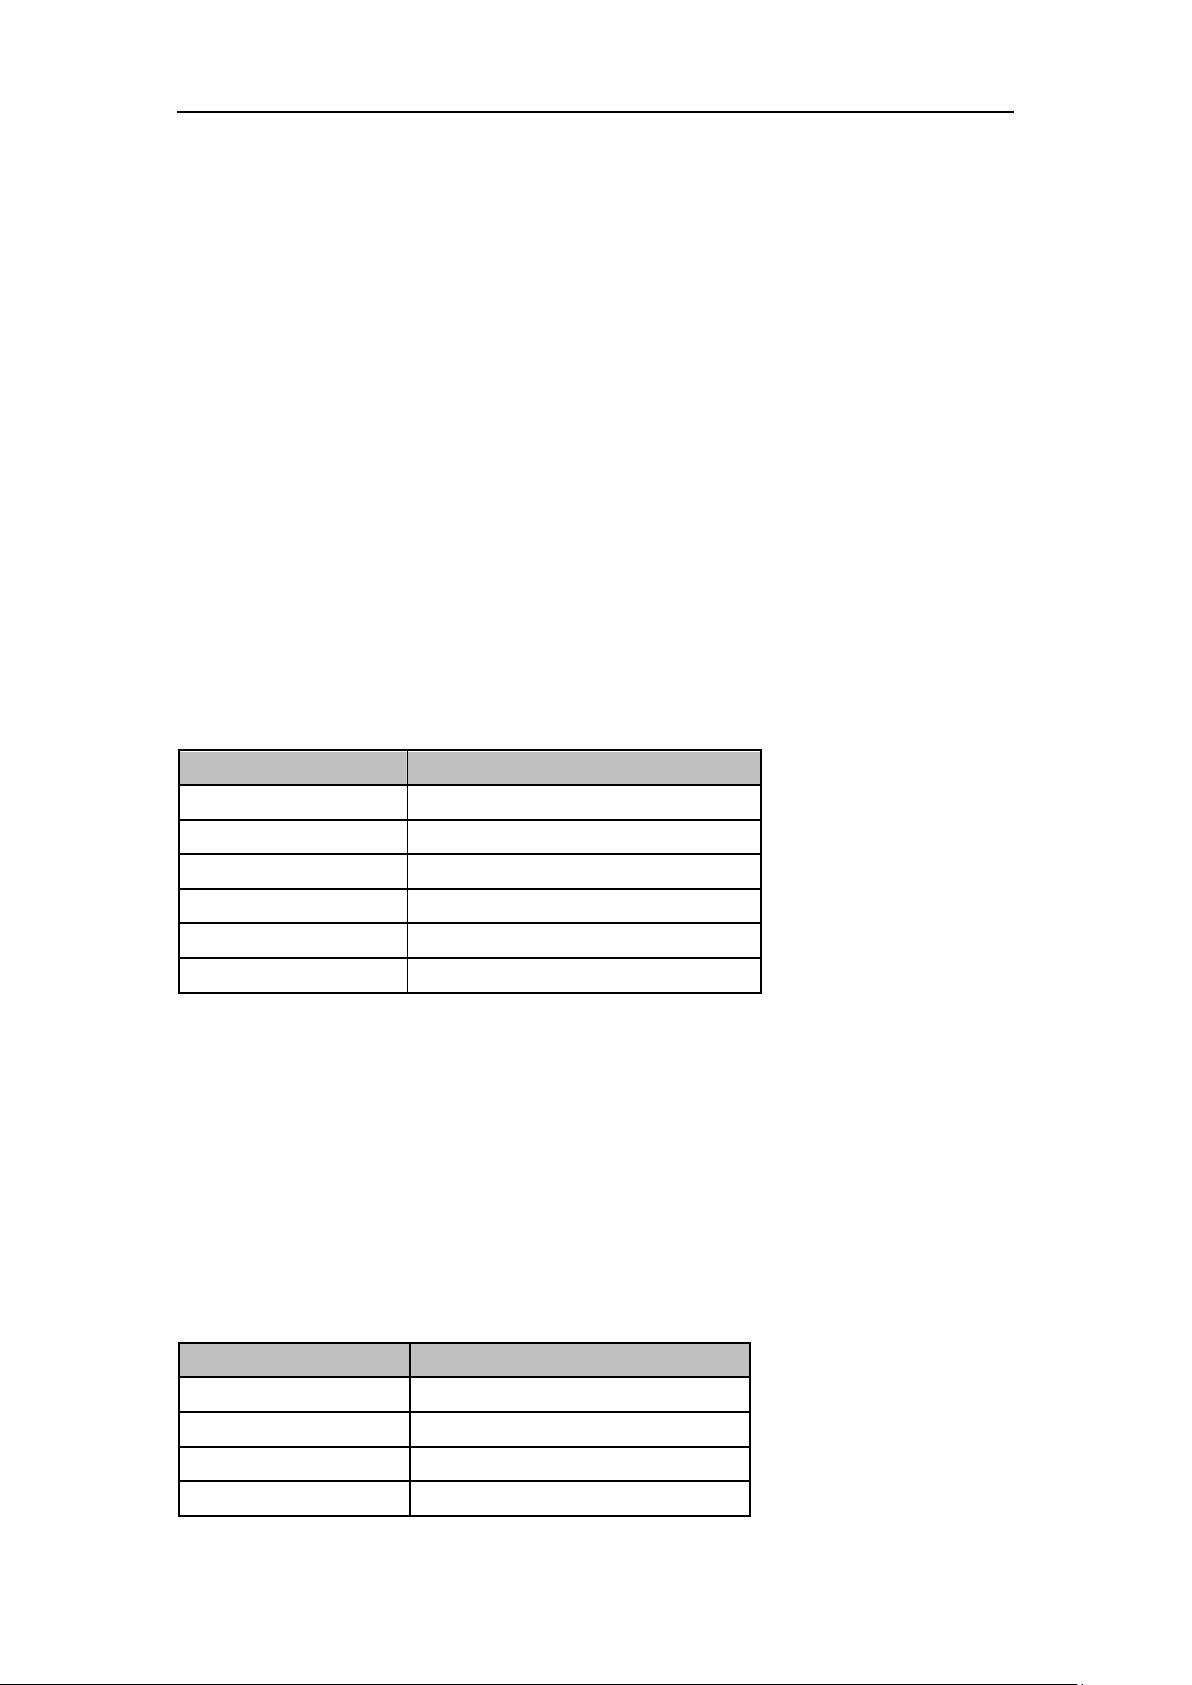
The bandwidth menu contains the RBW (Resolution Bandwidth), VBW (Video Bandwidth), and
controls for averaging and filter shape, including the EMI filter that enables EMI measurement
controls.
2.2.1.1 Resolution Bandwidth
Set the resolution bandwidth in order to distinguish between signals which have frequency
components that are near one another.
Reducing the RBW will increase the frequency resolution, but will also increase the sweep
time (Sweep Time is affected by a combination of RBW and VBW when the analyzer is in
Auto mode).
RBW varies with the span (non-zero span) in Auto RBW mode.
Table 2-11 RBW
2.2.1.2 Video Bandwidth
Set the desired video bandwidth in order to filter out the noise outside the video band.
Reducing the VBW will smooth the trace and helps to highlight small signals from noise,
but it will also increase the sweep time (Sweep Time is affected by a combination of RBW
and VBW when it is in Auto mode).
VBW varies with RBW when it is set to Auto. While in Manual mode, VBW is not affected
by RBW.
Table 2-12 VBW
SVA1000X User Manual 27
Page 34
SIGLENT
Direction Key Step
in 1, 3, 10 sequence
Relation
RBW, V/R Ratio, Sweep Time
Parameter
Explanation
Default
1
Range
0.001 ~ 1000
Unit
N/A
Knob Step
in 1, 3, 10 sequence
Direction Key Step
in 1, 3, 10 sequence
Relation
RBW,VBW
2.2.1.3 V/R Ratio
Set the ratio of VBW to RBW. This value is different while measuring different kinds of signals:
Sine/Continuous Wave (CW) signals: Use 1 to 3 (for faster sweeps)
Pulsed/transient signals: Use 10 (to reduce the influence on the amplitude of transient
signals)
Noise signals: Generally use 0.1 (to obtain the average of noises)
Table 2-13 V/R Ratio
2.2.1.4 Average Type
Choose one of the following averaging types: log power (video), power (RMS), or voltage
averaging. When trace average is on, the average type is shown on the left side of the display.
1. Log Power
Select the logarithmic (decibel) scale for all filtering and averaging processes. This scale is
"Video" because it is the most common display and analysis scale for the video signal within a
analyzer. This scale is excellent for finding Sine/CW signals near noise.
2. Power Average
In this average type, all filtering and averaging processes work on the power (the square of the
magnitude) of the signal, instead of its log or envelope voltage. This scale is best for
measuring the true time power of complex signals.
3. Voltage Average
In this Average type, all filtering and averaging processes work on the voltage of the envelope
of the signal. This scale is good for observing rise and fall behavior of AM or pulse-modulated
signals such as radar and TDMA transmitters.
2.2.1.5 Filter
Set the RBW filter type. The analyzer supports two kinds of RBW filters: “Gauss” (-3 dB
SVA1000X User Manual 28
Page 35
SIGLENT
bandwidth) and “EMI” (-6 dB bandwidth).
When “EMI” is selected, resolution bandwidth can be 200 Hz, 9 kHz or 120 kHz only.
“Quasi-Peak” detector is available only in “EMI” filter.
2.2.2 Trace
The sweep signal is displayed as a trace on the screen.
2.2.2.1 Select Trace
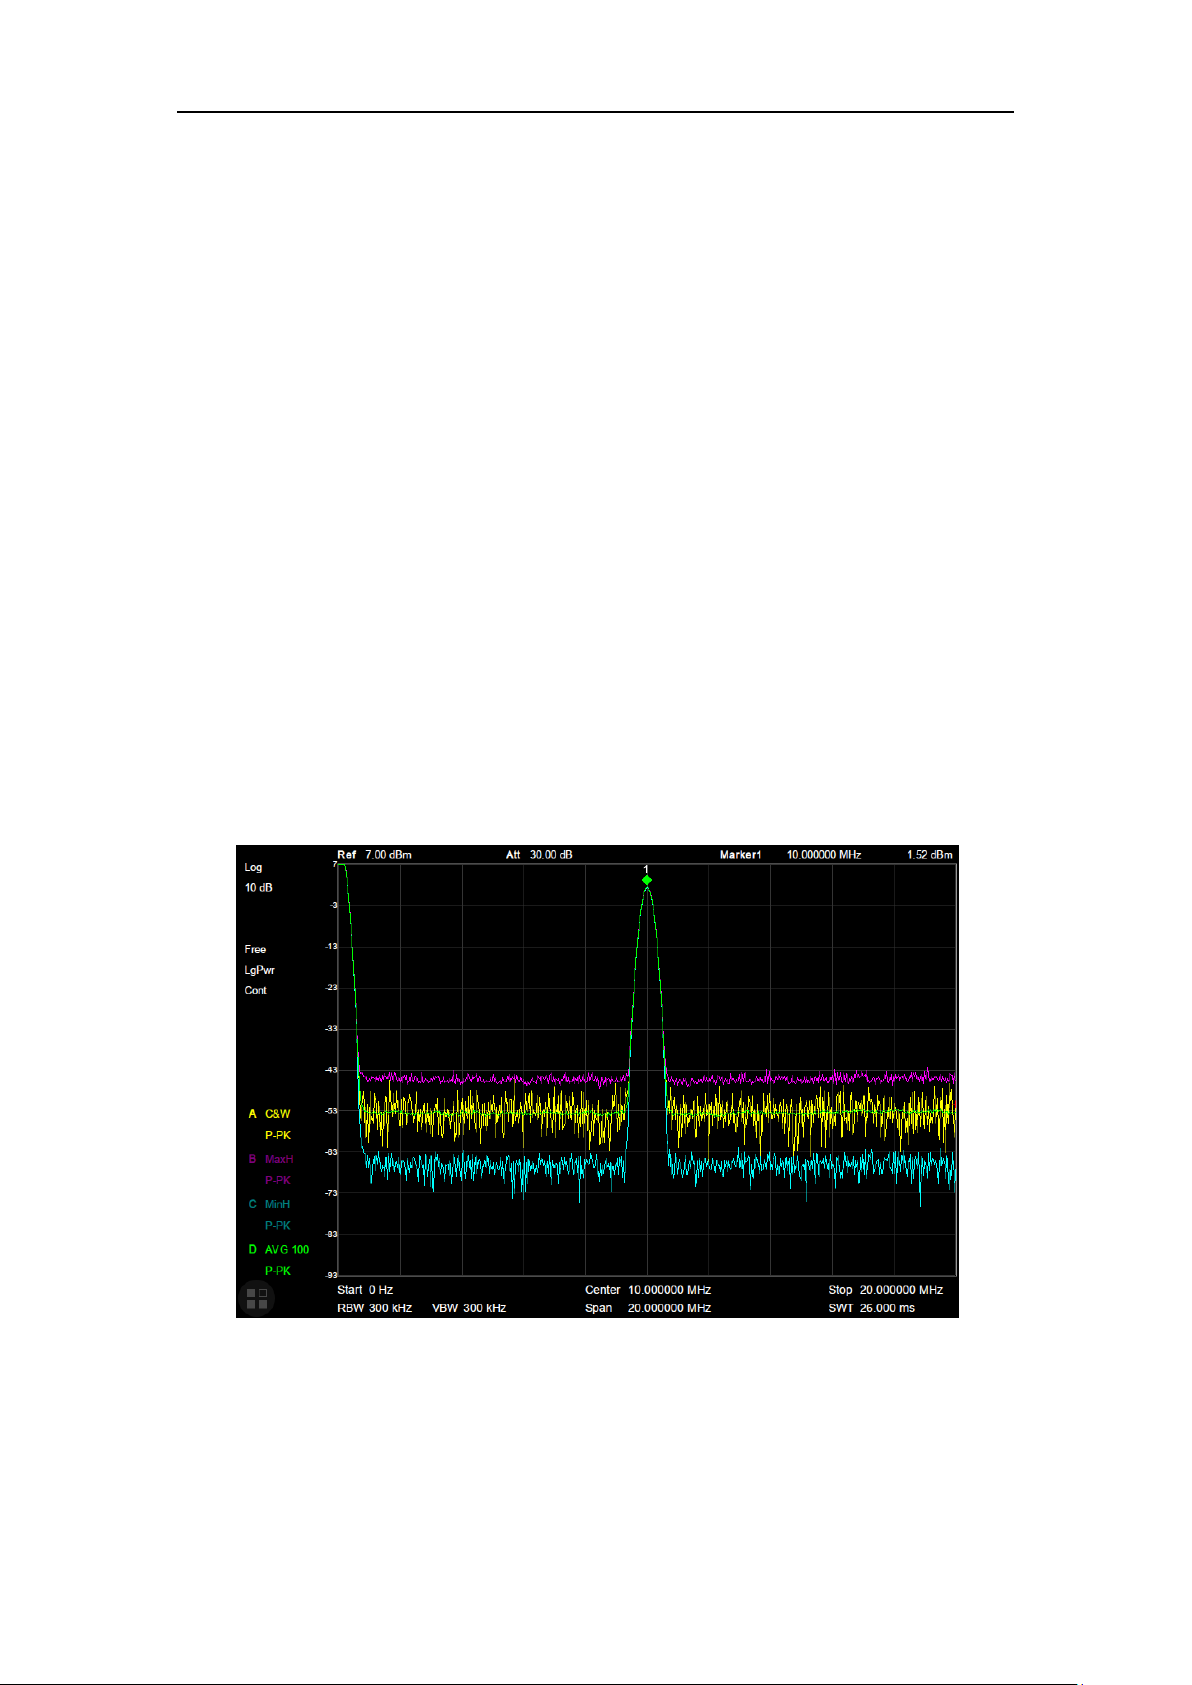
The analyzer allows for up to four traces to be displayed at the same time. Each trace has its
own color (Trace 1 - Yellow, Trace 2 - Purple, Trace 3 - Light blue and Trace 4 - Green). All
traces can be set parameter independently. As a default, analyzer will choose Trace A and set
the type of the trace as Clear Write
2.2.2.2 Trace Type
Set the type of the current trace or disable it. The system calculates the sampled data using a
specific operation method according to the trace type selected and displays the result. Trace
types include Clear Write, Max Hold, Min Hold, View, Average and Bank. The corresponding
icon of the trace type will be displayed in the status bar at the left of the screen. Take Trace
1,2,3,4 as an example and the icons are as shown in the figure below.
Figure 2-6 Trace Type
1. Clear Write
Erases any data previously stored in the selected trace, and display the data sampled in
real-time of each point on the trace.
SVA1000X User Manual 29
Page 36
SIGLENT
Parameter
Explanation
Default
100
Range
1 ~ 999
Unit
N/A
Knob Step
1
Direction Key Step
5
2. Max Hold
Retains the maximum level for each trace point of the selected trace. Updates the data if a new
maximum level is detected in successive sweeps. Max Hold is very effective when measuring
events that may take successive scans to measure accurately. Some common applications
include FM Deviation, AM NRSC, and frequency hopping or drift.
3. Min Hold
Display the minimum value from multiple sweeps for each point of the trace and update the
data if a new minimum is generated in successive sweeps.
4. View
Freezes and holds the amplitude data of the selected trace. The trace data is not updated as
the analyzer sweeps.
5. Blank
Disable the trace display and all measurements of this trace.
2.2.2.3 Average Times
Set the number of averages of the selected trace.
More averages can reduce the noise and the influence of other random signals; thus
highlighting the stable signal characteristics. The larger the number of averages is, the
smoother the trace will be. Enabling averaging increases the length of time to collect the full
spectral information because the analyzer will need to execute the sweep count that
corresponds to the average setting. The displayed data is averaged in a first-in-first-out
fashion.
Table 2-14 Average Times
2.2.2.4 Math
Set the computational method of the math trace.
1. Variable X, Y
Variable X, Y can be applied to trace A, B, C, or D.
2. Output Z
The Math result is denoted by the Z variable and can be displayed by trace A, B, C, or D.
SVA1000X User Manual 30
Page 37
Parameter
Explanation
Default
0dB
Range
-100 dB ~ 100 dB
Unit
dB
3. Calculation Type
The analyzer provides the calculation types as shown below:
Power Diff X-Y+Offset→Z
Power Sum X+Y+Offset→Z
Log Offset X+ Offset→Z
Log Diff X-Y-Ref→Z
Table 2-15 Offset
2.2.3 Detect
SIGLENT
The analyzer displays the sweep signal on the screen in the form of a trace. For each trace
point, the analyzer always captures all the data within a specific time interval and processes
(Peak, Average, etc.) the data using the detector currently selected, then it displays the
processed data (a single data point) on the screen.
Select an appropriate detector type according to the actual application in order to ensure the
accuracy of the measurement.
The available types are Pos Peak, Neg Peak, Sample, Normal, Average and Quasi Peak.
The default is Pos peak.
1. Positive Peak
For each trace point, Positive Peak detector displays the maximum value of data sampled
within the corresponding time interval.
2. Negative Peak
For each trace point, Negative Peak detector displays the minimum value of data sampled
within the corresponding time interval.
3. Sample
For each trace point, Sample detector displays the transient level corresponding to the central
time point of the corresponding time interval. This detector type is applicable to noise or
noise-like signal.
4. Normal
Normal detector (also called rosenfell detector) displays the maximum value and the minimum
value of the sample data segment in turn: Odd-numbered data points display the maximum
value and even-numbered data points display the minimum value. In this way, the amplitude
SVA1000X User Manual 31
Page 38
SIGLENT
Parameter
Explanation
Default
N/A
Range
900 us ~ 1.5 ks (Quasi Peak:
900us ~ 15ks)
Unit
ks, s, ms, us
Knob Step
Sweep time/100, min =1 ms
Direction Key Step
in 1,3 sequence
variation range of the signal is clearly shown.
5. Average
For each trace point, Average detector displays the average value of data sampled within the
corresponding time interval.
6. Quasi-Peak
Quasi-Peak (QP) detector, which is a weighted form of peak detector, is used for EMC pulse
testing. The SVA QP detector is designed to follow CISPR-16 response specifications. For a
single frequency point, the detector detects the peaks within the QP dwell time.
The peaks detected are weighted using a digital model that follows a defined response curve
as well as the time constant specified in the CISPR 16 standards. The measurement time for
QP is far longer than Peak Detector.
2.2.4 Sweep
Sets parameters about the Sweep functions, including sweep time, sweep rule, sweep mode,
number of sweep, etc.
2.2.4.1 Sweep Time
Sets the time needed for the analyzer to finish a sweep within the span range. The sweep time
can be set in “Auto” or “Manual” mode and the default is “Auto”.
In non-zero span, the analyzer selects the shortest sweep time on the basis of the current
RBW and VBW settings if Auto is selected.
Decreasing the sweep time will decrease measurement time. However, an error may be
caused if the specified sweep time is less than the minimum sweep time in Auto coupling;
at this point, “UNCAL” is shown in the status bar on the screen. Measurements taken with
“UNCAL” showing may not meet the specifications of the instrument and can have
significant error.
Table 2-16 Sweep Time
2.2.4.2 Sweep Rule
The analyzer provides two sweep time rules to meet the different sweep time requirements:
SVA1000X User Manual 32
Page 39
SIGLENT
Parameter
Explanation
Default
1
Range
1 ~ 9999
Unit
N/A
Knob Step
1
Direction Key Step
1
Speed: Activates the default fast sweep time rule.
Accuracy: Activates the normal sweep time rule to ensure increased measurement
accuracy. The Speed sweep time rule provides a fast measurement function that
decreases the sweep time. Using Fast Sweep will decrease the measurement accuracy.
2.2.4.3 Sweep
Sets the sweep mode in single or continuous, the default is continuous. The corresponding
icon of the sweep will be displayed in the status bar at the left of the screen.
1. Single
Sets the sweep mode to “Single”. The number on the parameter icon denotes the current
sweep number.
2. Numbers
Sets the number of sweeps for a single sweep. In single sweep mode, the system executes
the specified number of sweeps and the number shown on the icon in the status bar at the left
of the screen varies with the process of the sweep.
3. Continue
Sets the sweep mode to “Continue”. The character Cont on the parameter icon denotes the
analyzer is sweeping continuously.
If the instrument is in single sweep mode and no measurement function is enabled, press
this key and the system will enter continuous sweep mode and sweep continuously if the
trigger conditions are satisfied.
If the instrument is in single sweep mode and a measurement function is on, press this
key and the system will enter continuous sweep mode and measure continuously if the
trigger conditions are satisfied.
In continuous sweep mode, the system will send a trigger initialization signal
automatically and enter the trigger condition judgment directly after each sweep.
Table 2-17 Sweep Times
2.2.4.4 Sweep Mode
Sweep mode includes auto, sweep and FFT operation modes.
SVA1000X User Manual 33
Page 40
SIGLENT
Parameter
Explanation
Default
50 ms
Range
0 s ~ 10 s
Unit
ks, s, ms, us
Knob Step
N/A
Direction Key Step
N/A
1. Auto
When the sweep mode is auto, the analyzer selects the sweep mode automatically between
Sweep and FFT Mode in the shortest time.
2. Sweep
True swept operation including point-by-point scanning. The Sweep mode is only available
when the RBW is in 30 Hz – 1 MHz.
3. FFT
The FFT mode is only available when RBW is in 1 Hz - 30 kHz.
When the tracking generator (TG) is on, the sweep mode is forced to Sweep.
2.2.4.5 QPD Dwell Time
Dwell time is the measurement time at a single frequency. QP detector gets its weighted
envelope response during this dwell time. The longer dwell time is, the more sufficiently the QP
detector responses to a single frequency, and the more accurately the QP detector envelope
is.
Table 2-18 QPD Dwell Times
2.2.5 Trigger
The trigger type can be Free Run, Video or External.
2.2.5.1 Free Run
The trigger conditions are satisfied at any time and the analyzer generates trigger signals
continuously.
2.2.5.2 Video Trigger
A trigger signal will be generated when the system detects a video signal of which the voltage
exceeds the specified video trigger level.
Set the trigger level with the video trigger menu entry. At this point, the trigger level line (Trig
Line) and value are displayed on the screen.
SVA1000X User Manual 34
Page 41
SIGLENT
Parameter
Explanation
Default
0 dBm
Range
-300 dBm ~ 50 dBm
Unit
dBm
Knob Step
1 dB
Direction Key Step
10 dB
Function
Explanation
Type
Select the desired limit line (upper or lower) for editing
Mode
Select the line or point for editing. Set the number of the point to
be edited if you selected the point type. The range from 1 to 100
Add point
Add a new point for editing.
X-axis
Edit the X-axis value (frequency or time) of the current point. If
the X-axis unit is frequency and the Ref Freq is enabled, edit the
frequency difference between the frequency of the current point
and the center frequency.
Amplitude
Edit the amplitude of the current point or line. If the Ref AMPT is
enabled, edit the amplitude difference between the amplitude of
the current point and the reference level.
Table 2-19 Trigger Setup
2.2.5.3 External
In this mode, an external signal (TTL signal) is input from the [TRIGGER IN] connector at the
rear panel and trigger signals are generated when this signal fulfills the specified trigger edge
condition.
Set the trigger edge in external trigger to the rising (Pos) or falling (Neg) edge of the pulse.
2.2.6 Limit
The analyzer supports Pass/Fail test function. In this function, the measured curve is
compared with the pre-edited curve. If the related rules are met, the result is “Pass”; or else is
“Fail”.
2.2.6.1 Limit1
Select enable or disable limit1.
2.2.6.2 Limit1 Edit
Edit the properties of the limit1 lines.
Table 2-20 Limit1 Edit Menu
SVA1000X User Manual 35
Page 42
SIGLENT
Del Point
Delete the point you are editing.
Del All
Delete all point.
Save/Recall
Save or load the limit file.
Function
Explanation
Type
Select the desired limit line (upper or lower) for editing
Mode
Select the line or point for editing. Set the number of the
point to be edited if you selected the point type. The range
from 1 to 100
Add point
Add a new point for editing.
X-axis
Edit the X-axis value (frequency or time) of the current point.
If the X-axis unit is frequency and the Ref Freq is enabled,
edit the frequency difference between the frequency of the
current point and the center frequency.
Amplitude
Edit the amplitude of the current point or line. If the Ref AMPT
is enabled, edit the amplitude difference between the
amplitude of the current point and the reference level.
Del Point
Delete the point you are editing.
Del All
Delete all points.
Save/Recall
Save or load the limit file.
2.2.6.3 Limit2
Select enable or disable limit2.
2.2.6.4 Limit2 Edit
Edit the properties of the limit2 lines.
Table 2-21 Limit2 Edit Menu
2.2.6.5 Test
Enable or disable the limit test function.
2.2.6.6 Setup
1. Fail to stop
Select whether the instrument will continue or stop operation when a failure occurs.
2. Buzzer
Turn on or off the buzzer. When the buzzer is on, it beeps when a failure occurs.
3. X Axis
SVA1000X User Manual 36
Page 43
SIGLENT
Parameter
Explanation
Default
0 dB
Range
-20 dBm ~ 0 dBm
Unit
dBm
Knob Step
1 dB
Direction Key Step
10 dB
Parameter
Explanation
Default
0 dB
Range
-200 dB ~ 200 dB
Unit
dB
Set the X-axis unit to frequency or time units.
Note that all the points of the current limit line will be deleted when the X-axis unit changes.
2.2.7 TG (Tracking Generator)
Set the parameters related to the tracking generator (TG).
2.2.7.1 TG
The tracking generator is a signal source with an adjustable frequency and amplitude. When
the TG is enabled, a signal with the same frequency of the current sweep signal will be output
from the connector at the front panel. The power of the signal could be set through the menu.
The TG output frequency follows the analyzer sweep frequency. For example, if the sweep is
set to scan from 1 MHz to 10 MHz, the TG output frequency will change from 1 MHz to 10 MHz
in coordinated steps with the sweep. In Zero Span mode, the TG frequency will match the
center frequency of the analyzer.
2.2.7.2 TG Level
Set the output power of the signal of the tracking generator.
Table 2-22 TG Level
2.2.7.3 TG Level Offset
Assigns a certain offset to the output power of the TG when gains or losses occur between the
TG output and external device in order to display the actual power value.
This parameter only changes the readout of the TG output power, rather than the actual
value.
The offset could be either a positive (gain in the external output) or a negative (loss in the
external output).
Table 2-23 TG Level Offset
SVA1000X User Manual 37
Page 44
SIGLENT
Knob Step
1 dB
Direction Key Step
10 dB
Default
reference plane
Normalized
reference plane
Parameter
Explanation
Default
0 dB
Range
-200 dB ~ 200 dB
Unit
dB
Knob Step
1 dB
Direction Key Step
10 dB
2.2.7.4 Normalize
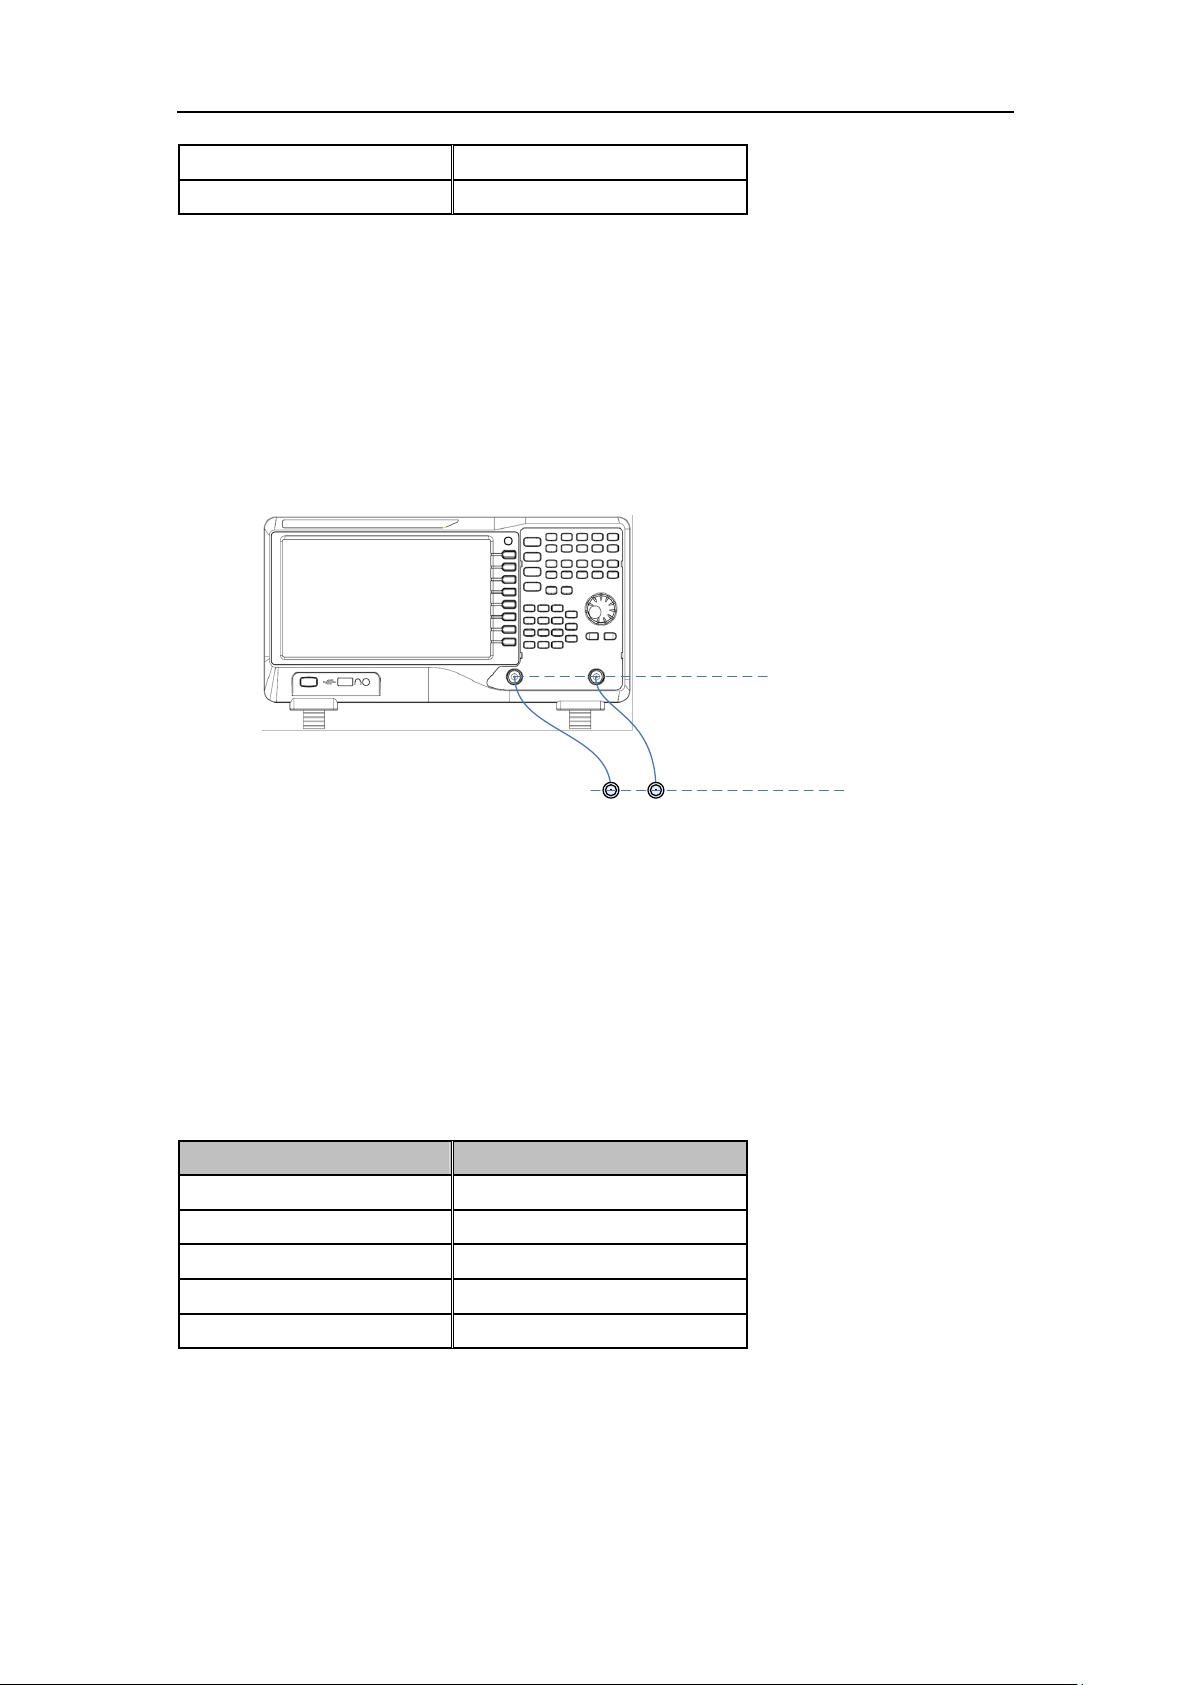
Normalization can eliminate errors in the TG Level. Before using this function, connect the [TG
SOURCE] output terminal of the TG with the [RF INPUT] input terminal of the analyzer.
When enabled, the reference trace will be stored automatically after the current sweep finishes
if no reference trace is stored before. During the reference trace storage, the corresponding
prompt message is displayed. When normalization is enabled, the corresponding value of the
reference trace will be subtracted from the trace data after every sweep.
Figure 2-7 Normalization
2.2.7.5 Norm Ref Level
Adjust the vertical position of the trace on the screen by adjusting the reference level when
normalization is enabled.
This operation differs from the Ref Level function in the AMPT menu. This parameter has no
influence on the reference level of the analyzer.
Table 2-24 Reference level under normalization
2.2.7.6 Norm Ref Pos
Adjust the vertical position of the normalization reference level on the screen by adjusting the
reference position when normalization is enabled.
The function of this menu is similar to that of Norm Ref Level. When it is set to 0%, the
SVA1000X User Manual 38
Page 45
SIGLENT
Parameter
Explanation
Default
100%
Range
0 ~ 100%
Unit
100%
Knob Step
1%
Direction Key Step
10%
normalization reference level is displayed at the bottom of the screen grid and at the top
when it is set to 100%.
Table 2-25 TG reference position under normalization
2.2.7.7 Ref Trace
Set whether to display the reference trace or not. If “View” is selected, the reference trace
saved (Trace D) will be shown in “View” type.
Note: When normalization is enabled, the unit of Y-axis is “dB” and will not be influenced by
the definition in AMPT->Units. At this point, “(dB)” is displayed under the Y-axis scale in the
user interface.
2.2.8 Demod
Press Demod at the front panel to enter the demodulation setting menu. Both AM and FM
demodulations are available in this device.
2.2.8.1 Demod (AM/FM)
Set the demodulation type to AM or FM; or disable the demodulation function. The default is
off.
The system will enable a marker automatically, place it at the center frequency and
perform AM (or FM) demodulation on this frequency point after you enable AM (or FM)
demodulation.
The analyzer features an earphone jack and the demodulated signal can be output in
audio frequency (AF) mode through the earphone. The frequency and intensity of AF
denotes the frequency and amplitude of the signal respectively.
2.2.8.2 Earphone
Set the status of the earphone. When it is on, the demodulated signal can be heard through
the earphone during the demodulation. By default, it is off.
2.2.8.3 Volume
Set the volume of the earphone.
SVA1000X User Manual 39
Page 46
SIGLENT
Parameter
Explanation
Default
6
Range
0 ~ 10
Unit
N/A
Knob Step
1
Direction Key Step
1
Parameter
Explanation
Default
5 s
Range
5 ms ~ 1000 s
Unit
ks, s, ms
Knob Step
0 ms ~ 100 ms, step = 1 ms
100 ms ~ 1 s, step = 10 ms
1 s ~ 10 s, step = 100 ms
10 s ~ 100 s, step = 1 s
100 s ~ 1000 s, step = 10 s
Direction Key Step
1-2-5 step
Table 2-26 Volume
2.2.8.4 Demod Time
Set the time for the analyzer to complete a signal demodulation after each sweep.
If the Earphone is set to “On”, you will hear the demodulated signal through the earphone
during the demodulation. A longer demod dwell time is recommended for demodulating audio
signals.
Table 2-27 Demod time
SVA1000X User Manual 40
Page 47
SIGLENT
Parameter
Explanation
Default
Center Frequency
Range
0 ~ Full Span
Unit
Readout = Frequency, units available are GHz, MHz, kHz, Hz
Readout = Time (or Period), units available are s, ms, us, ns, ps
Knob Step
Readout = Frequency (or Period), Step = Span/(Sweep Points - 1)
Direction
Key Step
Readout = Frequency (or Period), Step = Span/10
2.3 Marker
2.3.1 Marker
The marker appears as a rhombic sign (as shown below) for identifying points on a trace. You
can easily read the amplitude, frequency and sweep time of the marked point on the trace.
The analyzer allows for up to eight/four pairs of markers to be displayed at one time, but
only one pair or a single marker is active every time.
You can use the numeric keys, knob or direction keys to modify the desired frequency or
time as well as view the readouts of different points on the trace.
2.3.1.1 Select Marker
Select one of the four markers. The default is Marker1. When a marker is selected, you can set
its type, trace to be marked, readout type and other related parameters. The enabled marker
will appear on the trace selected through the Select Trace option and the readouts of this
marker are also displayed in the active function area and at the upper right corner of the
screen.
Table 2-28 Marker parameters
2.3.1.2 Select Trace
Select the trace to be marked by the current marker. Valid selections include A, B, C, or D.
2.3.1.3 Normal
One of the marker types. It is used to measure the X (Frequency or Time) and Y (Amplitude)
values of a certain point on the trace. When selected, a marker with the number of the current
marker (such as “1”) appears on the trace.
If no active marker exists currently, a marker will be enabled automatically at the center
frequency of the current trace.
You can use the numeric keys, knob or direction keys to move the marker. The readouts
of the marker will be displayed at the upper right corner of the screen.
SVA1000X User Manual 41
Page 48

SIGLENT
The readout resolution of the X-axis (frequency or time) is related to the span. For higher
readout resolution, reduce the span.
2.3.1.4 Delta
One of the marker types. It is used to measure the delta values of X (Frequency or Time) and Y
(Amplitude) between the reference point and a certain point on the trace. When selected, a
pair of markers appears on the trace: Fixed Related Marker (marked by a combination of the
marker number and letter “+”, such as “2+”) and the Delta Marker (marked by the “∆”, such as
“1∆2”).
After the marker selects “Delta”, the original marker will become the delta measurement
marker, and the related marker of the incrementing sequence number will become the
reference “fixed” marker
The delta marker is in the "relative to" state, and its X-axis position can be changed; the
related marker is in the "fixed" state by default (the X-axis and Y-axis positions are fixed),
but the X-axis can be adjusted by changing to the "normal" state.
The first row in the upper right corner of the trace area shows the frequency (or time)
difference and amplitude difference between the two markers; the second row in the
upper right corner of the trace area shows the X axis and amplitude value of the related
marker.
2.3.1.5 Fixed
One of the marker types. When “Fixed” is selected, the X-axis and Y-axis of the marker will not
change by the trace and can only be changed through the menu. The fixed marker is marked
with "+".
After the marker selects “Delta”, the original marker will become the delta measurement
marker, and the related marker of the incrementing sequence number will become the
reference “fixed” marker
2.3.1.6 Off
Turn off the marker currently selected. The marker information displayed on the screen and
functions based on the marker will also be turned off.
2.3.1.7 Relative To
“Relative to” is used to measure the delta values of X (Frequency or Time) and Y (Amplitude)
between two markers which can mark on different traces.
After the marker selects “Delta”, the original marker will become the delta measurement
marker, and the related marker of the incrementing sequence number will become the
reference “fixed” marker
SVA1000X User Manual 42
Page 49
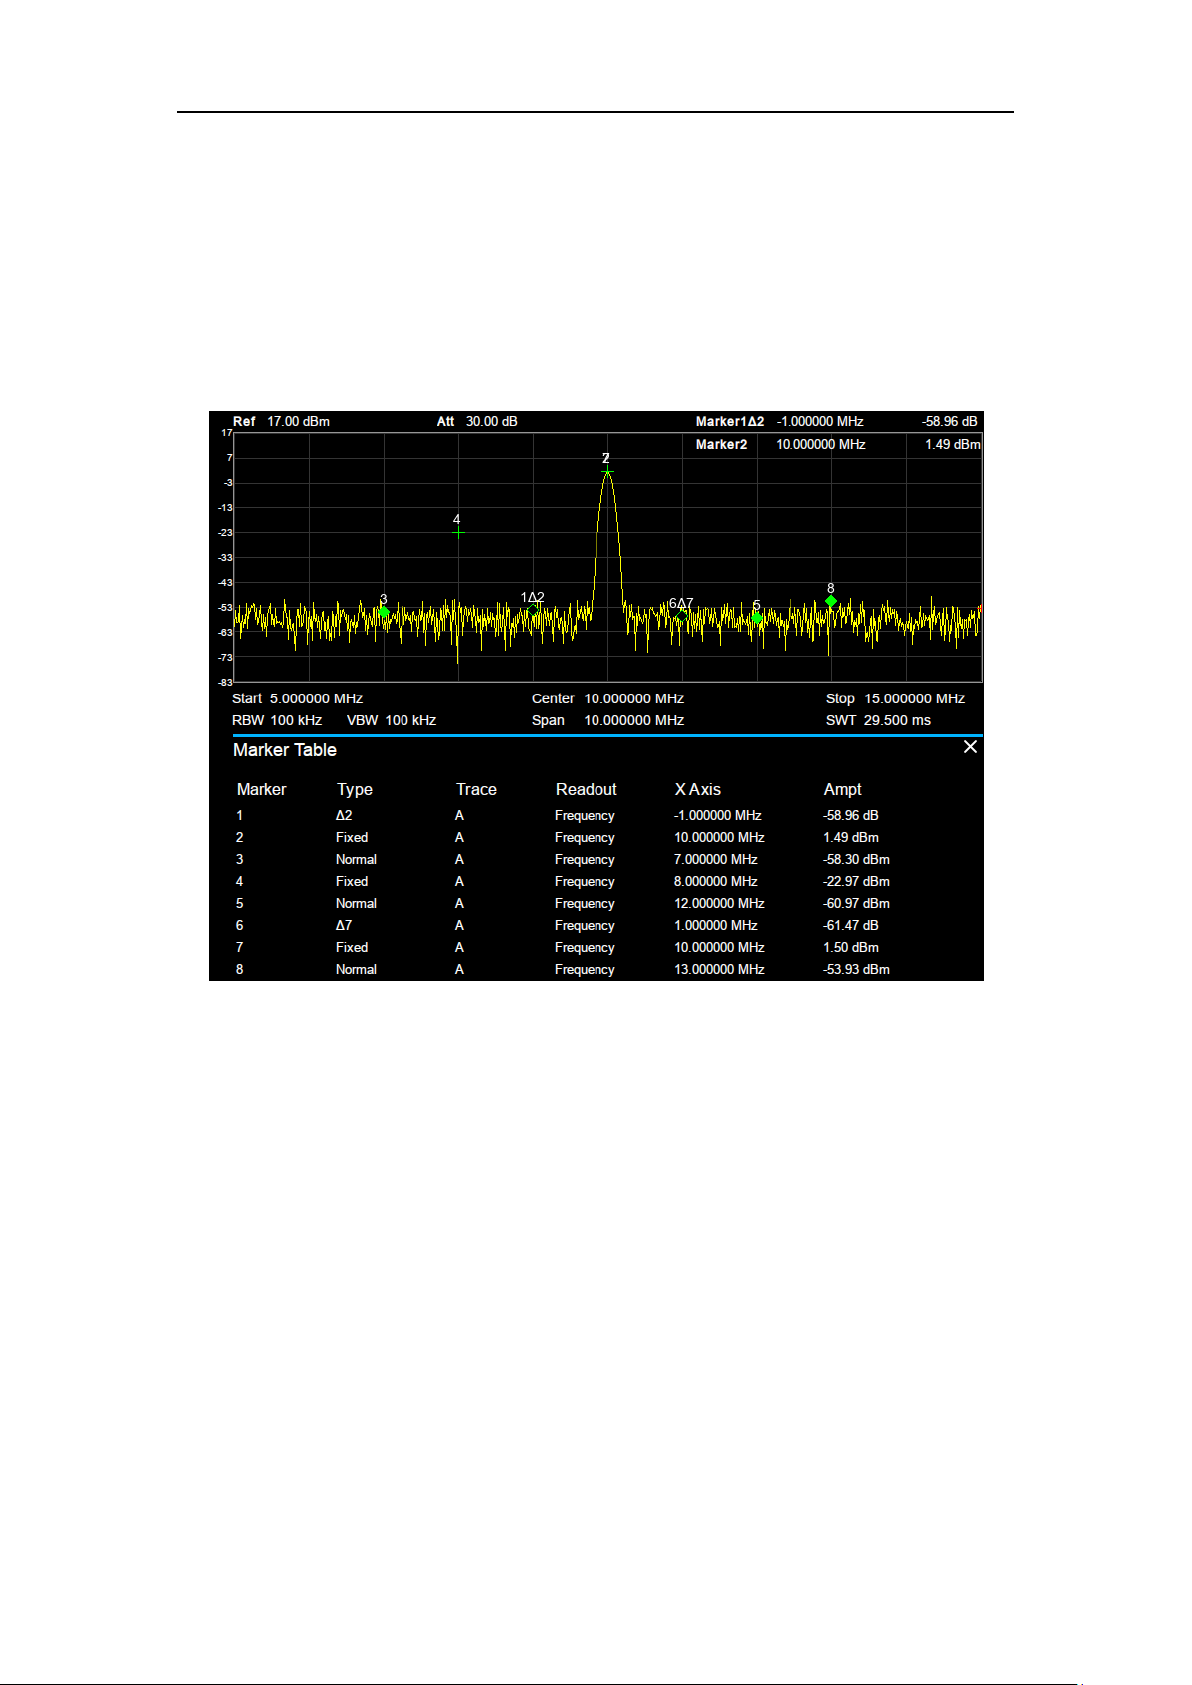
SIGLENT
2.3.1.8 Marker Table
Enable or disable the Marker Table.
Display all the markers enabled on the lower portion of the screen, including marker number,
trace number, marker readout type, X-axis readout and amplitude. Through this table you can
view the measurement values of multiple points. The table allows for up to eight markers to be
displayed at one time.
Figure 2-8 Marker table
2.3.2 Marker ->
1. M->CF
Set the center frequency of the analyzer to the frequency of the current marker.
If the Normal marker is selected, the center frequency will be set to the frequency of the
current marker.
If the Delta or Delta Pair marker is selected, the center frequency will be set to the
frequency of the Delta Marker.
The function is invalid in Zero span.
2. M -> CF Step
Set the center frequency step of the analyzer to the frequency of the current marker.
If the Normal marker is selected, the center frequency step will be set to the frequency of
the current marker.
If the Delta or Delta Pair marker is selected, the center frequency step will be set to the
SVA1000X User Manual 43
Page 50

SIGLENT
frequency of the Delta Marker.
The function is invalid in Zero span.
3. M -> Start Freq
Set the start frequency of the analyzer to the frequency of the current marker.
If the Normal marker is selected, the start frequency will be set to the frequency of the
current marker.
If the Delta or Delta Pair marker is selected, the start frequency will be set to the
frequency of the Delta Marker.
The function is invalid in Zero span.
4. M -> Stop Freq
Set the stop frequency of the analyzer to the frequency of the current marker.
If the Normal marker is selected, the stop frequency will be set to the frequency of the
current marker.
If the Delta or Delta Pair marker is selected, the stop frequency will be set to the
frequency of the Delta Marker.
The function is invalid in Zero span.
5. M ->Ref Level
Set the reference level of the analyzer to the amplitude of the current marker.
If the Normal marker is selected, the reference level will be set to the amplitude of the
current marker.
If the Delta or Delta Pair marker is selected, the reference level will be set to the
amplitude of the Delta Marker.
6. ΔM->Span
Set the span of the analyzer to the frequency difference between the two markers in Delta
marker type.
If the Normal marker is selected, this function is invalid.
The function is invalid in Zero span.
7. ΔM->CF
Set the center frequency of the analyzer to the frequency difference between the two markers
in Delta marker type.
If the Normal marker is selected, this function is invalid.
The function is invalid in Zero span.
2.3.3 Marker Fn
Special marker functions including Noise Marker, N dB BW and Freq Counter.
SVA1000X User Manual 44
Page 51
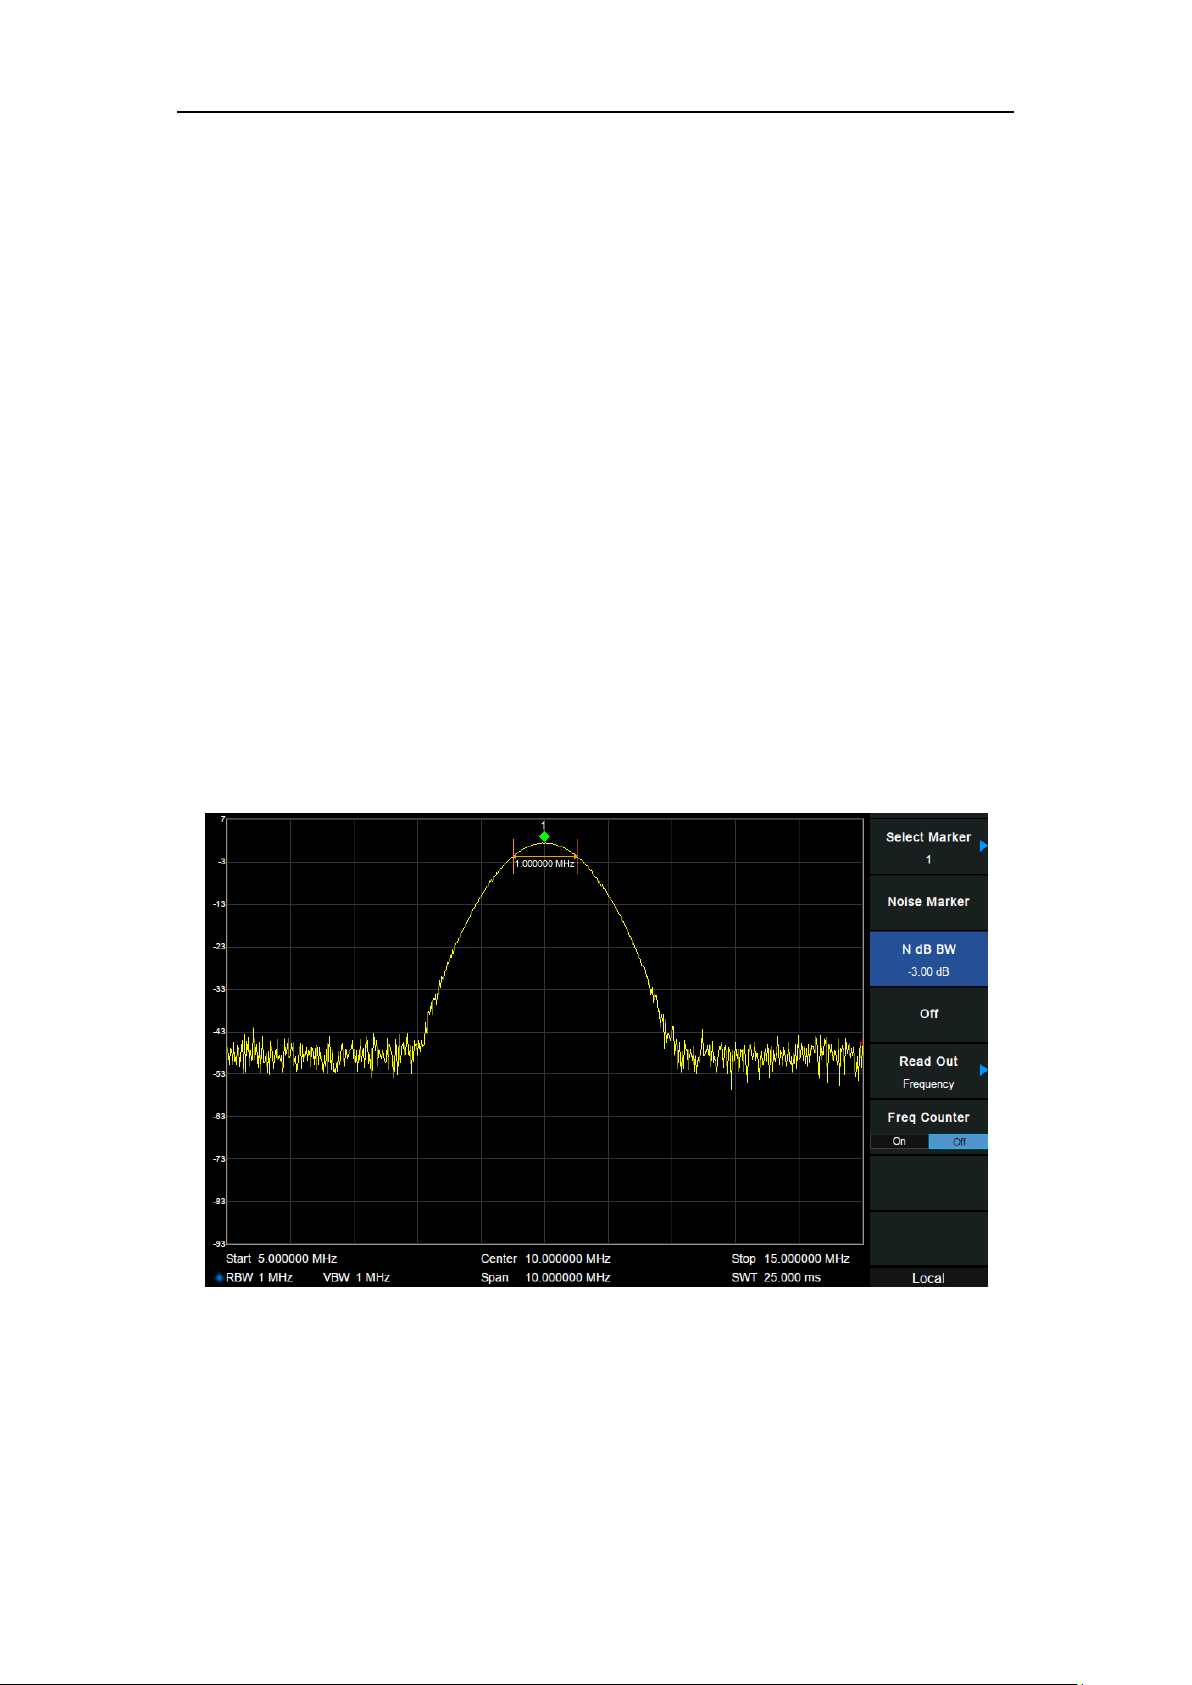
SIGLENT
2.3.3.1 Select Marker
Select one of the eight markers (1, 2, 3, 4, 5, 6, 7 and 8) and the default is Marker1.
2.3.3.2 Noise Marker
Execute the Noise marker function for the selected marker and read the normalized noise
power spectral density.
If the current marker is “Off” in the Marker menu, pressing Noise Marker will first set it to
Normal type automatically; then measure the average noise level at the marked point and
normalize this value to 1 Hz bandwidth. During this process, certain compensation is
always made on the basis of the detection and trace types. The measurement will be
more precise if RMS Avg or Sample detection type is used.
This function can be used for measuring the C/N ratio.
2.3.3.3 N dB BW
Enable the N dB BW measurement or set the value of N dB. The N dB BW denotes the
frequency difference between two points that are located on both sides of the current marker
and with N dB fall (N<0) or rise (N>0) in amplitude as shown in the figure on the next page.
Figure 2-9 N dB BW
When the measurement starts, the analyzer will search for the two points which are located at
both sides of the current point with N dB fall or rise in amplitude and display the frequency
difference between the two points in the active function area. "----" would be displayed if the
search fails.
SVA1000X User Manual 45
Page 52

SIGLENT
Parameter
Explanation
Default
-3 dB
Range
-100 dB ~ 100 dB
Unit
dB
Knob Step
0.1 dB
Direction Key Step
1 dB
Table 2-29 N dB Noise
2.3.3.4 Freq Counter
Turn on or off the frequency counter. The frequency readout is accuracy is up to 0.01 Hz.
The function is valid only when selecting marker 1.
If marker 1 is selected but not active, turning on the frequency counter will open marker 1
Normal marker automatically.
The frequency counter measures the frequency near the center frequency in Zero span.
2.3.3.5 Off
Turn off the noise marker, N dB BW measurement or Frequency Counter, but not the marker
itself.
2.3.3.6 Read Out
Select a desired readout type for the X-axis for the marker. Different markers can use different
readout types. This setting will change the readout type and affect the marker readings in the
active function area and at the upper right corner of the screen, but will not change the actual
value.
1. Frequency
In this type, Normal marker shows the absolute frequency. Delta markers and Delta Pair
markers show the frequency difference between the delta marker and reference marker. The
default readout mode in non-zero span is “Frequency”.
Note: This type is invalid in Zero span.
2. Period
In this type, the Normal marker shows the reciprocal of frequency; while Delta marker and
Delta Pair marker show the reciprocal of frequency difference. When the frequency difference
is zero, the reciprocal is infinite and 100 Ts is displayed.
Note: This type is invalid in Zero span.
3. Δ Time
In this type, the Normal marker shows the time difference between the marker and the start of
the sweep; while Delta marker and Delta Pair marker show the sweep time difference between
SVA1000X User Manual 46
Page 53

SIGLENT
the delta marker and reference marker.
The default readout mode in Zero span is Δ Time.
2.3.4 Peak
Open the peak search setting menu and execute peak search.
2.3.4.1 Peak -> CF
Execute peak search and set the center frequency of the analyzer to the frequency of the
peak.
2.3.4.2 Next Peak
Search for and mark the peak whose amplitude is closest to that of the current peak and which
meets the peak search condition.
2.3.4.3 Next Left Peak
Search for and mark the nearest peak which is located at the left side of the current peak and
meets the peak search condition.
2.3.4.4 Next Right Peak
Search for and mark the nearest peak which is located at the right side of the current peak and
meets the peak search condition.
2.3.4.5 Peak Peak
Execute peak search and minimum search at the same time and mark the results with delta
pair markers. Wherein, the result of peak search is marked with the delta marker and the result
of minimum search is marked with the reference marker.
2.3.4.6 Count Peak
Enable or disable continuous peak search. The default is Off. When enabled, the system will
always execute a peak search automatically after each sweep in order to track the signal
under measurement.
2.3.4.7 Peak Table
Open the peak table (in the lower window) which lists the peaks (with frequency and amplitude)
that meet the peak search condition. Up to 16 peaks can be displayed in the table.
SVA1000X User Manual 47
Page 54
SIGLENT
Parameter
Explanation
Default
-140 dBm
Range
-200 dBm ~ 200 dBm
Unit
dBm
Knob Step
1 dB
Direction Key Step
5 dB
Parameter
Explanation
Default
15 dB
Range
0 dB ~ 200 dB
Unit
dB
Knob Step
1 dB
Direction Key Step
5 dB
2.3.4.8 Search Config
Define the conditions of peak search for various peak searches. A real peak should meet the
requirements of both the “Peak Excursion” and “Peak Threshold”.
1. Peak Threshold
Assign a minimum for the peak amplitude. Peaks whose amplitudes are greater than the
specified peak threshold are treated as real peaks.
Table 2-30 Peak Threshold
2. Peak Excursion
Set the excursion between the peak and the minimum amplitude on both sides of it. Peaks
whose excursions are beyond the specified excursion are treated as real peaks.
Table 2-31 Peak Excursion
3. Peak Type
Set the peak search condition. The available options are Maximum and Minimum
SVA1000X User Manual 48
Page 55

SIGLENT
2.4 Measurement
2.4.1 Meas
Provides optional measurement functions. When activated, the screen will be divided into two
parts, the above part is the measure screen which displays traces. The other part is used to
display measurement results.
2.4.1.1 Channel Power
Measure the power and power density within the specified channel bandwidth. When this
function is enabled, the span and resolution bandwidth are automatically adjusted to smaller
values. Select Channel Power and press Meas Setup to set the corresponding parameters.
2.4.1.2 ACPR
Measures the power of the main channel and adjacent channels as well as the power
difference between the main channel and each of the adjacent channels. When this function is
enabled, the span and resolution bandwidth of the analyzer are adjusted to smaller values
automatically.
Select ACPR and press Meas Setup to set the corresponding parameters.
2.4.1.3 Occupied BW
Integrates the power within the whole span and calculates the bandwidth occupied by this
power according to the specified power ratio. The OBW function also indicates the difference
(namely “Transmit Freq Error”) between the center frequency of the channel under
measurement and the center frequency of the analyzer. Select Occupied BW and press Meas
Setup to set the corresponding parameters.
2.4.1.4 T-Power
The system enters Zero span and calculates the power within the time domain. The types of
powers available include Peak, Average and RMS. Select T-Power and press Meas Setup to
set the corresponding parameters.
2.4.1.5 TOI
Automatic measurement of IP3 (Third order Intercept Point), including the power of
fundamental wave and the Third order in the power, and calculate the adjustable Intercept
Point
SVA1000X User Manual 49
Page 56
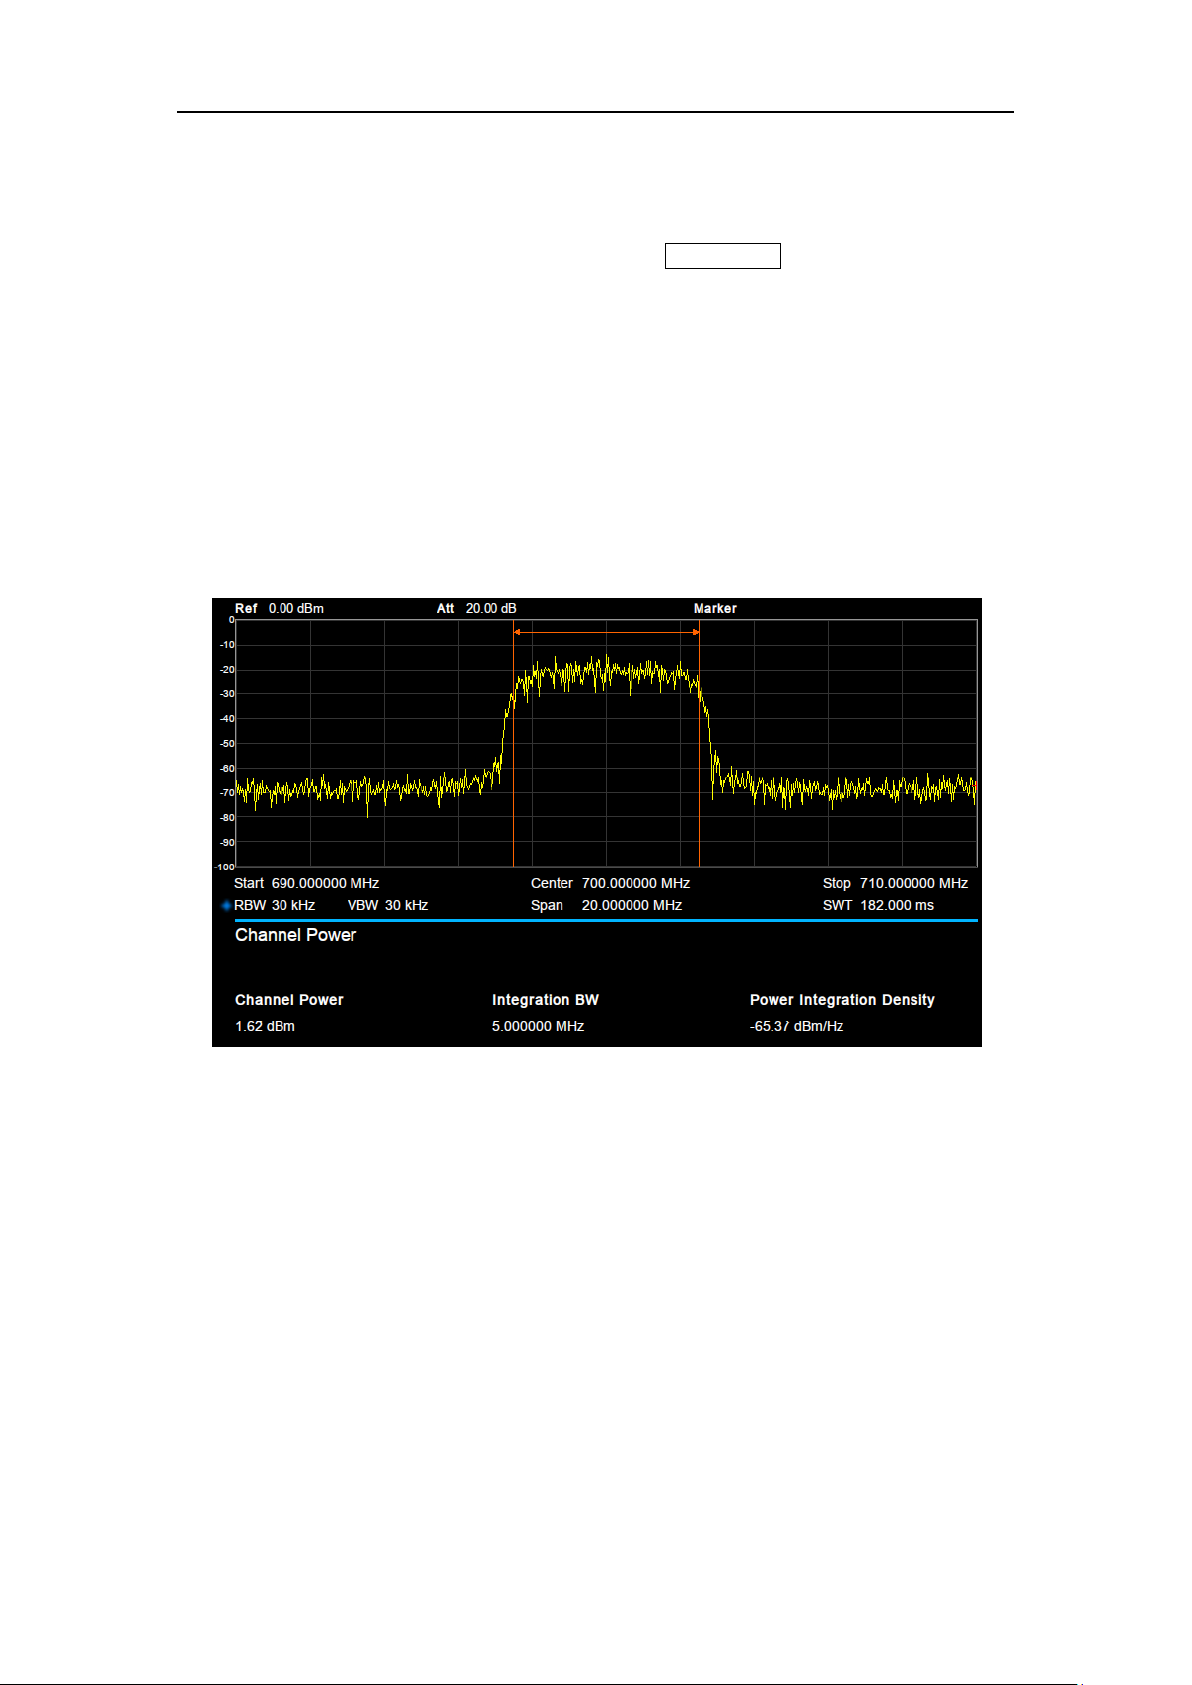
SIGLENT
2.4.1.6 Spectrum Monitor
Display the power of the swept spectrum as an intensity color map commonly referred to as a
waterfall chart. Select Spectrum Monitor and press Meas Setup to set the corresponding
parameters.
2.4.1.7 Meas Off
Turn off all the Meas functions.
2.4.2 Meas setup
2.4.2.1 Channel Power
Figure 2-10 Channel Power
Measurement Results: Channel power and power spectral density.
Channel Power: Power within the integration bandwidth.
Power Spectral Density: Power (in dBm/Hz) normalized to 1Hz within the integration
bandwidth.
Measurement Parameters: Center Freq, integration bandwidth, Span, Span power.
1. Center Freq
Set the center frequency, this center frequency which is the same with the center frequency of
the analyzer. Modifying this parameter will change the center frequency of the analyzer.
2. Integration bandwidth
Set the frequency width of the channel to be tested and the power of the channel is the power
SVA1000X User Manual 50
Page 57
SIGLENT
Parameter
Explanation
Default
2 MHz
Range
100 Hz ~ Span
Unit
GHz, MHz, kHz, Hz
Knob Step
Integration BW/100, the minimum is 1 Hz
Direction Key Step
In 1-1.5-2-3-5-7.5 sequence
Parameter
Explanation
Default
current span
Range
100 Hz ~ Span
Unit
GHz, MHz, kHz, Hz
Knob Step
Channel Power Span/100, the minimum is
1Hz
Direction Key Step
In 1-1.5-2-3-5-7.5 sequence
integral within this bandwidth. You can use the numeric keys, knob or direction keys to modify
this parameter.
Table 2-32 Integration BW
3. Span
Set the frequency range of the channel. This span which is the same with the span of the
analyzer is the frequency range of the sweep. Modifying this parameter will change the span of
the analyzer.
The channel power span is related to the integration bandwidth.
Table 2-33 Channel Power Span for Chan Power Measurement
4. Span Power
Set the integrated bandwidth to the sweep span of display. The channel power and power
spectral density display on the screen simultaneously.
SVA1000X User Manual 51
Page 58
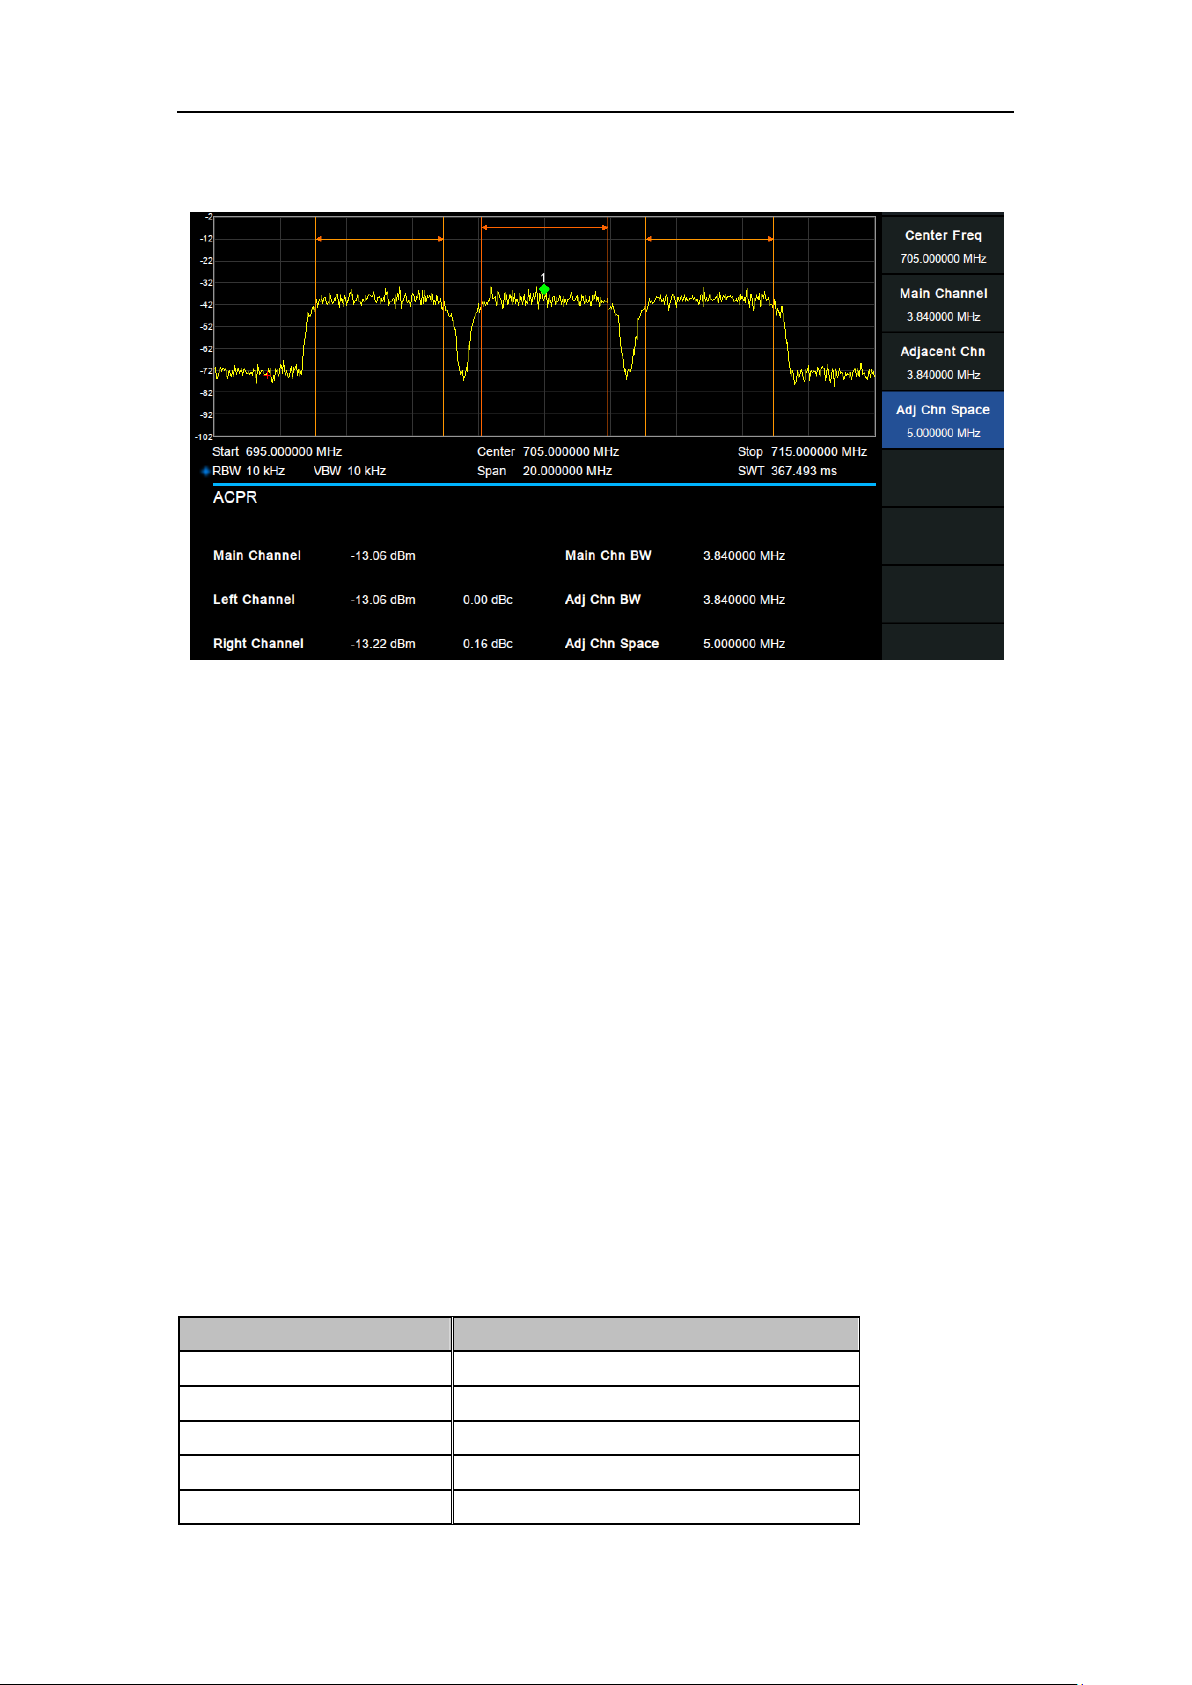
SIGLENT
Parameter
Explanation
Default
1 MHz
Range
100 Hz ~ Sweep Span
Unit
GHz, MHz, kHz, Hz
Knob Step
Integration BW /100, the minimum is 1 Hz
Direction Key Step
In 1-1.5-2-3-5-7.5 Sequence
2.4.2.2 ACPR
Figure 2-11 ACPR
Adjacent Channel Power Measurement: Main CH Power, Left channel power and Right
channel power.
Main CH Power: Displays the power within the bandwidth of the main power
Left channel power : Displays the power of left channel and the power difference between
the left channel and the main channel (in dBc)
Right channel power: Display the power of the right channel and the power difference
between the right channel and the main channel(in dBc)
Measurement parameter: Center frequency, main channel bandwidth, adjacent channel
bandwidth and channel spacing
1. Center Frequency
Set the center frequency. The center frequency is the same with the center frequency of the
analyzer display. Modifying this parameter will change the center frequency of the analyzer.
2. Main channel bandwidth
Set the bandwidth of the main channel and the power of the main channel is the power integral
within this bandwidth.
Table 2-34 Main channel bandwidth
SVA1000X User Manual 52
Page 59
SIGLENT
Parameter
Explanation
Default
1 MHz
Range
100 Hz ~ Sweep Span
Unit
GHz, MHz, kHz, Hz
Knob Step
Integration BW /100, the minimum is 1 Hz
Direction Key Step
In 1-1.5-2-3-5-7.5 Sequence
Parameter
Explanation
Default
3 MHz
Range
100 Hz ~ full span
Unit
GHz, MHz, kHz, Hz
Knob Step
Integration BW /100, the minimum is 1 Hz
Direction Key Step
In 1-1.5-2-3-5-7.5 Sequence
3. Adjacent channel bandwidth
Set the frequency width of the adjacent channels.
The adjacent channel bandwidth is related to the main channel bandwidth.
Table 2-35 Adjacent channel bandwidth
4. Adjacent Channel space
Set the difference between the center frequency of the main channel and the center frequency
of the adjacent channels.
Adjusting this parameter will also adjust the distance between the upper/lower channel and the
main channel.
Table 2-36 adjacent channel space
SVA1000X User Manual 53
Page 60
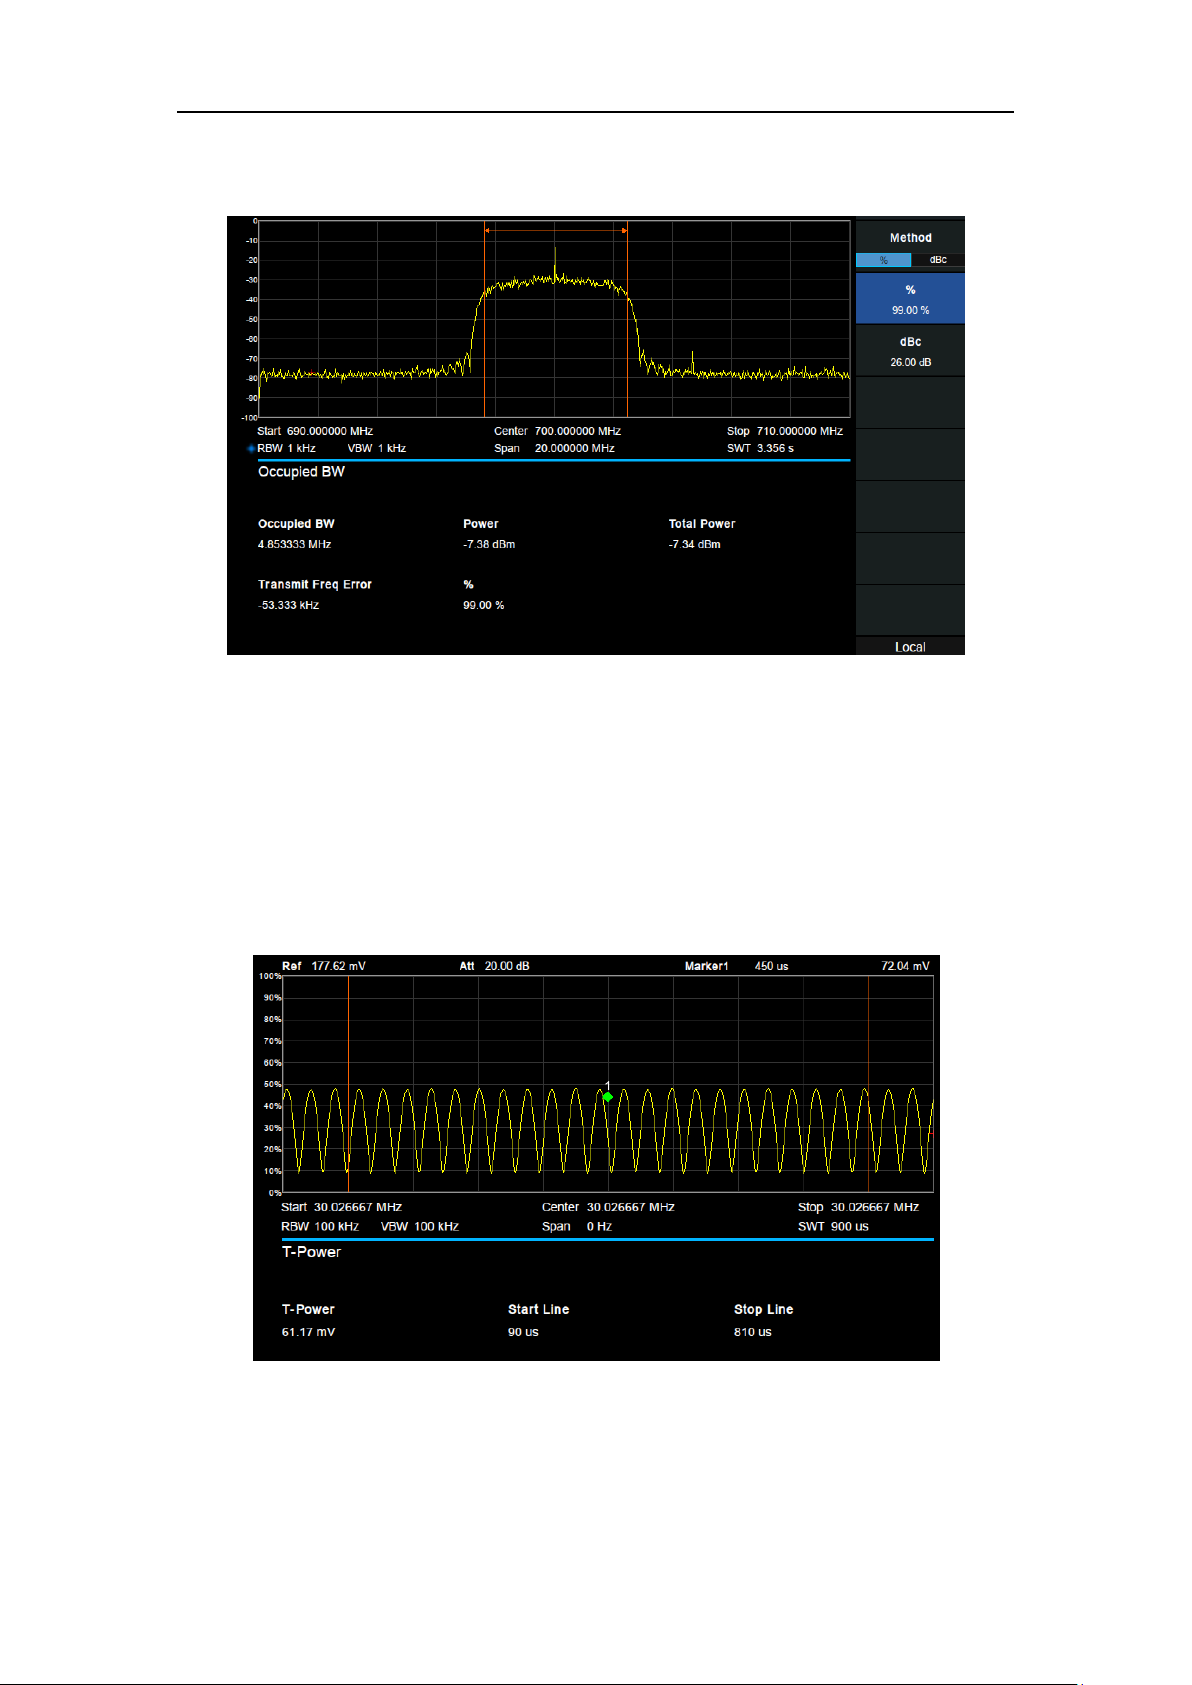
SIGLENT
2.4.2.3 OBW
Figure 2-12 OBW
OBW measurement: occupied bandwidth and transmit frequency error.
Occupied Bandwidth: Integrates the power within the whole span and then calculates
the bandwidth occupied by the power according to the specified power ratio.
Transmit Frequency Error: The difference between the center frequency of the channel
and the center frequency of the analyzer.
2.4.2.4 T-Power
Figure 2-13 T-Power
T-Power: The power of the signal from the start line to the stop line.
Measurement Parameter: Center frequency, start line, stop line.
SVA1000X User Manual 54
Page 61
SIGLENT
Parameter
Explanation
Default
0 s
Range
0 s ~ stop line
Unit
ks, s, ms, us, ns
Knob Step
Sweep time/751
Direction Key Step
In 1-1.5-2-3-5-7.5 Sequence
Parameter
Explanation
Default
900 us
Range
Start line ~ sweep time
Unit
ks, s, ms, us, ns
Knob Step
Sweep time /751
Direction Key Step
In 1-1.5-2-3-5-7.5 Sequence
1. Center Frequency
Set the center frequency, this center frequency which is the same with the center frequency of
the analyzer. Modifying this parameter will change the center frequency of the analyzer.
2. Start line
Set the left margin (in time unit) of T-Power measurement. The data calculated under this
measurement is between the start line and stop line.
Table 2-37 start line
3. Stop line
Set the right margin (in time unit) of T-Power measurement. The data calculated under this
measurement is between the start line and stop line.
Table 2-38 stop line
SVA1000X User Manual 55
Page 62
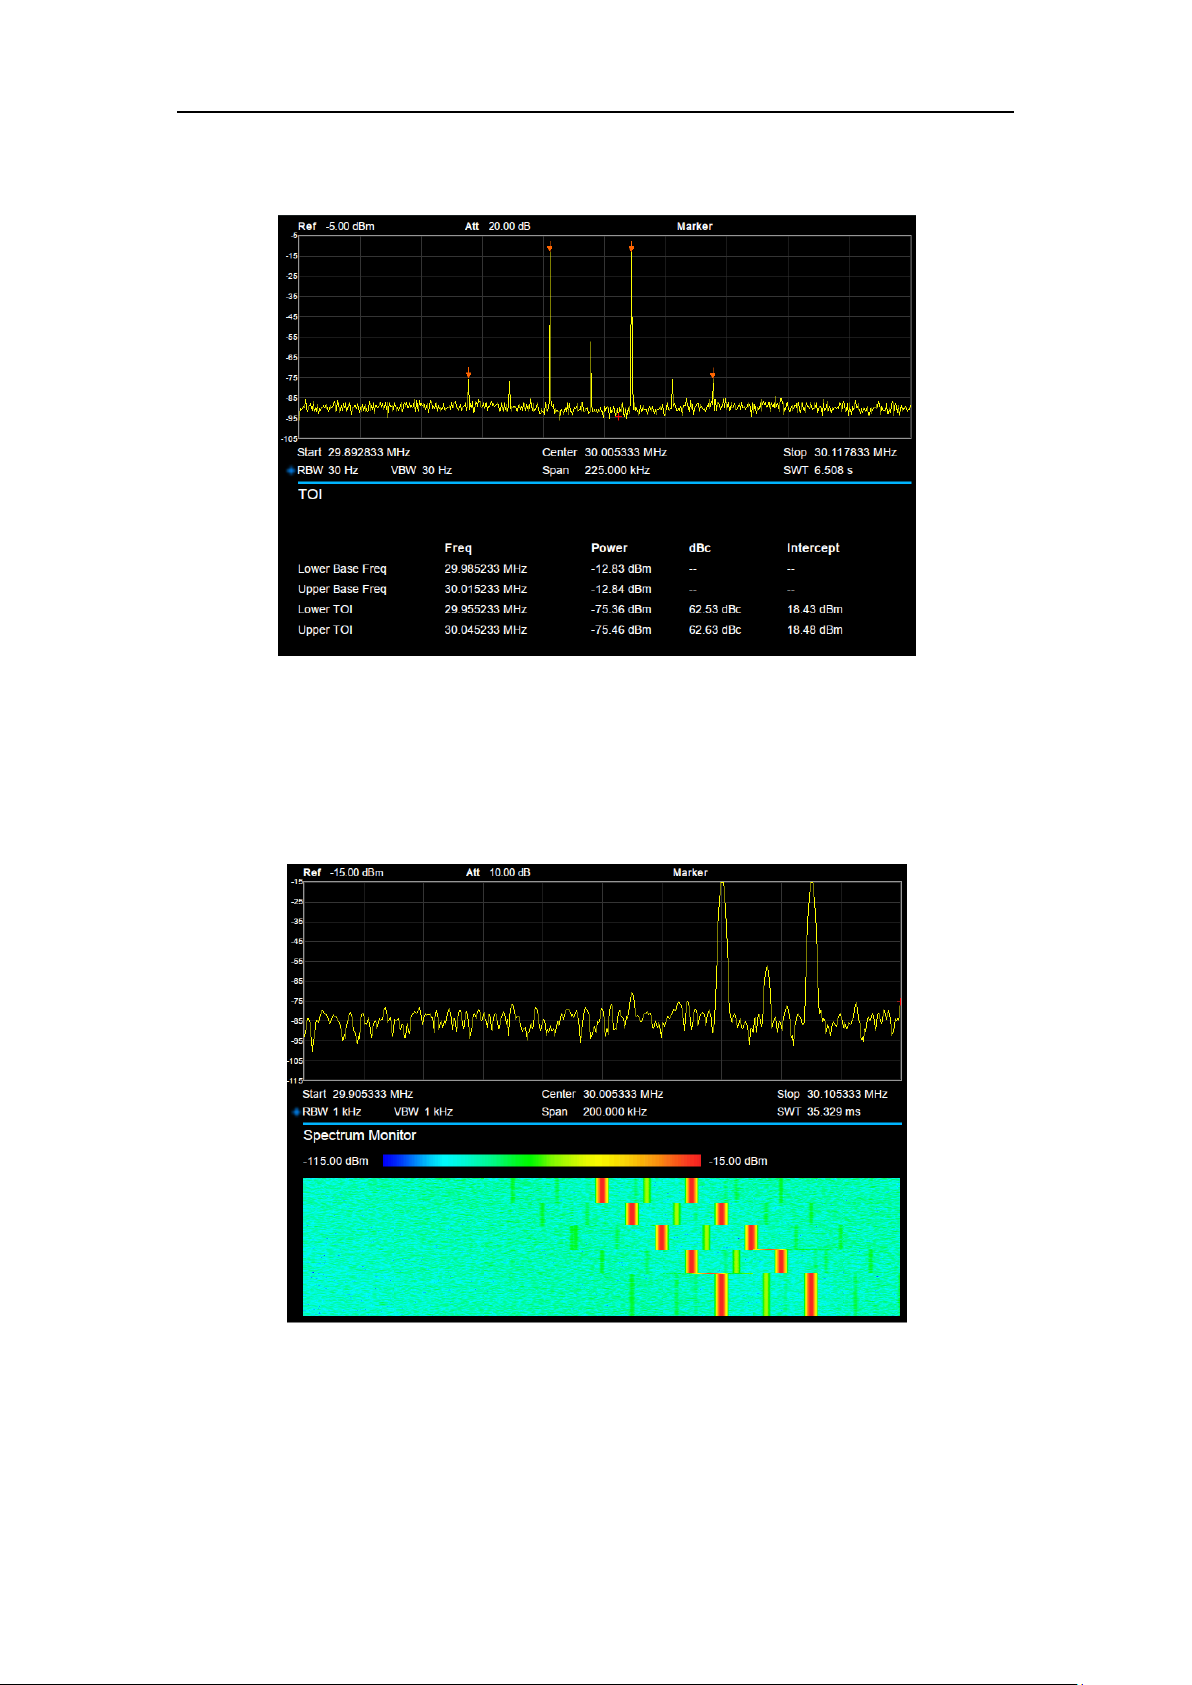
SIGLENT
2.4.2.5 TOI
Figure 2-14 TOI
TOI is an automatic measurement. There are no user controlled parameters.
2.4.2.6 Spectrum Monitor
Figure 2-15 Spectrum Monitor
Displays the power of spectrum of successive scans as a color map. Also called a waterfall
chart.
Spectrogram: Sets the meas state of spectrum monitor.
SVA1000X User Manual 56
Page 63

SIGLENT
2.5 System
2.5.1 System
Set the system parameters.
2.5.1.1 Language
The analyzer supports a multi-language menu, Chinese and English built-in help and popup
messages.
Press this key to select the desired display language.
2.5.1.2 Power On/Preset
1. Power On
Set the power on setting to Default, Last or one of user.
Def: Load the default settings, for more details please refer to Table 2-51.
Last: When Last is selected, instrument settings before the last power-off are recalled
automatically at power on.
User: If power on is set to user, the device will recall the specified configuration after
power on.
2. Preset
Set the preset type to Default, Last or one of User.
Def: When press Preset, load the default settings, for more details please refer to Table
2-51.
Last: When press Preset, load the last power-off settings.
User: When press Preset, load the specified configuration type.
3. User Config
Save the current instrument settings as user-defined setting into the internal non-volatile
memory.
4. Factory
When factory is selected, the device will recall the initial config.
5. Reset & Clear
When Reset & Clear is selected, the device will recall the initial config and all user data and
settings will be erased.
2.5.1.3 Interface Config
The analyzer supports communications through LAN, USB and the SIGLENT USB-GPIB
SVA1000X User Manual 57
Page 64
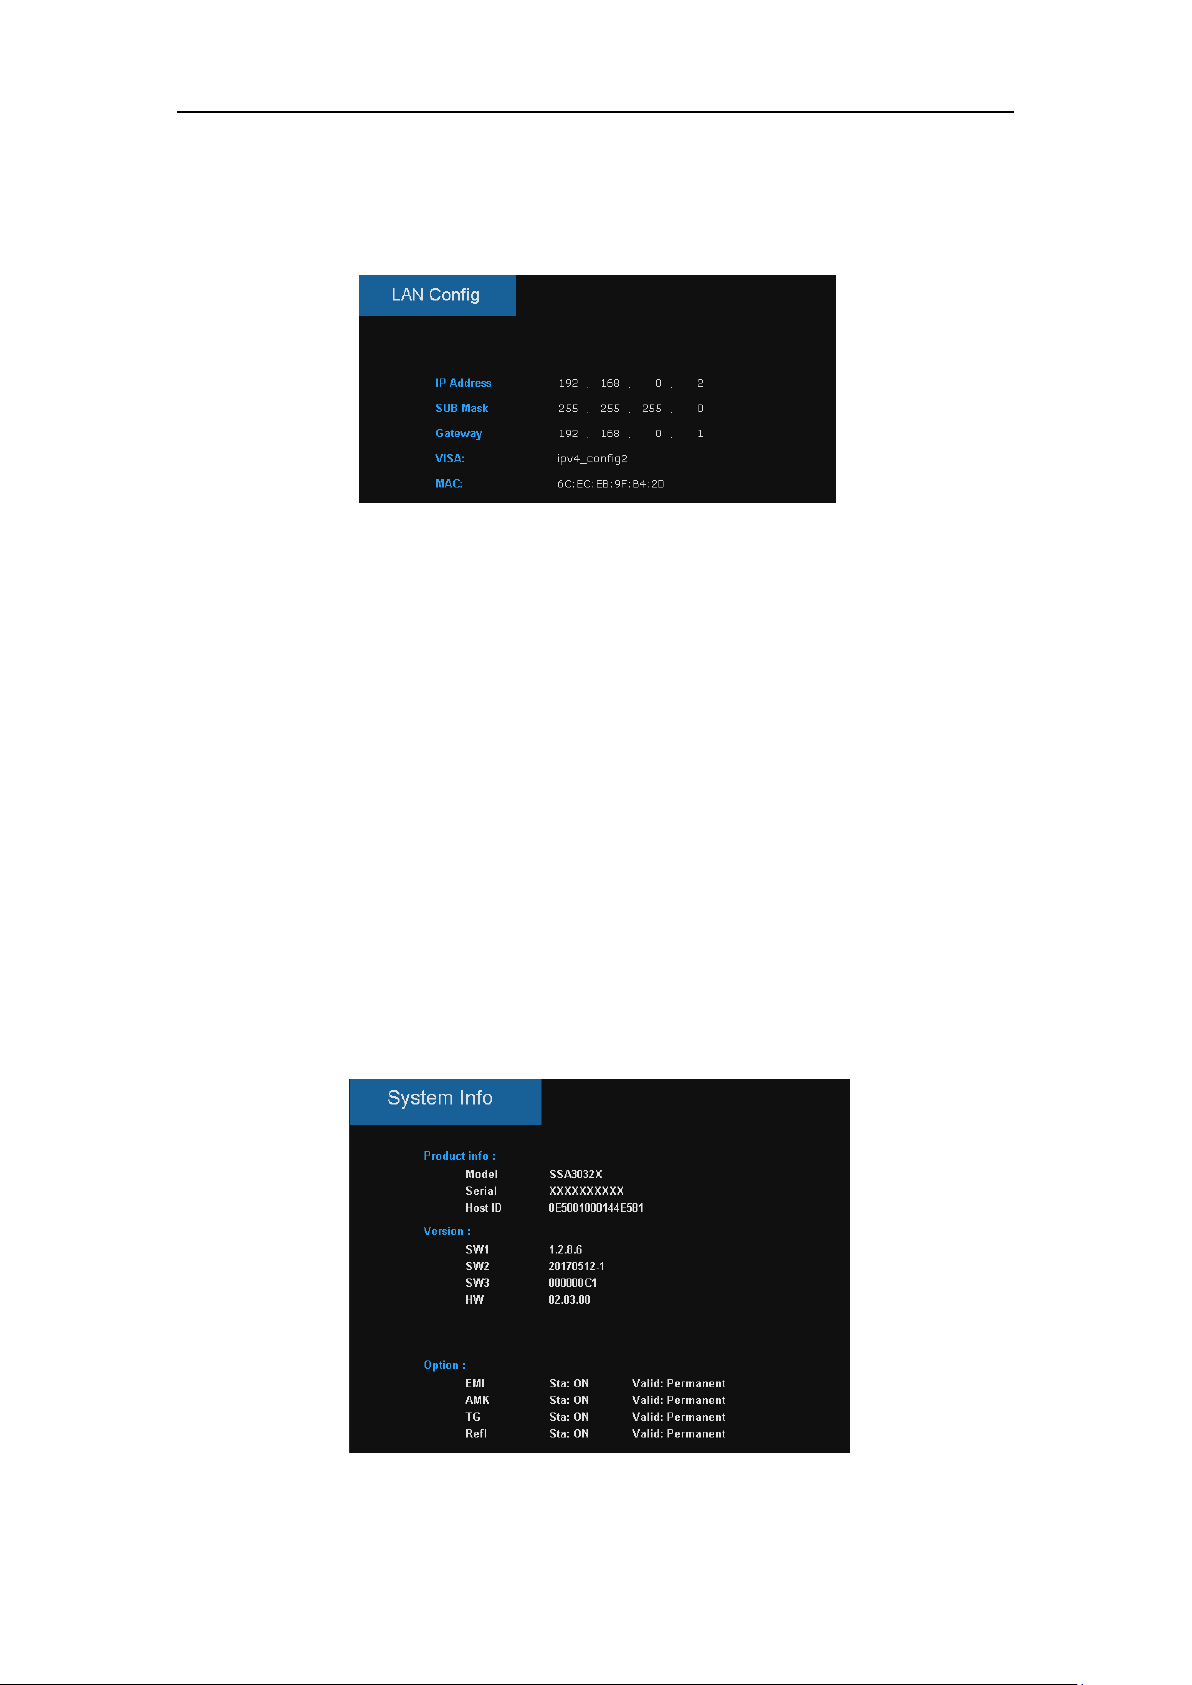
SIGLENT
adapter as standard remote computer control interfaces.
1. LAN
Config or reset related parameters of the LAN connection. As a default, the IP config is DHCP.
Figure 2-16 Static IP Config
2. GPIB
Config GPIB port number. The analyzer provides a digital interface for use with an optional
SIGLENT USB-GPIB module through the front USB port.
2.5.1.4 Calibration
Auto Cal
When Auto Cal is open, the analyzer will process self-calibration regularly. Within half an hour
after power-on, the device executes a self-calibration every 10 minutes.
2.5.1.5 System Info
1. System Info
Product Model, Serial and HOST ID
Software Version and Hardware Version
Option Information
2. Load Option
SVA1000X User Manual 58
Figure 2-17 System Info
Page 65
SIGLENT
Parameter
Explanation
Default
0 dBm
Range
REF Level + REF Offset – 10*Scale/Div ~ REF Level + ref
Offset
Knob Step
1 dB
Direction Key Step
Scale/Div
Load license, enter license here to load options.
3. Firmware Update
Update firmware from the proper files in storage. SVA firmware files have .ADS file extensions.
After the firmware has updated, the analyzer will be reboot.
2.5.1.6 Date and Time
Controls the display state and format for system data and time. The system time is displayed
in “ymd”, “mdy”, “dmy” format in the user interface.
2.5.1.7 Self Test
1. Screen Test
Tests whether the screen has any pixel defects by displaying five colors: White, Red, Green,
Blue and Black. Press any key to switch the screen color and exit the test.
2. Keyboard Test
Enter the keyboard test interface. Press the function keys at the front panel one-by-one and
observe whether the corresponding key is checked. If not, an error may have occurred in that
key. To exit the test, press “←“four times.
3. LCD Test
If the keys at the front panel are transparent, when the key is pressed, the corresponding
backlight will turn on when testing it.
2.5.2 Display
2.5.2.1 Display Line
Open or Close Display Line or move the location.
Table 2-39 Display Line
SVA1000X User Manual 59
Page 66
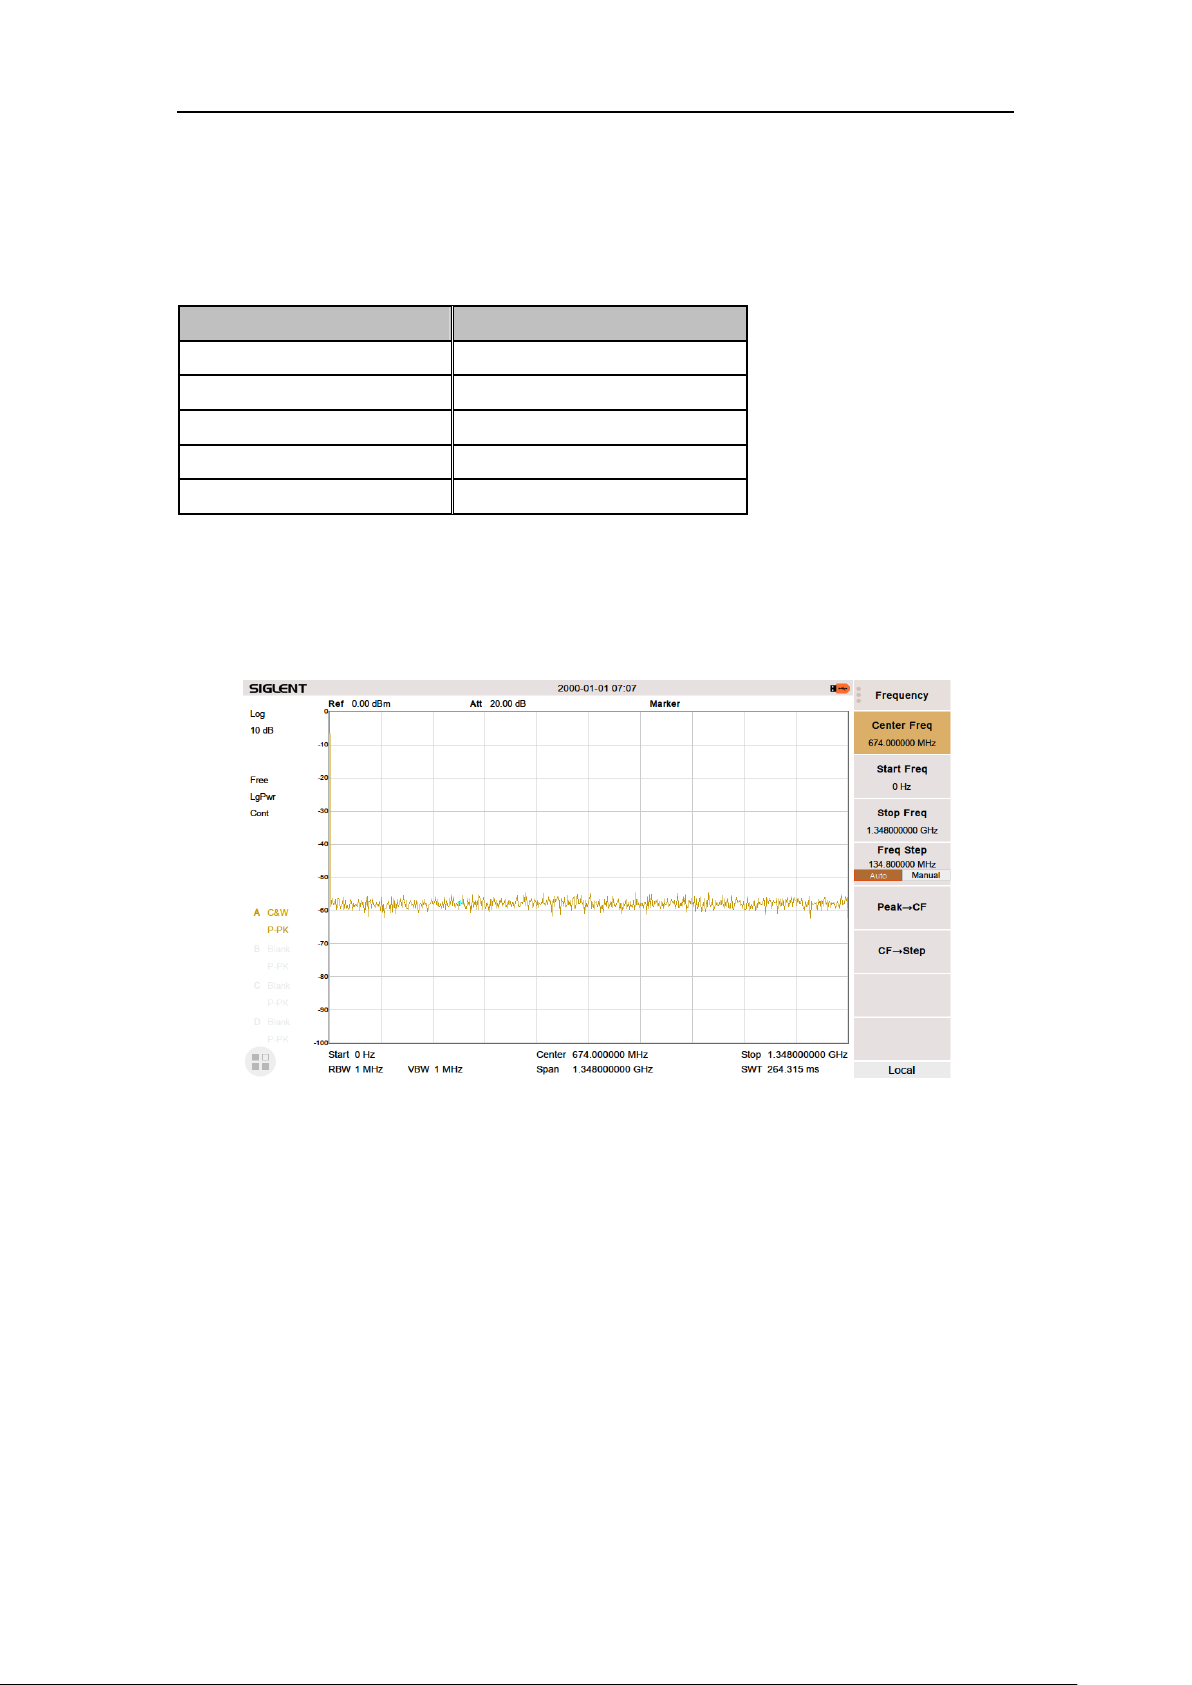
SIGLENT
Parameter
Explanation
Default
30%
Range
0 ~ 100%
Unit
None
Knob Step
1%
Direction Key Step
10%
2.5.2.2 Grid brightness
Controls the display grid brightness.
Table 2-40 Grid brightness
2.5.2.3 Screenshot
Toggle between normal and inverse color for images of the display saved to storage.
The color of traces is not inversed in inverse mode.
Figure 2-18 Inverse color Screenshot
2.5.3 File
2.5.3.1 Browser
Browser type including “Dir” and “File”,
Dir: When selected, use the knob or direction keys to change the highlighted directory.
File: When selected, use the knob or direction keys to switch among files or folders under the
current directory.
2.5.3.2 Open/Load
Open the selected folder or load selected file
SVA1000X User Manual 60
Page 67

SIGLENT
2.5.3.3 Back
Return to previous directory.
2.5.3.4 View Type
User can define the file type be browsed, included “All Type”, “STA”, “TRC”, “COR”, “CSV”,
“LIM”, “PIC” (JPG/BMP/PNG).
2.5.3.5 Save Type
User can define the file type be saved, included “STA”, “TRC”, “COR”, “CSV”, “LIM”, “JPG,”
“BMP”, “PNG”.
1. STA(Status)
STA files can be used to save and recall the instrument configuration. They are saved in ASCII
format, which can be read by humans.
2. TRC(Trace)
TRC files store the active (visible) trace data and scaling factors that were in place when the
data was saved. They are saved in ASCII format, which can be read by humans.
NOTE: When you first recall trace files, the instrument will adjust the display parameters
(horizontal and vertical scaling, for example) to match the settings used during data collection.
The trace data will not change, even if you adjust the parameters.
3. COR(Correction)
COR files store the data used to mathematically adjust the displayed input signal based on
external factors (Cable loss, Amplifier/Antenna gain, etc.). They are saved in ASCII format,
which can be read by humans.
4. CSV(Comma-Separated Variable)
CSV files store instrument configuration (scaling, units, etc.) and raw data (amplitude and
frequency values) in ASCII format, commonly viewed in spreadsheet programs like Microsoft®
Excel®. This file type can be read by humans
5. LIM(limit)
LIM files store the line or point data used to configure and display lines used for visual
indication of a user-defined limit. They are saved in ASCII format, which can be read by
humans.
6. BMP(Bitmap)/JPG(JPEG)/PNG
Picture files capture the display of the instrument (screenshot) as an image file. All of the
details of the display are captured exactly. What you see on the display is in the file. These are
SVA1000X User Manual 61
Page 68

SIGLENT
readable using image programs like Microsoft® Paint®.
2.5.3.6 Save
Save file in current directory, the file type is set in ‘Save Type’.
If there is an external memory, it will be saved to the external memory first.
Also used to set the save type of the Save shortcut, which can be used to quickly save the
screenshot
2.5.3.7 Create Folder
Create a new folder in current directory.
2.5.3.8 Delete
Delete selected file or directory.
2.5.3.9 Rename
Rename the selected file or folder.
2.5.3.10 Operate
1. Browser
Browse files or directories; use the knob or direction keys to select the corresponding item.
2. Open/Load
Open the selected folder or directory, Load the selected file.
3. Back
Return to previous directory
4. Cut
Cut the Selected file or folder, and delete the primary one after paste.
5. Copy
Copy the Selected file or folder for paste.
6. Paste
Paste the file cut or copied before into the current.
7. Delete
Delete selected file or directory.
SVA1000X User Manual 62
Page 69
SIGLENT
Parameter
Explanation
Default
100 MHz
Range
Full Span
Knob Step
1%
Direction Key Step
1%
2.6 Mode Setup
The analyzer offers a variety of optional operating modes that can be purchased separately.
Once activated, you can select the operating mode via the Mode key enables:
Spectrum Analyzer
Modulation Analysis (AMA/DMA)
Vector Network Analysis (VNA)(Only for SVA models)
Distance-To-Fault (DTF)( Only for SVA models)
Front panel keys may be different in different modes.
Different modes have their own Preset
2.6.1 Spectrum Analyzer
Press Mode, select ‘Spectrum Analyzer’ to enter spectrum analysis mode.
The ‘Spectrum Analysis’ mode is the default mode of the machine. In this mode, the Mode
backlight does not light up; in other modes, the Mode backlight will light up.
2.6.2 Digital Modulation Analysis
This mode (DMA) enables modulation analysis of incoming signals. To start, press Mode, then
select "Modulation Analysis" mode. The instrument will enter into ASK/FSK/AM/FM analysis
sub-mode. ASK modulation analysis and FSK modulation analysis can be performed by
selecting either "ASK" or "FSK" respectively. Pressing Meas, can also select "ASK" and
"FSK".
2.6.2.1 Carrier Frequency
After entering into "ASK" or "FSK" modulation analysis, set the modulated carrier frequency.
Press Frequency can set the relative parameters
Table 2-41 Grid brightness
2.6.2.2 Symbol Rate
Sets the symbol rate of the signal to be analyzed. Press Meas Setup, then select "Symbol
Rate", you can input the symbol rate and change the symbol rate by the knob.
SVA1000X User Manual 63
Page 70
SIGLENT
Parameter
Explanation
Default
10 ksps
Range
1 ksps ~ 100 ksps
Unit
Msps, ksps, sps
Transmitter Filter
Measure Filter
Reference Filter
Sqrt Nyquist
Sqrt Nyquist
Nyquist
Nyquist
Off
Nyquist
Gauss
Off
Gauss
Parameter
Explanation
Default
0.5
Range
0 ~ 1
Unit
0.01
Table 2-42 Symbol Rate
2.6.2.3 Filter Setup
After entering into the "Filter Setup" sub-menu, you can choose the relative parameters of
filters.
1. Measure Filter
Sqrt Nyquist
Nyquist
Gauss
Off
2. Reference Filter
Sqrt Nyquist
Nyquist
Gauss
Off
Note: The rule of common filter type selected
3. Filter Alpha/BT
For Sqrt Nyquist and Nyquist filter settings, you can set the alpha parameter. It can be set
the same as the transmitter.
For a Gauss filter, use the BT parameter. It can be set the same as the transmitter.
Table 2-43 Filter Parameter
4. Filter Length
Set the symbols number of the filter selected. It can be set the same as the transmitter.
SVA1000X User Manual 64
Page 71
SIGLENT
Parameter
Explanation
Default
6
Range
2 ~ 25
Unit
1
Parameter
Explanation
Default
100
Range
20 ~ 1500
Unit
1
Parameter
Explanation
Default
10
Range
1 ~ 100
Unit
1
Table 2-44 Filter Length
2.6.2.4 Measure Length
Set the number of symbols which will be used in calculating the measurement. As the length is
longer, the range for statistics is bigger, and the measure time is longer.
Table 2-45 Measure Length
2.6.2.5 Avg Number
Open and close the average option for the measurement result. It can set the average number.
When the Avg Number is set to off, the column title "Average" in numerical results view will be
changed to "Current". The "Average" measurement result will be stable if the average number
is set to larger values.
Table 2-46 Avg Number
2.6.2.6 View
After entering into the "View" sub-menu, you can select three view modes.
SVA1000X User Manual 65
Page 72
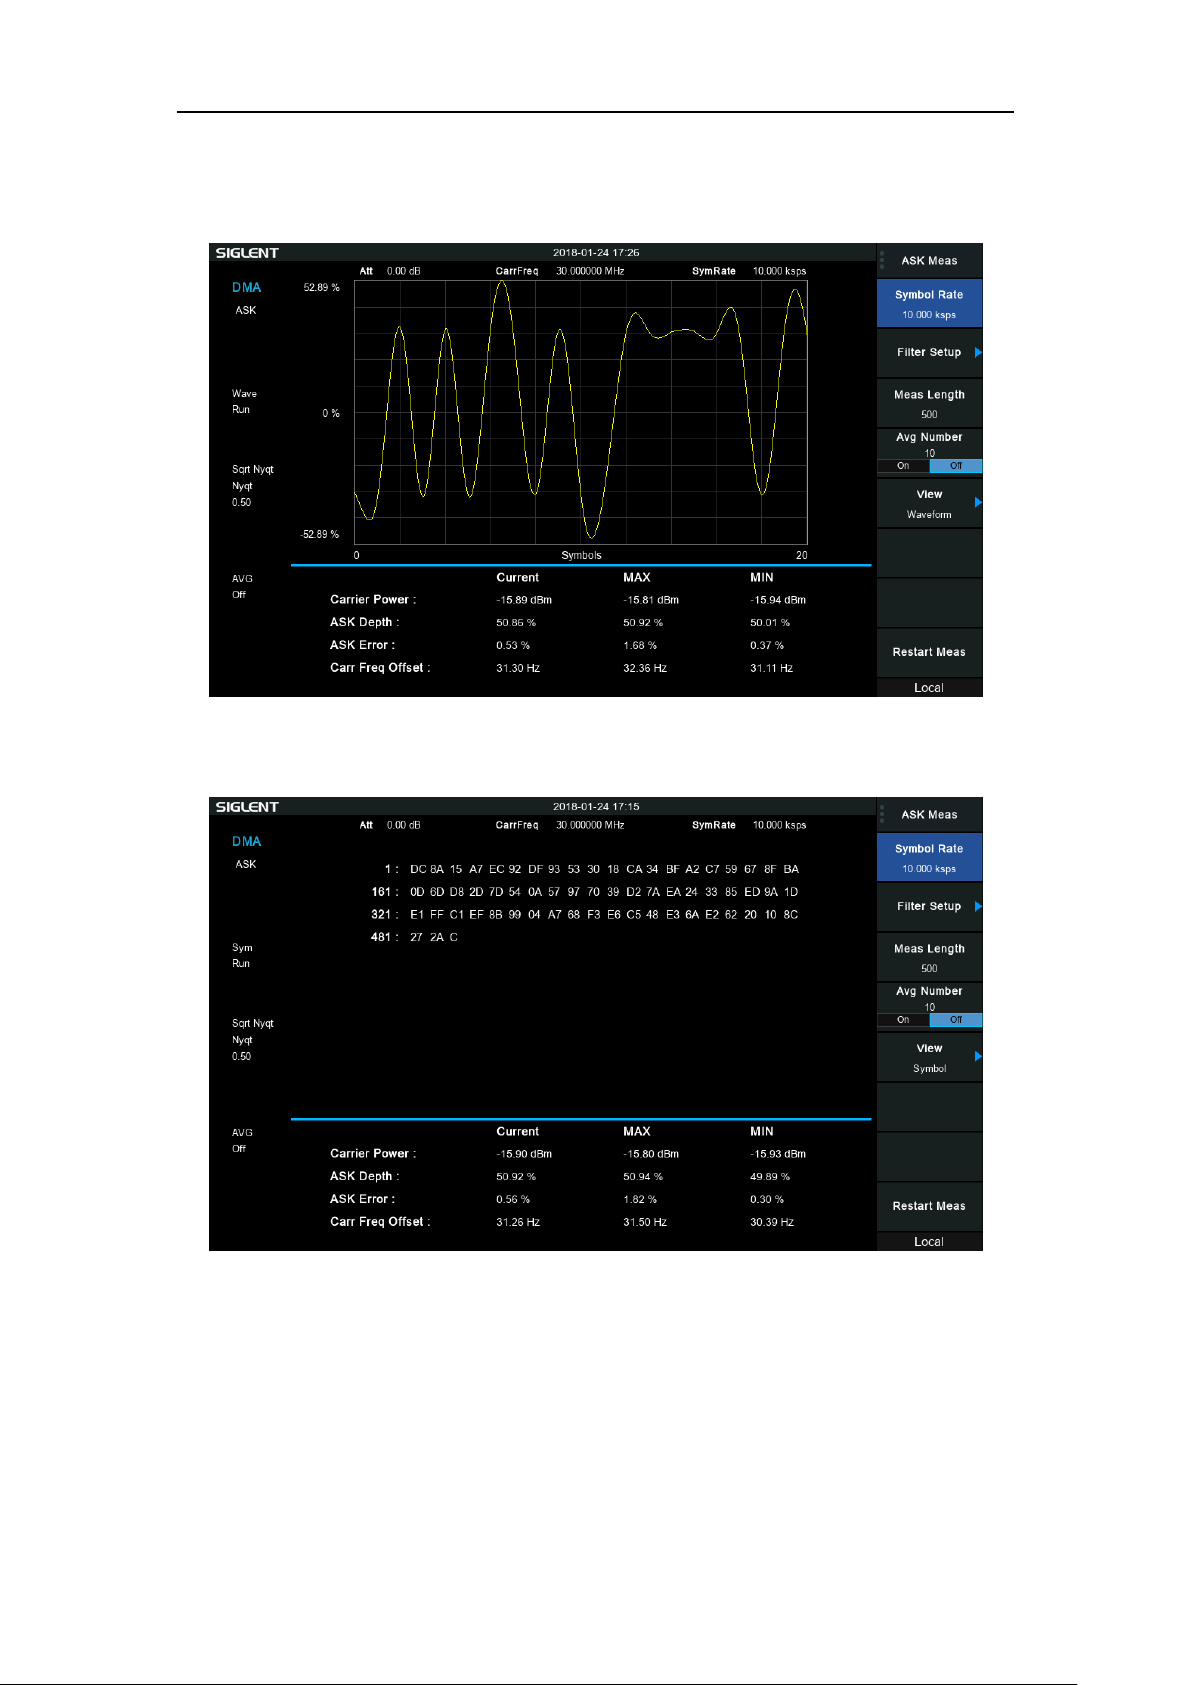
SIGLENT
Waveform: Display the demodulation waveform.
Figure 2-19 Waveform View
Symbol: Display the demodulation digital symbols. ( binary or hex)
Figure 2-20 Symbol View
SVA1000X User Manual 66
Page 73
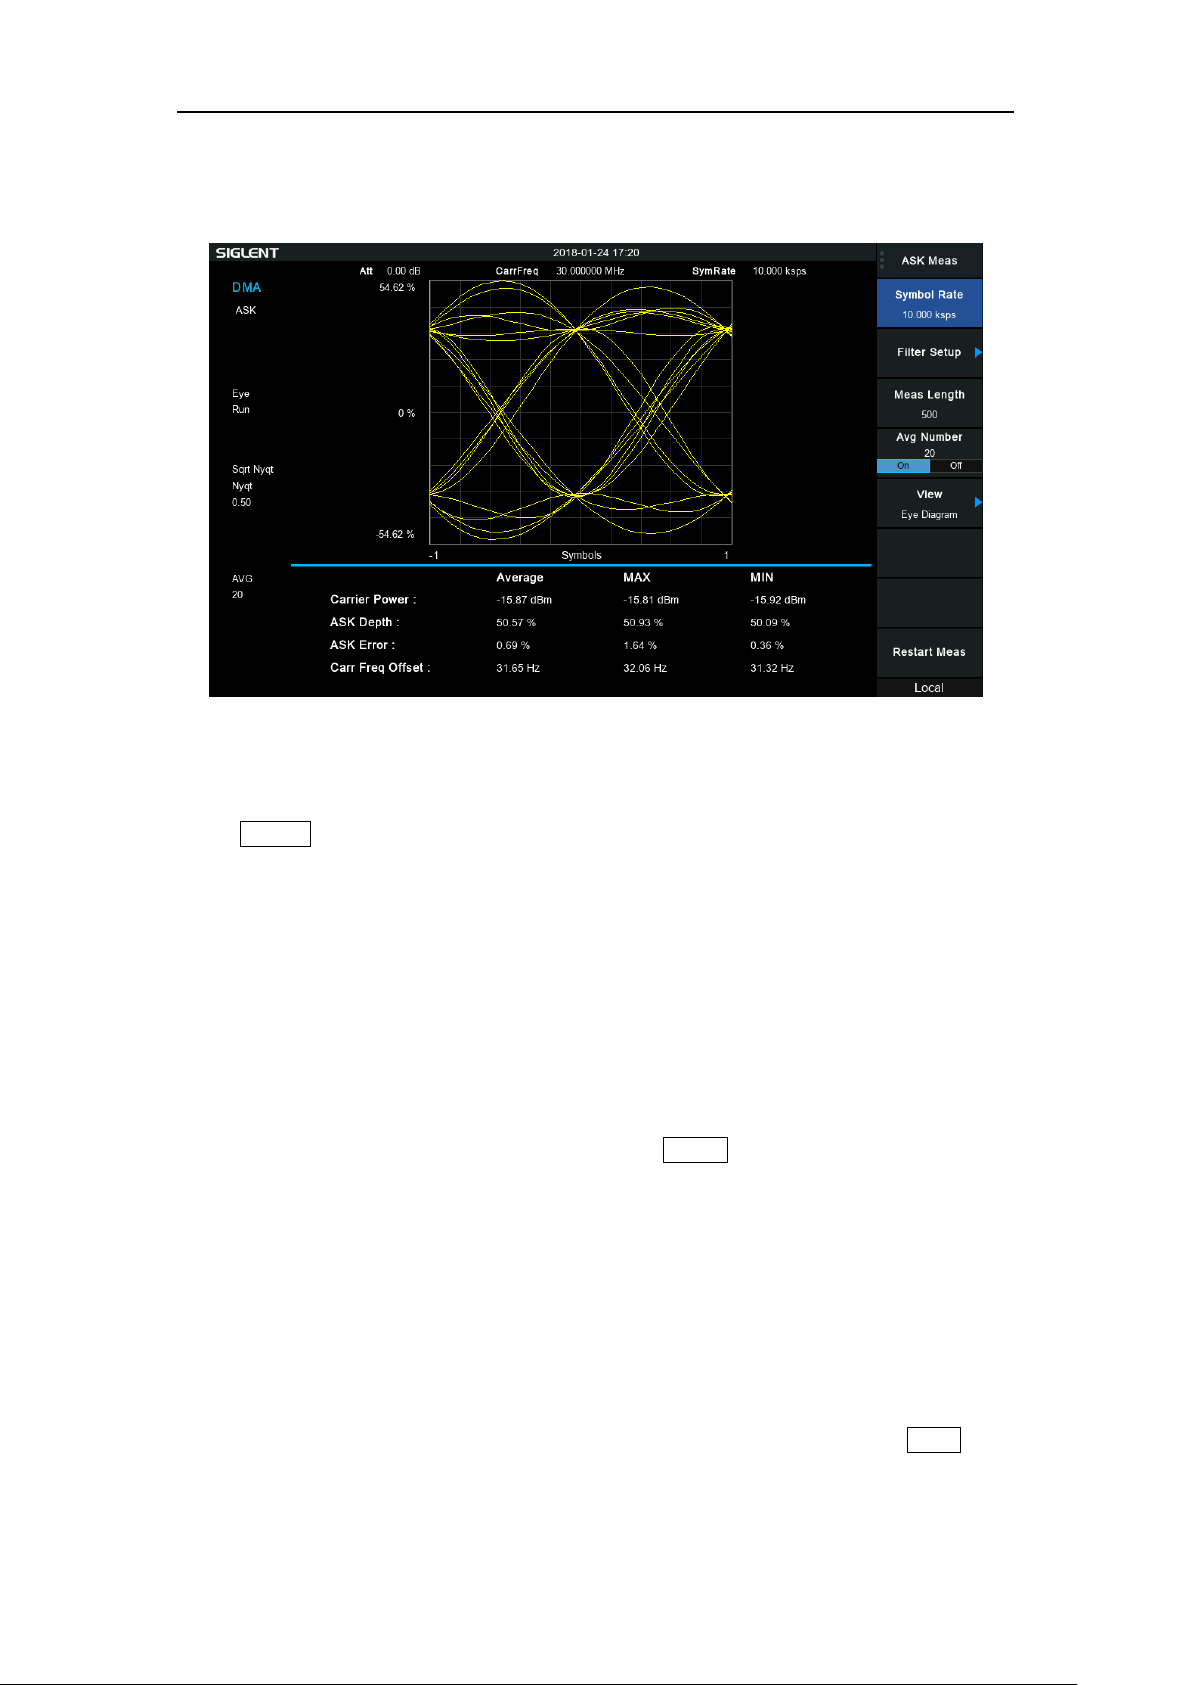
Eye: Display eye diagram.
SIGLENT
Figure 2-21 Eye View
2.6.2.7 Trigger
Press Trigger to open the menu. The analyzer will begin a sweep only with the selected
trigger conditions are met. A trigger event is defined as the point at which your trigger source
signal meets the specified trigger level.
Free Run: New sweep starts as soon as possible after the current sweep ends.
RF Trigger: Activates the trigger condition that starts the next sweep if the detected RF
envelops voltage rises to a level set by the RF trigger level.
External: The trigger even is the rising or falling edge of the external trigger signal.
2.6.2.8 Sweep
Select "single" or "continue" type for sweep. Press Sweep into the menu. When "single"
sweep type is selected, it will start a new sweep if meets the trigger even, after press the menu
button "single".
Single Sweep
Continue Sweep
2.6.3 Analog Modulation Analysis
This mode (AMA) enables modulation analysis of incoming signals. To start, press Mode, then
select "Modulation Analysis" mode. The instrument will enter into ASK/FSK/AM/FM analysis
sub-mode. AM modulation analysis and FM modulation analysis can be performed by
SVA1000X User Manual 67
Page 74
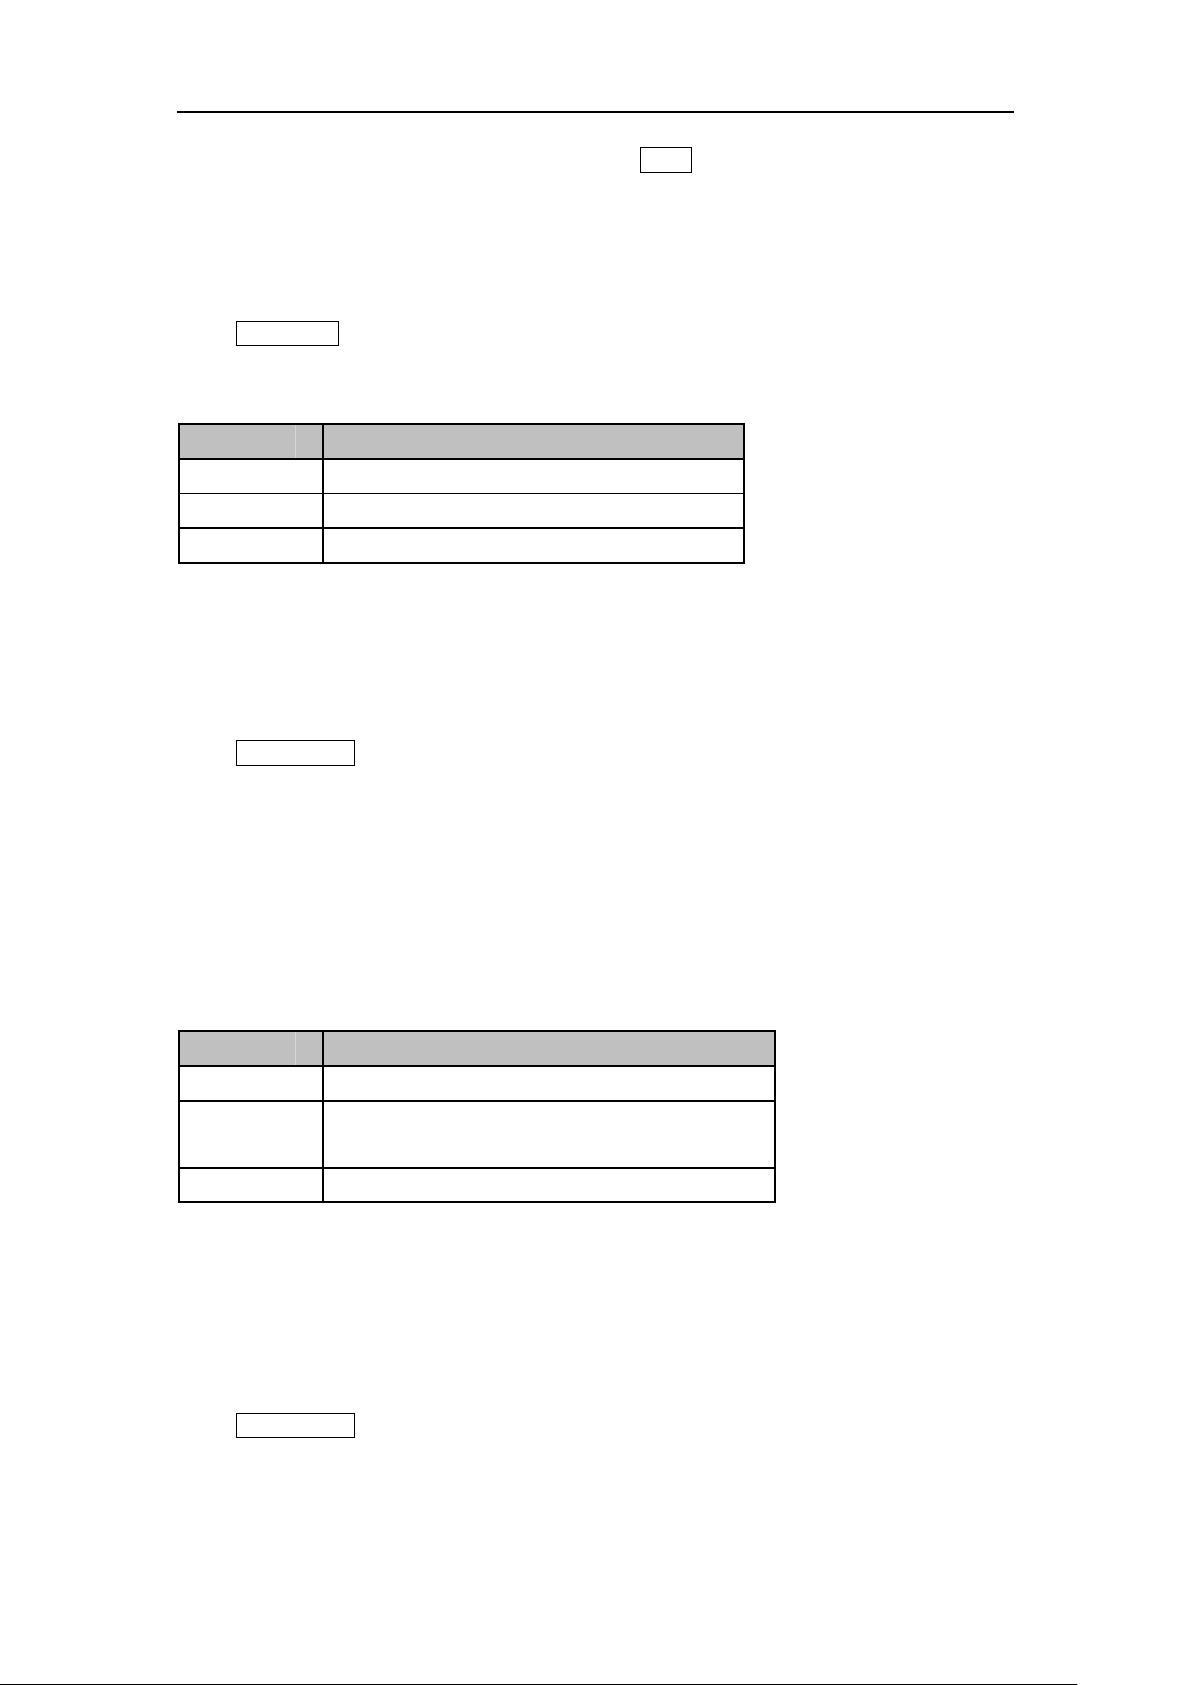
SIGLENT
Parameter
Explanation
Default
100 MHz
Range
Full Span
Unit
GHz、MHz、kHz、Hz
Parameter
Explanation
Default
1.2 MHz
Range
1.2 MHz, 960 kHz, 600 kHz, 480 kHz, 300 kHz,
240 kHz, 120 kHz, 96 kHz, 60 kHz
Unit
MHz, kHz
selecting either "AM" or "FM" respectively. Pressing Meas, can also select "AM" and "FM".
2.6.3.1 Carrier Frequency
After entering into "AM" or "FM" modulation analysis, set the modulated carrier frequency.
Press Frequency can set the relative parameters
Table 2-47 Carrier Frequency
2.6.3.2 IFBW
After entering into the mode "AM" modulation analysis or "FM" modulation analysis, set the
intermediate frequency bandwidth (IFBW).
Press Meas Setup , you can set the "IFBW" again.
It specifies the IFBW of the signal to be analyzed. The measurement accuracy will be impacted
if this value isn't set precisely. The IFBW should be as narrow as possible to improve the S/N
ratio.
For "AM" modulation analysis, the IFBW should be larger than twice the modulation frequency.
For "FM" modulation analysis, the IFBW should be larger than twice the sum of the deviation
frequency and the modulation frequency.
Table 2-48 IFBW
2.6.3.3 EqLPF
After entering into the mode "AM" modulation analysis or "FM" modulation analysis, set the
equivalent low pass filter (EqLFP).
Press Meas Setup , you can set the "EqLFP" again.
It specifies the EqLPF bandwidth of the signal to be analyzed. The measurement accuracy will
be impacted if this value isn't set precisely. The EqLPF is an additional low pass filter. It can
conveniently measure the lower modulation frequency signal. The EqLPF bandwidth should be
SVA1000X User Manual 68
Page 75
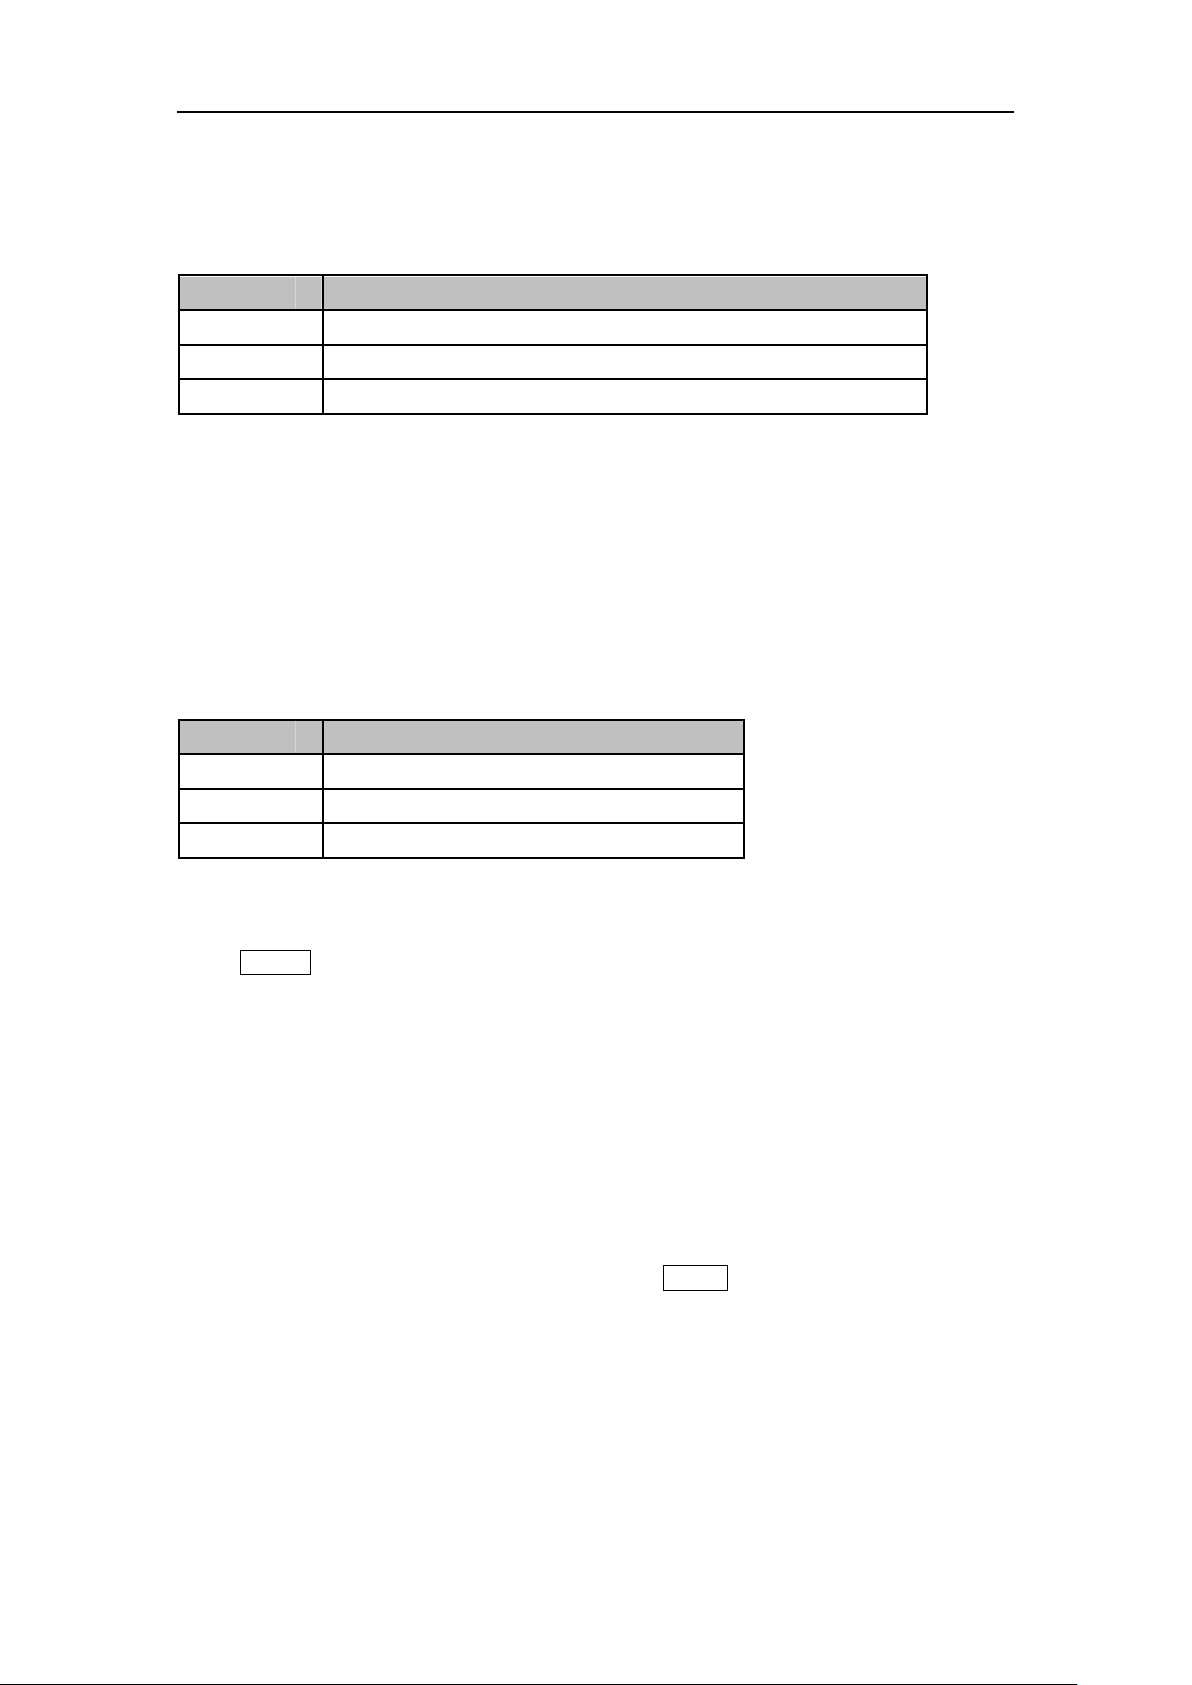
SIGLENT
Parameter
Explanation
Default
IFBW/6
Range
Off, IFBW/6, IFBW/20, IFBW/60, IFBW/200, IFBW/600, IFBW/2000
Unit
kHz、Hz
Parameter
Explanation
Default
10
Range
1 ~ 100
Unit
1
as narrow as possible to improve the S/N ratio, but also need to be larger than the modulation
frequency.
Table 2-49 EqLPF
2.6.3.4 Avg Number
Open and close the average option for the measurement result. It can set the average number.
When the Avg Number is set to off, the column title "Average" in numerical results view will be
changed to "Current". The "Average" measurement result will be stable if the average number
is set to larger values.
Table 2-50 Avg Number
2.6.3.5 Trigger
Press Trigger to open the menu. The analyzer will begin a sweep only with the selected
trigger conditions are met. A trigger event is defined as the point at which your trigger source
signal meets the specified trigger level.
Free Run: New sweep starts as soon as possible after the current sweep ends.
RF Trigger: Activates the trigger condition that starts the next sweep if the detected RF
envelops voltage rises to a level set by the RF trigger level.
External: The trigger even is the rising or falling edge of the external trigger signal.
2.6.3.6 Sweep
Select "single" or "continue" type for sweep. Press Sweep into the menu. When "single"
sweep type is selected, it will start a new sweep if meets the trigger even, after press the menu
button "single".
Single Sweep
Continue Sweep
SVA1000X User Manual 69
Page 76
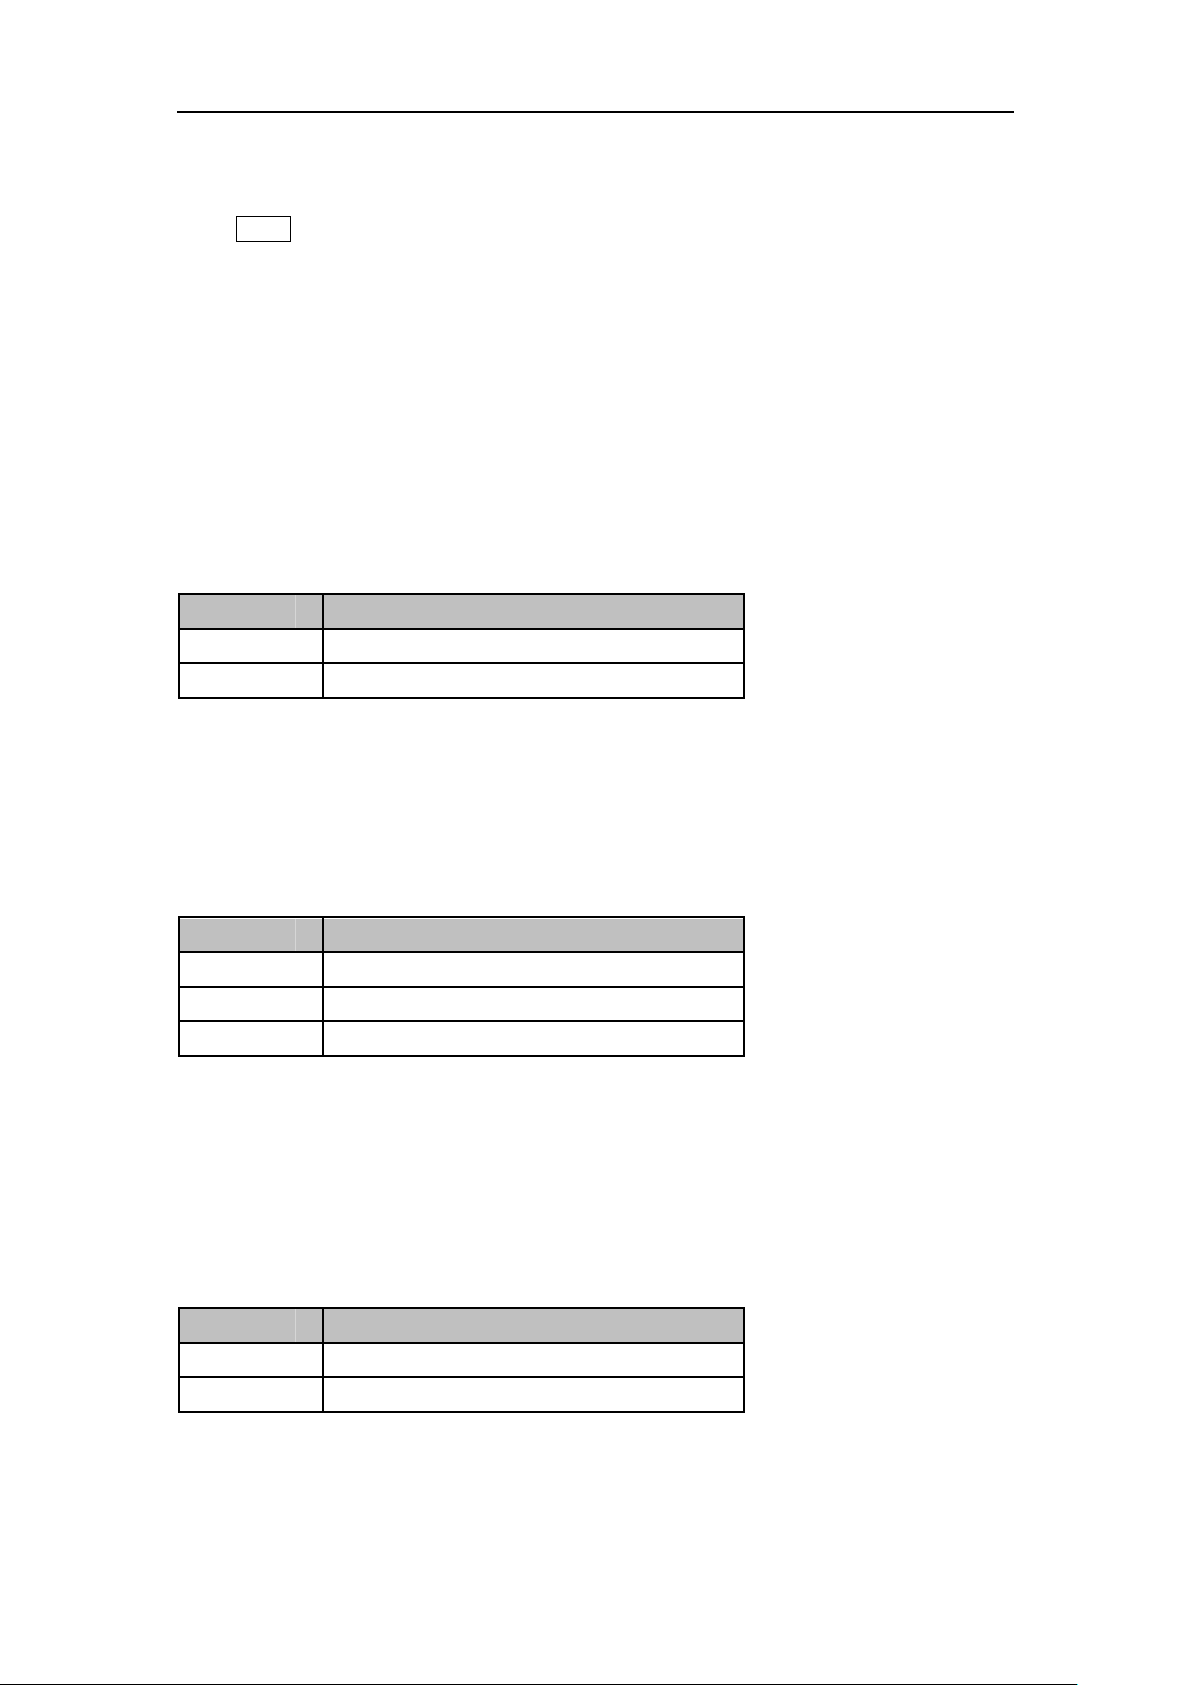
SIGLENT
Parameter
Conversion relationship
RL
VSWR
Parameter
Explanation
Default
0.00 m
Range
0.00 m ~ (Stop Distance – 0.2)m
Unit
m, feet
Parameter
Explanation
Default
34.00 m
Unit
m, feet
2.6.4 Distance-to-fault
Press Mode, then select "Distance-to-fault" to enter Distance-to-fault mode.
2.6.4.1 Disp Mode
Entering "Disp Mode" sub-menu, then choose from the following three types of display. This
value is also displayed in the status bar on the left side of the screen.
Return Loss
VSWR
Reflection Coefficient
All three forms reflect the matching condition of the entire cable.
Table 2-47 Return Loss (RL), VSWR, and Reflection Coefficient ()
2.6.4.2 Start Distance
Set the starting distance for DTF.
The range of this distance is limited by the minimum resolution.
Table 2-48 Start Distance
2.6.4.1 Stop Distance
Set the stopping distance for DTF.
The range of this distance is limited by the velocity factor and is proportional to the velocity
factor. When the velocity factor is 1, the length that can be measured is the maximum.
Table 2-49 Stop Distance
Selecting the appropriate frequency span (= start freq – stop freq) is not as obvious as it may
seem. The resolution and maximum distance range are dependent upon the span, the number
of frequency data points and the velocity factor of the cable. Therefore, the frequency span
SVA1000X User Manual 70
Page 77
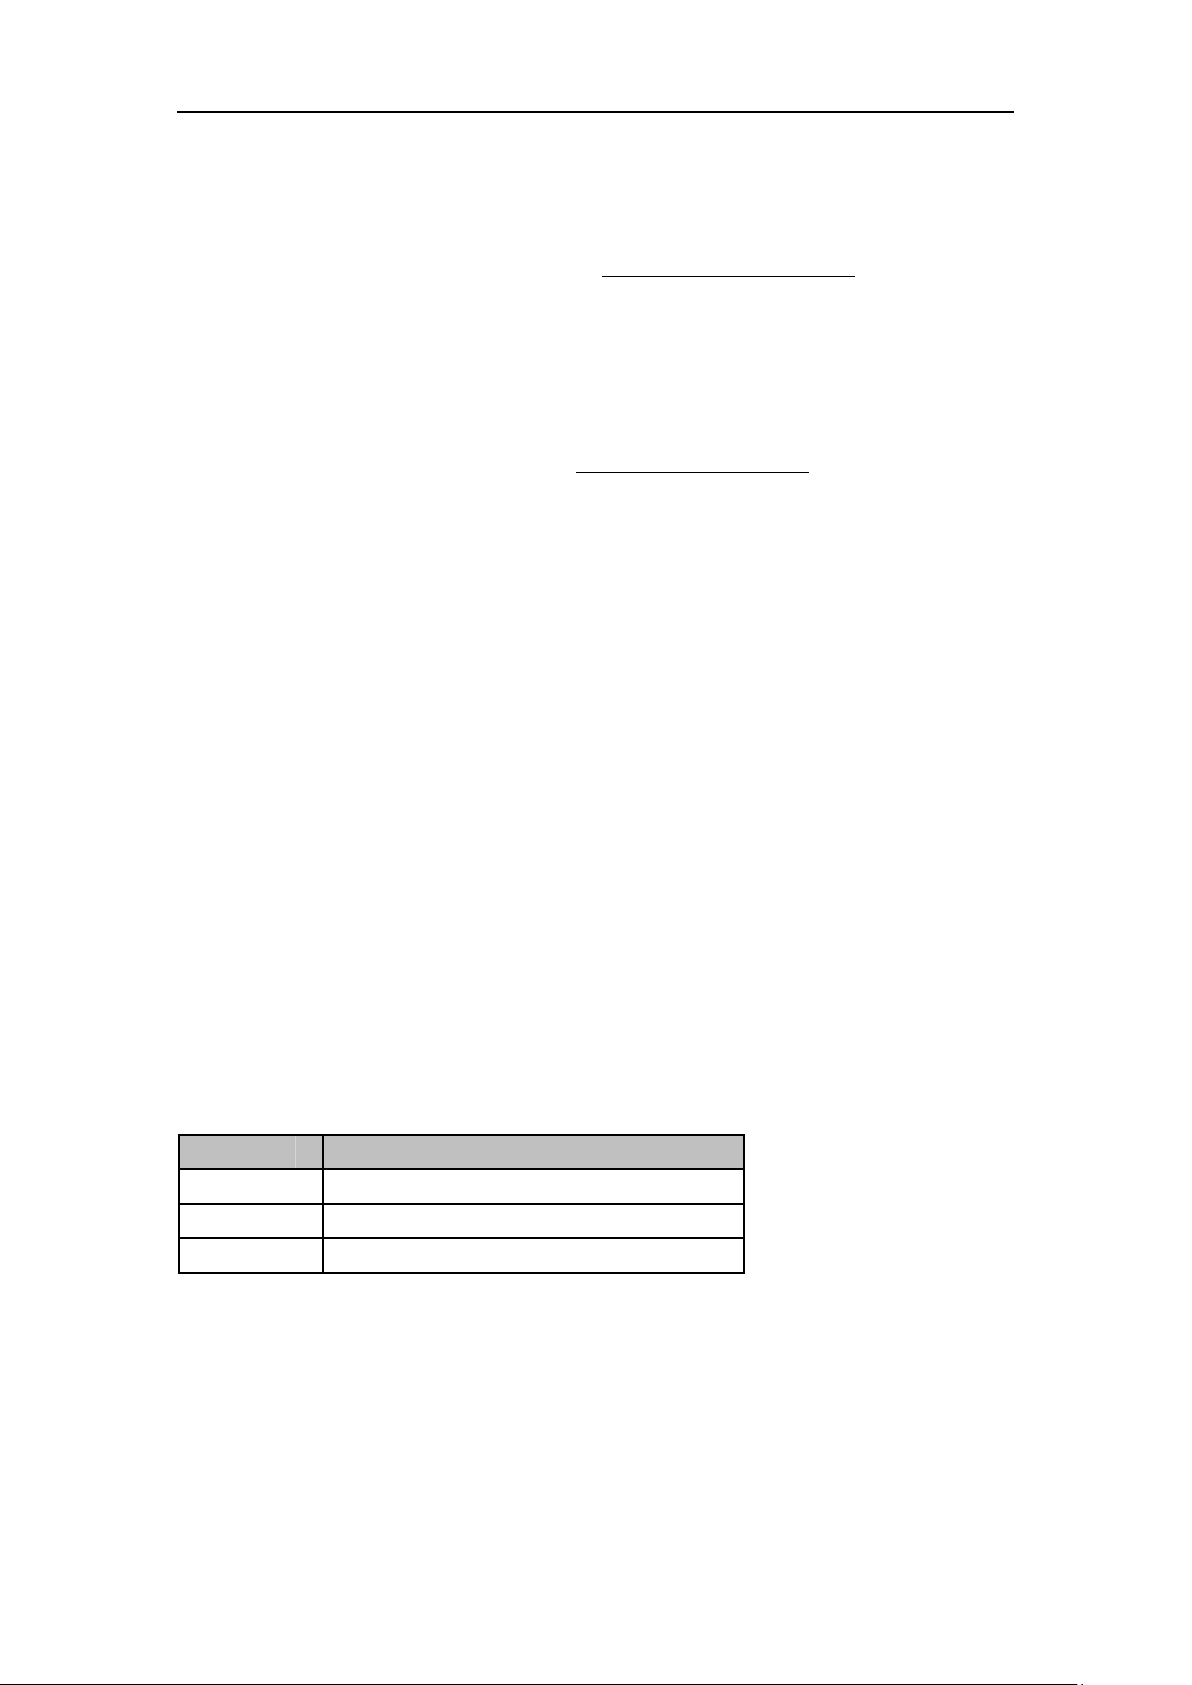
must be chosen carefully.
Parameter
Explanation
Default
66.00%
Range
0.00% ~ 100.00%
Unit
1
There is a constraint that limits the frequency range:
SIGLENT
The wider the span is, the smaller the maximum distance that can be measured. In another
words, long distance measurements require small span settings.
Meanwhile, there is also a relationship between resolution and the span.
The wider the span is, the smaller the resolution. Wider frequency sweeps improve the
resolution of DTF measurements.
2.6.4.2 Unit
Set the display units for the fault point distance, including the following two units. This value is
also displayed in the status bar on the left side of the screen.
Meter
Feet
The default unit is "Meter".
2.6.4.3 Velocity Factor
Set the velocity factor of the cable to be measured with respect to the speed of light in a
vacuum. Make sure that the velocity factor of the cable to be measured matches the actual
value. Otherwise, the position of the positioning point obtained from the measurement does
not meet the actual requirements.
This value is also displayed in the status bar on the left side of the screen.
Table 2-50 Velocity Factor
2.6.4.4 Cable Atten
Set the attenuation factor of the cable-under-test. It is used to compensate the amplitude of
peaks in different positions. The DTF calculates the peaks by the final receiving data which
has been attenuated by the cable, thus the amplitude of peaks cannot show exactly where the
mismatch position is. So the cable atten is used to compensate by length.
SVA1000X User Manual 71
Page 78
SIGLENT
Parameter
Explanation
Default
0.00 dB/m
Range
0.00 dB/m ~ 5.00 dB/m
Unit
dB/m
Win-type
Expression
Main lobe width
Rectangular
Hamming
Table 2-51 Cable Atten
2.6.4.5 Window
Set the window function used in DTF.
The use of a non-rectangular window function can improve the side lobe effect of the analysis.
The vertical axis is more accurate, but the horizontal axis resolution is reduced.
In the sub-menu, the following three settings can be selected.
Off
Rectangular
Hamming
The default state is "Off"; this value is also displayed in the status bar on the left side of the
screen.
Table 2-52 Window function properties
2.6.4.6 Calibration
Set calibration related items. There are three calibration states, factory calibration, user
calibration, and no calibration. The user calibration status is displayed in green font at the top
left corner of the screen. Enter the sub-menu; you can make the appropriate choice.
1. Calibration
Calibrating with the specified mechanical calibration requires three loads: open, short, and
match. Calibration data is saved as user calibration data.
2. Ecal
Use the optional SIGLENT electronic calibration unit for calibration. Calibration data is saved
as user calibration data.
3. Cal kit
Specifies the calibration kit used for mechanical calibration.
4. Clear
Clear user calibration data.
2.6.5 Vector Network Analysis
Press Mode, then select "Vector Network Analysis" to enter VNA mode.
SVA1000X User Manual 72
Page 79

SIGLENT
2.6.5.1 Meas
Select S11 or S21 as the current measurement item. This value is also displayed in the status
bar on the left side of the screen.
2.6.5.2 Format
Set the display type of measurement result, enter “Format” submenu, and select the
corresponding display type. This value is also displayed in the status bar on the left side of the
screen.
1. Log Mag
The trace represents the logarithmic magnitude of the measurement result, unit: dB.
2. Phase
The trace represents the phase of the measurement result, range:
3. Group Delay
The trace represents the transmission delay of the signal through the DUT, units: Seconds (s).
4. Smith
The Smith chart format is used to display impedances based on the reflection measurement
data of the DUT. In this format, traces are plotted at the same spots as in the polar format. The
Smith chart format allows users to select one of the following five data groups for displaying
the marker response values.
Linear magnitude and phase (°)
Log magnitude and phase (°)
Real and imaginary parts
Resistance (ohm), Reactance (ohm), and inductance (H) or capacitance (F)
Conductance (S), susceptance (S), and capacitance (F) or inductance (H)
5. Polar
In the polar format, traces are drawn by expressing the magnitude as a displacement from the
origin (linear) and phase in an angle counterclockwise from the positive X-axis. This data
format does not have a stimulus axis, so frequencies must be read by using the marker. The
polar format allows users to select one of the following three data groups for displaying the
marker response values.
Linear magnitude and phase (°)
Log magnitude and phase (°)
Real and imaginary parts
6. Lin Mag
The trace represents the linear magnitude of the measurement result, units: 1.
7. SWR
, units: degrees.
The trace represents:
ρ
, where ρ is the reflection coefficient, units: 1.
ρ
SVA1000X User Manual 73
Page 80

SIGLENT
2.6.5.3 Ref Level
Set the reference level to indicate the minimum value that the current grid can display. This
value is also displayed in the status bar on the left side of the screen.
2.6.5.4 Scale
Set the vertical scale of each grid to adjust the range of amplitude that can currently be
displayed. This value is also displayed in the status bar on the left side of the screen.
2.6.5.5 Calibration
Set calibration related items. This function is only available when the measurement item is S11.
There are three calibration states, factory calibration, user calibration, and no calibration. The
user calibration status is displayed in green font at the top left corner of the screen. Enter the
sub-menu; you can make the appropriate choice.
1. 1-Port Cal
Calibrating with the specified mechanical calibration requires three loads: open, short, and
match. Calibration data is saved as user calibration data.
2. Response (Through)
When operating, connect the port 1 and port 2 of the analyzer with an optional Through
Adapter. The normalization operation moves the measurement reference plane to both ends of
the Through Adapter. This function is only available when the measurement item is S21. Enter
the normalized submenu to make the appropriate selection.
3. Ecal (not available)
Use the optional SIGLENT electronic calibration kit for calibration. Calibration data is saved as
user calibration data.
4. Clear
Clear user calibration data.
5. Cal kit
Specifies the calibration kit used for mechanical calibration.
F503ME:Type-N 50Ω 3 GHz Cal Kit (Siglent)
85032F:Type-N 50Ω 9 GHz Cal Kit (KeySight)
6. Modify Cal kit (not available)
Use user defined calibration kit.
SVA1000X User Manual 74
Page 81
SIGLENT
Parameter
Default
Frequency
Center Freq
750 MHz
Start Freq
0 Hz
Stop Freq
1.5 GHz
Freq Step
Auto
Span
Span
1.5 GHz
X Scale
Linear
Amplitude
Ref Level
0 dBm
Attenuator
Auto, 20 dB
Preamp
Off
Units
dBm
Scale/Div
10 dB
Scale Type
Log
Ref Offset
0 dBm
Corrections
Off
BW
RBW
Auto, 1MHz
VBW
Auto, 1MHz
VBW/RBW
1
Avg Type
Log Pwr
Filter
Gauss
Sweep
Sweep Time
Auto
Sweep Rule
Speed
Sweep
Continue
Sweep Mode
Auto
2.7 Shortcut Key
2.7.1 Preset
Recall the preset setting and restore the analyzer to a specified status.
Press System ->Pwr On/Preset ->Preset to select “Def”, “Last” or “User”.
Press Preset to load the factory settings listed in the following table (except items marked
with “**”) or User-defined settings.
Different modes have their own Presets. The following table shows the initial default state
of the spectrum analysis mode.
Table 2-51 Factory Settings
SVA1000X User Manual 75
Page 82

SIGLENT
Numbers
1
QPD Dwell Time
50 ms
Trig
Trigger Type
Free Run
Video Trigger
0 dBm
External Trigger
Rising
TG
TG
Off
TG Level
-20 dBm
TG Lvl Offset
0 dB
Normalize
Off
Norm Ref Lvl
0 dB
Norm Ref Pos
100%
Ref Trace
Blank
Trace
Select Trace
A
Trace Type of Trace A
Clear Write
Avg Times
100
Variable X
A
Variable Y
B
Constant
0 dB
Output Z
C
Math Type
Off
Detect
Select Trace
A
Detect Type of Trace A
Pos Peak
Limit
Limit1
Off, Limit Upper, 0 dBm
Limit2
Off, Limit Lower, -100 dBm
Test
Stop
Fail to stop
Off
Buzzer
Off
X Axis
Freq
Demod
Demod Mode
Close
Earphone
Off
Volume
6
Demod Time
5.00 s
Marker
Select Marker
1
Select Trace
A
SVA1000X User Manual 76
Page 83

SIGLENT
Marker Type
Normal
Delta Pair
Delta
Relative To
Off
Marker Table
Off
Marker Fn
Select Marker
1
Marker Fn
Off
N dB BW
-3 dB
Read Out
Frequency
Peak
Cont Peak
Off
Peak Table
Off
Peak Threshold
-140 dBm
Peak Excursion
15 dB
Peak Type
Max
Mode
Mode
Spec Analyzer
Measure
Meas Type
Off
Measure Setup
Channel Power
Center Freq
750 MHz
Integration BW
2 MHz
Span
1.5 GHz
ACPR
Center Freq
750 MHz
Main Channel
1 MHz
Adjacent Chn
1 MHz
Adj Chn Space
3 MHz
Occupied BW
Method
%
dBc
26
%
99
T-Power
Center Freq
750 MHz
Start Line
0 s
Stop Line
20 ms
System**
Language
English
Power On
Def
Preset
Def
SVA1000X User Manual 77
Page 84

SIGLENT
IP Config
DHCP
Auto Cal
Close
Tine Date
On
Set Format
ymd
Display**
Display Line
Off, 0 dBm
Grid Brightness
30%
Screenshot
Normal
Touch
On
Touch Assistant
On
2.7.2 Couple
Set related parameters according to the coupling relationship.
Auto all: Set Related parameters automatically according to the coupling relationship.
1. RBW
RBW has a coupling relationship with the span. Please refer to the introduction of the
"Resolution Bandwidth".
2. VBW
VBW has a coupling coupling relationship with VBW. Please refer to the introduction of "VBW".
3. Attenuation
Input attenuation has coupling relationship with Ref Level and the preamp. Please refer to
introduction of "amplitude".
4. Freq step
Freq step has a coupling relationship with RBW at the zero span, when in none-zero mode,
Freq step have coupling relationship with Span. please refer to the introduction of the "Freq
Step".
5. Sweep time
Sweep time has a coupling relationship with RBW, VBW and span. Please refer to the
introduction of "Sweep Time".
2.7.3 Help
After pressing Help, press any key to show help information. Press Help second time to close
help information
SVA1000X User Manual 78
Page 85
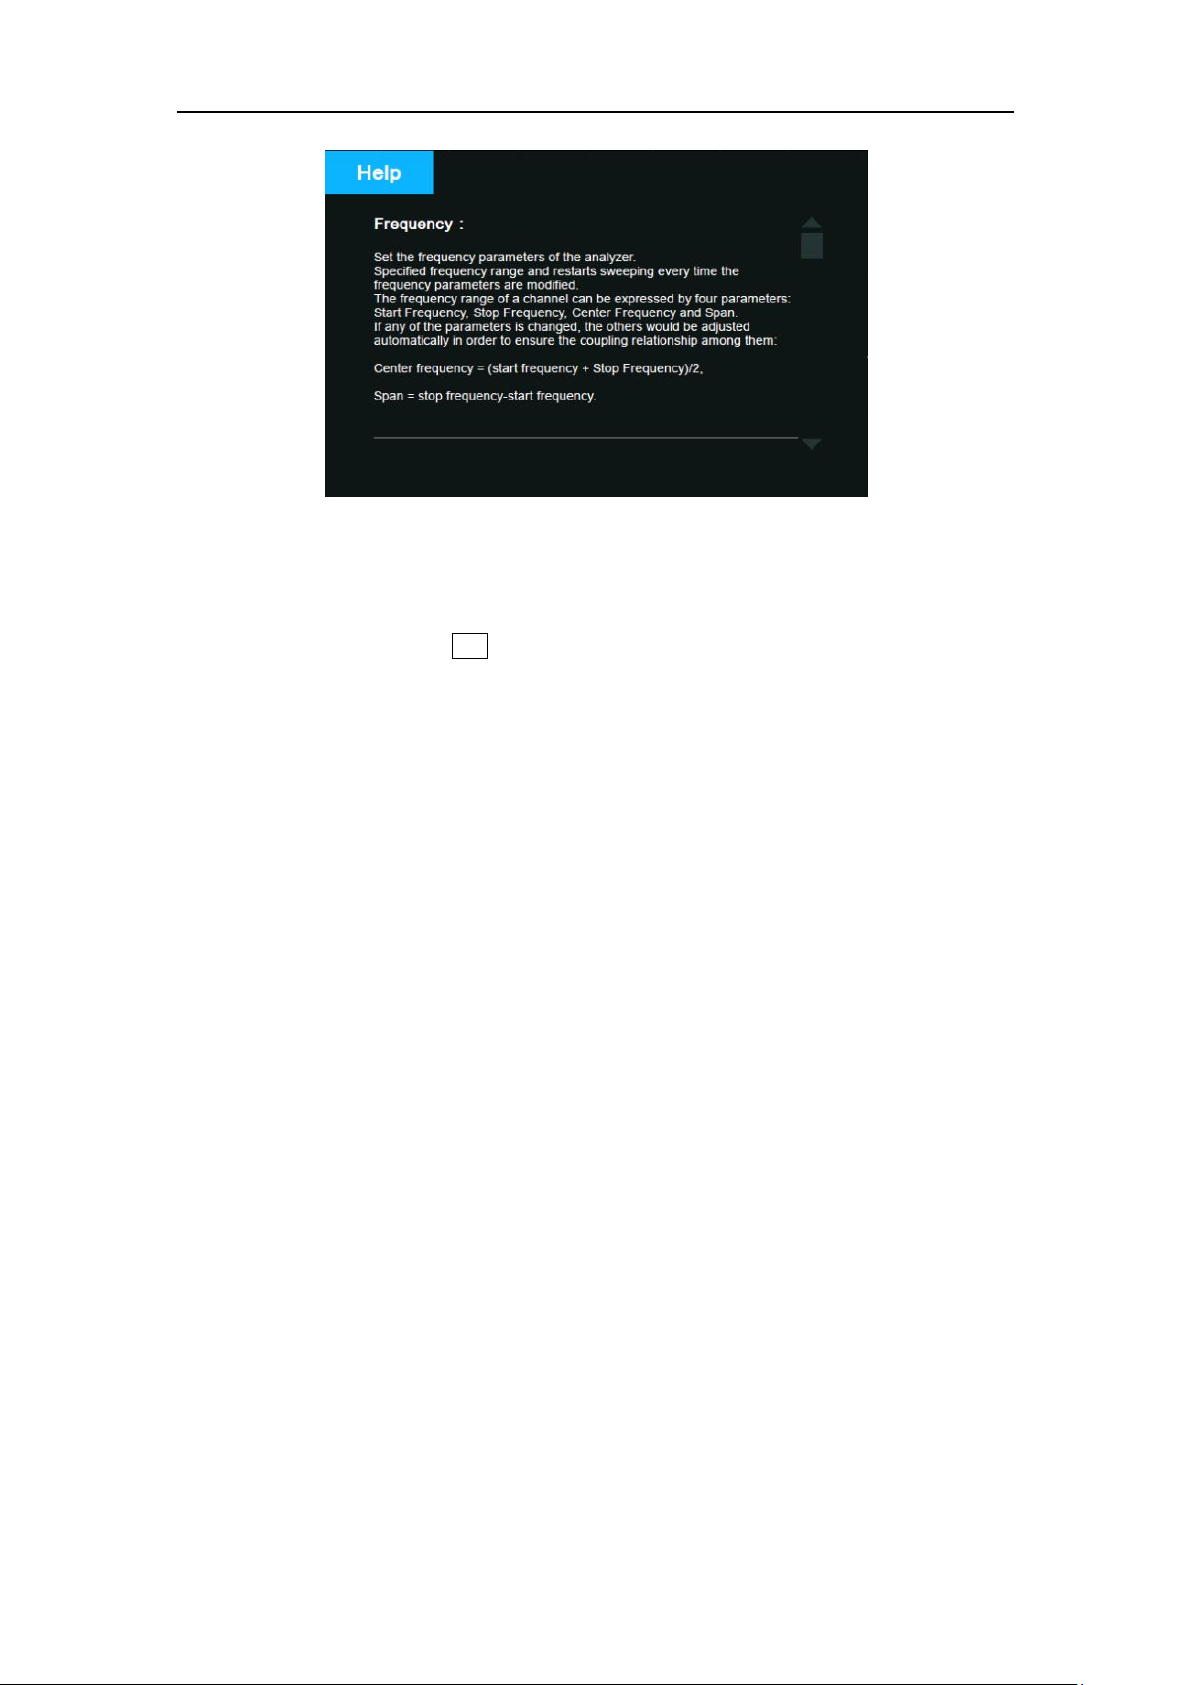
Figure 2-22 Help
2.7.4 Save
Quick save a file, according to File->’Save Type’ settings.
SIGLENT
SVA1000X User Manual 79
Page 86
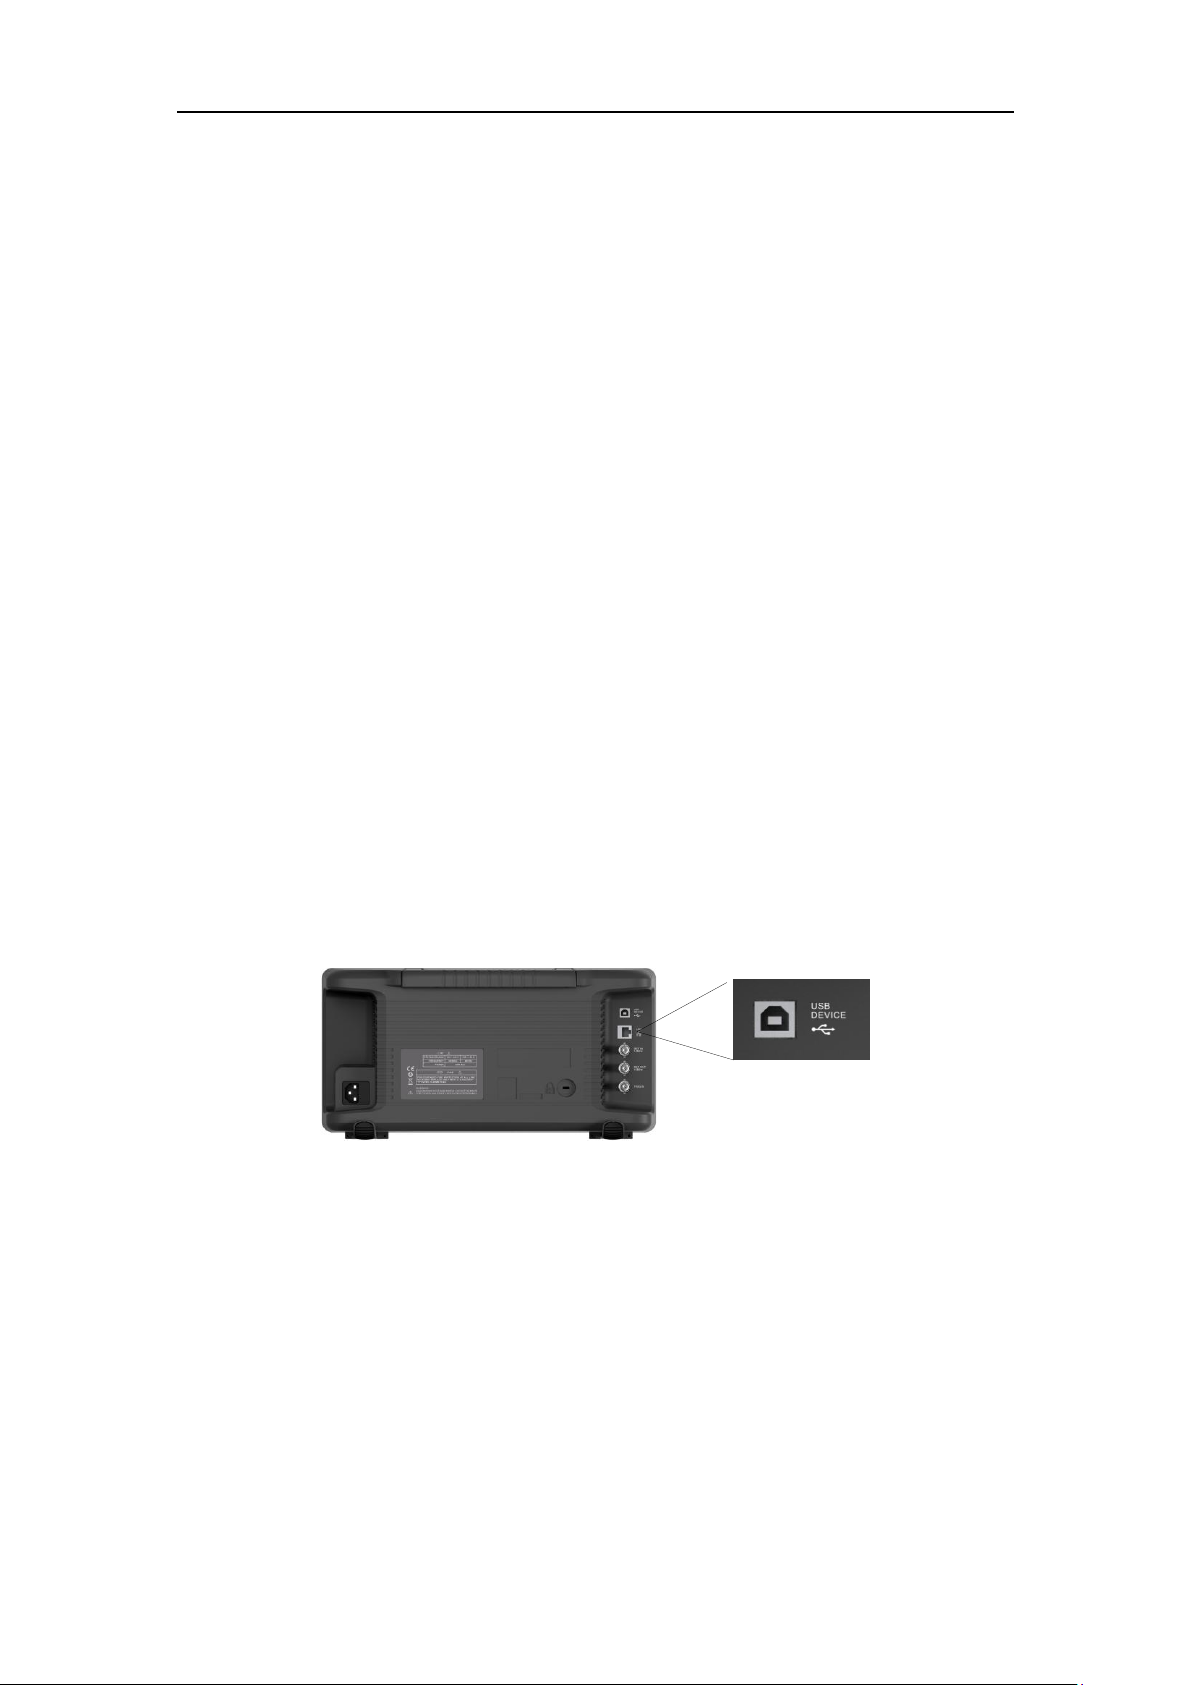
SIGLENT
Chapter 3 Programming Overview
The Siglent SVA1000X Series analyzer features LAN, USB Device, and SIGLENT GPIB_USB
module interfaces. By using a computer with these interfaces, and a suitable programming
language (and/or NI-VISA software), users can remotely control the analyzer based on SCPI
(Standard Commands for Programmable Instruments) command set, Labview and IVI
(Interchangeable Virtual Instrument), to interoperate with other programmable instruments.
This chapter introduces how to build communication between the analyzer and a controller
computer with these interfaces.
3.1 Remotely Operating the Analyzer
The analyzer provides both the USB and LAN connection which allows you to set up a remote
operation environment with a controller computer. A controller computer could be a personal
computer (PC) or a minicomputer. Some intelligent instruments also function as controllers.
3.1.1 USB: Connecting the Analyzer via the USB Device port
Refer to the following steps to finish the connection via USB-Device:
1. Install NI-VISA on your PC for USB-TMC driver.
2. Connect the analyzer USB Device port to a PC with a USB A-B cable.
3. Switch on the analyzer
Figure 3-1 USB Device
The analyzer will be detected automatically as a new USB hardware.
3.1.2 LAN: Connecting the Analyzer via the LAN port
Refer to the following steps to finish the connection via LAN:
1. Install NI-VISA on your PC for VXI driver. Or without NI-VISA, using socket or telnet in
your PC’s Operating System.
2. Connect the analyzer to PC or the local area network with a LAN cable
3. Switch on the analyzer
SVA1000X User Manual 80
Page 87
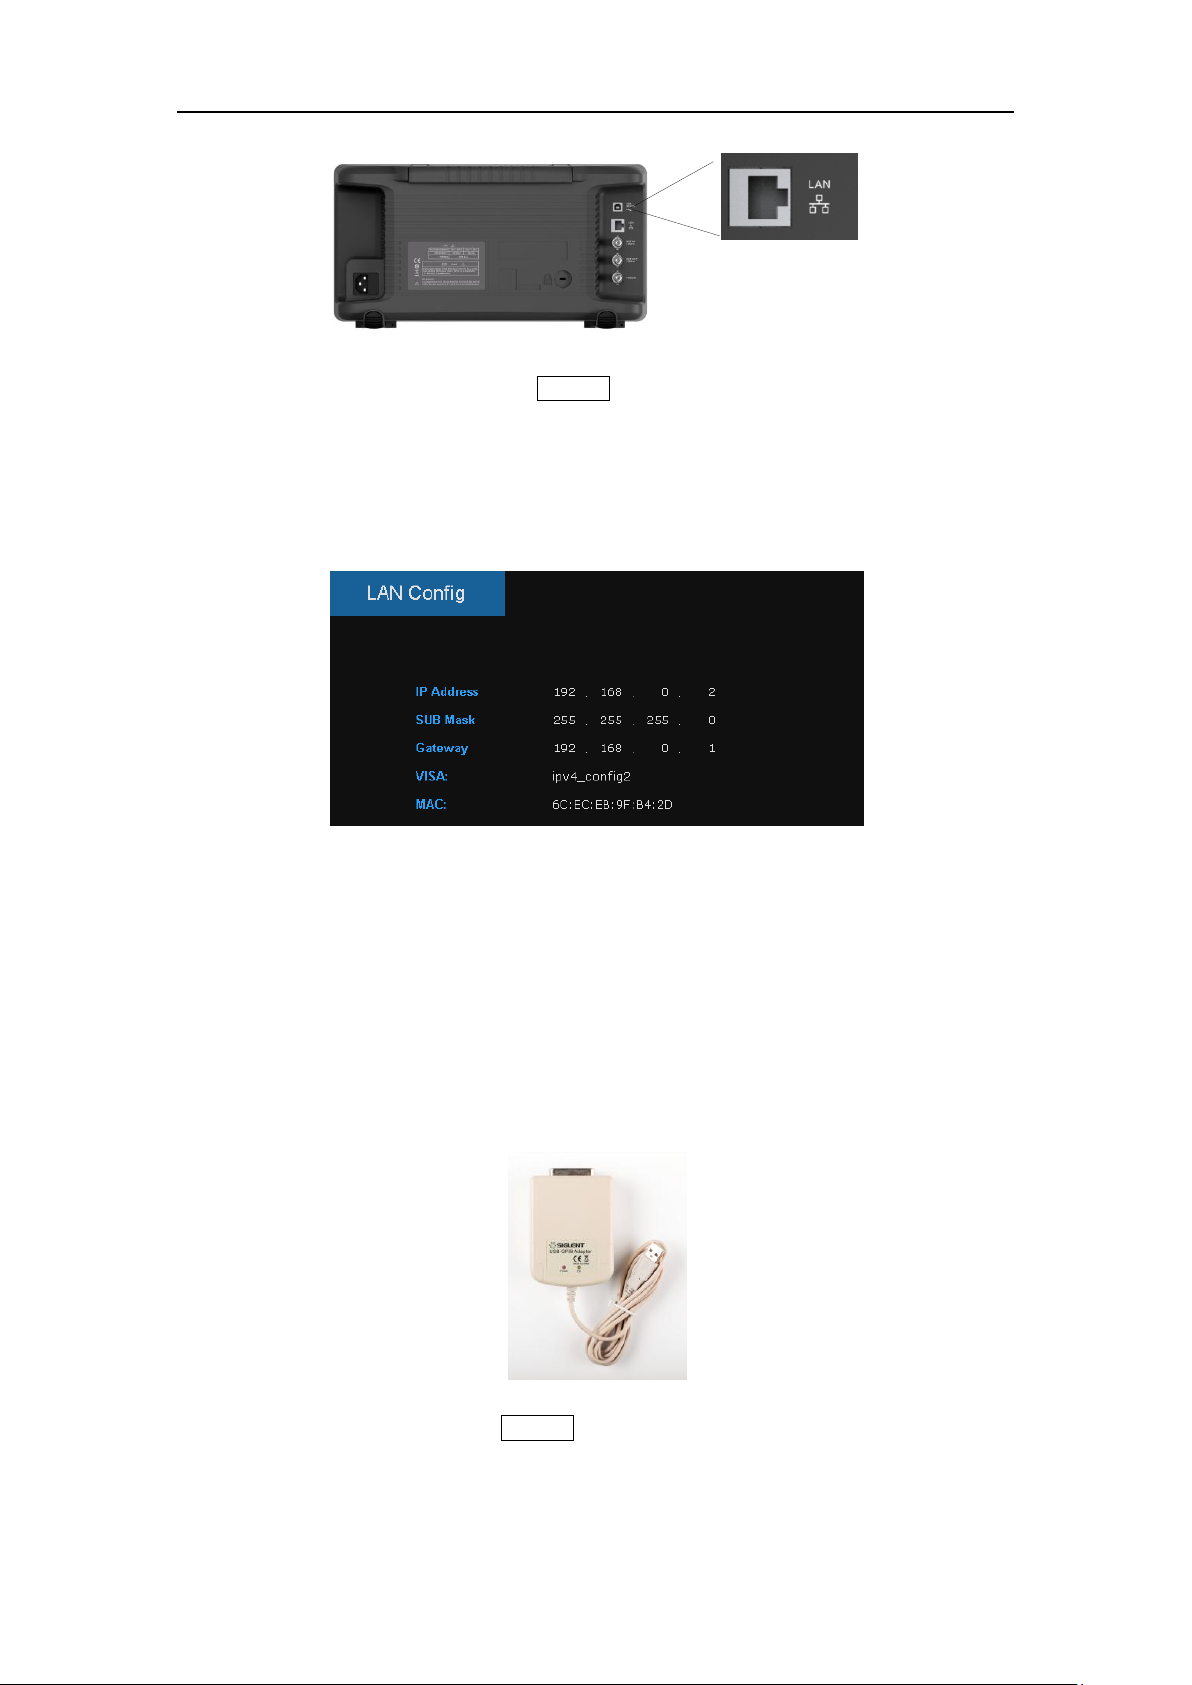
SIGLENT
Figure 3-2 LAN
4. Press button on the front panel System→Interface→LAN to enter the LAN Config
function menu.
5. Select the IP Config between Static and DHCP
DHCP: the DHCP server in the current network will assign the network parameters
automatically (IP address, subnet mask, gate way) for the analyzer.
Static: you can set the IP address, subnet mask, gate way manually. Press Apply.
Figure 3-3 LAN Config
The analyzer will be detected automatically or manually as a new LAN point.
3.1.3 GPIB: Connecting the Analyzer via the USB-Host port
Refer to the following steps to finish the connection via USB:
1. Install NI-VISA on your PC for GPIB driver.
2. Connect the analyzer USB Host port to a PC’s GPIB card port, with SIGLENT USB-GPIB
adaptor.
3. Switch on the analyzer
Figure 3-4 SIGLENT USB-GPIB Adaptor
4. Press button on the front panel System→Interface→GPIB to enter the GPIB number.
The analyzer will be detected automatically as a new GPIB point.
SVA1000X User Manual 81
Page 88
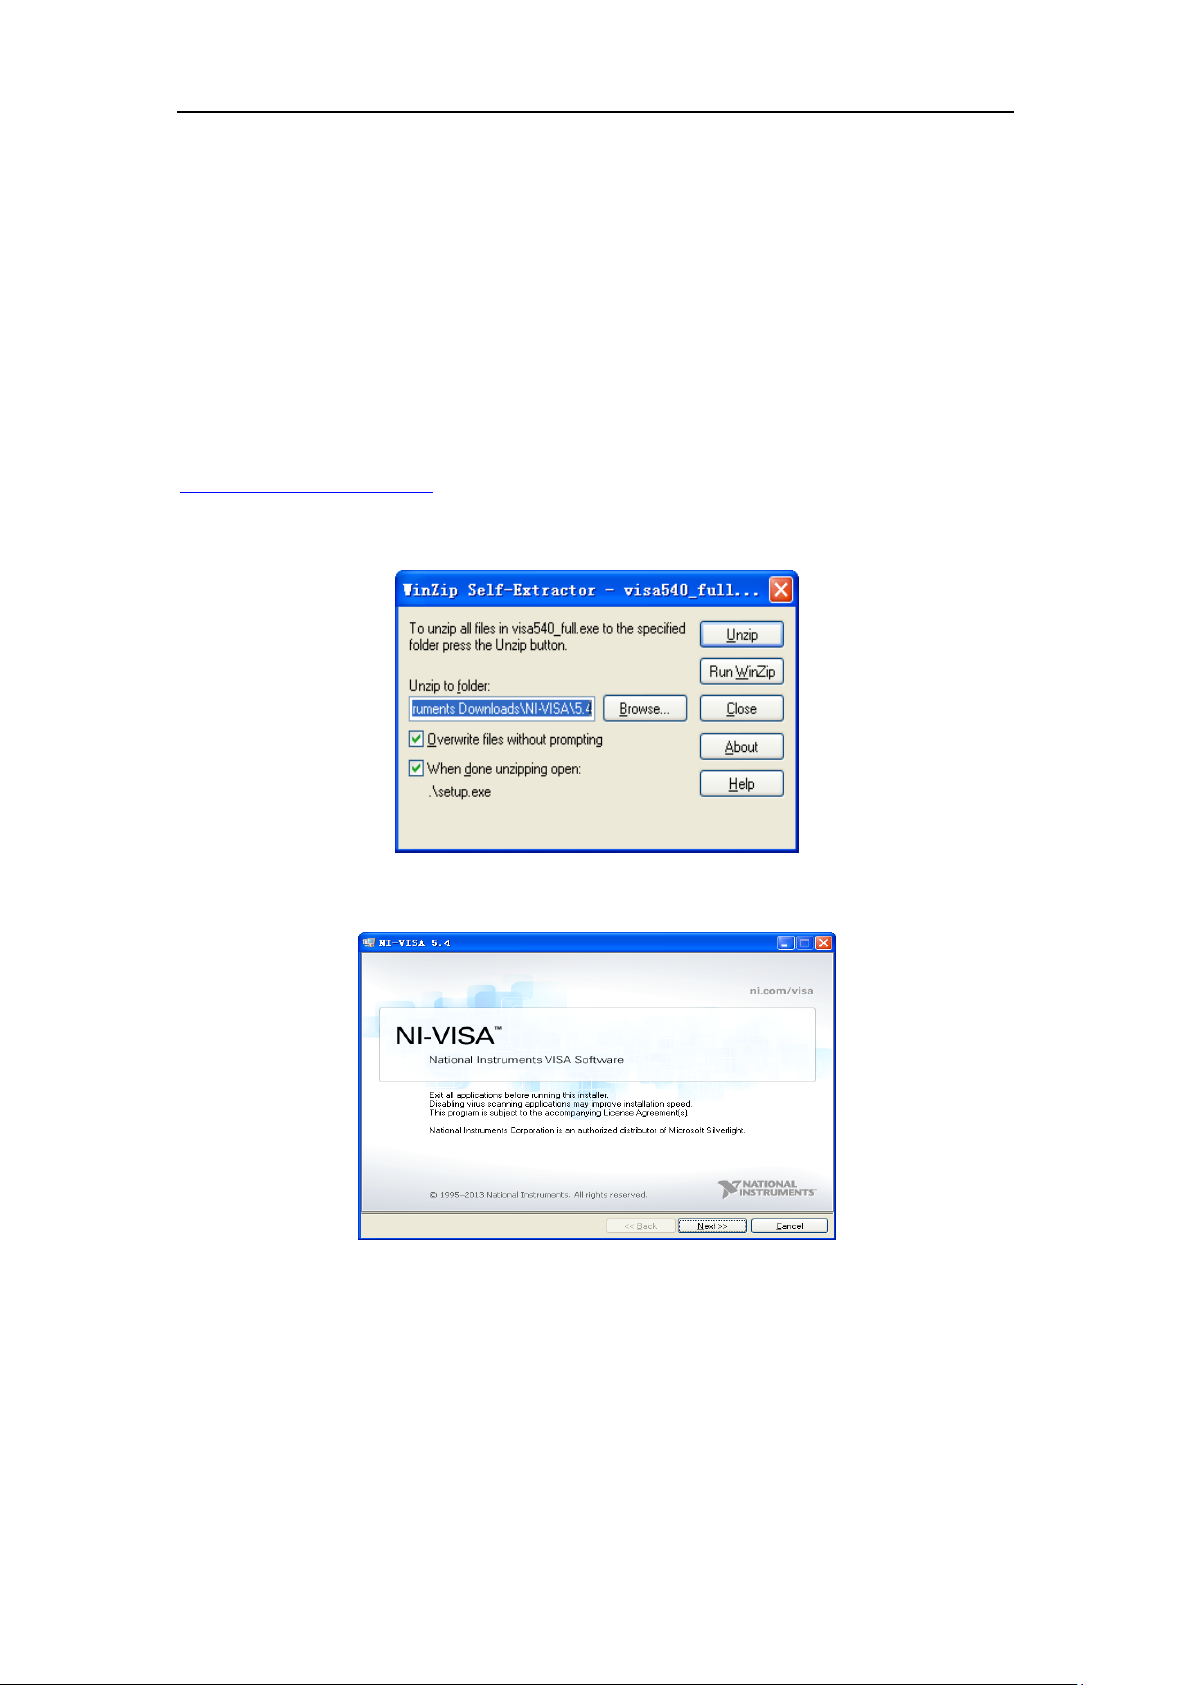
SIGLENT
3.2 Build Communication
3.2.1 Build Communication Using VISA
NI-VISA includes a Run-Time Engine version and a Full version. The Run-Time Engine version
provides NI device drivers such as USB-TMC, VXI, GPIB, etc. The full version includes the
Run-Time Engine and a software tool named NI MAX that provides a user interface to control
the device.
You can get NI-VISA full version from:
http://www.ni.com/download/.
After download you can follow the steps below to install it:
1. Double click the visa_full.exe, dialog shown as below:
2. Click Unzip, the installation process will automatically launch after unzipping files. If your
computer needs to install .NET Framework 4, its setup process will auto start.
3. The NI-VISA installing dialog is shown above. Click Next to start the installation process.
SVA1000X User Manual 82
Page 89
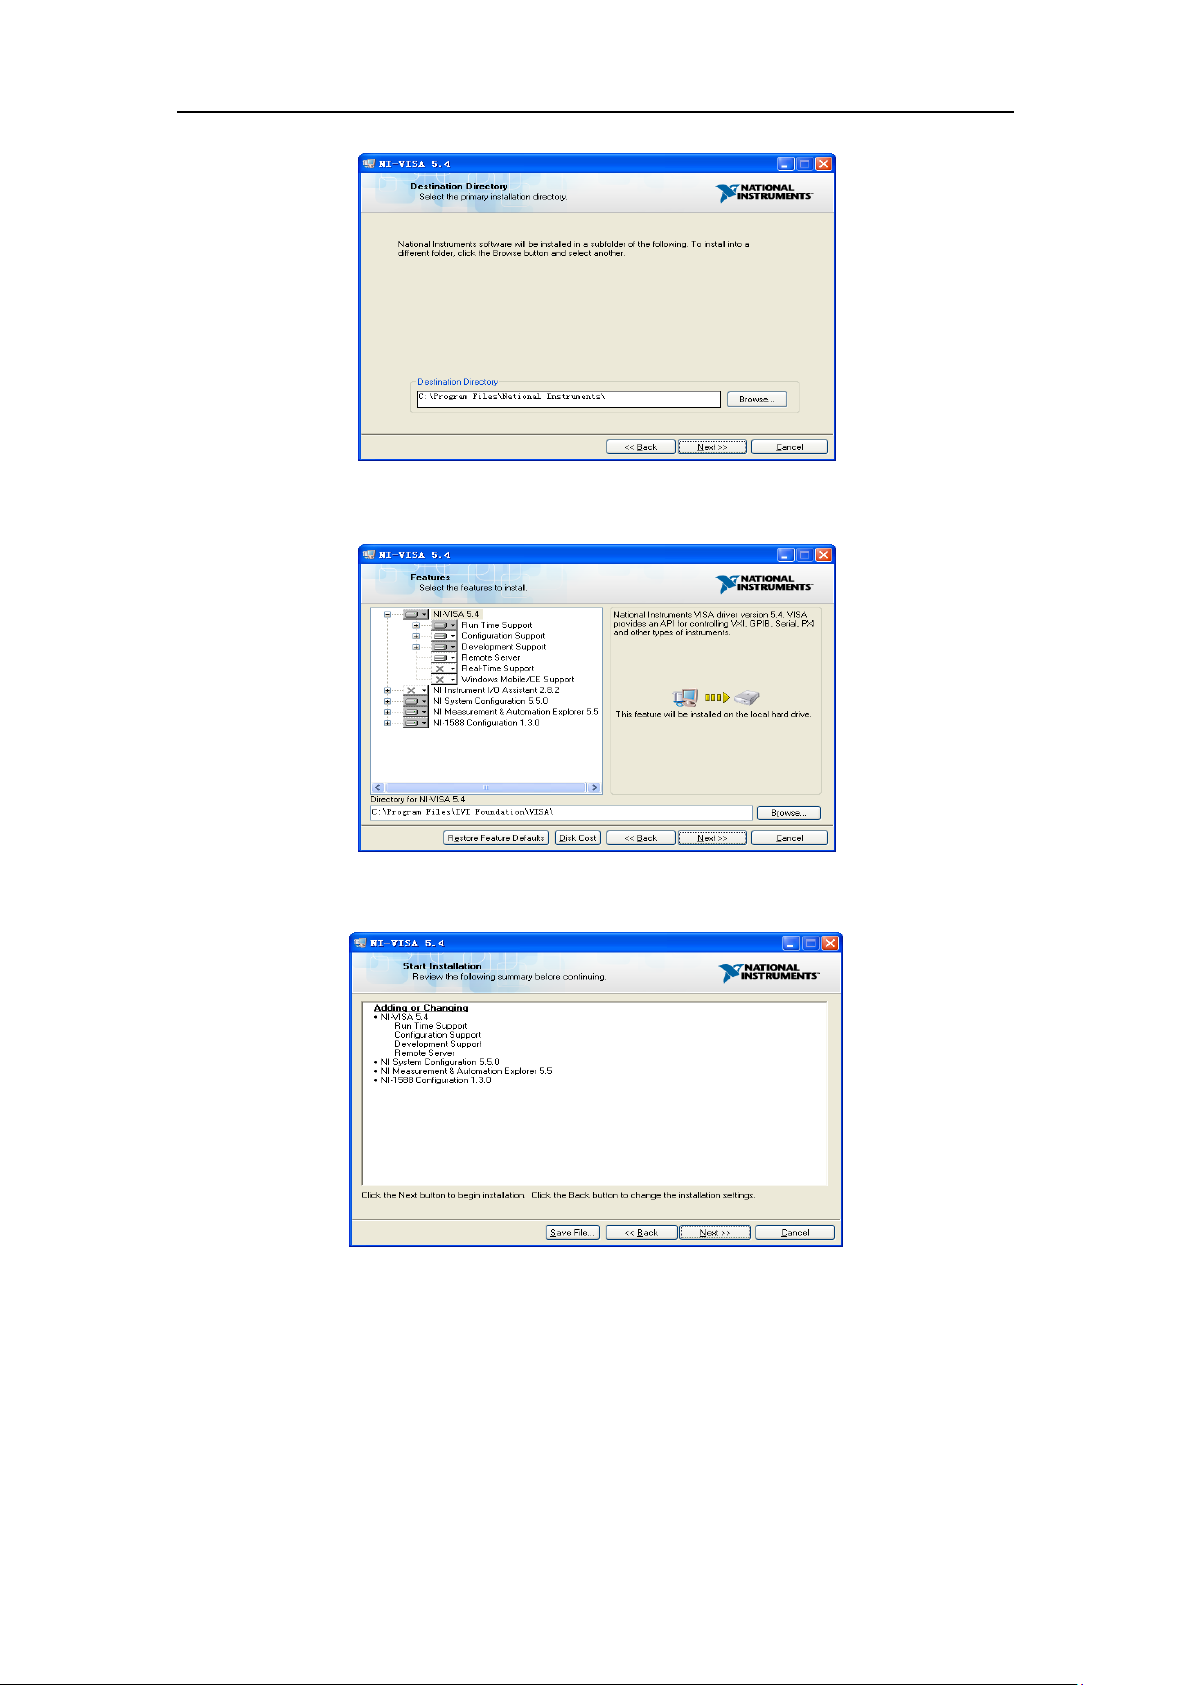
SIGLENT
4. Set the install path, default path is “C:\Program Files\National Instruments\”, you can
change it. Click Next, dialog shown as above.
5. Click Next twice, in the License Agreement dialog, select the “I accept the above 2
License Agreement(s).”, and click Next, dialog shown as below:
6. Click Next to run installation.
SVA1000X User Manual 83
Page 90
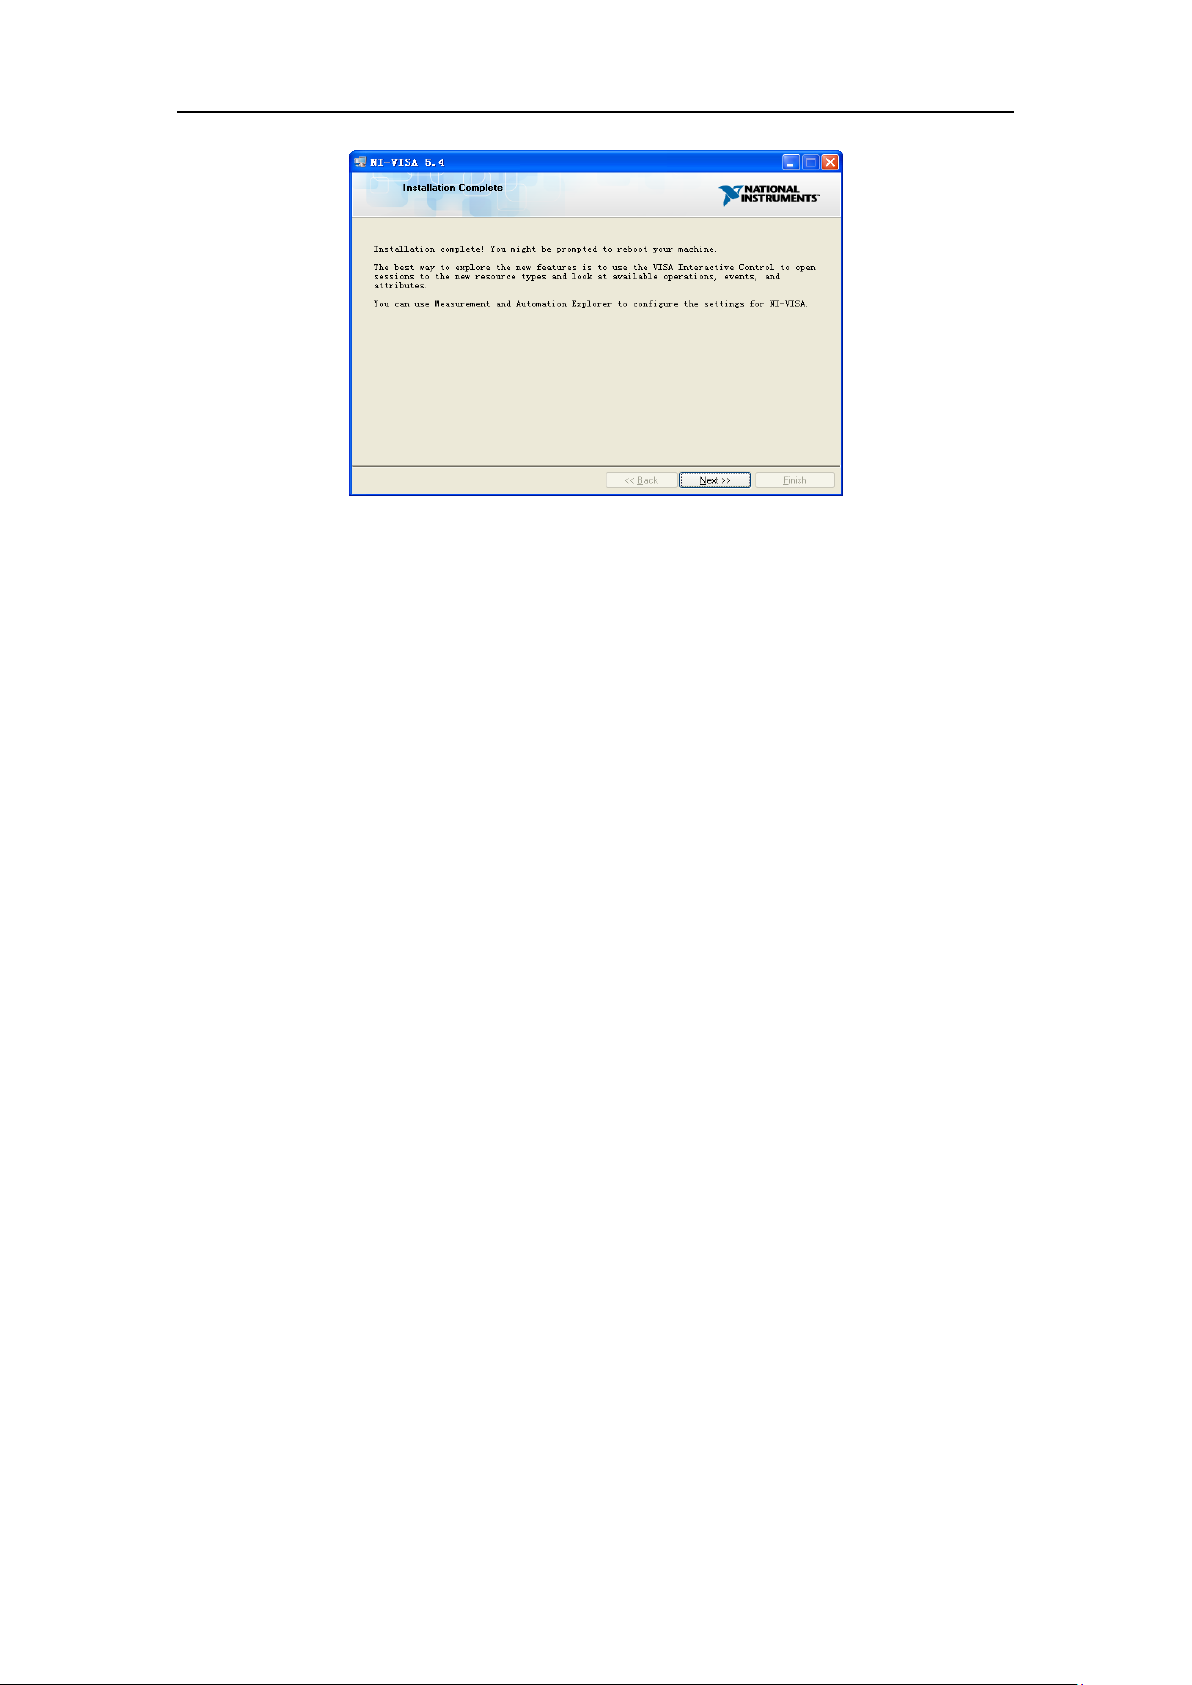
SIGLENT
Now the installation is complete, reboot your PC.
3.2.2 Build Communication Using Sockets/Telnet
Through the LAN interface, VXI-11, Sockets and Telnet protocols can be used to communicate
with the analyzer. VXI-11 is provided in NI-VISA, while Sockets and Telnet are commonly
included in PC’s OS initially.
Socket LAN is a method used to communicate with the analyzer over the LAN interface using
the Transmission Control Protocol/Internet Protocol (TCP/IP). A socket is a fundamental
technology used for computer networking and allows applications to communicate using
standard mechanisms built into network hardware and operating systems. The method
accesses a port on the analyzer from which bidirectional communication with a network
computer can be established.
Before you can use sockets LAN, you must select the analyzer’s sockets port number to use:
Standard mode: Available on port 5025. Use this port for programming.
Telnet mode: The telnet SCPI service is available on port 5024.
SVA1000X User Manual 84
Page 91
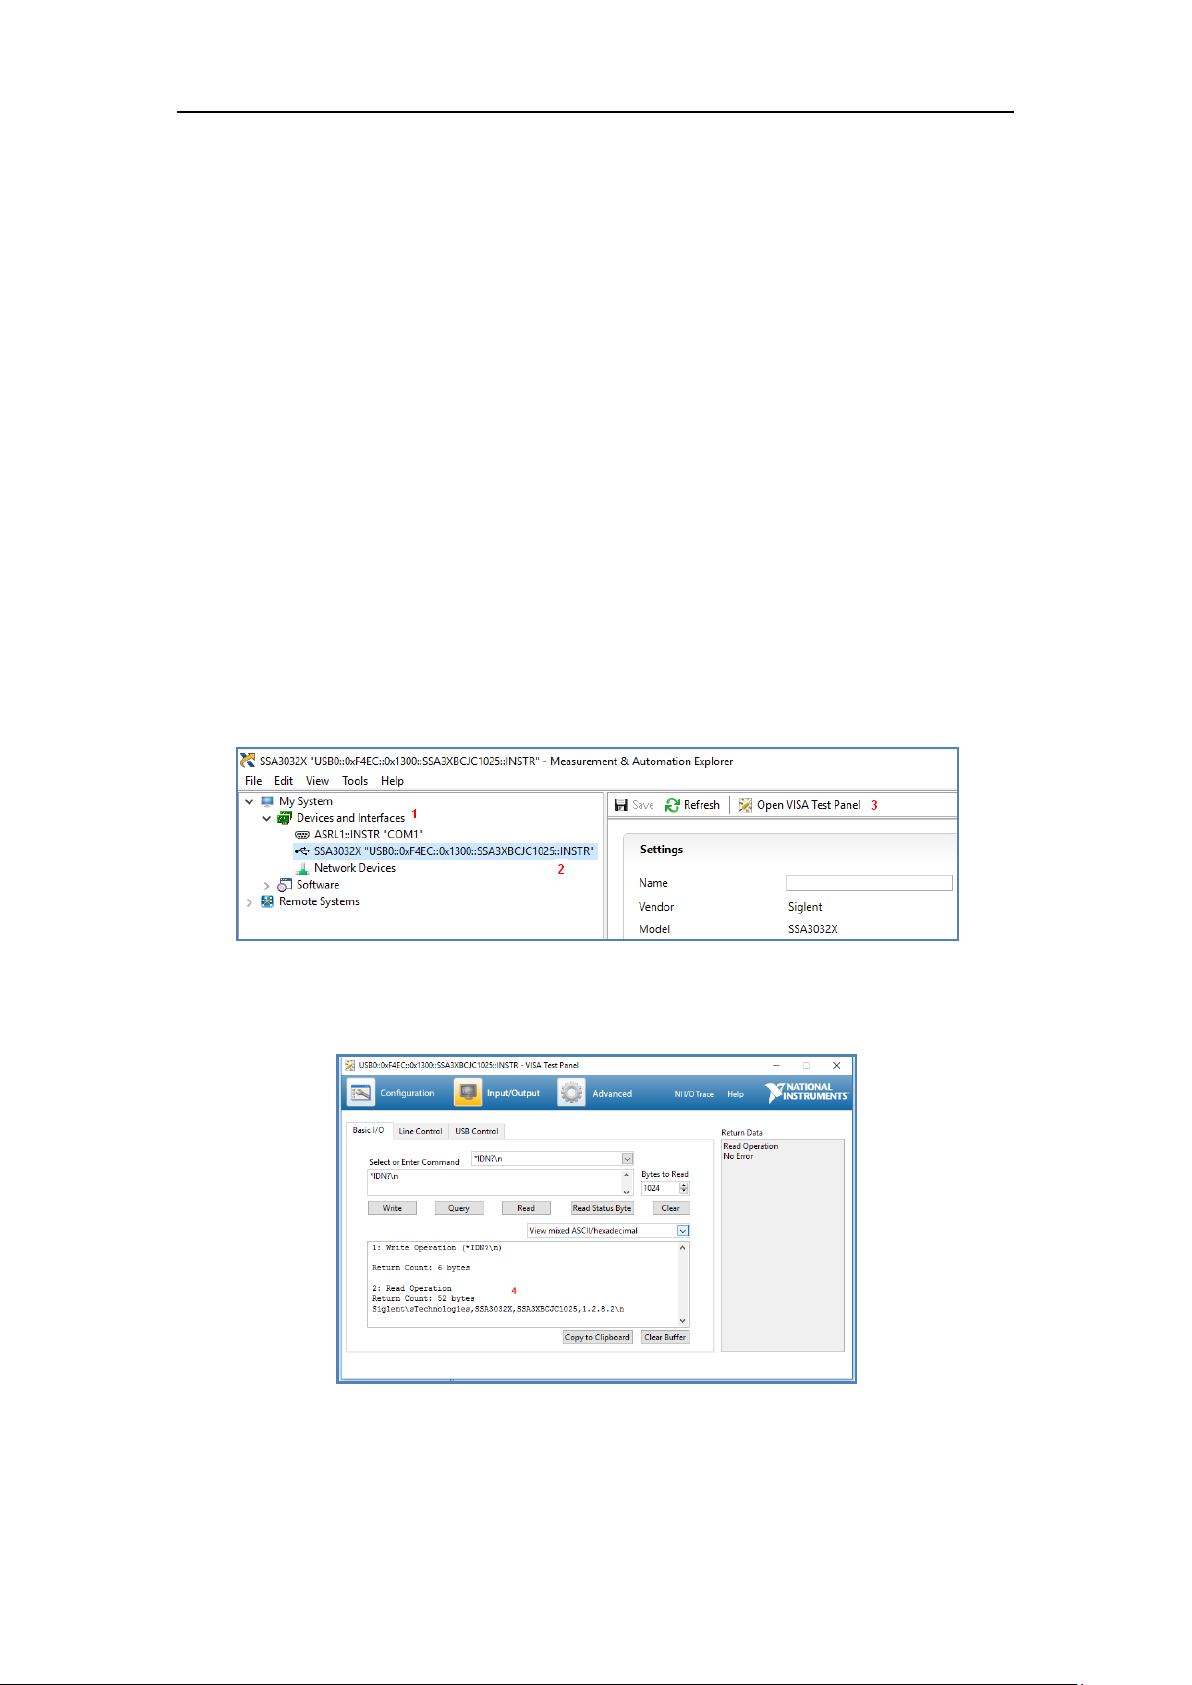
SIGLENT
3.3 Remote Control Capabilities
3.3.1 User-defined Programming
Users can use SCPI commands to program and control the analyzer. For details, refer to the
introductions in “Programming Examples”.
3.3.2 Send SCPI Commands via NI MAX
Users can control the analyzer remotely by sending SCPI commands via NI-MAX software.
NI_MAX is National Instruments Measurement and Automation Explorer. It is an executable
program that enables easy communication to troubleshoot issues with instrumentation.
3.3.2.1 Using USB
Run NI MAX software.
1. Click “Device and interface” at the upper left corner of the software;
2. Find the “USBTMC” device symbol
3. Click “Open VISA Test Panel” option button, then the following interface will appear.
4. Click the “Input/Output” option button and click the “Query” option button in order to view
the operation information.
NOTE: The “*IDN?” command (known as the Identification Query) returns the instrument
manufacturer, instrument model, serial number, and other identification information.
SVA1000X User Manual 85
Page 92
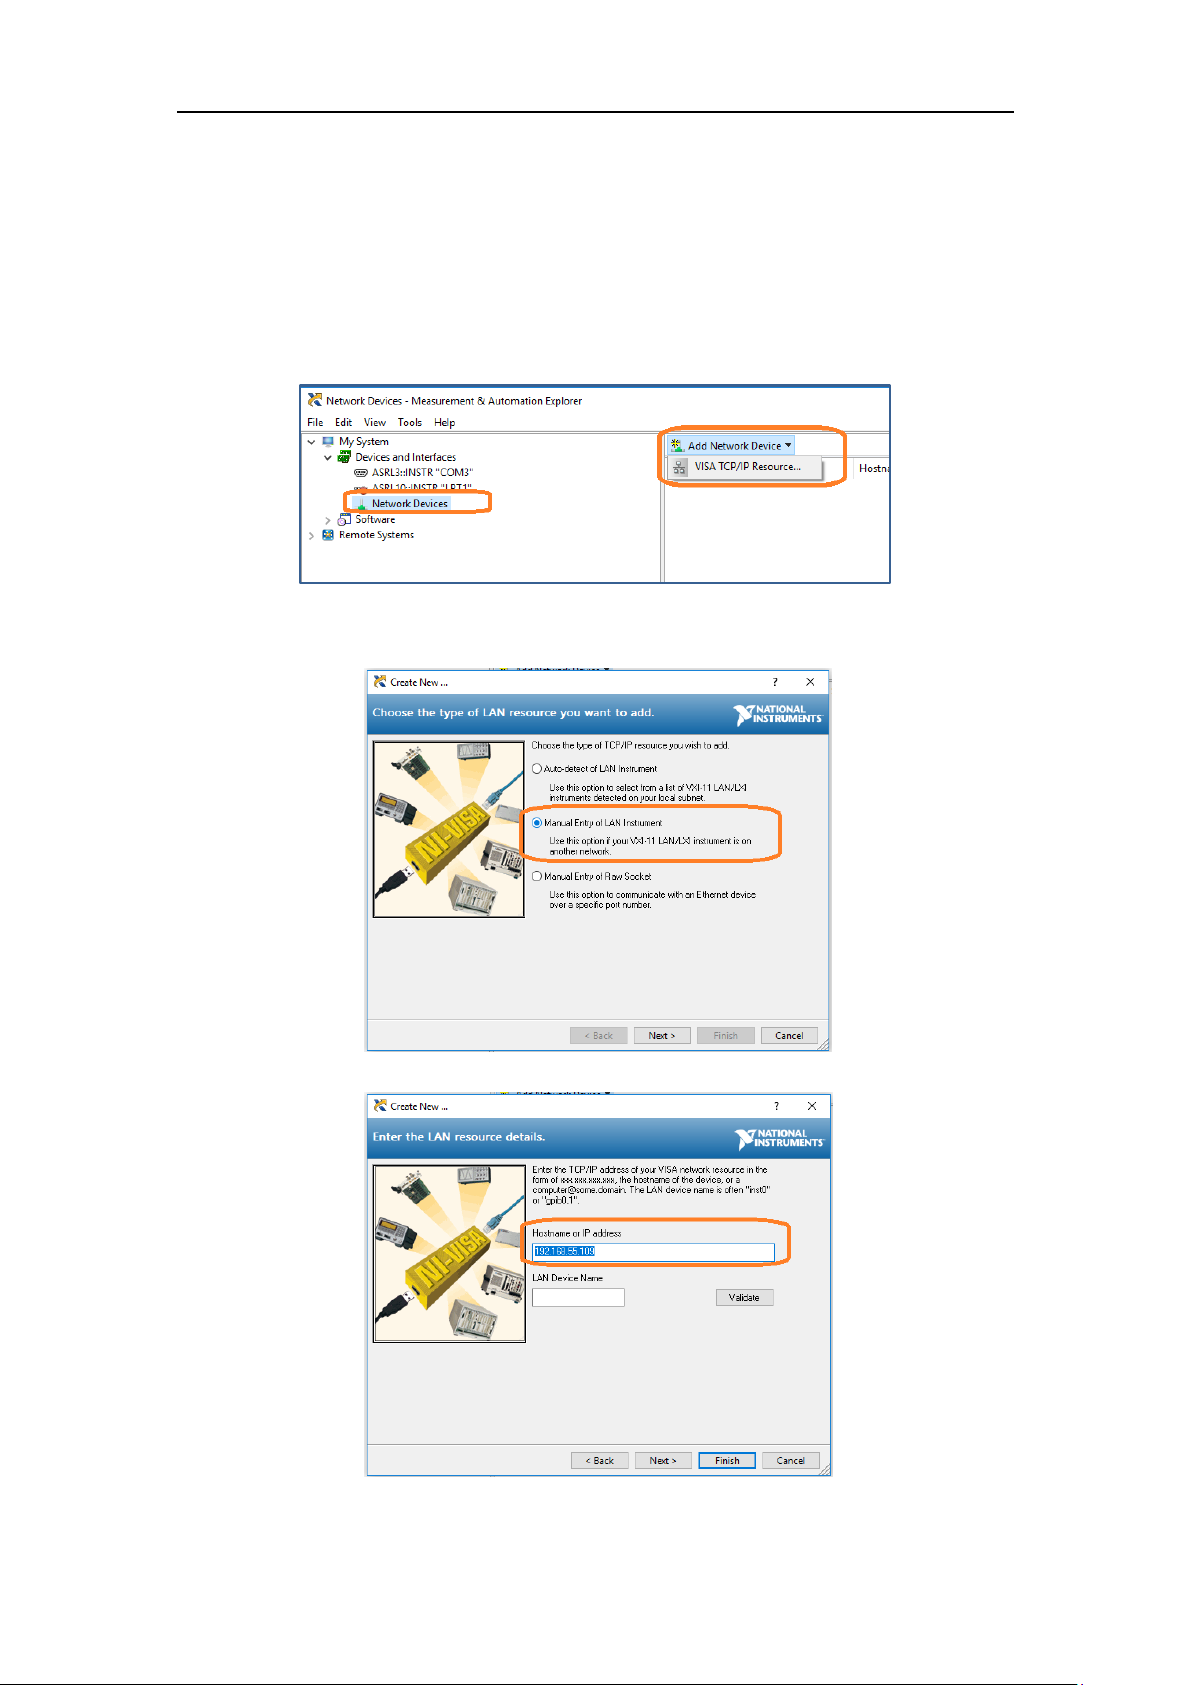
SIGLENT
3.3.2.2 Using LAN
Select “Add Network Device”, and select “VISA TCP/IP Resource” as shown:
Run NI MAX software.
1. Click “Device and interface” at the upper left corner of the software;
2. Find the “Network Devices” symbol, click “Add Network Devices”;
1. Select Manual Entry of LAN instrument, select Next, and enter the IP address as shown.
Click Finish to establish the connection:
NOTE: Leave the LAN Device Name BLANK or the connection will fail.
2. After a brief scan, the connection should be shown under Network Devices:
SVA1000X User Manual 86
Page 93
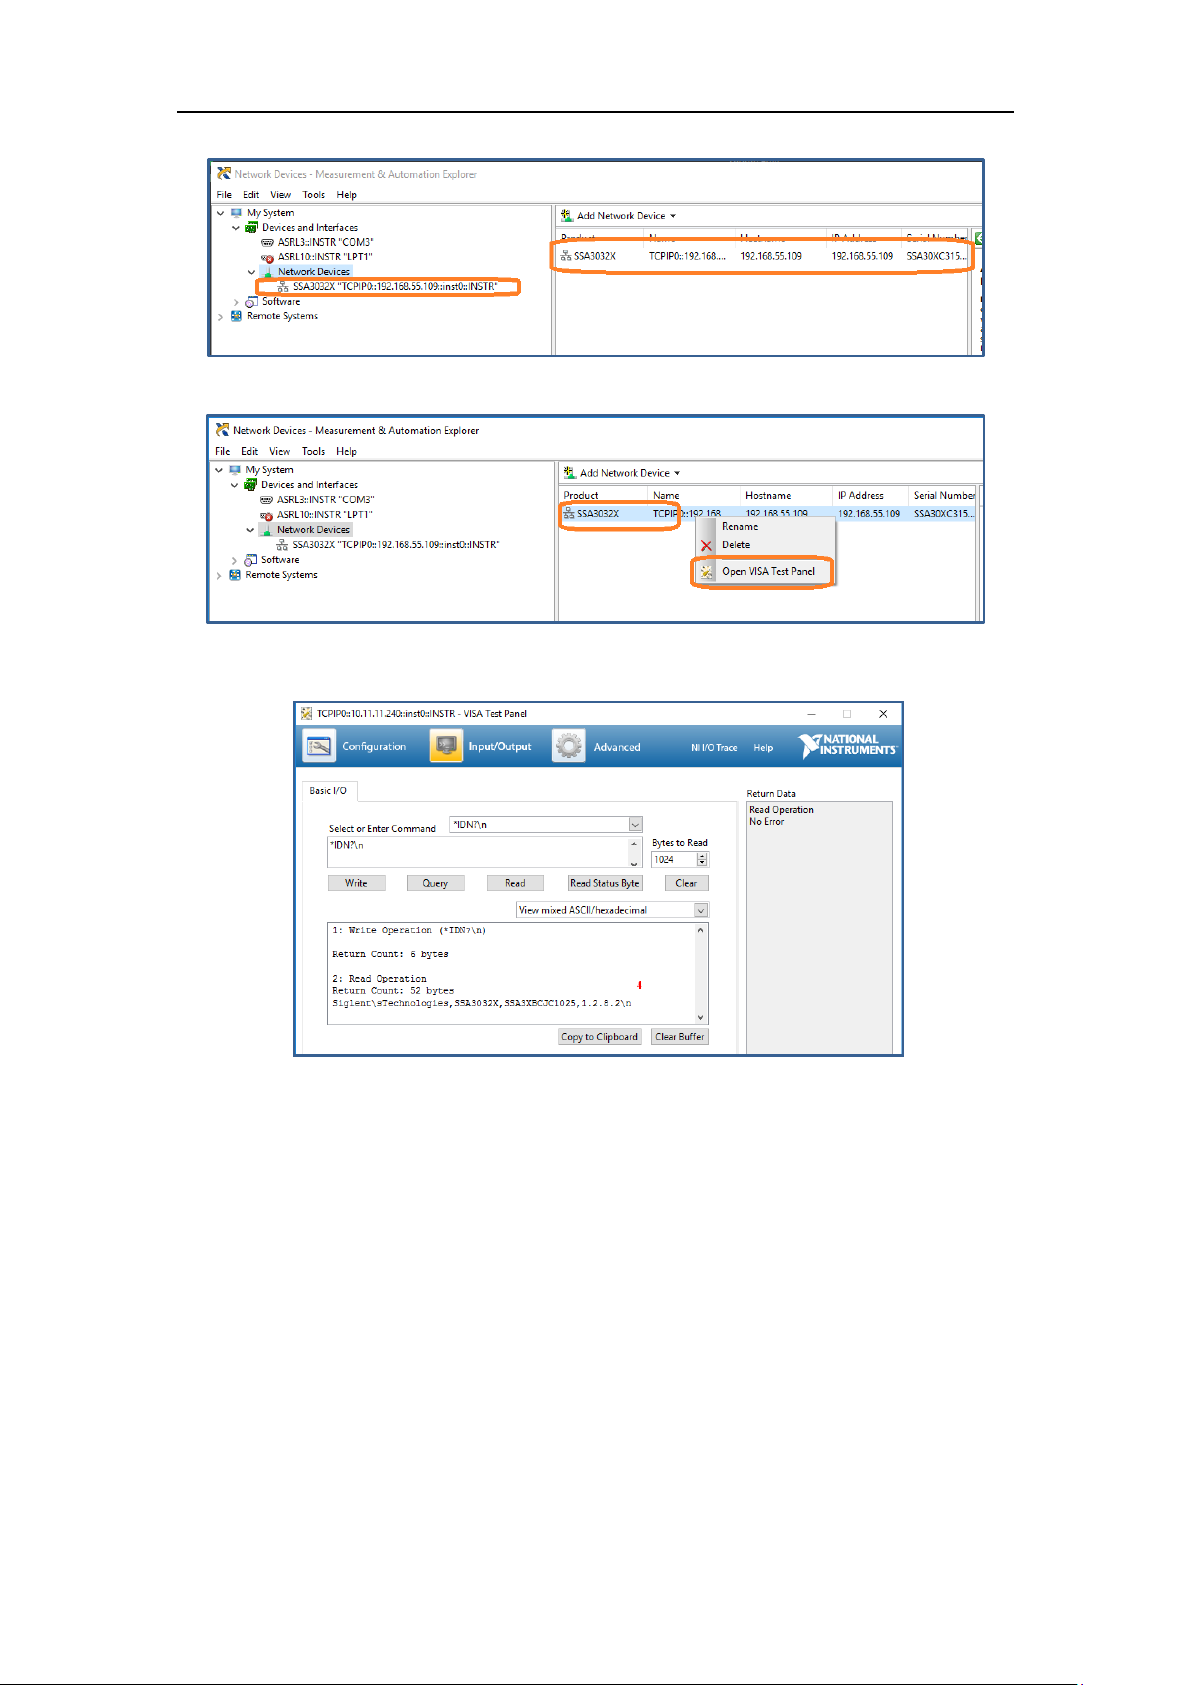
SIGLENT
3. Right-click on the product and select Open NI-VISA Test Panel:
4. Click “Input/Output” option button and click “Query” option button. If everything is OK, you
will see the Read operation information returned as shown below.
3.3.3 EasySpectrum Software
Users can control the analyzer remotely by EasySpectrum. PC software EasySpectrum is an
easy-to-use, PC-Windows-based remote control tool for Siglent’s analyzer. You can download
it from Siglent’s website. To connect the analyzer via the USB/LAN port to a PC, you need
install the NI VISA first.
It is able to be used as:
A monitor to display and control the trace scans simultaneously with the analyzer;
A file maker to get user defined Limit/Correction files, and load them to the analyzer;
An EMI receiver perform EMI Pre-compliance test including pre-scan, peak search, final
scan and report generating.
For the further description of the software, please refer to the online help embedded in this
SVA1000X User Manual 87
Page 94
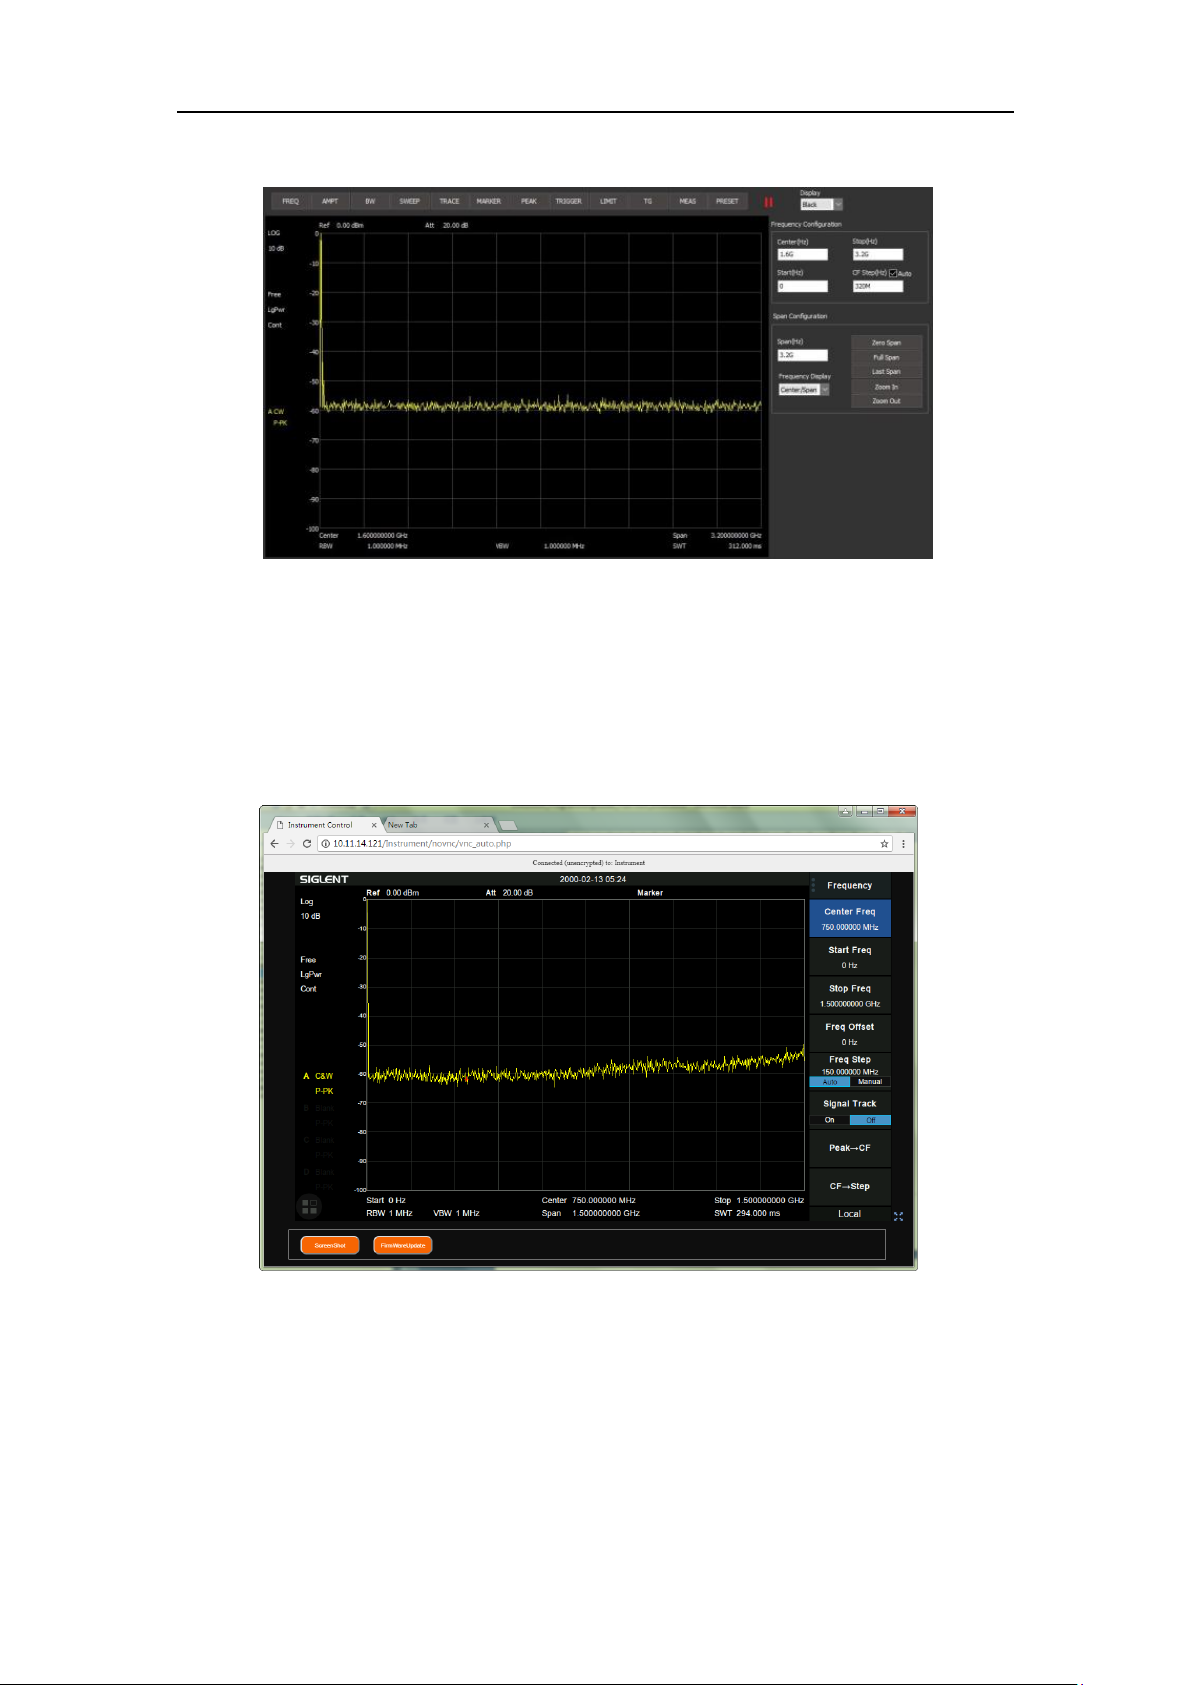
SIGLENT
software.
3.3.4 Web Control
With the embedded web server, the analyzer can be controlled through LAN from a web
browser* on PC and mobile terminals, without any extra driver be installed. This provides
remote controlling and monitoring capabilities. Screenshot and firmware update are also
supported.
*Web browser with HTML5 supported like Google Chrome or Firefox are recommended.
SVA1000X User Manual 88
Page 95

SIGLENT
Chapter 4 Service and Support
4.1 Service Summary
SIGLENT warrants that the products that it manufactures and sells will be free from defects in
materials and workmanship for a period of three years (accessories for a period of one year)
from the date of shipment from an authorized Siglent distributor. If the product proves defective
within the respective period, SIGLENT will provide repair or replacement as described in the
complete warranty statement.
To arrange for service or obtain a copy of the complete warranty statement, please contact
your nearest Siglent sales and service office. Except as provided in this summary or the
applicable warranty statement, SIGLENT makes no warranty of any kind, express or implied,
including without limitation the implied warranties of merchantability and fitness for a particular
purpose. In no event shall SIGLENT be liable for indirect, special or consequential damages.
4.2 Troubleshooting
Before calling SIGLENT, or returning an analyzer for service, perform the quick checks listed
below. This check may eliminate the problem.
If the problem remains still, please contact SIGLENT and provide your device information in
the back of the analyzer.
1. The Power Switch is still dark after power on:
(1) Check that the power is correct / working.
(2) Check the power cord has been connected correctly
(3) Check the power fuse. If a new fuse needs to be installed, please use a specified
fuse.
2. The analyzer’s screen is still dark (no display) after power on:
(1) Check whether the fan is running while the screen is dark, maybe the LCD cable is
loose?
(2) Check whether the fan is not running while screen is dark, maybe it has failed to start
up?
Do not disassemble the instrument by yourself and contact SIGLENT.
SVA1000X User Manual 89
Page 96

SIGLENT
3. The key is unresponsive or gives a wrong response:
(1) Press all the keys at the front panel to check if all of them are normal after power on.
(2) Press System ->Self Test ->Key Test to check if all the keys are working properly.
(3) If a key is not working, the numeric keyboard connection might be loose or the numeric
keyboard is broken.
Do not disassemble the instrument by yourself and contact SIGLENT.
4. The spectrum lines on the screen do not update for a long period of time:
(1) Check whether the screen is locked; if so, press Esc to unlock it.
(2) Verify whether all the trigger conditions have been met and whether there is a valid
trigger signal inputting.
(3) Check whether the analyzer is in single sweep.
(4) Check whether the current sweep time is too long.
5. Wrong measurement results or poor precision:
To calculate the system errors and check the measurement results and precision, refer to the
introductions in “Specifications”. To reach these specifications, please:
(1) Check whether all the external devices are successfully connected and are working
normally.
(2) Get some knowledge of the signal under measurement and set appropriate instrument
parameters.
(3) Make measurements under proper conditions; for example, warm-up the instrument
appropriately and operate the instrument under the specified environment temperature.
(4) Calibrate the instrument regularly to reduce or avoid errors that might occur over time.
If you need a specific calibration after the stated calibration period, contact SIGLENT or get
paid service from authorized measurement agencies.
6. Pop-up Message:
The instrument may display prompt messages, error messages or state messages according
to the current working status. These messages are displayed to help you to use the instrument
correctly and are not instrument failures.
SVA1000X User Manual 90
Page 97

SIGLENT
4.3 Contact Us
China:
SIGLENT TECHNOLOGIES CO., LTD.
Add: Bldg No.4 & No.5, Antongda Industrial Zone, 3rd Liuxian Road, Bao'an District,
Shenzhen, 518101, China.
Tel: + 86 755 3661 5186
Fax: + 86 755 3359 1582
Email: [email protected];
Website: http://www.siglent.com/ens/
USA:
SIGLENT Technologies America, Inc
6557 Cochran Rd Solon, Ohio 44139
Tel: 440-398-5800
Toll Free: 877-515-5551
Fax: 440-399-1211
Email: [email protected]
Website: www.siglentamerica.com
Europe:
SIGLENT TECHNOLOGIES EUROPE GmbH
ADD: Liebigstrasse 2-20, Gebaeude 14, 22113 Hamburg Germany
Tel: +49(0)-819-95946
Fax: +49(0)-819-95947
Email: [email protected]
Website: www.siglenteu.com
SVA1000X User Manual 91
 Loading...