

Page 1
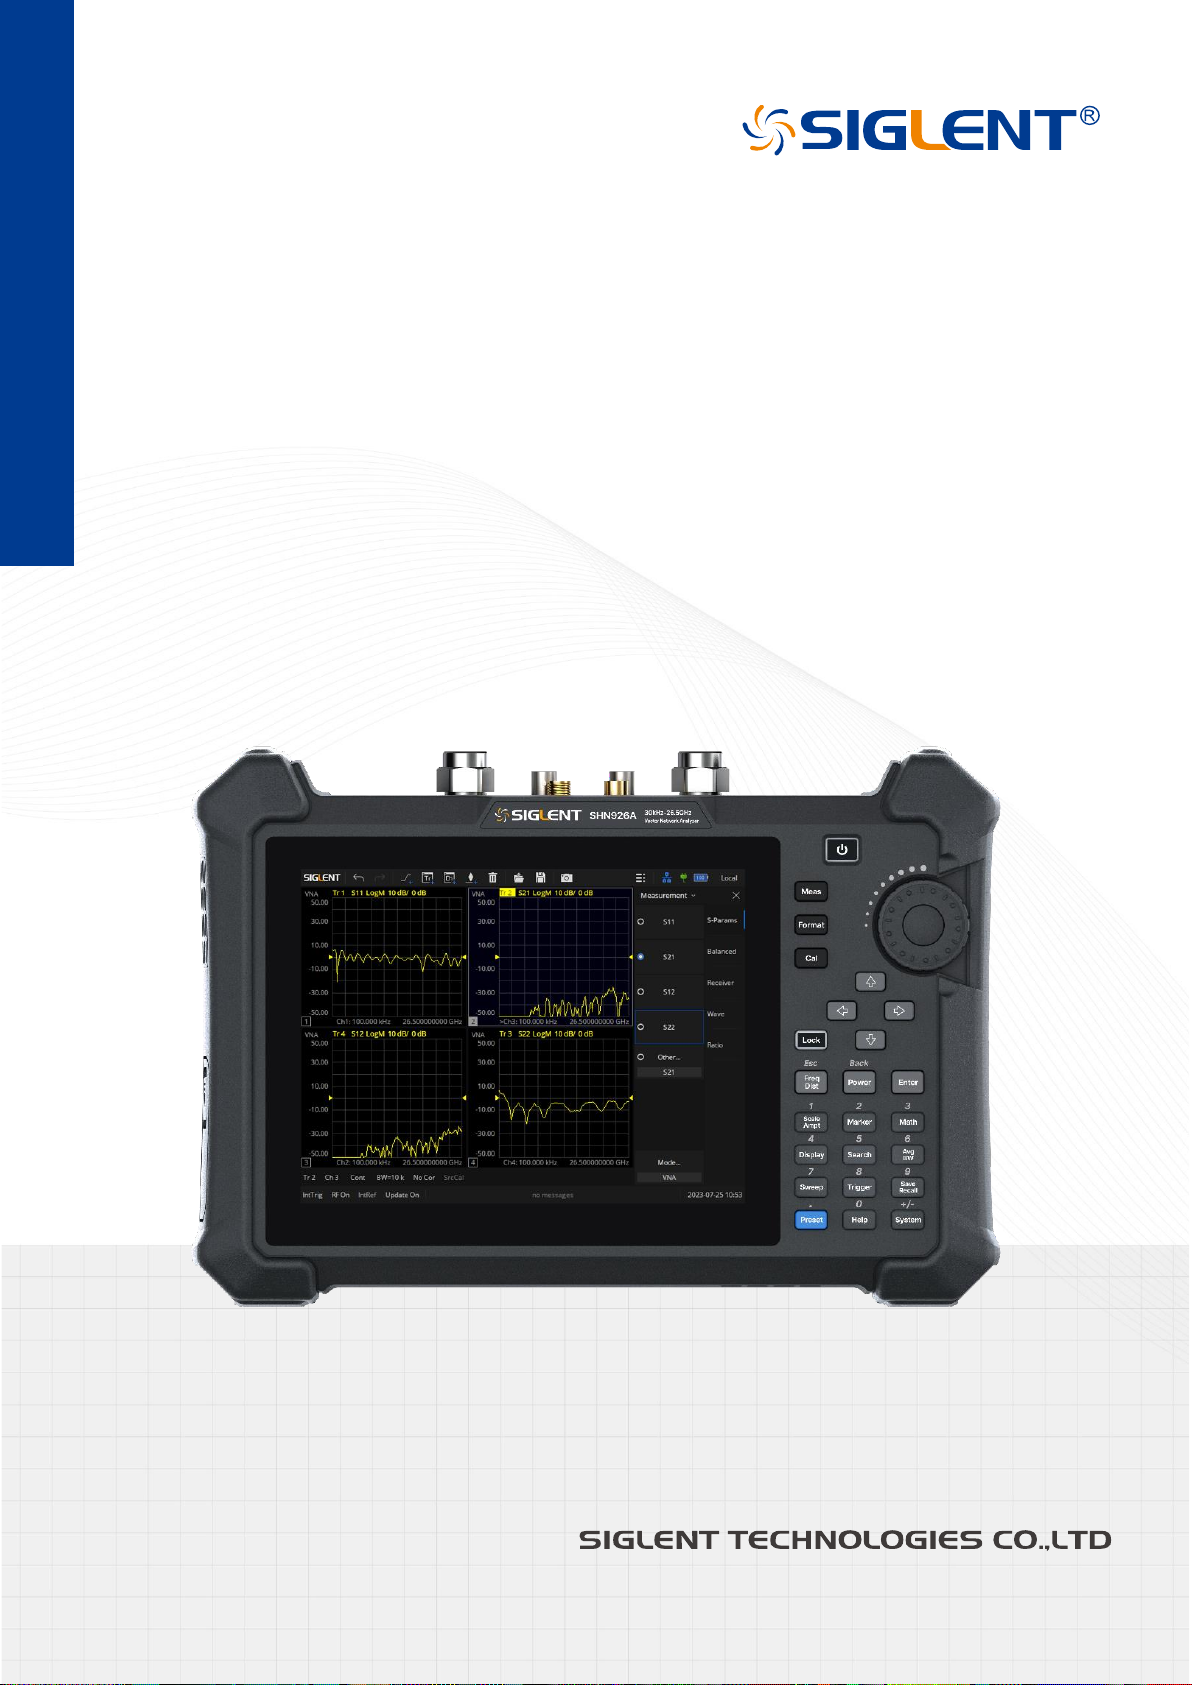
DY-WTFK-202308079426
SHN900A Series
Vector Network Analyzer
User Manual
EN01
Page 2

Page 3

SHN900A User Manual
www.siglent.com
1
Content
Content .......................................................................................................................................... 1
1 Copyright and Declaration ................................................................................................... 8
2 General Safety Summary ..................................................................................................... 9
2.1 Precautions for Operation ........................................................................................ 9
2.2 Safety Terms and Symbols ..................................................................................... 10
2.3 Safety Operation Matters ....................................................................................... 10
2.4 Safety of Electricity ................................................................................................. 11
2.5 Safety Transportation Matters ................................................................................ 12
2.6 Battery Usage ......................................................................................................... 12
2.7 Waste Disposal ....................................................................................................... 13
2.8 Safety Compliance ................................................................................................. 13
2.9 General Care and Cleaning .................................................................................... 14
2.10 Measurement Category .......................................................................................... 14
3 Working Environment ......................................................................................................... 16
3.1 General requirement ............................................................................................... 16
3.2 AC Power Requirement .......................................................................................... 18
4 Quick Start ........................................................................................................................... 19
4.1 General Inspection ................................................................................................. 19
4.2 Preparing for Use ................................................................................................... 20
4.2.1
Appearance and Dimension .................................................................................. 20
4.2.2
Fixed Bracket ........................................................................................................ 20
4.2.3
Power Supply Information ..................................................................................... 21
4.3 Front Panel ............................................................................................................. 22
4.4 Rear Panel .............................................................................................................. 25
4.5 User Interface ......................................................................................................... 27
4.5.1
Active entry ............................................................................................................ 27
4.5.2
Value of marker ..................................................................................................... 28
4.5.3
Trace State ............................................................................................................ 28
4.5.4
Hardkeys ............................................................................................................... 29
4.5.5
Channel State........................................................................................................ 29
4.5.6
Function Keys........................................................................................................ 29
4.5.7
Label Page ............................................................................................................ 29
4.5.8
Window State ........................................................................................................ 29
4.5.9
Stimulus Range ..................................................................................................... 30
4.5.10
Status Bar .............................................................................................................. 30
4.5.11
Message Bar ......................................................................................................... 30
4.5.12
Graffiti Function ..................................................................................................... 30
Page 4

SHN900A User Manual
2
www.siglent.com
4.5.13
Theme Management ............................................................................................. 34
4.6 Touch screen and mouse operation ....................................................................... 38
4.7 Help Information ..................................................................................................... 39
4.8 Communication and Remote Control ..................................................................... 39
4.9 Troubleshooting ...................................................................................................... 40
5 Set Up a Measurement ....................................................................................................... 42
5.1 Measurement parameters ...................................................................................... 42
5.1.1
S parameters ......................................................................................................... 42
5.1.2
Receiver Measurement ......................................................................................... 42
5.1.3
Balanced Measurement ........................................................................................ 43
5.1.4
Wave ..................................................................................................................... 46
5.1.5
Ratio ...................................................................................................................... 48
5.2 Frequency range .................................................................................................... 48
5.2.1
Set the frequency range ........................................................................................ 49
5.2.2
CW time sweep or power sweep........................................................................... 49
5.2.3
Frequency resolution ............................................................................................. 50
5.3 Power level ............................................................................................................. 50
5.4 Sweep ..................................................................................................................... 50
5.4.1
Points .................................................................................................................... 50
5.4.2
Sweep type ............................................................................................................ 51
5.5 Trigger ..................................................................................................................... 54
5.5.1
Trigger Settings ..................................................................................................... 54
5.5.2
Trigger source ....................................................................................................... 54
5.5.3
Trigger Range ....................................................................................................... 55
5.5.4
Channel Settings ................................................................................................... 55
5.5.5
Trigger mode ......................................................................................................... 56
5.5.6
External and auxiliary triggers ............................................................................... 57
5.6 Data format ............................................................................................................. 60
5.6.1
Display format ....................................................................................................... 60
5.6.2
Cartesian coordinates display format .................................................................... 60
5.6.3
Polar coordinates .................................................................................................. 62
5.6.4
Smith circle diagram .............................................................................................. 63
5.7 Scale ....................................................................................................................... 65
5.7.1
Scale/ reference level and position ....................................................................... 65
5.7.2
Scaling coupling .................................................................................................... 66
5.7.3
Electrical delay ...................................................................................................... 67
5.7.4
Amplitude offset and amplitude slope ................................................................... 68
5.7.5
Phase deviation ..................................................................................................... 68
5.7.6
Divisions ................................................................................................................ 69
Page 5

SHN900A User Manual
www.siglent.com
3
5.7.7
Scale type .............................................................................................................. 69
5.8 Avg BW And IFBW ................................................................................................. 70
5.8.1
Overview ............................................................................................................... 70
5.8.2
Averaging .............................................................................................................. 70
5.8.3
IF Bandwidth ......................................................................................................... 71
5.8.4
Smoothing ............................................................................................................. 72
5.9 Preset instructions .................................................................................................. 73
6 Measurement Calibration ................................................................................................... 76
6.1 Overview ................................................................................................................. 76
6.2 Calibration type ....................................................................................................... 77
6.3 Checking Calibration Status ................................................................................... 80
6.3.1
Execution Status of Error Correction for Each Channel ....................................... 80
6.3.2
Execution Status of Error Correction for Each Trace ............................................ 82
6.3.3
Acquisition Status of Calibration Coefficient for Each Channel ............................ 82
6.3.4
Procedure to turn on/off calibration property display ............................................ 83
6.4 S parameter calibration .......................................................................................... 84
6.4.1
S parameter calibration Kit management .............................................................. 84
6.4.2
S Parameter calibration wizard ............................................................................. 96
6.4.3
Open Response Calibration .................................................................................. 98
6.4.4
Short circuit response calibration(One Port
)
.................................................... 99
6.4.5
Full 1 port OSL calibration ..................................................................................... 99
6.4.6
Transmission response calibration (two ports) ................................................... 100
6.4.7
Enhanced response calibration (two ports) ......................................................... 101
6.4.8
SOLT calibration (two ports) ................................................................................ 102
6.4.9
SOLR unknown through calibration (two ports) .................................................. 103
6.4.10
TRL Direct Reflection Transmission Line Calibration (Two Ports) ...................... 104
6.4.11
Partial Overwrite calibration ................................................................................ 104
6.5 Internal source power calibration ......................................................................... 105
6.6 Receiver calibration .............................................................................................. 107
6.7 Port extension ....................................................................................................... 108
6.8 Fixture measurement function ............................................................................... 111
6.9 Adapter removal / insertion function ..................................................................... 117
6.10 Ecal ....................................................................................................................... 119
6.10.1
ECal Overview..................................................................................................... 119
6.10.2
ECal Config ......................................................................................................... 120
6.10.3
Confidence Check ............................................................................................... 121
6.10.4
Orientation ........................................................................................................... 122
6.10.5
Characterization .................................................................................................. 123
7 Data Analysis ..................................................................................................................... 125
Page 6

SHN900A User Manual
4
www.siglent.com
7.1 Marker ................................................................................................................... 125
7.1.1
Ordinary marker: ................................................................................................. 125
7.1.2
Reference marker: .............................................................................................. 125
7.1.3
Marker setting:..................................................................................................... 125
7.1.4
Marker Display: ................................................................................................... 128
7.1.5
Marker function:................................................................................................... 128
7.1.6
Marker search function: ....................................................................................... 129
7.2 Mathematical operation / Memory Operations ..................................................... 134
7.3 Conversion ............................................................................................................ 134
7.4 Equation editor ..................................................................................................... 136
7.5 Trace statistics ...................................................................................................... 145
7.6 Limit test ............................................................................................................... 145
7.7 Point Limit test ...................................................................................................... 148
7.8 Ripple limit test ..................................................................................................... 150
7.9 Bandwidth limit test ............................................................................................... 152
7.10 Time domain ......................................................................................................... 153
7.10.1
Transform ............................................................................................................ 153
7.10.2
Gating .................................................................................................................. 155
7.10.3
Window ................................................................................................................ 156
7.10.4
Coupling .............................................................................................................. 157
7.10.5
Marker ................................................................................................................. 159
7.10.6
Advance .............................................................................................................. 160
8 Guide For the TDR Option ................................................................................................ 162
8.1 Overview ............................................................................................................... 162
8.2 Open/Close/Preset TDR Option ........................................................................... 163
8.3 TDR Setup Wizard ................................................................................................ 164
8.4 Calibration for TDR Option ................................................................................... 165
8.4.1
Deskew ................................................................................................................ 165
8.4.2
Deskew & Loss Compensation ........................................................................... 166
8.5 TDR Channel Setup ............................................................................................. 167
8.5.1
DUT Topology ...................................................................................................... 168
8.5.2
DUT Length ......................................................................................................... 168
8.5.3
Stimulus Magnitude in Time Domain .................................................................. 169
8.5.4
Port Impedance ................................................................................................... 169
8.5.5
Velocity Factor & Dielectric Constant .................................................................. 169
8.5.6
Power Level......................................................................................................... 169
8.5.7
Average ............................................................................................................... 170
8.5.8
IF Bandwidth ....................................................................................................... 170
8.5.9
Trigger Mode ....................................................................................................... 170
Page 7

SHN900A User Manual
www.siglent.com
5
8.6 TDR Trace Setup .................................................................................................. 171
8.6.1
Select a Trace ..................................................................................................... 171
8.6.2
Trace Scale Settings ........................................................................................... 171
8.6.3
Memory Trace Management ............................................................................... 172
8.6.4
Measure Parameter & Format ............................................................................. 172
8.6.5
Stimulus in Time Domain .................................................................................... 174
8.6.6
Smoothing ........................................................................................................... 174
8.6.7
Trace Allocation ................................................................................................... 174
8.6.8
Trace Setup Coupling .......................................................................................... 175
8.6.9
Time Domain Gating ........................................................................................... 175
8.6.10
DC Value ............................................................................................................. 176
8.7 TDR Data Analysis & Output ................................................................................ 177
8.7.1
Marker Setup ....................................................................................................... 177
8.7.2
Rise Time Search ................................................................................................ 177
8.7.3
Delta Time Search ............................................................................................... 177
8.7.4
Peeling ................................................................................................................ 178
8.7.5
File & Data Output ............................................................................................... 178
8.8 Eye Diagram Simulation ....................................................................................... 179
8.8.1
Overview ............................................................................................................. 179
8.8.2
Stimulus Bit Pattern ............................................................................................. 180
8.8.3
Stimulus Signal Setup ......................................................................................... 181
8.8.4
Eye Diagram Analysis ......................................................................................... 182
8.8.5
Eye Diagram Scale Management ....................................................................... 182
8.8.6
Mask Test for Eye Diagram ................................................................................. 183
8.8.7
Jitter & Statistical Eye Diagram ........................................................................... 183
8.9 TDR Advanced Waveform Function ..................................................................... 185
8.9.1
View point ............................................................................................................ 185
8.9.2
Emphasis/De-emphasis ...................................................................................... 186
8.9.3
De-embedding ..................................................................................................... 186
8.9.4
Equalization ......................................................................................................... 187
8.10 Hot TDR measurement ......................................................................................... 189
8.10.1
Overview ............................................................................................................. 189
8.10.2
Usage Guidelines ................................................................................................ 190
9 Guide for the SA Option ................................................................................................... 192
9.1 Overview ............................................................................................................... 192
9.2 User Interface ....................................................................................................... 192
9.3 Create a Spectrum Analysis Channel .................................................................. 193
9.4 Spectrum Analyzer Settings ................................................................................. 194
9.4.1
SA Tab Setting ..................................................................................................... 194
Page 8

SHN900A User Manual
6
www.siglent.com
9.4.2
SA Tab Processing setup .................................................................................... 197
9.4.3
Source Tab .......................................................................................................... 199
9.4.4
Advanced Tab ...................................................................................................... 201
9.4.5
Trace setup ......................................................................................................... 203
9.5 Spectrum Analysis measurement ......................................................................... 207
9.5.1
Marker → SA ....................................................................................................... 207
9.5.2
Channel Power .................................................................................................... 208
9.5.3
ACPR .................................................................................................................. 209
9.5.4
Occupied BW ...................................................................................................... 211
10 The Frequency Offset Measurement ............................................................................... 214
10.1 Overview ............................................................................................................... 214
10.2 Frequency Offset Mode ........................................................................................ 214
10.2.1
Frequency Offset settings ................................................................................... 214
11 Cable and Antenna Mode ................................................................................................. 218
11.1 Overview ............................................................................................................... 218
11.2 Create a CAT Channel ......................................................................................... 218
11.3 Freq/Dist ............................................................................................................... 218
11.4 Meas Settings ....................................................................................................... 220
11.4.1
Distance to Fault Measurement .......................................................................... 220
11.4.2
Time Domain Reflection Measurement ............................................................... 224
11.4.3
Insertion Loss Measurement ............................................................................... 228
11.4.4
Return Loss Measurements ................................................................................ 229
11.4.5
Cable Loss Measurements ................................................................................. 230
11.4.6
VSWR Measurements ......................................................................................... 231
12 Save and Recall ................................................................................................................. 233
13 System setting ................................................................................................................... 236
13.1 System Configuration ........................................................................................... 236
13.1.1
File Browser ........................................................................................................ 236
13.1.2
Firmware Upgrade .............................................................................................. 237
13.1.3
Date/Time setting ................................................................................................ 237
13.1.4
Screenshot setting .............................................................................................. 238
13.1.5
Screensaver ........................................................................................................ 238
13.1.6
System language ................................................................................................ 238
13.1.7
Power .................................................................................................................. 239
13.2 Input and Output Setting ...................................................................................... 239
13.2.1
Network Setting ................................................................................................... 239
13.2.2
BIAS .................................................................................................................... 240
13.2.3
GPIB .................................................................................................................... 241
13.2.4
External Device ................................................................................................... 241
Page 9

SHN900A User Manual
www.siglent.com
7
13.2.5
GPS Receiver...................................................................................................... 241
13.3 Preset ................................................................................................................... 242
13.3.1
Preset Setting ...................................................................................................... 242
13.3.2
Factory Reset ...................................................................................................... 243
13.4 Help information ................................................................................................... 244
13.4.1
Help Documents .................................................................................................. 244
13.4.2
About ................................................................................................................... 244
13.4.3
Message Setting ................................................................................................. 244
13.4.4
View Message ..................................................................................................... 244
13.5 Buzzer ................................................................................................................... 245
13.6 Self-Test ................................................................................................................ 245
13.6.1
Key and touch screen test ................................................................................... 245
13.7 Options ................................................................................................................. 245
13.8 External Ports ....................................................................................................... 245
14 Service and Support ......................................................................................................... 246
14.1 Ordering and activating the options ..................................................................... 246
14.2 Warranty overview ................................................................................................ 247
14.3 Contact Us ............................................................................................................ 247
Page 10

SHN900A User Manual
8
www.siglent.com
1 Copyright and Declaration
Copyright
SIGLENT TECHNOLOGIES CO., LTD.
All Rights Reserved.
Trademark Information
SIGLENT
is the registered trademark of
SIGLENT TECHNOLOGIES CO., LTD.
Declaration
⚫ SIGLENT products are protected by patent law in and outside of P.R.C.
⚫ SIGLENT reserves the right to modify or change parts of or all the specifications or pricing
policies at company’s sole decision.
⚫ Information in this publication replaces all previously corresponding material.
⚫ Any way of copying, extracting or translating the contents of this manual is not allowed without
the permission of SIGLENT.
Product Certification
SIGLENT
guarantees this product conforms to the national and industrial stands in China and other
international stands conformance certification is in progress.
Page 11

SHN900A User Manual
www.siglent.com
9
2 General Safety Summary
Carefully read the following safety precautions to avoid any personal injury or damage the instrument
and avoid any products connected to it. To avoid potential hazards, please use the instrument as
specified.
Protection is impaired if used in a manner not specified by the manufacturer.
2.1 Precautions for Operation
Before operating this product, special training is required to ensure that the user is physically, mentally
and emotionally healthy and able to use the network analyzer, otherwise it may cause personal injury
or material damage. Employers、operators are responsible for selecting suitable personnel to operate
this product.
Before moving or transporting this product. Please read and observe the "Safety Transportation
Matters" chapter.
As with all industrial products, the use of substances that cause allergic reactions such as nickel
cannot generally be ruled out. If you experience an allergic reaction while using this product, please
consult a doctor in time to determine the cause.
Before you perform mechanical or heat treatment or disassemble the network analyzer, please be
sure to read and pay special attention to the "Waste Disposal/Environmental Protection" chapter.
In the event of a fire, this product may release harmful substances (gas, liquids, etc.), causing health
problems. Therefore, appropriate measures must be taken, for example, protective masks and
protective clothing must be worn.
Page 12
SHN900A User Manual
10
www.siglent.com
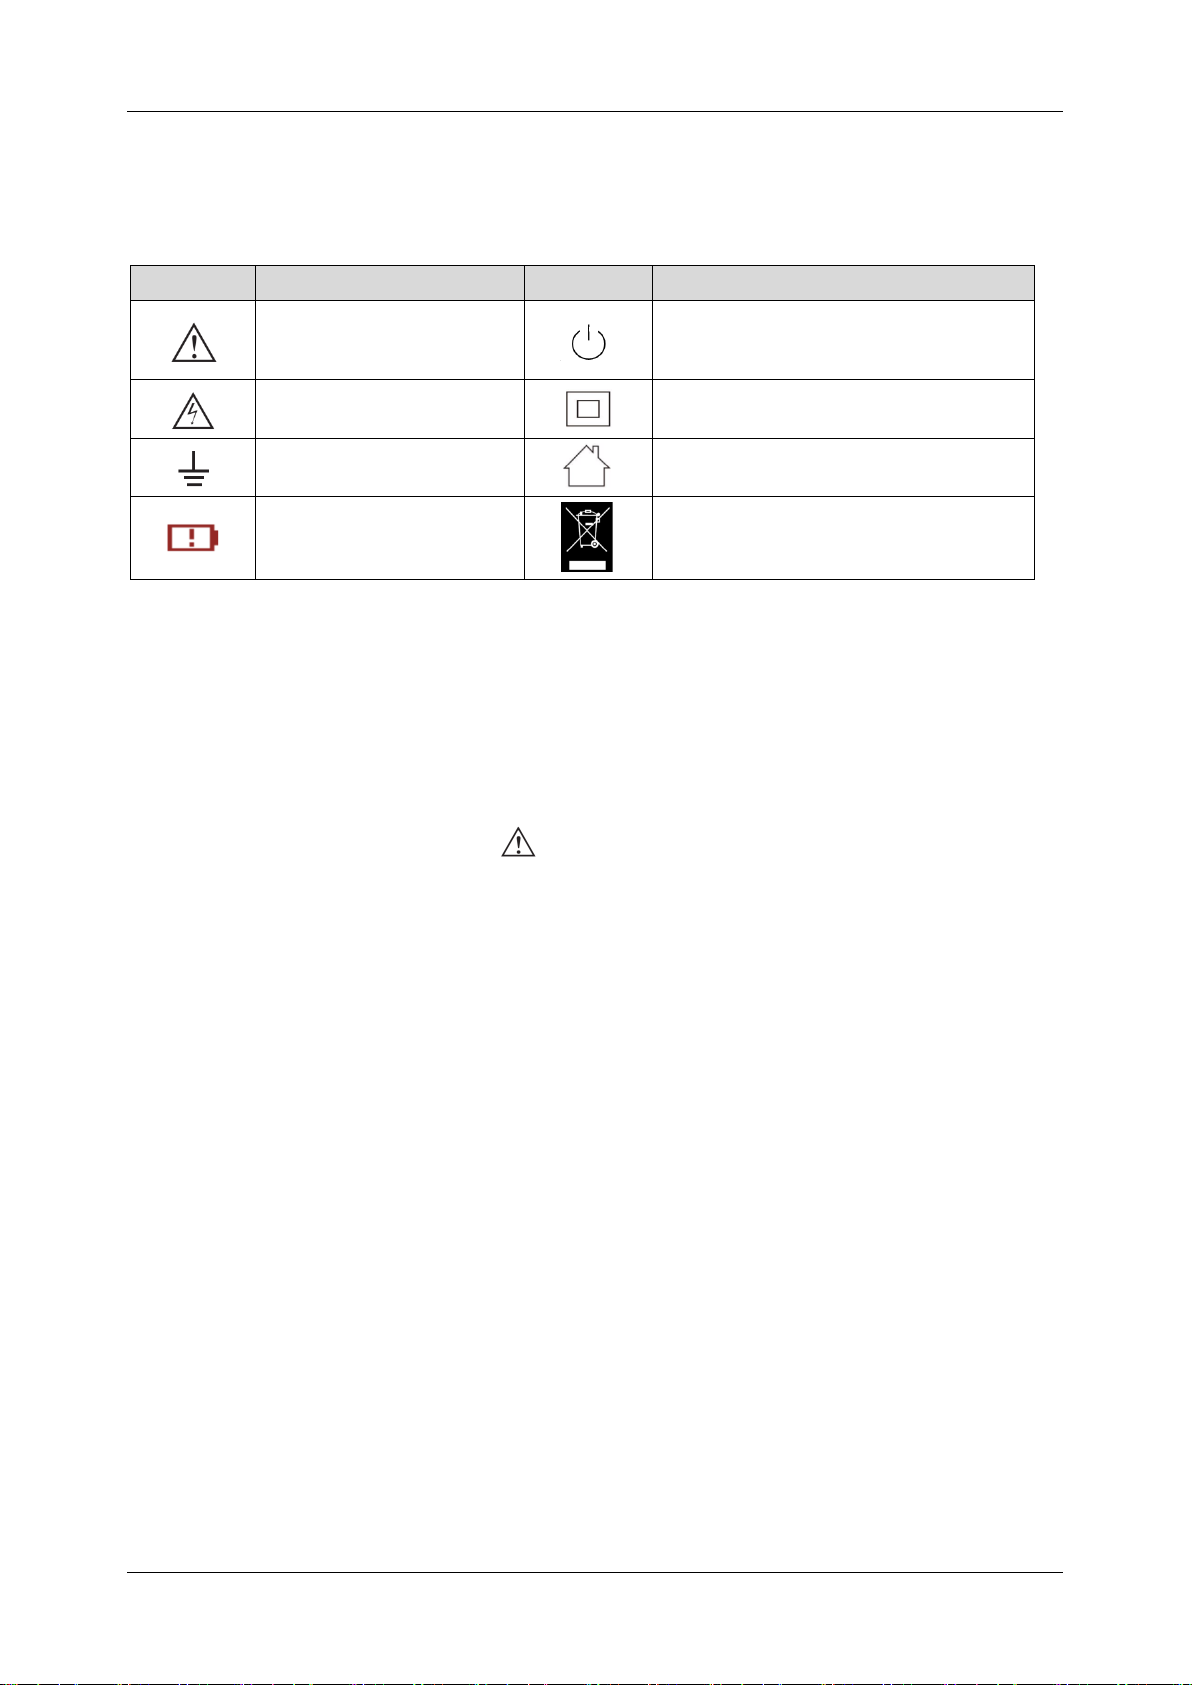
2.2 Safety Terms and Symbols
The meaning of symbols
symbol
meaning
symbol
meaning
Warning
Power Switch
Hazardous Voltage
Equipment meeting double
insulation or reinforced insulation
EarthGround
Indoor use only
Lithium battery failure
EU label for separately recycled
electrical and electronic equipment
Cue and its meaning
DANGER : Indicates direct injury or hazards that may happen.
WARNING : Indicates potential injury or hazards that may happen.
CAUTION : Indicates potential damage to the instrument or other property that may happen.
It must be consulted in all cases where is marked, in order to find out the nature of the potential
HAZARDS and any actions which have to be taken to avoid them.
2.3 Safety Operation Matters
The product can only be operated under the safe conditions and positions specified by the
manufacturer. Do not obstruct the ventilation of the network analyzer during use. Failure to comply
with the manufacturer's specifications may result in electric shock, fire, serious personal injury, or
even death. Applicable local safety regulations and accident prevention rules must be observed in all
applications.
When powered by a power adapter, it can only be used indoors.
Do not place the product on surface, vehicle, cabinet or tables that for reasons of weight or stability
are unsuitable for this purpose. When installing the product and fastening it to the article or structures,
always follow the manufacturer's installation instructions. If the installation is not carried out in
accordance with the requirements of the document, it may cause personal injury or even death.
Do not use this product in or near a heat source, and the ambient temperature cannot exceed the
Page 13

SHN900A User Manual
www.siglent.com
11
maximum temperature in the document or datasheet
2.4 Safety of Electricity
If you ignore the electrical safety methods, electric shock, fire and/or serious personal injury or death
may occur.
Only use the power adapter and battery specified by the manufacturer to power the network analyzer,
and the power adapter can only work within its rated input voltage range.
Only the probe specified by the manufacturer can be used for testing. The use of non-manufacturer
probes for testing may result in electric shock accidents.
The user is not allowed to damage the insulation protection layer of the network analyzer and
accessories. Doing so may cause electric shock. If an extension cord or terminal block is used for
power supply, it must be checked regularly to ensure safe use.
Before use, please check whether the power cord and probe are damaged. If the power cord and
probe are damaged, please do not continue to use the product.
Do not insert the AC plug of the power adapter into a dusty or dirty socket. Please make sure that the
plug is firmly inserted into the socket, otherwise it may cause fire and/or injury due to sparks.
Do not overload any sockets, extension cords or connectors. Doing so may cause fire or electric
shock.
When the measured voltage Vrms exceeds 30V, you should take appropriate measurement methods
to avoid any danger.
Unless expressly permitted, do not remove the cover or any part of the shell while the product is in
operation. Doing so will expose circuits and components, reduce the overvoltage level of the
measurement, and may cause personal injury, fire, or damage to the network analyzer.
Anything that is not designed to be placed on the external interface of this product should not be
placed on the external interface, otherwise it will cause an internal short circuit and/or electric shock,
fire or injury to the network analyzer.
Do not place this product in an environment exceeding IP51, otherwise the network analyzer will be
damaged.
This product must be used in a dry environment, otherwise it may cause electric shock.
It is forbidden to use this product when condensation has formed or may form inside or on the surface
of this product. For example, when the network analyzer moves from a cold environment to a warm
Page 14

SHN900A User Manual
12
www.siglent.com
environment, the penetration of water increases the risk of electric shock.
2.5 Safety Transportation Matters
SIGLENT Technology provides handbags for the network analyzer. For short-distance transportation
under supervision, please make sure that the network analyzer is turned off before putting it in the
handbag. For long-distance transportation under unsupervised, please take out the battery and put it
in your handbag.
In order to facilitate the user to hold, SIGLENT Technology has installed a fabric handle on the network
analyzer. This handle cannot be used as a focus point to be fixed on transportation equipment, such
as cranes, forklifts, trucks, etc. It is the user's responsibility to fasten the product firmly to the
transportation or lifting tool.
If you use this product in a vehicle, the driver is responsible for driving the vehicle safely and correctly.
The manufacturer is not responsible for any accidents or collisions. Do not use this product in a
moving vehicle to avoid distracting the driver. Use this product appropriately in the vehicle to prevent
injury or other damage in the event of an accident.
2.6 Battery Usage
This product contains a rechargeable lithium battery pack. If misused, there is a risk of explosion, fire
and / or serious personal injury, and even death in some cases.
The battery cannot be disassembled or crushed.
The battery or battery pack cannot be exposed to high temperature or fire, and it must be stored in
direct sunlight. Keep the battery clean and dry. Use a dry, clean cloth to clean contaminated
connectors.
The battery or battery pack cannot be short-circuited. Batteries or battery packs should not be stored
in an environment that can easily cause a short circuit, such as boxes and drawers containing metal
debris. The battery pack cannot be taken out of its original packaging before use.
Batteries and battery packs should not be exposed to any mechanical shock that exceeds the
allowable level.
If the battery leaks, do not let the liquid contact the skin or eyes. If contact occurs, wash the contact
area with plenty of water and seek medical assistance.
The power adapter specified by SIGLENT Technology must be used for charging, otherwise it may
Page 15

SHN900A User Manual
www.siglent.com
13
cause a fire or cause personal injury or death.
It must be charged in a well-ventilated room. During the charging process, the network analyzer
should not be covered by objects (such as blankets, towels, clothes), which will affect the heat
dissipation effect and cause a serious fire.
Improper battery replacement may cause an explosion. For the reliability and safety of the network
analyzer, the battery model specified by SIGLENT Technology must be replaced.
Used batteries and battery packs must be recycled and separated from residual waste. Batteries
contain hazardous waste, and local regulations on waste disposal and recycling must be followed.
2.7 Waste Disposal
The used batteries in the product must not be disposed of together with unsorted municipal waste,
they must be collected separately and placed in designated recycling points.
If the product and its components are mechanically and/or thermally processed in a way beyond the
intended use, hazardous substances may be released. Therefore, this product can only be
disassembled by professional personnel. Improper disassembly may endanger your health. The local
waste disposal regulations must be followed.
2.8 Safety Compliance
This section lists the safety standards with which the product complies.
U.S. nationally recognized testing laboratory listing
◼ UL 61010-1:2012/R:2018-11. Safety Requirements for Electrical Equipment for Measurement,
Control, and Laboratory Use – Part 1: General Requirements.
◼ UL 61010-2-030:2018. Safety Requirements for Electrical Equipment for Measurement,
Control, and Laboratory Use – Part2-030: Particular requirements for testing and measuring
circuits.
Canadian certification
◼ CAN/CSA-C22.2 No. 61010-1:2012/A1:2018-11. Safety Requirements for Electrical Equipment
for Measurement, Control, and Laboratory Use – Part 1: General Requirements.
◼ CAN/CSA-C22.2 No. 61010-2-030:2018. Safety Requirements for Electrical Equipment for
Page 16
SHN900A User Manual
14
www.siglent.com
Measurement, Control, and Laboratory Use – Part 2-030: Particular requirements for testing
and measuring circuits.
2.9 General Care and Cleaning
Care
Do not store or leave the instrument in direct sunshine for extended periods of time.
To avoid damages to the instrument or probes, please do not expose them to fog, liquid, or solvents.
Cleaning
Please perform the following steps to clean the instrument and probes regularly in accordance with
its operating conditions.
Disconnect the instrument from all power sources and then clean with a soft wet cloth.
Clean the loose dust on the outside of the instrument and probe with a soft cloth. When cleaning the
LCD, take care to avoid scratching it.
To avoid damage to the surface of the instrument and probe, please do not use any corrosive liquid
or chemical cleansers.
Make sure that the instrument is completely dry before restarting it to avoid potential short circuits or
personal injury.
2.10 Measurement Category
WARNING
Make sure that no measurement overvoltage reach the product, or else the
operator might expose to danger of electric shock.
IEC61010-2-030 defines the measurement category to rate the ability of measuring instruments to
withstand short-term transient overvoltage outside of the working voltage. This product and its
accessories can only be used in the environment of the nominal measurement category.
⚫ CAT Ⅰ:
0- An instrument with no rated measurement category is used to measure circuits that are not
directly connected to the mains, such as a circuit board powered by a battery or a secondary
Page 17
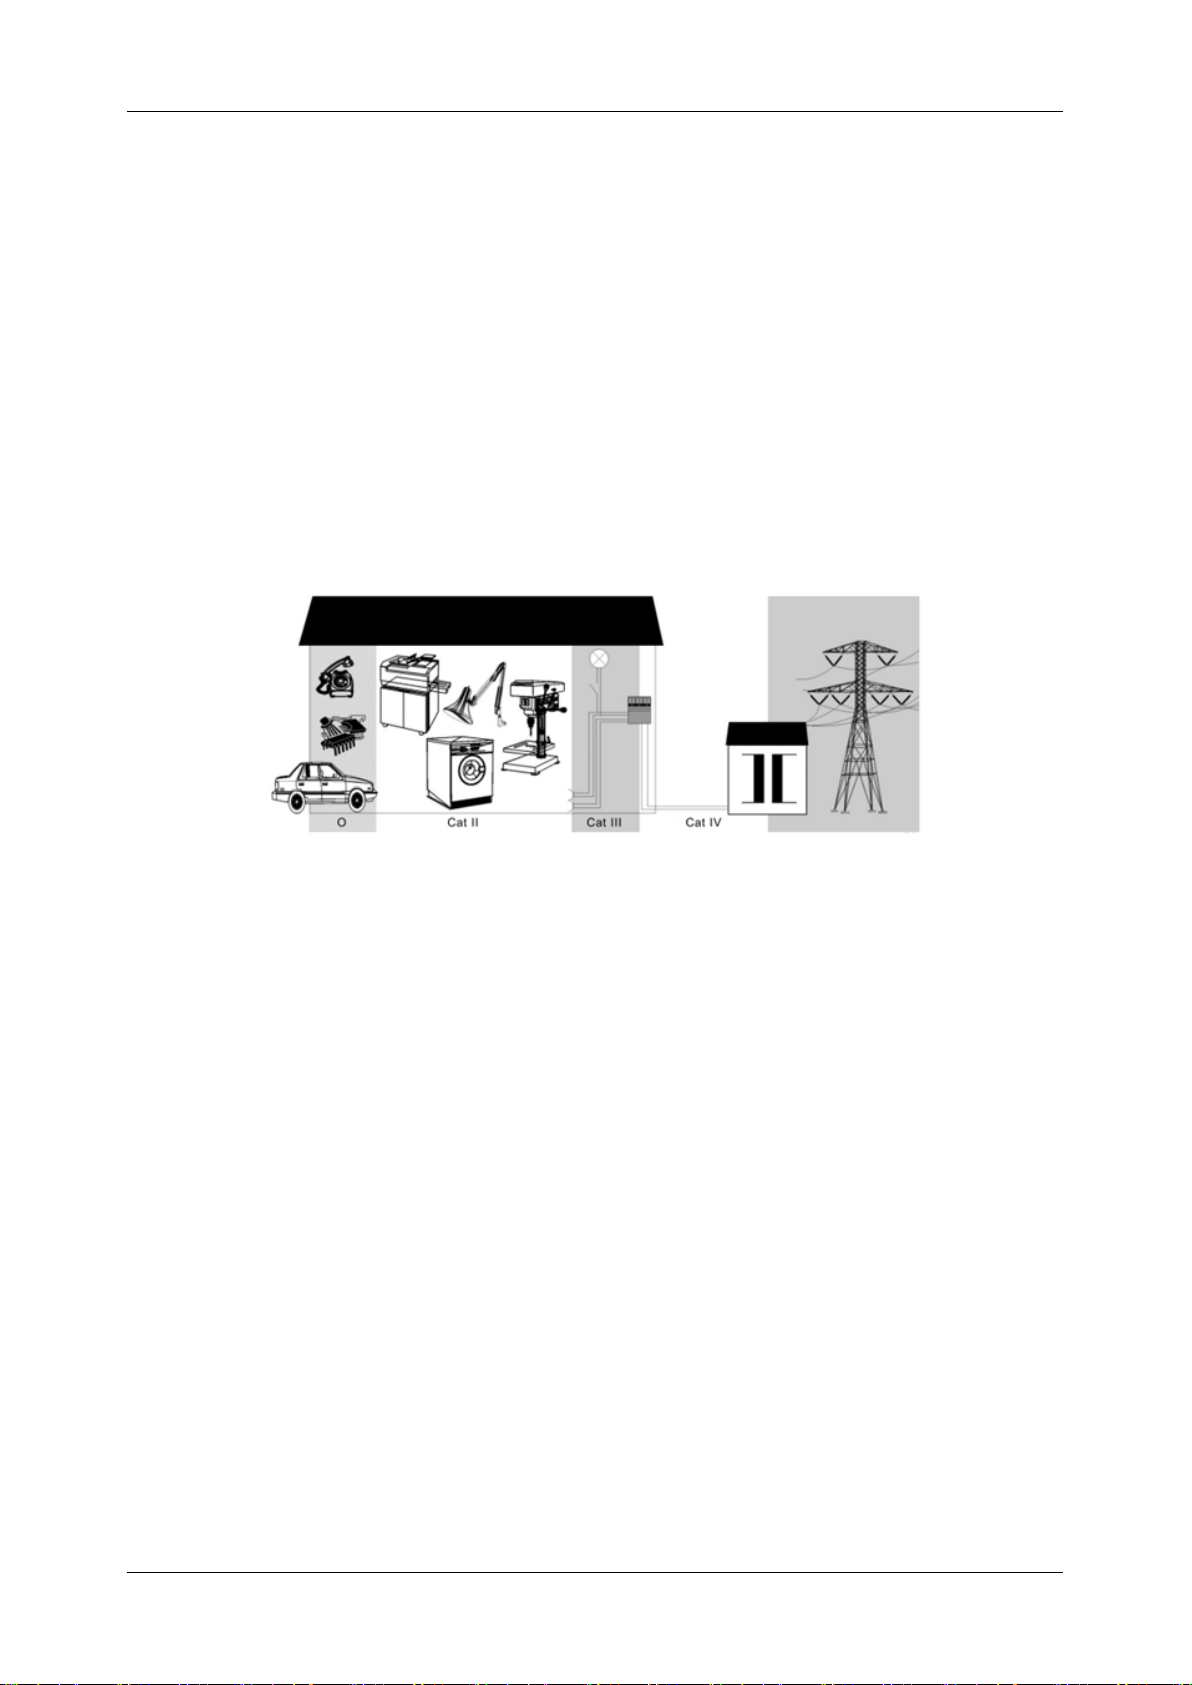
SHN900A User Manual
www.siglent.com
15
circuit with special protection.
⚫ CAT II:
For measurements installed in buildings, such as junction boxes, circuit breakers, distribution
boards and equipment permanently connected to fixed installations.
⚫ CAT III:
Used for measurements installed in buildings, such as junction boxes, circuit breakers,
distribution boards and equipment that are permanently connected to fixed installations.
⚫ CAT IV:
It is used for measuring at the source of low-voltage devices, such as electricity meters and
primary overcurrent protection devices.
Page 18

SHN900A User Manual
16
www.siglent.com
3 Working Environment
3.1 General requirement
Environment
This product is intended for indoor use and should be operated in a clean, dry environment.
It can be stored in an environment with a waterproof/dustproof rating better than IP51.
Temperature
Operating: 0℃ to +40
℃
Non-operation:-20℃ to +60
℃
Note:
Direct sunlight, radiators, and other heat sources should be taken into account when assessing
the ambient temperature.
Humidity
Operating: 85% RH, 40
℃
, 24 hours
Non-operating: 85% RH, 65
℃
, 24 hours
Altitude
Operating: less than 2 km
Non-operation: less than 3 km
Installation (overvoltage) Category
This product is powered by mains conforming to installation (overvoltage) category II.
WARNING
Make sure that no overvoltage (such as that caused by thunderbolt) can
reach the product, or else the operator might expose to danger of electric
shock.
Page 19

SHN900A User Manual
www.siglent.com
17
Installation (overvoltage) Category Definitions
Installation (overvoltage) category I
refers to signal level which is applicable to equipment
measurement terminals connected to the source circuit. In these terminals, precautions are done to
limit the transient voltage to the corresponding low level.
Installation (overvoltage) category II
refers to the local power distribution level which is applicable
to equipment connected to the AC line (AC power).
Degree of Pollution
network analyzers may be operated in environments of
Pollution Degree II
.
Degree of Pollution Definitions
⚫ Degree of Pollution I:
No pollution, or only dry non-conductive pollution occurs. This pollution level has no impact. For
example, clean rooms or air-conditioned office environments.
⚫ Degree of Pollution II:
Generally, only dry non-conductive pollution occurs. Sometimes temporary conductivity may
occur due to condensation. For example: general indoor environment.
⚫ Degree of Pollution III:
Conductive contamination occurs, or dry non-conductive contamination becomes conductive
due to condensation. For example, an outdoor environment with a canopy.
⚫ Degree of Pollution IV:
Produce permanent conductive pollution through conductive dust, rainwater, or snow. For
example: outdoor places.
IP Rating
IP51 (as defined in IEC 60529).Ventilation Requirement
Please make sure that the air intake and exhaust areas are free from obstructions and have free air.
When using the network analyzer in a bench-top or rack setting, provide at least 10 cm clearance
beside, above and behind the instrument for adequate ventilation.
Page 20
SHN900A User Manual
18
www.siglent.com
WARNING
Inadequate ventilation may cause temperature increase which would
damage the instrument. So please keep the instrument well ventilated during
operation.
3.2 AC Power Requirement
The power adapter operates with a single-phase, 100 to 240 Vrms (+/-10%) AC power at 50/60 Hz
(+/-5%).
No manual voltage selection is required because the instrument automatically adapts to line voltage.
Depending on the type and number of options and accessories (probes, PC port plug-in, charging
etc.), When powered by adapter, the analyzer can consume up to 20 W of power.
Note:
The power adapter automatically adapts to the AC line input within the following ranges:
Voltage Range:
90 - 264 Vrms
Frequency Range:
47 - 63 Hz
Please use the power cord and adapter provided by the manufacturer. Use of other non-designated
products may cause personal injury.
WARNING
Electrical Shock Hazard!
Use of an adapter or power supply not specified by the manufacturer may
cause personal injury.
To make the network analyzer completely power off, unplug the instrument power cord from the AC
socket and remove the battery from the analyzer.
The battery should be removed from the analyzer when it is not to be used for an extended period of
time.
Page 21

SHN900A User Manual
www.siglent.com
19
4 Quick Start
This chapter guides users to quickly get familiar with the appearance, panel and the user interface,
as well as announcements during the first use of the analyzer.
4.1 General Inspection
When you get a new analyzer, it is recommended that you proceed through the following steps.
Check to see if there is any damage caused by shipping problems
If the packing case or foam protective pad is seriously damaged, keep it until the whole machine and
accessories pass the electrical and mechanical tests.
Inspection machine
If you notice external damage, contact your
SIGLENT
dealer or local office, and
SIGLENT
will arrange
for a repair or replacement.
Check the accessories
Please check the accessories according to the packing list in the box. If the accessories are
incomplete or damaged, please contact your
SIGLENT
sales representative.
Page 22
SHN900A User Manual
20
www.siglent.com
4.2 Preparing for Use
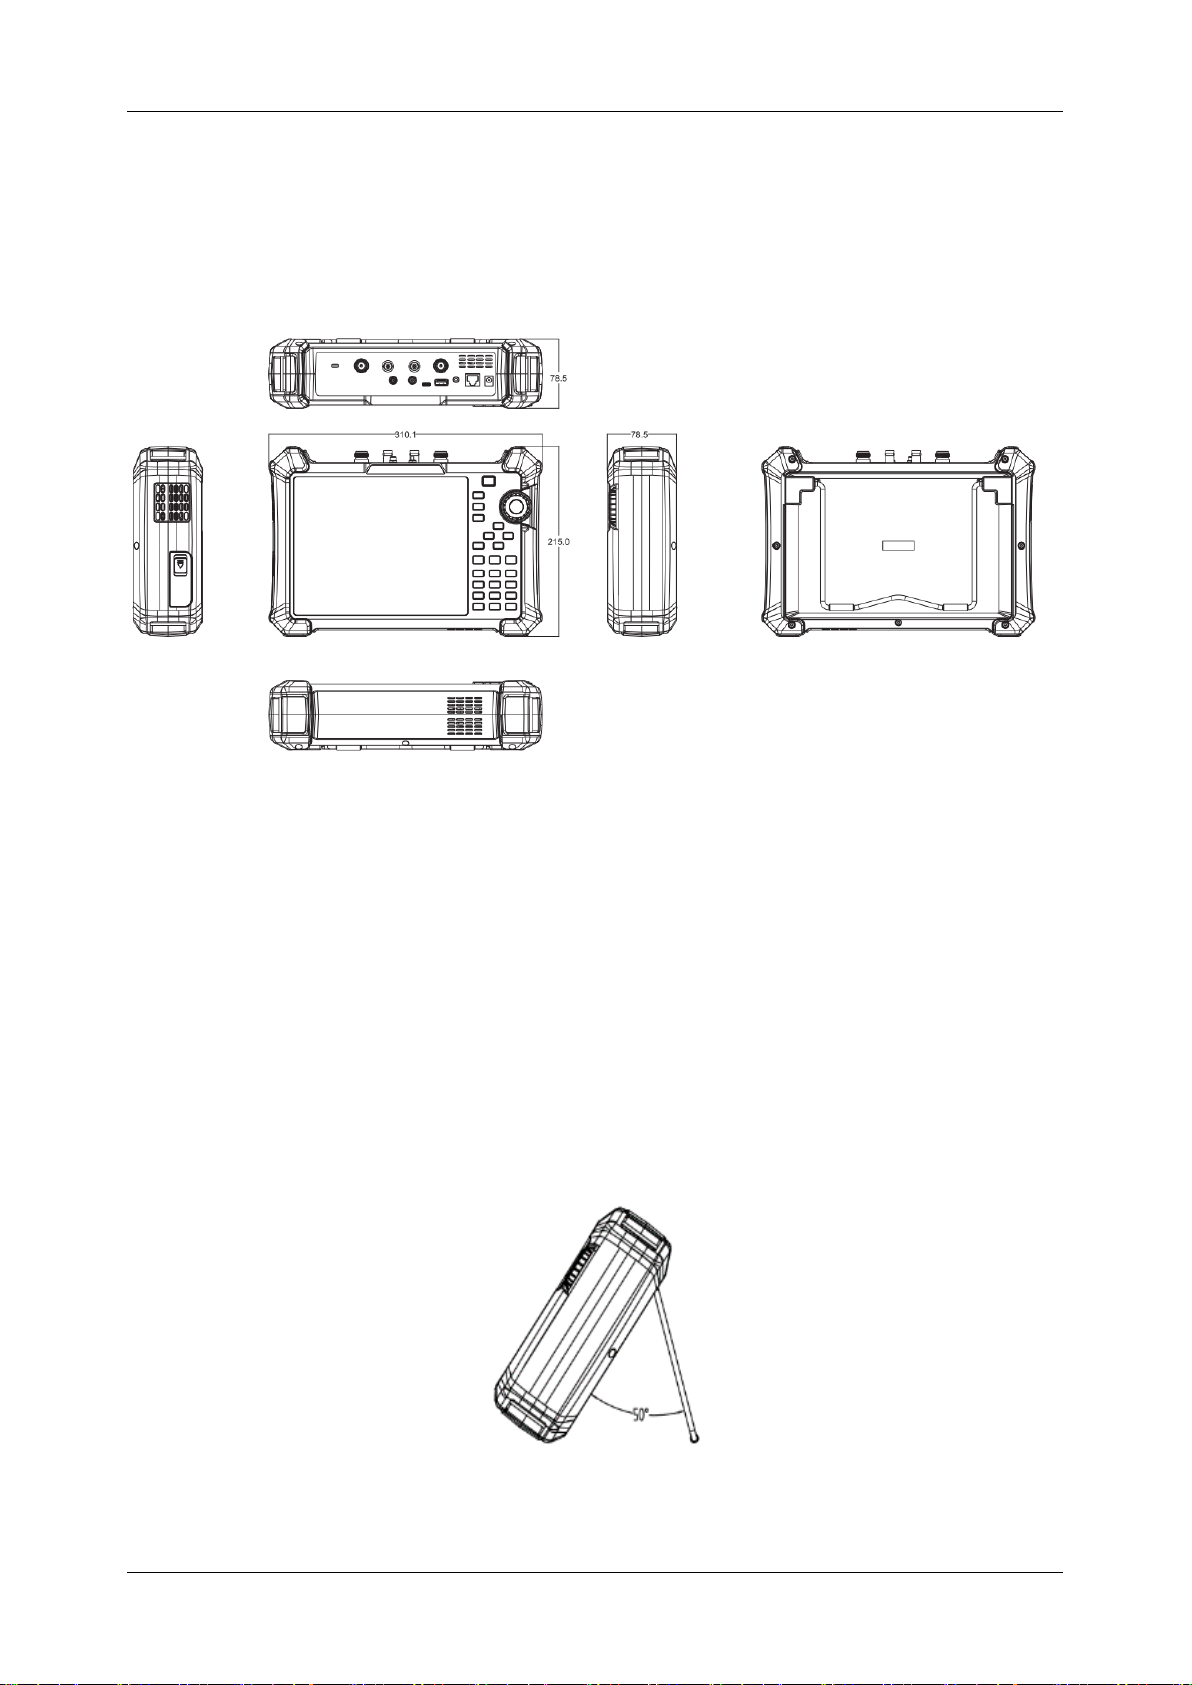
4.2.1 Appearance and Dimension
Figure 4-1 Front and lateral View
4.2.2 Fixed Bracket
The included tilting stand is available for desktop operation. The tilting bracket provides a backward
tilt for improved stability. To deploy the tilt bracket, pull the bottom of the tilt bracket away from the
back of the instrument. To retract the tilting bracket, push the bottom of the bracket toward the back
of the instrument.
Figure 4-2 Side View
Unit:mm
Page 23
SHN900A User Manual
www.siglent.com
21
4.2.3 Power Supply Information
The battery that comes with the analyzer may need to be recharged before use. The device can use
the supplied AC-DC adapter (refer to the product technical data sheet for ordering information). The
specifications of the input AC power supply are: 100-240V, 50/60Hz; Or charge through the on-board
DC adapter in the accessory.
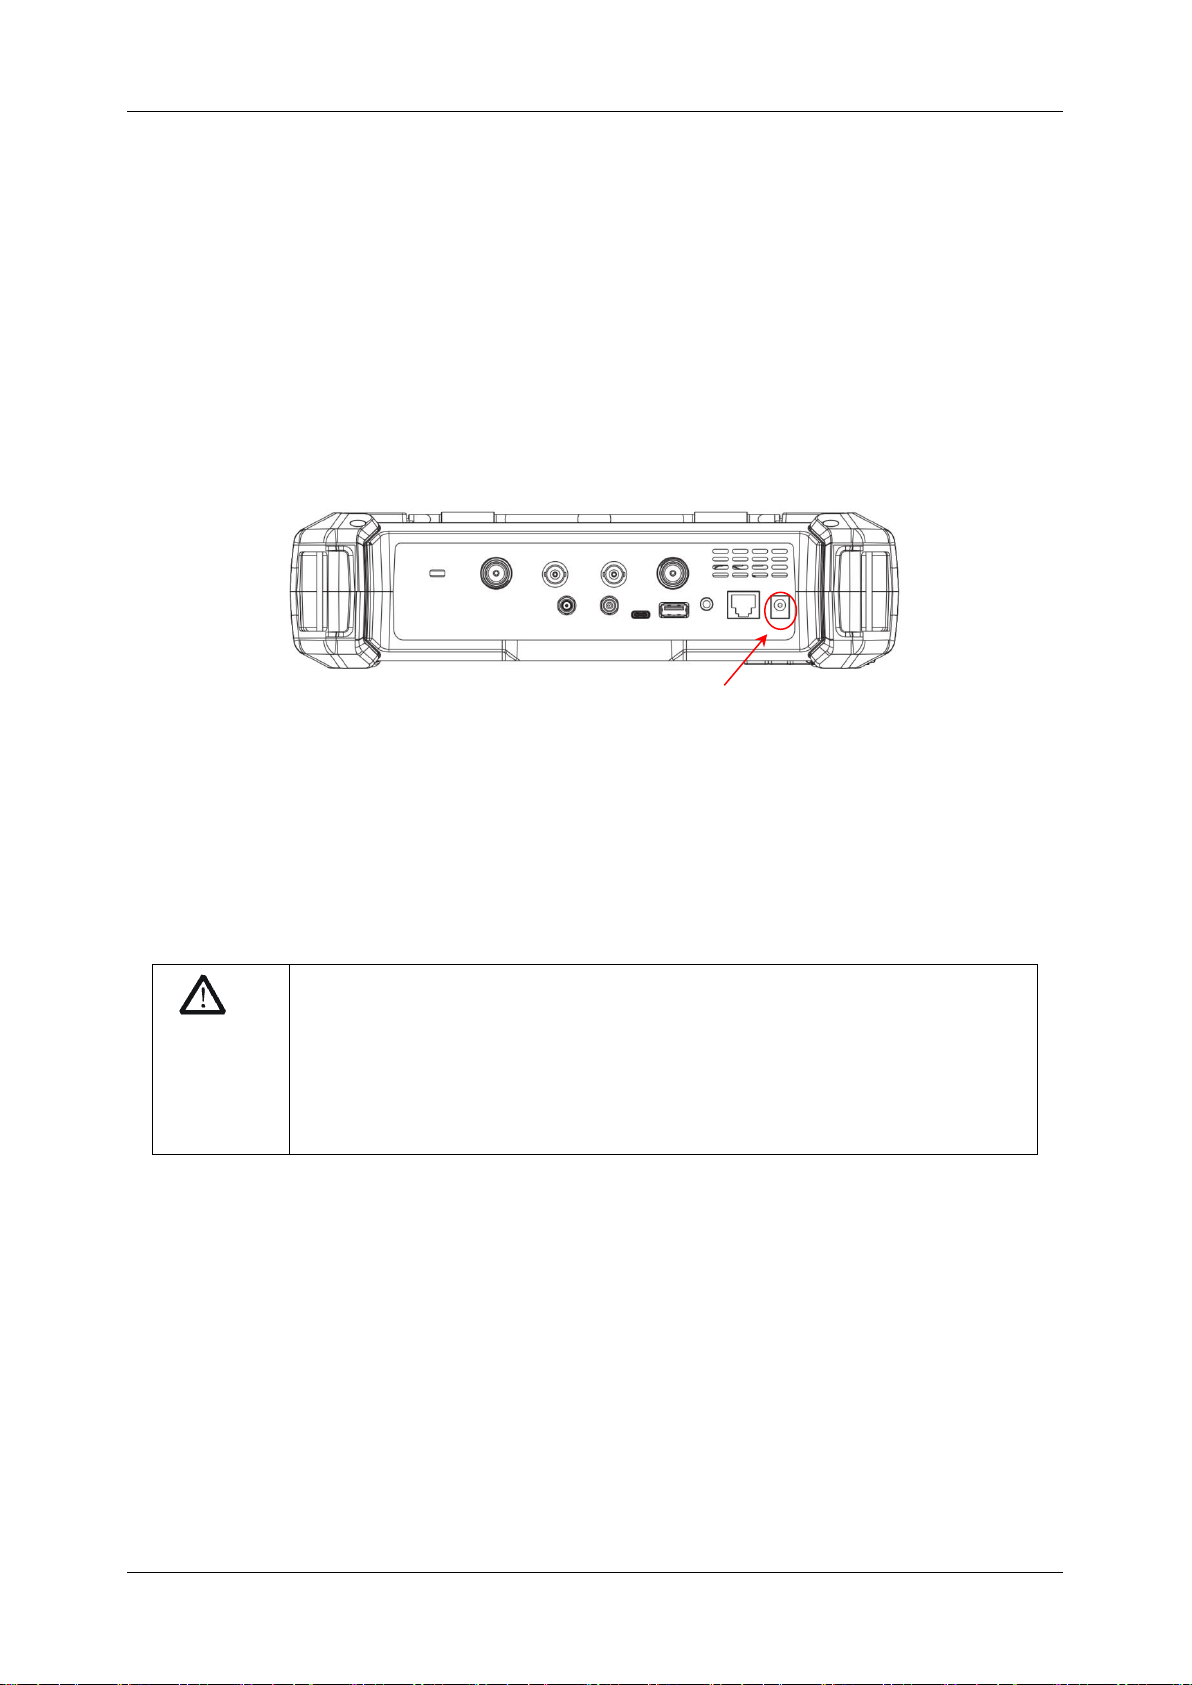
Specifically, the analyzer can be connected to the adapter according to the power socket shown in
the figure below.
Figure 4-3 Rear View and Power
◆ Adapter factory configuration is the 12V 4A
◆ Battery factory installed, the user can change itself
WARNING
This instrument can only use Siglent approved batteries, adapters and
chargers. When using an onboard DC adapter, always ensure that the power
supply is rated at least 75 W @ 15 VDC and that there is no dust or debris
on the socket. If the adapter plug becomes hot during operation, discontinue
use immediately. Siglent recommends taking out the batteries when devices
aren't used for too long.
Power socket
Page 24
SHN900A User Manual
22
www.siglent.com
4.3 Front Panel
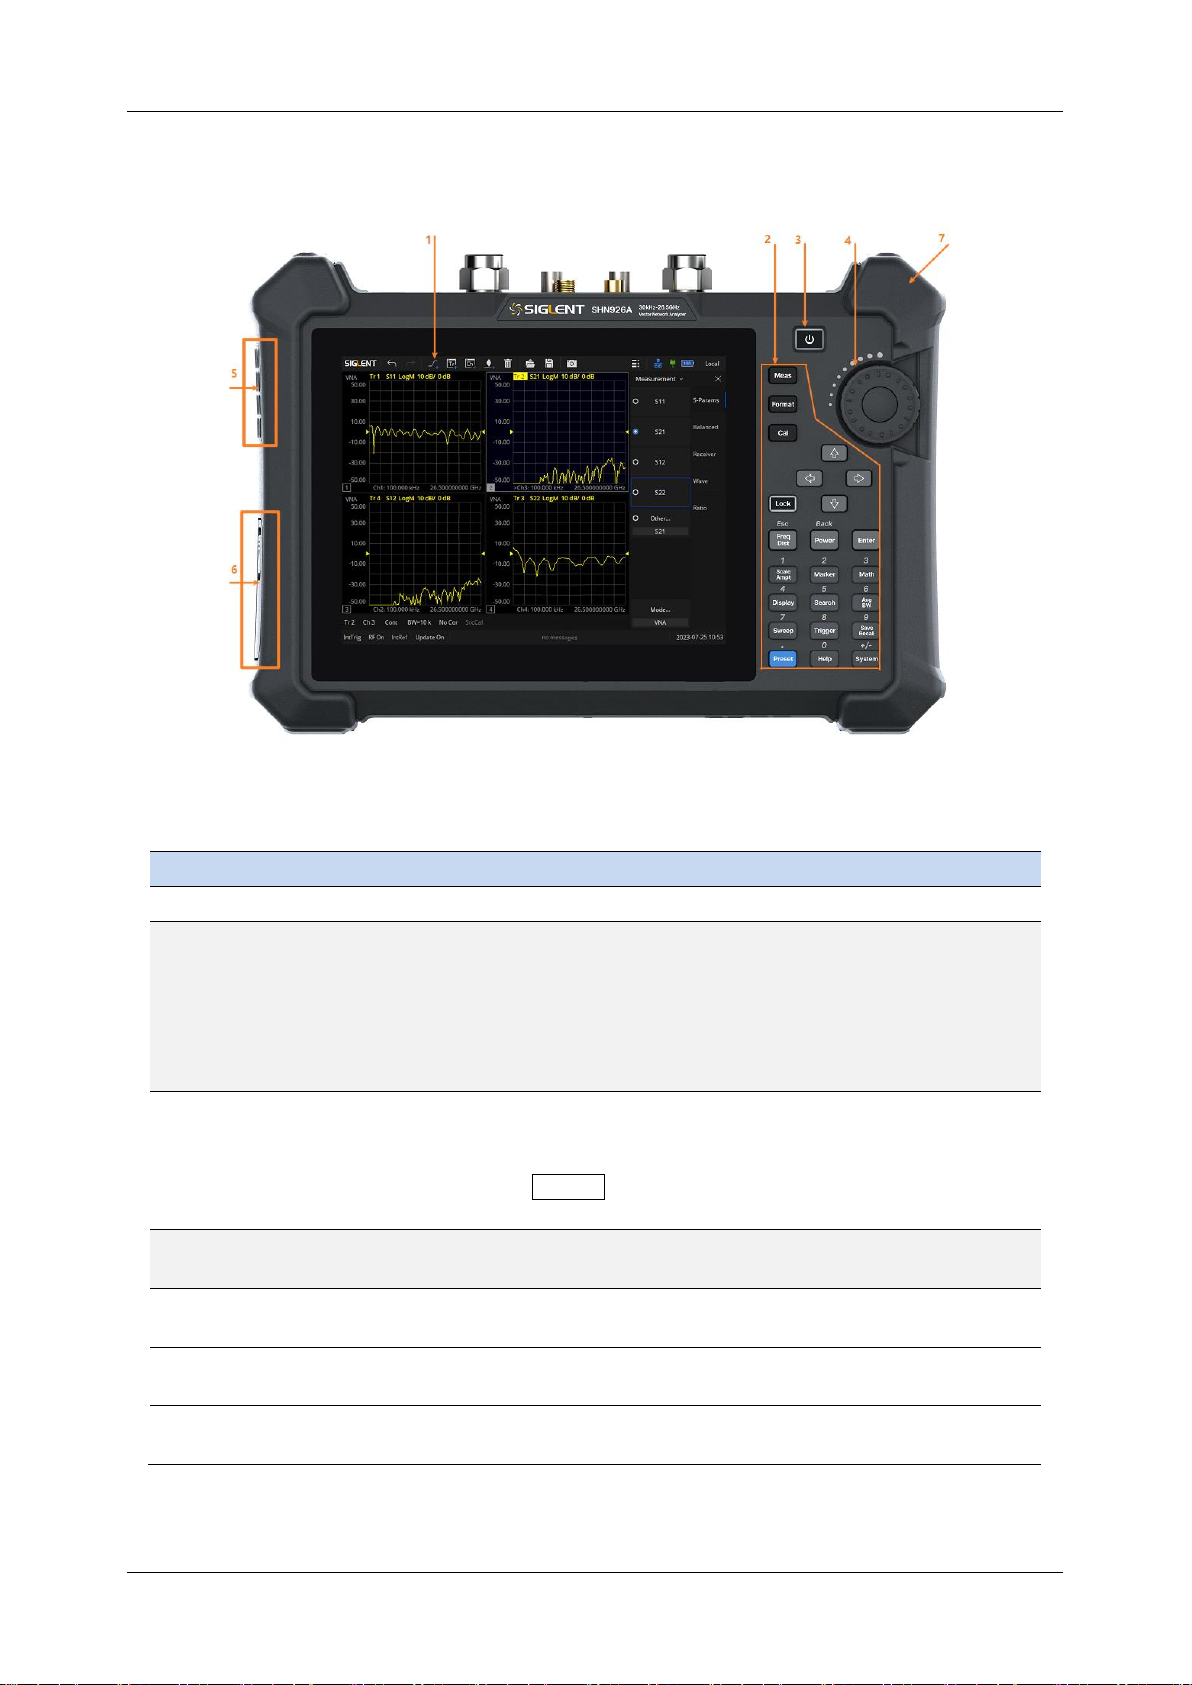
Figure 4-4 the Front Panel
NO.
Name
Description
1
LCD Screen
8.4 inch multi-touch screen, resolution 800*600
2
Power Switch
Stand by status: Orange; Fully charged status: green
Power on status: White
Short press(1 second): Software startup/Shutdown prompt
pops up,to Stand by status with current state saved
Long press(3 second): Hardware shutdown,to Stand by
status without current state saved
3
Function Keys
Complete the function control and parameter input of the
analyzer, and most operations can be completed by the
touch screen.
Press Lock to turn off/on the keyboard and touch
functions.
4
Three-dimensional
knob
Complete the quick adjustment and selection of
parameters.
5
Fan vent
Built-in fan external exhaust port. Please ensure that this
vent is unblocked.
6
Battery case cover
Internal battery protection cover. Remove during battery
replacement.
7
Detachable
hand strap
Convenient hand force, can be installed on both sides.
Page 25
SHN900A User Manual
www.siglent.com
23
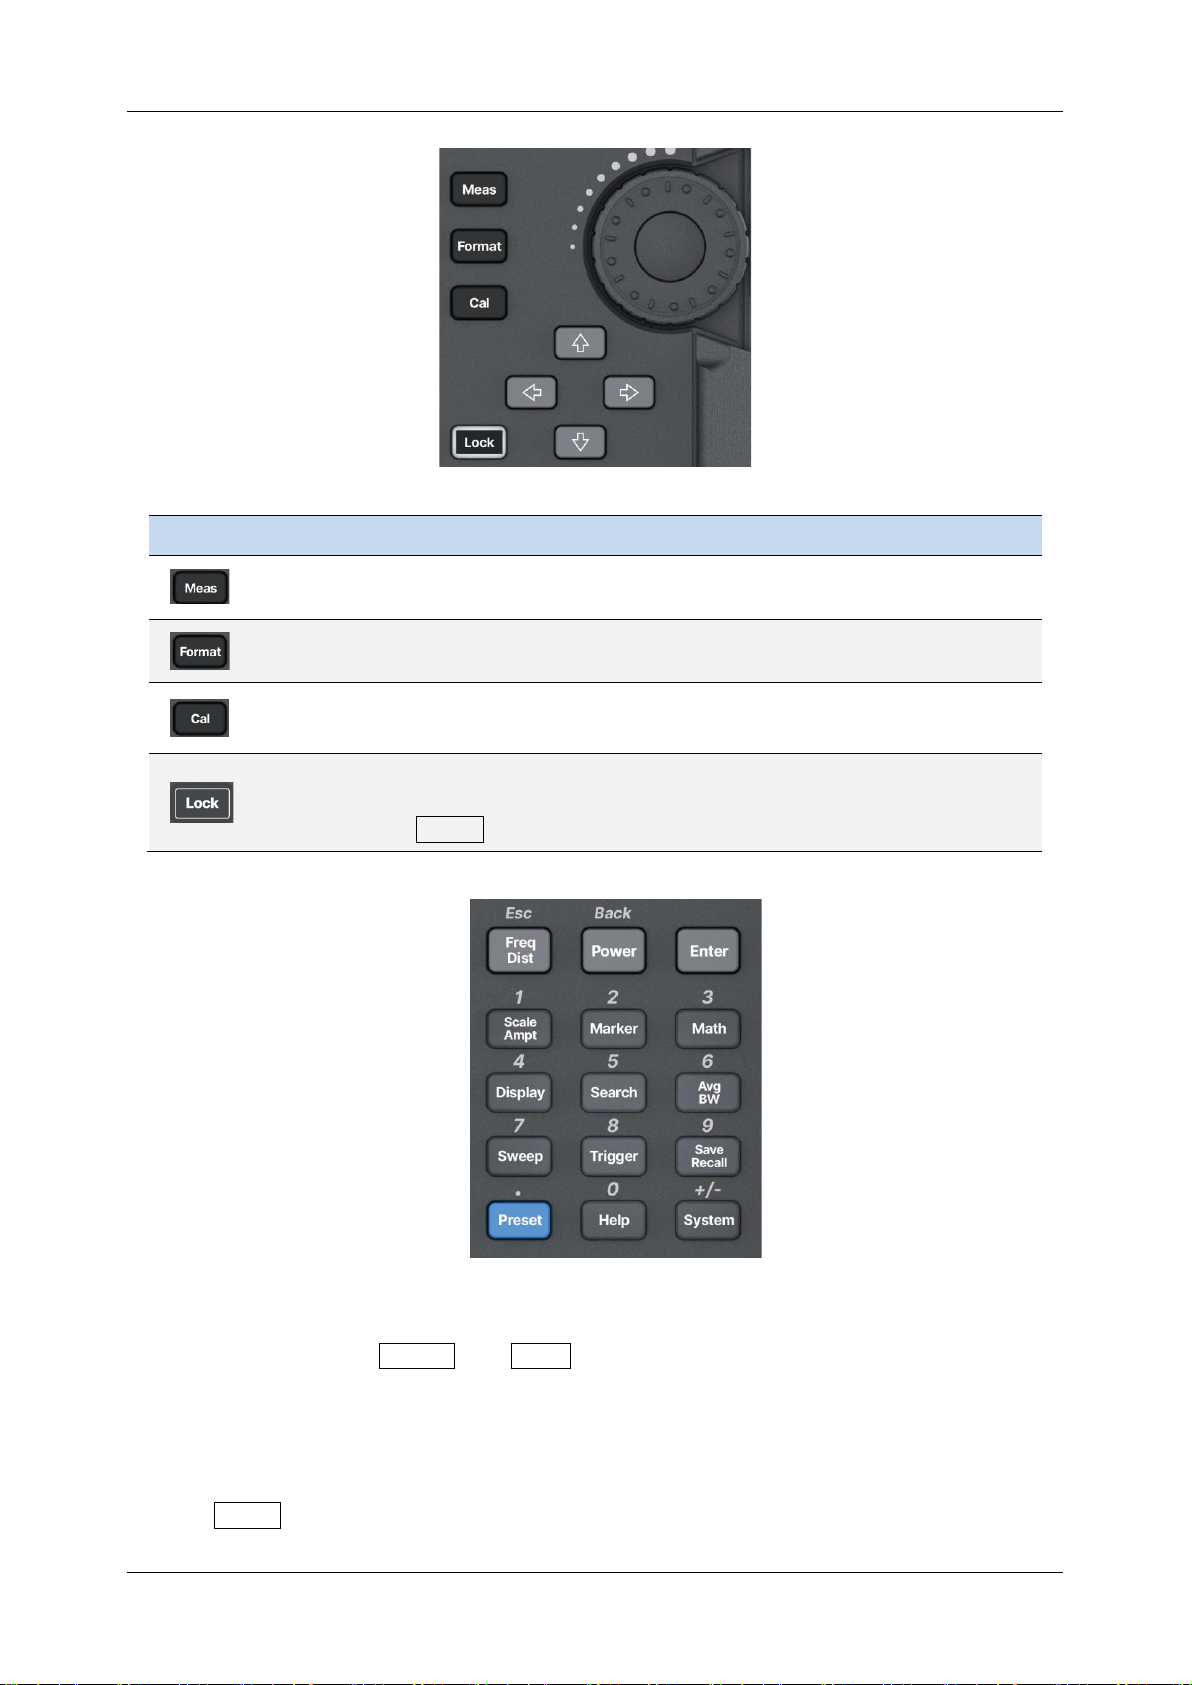
Name
Description
The shortcut item selection button will pop up a measurement item selection
menu on the screen, where you can select a test item.
Shortcut format selection button to select the data format displayed for the
test project.
Quick calibration selection button, call up the calibration item menu, and you
can proceed with subsequent calibration items.
Key and touch screen lock control.
When the button light is on, all key pad buttons and touch screen buttons
except the Lock button are locked to prevent misoperation.
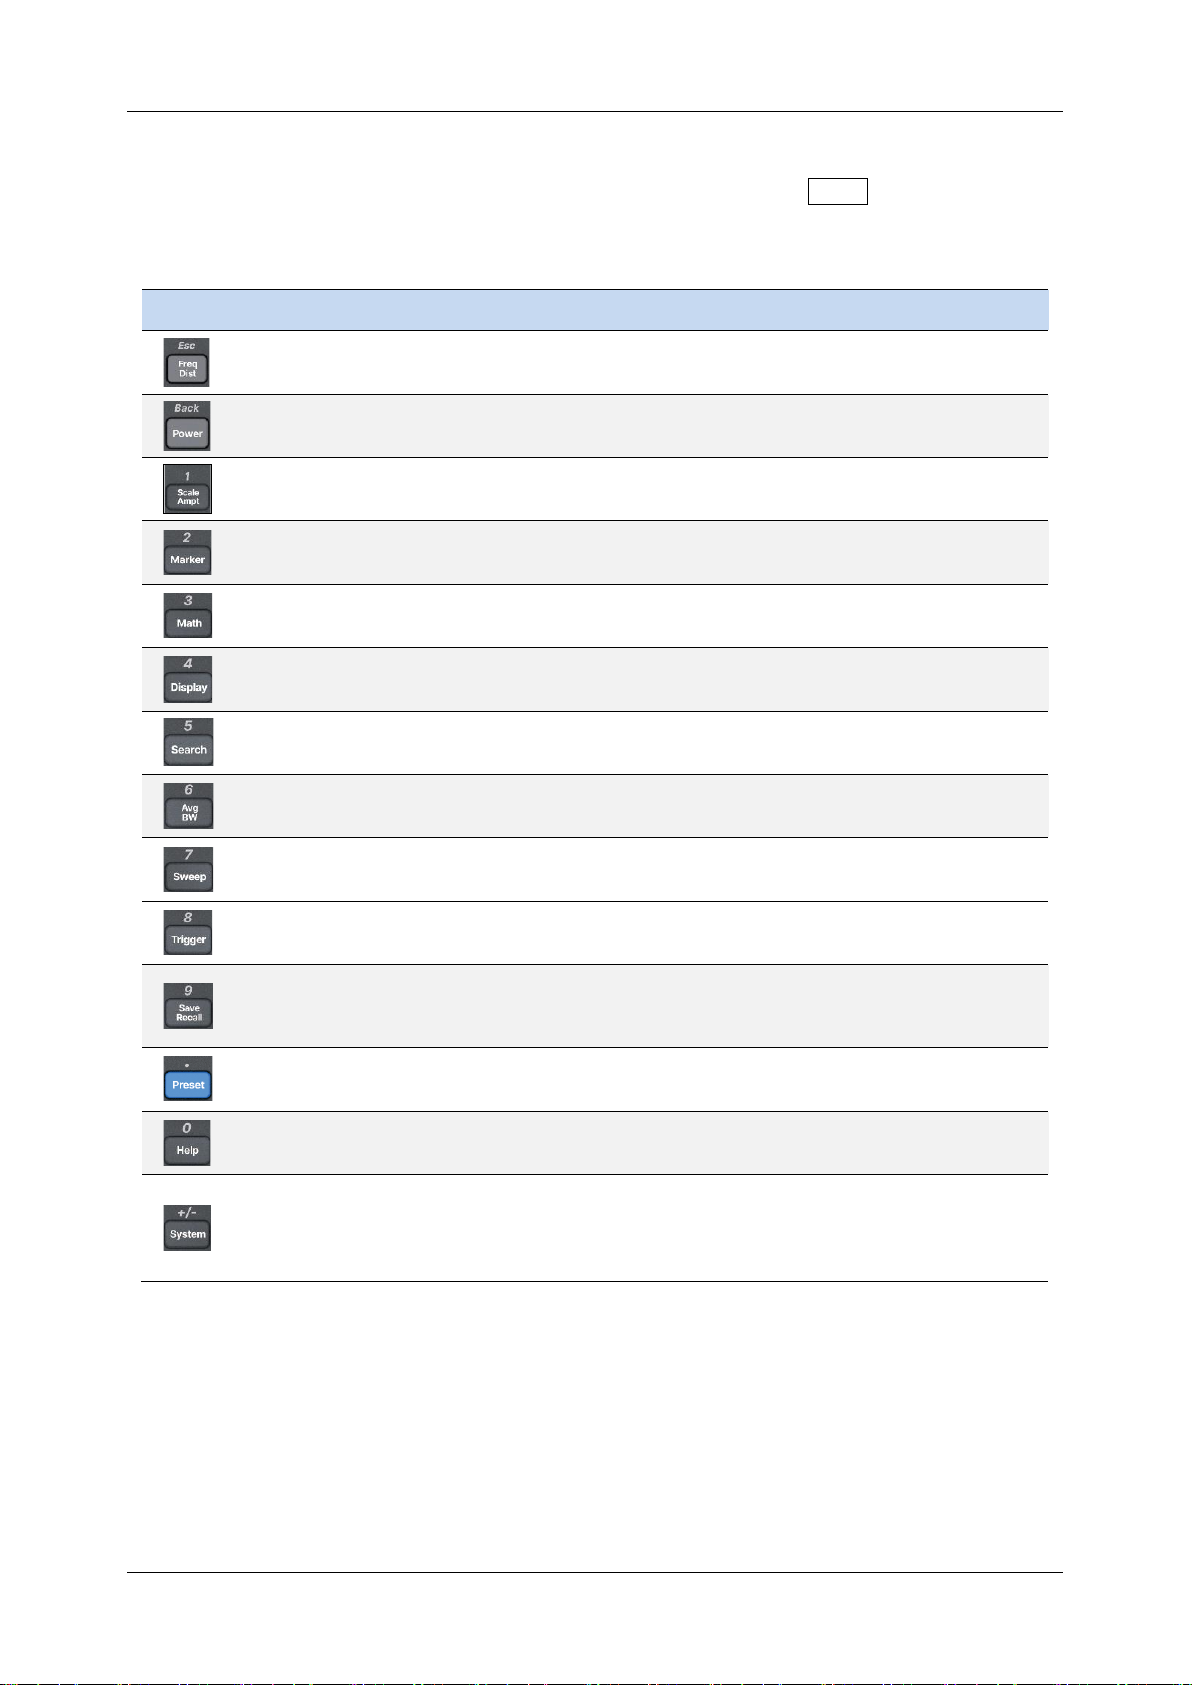
The function key part of the front panel is the reuse key of menu selection mode and value input mode,
which can be switched by
Enter
and
Esc
:
◆ Under default reset, the operation interface is in menu selection mode, and function keys will
be identified as the blue silk screen function identifier on the upper side of the key. Use
Enter to switch from menu selection mode to value input mode.
Page 26
SHN900A User Manual
24
www.siglent.com
◆ When the operation interface is in value input mode, the multiplex key will be identified as
the white silk screen digital identifier inside the key. You can use Esc to switch from value
input mode to menu selection mode.
Name
Description
In menu selection mode, control frequency parameters; Control the length
(distance) parameter during time domain analysis.
In menu selection mode, control the scanning power.
In menu selection mode, control amplitude parameters, such as scale and unit,
reference power, etc.
In menu selection mode, control the cursor Marker parameters, such as cursor
type, cursor positioning, noise cursor, N dB bandwidth, etc.
In menu selection mode, control mathematical functions, such as mathematical
calculations, formula editing, data temporary storage, etc.
In menu selection mode, control screen display parameters, such as trace
settings, channel settings, sub window settings, etc.
In the menu selection mode, control peak parameters, such as peak search,
peak rule setting, etc.
In the menu selection mode, control the average function and bandwidth
parameters, such as RBW, VBW, IFBW, etc.
In menu selection mode, control the scanning parameters, such as scanning
time and type, scanning points, etc.
In menu selection mode, control trigger parameters, such as trigger mode,
single scan, HOLD, etc.
In menu selection mode, storage and call control of data and configuration,
images, etc., such as trace data storage and call, calibration status storage and
call, screenshot storage, etc.
In menu selection mode, control reset parameters, such as reset status
definition, power on status definition, user status definition, etc.
In the menu selection mode, view help information, version information, etc.
In menu selection mode, perform system general information viewing, version
and calibration operations, as well as input and output port settings, screen
display settings, etc.ell as input and output port Settings, screen display
Settings, etc.
Page 27

SHN900A User Manual
www.siglent.com
25
4.4 Rear Panel
NO.
Name
Description
1
Port 1
The RF signal input and output port is a 50 Ω SMA 3.5mm male
connector, which can also be configured as a DC output to provide
bias voltage.
Maximum input ±50 VDC, + 30 dBm.
2
Trig In
Trigger input is a BNC female connector. When the analyzer uses an
external trigger mode, the connector receives a rising or falling edge
of an external trigger signal that is used to establish event
synchronization.
3
Ref In
Reference clock input, BNC female connector. The analyzer can use
an internal reference clock or an external reference clock. If the
instrument detects a signal from an external 10 MHz reference clock,
it automatically uses the signal as the analyzer's reference clock
source. At this time the screen status bar frequency reference
display external;
When the external 10 MHz reference signal is lost, exceeded, or not
connected, the analyzer's reference clock is automatically switched
to the internal 10 MHz reference clock, and the screen frequency
reference bar will display the internal.
[Ref In] is used to establish clock synchronization between multiple
instruments.
4
Port 2
The RF signal input and output port is a 50 Ω SMA 3.5mm male
connector, which can also be configured as a DC output to provide
bias voltage.
Maximum input ±50 VDC, + 30 dBm.
5
K-groove
Slots are provided to accept Kensignton® cable locks.
6
GPS Ant
The GPS antenna port is a SMA female connector used to install the
GPS antenna and receive GPS satellite signals.
Can provide 3.3V DC feed for active GPS antenna.
7
Bias Out
The offset voltage output port is a 50Ω female SMB connector.
Used to provide bias voltage for external signal amplifiers, such as
tower amplifiers.
8
USB
Device
The main USB port is TypeC. The analyzer can be used as a slave
device and connected to a PC via USB cable. The PC uses the USBTMC protocol to remotely control the analyzer.
9
USB
USB slave port, TypeB. The analyzer can be used as the main
Page 28
SHN900A User Manual
26
www.siglent.com
Host
device and is connected to external USB devices through this port.
For example,
Connect external extended memory to read files in memory, or store
the current instrument state, data, or current screen display content
into memory;
Connect a USB keyboard, USB mouse, or other USB receiver;
Connect USB-GPIB adapter to realize GPIB remote control of
analyzer;
Connect electronic calibration parts to realize automatic calibration of
analyzer.
10
LAN
RJ45 ports. The analyzer is connected to the LAN through network
cable, and can be viewed and controlled remotely through VXI,
Socket protocol, or a web browser.
11
External
power
supply
2.5mm x 5.5mm barrel connector, connected to 12V 4A power
adapter charging port, center positive. Used to power devices and
charge batteries.
WARNING
The analyzer does not support DC input. To avoid damage to the instrument,
the DC voltage component of the signal reaching the RF input must not
exceed 50 V.
If possible, add an isolated DC component to the RF input of the analyzer
before signal measurement.
WARNING
In order to avoid damage to the instrument, the DC voltage component of the
signal input to the RF input should not exceed 50 V;
When the frequency is greater than 10 MHz, the maximum continuous power
of the RF signal shall not exceed +33 dBm.
When the frequency is less than 10 MHz, the maximum continuous power of
the RF signal should not exceed +20 dBm.
WARNING
Before connecting any signal, short connect the inner core of the test cable
to the housing floor to release the static electricity accumulated on the inner
core of the test cable.
Page 29
SHN900A User Manual
www.siglent.com
27
4.5 User Interface
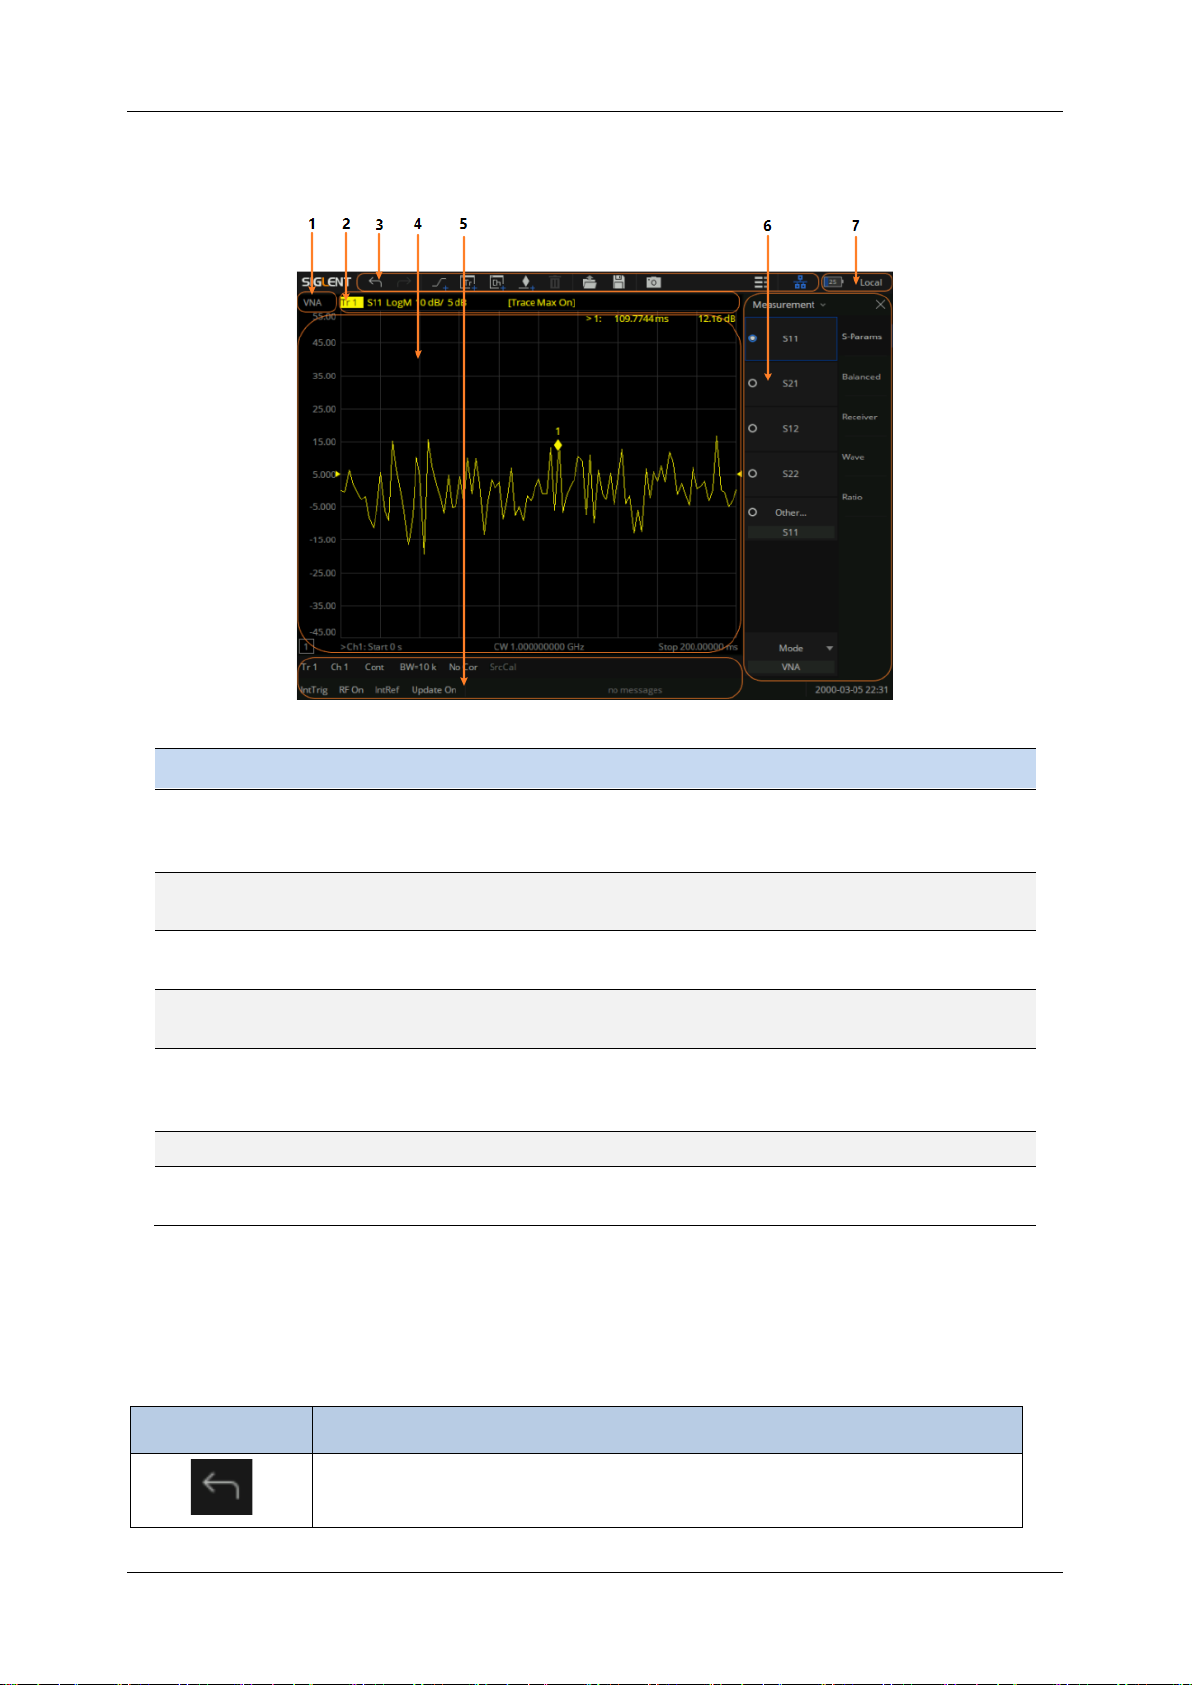
No
Name
Description
1
Mode/Measure
Indicate the current working mode and measurement function
of the analyzer, and click to switch, such as spectrum analysis
mode, real-time spectrum mode, etc.
2
Trace
information
Indicates the items tested by the trace, parameter
configurations, etc.
3
Quick Action
Bar
Shortcut buttons for some commonly used operations.
4
Result display
area
The measurement results are displayed in various forms such
as spectral lines, cursors, traces, and Smith circles.
5
Information
and
Notifications
Display the basic configuration and information of the currently
selected trace, as well as hardware status and notifications.
6
Menu area
Used to configure measurement Settings.
7
Battery and
Remote status
Display battery level and remote control status.
4.5.1 Active entry
Functions
Functions Description
Recall the previous step.
Page 30

SHN900A User Manual
28
www.siglent.com
Recovering the withdrawn operation.
Add a measurement trace.
Add a measurement trace in a new window
Add a measurement channel in a new window.
Add a marker.
Delete active window or trace.
Note: Keep at least one trace on the interface.
Save status, calibration data, and snp files, etc
Load status, calibration data, and snp files, etc
Screenshot
4.5.2 Value of marker
Display the frequency and reading of the marker.
4.5.3 Trace State
⚫ A trace is a series of measured data points. Up to 256 traces can be created. In addition, one
historical memory trace for each active trace can be stored and displayed. Mathematical
operations can be performed on the current trace data and the historical memory trace.
⚫ Press the
Display
button in the front panel, and the
Trace Setup
menu pops up on the right side
of the screen to manage the operation Trace, such as adding a trace, deleting a trace, maximizing
the trace window, moving traces between Windows, keeping the trace to the maximum or
minimum value without displaying the current value, etc.
⚫ Select a trace line and press the
Scale
button to change the reference electric equalization
operation.
Page 31
SHN900A User Manual
www.siglent.com
29
4.5.4 Hardkeys
Using Display Setup in the Display submenu, you can set Hardkeys and open the virtual keypad on
the right side of the screen to operate the vector network analyzer without operating the function keys
on the front panel.
4.5.5 Channel State
⚫ Channels contain traces. Up to 256 channels can be created. The channel setting determines
how trace data is measured, and all traces assigned to a channel share the same channel setting.
⚫ Press the
Display
button in the front panel, and the
Channel Setup
menu pops up on the right
side of the screen. This can be used to manage operation channels, such as adding channels,
copying channels, and deleting channels.
4.5.6 Function Keys
Functions
Functions Description
Log Mag
Parameters are displayed in logarithmic amplitude mode.
Lin Mag
The parameters are displayed in amplitude linear fashion.
Phase
Displays the phase of the parameter.
Delay
Displays the delay of the parameter.
Smith
The parameters are shown in the form of a Smith chart.
Polar
The parameters are displayed in polar coordinates.
SWR
The parameters are shown in SWR.
4.5.7 Label Page
Displays all parameter display formats supported by the vector network analyzer.
4.5.8 Window State
⚫ Windows can be used to view trace data and up to 100 windows can be created.
Page 32
SHN900A User Manual
30
www.siglent.com
⚫ Press the button of
Display
in the front panel and the
Window Setup
menu pops up on the right
side of the screen. It can be used to manage operation windows, such as selecting a window,
adding a window, deleting a window, maximizing a window, layout, and so on.
4.5.9 Stimulus Range
Displays the excitation signal set in the current window, including starting frequency, ending frequency,
internal source output power, etc.
4.5.10 Status Bar
Functions
Functions Description
IntTrig
Displays the current trigger mode.
Continuous
Continuous trigger, single trigger, and other trigger mode displays.
BW=10k
Display of the current IF bandwidth.
C1·Port
S parameter calibration data state loading display.
SrcCal
Display whether the internal source power calibration data state is loaded
or not. A Gray dark shaded label represents an unavailable selection/
option.
RF On
Internal source output power ON and off, RF ON stands for ON.
IntRet
A display that currently uses an internal or external reference signal.
Update On
UI waveform update or not.
4.5.11 Message Bar
Displays the current date information and error information during testing.
4.5.12 Graffiti Function
This product provides a basic graffiti function, which is used to draw graphics and mark information
on the main interface. This feature is great for annotating screenshots and adding important details
before saving.
Page 33
SHN900A User Manual
www.siglent.com
31
⚫
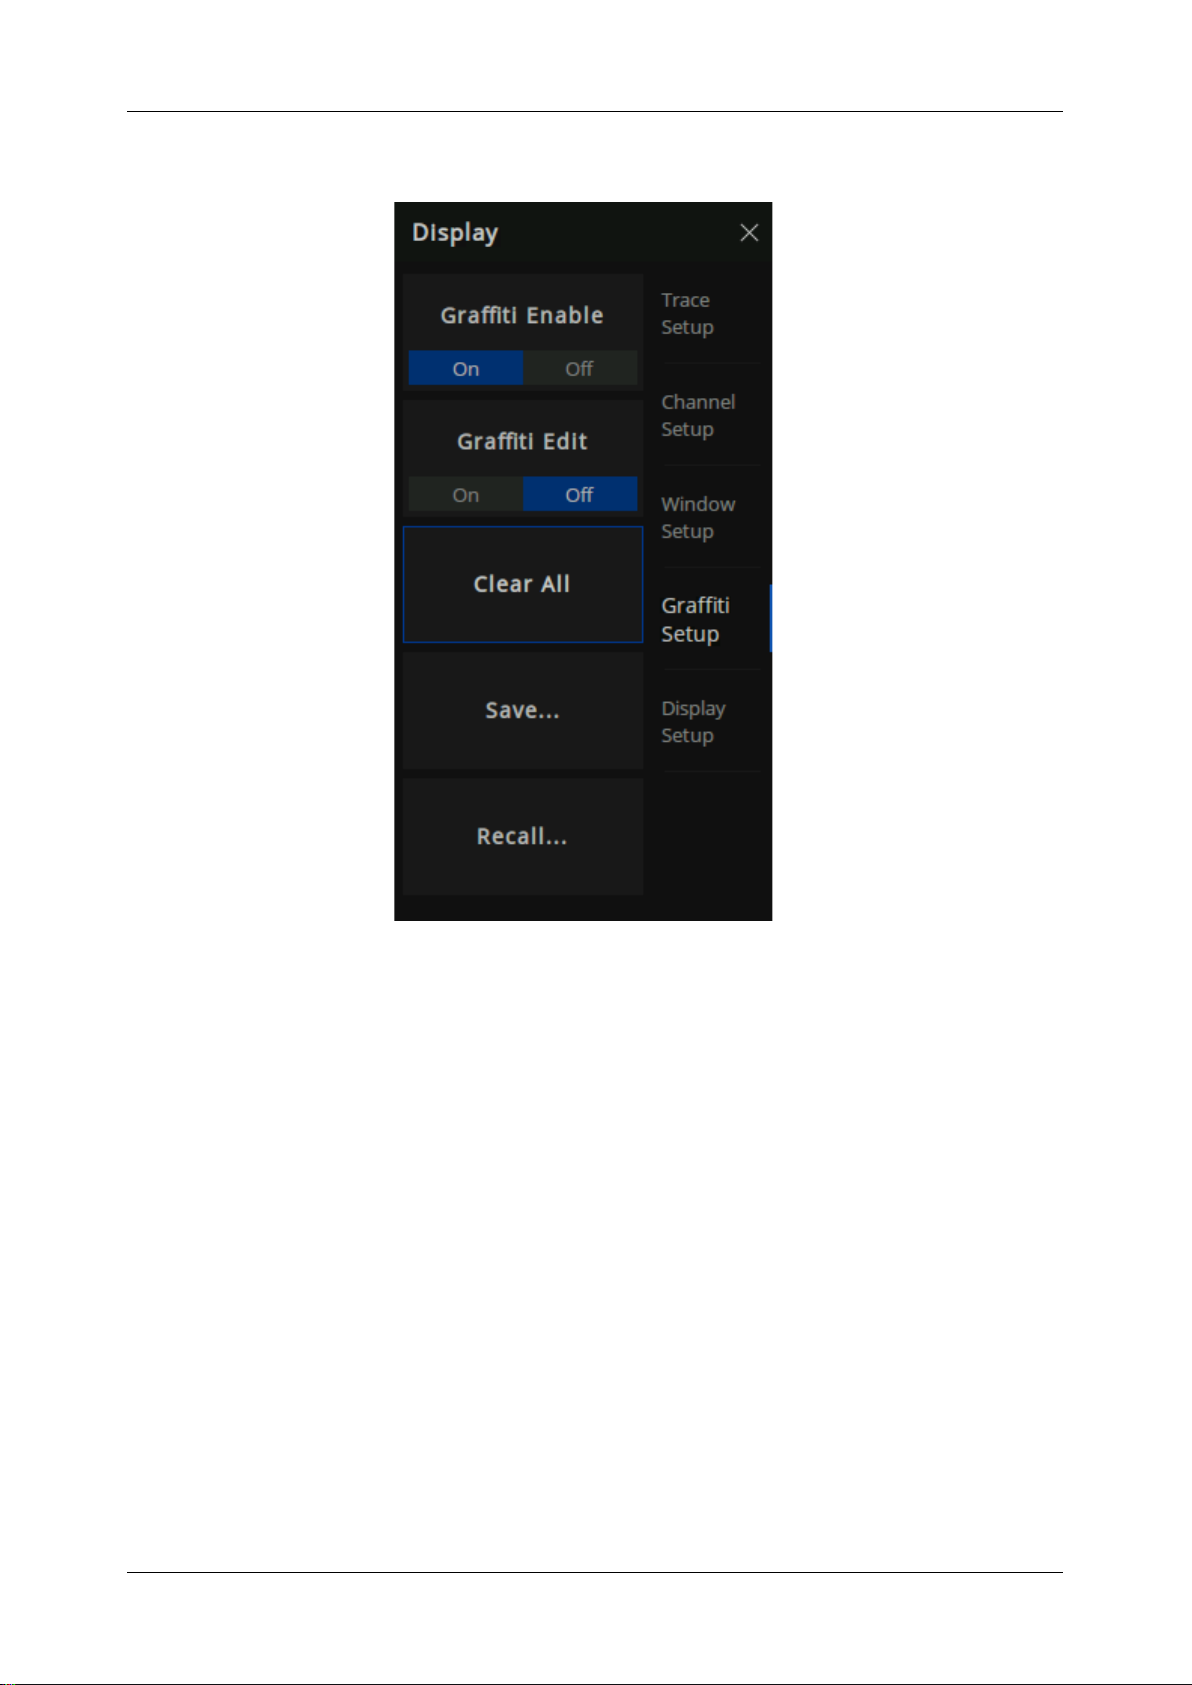
Graffiti function menu bar
Figure 4-5 graffiti function menu bar
As shown in Figure 4-5, the graffiti menu contains functions of enable, edit, clear, save and call.
⚫
Graffiti Editing Interface
Page 34
SHN900A User Manual
32
www.siglent.com
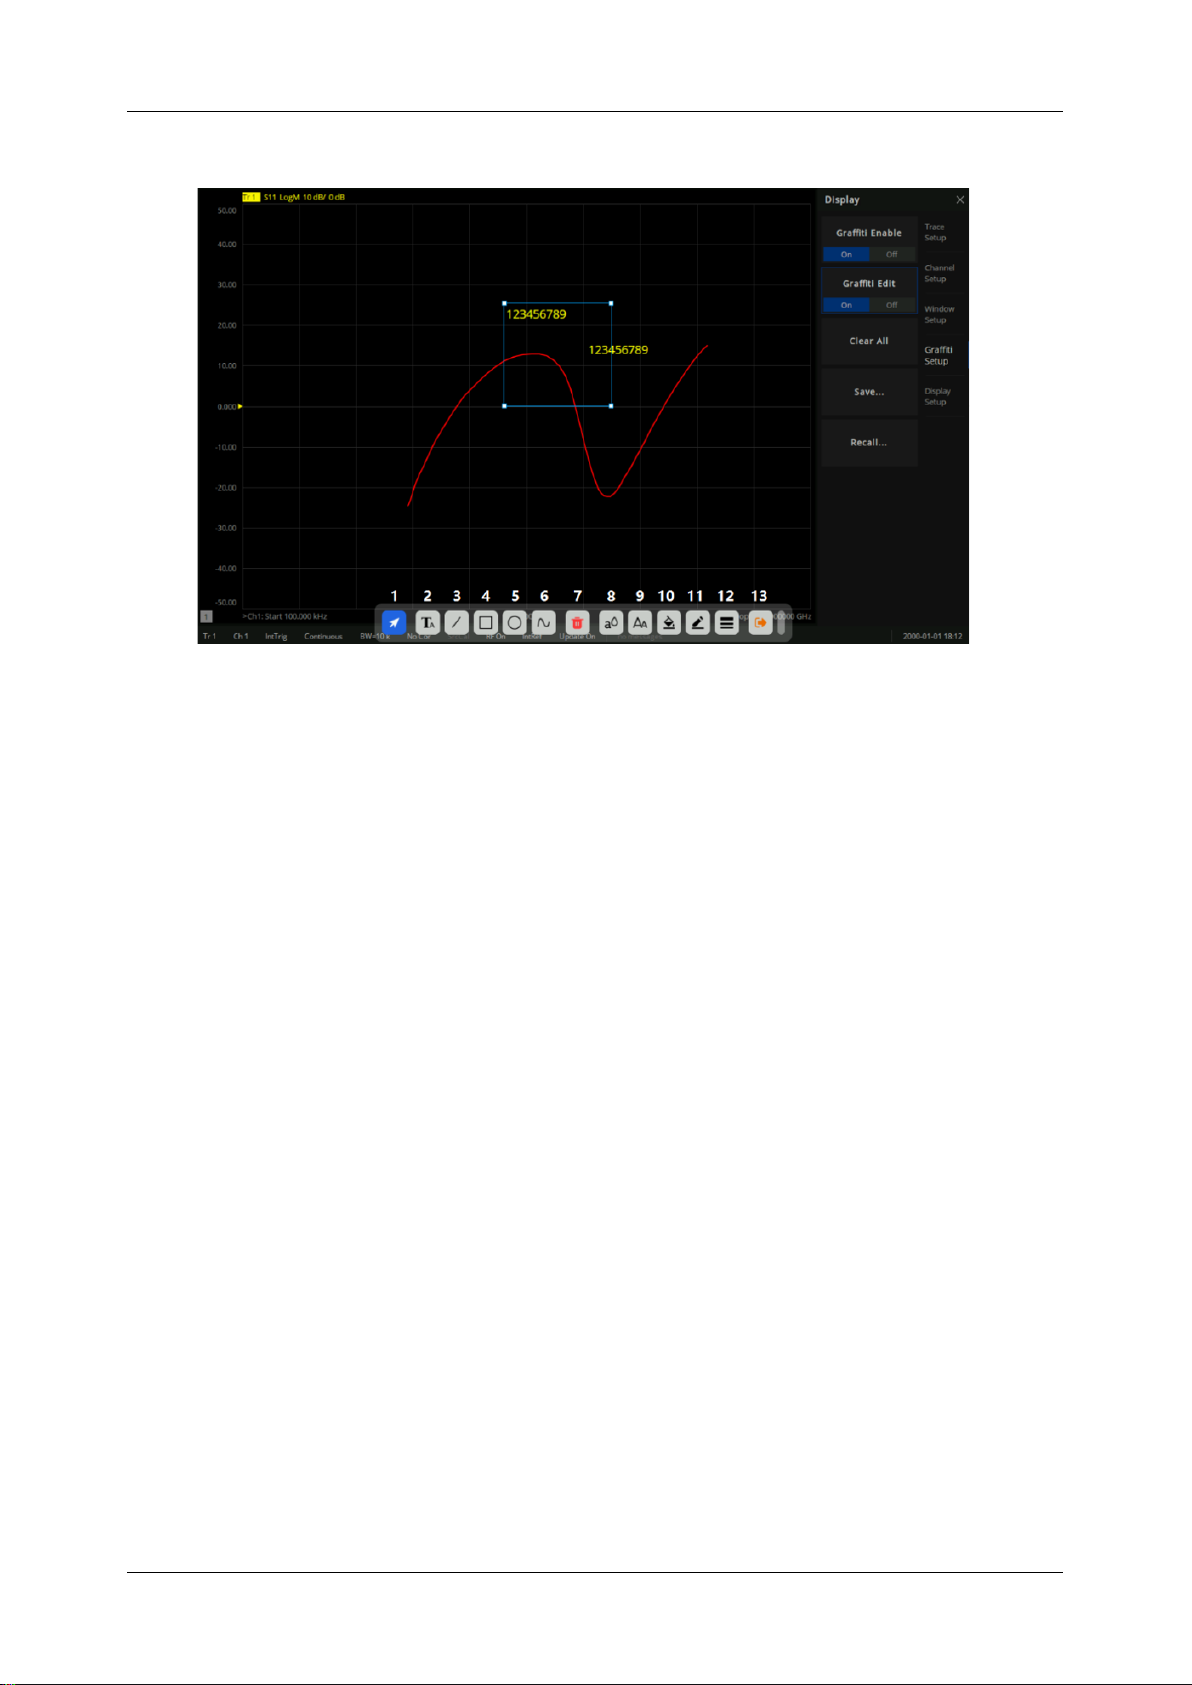
Figure 4-6 graffiti editing interface
As shown in Figure 4-6, the toolbar at the bottom of the interface displays a series of tools for graphic
editing:
1. Selection tool: A series of editing can be carried out after the drawing is selected
2. Text tool: Add text notes in the interface
3. Line tool: Add a line in the interface
4. Rectangle tool: Add a rectangle to the interface
5. Ellipse tool: Add an ellipse to the interface
6. Curve tool: Draw a series of lines arbitrarily in the interface (double click the mouse/ double
click the finger on the screen to finish drawing)
7. Delete tool: Delete the currently selected drawing
8. Text color tool: Set text color (support graphics: text)
9. Text size tool: Set text size (support graphics: text)
10. Background filling tool: Fill graphics background color (support graphics: text, rectangle, ellipse)
11. Border color tool: Set the border color of graphics (support graphics: text, line, rectangle,
ellipse, curve)
12. Border line tool: Adjust the border line thickness of graphics (support graphics: text, line
segment, rectangle, ellipse, curve)
Page 35
SHN900A User Manual
www.siglent.com
33
13. Exit editing tool: Exit the current editing state
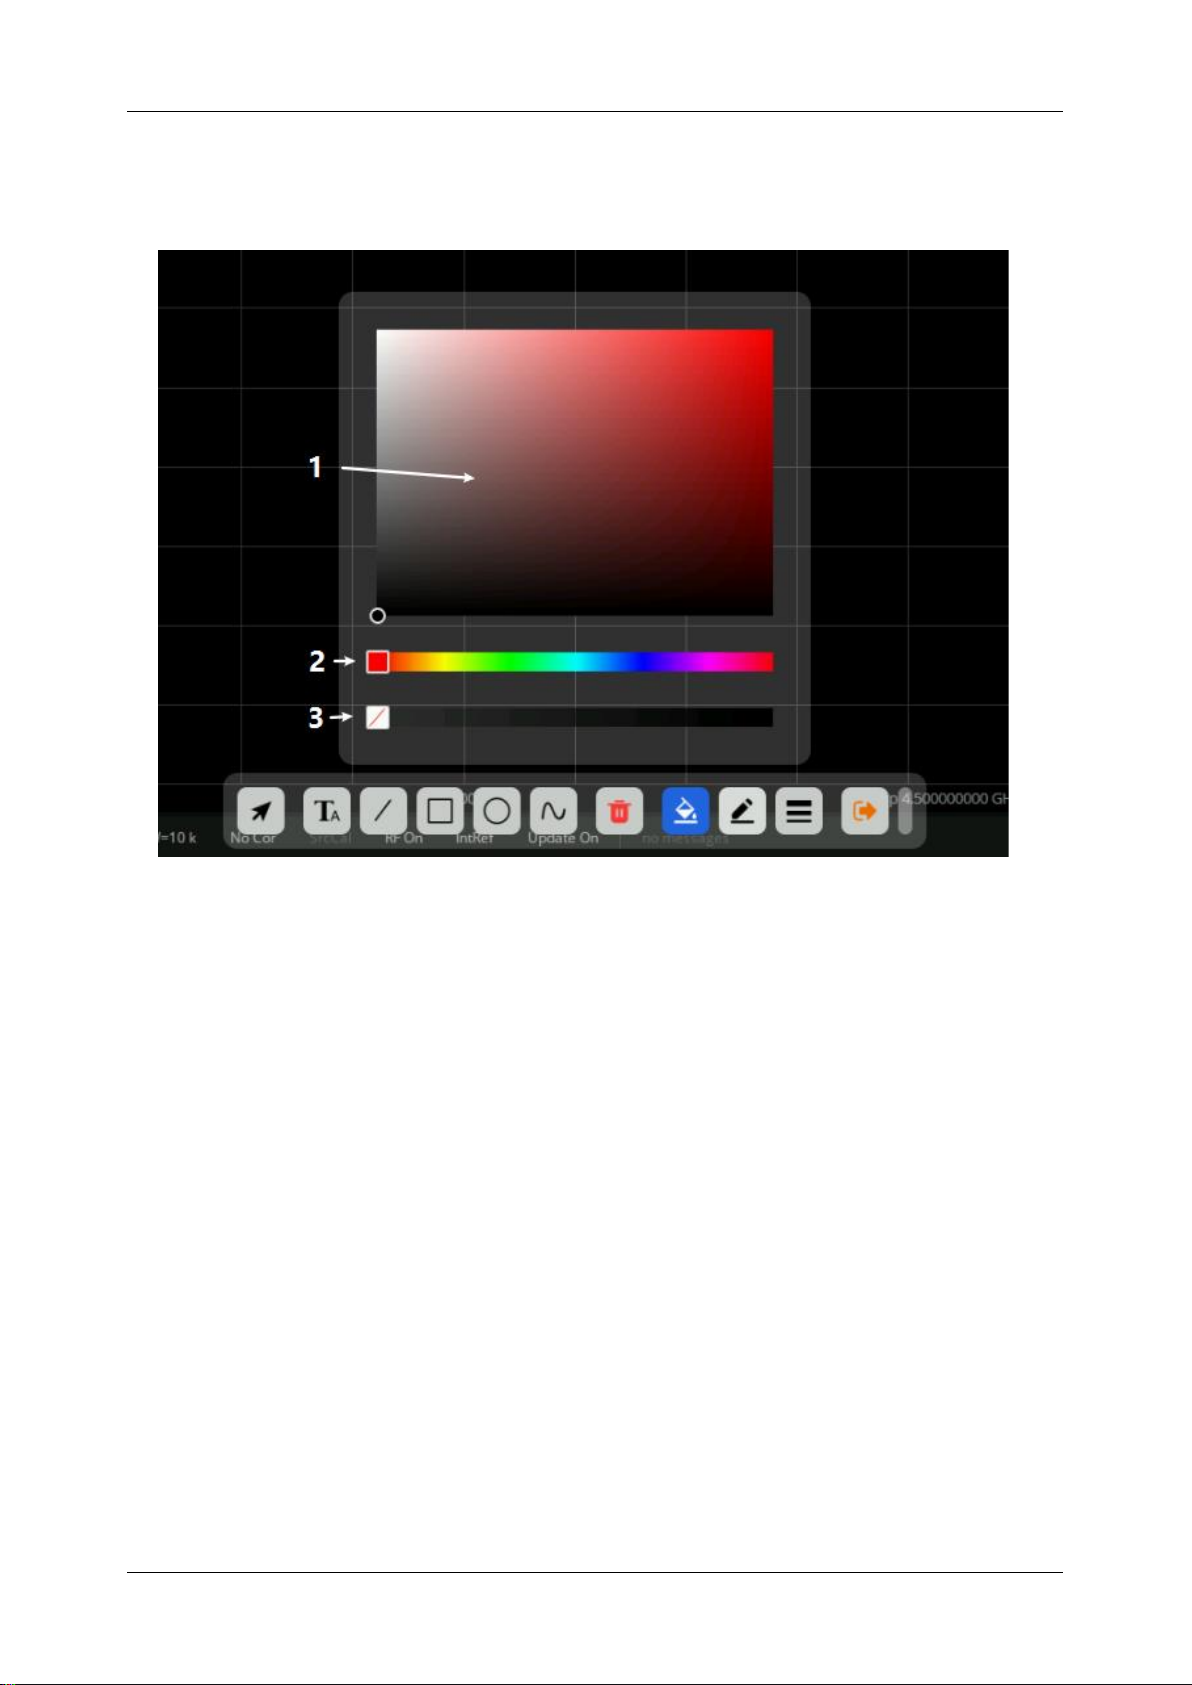
Figure4–7 Color selection interface
As shown in Figure 4–7, after calling out this interface, you can adjust the corresponding colors of the
graphics:
1. Color shade selection tool: Mouse/ finger click to select the appropriate brightness of the color
2. Color selection tool: Select a specific color
3. Color transparency tool: Adjust color transparency (the more right, the lower color
transparency)
Page 36
SHN900A User Manual
34
www.siglent.com
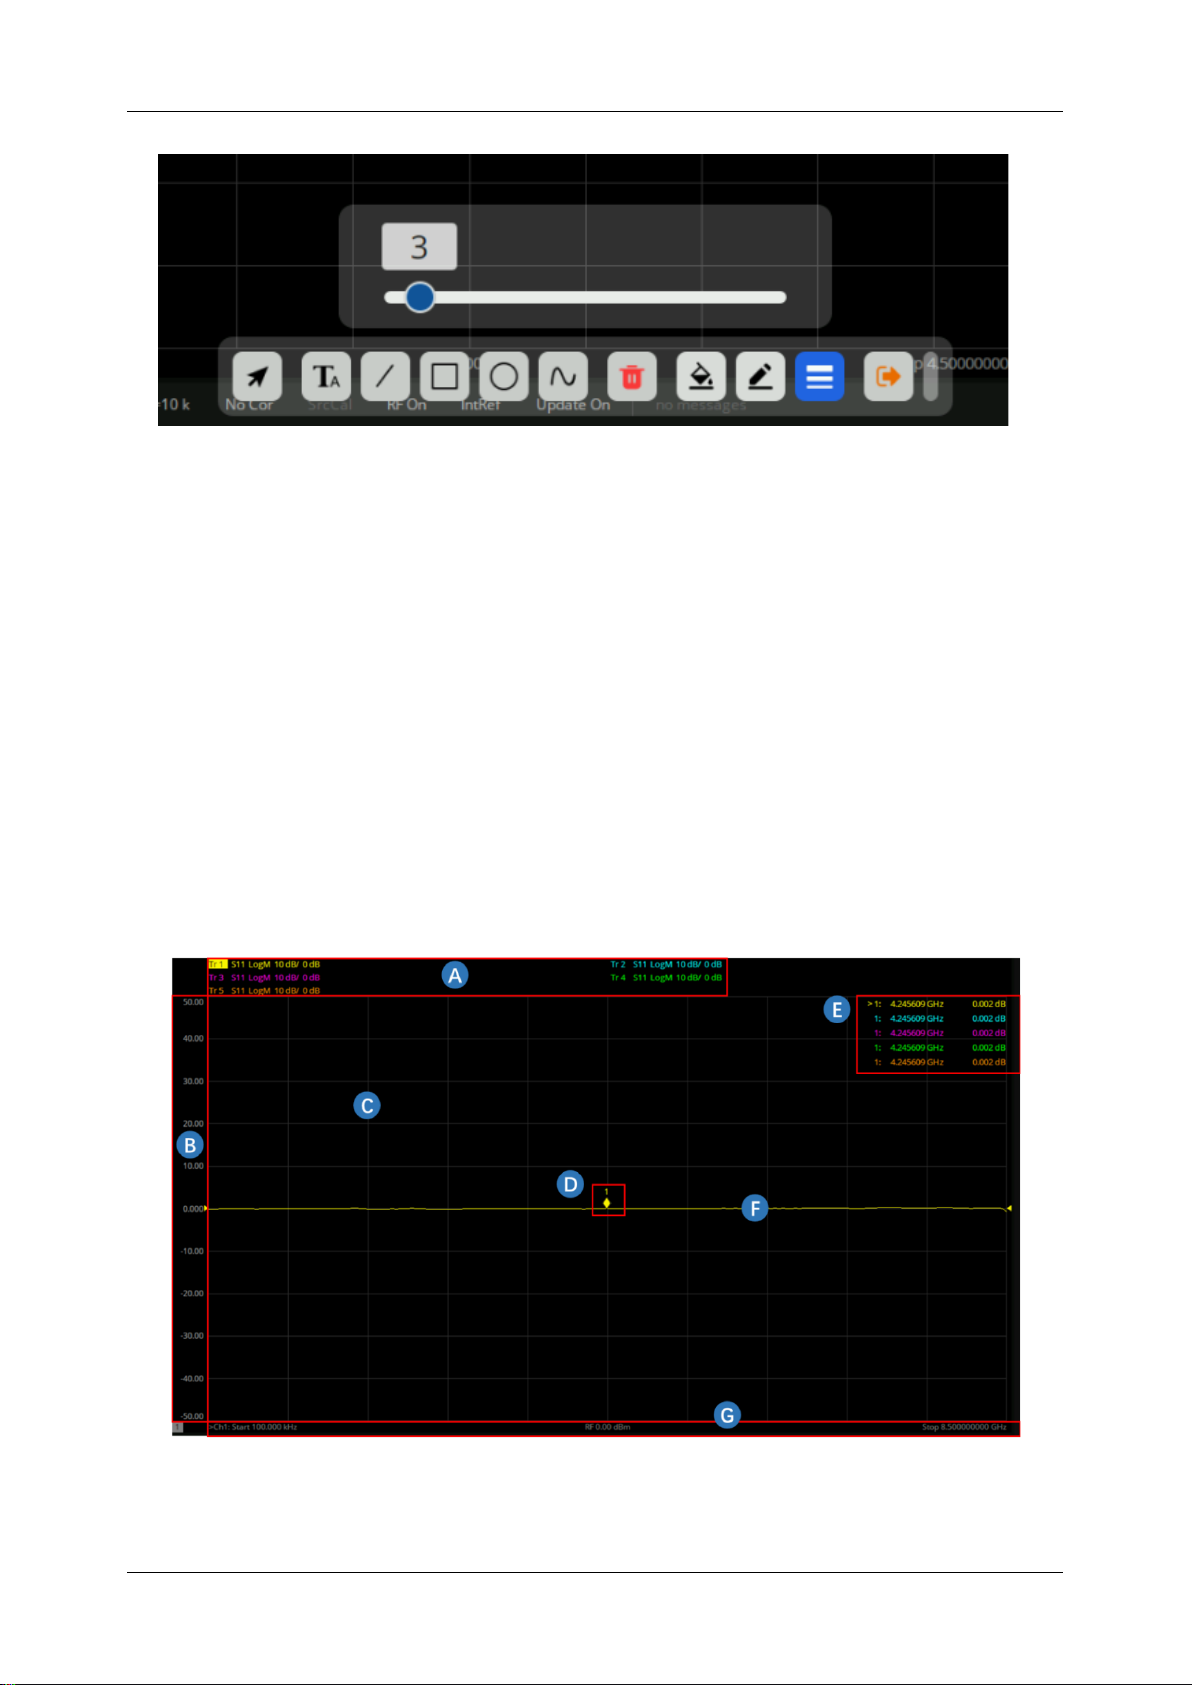
Figure 4-8 Line thickness adjustment interface
As shown in Figure 4-8, you can adjust the line thickness at the edge of the graph by calling out this
interface. The larger the value is, the thicker the line will be.
⚫
Save/Recall
Click the save menu button to save the current graffiti content as a file with *.GFT as the file extension.
4.5.13 Theme Management
In the "Theme Management" panel, Siglent provides display configuration options for the
measurement panel, allowing you to flexibly configure parameters such as trace color thickness, XY
axis font style, and view grid style.
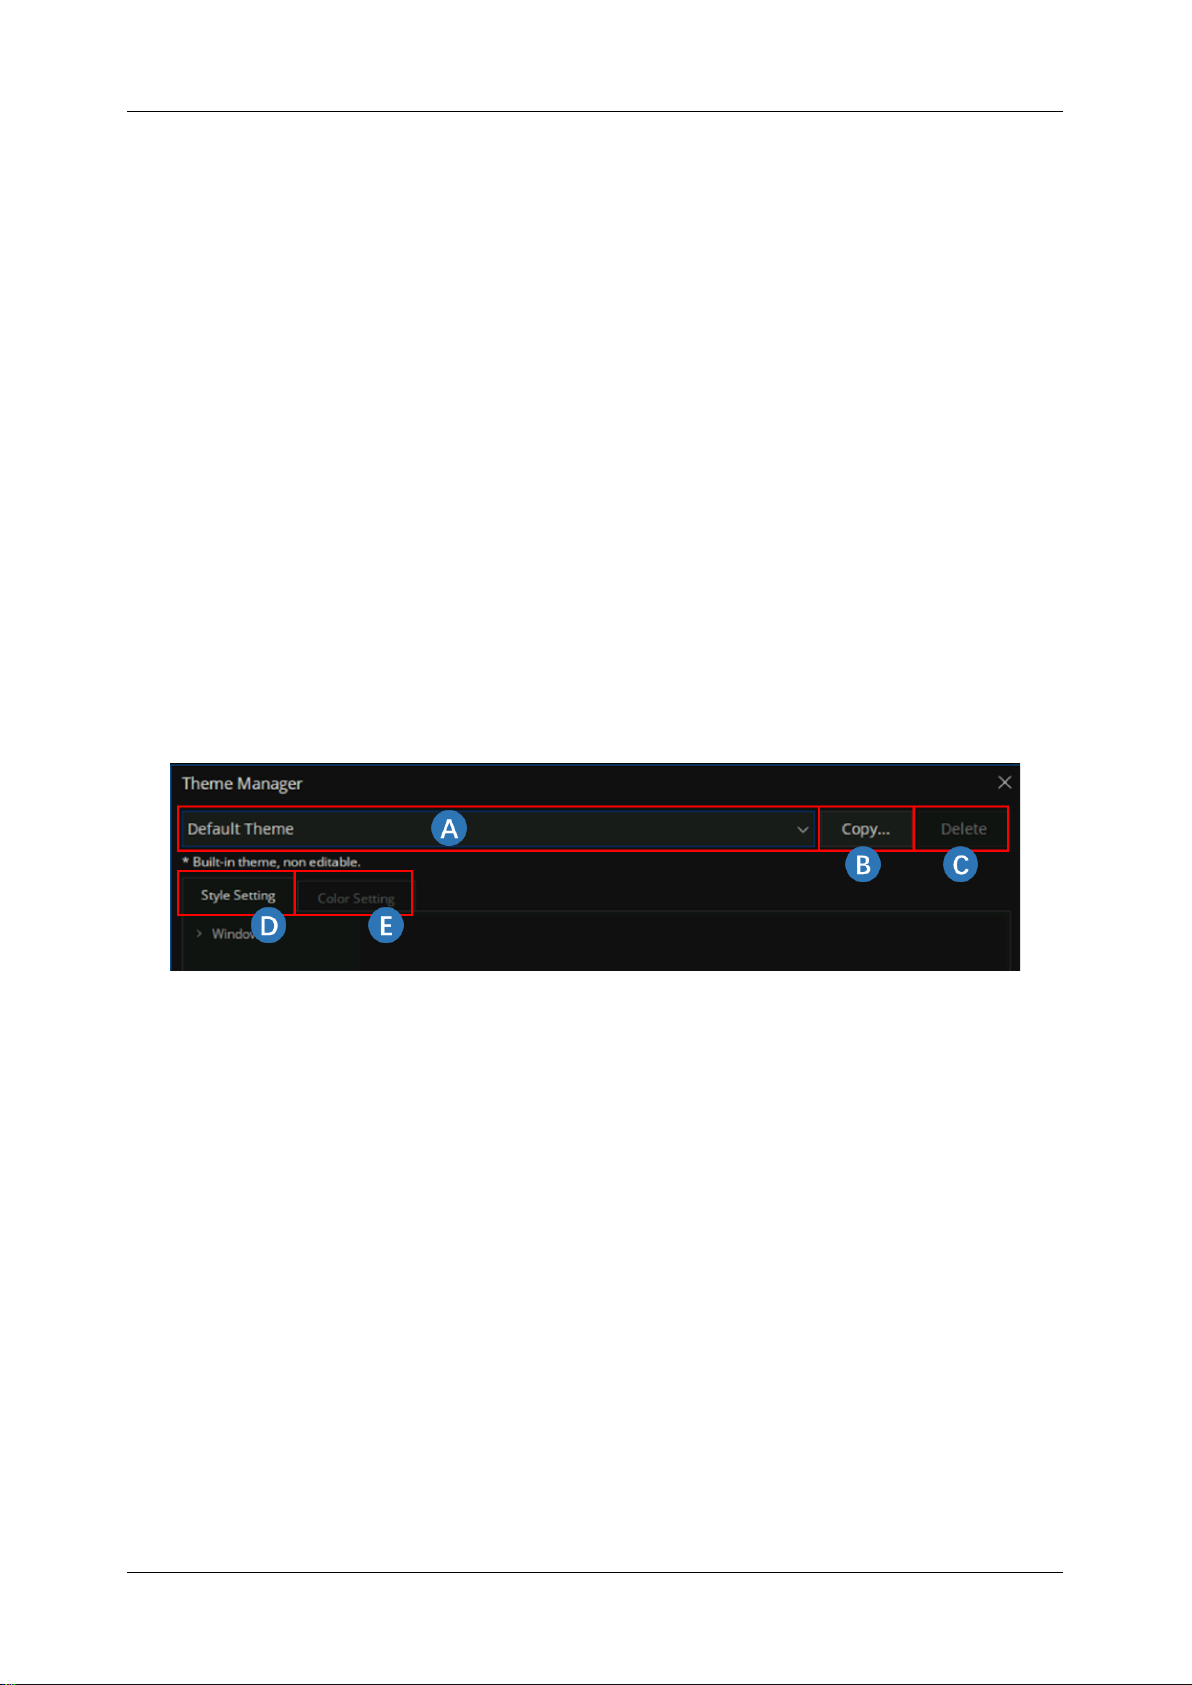
Figure 4-9 The Measurement Panel
Page 37
SHN900A User Manual
www.siglent.com
35
A. Trace Title Bar
B. Response Axis/ LeftAxis
C. Plot Grid
D. Marker
E. Marker Info Bar
F. Trace Line
G. Stimulus Axis/ BottomAxis
Press the “Display” button on the front panel → “Display Setup” →“Theme Manager…” to enter the
"Theme Management" panel. Siglent supports importing and saving themes. Select a specific theme
from the theme drop-down menu to configure the measurement panel display parameters in one step.
After completing the new theme configuration, click "Copy..." and then set a new name to add the
current theme to the theme drop-down menu. Click "Delete" to delete the current topic from the theme
drop-down menu.
Figure 4-10 Theme Management Panel
A. theme drop-down menu
B. "Copy...", save current theme
C. "Delete", delete current theme
D. Style Settings
E. Color Settings
4.5.13.1 Style Settings
Click on "Style Settings" to enter the style setting interface, with the following options:
Page 38
SHN900A User Manual
36
www.siglent.com
4.5.13.1.1 Plot Grid
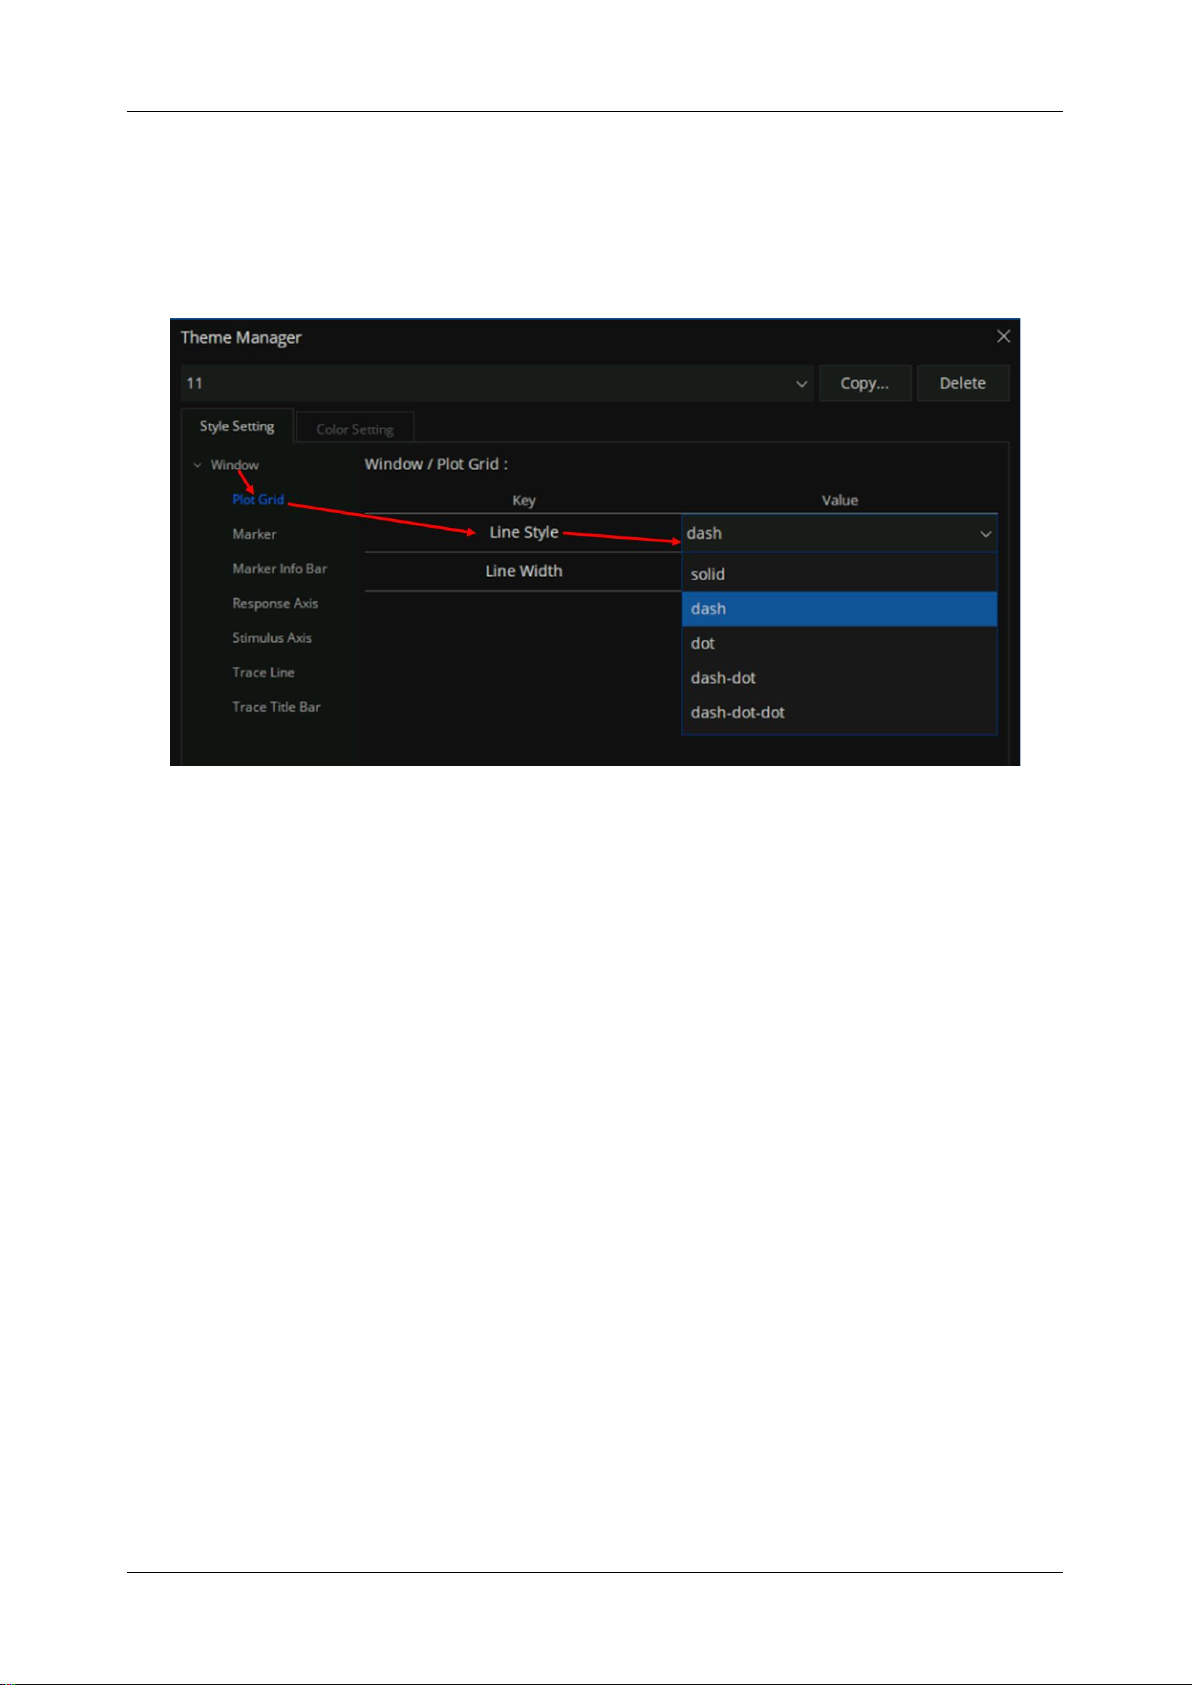
"Window" → "Plot Grid" to enter the plot grid style setting menu, where you can set the grid line style
and width. The grid line style menu bar has five styles to choose from: solid, dash, dot, dash dot, and
dash dot dot.
Figure 4-11Choosing The Line Style With “dash” In The Plot Grid Menu
4.5.13.1.2 Marker
"Window" → "Marker" to enter the marker style setting menu, where you can set the font size, font
style and font weight of the marker. The font style can be selected as normal or italic, and the font
weight can be selected as normal or bold. The settings for font styles are the same below.
4.5.13.1.3 Marker Info Bar
"Window" → "Marker Info Bar" to enter the marker information bar style setting menu, where you can
set the font size, font style, and font weight of the marker information bar.
4.5.13.1.4 Response Axis
"Window" → "Response Axis" to enter the response axis style setting menu, where you can set the
font size, font style, and font weight of the response axis.
Page 39

SHN900A User Manual
www.siglent.com
37
4.5.13.1.5 Stimulus Axis
"Window" → " Stimulus Axis" to enter the stimulus axis style setting menu, where you can set the font
size, font style, and font weight of the stimulus axis.
4.5.13.1.6 Trace Line
"Window" → "Trace Line" to enter the trace line style setting menu, where you can set the trace line
width.
4.5.13.1.7 Trace Title Bar
"Window" → "Trace Title Bar" to enter the trace title bar style setting menu, where you can set the
maximum limit columns, minimum limit columns, maximum limit rows, font size, font style, and font
weight.
4.5.13.2 Color Setting
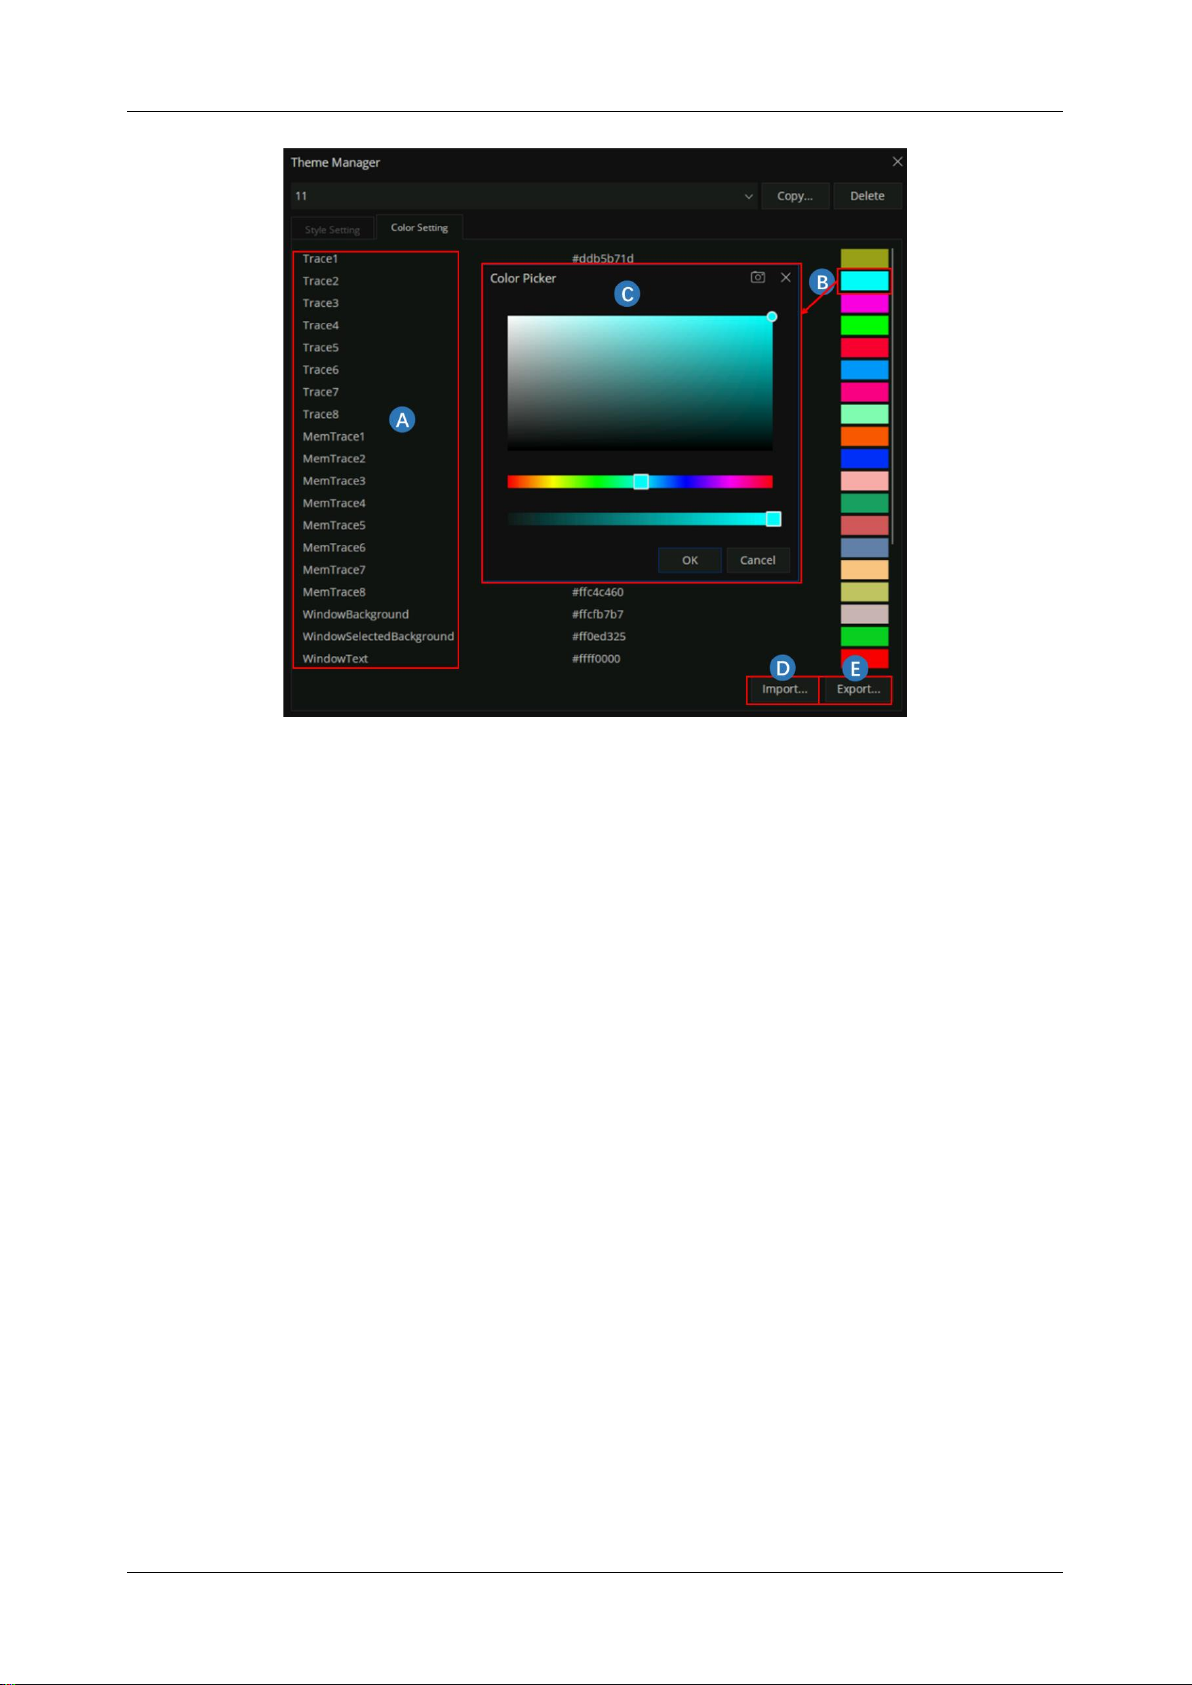
Click on "Color Setting" to enter the color setting interface. In the interface, you can set the colors of
current traces, historical memory traces, measurement window backgrounds, grid lines, axis text, and
other objects. For the current trace and historical memory trace, you can choose eight colors each,
corresponding to Trace1-8 and MemTrace1-8. If the number of traces is greater than 8, the color of
the trace is Trace x% 8, where x is the serial number of the trace.
Click on the color box on the right, and the "Color Picker" interface will pop up. You can set the desired
color by moving the color panel circle and color axis ruler.
Siglent supports importing and exporting color configuration files. Click on "Import" on the bottom right
side and select the corresponding file to complete the color configuration in one step; Click on "Export",
select the save path and set the file name to save your current color configuration.
Page 40
SHN900A User Manual
38
www.siglent.com
A. Objects with modifiable colors
B. Color Box, click to pop up the "Color Picker" interface
C. "Color Picker" interface
D. Import Color Settings
E. Export Color Settings
4.6 Touch screen and mouse operation
The analyzer provides a 8.4 inch multi-touch screen and supports various gesture operations
including:
◆ Slide the waveform left and right or up and down in the measurement result area to change the
X-axis center coordinate or Y-axis reference coordinatePerform two-points scaling in the
waveform area to change the X-axis span
◆ The waveform is scaled horizontally at two points in the measurement result area to change the
X-axis display range
◆ Click the shortcut menu area, working status area, scanning parameter area and menu area for
function selection
◆ Click editable parameters, virtual numeric keyboard or QWERT keyboard will pop up, parameter
Page 41
SHN900A User Manual
www.siglent.com
39
or text editing
◆ Open and drag the cursor
◆ When the mouse is connected, clicking the left mouse button has the same effect as a single
touch
You can turn the touch screen function on and off via
Lock
.
No
Name
Description
1
Click
Most controls just need to be tapped, touched and released.
2
Double click
Some controls require double clicking.
If the second press is not detected within a specific time
period, the operation is cancelled or treated as a single
press.
3
Press and drag
Some objects can be dragged.
This is done by gently holding down the action object and
dragging it to a new position while releasing it. For example,
you can drag items such as tags, limit line nodes, and center
frequencies by dragging tracks left or right.
4
Pinch or release
Some projects can be scaled down or expanded.
This is done by pressing down with two fingers at the same
time and gently holding the item as you pull the fingers closer
or further, then releasing. You can pull items in and out, such
as frequency spans, by touching and holding the trace in two
locations, then pulling your finger closer to narrow the span
or pulling your finger further to widen it.
4.7 Help Information
The Help system of the vector network analyzer can provide the Help information of the function keys
and menu options on the front panel. Press the Help button on the front panel to enter the
Utility
menu, click
Help
to open the
Help
document, click into the corresponding directory to view the
information.
4.8 Communication and Remote Control
The analyzer supports communication with computers via USB, LAN, and GPIB-USB interfaces. By
using these interfaces, in combination with programming languages and/or NI-VISA software, users
can remotely control the analyzer based on a SCPI (Standard Commands for Programmable
Instruments) compliant command set, LabView and IVI (Interchangeable Virtual Instrument), to
Page 42

SHN900A User Manual
40
www.siglent.com
interoperate with other programmable instruments.
You can also go to
System
> System > I/O Settings > Network and set the corresponding
communication port to view and control the analyzer directly on a PC or mobile terminal using a web
browser. For more details, refer to the ‘User Guide’.
4.9 Troubleshooting
This section lists the possible faults and troubleshooting methods that may occur during the use of
the analyzer. When you encounter these faults, please follow the corresponding steps to handle them.
If unable to process, please contact SIGLENT and provide the equipment information of your
instrument (serial number labeled on the back of the instrument or
System
> Help > About… ).
Troubleshoot the analyzer according to the following steps:
1. Switch on the power and the instrument will enter the charging state. The backlight of the power
switch on the front panel will light up orange (charging)/green (full).
If the power switch on the front panel is not on:
◆ Check that the power switch is turned on and that the power connector is properly connected
2. Press the power switch on the front panel, and the instrument will turn on. The color of the power
switch on the front panel will turn white. At the same time, the fan on the back will turn and the
screen will light up.
If the instrument does not enter the power on state normally:
◆ Check whether the fan and screen are loose or damaged
◆ If the fan and screen are normally powered on, but the screen stops in the startup screen,
or the button does not respond
If the above problems exist, do not disassemble the instrument and contact SIGLENT in time.
3. The analyzer enters the working state normally, and the buttons and touch screen should respond
to the measurement operation normally.
If the instrument does not work properly:
◆ Check that the analyzer is working in the remote control lock state
◆ Check whether the analyzer can be controlled using the mouse and keyboard
◆ Check whether the analyzer can be controlled using VNC or remote commands
Page 43

SHN900A User Manual
www.siglent.com
41
◆ Press System > Self Test > Screen Test/Key Test /LED Test/Touch Test to check
whether there is any response or interference between the key and screen
◆ Check whether strong electromagnetic fields exist around the analyzer. Strong
electromagnetic fields will affect the response of the capacitor touch screen
If the above problems exist, do not disassemble the instrument and contact SIGLENT in time.
4. The analyzer should be in scanning or measuring state when working normally, and the screen
waveform and parameters are in updating state.
If the instrument screen waveform or parameters are not updated for a long time:
◆ Check whether the current trace is in View state or multiple averaging state
◆ Check whether the trigger conditions are not met and wait. Check the trigger Settings and
whether there is a trigger signal
◆ Check whether it is currently in a single scan state, or whether it is in a measurement
calculation state
◆ Check whether the current scan time is set too long or whether the measured dwell time is
set too long
5. Incorrect or inaccurate measurement:
Users can obtain detailed instructions on technical indicators from the back of this manual to
calculate systematic errors, check measurement results and accuracy problems. To achieve the
performance indicators listed in this manual, you need:
◆ The instrument is in the calibration cycle, stored in the working temperature of 20℃~30℃
for at least two hours, and preheated for more than 40 minutes
◆ Have a certain understanding of the measured signal, and set the appropriate parameters
for the instrument
◆ Check that external devices are properly connected and working, and that line losses are
correctly compensated
◆ Check whether signal tracing, frequency offset, amplitude offset, or correction functions are
applied
◆ Check whether an external reference clock source is applied
◆ The instrument is measured and calibrated regularly to compensate for measuring errors
caused by aging and other factors. For calibration, contact SIGLENT, Inc., or an authorized
measurement provider for paid service.
6. Pop-up message:
The instrument will give prompt message, error message or status message according to the
state it is in. These messages can help the user to use the device correctly, not the device failure.
Page 44

SHN900A User Manual
42
www.siglent.com
5 Set Up a Measurement
This chapter introduces in detail each function button on the front panel of SHN900A series vector
network analyzers and the following menu functions.
5.1 Measurement parameters
5.1.1 S parameters
S parameters are used to describe the degree of a transmitted or reflected signal through an
impedance discontinuity. S parameters are relative measurements, defined as the ratio of two
complex voltages. They contain the amplitude and phase information of the relevant signals. For the
2-port vector network analyzer, there are 4 S parameters (S11, S21, S12, S22).
The specific meaning of each S parameter can be described by the following items:
Sxy x,y
∈
(1,2):
x:
The response port is also known as the receiving port of the vector network analyzer. The
transmitted signal enters the port after passing through the DUT.
y:
The excitation port is also known as the transmitting port of the vector network analyzer.
The output signal of this port is provided to the DUT.
Here is a list of common Measurements with S-Parameters:
Reflection Measurements
Transmission Measurements
● Return loss
● SWR
● Reflection coefficient
● Input impedance
● S11, S22
● Insertion loss
● Transmission coefficient
● Gain/ loss insertion
● group delay
● Linear phase shift
● electrical delay
● S21, S12
5.1.2 Receiver Measurement
Each port of the vector network analyzer contains 1 reference receiver and 1 measurement reference
receiver. For the 2-port vector network analyzer, there are a total of 2 reference receivers and 2
measurement reference receivers. The power measured by these receivers can be compared to
Page 45

SHN900A User Manual
www.siglent.com
43
obtain all the S parameter indices.
R1, R2 are the reference receivers used to measure the signal emitted from the vector network
analyzer, it is equal to the transmitted power at the port after power calibration.
● R1: Measures the output power of port 1
● R2: Measures the output power of port 2
A, B are test receivers used to measure the reflected or transmitted signal power after passing through
the device under test.
● A: Measures the signal power entering port 1
● B: Measures the signal power entering port 2
5.1.3 Balanced Measurement
5.1.3.1 Balanced Devices
Standard Single-ended devices generally have one input port and one output port. Signals on the
input and output ports are referenced to ground. As Fig2.1 Balanced devices have two pins on either
the input, the output, or both. The signal of interest is the difference and average of the two input or
output lines, not referenced to ground, as Fig2.2.
DUT
V
V
Fig 2-1 Single-ended devices
DUT
V
V
Fig 2-2 Balanced devices
Differential and Common Modes Model
On balanced devices, the signal of interest is the
difference
and
average
of the two input or output
lines. In balanced device terminology, these signals are known as the Differential and Common modes.
● Signal A is fixed at 1V peak
● Signal B is selectable
● Differential is calculated as A minus B
Page 46
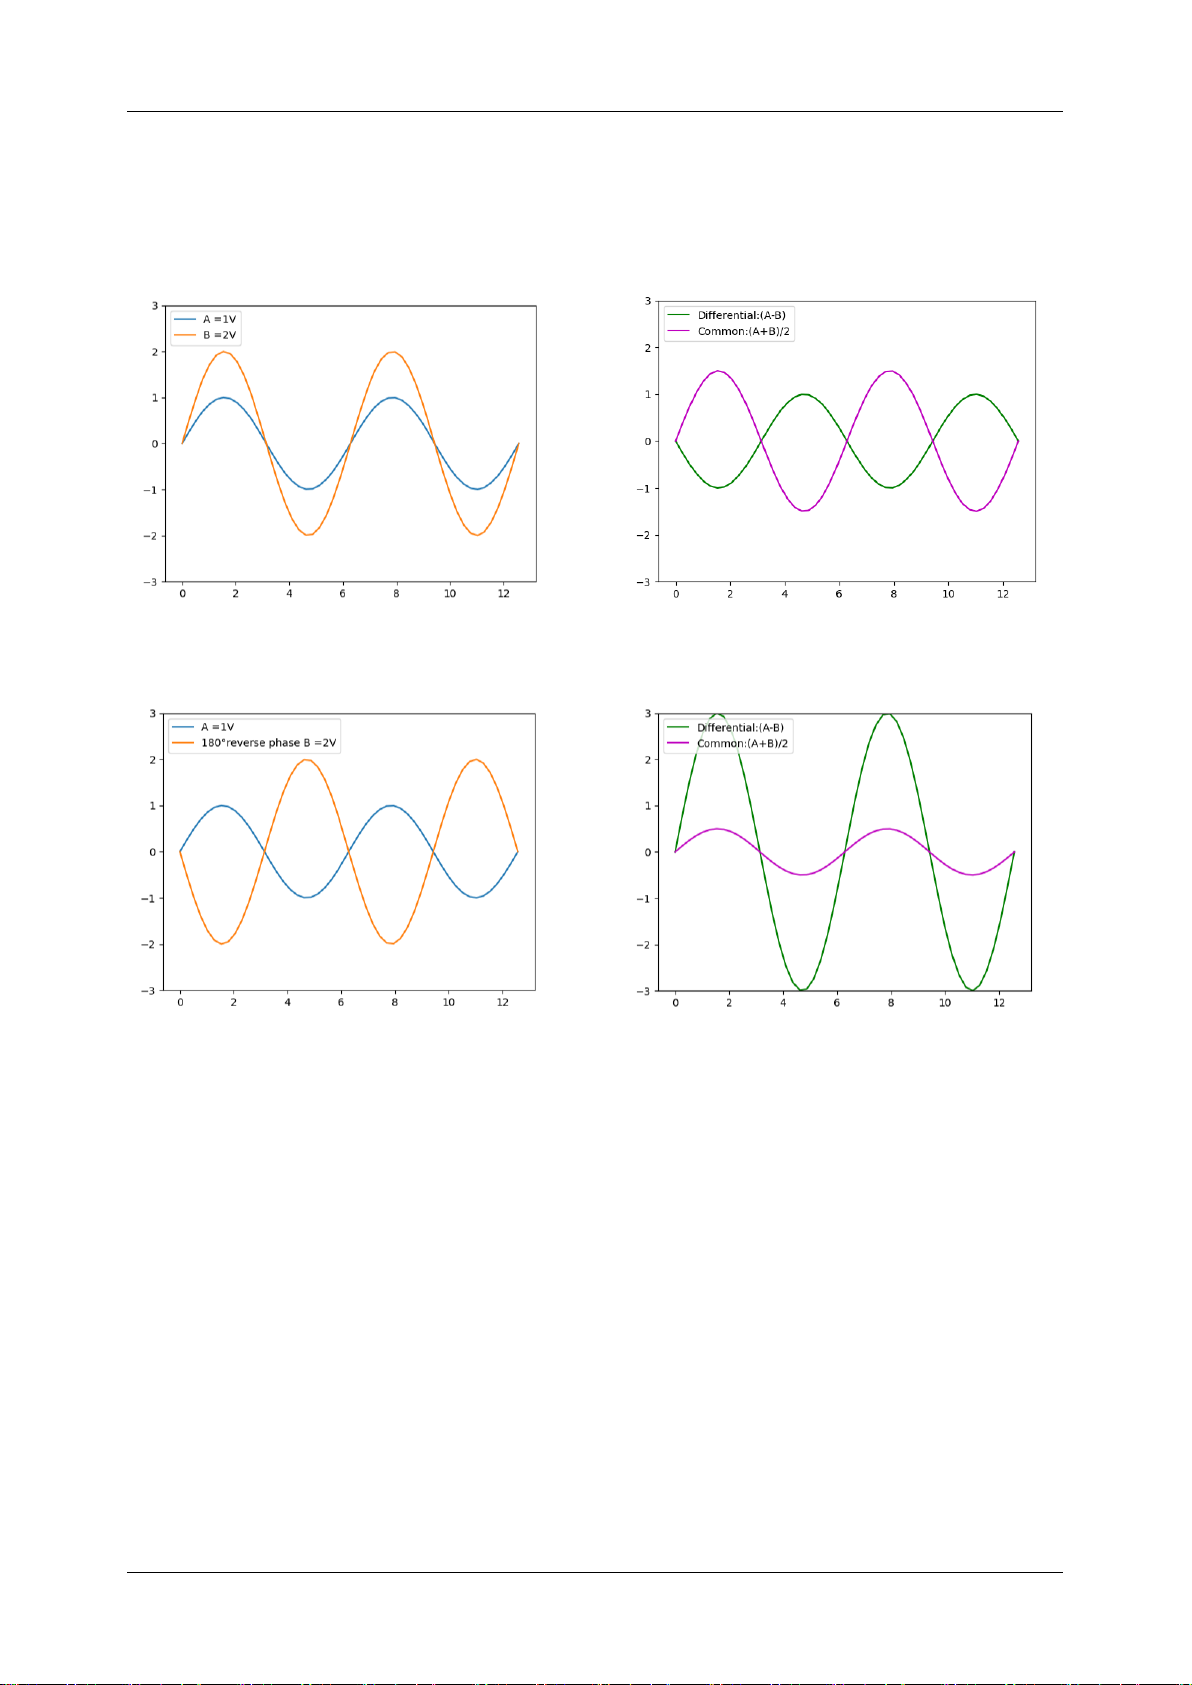
SHN900A User Manual
44
www.siglent.com
● Common is calculated as the average of A and B
Input Signal A and B, A =1V, B=2V
Differential=(A-B), Common=(A+B)/2
Input Signal A and B, A =1V, B= reverse phase 2V
Differential=(A-B), Common=(A+B)/2
5.1.3.2 Measuring Mixed Mode (Balanced) S-Parameters
The mixed mode S parameter is an extension of the conventional S parameter for balance
measurement. If the measuring device is a balanced device, its mixed mode parameters can be
measured by the VNA. Some balanced devices are designed to amplify the differential component
and reject the common component. This allows noise that is common to both inputs to be virtually
eliminated from the output. For example, a balanced device may amplify the differential signal by a
factor of 5, and attenuate the common signal by a factor of 5. Using traditional S-parameter notation,
an S21 is a ratio measurement of the device
Output
/device
Input
. Mixing this with balanced
terminology, we could view the amplifier's Differential Output signal/ Differential Input signal. To see
this parameter on the analyzer, we would select an Sdd21 measurement using the following balanced
notation:
Page 47
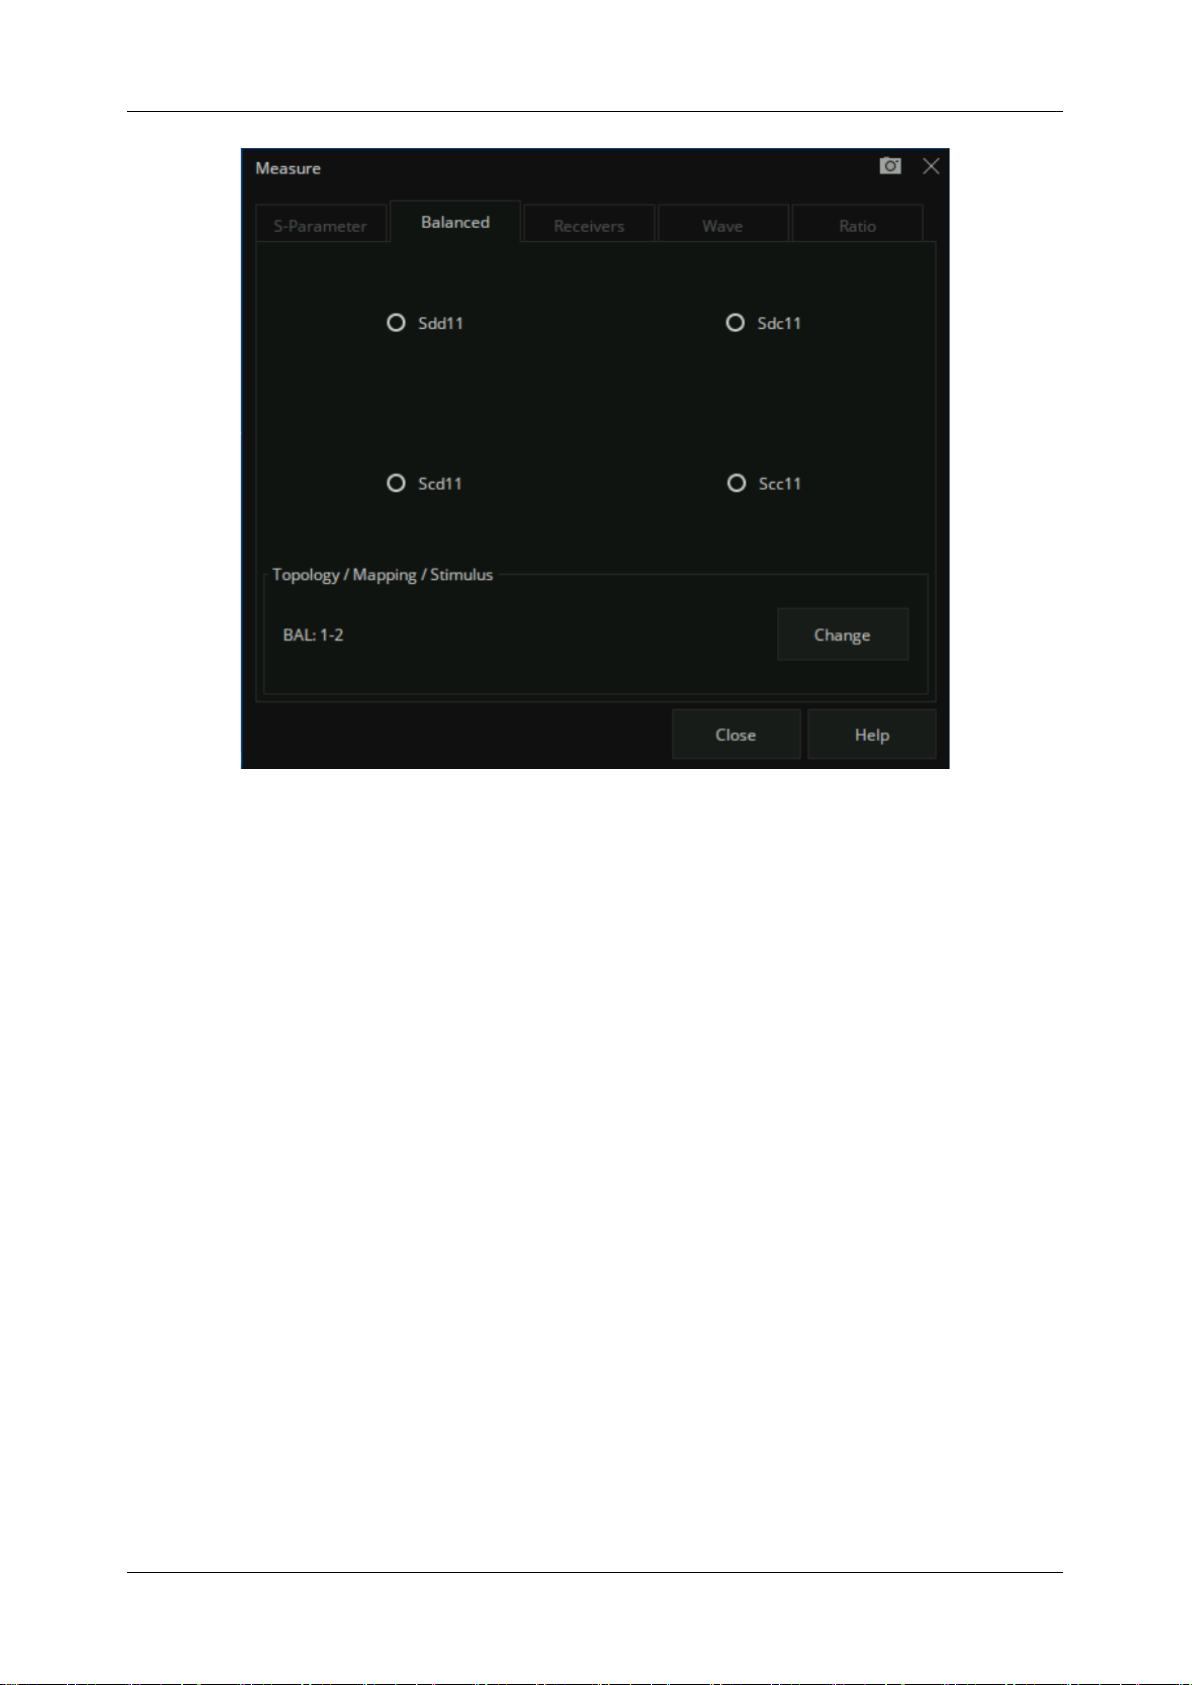
SHN900A User Manual
www.siglent.com
45
The general notation for the mixed S parameter is Sabxy, where:
1) a - Represents the output mode of the device
2) b - Represents the input mode of the device
choose from the following for both a and b
● s – single ended (unbalanced port)
● d – differential (balanced port)
● c – common (balanced port)
3) x – device output “logical” port number
4) y - device input “logical” port number
5.1.3.3 DUT Topology Port Mapping
In the balanced measurement, the signal of interest is the difference or average of two BALANCED
input or BALANCED output lines. It is also possible to have single-ended ports AND balanced ports
on the same device.
Press the “Meas” button on the front panel → Balanced → Topology... , Create or edit DUT Topology
Page 48
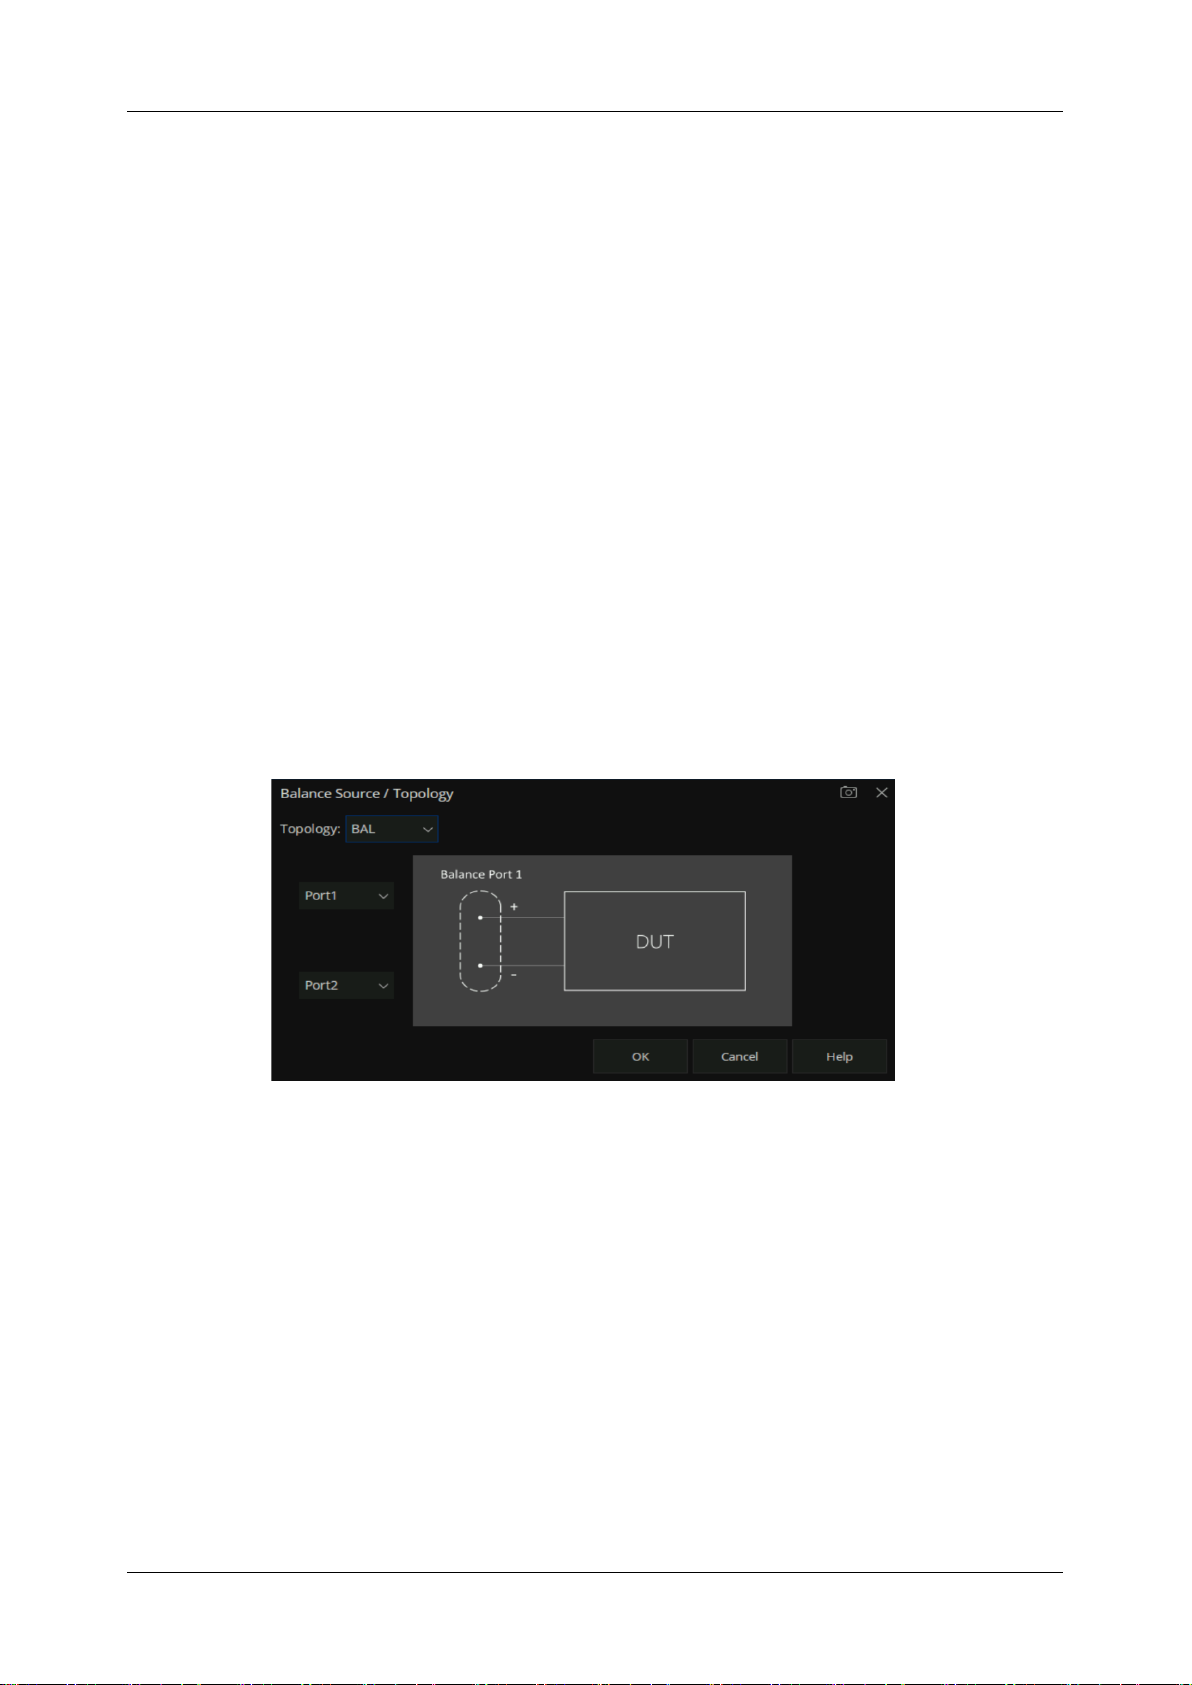
SHN900A User Manual
46
www.siglent.com
and Logical Port Mapping.
“Logical Port” is used to describe a physical analyzer test port that has been remapped to a new port
number.
1. Map any two physical ports of the vector network analyzer to a balanced logical port.
2. Map any physical port of the vector network Analyzer to a single-ended logical port.
These selections apply to ALL measurements in the channel. If the device topology is changed, any
existing measurements in the channel that are incompatible with the new topology will be
automatically changed to one that is compatible.
A multi-port vector network analyzer can be used to measure the following topological relationships
for differential devices. When the vector network analyzer has only 2 test ports, then only the first
balanced device under test can be tested.
Balanced
1 Logical port (Balance Port 1) - 2 physical ports (Port1, Port2)
5.1.4 Wave
Receivers can be also selected using logical receiver notation
Press the “Meas” button on the front panel → Wave → Other... to enter the Wave TAB interface.
Page 49
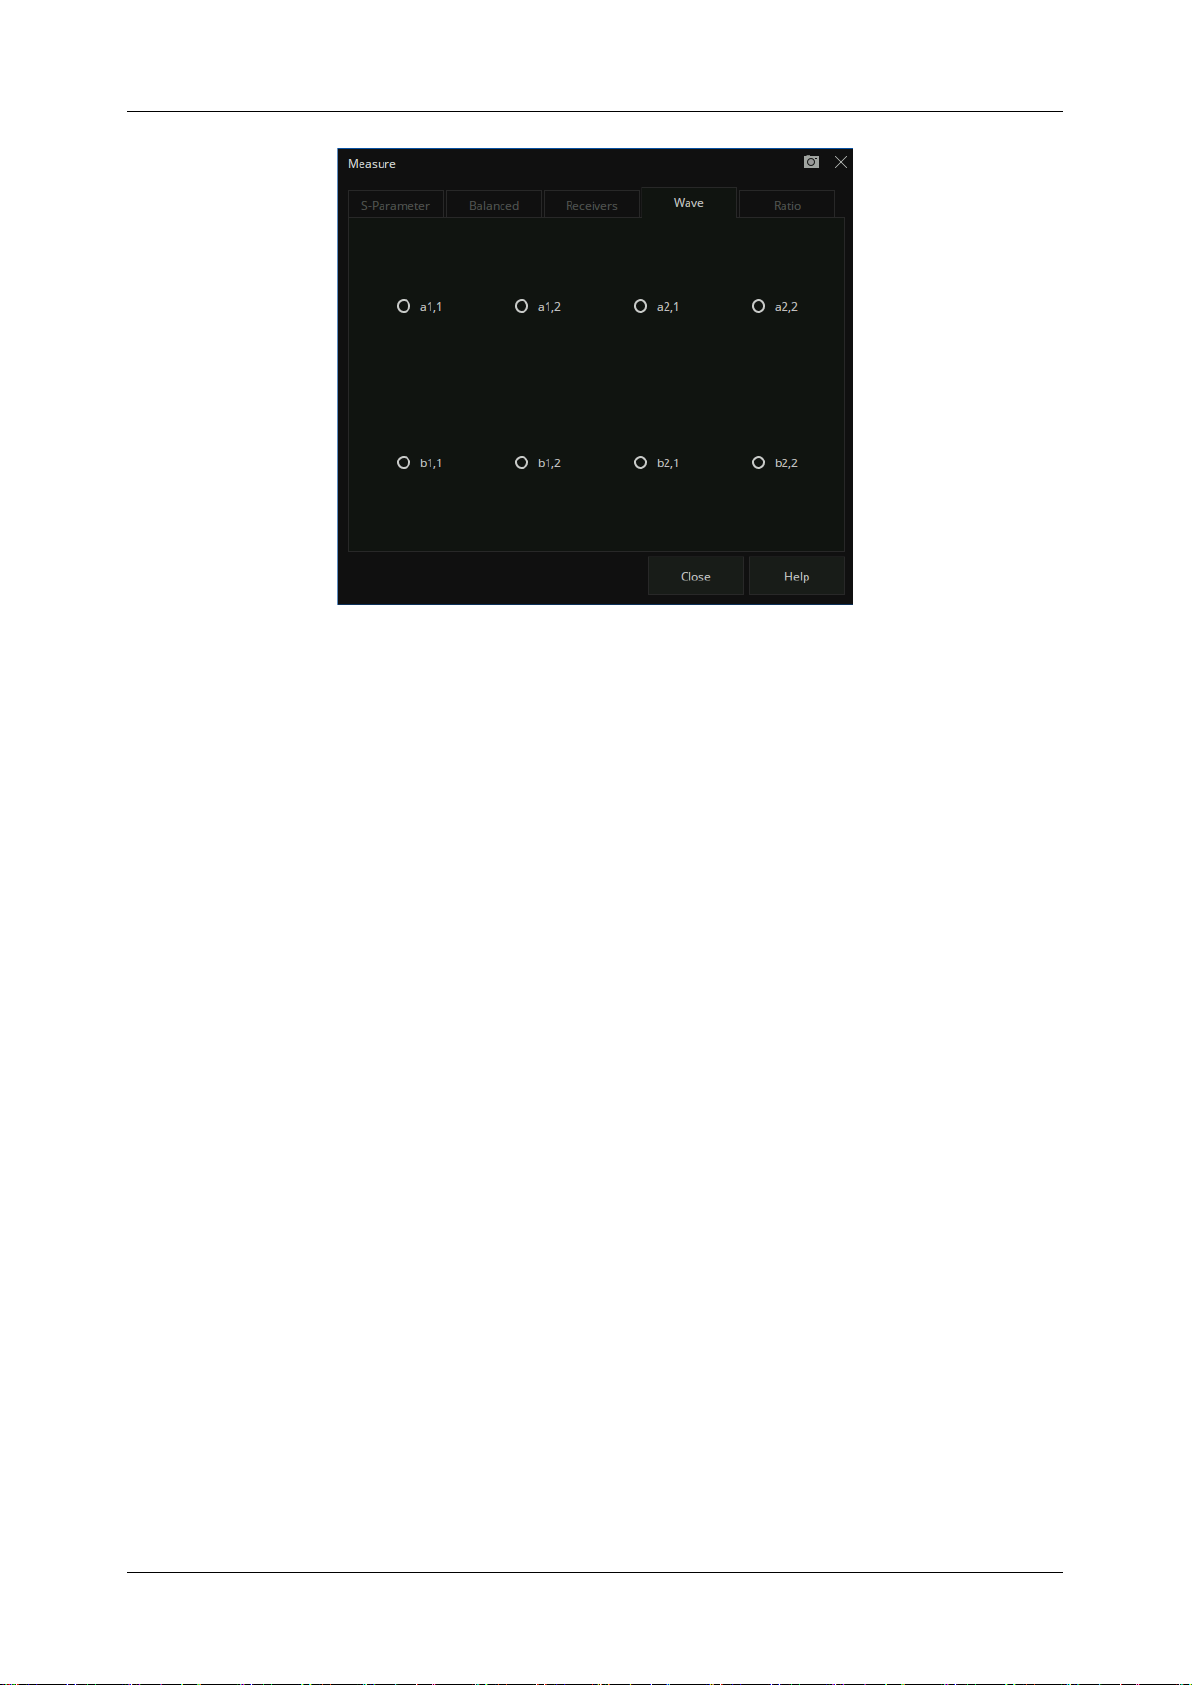
SHN900A User Manual
www.siglent.com
47
Logical receivers are generally represented by aN, M and bN, M forms.
aN, M represent the power received by the reference receiver of the logical port N when the physical
port M outputs power.
bN, M represent the power received by the measurement receiver of logical port N when the physical
port M outputs power.
● aN - Represents Reference receiver for logical port N
● bN - Represents the test port receiver for logical port N
● M – Represents the Physical port number of the output power
For example:
1)
a1,1
Represents Physical port 1 outputs power when the reference receiver of logical port 1 is
measured. When logical port 1 is mapped to physical port 1, it is equivalent to R1,1;
2)
a2,1
Represents Physical port 1 outputs power when the reference receiver of logical port 2 is
measured. When logical port 2 is mapped to physical port 2, it is equivalent to R1,2;
3)
b1,1
Represents Physical port 1 outputs power when the test port receiver of logical port 1 is
measured. When logical port 1 is mapped to physical port 1, it is equivalent to A,1;
4)
b2,1
Represents Physical port 1 outputs power when the test port receiver of logical port 2 is
measured. When logical port 2 is mapped to physical port 2, it is equivalent to B,1;
Page 50
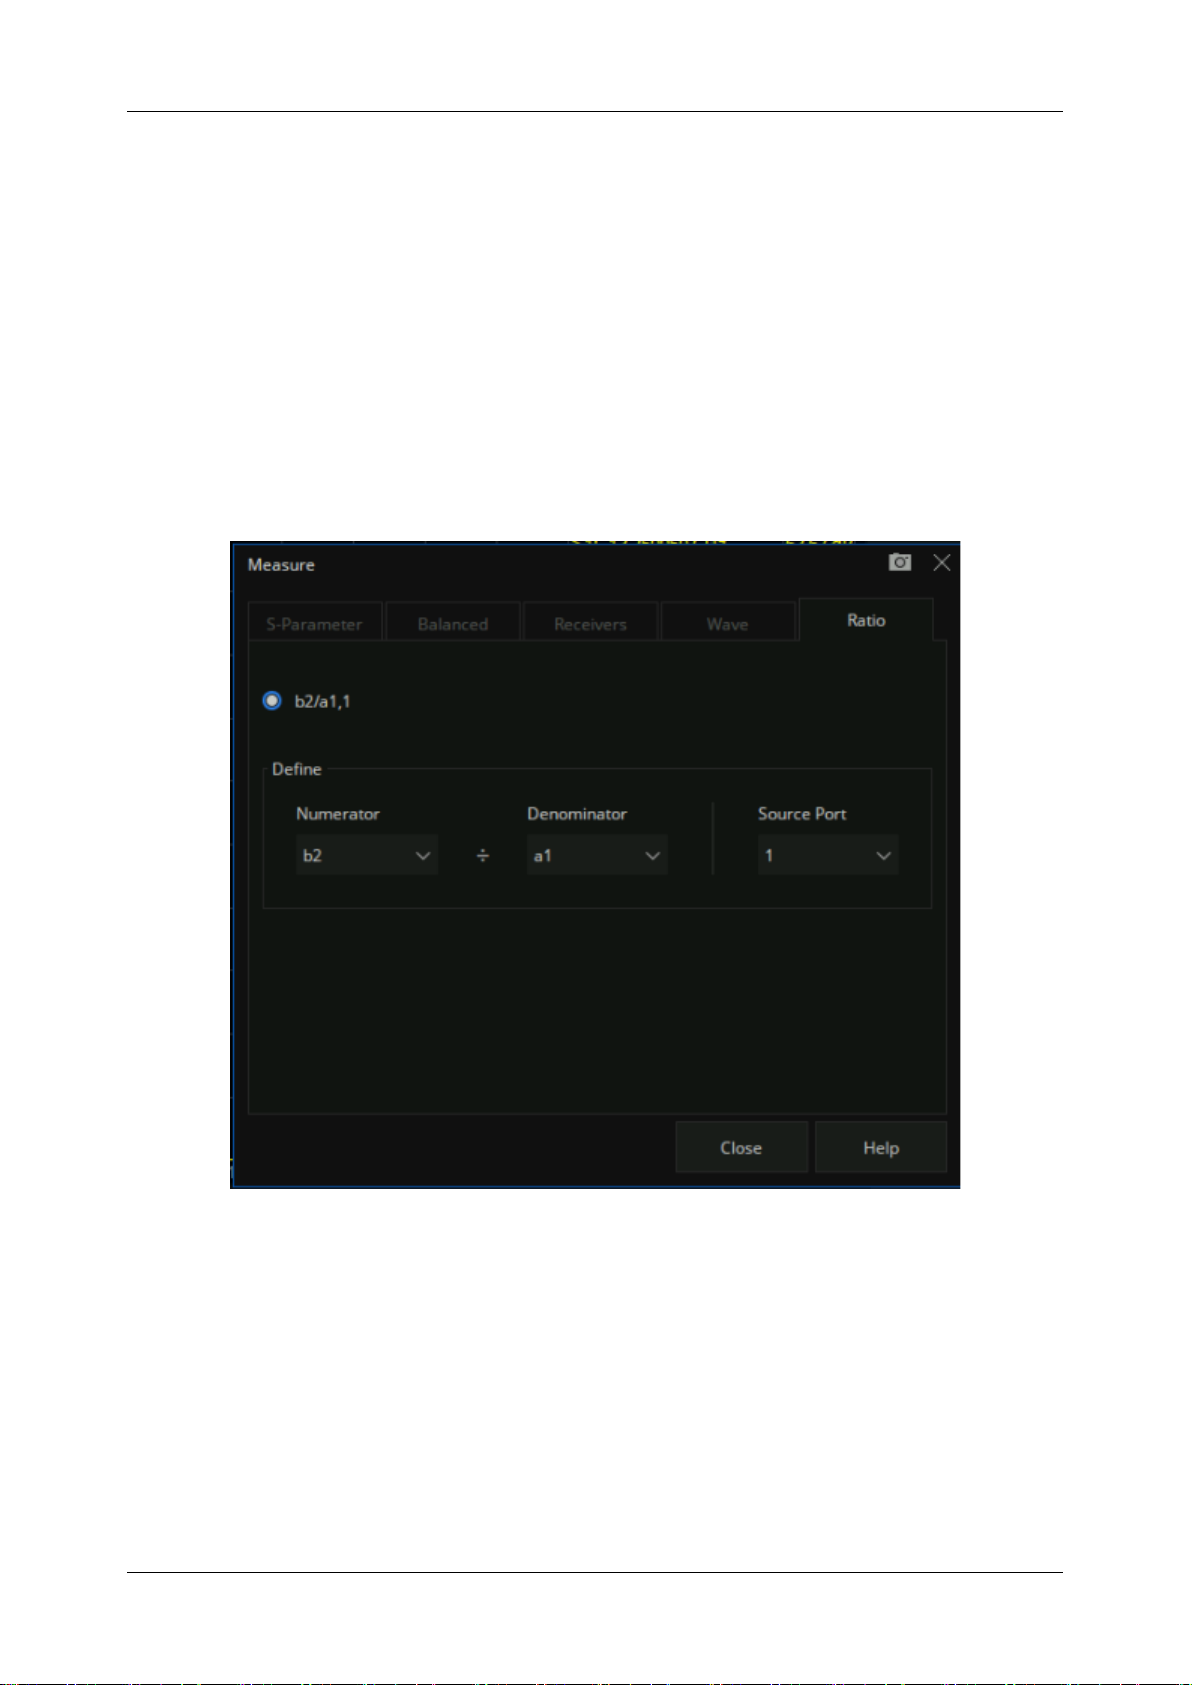
SHN900A User Manual
48
www.siglent.com
5.1.5 Ratio
Ratio measurement allow you to choose your own ratio of any two receivers that are available in
your analyzer. S-parameters are actually predefined ratio measurement. For example S11 is A/R1.
Ratio - Check Activate to create or change a measurement. Select a receiver for the Numerator,
select another receiver for the Denominator, then select a source port for the measurement.
The
Source port
is always interpreted as a logical port number.
For ratio measurement: "b2/a1,1" means that the logical source port number is 1, and the logical port
2 measurement receiver/logical port 1 reference receiver.
5.2 Frequency range
Frequency range is the span of frequencies you specify for making a device measurement.
Page 51

SHN900A User Manual
www.siglent.com
49
5.2.1 Set the frequency range
Set the range of RF frequencies.
Operating steps:
Press
Freq
on the front panel to open the frequency setting interface, parameter change mode:
1. Use the numeric keypad to input the value of the frequency and press the unit button to select
the desired unit. The optional units are GHz, MHz, kHz, and Hz. Press
ENTER
to select the
current unit by default.
2. Press
ENTER
or the multifunction knob to enter the state of parameter editing. Move the cursor
to the specified position by the left and right arrow keys. Modify the value by pressing the up and
down key, rotating the knob, or pressing the numeric keypad. Press
ENTER
, the knob, or
ESC
to exit the editing mode.
Note:
● Start: Specify the starting frequency of the swept measurement range
● Stop: Specify the end frequency of the swept measurement range
● Center: Specify a center frequency of the swept measurement range
● Span: Specify the swept measurement frequency range
● Step: Specifies the frequency step size between data points
● Number of Points: Specify the number of measurement points per sweep
5.2.2 CW time sweep or power sweep
Measurements using a CW time sweep or power sweep will be performed on a single frequency
rather than the entire frequency range
Operating steps:
Press
Sweep
, use the knob or arrow keys to focus on the
Sweep → Sweep type.
Parameter change
mode:
1. Press
ENTER
or the knob to enter the parameter editing state and then move the cursor to the
specified position by up and down arrow keys or the knob to set the
Sweep type
to
CW Time
or
Power Sweep
. Press
ENTER
or the knob to select the current option.
2. Press
Freq
use the knob or arrow keys to focus on the
Freq → CW
parameter entry. Select the
edit box to enter the edit mode and change the value by pressing the up and down key, rotating
the knob, or pressing the numeric keypad. Press
ENTER
, the knob, or
ESC
to exit editing mode.
Page 52

SHN900A User Manual
50
www.siglent.com
5.2.3 Frequency resolution
Set the frequency resolution to 1Hz.
5.3 Power level
Power level refers to the output power at the port of the vector network analyzer.
Here are the keys to operation:
1. Press
Power
, use the knob or arrow keys to focus on the
Power → Power Level
parameter
item. Input the required power level. Press
ENTER
to exit editing mode. The default unit is dBm.
2. Press
Power
, use the knob or arrow keys to focus on the
Power → RF Power
parameter item.
Turn on or off RF power.
3. Press
Power
, use the knob or arrow keys to focus on the
Port Power
parameter item, Configure
start and stop power. Start and stop power are only available in power sweep mode.
5.4 Sweep
Sweeping refers to the measurement of a series of consecutive data points against a series of
specified excitation values.
5.4.1 Points
Data points are the number of data samples representing the measured values at a single excitation
value. You can specify the number of data points that the vector network analyzer measures in a
sweep. The sweeping time of the vector network analyzer varies proportionally with the number of
points.
Operating steps:
Press
Sweep
, use the knob or arrow keys to focus on the
Sweep → Number of Points
parameter
item, Enter the number of points required, Press
ENTER
to exit editing mode.
The number of data points collected by the vector network analyzer during the measurement sweep
can be set to any number between 2 and 20001.
Page 53

SHN900A User Manual
www.siglent.com
51
Note:
Maximum point limits may differ for some measurement classes.
● For maximum trace resolution, use the maximum data points.
● For faster throughput, use a minimum number of data points to provide an acceptable resolution.
● To get the best number of points, look for values that do not differ significantly in the measurement
as you add points.
● To ensure accurate measurement calibration, ensure that the user uses the same number of
points for calibration and measurement.
Points are the number of data items collected in one sweep. This number can be set separately for
each channel.
● To obtain high trace resolution for excitation values, select a larger point value.
● For high throughput, keep the smaller point value within the allowable trace resolution range.
● For high measurement accuracy after calibration, use the same number of points as the actual
measurement.
5.4.2 Sweep type
Key operation:
Press
Sweep
, use the knob or arrow keys to focus on the
Sweep → Sweep Type
parameter item.
Press
ENTER
or Knob to enter the editing state, then move the cursor to the specified position by up
and down direction keys or Knob, set the sweep type to the required measurement type, press
ENTER
or Knob to select the current option.
Sweep type:
● Linear Frequency
● Log Frequency
● Power Sweep
● CW Time
● Segment Sweep
Linear Frequency:
Set the measured abscissa frequency scale as a linear scale, and keep the full
Page 54

SHN900A User Manual
52
www.siglent.com
frequency scale at equal intervals.
Log Frequency:
Set the measured abscissa frequency scale to log scale. To observe a wider
frequency range, the calibration interval in the full frequency band is not uniform and presents periodic
changes.
Power Sweep:
The power sweep will increase or decrease the power of the source according to the
walk length. Power sweeping is used to characterize power-sensitive circuits through measurements
such as gain compression. In the Sweep Type dialog box, you can specify “Start Power”, “Stop Power”,
“CW Frequency”, “Points”.
CW Time:
Set the analyzer to a single frequency, and the data is displayed versus time.
Segment Sweep:
“Segment Sweep” activates a sweep consisting of frequency sub sweep (called
segmentation). For each segment, you can define a separate power level, IF bandwidth, IF bandwidth
for each port, sweep time, delay, sweep mode. After the measurement calibration has been performed
on the entire sweep or all segments, the measurement values of one or more segments can be
calibrated.
In the Segment Sweep type, the vector network analyzer performs the following operations.
● Sort all defined segments in order of increasing frequency.
● Measurements were made at each point.
● Display a trace containing all retrieved data.
Limitations on segmented sweeping:
● The frequency range of one segment may not overlap with the frequency range of any other
segment.
● The number of segments is limited only by the combined data points of all segments in the sweep.
Operating steps:
Press
Sweep
, Use the knob or arrow keys to focus on the
Sweep → Sweep Type
parameter item.
Parameter change mode:
1. Press
ENTER
or Knob to enter the state of parameter editing, then move the cursor to the
specified position by up and down arrow keys or Knob, set the sweep type as
Segment Sweep
,
and press
ENTER
or Knob to select the current option.
2. Press
Sweep
, use the knob or arrow keys to focus on the
Segment Table
parameter item. Move
Page 55
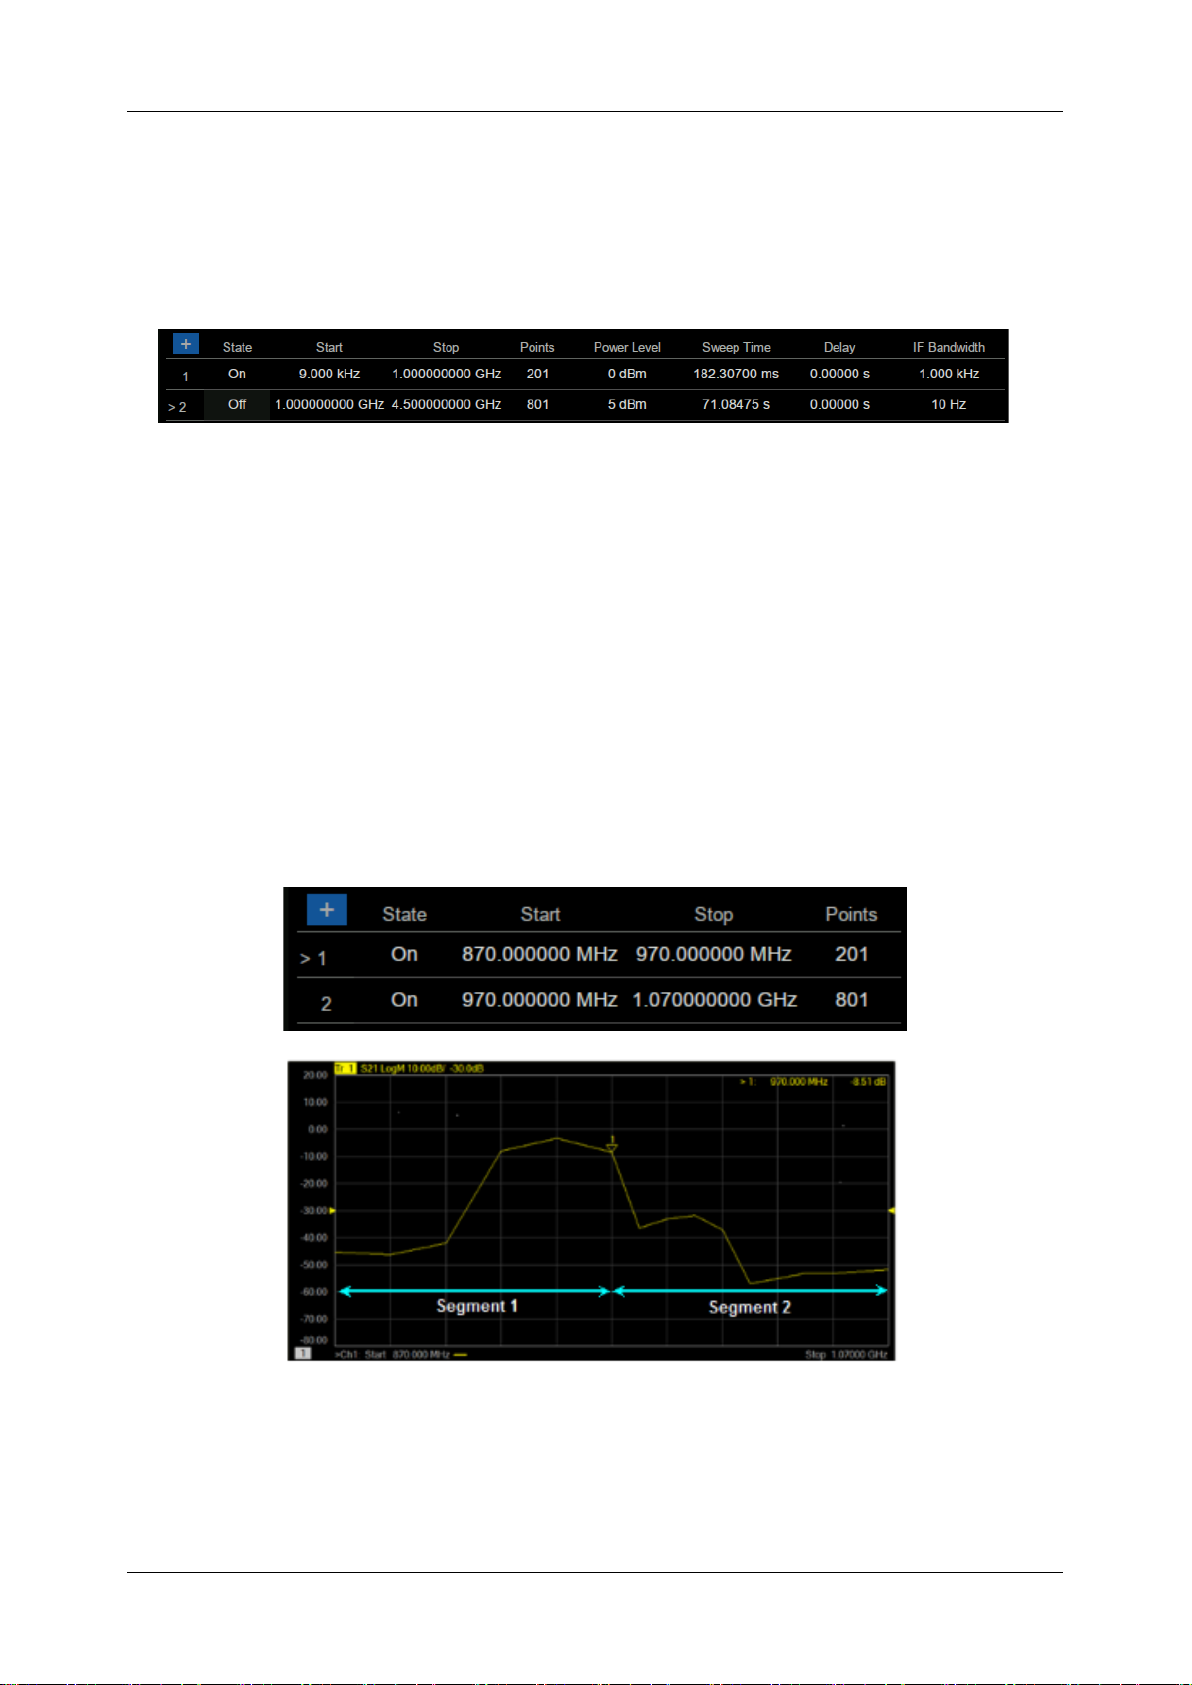
SHN900A User Manual
www.siglent.com
53
the cursor to the specified position by up and down arrow keys or knobs, set Add Segment, Insert
Segment, Delete Segment and Delete All Segments to perform segment operation. Select the
segment table for segment setting and tick the corresponding menu to display the corresponding
contents in the following segment.
Figure 5-1 Segment table
X-Axis Point Spacing:
In segment sweep mode, this feature will affect how the segment trace is
drawn on the screen. This function is in the sub-sweep table menu.
● When X-axis point spacing is not used, multi-segment sweeping traces may sometimes result in
many measurement points being squeezed into a narrower portion of the X-axis
● When X-axis point spacing is used, the X-axis position of each point needs to be selected so that
all measurement points are evenly distributed along the X-axis.
For example, suppose you have the following two sections:
Figure 5-2 X-point spacing is not used
Page 56
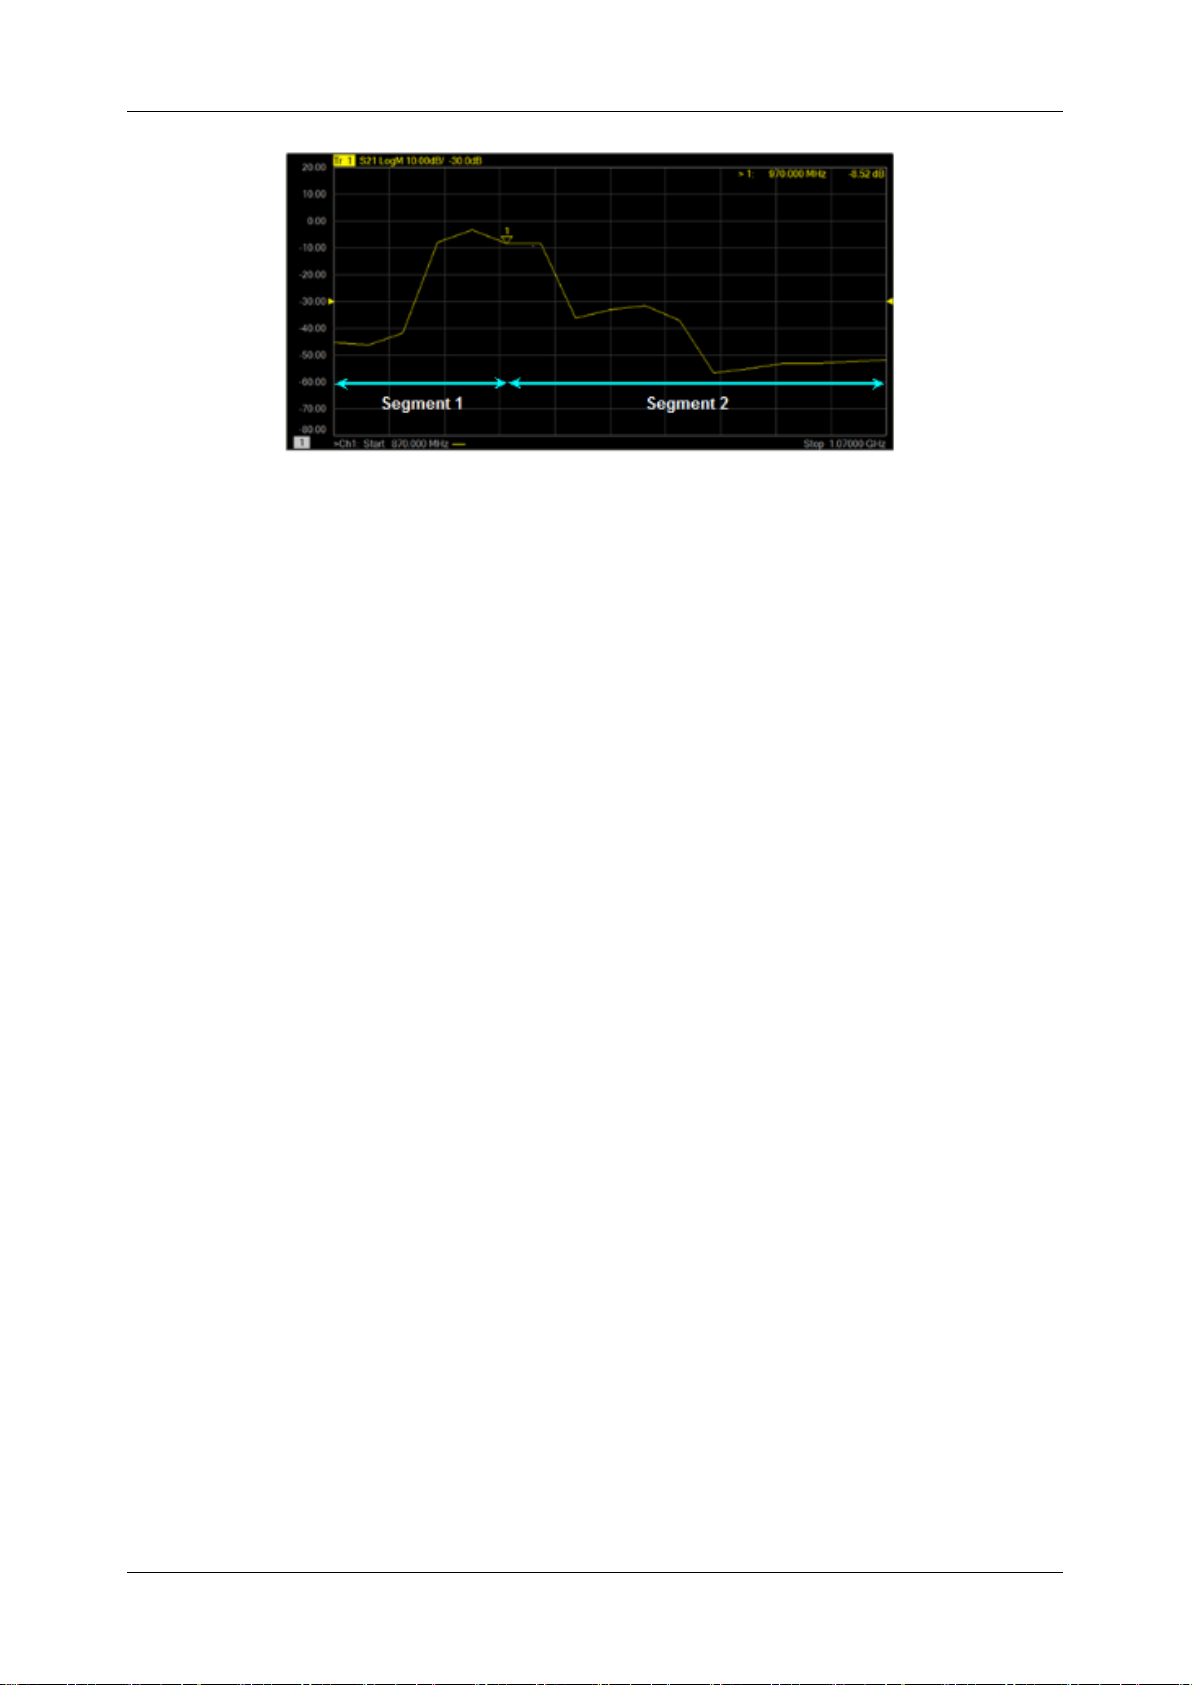
SHN900A User Manual
54
www.siglent.com
Figure 5-3 Use X-axis point spacing
5.5 Trigger
The trigger is the signal that causes the vector network analyzer to carry out the measurement sweep.
The vector network analyzer is flexible in the configuration of the trigger function.
5.5.1 Trigger Settings
Operating steps:
Press
Trigger
, use the knob or arrow keys to focus on the
Trigger
parameter item.
5.5.2 Trigger source
Operating steps:
Press
Trigger
, Use the knob or arrow keys to focus on the
Trigger Source
parameter item. Press
ENTER
or the Knob to enter the parameter editing state, then move the cursor to the specified position
by the up and down arrow keys or the knob, and press
ENTER
or the knob to select the current option.
Trigger source:
These Settings determine the source of the trigger signal for all existing channels. A
valid trigger is generated only if the vector network analyzer is not sweeping.
● Internal triggers: After the previous measurement is completed, the vector network analyzer will
immediately send a continuous trigger signal.
Page 57

SHN900A User Manual
www.siglent.com
55
● Bus trigger: The vector network analyzer waits for the SCPI trigger instructions issued by an
external controller (PC).
● External trigger: Trigger signals generated by external devices received through the BNC
Connector on the rear panel.
● Manual trigger: Manually send a trigger signal to the vector network analyzer. Available Only
when you select “Manual” to trigger.
5.5.3 Trigger Range
Operating steps:
Press
Trigger
, Use the knob or arrow keys to focus on the
Trigger Scope
parameter item. Press
ENTER
or the Knob to enter the parameter editing state, then move the cursor to the specified position
by the up and down arrow keys or the knob, and press
ENTER
or the knob to select the current option.
● All channels: Triggers are sent to all triggerable channels. A trigger will sweep all channels that
can be triggered. (Default setting)
● Current channel: Triggers are sent to the current channel but after the current channel completes,
the channel increments to the next triggerable channel.
5.5.4 Channel Settings
Operating steps:
Press
Trigger
, use the knob or arrow keys to focus on the
Trigger
parameter item. Press
ENTER
or
the Knob to enter the parameter editing state, then move the cursor to the specified position by the
up and down arrow keys or the knob, and press
ENTER
or the knob to select the current option.
These settings determine the number of trigger signals that the channel will receive.
● Hold trigger: The channel does not accept any trigger signals.
● Single trigger: The channel receives a trigger signal and then enters the “hold” state. Another
way to trigger a single measurement: Set the trigger source to “manual” and send a manual
trigger. At this point, however, all channels are set to single trigger.
● Continuous trigger: Channels accept an unlimited number of trigger signals.
● Hold all channels: All channels enter the hold state and do not accept any trigger signals.
Page 58

SHN900A User Manual
56
www.siglent.com
● Restart:
Stops the currently sweeping Channel, and re-sweep when a new trigger signal is received.
Examples:
1. When the trigger source is internal trigger and the trigger mode is "Single" or "Continuous",
click the "Restart" then the trace will re-sweep from the first frequency point.
2. When the trigger source is Manual/External/Bus and the trigger mode is "Single" or
"Continuous", click the "Restart" will stops the currently sweeping and re-sweep when a new
trigger signal is received.
3. When channel in Hold mode, click the "Restart" does not do anything.
4. Multiple Channels in Continuous mode: The current sweep on the current channel is stopped,
and the first channel that can sweep is started.
5.5.5 Trigger mode
Operating steps:
Press
Trigger
, use the knob or arrow keys to focus on the
Trigger → Trigger Setup
parameter item.
Press
ENTER
or the Knob to enter the parameter editing state. Then move the cursor to the specified
position by the up and down arrow keys or the knob, and press
ENTER
or the knob to select the
current option.
These settings determine the number of trigger signals that the channel will receive.
● Sweep trigger: Each “manual” or “external” trigger causes all traces of the shared source port to
be swept in the order specified below. In the case of a “single” trigger, the count decrements by
1 after sweeping all traces in all directions.
● Point trigger: Each “manual” or “external” trigger results in a measurement of a data point.
Subsequent triggers go to the same trace until it completes, the other traces in the same channel
are then swept in the order specified below. If it is a "single" trigger, the count decreases by 1
after measuring all data points on all trace lines in the channel.
When multi-port calibration is on (requires multi-direction sweeping), the trace on the screen will not
be updated until all relevant directions have been swept. For example, when all four 2-port S
parameters are displayed:
a) If full 2-port calibration is on, triggering 1 will cause no trace to be updated.
b) When the calibration is off, triggering 1 will cause S11 and S21 updates. Trigger 2 will cause
updates to S22 and S12.
Trace sweep order:
Page 59

SHN900A User Manual
www.siglent.com
57
For all trigger modes, the trigger signal remains in the same channel until all traces in this channel
have been swept, and then continue to trigger the next channel that is not in the "hold" state.
The traces within each channel are always swept in the following order:
Scan the traces in order of source ports. For example, in a channel with all four 2-port S parameters,
simultaneously scan the source port 1 trace (S11 and S21). Then, simultaneously scan the source
port 2 traces (S22 and S12).
5.5.6 External and auxiliary triggers
Both external and auxiliary triggers are used to synchronize the triggers of the vector network analyzer
with those of other devices.
Ready signal and trigger signal:
Ready signals are different from trigger signals. The ready signal is used to indicate that the
transmitting instrument is ready for measurement. The instrument receiving the ready signal then
sends a trigger signal indicating that the measurement will be made or that the measurement has
been completed. Usually, the slower instrument sends the trigger signal.
● Measurement trigger input: This signal is easy to use, but has limited configuration capabilities.
● Auxiliary trigger outputs: Connectors and signals are highly configurable and can be used to
synchronize with any number of devices.
Measurement trigger input
The trigger input connector is located on the back panel of the vector network analyzer. These signals
can be used when the vector network analyzer communicates with slower instruments.
● The vector network analyzer sends a “ready” signal when it is ready for measurement
● The external device sends a trigger signal to the vector network analyzer when it is ready for
measurement
● Additional signals are provided on the vector network analyzer processor I/O to indicate that the
vector network analyzer sweep has been completed and the processor can be set for the next
measurement.
Page 60

SHN900A User Manual
58
www.siglent.com
To make the vector network analyzer respond to measured trigger inputs or processor I/O signals,
select
External
on the “Trigger Settings” tab on the “Source” Settings. Also, on the Trigger Settings
tab, on the Range Settings, select whether an external trigger applies to all channels (global) or one
channel (local). The appropriate settings to apply are as follows:
Main trigger input:
Global/ channel trigger delay - after receiving an external trigger, the start time of the sweep will be
delayed by the specified amount of time plus any inherent delay.
● When the trigger scope is “channel” , the delay value is applied to the specified channel.
● When the Trigger Range is Global, the same delay value is applied to all channels.
The VNA receives the trigger input signal through the following connectors:
● Measure trigger input BNC connector: Trigger input on the rear panel.
Polarity:
High level: When the vector network analyzer is ready (trigger ready) and the TTL signal on the
selected input is “high”, It triggers the vector network analyzer.
Low level: When the vector network analyzer is ready (trigger ready) and the TTL signal on the
selected input is “low”, it triggers the vector network analyzer.
Positive edge: When the vector network analyzer is ready, it will trigger on the next positive edge.
When set to accept a trigger before ready, if a positive edge has been received since the last data
acquisition, the vector network analyzer will trigger immediately after ready
Negative edge: When the vector network analyzer is ready, it will trigger on the next negative edge.
When set to accept the trigger before ready, if a negative edge has been received since the last data
acquisition, the vector network analyzer will trigger immediately after ready.
After receiving the trigger selection before being ready, the vector network analyzer will move to the
ready state (trigger ready), if any triggers have been received since the last data fetch, the vector
network analyzer will trigger immediately and the vector network analyzer will remember only one
trigger signal. All other signals will be ignored.
● If this check box is cleared, any trigger signals received by the vector network analyzer before it
is ready will be ignored.
● This feature is only available when a positive or negative edge trigger is selected.
Page 61

SHN900A User Manual
www.siglent.com
59
Trigger ready indicator (output):
On the Vector Network Analyzer, when "External" is selected on the "Trigger Settings" tab, both
"Measurement Trigger Input" and "Measurement Trigger Ready (Output)" will be enabled.
Select the connector to send the ready output signal of the vector network analyzer:
● Processor I/O pin 21.
Select the "polarity" of the "ready output" signal.
● Ready low: "TTL low" indicates that the vector network analyzer is triggered ready
Auxiliary trigger
The auxiliary trigger connector is located on the back panel of the vector network analyzer. When the
external source is configured as an external device, the vector network analyzer will automatically
control all trigger settings. Do not set other trigger settings. The vector network analyzer will start
measuring when it receives a valid trigger signal from the specified trigger source:
● Inside: Measurements begin immediately.
● Manual: Press the vector network analyzer “Trigger” button to start the measurement.
● External: The measurement starts when the measurement trigger input signal is received from
the external device. This must be configured separately.
The “Auxiliary Trigger Output” signal can be configured to be sent just before the measurement is
performed or just after the measurement is completed. When communicating with an external source,
the “Auxiliary Trigger Output” signal should be sent after the measurement is completed to indicate
that the external source can be set for the next measurement.
Enable:
When checked, the signal can be output to external devices using auxiliary connectors.
● Channel: This setting is controlled by the vector network analyzer “Preferences” setting.
● Global: All secondary trigger settings apply to all channels. On the Trigger Settings tab, set the
“Each Point” setting, which also applies to all channels.
Channels:
All secondary trigger settings will be applied to the specified channel and each channel
can be configured individually.
Auxiliary channel output (to device):
The following settings control the properties of the signal emitted from the “Auxiliary Trigger Output ”
Page 62

SHN900A User Manual
60
www.siglent.com
connector on the back panel:
Polarity:
Positive pulse: the output pulse is positive.
Negative pulse: The output pulse is negative.
Location:
Before acquisition: Send pulses just before data collection begins.
After the acquisition: Pulses are sent immediately after data collection is completed.
Each point: When checked, trigger output can be sent for each data point, and when cleared, trigger
output can be sent for each sweep.
Select “Auxiliary Trigger” - “Global” vector network analyzer preferences, On the “Trigger Settings”
tab, the “Dot” Settings are set. After that, this setting applies to all channels. When multiple channels
exist, the channel settings set last are used.
Pulse Duration: Specify the duration of a positive or negative output trigger pulse.
5.6 Data format
The data format is the method by which the vector network analyzer displays the measured data
graphically. Select the data format that corresponds to the information you want to know about the
test device.
5.6.1 Display format
Operating steps:
Press
Format
, Use the knob or arrow keys to focus on the
Format
parameter item. Press
ENTER
or
the Knob to enter the parameter editing state, then move the cursor to the specified position by the
up and down arrow keys or the knob, and press
ENTER
or the knob to select the current option.
5.6.2 Cartesian coordinates display format
Nine of the twelve available data formats use rectangular displays to present measurement data. This
Page 63

SHN900A User Manual
www.siglent.com
61
display is also known as Cartesian, XY, or linear coordinates. The Cartesian coordinate display is
especially suitable for clearly displaying the frequency response information of the device-under-test
(DUT).
● The excitation data (frequency, power, or time) is linearly scaled and displayed on the X-axis
● The measured response data is displayed on the Y-axis
Log amplitude scheme:
● Display amplitude (no phase)
● Y: dB
● Typical measurements: Return loss, insertion loss, or gain
Phase format:
The phase of the signal is measured relative to the calibration reference plane, within a range of ±180
degrees.
● Display phase (no amplitude)
● Y: Phase (degrees)
● Each 180-degree trace is “wrapped” for easy scaling
● Typical measurement: Linear phase shift.
Unfold phase:
● Same phase, but no 180-degree entanglement.
Note: Phase unwrapping is accomplished by comparing the phases of two adjacent data points. If the
phase difference between the two points is greater than 180 degrees, or the DC offset phase
of the first data point is greater than 180 degrees, then the phase measurement may not be
accurate.
Group delay format:
● Displays the transmission (propagation) time of signal in the device
● Y: Time (s)
● Typical measurement: Group delay
Page 64

SHN900A User Manual
62
www.siglent.com
Linear amplitude scheme:
● Only positive values are displayed
● Y: No Unit (U, suitable for proportional measurements)
Watts (W, suitable for disproportionate measurements)
● Typical measurements: Reflection and transmission coefficients (amplitude), time domain
transformation
SWR format:
● Displays the reflection measurements calculated from the formula (1+ R) / (1-R), where R is the
reflection coefficient
● Valid for reflection measurements only
● Y: No units
● Typical measurements: SWR
Real number format:
● Show only the real part of the measured complex data
● Can display both positive and negative values
● Y: No units
● Typical measurements: Time domain, auxiliary input voltage signals for maintenance purposes
Imaginary number format:
● Only imaginary parts of the measured data are displayed
● Y: No units
● Typical measurement: Network impedance matching
5.6.3 Polar coordinates
The polar coordinate format is used to view the amplitude and phase of the reflection coefficients in
S11 or S22 measurements.
Page 65
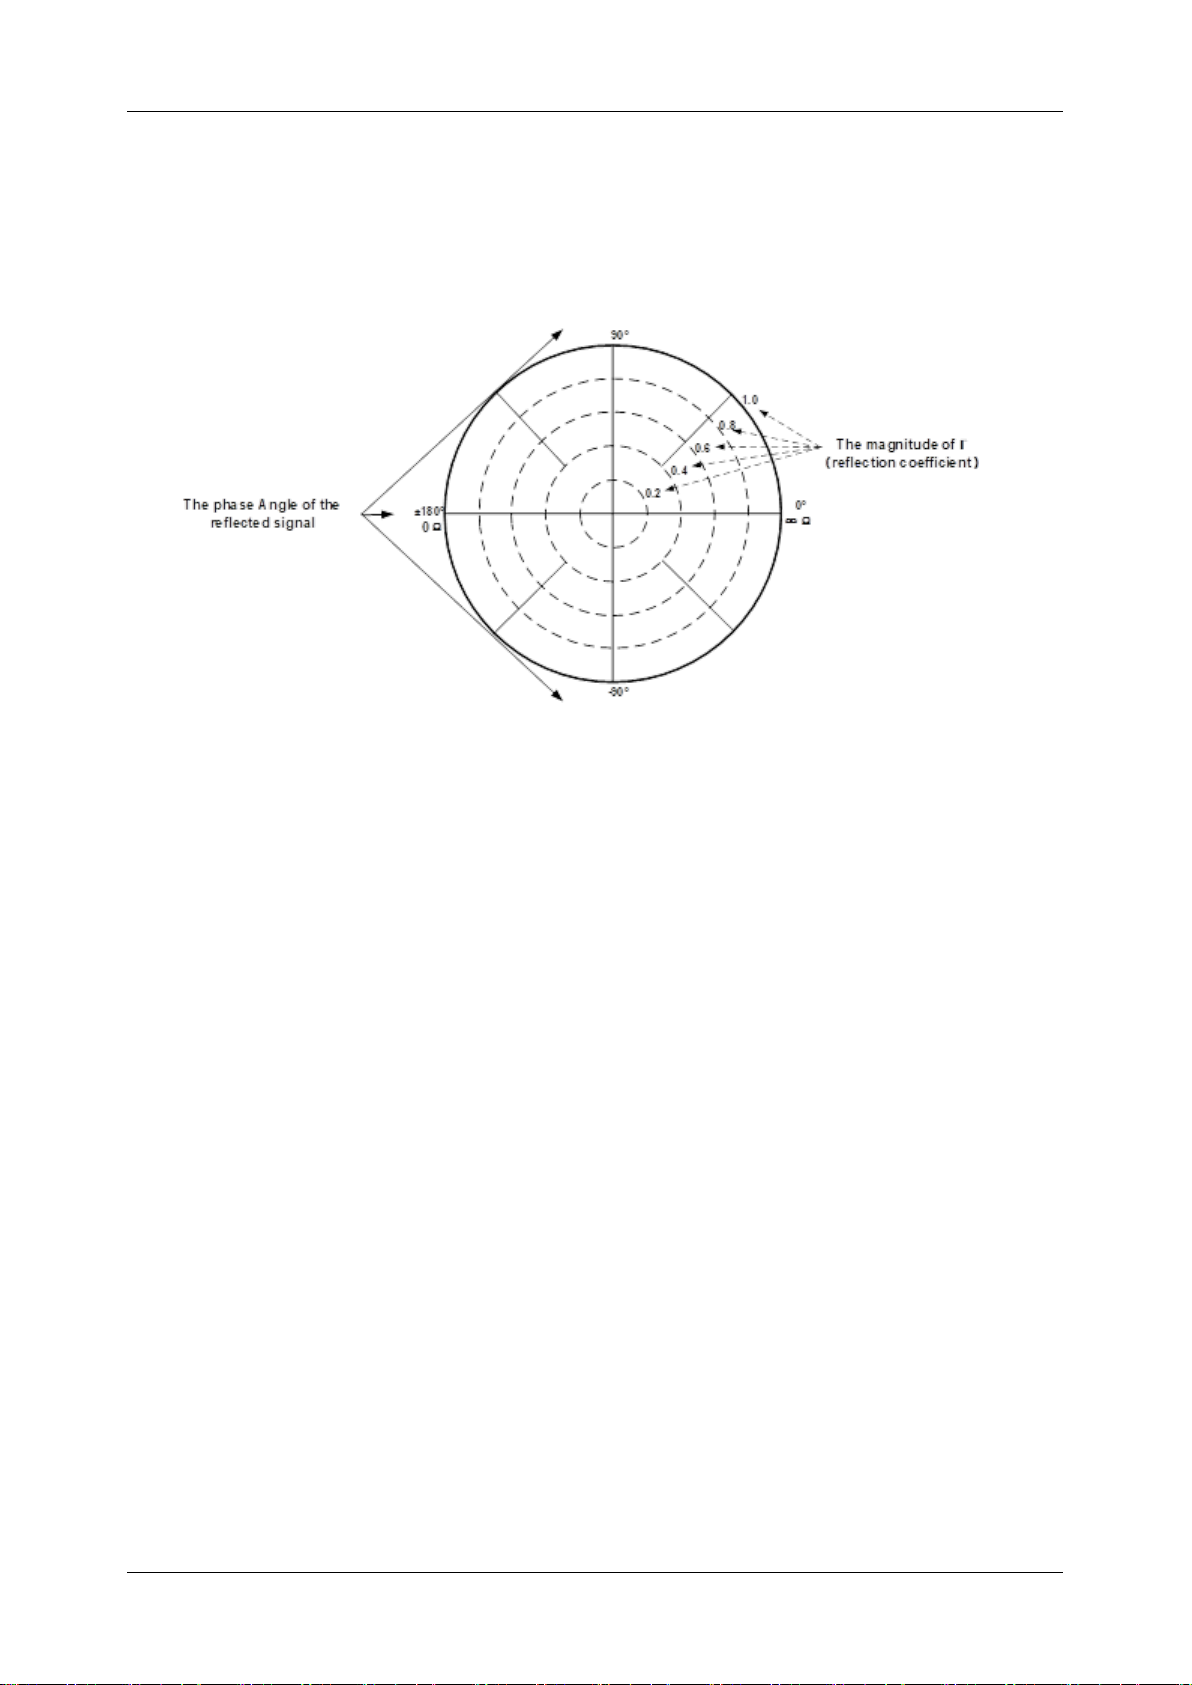
SHN900A User Manual
www.siglent.com
63
You can use a cursor to display the following items:
● Linear or log amplitude (in dB)
● Phase (in degrees)
Figure 5-5-4 Polar diagram
● The dotted circle indicates the reflection coefficient. The outermost circle represents the reflection
coefficient with a value of 1. The center of the circle represents the reflection coefficient with a
value of 0.
● The radial line shows the phase angle of the reflected signal. The right-most position corresponds
to the zero-phase angle (that is, the reflected signal has the same phase as the incident signal).
The phase differences of 90°, ±180°, and -90° correspond to the top, leftmost, and bottom of the
polar display, respectively.
5.6.4 Smith circle diagram
Smith diagrams are a tool for mapping complex reflectance coefficients to test the impedance of
equipment. In the Smith chart, the linear impedance plane is reshaped to form a cyclic grid from which
the resistance and reactance (R+ Jx) can be read.
You can use a cursor to display the following items:
● Resistance (in Ohms)
● Reactance as equivalent capacitance (in Ephraeras) or inductance (in Henrys)
Page 66
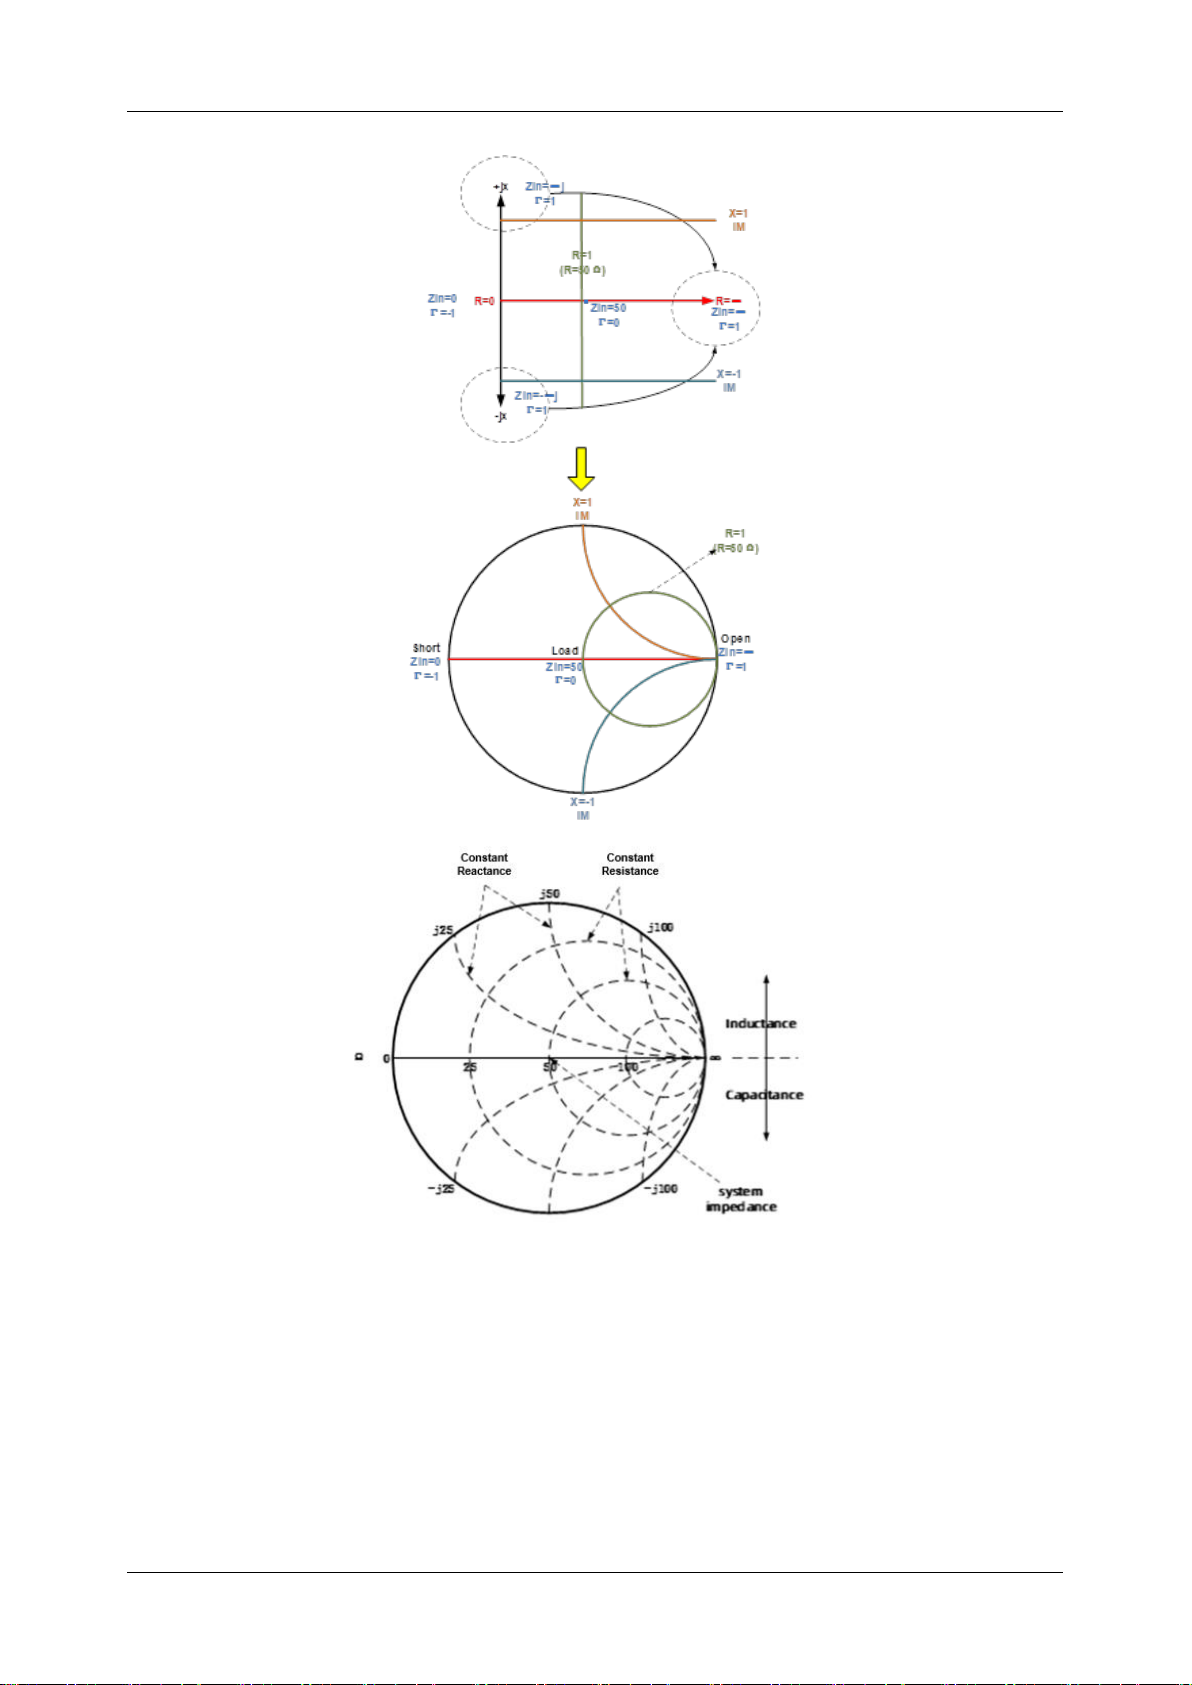
SHN900A User Manual
64
www.siglent.com
Figure 5-5 Schematic diagram of Smith circle
Smith diagram interpretation:
● Each point on the Smith chart represents a complex impedance (r±jx) consisting of a real
resistance (r) and an imaginary reactance (x).
● The horizontal axis (solid line) shows the real part of the difference between impedance and
resistance. The horizontal axis always represents the system impedance. The rightmost
Page 67

SHN900A User Manual
www.siglent.com
65
value is infinite ohms (open path). The leftmost value is zero ohms (short circuit).
● The dotted circle intersecting the horizontal axis represents a constant resistance.
● A dashed arc tangent to the horizontal axis represents a constant reactance.
● The top half of Smith's circle is the region where the reactance component is positive and
hence inductance is generated.
● The lower half is the region where the reactance component is negative and therefore
generates capacitance.
There is also a Reverse Smith circle diagram (also called an Admittance Smith Chart):
Same as the standard Smith circle, with the following exceptions:
● The polar grid is reversed from right to left.
● Admittance (in Siemens) instead of resistance.
5.7 Scale
5.7.1 Scale/ reference level and position
The “Scale”, “Reference Level”, and “Reference Position” Settings (as well as the format) determine
how the data trace will appear on the vector network analyzer screen.
Operating steps:
Press
Scale
, Use the knob or arrow keys to focus on the reference level and reference position
parameter items under the
Scale
menu bar. Press
ENTER
or the knob to enter the parameter editing
state, then move the cursor to the specified position by the up and down arrow keys or the knob, and
press
ENTER
or the knob to select the current option.
Scale:
Sets the vertical indexing value of the rectangular coordinate display format. In polar
coordinates and Smith chart formats, the scale sets the value of the outer perimeter. Range: 0.001
dB/div to 1000 dB/div. Scale do not apply in logarithmic scale type.
Automatic scaling:
Automatically sets the vertical indexing value and reference value to fit the
working data trace in the screen grid area. The excitation value and reference position are not affected.
The vector network analyzer determines the minimum possible scaling factor that will allow all display
data to appear on the 80% vertical grid. The selected reference values center the trace on the screen.
All autoscaling:
Automatically scales all data traces in the working window to fit vertically into the
Page 68

SHN900A User Manual
66
www.siglent.com
grid area of the screen.
Reference level:
Sets the value of the guide in rectangular format. Range: -1000 dB to 1000 dB. In
polar coordinates and Smith's circle chart formats, and logarithmic scale type, the reference level
does not apply.
Reference position:
Sets the position of the guide in Rectangular coordinate format. Zero is the
bottom line and 10 is the top line. The default position is 5 (middle of the screen). Reference positions
do not apply in polar coordinates, Smith chart formats and logarithmic scale type.
5.7.2 Scaling coupling
When “Scale Coupling” is enabled, tracks of the same format will have the same “Scale”, “Reference
Level”, and “Reference Position”. You can choose to couple the scales for traces in the same window,
for all traces in all Windows, or uncouple them.
Operating steps:
Press
Scale
, use the knob or arrow keys to focus on the
Scale → Scale Coupling
parameter item.
Press
ENTER
or Knob to enter the editing state, select
Off / Window / All
, then move the cursor to
the specified position by up and down arrow keys or Knob, press
ENTER
or Knob to select the current
option
Note:
Traces of the same format have the same scale, reference level, and reference position.
Coupling Method:
Close:
No coupling. Each trace is scaled individually. This is the default setting.
Window:
All traces of the same format in each selected window share the same scale settings
All:
Coupled between all selected windows, all traces of the same format in all selected windows
share the same scale settings.
● When window or full coupling is enabled, the scale settings for the working trace will be adopted
by other coupling traces of the same format
● If traces of a different format exist, all traces of that format will be set as the least numbered trace
in that format
● Once enabled, the scale settings for all coupling traces of the same format can be changed with
any coupling trace in the working state
Page 69

SHN900A User Manual
www.siglent.com
67
Selected Windows:
Available when selecting a window or all methods. The selected window participates in scaling
coupling. By default, all windows are selected. Cancel the check box to disable zoom coupling for this
window.
About “Auto Scaling” and “Scaling Coupling”:
Automatic scaling using the coupling method affects the work trace in the work window. All traces
coupled to this trace will be set with the new scale of the working trace. This will cause some traces
to not appear on the screen.
Full automatic scaling using the coupled method
● Close: All traces in the working window are automatically scaled separately.
● Window: All traces in each selected window are automatically scaled to conform to a common
set of scaling factors.
● All: All traces in all selected Windows are automatically scaled to conform to a common set of
scaling factors.
5.7.3 Electrical delay
Electrical delay is a mathematical function that simulates the variable length of a lossless transmission
line. Linear phase shifts through the device can be compensated using the electrical delay function.
Use this feature to determine only the linear phase deviation of the device. Electrical delay can be set
separately for each measuring trace.
Operating steps:
Press
Scale
, use the knob or arrow key to bring focus to the
Electrical Delay
parameter item. Press
ENTER
or Knob to enter the editing state. After the editing is completed, move the cursor to the
specified position by up and down direction keys or Knob. Press
ENTER
or Knob to select the current
option.
Delay time:
Specifies the value of the delay added or removed, expressed in time or distance. This
compensates for the linear phase shift through the device. Electrical delay can be set separately for
each measuring trace.
Page 70

SHN900A User Manual
68
www.siglent.com
Speed coefficient:
Specify the velocity factor applied to the device media inserted after
measurement calibration. The value is 0.66 for polyethylene insulated cables and 0.7 for PTFE
insulators.1 corresponds to the speed of light in a vacuum.
Distance unit:
Select meters, inches, or feet. When you change this value, the step size does not
change automatically.
5.7.4 Amplitude offset and amplitude slope
The “amplitude offset” allows the amplitude (rather than phase) data to be offset by a fixed or slope
value in Db. The amplitude offset setting affects only the work trace. If the display format is “Linear
Amplitude” or “Real Number” (unitless), the dB is converted and the correct offset is implemented.
Operating steps:
Press
Scale
, use the knob or arrow keys to bring focus to the
Constants → Mag Offset / Mag Slope
parameter item.
Press
ENTER
or Knob to enter the editing state. After the editing is completed, move the cursor to
the specified position by up and down direction keys or Knob. Press
ENTER
or Knob to select the
current option.
Amplitude deviation:
Offset the entire data trace at the specified value.
Margin slope:
Offset the data trace by some value that changes with frequency. The offset slope
starts at 0 Hz.
5.7.5 Phase deviation
Phase offset mathematically adjusts the phase measurement to a specified degree (up to 360°). This
feature can be used in the following ways:
● Improved display of phase measurements. This is the same way as changing the reference level
in the amplitude measurement. Change the phase response to the center or align the response
on the screen.
● Simulate Projection phase shift in measurements. For example, if you know that you need to add
a cable and that the length of the cable will add a certain phase shift to the measurement, you
can use a phase shift to increase the length and simulate the entire device measurement.
Page 71

SHN900A User Manual
www.siglent.com
69
Operating steps:
Press
Scale
, use the knob or arrow keys to bring focus to the
Constants → Phase Offset
parameter
item. Press
ENTER
or Knob to enter the editing state. After the editing is completed, move the cursor
to the specified position by up and down direction keys or Knob. Press
ENTER
or Knob to select the
current option.
5.7.6 Divisions
Sets the number of divisions on the Y axis. An even number from 4 to 30 must be used. Once set, it
is commonly applied to all the traces displayed in the linear scale type on the Y axis within that window.
Operating steps:
Press
Scale
, use the knob or arrow keys to focus on the
Advanced → Divisions
parameter item.
Press
ENTER
or Knob to enter the editing state. Set the value of the Y-axis divisions in the Cartesian
coordinate format. After the editing is completed, move the cursor to the specified position by up and
down direction keys or Knob. Press
ENTER
or Knob to select the current option. Range: even
numbers from 4 to 30. Divisions do not apply in polar coordinates, Smith chart formats and logarithmic
scale type.
5.7.7 Scale type
The scale types include linear scale and logarithmic scale, which are expressed as the scale
distribution of the Y axis in the coordinate system. In a logarithmic scale type, the upper and lower
limits of the Y-axis determine how the data trace is displayed on the VNA screen. The scale type can
be set separately for each measuring trace.
Operating steps:
Press
Scale
, use the knob or arrow keys to focus on the
Advanced → Scale Type
parameter item.
Press
ENTER
or Knob to enter the editing state. After the editing is completed, move the cursor to
the specified position by up and down direction keys or Knob. Press
ENTER
or Knob to select the
current option.
Note:
The logarithmic scale type can only be selected when the display format is linear magnitude
scheme, real number format or imaginary number format. Other formats are linear scale type.
Page 72

SHN900A User Manual
70
www.siglent.com
Scale type:
● Linear Scale Type
● Log Scale Type
Linear:
Y-axis scale linear distribution. The display mode can be set by setting scale, reference level
and position.
Log:
The Y-axis scale is logarithmic. The display range can be set by setting the maximum and
minimum values of the Y axis.
Max Value:
Set the upper limit of the Y-axis in the logarithmic scale type.
Min Value:
Set the lower limit of the Y-axis in the logarithmic scale type.
5.8 Avg BW And IFBW
5.8.1 Overview
The dynamic range is the finite difference between the maximum input power level and the minimum
measurement power level (noise floor) of the analyzer. In evaluating a characteristic accompanied by
a large change in the amplitude (the start and stop band of a filter for example), it is important to
increase the dynamic range. The noise floor can be reduced by narrowing the IF bandwidth or turning
on Sweep Averaging.
For minimizing very low noise, Averaging is more effective than reducing IF bandwidth. Generally,
Averaging takes slightly longer than IF bandwidth reduction to lower noise, especially if many
averages are required. Also, changing the IF bandwidth after calibration results in uncertain accuracy.
5.8.2 Averaging
Averaging is a feature that the VNA averaging on each data point before stepping to the next data
point. You determine the number of measurements by setting the averaging factor. The higher the
averaging factor, the greater the amount of noise reduction.
Averaging setting:
Press the “Avg BW” key, then enter the Averaging and Bandwidth menu.
Page 73
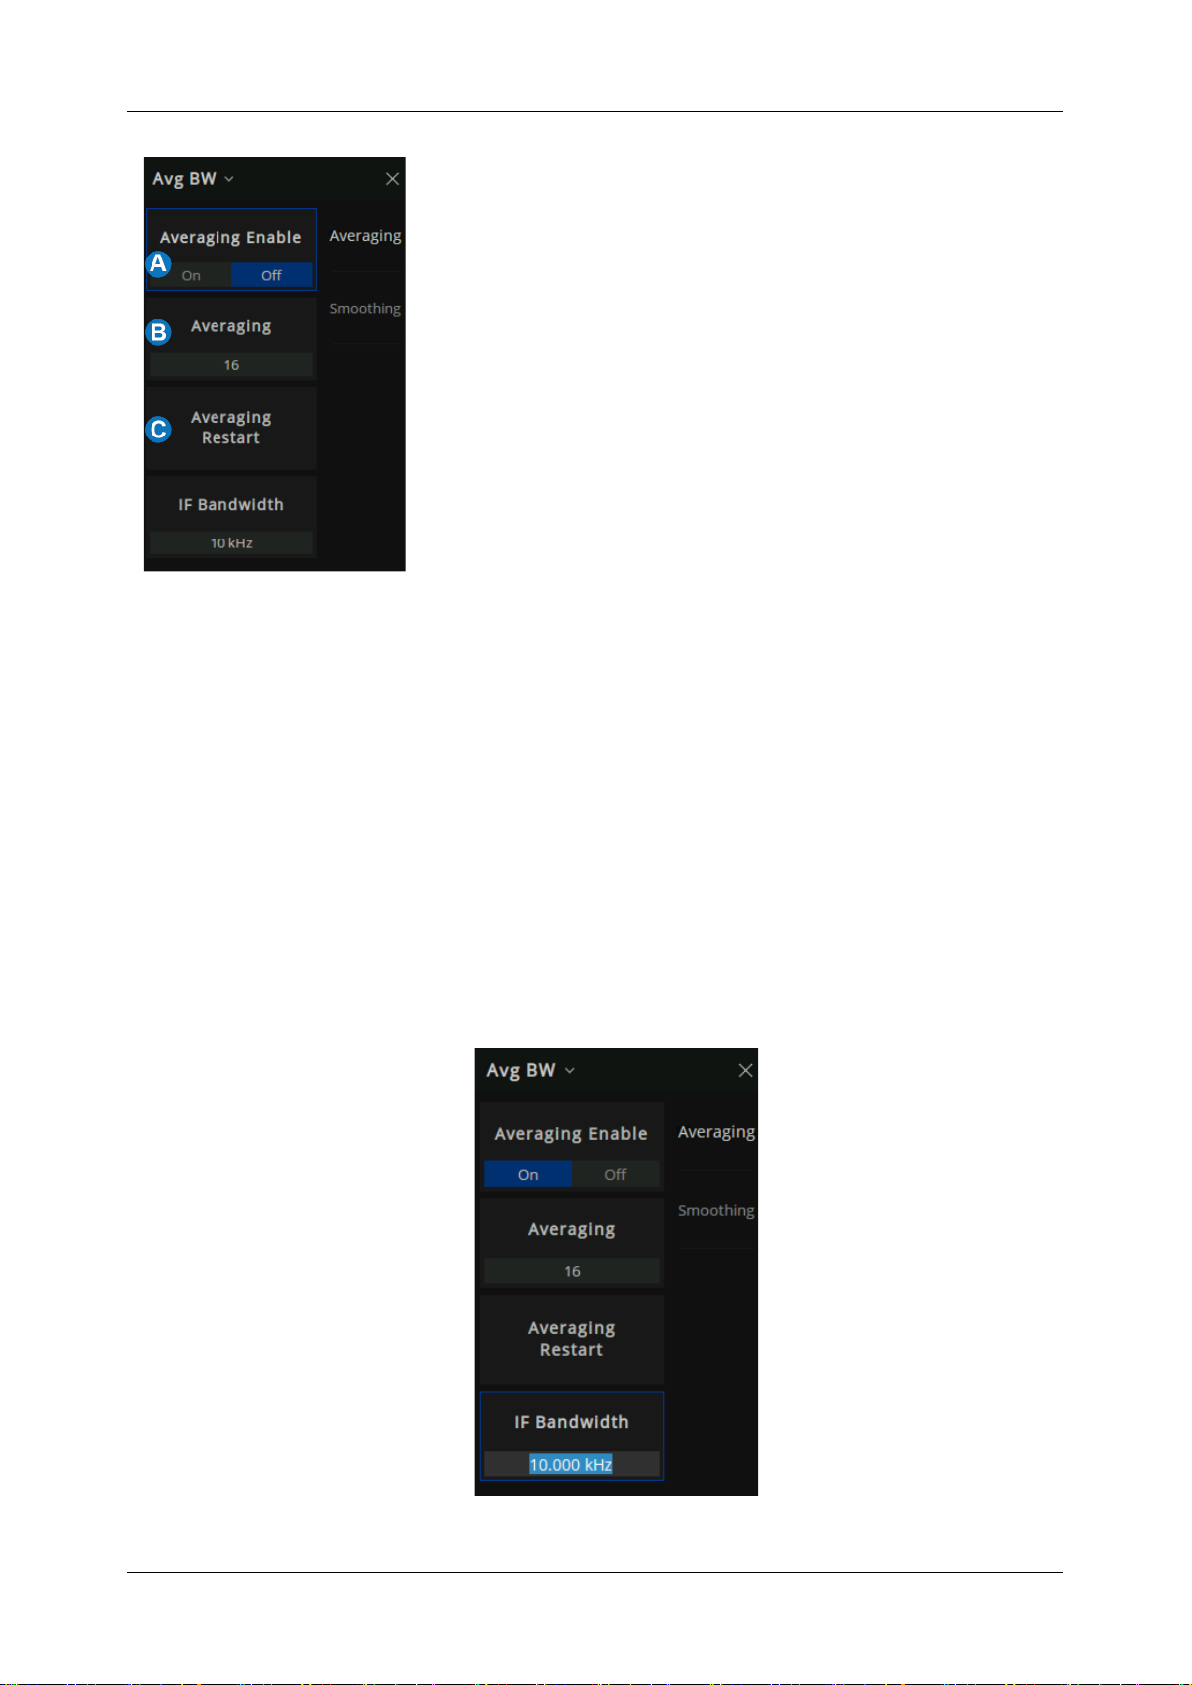
SHN900A User Manual
www.siglent.com
71
Figure 5-6 Avg BW menu
A. Averaging Enable.
B. Sweep Averaging factor. (an integer between 1
and 999)
C. Averaging Restart.
5.8.3 IF Bandwidth
The received signal of VNA is converted from its source frequency to a lower intermediate
frequency (IF). Reducing the IF receiver bandwidth reduces the effect of random noise on a
measurement. Each tenfold reduction in IF bandwidth lowers the noise floor by 10 dB. However,
narrower IF bandwidths cause longer sweep times.
IF Bandwidth setting:
1. Using the Softkey for setting: Press the “Avg BW” key, Press “Avg BW” > Averaging > IF
Bandwidth > Enter the IF Bandwidth value.
Page 74

SHN900A User Manual
72
www.siglent.com
Figure 5-7 Set the IF from the menu bar
2. Using a mouse for setting: Click the “BW=xx” icon on the menu bar and select IF Bandwidth.
Figure 5-8 Set the IF from the status bar
5.8.4 Smoothing
Trace smoothing averages several adjacent data points to smooth the displayed trace. The number
of adjacent data points that get averaged together is also known as the smoothing aperture. You can
specify the aperture as either the number of data points or the percentage of the x-axis span.
Trace Smoothing reduces the peak-to-peak noise values on broadband measured data. It smooths
trace noise and does not increase measurement time significantly.
Smoothing setting:
Using the Softkey for setting: Press the “Avg BW” key, “Avg BW” > Smoothing then enter the
Smoothing menu.
Page 75
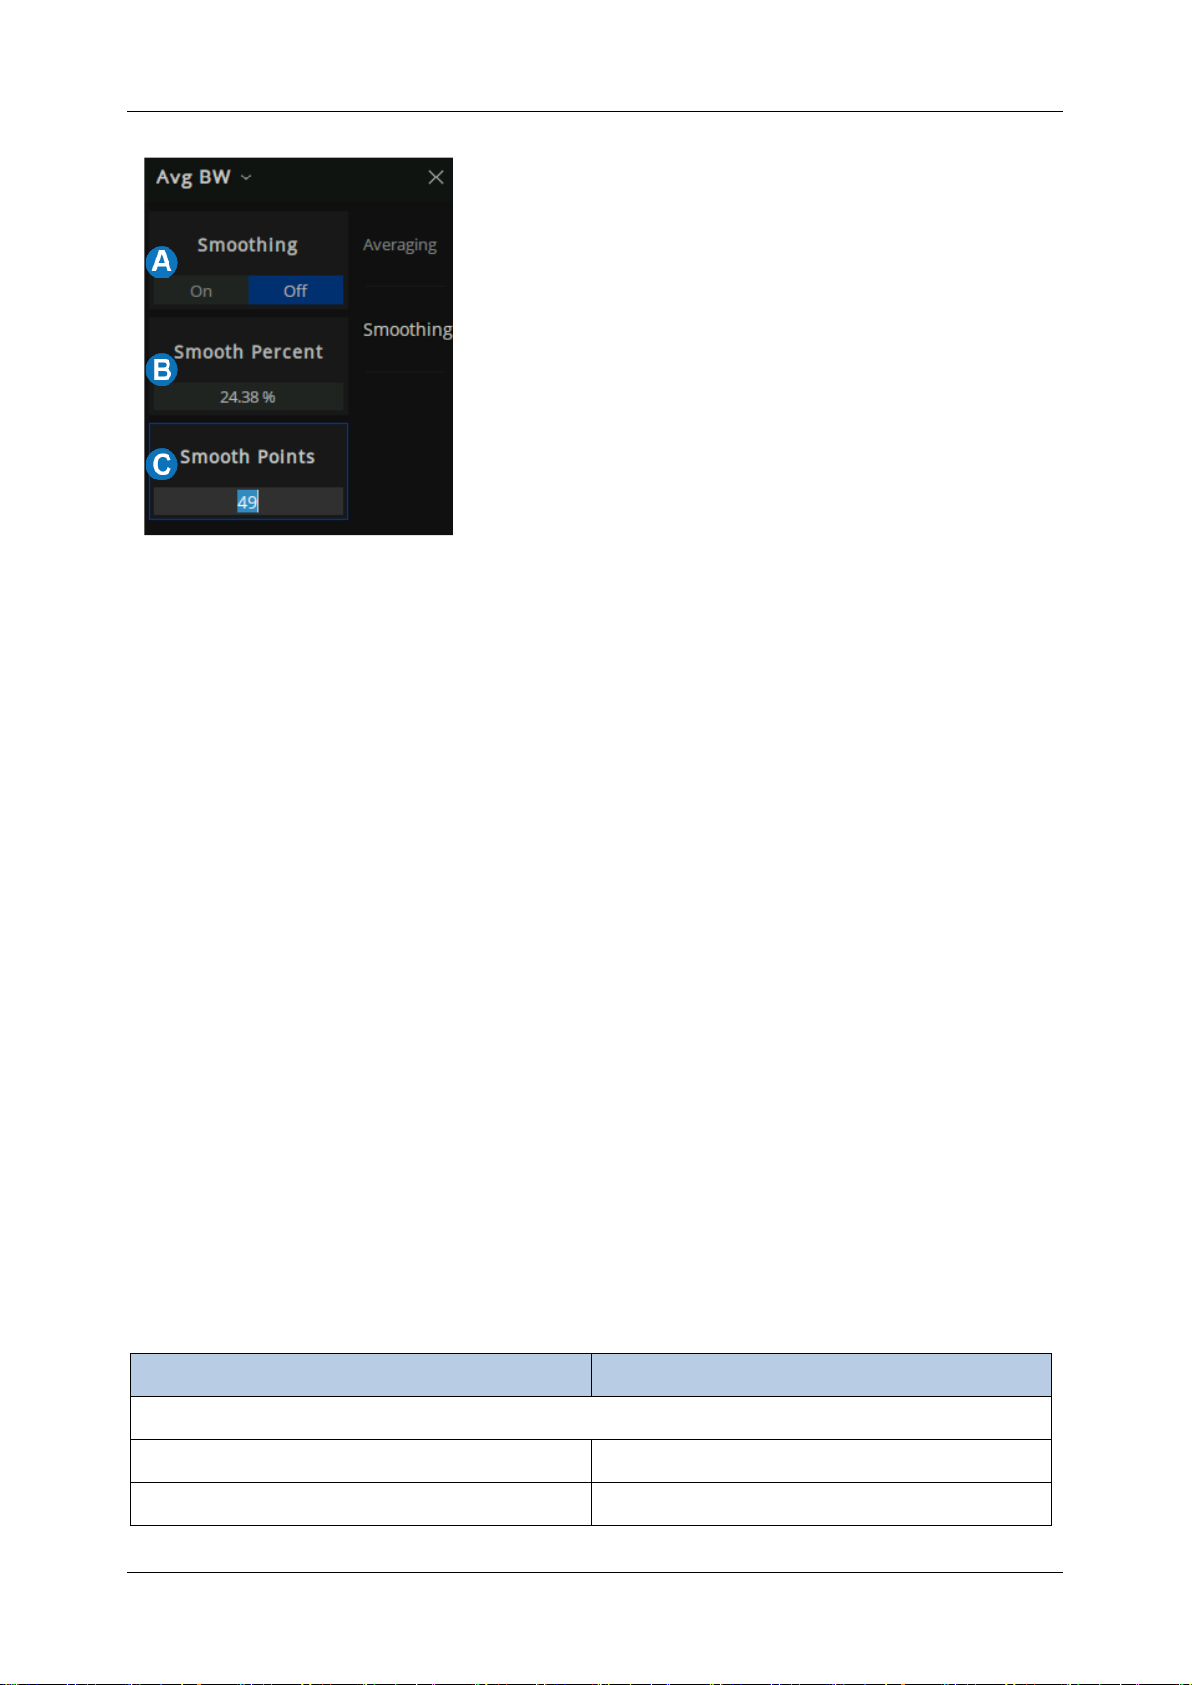
SHN900A User Manual
www.siglent.com
73
Figure 5-9 Smoothing menu
A. Smooth On|Off When is On, applies smoothing
to the displayed trace.
B. Percent of Smooth: Specify the percent of the
swept stimulus span to smooth. For example,
for a trace that contains 100 data points, and a
smoothing percent of span = 11%, then the
number of data points that are averaged is 11.
C. Smooth Points: Specify the number of adjacent
data points to average.
Tips:
● Start with a high number of display points and reduce until you are confident that the trace is not
giving misleading results.
● Do not use smoothing for high-resonance devices, or devices with wide trace variations. It may
generate misleading information.
● Smoothing is set independently for each trace.
5.9 Preset instructions
Invokes preset Settings to restore system Settings to the specified just started state.
Operating instructions:
● Preset types are available through
Preset → Preset Option, Select “Default”, “Last”, or
“User”
.
● Press the
Preset
key, and the device invokes either default Settings or user Settings.
Table 5-1 Some default setting values
Parameter name
Parameter value
RF Power
RF state
ON
RF level
-10 dBm
Page 76

SHN900A User Manual
74
www.siglent.com
Frequency
Frequency range
100 kHz-26.5 GHz
Frequency step size
132.4995MHz
Frequency points
201
Sweeping
Sweeping points
201
Sweeping type
Linear frequency
Sweeping time delay
0 s
Sweeping mode
automatic
Trigger
Trigger mode
continuous
Trigger source
internal
Measurement
S parameter
S11
Display format
Data display format
Log Mag
Scale
Scale
10 dB
Reference level
0 dB
reference position
5
Scale coupling
OFF
Delay time
0 s
Delay distance
0 m
Distance unit
meter
Speed coefficient
1
System impedance
50 Ω
Phase deviation
0°
Amplitude deviation
0 dB
Average
Average state
OFF
Smooth state
OFF
Calibration
Page 77

SHN900A User Manual
www.siglent.com
75
Calibration state
unloaded calibration data
Page 78
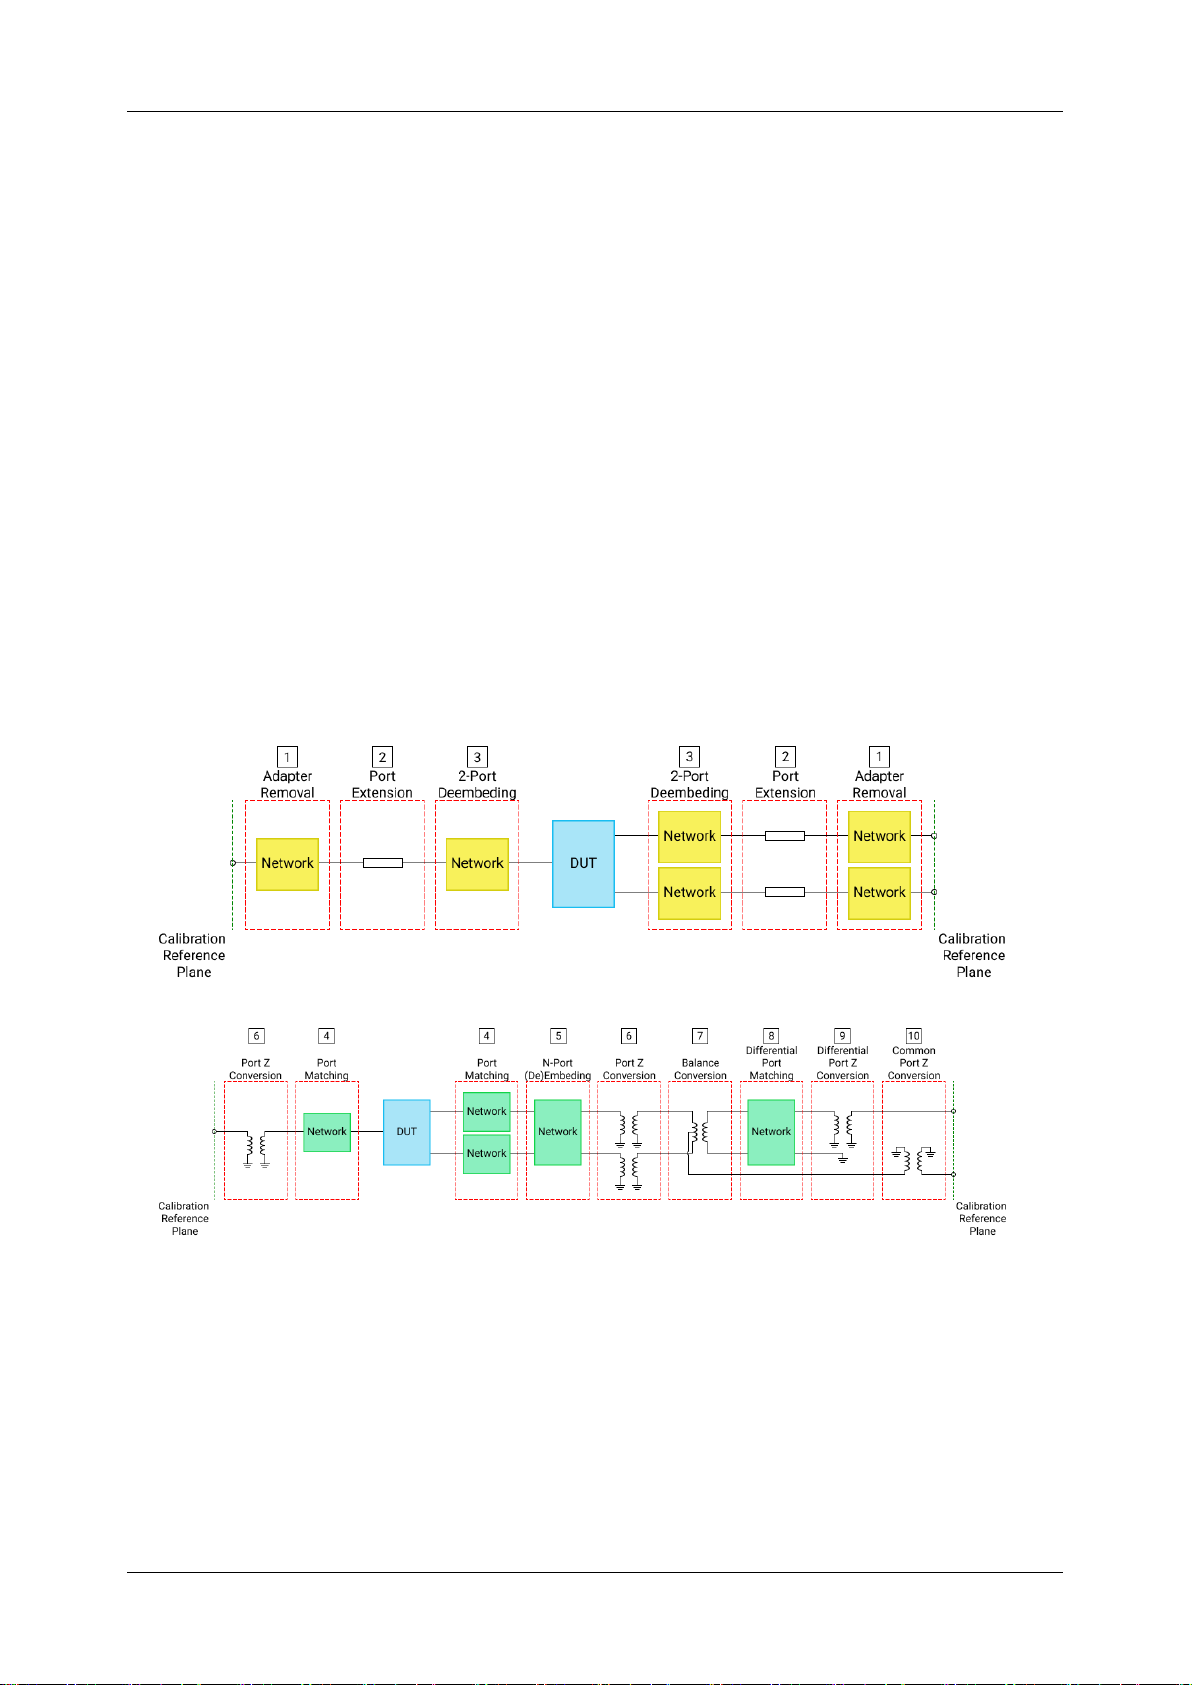
SHN900A User Manual
76
www.siglent.com
6 Measurement Calibration
6.1 Overview
Usually, DUTs can't be measured directly and accurately due to cabling, adapters, probes, and more.
Calibration, compensation, and fixture simulation are introduced to help achieve higher accuracy.
These functions meet different measurement requirements, but they all can be expressed as a matrix
multiplication of the scattering parameter matrix and a specific compensation matrix. The order of the
matrix multiplication has a large influence on the result. So it's important to understand the order of
applying these functions and to design a suitable physical connection to the DUT and expected
measurement network.
Internal source power calibration and receiver calibration are applied before the scattering parameter
calculation, and the S parameter calibration is applied to the calculation results. This provides the
highest measurement accuracy at the calibration reference plane.
From the reference plane, the order of applying functions is as follow:
Figure 6-1 The order of applying functions
At first, adapter removal/ insertion, port extension, 2-port de-embedding are applied to remove the
needless networks in the physical connections of the DUT and move the measurement plane to the
DUT. Then, Port match, N-port embedding/ de-embedding, port impedance conversion are used to
embed or de-embed expected virtual networks. If balance scattering parameters are measured,
balance conversion, differential port match, differential port impedance conversion, common port
Page 79
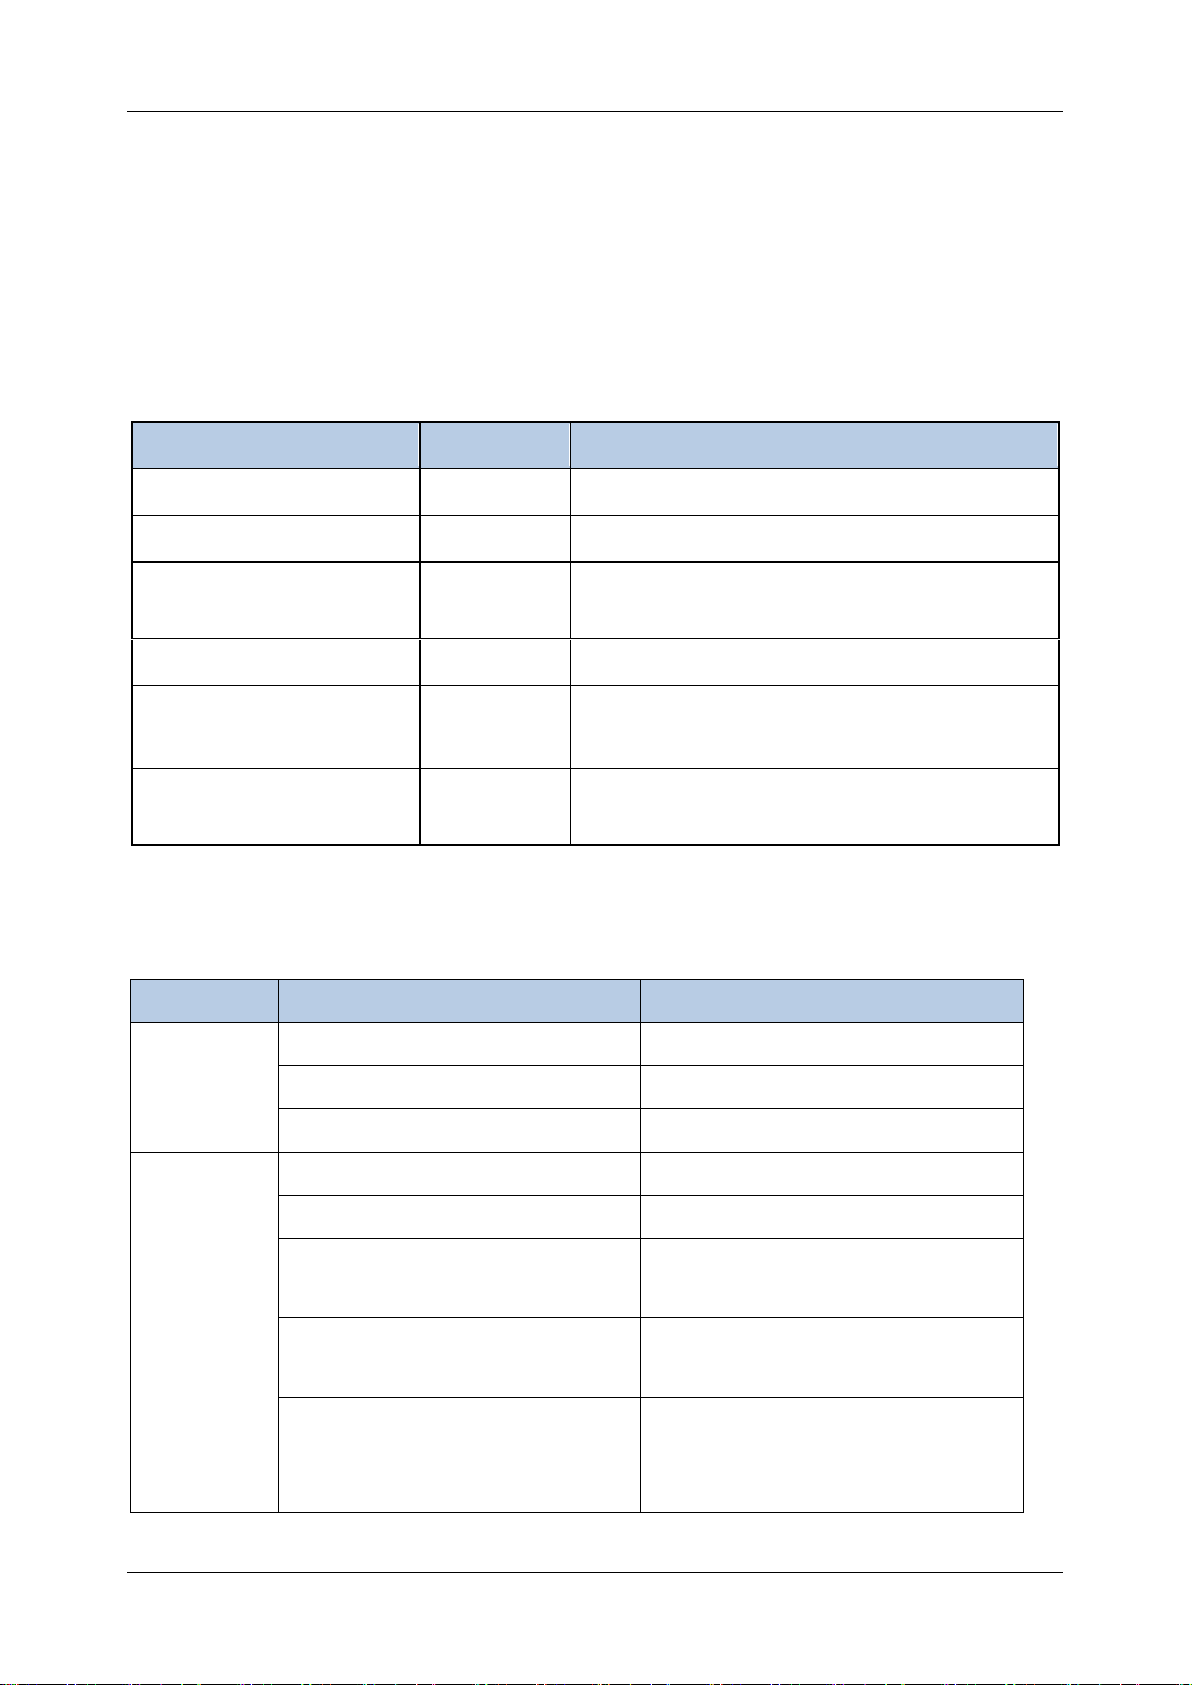
SHN900A User Manual
www.siglent.com
77
impedance conversion can be helpful if needed.
6.2 Calibration type
The following table is a comparison of some common S-parameter calibration types:
Table 6-1 S-parameter calibration types
Calibration type
precision
Allow pass-through methods
TRL
Very high
All, except the unknown direct
SOLT
high
All
Enhanced Response
high
Defined through or flush through (zero-length
through)
Port 1 (reflection)
high
Not Applicable
Open Circuit Response/
Short Circuit Response
low
Not Applicable
Direct Response
low
Known through or flush through (zero-length
through)
The following are the actual S-parameter calibration types used by this vector network analyzer.
Table 6-2 The vector network analyzer S parameter calibration types
Port number
Calibration type
Calibration item
Port 1
Response (Open)
Open, Load (optional)
Response (Short)
Short, Load (optional)
OSL
Open, Short, Load
Port 2
Response (Thru) 1 → 2
Thru, Isolation (optional)
Response (Thru) 2 → 1
Thru, Isolation (optional)
Enhanced Response (Thru) 1 → 2
Port1:Open, Short, Load
Thru, Isolation (optional)
Enhanced Response (Thru) 2 → 1
Port2:Open, Short, Load
Thru, Isolation (optional)
SOLT
Port1: Open, Short, Load
Port2: Open, Short, Load
Thru, Isolation (optional)
Page 80

SHN900A User Manual
78
www.siglent.com
SOLR
Port1: Open, Short, Load
Port2: Open, Short, Load
Unknown Thru, Isolation (optional)
TRL
Port1: Reflect (Open or Short)
Port2: Reflect (Open or Short)
Thru, Line
TRL:
Application: Used to precisely calibrate any pair of ports when no calibration kits are readily Available.
Note:
Difference matching calibration may be required
(Delta Match Cal)
Overall accuracy: Very high
Calibration kits required: Straight, reflection, line, or similar combination
Corrected system error:
● Directivity
● Isolation
● Frequency response
transmission tracking
● Source match
● Load match
● Frequency response
reflection tracking
SOLT:
Application: Used to accurately calibrate any number of ports
Overall accuracy: High
Required calibration kits: short circuit, open circuit, load, through) or ECAL electronic calibration parts
module
● Directivity
● Isolation
● Frequency response
transmission tracking
● Source match
● Load match
● Frequency response
reflection tracking
Enhanced Response:
Application: Calibrate two ports when only one direction (forward or reverse) is needed for
Page 81

SHN900A User Manual
www.siglent.com
79
measurement. Because no secondary sweep is required, the measurement is faster.
● The reflection calibration element (open, short circuit, or load) is connected to the source
port to be calibrated.
● The defined through-through or flush through-through calibrator kits are connected between
port pairs.
● The mechanical calibration kit is much faster than the SOLT. You can also use ECAL.
To select an enhanced response, do the following:
Keys operation:
Press
Cal
, using the knob or arrow keys, to focus on the
Cal → Basic Cal
parameter item. Select
port1 & port2
from the interface menu, Select
Enhanced Response 1 → 2 or Enhanced Response
2 → 1
in the
Cal Type,
Press
ENTER
or the knob to select the current option.
Overall accuracy: High
Required calibration kits: Short circuit, open circuit, load, defined through or flush through
Corrected system error:
● Directivity (Source port)
● Isolation
● Frequency response transmission tracking (receiver port)
● Source match (source port)
● Load matching (receiver port) is used only to generate transmission trace items
● Frequency response reflection tracking (source port)
One port (reflection):
Application: Used to accurately calibrate any test port suitable for reflection measurement only
Overall accuracy: High
Required calibration kits: Short circuit, open circuit, and load or ECAL module
Corrected system error:
● Directivity
● Frequency response reflection tracking
Page 82

SHN900A User Manual
80
www.siglent.com
● Source match
Open circuit response / short circuit response:
Application: Quick calibration of any test port suitable for reflection measurement only
Overall accuracy: Low
Calibration kits required: Open circuit or short circuit.
Corrected system error:
● Frequency response reflection tracking
Direct / Transport Tracking (isolation optional):
Application: Quick calibration of any pair of test ports suitable for transmission measurements only.
Isolation calibration is generally not recommended.
Overall accuracy: Low
Required calibration kit: Through
Isolation: Each load corresponds to a vector network analyzer test port.
Corrected system error:
● Isolation
● Frequency response transmission tracking
Power calibration types: Transmitter calibration (internal source power calibration) and receiver
calibration.
6.3 Checking Calibration Status
6.3.1 Execution Status of Error Correction for Each Channel
User can check the execution status of error correction for each channel with the error correction
status.
The error correction status is indicated in the channel status bar in the lower part of the window by
the symbols in the below table.
Page 83

SHN900A User Manual
www.siglent.com
81
Symbol
Execution Status of Error Correction
Accuracy
No Cor
Error correction: Off (No Correction)
Lowest
C N-Port
Error correction: On (Full N Port Correction)
Highest
C* N-Port
Error correction: On (Interpolation is being executed)
Uncertain
CΔ N-Port
Error correction: On (Stimulus settings change)
Uncertain
No Cor
It indicates there is no Correction. The following will cause the VNA to turn Error Correction OFF for
the channel:
● Decrease the start frequency.
● Increase the stop frequency.
C
N
-Port
Full N Port correction, where N is the number of fully calibrated ports. This correction is applied to
SParameters.
C*
N
-Port
"C* " appears in the status bar when a measurement is being interpolated. Interpolation occurs when
you change any of the following settings:
Start frequency increased
Stop frequency decreased
Increase number of points
Change sweep type.
CΔ
N
-Port
"CΔ" appears in the status bar when one or more of the following stimulus settings change. The
resulting measurement accuracy depends on which parameter has changed and how much it has
changed. For optimum accuracy, recalibrate using the new settings.
Sweep time
IF Bandwidth
Page 84
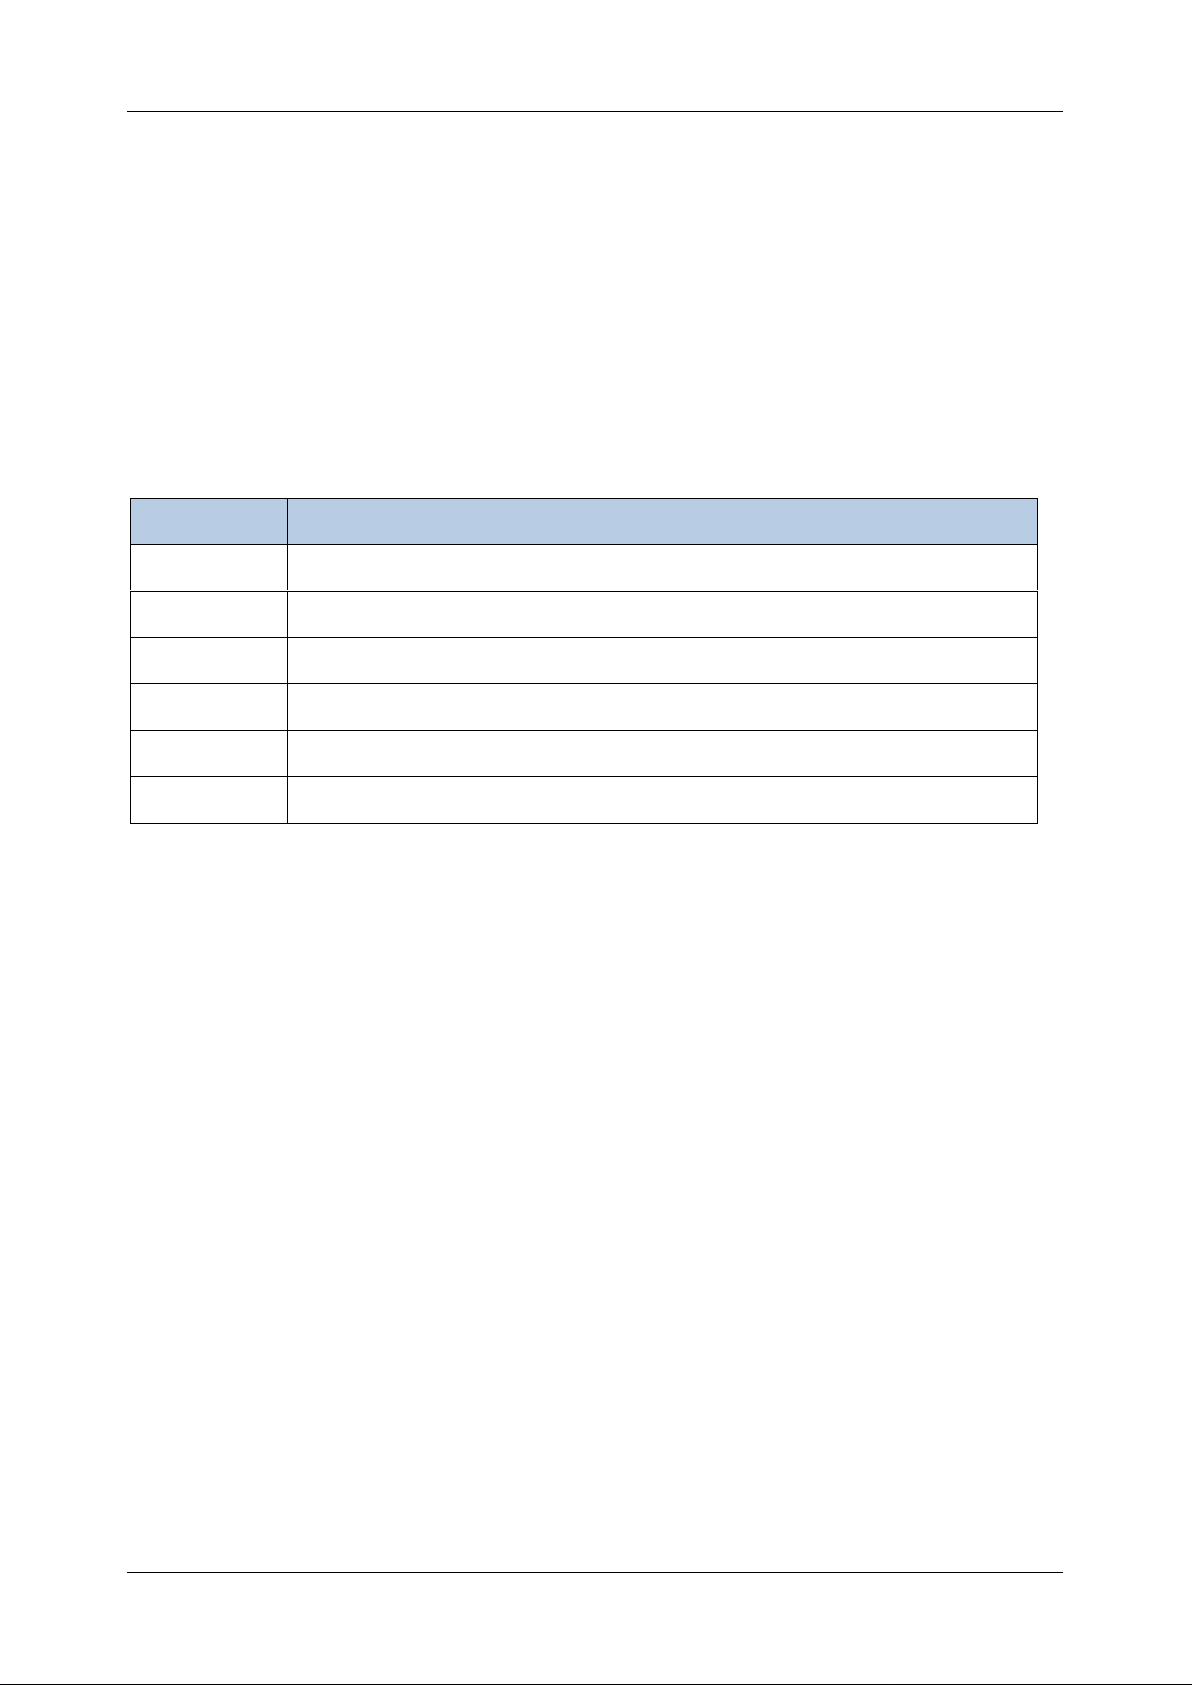
SHN900A User Manual
82
www.siglent.com
Port power
6.3.2 Execution Status of Error Correction for Each Trace
User can check the status of the error correction actually executed for each trace with the trace status
area.
For a trace for which error correction is executed, the applied calibration type is indicated in the trace
status area by the symbols in the table below.
Symbol
Calibration type
RO
Open response calibration
RS
Short response calibration
RT
Thru response calibration
ER
Enhanced response calibration
F1
1-port calibration
F2
Full 2-port calibration/2-port TRL calibration
If none of the symbols described above is displayed, error correction is not executed for the trace.
6.3.3 Acquisition Status of Calibration Coefficient for Each Channel
User can check the acquisition status of the calibration coefficient for each channel with the calibration
property.
The calibration property displays the acquisition status of the calibration coefficient between test ports
for each channel in matrix format. The following figure shows an example of when the calibration
coefficients have been acquired for the full 2-port calibration between test ports 1 and 2.
Page 85
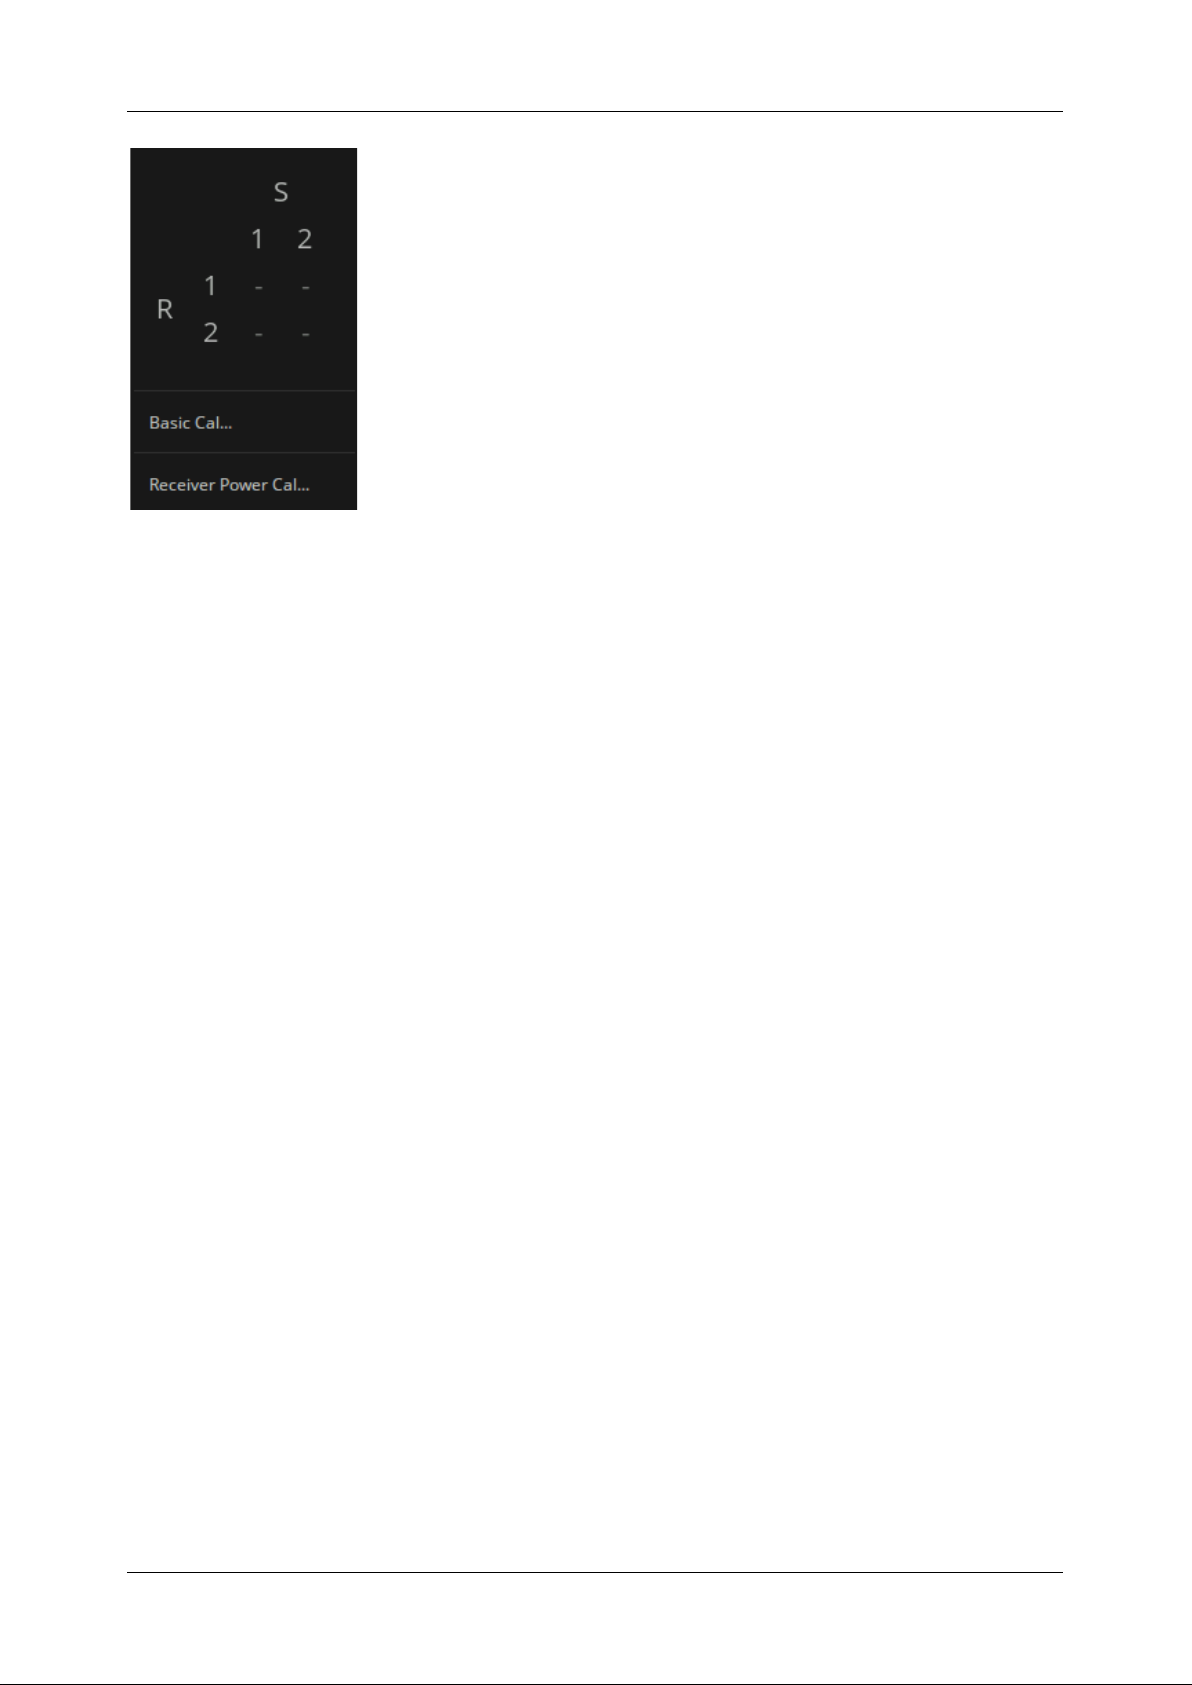
SHN900A User Manual
www.siglent.com
83
F : Full Port Calibration
R : Response Calibration
-- : Nothing
6.3.4 Procedure to turn on/off calibration property display
There are two methods to turn on/off the display of calibration property.
Method 1: Click the channel error correction execution status symbol in the channel status bar to open
and close, as shown in the left figure below.
Method 2: Press "Cal” on the front panel > Cal > Correction, as shown in the right figure below.
Page 86
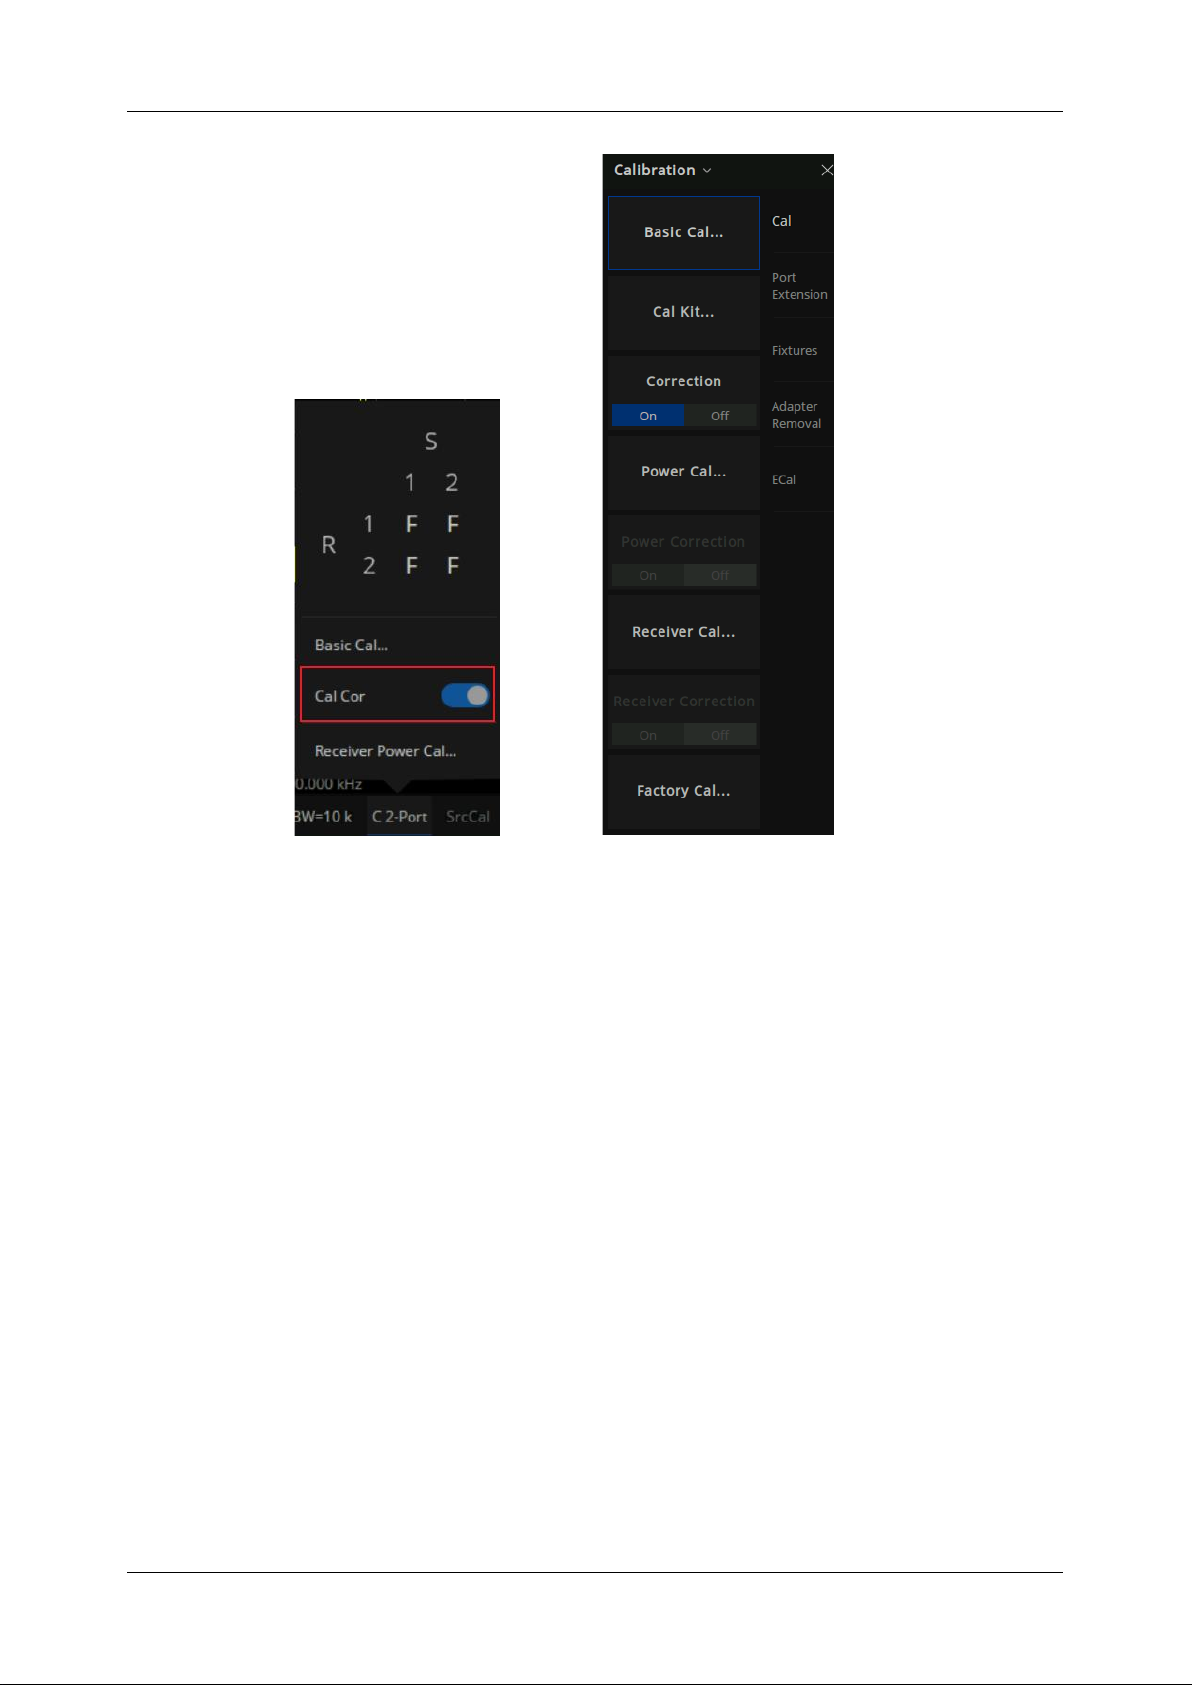
SHN900A User Manual
84
www.siglent.com
6.4 S parameter calibration
6.4.1 S parameter calibration Kit management
6.4.1.1 Overview
For most applications, the default calibration kit models provide sufficient accuracy for your calibration.
However, several situations may exist that would require you to create a custom calibration kit:
● Using a connector interface different from those used in the predefined calibration kit models.
● Using standards (or combinations of standards) that are different from the predefined calibration
kits. For example, using three offset SHORTs instead of an OPEN, SHORT, and LOAD to perform
a 1-port calibration.
● Improving the accuracy of the models for predefined kits. When the model describes the actual
performance of the standard, the calibration is more accurate. For example, A 7 mm LOAD is
determined to be 50.4 Ω instead of 50.0 Ω.
● Modifying the THRU definition when performing a calibration for a non-insertable device.
Page 87
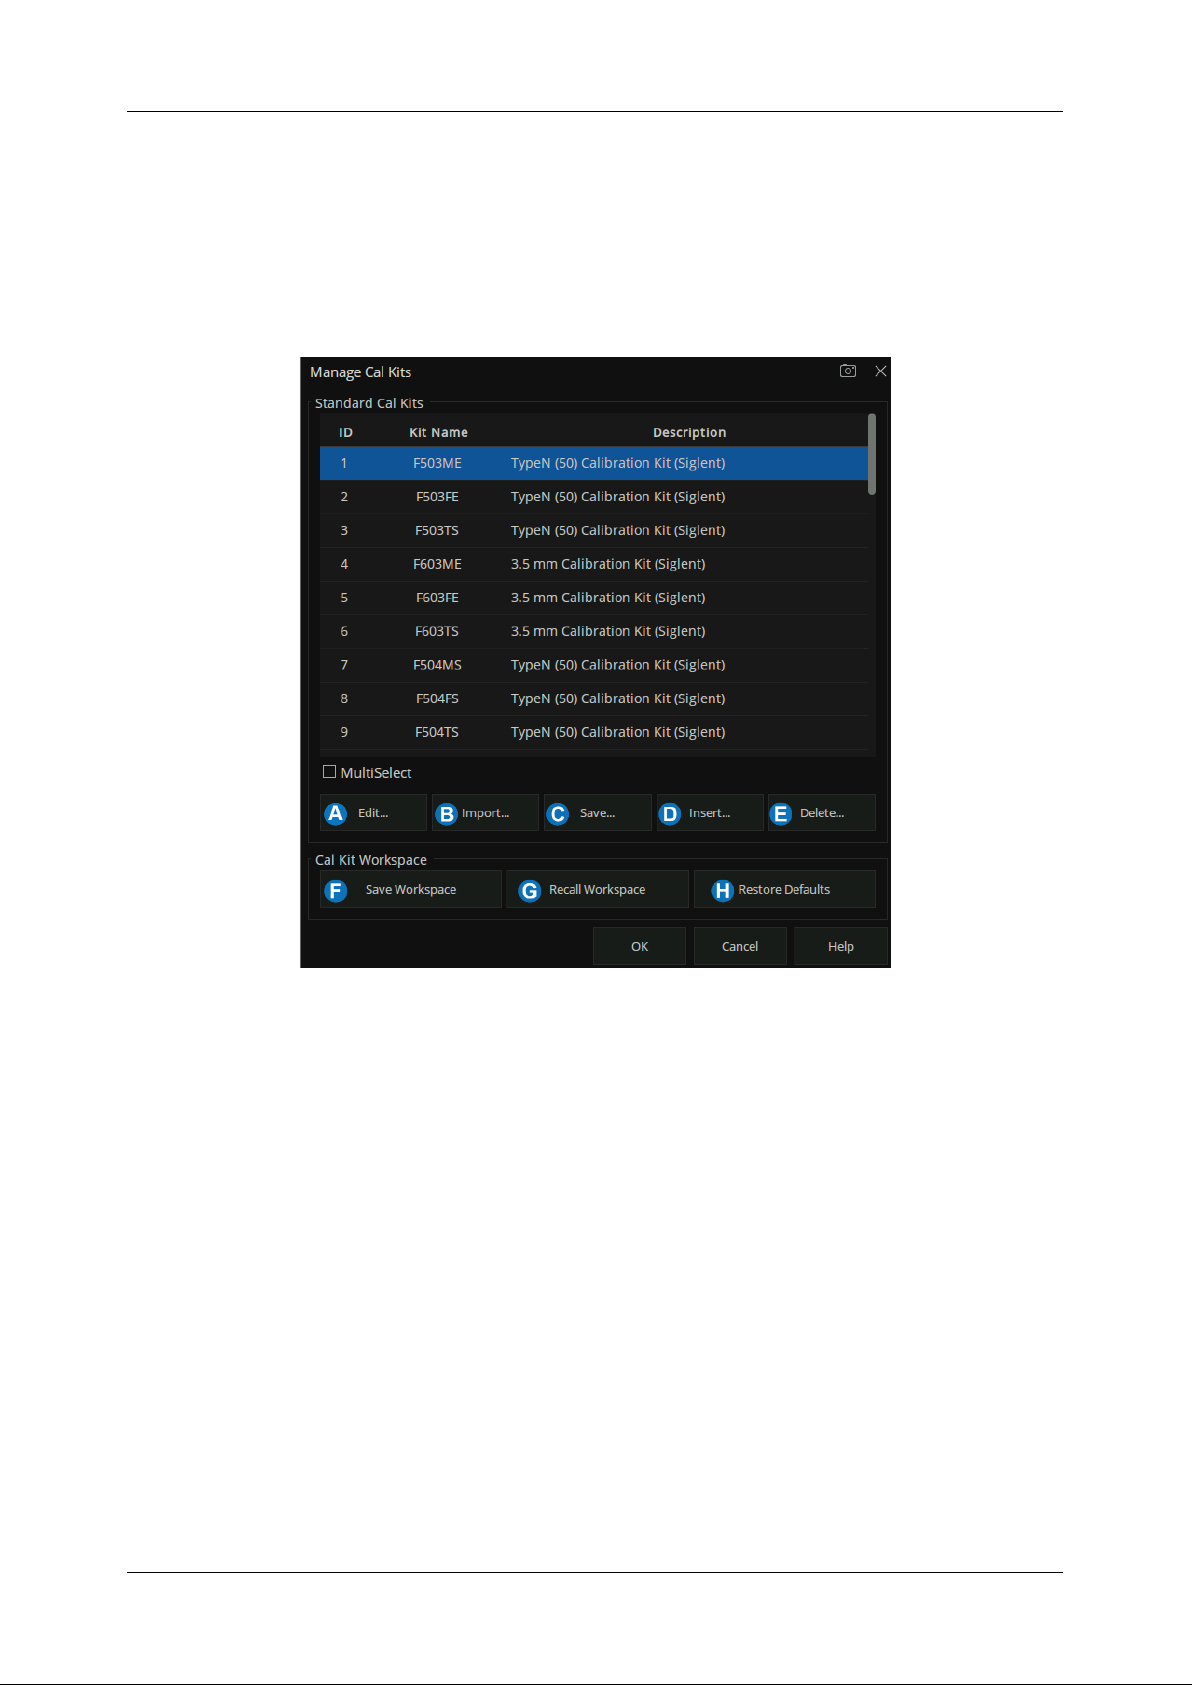
SHN900A User Manual
www.siglent.com
85
● Performing a TRL calibration.
Operation instructions:
Press “Cal” on the front panel, Cal > Cal >Cal Kit to enter the Manage Cal Kits page. You can edit,
import, and create or delete calibration kits.
Figure 6-2 Manage Cal Kits
A. Edit the Existing Cal Kit.
B. Import the customized Cal Kit.
C. Save the existing Cal kits and change the file name.
D. Create a new custom Cal Kit.
E. Select the Cal Kit.
F. Save the current Cal kits (both factory and custom).
G. Recall the Cal Kits.
H. Restore the default factory Cal kits.
Page 88
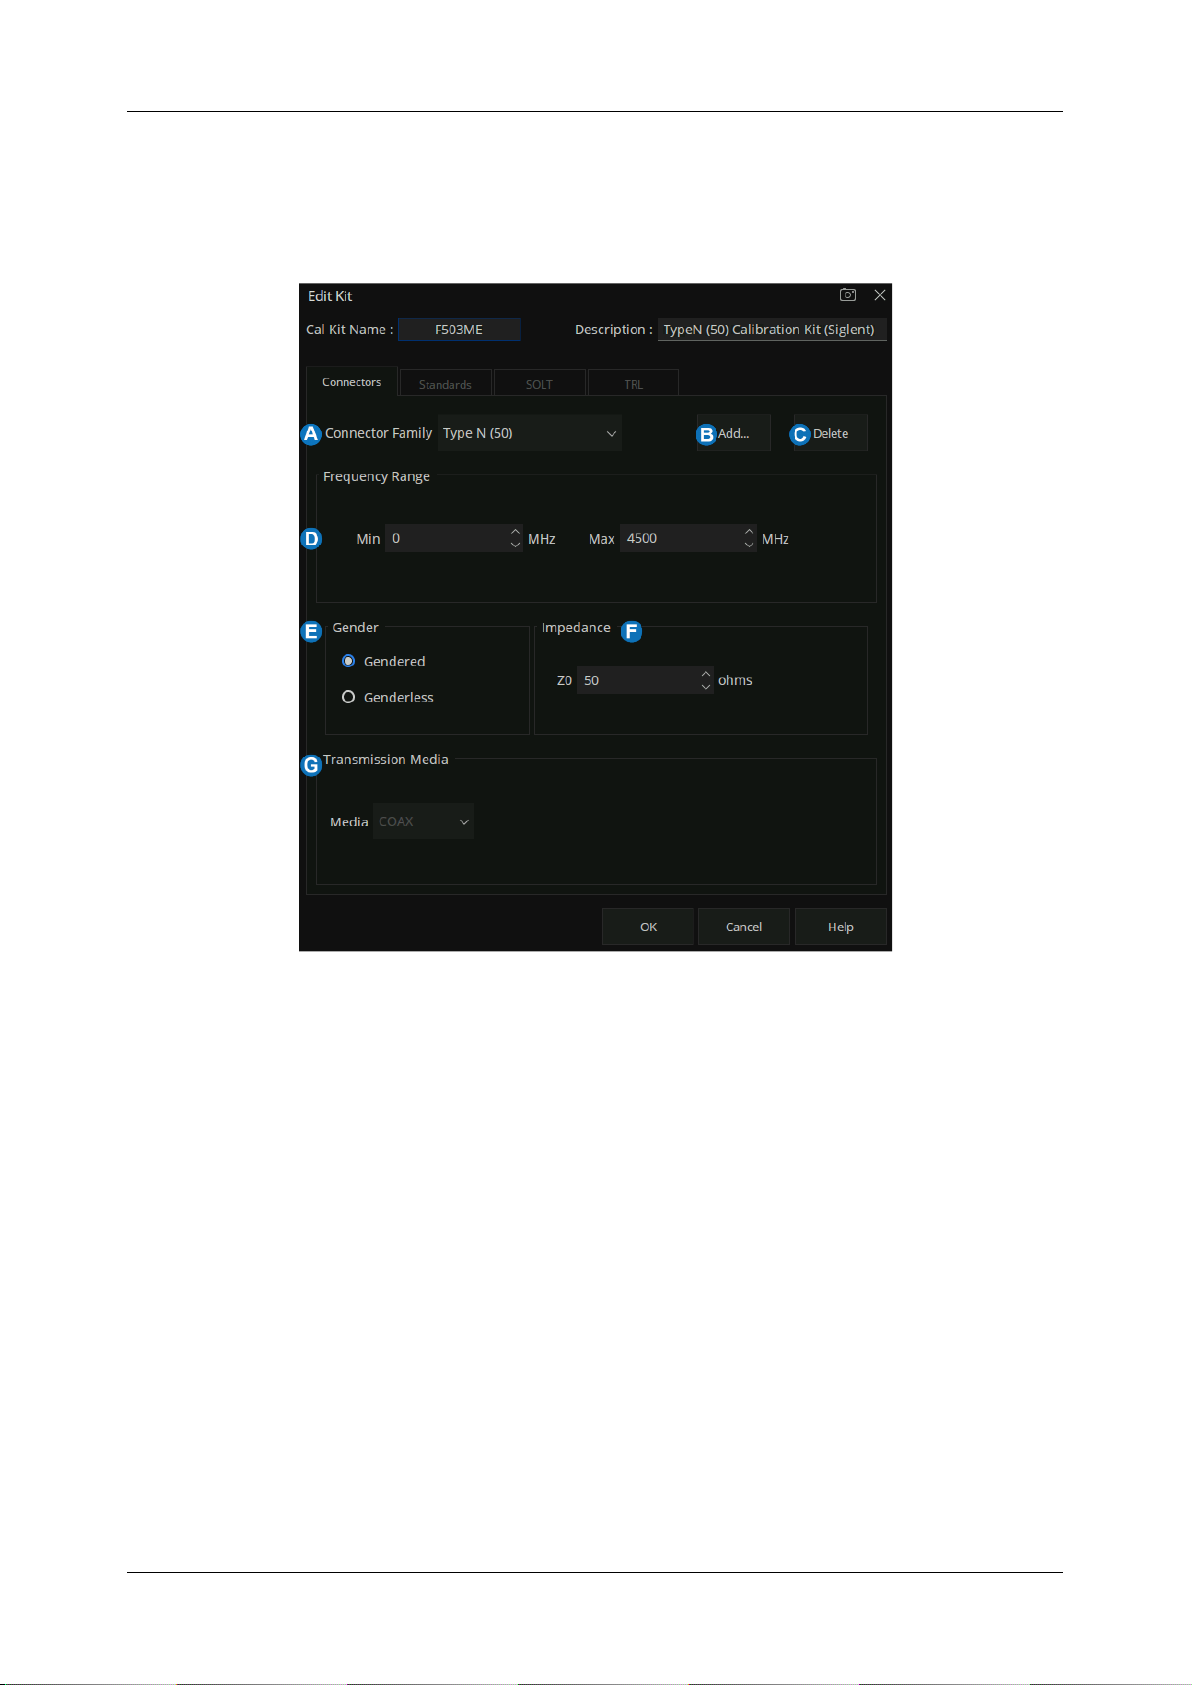
SHN900A User Manual
86
www.siglent.com
6.4.1.2 Connector Tab
At the bottom of each Tab, 'OK' is used to save the edited file, and 'Cancel' is used to close the
calibration suite edit session and the file will not be saved. “Help” is used to view the Help documents.
Figure 6-3 The Connectors Tab interface
A.
Connector Family:
Click the down arrow to select the connector family associated with the Cal
Kit.
B.
Add:
Starts the Add Connector dialog box which allows you to add a new connector type to the
calibration kit.
C.
Delete:
Delete the selected connector family.
D.
Frequency Range:
Define the lowest and the highest frequency at which the standard is used
for calibration.
E.
Gender:
Gendered or Genderless
F.
Impedance:
Specify the impedance of the standard.
G.
Transmission Media:
The medium of the connector, COAX or WAVEGUIDE
Page 89
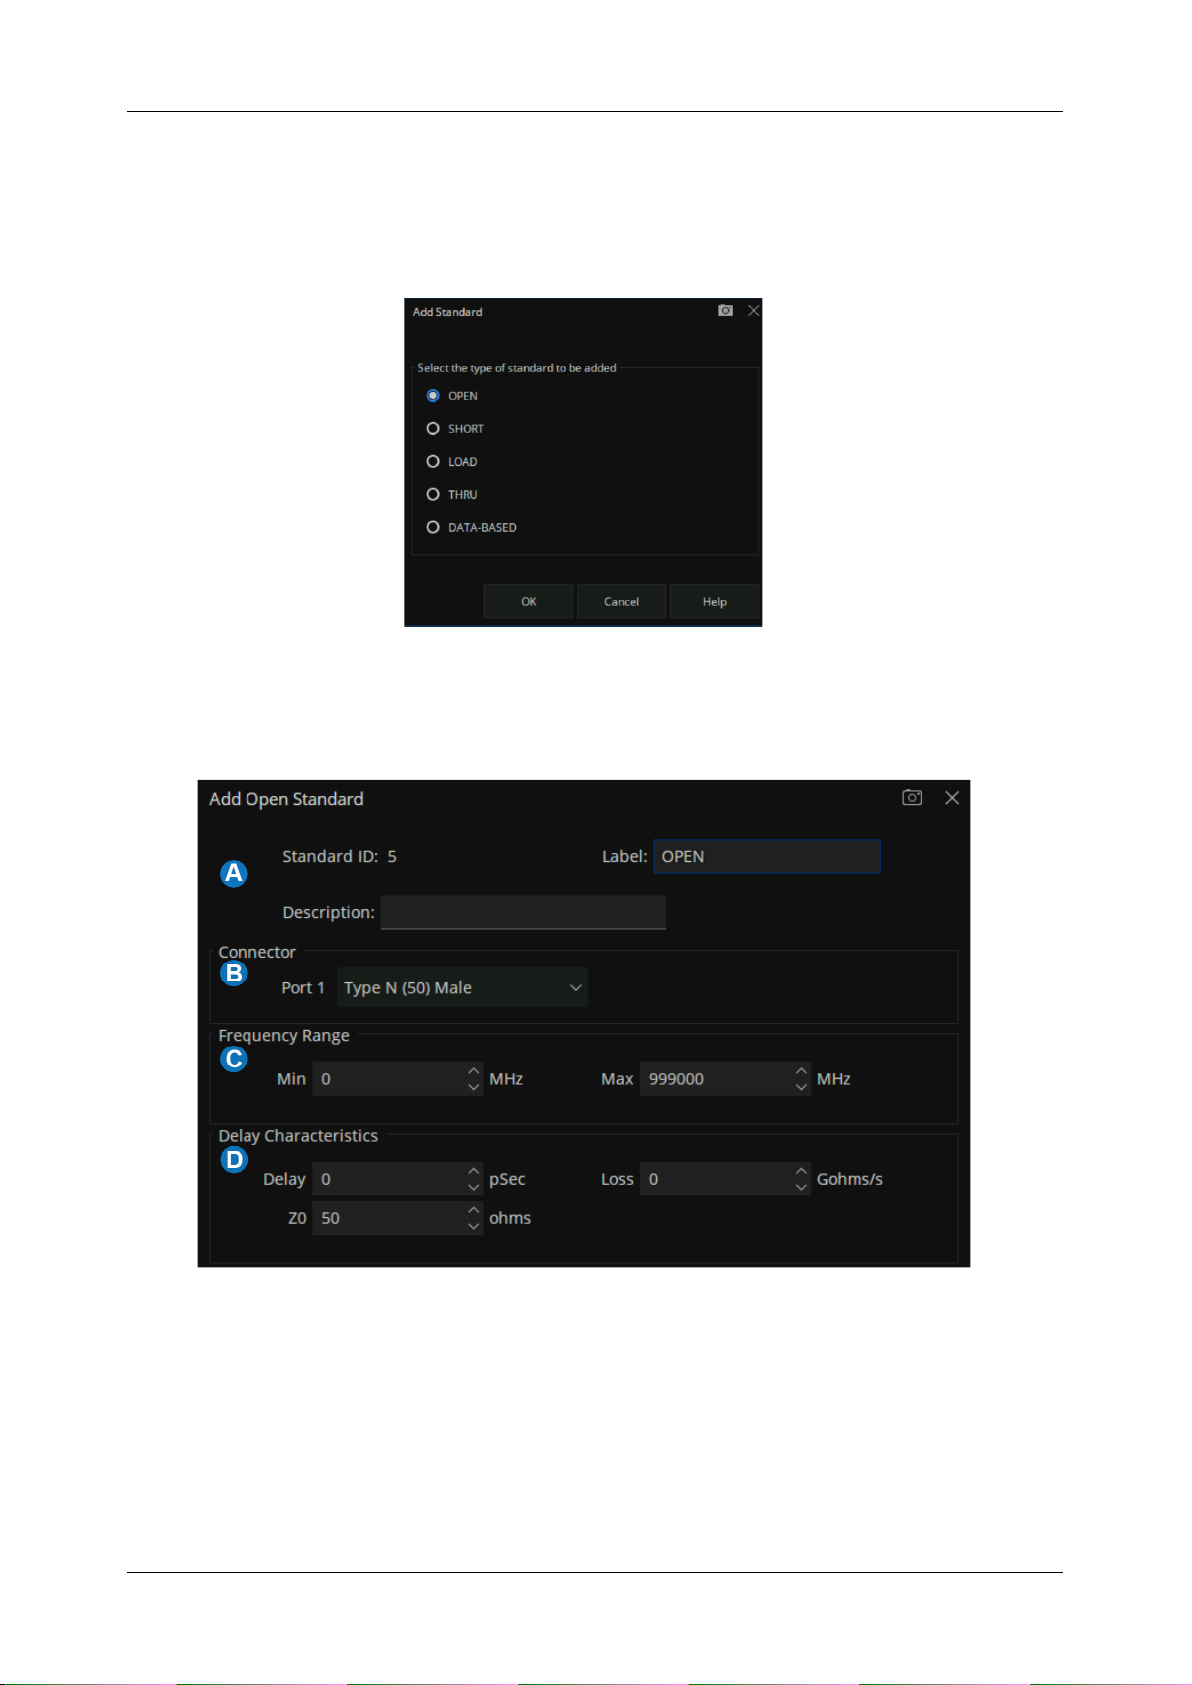
SHN900A User Manual
www.siglent.com
87
6.4.1.3 Standards Tab
Allows you to Add, Edit, or Delete Cal standards in a Cal kit.
1) In the “Standard” tab, click “Add” to add the Standard sample.
Figure 6-4 add standard interface
2) Standards dialog box help, the following fields apply to ALL standard types.
Figure 6-5 The help dialog of the Standard
A. Identification
Standard ID: Number in list of standards
Label: Type of standard. This usually appears in prompts for standards.
Description: Description of standard.
Page 90
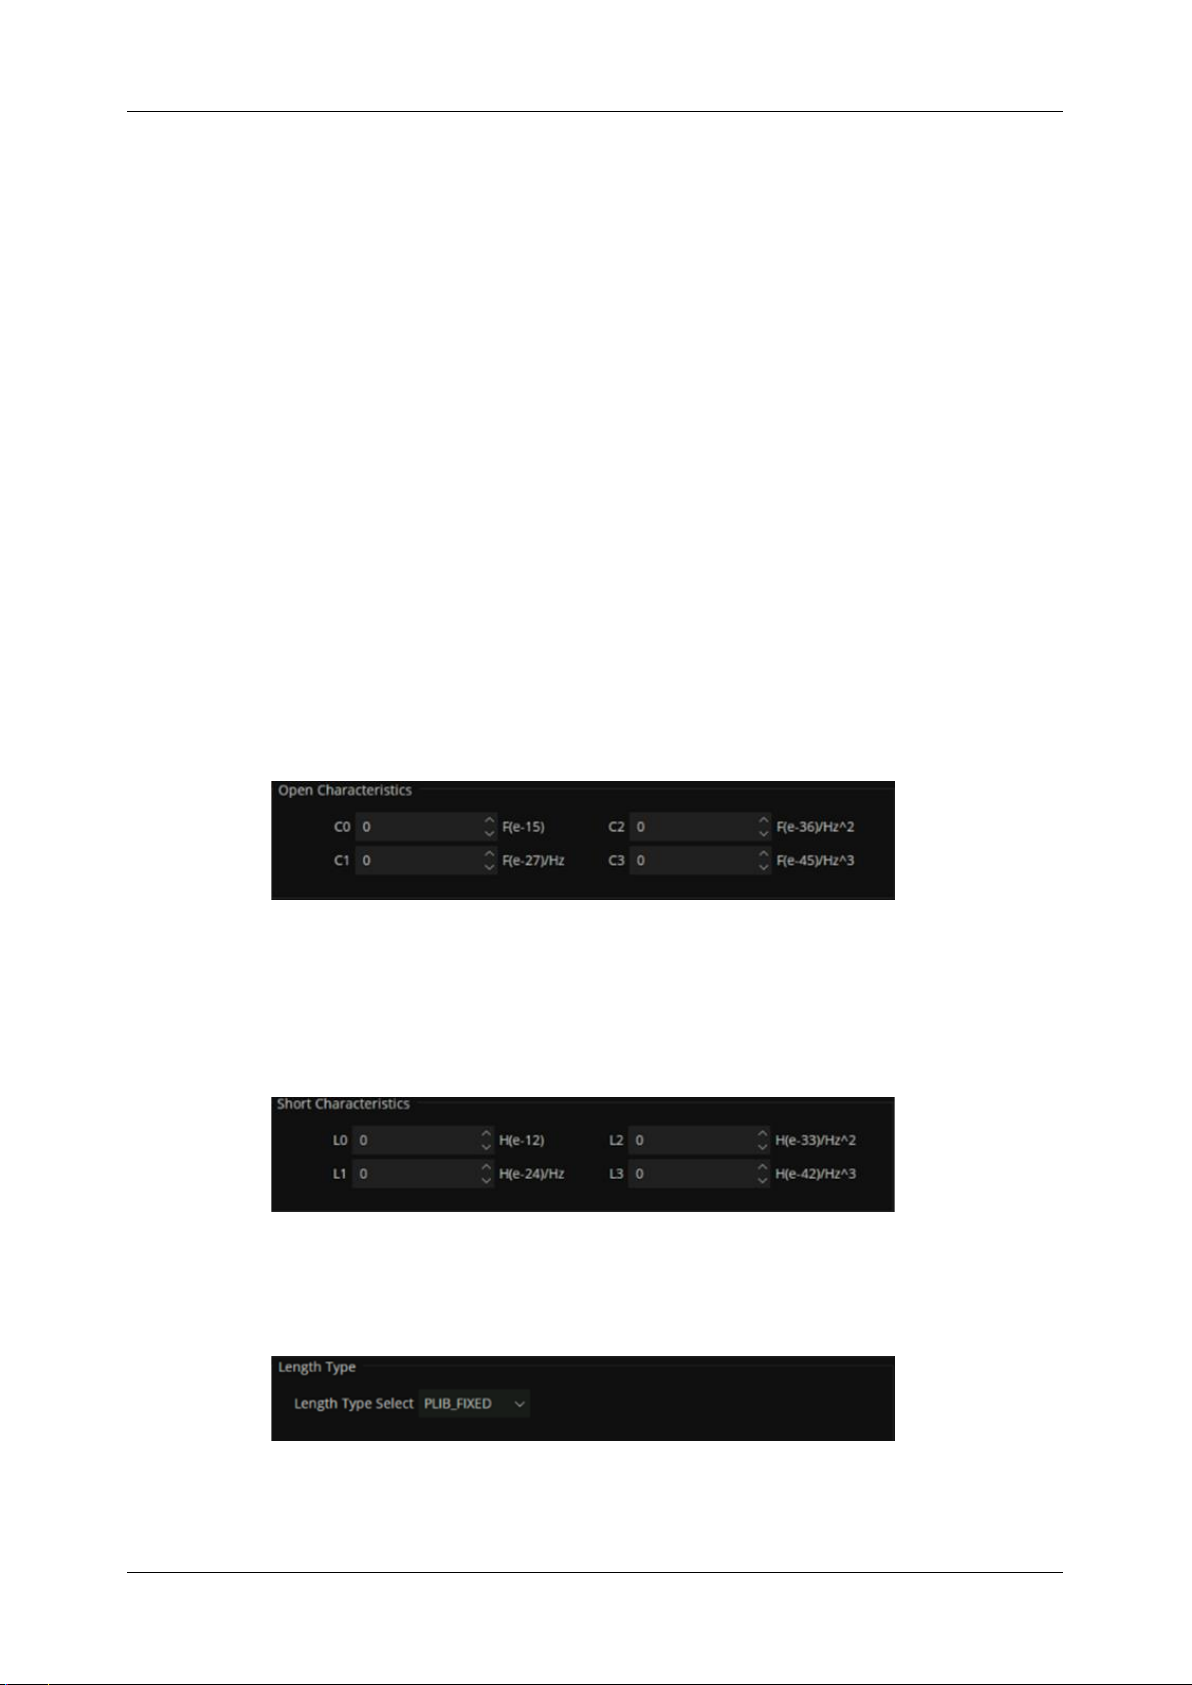
SHN900A User Manual
88
www.siglent.com
B. connector
Indicates the type and gender (Male, Female, None) of the standard.
Thru and Isolation standards have two connectors.
C. Frequency Range
Min: Defines the lowest frequency at which the standard is used for calibration.
Max: Defines the highest frequency at which the standard is used for calibration.
D. Delay Characteristics
Delay: Defines the one-way travel time from the calibration plane to the standard in seconds.
Z0: Defines the impedance of the standard.
Loss: Defines energy loss in Gohms, due to skin effect, along a one-way length of coaxial cable.
3) Open Standard
C0, C1, C2, C3: Specify the fringing capacitance.
Figure 6-6 Open Characteristics
4) Short Standard
L0, L1, L2, L3: Specify the residual inductance.
Figure 6-7 Short Characteristics
5) Load Standard
Figure 6-8 load Characteristics
Page 91
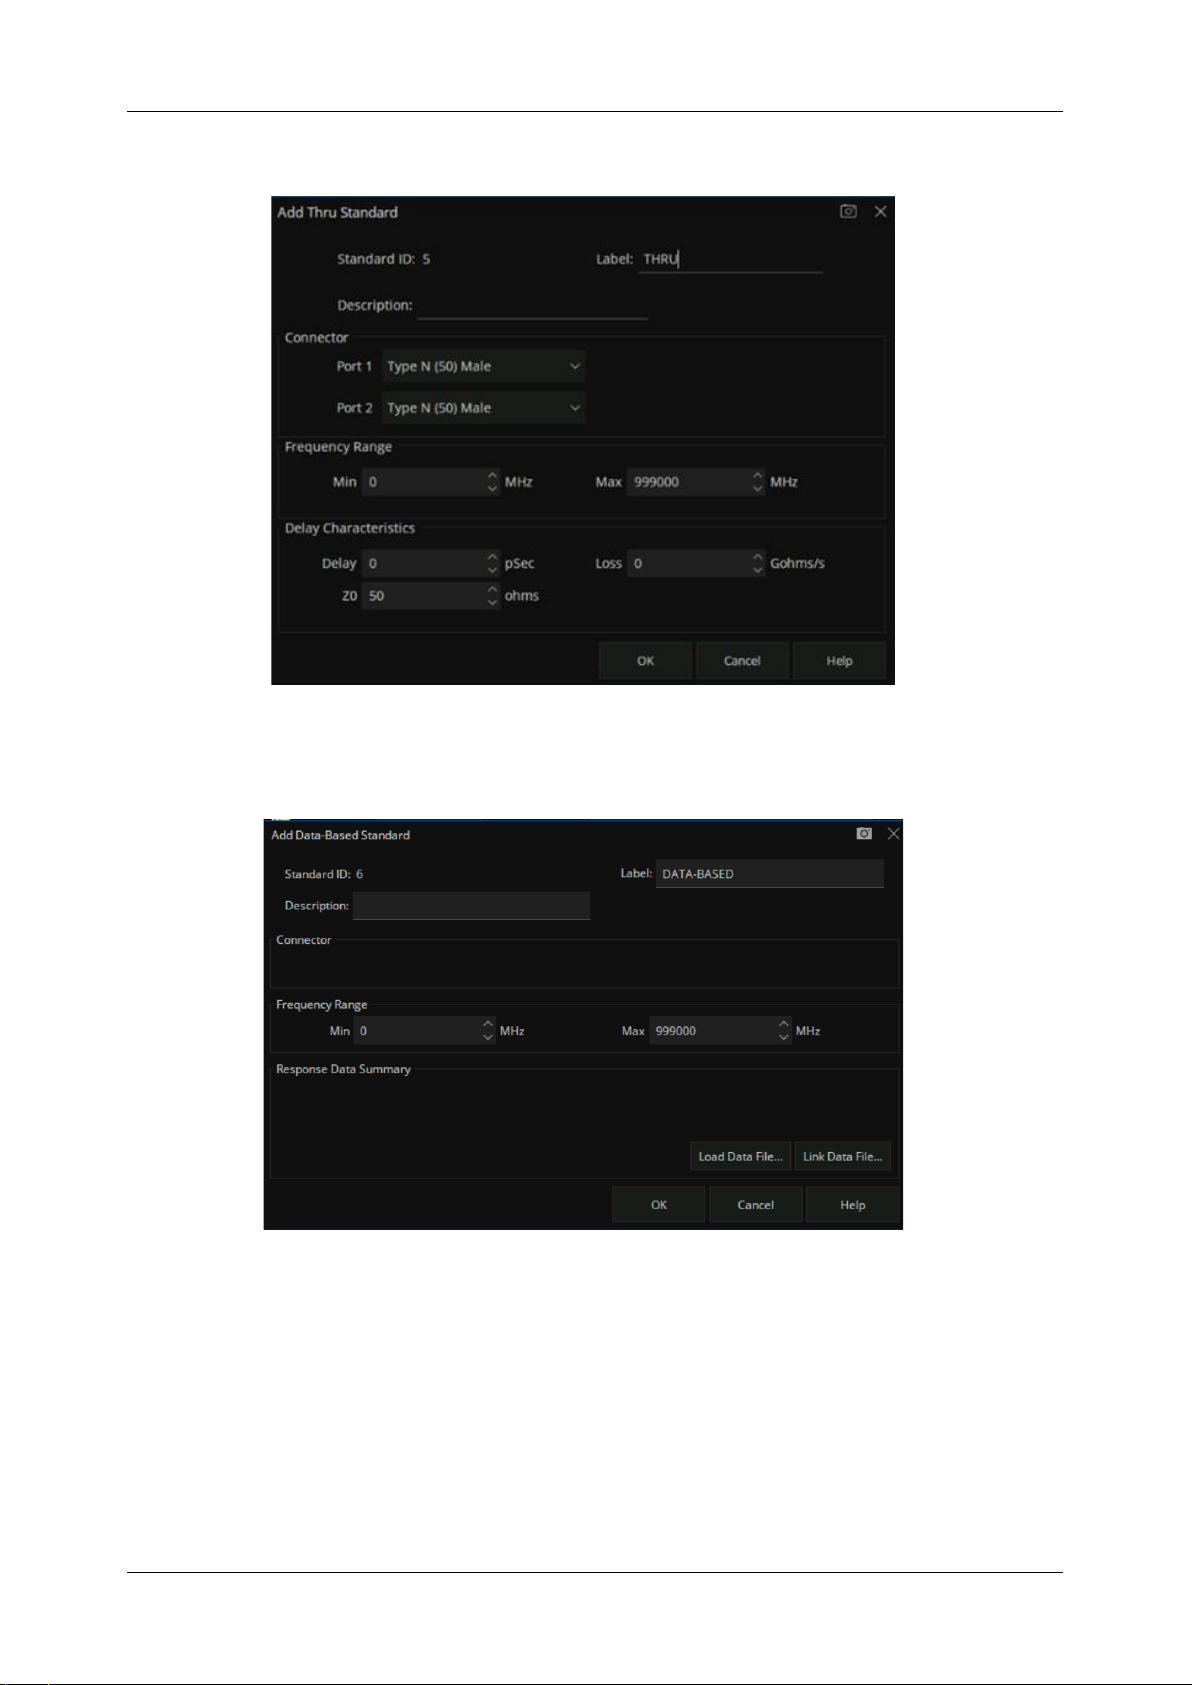
SHN900A User Manual
www.siglent.com
89
6) THRU Standard
Figure 6-9 THRU Characteristics
7
)
DATA-BASED
Figure 6-10 DATA-BASED Characteristics
6.4.1.4 SOLT Tab
Allows you to assign single or multiple standards to SOLT Calibration Classes.
1) For each Cal Kit Class, select Available Standards from the left list, then click >> to copy the
standard to the Cal Kit
Page 92

SHN900A User Manual
90
www.siglent.com
2) Use Move Up and Move Down to change the ORDER of the standards.
Figure 6-11 SOLT Tab dialog box
6.4.1.5 TRL Tab
Allows you to assign single or multiple standards to Calibration Classes.
1) For each Cal Kit Class, select Available Standards from the left list, then click >> to copy the
standard to the Cal kit.
2) Use Move Up and Move Down to change the ORDER of the standards.
Page 93
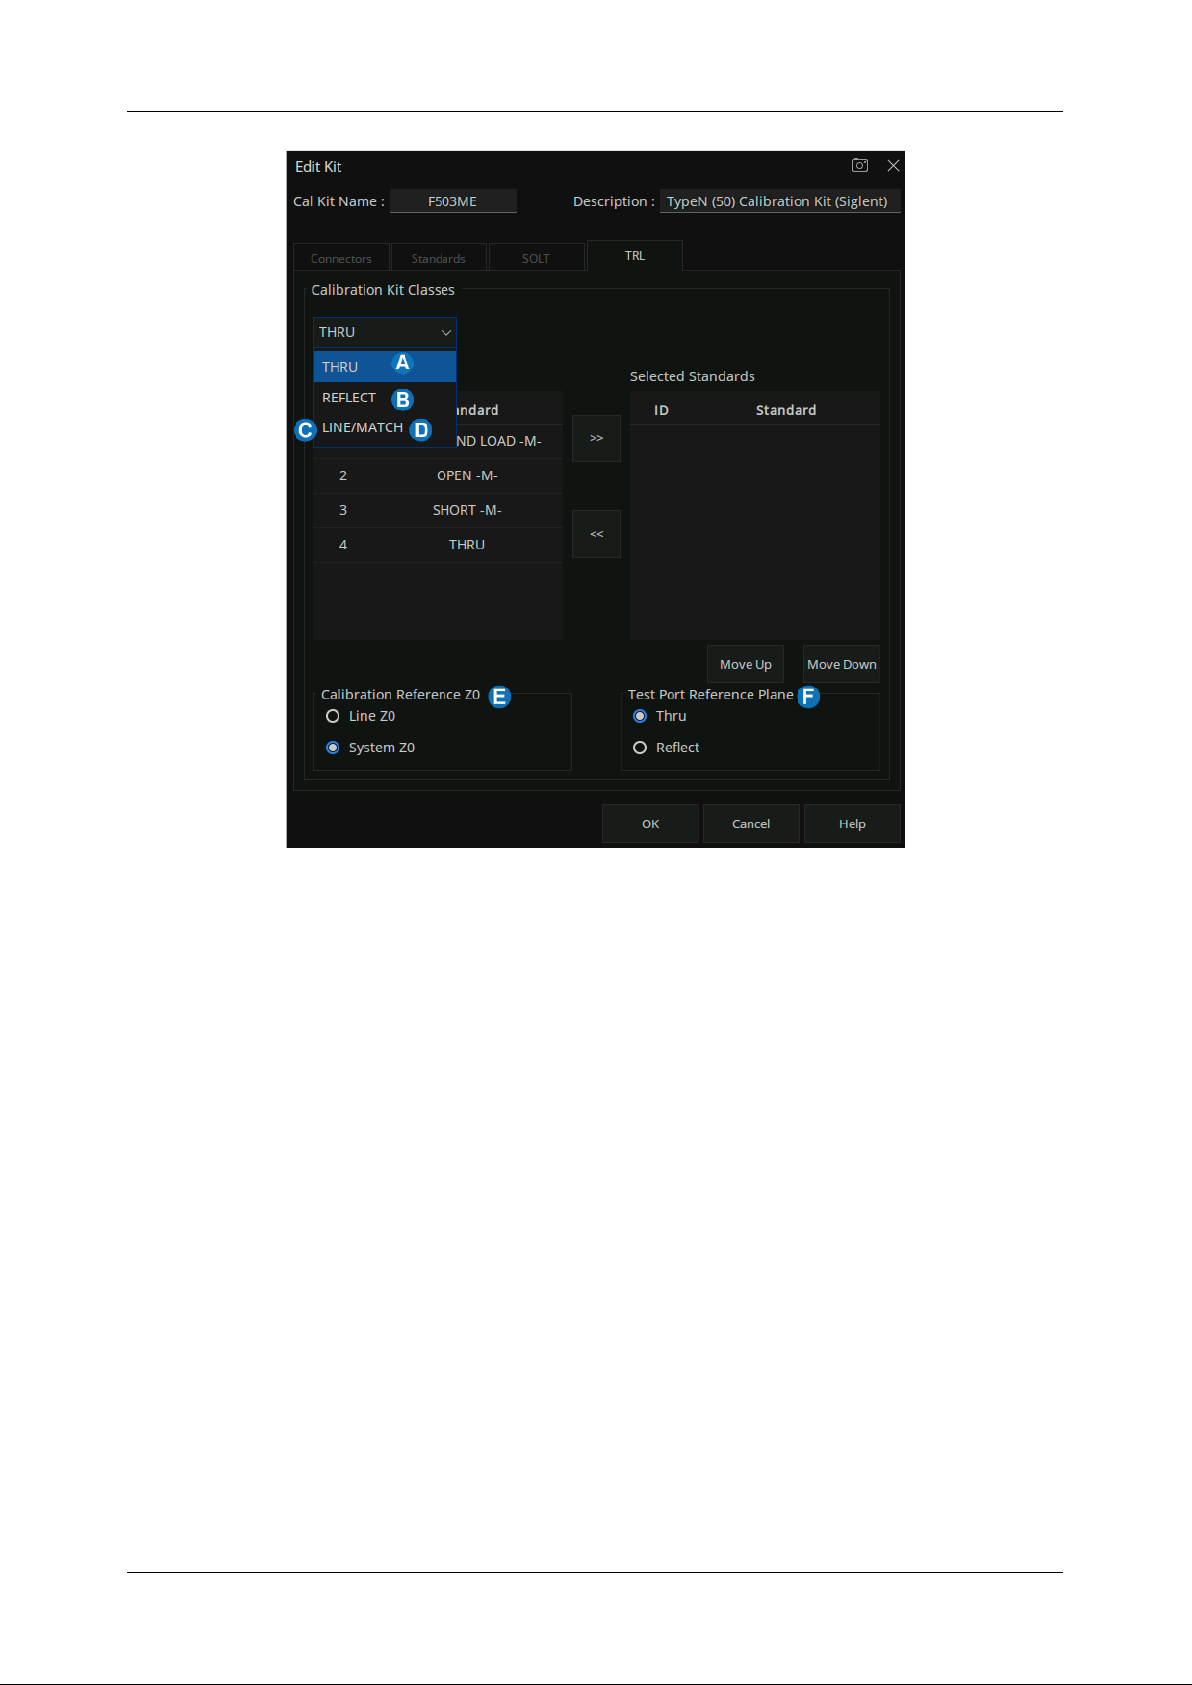
SHN900A User Manual
www.siglent.com
91
Figure 6-12 TRL dialog box
A. TRL THRU
All THRU calibration methods are supported in a TRL Cal EXCEPT Unknown Thru.
● The THRU standard can be either a zero-length or non-zero length. However, a zero-length
THRU is more accurate because it has zero loss and no reflections, by definition.
● The THRU standard cannot be the same electrical length as the LINE standard.
● If the insertion phase and electrical length are well-defined, the THRU standard may be used
to set the reference plane.
● The THRU standard and LINE standard have the same characteristic impedance and are
perfectly matched. They define the reference impedance of the calibration.
● If a THRU standard with the correct connectors is NOT available, an adapter removal Cal
can be performed.
B. TRL REFLECT
Page 94

SHN900A User Manual
92
www.siglent.com
● The REFLECT standard can be anything with a high reflection, as long as it is the same
when connected to one or more VNA ports.
● The REFLECT standard on each port is identical.
● The actual magnitude of the reflection need not be known.
● The phase of the reflection standard must be known within 1/4 wavelength.
● If the magnitude and phase of the reflection standard are well-defined, the standard may be
used to set the reference plane
C. TRL LINE
The LINE and THRU standards establish the reference impedance for the measurement after the
calibration is completed. TRL calibration is limited by the following restrictions of the LINE standard
● Must be of the same impedance and propagation constant as the THRU standard.
● The electrical length need only be specified within 1/4 wavelength.
● Cannot be the same length as the THRU standard.
● Must be an appropriate electrical length for the frequency range
D. TRL MATCH
If the LINE standard of appropriate length or loss cannot be fabricated, a MATCH standard may be
used instead of the LINE.
● The MATCH standard is a low-reflection termination connected to both Port 1 and Port 2.
● The MATCH standard may be defined as an infinite length transmission line OR as a 1-port
low reflect termination, such as a load.
● When defined as an infinite length transmission line, both test ports must be terminated by
a MATCH standard at the same time. When defined as a 1-port load standard, the loads are
measured separately. The loads are assumed to have the same characteristics.
● The impedance of the MATCH standard becomes the reference impedance for the
measurement. For best results, use the same load on both ports. The load may be defined
using the data-based definition, the arbitrary impedance definition, or the fixed load definition.
E. Calibration Reference Z0
● System Z0: The system impedance is used as the reference impedance. Choose when the
Page 95
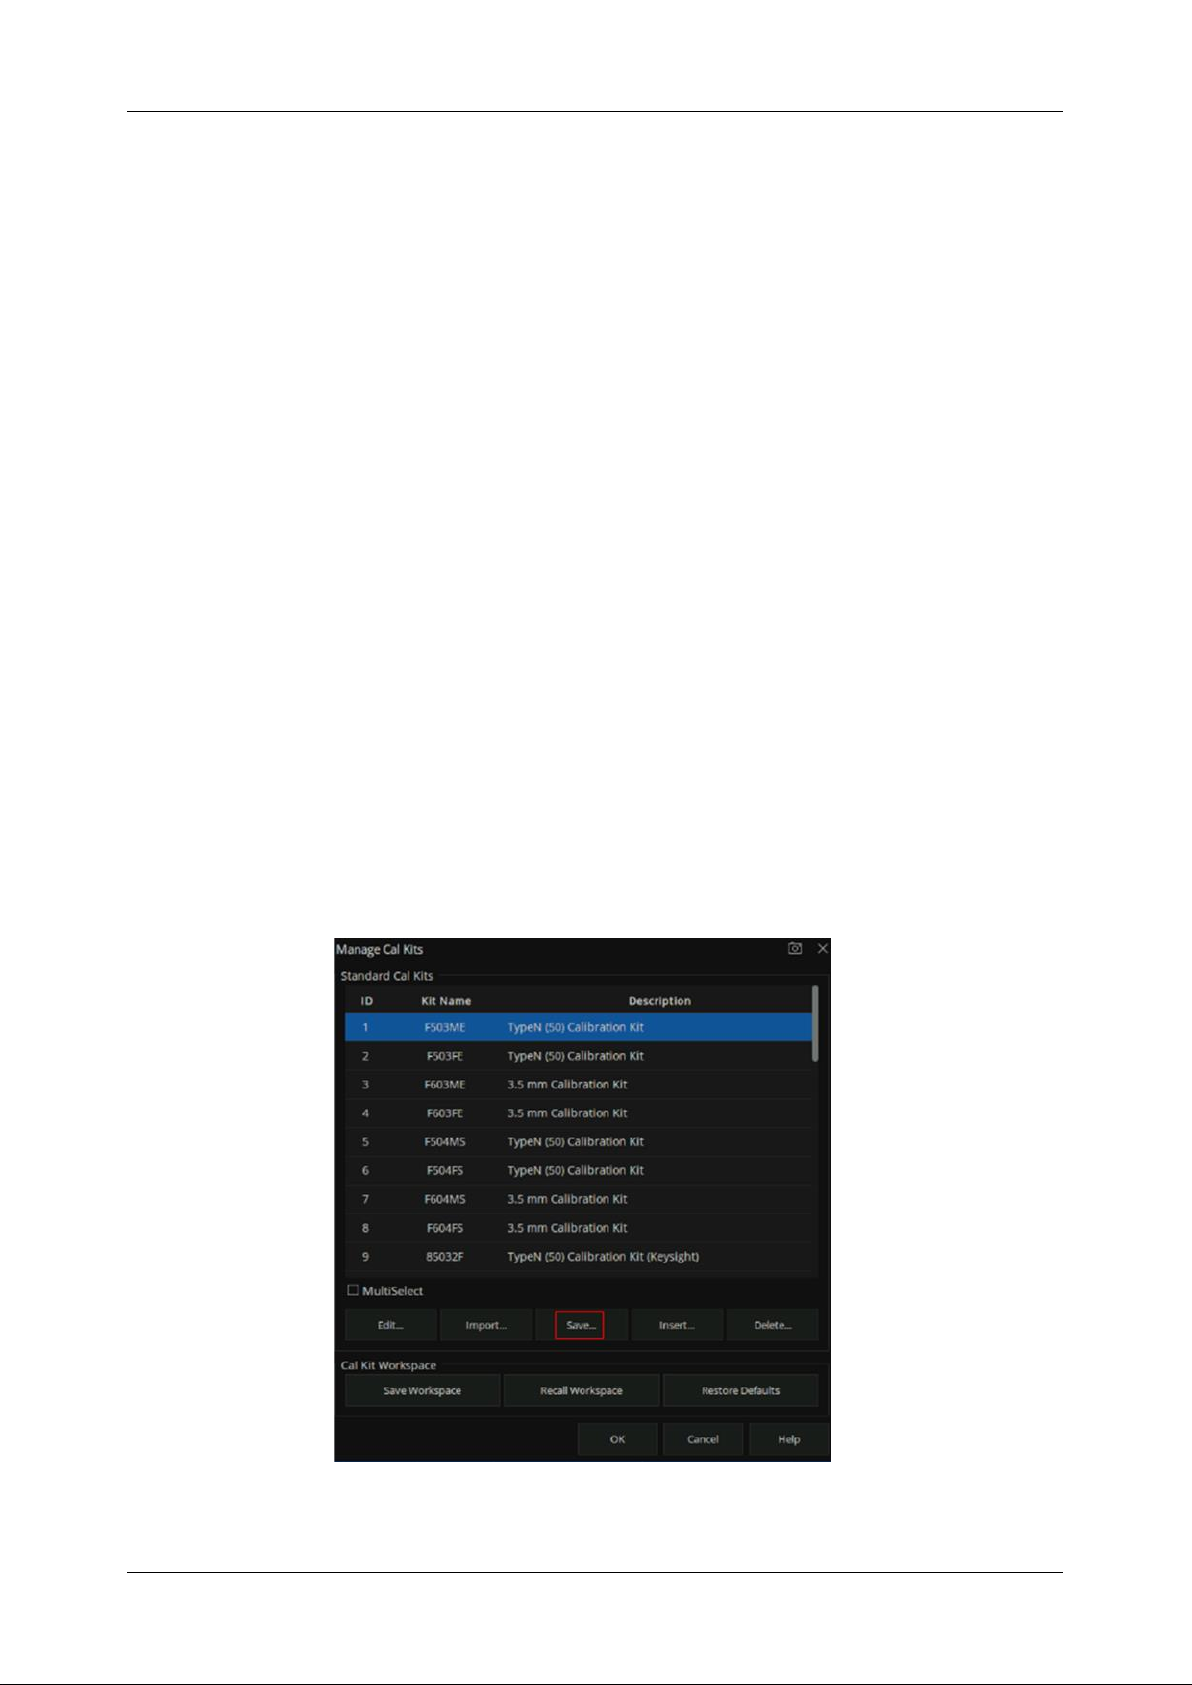
SHN900A User Manual
www.siglent.com
93
desired test port impedance differs from the impedance of the LINE standard. Also, choose
when skin effect impedance correction is desired for coax lines.
● Line Z0: The impedance of the line standard is used as the reference impedance or center
of the Smith Chart. Any reflection from the line standard is assumed to be part of the
directivity error.
F. Test Port Reference Plane
● Thru Standard: The THRU standard definition is used to establish the measurement
reference plane. Select if the THRU standard is zero-length or very short.
● Reflect Standard: The REFLECT standard definition is used to establish the position of the
measurement reference plane. Select if the THRU standard is not appropriate AND the delay
of the REFLECT standard is well defined.
6.4.1.6 Greate a custom Cal Kit
There are two methods to create a custom Cal Kit:
Method 1:
Create custom Cal Kit based on existing Cal kits
1. Press “Cal” > Cal > Cal Kit > F503ME > Save. Select the existing F503ME Cal Kit then save it to
a local file named “F503ME123.xkt”.
Figure 6-13 Creating a Custom Cal Kit dialog box
Page 96
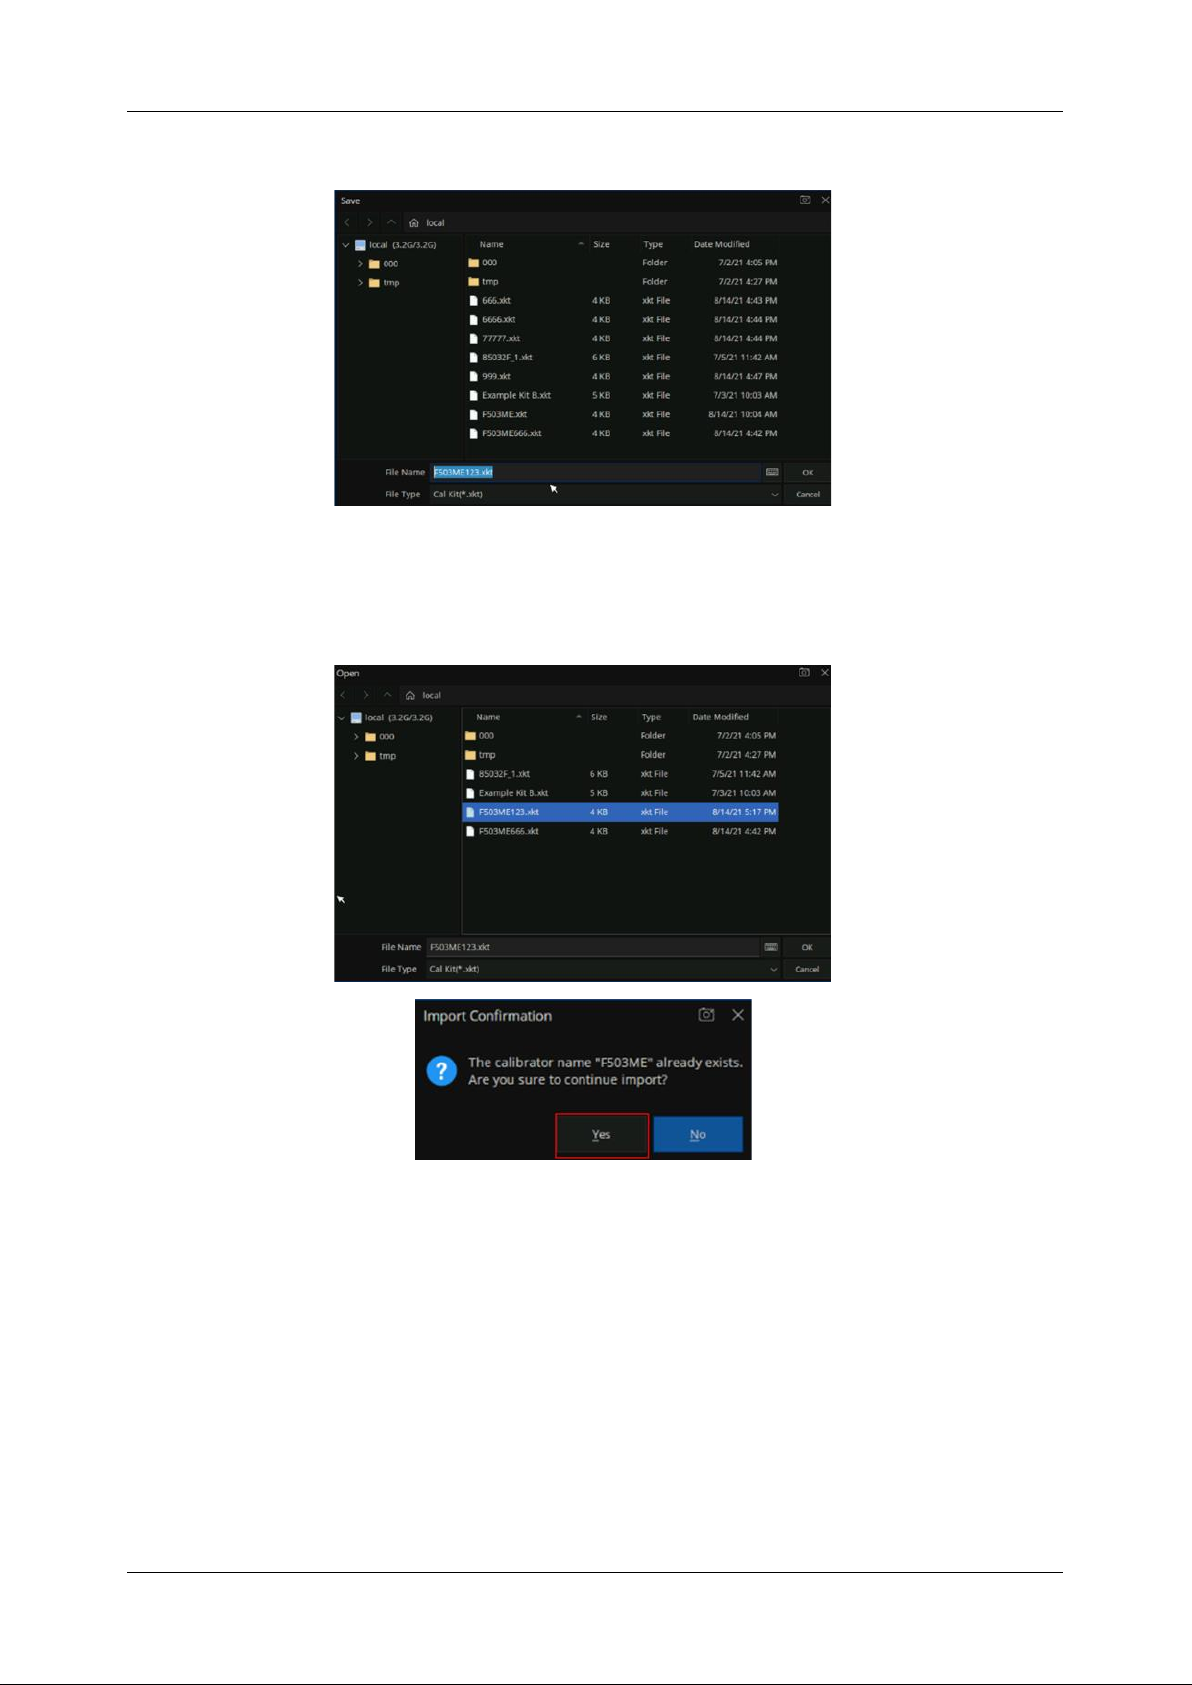
SHN900A User Manual
94
www.siglent.com
Figure 6-14 Save the ECal Kit
2. In the Manage Cal Kits dialog box, click “Import” to Import the new calibration “F503ME123.xkt”.
Figure 6-15 Import the new ECal Kit
3. Select the newly imported calibration, click “Edit” to enter the calibration editing interface, and
modify the calibration name as “F530ME-ABC”.
Page 97
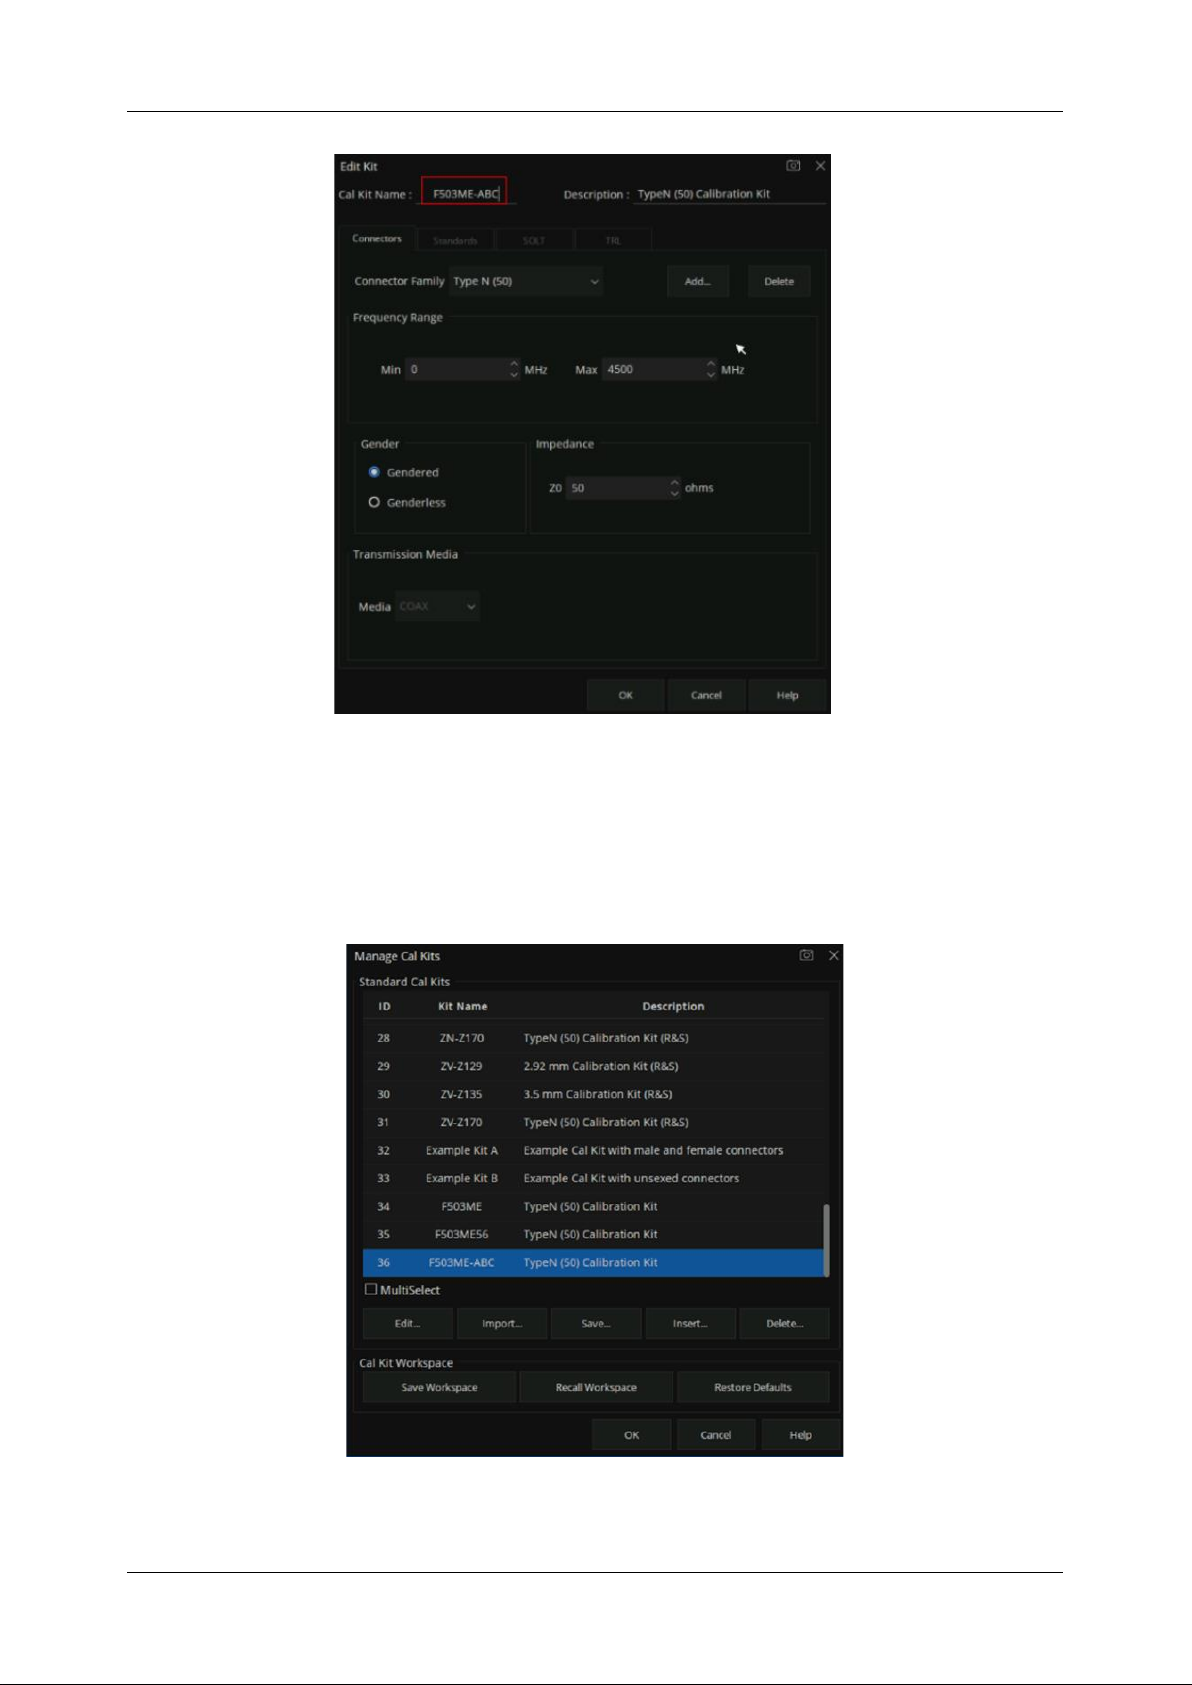
SHN900A User Manual
www.siglent.com
95
Figure 6-16 Edit the new import ECal Kit
4. Click the Connectors, Standards, SOLT, and TRL Tabs to modify the corresponding parameters
as you need.
5. Click “OK” for the changed Cal Kit to take effect.
Figure 6-17 View the newly created Cal Kit
Page 98
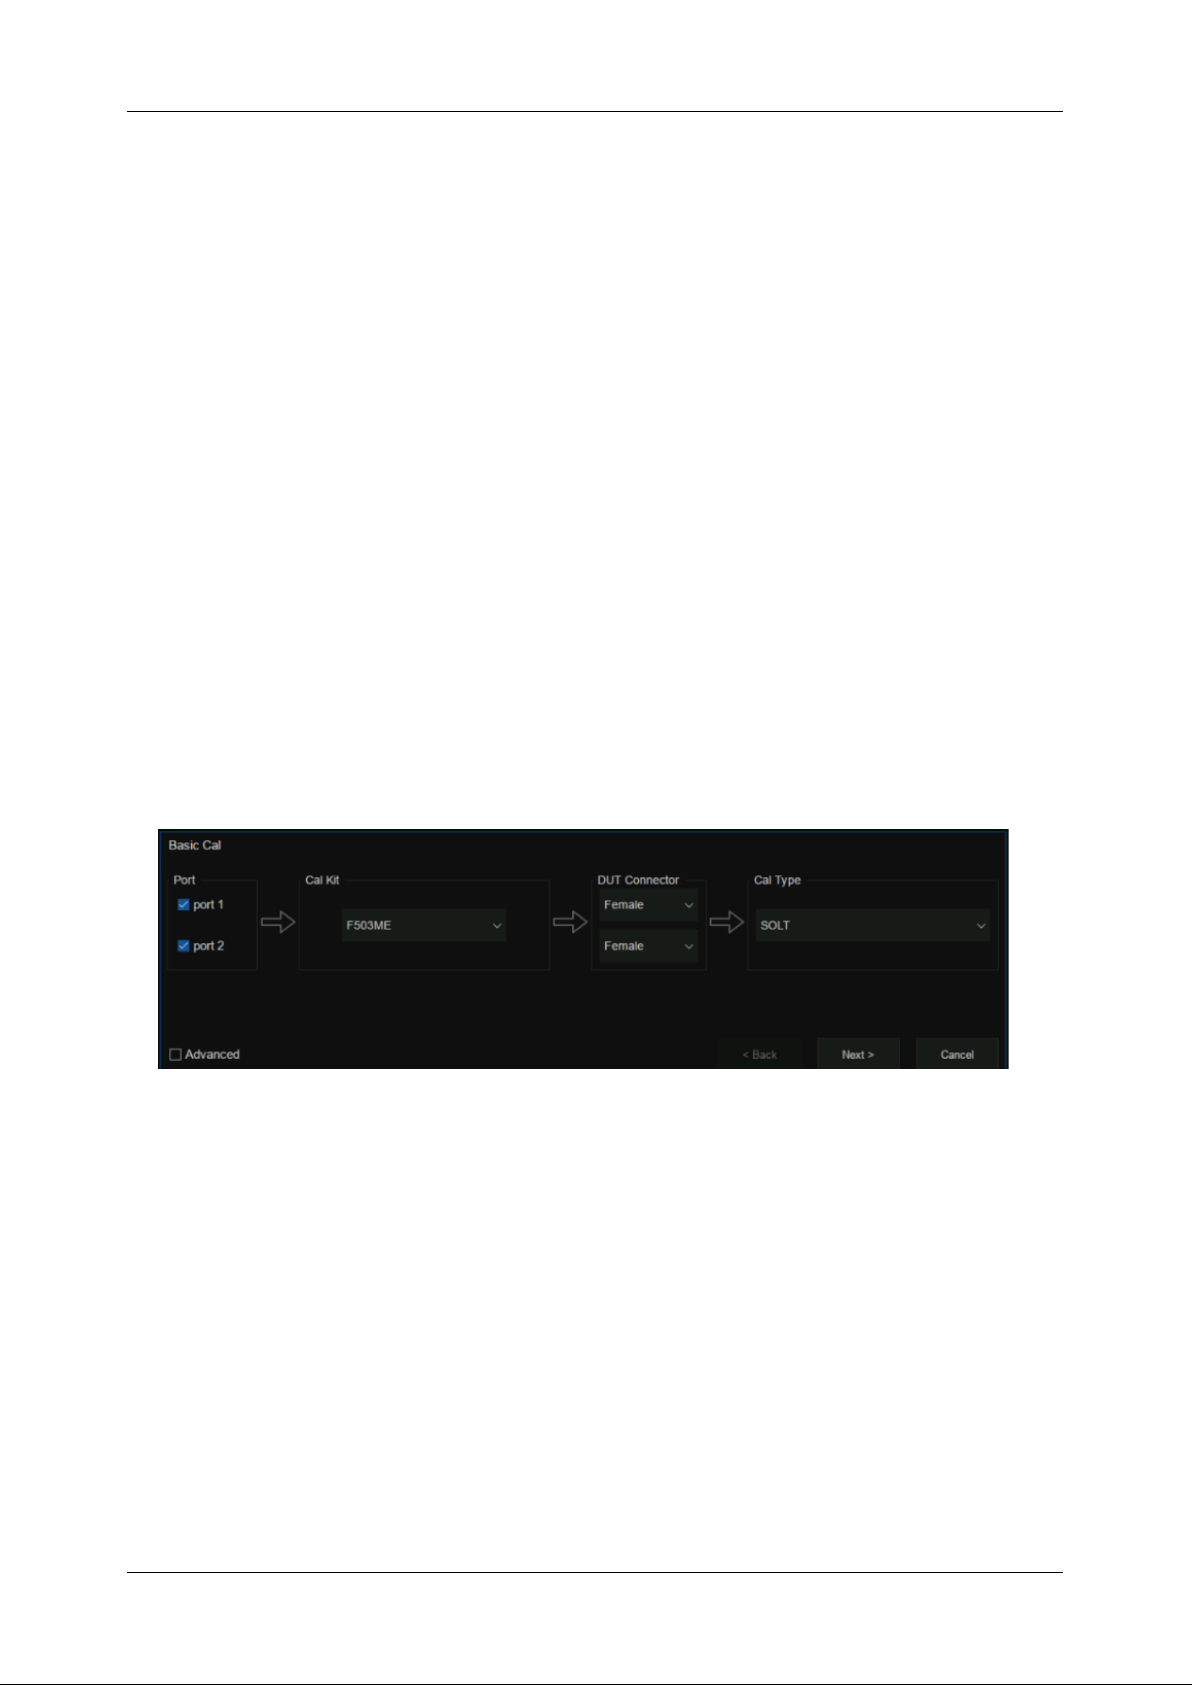
SHN900A User Manual
96
www.siglent.com
Method 2
: Create a custom Cal Kit directly for new connector types.
1. Press “Cal” > Cal > Cal Kit > Insert...
2. Enter the name and description of the custom Cal Kit.
3. Refer to Method 1, click the Connectors, Standards, SOLT, TRL tab to modify the corresponding
parameters.
4. Click “OK” to make the created calibration effective.
6.4.2 S Parameter calibration wizard
S parameter user calibration can be started after selecting the required S parameter calibration type
in the calibration wizard and setting the corresponding parameters.
Operating instructions:
Press the
Cal
key, use the knob or the arrow key to make the focus fall on
Basic Cal
, and press
Enter
to enter the setting interface of the calibration kit:
Figure 6-18 Calibration wizard interface
Select the number of ports to be calibrated from the port menu in the calibration wizard interface, and
select the corresponding calibration kit model in the Cal Kit pull-down option. Select the gender
properties of the calibration connector from the DUT Connector drop-down option, and select the
corresponding calibration method from the Cal Type drop-down option, as shown in the figure below:
Page 99

SHN900A User Manual
www.siglent.com
97
Figure 6-19 Calibration wizard interface
After the calibration is set, a specific calibration item interface will appear as shown in the figure below.
Here, taking the two-port SOLT calibration method as an example, it includes several calibration items:
OPEN, SHORT, LOAD, THRU, ISOLATION, among which the ISOLATION calibration item may not
be calibrated. There is no sequence relation between these calibration terms. Simply select the
corresponding calibration kit and click the corresponding calibration item menu on the interface.
After completion of the corresponding calibration item, the percentage of calibration progress will be
displayed in the lower-left corner of the interface. When all the calibration steps are completed, the
calibration progress bar will show 100%. Click Finish to exit the calibration interface, calibration results
are automatically loaded in the current screen.
Figure 6-20 Calibration wizard interface
To Save the current calibration data for future use, press the
Save Recall
button and use the knob or
arrow keys to bring the focus to the
Save State
menu bar. Select
State+Cal Data
from the
Save Type
drop-down option, click
Save State As
and enter the file name, and click OK to Save the current
calibration Data and the current setting State.
Page 100
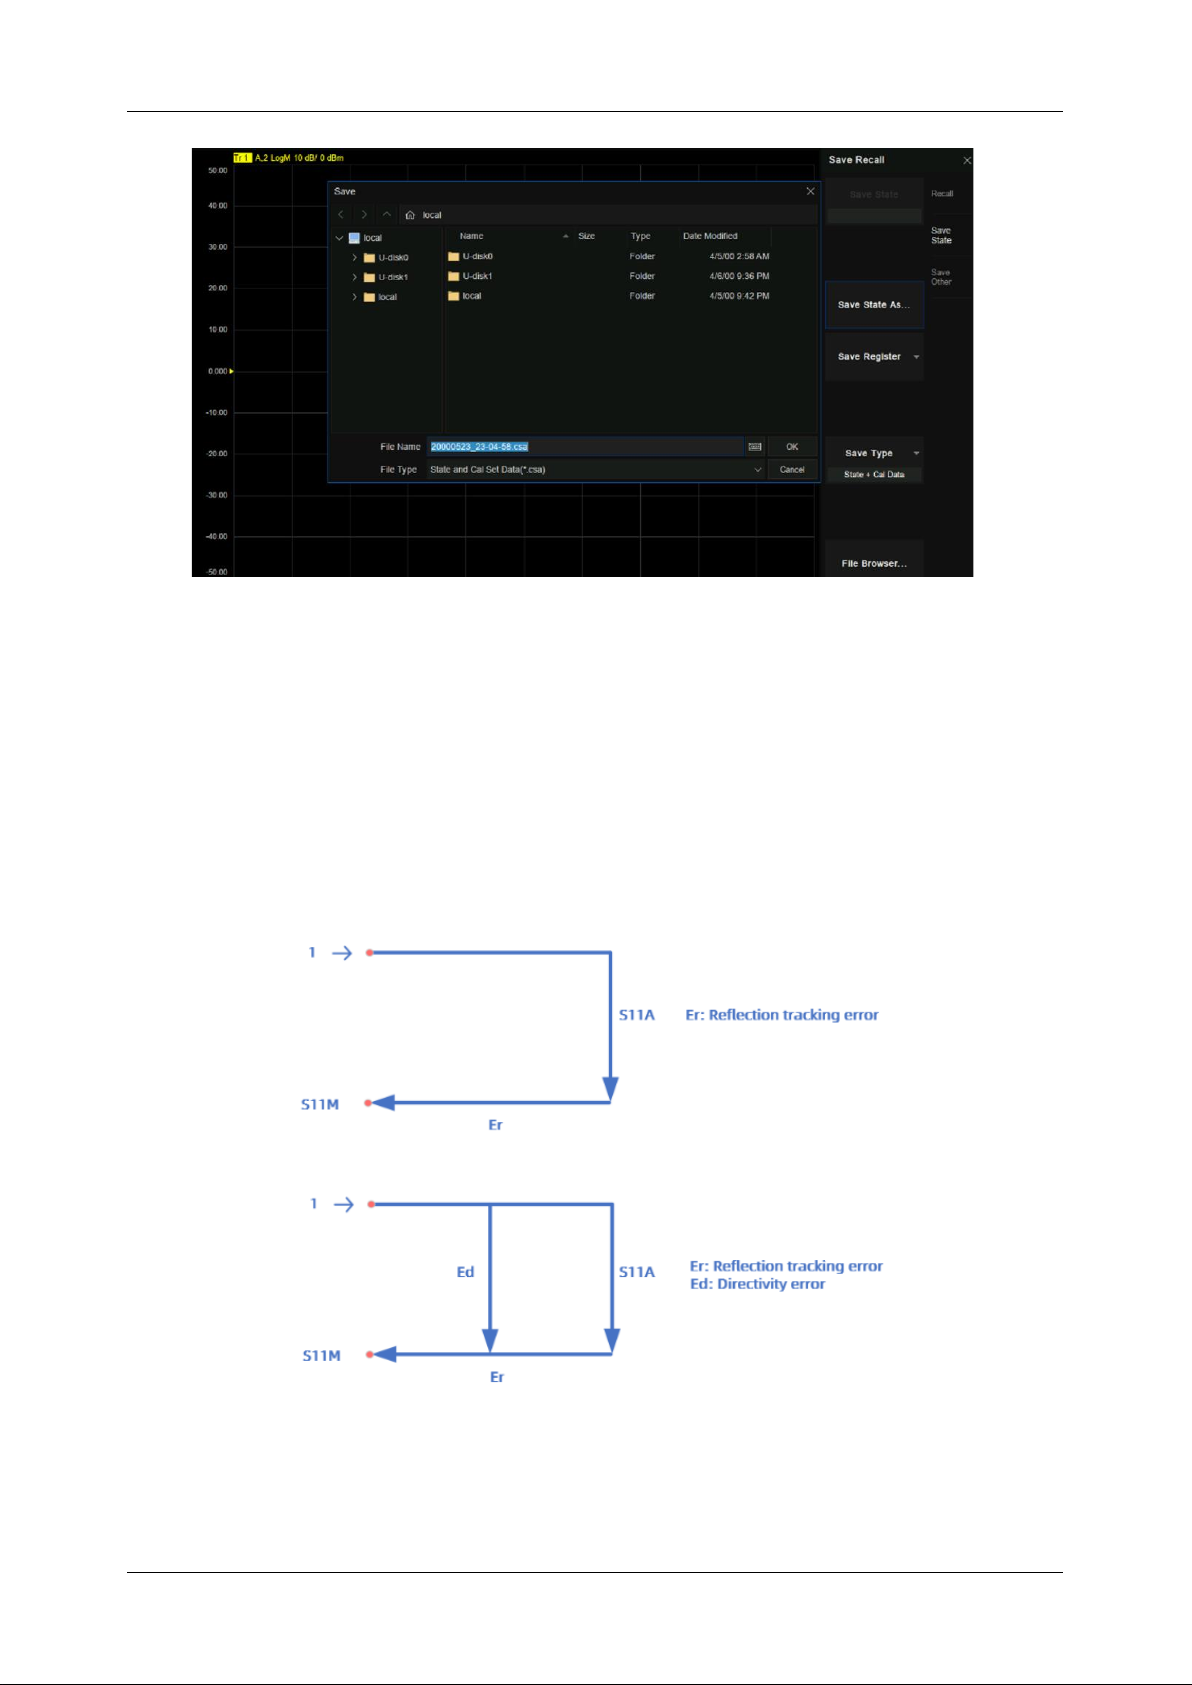
SHN900A User Manual
98
www.siglent.com
Figure 6-21 Calibration wizard interface
6.4.3 Open Response Calibration
When a single port is used for open-circuit response calibration, the reflection tracking error in the
error model of the test device can be calculated by only connecting the OPEN calibration element to
the test port. If the LOAD calibration element is used for isolation calibration at the same time, the
directional error can be calculated.
Figure 6-22 Schematic diagram
Operating steps:
 Loading...