

Page 1
The information in this datasheet is subject to change 42 1669 01
December 1995
1/21
ST20 TOOLSET
ST20–SWC
ST20 software development and debugging tools
PRODUCT INFORMATION
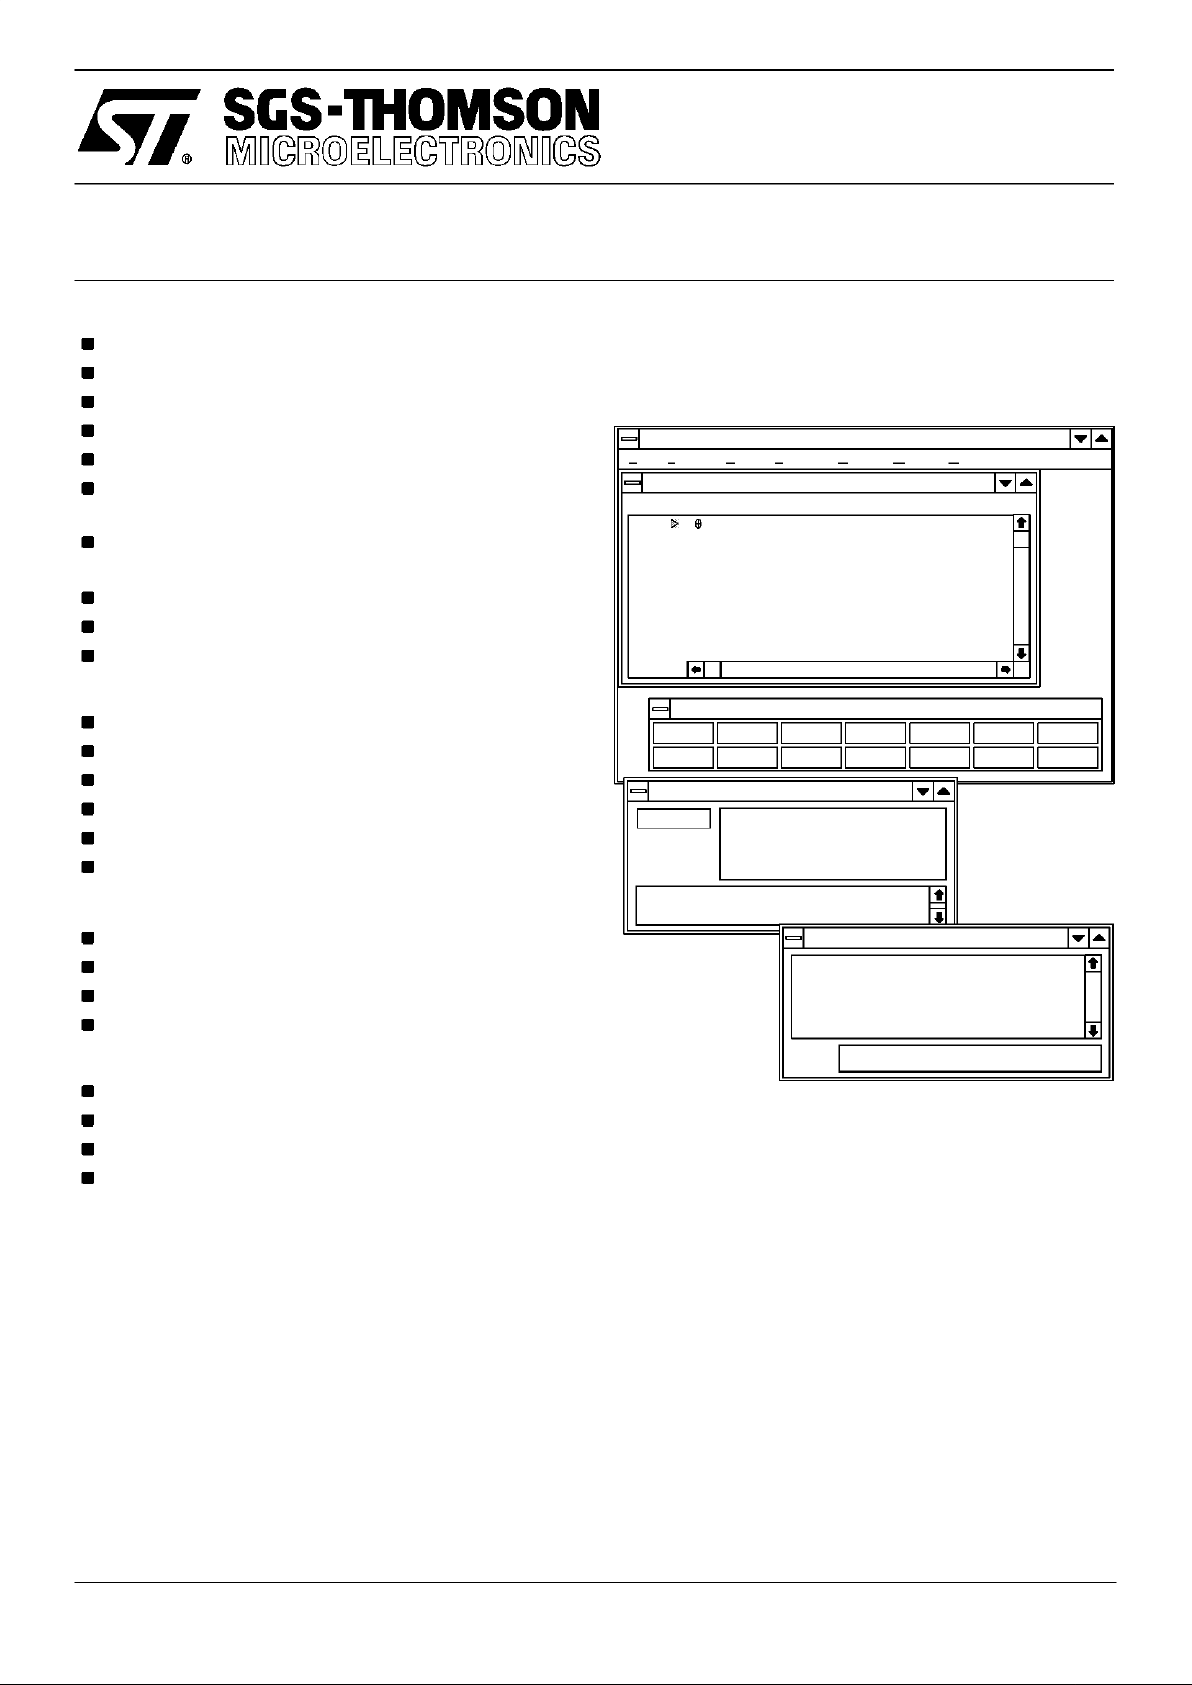
Inquest
File Execution E vents Variables O ptions W indow H elp
Program :C :\INQUEST\EXAMPLES\APP_C\APP .BTL
C:\INQUEST\EXAMPLES\APP_C\control.c
30
31
32
33
34
35
36
37
38
do
{
printf(”Please type n : ”);
} while (scanf(”%d”, &n) !=1);
return (n);
}
void close_down (Channel *in, Channel *o
Continue
Interrupt
Step
Next
Step Out
Step To
Break
Watch
Delete
Print
Jump
Print *
Locate
Last Evt
FEATURES
ANSI C compiler (X3.159-1989).
Excellent compile time diagnostics.
Global and local optimization.
Assembler inserts and standalone assembler.
Support for EPROM programming.
Support for placing code and data in user specified
memory locations.
Support for dynamically loading programs and
functions.
Small runtime overhead.
Cross-development from PC and Sun-4 platforms.
Support for trap and interrupt handlers.
INQUEST Interactive and post-mortem debugging:–
Windowing interface using X Windows or Windows.
Programmable command language.
Source code or assembly code view.
Stack trace-back facility.
Variableand Memory display facility.
C expression interpreter.
INQUEST Interactive debugging:–
Process and thread break points.
Single stepping of threads.
Read/Write/Access watch point capability.
Facilities to interrupt and find threads.
Performance analysis tools:–
Analysis of time spent in each function.
Analysis of block executionfrequency.
Analysis of processor idletime.
Analysis of processor utilization.
DESCRIPTION
The ST20 ANSI C Toolset provides a complete high
qualitysoftware development environment for the ST20
microcontroller and microprocessor. The compiler
supports the full ANSI C language definition and
includes both local and global optimizing features.
Embedded application support is provided by both
configuration and symbol maputilities.
An
interactive windowing debugger
provides single
stepping, breakpoints, watchpoints and many other
features for debugging sequential and multi-tasking
programs.
Execution profilers
givevarious post-mortem
statistical analyses of the execution of a program.
Inquest - Browser
app main : running
app control: stopped at #8001130d
app sum: chan-waiting
FAreg: 0.000000 FBreg: 0.000000 FCreg: 0.000000
Processes
app feed: chan-waiting
Inquest - Cmdline
32>
3 1 app main : breakpoint 6 at <app.c 26 0>
0 0 > continue
0 0 > interrupt
3 2 app control : interrupted at #8001130d
Page 2

ST20–SWC
2/21
Contents
1 Introduction 3................................................................
1.1 Applications 3............................................................
2 Code building tools 4.........................................................
2.1 How programs are built 4..................................................
2.2 ANSI C compilation system 5..............................................
2.3 Support for embedded applications 6........................................
3 INQUEST windowing debugger 9..............................................
3.1 Interactive debugging 12...................................................
3.2 Post-mortem debugging 13.................................................
4 Execution analysis tools 14....................................................
4.1 Execution profiler 14.......................................................
4.2 Utilization monitor 15.......................................................
4.3 Test coverage and block profiling tool 15......................................
5 Host interface and AServer 18..................................................
5.1 The application loader – irun 18............................................
5.2 AServer 18...............................................................
5.3 AServer features 19........................................................
6 ST20 Toolset product components 20..........................................
6.1 Documentation 20.........................................................
6.2 Software Tools 20.........................................................
6.3 Software libraries 20.......................................................
6.4 Operating requirements 20..................................................
6.5 Distribution media 21.......................................................
7 Support 21....................................................................
8 Ordering Information 21.......................................................
Page 3
ST20–SWC
3/21
1 Introduction
The ST20 ANSI C Toolset provides a complete high quality software development environment for
the ST20 microprocessor. The compiler supports the full ANSI C language definition and includes
both local and global optimizing features. The run-time library includes both standard C functions,
supported by hosttargetconnections, andST20specific functionstofacilitate real-time,multi-tasking
and embedded control operations. The real-time and multi-tasking support uses the on-chip hardware micro-kernel and timers, so for many applications no operating system or real-time kernel
software is needed.
An interactive windowing debugger provides single stepping, breakpoints, watchpoints and many
other featuresfor debugging sequential and multi-tasking programs running on an ST20.Execution
analysis tools give post-mortem statistical analyses including execution profiles, processor utilization, test coverage and block profiles.
The host interface is provided by the AServer.This can be used simply as an application loader and
hostfileserver,invoked by the iruncommand. TheINQUEST toolshavetheirowncommandswhich
in turn load irun in order to load the application. The AServer may also be used to customize the
host interface if required.
1.1 Applications
Single- and multi-tasking;
Embedded systems;
Real-time applications;
Low cost single chip applications;
Low level device control applications;
Porting of existing software and packages.
Page 4

ST20–SWC
4/21
2 Code building tools
The ST20 ANSI C Toolsetprovides a complete C cross-development system for the ST20. It can be
used to build single task and multi-tasking programs for the ST20. Programs developed with the
toolset are both source and binary compatible across all host development machines.
The ST20 ANSI CToolset is available for the following development platforms:
IBM 386/486 PC and compatibles under MSDOS 5 and Windows 3.1, or later versions.
Sun 4 under SunOS 4.1.3 or Solaris 2.4 with X11 Release 4 server or OpenWindows 3, or
later versions.
2.1 How programs are built
The toolset build process is shown diagrammatically in Figure 1.
Figure 1 The tool chain
ANSI C source files may be separately compiled into
object files
. The compiler and libraries are
described insection2.2.The
librarian
may beused tocollate objectfiles intolibraries.The
linker
links
object files and libraries into fully resolved linked units.
A
configuration description
is a text file describing the target hardware and how the software maps
onto it.The
configurer
converts the configuration description file into a
configuration binary
file. The
collector
removes any debugging information,and usesthe configuration binary tocollect the linked
files with bootstrap code to make an executable file called a
bootable file
.
During development and forhosted systems, thebootable file may be loaded downa hardware serial
link ontothe target hardwareusing the
application loader
. For stand-alone systems, the bootable file
may beconverted, using the EPROM tool, to anindustry standard EPROM formatfor programming
EPROMs.
In addition toloading programs down a hardware serial link, the application loader program provides
access to host operating system facilities through a remote procedure call mechanism. This method
is used to support the full ANSI C run-time library.
A memory configurer tool is supplied for describing a ST20450 memory configuration. This data is
used to initializethe memory interface of theST20450.The memoryinterfacecanbe initialized either
using the hardware serial link or from ROM.
Page 5

ST20–SWC
5/21
2.2 ANSI C compilation system
2.2.1 Compiler operation
The compiler operates from a host command line interface. The preprocessor is integrated into the
compiler for fast execution. The compile time diagnostics provided by the compiler are comprehensive and include type checking in expressions and type checking of function arguments.
2.2.2 ANSI conformance
The ST20 ANSI C Toolset supports the full standard language as defined in X3.159-1989. The
compiler passes all the tests in the validation suites from Plum Hall and Perennial.
2.2.3 Local optimized code generation
The compiler implements a wide range of local code optimization techniques.
Constant folding. The compiler evaluates all integer and real constant expressions at compile
time.
Workspace allocation. Frequentlyused variables are placed atsmall offsets in workspace,thus
reducing the size of the instructions needed to access them, and hence increasing the speed
of execution.
Dead-code elimination. Code that cannot be reached during the execution of the program is
removed.
Peephole optimization. Code sequences are selected that are the fastest for the operation.
Constant caching. Some constants have their loadtime reduced by placing them in a constant
table.
Unnecessary jumps are eliminated.
Switch statements can generate a number of different code sequences to cover the dense
ranges within the total range.
Special idioms that are better on ST20s are chosen for some code sequences.
2.2.4 Globally optimized code generation
The ANSI C globally optimizing compiler extends the types of optimizations it performs to global
techniques. These have typically given a 15–25 percent improvement in speed over the local optimizations as measured by a suite of internal benchmarks.
Common sub-expression elimination removes the evaluation of an expression where it is
known that the value has already been computed; the value is stored in temporary local workspace. This improves the speed of a program and reduces code size.
Loop-invariant code motion can movethe positionwhere anexpression isevaluated fromwithin
alooptooutside it.Iftheexpressioncontains no variablesthat are changedduring theexecution
of a loop, thenthe expression can beevaluated just once beforethe loop is entered.Bykeeping
the result in a temporary, the speed of execution of the whole loop is increased.
Tail-call optimization reduces the number of calls and returns executed bya program. If the last
thing afunction does is to invoke another function and immediately return the value there from,
then thecompiler attemptsto re-use the same workspace area by just jumping to (rather than
calling) thelower level function.The called function thenreturnsdirectlytowherethe upper level
function wascalled from. Inthe case where the call isa recursive call to thesame function,then
the workspace is exactly theright size,and asaving is alsomadebecause the stackadjustment
instructions are no longer neededeither.This optimization saves speed andtotal stack space.
Page 6
ST20–SWC
6/21
Workspace allocation by coloring reduces the amount of workspace required by using the
same word for two variables when it can be determined that they are not both required at the
same time.
The optimizing compiler also implements a pragma, IMS_nosideeffects, whereby the user can
indicate that a function does not have any side-effectson external or static variables. The optimizer
can then use this information to make assumptions about what state can be changed by a function
invocation and hence about the validity of any previously computed expressions.
2.2.5 Libraries
The full set of ANSI libraries is provided.
The standard library operates in double precision. Versions of the mathematical functions are
provided that operate on float arguments and return float values. These libraries provide improved
performance for applications where performance requirements override accuracy requirements.
A reduced Clibraryis supplied to minimize code sizefor embedded systemsapplications. Thislibrary
is appropriate for code which does not need to access host facilities.
Collections offunctions canbe compiled separately withthe ANSIC compiler andthen combinedinto
a library.The linker is used to combine separately compiled functions into a program.
2.2.6 Assembler inserts
The ANSI C Toolset provides a very powerful assembler insert facility. The assembler insert facility
supports:
Access to the full instruction set of the ST20;
Symbolic access to C variables (automatic and static);
Pseudo operations to load values into registers;
Loading results of C expressions;
Labels and jumps;
Directives for instruction sizing, stack access, return address access etc.
2.3 Support for embedded applications
The toolset has been designed to support thedevelopment of embedded applications. The features
include the ability to place code and data at particular places in memory,being able to access the
ST20 instruction set efficiently from C, and to reduce theC run-time overhead to suit the application.
2.3.1 Placing code and data
At configurationlevel,aprogram consistsof itscode,stack, staticandheap segments.Theconfigurer
allocates each of these separate segments a place in the memory of the processor.
By default, the configurer allocates all the code and data segments to a contiguous default block of
memory. The location of this default block and the order of the segments may be defined in the
configuration description. The configuration description canalso specify that any one ofthe code or
data segmentsofan application are tobeallocated to particularplacesin memory outsidethe default
block.
The compiler,linker and collector each willoptionally produce alisting of how the various parts ofan
application are mappedintothesegments andmemory.A tool is provided that canread all thesemap
files and produce a summary of the whole application, giving the locations of all the functions and
static variables. Information iscollated aboutcodeanddatasegments includingthe start address and
size.
Page 7

ST20–SWC
7/21
2.3.2 Access to the instruction set
ANSI C is a good language for writing embedded applications, since it combines the constructs of
a highlevelprogramming languagewith low level access tothe hardwarethrough assembler inserts.
Tomake the access tosomeof the ST20 instructions even more effective,a number ofspecial library
functions have beendefined which the optimizing compiler canrender as in-linecode. This removes
the overhead of a library call, but it also gives the optimizer more information on what the program
is doing.
Normally, when the optimizer sees a function containing some assembler code, it must make very
conservative assumptions about theeffect the codehas on its surroundings, e.g. on static variables
and parameters. By using the functions defined to access the instructions, the optimizer knows
exactly whatthe effectswill be and can makethe correct assumptions forthe side-effectsof thecode.
The ST20 instructions that can be accessed in this way include block moves, channel input and
output, bit manipulation, CRC computations, semaphores and some scheduling operations.
2.3.3 Run-time overhead reduction
In order to support the full ANSI C language, a significant run-time library is necessary.The toolset
is suppliedwith another library,known as the
reduced library
,which doesnot support file system and
environment requests, which depend on a host.
If some of the other features in ANSI C are not used, thenit may be possible to reducethe overhead
further by modifying the run-time initialization, the source of which is provided.
2.3.4 Assembler inserts
Within the SGS-THOMSON implementation ofthe ANSI C language, assemblercode can be written
at any point to achieve direct access to ST20 instructions for reasons of speed and code size. Full
access is available to the ST20 instruction set and C program variables.
2.3.5 Assembler
If there is no other way to obtain the code required, for example when writing customized bootstrap
mechanisms, then thetoolset contains an assembler as thefinal phase of the compiler.This can be
invoked to assemble user-written code.
2.3.6 Dynamic loading of processes
The toolset can encapsulate the code and data of a process in a file called a
relocatable separately-
compiled unit
or rsc. This form is suitable for it to be loaded byanother application andcalled. A set
of functions is provided for this to be achieved. The rsc can be found either in a file, or already in
memory,or is inputalong achannel. The memory variant allows anrsc to be placed into ROMand
executed if required. For example, if an application wishes to select a device driver to be placed in
on-chip memory,then a number of possible drivers can be placed in ROM and the application can
choose one for the occasion, copy it into low memory and execute it.
2.3.7 Bootstraps
The source code of the standard bootstraps are provided. The user can then write bootstraps that
are tailored to a specific application by using the standard ones as templates.
2.3.8 Memory configuration
An interactive memory configurer tool is supplied for describing a ST20450 memory configuration.
The memory interface of the ST20450 is configurable and must be initialized before the memory can
be accessed. This data is used by the Toolset tools to generate the code to initialize the memory
Page 8

ST20–SWC
8/21
interface of theST20450. Thiscode is either downloadedfrom the host using the hardware serial link
using the host server or is incorporated into a ROM using the EPROM programming tool.
For an ST20 variant with a memory interface different from the ST20450, example bootstrap code
is provided.
2.3.9 Interrupt and trap handling
Library support is supplied for trap handlers and ST20450 interrupt handlers. This allows trap
handlers and ST20450 interrupt handlers to be written in C which will use the on-chiptrap handling
and interrupt handling support. Interrupt handlers for other ST20 variants may be based on the
provided libraries.
Page 9

ST20–SWC
9/21
3 INQUEST windowing debugger
The INQUEST debugger can debug ANSI C ST20 programs either interactively or post-mortem. A
user interfacedisplays sourcecode or disassembled code andenables the user to interact with the
debugger by means of buttons and menus, mouse and keyboard. The interface is built using the X
Window System and OSF/Motif for Sun-4s or Microsoft Windows for PCs.
The program being debugged may consist of any number of tasks (or threads of execution) some
of which may be running while others are stopped or being single stepped. The host debugger
program is asynchronous and holds a copy of the last stopped state of each thread, so values may
be inspected bythe host while the user program is runningon theST20. Multiple debugging windows
may be opened to view different parts of the program simultaneously.
The INQUEST debugger has three debugging modes:
interactive debugging, i.e. monitoring the application asit executeson the target processor;
post-mortem debugging on the target processor when the application has stopped;
post-mortem debugging on the host from a dump file.
Inquest - Browser
app main : running
app control: stopped at #8001130d
app sum: chan-waiting
FAreg: 0.000000 FBreg: 0.000000 FCreg: 0.000000
Processes
app feed: chan-waiting
Inquest
File Ex ecution E vents Variables O ptions W indow H elp
Program : C :\INQUEST\EXAMPLES\APP_C\APP .BTL
C:\INQUEST\EXAMPLES\APP_C\control.c
30
31
32
33
34
35
36
37
38
do
{
printf(”Please type n : ”);
} while (scanf(”%d”, &n) !=1);
return (n);
}
void close_down (Channel *in, Channel *o
Continue
Interrupt
Step
Next
Step Out
Step T o
Break
Watch
Delete
Print
Jump
Print *
Locate
Last Evt
Inquest - Cmdline
32>
3 1 app main : breakpoint 6 at <app.c 26 0>
0 0 > continue
0 0 > interrupt
3 2 app control : interrupted at #8001130d
Figure 2 The Microsoft Windows debugger display
Inquest - Browser
3 factorial( ) at <facs.c 25 0>
2 factorial( ) at <facs.c 27 0>
1*main( ) at <facs.c 49 0>
Processes
Threads
FAreg: 0.000000 FBreg: 0.000000 FCreg: 0.000000
Figure 3 A Microsoft Windows stack trace
Inquest - Cmdline
3 3 > print *p
{
link = 00000000,
wsret = -2147422152,
wbase = 8002cde0,
wsize = 4096,
chan = *empty*
}
00>
Figure 4 Displaying a structured variable on Microsoft Windows
Page 10

ST20–SWC
10/21
Boot file app.btl
Simple
/user/inquest/examples/app_c/app.cfs
00>
File Execution Events Variables Options
Continue
Last Event
Interrupt
Config file: app.cfs
ST20_4 (memory=1M, memstart = 0x80000140) Single;
connect Single.link[0] to host;
process (interface(input HostIn, output HostOut),
stacksize=20k, heapsize=40k,
priority=low) Simple;
input FromHost;
output ToHost
connect Simple.HostIn to FromHost;
connect Simple.HostOut to ToHost;
use ”simple.lku” for Simple;
place Simple on Single;
place FromHost on host;
place ToHost on host;
1
2
3
4
5
6
7
8
9
10
11
12
13
14
15
16
17
18
19
20
3 1 app main : monitor 0 thread created at <app.c 26 0>
Locate
Figure 5 The X-Windows debugger display
2 1 facs main: stopped at <facs.c 25 0>
4 factorial() at <facs.c 25 0>
File Execution Events Variables Options
3 factorial() at <facs.c 27 0>
2 factorial() at <facs.c 27 0>
1*main() at <facs.c 49 0>
Processes
Threads
Figure 6 An X-Windows stack trace
Page 11

ST20–SWC
11/21
33>
ChanOutInt(outfeed, 0);31
3 3 > print *p
{
link = 00000000,
wsret = –2147422152,
wbase = 8002cde0,
wsize = 4096,
wp = 8002ddc4,
psize = 4,
ofunc = 80010650,
chan = *empty*
}
Figure 7 Displaying a structured variable on X-Windows
#8000a098: 0x00000000 0x00000001 0x00000001 0x8003b5e4 0x8003b5dc 0x8000fbd1
#8000a0b0: 0x80014fdc 0x00000001 0x8000a0d4 0x00000000 0x00000000 0x00000000
#8000a0c8: 0x00000000 0x00000000 0x80014fdc 0x8000fbd8 0x00000000 0x8003b95c
#8000a0e0: 0x80014fdc 0x8003b8d8 0x8171f824 0xfa7671d1 0x80000000 0x80000000
#8000a0f8: 0x80000000 0x80000000 0x80000000 0x80000000 0x80000000 0x80000000
#8000a110: 0x80000000 0x80000000 0x80000000 0x80000000 0x80000000 0x80000000
#8000a128: 0x80000000 0x80000000 0x80000000 0x80000000 0x80000000 0x80000000
#8000a140: 0x80000000 0x80000000 0x80000000 0x80000000 0x80000000 0x80000000
#8000a158: 0x80000000 0x80000000 0x80000000 0x80000000 0x80000000 0x80000000
#8000a170: 0x80000000 0x80000000 0x80000000 0x80000000 0x80000000 0x80000000
#8000a188: 0x80000000 0x80000000 0x80000000 0x80000000 0x80000000 0x80000000
#8000a1a0: 0x80000000 0x80000000 0x80000000 0x80000000 0x80000000 0x80000000
#8000a1b8: 0x80000000 0x80000000 0x80000000 0x80000000 0x80000000 0x80000000
#8000a1d0: 0x80000000 0x80000000 0x80000000 0x80000000 0x80000000 0x80000000
#8000a1e8: 0x80000000 0x80000000 0x80000000 0x80000000 0x80000000 0x80000000
#8000a200: 0x80000000 0x80000000 0x80000000 0x80000000 0x80000000 0x80000000
#8000a218: 0x80000000 0x80000000 0x80000000 0x80000000 0x80000000 0x80000000
#8000a230: 0x80000000 0x80000000 0x80000000 0x80000000 0x80000000 0x80000000
#8000a248: 0x80000000 0x80000000 0x80000000 0x80000000 0x80000000 0x80000000
#8000a260: 0x80000000 0x80000000 0x80000000 0x80000000 0x80000000 0x80000000
#8000a278: 0x80000000 0x80000000 0x80000000 0x80000000 0x80000000 0x80000000
#8000a290: 0x80000000 0x80000000 0x80000000 0x80000000 0x80000000 0x80000000
#8000a2a8: 0x80000000 0x80000000 0x80000000 0x80000000 0x80000000 0x80000000
#8000a2c0: 0x80000000 0x80000000 0x80000000 0x80000000 0x80000000 0x80000000
#8000a2d8: 0x80000000 0x80000000 0x80000000 0x80000000 0x80000000 0x80000000
#8000a2f0: 0x80000000 0x80000000 0x80000000 0x80000000 0x80000000 0x80000000
#8000a308: 0x80000000 0x80000000 0x80000000 0x80000000 0x80000000 0x80000000
File View Options
Processor: 0
Start address: 0x8000a098 End address: 0x8000a31c
Hexadecimal Type: WordFormat:
Processor: Single Type: ST20 Memory: 2048k
Figure 8 Displaying memory contents on X-Windows
Page 12

ST20–SWC
12/21
3.1 Interactive debugging
Sun-4 or PC host Target ST20
Debugging
kernel
User
program
Debugger
program
User i/o
debug services
Trace
information
User i/o
server
application
Figure 9 Interactive debugger architecture
The interactive debugger consists of ahost-based symbolic debugger anda target-residentdebugging kernel that is configured into the application program on an ST20 processor.
The interactive debugger provides the following features:–
A break point facility that can be used on particular threads of execution.
A single stepping facility that allowsa thread ofexecution to be single steppedat the source
level or at the assembly code level.
Awatch point facility that enables theprogram to be stopped when variables are tobe written
to or read from.
A facility to find the threads of execution of a program and set break points on them.
A stack trace facility.
A facility to monitor the creation of threads of execution.
Commands to print the values of variables and display memory.
Commands to modify variables and memory at run time.
A simple interpreter to enable C aggregate types (i.e. structures and arrays) to be displayed.
A programmable command language that allows complex break points and watch points to
be set and enables debugging scripts to be generated.
A source and object browser to select a process, a thread and source code.
An interface to the real-time operatingsystem for dynamic code loading andthread creation.
Page 13

ST20–SWC
13/21
3.2 Post-mortem debugging
The post-mortem debugger provides the following features:–
A source and object browser to select a process, a thread and source code.
Commands to print the values of variables and display memory.
A simple interpreter to enable C aggregate types (i.e. structures and arrays) to be displayed.
Creation of dump files.
Debugging from a dump file.
Page 14

ST20–SWC
14/21
4 Execution analysis tools
Three profiling tools are supplied for analyzing the behavior of application programs; the execution
profiler,the utilization monitor,and the test coverage and blockprofiling tool. The monitoring data is
stored in the target processor’smemory, so the profiling tools have little execution overhead on the
application. After the program has completed execution, the monitoring data is extracted from the
processor and is analyzed to provide displays on the program execution.
The tools provided are the execution profiler,the utilizationmonitor,and the test coverage and block
profiling tool. The execution profiler estimates the time spent in each function and procedure, the
processor idle time and various other statistics.The utilization monitor displays a Gantt chart of the
CPU activityof theprocessor as time progresses. The test coverage and block profiling tool counts
how many times each block of code is executed.
4.1 Execution profiler
The execution profiler gives an analysis of the total time spent executing each function on each
processor.
It provides the following information on program execution:–
The percentage time spent executing each low priority function.
The percentage time spent executing at high priority.
The percentage idle time of the processor.
The number of low priority calls of each function and where it was called from.
Processor ”Root”
Idle time 35.3% (19516)
High time 0.1% (37)
Wptr Misses 0
Iptr Misses 0
Resolution 4
----------------------------------------------------------------------------Process ”ex” (99.9% processor) (35.666s)
Stack 100.0% (35666) Heap 0.0% (0) Static 0.0% (0)
Function Name | Process | Processor |Samples
----------------------------------------------------------------------------libc.lib/getc | 11.4 | 11.4 |4081
cc/pp.c/pp_rdch0 | 10.1 | 10.1 |3605
cc/bind.c/globalize_memo | 6.9 | 6.9 |2467
cc/pp.c/pp_process | 4.3 | 4.3 |1525
cc/pp.c/pp_rdch3 | 4.2 | 4.2 |1497
cc/pp.c/pp_rdch2 | 3.9 | 3.9 |1380
cc/pp.c/pp_rdch1 | 3.8 | 3.8 |1354
cc/pp.c/pp_rdch | 3.5 | 3.5 |1252
cc/pp.c/pp_nextchar | 3.3 | 3.3 |1189
cc/pp.c/pp_checkid | 3.2 | 3.2 |1150
cc/lex.c/next_basic_sym | 2.7 | 2.7 |979
libc.lib/strcmp | 2.3 | 2.3 |812
libc.lib/DummySemWait | 2.2 | 2.2 |784
libc.lib/sub_vfprintf | 1.7 | 1.7 |617
Figure 10 Example output from the execution profiler
The execution of the user program is monitored by a profiling kernel. The presence of the profiler
kernel will slow the execution of the program by less than 5%.
4.2 Utilization monitor
The utilization monitor shows in graphical form the utilization of the processor over the time of the
program execution. This is displayed by an interactive program that draws a chart of processor
Page 15

ST20–SWC
15/21
execution against time using X Window System and OSF/Motif on a Sun-4 or Microsoft Windows on
a PC.
As withthe execution profiler,the userprogram is monitored by aprofiling kernel.The kernel willslow
the program by less than 5%.
ST20
Quit Zoom In Zoom Out
0.000 3.840 7.680 11.520 15.360 19.200 23.040 26.880 30.720 34.560
Figure 11 Example X-Windows display from the utilization monitor
4.3 Testcoverage and block profiling tool
This tool monitors test coverage and performs block profiling for an application which has been run
on target hardware.
This tool is able to:
provide an overall test coverage report;
provide per module test coverage reports;
accumulate a single report from multiple test runs;
provide a detailed basic block profiling output by creating an annotated program listing;
provide output that can be fed back into the compiler as a part of its optimization process.
The application program (compiled with the appropriate compiler option) is run and accumulates the
counts in the memory of the target processor. The tool is used to extract the results and save,
accumulate or display them. This application writes the counts into the code area, so the tool cannot
be used with code running from ROM.
Writing coverage file ”square.v” – 40% coverage
Writing coverage file ”comms.v” – 14% coverage
Writing coverage file ”app.v” – 75% coverage
Writing coverage file ”control.v” – 36% coverage
Writing coverage file ”feed.v” – 33% coverage
Writing coverage file ”sum.v” – 40% coverage
Total coverage for bootable 39% over 1 run
Figure 12 Example test coverage summary report
The following is an example of the contents of a coverage file:
|/*
| * facs.c
|*
| * generate factorials
|*
|*/
|
|#include <stdio.h>
|#include <stdlib.h>
|#include <process.h>
|#include <channel.h>
|#include <misc.h>
|#include ”comms.h”
|
|#define TRUE 1
|#define FALSE 0
|
|
Page 16

ST20–SWC
16/21
|/*
| * compute factorial
|*
|*/
|
|int factorial(int n)
96 |{
| if(n>0)
74 | return(n*factorial(n–1));
| else
22 | return (1);
|
|}
|
|int main()
1|{
| Channel *in, *out;
| int going = TRUE;
|
| in = get_param(1);
| out = get_param(2);
|
| while (going)
27 | {
| int n, tag;
|
| tag = read_chan (in, &n);
| switch (tag)
|{
| case DATA: {
22 | send_data (out, factorial(n));
| break;
|}
| case NEXT: { /* start a new sequence */
4 | send_next (out);
| break;
|}
| case END: { /* terminate */
1 | going = FALSE;
| send_end (out);
|}
|}
|}
|}
|}
|
######################
# Summary of results #
######################
Source file : facs.c
Number of runs : 1
Processors : All
>From linked unit : facs.lku
Top 10 Blocks!!
Line 25 – 96 times
Line 27 – 74 times
Line 42 – 27 times
Line 29 – 22 times
Line 49 – 22 times
Line 53 – 4 times
Line 34 – 1 time
Line 57 – 1 time
Total number of basic blocks 8
Basic blocks not executed 0
Coverage 100%
Page 17

ST20–SWC
17/21
5 Host interface and AServer
The host interface is provided by the AServer.This can be used simply as an application loader and
hostfileserver,invoked by the iruncommand. TheINQUEST toolshavetheirowncommandswhich
in turn load irun in order to load the application. The AServer may also be used to customize the
host interface if required.
5.1 The application loader – irun
irun performs three functions, namely:
1 to initialize the target hardware;
2 to load a bootableapplication program onto the target hardwarevia the hardware serial link;
3 to serve the application, i.e. to respond to requests from the application program for access
to host services, such as host files and terminal input and output.
These steps are normally performed when irun is invoked.
5.2 AServer
The AServer (Asynchronous Server) system is a high performance interface system which allows
multiple processes on a target device to communicate via a hardware serial link with multiple
processes on some external device. The AServer software acts as a standard interface which is
independent of the hardware used. A simple example is shown in Figure 13, in which the external
device is the host.
irun
Services
Target
Host
gatewaygateway
Clients
Link
Target hardware
Figure 13 A simple software host-target interface
The AServer is a collection of programs, interface libraries and protocols that together create a
system to enable applications running on target hardware to access external services in a way that
is consistent, extensible and open. The software elements provided are:
a target gateway which runs on the target;
an irun gateway which runs on the host;
an iserver service which runs on the host;
an iserver converter which runs on the target;
a library of interface routines for use by client and service processes;
simple example services.
Page 18

ST20–SWC
18/21
5.3 AServer features
This type of architecture offers a number of advantages:
1 The AServer handles multiple services.
A number of services may be available on one device, handled by a single gateway. For
example, new services may be added without modifying a standard server.
2 The AServer handles multiple clients.
Any process on any processor in the target hardware may open a connection to any service.
Theprocessopening the connectionis calledtheclient. Several clients may accessthe same
service. The gateway will automatically start new services as they are requested.
3 Services are easy to extend.
TheAServerenables usersto extend the set ofservicesthatare available to auser’sapplication. The AServer provides the core technology to allow users to create new services by
providing new processes. For example, the iserver service provides terminal text i/o, file
access and system services, which may be expanded by adding new AServer service
processes such as a graphics interface.
4 AServer communications can be fast and efficient.
The communications over the link between gateways use mega-packets, which make efficientuse oftheavailable bandwidth.Messagesbetween theclientandtheservice are divided
into packets of up to 1 kbyte. The packets are bundled into mega-packets to send over the
hardware serial link. Packets from differentclients andservices canbe interleaved to reduce
latency.
5 AServer communications are independent of hardware.
When an AServer connection has been established the processcan send data messages of
arbitrarylengthtothe serviceitisconnectedto,receivedatamessages ofarbitrary lengthand
disconnect from the service. The gateways are responsible for building and dividing megapackets and complying with hardware protocols.
Page 19

ST20–SWC
19/21
6 ST20 Toolset product components
6.1 Documentation
Toolset User Guide
INQUEST Debugger Tutorial
Toolset Reference Manual
Language and Libraries Reference Manual
INQUEST User and Reference Manual
Delivery Manual
AServer Programmers’ Guide
6.2 Software Tools
icc, ilink, ilibr – ANSI C compiler,linker and librarian
ilist, imap – Binary lister program and memory map lister
icconf, icollect – Configuration tools
ieprom, imem450 – EPROM and ST20450 memory interface programming tools
irun – Application loader
inquest – Interactive and post-mortem debugger
imon, iprof, iline – Execution analysis tools
AServer – Customizable host interface
6.3 Software libraries
Full ANSI library plus multi-tasking support
Reduced library for embedded systems
Run-time start-up support library
Debugging support library
AServer library
6.4 Operating requirements
6.4.1 Sun-4 Toolset
The Sun-4 ST20 Toolsetpackage willrun on a Sun-4 SPARC-basedworkstation, server or compatible, running SunOS 4.1.3 or Solaris 2.4 or later.Tosupport the graphical user interface, theenvironment mustinclude an XWindow Systemserver (X11R4or later) such as an X terminal or SPARCstation running OpenWindows 3.
The toolset is designed to operate in conjunction with an IMS B300 Ethernet Gateway acting as
interface to the ST20 development hardware, such as a ST20450 Development Board.
Page 20

ST20–SWC
20/21
6.4.2 PC Toolset
The PC ST20 Toolsetwill run on an IBM 386PC or IBM 486 PC or compatible, running MS-DOS 5.0
or compatible. To support the graphical user interface, the environment must include Microsoft
Windows 3.1.
The PC Toolsetisdesigned to operate inconjunctionwithany of thefollowing hardware development
systems or compatible hardware:
a ST20 Evaluation Board using the PC parallel port;
a ST20450 Development Board and a PC parallel port interface;
anEthernetconnection toanIMS B300 Ethernet Gateway and ST20 development hardware,
such as a ST20450 Development Board.
6.5 Distribution media
Sun-4 software is distributed on 60 MbyteQIC-241/4inch data cartridges, in tar format. PC software
is distributed on 3.5 inch high density (1.44 Mbyte) diskettes.
7 Support
ST20 development products are supported worldwide through SGS-THOMSON Sales Offices,
Regional TechnologyCenters, and authorized distributors.
8 Ordering Information
Description Order number
ST20 Toolset for 386 PC. ST20–SWC/PC
ST20 Toolset for Sun 4. ST20–SWC/SUN
Page 21

ST20–SWC
21/21
Information furnished is believed to be accurate and reliable. However, SGS-THOMSON Microelectronics assumes no responsibility for the
consequences of use of such information nor for any infringement of patents or other rights of third parties whichmay result from its use. No
license isgrantedby implication or otherwiseunderany patent or patentrights of SGS-THOMSON Microelectronics.Specifications mentioned
in this publication are subject to change without notice. This publication supersedes and replaces all information previously supplied. SGSTHOMSON Microelectronics products are not authorized for use as critical components in life support devices or systems without express
written approvalof SGS-THOMSON Microelectronics.
E 1995 SGS-THOMSON Microelectronics - All Rights Reserved
IMS and DS-Link are trademarks of SGS-THOMSON Microelectronics Limited.
is a registered trademark of the SGS-THOMSON Microelectronics Group.
X Window System is a trademark of MIT.
OSF/Motif is a trademark of the Open Software Foundation, Inc.
Windows is a trademark of Microsoft Corporation.
SGS-THOMSON Microelectronics GROUP OF COMPANIES
Australia - Brazil - France - Germany - Hong Kong - Italy - Japan - Korea - Malaysia - Malta - Morocco -
The Netherlands - Singapore - Spain - Sweden - Switzerland - Taiwan- Thailand - United Kingdom - U.S.A.
 Loading...