

Page 1

VB3xx 10G Probes
Applies to software release v5.3
Form 8046E • February 2017
Page 2

VB3xx 10G Probe User’s Manual
Revision 02da336 (2017-02-23)
Copyright
c
2017 Sencore, Inc. All rights reserved.
3200 Sencore Drive, Sioux Falls, SD USA
www.sencore.com
This publication contains confidential, proprietary, and trade secret information. No part of this document
may be copied, photocopied, reproduced, translated, or reduced to any machine-readable or electronic
format without prior written permission from Sencore. Information in this document is subject to change
without notice and Sencore Inc. assumes no responsibility or liability for any errors or inaccuracies.
Sencore, Sencore Inc, and the Sencore logo are trademarks or registered trademarks in the United
States and other countries. All other products or services mentioned in this document are identified by
the trademarks, service marks, or product names as designated by the companies who market those
products. Inquiries should be made directly to those companies. This document may also have links to
third-party web pages that are beyond the control of Sencore. The presence of such links does not imply
that Sencore endorses or recommends the content on those pages. Sencore acknowledges the use of
third-party open source software and licenses in some Sencore products. This freely available source
code can be obtained by contacting Sencore Inc.
About Sencore
Sencore is an engineering leader in the development of high-quality signal transmission solutions for the
broadcast, cable, satellite, IPTV, and telecommunications markets. The company’s world-class portfolio
includes video delivery products, system monitoring and analysis solutions, and test and measurement
equipment, all designed to support system interoperability and backed by best-in-class customer support.
Sencore products meet the rapidly changing needs of modern media by ensuring the efficient delivery
of high-quality video from the source to the home. More information about Sencore is available at the
company’s website, www.sencore.com.
All trademarks and registered trademarks mentioned herein are the property of their respective owners.
Page 3

Contents
Contents 3
Document Revision History 8
1 INTRODUCTION 9
1.1 About the 10G Probe . . . . . . . . . . . . . . . . . . . . . . . . . . . . . . . . . . . . 9
1.1.1 VB330 – Overview . . . . . . . . . . . . . . . . . . . . . . . . . . . . . . . . . 9
1.1.2 10G Probe – Functionality . . . . . . . . . . . . . . . . . . . . . . . . . . . . . 10
1.2 How to Use This Manual . . . . . . . . . . . . . . . . . . . . . . . . . . . . . . . . . . . 11
2 PRINCIPLE OF OPERATION 12
3 SAFETY 14
4 INSTALLATION AND INITIAL SETUP 15
4.1 Quick Installation Guide . . . . . . . . . . . . . . . . . . . . . . . . . . . . . . . . . . . 15
4.2 The Enhanced Chassis (VB300) . . . . . . . . . . . . . . . . . . . . . . . . . . . . . . 15
4.2.1 Dual Power Supply . . . . . . . . . . . . . . . . . . . . . . . . . . . . . . . . . 16
4.2.2 Cooling System . . . . . . . . . . . . . . . . . . . . . . . . . . . . . . . . . . . 16
4.3 The Enhanced Chassis –48V DC version (VB300-DC) . . . . . . . . . . . . . . . . . . 16
4.3.1 Dual Power Supply . . . . . . . . . . . . . . . . . . . . . . . . . . . . . . . . . 16
4.3.2 Cooling System . . . . . . . . . . . . . . . . . . . . . . . . . . . . . . . . . . . 17
4.3.3 VB300-DC Power Supply . . . . . . . . . . . . . . . . . . . . . . . . . . . . . . 17
4.4 Serial Number Location . . . . . . . . . . . . . . . . . . . . . . . . . . . . . . . . . . . 18
4.5 The Hardware Modules and Connectors . . . . . . . . . . . . . . . . . . . . . . . . . . 18
4.5.1 The VB330 Module . . . . . . . . . . . . . . . . . . . . . . . . . . . . . . . . . 18
4.6 Installing the Unit in a Rack . . . . . . . . . . . . . . . . . . . . . . . . . . . . . . . . . 19
4.6.1 Default Installation — Connectors at the Front of Rack . . . . . . . . . . . . . . 19
4.6.2 Optional Installation — Connectors at the Rear of Rack . . . . . . . . . . . . . 19
4.6.3 Optional Installation — Mid-Mounting . . . . . . . . . . . . . . . . . . . . . . . 19
4.7 Powering up the Unit . . . . . . . . . . . . . . . . . . . . . . . . . . . . . . . . . . . . . 20
4.8 Initial Configuration . . . . . . . . . . . . . . . . . . . . . . . . . . . . . . . . . . . . . . 20
4.8.1 Initial Configuration Using the Pre-Set IP-Address . . . . . . . . . . . . . . . . 20
4.8.2 Initial Configuration Via Serial Console Emulated Over USB . . . . . . . . . . . 21
4.8.3 Verifying Correct Initial Setup of the 10G Probe . . . . . . . . . . . . . . . . . . 24
VB3xx 10G Probe User’s Manual version 5.3 3
Page 4

4.8.4 Initial Setup Troubleshooting . . . . . . . . . . . . . . . . . . . . . . . . . . . . 24
5 QUICK SETUP GUIDE 26
5.1 Basic Setup . . . . . . . . . . . . . . . . . . . . . . . . . . . . . . . . . . . . . . . . . . 26
5.2 Input Signal Definitions . . . . . . . . . . . . . . . . . . . . . . . . . . . . . . . . . . . 26
5.2.1 Multicasts . . . . . . . . . . . . . . . . . . . . . . . . . . . . . . . . . . . . . . 26
5.2.2 OTT Input (OTT Engine Option Only) . . . . . . . . . . . . . . . . . . . . . . . 27
5.3 Monitoring . . . . . . . . . . . . . . . . . . . . . . . . . . . . . . . . . . . . . . . . . . 27
5.4 Adjusting Alarm Thresholds . . . . . . . . . . . . . . . . . . . . . . . . . . . . . . . . . 27
6 THE 10G PROBE GRAPHICAL USER INTERFACE 30
6.1 Main . . . . . . . . . . . . . . . . . . . . . . . . . . . . . . . . . . . . . . . . . . . . . 32
6.1.1 Main — Summary . . . . . . . . . . . . . . . . . . . . . . . . . . . . . . . . . . 32
6.1.2 Main — CPU usage . . . . . . . . . . . . . . . . . . . . . . . . . . . . . . . . . 35
6.1.3 Main — Thumb overview . . . . . . . . . . . . . . . . . . . . . . . . . . . . . . 36
6.1.4 Main — Eii graphing . . . . . . . . . . . . . . . . . . . . . . . . . . . . . . . . . 37
6.2 Alarms . . . . . . . . . . . . . . . . . . . . . . . . . . . . . . . . . . . . . . . . . . . . 39
6.2.1 Alarms — All Alarms . . . . . . . . . . . . . . . . . . . . . . . . . . . . . . . . 40
6.2.2 Alarms — Alarm setup . . . . . . . . . . . . . . . . . . . . . . . . . . . . . . . 41
6.2.3 Alarms — Flash Alarms (FLASH option) . . . . . . . . . . . . . . . . . . . . . . 47
6.3 OTT (Option) . . . . . . . . . . . . . . . . . . . . . . . . . . . . . . . . . . . . . . . . . 48
6.3.1 OTT — Active testing . . . . . . . . . . . . . . . . . . . . . . . . . . . . . . . . 48
6.3.2 OTT — Details . . . . . . . . . . . . . . . . . . . . . . . . . . . . . . . . . . . 49
6.3.2.1 OTT — Details — Profiles . . . . . . . . . . . . . . . . . . . . . . . . 50
6.3.2.2 OTT — Details — Manifest . . . . . . . . . . . . . . . . . . . . . . . 52
6.3.2.3 OTT — Details — Alarms . . . . . . . . . . . . . . . . . . . . . . . . 54
6.3.2.4 OTT — Details — Thumbnails . . . . . . . . . . . . . . . . . . . . . 55
6.3.2.5 OTT — Details — Alignment . . . . . . . . . . . . . . . . . . . . . . 56
6.3.3 OTT — Latency . . . . . . . . . . . . . . . . . . . . . . . . . . . . . . . . . . . 58
6.3.4 OTT — Channels . . . . . . . . . . . . . . . . . . . . . . . . . . . . . . . . . . 59
6.3.5 OTT — Settings . . . . . . . . . . . . . . . . . . . . . . . . . . . . . . . . . . . 62
6.3.6 OTT — Thresholds . . . . . . . . . . . . . . . . . . . . . . . . . . . . . . . . . 62
6.4 Multicasts . . . . . . . . . . . . . . . . . . . . . . . . . . . . . . . . . . . . . . . . . . . 64
6.4.1 Multicasts — Parameters . . . . . . . . . . . . . . . . . . . . . . . . . . . . . . 64
6.4.2 Multicasts — Parameters — Fields . . . . . . . . . . . . . . . . . . . . . . . . . 75
6.4.3 Multicasts — Summary . . . . . . . . . . . . . . . . . . . . . . . . . . . . . . . 76
6.4.4 Multicasts — History . . . . . . . . . . . . . . . . . . . . . . . . . . . . . . . . 77
6.4.5 Multicasts — Join . . . . . . . . . . . . . . . . . . . . . . . . . . . . . . . . . . 79
6.4.6 Multicasts — Streams . . . . . . . . . . . . . . . . . . . . . . . . . . . . . . . . 80
6.4.7 Multicasts — Ethernet thresh. . . . . . . . . . . . . . . . . . . . . . . . . . . . 85
6.5 MW (Media Window) . . . . . . . . . . . . . . . . . . . . . . . . . . . . . . . . . . . . . 87
6.5.1 Media Window — Selected channel . . . . . . . . . . . . . . . . . . . . . . . . 89
6.5.2 Media Window — Bandwidth graph . . . . . . . . . . . . . . . . . . . . . . . . 90
6.5.3 Media Window — Inter Arrival Time graph . . . . . . . . . . . . . . . . . . . . . 90
6.6 RDP (Return Data Path) . . . . . . . . . . . . . . . . . . . . . . . . . . . . . . . . . . . 91
6.6.1 RDP — Control . . . . . . . . . . . . . . . . . . . . . . . . . . . . . . . . . . . 91
4 VB3xx 10G Probe User’s Manual version 5.3
Page 5

6.6.2 RDP — Setup . . . . . . . . . . . . . . . . . . . . . . . . . . . . . . . . . . . . 92
6.7 Traffic . . . . . . . . . . . . . . . . . . . . . . . . . . . . . . . . . . . . . . . . . . . . . 94
6.7.1 Traffic — Protocols . . . . . . . . . . . . . . . . . . . . . . . . . . . . . . . . . 94
6.7.2 Traffic — Detect . . . . . . . . . . . . . . . . . . . . . . . . . . . . . . . . . . . 96
6.7.3 Traffic — Filter statistics . . . . . . . . . . . . . . . . . . . . . . . . . . . . . . . 97
6.7.4 Traffic — Filter setup . . . . . . . . . . . . . . . . . . . . . . . . . . . . . . . . 100
6.7.5 Traffic — Microbitrate . . . . . . . . . . . . . . . . . . . . . . . . . . . . . . . . 102
6.8 Ethernet . . . . . . . . . . . . . . . . . . . . . . . . . . . . . . . . . . . . . . . . . . . 103
6.8.1 Ethernet — FSM . . . . . . . . . . . . . . . . . . . . . . . . . . . . . . . . . . 103
6.8.1.1 Ethernet — FSM — Monitor . . . . . . . . . . . . . . . . . . . . . . . 104
6.8.1.2 Ethernet — FSM — Setup . . . . . . . . . . . . . . . . . . . . . . . 105
6.8.1.3 Ethernet — FSM — Syslog . . . . . . . . . . . . . . . . . . . . . . . 107
6.8.2 Ethernet — IGMP . . . . . . . . . . . . . . . . . . . . . . . . . . . . . . . . . . 108
6.8.3 Ethernet — PCAP . . . . . . . . . . . . . . . . . . . . . . . . . . . . . . . . . . 109
6.9 ETR 290 (Option) . . . . . . . . . . . . . . . . . . . . . . . . . . . . . . . . . . . . . . 110
6.9.1 ETR 290 — ETR Overview . . . . . . . . . . . . . . . . . . . . . . . . . . . . . 111
6.9.2 ETR 290 — ETR Details . . . . . . . . . . . . . . . . . . . . . . . . . . . . . . 112
6.9.3 ETR 290 — PIDs . . . . . . . . . . . . . . . . . . . . . . . . . . . . . . . . . . 114
6.9.4 ETR 290 — Services . . . . . . . . . . . . . . . . . . . . . . . . . . . . . . . . 116
6.9.5 ETR 290 — Bitrates . . . . . . . . . . . . . . . . . . . . . . . . . . . . . . . . . 119
6.9.6 ETR 290 — Tables . . . . . . . . . . . . . . . . . . . . . . . . . . . . . . . . . 120
6.9.7 ETR 290 — PCR . . . . . . . . . . . . . . . . . . . . . . . . . . . . . . . . . . 123
6.9.8 ETR 290 — T2MI (requires T2MI-OPT) . . . . . . . . . . . . . . . . . . . . . . 125
6.9.9 ETR 290 — SCTE 35 (requires SCTE35-OPT) . . . . . . . . . . . . . . . . . . 129
6.9.10 ETR 290 — Status . . . . . . . . . . . . . . . . . . . . . . . . . . . . . . . . . 131
6.9.11 ETR 290 — Compare . . . . . . . . . . . . . . . . . . . . . . . . . . . . . . . . 132
6.9.12 ETR 290 — ETR thr. . . . . . . . . . . . . . . . . . . . . . . . . . . . . . . . . 136
6.9.13 ETR 290 — PID thresh. . . . . . . . . . . . . . . . . . . . . . . . . . . . . . . . 148
6.9.14 ETR 290 — Service thresh. . . . . . . . . . . . . . . . . . . . . . . . . . . . . 151
6.9.15 ETR 290 — Gold TS thresholds . . . . . . . . . . . . . . . . . . . . . . . . . . 154
6.10 Setup . . . . . . . . . . . . . . . . . . . . . . . . . . . . . . . . . . . . . . . . . . . . . 160
6.10.1 Setup — Params . . . . . . . . . . . . . . . . . . . . . . . . . . . . . . . . . . 160
6.10.2 Setup — Pages . . . . . . . . . . . . . . . . . . . . . . . . . . . . . . . . . . . 162
6.10.3 Setup — Colors (requires EXTRACT-OPT) . . . . . . . . . . . . . . . . . . . . 162
6.10.4 Setup — Time . . . . . . . . . . . . . . . . . . . . . . . . . . . . . . . . . . . . 163
6.10.5 Setup — Ethernet . . . . . . . . . . . . . . . . . . . . . . . . . . . . . . . . . . 164
6.10.5.1 Setup — Ethernet — IPv6 Settings . . . . . . . . . . . . . . . . . . . 165
6.10.5.2 Example 1 – Separate Management IPv4 . . . . . . . . . . . . . . . 167
6.10.5.3 Example 2 – In-Line Management IPv4 . . . . . . . . . . . . . . . . 167
6.10.5.4 Example 3 – Mixed Mode IPv4 . . . . . . . . . . . . . . . . . . . . . 168
6.10.6 Setup — VLANs . . . . . . . . . . . . . . . . . . . . . . . . . . . . . . . . . . . 168
6.10.7 Setup — VBC . . . . . . . . . . . . . . . . . . . . . . . . . . . . . . . . . . . . 169
6.10.8 Setup — Login . . . . . . . . . . . . . . . . . . . . . . . . . . . . . . . . . . . 170
6.10.9 Setup — ETR . . . . . . . . . . . . . . . . . . . . . . . . . . . . . . . . . . . . 171
6.10.9.1 Parsing rules for private descriptors . . . . . . . . . . . . . . . . . . 171
VB3xx 10G Probe User’s Manual version 5.3 5
Page 6

6.10.9.2 ETR 290 tuning control . . . . . . . . . . . . . . . . . . . . . . . . . 172
6.10.9.3 ETR details . . . . . . . . . . . . . . . . . . . . . . . . . . . . . . . 172
6.10.9.4 EIT table IDs . . . . . . . . . . . . . . . . . . . . . . . . . . . . . . . 172
6.10.9.5 Inactive inputs . . . . . . . . . . . . . . . . . . . . . . . . . . . . . . 173
6.10.10 Setup — VBC thresh. . . . . . . . . . . . . . . . . . . . . . . . . . . . . . . . . 173
6.10.11 Setup — Scheduling . . . . . . . . . . . . . . . . . . . . . . . . . . . . . . . . 176
6.10.12 Setup — Routing . . . . . . . . . . . . . . . . . . . . . . . . . . . . . . . . . . 177
6.10.13 Setup — Security . . . . . . . . . . . . . . . . . . . . . . . . . . . . . . . . . . 178
6.11 Data . . . . . . . . . . . . . . . . . . . . . . . . . . . . . . . . . . . . . . . . . . . . . . 180
6.11.1 Data — Configuration . . . . . . . . . . . . . . . . . . . . . . . . . . . . . . . . 180
6.11.2 Data — Software . . . . . . . . . . . . . . . . . . . . . . . . . . . . . . . . . . 181
6.11.3 Data — Table Descriptors . . . . . . . . . . . . . . . . . . . . . . . . . . . . . . 182
6.11.4 Data — Eii . . . . . . . . . . . . . . . . . . . . . . . . . . . . . . . . . . . . . . 183
6.11.5 Data — Storage (FLASH option) . . . . . . . . . . . . . . . . . . . . . . . . . . 184
6.12 About . . . . . . . . . . . . . . . . . . . . . . . . . . . . . . . . . . . . . . . . . . . . . 185
6.12.1 About — Release info . . . . . . . . . . . . . . . . . . . . . . . . . . . . . . . . 185
6.12.2 About — License . . . . . . . . . . . . . . . . . . . . . . . . . . . . . . . . . . 186
6.12.3 About — Technologies . . . . . . . . . . . . . . . . . . . . . . . . . . . . . . . 187
6.12.4 About — Credits . . . . . . . . . . . . . . . . . . . . . . . . . . . . . . . . . . . 187
A Appendix: VB330 Versus VBC Alarms 188
B Appendix: Monitoring Practices 189
B.1 RTP Monitoring . . . . . . . . . . . . . . . . . . . . . . . . . . . . . . . . . . . . . . . . 189
B.2 Default Multicst Monitoring . . . . . . . . . . . . . . . . . . . . . . . . . . . . . . . . . . 189
B.3 Strategy for MediaWindow Analysis . . . . . . . . . . . . . . . . . . . . . . . . . . . . . 191
B.3.1 IAT Before and After Router . . . . . . . . . . . . . . . . . . . . . . . . . . . . 192
B.3.2 Identifying UDP Packet Loss . . . . . . . . . . . . . . . . . . . . . . . . . . . . 193
B.4 Multicast Thresholds . . . . . . . . . . . . . . . . . . . . . . . . . . . . . . . . . . . . . 194
B.5 Dedicated interface for OTT . . . . . . . . . . . . . . . . . . . . . . . . . . . . . . . . . 194
B.6 OTT Bandwidth requirements . . . . . . . . . . . . . . . . . . . . . . . . . . . . . . . . 194
C Appendix: OTT Profile Health 195
C.1 OTT Profile Health Bar . . . . . . . . . . . . . . . . . . . . . . . . . . . . . . . . . . . . 195
C.2 OTT Profile Health Timeline . . . . . . . . . . . . . . . . . . . . . . . . . . . . . . . . . 196
D Appendix: Software Maintenance 197
E Appendix: Software Upload 198
E.1 Obtain the software image . . . . . . . . . . . . . . . . . . . . . . . . . . . . . . . . . . 198
E.2 Export and save the probe configuration . . . . . . . . . . . . . . . . . . . . . . . . . . 198
E.3 Delete any existing probe stream recordings . . . . . . . . . . . . . . . . . . . . . . . . 198
E.4 Transfer the image to the probe and save to flash . . . . . . . . . . . . . . . . . . . . . 199
E.5 Wait while the software is being saved . . . . . . . . . . . . . . . . . . . . . . . . . . . 201
E.6 Verify the new image . . . . . . . . . . . . . . . . . . . . . . . . . . . . . . . . . . . . . 201
E.7 Software upload troubleshooting . . . . . . . . . . . . . . . . . . . . . . . . . . . . . . 201
6 VB3xx 10G Probe User’s Manual version 5.3
Page 7

F Appendix: Restoring probe factory defaults 203
VB3xx 10G Probe User’s Manual version 5.3 7
Page 8

Document Revision History
Date Version Description
February 2017 5.3 Updated manual to reflect changes in v5.3 software
March 2016 5.2 Updated manual to reflect changes in v5.2 software
February 2015 5.1 Updated manual to reflect changes in v5.1 software
January 2014 5.0 Updated manual to reflect changes in v5.0 software
8 VB3xx 10G Probe User’s Manual version 5.3
Page 9

1 INTRODUCTION
SUPER HEADEND
CORE NETWORK REGIONAL METRO NETWOR K
RG
STB
PHONE PADTV
PC
ACCESS NETWORK
DSLAM OR
FIBRE
AGGREGATION
VB330 PROBE
VB288 CONTENT EXTRACTOR
VB330 PROBE
VB330 PROBE
VB220 PROBE
microVB™
HOME NETWORK
MDC
– MicroDEVICE Controller
™
VBC
– VideoBRIDGE Controller
™
Remote Video Wall – Site 1
DIGITAL TERRESTRIAL
REGIONAL MUX AND COFDM MODULATOR
IP
GPS
COFDM
RF
ASI
CABLE DISTRIBUTION
REGIONAL MONITORING OF SATELLITE AND IP
IP ASI QPSK/
DVB-S/S2
DIGITAL SATELLITE
REGIONAL MUX AND QAM MODULATOR
IP ASI QAM
REGIONAL
CABLE
NETWORK
VB120 PROBE & VB252 DVB-T/T2 MODULEVB120 PROBE & VB272 QPSK/DVB-S/S2 MODULE
VB12-RF PROBE
VB120 PROBE & VB262 QAM/VSB DVB-C MODULE
1.1 About the 10G Probe
1.1.1 VB330 – Overview
The VB330 10G Probe was made specifically for IPTV backbone network monitoring. Equipped with two
10G SFP+ optical Ethernet inputs, the 10G Probe provides detailed IP packet monitoring of a very high
number of Ethernet streams, suitable for core networks carrying extreme amounts of media signals.
The OTT software option is available on the VB330 and enables monitoring of up to 500 adaptive bitrate
channels in steps of 5 or 50 (Bulk OTT option) OTT engines depending on licensing.
A built-in web server in the VB330 allows remote signal monitoring using a standard web browser. This
can be managed either through a separate Ethernet network, or by using the regular video/data network
– both IPv4 and IPv6 are supported.
The VB330 10G Probe can also be managed via the VideoBRIDGE Controller. The VideoBRIDGE
Controller will add management features like alarm aggregation and report functionality.
The VB330 10G Probe is a module housed in a 1 RU chassis. Several VB330 modules may be installed
in one chassis, extending the monitoring capacity.
Note: The VB330 does not support RF modules such as VB242, VB252, VB262, and VB272.
VB3xx 10G Probe User’s Manual version 5.3 9
Page 10
1.1.2 10G Probe – Functionality
An IP-based network is fully transparent with respect to signal contents quality, provided that the IP
packets arrive, and provided that they arrive in time. The 10G Probe therefore uses the patented
MediaWindow to allow monitoring at-a-glance of packet loss and errors in inter-packet arrival time. This
way the operator can conveniently ensure correct signal quality at IP-level.
The advanced Ethernet protocol analysis tool automatically detects all protocols carried over Ethernet
past the port the 10G Probe is connected to, and it displays statistics like percentage utilization of the
interface and percentage of the different transported protocols. This gives the 10G Probe a real-time
sniffer capability.
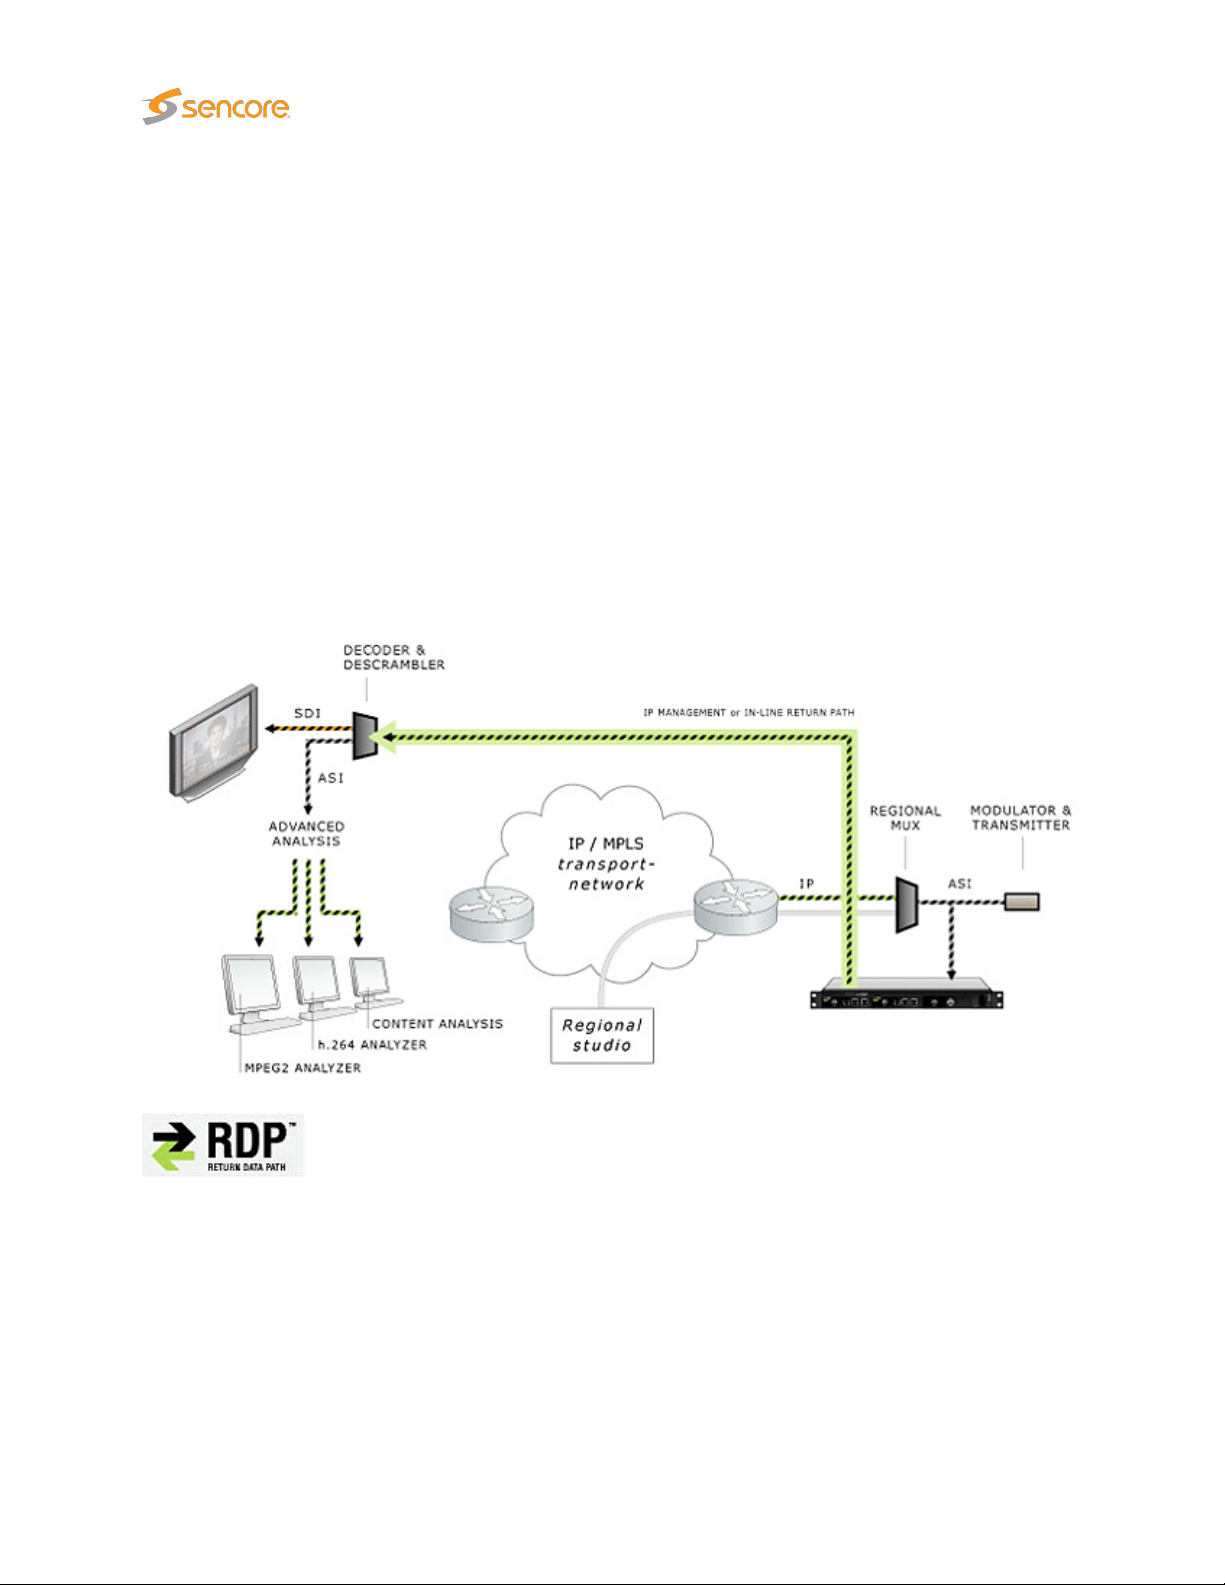
The 10G Probe allows the user to define a Return Data Path (RDP), using the regular video/data network
or the management network to return a stream. A faulty signal can then be further analyzed at the studio
premises, when necessary.
The recording functionality allows the user to record a stream, either triggered manually by the user or
triggered by a user defined alarm.
Full Service Monitoring (FSM) checks that vital system components like CA-servers are active.
Optional Ethernet TR 290 monitoring allows the operator to check parameters like transport stream sync
and PSI/SI standards conformity. This option also performs further PSI/SI analysis, making it possible to
view PSI/SI contents. PID and service bitrates are also continuously measured.
Optional OTT monitoring allows the operator to set up active testing of Over-the-top type signals as
found in adaptive bitrate streaming architectures. Formats supported include AppleTMHLS, Microsoft
Smoothstream, RTMP, MPEG DASH, AdobeTMHDS and Nullsoft SHOUTcastTM.
TM
10 VB3xx 10G Probe User’s Manual version 5.3
Page 11

The 10G Probe can be expanded through licence options to monitor the T2MI protocol layer as found in
DVB-T2 networks.
The 10G Probe can also be licensed with an SCTE 35 option that allows monitoring and logging of splice
time codes embedded in the transport streams.
1.2 How to Use This Manual
This User’s Manual is valid for software version 5.3 of the VB330 10G Probe.
Throughout this manual the term stream is often used rather than unicast or multicast. One stream may
consist of one or more services, and refers to one IP uni- or multicast.
Chapter 2 PRINCIPLE OF OPERATION provides a simplified block-diagram overview of the probe.
Chapter 3 SAFETY lists safety precautions, and this chapter should be read prior to equipment installation.
Chapter 4 INSTALLATION AND INITIAL SETUP explains how to install the equipment in a rack, and
also how to perform the necessary initial configuration of the 10G Probe management IP address. A
step-by-step quick installation guide is found in section 4.1.
Chapter 5 QUICK SETUP GUIDE contains a quick setup guide; a step-by-step description of how to
setup the 10G Probe once the initial setup has been performed.
Chapter 6 THE 10G PROBE GRAPHICAL USER INTERFACE describes the graphical user interface
(GUI) as seen when pointing a web browser to the 10G Probe’s IP address.
A Appendix: VB330 Versus VBC Alarms describes the alarm handling in the 10G Probe versus the
VideoBRIDGE Controller.
B Appendix: Monitoring Practices explains some useful monitoring practices.
C Appendix: OTT Profile Health explains the OTT profile health bar and timeline.
D Appendix: Software Maintenance briefly describes software maintenance licenses and how they are
used.
E Appendix: Software Upload explains how to upgrade the software on the 10G Probe.
F Appendix: Restoring probe factory defaults details how to reset the 10G Probe to factory default
settings.
Note that current version of the User’s Manual can be obtained from Sencore ProCare support by
emailing procare@sencore.com.
VB3xx 10G Probe User’s Manual version 5.3 11
Page 12

2 PRINCIPLE OF OPERATION
The VB330 module is equipped with two SFP+ optical ports and one RJ45 Ethernet port. The user
selects which transport stream signal input to be used by the monitoring engine. Management of the
probe is conducted via the Ethernet management port or alternatively in-band via the video/data ports.
VB330 Module
Ethernet Management
SNMP Traps
SFP+ B main port
Monitoring Engine
SFP+ A (optional port)
Figure 2.1: The VB330 Module – Principle of Operation
A simplified diagram of the alarm handling mechanisms of the 10G Probe is shown in figure 2.2. The
input signals are continuously analyzed, and measured data are checked against user defined threshold
values. If the data do not comply with the threshold values alarms will be generated. The overall alarm
settings further make it possible to enable and disable alarms, thus defining which alarms should be
reported in the 10G Probe alarm list and sent as SNMP traps to an external management system.
12 VB3xx 10G Probe User’s Manual version 5.3
Page 13

Signal
Measurements
Threshold
Settings
Alarm
Settings
SNMP
Alarms
Alarm
Lists
Figure 2.2: Simplified Diagram of the Alarm Handling in the 10G Probe
VB3xx 10G Probe User’s Manual version 5.3 13
Page 14

3 SAFETY
Read the installation instructions before connecting the chassis unit to the power source. Do
not install the chassis unit with power on.
The chassis is intended for installation in restricted access areas. A restricted access area can
be accessed only through the use of a special tool, lock and key, or other means of security.
Blank face plates and cover panels serve three important functions: they prevent exposure to
hazardous voltages and currents inside the chassis, they provide electromagnetic interference
shielding and they direct the flow of cooling air through the chassis. Do not operate the chassis
unit unless all modules, face plates, front covers and rear covers are in place.
Only trained and qualified personnel should be allowed to install, replace or service this equipment.
This equipment must be installed and maintained by service personnel as defined by AS/NZS
3260. Incorrectly connecting this equipment to a general-purpose outlet could be hazardous.
The 10G Probe is shipped with an SX SFP+ module that is equipped with a Class 1 laser. Do not
stare into open optical ports. Note that if the SFP+ module is replaced special precautions may
have to be taken – refer to the manufacturer’s instructions. SFP+ modules are static sensitive
devices, and ESD-preventive measures should be taken when handling them, to avoid damage.
Ultimate disposal of this product should be handled according to all national laws and regulations.
To prevent the system from overheating, do not operate it in an area that exceeds the maximum
ambient temperature of 45 degrees Celsius.
Do not work on the system or connect or disconnect cables during periods of lightning activity.
The chassis requires short-circuit (overcurrent) protection. Ensure that the protective device is
rated not greater than 120 VAC, 15 A; 240 VAC, 16 A; 60 VDC, 20 A.
14 VB3xx 10G Probe User’s Manual version 5.3
Page 15

4 INSTALLATION AND INITIAL SETUP
4.1 Quick Installation Guide
1. Read the safety instructions, refer to chapter 3
2. Install the unit in a 19 inch rack for rack mount probes, refer to section 4.6
3. Connect the signal cables, refer to section 4.5
4. Power up the unit, refer to section 4.7
5. Perform initial set-up of IP addresses, refer to section 4.8
6. Verify that the GUI launches correctly, refer to section 4.8.3
4.2 The Enhanced Chassis (VB300)
The 1RU Enhanced Chassis can house a maximum of2modules, and it is equipped with two 100–240V
AC 75W power supplies. The unit is forced air ventilated, the air flow going from front to back. The
maximum power consumption of the chassis with optional modules is 75W. By default all connectors are
located at the front of the unit. The power plugs are located at the rear of the unit. The rack ears of the
chassis may be moved to provide for mid or rear mounting of the unit. The rack ears are designed to
support the weight of the unit.
Figure 4.1: The Enhanced Chassis with probe boards installed
VB3xx 10G Probe User’s Manual version 5.3 15
Page 16

4.2.1 Dual Power Supply
The Enhanced Chassis (VB300) is delivered with two 100–240V AC / 75W power supplies, providing
power redundancy. In normal operation load is shared between the two power supplies. If mains fall-out
occurs for one of the power sources or one of the power supplies fails, the power supply still in operation
will take the full load, seamlessly. This means that monitoring operation will not be affected if one of the
power sources fails.
4.2.2 Cooling System
The chassis is equipped with six long-life fans that suck in air from front of the chassis. The air exits at the
back of the unit. The fans are temperature controlled, allowing them to run at an optimum speed. Venting
holes at the sides of the chassis provide an optional air intake, ensuring good aerodynamical properties
of the cooling air flow. It is recommended, but not essential, that these venting holes are not covered.
4.3 The Enhanced Chassis –48V DC version (VB300-DC)
The 1RU Enhanced Chassis can house a maximum of2modules, and it is equipped with two –48V DC
75W power supplies. The unit is forced air ventilated, the air flow going from front to back. The maximum
power consumption of the chassis with optional modules is 75W. By default all connectors are located at
the front of the unit. The power plugs are located at the rear of the unit. The rack ears of the chassis
may be moved to provide for mid or rear mounting of the unit. The rack ears are designed to support the
weight of the unit.
4.3.1 Dual Power Supply
Figure 4.2: VB300-DC rear: two –48V DC connectors located on the the right
The Enhanced Chassis (VB300-DC) is delivered with two –48V DC / 75W power supplies, providing
power redundancy. Each VB300-DC unit consists of a 1RU chassis with2option slots. In normal
operation load is shared between the two power supplies. If mains fall-out occurs for one of the power
sources or one of the power supplies fails, the power supply still in operation will take the full load,
seamlessly. This means that monitoring operation will not be affected if one of the power sources fails.
16 VB3xx 10G Probe User’s Manual version 5.3
Page 17

4.3.2 Cooling System
The chassis is equipped with six long-life fans that suck in air from front of the chassis. The air exits at the
back of the unit. The fans are temperature controlled, allowing them to run at an optimum speed. Venting
holes at the sides of the chassis provide an optional air intake, ensuring good aerodynamical properties
of the cooling air flow. It is recommended, but not essential, that these venting holes are not covered.
4.3.3 VB300-DC Power Supply
The VB300-DC unit is equipped with two –48V DC / 50W power inlet connectors. The power plug is a
male 3-PIN D-sub(15) connector. Matching female plugs are supplied with the VB300-DC unit. This plug
should be soldered to the power cable in accordance with the drawing in figure 4.4.
Figure 4.3: The VB200-DC Power connector on the chassis
Figure 4.4: Soldering the Female 3-PIN D-sub(15) Connector to the Power Cable
VB3xx 10G Probe User’s Manual version 5.3 17
Page 18

4.4 Serial Number Location
The serial number of the Enhanced Chassis is located at the rear of the unit. The serial numbers of the
individual optional modules are located on the components side of the modules. All serial numbers can
also be found on the shipping box.
All modules except the demodulator interface modules have a serial number that is available via the web
GUI under About License.
4.5 The Hardware Modules and Connectors
4.5.1 The VB330 Module
The VB330 module is equipped with the following connectors:
SYNC: 1PPS input (for future use)
USB: USB serial port emulator for initial set-up of the probe – Type A
MANAGEMENT:
SFP+ A: SFP+ optical interface (optional interface not enabled by default)
SFP+ B: SFP+ optical interface – main data input.
A number of LEDs serve the following purposes:
PWR: Green power LED
For optionally running management of the probe on a separate network – RJ-45.
This interface supports 10/100/1000T.
The VB330 module’s SFP+ B port is shipped with an SR (short range) SFP+
module. This should be replaced if the system requires a different SFP+ module,
e.g. for use with single mode fibre. Note that using other SFP+ modules than the
type shipped may imply that special safety precautions must be taken, like using
protective glasses. Refer to the manufacturer for instructions.
18 VB3xx 10G Probe User’s Manual version 5.3
Page 19

STAT: Green status LED for future use
MANAGEMENT:
LINK: Green LED indicating SFP link status
ACT: Green LED indicating SFP activity (traffic)
The green LEDs indicate link and activity. A blinking LED indicates activity, whereas
a steadily lit LED indicates link without activity (traffic). If the left LED is active the
speed is 10/100Mbps, the right LED indicates 1000Mbps.
4.6 Installing the Unit in a Rack
The following equipment is needed for hardware installation of the unit:
• 4 rack screws
• A screw driver for the rack screws
• For rear mounting: a size 2 Phillips screwdriver for rack ear screws
4.6.1 Default Installation — Connectors at the Front of Rack
By default the Enhanced chassis is shipped with rack ears for front mounting of the unit. The rack ears
are designed to support the weight of the unit, so no additional support, like a rack shelf, is needed.
When deciding where to locate the unit, make sure there is sufficient space surrounding the unit to allow
efficient cooling, refer to section 4.2.2.
Use four rack screws to install the unit in the rack.
4.6.2 Optional Installation — Connectors at the Rear of Rack
For rear mounting of the chassis, the rack ears should be moved prior to rack installation. Unscrew the
six size 2 Phillips screws holding the rack ears, and move the six screws covering the rear mounting
holes to the front mounting holes. Remount the rack ears at the rear end of the unit.
Install the unit as described in section 4.6.1.
4.6.3 Optional Installation — Mid-Mounting
The Enhanced Chassis allows rack ears to be mid-mounted. This can be convenient if the chassis is
installed in a telco environment. Unscrew the six size 2 Phillips screws holding the rack ears, and move
VB3xx 10G Probe User’s Manual version 5.3 19
Page 20

the six screws covering the mid mounting holes to the front mounting holes. Remount the rack ears at
the middle of the unit.
Figure 4.5: Rack Ears Mounting – Side View of Enhanced Chassis Showing Screw Holes
4.7 Powering up the Unit
Once the chassis is securely mounted and signal cables are connected, it can be powered up by
connecting the power cable to a mains source. When the power cable is connected the power LEDs of
the individual optional modules should light up and the chassis fans should operate.
Note that it will take some time from power-up until the modules can be accessed via the management
interface – typically the start-up may take up to two minutes.
4.8 Initial Configuration
There are two alternative ways of performing an initial configuration of the probe module:
1. By using the preconfigured IP address of the probe management port
2. Via serial console emulated over USB
For most users the first method will be the easiest.
Note that if there are two 10G Probe modules in the chassis, each module should be configured
individually, one by one.
4.8.1 Initial Configuration Using the Pre-Set IP-Address
The 10G Probe modules are shipped with the following factory settings:
Management (eth1) IP address: 10.0.20.101
Management (eth1) subnet mask: 255.255.0.0
In order to connect to the eth1 management port, the PC used for set-up should have corresponding
20 VB3xx 10G Probe User’s Manual version 5.3
Page 21

Figure 4.6: Setting the IP address manually in Windows
network settings. Typically a lap-top PC is used for initial configuration. Connect directly to the device’s
eth2 management port using an Ethernet cable.
For Windows, the network parameters are set in the
work and Sharing Center — Network Connection — Properties — Internet Protocol Version 4
Properties
10.0.20.100 and the subnet mask to 255.255.0.0.
When the IP address of the PC has been set to match the VB330 factory setting, the permanent network
settings can be configured through the VB330 web browser interface. Refer to sections 4.8.3 and 6.10.5
for details on how to launch the VB330 graphical user interface and how to set the network parameters.
view, as shown in figure 4.6. Select the user defined address, and set the PC’s IP address to
Control Panel — Network and Internet — Net-
4.8.2 Initial Configuration Via Serial Console Emulated Over USB
If the 10G Probe for some reason cannot be reached through Ethernet communication, the initial set-up
may be performed via serial console emulated over USB. For the initial set-up, you must do the following:
1. Installing a driver for the USB communication, if not already supported by the operating system
2. Setting the management IP address
VB3xx 10G Probe User’s Manual version 5.3 21
Page 22
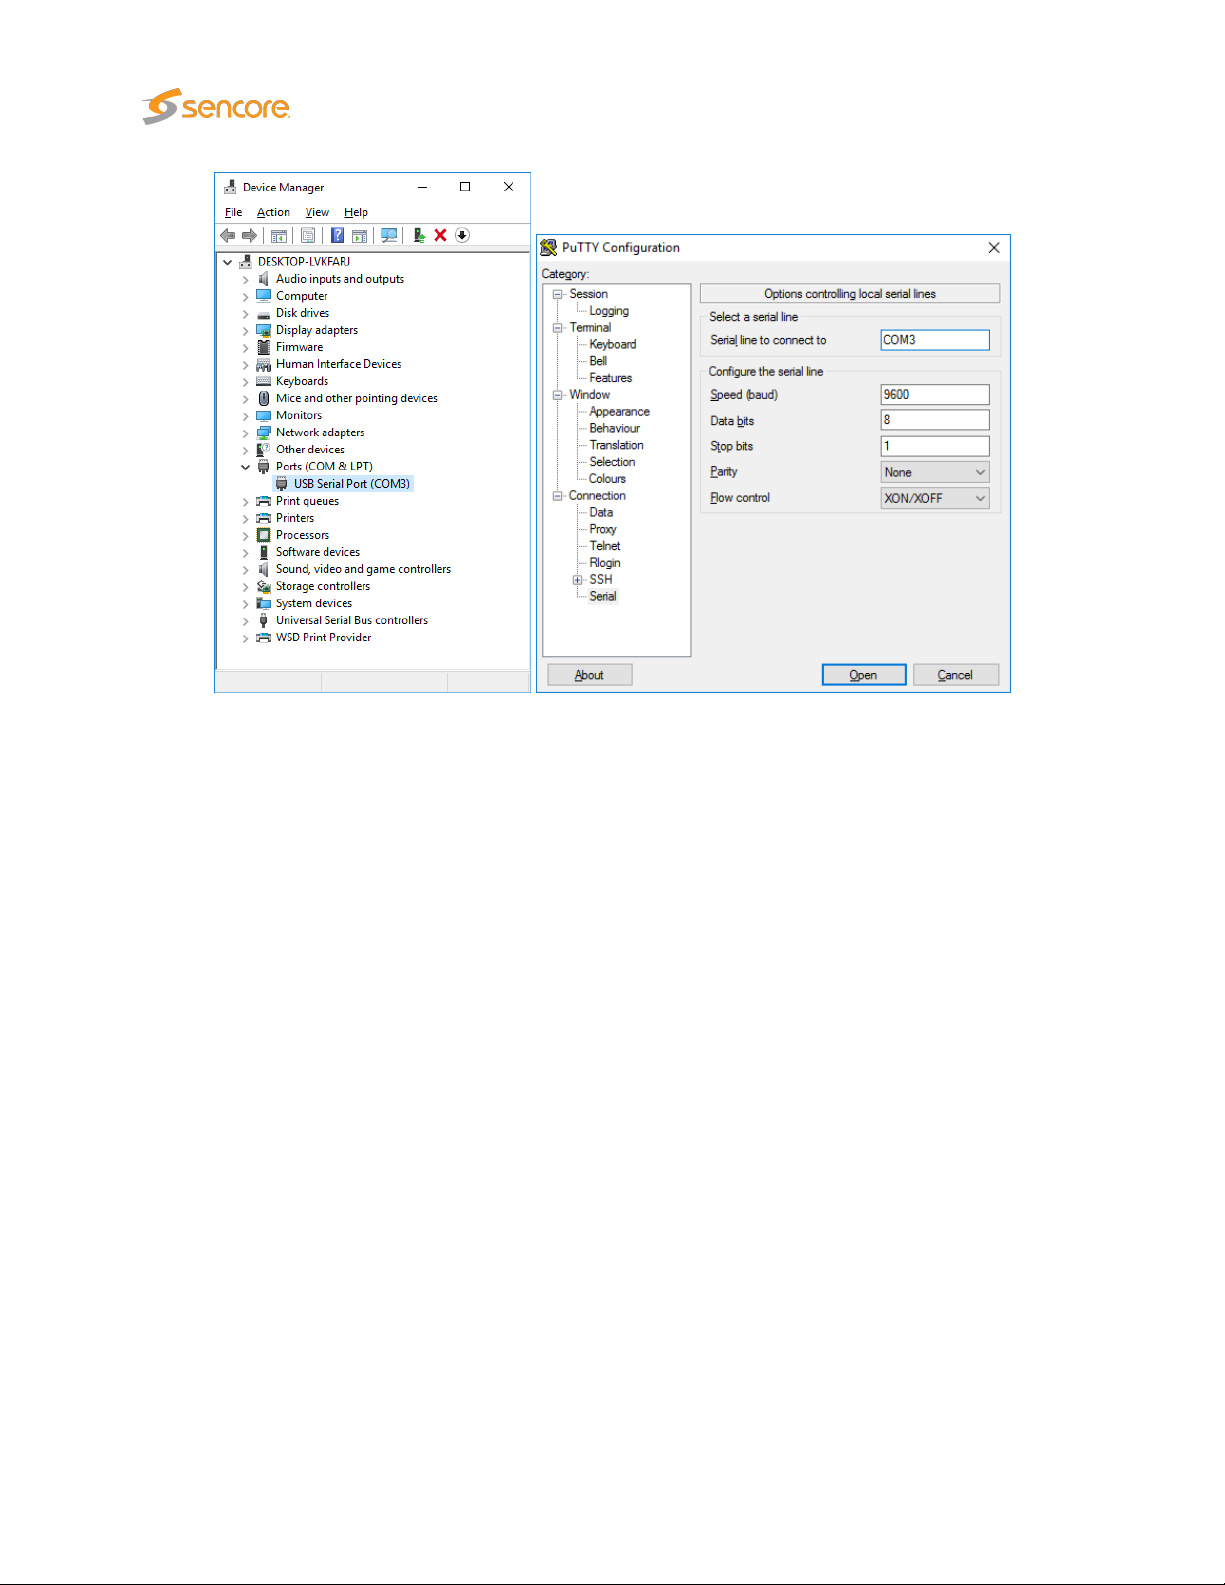
Figure 4.7: Connecting to the serial console over USB
Most operating systems will have native support for the FT232 driver needed. When a USB cable is
connected between a PC and the 10G Probe, the operating system will detect a new USB device. For
Windows, the new device will appear as a COM port in the
If your operating system does not detect the probe, you may have to download and install a driver for
it. The driver may be downloaded directly from the chip manufacturer at
Select first Drivers, then VCP followed by the operating system (VCP is short for Virtual COM Port).
If it is not already connected, connect the USB cable between the USB port on the probe and a USB port
on the PC.
Start a terminal program. Windows XP users can use Hyperterm, Linux users can use minicom. For
modern versions of Windows, that do not ship with a terminal program, the free application
be downloaded from http://www.chiark.greenend.org.uk/~sgtatham/putty/.
Select the new COM port that should appear as the USB cable is plugged in (Linux users should check
/var/log/messages to see what device to use) and establish a serial connection to the 10G Probe using
these communication parameters:
Device Manager
http://www.ftdichip.com/
view as shown in figure 4.7.
PuTTY
may
• Baud rate: 9600
.
• Data bits: 8
• Parity: None
22 VB3xx 10G Probe User’s Manual version 5.3
Page 23

Menu: /ewe/probe/core/setup/ethernet/
==============================================================================
<0> Back <9> Exit
<1> ethStatusDoc
-----------------------------------------------------------------------------<A> data_dhcp - false SFP+ B port (eth0) DHCP
<B> data_ipa - 10.0.30.101 SFP+ B port (eth0) IP address
<C> data_mask - 255.255.255.0 SFP+ B port (eth0) netmask
<D> data_gateway - 10.0.30.1 SFP+ B port (eth0) IPv4 GW
<E> data_management - true SFP+ B port (eth0) web-server
<F> dhcp - false Management port (eth1) DHCP
<G> ipaddress - 10.0.20.101 Management port (eth1) IP address
<H> netmask - 255.255.255.0 Management port (eth1) netmask
<I> mm_gateway - 10.0.20.1 Management port (eth1) IPv4 GW
<J> management - true Management port (eth1) web-server
<K> gateway_interface - eth1 Force default interface
<L> dns_server - 208.67.222.222 DNS Server
<M> reboot - false
------------------------------------------------------------------------------
Figure 4.8: Text-based menu displayed when connecting over USB
• Stop bits: 1
• Flow control: None
Press
password elvis (this password can be changed in the Setup – Security view).
A simple text based menu system like the one in figure 4.8 should now be displayed. To change a
setting, press the appropriate character from the left-most column, enter the new value and confirm by
pressing
ethStatusDoc option.
The 10G Probe is equipped with two network interfaces called management (or eth1) and data/video
SFP+ B (or eth0). It is necessary to configure at least one of these interfaces from the terminal and
then do the rest of the setup from a web browser. Depending on the installed license, an additional data
interface, labelled data2 (eth2), may also be available.
The 10G Probe supports both in-band management (i.e. using eth0 for both data/video and management)
and separate management (i.e. using eth1 for management). In any case make sure that the subnets
configured for eth0 and eth1 do not overlap – otherwise the probe will not work properly. Note that if IP
addresses for eth0 and eth1 are configured so that the subnets overlap, the IP address of one of the
ports will be automatically set to 1.1.1.1 by the 10G Probe.
To configure the management interface, edit values for ipaddress, netmask and mm_gateway or enable
dhcp instead.
Enter
a few times to bring up the login prompt. Log in using the user name
Enter
. If DHCP is enabled, you can find the currently assigned IP address by selecting the
admin
and the
VB3xx 10G Probe User’s Manual version 5.3 23
Page 24

Make sure Management is enabled (set to true) – otherwise management via web will not be possible.
To configure the data/video interface, enter values for data_ipa, data_mask, data_gateway or alternatively
enable data_dhcp. Set data_management to true to enable web access via the data interface.
When all the listed parameters have been configured, the probe must be rebooted to let the parameters
take effect. This is achieved by selecting the reboot option and confirming by selecting ‘t’ for TRUE.
4.8.3 Verifying Correct Initial Setup of the 10G Probe
Once the probe management network interface have been configured, all further configuration takes
place using a web browser over HTTP.
Launch a web browser application on the management PC. The following web browsers are supported:
• Microsoft Edge
• Microsoft Internet Explorer 11 or higher
• Mozilla Firefox 29 or higher
• Google Chrome
• Apple Safari
Type the IP address of the probe in the browser URL field and press
probe is that of the eth0 or eth1 port (the one used for management) as set in the initial set-up procedure.
The default management view should be displayed inside the browser. This could look similar to figure 4.9,
depending on the options installed.
Enter
. The IP address of the
4.8.4 Initial Setup Troubleshooting
If there are problems bringing up the probe web-based management interface, verify the following:
•
Verify that the laptop and the probe are configured on the same subnet and that they have different
addresses. The network settings of the probe can be verified through RS232/USB as described
earlier
• Make sure that the IP address of the gateway and the network interface are not the same
• Verify that the appropriate Ethernet link indicators of the PC and probe are lit
• Verify that web browser proxy settings are not interfering
• Verify that local firewall settings on the laptop are not interfering
24 VB3xx 10G Probe User’s Manual version 5.3
Page 25
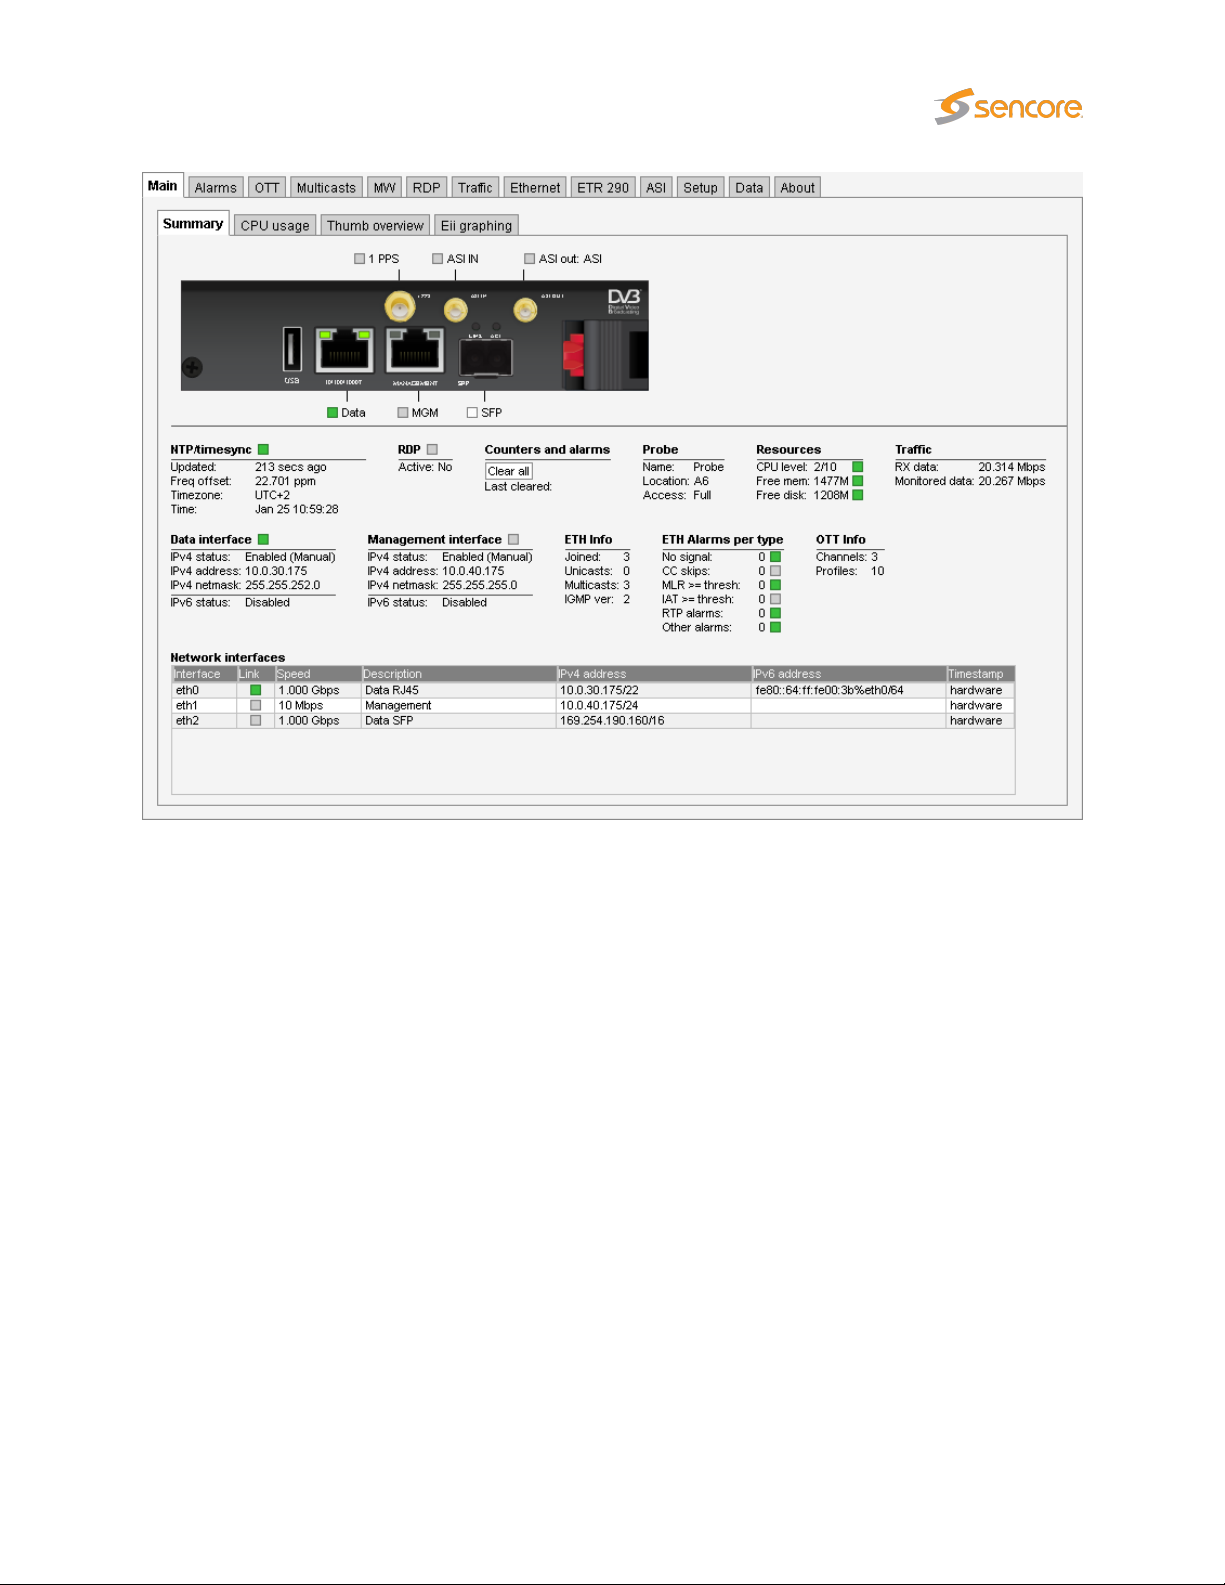
Figure 4.9: Web-based management view
•
Make sure that the management and data/video subnets do not overlap (even if only one is
physically connected)
• Make sure the probe was rebooted to activate the new settings
• Clear the browser’s cache
VB3xx 10G Probe User’s Manual version 5.3 25
Page 26

5 QUICK SETUP GUIDE
This quick setup guide is intended to provide a step-by-step explanation of how to setup a probe once
the initial setup has been performed (as described in chapter 4).
More detailed instructions are found in chapter 6 of this manual.
The Return Data Path and Full Service Monitoring features are not covered by this quick setup guide.
5.1 Basic Setup
1. Set appropriate parameters in the Setup — Params and Setup — Ethernet views.
2.
Enabling Time synchronization is strongly recommended, this can be done in
If no time reference for automatic time locking is available set the time manually in the
Time view.
3. If access control is required, define a password in the Setup — Login view.
Setup — Params
Setup —
.
Note:
ter 6.10.8.
it is important to read the instructions in the associated section of this manual, see chap-
5.2 Input Signal Definitions
5.2.1 Multicasts
1.
Define multicasts, either by using the multicast detect feature (
multicasts manually (Multicasts — Streams).
Note:
received, and in this case it will usually not be possible to detect multicasts automatically. Select
predefined threshold templates that seem appropriate for the signal. Note that the sequence of
the multicast definitions will be reflected in monitoring, so order the multicasts correctly if required.
Also note that ETR 290 monitoring for Ethernet streams is disabled by default, so if this is required,
it will have to be enabled by the user (on a per-stream basis).
Often upstream equipment will not transmit multicasts unless join messages have been
26 VB3xx 10G Probe User’s Manual version 5.3
Traffic — Detect
) or by defining
Page 27

2. Define stream page name(s) in the Setup — Pages view (not strictly necessary).
3. Join multicasts in the Multicasts — Join view or in the Multicasts — Streams view.
5.2.2 OTT Input (OTT Engine Option Only)
1.
Define the OTT channel manifest URLs and channel names in the
the Threshold and VBC threshold settings at default values for now. Remember to tick the Enable
box in the dialog box. If you have multiple OTT engines installed (1 to 50 are allowed) then select
which engine to assign to the channel. Any number of OTT channels can be assigned to each
OTT engine. Each engine works in parallel to each other.
Note:
When monitoring both multicast (UDP) and OTT (TCP) traffic, we recommend using different
network interfaces. Mixing the two traffic types on the same network can have unwanted impact on
the monitored signals. The interface used for OTT traffic is controlled using the
view.
2. Inspect the OTT monitoring progress using the OTT — Active testing dialog. Useful information
on OTT monitoring can be found in Appendix C.
OTT — Channels
Setup — Routing
view. Leave
5.3 Monitoring
When input signal parameters have been set, the signals may be monitored.
For Ethernet multicasts the relevant monitoring views are
Ethernet
OTT are of relevance as well.
Ethernet monitoring hints are found in B Appendix: Monitoring Practices.
. If the probe is equipped with the ETR 290 and/or the OTT option then the views
Main,Alarms,Multicasts,MW,Traffic
ETR 290
and
and
5.4 Adjusting Alarm Thresholds
When the probe inputs and streams have been defined using default thresholds, the result will usually
be a number of more or less permanent alarms, some which may not be relevant under the current
circumstances. In order for the user to get rid of unwanted alarms, the probe provides alarm filtering
functionality in the form of alarm thresholds and alarm on/off selection.
Multicasts
By default Ethernet thresholds are set to raise alarms when service affecting errors occur, that are
caused by the network. There may however be reasons for these thresholds to be altered, for instance to
reflect receiver robustness in the case of IAT, or to reflect a TS into IP mapping different from the default
(7TS/UDP). Creating a new threshold template is done either by copying an existing one and altering the
copy, or by creating a new threshold template from scratch. The Ethernet thresholds are defined in the
VB3xx 10G Probe User’s Manual version 5.3 27
Page 28

Multicasts — Ethernet thresh.
— Streams view.
In addition to the miscellaneous thresholds, that affect only the streams with which they are associated,
the
Alarm — Alarm setup
also possible to define the alarm severity levels for different alarms in this view.
OTT
When an OTT channel is defined the default OTT threshold template is assigned to it. To change
threshold values create one or more new templates in the
OTT channels in the OTT — Channels — Edit view.
ETR 290
view. These thresholds are associated with streams in the
view allows the user to enable and disable alarms on an overall basis. It is
OTT — Thresholds
view and assign them to
Multicasts
By default the streams configured in the probe will be set up to use the ETR 290 threshold named
This has the most important alarms enabled but have been adjusted to match real world systems and
only alarm on more severe problems. The threshold named
101 290 guidelines and are fairly strict generating more alarms. The ETR 290 thresholds should be
changed if there are tables that are not relevant for a system, or if the user requires alarm functionality
that exceeds the ETR 290 guidelines. The ETR engines has a lot of powerful functionality not enabled by
default, for instance the ability to raise alarms if the number of services present in a signal is lower than a
preset limit.
The default PID and service thresholds do not affect alarming at all, they are completely transparent. The
thresholds may be altered for instance in order to mask an alarm generated by an unreferenced PID or to
ensure an alarm is raised if a service or PID bitrate is outside preset limits.
Creating a new threshold template is done either by copying an existing one and altering the copy, or by
creating a new threshold template from scratch. The thresholds are defined in these views:
ETR thresh., ETR 290 — PID thresh., ETR 290 — Service thresh.
The thresholds are associated with streams in the Multicasts — Streams — Edit view.
ETSI TR 101 290
is based on the ETSI TR
Default
ETR 290 —
.
28 VB3xx 10G Probe User’s Manual version 5.3
Page 29

VB3xx 10G Probe User’s Manual version 5.3 29
Page 30

6 THE 10G PROBE GRAPHICAL USER
INTERFACE
30 VB3xx 10G Probe User’s Manual version 5.3
Page 31

The VB330 web interface is reached by pointing a web browser to the IP address of the 10G Probe as
shown in the screen shot above. The following web browsers are recommended:
• Microsoft Edge
• Microsoft Internet Explorer 11 or higher
• Mozilla Firefox 29 or higher
• Google Chrome
• Apple Safari
Note that different web browsers behave differently with respect to memory leaking, and if the VB330
GUI should be available at all times the browser should be selected carefully. A browser memory leak
manifests itself as the browser responding more and more slowly, and this is corrected by closing down
the application and restarting.
The interface is easy and intuitive to use. Navigate by clicking on the tabs just below the 10G Probe logo.
Some of the pages have their own tabs for accessing nested pages. The bottom frame of the interface is
always the Alarms & events list, usually referred to as the
hidden by clicking the Toggle link, which is displayed as an arrow head.
The web interface has been designed to be resizeable in both vertical and horizontal directions with a
minimum screen resolution of 1280×800 pixels.
alarm list
. The alarm list can be displayed or
Tool-tips are available for most buttons and labels. To access tool-tip information simply navigate the
mouse pointer towards a button or a label and leave it hovering for a second or two.
In this manual the term stream is generally used instead of the terms multicast and/or unicast. A stream
may thus contain a single service or multiple services.
VB3xx 10G Probe User’s Manual version 5.3 31
Page 32

6.1 Main
6.1.1 Main — Summary
The intention of this page, together with the
to immediately see if there is anything seriously wrong with one or more input streams.
At the very top, a graphic is displayed representing the front panel of the probe, indicating the status of
the different inputs.
Below this display, the following parameters are shown:
(Bulb):
Updated: The time since the last time synchronization update.
Freq offset: Indicates the measured frequency offset for the system clock.
Timezone: The time zone as selected by the operator in the Setup — Params view.
The NTP/timesync bulb indicates whether the VB330 clock is locked to an external time
reference signal. Green indicates that the VB330 is locked to an external reference
whereas gray indicates that the VB330 runs in unlocked mode.
alarm list
NTP/timesync
, is to provide enough information for the operator
32 VB3xx 10G Probe User’s Manual version 5.3
Page 33

Time: The current local time (configured in the Setup — Params or Setup — Time view).
RDP
(Bulb):
The RDP bulb indicates whether RDP is active or not. Green indicates RDP active whereas
grey indicates that RDP is currently not active.
Active:
Last cleared:
Name: The VB330 name as defined by the operator in the Setup — Params view.
Location: The VB330 location as defined by the operator in the Setup — Params view.
Access:
CPU level:
The RDP active state is either yes or no, yes indicating that RDP relaying or alarm triggered
recording mode has been selected by the operator in the RDP view.
Counters and alarms
Clear all:
Click the
measurement and alarm history is cleared. Note that it is not possible to undo
this operation.
The time the
counters have not been cleared since VB330 startup/reboot time.
The access rights of the current user. Access rights are either full access or read only
access, and are defined by the operator in the Setup — Login view.
The CPU level indicates the workload of the probe, on a scale from 1 to 10 of total
capacity.
Clear all
Clear all counters
button to reset all counters, graphs and alarms. All VB330
button was last clicked. If no time is indicated the
Probe
Resources
Free mem: The available free memory.
Free disk: The available free probe disk space.
The probe employs a memory-based disk, which means that the amount of available free memory
decreases as more files (such as recordings, thumbnails, PCAPs, etc.) are stored.
Traffic
RX data: The total bitrate of received data traffic
Monitored data: The total bitrate of multicasts and unicasts monitored (analyzed) by the probe
Data interface
(Bulb): The bulb indicates whether the data interface is connected and active or not.
VB3xx 10G Probe User’s Manual version 5.3 33
Page 34

IPv4 status: The IPv4 status as defined in the Setup — Ethernet view
IPv4 address:
IPv4 netmask:
The probe IPv4 Ethernet data/video interface IP address as defined by the user in
the Setup — Ethernet view
The probe IPv4 Ethernet data/video interface IP address as defined by the user in
the Setup — Ethernet view
Management interface
(Bulb):
IPv4 status: The IPv4 status as defined in the Setup — Ethernet view
IPv4 address:
IPv4 netmask:
Joined: The number of joined streams (multicasts and unicasts)
Unicasts: The number of unicasts currently being joined/monitored by the probe
Multicasts: The number of multicasts currently being joined/monitored by the probe
IGMP ver:
VLAN tag:
The bulb indicates whether the management interface is connected and active or
not.
The probe IPv4 Ethernet data/video interface IP address as defined by the user in
the Setup — Ethernet view
The probe IPv4 Ethernet data/video interface IP address as defined by the user in
the Setup — Ethernet view
ETH info
The IGMP version currently used by the probe. IGMPv2 is used unless the operator has
selected source specific multicasts (
used.
The VLAN tag currently used by the probe. If no VLAN tag has been specified by the
operator (Setup — Params view), the VLAN tag value will read disabled.
Setup — Params
view), in which case IGMPv3 is
ETH alarms per type
No signal: The number of currently active Ethernet ‘No signal’ alarms
CC skips: The number of currently active Ethernet ‘CC skips’ alarms
MLR>=thresh:
IAT>=thresh:
RTP alarms:
Other alarms:
The number of currently active Ethernet MLR alarms, i.e. the total number of ‘MLR>=
warning-threshold’ and ‘MLR>= alarm-threshold’ alarms
The number of currently active Ethernet IAT alarms, i.e. the total number of ‘IAT>=
warning-threshold’ and ‘IAT>= alarm-threshold’ alarms
The number of currently active RTP alarms, i.e. the total number of ‘RTP packet
drop’, ‘RTP duplicates’ and ‘RTP out of order’ alarms
The total number of currently active Ethernet alarms not included in the alarm figures
specified above
34 VB3xx 10G Probe User’s Manual version 5.3
Page 35

OTT info
Channels: The number of enabled OTT channels.
Profiles: The total number of profiles in the enabled OTT channels.
At the very bottom of the Summary page, an overview of the Ethernet network interfaces on the VB330
are displayed.
Network interfaces
Interface: The ID of the selected network interface.
Link: Indicates whether the interface is connected.
Description: Provides a human-readable description of the interface, if available.
IPv4 address: Lists the IPv4 address and netmask of the network interface, if set.
IPv6 address: Lists the IPv6 address and netmask of the network interface, if set.
Timestamp:
Indicates whether the network interface supports hardware timestamping for precise
measurements, or if kernel timestamping is used.
6.1.2 Main — CPU usage
The
CPU usage
load.
Three internal performance indicators (System, User and Idle) are displayed as percentage numbers
and also graphed for the last minute. Issues can potentially arise if the System indicator becomes high
(>80%).
The
CPU usage
averaged over the last 10 seconds click the
60 seconds click the
view is meant for troubleshooting performance issues in case of excessively high traffic
view displays CPU usage of the 10G Probe’s eight cores. To view the CPU usage
Last 60 seconds
Current
button. Clicking the
button. To view the usage averaged over the last
Peak any 10 secsorPeak any 60 seconds
VB3xx 10G Probe User’s Manual version 5.3 35
Page 36

button will display the historical maximum value for an averaging period of 10s and 60s respectively. To
clear peak values click the Clear peaks button.
CPU capacity is automatically allocated by the probe, and core 8 always handles ‘User’ processes, like
the web server and thumbnail extraction.
6.1.3 Main — Thumb overview
The
Thumb overview
is used. Placeholder images will be displayed if thumbnailing has not been enabled in the
Params view, indicating the type of stream being received.
If the
Small
allowing more thumbnails to be displayed in a view. To display the stream address and name (as defined
in the Multicasts — Streams and OTT — Channels views) click the Stream info button.
The following information is displayed for each stream:
button is clicked the
Service name:
Service id: For TS services, the ID of the selected service within a transport stream.
view displays a mosaic of all decoded thumbnails. By default the
Thumb overview
Thumb overview
Shows the name defined for the TV service in the SI service descriptor. If no
SI is present in the stream the service id will be shown.
Type: For non-TS services, the service type is displayed.
view will display service names and thumbs only,
Normal
Setup —
mode
36 VB3xx 10G Probe User’s Manual version 5.3
Page 37

Freeze-frame status:
The
Thumbs Details
more information about the details displayed in the
streams, and chapter 6.3.2 for OTT channels.
Clicking the Close button will close the view.
If the probe has been licensed with the Content Extraction and Alarming
option, status bulbs are displayed indicating the current freeze-frame and
color-freeze status for the streams.
White: Unknown (typically due to the VB330 being unable to decode video)
Grey: freeze-frame detection is disabled.
Green: freeze-frame detection is enabled, no freeze-frame is detected.
Yellow:
have been detected, but the freeze-frame error timeout value has not been
exceeded.
Red:
freeze-frame error timeout value has been exceeded, thus resulting in an
alarm.
pop-up view is accessed by clicking a thumb in the
freeze-frame detection is enabled. Two consecutive equal frames
freeze-frame is enabled. Freeze-frame has been detected and the
6.1.4 Main — Eii graphing
Thumbs Details
Thumb overview
pop-up see chapter 6.4 for multicast
view. For
VB3xx 10G Probe User’s Manual version 5.3 37
Page 38

Eii is short for External Integration Interface and constitutes a set of XML files accessible through the
probe web server interface for machine access to measurement data.
Portions of the Eii interface are available in this view for simple trend graphing over arbitrary long time by
the web browser.
The screenshot shows the bandwidth of two IP streams being graphed by sampling the Eii interface every
2 seconds. The graph is stored in the client web browser for as long as the graph window remains open.
The graph starts again with zero history if the window is closed and then opened again.
Up to 5 streams are possible to plot on the same graph using the dropdown menus named
plot
where N is 1 through to 5. The parameter to plot is selected through the dropdown called
to plot. The following choices are available:
1. bitrate
2. rtp_drops
3. iat_avg
4. cc_errs
Refresh (seconds) selects how often samples are read and plotted on the graph.
Please refer to the separate Eii documentation for more details.
Stream N to
Parameter
38 VB3xx 10G Probe User’s Manual version 5.3
Page 39
6.2 Alarms
OTT Option
OTT Channel
OTT Analysis
PID Thresholds
OTT Thresholds ETR Thresholds
FSM Settings
FSM Measurements
Alarm Settings
and Scheduling
SNMP Alarms Alarm Lists
System Events
ETH Thresholds
Service Thresholds
ETH Multicast
ETH Measurements
ETR 290 Option
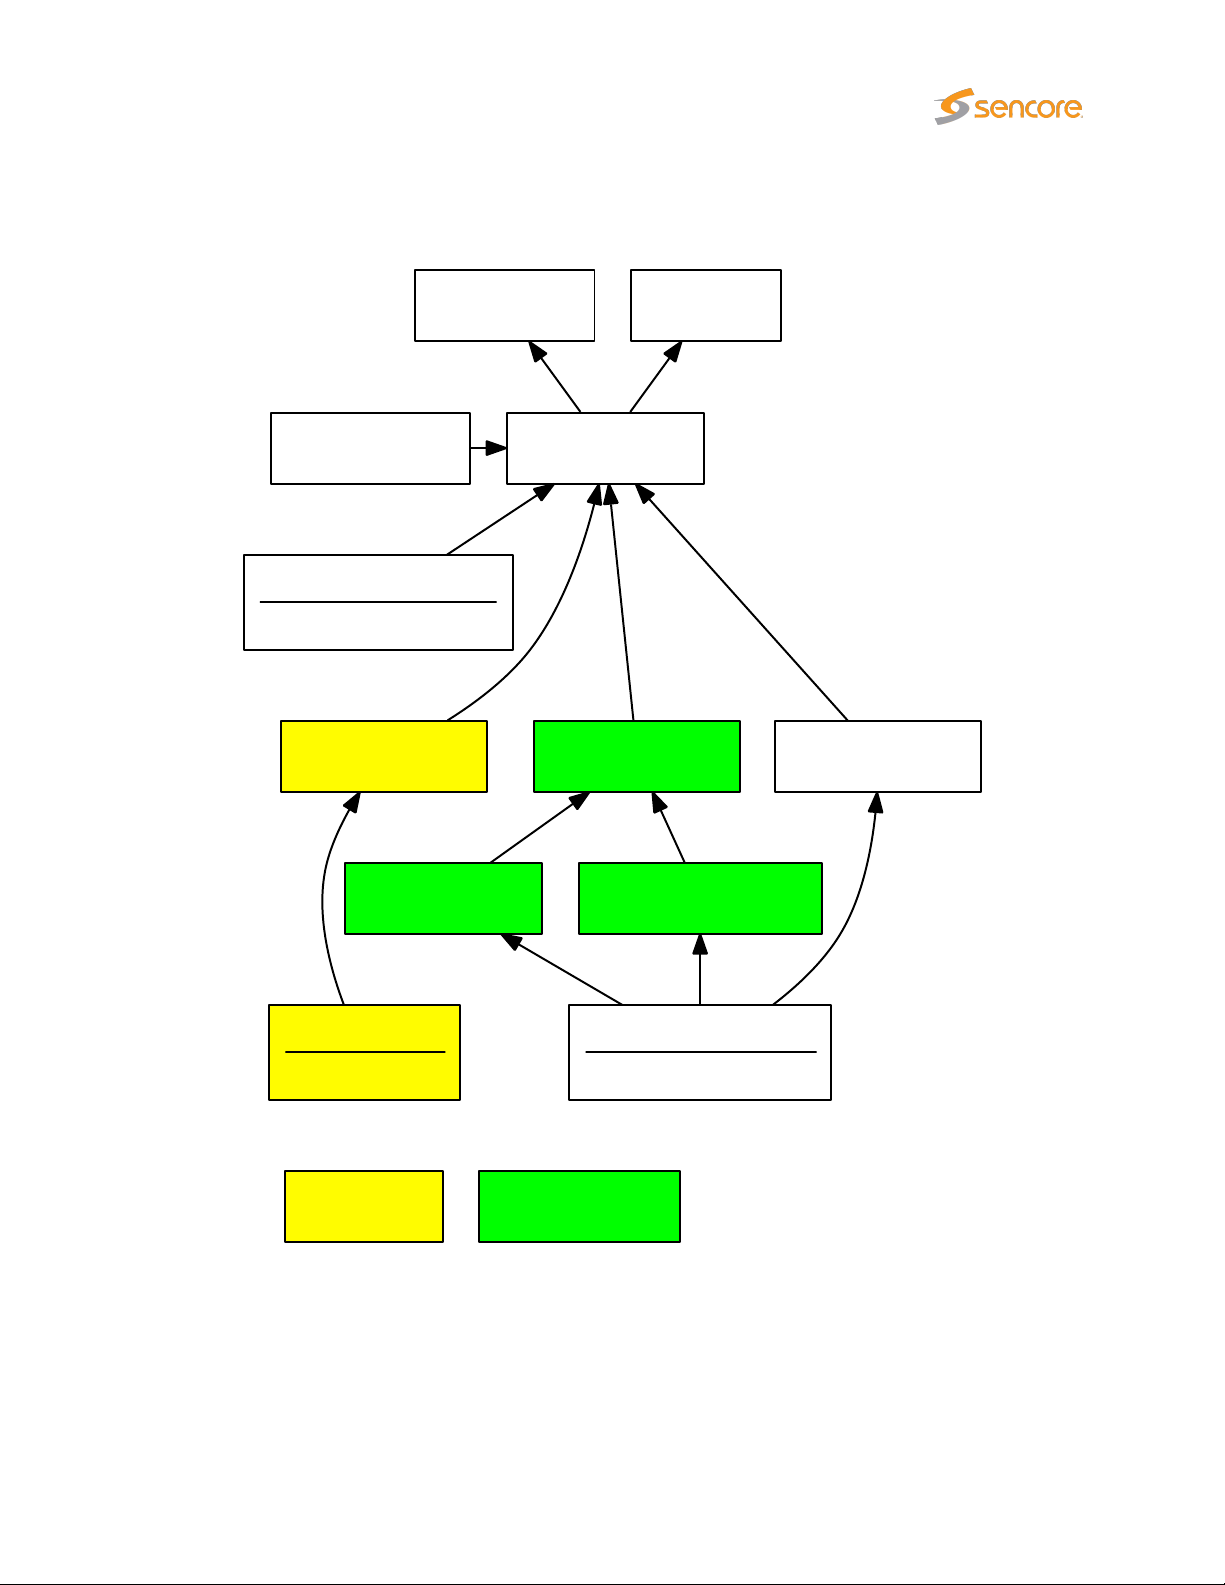
Figure 6.1: Alarm handling in the 10G Probe.
Figure 6.1 shows an overview of the alarm handling in the 10G Probe. It is useful to obtain an understanding of the alarm processing of the 10G Probe – in particular how threshold settings and alarm setup
VB3xx 10G Probe User’s Manual version 5.3 39
Page 40

will affect alarm handling.
The 10G Probe continuously compares measurement data with user defined thresholds in order to
generate alarms. These alarms are further checked against the settings defined in the
setup
SNMP traps to support third party management systems. Refer to Appendix: VB330 Versus VBC Alarms
for a description of alarm handling in the VideoBRIDGE Controller.
The 10G Probe distinguishes between events and alarms. The ETR software module will always generate
alarms and the Systems software module will always generate events. The Ethernet software module will
by default generate events for errors that are resolved within 1 second, otherwise it will generate alarms.
This can be overridden by checking the ‘Treat ethernet events as alarms’ box in the
view. The OTT module generates alarms only.
view, and the resulting alarms are presented in the alarm lists. These alarms will also be sent as
Alarms — Alarm
Setup — Params
6.2.1 Alarms — All Alarms
The
Alarms
list. The individual alarm lists can hold the number alarms indicated below independently of each other,
meaning that one may become full without affecting the other lists.
Full Service Monitoring (FSM) 100 alarms
Over The Top Television (OTT) 100 alarms
ETSI TR 101 290 Analysis (ETR) 400 alarms
view gives the user the possibility of viewing alarms according to type or as one combined
Alarm list capacity
Ethernet alarms (ETH) 4000 alarms
System alarms (SYS) 100 alarms
40 VB3xx 10G Probe User’s Manual version 5.3
Page 41
If
Auto-refresh list
alarms are always located at the top of the list.
is selected, the alarm list will be continuously updated with new alarms. Active
Clicking the
events list. By clicking one of the blue information icons leftmost in the offline list, a detailed alarm
description can be viewed. The search field in the upper right corner of the view allows the user to type a
text string and the alarm list is updated to display only streams and alarms matching the specified text.
To update the offline alarm list click the Auto-refresh list button and then go back to the offline mode.
The alarm lists can be deleted by clicking the
action will permanently clear the alarm lists — they cannot be restored.
The
Export
new window.
View list offline
button enables export of the corresponding alarm list as an XML file. This file will open in a
button gives the user the opportunity to view the complete alarms and
Flush alarms
button. However it should be noted that this
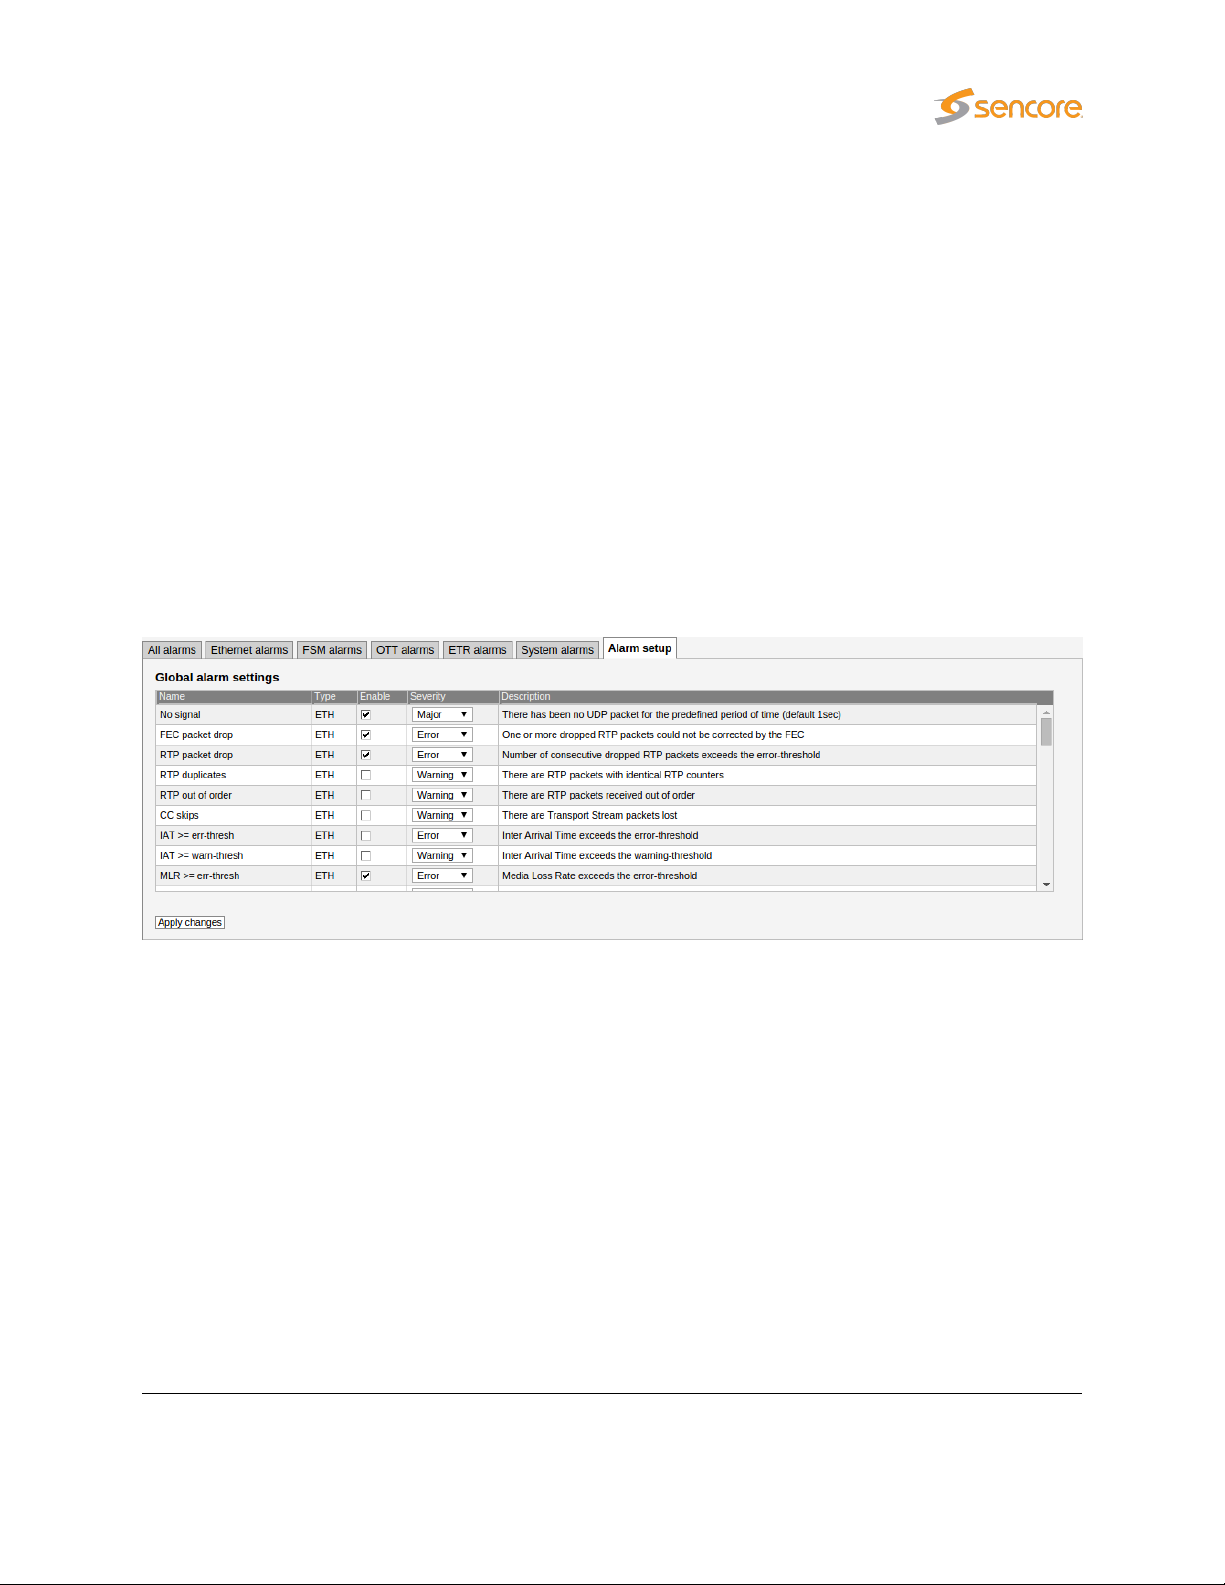
6.2.2 Alarms — Alarm setup
The
Alarm setup
should be enabled or ignored, and associates an error severity level with each alarm, and associates an
error severity level with each alarm. When changes have been made to alarm settings click the
changes button for changes to take effect.
Figure 6.1 gives an overview of the total alarm handling of a 10G Probe. The settings in the
view are represented by the Alarm Settings box in this figure.
Note that the probe alarm handling will also depend on the threshold template settings defined by the
user in the
290 — Service thresh., and OTT — Thresholds views.
Also note that only enabled alarms are shown in the alarm lists and forwarded as SNMP traps. Enabling
or disabling 10G Probe alarms does however not affect the alarms presented by the VBC. Refer to
Appendix: VB330 Versus VBC Alarms for a description of the VB330 versus VBC alarm handling.
The following alarm severity levels may be selected:
represents the final filtering stage for VB330 alarms. The user selects whether an alarm
Apply
Alarm setup
Multicasts — Ethernet thresh.,ETR 290 — ETR thresh.,ETR 290 — PID thresh.,ETR
VB3xx 10G Probe User’s Manual version 5.3 41
Page 42

OK: If enabled, the alarm will be present in the alarm list, color green
Warning: If enabled, the alarm will be present in the alarm list, color yellow
Error: If enabled, the alarm will be present in the alarm list, color orange
Major: If enabled, the alarm will be present in the alarm list, color red
Fatal: If enabled, the alarm will be present in the alarm list, color black
The following alarms and events are configured:
ETH (Ethernet) alarms
No signal:
There has been no UDP packet for
the predefined period of time (default 1sec)
Default: Enabled,
severity Major
FEC packet drop:
RTP packet drop:
RTP duplicates:
RTP out of order:
CC skips:
IAT >= err-thresh:
One or more RTP packets could not
be corrected by the FEC
Number of consecutive dropped
RTP packets exceeds the errorthresholds – only available if RTP
headers are present
Number of RTP packets with identical RTP counters – only available if
RTP headers are present
There are RTP packets received
out of order – only available if RTP
headers are present
Number of transport stream discontinuities due to packet loss. Note
that the CC skips number does not
necessarily equal the number of
lost packets, as several consecutive
packets lost will be counted as one
CC skip.
The Inter-packet Arrival Time exceeds the error threshold
Default: Enabled,
severity Error
Default: Enabled,
severity Error
Default: Disabled,
severity Warning
Default: Disabled,
severity Warning
Default: Disabled,
severity Warning
Default: Disabled,
severity Error
IAT >= warn-thresh:
MLR >= err-thresh:
MLR >= warn-thresh:
The Inter-packet Arrival Time exceeds the warning threshold
The Media Loss Rate exceeds the
error-threshold
The Media Loss Rate exceeds the
warning-threshold
42 VB3xx 10G Probe User’s Manual version 5.3
Default: Disabled,
severity Warning
Default: Enabled,
severity Error
Default: Disabled,
severity Warning
Page 43

TTL changed: The Time-To-Live field is changing Default: Enabled,
severity Error
TOS changed: The Type-Of-Service field is chang-
Multiple mcast sources:
Mcast source changed:
Bitrate overflow:
Bitrate underflow:
Full service monitoring:
ing
There are multiple multicast
sources
The multicast source changed to
one of the valid multicast sources
specified by the operator.
The net stream bitrate exceeds the
maximum bitrate Ethernet threshold
value specified by the operator.
The net stream bitrate goes below the minimum bitrate Ethernet
threshold value specified by the operator.
FSM alarms
No reply was obtained within timeout period for the configured FSM
service
Default: Enabled,
severity Error
Default: Enabled,
severity Error
Default: Enabled,
severity Error
Default: Enabled,
severity Error
Default: Enabled,
severity Error
Default: Enabled,
severity Major
ETR (ETR 290) alarms
TS Sync: No TS Sync (no signal) Default: Enabled,
severity Major
Sync byte:
PAT: Program Association Table error Default: Enabled,
Continuity: Continuity counter error Default: Enabled,
PMT: Program Map Table error Default: Enabled,
PID: PID is missing Default: Enabled,
Transport:
Sync byte error, sync byte not 0x47
Transport stream error indicator is
set
Default: Enabled,
severity Major
severity Major
severity Major
severity Major
severity Major
Default: Enabled,
severity Major
VB3xx 10G Probe User’s Manual version 5.3 43
Page 44

CRC: Table checksum error Default: Enabled,
severity Major
PCR: Program Clock Reference error Default: Enabled,
severity Major
PCR Accuracy:
PTS: Presentation Time Stamp error Default: Enabled,
CAT: Conditional Access Table error Default: Enabled,
NIT: Network Information Table error Default: Enabled,
SI Rep Rate: Wrong repetition rate for SI tables Default: Enabled,
Unref PID: PID is unreferenced Default: Enabled,
SDT: Service Description Table error Default: Enabled,
EIT: Event Information Table error Default: Enabled,
RST: Running Status Table error Default: Enabled,
TDT: Time Date Table error Default: Enabled,
Program Clock Reference accuracy
error (PCR jitter)
Default: Enabled,
severity Major
severity Major
severity Major
severity Major
severity Major
severity Major
severity Major
severity Major
severity Major
severity Major
MGT:
VCT:
PIM/PNM: PIM/PNM error (ATSC mode) Default: Enabled,
RRT:
ATSC EIT:
STT:
ETT:
Master Guide Table error (ATSC
mode)
Virtual Channel Table error (ATSC
mode)
Region Rating Table error (ATSC
mode)
ATSC EIT Table error (ATSC mode)
System Time Table error (ATSC
mode)
Extended Text Table error (ATSC
mode)
44 VB3xx 10G Probe User’s Manual version 5.3
Default: Enabled,
severity Major
Default: Enabled,
severity Major
severity Major
Default: Enabled,
severity Major
Default: Enabled,
severity Major
Default: Enabled,
severity Major
Default: Enabled,
severity Major
Page 45

CA System: CA System error Default: Enabled,
severity Major
PID min. bitr.
PID max. bitr.
PID checks: PID check error Default: Enabled,
Service min. bitr.
Service max. bitr.
Service checks: Service check error Default: Enabled,
MIP: Megaframe Insertion Packet error Default: Enabled,
Content:
Reference:
Gold TS:
PID minimum bitrate below threshold
PID maximum bitrate exceeds
threshold
Service minimum bitrate below
threshold
Service maximum bitrate exceeds
threshold
Content check error (checking of audio and video)
Reference check error (comparing
the stream with a Gold TS)
Error found while comparing the
stream with the stored Gold TS
snapshot)
Default: Enabled,
severity Major
Default: Enabled,
severity Major
severity Major
Default: Enabled,
severity Major
Default: Enabled,
severity Major
severity Major
severity Major
Default: Enabled,
severity Major
Default: Enabled,
severity Major
Default: Enabled,
severity Major
Interface overflow:
[Critical system errors]:
[System errors]:
[System info]:
VB3xx 10G Probe User’s Manual version 5.3 45
Input interface overflow error.
Means that the probe is overloaded
and can not properly analyze the
signals.
SYS (System) events
Critical system errors preventing the
10G Probe from operating correctly
Enable this to view all system errors
Enable this to view system information messages such as time synchronization
OTT Alarms
Default: Enabled,
severity Major
Default: Enabled,
severity ‘Fatal’
Default: Enabled,
severity ‘Major’
Default: Enabled,
severity ‘Ok’
Page 46

The number of profiles changed:
The number of profiles flagged in
the manifest file changed
Default: Enabled,
severity ‘Warning’
Profile stream type changed:
Minimum profiles
Download bitrate low:
Download bitrate too low:
Manifest size:
Actual bitrate:
Download timeout:
The stream type of the profile
changed in the manifest
The channel has less profiles than
specified in the threshold
The download duration time exceeds the OTT bitrate threshold.
The bitrate threshold is part of the
OTT threshold template defined in
the
OTT — Thresholds
threshold template is assigned to
a stream in the
view.
The download duration time exceeds the OTT chunk duration time.
The manifest file size exceeds the
OTT manifest size threshold.
The actual measured bitrate does
not match the profile bitrate specified in the manifest file.
The download time exceeds twice
the chunk duration time.
OTT — Channels
view. A
Default: Enabled,
severity ‘Warning’
Default: Enabled,
severity Warning
Default: Disabled,
severity Warning
Default: Enabled,
severity Error
Default: Enabled,
severity Warning
Default: Enabled,
severity Warning
Default: Enabled,
severity Major
Address resolve error: Unable to resolve address name Default: Enabled,
Connection failed: Connection failed Default: Enabled,
Send error: Could not send data to host Default: Enabled,
Receive error: Could not receive data from host Default: Enabled,
Empty reply:
HTTP error: Invalid HTTP response Default: Enabled,
HTTP redirect error: HTTP 3xx redirection error Default: Enabled,
HTTP client error: HTTP 4xx client error Default: Enabled,
Response did not contain any data
in body
46 VB3xx 10G Probe User’s Manual version 5.3
severity ‘Error’
severity ‘Error’
severity ‘Error’
severity ‘Major’
Default: Enabled,
severity ‘Major’
severity ‘Major’
severity ‘Major’
severity ‘Major’
Page 47

HTTP server error: HTTP 5xx server error Default: Enabled,
severity ‘Major’
Static manifest:
Manifest parse error:
Unknown manifest:
Manifest file unchanged for longer
than configured threshold.
Failed to parse manifest file. Invalid
format
Cannot recognize manifest XML format
6.2.3 Alarms — Flash Alarms (FLASH option)
Default: Enabled,
severity Major
Default: Enabled,
severity ‘Major’
Default: Enabled,
severity ‘Fatal’
The FLASH option enables the Flash alarms TAB. This alarm list contains the last 20,000 alarms and
keeps them in non-volatile memory so that they survive reboots and power-outages. This opens up a lot
of possibilities for probes that cannot be reached while doing measurements and for probes that need to
be powered down and consulted elsewhere. It also severely increases the size of the alarm list allowing
browsing of older alarms.
VB3xx 10G Probe User’s Manual version 5.3 47
Page 48
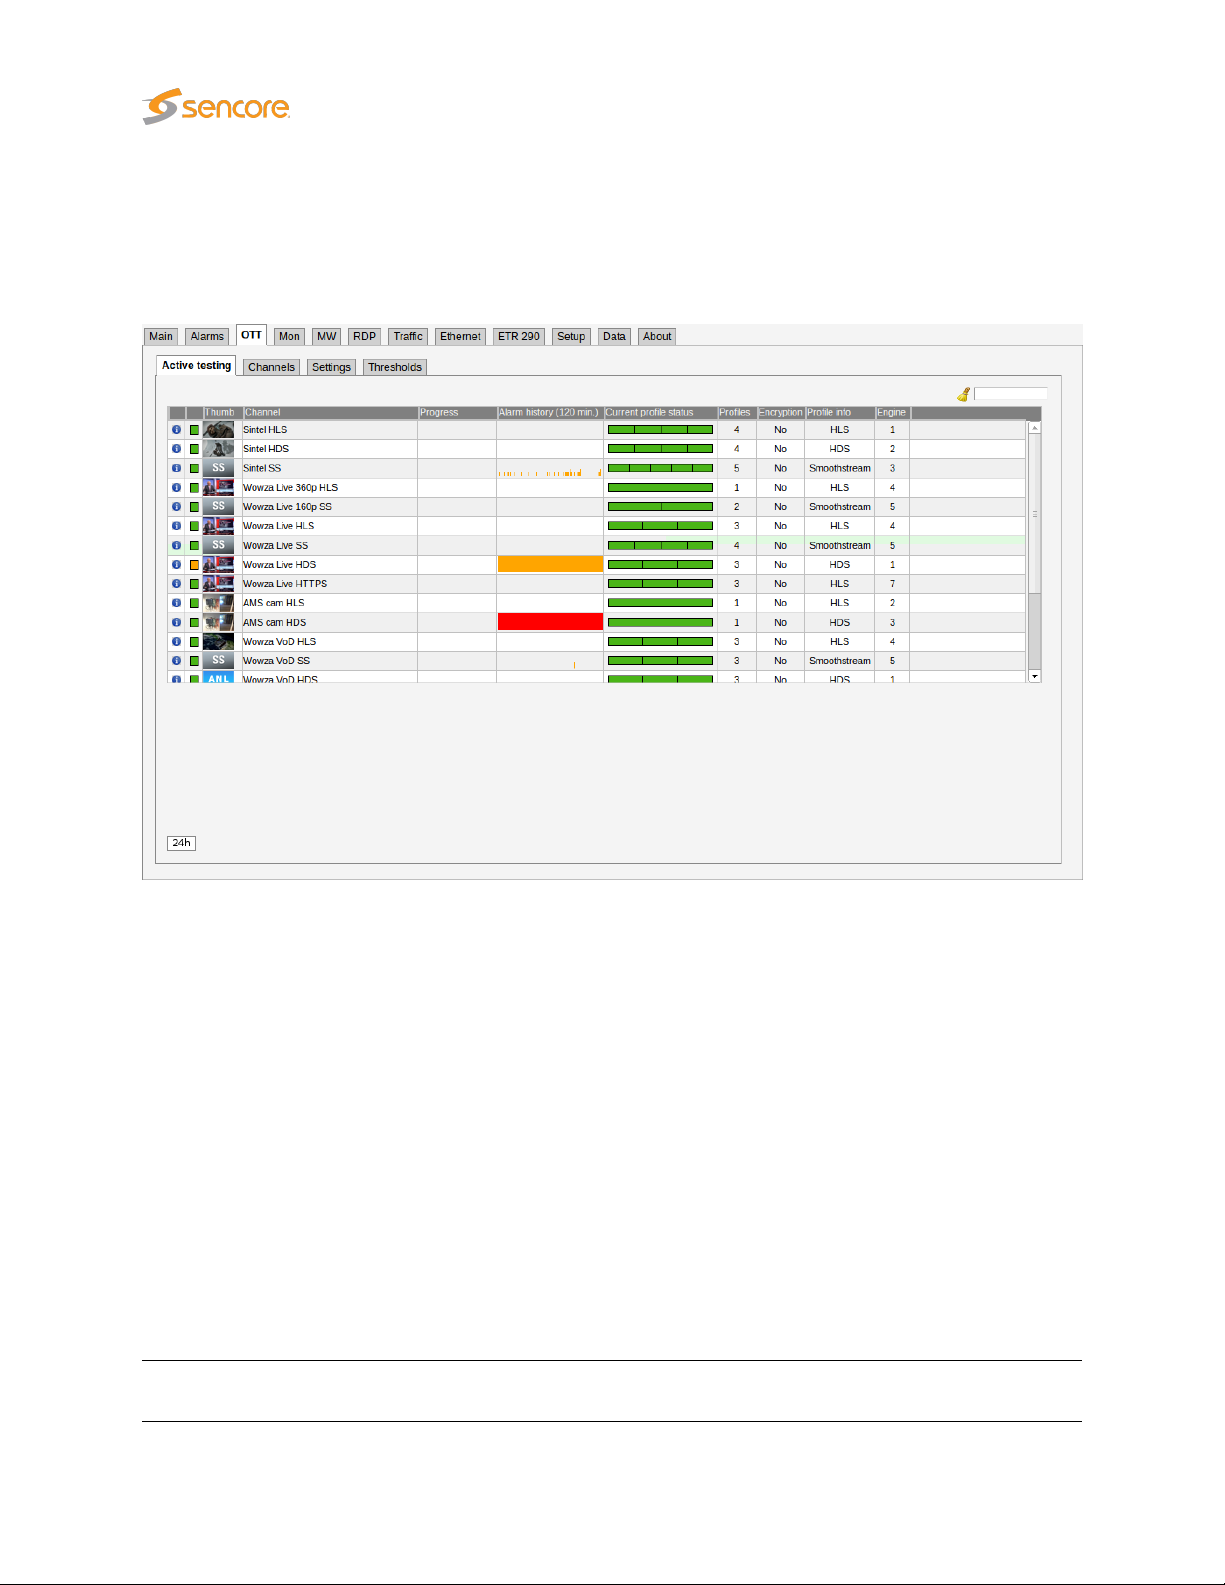
6.3 OTT (Option)
6.3.1 OTT — Active testing
The OTT option enables monitoring of up to 500 OTT channels. Up to 50 OTT engines (depends on
license) can operate in parallel, and each engine licensed allows any channels to be analyzed. Each
engine analyses channels in series and can be configured with any number of channels up to the
maximum allowed by the license.
The 10G Probe will parse a channel’s manifest file, and for a live channel one of the latest chunks in each
OTT profile’s chunk sequence will be analyzed. The engine then moves on to the next OTT channel in
the channel list defined by the user. For a VoD channel the OTT engine will analyze all chunks in the VoD
file, one in each round-robin loop.
If manifest file parsing or chunk analysis reveals an error, an alarm will be raised. Note that some alarms
depend on user defined threshold values. Alarms must also be enabled in the
view.
Thumbnail decoding is available for
some types of encrypted HLS channels.
The following OTT information is displayed in the Active testing view:
Status bulb:
A bulb indicates the current status of the channel, i.e. the most severe
profile status.
non-encrypted
HLS, HDS, DASH and RTMP channels, as well as
Alarm — Alarm setup
48 VB3xx 10G Probe User’s Manual version 5.3
Page 49

Thumb:
If the selected channel is of type HLS, HDS, DASH or RTMP a thumbnail of
the content will be decoded and updated. Thumbnail decoding is a process
asynchronous of the channel analysis and therefor should not be expected
to be updated at the same time. The main purpose of the thumbnails is to
provide brief information about the channel contents.
Channel:
Progress:
Alarm history:
Current profile status:
Profiles: The number of profiles associated with a channel.
Encryption:
The channel name defined by the user and linked to a URL in the
Channels view.
Channels will be analyzed sequentially, and the progress bar shows which
channel is currently being monitored and how analysis is progressing.
A bar graph showing alarm severity history. It can either show the last 120
minutes or the last 24 hours. To switch between them, press the “24h” or
“2h” button on the left under the channel list. Each bar color represents the
alarm severity level as configured under Alarms — Alarm setup.
The channel health bar displays the current status for individual channel
profiles. Profiles are separated by vertical black lines.
Colors indicate profile alarm status:
OTT —
• Green: OK
• Yellow: Warning
• Orange: Error
• Red: Major
• Black: Fatal
Scrambling information is resolved from the profile manifest. If the profile is
scrambled the encryption field will read Yes. If the profile is transmitted in
clear the encryption field will read No.
Profile info:
Engine:
Channel and profile information is resolved from the manifest files. At
channel level the OTT format is displayed (Smoothstream, HLS, Adobe
HDS, MPEG DASH or SHOUTcast). At profile level the profile bitrate is
displayed.
Indicates which OTT engine is assigned to what channel. The 10G Probe
can be licensed with anywhere from 1 up to 50 OTT engines. Each engine
is capable of handling any number of channels.
6.3.2 OTT — Details
Click the blue information button on a channel to open the details window. This window provides detailed
information about the status and alarms on all the profiles for the selected channel. The same pop-up
can be opened from the Main — Thumb Overview view, see chapter 6.1.3 for more information.
VB3xx 10G Probe User’s Manual version 5.3 49
Page 50

6.3.2.1 OTT — Details — Profiles
The Profiles view in this pop-up consists of two tables detailed below:
The following information relevant for the overall OTT channel is shown in the first part of the Details —
Profiles pop-up window:
Channel:
Progress:
Profiles: The number of profiles associated with a channel.
The channel name defined by the user and linked to a URL in the
view. A bulb indicates the current status of the channel, i.e. the most severe profile
status.
Channels will be analyzed sequentially, and the progress bar shows which channel
is currently being monitored and how analysis is progressing.
OTT — Channels
50 VB3xx 10G Probe User’s Manual version 5.3
Page 51

Profile status:
The channel health bar displays the current status for individual channel profiles.
Profiles are separated by vertical black lines.
Colors indicate profile alarm status:
• Green: OK
• Yellow: Warning
• Orange: Error
• Red: Major
• Black: Fatal
Stream type:
In the same view below the table for the overall channel a more detailed view per
shown with the following information in it:
Profile: The name of the OTT profile as flagged in the manifest files.
Type: Live
Profile health:
Profile bps: The profile nominal bandwidth as flagged in the manifest files.
Actual bps:
Download bps:
Channel and profile information is resolved from the manifest files. At channel level
the OTT format is displayed (Smoothstream, HLS, Adobe HDS, MPEG DASH or
SHOUTcast).
for live content or
done based on whether the profile sequence numbers update or not.
A timeline graph display of a combined bitrate and alarm representation for individ-
ual profiles. Refer to Appendix C for a description of these graphs. The timeline
duration is either 2 or 24 hours, and the graph resolution is one minute for the 2
hour graph, and twelve minutes for the 24 hour graph.
The actual profile bitrate, i.e. the chunk size (megabits) divided by the chunk length
(seconds). The actual profile bitrate should match the manifest bitrate specification
within limits defined by the user in the OTT thresholds template associated with a
channel. Otherwise an alarm will be raised.
The download bitrate, i.e. the chunk size (megabits) divided by the download time
(seconds).
VoD
for stored content. The distinction between the two is
channel profile
is
Chunk length: The profile chunk length (seconds) specified in the manifest file.
Download time: The actual profile chunk download time (seconds).
Download size: The actual profile chunk size (bytes).
Encrypt.: Yes or No depending on whether the content for that profile is encrypted or not.
HTTP header: The current HTTP header of the last chunk downloaded for that profile.
VB3xx 10G Probe User’s Manual version 5.3 51
Page 52

6.3.2.2 OTT — Details — Manifest
The
Manifest
manifest files for the individual profiles.
Channel:
Progress:
Profiles: The number of profiles associated with a channel.
Profile status:
view shows health information on the overall manifest file for the channel as well as for the
The channel name defined by the user and linked to a URL in the
view. A bulb indicates the current status of the channel, i.e. the most severe profile
status.
Channels will be analyzed sequentially, and the progress bar shows which channel
is currently being monitored and how analysis is progressing.
The channel health bar displays the current status for individual channel profiles.
Profiles are separated by vertical black lines.
Colors indicate profile alarm status:
• Green: OK
• Yellow: Warning
• Orange: Error
• Red: Major
• Black: Fatal
52 VB3xx 10G Probe User’s Manual version 5.3
OTT — Channels
Page 53

Profile info:
Manifest size: The size in bytes of the main/top manifest file for the overall channel.
Manifest file: Clickable URL for displaying the manifest file as text for the overall channel.
Manifest URL: A clickable link to the current main/top manifest file for the overall channel.
HTTP header: The current HTTP header of the main/top manifest file for the overall channel.
Just below the channel manifest information in the same window is the detailed manifest information per
profile. This view contains the following information:
Profile: The name of the OTT profile as flagged in the manifest files.
Profile bps: The profile nominal bandwidth as flagged in the manifest files.
The type of stream is shown here. Apple
HDS, MPEG DASH or SHOUTcast.
HLS
, Microsoft
Smoothstream
, Adobe
Type: Live
Seq.age:
Manifest size: The size in bytes of the manifest file for a particular profile.
Manifest file: Clickable URL for displaying the manifest file as text for this particular profile.
Manifest URL: Clickable URL to the profile manifest file.
HTTP header: URL to HTTP header in text form for a particular profile manifest file.
for live content or
done based on the contents of the manifest file.
The profile sequence shows how long it has been since the manifest was updated in
whole seconds.
VoD
for stored content. The distinction between the two is
VB3xx 10G Probe User’s Manual version 5.3 53
Page 54

6.3.2.3 OTT — Details — Alarms
The
Details — Alarms
channel. An alarm log for the selected channel is also provided here.
In the right corner of the pop-up window is a free text search field used to narrow down the entries in the
alarm log.
The alarms are the same ones as explained for the Alarms — Alarm setup view, see chapter 6.2.2 for
more information.
view gives an at-a-glance overview of any active OTT alarms for the selected
54 VB3xx 10G Probe User’s Manual version 5.3
Page 55
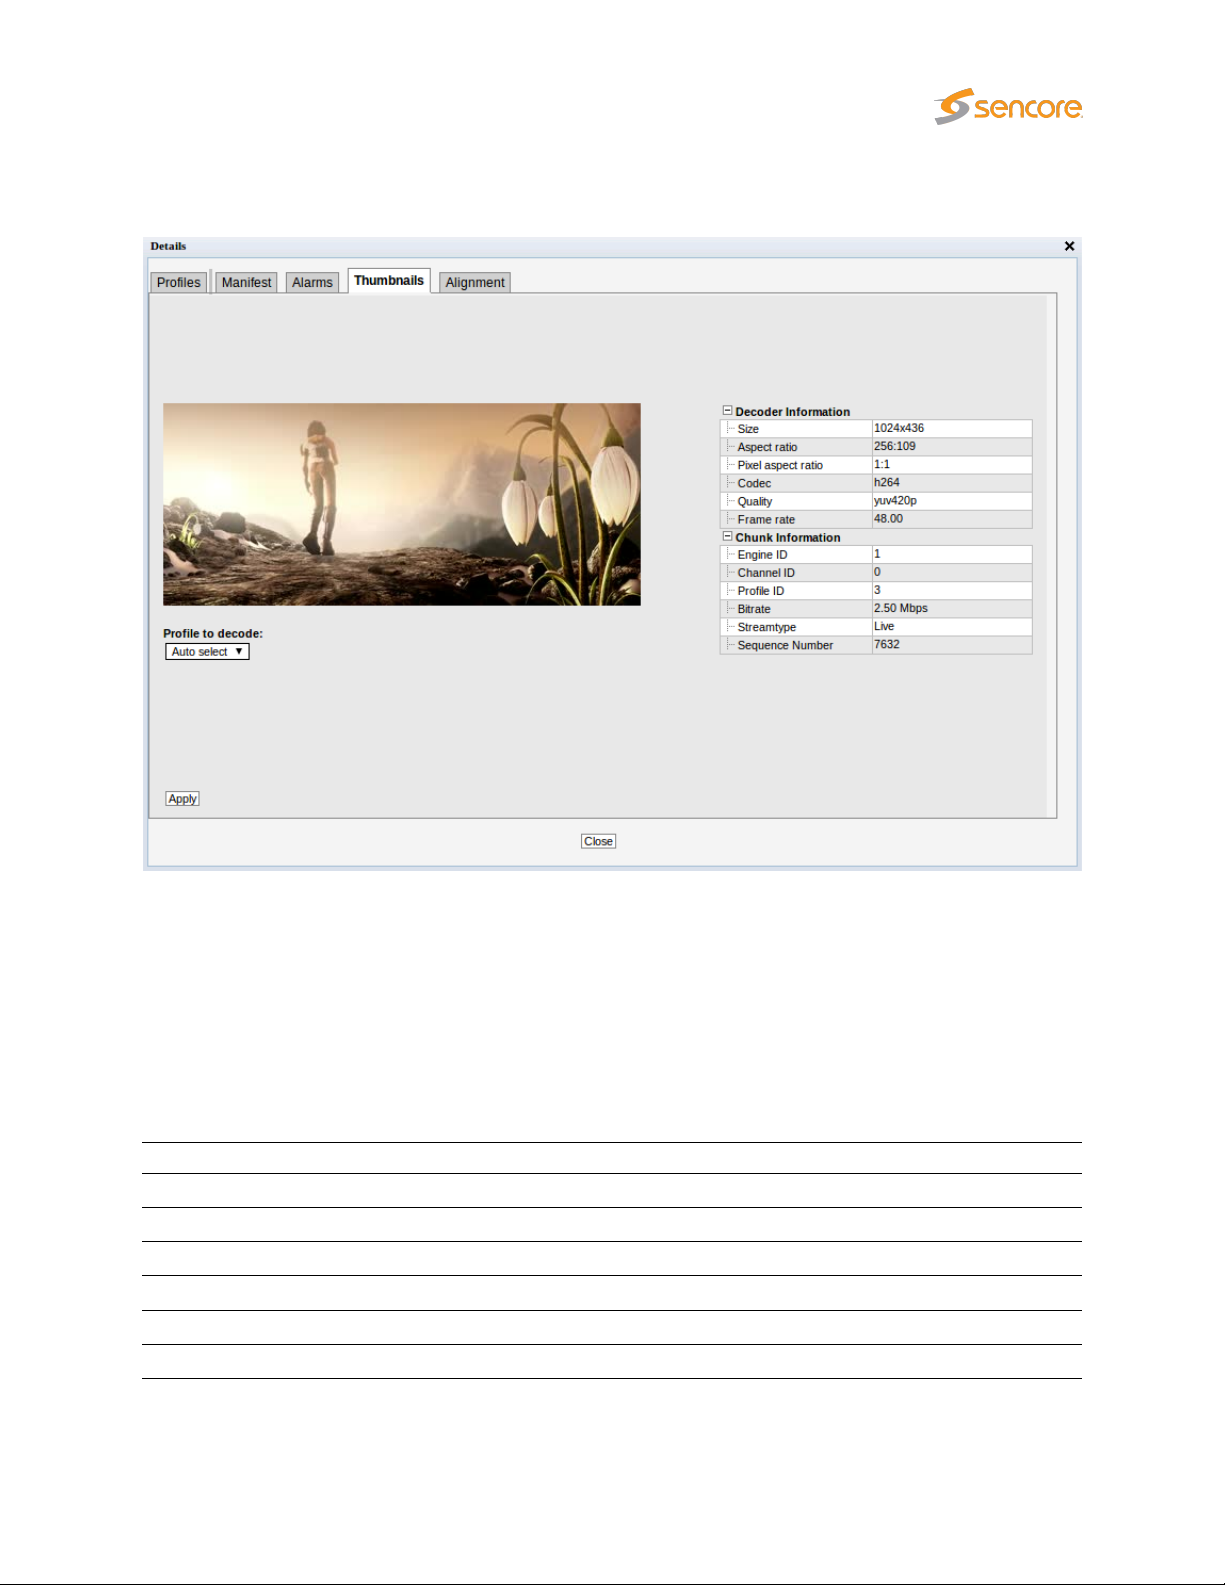
6.3.2.4 OTT — Details — Thumbnails
The Thumbnails tab will provide information about the current thumbnails in the channel.
The quality of the content in the selected profile can be viewed in the thumbnail section, and the user
may alter the selected profile in the drop down list.
The section on the right hand side provides specific decoder and chunk information.
By pressing the
switched to the default selection;
and video data.
Aspect ratio: The video aspect ratio of the selected profile
Pixel aspect ratio: The video pixel aspect ratio of the selected profile
Frame rate: The video frame rate of the selected profile (Hz)
Apply
Size: The video picture size of the selected profile
Codec: The video encoding format of the selected profile
Quality: The video sampling format of the selected profile
button without selecting a profile from the drop-down list the thumbnail will be
Auto select
. Auto select will select the profile with the highest bitrate
Decoder information
VB3xx 10G Probe User’s Manual version 5.3 55
Page 56

Chunk Information
Engine ID: The OTT engine monitoring the selected channel.
Channel ID:
Profile ID: The ID of the selected profile.
Bitrate: Bitrate rate of the a chunk.
Streamtype: The type of the stream detected; live or video on demand.
Sequence Number: The sequence number of a chunk.
The ID of selected channel corresponding to the list of channels defined by the
user.
6.3.2.5 OTT — Details — Alignment
The Alignment tab gives the user a view of all the profiles for a selected channel with thumbnails and
corresponding data.
Profile Alignment Information
Profile:
This is a generated ID that identifies the OTT profile. The first profile
listed is always the one with the highest signaled bitrate.
56 VB3xx 10G Probe User’s Manual version 5.3
Page 57

Chunk/Sequence Number:
Bitrate: The signaled bitrate for this profile (bits/s).
Size & FPS: Indicates the original video size (pixels) and the frame-rate (Hz).
Audio: Indicates the audio channel layout.
The chunk or sequence number for the current thumbnail. This is either
signaled in the stream, or generated by the probe.
If the sequence numbers are highlighted in yellow, the thumbnails are
not generated from the same chunk for all profiles, and may therefor
appear to be out of synchronization.
VB3xx 10G Probe User’s Manual version 5.3 57
Page 58
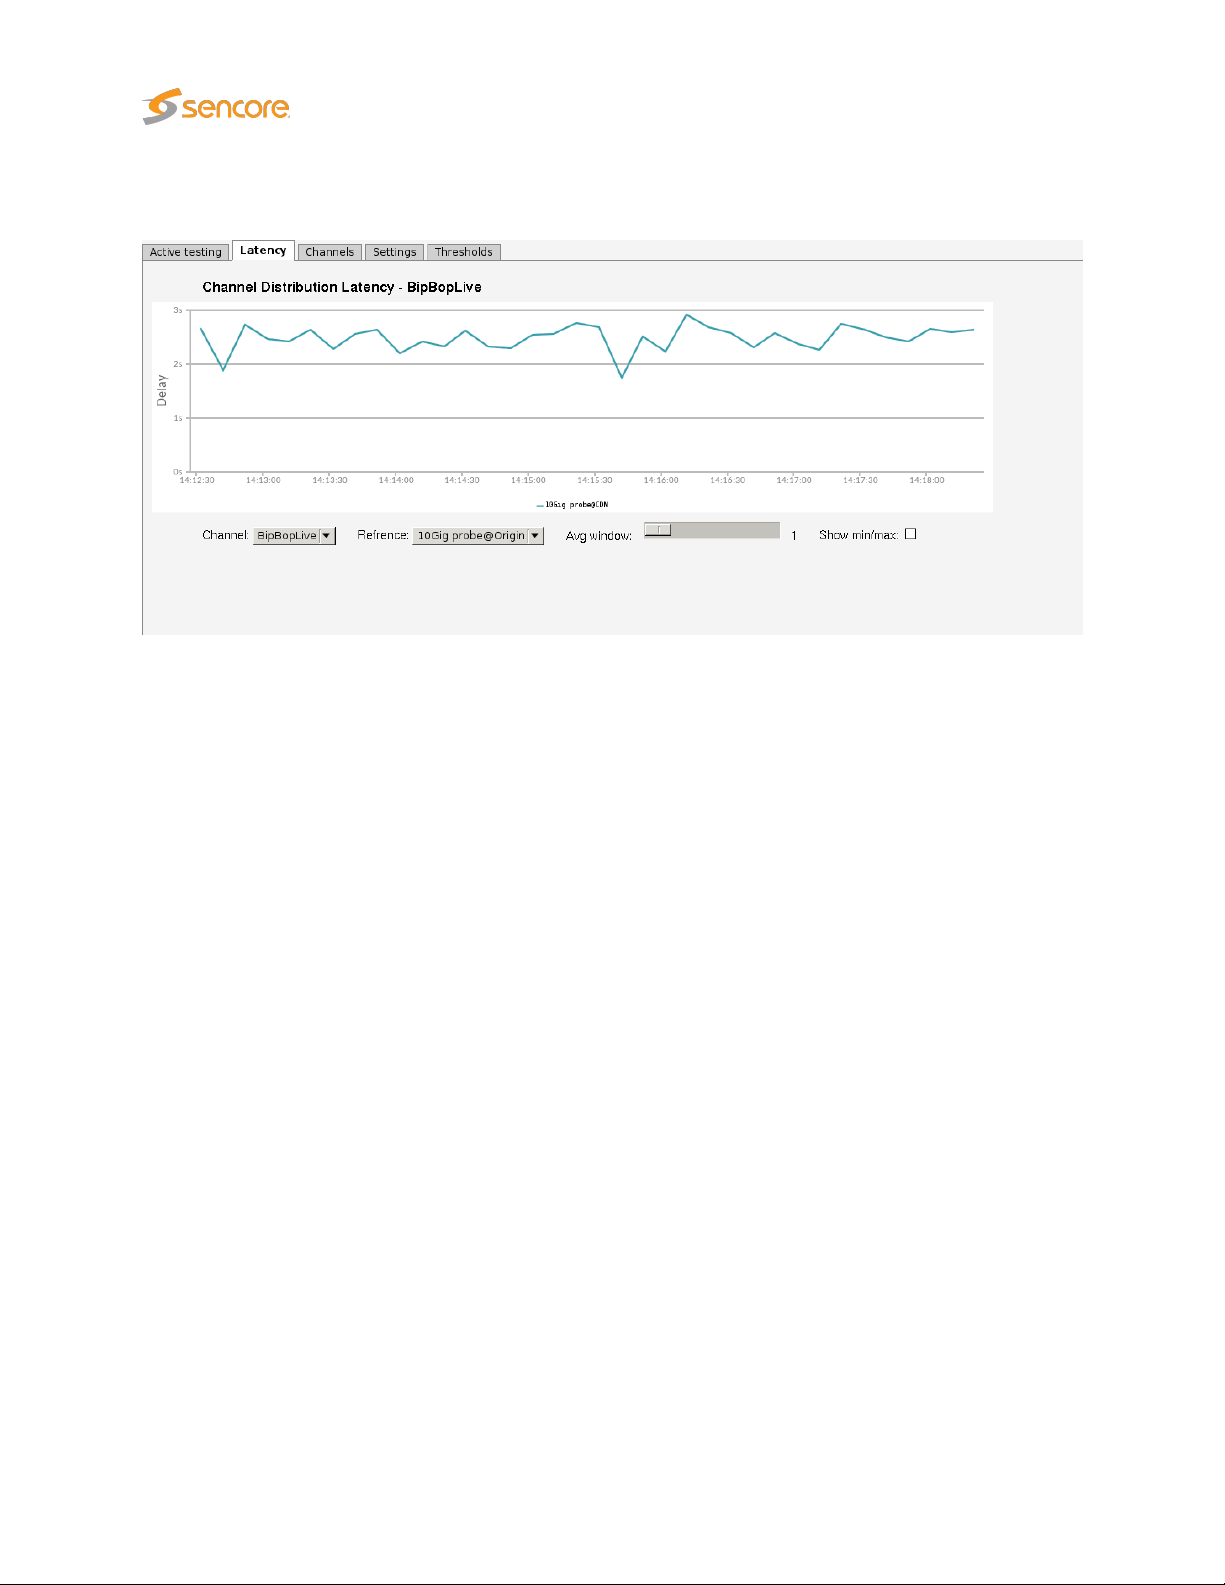
6.3.3 OTT — Latency
The OTT Channel Latency Distribution feature makes it possible to measure the delay from when a chunk
is available through different caches, compared to its origin.
Before using this feature, you must set aside a number of OTT engines to exclusively measure the timings
of one channel on one server. This is done in the
use two Latency Engines per channel: one for the origin and one for the cache.
OTT — Settings
view. In general, you would need to
After selecting the number of Latency Engines, open the
from multiple sources (URLs), using the same base name, but different
TV1
@CDN
this server, or
will use one dedicated Latency Engine, if you try setting
Engine available, it will default back to Normal.
Once the configuration is finished, you are ready to use this feature. Select the channel to produce a
latency graph for using the
be used as the reference in the
The graph will start off showing the difference in availability time of each chunk for the last minute and
will build up history until displaying the last hour. Due to the nature of timing in different engines, these
measurements are accurate down to±0.5 seconds. To minimize these inaccuracies, a moving average
is provided, smoothing the spikes. The sliding window can be manually controlled by moving the
window
min/max checkbox.
. Then set the
Both
slider. It is also possible to display the minimum and maximum values by checking the
Measurement modetoLatency
if you also want the traditional Active Testing measurements. Each added channel
Channel
drop-down. Then select which of the classes of the channel that is to
Reference
drop-down. This is used to calculate the time delta difference.
OTT — Channels
if you are only interested in the timings from
LatencyorBoth
view and add the channel
classes
, e.g. TV1
and there is no free Latency
@Origin
and
Avg
Show
58 VB3xx 10G Probe User’s Manual version 5.3
Page 59

6.3.4 OTT — Channels
The OTT Channel Configuration list shows OTT channels configured by the user.
To add a channel to the list click the
view, allowing the user to define channel parameters. A channel entry can be selected by clicking the
channel; the list entry will be highlighted. Several list entries can be selected by using regular Ctrl
+ click functionality. Clicking the
with all channel parameters duplicated, except the channel name. Clicking
the highlighted list entry. Clicking
licensed OTT engines (the VB330 can be licensed with up to 50 OTT engines). Clicking
open the
this is convenient if a new threshold template should be assigned to a number of channels or if monitoring
of several channels should be enabled or disabled. Select the channels and click the
button. Parameters differing between channels will be indicated in the
asterisk wildcard symbol.
The search field in the upper right corner of the view allows the user to type a text string, and the OTT
channel list is updated to display only channels matching the specified text.
Edit channel
pop-up view associated with the highlighted channel. Batch editing is supported;
Add new channel
Duplicate selected
Distribute selected
button. This will open the
button will open the
will distribute the selected channels across the
Edit selected
Edit channel
Edit channel
Delete selected
pop-up view
Edit selected
Edit selected
pop-up view by an
pop-up
will delete
will
VB3xx 10G Probe User’s Manual version 5.3 59
Page 60

Enabled:
Select engine:
General
Check the ‘Enabled’ check box to start monitoring the OTT service.
A number between 1 and 50, depending on license activated,
indicating which OTT engine the channel uses.
Threshold:
VBC thresholds:
Measurement mode
Name:
Manifest URL: The URL of the OTT channel.
Player URL:
Smooth Streaming target chunk
The OTT threshold that should be assigned to the OTT channel.
OTT thresholds that have been defined in the
olds view are available for selection from the drop-down menu.
The alarm threshold template used to configure when alarms are
generated towards the VBC server.
Specify if you want
Channel Distribution
measurements for this channel.
Each channel you set to either
Latency Engine. If you do not have any spare, it will be set back
to Normal. See OTT — Latency for more info.
A name should be assigned to each OTT channel. The name
will be used throughout the probe’s user interface when referring
to this channel.
In this field you can enter the URL to a web page which will
open the OTT channel in your browser. If entered, a ‘play’ button
will be displayed in the OTT overview tab, which will open the
selected URL in a new browser tab.
For Smooth Streaming, this specifies which chunk, counted from
the bottom of the list, the probe should download when doing
active testing on a live channel. For other formats, this option is
ignored.
Normal
Latency
active testing measurements, OTT
measurements, or
LatencyorBoth
OTT — Thresh-
Both
kinds of
uses up one
RTMP: Check this check box if the channel is an RTMP channel.
RTMP live: Check this check box if the RTMP channel is a live service.
Thumbnail:
Alignment:
If the thumbnail option is enabled thumbnails will be available
for the selected channels in the Active testing and Thumbnails
sections.
If the alignment option is enabled the alignment section will be
available.
60 VB3xx 10G Probe User’s Manual version 5.3
Page 61

Enable adv. settings:
Method:
Adv. manifest
Check this box to enable the advanced manifest settings. If unchecked, all
settings on this page are ignored.
Determines which HTTP method to use when requesting the top-level manifest file. Supported methods are GET and POST.
Content-Type:
Additional headers:
Body:
The advanced manifest options can be used in instances where the master manifest file is not directly
available to download. If your channel needs serveral steps of authentication or other web service calls
before supplying clients with an URL to the master manifest, you can make an “in-between” web service
which the probe sends all required info to do the authentication and/or channel lookups through this
interface, and which returns an JSON file with an “url” parameter containing the URL to the master
manifest file.
When requesting the manifest using the HTTP
for the submitted request body.
To provide additional custom request headers or overwrite the default headers when requesting the top-level manifest file, create a text file containing
the headers and upload them here.
When requesting the manifest using the HTTP
submit here.
POST
, use this Content-Type
POST
, upload the file to
VB3xx 10G Probe User’s Manual version 5.3 61
Page 62
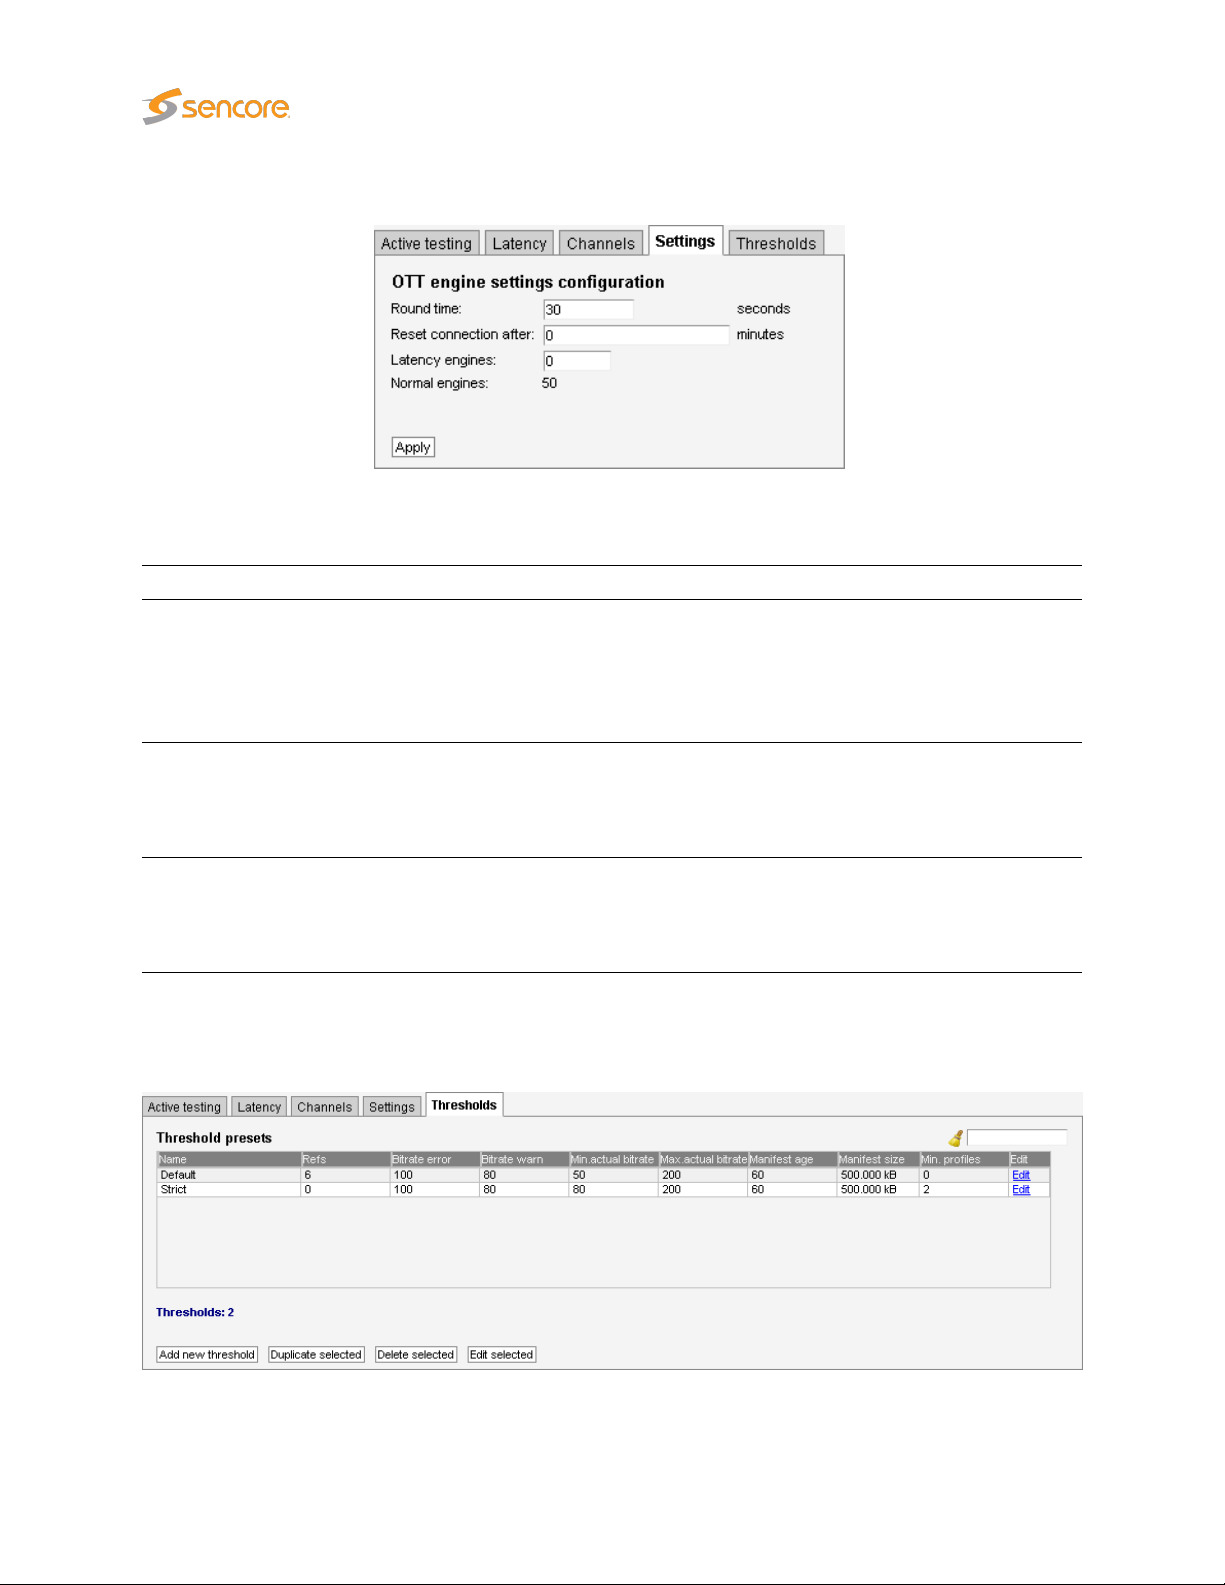
6.3.5 OTT — Settings
The Settings tab makes it possible to change OTT global monitoring parameters. Press
changes made.
Settings
Round time:
Reset connection after:
Latency engines:
Sets the minimum round time of all of the OTT engines, in seconds (default:
15 seconds). If an engine finishes processing all its channels in less time
than this, it waits until this amount of seconds has passed since it started
the round before starting to process through its channels again.
Note: The round time may not be set to any value less than 2 second.
Configures the VB330 OTT engines to reset the connections after the
specified number of minutes. This is useful for cases where the server
has a limit for how long a session can live. By resetting before that limit a
new session is created and the problem is avoided.
Select the number of engines to dedicate to OTT latency monitoring.
These engines will not be available for regular OTT monitoring, and the
value must be less than the total number of licensed OTT engines on the
probe (up to 50 for the VB330). See OTT — Latency for more info.
6.3.6 OTT — Thresholds
Apply
to confirm
The OTT Threshold presets list shows OTT threshold templates configured by the user.
62 VB3xx 10G Probe User’s Manual version 5.3
Page 63

To add a threshold template to the list click the
threshold
be selected by clicking the threshold template; the list entry will be highlighted. Several list entries can
be selected by using regular Ctrl + click functionality. Clicking the
the
Edit threshold
template name. Clicking
open the
is supported. Select the threshold templates and click the
between templates will be indicated in the Edit selected pop-up view by an asterisk wildcard symbol.
The search field in the upper right corner of the view allows the user to type a text string, and the threshold
list is updated to display only thresholds matching the specified text.
To disable a threshold alarm, set the threshold value to –1. This does not apply for Manifest XML size.
pop-up view, allowing the user to define threshold parameters. A threshold template entry can
pop-up view with all threshold template parameters duplicated, except the threshold
Edit threshold
Name: The threshold template name defined by the user.
Refs: The number of channels associated with the threshold template
Delete selected
pop-up view associated with the highlighted threshold template. Batch editing
will delete the highlighted list entry. Clicking
Threshold preset
Add new threshold
Duplicate selected
Edit selected
button. This will open the
button will open
Edit selected
button. Parameters differing
Edit
will
Download speed error:
Download speed warn:
Actual bitrate min:
Actual bitrate max:
Sequence age:
Manifest XML size:
Min. profiles:
The maximum allowed difference between profile bitrate and download
bitrate (%). If the difference exceeds the threshold value a bitrate error
alarm will be raised.
The maximum allowed difference between profile bitrate and download
bitrate (%). If the difference exceeds the threshold value a bitrate error
warning will be raised.
The minimum allowed bitrate when measured actual bitrate is compared to
profile bitrate (%). If the actual bitrate goes below the threshold an actual
bitrate alarm will be raised.
The maximum allowed bitrate when measured actual bitrate is compared
to profile bitrate (%). If the actual bitrate exceeds the threshold an actual
bitrate alarm will be raised.
The maximum time a manifest can remain unchanged before a manifest
age alarm is raised.
The maximum detected size of the manifest before a manifest size alarm
is raised.
Minimum number of profiles in the selected channel before an alarm is
raised.
VB3xx 10G Probe User’s Manual version 5.3 63
Page 64
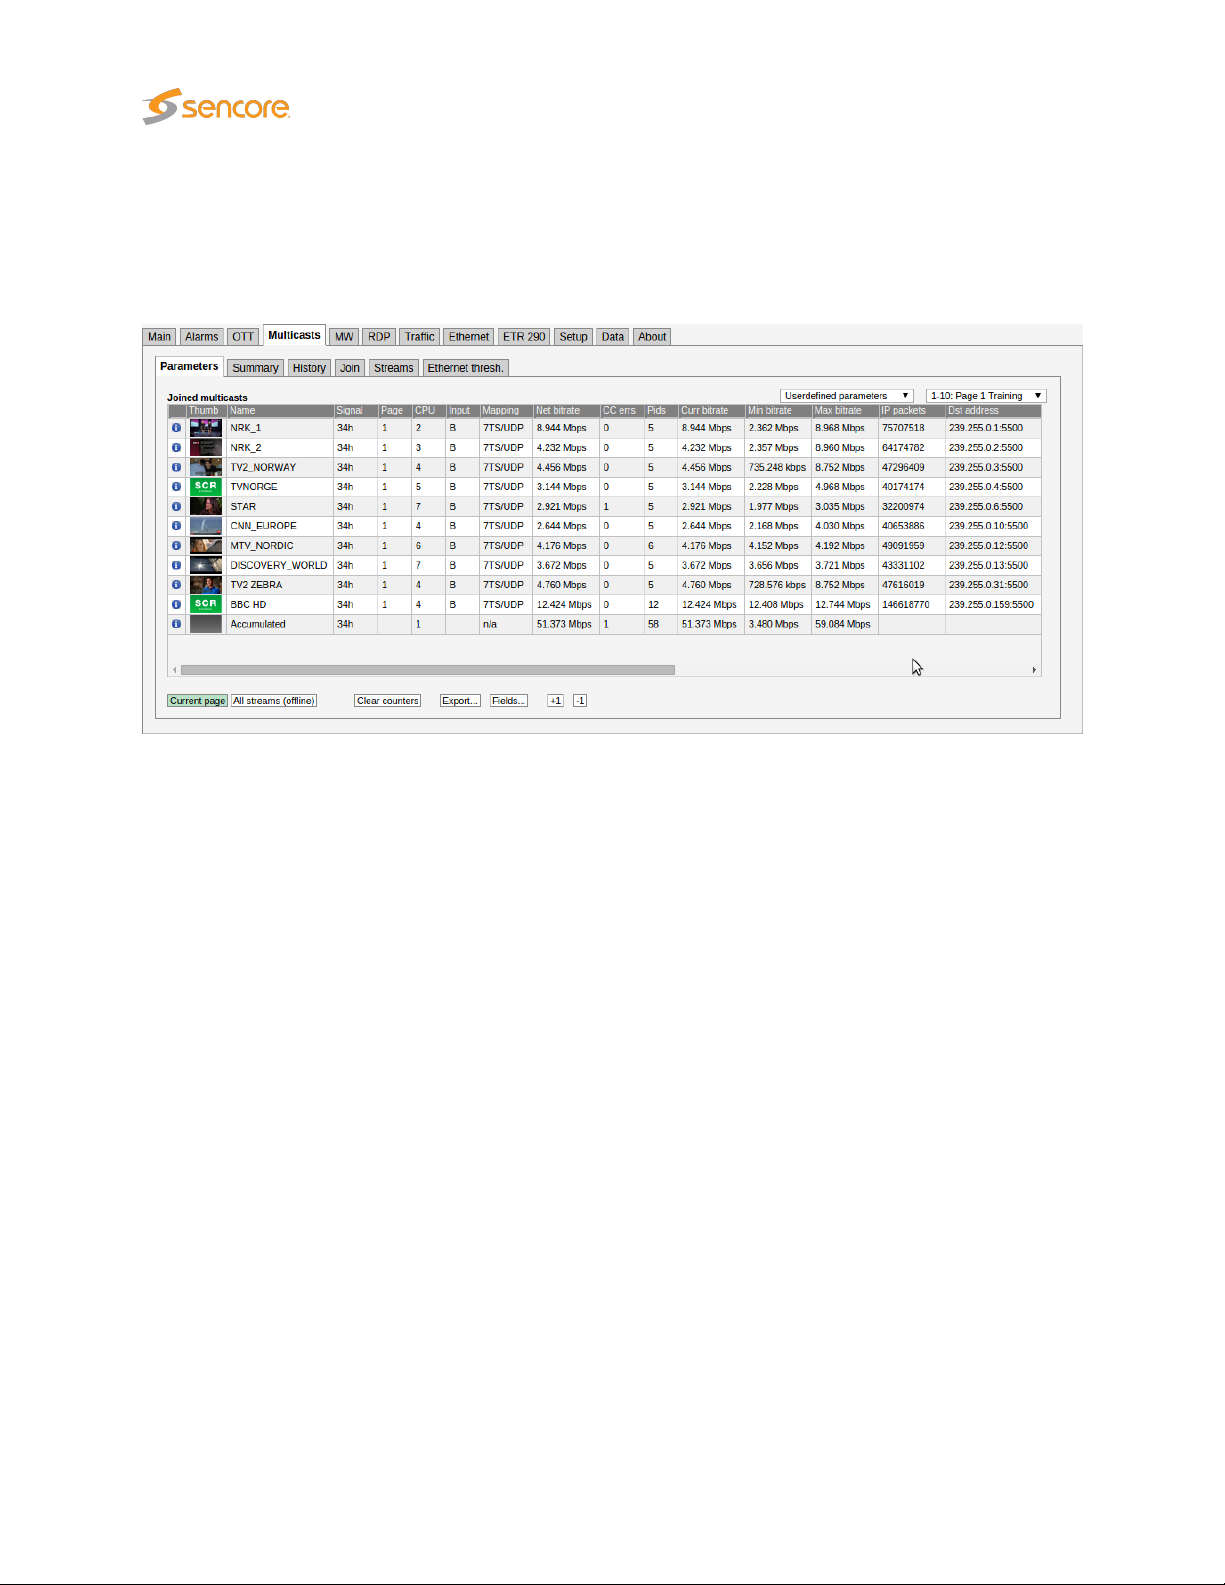
6.4 Multicasts
6.4.1 Multicasts — Parameters
The Multicasts — Parameters view displays detailed information about each stream.
The user selects which group of measurements should be displayed. Selections are IP parameters, TS
parameters, Ethernet parameters, RTP and FEC parameters, User-defined parameters and Statistical
parameters. If User-defined parameters is selected, the
by the user in the Multicasts — Parameters — Fields view.
For each page the Accumulated row at the bottom of the multicast list displays accumulated values for all
streams associated with the page. The accumulated Min bitrate and Max bitrate is the minimum and
maximum value of the Accumulated current bitrate.
When the
associated thumbnails are shown in the leftmost column of the list of measurements. Click one of the
small thumbnails to view a larger thumbnail that is updated more frequently. Note that it is possible to
disable probe thumbnail extraction in the Setup — Params view.
When
A search field allows the user to type a text string and the multicast list is updated to display only
multicasts matching the specified text. Note that monitoring parameters and thumbs will not be updated
in All streams (offline) mode.
Current page
All streams (offline)
button is clicked it is possible to select the page from a drop-down menu. The
is clicked a complete list of measurements for all joined streams is displayed.
Multicasts
view displays parameters selected
64 VB3xx 10G Probe User’s Manual version 5.3
Page 65

Peak and aggregate measurements are cleared when the
button is clicked.
Clicking the Export button will allow export of the measurement data as an XML file that is opened in a
new window.
Clear countersorClear counters all pages
Click the
from the list. The
indicated by the selected time button (Last 4d, Last 24h, Last 8h, Last 20m, Last 1m).
Clicking a stream brings up the Detailed monitoring pop-up described later in this section.
In
All streams (offline)
updated to display only multicasts matching the specified text.
Trim ch-list
Statistical parameters
button to unjoin streams with current status ‘No signal’, thereby removing them
view lists sum or peak values for parameters over the interval
mode a search field allows the user to type a text string and the multicast list is
VB3xx 10G Probe User’s Manual version 5.3 65
Page 66

Joined multicasts
i
: Click the information icon to access the Detailed Monitoring pop-up view.
Thumb:
Name: The stream name specified by the user in the Edit Multicast view
Signal: Time since last signal loss
Page: The page associated with the multicast
Mapping:
Net bitrate:
CC errs:
A thumbnail is displayed for each stream. Click the small thumbnail to view a larger
image that is updated more frequently.
For MPEG-2 Transport streams, the number of MPEG-2 packets mapped into each
RTP or UDP packet is displayed here. For SMPTE 2022-6 SDI over IP streams,
“SDI/RTP” is displayed, and for other unsupported RTP streams, “RTP data” is
displayed.
Instantaneous MPEG-2 Transport Stream bitrate excluding null packets (PID 8191).
The instantaneous bitrate is measured over a time period of 1000 ms.
The number of times a discontinuity has been detected for all the MPEG-2 Transport
Stream continuity counters. This value is the total number of discontinuities detected
for all PIDs present. Note that this value does NOT represent the number of MPEG-2
TS packets lost because any continuity counter mismatch detected for an IP-frame
will increase CC errs by one. CC errors are serious as they will in practice usually
result in visual video artefacts (‘blocking’) if occurring on the video PIDs. CC errors
can be due to an erroneous input signal to the streaming head-end (e.g. from
satellite rain fading or changes in the uplink). Alternatively, CC errors can arise from
IP packets being dropped in the network.
PIDs: Number of PIDs in the MPEG2-TS
Syncb errs: Number of transport stream packets with wrong syncbyte (0x47)
Curr bitrate:
Min bitrate: The minimum current bitrate measurement
Instantaneous MPEG-2 Transport Stream bitrate including null packets (PID 8191).
The instantaneous bitrate is measured over a time period of 1000 ms. For non-TS
traffic the bitrate is calculated from the size of the UDP payloads.
66 VB3xx 10G Probe User’s Manual version 5.3
Page 67

Max bitrate: The maximum current bitrate measurement
IP packets: The number of IP packets received
Dst address: Multicast/unicast destination address : port
TOS: Type-Of-Service (also called Differentiated Services Field)
TTL: Time-To-Live
VLAN ID: Native VLAN ID of this stream
Src address: Multicast/unicast source address : port
Joined src: The source address of the originally joined multicast.
IAT avg:
IAT min:
IAT max:
Src MAC: Source MAC address
Dst MAC: Destination MAC address
RTP drops:
RTP dups:
Average Inter-Arrival Time. The average time between consecutive IP frames (in
milliseconds). Recalculated each second.
The Minimum Inter-Arrival Time is the minimum registered time between two consecutive IP frames carrying video. Units are in milliseconds.
The Maximum Inter-Arrival Time is the maximum registered time between two
consecutive IP frames carrying video. Units are in milliseconds. The Max-IAT is
a measure of the maximum amount of network-induced packet jitter present. IP
packet jitter affects video quality and should be minimized.
Accumulated number of dropped IP-frames due to network errors. Only available for
multicasts that carry RTP information. When running video inside an RTP wrapper
it is possible to exactly deduce the number of dropped IP frames due to network
issues. This is possible as a result of the 16-bit sequence counter inside the RTP
header. The following sequence will generate an RTP drops of +3: . . ., 10, 11, 12,
16, 17, 18, . ..
Accumulated number of duplicate IP-frames. Only available for multicasts that
carry RTP information. Duplicate IP-frames in the network can occur under normal
circumstances and does not necessarily indicate network problems. The following
sequence will generate an RTP dups of +2: . . . , 10, 11, 12, 12, 12, 13, 14, . . .
RTP ooo:
RTP lag:
Min hole size:
Accumulated number of times a packet has been found to be out of order. Only
available for multicasts that carry RTP information. An out-of-order situation is
defined to have occurred when the current sequence number is lower than the
previous one. The following sequence will generate an RTP ooo of +2 (since there
are two occurrences): . .. , 10, 11, 15, 12, 16, 17, 13, 14, 18, 19, . ..
The maximum number of packet positions an out-of-order packet has been moved
relative to its correct position. So for example 1,2,3,5,6,7,8,4,9,10 will result in an
RTP lag of 4. The RTP lag is a good measure of how big a packet re-ordering buffer
is needed in the receiving equipment to re-order packets.
Minimum number of consecutive dropped RTP packets. The sequence
1,2,3,10,11,12,15 gives a min hole size of 2.
VB3xx 10G Probe User’s Manual version 5.3 67
Page 68

Max hole size:
Maximum number of consecutive dropped RTP packets. The sequence
1,2,3,10,11,12,15 gives a max hole size of 6.
Min hole sep:
Num holes:
FEC mode: The CoP3 FEC mode
FEC drops: Number of RTP packet drops in the main stream that the FEC could not correct
C-FEC drops: Number of IP packets in the column-FEC streams dropped
R-FEC drops: Number of IP packets in the row-FEC streams dropped
Minimum number of RTP packets separating any holes. The sequence
1,2,3,10,11,12,15 gives a min hole sep of 3.
Number of packet loss sequences. The sequence 1,2,3,10,11,12,15 gives a num
holes of 2.
Statistical parameters
MPEG-2 transport stream parameters
i
: Click the information icon to access the Detailed Monitoring pop-up view.
Name: The stream name specified by the user in the Edit Multicast view
ES(IAT):
ES(MLR):
Number of seconds during selected period with Inter-packet Arrival Time higher than
associated Ethernet IAT warning threshold
Number of seconds during selected period with Media Loss (corresponding to number
of seconds with CC-errors)
ES(RTP): Number of seconds during selected period with RTP packet drops
ES(overfl): Number of seconds during selected period with bitrate overflow
ES(nosig): Number of seconds during selected period without signal
Peak(IAT): Peak Inter-packet Arrival Time during selected period.
Sum(MLR): Sum of Media Loss during selected period (equals number of TS packets lost)
Peak(bitr): Peak stream bitrate during selected period
Thumbnails
The probe will try to generate thumbnail pictures for all streams. For multi-program transport streams
(MPTS) the first video component is selected. MPEG-2, H.264/MPEG-4, H.265/HEVC and JPEG 2000
video formats in standard definition, high definition or ultra-high definition are supported in MPEG-2
transport streams, as well as SMPTE 2022-6 uncompressed video in RTP streams.
The thumbnail update rate will depend on how the streams are coded and if they are standard definition,
high definition or ultra-high definition. It is possible to increase the update rate by opening the
View pop-up, described below.
If the probe is unable to generate a thumbnail from the signal, it will present one of the following icons:
Thumb
68 VB3xx 10G Probe User’s Manual version 5.3
Page 69

Shown if no data is received for the stream. There should be a match between presenting
this icon and a No-signal alarm; however since the alarm and thumbnail mechanisms
work independently of each other they have been given different names (loss of signal
and no signal).
Shown while the thumbnail engine is trying to decode a thumbnail picture and more
precise status information has not yet been obtained. This icon is typically displayed after
probe reboot or if new streams have recently been joined.
Shown if the service does not carry a video PID — which is the case for radio services.
The stream contains no service, as signaled in PSI/SI.
The signal cannot be decoded due to excessive CC errors or RTP packet drops.
The probe does not support thumbnail generation for this protocol mapping.
The signal is recognized as being MPEG-2 encoded but the thumbnail extractor is unable
to correctly decode a thumbnail picture.
The signal is recognized as being MPEG-4/H.264 encoded but the thumbnail extractor is
unable to correctly decode a thumbnail picture.
The signal is recognized as being MPEG-H/H.265 encoded but the thumbnail extractor is
unable to correctly decode a thumbnail picture.
The signal is recognized as being JPEG 2000 encoded but the thumbnail extractor is
unable to correctly decode a thumbnail picture.
The signal is recognized as being an uncompressed (raw) video stream but the thumbnail
extractor is unable to correctly decode a thumbnail picture.
This icon is shown if the probe is unable to receive or analyze the PMT PID. Only streams
with PSI information can have thumbnails decoded since the probe does not support a
manual specification of the video PID.
The probe can only generate a thumbnail picture if the video data is not scrambled.
VB3xx 10G Probe User’s Manual version 5.3 69
Page 70

Detailed Monitoring
The Detailed Monitoring pop-up is activated by clicking a stream line in the monitoring list.
The 10G Probe is continuously gathering detailed information for the selected multicast. The VB330 will
continue updating the detailed information for the selected multicast until another is selected. Clicking
the Clear button will clear all information about the selected stream, including PSI/SI analysis data.
The
Detailed Monitoring — Services
tables) or SMPTE 2022-6 SDI over IP components, providing the following aggregate information for
each service:
Service/Pid:
Service/Component:
Bitrate: Service or component bitrate in bits per second
Min bitr.: Minimum service or component bitrate in bits per second
Max bitr.: Maximum service or component bitrate in bits per second
CC errors: Number of Continuity Counter occurrences
Thumb: Click the
Type: The list entry service type or PID type
PCR: This field will be checked if the corresponding PID carries PCR
For each service, the service-name or service-id is obtained from the PSI/SI
tables. PIDs that do not belong to a service are denoted ‘Other PIDs’. The
service ID is presented in square brackets.
This replaces the “Service/Pid” column for SMPTE 2022-6 SDI over IP
streams, displaying the identified components.
view lists detected MPEG-2 TS services (by analyzing the PSI/SI
i
icon to access the Thumb pop-up view, explained below
Scr: This field will be checked if the corresponding PID is scrambled
70 VB3xx 10G Probe User’s Manual version 5.3
Page 71

Directly beneath this list, the current parameters for the selected stream are displayed, as in the
multicasts list.
In the
Detailed Monitoring — IAT
of IAT measurements within each presented interval. Vertical green lines indicate the maximum and
minimum IAT values. By clicking the IAT range buttons it is possible to change the zooming of the graph. If
the
IAT auto
IAT readings.
button is pressed the diagram will auto-scale to always include the minimum and maximum
view the
Inter Arrival Time
histogram shows the accumulated number
Joined
The IAT histogram is a very useful and intuitive measure of how well the network is performing in terms
of forwarding real-time traffic. A predictable and tightly bunched graph indicates small levels of network
jitter. An unbound graph indicates network jitter issues typically brought forward by traffic congestion or
misconfigured routers. Clicking the Clear IAT button will clear the IAT graph.
Under the IAT histogram the
selected stream are displayed. Clicking the
stream, including PSI/SI analysis data.
Clicking the
in section 6.5.
Note that for variable bitrate streams the IAT histogram will show a very different IAT distribution compared
to the histogram for a constant bitrate stream. The histogram in the screenshot above displays the IAT
distribution for a CBR stream.
MediaWindow
Multicasts — Parameters (Current parameters)
Clear
button will clear all information about the selected
button will open the Media Window
Selected channel
measurements for the
view. This is described
VB3xx 10G Probe User’s Manual version 5.3 71
Page 72

Thumb View
The
Thumb View
Services
selected stream, with an increased update rate compared to non-selected streams. Service audio level is
indicated by one audio level bar per audio component. The same pop-up can be opened from the
— Thumb Overview view, see chapter 6.1.3 for more information.
Clicking the Close button will close the Thumb View view.
The following metadata is displayed for multicasts:
Language: The audio language, as derived from PSI/SI
Audio level:
The right-hand column will display the following detailed metadata:
view. This view presents a large thumbnail, as well as video and audio metadata for the
PID: The audio PID for which the associated parameters apply
Average: The average audio level in dB, measured over 0.4 seconds
Peak: The peak audio level in dB, detected during 0.4 seconds
pop-up is accessed by clicking an information icon in the
Audio fields
An audio level bar displaying the average audio level as a green bar referenced to the
peak audio level, the peak level being indicated by a white line
Detailed Monitoring —
Main
72 VB3xx 10G Probe User’s Manual version 5.3
Page 73

Multicast
Name:
Type: The type of the stream containing the selected service; multicast or unicast
Multicast address: The multicast address of the stream containing the selected service
Multicast port: The port number of the multicast containing the selected service
The name of the multicast containing the selected service, as defined by the
user
Transport stream ID:
Stream status:
Bitrate:
Controlbit scramble state: The scramble state as indicated by the MPEG TS control bit
PES sync scramble state: The scramble state as detected from the PES sync state
Number of PIDs/Components:
PID/Component:
The ID of the selected stream as shown in the list of multicasts in the Ethernet
section; non-TS services display 1 here
The status of the stream containing the selected service, as reported by the
decoding engine
The total stream bitrate of the multicast containing the selected service (bits/s)
Service
Service ID:
PSI/SI Name:
Bitrate: The total bitrate of the selected service (bits/s)
The service ID of the selected service; non-TS services display 1
here
The name of the selected service, as derived from PSI/SI; non-TS
services display the multicast name here instead
The number of PIDs or components associated with the selected
service
Video PID/Component
The video PID of the selected service for MPEG-TS services, or
the video component number for non-TS services
Has PCR: Yes if the selected stream contains PCR, No if not
Bitrate: The video PID bitrate of the selected service
PES sync: The latest PES sync state
PES length indicator:
Status: The status of the video PID as reported by the decoding engine
Size: The video picture size of the selected service
Aspect ratio:
VB3xx 10G Probe User’s Manual version 5.3 73
If signaled in the PES packet header, the PES packet length is
displayed; for non-TS services “N/A” is displayed
Video Information
The video aspect ratio of the selected service, or “N/A” if no information is available
Page 74

Pixel aspect ratio:
Codec: The video encoding format of the selected service
Quality: The video sampling format of the selected service
Frame rate: The video frame rate of the selected service (Hz)
PID/Component:
Type: The audio encoding standard
Has PCR: Yes if the selected Audio PID contains PCR
Language:
Bitrate: The audio bitrate for this PID or component (bit/s)
Is scrambled: ‘Yes’ if the audio PID is scrambled.
Peak level:
The video pixel aspect ratio of the selected service, or “N/A” if no
information is available
Audio PID/Component
The audio PID of the selected service for MPEG-TS services, or
the audio component number for non-TS services
Note that there may be several audio PIDs or components associated with a service
The language of the audio, as defined in the MPEG-TS Program
Map Table (PMT)
The peak audio level in dB, detected during a period of approximately 0.4 seconds
Average level:
Codec: The audio encoding format
Samplerate: The audio sample rate (Hz)
Channels:
Layout: The audio channel layout
Format: The binary format of the audio stream
Bitrate: The effective audio bitrate (bit/s)
The average audio level in dB, measured over a period of approximately 0.4 seconds
Audio Information PID/Component
The number of audio channels represented by the audio PID or
component
74 VB3xx 10G Probe User’s Manual version 5.3
Page 75
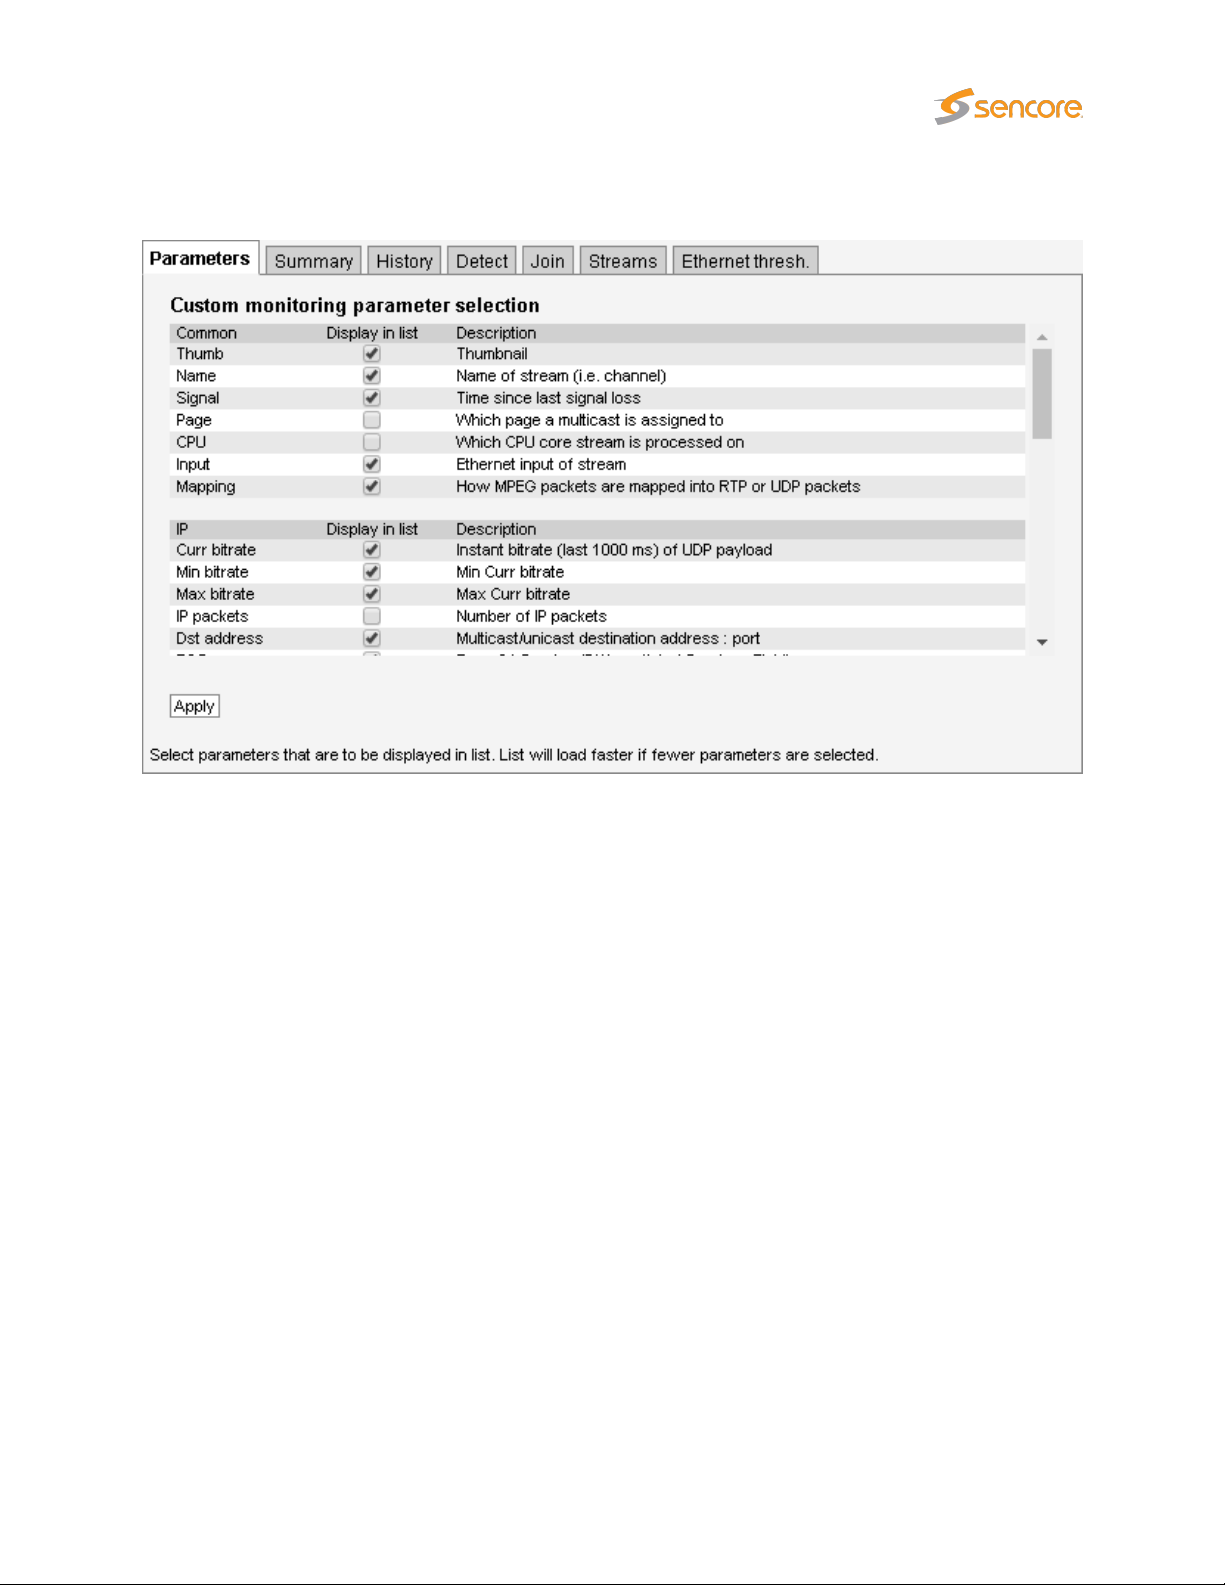
6.4.2 Multicasts — Parameters — Fields
The
Multicasts — Parameters — Fields
the
Multicasts — Parameters
view for thumbnail availability.
view enables selection of the parameters to be displayed in
view. Note that thumbnails must also be enabled in the
Setup — Params
VB3xx 10G Probe User’s Manual version 5.3 75
Page 76

6.4.3 Multicasts — Summary
The intention of this page, together with the
to immediately see if there is anything seriously wrong with one or more Ethernet input streams. The
overall status for the Full Service Monitoring (FSM) is also shown.
Throughout this view the bulb colors indicate the most severe active alarm. They may be green (no
alarm), yellow (warning), orange (error) or red (major). The bulb color is based on user defined alarm
severity settings for each alarm. A grey bulb indicates that monitoring is disabled.
The following Ethernet parameters are shown:
Eth streams withactive alarms:
Interface bitrate:
Monitoring:
Full Service Monitoring status:
The probe is capable of monitoring several thousand streams simultaneously. The probe splits streams
into pages for easy handling. Each of the 30 predefined pages can be given a name and have a user
defined number of streams associated.
alarm list
Shows the number of streams that are presently in an alarm state.
Note that the number of alarms counted refers to default settings,
and alarms disabled by the user will still be counted.
This is the total bitrate sensed on eth0. It should be greater than
or equal to the Monitoring bitrate.
This is the total number of Ethernet streams monitored and the
total bitrate for these streams.
The number of enabled FSM services / number of OK FSM services
, is to provide enough information for the operator
Part of the page-status is error-second statistics for the fundamental parameters
nosig summed across all streams belonging to that page.
76 VB3xx 10G Probe User’s Manual version 5.3
MLR,RTP,overfl
and
Page 77
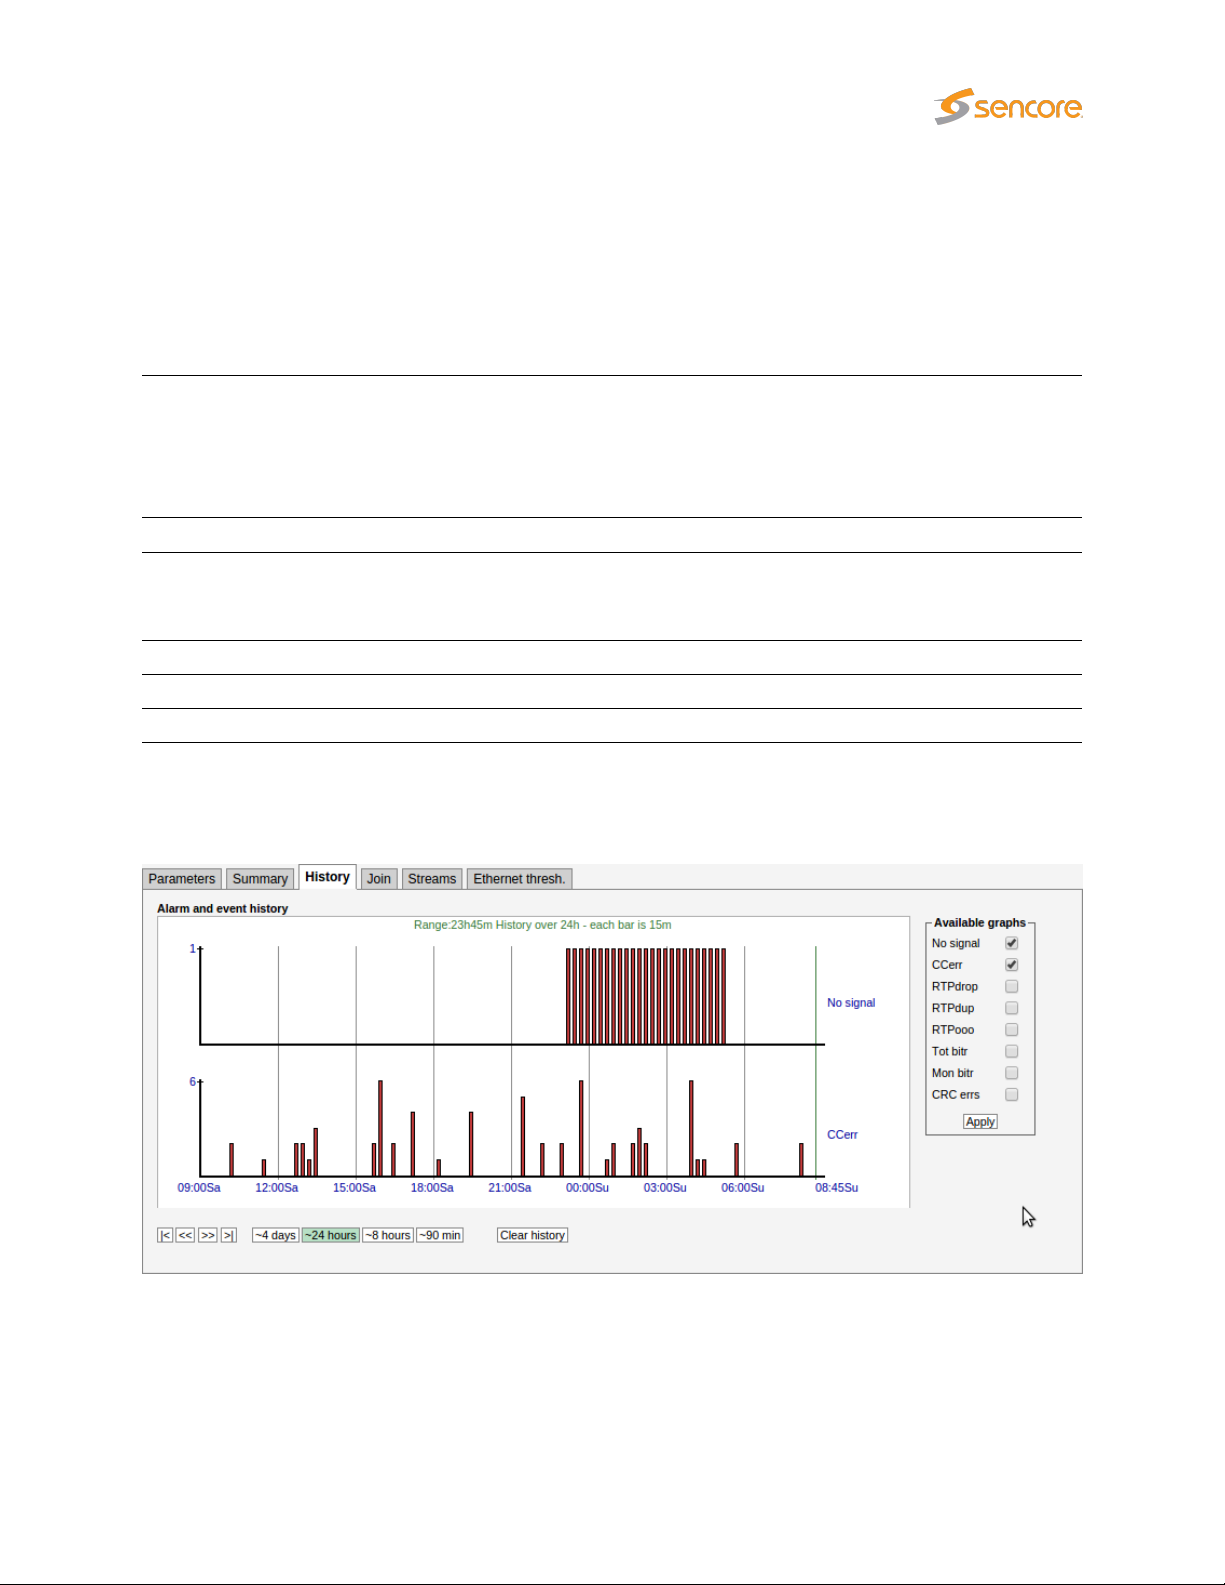
The error-second statistics interval is selected by clicking the buttons. For example, clicking the
button will present error-seconds for the last 8 hours. If 10 streams for a page have been without signal
for the last 8 hours, the nosig will show as 80hours.
The following parameters are presented (note that the error second values are accumulated from probe
boot time, and they will only be cleared by reboot or by clicking the
view):
Clear all
counters button in the
ES–8h
Main
‘Bulb’:
OK: Shows how many of the streams monitored on this page are without active alarms
ES(MLR):
ES(RTP): Number of seconds in selected period with RTP packet-drop
ES(overfl): Number of seconds in selected period with bitrate overflow
ES(nosig): Number of seconds in selected period where no signal (i.e. no data) was received
The bulb indicates the most severe active alarm for any of the streams on the page.
Active alarms are located on top of the alarm list. The alarm severity is reflected by the
color of the associated icon.
Next to the bulb is a link that will lead to the
page will present error-second statistics for each stream individually.
Number of seconds in selected period with continuity counter errors in the MPEG2
transport stream (which corresponds to the number of seconds with non-zero Media
Loss Rate).
Monitoring page
if pressed. The Monitoring
6.4.4 Multicasts — History
The probe keeps statistical Ethernet information for the last 4 days for visual inspection in the
timeline view.
Each bar in the histogram corresponds to a number of events that occurred within a certain time interval.
The interval that each bar represents depends on the scale, from 1 minute (when 90 min is selected) to 1
history
VB3xx 10G Probe User’s Manual version 5.3 77
Page 78

hour (when 4 days is selected).
Clicking the Clear history button will reset all history graphs.
Tool-tip information is available for each bar and shows the time-interval for the bar and its exact value.
For example, the tool-tip information ‘1315-1330:2’ means that within the time interval 13:15–13:30 there
were 2 occurrences.
The histogram is updated every minute.
Any subset of the following parameters can be selected, click the
No signal:
CCerr:
RTPdrop:
RTPdup:
RTPooo:
Tot bitr: Bitrate sensed on the eth0 interface
Mon bitr: Bitrate on eth0 corresponding to joined multicasts
CRC errs:
The number of streams that reported the ‘No signal’ alarm during the interval represented
by the bar.
The number of times a discontinuity has been detected for all the MPEG-2 Transport
Stream continuity counters in the interval represented by the bar. This parameter
corresponds to the sum of CC errs reported by all streams.
Accumulated number of dropped IP-frames due to network errors in the interval represented by the bar. This parameter corresponds to the sum of
streams.
Accumulated number of duplicate IP-frames in the interval represented by the bar. This
parameter corresponds to the sum of RTP dups reported by all streams.
Accumulated number of times a packet has been found to be out of order in the interval
represented by the bar. This parameter corresponds to the sum of
all streams.
Detected CRC errors. Ethernet CRC errors are most likely caused by a bad cable or a
misconfigured router. A CRC error may impact packet loss measurements such as CC
errors and RTP errors.
Apply
button for changes to take effect:
RTP drops
RTP ooo
reported by all
reported by
Note that the history graphs show the sum for all streams being analyzed across all pages. So for
example, if two streams experience No signal at the same time the No signal graph will increase by 2.
78 VB3xx 10G Probe User’s Manual version 5.3
Page 79
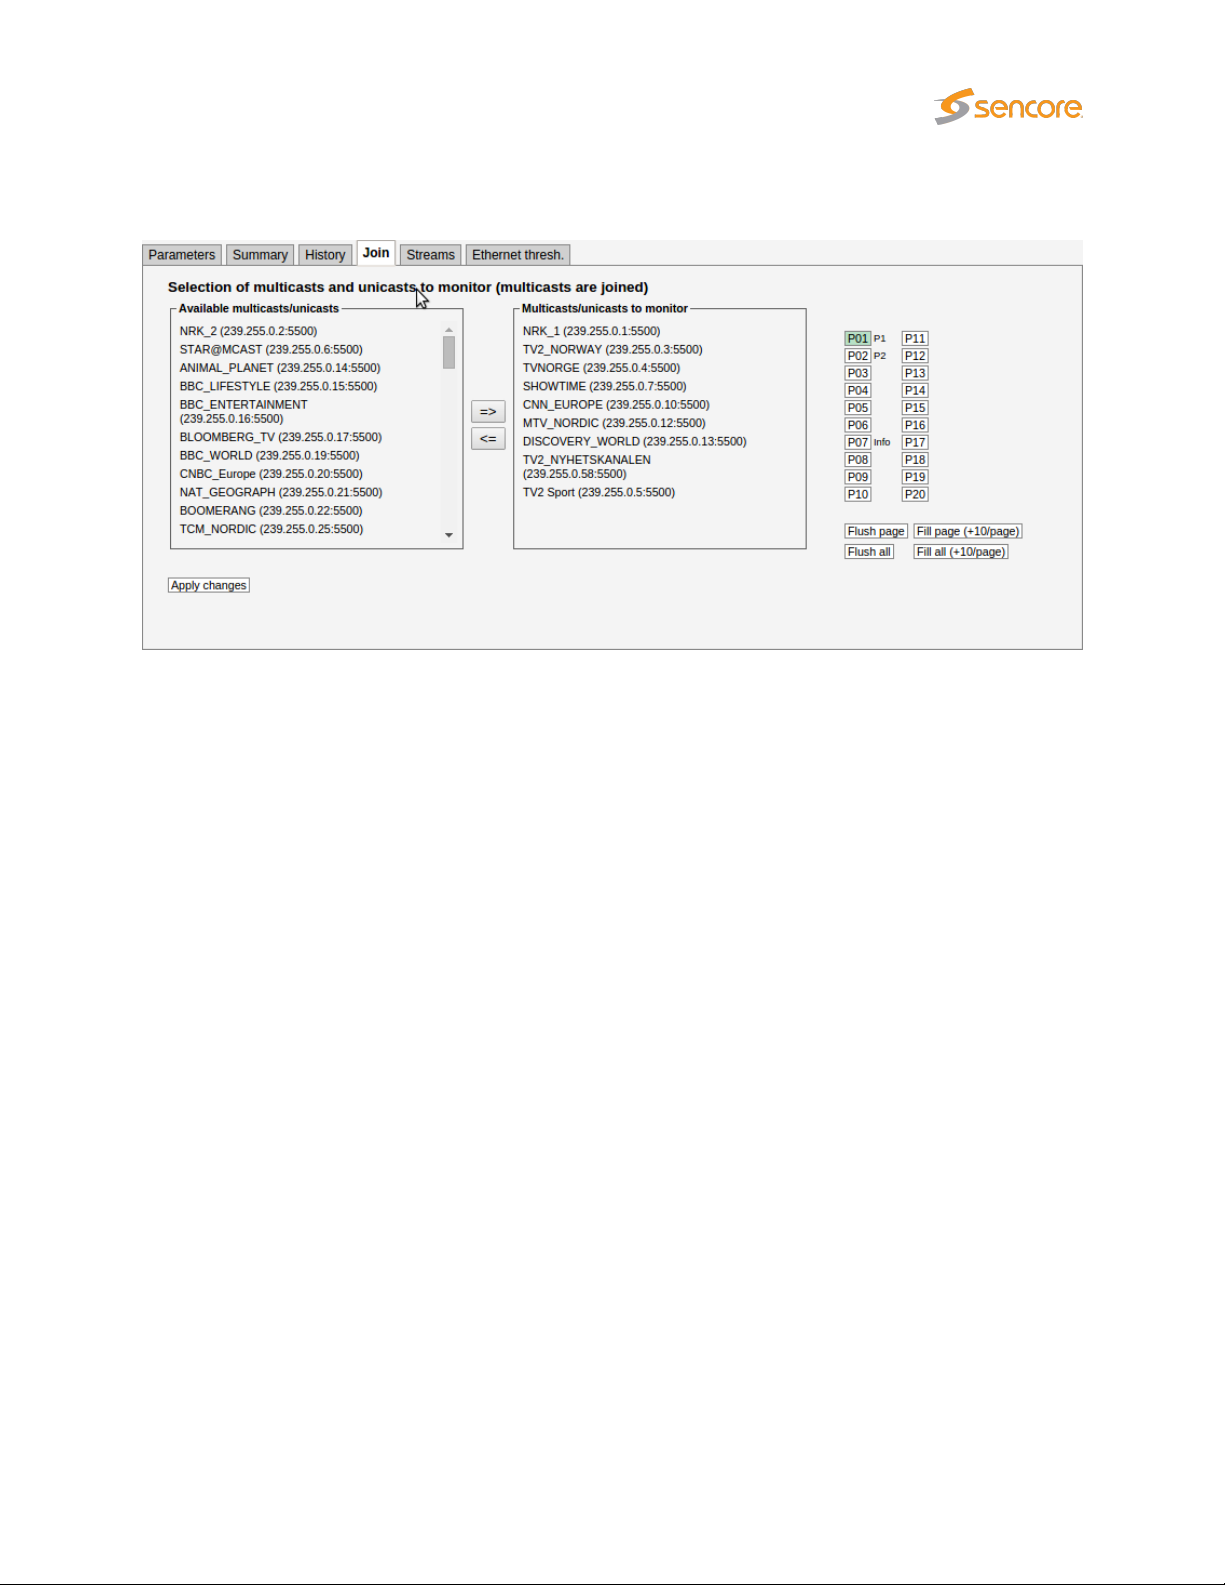
6.4.5 Multicasts — Join
In order for the defined Ethernet multicasts to be monitored by the probe, they must be joined. The
Multicasts — Join
that are joined by the probe.
view and the
Multicasts — Streams
view allow the user to select which multicasts
Streams defined in the
side of the arrows in this view. Select streams to be monitored by clicking them and moving them to
the right hand side of this view using the arrow. Changes should be confirmed by clicking the
changes button.
Joined streams may be freely associated with the 30 probe pages. The streams will be presented in the
Joined multicasts list in the Multicasts — Parameters view.
It is possible to flush or fill the multicasts/unicasts to monitor list by clicking the corresponding button.
Note that these operations will take effect immediately; it is not necessary to click
multicasts to be joined or unjoined.
Multicasts — Streams
view will appear as available streams on the left hand
Apply
Apply changes
for
VB3xx 10G Probe User’s Manual version 5.3 79
Page 80

6.4.6 Multicasts — Streams
In this view the operator can define multicasts available to the probe and associate a name with each
multicast address. This name will be used by the probe when referring to the multicast. If no name has
been defined the probe will use the multicast address:port notation.
It is possible to add, delete or edit several entries simultaneously. Several entries are selected by using
the regular Ctrl + click or Shift + click functionality. When adding new entries the current dialogue values
will be used as the template with the values for Name and Address incremented for each.
Note that both multicast and unicast addresses can be entered here.
Distribute ETR engines
engine already assigned. An ETR engine is considered used if one or more ETR with that engine is
enabled.
The search field in the upper right corner of the view allows the user to type a text string, and the multicast
list is updated to display only streams matching the specified text.
Clicking
— Streams — Edit
the selected multicasts and enable monitoring. The probe will only analyze joined multicasts. Clicking
Join all
or more multicasts is done by selecting multicasts and clicking
When the Edit button is clicked it is possible to define the following multicast parameters (note that some
parameters are only relevant and selectable when the probe is equipped with the ETR 290 option and
T2MI option respectively):
Add new
will join all multicasts in the list (up to the licensed maximum number of channels). Unjoining one
or selecting one or more multicasts and clicking
button will distribute unused ETR engines among selected streams if no ETR
Edit selected
pop-up menu. When multicasts have been defined, clicking
Unjoin selected
will open the
Join selected
or by clicking
Multicast
will join
Unjoin all
.
80 VB3xx 10G Probe User’s Manual version 5.3
Page 81

Name:
Address:
General
A name should be assigned to each unicast/multicast. The name will be
used throughout the VB330 user interface when referring to this stream. It
may also be used by an external management system like the VideoBRIDGE
Controller.
The IP address of the unicast or multicast. For a T2MI inner stream enter a
dummy address.
Port:
Ethernet thresholds:
VBC thresholds:
Join stream:
Join interface:
Page:
The port number of the unicast or multicast. For a T2MI inner stream enter a
dummy port number.
The Ethernet thresholds specify various error limits. Selectable Ethernet
thresholds templates are defined in the
For a T2MI stream select a dummy threshold template.
The VBC thresholds specify various error limits to be used by VideoBRIDGE
Controller to generate alarms. These thresholds are only relevant if the
VideoBRIDGE Controller is used. VBC threshold templates are defined in
the Setup — VBC thresh. view.
Check the ‘Join stream’ check box to join a multicast or unicast. Only joined
streams are analyzed. A stream may also be joined from the
JoinorMulticasts — Streams
be updated accordingly.
Select which interface to join the selected multicast. The data interface(s) are
listed as well as any enabled VLAN interface (defined in Setup — VLANs).
For easy navigation, each stream can be assigned a specific page. The
names of the pages are defined in Setup — Pages.
Multicasts — Ethernet thresh.
Multicasts —
views, and the status of this check box will
view.
VB3xx 10G Probe User’s Manual version 5.3 81
Page 82

SSM
SSM source 1:
SSM source 2:
SSM source 3: Additional SSM source address
SSM source 4: Additional SSM source address
SSM source 5: Additional SSM source address
The SSM address is only needed for IGMP v3 systems. A name may be associated
with the SSM source address.
Additional SSM source addresses may be specified to enable back-up solutions.
Note that it is the operator’s responsibility to ensure that a multicast is only transmitted by one SSM source at any time.
ETR (ETR290 Option)
Enable ETR:
ETR monitoring of a stream will not take place unless it is enabled by this
setting. This parameter is only relevant if the probe is ETR enabled.
82 VB3xx 10G Probe User’s Manual version 5.3
Page 83

Select ETR engine:
If the probe is licensed for several Ethernet ETR engines the user may select
which engine should be used to analyze the stream. The default ETR engine
selection is Ethernet1. It is also possible to use the
button described above to assign streams to engines.
Distribute ETR engines
ETR thresholds:
PID thresholds:
Service thresholds:
Reference table set:
The ETR thresholds specify various error limits and alarm conditions. Se-
lectable ETR thresholds templates are defined in the
view. The round-robin cycling time is also defined by this threshold template.
This parameter is only relevant if the probe is ETR enabled.
The PID thresholds specify various error limits and alarm conditions. Se-
lectable PID thresholds templates are defined in the
view. This parameter is only relevant if the probe is ETR enabled.
The Service thresholds selection defines various error limits and alarm con-
ditions. Selectable service thresholds templates are defined in the
— Service thresh.
enabled.
The Reference table set selection is used to compare the tables in the trans-
port stream with a set of stored tables. These tables are defined in the
290 — Gold TS thresholds view.
view. This parameter is only relevant if the probe is ETR
ETR 290 — ETR thresh.
ETR 290 — PID thresh.
ETR 290
ETR
Container stream:
Data PID: The container stream PID carrying the inner stream
PLP ID:
T2MI (T2MI Option)
For an T2MI inner stream the container stream (outer stream) must be specified.
Select the container stream from the drop-down menu. For streams other than
T2MI inner streams (none) should be selected.
The PLP ID for the inner stream. Select a fixed PLP ID value from the drop-down
menu or specify that the first detected PLP ID should be used.
VB3xx 10G Probe User’s Manual version 5.3 83
Page 84

Has FEC:
Redundancy
The stream carries COP3 (SMPTE 2022-5) Forward Error Correction. If enabled,
statistics about FEC drops and correctible errors will be reported for the stream.
First stream:
Second stream: Select the second of the two redundant RTP streams here.
Seamless Protection Switching (SMPTE 2022-7) monitors the same stream transmitted twice. The probe
verifies that the two streams combined do not have packet loss and the jitter between the two streams.
When two multicast/unicast streams are selected, the probe will report errors report errors if the same
RTP packets are missing from both streams. Errors are also reported if the timing between the two
stream exceeds the threshold settings.
Seamless Protection Switching has been optimized for monitoring SDI over IP (SMPTE 2022-6) streams.
For a Seamless Protection Switching (SMPTE 2022-7) protected stream, select
the first of the two redundant RTP streams here. For other streams, (none) should
be selected.
84 VB3xx 10G Probe User’s Manual version 5.3
Page 85

6.4.7 Multicasts — Ethernet thresh.
Thresholds are used to determine when to actually raise an alarm upon detection of an error. The Ethernet
thresholds are used for generating Ethernet probe alarms as well as for calculating error-seconds. Error
seconds and ETH probe alarms are issued whenever measurements exceed the defined threshold levels
for a parameter. Ethernet thresholds are also used to scale some graphs like the MediaWindow graphs.
The alarm level of each of these alarms is set in the
possible to disable alarms in the Alarms — Alarm setup view.
Alarms — Alarm setup
view. Note that it is also
The
Multicasts — Ethernet thresh.
stream level. Thresholds are associated with each stream in the
There are two different ways of creating user-defined thresholds. To create a new threshold template
from scratch the operator should click the
allowing the user to define alarm conditions. Another way of creating a user-defined threshold template is
by highlighting one of the threshold templates already defined and then click the
button.
Deleting a threshold template is done by highlighting the threshold template that should be removed and
clicking
are selected by using the regular Ctrl + click or Shift + click functionality. Click the
or more selected threshold templates. Note that the predefined ‘Default’ threshold template cannot be
deleted or changed.
In the threshold presets list the ‘Refs’ column displays how many streams are associated with each
stream threshold template.
Delete selected
. It is possible to delete or edit several entries simultaneously. Several entries
view makes it possible to define threshold values that operate at
Add new threshold
Multicasts — Streams — Edit
button. A pop-up window will appear
Duplicate highlighted
Edit
button to edit one
view.
VB3xx 10G Probe User’s Manual version 5.3 85
Page 86

Ethernet thresholds
Name: A text string that identifies the Ethernet threshold
IAT:MLR error:
IAT:MLR warning:
Max bitrate:
Min bitrate:
No signal:
This threshold contains error limits for IAT (Inter-packet Arrival Time) and MLR
(Media Loss Rate).
The IAT limit is the first parameter (before the colon), the MLR limit is the last
parameter. If the IAT limit is exceeded the alarm ‘IAT >= err-thresh’ will be raised.
If the MLR limit is exceeded the alarm ‘MLR >= err-thresh’ will be raised. The
severity (and hence the color used in the MediaWindow view) for IAT:MLR errors
depend on the severity assigned to these alarms in the
view.
Note that error seconds based on MLR are counted regardless of this threshold
if one or more packets are missing.
This threshold contains warning limits for IAT (Inter-packet Arrival Time) and
MLR (Media Loss Rate).
The IAT limit is the first parameter (before the colon), the MLR limit is the last
parameter. If the IAT limit is exceeded the alarm ‘IAT >= warn-thresh’ will be
raised. If the MLR limit is exceeded the alarm ‘MLR >= warn-thresh’ will be
raised. The severity (and hence the color used in the MediaWindow view) for
IAT:MLR errors depend on the severity assigned to these alarms in the
— Alarm setup view.
The maximum bitrate in Mbit/s. An alarm will be raised if the stream bitrate
exceeds the maximum bitrate.
The minimum bitrate in Mbit/s. A value of 0 will never generate an alarm. A
value of 0.1 Mbit/s will generate an alarm if the minimum bitrate threshold is less
than 0.1 Mbit/s.
Number of milliseconds without receiving any signal before the ‘No signal’ alarm
is raised
Alarms — Alarm setup
Alarms
86 VB3xx 10G Probe User’s Manual version 5.3
Page 87

RTP drop limit:
Ignore PID loss:
If the number of lost RTP packets exceeds the RTP drop limit an alarm will be
raised. Note that error seconds based on packet drops are counted regardless
of this threshold.
A comma separated list of PIDs for which the probe should ignore packet loss.
Packet loss that affects these PIDs will not result in an error-second count, and
the ETR monitoring engine will not count these errors.
6.5 MW (Media Window)
The
MW
Media Window view provides an at-a-glance status for each of the multicasts/unicasts being
monitored. From the graphs it is easy to see the jitter characteristics of the signal and if there is packet
loss or CC errors present in the signal. Periods of no signal are also displayed.
The measurements are always aggregated over a time interval – typically one second. The IAT(max) is
the maximum time measured between two neighboring IP frames within the measurement time interval
(the peak packet Inter-arrival time). IAT is expressed in milliseconds.
The MLR is the peak estimated number of lost MPEG-2 Transport Stream packets inside any second
within the actual time period. The number of lost TS packets is derived from the continuity counters inside
the TS packet headers.
A common scenario is to have 7 TS packets per UDP frame. Losing an IP packet will therefore usually
(but not always) result in an MLR of 7 (not always the case because some TS packets such as null
packets or PCR packets do not carry a valid CC field).
The patented Sencore VideoBRIDGE
in one graph, with jitter (IAT) values growing upwards (+ve Y) and packet loss (MLR) growing downwards
Media Window
presents both jitter and packet loss measurements
VB3xx 10G Probe User’s Manual version 5.3 87
Page 88

(-ve Y). Each sample along the x-axis corresponds to a measurement time-interval that depends on the
range of the graph selected. Periods of no sync are also displayed in the graph.
Error-second statistics for the graph-interval is displayed to the right. As the graphs are zoomed or
scrolled the error-second statistics is updated as well as the graphs.
Tool-tip provides the exact jitter (IAT) and packet loss (MLR) values for a selected bar in a selected graph,
the denotation is IAT::MLR. The current graph value displayed under ‘Running’ provides the maximum
MLR and IAT values measured during the last 3 seconds.
Red color is used to indicate that within the period represented by the bar there has been one or more
occurrences of no-signal. Orange is used to indicate error while yellow indicates warning. The error and
warning thresholds are allocated to each multicast in the Multicasts — Streams view.
The user determines whether only multicasts associated with the currently selected page should be
displayed (by clicking the
clicking the
by using the arrow buttons it is possible to move the timeline to view an error incident more accurately.
Clicking
will display the next page. Clicking the –1 button will display the previous page.
All
button). The time window buttons allow selection of x-axis resolution in the graphs, and
Clear
will clear all graphs. Note that clearing graphs cannot be undone. Clicking the+1button
Cur page
button), or if all joined multicasts should be presented in one list (by
By zooming and panning the user can pinpoint more accurately when errors occurred. In the above
diagram tooltip reveals that ‘No signal’ occurred between 9:15 and 9:20.
88 VB3xx 10G Probe User’s Manual version 5.3
Page 89
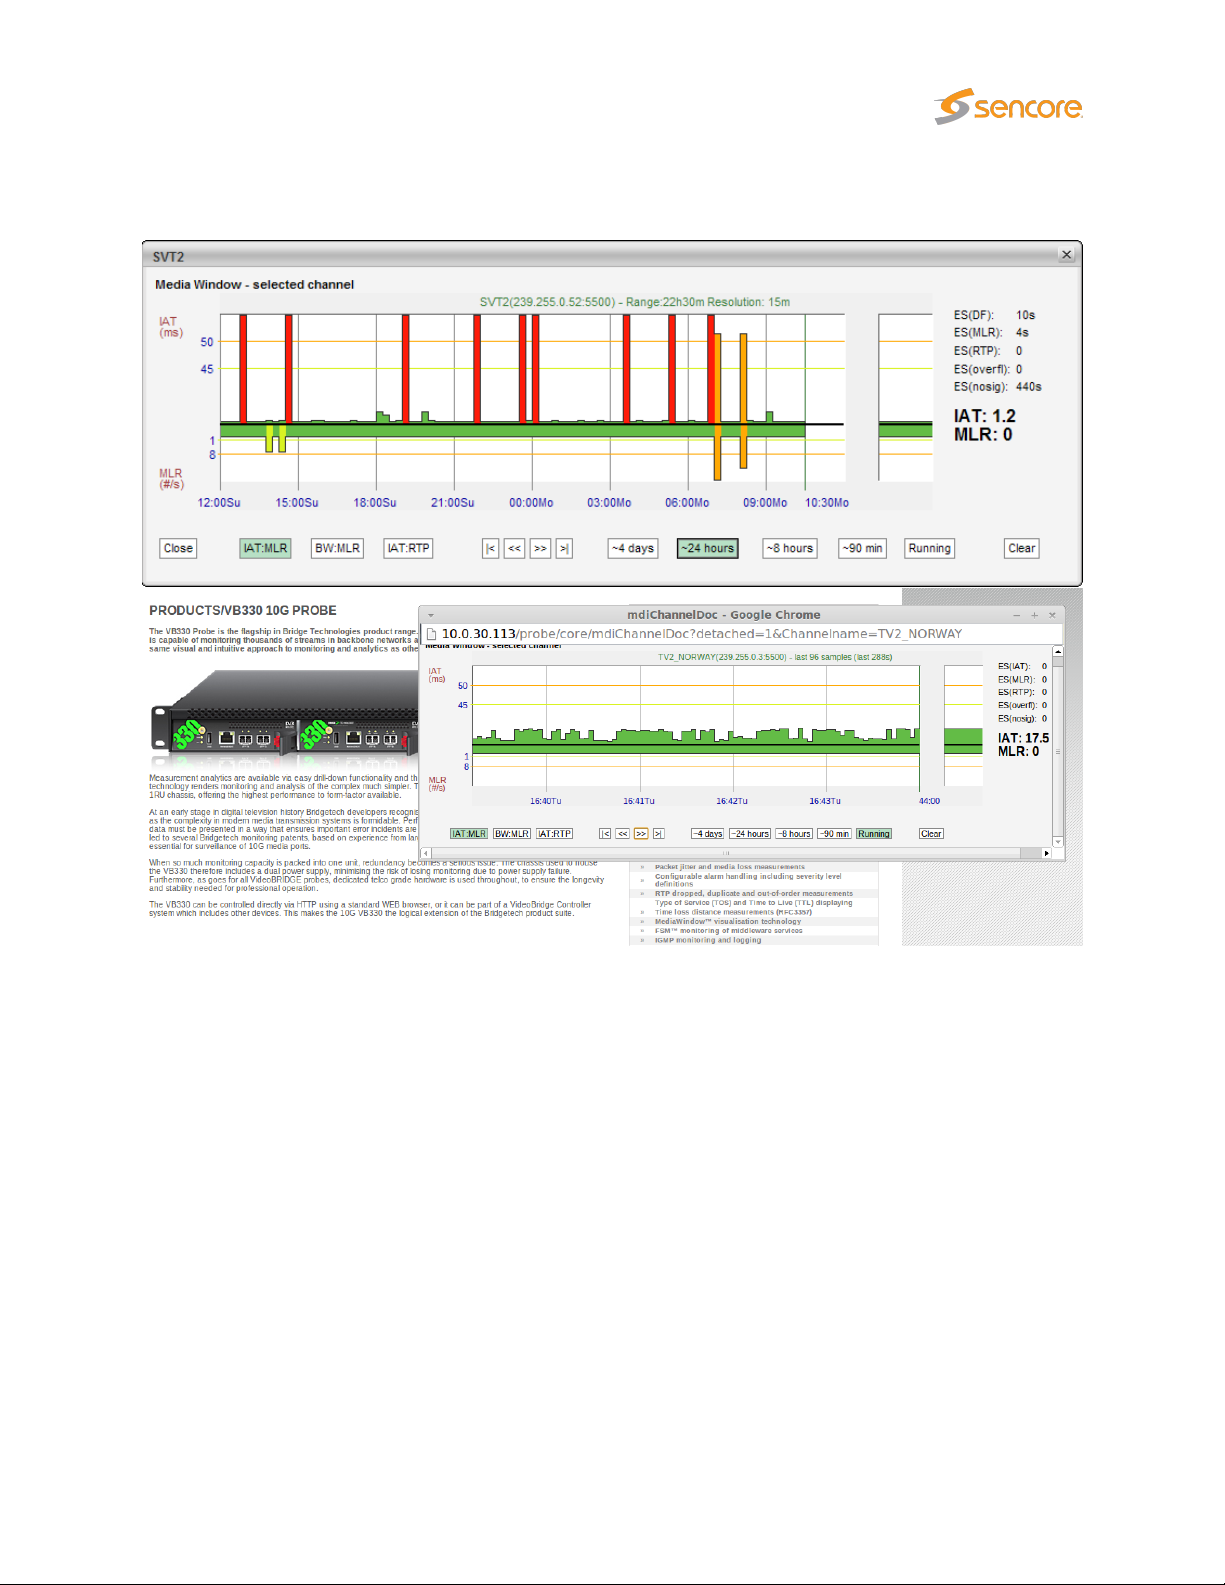
6.5.1 Media Window — Selected channel
The
Media Window — selected channel
By clicking the pop-up button a pop-up window will appear, the user can have this separate window
showing selected channel even when navigating away from the probe. This provides the ability to monitor
media windows for several streams without starting several browser sessions. When in the pop-up Media
Window by pressing some where in the graph, the field will get zoomed in.
This hi-resolution version of the
There are 3 times more samples along the X-axis, and the graph indicates visually the error and warning
thresholds. Note that the time windows of the regular
channel are not exactly the same, even if the same time window has been selected for both views.
Media Window
view is activated by clicking a multicast label in the
reveals more details than the compressed version.
Media Window
and
Media Window — selected
MW
page.
VB3xx 10G Probe User’s Manual version 5.3 89
Page 90

6.5.2 Media Window — Bandwidth graph
By clicking the
part of the composite graphs is still the packet loss (i.e. the MLR).
If the stream contains a transport stream (mapping TS/x) the bitrate corresponds to the
parameter
bitrate corresponding to the Multicasts parameter Curr bitrate.
The bandwidth error threshold is configured in the Multicasts — Ethernet thresh. view.
BW:MLR
Net bitrate
button the graph displays the peak bandwidth as a function of time. The negative
(i.e. bitrate excluding null packets). Otherwise the bitrate is the UDP payload
6.5.3 Media Window — Inter Arrival Time graph
Multicasts
90 VB3xx 10G Probe User’s Manual version 5.3
Page 91

By clicking the
graphs displays the RTP packet loss below the X-axis. If the monitored stream is not RTP encapsulated,
IAT will be represented by grey color and there will never be any indication of packet loss in the graph.
IAT:RTP
button the graph displays the packet jitter as a function of time. The composite
6.6 RDP (Return Data Path)
The Return Data Path feature enables forwarding of streams from any probe interface to another
destination IP address. Stream may also be recorded to file, either directly or triggered by alarms. The
probe supports forwarding or recording of two streams in parallel.
6.6.1 RDP — Control
Click the icons in the Control tab to activate or de-activate an RDP engine. There are different icons for
controlling RDP engines depending on whether they are configured to relay or record. The state of each
RDP engine is restored after a reboot.
For recordings and triggered recordings the last recording is made available in the Destination column
along with the metadata file. The metadata file contains basic information about the recording such as
the recording size, list of PIDs and CC-errors for each PID. In the case of triggered recording, the alarm
causing the recording is also included. Pressing the Delete button deletes the recording. For triggered
recordings the number of recordings is stated in the Status column. Pressing the Delete button resets
this counter. The buffer utilization is stated as a percentage and should never approach 100% for correct
relaying or recordings.
VB3xx 10G Probe User’s Manual version 5.3 91
Page 92

6.6.2 RDP — Setup
Each of the RDP engines is configured separately. First the Mode is selected. Depending on the mode
either the Relay or Record settings needs to be configured. The Input selects the stream or interface to
relay or record.
These are the settings:
Mode and Input
Mode: Select whether this RDP engine should relay, record or trigger-record.
Source interface:
Source Stream:
Content:
Selected PIDs:
When mode Relay over IP has been selected, the RDP parameters are:
IPv4-address:
The source interface drop-down menu allows selection of available input signals.
When Ethernet input is selected the user selects the stream to forward or record.
Ethernet streams being joined/monitored by the probe are available for selection.
The user selects the service to be relayed or recorded, or alternatively selects
that the complete stream should be used. The PIDs associated with the service
are automatically displayed in the ‘Selected PIDs’ field, and these may be edited
if required.
The user can specify the PIDs to be selected, default is all PIDs. Typically PAT
and PMT PIDs should be forwarded in addition to video and audio PIDs, however
this depends on the equipment receiving the forwarded stream.
RDP Ethernet
The unicast address or multicast address to forward to. Multicast addresses
are in the range 224.0.0.0 – 239.255.255.255.
92 VB3xx 10G Probe User’s Manual version 5.3
Page 93

Port:
TTL: The Time-To-Live flagging of the relayed signal. The default value is 64.
The port to forward to. The combination of IP address and port fully describes
the destination address.
Timeout:
Encapsulation:
Relay via interface: The available interfaces for forwarding the stream are listed.
When mode Record or Trigger recording has been selected the options are:
Rec timeout: The maximum recording time in seconds. This setting enables the user to limit
Rec size:
Protect:
Alarm trigger 1–3: Select a maximum of three different alarms that should trigger recording. Note
The relaying period in minutes. If the value 0 is selected, no timeout applies,
and relaying will continue until it is stopped manually.
The encapsulation format of the relayed stream.
Record and trigger options
recordings of low-bitrate streams.
The total file size of the recording. When in alarm trigger mode the resulting
recording will consist of a fixed sized portion of data before the alarm is raised
and the remaining recording from data after the trigger occurred.
When in alarm trigger mode the user may select to protect a recording from
being overwritten due to a new alarm occurrence. The user may select between
‘Never overwrite’, ‘Do not protect’, ‘30 seconds’, ‘60 seconds’ and ‘5 minutes’.
that a recording will start upon a transition from status ok to status alarm. Alarms
that have been disabled in the
brackets – these will never trigger a recording.
Alarm — Alarm setup
UDPorRTP
view will be shown in
may be selected.
The maximum recording size depends on the amount of free disk on the probe, up to a maximum of
750 Mbyte.
VB3xx 10G Probe User’s Manual version 5.3 93
Page 94

6.7 Traffic
6.7.1 Traffic — Protocols
The Protocols view allows monitoring of IP traffic on the selected port in terms of the protocols used.
The interface can be selected using the drop-down at the bottom of the page. Clicking the
button will reset displayed values.
The following measurements are presented, depending on which statistic is selected:
Statistics
Statistic: The protocol for which the following measurements apply
Cur bitrate: The current total bitrate for this protocol (measured over the last 1s period)
Max bitrate: The maximum bitrate during any 1s period
Min bitrate: The minimum non-zero bitrate during any 1s period
Frames/sec: Traffic speed in number of IP packets per second
Frames: Number of Ethernet frames
Frames %: Percentage of total number of frames
Min flen: Minimum Ethernet frame length
Max flen: Maximum Ethernet frame length
Bitrates
Statistic: As above
Cur bitrate: As above
Bitrates: A graph displaying the bitrate over time, displaying the last five minutes
Clear statistics
94 VB3xx 10G Probe User’s Manual version 5.3
Page 95

Bitrate graph:
Statistic: As above
Frames/sec: Traffic speed for this protocol expressed in number of IP packets per second
Frames: A graph displaying frames per second over time, displaying the last five minutes
Click the bitrate graph button to display a detailed bitrate graph for the specified
protocol
Frames
Frames graph:
Link status: Displays whether the interface is up or down
Link speed: Displays the interface speeds, as bits per second
Link duplex: Indicates whether the interface is operating at full or half duplex
UDP unicasts: The number of detected UDP unicasts
UDP multicasts: The number of detected UDP multicasts
COP3 Correctable: Total count of dropped payload IP packets that are correctable by the FEC
COP3 Uncorrectable:
COP3 Late:
COP3 Errors:
Click the frames graph button to display a detailed frames per second graph for the
specified protocol
Interface statistics
Total count of dropped payload IP packets that cannot be corrected by the
FEC
Payload or FEC packets are received slightly too late according to the
buffer model and may result in errors in another implementation of the
specifications. The number of packets with this error.
Either the L/D parameters are not consistent across the streams or payload/FEC packets are received too late or too early according to the buffer
model. The number of packets with these errors.
VB3xx 10G Probe User’s Manual version 5.3 95
Page 96

6.7.2 Traffic — Detect
The
Traffic Detect
mode should be enabled in the
multicasts already joined by the probe. Note that generally the upstream switch or router will not output
streams that are not joined by downstream equipment, i.e. usually only joined streams will be available
for monitoring.
view displays all UDP traffic sensed by the probe. Note that promiscuous network
Setup — Params
view for the probe to detect all traffic, and not only
If the unicast/multicast destination address is known to the probe (i.e. listed in the
view) the stream’s Name is looked up, otherwise a generic name is used.
When the
streams. Click the
button to update the stream list in offline mode.
The source address makes it possible for the probe to distinguish between multicasts with the same
destination IP address and port, provided that
Setup — Params view.
If the stream is currently joined by the probe (i.e. the probe is currently monitoring the stream), the
Joined field is set to yes.
Detected streams can be added to the probe’s stream list by selecting streams and clicking the
selected to stream list
Only streams not already in the probe’s stream list are considered. Clicking the
generate an XML-file that opens in a new window.
A drop down menu allows filtering of detected streams, making is possible to view streams of a specific
type only. Stream types are defined in the
the probe the Detect list will contain the following additional columns: Mapping, signal, RTP drops, CC
errors and Bitrate. These parameters are the same as on the Multicasts page.
Traffic — Detect
View list offline
. To add all detected streams the
view is entered after probe booting, the probe will continuously try to detect
button to view the stream list in offline mode. Click the
Source specific multicasts
Add all to stream list
Traffic — Filter setup
view. If the AEO option is enabled for
Multicasts — Streams
Refresh
has been enabled in the
Add
button can be pressed.
Export
button will
96 VB3xx 10G Probe User’s Manual version 5.3
Page 97

i
: Click the blue information icon to pop up the detailed stream info.
Dst address: The multi- or unicast address
Src address: The streams source address
Name:
VLAN ID: The VLAN ID of the stream
Joined: If the stream is joined by the probe this field will read ‘Yes’.
CPU: The probe CPU used to analyze the stream (1-7)
Mapping:
Signal: The duration of stream availability
The stream name, as defined in the
will be used for multi- or unicasts not defined by the user.
The transport stream to IP mapping. Typically seven transport stream packets are
mapped into one IP packet.
Multicasts — Streams
view. A generic name
RTP drops:
CC errors: The number of detected continuity counter errors for the stream.
Bitrate: The stream bitrate
The number of detected RTP drops for the stream. This is only valid if the stream is
RTP encapsulated.
6.7.3 Traffic — Filter statistics
The
Traffic — Filter statistics
types are defined by the user in the Traffic — Filter setup view.
Statistics is displayed for a time period selected by clicking one of the time duration buttons.
Filter: The filter name, as defined by the user in the Traffic — Filter setup view.
Streams: The number of streams matching the associated filter.
Bitrate: The total summed bitrate for streams matching the associated filter.
view makes it possible to view statistics for different stream types. Stream
Filter statistics:
VB3xx 10G Probe User’s Manual version 5.3 97
Page 98

RTP loss %:
Percentage of time an average stream that matches the filter experiences RTP
packet loss inside selected time period.
Example: If the
caught by filter:
Last 1m
period is selected and there are totally three streams
• stream A: present for 60 seconds, 4 RTP error seconds
• stream B: present for 30 seconds, 0 RTP error seconds
• stream C: present for 30 seconds, 5 RTP error seconds
RTP loss % = 9ES / 120s
RTP loss % = 9ES / 3streams / 120s *100% = 7.5%
MLR %:
Avg str bitr: The average bitrate for streams matching the associated filter.
Percentage of time an average stream that matches the filter experiences MLR
inside selected time period.
The calculation is similar to that for RTP loss %.
Avg str duration:
Clicking the icon next to each value brings up the detailed graph window.
The stream duration is calculated for each stream by identifying the stream’s
average stream alive counter inside the selected time period, then multiply by 2.
The stream alive counter is the number of seconds the stream has existed.
This gives accurate results for streams that begin within the selected time period,
but may give up to twice the real bitrate for streams that begin (long) before the
selected period.
Examples: a stream exists for 100 seconds, and begins within the selected period.
The calculation becomes:
Stream duration = (1+2+. . . +100)/100*2 = 101
If the same stream started 50 seconds before the selected period, the calculation
becomes:
Stream duration = (51+52+. . . +100)/50*2 = 151
98 VB3xx 10G Probe User’s Manual version 5.3
Page 99

The detailed graph window displays up to 4 days of history.
Trending
Clicking the
the last 60 minutes.
Clicking a graph icon displays the corresponding detailed graph for the selected filter. Clicking the trend
graphs itself will bring up the same detailed graph but will plot all the filters so that they can easily be
compared.
Trending last 60m
button will present at-a glance trending graphs for each parameter for
The detailed trending graph above displays MLR errors for all filters.
VB3xx 10G Probe User’s Manual version 5.3 99
Page 100

6.7.4 Traffic — Filter setup
The
Traffic — Filter setup
Traffic — Detect
user.
Name: A text string defining the filter
and
view makes it possible to define stream filter requirements affecting the
Traffic — Filter statistics
views. Ten filters can be defined and enabled by the
Statfilter settings:
Enabled: Only enabled filters are in use
Streams: The number of streams matching filter requirements
Cast: The type of stream: No filtering, Only unicasts or Only multicasts
RTP: The RTP mode: No filtering, Only with RTP header or Only without RTP header
VLAN:
IP dst:
IP src:
UDP dst:
UDP src:
UDP payload:
Edit: Click the Edit link to edit filter settings.
VLAN selection mode: No filtering, Only tagged traffic, Only untagged traffic or
Require matching specified value (a specific VLAN ID).
The IP destination address mode: No filtering or Require matching specified value
(a specific IP address/netmask)
The IP source address mode: No filtering or Require matching specified value (a
specific IP address/netmask)
The UDP destination mode: No filtering or Require matching specified value (a
specific UDP port number)
The UDP source mode: No filtering or Require matching specified value (a specific
UDP port number)
The UDP payload mapping type: No filtering, 7 TS/UDP or N TS/UDP (any integer
number of TS to UDP mapping)
100 VB3xx 10G Probe User’s Manual version 5.3
 Loading...