

Page 1

SLM 1479
CATV, TV,
Signal Level Meter
User Manual
July 2017
Form 8150A www.sencore.com | 1.605.978.4600 Revision 1.1
Page 2

SLM 1479 User Manual
Copyright
© 2017 Sencore, Inc. All rights reserved.
3200 Sencore Drive, Sioux Falls, SD USA
www.sencore.com
This publication contains confidential, proprietary, and trade secret information. No part
of this document may be copied, photocopied, reproduced, translated, or reduced to any
machine-readable or electronic format without prior written permission from Sencore.
Information in this document is subject to change without notice and Sencore Inc.
assumes no responsibility or liability for any errors or inaccuracies. Sencore, Sencore
Inc, and the Sencore logo are trademarks or registered trademarks in the United States
and other countries. All other products or services mentioned in this document are
identified by the trademarks, service marks, or product names as designated by the
companies who market those products. Inquiries should be made directly to those
companies. This document may also have links to third-party web pages that are
beyond the control of Sencore. The presence of such links does not imply that Sencore
endorses or recommends the content on those pages. Sencore acknowledges the use
of third-party open source software and licenses in some Sencore products. This freely
available source code can be obtained by contacting Sencore Inc.
About Sencore
Sencore is an engineering leader in the development of high-quality signal transmission
solutions for the broadcast, cable, satellite, IPTV, telecommunications, and professional
audio/video markets. The company’s world-class portfolio includes video delivery
products, system monitoring and analysis solutions, and test and measurement
equipment, all designed to support system interoperability and backed by best-in-class
customer support. Sencore meets the rapidly changing needs of modern media by
ensuring the efficient delivery of high-quality video from the source to the home. For
more information, visit www.sencore.com
Dolby Digital Information
This product contains circuitry licensed from Dolby Laboratories.
“Dolby Digital”, “DolbyE”, “AC-3” and “EAC-3” are licensed trademarks of Dolby
Laboratories.
Page 2 (124)
Page 3
Revision History
Date
Version
Description
Author
05/26/2016
1.0
Operations Manual for SLM 1479
GK
07/13/2017
1.1
Small edits
SV
SLM 1479 User Manual
Page 3 (124)
Page 4

SLM 1479 User Manual
Table of Contents
INTRODUCTION ............................................................................................................................. 7
PACKAGE CONTENTS ........................................................................................... 7
CD DISC CONTENTS ............................................................................................ 8
SMART SOFTWARE ............................................................................................ 8
SYSTEM INFORMATION ......................................................................................... 8
SECTION 1: UNIT FAMILIARIZATION .......................................................................................... 9
1.1 FRONT PANEL CONTROL FAMILIARIZATION ...................................................... 9
1.2 RIGHT SIDE PANEL FAMILIARIZATION ............................................................ 10
1.3 TOP PANEL FAMILIARIZATION ....................................................................... 11
1.4 HOME MENU ICON FAMILIARIZATION ............................................................. 11
1.5 POWERING ON/OFF .................................................................................... 12
1.6 POWER ADAPTER ........................................................................................ 13
1.7 BATTERY CHARGING/MANAGEMENT .............................................................. 13
1.8 BATTERY REPLACEMENT .............................................................................. 15
SECTION 2: QUICK START GUIDE ............................................................................................ 16
2.1 NAVIGATION ................................................................................................ 16
2.2. NAVIGATION – EXERCISE ............................................................................. 17
2.3 DROPDOWN MENU SELECTIONS .................................................................... 18
2.4 MEASUREMENT SIGNAL SELECTION .............................................................. 19
2.5 METER TUNING ............................................................................................ 19
2.6 QUICK START MEASUREMENTS..................................................................... 20
2.7 ENTERING FIELD VALUES ............................................................................. 21
2.8 TOUCH SCREEN SHORTCUTS ........................................................................ 21
SECTION 3: METER CONFIGURATION ..................................................................................... 23
3.1 CONFIG PUSHBUTTON (QUICK VIEW) MENU ................................................ 23
3.11 VOLUME ....................................................................................................................... 23
3.12 BRIGHTNESS ............................................................................................................... 24
3.13 VIDEO IN ...................................................................................................................... 24
3.14 IMAGE FORMAT .......................................................................................................... 24
3.15 RF IN ............................................................................................................................. 24
3.16 BATTERY SAVING ....................................................................................................... 25
3.17 CONFIGURATION MENU ............................................................................................ 25
3.2 CONFIGURATION MENU ................................................................................ 26
3.21 METER CONFIGURATION .......................................................................................... 26
3.23 TV CONFIGURATION MENU ...................................................................................... 29
3.23 CABLE MODEM ........................................................................................................... 31
3.24 CATV CONFIGURATION ............................................................................................. 32
3.24.1 LNB L.O. ...............................................................................................................................32
3.24.2 SNR LINE ............................................................................................................................32
3.25 METER INFO MENU .................................................................................................... 33
3.26 DIAGNOSTIC TEST .................................................................................................... 34
SECTION 4 VIDEO IN MONITORING .......................................................................................... 35
4.1 VIDEO IN ..................................................................................................... 35
SECTION 5: TV BROADCAST MEASUREMENTS ..................................................................... 36
Page 4 (124)
Page 5

SLM 1479 User Manual
5.1 TV PLAN SELECTION ................................................................................... 36
5.2 TV DIGITAL & ANALOG MEASUREMENTS ....................................................... 37
5.21 Main Digital TV Measurement Page ............................................................................. 37
5.22 Analog TV Measurements ............................................................................................ 38
5.23 FM Radio Tuning & Measurement ................................................................................ 39
5.3 TV MPEG SERVICE LIST ........................................................................... 40
5.31 TV MPEG Service Page Description ............................................................................ 40
5.32 TV Constellation & Monitoring ...................................................................................... 41
5.33 TV MPEG Video Service Monitoring ............................................................................. 42
5.34 MINISPECTRUM ......................................................................................................... 42
5.4 TV MEASUREMENT POPUP MENU ................................................................. 43
5.43 VISUAL NIT .................................................................................................................. 43
5.44 CHANNEL LOGGER .................................................................................................... 44
5.5 TV SPECTRUM ANALYZER ............................................................................ 46
5.6 TV SPECTRUM ANALYZER POPUP MENU ....................................................... 47
5.62 Spectrum Analyzer Marker Bandwidth Measurement .................................................. 48
5.63 Spectrum Analyzer Delta Marker Measurement ........................................................... 48
5.7 TV SPECIAL FUNCTIONS .............................................................................. 49
5.71 TV BUZZER & NOISE MARGIN GRAPH TEST ........................................................... 49
5.72 TV ATTENUATION TEST ............................................................................................. 51
5.8 TV MEMORY MANAGEMENT .......................................................................... 52
5.81 AUTOMEMORYtv – Scan to Create a Channel Plan ................................................... 53
5.82 SAVE DATALOGGER – TV Auto Measure & Store ..................................................... 54
5.83 RECALL DATALOGGER - View TV Data Log File ....................................................... 56
5.84 MANUMEMORY – Creating or Editing TV Channel Plans ........................................... 57
5.85 TV FILE MANAGER – Renaming or Deleting Files ...................................................... 59
5.9 TV “HELP” SIGNAL DISCOVERY ................................................................... 60
5.10 TV BAR SCAN TEST ................................................................................ 61
SECTION 6: CATV MEASUREMENTS ........................................................................................ 63
6.1 CATV PLAN SELECTION ................................................................ .............. 63
6.2 CATV DIGITAL MEASUREMENTS ................................................................... 64
6.21 Main Digital Measurement Page Description ............................................................... 64
6.22 Analog CATV Measurement Page ................................................................................ 66
6.23 FM RADIO TUNING & MEASUREMENT ................................................ 67
6.3 CATV MPEG SERVICE LIST .................................................................... 69
6.31 CATV MPEG Service Page Description ....................................................................... 69
6.32 CATV MPEG Video Service Monitoring........................................................................ 70
6.4 CATV MEASUREMENT POPUP MENU ................................................... 70
6.42 MINISPECTRUM .......................................................................................................... 71
6.43 VISUAL NIT .................................................................................................................. 71
6.44 CHANNEL LOGGER .................................................................................................... 72
6.5 CATV SPECTRUM ANALYZER ....................................................................... 74
6.6 CATV SPECTRUM ANALYZER POPUP MENU .................................................. 75
6.62 CATV Spectrum Analyzer Delta Marker Measurement ................................................ 76
6.63 Spectrum Analyzer Marker Bandwidth Measurement .................................................. 76
6.7 CATV SPECIAL FUNCTIONS ......................................................................... 77
6.71 CATV LEAKAGE TEST ................................................................................................ 78
6.72: CATV INGRESS TEST ................................................................................................ 80
6.73 CATV BUZZER & NOISE MARGIN GRAPH TEST ...................................................... 81
6.8 CATV MEMORY MANAGEMENT..................................................................... 82
6.81 AUTOMEMORYtv – Scan CATV Channels to Create a Channel Plan ........................ 82
Page 5 (124)
Page 6

SLM 1479 User Manual
6.82 SAVE DATALOGGER – CATV Auto Measure & Store ................................................ 84
6.83 RECALL DATALOGGER - View CATV Data Log File .................................................. 86
6.84 MANUMEMORY – Creating or Editing CATV Channel Plans ...................................... 87
6.85 CATV FILE MANAGER – Renaming or Deleting Files ................................................. 89
6.9 CATV HELP .............................................................................................. 90
6.10 CATV BAR SCAN TEST ........................................................................... 91
6.11 CATV BAR SCAN – TILT TEST ................................................................ 93
SECTION 7: DOCSIS MEASUREMENTS .................................................................................... 94
7.1 DOCSIS - MODEM SETUP – SETTINGS.......................................................... 96
7.11 SEARCH SETTINGS .................................................................................................... 96
7.12 TEST SETTINGS. ......................................................................................................... 97
7.13 IP SETTINGS ................................................................................................................ 97
7.2 DOCSIS MEASURE .................................................................................. 98
7.21: DOCSIS Downstream & Upstream Channel Search Mode .................................... 98
7.22 DOCSIS Measurements ............................................................................................... 99
7.3 DOCSIS UPSTREAM GENERATOR .............................................................. 102
SECTION 8: OPTIC POWER MEASUREMENTS ...................................................................... 105
8.1 OPTIC POWER FUNCTION ........................................................................... 105
8.2 OPTICAL INPUT CONNECTORS .................................................................... 106
THE OPTICAL OPTION ON THE SLM 1479 IS SUPPLIED WITH SEVERAL FIBER CABLE
ADAPTERS. THE ADAPTERS PROVIDE CONNECTION FROM COMMON FIBER CABLE
CONNECTORS TO THE OPTICAL POWER METER INPUT JACK OF THE METER. THE
FOLLOWING SECTION ILLUSTRATES AND DESCRIBES THESE ADAPTERS. ............... 106
SECTION 9: UPGRADE MEM PLANS - MEM FILE TRANSFERS ........................................... 107
9.1 LOAD MEMORY PLANS FROM USB KEY ............................................. 107
9.2 LOAD MEMORY PLANS ON USB KEY .................................................. 108
SECTION 10: DISPLAY SCREEN SHOT CAPTURES .............................................................. 110
10.1 CAPTURING SCREEN SHOTS TO A USB MEMORY STICK ............................. 110
SLM 1479 SPECIFICATIONS ..................................................................................................... 111
APPENDIX A – NORTH AMERICA CHANNEL PLANS ............................................................ 114
APPENDIX B – CLEANING/MAINTENANCE INFORMATION ................................................. 122
APPENDIX C - WARRANTY/SERVICE INFORMATION ........................................................... 123
Page 6 (124)
Page 7

SLM 1479 User Manual
Introduction
Thank you for choosing the Sencore SLM 1479. This instrument is a TV/RF signal
analyzer providing today’s engineer a complete tool in resolving digital video cable and
broadcast reception challenges. Capable of testing and analyzing digital and analog
cable channels and ATSC broadcast channels. The SLM 1479 features a large color
touch control screen eliminating multiple menus and pushbuttons to achieve a new
plateau in user friendliness, with selections virtually at your finger tip. The large screen
further provides unprecedented resolution so you won’t miss problems when analyzing
critical constellation and spectrum analyzer test screens.
The SLM 1479 provides powerful digital TV/RF analysis including MER, BER, noise
margin, constellation, and spectral analysis tests. A simple pass or fail indication
simplifies interpretation. Additionally, the modulation type, FEC value, encryption type,
network and program names, video/audio program identification lists, and non-encrypted
video is displayed providing advanced signal analyzing.
The SLM 1479 further provides a full arsenal of unique special tests and control features
to assist technicians in troubleshooting cable and TV reception systems. Advanced
features include an integrated Spectrum Analyzer, BarScan, Tilt, Leakage, Ingress, and
Logger tests. The SLM 1479 comes equipped with protective case, power adapters,
USB cable, antenna, and SMART software.
Package Contents
Great care is taken to ensure the SLM 1479 shipped from the Sencore factory is free of
defects, contains the supplied accessories and is securely packaged. Please inspect the
package and contents upon receipt. If there has been significant damage please contact
Sencore for further instructions. It is recommended that you save all packing materials
for return shipping to Sencore when calibration or service is needed.
Please inspect the contents to be sure you have received all the intended items and
supplied accessories. Your SLM 1479 is shipped with the following:
Instrument SLM 1479
Soft Carry Case with carry strap
AC Power Adapter/Battery Charger
Automotive Power Cable
Software CD Disc
USB 2.0 Cable
Replacement F Connector “Barrel”
F Push-On Connector
Leakage Test Antenna
Page 7 (124)
Page 8

SLM 1479 User Manual
CD Disc Contents
The supplied CD disc contains several files. It contains a pdf version of this manual for
your reference. It also contains a PC software program called “SMART” which is
explained in the next section on this page. The CD also includes a pdf file of the
SMART Software Users Guide which provides instructions on how to install, license,
connect and use the SMART software. The CD further contains a driver file used for the
USB connection from the PC to the SLM 1479 when establishing a connection for the
SMART software.
SMART Software
The SMART (System Monitoring Acquisition & Reprogramming Tool) Software is
provided at no additional charge. The software is provided on the CD shipped with the
instrument. This software is used to interface with the meter and provide the following
functions: custom channel plan programming, meter “cloning”, logger file download and
export in xls, firmware updates and more. Please read the SMART Users Guide supplied
on the CD with the instrument for information on how to install, use, and obtain the free
license for the software.
System Information
The SLM 1479 provides unit information on its
initialization screen when powering on.
Should you seek Sencore technical or service
assistance, please note the information on this
initialization screen and have it available.
Please note the hardware or “HW” value and
the firmware revision or “FW” value.
A continuous screen with the same
information is available in the METER
CONFIGURATION menu. Touch the CONFIG
pushbutton at the bottom right of the meter.
On the menu that appears, touch the “CONFIGURATION MENU” listing at the bottom
and on this menu touch the “METER INFO” listing.
This screen also indicates the existence and or activation of optional features. If installed
and active, these features indicate “OK” in the initialization screen.
Page 8 (124)
Page 9

SLM 1479 User Manual
Ref.
Main Function
Description
Second Function
A
Power and Home
Pushbutton
Press 2-3 sec to power on or off,
press briefly to return Home menu
Press/hold 10 seconds or more
to reset unit
B
Spectrum Analyzer
Pushbutton
Selects the Spectrum Analyzer
function
Selects numeric 7-8, mnop
letters, provides screenshots
C
DOCSIS Measure
Pushbutton
Selects DOCSIS cable
Measurements
Select numeric 1-2, abcd letters
D
TV Measure
Pushbutton
Selects Broadcast TV
Measurements
Select numeric 3-4, ijkl letters
E
Control Wheel – Enter
Pushbutton
Rotate -Increments field selection on
the display
Push ENTER button to enter a
field for test or selection
F
CATV Pushbutton
Selects Cable Measurements
Select numeric 5-6, ijkl letters
G
Barscan Pushbutton
Selects Barscan Measurement
Select characters, uv letters
H
Main Power Light
Indicates AC Power present to mete
I Battery Charge Light
Indicates battery is being charged
J
Plan Pushbutton
Selects channel or transponder
tuning plans
Select numeric 9-0, qrst letters
K
Volume and Configure
Menu Pushbutton
Controls volume of internal speaker,
provides path to configuration menu
Press to Brightness/Volume
Menu, configuration menu
L
Touch Panel Display
Provides all feature selections and
measurements
A.
C.
B.
D.
E.
J.
H.
I.
G.
F.
K.
ENTER
Section 1: Unit Familiarization
1.1 Front Panel Control Familiarization
L.
Page 9 (124)
Page 10

SLM 1479 User Manual
A.
C.
B. D.
Ref.
Main Function
Description
Second Function
A
Management LAN Port
RJ45 Connector for LAN connection,
Meter Setup and remote /control
application
B
USB B Connector
Communications Port
Port for interface with PC for file
upload, firmware updates
Use with SMART software via USB
connection
C
USB A Connector
Port for USB memory stick – stores
screen shots, logs, captures, etc.
Used to read/write mem file to/from
meter
D
Power Supply Input
Jack – Connect Power Adapter
12VDC @ 3A (Center – Pos.)
Charge internal battery
E
Inlet for cooling fan
Opening – Internal Cooling Fan
DO NOT BLOCK AIR FLOW
F
Internal Speaker
Opening for sound from internal
speaker
E. F.
1.2 Right Side Panel Familiarization
The right side panel of the SLM 1479 contains several interface connection jacks along
with an air intake fan and internal speaker. The following section provides a brief
description.
Note: Please do not block the inlet air flow (E) and the opening on the units opposite
side. The fan is automatically controlled and turns on and off randomly as needed to cool
the internal circuits.
Page 10 (124)
Page 11

SLM 1479 User Manual
A.
C. B.
D.
E.
Ref.
Main Function
Description
A
A/V Input
Analog SD audio/video input
B
Optical Input
Provides input of optical measurements
C
RF Output from Optical
converter
Optical to RF transceiver or converter – converts cable band channels
from light to RF band
D
RF-IF Input Jack
RF-IF Input for cable or broadcast channel
E
Cable Modem
Provides DOCSIS measurements and generation
A. C. B. D. E.
J. H. I. G. F.
1.3 Top Panel Familiarization
The top side panel of the SLM 1479 contains most of the input/output interface
connection jacks. The following section provides a brief description of these inputs and
outputs.
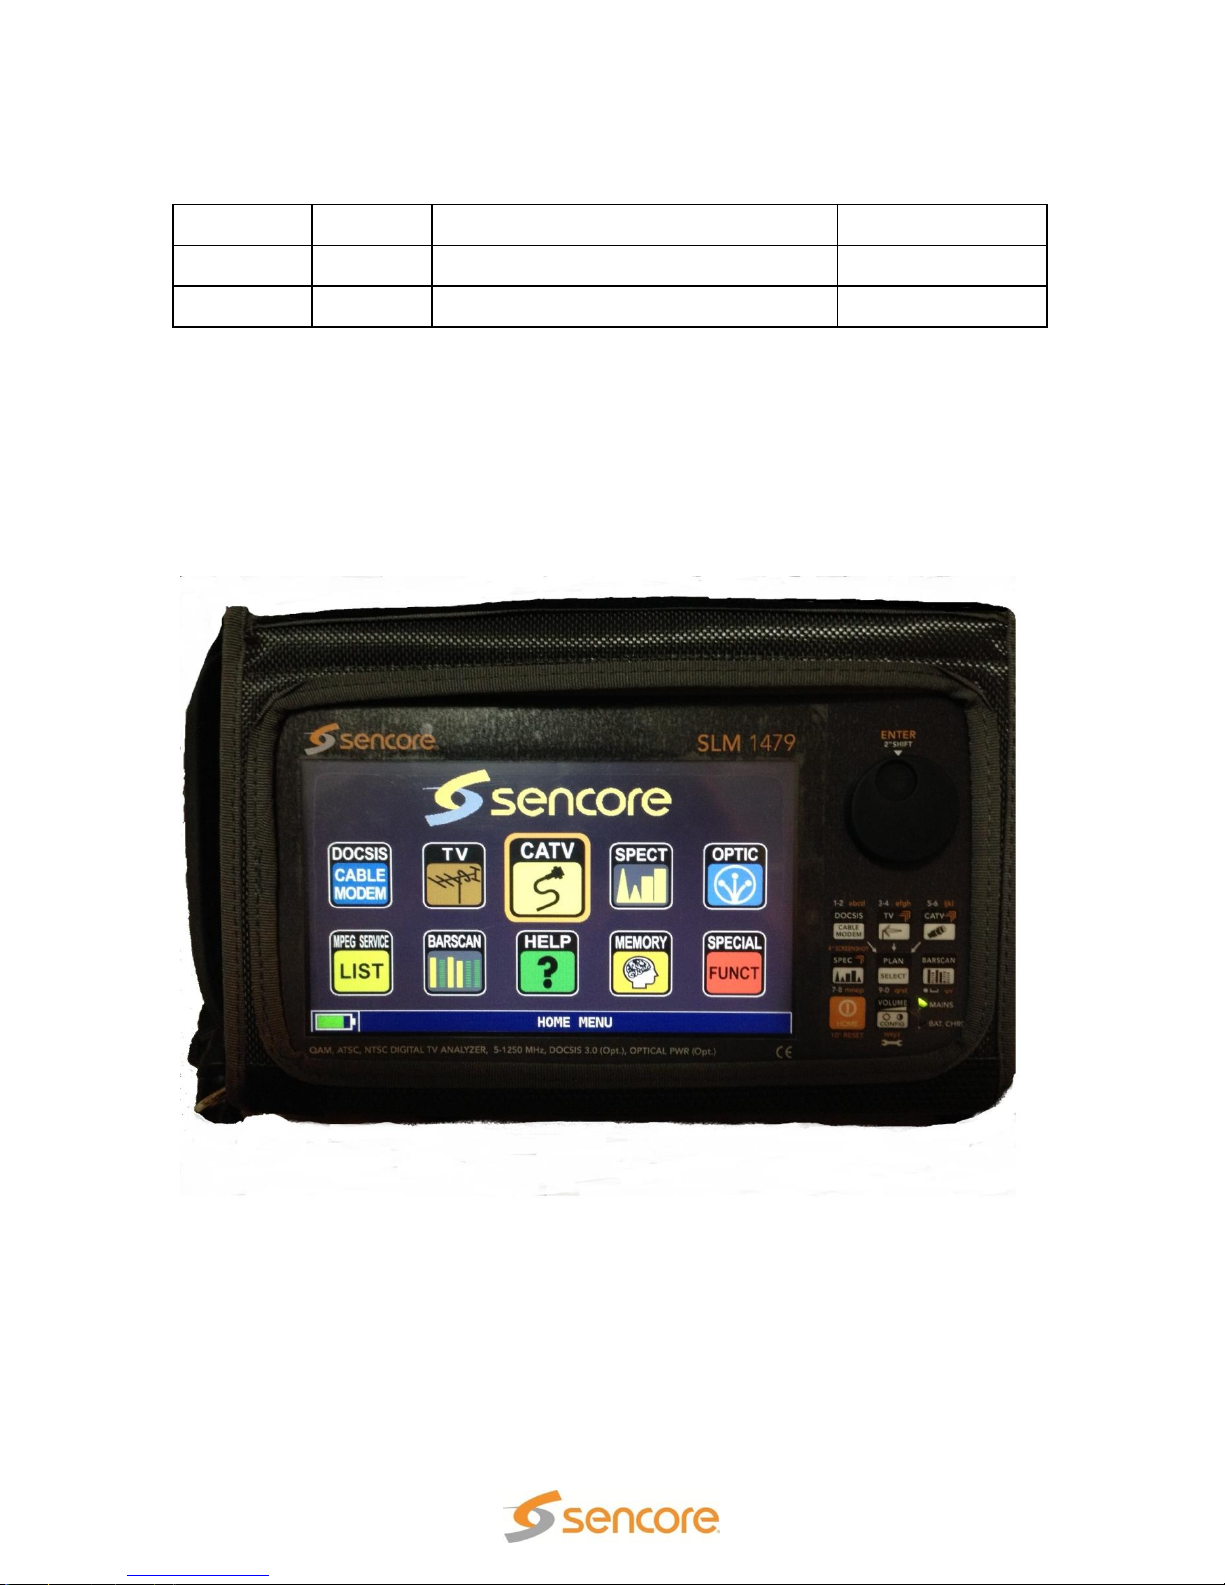
1.4 Home Menu Icon Familiarization
The Home Menu of the SLM 1479 is the first menu you see when powering on the
meter. You may return to this menu
from any other menu by briefly
pressing the HOME pushbutton.
The Home Menu shows icons
representing tests or functions you
may select to begin using the
meter. You may alternately
choose to directly to satellite, tv or
cable tv measurements by
pushing the SAT, TV or CATV
pushbutton.
The color LCD screen includes a
durable touch control panel.
Touch the screen with your finger or
with the included stylus at the
location of the screen icon when you wish to select a field or function. The stylus is
stored in the padded carrying case by opening the flap of the padded carrying case on
the right side of the meter. Using the stylus, helps keep the meter’s screen clearer and
cleaner.
Page 11 (124)
Page 12

SLM 1479 User Manual
The icons on the Home Menu screen quickly take you to measurement features
provided by the meter. The following section briefly describes the icons.
A: DOCSIS: Touch to select the meter’s DOCSIS setup and analyzing features. Also
selects upstream generator.
B: TV: Touch to select TV Broadcast tuning plans, perform measurements on a TV-RF
channel, view broadcast channel(s) on spectrum analyzer, and log broadcast channel
measurements to memory – logger
C: CATV: Touch to select TV CABLE channel tuning plans, perform measurements on
a digital or analog cable channels, view cable channel(s) on spectrum analyzer, log
cable channel measurements to memory – logger
D: SPEC: Touch to view spectrum analyzer display for frequency spectrum viewing of
the currently selected satellite, TV or cable measurement channel/transponder(s).
E. OPTIC: Optional Feature: Touch for measurements of the optical input power and
power loss when comparing the active input power to a saved reference power level.
F. SPECIAL FUNCT: Touch to see extended or special functions associated with the
selected satellite, broadcast TV, or cable TV measurement mode.
G. MEMORY: Touch to manage logger files, start channel logs, or recall log files.
H. HELP: Touch for tuning assistance “Auto Discovery” to determine signal type and
signal setup.
I. BARSCAN: Touch to select the Bar Scan function which provides a bar chart
showing multiple channel levels through a frequency span.
J. MPEG SERVICE LIST: Touch to display the program list of the selected channel or
transponder. Includes program name, V-PID, A-PID, Encrypted Yes/No
1.5 Powering ON/OFF
The SLM 1479 is powered on and off with the orange front panel pushbutton labeled
“HOME” located at the bottom right of the instrument front panel. The HOME pushbutton
has a circle with a line in it on the pushbutton. This is a universal on/off symbol.
To turn the meter on, momentarily press the HOME pushbutton and release. You will
hear the fan turn on briefly and after a boot delay see a meter information screen. When
initializing, the display screen may briefly indicate “AUTO OFF ACTIVE.” This indicates
the Battery Saving feature is set to “ON” to auto shutoff the meter after a period of non
use. Please refer to the BATTERY SAVINGS feature section 3.19 on page 27 of this
manual for information on this feature. Please also see the CONFIG section 3.21.1 of
Page 12 (124)
Page 13

SLM 1479 User Manual
CHARGE EVERY NIGHT
AFTER USE
FULL
80%
50%
< 30% < 10%
this manual on page 28 for more information on the TIMER OFF feature which may also
be set to automatically power the unit off after a set delay.
To turn the meter off, press and hold down the POWER pushbutton for 2-3 seconds and
release. When powering off the SLM 1479 should you wish to turn it back on again,
please wait 5 seconds after powering down the instrument before you turn it back on
again. This gives the internal circuits time to reach a full shutdown state for proper
initialization.
1.6 Power Adapter
The SLM 1479 is supplied with a DC power supply that is used to power the instrument
and to indirectly charge its internal battery. The power supply/adapter is a regulated 12
VDC with a positive center terminal on the connector to the instrument. The power
supply is rated for ACV inputs ranging from 100-240 VAC @ 50/60 Hz and can deliver
up to 3.0 amp of DC output current.
The Power Supply/Adapter provided with the SLM 1479 meets industry and safety
regulatory standards. This insures safe instrument operation. Therefore, it is
recommended that you use only the provided Power Adapter.
NOTE: When powering the SLM 1479 use only the supplied Power Adapter or a power
supply/adapter which strictly meets all technical specifications and industry safety (CE,
UL etc) requirements.
1.7 Battery Charging/Management
The latest battery technology, hyper lithium polymer (Li Po) battery, powers the SLM
1479 for portable testing applications. The battery pack provides years of dependable
service. The battery pack requires no routine maintenance but it is advisable to be
familiar with some handling, charging, storing, and disposal characteristics.
Some charging management practices may extend the battery pack’s useful life. Also
the SLM 1479’s power management features may provide added use time on a single
charge. This section covers the meter’s battery condition indicator, battery charging
recommendations and battery power management features.
When operating from the battery, a battery indicator icon at the bottom left of the
measurement screen indicates the remaining battery charge. Battery indicators include a
full charge 100%, 80%, half charge 50%, 30%, and
10% charge indicators. The presence of the battery
icon indicates the meter is operating under battery
power. When the power supply/adapter is used to
power the meter, the battery icon is replaced by an AC
plug icon.
The SLM 1479 uses a special battery charging/management circuit to monitor and
manage battery charging. Battery charging is managed by the meter‘s charging circuits
Page 13 (124)
Page 14

SLM 1479 User Manual
with sensors inside the battery pack. You should never remove the battery and attempt
to charge the battery with an adjustable power supply.
A Li Po battery contains no memory or conditioning affects like other battery
technologies so a full discharge and recharge cycle is not beneficial. After use, it would
be advisable to charge the battery. If used daily, charge the battery pack every night for
best battery life.
Avoid a complete discharge state or prolonged low charge of the battery as this can
have an adverse effect. Charge the battery after continuous use in which the battery
charge is low or depleted. Also, Li Po batteries gradually discharge over a very long
period of time (> 4 months) when stored or not used. Recharge the battery every 3-4
months when not used or in storage. NOTE: Do not leave the battery in a discharged
state. If stored, or not used, periodically charge the battery.
Battery operating time varies considerably depending on use and power management
settings. Expect approximately 4 – 5 hours depending on power management settings
and LNB powering. To extend the useable battery measurement time on a single
charge, the SLM 1479 offers three power management features including: 1) Unit Auto
Off, 2) Display Light Timer and, 3) Backlight Brightness. Please see the METER
CONFIGURATION Menu (Section 3) of this manual for details on these settings. For
maximum battery use time, set the BATTERY SAVING setting to the “ON” position. A
lower display backlight brightness level greatly extends battery use time. Set the
BRIGHTNESS setting as low as you can, depending on your tolerance for display
brightness and the light in the testing environment.
Page 14 (124)
Page 15

SLM 1479 User Manual
1.8 Battery Replacement
The Li Po Battery is a 7.4V, 4 Ah, battery pack located inside the metal chassis of the
SLM1479. The battery can only be accessed by disassembly of the instrument to gain
access to internal components including the battery compartment. For this reason, in the
field battery replacement is not recommended. Please consult the Sencore Service
Dept. for assistance in diagnosing symptoms and information regarding options to
replace the internal battery.
In the event you are handling a Li Po battery, please take cautions as described below.
Handling: Handle the Li Po battery pack with extreme care not to drop, short out the
battery, or damage its protective wrap.
Replacement: You need to be absolutely sure you have the proper replacement Li Po
battery pack for your SLM 1479. Sensing wires to the battery pack are critical in battery
charging/discharging and safety. ONLY an exact replacement or a suitable replacement
battery provided from Sencore should be used.
WARNINGS !!
For your safety never attempt to repair/replace individual cells in a Li Po
battery pack or solder to terminals on the cells.
LiPo Battery Replacement: Replace the SLM 1479 LiPo battery pack with
only an identical replacement or approved replacement obtained from
Sencore.
Li Po Battery Disposal: Li Po battery packs that can no longer be used are
hazardous waste and must be disposed of accordingly. Completely
discharge the battery and take it to a designated collection point in your
area. Never dispose in a household or business waste collection.
Page 15 (124)
Page 16

SLM 1479 User Manual
Section 2: Quick Start Guide
2.1 Navigation
The SLM 1479 features a touch sensitive screen but supplements operation with a
mechanical control knob and mechanical front panel switches. In combination, they are
used to navigate, make selections, and initiate tests. The ability to make selections
directly from the screen with a finger touch greatly simplifies meter use. The following
section provides a brief explanation and some navigational hints to get you started.
Control Knob: The Control Knob may be rotated to increment through selectable screen
fields. It may also be pushed to lock to a field or to make selections within a field.
Rotating the knob, either clockwise or counter clockwise directs field movement on the
display or selections within a highlighted/selected field. Pushing the knob inward selects
a field or enters a selected operation. Pushing the knob also releases a selected field.
Operating the SLM 1479 requires 3 essential actions. These may be performed in
random order depending on the test screen. They are summarized below:
User Action Summary:
Touch Screen – Touch your finger tip or stylus to the screen at locations of a listing,
heading field or an icon. This selects the test or field. The selected field is indicated by a
colored box, typically red or dark orange. (The color depends on the meter’s Graphics
Color setting)
Control Knob – Turning the control clockwise or counter clockwise. Moves a
highlighted area upward or downward through a list or icons on the screen. Increments
through values within a field when there is no list.
Control Knob - ENTER – push in the Control Knob. Selects a field so that changes
may be made within the field. Releases a field so that the wheel can be used to move to
other locations.
Navigation Hints:
Select a function – Home Menu: Touch your finger to an icon location on the screen.
Alternative: Rotate the control knob to move highlight (an orange ring surrounding the
icon) to the desired function. Push inward the control knob to ENTER area of the control
knob – selecting that function.
Select/Release Field: Touch your finger to the selectable field heading. Alternative:
Rotate the control knob to move highlight to different or desired heading. Push inward
the control knob to select/enter the field.
Choose item within a list: Touch finger to the desired choice. Repeat finger touch to
increment through field selection. Alternative: Push inward the control knob to ENTER
the field or release/exit the field.
Page 16 (124)
Page 17

2.2. Navigation – Exercise
MAINS
BAT CHG
HOME
10" Reset
ENTER
DIGITAL SIGNAL ANALYZER MULTISTREAM SAT, TV, CATV, OPTICAL, IP, ASI, 4-2250 MHz, MPEG2/4 HD
S L M 1 4 79
S E N C O R E
SATELLITE PLAN SELECTION MENU
SPEC
MEAS
SPECIAL
FUNCT.
MEMORY
CABLE PLAN
MANU MEMORY (MIX)
MASTER
HOME MENU
4.
5.
6.
7.
1.
8.
VOL.
Config
Plan
Select
SPEC
BrScan
TV
CATV
2.
DOCSIS
Cable
Modem
AUTOMEMORY tv
POLAND
RUSS. A
RUSS. B
USABRO
USACAB
USAHRC
USAIRC
RA BRO
RA CAB
RA HRC
3.
To become familiar
with the SLM 1479’s
navigation follow the
steps below: (#s
reference fingers in
the diagram above.)
(Display Graphics
Color Setting =
BLUE)
1. Power the meter
on: Briefly press
and release the
HOME pushbutton (Finger #1). (This is not a touch button - firmly press and release).
Control Knob Familiarization: Rotate the control knob (#7). Note how the orange
highlight moves to different display icons. Move the highlight to the TV icon.
2. Select a Test - touch the display at the location of the TV icon or with it highlighted
press the control knob (#8). Or, press the CATV pushbutton (#2) below the control
knob.
3. Select a channel tuning plan. Press the PLAN pushbutton (#3). The CATV PLAN
SELECTION MENU is shown with a left section, center section, and available test
icons at the right. The blue sections contain listings which may be selected. A red box
or yellow box highlights or indicates the selected listing in these groups.
4. Select a CATV Plan (left blue area) with the Control Knob – rotate the control knob
(#7) and observe how the red highlight box moves through the selectable listings.
Highlight the “MASTER” listing. Press the control knob to ENTER the field (#8). Notice
how the red highlight disappears. The center colored area is now active and the yellow
box indicates the selected listing.
5. Select a CATV tuning plan (center colored area) - touch your finger to the screen
listing several listings above the one selected in the yellow box (#5). Your selection is
moved to the center of the list and is highlighted. To scroll farther down in the list, touch
your finger along the screen near the bottom of the list. To scroll upward repeat the
action near the top of the list box. With the desired plan highlighted, select a satellite
test icon (right side of screen) – touch the MEAS icon (#6). The meter advances to the
CATV Measurement Menu.
Hint: Using the touch screen is the most efficient. Most selections are available on the
touch screen. Only occasionally there are too many selections in a field to list requiring
Control Knob use. Examples include the REF selection field in the Spectrum Analyzer
and FREQ selection in the MEAS menu. These require use of the Control Knob to
increment through selections.
Page 17 (124)
SLM 1479 User Manual
Page 18

2.3 Dropdown Menu Selections
Vpid: 49 Apid: 52
ANNEX: B
SYM. RATE: 5.3605 MS/s
ENCRYPT.: Clear
PLAN MODULAT CONST DC@RF
USACAB J83-B QAM256 OFF
CHAN
FREQ
13
213.00
MENU & ?
28 247.25 MASTER
1 2 3 4 5 6 7 8 9 0
29 253.25 MASTER
30 259.25 MASTER
31 265.25 MASTER
32 271.25 MASTER
33 277.25 MASTER
34 283.25 MASTER
35 289.25 MASTER
36 295.25 MASTER
37 301.25 MASTER
PLAN MODULAT CONST DC@RF
USABRO VSB 8VSB OFF
CHAN
FREQ
11
201.00
TSID: 2643
MENU & ?
EXIT
INSERT FREQ.
ENTER
<- .
1 2 3 4 5 6 7 8 9 0 ->
Several fields within the SLM 1479 screen have dropdown menus in which selections or
entries are made. This section briefly explains how to select or enter values within a drop
down menu.
Channel Selection Dropdown Menu
When many channels exist in the channel plan, a list is provided with a dropdown box by
touching the on screen channel listing field with your finger tip or the stylus. The scroll
up/down box with arrows on the right side of the dropdown list indicates that more
channels are in the list than are
currently visible. To scroll up in
the list touch the up arrow with
the stylus or your finger tip. To
scroll downward touch the down
arrow with the stylus or your
finger tip.
You may jump to a channel
listing by entering the desired
channel number. With the stylus
touch the channel numbers
corresponding to the desired
channel at the bottom of the list.
The list immediately updates
with the entered channel
number centered in the list. To
select the desired channel, touch the listing with your finger tip or stylus.
Frequency Selection Entry
The FREQ field provides a drop down
menu which provides direct entry of a
desired frequency. Touch the
frequency value below the FREQ
heading to produce the frequency
entry menu. Touch the stylus to the
numbers at the bottom to enter the
frequency value. Use the back arrow
to increment fields to the left. Use the
clear entry, 2nd from the right, to clear
a field entry. Touch the ENTER box
when you have entered the desired
value. Press the EXIT box to exit
without frequency selection.
Page 18 (124)
SLM 1479 User Manual
Page 19

SLM 1479 User Manual
CABLE PLAN
MANU MEMORY
(
MIX
)
MASTER
HOME MENU
AUTOMEMORY tv
USABRO
USACAB
USAHRC
USAIRC
Plan
SELECT
TV CATV
DOCSIS
CABLE
MODEM
2.4 Measurement Signal Selection
This section introduces you to the general
operational layout of the SLM 1479 to improve
your understanding and operational ease. The
instrument is fundamentally divided into 2
major categories by signal type. The signal
types are Broadcast Television (TV) and Cable
Television (CATV). The first operational step is to select one of these signal
types for measurement. The signal type is selected by touching one of the Home Menu
screen icons or pressing the TV or CATV pushbutton. The DOCSIS test is an extension
of the CATV measurement which may be selected via the touch panel DOCSIS icon or
by pressing the DOCSIS pushbutton.
The SLM 1479 always retains the last selected signal type as its selected operational
base until you return to the HOME Menu and select a different type or press the TV or
CATV pushbutton to change signal types. On the HOME Menu screen either the TV or
CATV icon will always be highlighted or outlined. As you navigate through other test
menus, this operational mode is retained.
The selected TV, or CATV operational mode, determines the available testing features,
measurements, screen configurations, spectrum analyzer screen configurations and
features, special test selections, signal/channel plans, and individual screen popup
menus. Therefore, when operating the SLM 1479, always be conscious of the main
signal type selected on the HOME Menu. Always select the signal type that is proper for
the TV-RF signal you are measuring.
2.5 Meter Tuning
The SLM 1479 is both a TV and Cable
receiver. As a receiver it needs TV broadcast
and/or cable channel tuning information. The
PLAN SELECTION MENU(s) provides the
needed channel plan selections. Press the PLAN
SELECT pushbutton on the front panel to select the
PLAN SELECTION MENU. This menu is unique for
the cable and TV tuning channel plans.
The SLM 1479 contains factory TV, and cable channel plans that provide tuning and
measurement without further setup. Factory tuning plans are available for various
country locations. For quick occasional measurements simply select the standard plans
as summarized below.
BROADCAST TV TESTING: Select “TvMASTER PLAN”, Select “USABRO”
CABLE TESTING: Select “MASTER,” Select “USACAB”
After selecting a plan, touch the corresponding TV or CATV measurement pushbutton.
Page 19 (124)
Page 20

SLM 1479 User Manual
2.6 Quick Start Measurements
This section of the manual provides only enough information to get you making basic
satellite, broadcast TV or cable measurements. It is not intended to completely
summarize all the information contained in this manual. Please reference other portions
of the manual as needed to answer questions and become familiar with the SLM 1479
and its features.
Follow these steps to start making basic measurements:
1. Connect the signal cable to the F-Type connector on the top – center of the
meter identified as the RF-IN Jack. BE SURE TO CONNECT TO THE
CENTER F CONNECTOR AS THE ONE ON THE LEFT IS THE OPTICAL
OUTPUT AND THE ONE ON THE RIGHT IS THE DOCSIS CABLE
MODEM.
2. Select the type of TV-RF signal to measure. When in the HOME icon menu
screen touch the icon that matches the signal type to be measured. Or,
simple press the TV or CATV front panel pushbutton.
TV (Broadcast): Touch to test terrestrial broadcast 8VSB signals.
CATV (Cable TV: Touch to test RF-RF signals on a cable television system.
Instructions Continued: a = BROADCAST TV, b = CABLE
(Follow a, b, c, instructions below relative to the signal type selected above.
3. Select a tuning channel plan and plan variation in the PLAN SELECTION
MENU. Press the PLAN SELECT front panel pushbutton.
a. BROADCAST TV: Highlight “TvMASTER PLAN” - typically the default.
Select/highlight “USABRO” in center section of display. Touch the screen’s
MEAS icon at right.
b. CABLE: Select “MASTER” at left. Select “USACAB” in center section of the
display. Touch the screen’s MEAS icon at the right of the screen.
4. Modify or select the channel/transponder or frequency to be measured.
a. TV: Touch the number below CHAN heading (upper right on screen). Touch
finger near the up arrow or downward near the down arrow to move through
the channel list. Press control knob to ENTER or select the channel.
b. CABLE: Touch the number below the CHAN heading (upper right on screen).
Touch finger upward near the up arrow or downward near the down arrow to
move through the channel list. Press the Control Knob to select.
NOTE: Press the TV or CATV push button to increment through available
measurement pages. Touch the display section below the Vpid and Apid labels
for MPEG program information. Touch the video portion of the display to view it
full screen.
Page 20 (124)
Page 21

SLM 1479 User Manual
2.7 Entering Field Values
Some field values in the SLM 1479
are entered with a popup entry
menu. This menu presents several
entry boxes in the center of the
display screen area. The number
of fields represent the number of
digits available for entry. The
characters and/or numbers along
the bottom are the appropriate
entries. You may move to the left
or right using the left arrow or right
arrow entry. You may exit without
making changes by selecting the
EXIT field on the left. When the values are selected, select or touch the ENTER field to
apply the value.
2.8 Touch Screen Shortcuts
The touch screen provides selections or shortcuts to move to other measurement pages
simply by touching areas of the screen. These shortcuts are available when in the main
channel measurement pages. The same area of the screen permits returning to the main
measurement page by touching the same area. This section illustrates the shortcuts
available.
Main Measurement Page to Constellation Page
When in the main measurement page touching the left center of the screen advances
the display to the constellation measurement page. Touching the same left center area
of the constellation page returns the screen to the main measurement page.
Page 21 (124)
Page 22

SLM 1479 User Manual
SPECIALHELP MEMORY
BAR SCAN
MPEG SERVICE
LIST FUNCT.
MEASCATV SPECTV
SAT
SPECIALHELP MEMORY
BAR SCAN
MPEG SERVICE
LIST FUNCT.
MEASCATV SPECTV
SAT
SPECIALHELP MEMORY
BAR SCAN
MPEG SERVICE
LIST FUNCT.
MEASCATV SPECTV
SAT
SPECIALHELP MEMORY
BAR SCAN
MPEG SERVICE
LIST FUNCT.
MEASCATV SPECTV
SAT
Main Measurement Page to MPEG Service List Page
When in the main measurement page touching the right area of the screen below the
video screen section advances the measurement to the MPEG SERVICE LIST function
or display screen. Touching the same area of the MPEG SERVICE LIST screen returns
the measurement to the main measurement page.
Main Measurement Page to Full Screen Video Monitor
When in the main measurement page touching the right area of the screen on the video
screen section advances the meter to a full screen display of the video. Touching the
same area of the full screen displayed video returns the display to the main
measurement page.
Page 22 (124)
Page 23

SLM 1479 User Manual
VOL.
CONFIG
BATTERY SAVINGS:
EXIT
VOLUME:
BRIGHTNESS:
VIDEO IN:
IMAGE FORMAT
CONFIGURATION MENU:
INT
16/9
OFF
RF IN:
F(75Ohm)
Section 3: Meter Configuration
The DSA 1491 has two meter configuration menus. They include an initial CONFIG
Pushbutton or “Quick View” menu and an extended CONFIGURATION MENU. The
Quick View menu is accessed by briefly touching the CONFIG pushbutton at the bottom
right corner of the meter. The extended CONFIGURATION MENU is accessed by
touching the “CONFIGURATION MENU” listing in red at the bottom of the quick view
menu. These menus and their listing are covered in the following section.
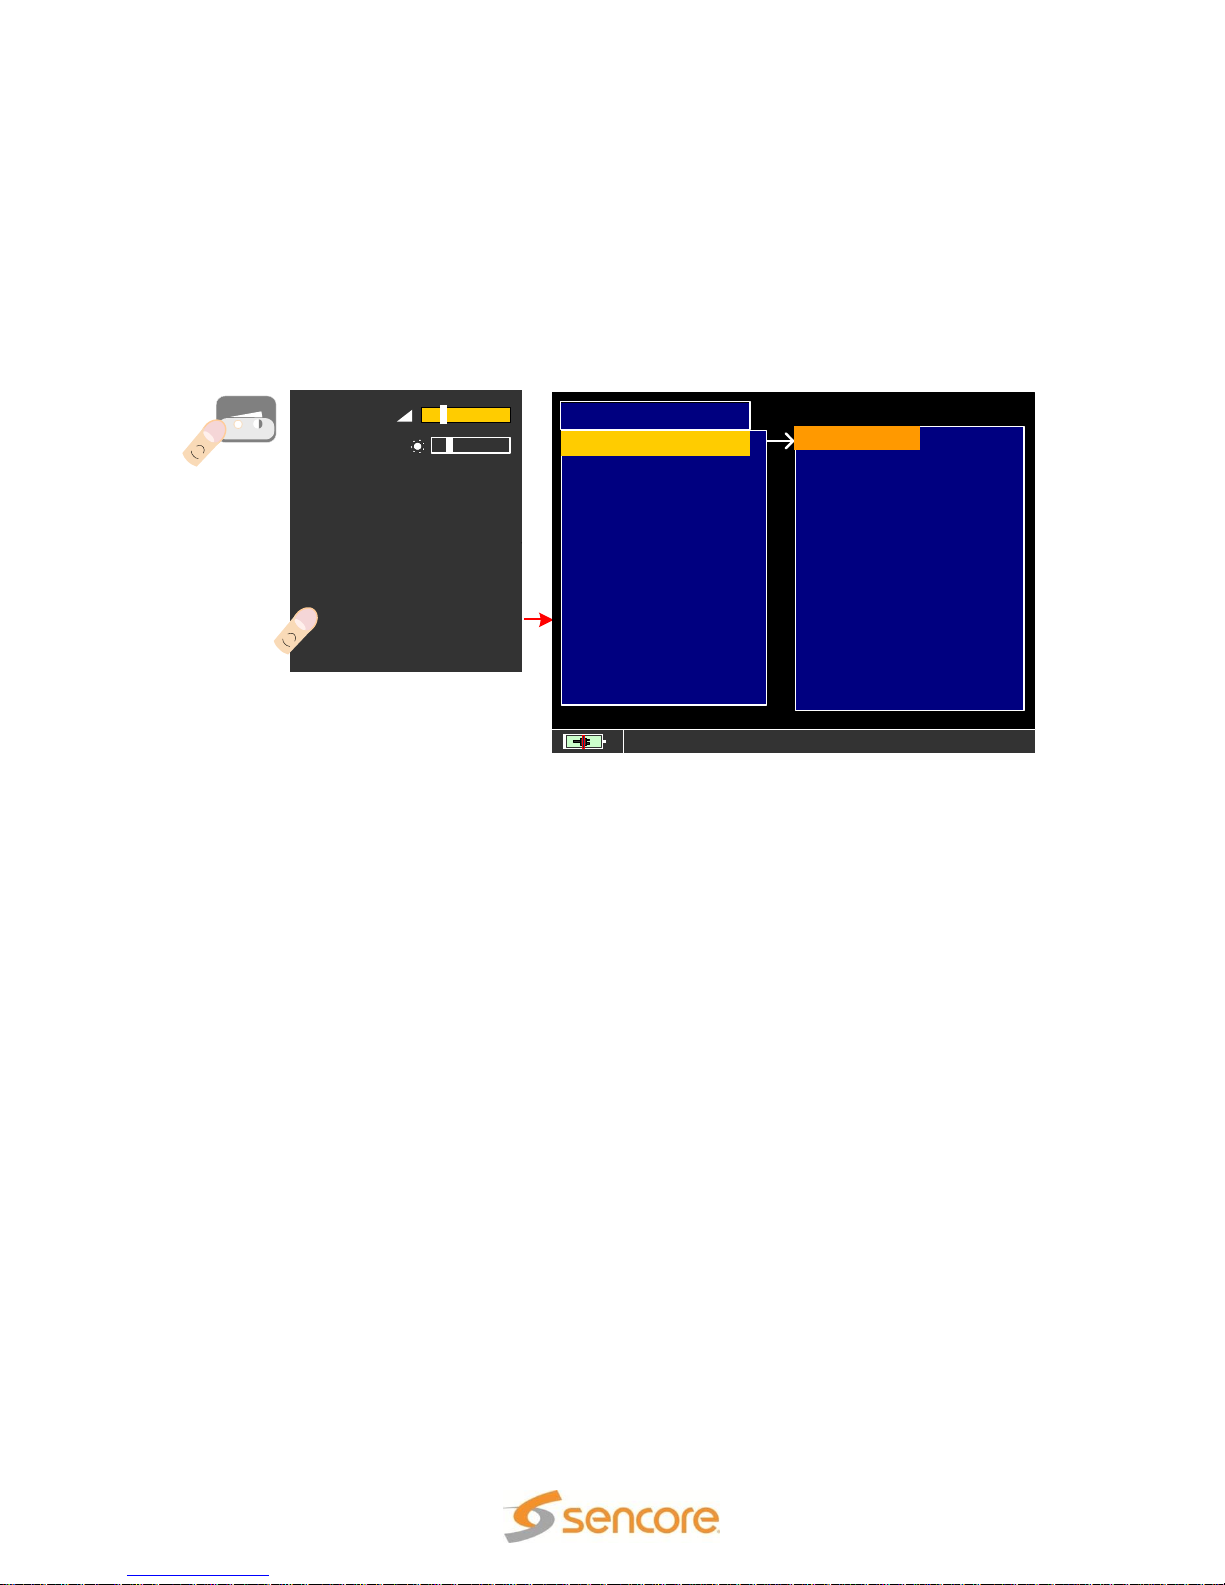
3.1 CONFIG Pushbutton (Quick View) Menu
The VOL/CONFIG pushbutton provides a quick view
menu showing display settings and several in/out
settings. This menu is intended to be easy to access
providing commonly used selections or adjustments. To
access this menu touch the VOL/CONFIG pushbutton at the
bottom right of the meter front panel. The menu that appears
automatically times off after a few seconds so is referred to as
the “Quick View Menu” in this manual.
Each of the listings in the Quick View Menu is selectable and
has an associated adjustment or selection which is shown to
the right. Upon opening, the Quick View menu defaults to the VOLUME field which is
highlighted. To select other listed fields, simply touch the screen with your finger over the
listing. Alternatively, you may push the ENTER pushbutton and slide your finger over the
arrow section of the Control Knob to navigate to other listings. The selection to the right
of the listing is highlighted when selected for change. The following section briefly
explains each of the selectable listings within this menu and explains the corresponding
selections and use.
3.11 VOLUME
The VOLUME field contains an adjustment bar which may be selected and varied to
increase or decrease the audio speaker level. This field is by default always selected or
highlighted when the VOL/CONFIG pushbutton is pressed and the Quick View menu
appears.
To change the volume, touch your finger or stylus to the left side of the adjustment bar to
decrease the volume. Touch to the right side of the adjustment bar to increase volume.
Or, once the bar is selected move your finger over the arrow of the Control Knob to
increase or decrease the volume setting.
The volume adjustment only varies the volume of the built-in meter’s speaker and the
volume of the Audio/Video Output jack. When using an external HDMI monitor
connected through the HDMI connector, the HDMI audio level is not varied with this
adjustment. However, you may adjust the volume with the controls on the HDMI
monitor.
Page 23 (124)
Page 24

SLM 1479 User Manual
3.12 BRIGHTNESS
The BRIGHTNESS field adjusts the display backlight setting resulting in an increase or
decrease in the display’s brightness. Keep in mind, that the brighter the display setting
the faster the internal battery pack discharges reducing the portable use time.
To change the brightness, touch your finger or stylus to the left side of the adjustment
bar to decrease the brightness. Touch to the right side of the adjustment bar to increase
the brightness. Or, once the brightness bar is selected by touching the BRIGHTNESS
field listing, move your finger over the arrow section of the Control Knob to increase or
decrease the brightness.
3.13 VIDEO IN
The VIDEO IN field selects the INT (internal) or EXT (external) video. The INT selection
directs the meter to route video from the meter’s internal demodulator to the meter’s
display for normal TV-RF signal analyzing and video viewing. This is the default setting.
Selecting EXT directs the meter to switch to an external video input monitoring mode. In
this mode the video input to the Audio/Video Input on the left side of the meter is routed
to the display for viewing. The audio to the Audio/Video Input is routed to the audio
circuits for monitoring. Selecting this mode defeats the normal RF measurement
functions.
Note that the normal default of the VIDEO IN setting is INT which provides normal meter
use and video viewing of the demodulated TV-RF signal. To setup the meter for external
video viewing, touch the VIDEO IN field or listing. Touch the highlighted field to
increment to EXT. To switch back to normal meter use, press the CONFIG pushbutton
and change the VIDEO IN setting back to the INT. setting.
3.14 IMAGE FORMAT
The IMAGE FORMAT field provides an aspect ratio selection for the displayed video.
The image format may be set to either16:9 or 4:3. The selection changes the aspect
ratio of the video viewed on the SLM 1479’s display. To select the image format, touch
the IMAGE FORMAT field, and touch the highlighted section to increment to the desired
aspect ratio.
3.15 RF IN
The SLM 1479 includes the optional capability of converting optical signals to RF
channels for input to the SLM 1479’s RF analyzing measurements. This capability
complements measurements directly from the fiber cable in RFoG and fiber to the home
delivery systems. The RF IN field provides control to switch or activate the Optical RF
output so it may be used to feed the RF IN jack of the meter.
When making TV or CATV RF measurements with inputs to the conventional F
connector or RF- IN jack, select the default or F (75 ohm) selection. When making
Page 24 (124)
Page 25

SLM 1479 User Manual
converted optical RF signals from the output of the Optical Converter via the RF OUT
jack select the OPTICAL selection in this field.
Note: This input selection does not influence the OPTIC power level measurement
function that is available from the HOME menu when the OPTIC icon is selected. This
function always uses the OPTICAL IN jack.
When making RF measurements from the optical converter you must connect a
connection cable from the RF OUT connector near the OPTICAL IN connector on the
top of the meter to the RF-IN jack at the top center of the meter. The SLM 1479 does
not contain an internal connection path from the optical converter to the meter’s RF
analyzing circuitry.
3.16 BATTERY SAVING
The BATTERY SAVING field provides control to either turn ON or turn OFF the battery
saving features of the meter. The SLM 1479 provides two battery saving features. When
the BATTERY SAVING setting is in the ON mode, if no user key press or touch
command is received for a period of 30 seconds, the display brightness is reduced. If no
user key press or touch command is received within 5 minutes, the meter automatically
powers off. When the displayed is dimmed, pressing a key or a touch command returns
normal display brightness and resets the timer.
To use the BATTERY SAVING features, touch the BATTERY SAVING field and touch
the highlighted selection field until it reads “ON.” To disable the BATTERY SAVING
features, touch the BATTERY SAVING field and touch the highlighted selection field to
read “OFF.”
3.17 CONFIGURATION MENU
The CONFIGURATION MENU field provides access to the Configuration Menu which
provides further meter and measurement setup. The next section (3.2) provides details
of the CONFIGURATION MENU.
Page 25 (124)
Page 26
SLM 1479 User Manual
BATTERY SAVINGS:
EXIT
VOLUME
:
BRIGHTNESS:
:
VIDEO IN
:
IMAGE FORMAT
CONFIGURATION MENU
:
INT
16/9
OFF
:
F (75
Ohm
)
SETTINGS AND CONFIGURATION MENU
METER
DIAGNOSTIC
CATV
TV
CABLE MODEM:
METER INFO
EXIT
CONFIGURATION MENU
000255000
DISP . LIGHT:
UNIT:
BACK
GRAPHICS COLOR:
LANGUAGE:
KEYS BEEP:
BATTERY TEST
dBmV
INT
OFF
BLUE
FULL ON
CALIBRATE TOUCHSCEEN:
TIMER OFF :
OFF
LAN CONFIGURATION:
TIME & DATE SETTINGS:
VOL.
CONFIG
RF IN
3.2 Configuration Menu
The CONFIGURATION MENU provides setup options for the meter and measurement
functions. The CONFIGURATION MENU is accessed by first pressing the VOL/CONFIG
pushbutton at the bottom right of the meter’s front panel. Secondly, touch the
CONFIGURATION MENU listing near the bottom of the Quick View Config. Menu as
illustrated below.
The CONFIGURATION MENU has several listings or categories in which setup
selections are available. The selections are listed at the right of the category. The
Configuration Menu includes METER, TV, CATV, CABLE MODEM, METER INFO and
DIAGNOSTIC listings. Each listing has an associated configuration menu. Touch the
screen listing to select the desired configuration menu. This section of the manual
covers each of the CONFIGURATION MENU listings and explains the associated
settings included within each.
3.21 METER CONFIGURATION
The METER listing provides display and measurement settings. To access the METER
field navigate to the CONFIGURATION MENU screen and touch the METER listing. The
METER menu appears to the right and includes the selectable fields TIMER, UNIT,
LANGUAGE, KEYS BEEP, GRAPHICS COLOR, DISP. LIGHT, BATTERY TEST,
CALIBRATE TOUCHSCREEN, TIME & DATE SETTINGS, and LAN CONFIGURATION.
The follow section describes the purpose and selections of each of these menu
selections.
3.21.1 TIMER OFF
The TIMER OFF field provides selections to specify the time delay before the meter
powers off from user inactivity. If no touch command is sensed by the meter within the
TIMER OFF setting time, the meter automatically turns itself off in order to save battery
life. To set, navigate to the CONFIGURATION MENU and touch the METER field. Then
touch the TIMER OFF listing followed by touches to the highlighted field at the right to
Page 26 (124)
Page 27

SLM 1479 User Manual
select the desired time delay. The settings include: OFF (meter always on), 5 min (meter
turns off in 5 minutes), 10 min (meter turns off in 10 minutes), 15 min (meter turns off in
15 minutes), 30 min (meter turns off in 30 minutes)..
3.21.2 UNIT
The UNIT field provides selection for the unit of measurement for the channel level tests.
The unit of measurements available include dBm, dBuV (dB microVolt), and dBmV (dB
milliVolt). To select, navigate to the CONFIGURATION MENU and touch the METER
field. Touch the UNIT field followed by touches to the highlighted selection field at the
right to increment to the desired unit of measurement.
NOTE: dBmV is the most popular reference for a TV and CATV measurements. dBm is
commonly used for satellite power references.
3.21.3 LANGUAGE
The LANGUAGE field provides selection for the language used by the meter’s display
menus. The language selections include English, Spanish, Dutch, French, Italian, and
Portuguese, and Polish. To select a language, navigate to the CONFIGURATION
MENU and touch the METER field. Touch the LANGUAGE field followed by touches to
the highlighted field at the right to increment through available language selections.
3.21.4 KEYS BEEP
The KEYS BEEP field provides selections to enable a beep sound from the meter’s
speakers when touch commands are received by the meter. The settings include OFF,
LOW, MEDIUM, and HIGH selections. The OFF selection disables the touch beeps. The
LOW, MEDIUM and HIGH selections enable the touch beeps and vary the sound level.
To turn on the key beep feature and select a volume navigate to the CONFIGURATION
MENU and touch the METER field. Touch the KEYS BEEP field followed by touches to
the highlighted field at the right to increment through available beep levels.
3.21.5 GRAPHICS COLOR
The GRAPHICS COLOR field provides selections for the color scheme used by the
various displays and menus of the SLM 1479. The color schemes include BLUE,
GREEN, GREY, and BROWN to match personal preferences. The color scheme
selected does not influence the battery use time. To select a color scheme, navigate to
the CONFIGURATION MENU and touch the METER field. Touch the GRAPHICS
COLOR field followed by touches to the highlighted field at the right to increment through
the available color schemes.
3.21.6 DISPLAY LIGHT
The DISPLAY LIGHT field provides several time selections to choose from for delaying
the time in which the POWER SAVINGS feature dims the display lights when there is no
user selection activity. To select a display light dimming time delay, navigate to the
CONFIGURATION MENU and touch the METER field. Touch the DISPLAY LIGHT field
followed by touches to the highlighted field at the right to increment through the available
Page 27 (124)
Page 28

SLM 1479 User Manual
time delays. Delay times may be FULL ON (display lights do not dim), 15 sec (display
lights dim in 15 sec), 30 sec (display lights dim in 30 seconds).
3.21.7 BATTERY TEST
The BATTERY TEST field provides an automated battery test and reconditioning routine
performed by the SLM 1479. The feature performs an internal battery test. The
BATTERYTEST checks/recovers the battery capacity and recalculates the meter’s
battery charge indicator to get precise Indications on the charge battery status. For
example, if the battery test indicates “000255000,” the battery capacity is approximately
255 minutes. If letters are indicated, such as a “000275BGEY” readout, the battery
capacity is 275 minutes. If sufficient time and/or a “Y” (YES) shows as the last letter,
then the batteries are considered good.
3.21.8 TOUCHSCREEN
The TOUCHSCREEN field provides the ability to enable or disable the touchscreen.
Setting this field to DISABLE will cause the touchscreen to be unresponsive to any touch
selection. Setting this field to ENABLE permits touchscreen sensitive display selection.
Note: Full user control is possible using the large rotating and push control knob along
with the front panel pushbuttons.
3.21.9 CALIBRATE TOUCHSCREEN
The touch sensitive screen can be calibrated to improve position or touch location
accuracy. If the touch point on the screen is shifted from the desired command or
selection field’s highlighted location or if you notice nearby values or commands are
selected, a touch screen alignment with the included stylus is recommended.
To calibrate the touch screen navigate to the
CONFIGURATION MENU and touch the
METER field. Touch the CALIBRATE
TOUCHSCREEN field to begin the calibration.
The meter presents target circles one at a
time in each corner of the meter starting at
the upper left and progressing clockwise.
Touch the stylus to the center of each circle
that alternately appears in the corners of the
display screen. Repeat this operation 4 times for each position or square that appears.
Page 28 (124)
Page 29

SLM 1479 User Manual
Be sure to use the special stylus pointer and touch the screen exactly in the center of the
target circle.
3.21.10 TIME & DATE SETTINGS
The TIME & DATE SETTINGS field provides entry of
the time in hours (1-24), minutes, and seconds. It
further provides entry of date information including
the month, day, and year. The time and date settings
are used for logging functions.
3.21.11 LAN CONFIGURATION
The LAN CONFIGURATION field provides selections to configure the RJ45 or LAN
connection port of the SLM 1479 for connection to a network. The menu provides
selection for a DHCP (Dynamic Host Connection Protocol) IP connection/configuration
or static connection/configuration. The static
configuration provides entry of IP, Network Mask
and Gateway address entries. To configure a LAN
connection, navigate to the CONFIGURATION
MENU and touch the METER field. .22 TV
Configuration
The TV listing provides settings relative to the
terrestrial TV measurements provided by the SLM
1479. To access the TV field navigate to the
CONFIGURATION MENU screen and touch the TV listing. The TV menu appears to the
right and includes the selectable fields LNB L.O., C/N TYPE, and DISCOVERY. The
follow section describes the purpose and selections of each of these menu selections.
3.23 TV CONFIGURATION MENU
The TV listing provides settings relative
to using the TV measurements provided
by the SLM 1479. To access the TV field
navigate to the CONFIGURATION
MENU screen and touch the TV listing.
The TV configuration menu appears to
the right and includes the selectable
fields LNB L.O., C/N TYPE,
DISCOVERY, FIELD STRENGTH and
EDIT ANT. FACTOR. The follow section
describes the purpose and operation of
each of these menu selections.
Page 29 (124)
Page 30

SLM 1479 User Manual
3.23.1 LNB L.O.
The meter LNB L.O. (Low Noise Block Converter - local oscillator) frequency is typically
used for settings associated with the Satellite receiver and dish settings. However, the
LNB L.O. feature is made available in the TV and CATV reception settings in the rare
case that an LNB L.O. input is required for a frequency conversion of the received
signal. The default setting is 0 MHz which results in no frequency conversion. If the LNB
L.O frequency is set or selected, the meter performs the frequency conversion
subtracting the lower frequency from the larger frequency.
Note: If the LNB L.O. frequency is not the default 0 MHz, the frequency readout in the
meter’s measurement screen will indicate improperly for the known broadcast or cable
channel frequency. The frequency indication is higher or lower by the entered L.O.
frequency value.
3.23.2 SNR LINE
The SNR LINE field is relative to measurements of analog channels only. The SNR
(Signal-to-noise-ratio) measurement is a measured ratio of the video noise compared to
the video amplitude or voltage. The ratio is calculated as a ratio of noise to signal
voltages in dB.
The integrated video waveform monitor for analog channels is used to measure the
SNR. The measurement is calculated using a single scan line of the detected video
modulation of the selected channel. The SNR LINE field provides selection of the analog
channel video scan line in which the meter performs the signal-to-noise ratio
measurement. The selected line must be void of any test signal or vertical interval data
as this would degrade or reduce the measured SNR measurement. The default line is
line 21. To select a different line, touch the SNR LINE field. Rotate the large control knob
to increment to the desired line. Push in the large knob to enter the selected line.
3.23.3 DISCOVERY
The DISCOVERY field provides an indication of the signal type(s) the meter searches for
when performing a channel scan when creating automatic channel plans for broadcast
TV. The DISCOVERY field in the TV Configuration is fixed at TERR. ONLY as there is
no need to search for cable channel modulation types.
3.22.4 FIELD STRENGTH & EDIT ANT. FACTOR
The FIELD STRENGTH field provides
modifications to the TV level measurements
when using the SLM 1479 to measure TV
coverage field strengths. The field provides
several selections of common antenna types.
Or, you may use an alternate antenna and
select the CUSTOM antenna selection. When
the CUSTOM selection is choosen the EDIT
ANT. FACTOR field becomes active and may
be selected to provide antenna factor calibration offsets and offsets for cable loss. For
Page 30 (124)
Page 31

SLM 1479 User Manual
normal TV antenna dBmV measurements, the FIELD STRENGTH field should remain
“OFF.”
3.23 CABLE MODEM
The CABLE MODEM listing provides
selection of the settings used for the
meter’s cable modem and DOCSIS
testing of a cable system. The settings
are divided into the Search Settings, Test
Settings and IP Settings and are
described in this section of the manual.
More information on the DOCSIS test
may be found in Section 7 of this manual
starting on page 97.
3.23.1 SEARCH SETTINGS
The SEARCH settings select the channels in which the DOCSIS downstream channels
are selected for testing. The AUTOMATIC selection permits the meter to automatically
search and find the DOCSIS downstream channels. The FIXED search setting defines
the channel, channel plan and channel frequency used as the primary downstream
DOCSIS test channel. The channel within the selected channel plan defined for CATV
measurements may be selected for the DOCSIS downstream channel. A frequency
entry may be used to offset the frequency of the channel selected or define a test
frequency.
3.23.2 TEST SETTINGS
The TEST settings select or define the input receive (RX) level for the cable system
CMTS. This receive level is used by the DOCSIS Measurements to determine the
attenuation (ATT:) measurement level using the known output level of the meter’s cable
modem and defined receive level.
The REG. MODE defines the DOCSIS test mode as to if registration with the CMTS is
desired. When ON the meter’s modem negotiates connection with the CMTS and
requests service authorization. When authorization is granted then the meter is able to
complete PING REPORT testing and IP Report measurements. When the REG. MODE
is set to OFF the DOCSIS test does not register with the CMTS and only upstream and
downstream measurements are provided.
3.23.3 IP SETTINGS
The IP Settings section configures the CMTS Gateway and MAC Address required for
network connection. The address can be the pinged address (Gateway) or a user
defined address. The MAC ADDRESS can be the default of the meter or be a user
defined (USR DEF) MAC ADDRESS inwhich to emulate a cable modem inwhich is
registered for use with the cable system CMTS.
Page 31 (124)
Page 32

SLM 1479 User Manual
Please see the DOCSIS testing section of this manual for descriptions and use of the
DOCSIS MEASURE and TONE GENERATOR sections of the DOSCIS tests.
3.24 CATV CONFIGURATION
The CATV listing provides settings relative
to using the CATV measurements provided
by the SLM 1479. To access the CATV field
navigate to the CONFIGURATION MENU
screen and touch the CATV listing. The
CATV menu appears to the right and SNR
LINE, and DISCOVERY. The follow section
describes the purpose and selections of
each of these menu selections.
3.24.1 LNB L.O.
The meter LNB L.O. (Low Noise Block Converter - local oscillator) frequency is typically
used for settings associated with the Satellite receiver and dish settings. However, the
LNB L.O. feature is made available in the CATV reception settings in the rare case that
an LNB L.O. input is required for a frequency conversion of the received signal. The
default setting is O MHz which results in no frequency conversion. If the LNB L.O
frequency is set or selected, the meter performs the frequency conversion subtracting
the lower frequency from the larger frequency.
Note: If the LNB L.O. frequency is not the default 0 MHz, the frequency readout in the
meter’s measurement screen will indicate improperly for the known broadcast or cable
channel frequency. The frequency indication is higher or lower by the entered L.O.
frequency value.
3.24.2 SNR LINE
The SNR LINE field is relative to measurements of analog channels only. The SNR
(Signal-to-noise-ratio) measurement is a measured ratio of the video noise compared to
the video amplitude or voltage. The ratio is calculated as a ratio of noise to signal
voltages in dB.
The integrated video waveform monitor for analog channels is used to measure the
SNR. The measurement is calculated using a single scan line of the detected video
modulation of the selected channel. The SNR LINE field provides selection of the analog
channel video scan line in which the meter performs the signal-to-noise ratio
measurement. The selected line must be void of any test signal or vertical interval data
as this would degrade or reduce the measured SNR measurement. The default line is
line 21. To select a different line, touch the SNR LINE field. Rotate the large control knob
to increment to the desired line. Push in the large knob to enter the selected line.
Page 32 (124)
Page 33

SLM 1479 User Manual
3.24.3 DISCOVERY
The DISCOVERY field provides an indication of the signal type(s) the meter searches for
when performing a “HELP” channel function. A HELP discovery analysis is performed
when in the Spectrum mode and selecting the MENU & ? menu and touching the HELP
icon. A discovery analysis automatically tries to determine a channel band’s modulation
type, symbol rate and bandwidth resulting in an automatic configuration of the meter and
signal tuning/reception.
The DISCOVERY field in the CATV Configuration menu identifies CABLE ONLY. No
selections or changes are available.
3.25 METER INFO MENU
The METER INFO menu provides
information regarding the internal
hardware, firmware, boot-up version,
microprocessor program version,
and serial number. The menu further
indicates the inclusion of optional
hardware and firmware features.
The MAC address of the meter is
also indicated.
The Meter Info Menu contains an
“OPTIONS” selection at the bottom
right. Touch this selection or rotate the large Control Knob to highlight the OPTIONS
row and push the knob in to select.
The OPTION LIST menu shows
possible options for the SLM
1479. It further indicates a YES
or NO indicating if that option is
included or licensed in the
meter. Not all of the listings are
currently offered or available for
the Sencore SLM 1479. The
COAX CABLE
REFLECTOMETER, 2700 MHZ
SAT. EXT, VIDEO WAVE F.
MONITOR, and HD REMOTE
CONTROL are not currently
available. Some options on the list are provided courtesy of Sencore and are not
additional purchased options. Examples include the TV MINISPECTRUM, VIDEO WAVE
F. MONITOR, and HD AUDIO DOLBY +. These options are included with every SLM
1479.
Page 33 (124)
Page 34

SLM 1479 User Manual
3.26 DIAGNOSTIC TEST
The DIAGNOSTIC listing in the
CONFIGURATION MENU provides a
self-test of the meters internal
circuits. The circuits should all
indicate “OK” if they are working and
responding to the microcontroller. If
a listing does not indicate OK, a likely
problem exists. Please contact the
Sencore Service Dept. for assistance.
Please see Appendix B of this
manual for service information and
procedures.
Page 34 (124)
Page 35

SLM 1479 User Manual
Section 4 Video In Monitoring
The SLM 1479 offers a video input monitoring capability to supplement its TV-RF
analyzing capabilities. This section summarizes the video input features and provides
operational information.
4.1 Video In
The video display of the SLM 1479 may be used as an NTSC
composite video monitor through the use of the VIDEO IN jack
located at the top left of the meter. The video input jack is an
RCA phono connector. Connect an RCA phono to RCA phono
connection cable from the composite video source to the VIDEO
IN connector of the meter.
Select the VOL/CONFIG or Quick View menu by touching the VOL/CONFIG pushbutton
at the bottom right of the meter. Touch the VIDEO IN field and touch the listing at the
right to change to “EXT.” This puts the meter into a video monitoring mode to monitor
composite video. No RF measurements are available when in this mode. If selected the
meter’s touch panel screen goes blank if no video signal is being input to the VIDEO IN
jack. Press the VOLUME/CONFIG pushbutton to return to the normal meter
measurement function.
Page 35 (124)
Page 36

SLM 1479 User Manual
Section 5: TV Broadcast Measurements
The broadcast TV signal analysis provided by the
SLM 1479 indicates the performance of
broadcast television digital 8VSB signals.
Measurements provide guidance for antenna
installation/aiming and may be used to test TVRF distribution systems. This section provides
information on the broadcast TV measurements.
5.1 TV Plan Selection
When the TV icon in the HOME Menu is highlighted, pressing the PLAN SELECT front
panel pushbutton presents a TV BROADCAST PLAN SELECTION MENU. This menu
provides selections which define a tuning plan for selecting TV channels and respective
frequency bands for measurements. The TV BROADCAST PLAN MENU contains
several listings of which to choose from. The following is a brief description of these
listings and their content.
TvMASTER PLAN: This selection provides a listing of standard or master TV channel
plans to choose from. For testing applications in North America, the USABRO listing
provides a suitable channel plan which includes all the off-air TV channels from 2 to 69.
AUTOMEMORYtv: This selection provides a
list of channel plans to choose from that are
“AUTO” plans. These plans are created with
the AUTOMEMORYtv feature in the MEMORY
MENU. Please see section 5.81 of this manual
for information on creating an AUTO channel
plan. If you have created an AUTO plan for
broadcast signal analyzing or antenna work, it
will be listed for selection.
MANU MEMORY (MIX) Plan: The MANU MEMORY (MIX) listing in the TV
BROADCAST PLAN menu contains manually created channel plans. A manual plan
may include a mix of cable channels or TV broadcast channels. Manual channel plans
may be edited in the MEMORY MENU function or using the supplied SMART software.
Manual channel plans may be created in the SMART software. The MANUMEMORY of
the SLM 1479 includes a USATSC plan with all the off-air TV channels from 2 to 69. This
plan may be edited in the MEMORY MENU to customize it for your local channels.
Please see section 5.82 of this manual.
To Select a Broadcast TV Channel Plan:
1. Touch the TV icon. Touch the PLAN SELECT pushbutton to present the
BROADCAST PLAN SELECTION MENU.
Page 36 (124)
Page 37

SLM 1479 User Manual
MEAS
15
aBER: <10-9
ERR:= 0059
-2 -3 -4 -5 -6 -7 -8
POWER: -5 dBmV
MER: 29.9 dB
8 12 16 20 24 28 32 36 40 42
QLTY: PASS
Ns.MAR: 11.5 dB
-1 1 3 5 7 9 11 13 15 17 19
bBER: 3X10⁻⁸
-2 -3 -4 -5 -6 -7 -8
-12 -6 0 2 4 6 8 10 12 14 16 18
Vpid: 49 Apid: 52
ANNEX : 8VSB
SYM. RATE: 5.381MS/s
ENCRYPT.: Clear
PLAN MODULAT CONST DC@RF
USABRO VSB 8VSB OFF
CHAN
FREQ
11
201.00
TSID: 2643
MENU & ?
KELO
21
16
1
2
3
4
5
6
7
8
9
11
10
20
19
18
17
12
13
14
TV
2. Touch the TvMASTER PLAN. Touch the USABRO field in the center list. Press the
TV pushbutton or the MEAS icon at the right. The meter advances to the TV
MEASUREMENT page.
5.2 TV Digital & Analog Measurements
The SLM 1479 provides a comprehensive
analysis of a TV broadcast signal, either
digital or analog. Digital signal analysis
includes standard 8VSB analysis. To access
the TV Broadcast measurements touch the
TV icon on the HOME page or touch the TV
front panel pushbutton. Press the PLAN
SELECTION pushbutton to select a broadcast
channel plan as outlined in the previous
section.
5.21 Main Digital TV Measurement Page
The main measurement page includes many fields. The following section describes the
fields of a digital channel measurement as numbered in the figure below.
1. Plan: The TV channel plan selected in the TV Broadcast Plan Selection Menu or in a
Manual channel plan
2. Modulation: The modulation type of the digital signal. Defaults to the type identified
in the channel plan which should be VSB for broadcast TV in North America for the
selected channel (6). This is a field that permits selection of other modulation types and
analog (AN.TV).
3. CONST: The current setting for constellation based upon modulation.
Page 37 (124)
Page 38

SLM 1479 User Manual
4. DC@RF: This field indicates OFF as the SLM 1479 does not provide switchable
output DC voltage
5. FREQ: The center frequency of the digital channel or video carrier of analog channel.
Selectable field permits frequency tuning.
6. CHAN: The selected channel being analyzed. Selectable field permits channel
selection. The channel must be included in the selected channel plan (1).
7. Video: The active video on the selected video service within the channel
8. VPID/APID: Video and Audio Program Identifier values for the selected video service
contained in MPEG
9. ANNEX: The standard signal type or reference – 8VSB for terrestrial digital signals.
10. SYM RATE: The symbol rate of the RF digital carrier in million (MEGA) symbols
per second.
11. Encryption: Indicates if the selected video service is encrypted
12. Locked Symbol: Indicates if the meter’s receiver is locked to a digital RF signal
13. MENU & ?: Provides a popup menu with related selections and a HELP icon for
auto tuning to determining the channel signal modulation, symbol rate, and frequency.
14. Network Name (NETW): Indicates the network name or identification
15. TSID or NID: Transport Stream or network Identification numbers
16. aBER: Bit Error Ratio measurement after error correction measurement
17.bBER: Bit Error Ratio measurement – before error correction
18.Noise Margin (Ns.MAR): Provided margin signal vs. noise power measurement
19.Quality (QLTY) Rating: Quality rating based upon MER and noise margin values
20. MER: Modulation Error Ratio measurement of selected channel
21. POWER: Average Power measurement for the digital channel and video carrier
peak measurement for an analog channel, typically in dBmV.
5.22 Analog TV Measurements
The SLM 1479 may be used to
analyze the level, A/V ratio,
signal-to-noise (SNR) and
analyze the video waveform of
an analog TV channel. You may
further view the demodulated
video and listen to the audio. To
measure a TV channel as an
analog channel, the modulation
type for the channel must be
specified as an analog TV
channel. The abbreviation for
this on the meter is “AN. TV.”
You may change the modulation type of a selected channel in the main measurement
page by touching the MODULAT header. Select the AN.TV listing in the drop down
selection box by touching the AN.TV listing
Analog measurements are provided on three different measurement pages. The 1st page
provides a level measurement, provides video and audio monitoring, and provides a
basic spectrum analyzer view. Any voltage input to the RF jack is indicated by the
Page 38 (124)
Page 39

SLM 1479 User Manual
voltmeter measurement. The 2nd page provides a waveform monitor screen in which the
signal-to-noise ratio and hum is measured on a selected video line. The 3rd
measurement page provides a waveform monitor (WFM) screen in which the selected
scan line of detected video is scanned and displayed.
Push the TV front panel push button to
increment to each measurement page. Or
touch the display’s SNR field to increment to
the second SNR MEASURE page or touch
the WFM field to advance to the 3rd WFM
(Waveform Monitor) measurement page.
5.22.1 SNR MEASURE
The SNR measurement page provides
analysis of the detected video of the analog channel. The signal-to-noise ratio indicates
the dB ratio or difference between the noise voltage and video amplitude voltage. The
greater the ratio or dB value the better. The measurement should be performed on a
video line in which there is no active video by selecting a line in the vertical blanking
interval. Be sure to select a line in which there is no test signal or data signals such as
close captioning. The default Line Num is selected in the meter’s configuration menu.
Please refer to section 3.23 starting on page 28.
5.22.2 WAVEFORM MONITORING (WFM)
The waveform monitor measurement page
provides a view of the selected line of the
detected video modulation of an analog
channel. The LINE NUM field or header field
may be selected and the knob rotated to
increment/decrement to the desired line of
video. The display shows one scan line starting
at the beginning of the horizontal sync period to
the beginning of the next sync period.
The waveform monitor offers a LINE ZOOM
feature in which the first part of the scan line
can be expanded for viewing. Select the
WAVEFORM field and increment the large
know to select the LINE ZOOM mode.
5.23 FM Radio Tuning & Measurement
To measure the level of an FM radio signal, touch the MODULAT header field and select
the “FM RADIO” listing. Touch the FREQ header and enter the FM radio frequency. The
level of the FM radio signal is metered and you may listen to the detected audio.
Page 39 (124)
Page 40
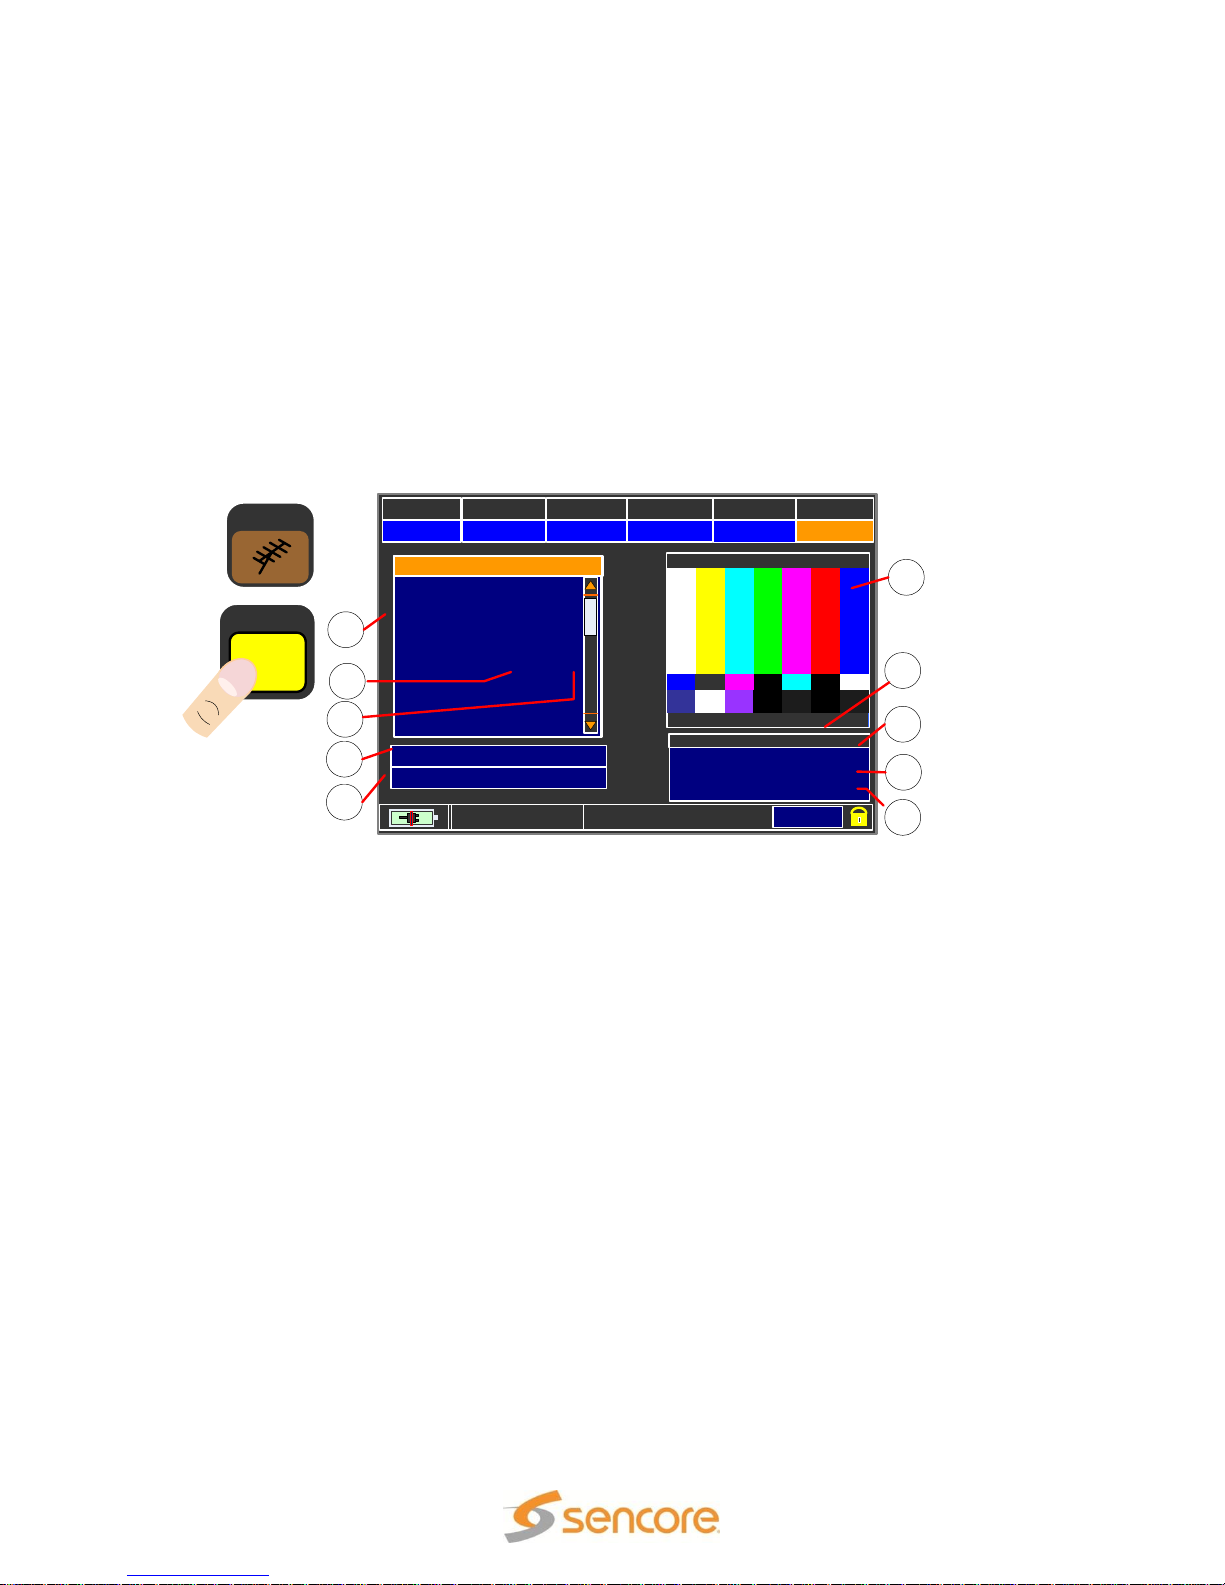
SLM 1479 User Manual
Vpid: 49 Apid: 52
SERV. ID. : 49
SYM. RATE: 5.381MS/s
ENCRYPT.: Clear
PLAN MODULAT CONST DC@RF
USABRO VSB 8VSB OFF
CHAN
FREQ
11
201.00
TSID: 2643
MENU & ?
KELO-TV_
DISCOVERY:
TV N
TV N
NAME
TYPE ENC
DATE:
VIDEO RATE:
15/01/2012
15.01 Mb/s
10
7
6
2
1
4
3
5
9
8
MPEG SERVICE
LIST
TV
5.3 TV MPEG SERVICE List
The MPEG SERVICE LIST measurement page of the SLM 1479 provides information
regarding the MPEG stream and video service/programs of the selected TV channel.
The MPEG SERVICE LIST page may be accessed in two ways. From the HOME Menu
with the TV icon highlighted, touch the MPEG SERVICE LIST icon. Secondly for
convenience from the TV Main Measurement Page, touch the box below the displayed
video. Touch the same box to return to the Main Measurement Page from the MPEG
SERICE LIST page.
5.31 TV MPEG Service Page Description
The MPEG SERVICE LIST measurement page provides information regarding the
MPEG transport stream and the selected video service/program contained in the stream.
The top and bottom fields are the same as listed and described in the Main
Measurement page in section 5.2 of this manual. The unique fields are numbered in the
nearby figure and a brief description of these fields follow.
1. Demodulated Video Display: Shows the demodulated video of the selected
service from the selected satellite transponder.
2. VPID/APID: Indicates the VPID (Video Packet Identifier Number) and APID (Audio
Packet Identifier Number) of the selected video service/program.
3. Service ID: The video service/program identification number
4. Symbol Rate: The RF symbol rate of the channel’s digital signal
5. Encryption Status: Indicates if the video service selected is in the clear or
encrypted.
6. Video Rate: The MPEG data rate of the selected video service/program
7. Date: The current date as listed in the MPEG stream
8. Encryption Status: Indicates if the individual services are encrypted (YES) or in the
clear non-encrypted (NO).
10. Service List: List the video services/programs in the MPEG transport stream
Page 40 (124)
Page 41

SLM 1479 User Manual
ZOOM:
FULL
5.32 TV Constellation & Monitoring
The constellation measurement page provides a second page of analysis of a broadcast
digital channel. The top and bottom fields of the page are the same as the main
measurement page. The left center of the Constellation & Info page provides a
constellation analysis. The right center of the Constellation & Info page provides an
INFO box with information regarding the CATV channel being measured.
There are two ways to access the Constellation & Info measurement page form the Main
Measurement page. Either press the TV pushbutton on the meter front panel or touch
the display screen anywhere on the left center measurements area from the POWER
measurement bar down to the aBER measurement bar. Touch this same area to return
from the Constellation Measurement page to the Main Measurement Page.
CONSTELLATION
The constellation analysis provides a
visual indication of the detected RF
symbol accuracy. The constellation
diagram changes its appearance to match
the modulation type and the number of
symbols in the RF transmission. When
measuring an 8VSB transmission the
constellation diagram consists of 8 vertical
spaced sections with detected symbols
plotted within. A good constellation ends
up showing a tightly created line from top
to bottom in the middle of each of the 8 sections or targets. As noise and other signal
impairment degrade the signal, the lines widen or separate from the middle target.
The constellation diagram may show a full or all the symbol
squares or ¼ sections of the constellation using the ZOOM
feature. To zoom into a smaller ¼ section of the full constellation
diagram, touch the selection box to the side or right of the
ZOOM box. Multiple touches increment the ¼ section view
through all the quarter sections of the constellation diagram. The
box to the right of the selection box indicates the selected
section being shown by the constellation diagram. .
ANNEX: The digital signal standard annex is 8VSB and it complies with the North
American ATSC standard.
SYM. RATE: The detected symbol rate of digital channel
VOLTMETER: Any voltage measured at the RF IN jack of the meter. If AC voltage is
present the frequency is indicated.
Page 41 (124)
Page 42

5.33 TV MPEG Video Service Monitoring
PLAN MODULAT CONST DC@RF
USABRO VSB 8VSB OFF
CHAN
FREQ
11
201.00
TSID: 2643
MENU & ?
KELO - TV
VIDEO: MPEG-2 528 x 480i 4:3 29Hz MP@ML
AUDIO: AC3 48 KHz LANGUAGE: eng
The video displayed in the Main Measurement Page or in the MPEG SERVICE LIST
page may be expanded to fill the display screen. For a full screen view of the
demodulated video of a selected video service touch the displayed video section of the
screen.
The displayed video initially indicates the video service name along with associated
MPEG header video and audio information. This information is located along the bottom
of the display and includes the video resolution, aspect ratio, and MPEG compression
level. The audio information includes the format, and data rate. After a few seconds for
review, the bottom section is pushed to the bottom of the display. When viewing a full
video display you may return to the previous measurement screen by touching the
center of the screen.
5.34 MINISPECTRUM
The MINISPECTRUM feature provides a
channel spectrum analyzer overlay on the
video display within the main
measurement page. The spectrum
overlay is approximately a 10 MHz span
with the center frequency as indicated in
the FREQ. field. The overlay cannot be
enable or disabled. When you touch the
display and expand the video to full
screen the overlay is removed. The
spectrum overlay provides convenient
feedback of multipath and optimum
antenna orientation at the same time you
are monitoring the channel’s digital
quality measurements.
SLM 1479 User Manual
Page 42 (124)
Page 43
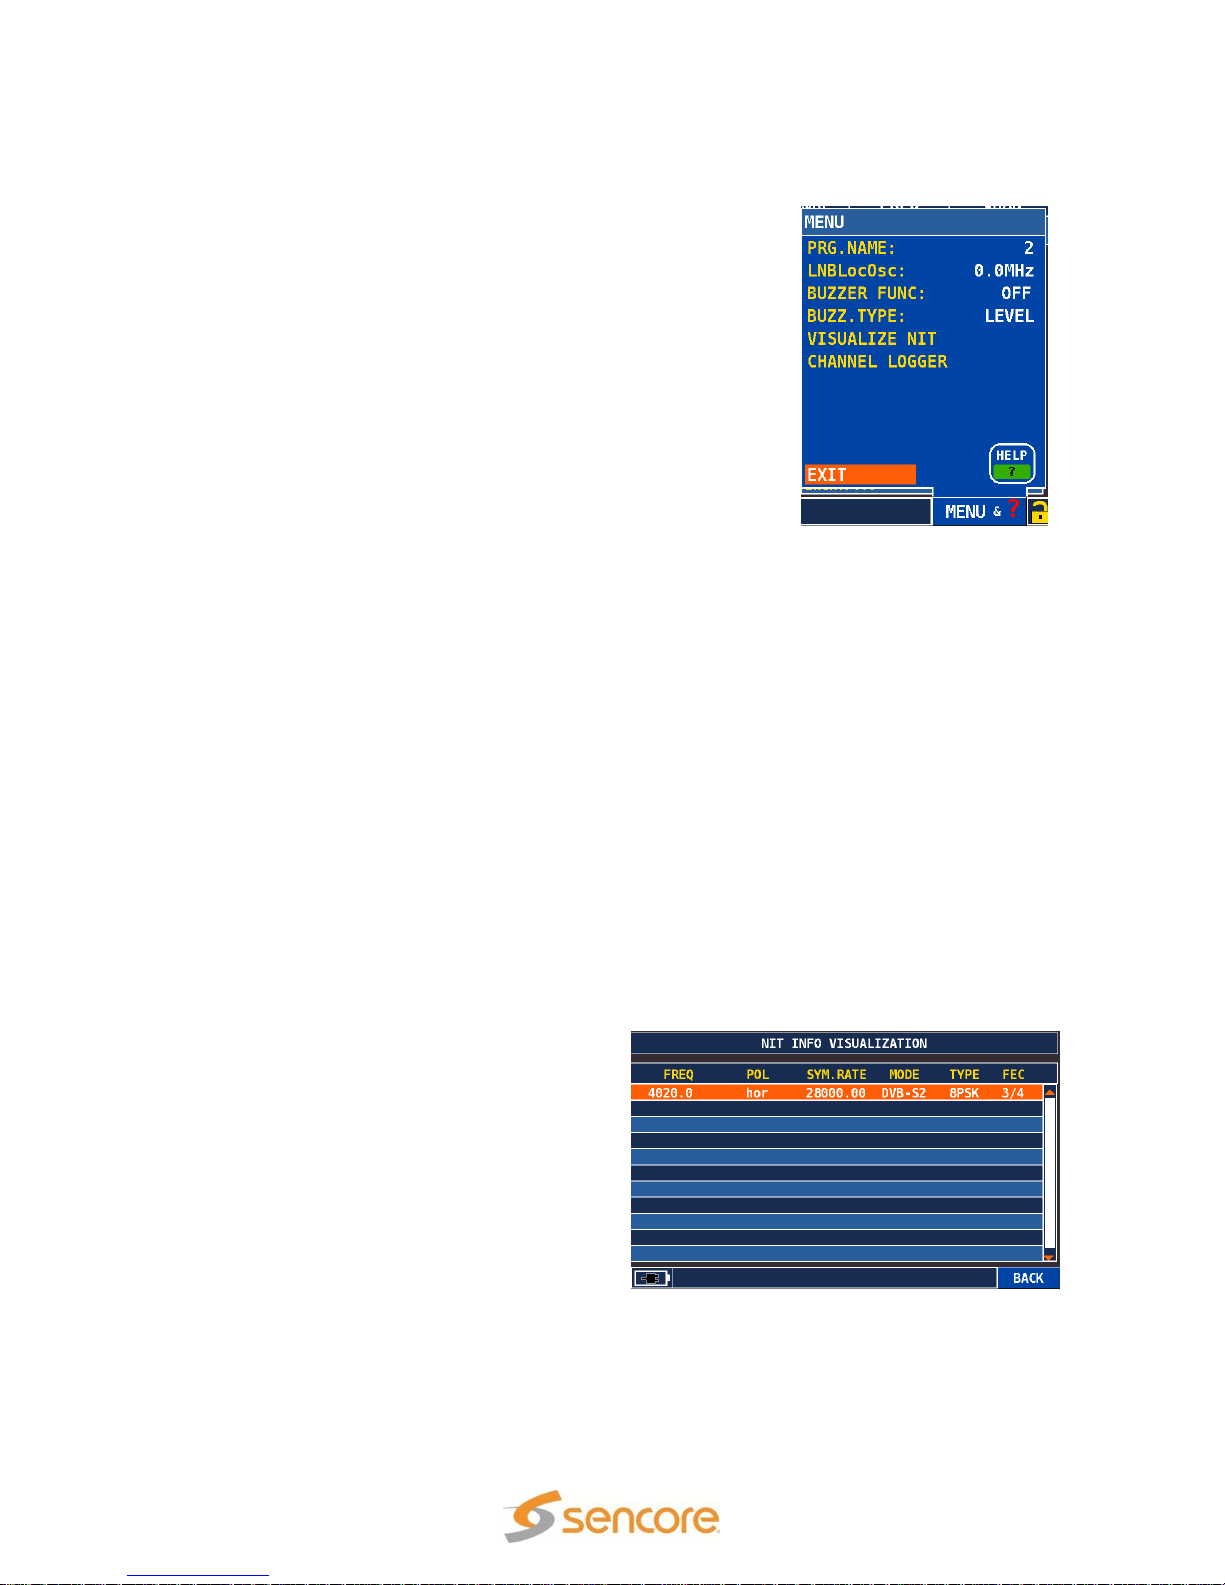
SLM 1479 User Manual
5.4 TV Measurement Popup Menu
The TV measurement page includes a popup menu that
provides easy changes to the meters local oscillator and to
the buzzer functions. It further includes quick access to the
HELP DISCOVERY function. The Popup Menu listings are
explained below.
PRG. NAME: The current channel number
LNBLocOsc: Provides user changes to the local oscillator
setting of the meter. This remains at 0 MHz for all typical TVRF input signal testing.
BUZZER FUNC: Provides a switch selection to turn the
alignment buzzer on or off.
BUZZ. TYPE: Provides a selection to produce a tone based upon the received signal
level or on the signal noise margin measurement.
VISUALIZE NIT: Provides a measurement screen with the information contained in the
DVB Network Information Table.
CHANNEL LOGGER: Monitors and charts the digital RF measurements of a TV or
cable channel.
5.43 VISUAL NIT
The SLM 1479 provides an information page of the data found in a DVB compliant
signal’s NIT (Network Information Table). This feature is not applicable when analyzing
North American ATSC broadcast signals as they do not include a NIT table.
When the signal includes a NIT table you may view the NIT information, touch the
MENU & ? field and touch the VISUALIZE NIT listing. Press the large Control Knob to
enter or initiate the VISUALIZE NIT feature.
The VISUALIZE NIT page includes the following information.
Frequency: The transponder frequency
Pol: Polarity of the transponder signal
horizontal or vertical
Sym Rate: Symbol rate of the transponder
Mode: DVB standard
Type: Constellation depth
FEC: Forward Error Correction applied
Note: When the signal contains no NIT
table, the VISUALIZE NIT function cannot
find or read the data needed to populate the
screen. A NIT table is common in a DVB formatted signal.
Page 43 (124)
Page 44
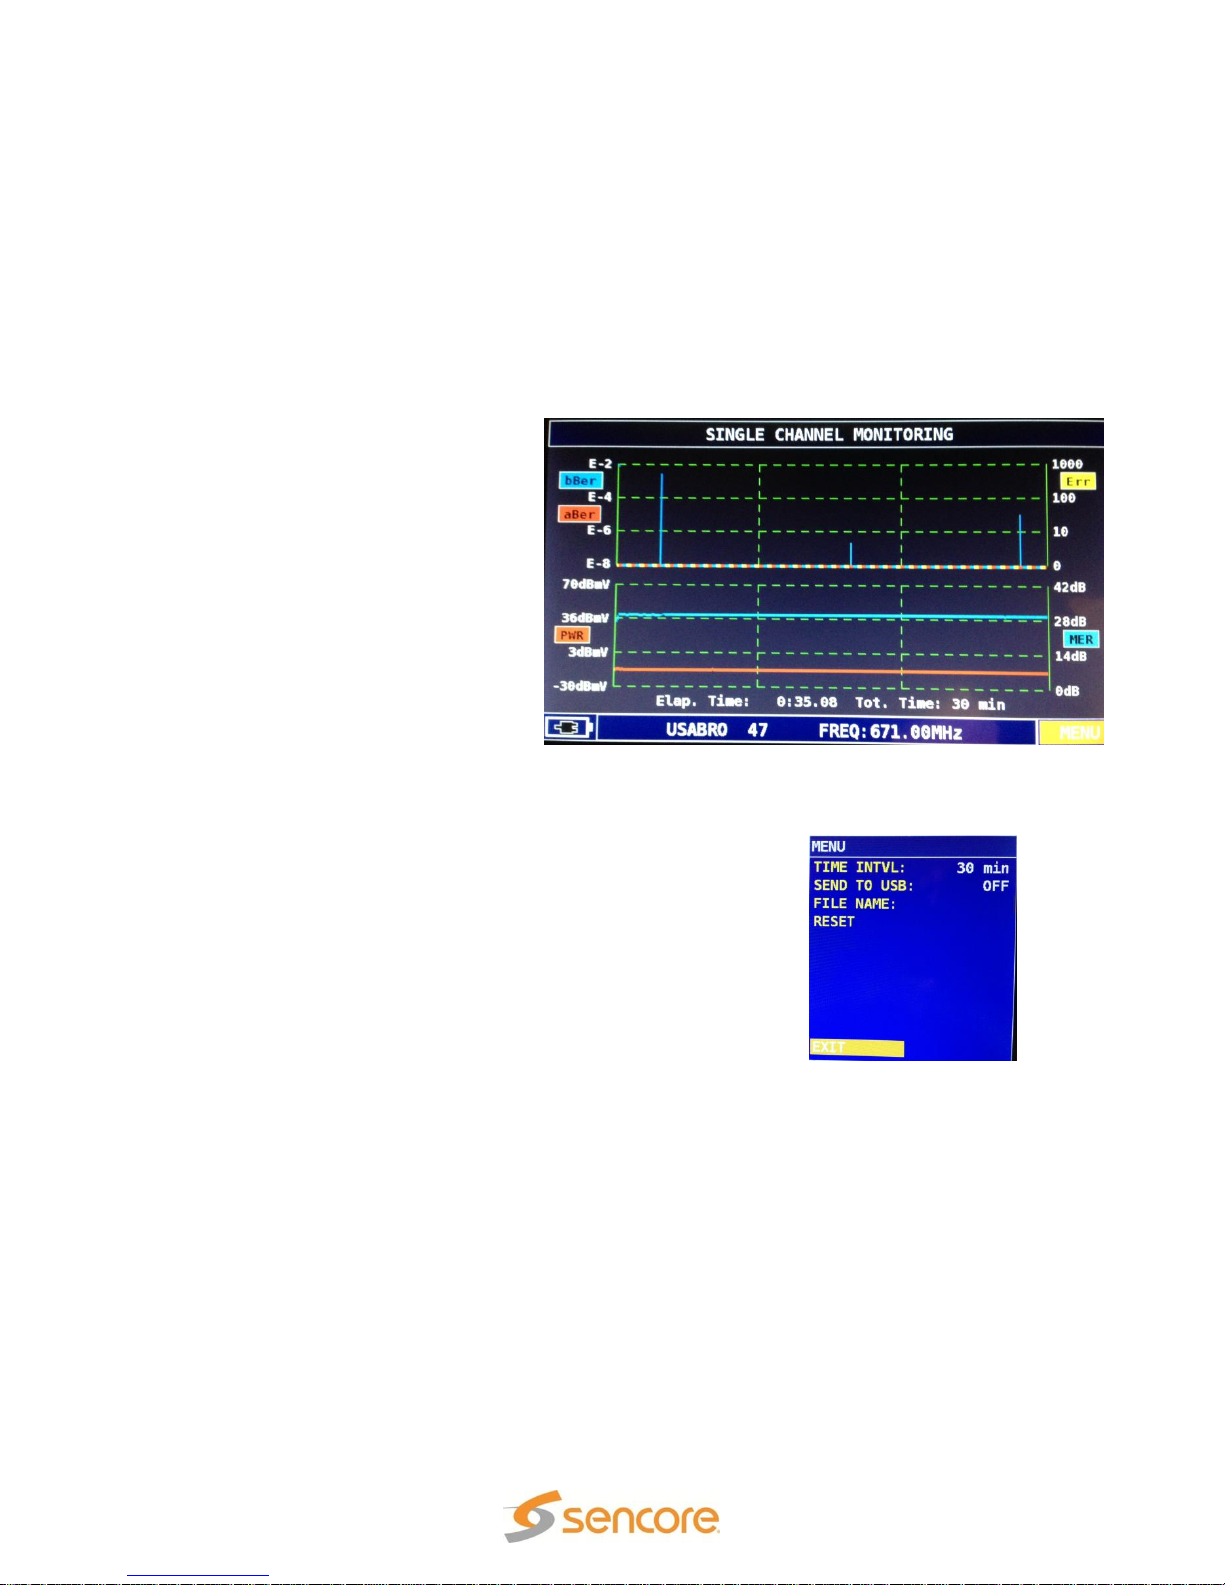
SLM 1479 User Manual
5.44 CHANNEL LOGGER
The SLM 1479 includes the ability to continuously monitor and chart the critical RF
analyzing measurements of a broadcast channel over a selected time period. The
charting allows you to see events or times of RF signal impairments or reception
interruptions. To select the Channel Monitoring feature touch the MENU & ? field when
in the main measurement screen. In the popup menu touch the CHANNEL LOGGER
field. The SINGLE CHANNEL MONITORING screen with multiple measuring graphs is
presented.
The Single Channel Monitoring
screen is divided into a top and
bottom chart or graph. Each graph
includes multiple channel
measurements as described
below:
Top Chart: The top chart of the
monitoring screen provides charted
values which include 3
measurements on a single chart.
The measurements are color
coded to indicate aBER (red),
bBER ((blue), and packet errors
(yellow). Menu when in the The channel monitor provides a continuous graphing of the
satellite transponder being received.
Bottom Chart: The bottom chart provides charted values of
the channel’s measured power (red), and MER (blue).
When in the Single Channel Monitoring function a control
Menu provides selections applicable to the charting. The Menu
includes the time interval setting elapsed from the left to right
side of the chart.
TIME INTVL: Time Interval of the graph shown on the
display.
SEND TO USB: Turns on the capability of writing channel monitoring values to a USB
memory stick file. When turned ON the graphed values of the channel measurements
are suspended and values are written to the USB stick file.
FILE NAME: Produces an entry menu to define a fine name to store channel
monitoring values on the USB memory stick.
RESET: Resets or clears the graph. Restarts the channel monitoring and graphing.
The Channel Logger provides a means to continuously sample and record the key
channel measurements to a file on the USB stick. To do this insert a USB stick into the
Page 44 (124)
Page 45
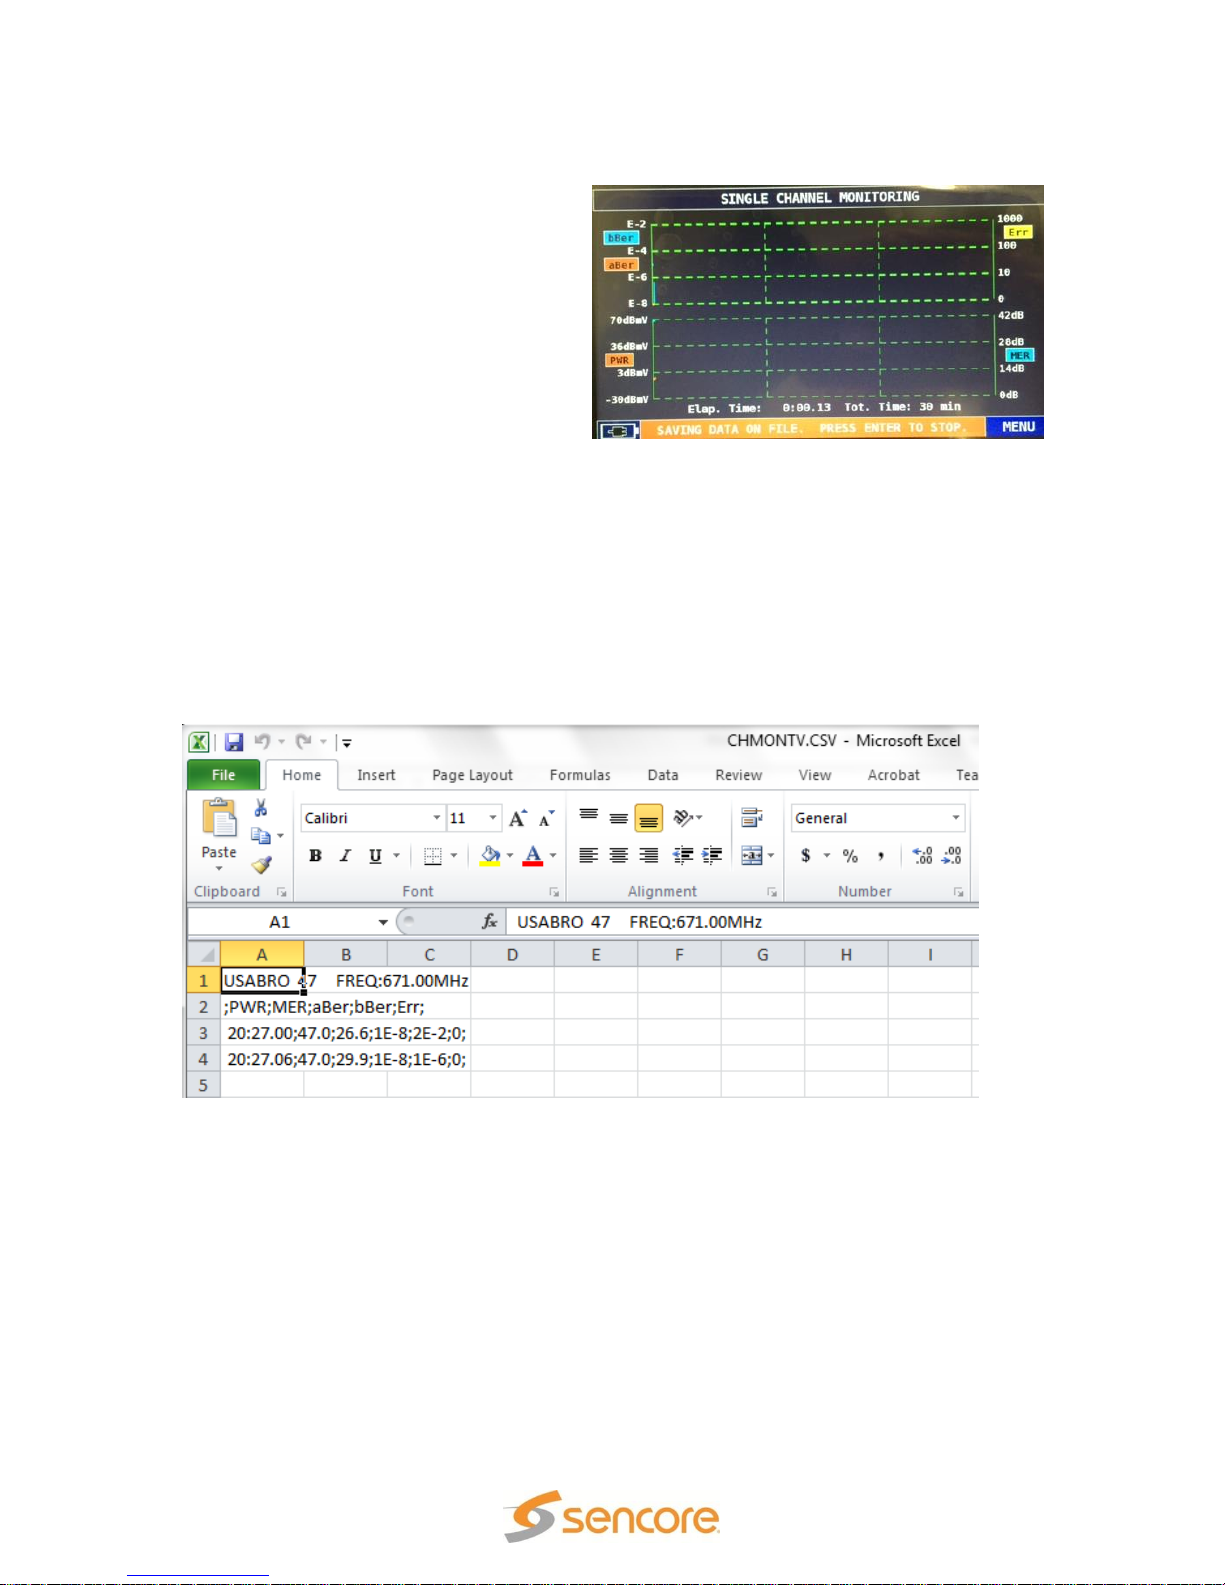
SLM 1479 User Manual
meter USB-A port. Setup meter to the desired channel to be monitored/logged. Press
the MENU & ? menu and select
Channel Logger feature. Press the
MENU field in the SINGLE CHANNNEL
MONITORING screen. In the menu,
select FILE NAME and enter a file name
for the data to be stored on the USB
stick. Select the SEND TO USB field
and increment to “ON.” Press the
ENTER selection or press the large
control knob in to Enter. Measurements
are active and the bottom of the display
indicates “SAVING DATA ON FILE. PRESS ENTER TO STOP.” Press the large control
knob in to stop the logging.
USB Logging File Data
Channel monitoring values that are written to the USB stick file can be opened and
viewed with a spreadsheet application. The values include a time reference from the
date/time settings of the meter. The values include the Power, MER, aBER, bBER and
packet errors
Page 45 (124)
Page 46
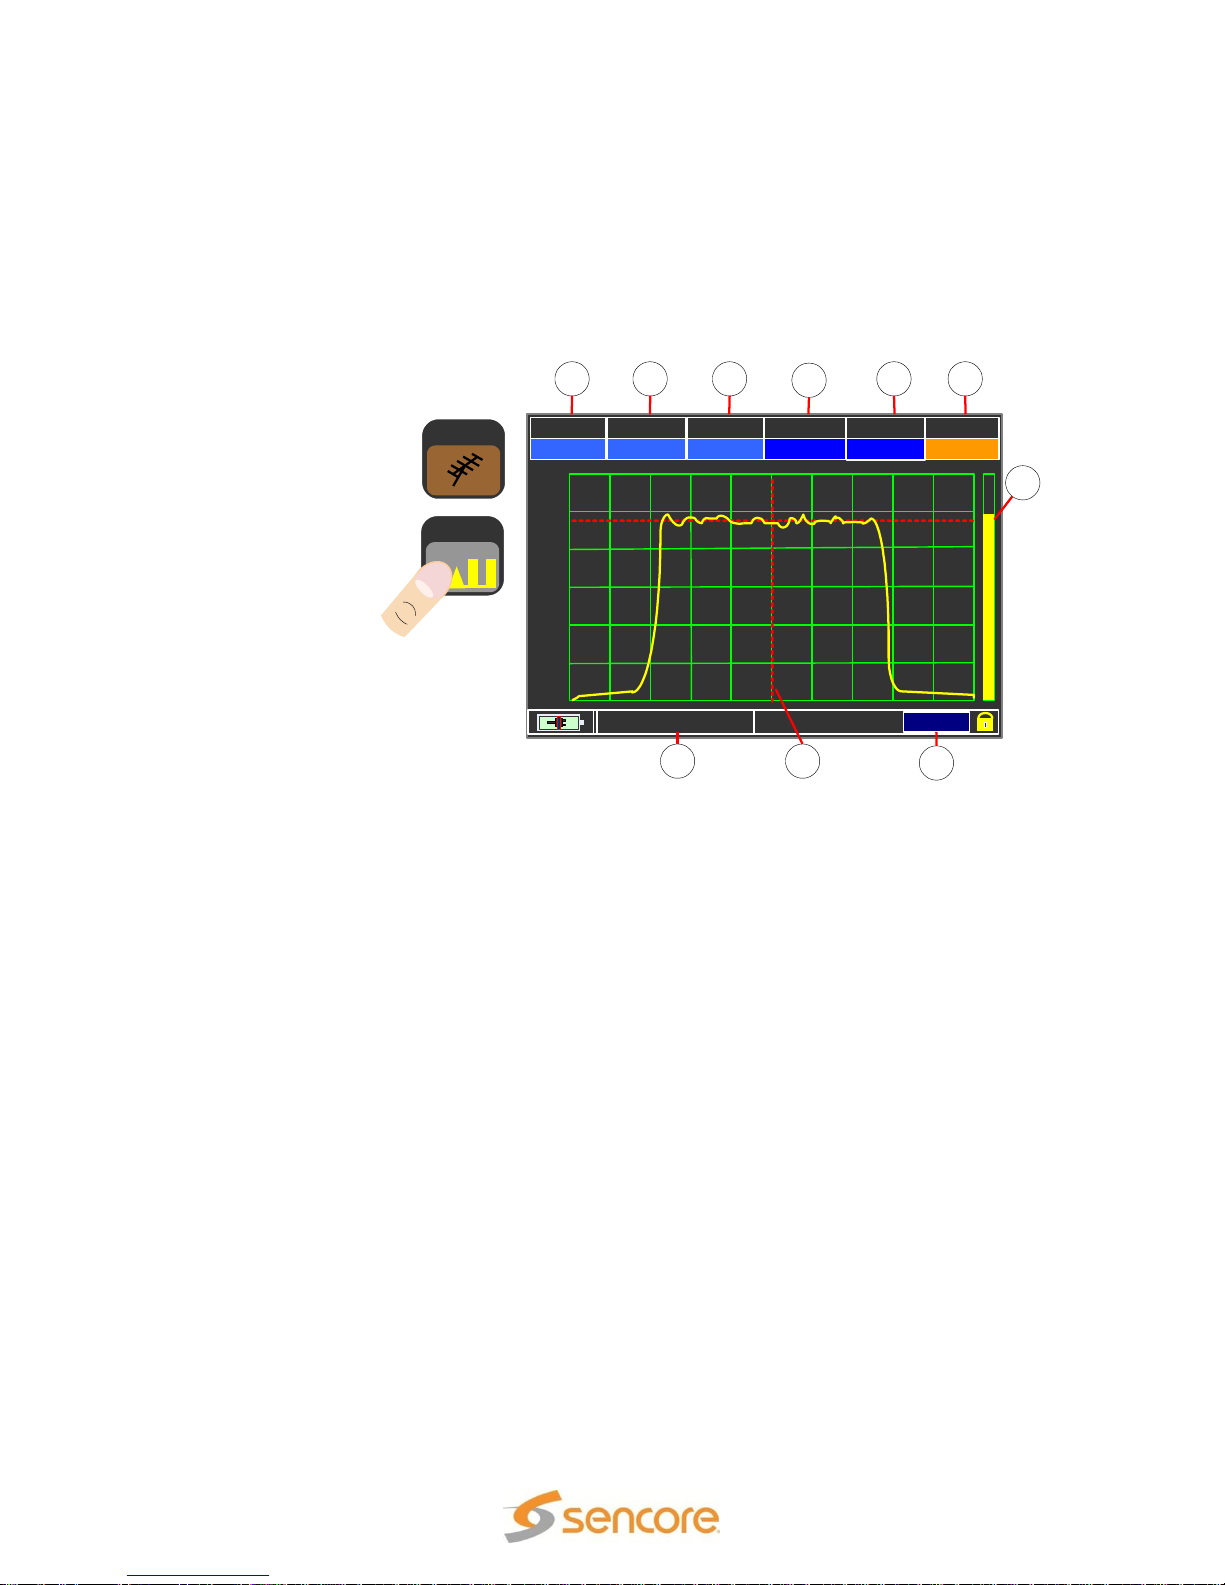
PLAN MODE REF. PWR MRK.FRQ
USABRO DIGITAL 0 dBmV 593.00
SPAN
CHAN
10
34
MRK. P: -12 dBmV
MENU & ?
0 dB
10 dB
20 dB
30 dB
40 dB
50 dB
60 dB
SPEC
21 3 5
4
6
7
8
10 9
TV
SLM 1479 User Manual
5.5 TV Spectrum Analyzer
The TV spectrum analyzer provides detailed spectral analysis of both analog and digital
analog TV signals. To select the spectrum analyzer function from the HOME menu with
the TV icon highlighted, touch the SPEC icon. You may also access the spectrum
analyzer from any of the other measurement pages by pushing the SPEC pushbutton at
the right of the display.
The TV Spectrum
Analyzer page
contains header
fields with many
of the same
sections as the
measurement
page. However,
some of the
headings are
different. Below is
a summary of all
the header fields
and an indication
if the field may be
highlighted for
change.
1. Plan: The channel plan selected in the TV Broadcast Plan Selection Menu. It may be
the USABRO or a Manual or Auto plan. This field is not selectable.
2. MODE: Indicates the spectrum analyzer’s detector mode. Selectable field permits
digital or analog selection.
3. Reference Power: Indicates the level of the top line of the spectrum analyzer
commonly called the reference power level.
4. Marker Frequency: The frequency represented by the location of the vertical red
marker line on the spectrum analyzer display. A selectable field permits moving the
marker line. The marker may be moved automatically by touching points in the display or
by highlighting the MRK FRQ field and rotating the touch control knob.
5. Channel: The selected TV broadcast channel being analyzed. Selectable field
permits channel selection. Note: A channel must be in the channel plan to be listed and
selected.
6. Span: The frequency span of the spectrum analyzer. A selectable field including 50
MHz, 100MHz, 200MHz, 500MHz and FULL selections.
7. Avg. Level: Bar graph indicating the average transponder level. Not selectable.
8. Menu &?: Popup Menu with selections to configure the meter’s receiver and
spectrum analyzer features. See the next section (5.6) for details.
9. Marker Line: The marker frequency cursor line. May be moved by touching the
display location you wish the marker to relocate.
10. Marker Power: The power indicated at the frequency location of the marker line.
The field is not selectable
Page 46 (124)
Page 47

SLM 1479 User Manual
5.6 TV Spectrum Analyzer Popup Menu
The TV Spectrum Analyzer includes a popup menu
that provides settings for the spectrum analyzer and
provides handy features. It further provides a
convenient access to the HELP function. Touch the
MENU & ? section of the display to access the Popup
Menu. The Popup Menu listings are explained below.
SPECTRUM: Provides a selection of the sweep or
update rate of the spectrum analyzer. Selections
include FAST and SUPERFAST.
BUZZER: Provides a switch selection to turn the
alignment buzzer on or off.
MRK. BW (Marker Bandwidth): Selections include OFF, ON, and BW.PWR. The ON
selection provides a variable BW with two vertical markers on the display which may be
varied by rotating the touch control knob. The MRK BW selection adds a power
measurement to the selected band at the bottom center of the spectrum analyzer
display.
DELTA MARKER: Turns on or off a white marker which along with the existing red
marker provide two adjustable frequency locations. At the center bottom of the spectrum
analyzer display is added a Delta Marker Power (Delta MRK.P) measurement which
indicates the level difference between the red and white frequency locations.
PICTURE: Changes how the spectral energy is displayed within the spectrum analyze
graph from a FULL to a CONTOUR view. The FULL selection fills in the displayed
spectral energy with color. The CONTOUR selection outlines the top of the spectral
energy with a colored line.
LOC. OSC: Provides user changes to the local oscillator setting of the meter. This
feature is rarely used with TV broadcast measurements and should remain at 0MHz.
dB DIV: Provides 1,2,5,10 dB selections to change the resolution of the spectrum
analyzer’s vertical increments or dB level.
SAVE/RECALL: Provides memory for 20 captured spectrum analyzer screens which
may be recalled and viewed on the screen.
RBW Filter: Indicates the spectrum analyzer’s resolution bandwidth filter. No selections
are provided to change the resolution bandwidth. The bandwidth is fixed at 100KHz.
HELP ICON: Provides signal analysis to automatically determine a digital broadcast
signal type, modulation type, and symbol rate for automatic tuning.
Page 47 (124)
Page 48

5.62 Spectrum Analyzer Marker Bandwidth Measurement
PLAN MODE REF. PWR MRK.FRQ
USABRO DIGITAL 0 dBmV 212.00
SPAN
MRK. FR
10
2.556
MRK. P: -9.3 dBmV
MENU & ?
0 dB
10 dB
20 dB
30 dB
40 dB
50 dB
60 dB
MRK. P: -6.3 dBmV
The Spectrum Analyzer includes a
marker bandwidth (MRK.BW.)
measurement. This measurement
provides a means to select a
bandwidth of interest for a level
measurement. The bandwidth is
adjustable from 0 to 8 MHz. When
the MRK BW function is turned ON
the spectrum analyzer marker
frequency field (MRK.FR.) is not
selectable.
This Marker Bandwidth (MRK.BW) measurement anchors the reference marker (MRK.
FR) so it may not be selected or moved. The test produces two bandwidth markers, red
horizontal lines, which begin at the reference MRK FR. and move apart as the control
knob is rotated. The CHAN header is replaced by a MRK BW. header and the
associated marker bandwidth value is shown. The field may be touched and selected to
adjust the 2nd red line to widen the bandwidth markers with the control knob.
To select the MARKER BANDWITH feature from the Spectrum Analyzer screen, touch
the MENU&? field. In the popup menu touch the MRK.BW field at the right so it indicates
“BW.PWR.” Touch EXIT and then touch the MRK BW header and rotate the control knob
to select the bandwidth. The bottom center field in the spectrum analyzer display
indicates the power measurement in the selected bandwidth.
5.63 Spectrum Analyzer Delta Marker Measurement
The Spectrum Analyzer includes a Delta
Marker measurement. The measurement
provides an additional white horizontal
and vertical marker or cursor on the
spectrum analyzer display. The CHAN
header is replaced by a MRK. FR. (Marker
Frequency) header. This header field
indicates the frequency position of the
white marker. The header field may be
touched and selected to move the white
marker horizontally on the display screen.
You may also touch locations on the
screen moving the white marker to the touched point. The red marker is not moveable in
the Delta Marker function.
To select the DELTA MARKER function touch the MENU&? field and in the popup menu
touch the Delta (Triangle) Marker listing so it indicates “ON.”
The Delta Marker measurement provides a frequency difference measurement and a
level difference measurement between the location of the red marker and the white
marker. The Delta Frequency is indicated under the MRK FR. Header. The Delta Marker
power or level is indicated in the bottom center measurement field.
SLM 1479 User Manual
Page 48 (124)
Page 49

ATTENUATION TEST
EXIT
SPECIAL FUNCTIONS
SPECIAL
BUZZ & NOIS. MARG. GR.
FUNCT.
TV
PLAN MODULAT CONST DC@RF
BRAS75 VSB 8VSB VL/12
CHAN
FREQ
TP2BE
1453.00
BUZZER & NOISE MARGIN GRAPH
EXIT
NOISE MARG
8.0 dB
MAX. N. MARG
8.3 dB
NOISE MARGIN GRAPH
20
15
10
5
0
TV
SPECIAL
FUNCT.
EXIT
SPECIAL FUNCTIONS
BUZZ& NOIS MAR GR.
ATTENUATION TEST
5.7 TV Special Functions
The TV Special Functions menu provides several
listings. The TV special functions menu is selected
by pressing the SPECIAL FUNCT icon on the
HOME Menu when the TV icon is highlighted. This
section provides an overview of the special
functions available for TV signal testing.
BUZZ & NOISE MARG. GR.: (Buzzer with Noise
Margin Graph): Provides a buzzer to indicate the relative
improvement or degradation of a TV digital channel Noise
Margin.. Provides an active Noise Margin performance graph
showing increases or decreases in signal performance during
a moving 7 second segment.
ATTENUATION TEST: Provides the simultaneous level dBmV measurement of three
RF test frequencies showing relative attenuation compared to a referenced calibration
point.
The following sections of this manual provide more information on these TV special
functions.
5.71 TV BUZZER & NOISE MARGIN GRAPH TEST
The BUZZER & NOISE MARGIN GRAPH test, abbreviated BUZZ&NOIS. MAR. GR, is a
special function which provides a time charted graph of the Noise Margin measurement
of a selected satellite transponder. It further is accompanied by the alignment buzzer.
The test may be used for satellite dish alignment or to monitor the received signal
performance of a satellite dish or LNB
To select the
BUZZ&NOIS
MAR.GR.
function from
the Home
Menu, touch
the SPECIAL
FUNCT icon
with the TV
icon
highlighted. If
the TV icon is
not
highlighted, touch the TV icon and from the TV BROADCAST PLAN SELECTION MENU
after selecting the desired channel plan, touch the SPECIAL FUNCT icon at the right.
Then touch the BUZZ&NOIS MAR.GR listing which takes you directly to the test
function.
Page 49 (124)
SLM 1479 User Manual
Page 50

SLM 1479 User Manual
Measurements in the BUZZ&NOISE MAR.GR function include the following:
NOISE MARG: The Current Noise Margin measurement
MAX N. MARG: Maximum or best Noise Margin measurement since the test began –
signal lock
MIN N. MARG: Minimum or worst noise margin measurement since test began – signal
lock.
The received signal performance (noise margin) is graphed from left to right scrolling a 7
second window of performance. Each horizontal increment represents a 1 second time
interval. Interruptions are marked as a yellow line falling to the bottom of the chart
moving to the left. Variations in noise margin are clearly seen as rising or falling levels
along the top of the chart. Levels on the right of the graph clearly indicate the maximum
and minimum variations since the onset of the test began.
Page 50 (124)
Page 51

SLM 1479 User Manual
TV
SPECIAL
FUNCT.
EXIT
SPECIAL FUNCTIONS
CALIBRATON
DC@RF OFF
EXIT
FREQ
65.0. MHz
2
0
10
0
-10
REF. LEV
- 55 dBmV
LEVEL
- 35 dBmV
ATTEN.
- 20 dBmV
FREQ
650 .0MHz
2
0
10
0
-10
REF. LEV
- 55 dBmV
LEVEL
- 25 dBmV
ATTEN.
- 20 dBmV
FREQ
280 .0MHz
2
0
10
0
-10
REF. LEV
- 55 dBmV
LEVEL
- 32 dBmV
ATTEN.
- 23
dBmV
5.72 TV ATTENUATION TEST
The TV ATTENUATION TEST is a special test that simultaneously measures the signal
power of three TV frequencies and meters the attenuation of the signals compared to a
reference or “calibrated” level. The test may be used to determine attenuation or loses
between two signal points. It further may be used to determine the differences in losses
between three test frequencies between the two signal points. The test is useful in
determining attenuation losses and frequency response differences from an antenna or
amplifier location to points in the TV-RF distribution system or to the receiver
To select the ATTENUATION TEST, touch the SPECIAL FUNCT icon on the Home
Menu when the TV icon is highlighted. If in the TV BROADCAST PLAN SELECTION
MENU, touch the SPECIAL FUNCT icon at the right of the display. Then touch the
ATTENUATION TEST field which takes you directly to the test function.
The test function is highly automated with three preselected test frequencies. Connect
the cable from the meter to the reference test point. Touch the CALIBRATION field at
the top center of the test screen. The meter tests and captures the reference levels at
the listed test frequencies. Proceed to move to other test points in which the same
source signal(s) used to capture the reference levels are present. The meter indicates
the current measured level and computes the attenuation for the three test frequencies
compared to the captured reference level. The bar graphs indicate the attenuation levels
for all three frequencies for easy comparison.
FREQUENCY: Frequency used for the level measurement
REF LEV: Power level at the reference point which was captured with the
“CALIBRATION” activity. Calibration is initialized by touching the CALIBRATION field.
LEVEL: Indicates the active or current test power level for each of the three test
frequencies
ATTEN: Indicates the attenuation or difference in power level between the reference
level, captured during the “Calibration” step, and the current input measured power for
the three test frequencies. Attenuation is also graphed by the vertical bar meters.
Page 51 (124)
Page 52

MEMORY
SLM 1479 User Manual
5.8 TV Memory Management
The MEMORY MENU provides channel plan
creating, test logging features and channel plan
management functions. The MEMORY MENU
is accessed by pressing the MEMORY icon
with the head/brain picture on it. On the Home Menu or
in the TV BROADCAST PLAN SELECTION Menu touch
the MEMORY icon. The MEMORY MENU functions are
summarized below: The following sections of this manual
provide more details.
AUTOMEMORY tv: Scans channels of a master TV or cable channel plan and
automatically discovers active channels and builds an AUTO named channel plan with
channels found meeting minimum level settings.
SAVE DATALOGGER: Scans the channels in a channel plan and records
performance measurements to a log file. The scanning progress and test summary is
shown during the scanning.
RECALL DATALOGGER: Selects and recalls a previously scanned and stored log
file by name for reviewing the test results
MANUMEMORY: Provides creation and editing of manually created
transponder/channel plans.
FILE MANAGER: Provides selection of logger and satellite manual created channel
plans for renaming or deleting.
UPGRADE MEM PLANS: Provides transfer of the meter’s mem plan from the meter
to a USB memory stick or from the USB memory stick to the meter. The mem plan is a
file containing the meter’s channel plans and configuration. The mem plan can be
created or edited in the provided SMART pc software. Saving the mem plan to the USB
stick and writing a mem plan to the meter provides meter cloning.
Touch a listing in the MEMORY MENU to begin a function as listed above.
Page 52 (124)
Page 53

5.81 AUTOMEMORYtv – Scan to Create a Channel Plan
AUTOMEMORY tv
MANUMEMORY
SAVE DATALOGGER
RECALL DATALOGGER
FILE MANAGER
EXIT
MEMORY MENU
FROM PLAN:
BACK
DISCOVERY:
LEVEL:
POWER:
AUTO 3
> - 13 dBmV
TERR. ONLY
START SAVE?
TO FILE N :
USABRO
> - 17 dBmV
The AUTOMEMORYtv feature
found in the MEMORY MENU
provides the ability to
automatically scan TV channels
in a standard tuning plan and
discover the active digital and
analog channels. The active
channels are retained creating a
channel tuning plan for the
meter. The file containing the
active channels is named as an AUTO plan
with a numeric reference (Example: AUTO 1).
Auto scanning channels and creating a channel plan provides the convenience of only
listing the channels available in your area for meter selection. All inactive channels are
removed from the channel plan. Auto scanning channels to create a channel plan further
configures each available channel as either analog or digital so the meter automatically
applies the proper signal measurements.
To perform the AUTOMEMORYtv scan, with the TV icon highlighted on the HOME
MENU touch the MEMORY icon. The meter advances to the MEMORY MENU. Touch
the AUTOMEMORYtv listing which brings up a configuration box. The listing in the
configuration box are listed and explained below.
FROM PLAN: Selects the master tuning plan to use for scanning for channels. Use
USABRO for scanning broadcast TV channels in North America.
TO FILE N: Selects the AUTO x channel plan name for reference. This is the new
channel plan name which may be selected after the channel scan is complete and the
plan successfully created.
LEVEL: Defines the minimum signal level of an analog channel required to consider
the analog signal a valid channel prior to adding it to the channel plan.
POWER: This defines the minimum signal level of an digital channel during the channel
scan required to consider the digital signal a valid channel.
DISCOVERY: This defines the modulation signal types that the meter looks for during
the channel scan. This field may offer TERRESTRIAL ONLY, CABLE ONLY, or TERR &
CABLE selections. Select TERRESTRIAL ONLY when scanning for broadcast TV
channels as this provides the fastest auto-scan time.
START SAVE?: Starts the AUTOMEMORY scan saving channel information to the
AUTO x file specified.
To Create an AUTOMEMORY Channel Plan:
Page 53 (124)
SLM 1479 User Manual
Page 54

SLM 1479 User Manual
1. Navigate to the MEMORY MENU and touch the AUTOMEMORYtv field.
2. Set the FROM PLAN field to USABRO. This is set by selecting the TV measure
function. Then press the PLAN pushbutton and select the Master channel plan as
needed. Then push the HOME button and from the start menu touch the Memory field to
return to the AUTOMEMORYtv menu.
3. Set the TO FILE N field to select an AUTO file name. Note: If the AUTO file selected
already contains channel data, the bottom field changes from START SAVE? to START
OVERWRITE? Touching the START OVERWRITE? field begins a scan replacing the
data in the existing AUTO file.
4. Touch the LEVEL and/or
POWER fields and set as desired.
5. Touch the START SAVE? field
to being the channel scan.
6. Wait a few minutes and watch
the display screen which illustrates
the scanning process and indicates
the channels as discovered. The
meter indicates complete when all
the channels have been scanned.
7. Touch the Exit field to exit the
scan. The Auto scanned plan is
automatically selected for use by the meter. The plan is then available for use.
5.82 SAVE DATALOGGER – TV Auto Measure & Store
The SAVE DATALOGGER feature within
the MEMORY MENU scans the channels in
a selected manual channel plan and
captures performance measurements for
each channel to a log file. The logged data
file is stored in one of the 99 available
memory locations in the meter or may be
written to a file on the USB memory stick.
The file is named for latter recall and test
result viewing.
To begin a data logger capture, select the
SAVE DATALOGGER by touching the
MEMORY icon on the Home Menu with the
TV icon highlighted. Touch the SAVE
DATALOGGER listing in the MEMORY
MENU.
The SAVE DATALOGGER has a
configuration menu with several fields which
impact the function. Following is a brief description of these fields.
FROM FILE: This field indicates the selected channel plan in which the individual
channels will be scanned and tested. This field may be highlighted and a channel plan
selected.
Page 54 (124)
Page 55

SLM 1479 User Manual
Data File: This is the file name where the scanned measurement data is to be stored.
Point: This is a name for the test point associated with the log file data.
STOP&GO: Provides for stopping the log measurements when changing from a cable
channel or broadcast channel to a Docsis measurement when the manual memory
channel plan contains a mix of signal types or tests. This provides the user a time to
change input connections.
LCN: Turns the logging of the language channels on or off so as to include or exclude
in the gathered channel data.
MEMORY DEV: Determines if the logging data is saved to internal meter memory or
to an external USB Memory stick inserted into the USB-A jack.
File Name: Provides a file name entry for the data saved to the USB memory stick.
START SAVE?: Starts the logging saving channel performance testing data to the
Data File name in the Date File field.
AVAILABLE LOGGER: 99: Indicates the available memory locations for storing
logging data files.
To begin the collection of test data
with the SAVE DATALOGGER
function touch the START
OVERWRITE or START SAVE field
to begin. When the DATA LOGGER
begins scanning channels in the
channel plan, a LOGGER
FUNCTION screen shows the
scanning/logging progress. A Total
Test Report section, on the right of
the display screen, indicates the
progress of the scan and
summarizes the performance of each channel tested. The channel is color coded in the
report indicating a pass, marginal or fail status. Near the bottom of the LOGGER
FUNCTION screen the channel currently being tested is highlighted. A picture indication
shows if the transponder was digital or analog.
Data logging measurements and data are written to the USB stick csv file. The data can
be opened and reviewed with a spreadsheet program such as Excel.
Page 55 (124)
Page 56

SLM 1479 User Manual
DATA FILE:
BACK
Point:
RECALL?
POINT 1
LOG. 1
AUTOMEMORY tv
MANUMEMORY
SAVE DATALOGGER
RECALL DATALOGGER
FILE MANAGER
EXIT
MEMORY MENU
MEMORY
5.83 RECALL DATALOGGER - View TV Data Log File
The RECALL
DATALOGGER within the
MEMORY MENU provides
a means to recall existing
memory log files
containing TV channel
performance test data.
The log files available for
recall are files created with
a SAVE DATALOGGER
function covered in the
previous section.
To recall a data logger file touch the MEMORY icon on the HOME Menu with the TV
icon highlighted. Touch the SAVE DATALOGGER listing in the MEMORY MENU. In the
DATA FILE field of the selection box, touch the listing on the right and rotate the touch
Control Knob to increment through the available log files. Press the RECALL field to
view the file’s measurement contents.
The DATALOGGER viewer
shows the file name and point
number in the upper left to
identify the logger file. The
name of the channel is shown
in the left column. The digital or
analog signal type is listed and
the associated performance
measurements are shown
horizontally for each
transponder/channel.
An indication of transponder
signal performance is provided with a color coded box at the left of the transponder
name. A green box indicates the transponder passed test performance criteria and is
good. A red box indicates a performance issue.
Page 56 (124)
Page 57

5.84 MANUMEMORY – Creating or Editing TV Channel Plans
AUTOMEMORY tv
MANUMEMORY
SAVE DATALOGGER
RECALL DATALOGGER
FILE MANAGER
EXIT
MEMORY MENU
PLAN:
BACK
(Press ENTER and
Select The Plan)
START EDIT
MAN 6
MEMORY
The MANUMEMORY feature found in the MEMORY MENU provides the ability to
manually create a tuning plan which may include a list of broadcast channels.
The file containing the active channels is named as a MANU plan with a numeric
reference (Example: MANU 1). Manually creating a channel plan provides the
convenience of only listing a few channels available in your area or desired for special
testing application. Only the channels created and added to the list are available in the
MANU channel plan for selection and measurement.
The MANUMEMORY feature permits entry of individual channels one at a time. For this
reason it is ideal for creating a channel plan in which there is a small number of
channels. When creating a channel plan with many channels the AUTOMEMORYtv or
use of the SMART software is recommended.
The SLM 1479
provides
management
features for the
MANU files. The
MANUMEMORY
feature permits edits
or changes to listed
channels within a
previously created
manual (MANU)
channel plan. The
following sections
provide information on creating and editing a MANU channel plan.
To Manually Create a Plan:
1. To create a transponder/channel plan navigate to the MANUMEMORY feature by
touching the MEMORY icon and touching the MANUMEMORY listing in the MEMORY
MENU.
2. In the PLAN field at the top of the configuration box touch the listing at the right to
highlight the field. Move your finger over the arrow portion of the touch control knob to
increment through available memory channels.
3. Select a manual channel plan number of choice. Press the START EDIT field to
begin construction of a manual plan. NOTE: The name of the selected manual file can
be renamed. See the next section of this manual for instructions on how to rename an
existing manual file.
4. The ITEM EDITING menu appears to enable entry of transponder. Touch the SAVE?
field to add a listing after changing the individual fields to the desired values.
Page 57 (124)
SLM 1479 User Manual
Page 58

ACTION
MODIFY ITEM
ADD BELOW
RETURN
EXIT
ACTIVE PLAN: MANU 25
8VSB
8VSB
8VSB
8VSB
MODE
8VSB
201.0
213.0
479.0
605.0
731.0
FREQ
11
13
15
36
47
TR/CHAN
1
2
1
2
3
N
ADD ABOVE
DELETE ITEM
4.5 FM
MODE
BACK
FREQ:
AUDIO:
8 VSB
CHAN:
201 MHz
NAME
ITEM EDITING
SAVE?
PR 1
11
MANUMEMORY ACTIONS
MODIFY ITEM: Produces the ITEM EDITING menu which permits changes to the
settings for the transponder listing highlighted
ADD BELOW: Produces the ITEM EDITING menu in which you may select the
parameters of a transponder signal and dish characteristic to add a listing below the
currently highlighted field.
ADD ABOVE: Produces the ITEM EDITING menu in which you may select the
parameters of a transponder signal and dish characteristic to add a listing below the
currently highlighted field.
DELETE ITEM: Deletes the highlighted listing from the selected plan.
RETURN: Returns to previous menu
To Edit an Existing Plan:
1. To make changes or additions to an existing manual memory plan navigate to the
MANUMEMORY feature by touching the MEMORY icon followed by touching the
MANUMEMORY listing in the MEMORY MENU.
2. In the PLAN field at the top of the configuration box touch the listing at the right side to
highlight the file name. Rotate the control knob to increment through the available
memory plans.
3. Select the file name in which you want to edit or add listings. Press the START EDIT
field to begin editing.
4. Touch MODIFY ITEM from the listings to produce the ITEM EDITING Menu. Modify
the items in the Menu to match the transponder and satellite dish characteristics as
needed. Press the SAVE? field to write the changes to the highlighted channel listing.
Press BACK to return to the previous menu without making changes.
Page 58 (124)
SLM 1479 User Manual
Page 59

5.85 TV FILE MANAGER – Renaming or Deleting Files
AUTOMEMORY tv
MANUMEMORY
SAVE DATALOGGER
RECALL DATALOGGER
FILE MANAGER
EXIT
MEMORY MENU
SELECT ITEM
5048
2300
1368
2328
88
56
56
56
152
1784
440
24
SIZE
US-QAM
LOG. 1
AUTO 2
MANU 2
MANU 3
SLIM 5
TEST 1
USATS
NAME
AUTO 1
MANU 4
MANU 5
MANU 6
LOG
AUTO
AUTO
MANU
MANU
MANU
TYPE
MANU
MANU
MANU
MANU
MANU
MANU
1
2
1
2
3
4
N
5
6
7
8
9
10
ACTION
RENAME FILE
DELETE FILE
RETURN
EXIT
MEMORY
The FILE MANAGER, found in the MEMORY MENU, provides management of the
logger and transponder/channel plan files. The FILE MANAGER provides the ability to
rename or delete files from the meter’s memory. To access the FILE MANAGER from
the Home Menu, touch the MEMORY icon followed by a touch of the FILE MANAGER
listing in the MEMORY MENU.
You can rename or delete files that were created with the DATA LOGGER as in
scanning a TV channel plan and capturing performance measurement data to a test file.
These test files are identified as LOG file types and are typically named as LOG 1,
LOG2, etc. You can rename or delete files that were created by the AUTOMEMORY
feature or with a MANUMEMORY feature of the meter. These files are typically named
“AUTO 1,” “AUTO 2”, etc. or “MANU 1,” “MAN 2, etc. by the meter. However, these file
names can be changed to a more recognized or descriptive name as desired. The
following section summarizes how to rename, or delete these files in the FILE
MANAGER function.
To Rename a File:
1. Navigate to the MEMORY MENU. Touch the FILE MANAGER listing.
2. Scroll up or down in the listed files to find the file you want to rename. Touch the
listing to select or highlight the listing and press the ENTER pushbutton in the center of
the larger touch Control Knob.
3. Touch the RENAME FILE listing in the ACTION MENU which appears.
4. A naming overlay appears on the screen. Touch letters to enter into naming boxes.
Press > to advance to the next box. Continue until the name is complete. Touch the
EXIT box.
To Delete an Existing File:
1. Navigate to the MEMORY MENU. Touch the FILE MANAGER listing.
2. Scroll up or down in the listed files to find the file you want to delete. Touch the listing
to select or highlight the listing and press the ENTER pushbutton in the center of the
larger touch Control Knob.
3. Touch the DELETE FILE listing in the ACTION MENU which appears to delete the
selected file: NOTE: DELETION IS PERMANENT – THE FILE CANNOT BE
RECOVERED.
Page 59 (124)
SLM 1479 User Manual
Page 60
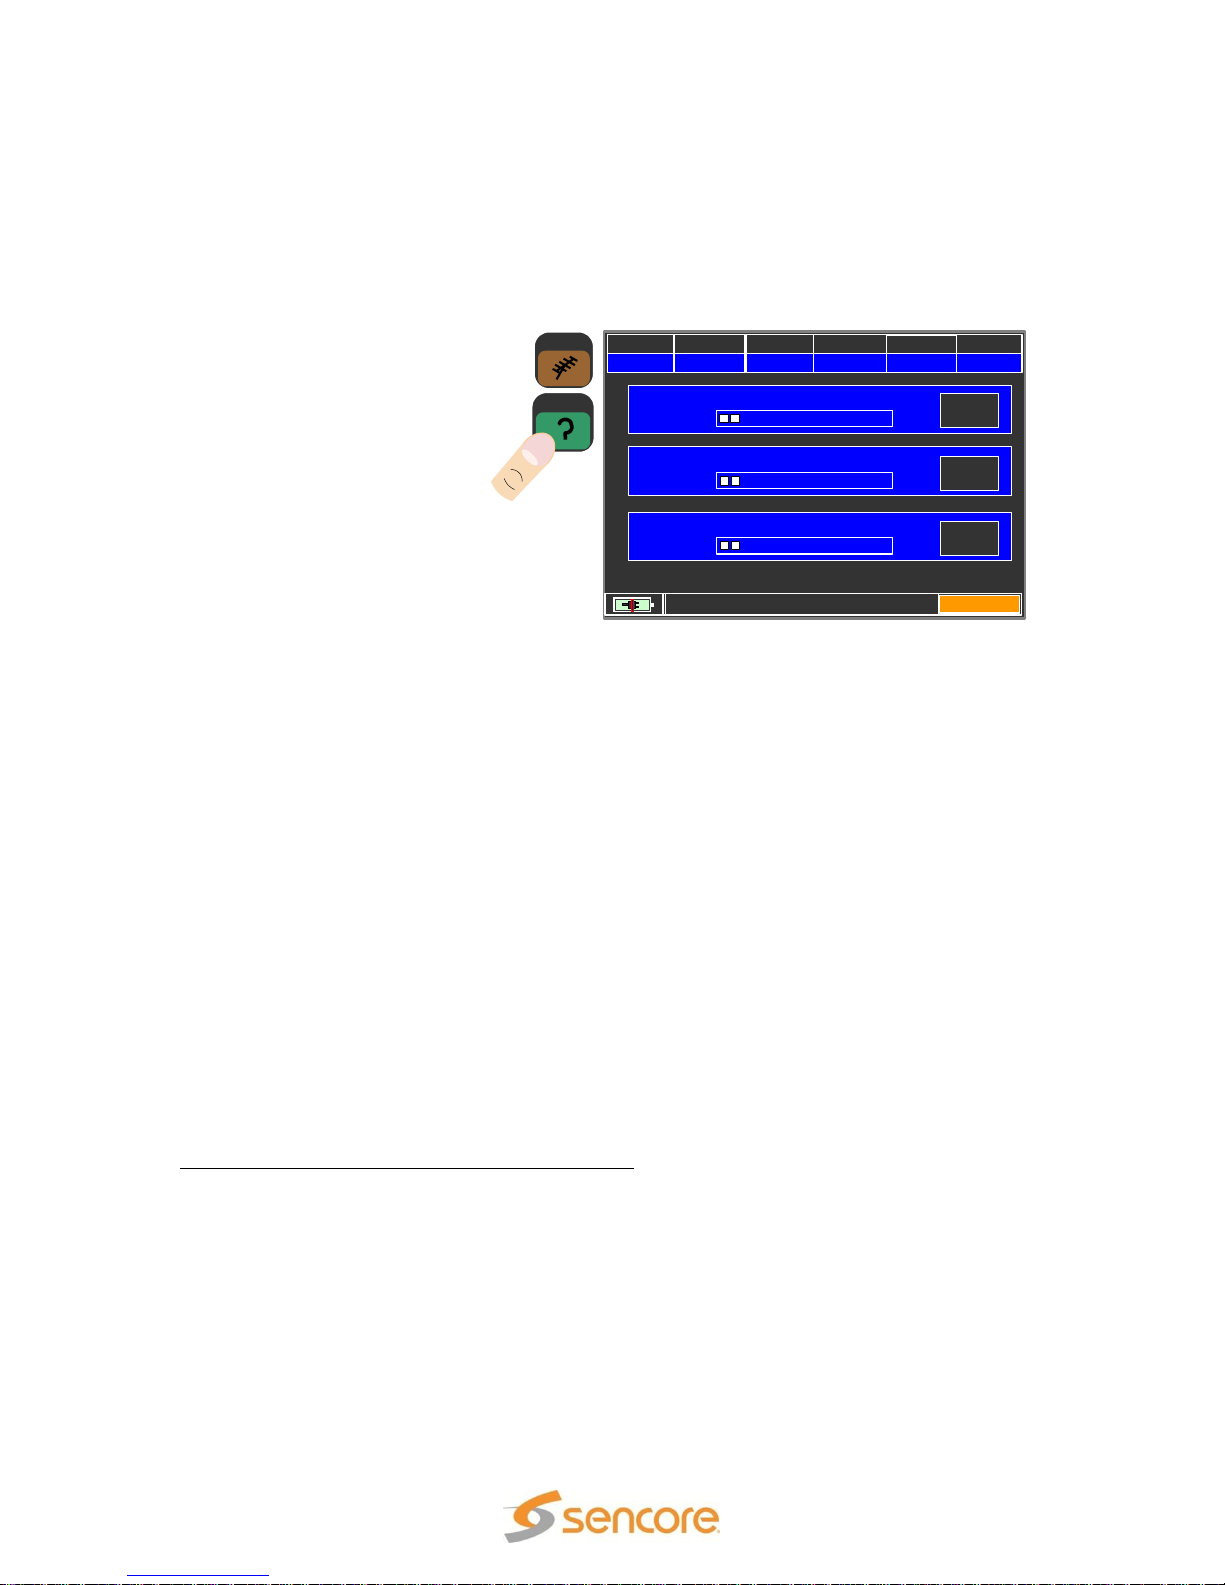
PLAN MODULAT CONST DC@RF
USABRO
VSB
8VSB OFF
CHAN
FREQ
13
213.00
EXIT HELP FUNCTION
WAIT
SEARCHING MODULATION
WAIT
SEARCHING FREQUENCY
WAIT
SEARCHING SYMBOL RATE
HELP
TV
SLM 1479 User Manual
5.9 TV “Help” Signal Discovery
The HELP icon on the SLM 1479 refers to help or assistance tuning in a digital channel.
The HELP function is used to help determine for a user the RF type of signal within a TV
broadcast channel.
Initiating a HELP function on
the SLM 1479 directs the
meter to automatically
analyze the TV channel and
determine automatically the
RF modulation type,
bandwidth/center frequency,
and RF symbol rate. The
SLM 1479 methodically
analyzes the digital signal to
determine these parameters.
If the parameters are within
the receiver capabilities the meter finishes by advancing to the measurement page with
the channel displayed. If the channel has no recognizable signal or is a proprietary
modulation scheme, the SLM 1479 reports “NO SIGNAL.”
To initiate a HELP function simply locate a HELP icon and touch it. The HELP icon is
located in the Spectrum Analyzer’s popup menu. When in the Spectrum Analyzer
function touch the MENU &? field at the bottom right of the screen. Touch the HELP
icon.
The HELP FUNCTION screen informs you of the meter’s progress in determining the
type of digital signal or detecting an analog signal within the channel. The boxes on the
right in the center list the modulation, frequency, and symbol rates as discovered by the
meter. When the search is completed, “FOUND” is displayed on all three measurement
status boxes at the right.
The HELP FUNCTION screen maintains the same header fields as in the TV
measurement page. The fields indicate the plan, channel, channel frequency,
constellation, and modulation for the selected channel. Press the EXIT field to exit at any
time during the analysis.
For TV Channel Signal DISCOVERY or HELP:
1. Touch the TV icon to select TV. Select a channel plan by pressing the PLAN SELECT
pushbutton and touching a selection in the center box. Touch the SPECTRUM icon.
2. Touch the CHAN field header and select a TV channel or position cursor at the center
of an unknown channel or signal.
3. Touch the “MENU & ?” field at the bottom right. Touch the HELP icon in the Popup
Menu.
4. Wait while the meter analyzes and determines the channel symbol rate, frequency
and modulation type. FOUND is shown in all three boxes when successful. Touch EXIT
to return to the MEAS page and begin transponder measurements.
Page 60 (124)
Page 61
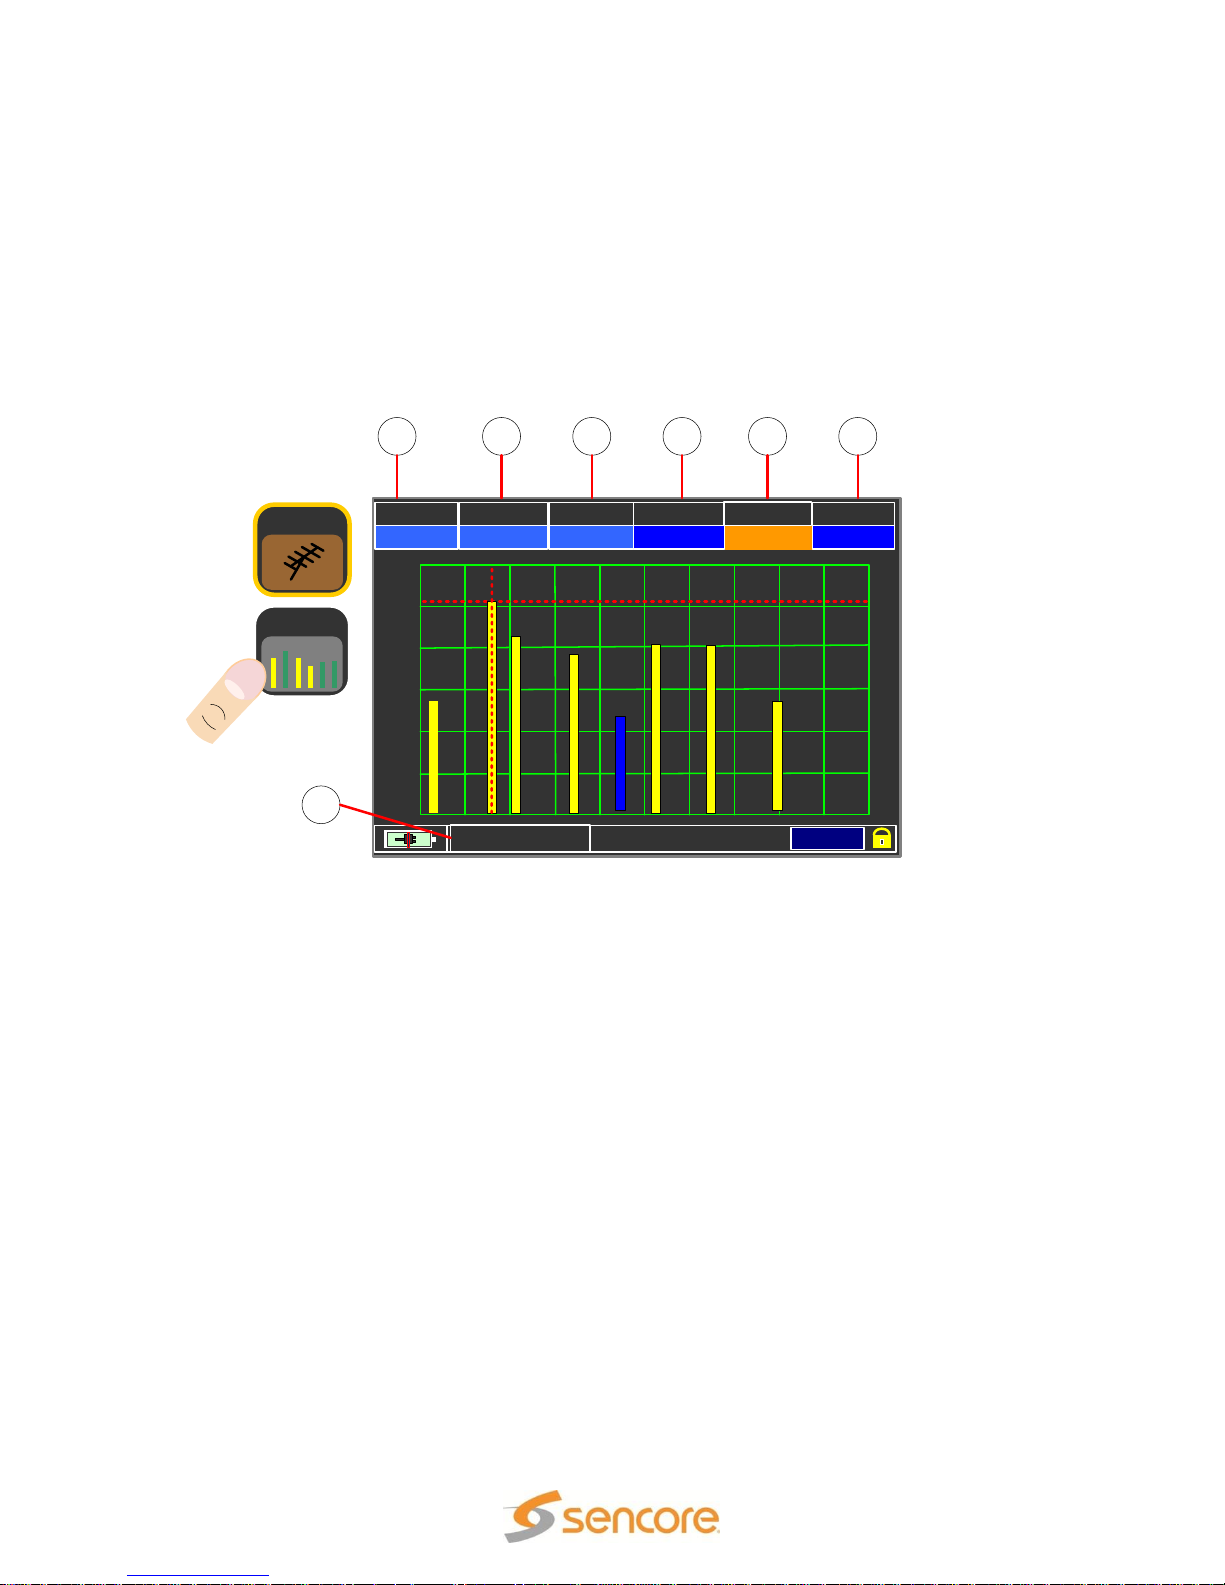
SLM 1479 User Manual
MRK. P: -9 dBmV
MENU & ?
0 dB
10 dB
20 dB
30 dB
40 dB
50 dB
60 dB
PLAN REF. PWR dB/Div MRK. CHAN
MAN 5 0 dBmV 10 dBmV 13
SPAN
FULL
212.97
MRK. FR
BAR SCAN
TV
1 2 3 4 5 6
7
5.10 TV BAR SCAN Test
The BAR SCAN measurement shows multiple bars forming a bar chart. Each bar of the
chart represents the level of a TV-RF channel. The Bar Scan is essentially a simplified
spectrum display in which multiple channel levels through a frequency span are
indicated with bars on a level chart. The number of channels plotted in the bar chart is
determined by the selected span (SPAN). For a TV Bar Scan measurement touch the
BAR SCAN icon with the TV icon highlighted. The following sections provide more
information on the Bar Scan measurement and fields on the Bar Scan display screen.
Bar Scan Basics
Each bar displays the signal level measured in a specific channel within the channel
plan. The SPAN value determines the number of channels or bars displayed in the bar
chart. A yellow bar represents a digital signal channel while a solid blue bar represents
an analog signal channel. The marker, a vertical red dotted line, is initially positioned on
the channel near the center of the display which is the center of the span of channels.
Bar Scan Measurement Initialization
When the Bar Scan measurement is selected the meter automatically defaults the center
channel of the span to the last channel selected in the Channel Measurement function of
the meter. To select the center channel for the Bar Scan test prior to a measurement,
press the MEAS button and select the desired channel. Press the HOME button to return
to the HOME menu and with the TV icon highlighted touch the BAR SCAN icon. The Bar
Scan measurement further selects a level reference based upon the selected channel’s
signal level. Be sure to select an active channel so a proper reference (REF) level is
automatically selected.
1. PLAN: Indicates the channel plan selected for measurement. The plan includes the
channel list that will be measured and plotted into the BAR SCAN test results.
Page 61 (124)
Page 62

SLM 1479 User Manual
2. REF PWR Reference Power: The reference value establishes the level of the top
horizontal bar of the bar graph. To change the reference value, touch the REF field
header and touch the value field below to see selections. Touch the desired selection.
3. dB/DIV: The db/Div field displays the level change represented between adjacent
horizontal lines or divisions in the bar graph. This field may be highlighted and changed
to predetermined values (5 dB/DIV, 10 dB/DIV).
4. MRK CHN: The Bar Scan display or span is centered upon a selected channel
shown in the field under the CHAN header. The CHAN field is selectable and the
channel value may be changed. Changing the value moves the red cursor or marker on
the display. Highlight the CHAN field and use the UP and DOWN arrow pushbuttons to
move the marker to the desired channel or bar.
5. MRK FREQ. - Marker Frequency: The Bar Scan display or span is centered upon
a selected channel shown in the field under the MRK CHAN header. The CHAN field is
selectable and the channel value may be changed. Changing the value moves the red
cursor or marker on the display. Touch the CHAN field to highlight it and show the
selectable channel list. Touch a channel in the list to select.
6. SPAN: The SPAN field determines the number of channels and a relative frequency
span included in the bar graph or scan. To change, highlight the field and use the UP or
DOWN key to change the span between pre-defined values, from (10, 20, 32, 64, 128).
7. Marker Level Measurement: This field indicates the level of the channel marked
by the red cursors on the display. The unit of measurement is set in the METER
CONFIGURATION MENU. A horizontal dotted line shows the real time signal level
value measured in the currently selected channel.
Page 62 (124)
Page 63

CABLE PLAN SELECTION MENU
SPEC
MEAS
SPECIAL
FUNCT.
MEMORY
USABRO
USACAB
USAHRC
USAIRC
CABLE PLAN
MANU MEMORY
(MIX)
MASTER
HOME MENU
AUTOMEMORY tv
BARSCN
CATV
SLM 1479 User Manual
Section 6: CATV Measurements
The SLM 1479 indicates the performance of cable
television digital QAM signals providing guidance for
installation and maintenance of cable TV-RF
distribution systems. This section provides
information on the cable TV measurements.
6.1 CATV Plan Selection
Upon selecting the CABLE icon in the HOME Menu and pressing the PLAN SELECT
front panel pushbutton, the DSA 1491 presents a CABLE PLAN SELECTION MENU.
This menu provides selections which define a tuning plan for selecting CATV channels
and respective frequency bands for measurements. The CATV PLAN SELECTIOIN
MENU contains several listings of which to choose from. The following is a brief
description of these listings and their content. These cable plan listing depend on the
SLM 1479 model and are appropriate for different locations.
MASTER PLAN: This
selection provides a
listing of standard
CATV channel plans in
which to choose from. For testing
applications in North America,
the USACAB listing provides a
suitable channel plan which
includes all the CATV channels
from 2 to 158.
AUTOMEMORYtv: This
selection provides a list of channel plans to choose from that are “AUTO” plans. These
plans are created with the AUTOMEMORYtv feature in the MEMORY MENU. Please
see Section 6.81 in this manual for information on creating an AUTO cable channel plan.
If you have created an AUTO plan for CATV signal analyzing, it will be listed for
selection.
MANU MEMORY (MIX) Plan
The MANU MEMORY (MIX) listing in the CATV PLAN SELECTIION Menu contains
manually created channel plans. A manual plan may include either cable or TV channels
with a mix of modulation/constellation types. It may also include a combination or a mix.
Manual channel plans may be edited in the MEMORY MENU function of the meter or
using the supplied SMART software with a PC. Manual channel plans may be created
within the SMART software and transferred to the meter. Please see Section 6.83 for
MANUMEMORY channel creation.
To Select a CATV Channel Plan:
1. Touch the TV icon. Touch the MASTER field to select it.
Page 63 (124)
Page 64

SLM 1479 User Manual
aBER: <10-9
ERR:= 00
-2 -3 -4 -5 -6 -7 -8
POWER: 1.5 dBmV
MER: 31.9 dB
8 12 16 20 24 28 32 36 40 42
QLTY: PASS
Ns.MAR: 9.5 dB
-1 1 3 5 7 9 11 13 15 17 19
bBER: 1 x10⁻⁹
-2 -3 -4 -5 -6 -7 -8
-12 -6 0 2 4 6 8 10 12 14 16 18
Vpid: 2368 Apid: 2369
ANNEX: J83B
SYM. RATE: 5.361 MS/s
ENCRYPT.: Clear
PLAN MODULAT CONST DC@RF
USACAB J83-B QAM256 OFF
CHAN
FREQ
34
285.00
TSID: 34179
MENU & ?
MEAS
15
21
16
1
2
3
4
5
6
7
8
9
11
10
20
19
18
17
12
13
14
CATV
2. Touch the USACAB field in the center list. The meter advances to the CATV
MEASUREMENT page.
6.2 CATV Digital Measurements
The SLM 1479 provides a comprehensive
analysis of a CATV signal, either digital or
analog. Digital signal analysis includes standard
QAM analysis also known as J83-B. To access
the CATV measurements touch the MEAS icon
from the HOME Menu with the CATV icon
highlighted or touch the MEAS icon in the
CATV Plan Selection Menu after selecting a
cable channel plan.
There are two CATV measurement pages for
digital cable signals including a main measurement page and a constellation
measurement page. The remainder of this section describes the SLM 1479’s CATV
measurements and measurement pages. The following section describes the fields as
numbered in the nearby figure.
6.21 Main Digital Measurement Page Description
1. Plan: The TV channel plan selected in the CATV Plan Selection Menu or in a Manual
or Automemory channel plan.
2. Modulation: The modulation type of the digital signal. Defaults to the type in the
channel plan which should be J83-B (QAM B) for CATV in North America for the
selected channel (6). Selectable field permits selection of other modulation types and
analog (AN.TV).
Page 64 (124)
Page 65

SLM 1479 User Manual
3. CONST: The current setting for constellation based upon modulation. Typically reads
QAM256 as most CATV systems use 256 symbols.
4. DC@RF: Indicates if DC voltage is applied to the RF input jack of the meter. This
field should be off for most testing applications. Selectable field permits voltage
selection and output.
5. FREQ: The center frequency of the digital channel or video carrier of an analog
channel. (6). Selectable field permits frequency tuning. Changing the frequency causes
dashed lines in the channel indicator as the frequency is no longer the channel’s
standard.
6. CHAN: The selected channel being analyzed. Selectable field permits channel
selection. For inclusion in the selectable list the channel must be included in the selected
channel plan (1).
7. Video: The active video on the selected video service within the channel.
8. VPID/APID: Video and Audio Program Identifier values for the selected video
service contained in MPEG.
9. ANNEX: The standard signal type or reference – J83B for CATV digital signals.
10. SYM RATE: The symbol rate of the RF digital carrier in million (MEGA) symbols
per second. QAM 256 uses a standard symbol rate of 5.361 MS/s.
11. Encryption: Indicates if the selected video service is encrypted or in the clear.
12. Locked Symbol: Indicates if the meter’s receiver is locked to a digital RF signal.
13. MENU & ?: Provides a popup menu with related selections and a HELP icon for
discovery of the channel signal modulation, symbol rate, and frequency.
14. Network Name (NETW): Indicates the network name or identification.
15. TSID or NID: Transport Stream or network Identification numbers.
16. aBER: Bit Error Ratio measurement after error correction measurement
17. bBER: Bit Error Ratio measurement – before error correction
18. Noise Margin (Ns.MAR): Provided margin signal vs. noise power measurement
19. Quality (QLTY) Rating: Quality rating based upon MER and noise margin values
20. MER: Modulation Error Ratio measurement of selected channel
21. POWER: Average Power measurement for the digital channel and video carrier
peak measurement for an analog channel, typically in dBmV.
Page 65 (124)
Page 66

SLM 1479 User Manual
6.22 Analog CATV Measurement Page
An analog NTSC cable channel
can be analyzed with the SLM
1479. To measure a TV channel
as an analog channel, the
modulation type for the channel
must be specified as an analog
TV channel. This may be done
in the channel plan used for the
CATV measurements, either in
a Manual or Automatic plan.
Analog measurement include
the level, A/V ratio, signal-tonoise (SNR) and video waveform line analyzing. You may further view the demodulated
video and listen to the audio. To measure a TV channel as an analog channel, the
modulation type for the channel must be specified as an analog TV channel. The
abbreviation for this on the meter is “AN. TV.” You may change the modulation type of a
selected channel in the main measurement page by touching the MODULAT header.
Select the AN.TV listing in the drop down selection box by touching the AN.TV listing
Analog measurements are provided on three different measurement pages. The 1st page
provides a level measurement, provides video and audio monitoring, and provides a
basic spectrum analyzer view. Any voltage input to the RF jack is indicated by the
voltmeter measurement. The 2nd page provides a waveform monitor screen in which the
signal-to-noise ratio and hum is measured
on a selected video line. The 3rd
measurement page provides a waveform
monitor (WFM) screen in which the selected
scan line of detected video is scanned and
displayed.
Push the TV front panel push button to
increment to each measurement page. Or
touch the display’s SNR field to increment to
the second SNR MEASURE page or touch
the WFM field to advance to the 3rd WFM (Waveform Monitor) measurement page.
6.22.1 SNR MEASURE
The SNR measurement page provides analysis of the detected video of the analog
channel. The signal-to-noise ratio indicates the dB ratio or difference between the noise
voltage and video amplitude voltage. The greater the ratio or dB value the better. The
measurement should be performed on a video line in which there is no active video by
selecting a line in the vertical blanking interval. Be sure to select a line in which there is
no test signal or data signals such as close captioning. The default Line Num is selected
in the meter’s configuration menu. Please refer to section 3.23 starting on page 28.
6.22.2 WAVEFORM MONITORING (WFM)
Page 66 (124)
Page 67

SLM 1479 User Manual
The waveform monitor measurement page
provides a view of the selected line of the
detected video modulation of an analog
channel. The LINE NUM field or header field
may be selected and the knob rotated to
increment/decrement to the desired line of
video. The display shows one scan line
starting at the beginning of the horizontal sync
period to the beginning of the next sync
period.
The waveform monitor offers a LINE ZOOM
feature in which the first part of the scan line
can be expanded for viewing. Select the
WAVEFORM field and increment the large
know to select the LINE ZOOM mode.
6.23 FM RADIO TUNING & MEASUREMENT
To measure the level of an FM radio signal, touch the MODULAT header field and select
the “FM RADIO” listing. Touch the FREQ header and enter the FM radio frequency. The
level of the FM radio signal is metered and you may listen to the detected audio.
Page 67 (124)
Page 68

SLM 1479 User Manual
ZOOM:
FULL
6.23 CATV Constellation & Info Measurement Page
The constellation measurement
page provides a second page of
analysis of a CATV digital
channel. The top and bottom
fields of the page are the same
as the main measurement page.
The left center of the
Constellation & Info page
provides a constellation analysis.
The right center of the
Constellation & Info page
provides an INFO box with
information regarding the CATV
channel being measured.
There are two ways to access the Constellation & Info measurement page form the Main
Measurement page. Either press the front panel TV pushbutton or touch the display
screen anywhere on the left center measurements area from the POWER measurement
bar down to the aBER measurement bar. Touch this same area to return from the
Constellation Measurement page to the Main Measurement Page.
CONSTELLATION
The constellation analysis provides a visual indication of the detected RF symbol
accuracy. The constellation diagram changes its appearance to match the number of
symbols in the QAM RF signal. For example, a QAM 64 signal has 64 squares while a
QAM256 signal has 256 squares.
The constellation diagram may show a full or all the symbol
squares or ¼ sections of the constellation using the ZOOM
feature. To zoom into a smaller ¼ section of the full constellation
diagram, touch the selection box to the side or right of the
ZOOM box. Multiple touches increment the ¼ section view
through all the quarter sections of the constellation diagram. The
box to the right of the selection box indicates the selected
section being shown by the constellation diagram.
INFO: The INFO box in the Constellation & Info measurement page provides additional
CATV channel information. A brief overview of the information shown is listed below.
ANNEX: The digital signal standard annex it complies with such as J83-A which is the
North American cable standard.
SYM RATE: The rate of the RF symbols as measured by the SLM 1479.
LNB Curr: Metered current flowing from the meter to the satellite dish LNB.
Page 68 (124)
Page 69

SLM 1479 User Manual
Vpid: 2368 Apid: 2369
SERV. ID. : 9
SYM. RATE: 27.51 MS/s
ENCRYPT.: DigiCypher
PLAN MODULAT MODULAT DC@RF
USBCAB J83B QAM256 OFF
CHAN
FREQ
34
285.00
TSID: 2013
MENU & ?
GSD
Golf
TV N
TV Y
NAME
TYPE ENC
DATE:
VIDEO RATE:
25/01/2012
3.51 Mb/s
MTV TV Y
FMC
TV Y
TBN
TV Y
GAC
TV Y
TBN
TV Y
NICK
TV Y
10
7
6
2
1
4
3
5
9
8
MPEG SERVICE
LIST
CATV
6.3 CATV MPEG SERVICE LIST
The MPEG SERVICE LIST measurement page of the SLM 1479 provides information
regarding the MPEG stream and video service/programs of the selected CATV channel.
The MPEG SERVICE LIST page may be accessed in two ways. From the HOME Menu
with the TV icon highlighted, touch the MPEG SERVICE LIST icon. Secondly for
convenience from the CATV Main Measurement Page, touch the box below the
displayed video. Touch the same box to return to the Main Measurement Page from the
MPEG SERICE LIST page.
6.31 CATV MPEG Service Page Description
The MPEG SERVICE LIST measurement page provides information regarding the
MPEG transport stream and the selected video service/program contained in the stream.
The top and bottom fields are the same as listed and described in the Main
Measurement page in section 6.2 of this manual. The unique fields are numbered in the
nearby figure and a brief description of these fields is provided below.
1. Demodulated Video Display: Shows the demodulated video of the selected
service from the selected cable channel.
2. VPID/APID: Indicates the VPID (Video Packet Identifier Number) and APID (Audio
Packet Identifier Number) of the selected video service/program.
3. Service ID: The video service/program identification number
4. Symbol Rate: The RF symbol rate of the channel’s digital signal
5. Encryption Status: Indicates if the video service selected is in the clear or
encrypted.
6. Video Rate: The MPEG data rate of the selected video service/program
7. Date: The current date as listed in the MPEG stream
8. Encryption Status: Indicates if the individual services are encrypted (YES) or in the
clear non-encrypted (NO).
10. Service List: List the video services/programs in the MPEG transport stream
Page 69 (124)
Page 70

SLM 1479 User Manual
PLAN MODULAT CONST DC@RF
USABRO VSB 8VSB OFF
CHAN
FREQ
11
201.00
TSID: 2643
MENU & ?
KELO - TV
VIDEO: MPEG-2 528 x 480i 4:3 29Hz MP@ML
AUDIO: AC3 48 KHz LANGUAGE: eng
6.32 CATV MPEG Video Service Monitoring
The video displayed in the Main Measurement Page or in the MPEG SERVICE LIST
page may be expanded to fill the display screen. For a full screen view of the
demodulated video of a selected video service touch the displayed video section of the
screen.
The displayed video initially indicates the video service name along with associated
MPEG header video and audio information. This information is located along the bottom
of the display and includes the video resolution, aspect ratio, and MPEG compression
level. The audio information includes the format, and data rate. After a few seconds for
review, the bottom section is pushed to the bottom of the display. When viewing a full
video display you may return to the previous measurement screen by touching the
center of the screen.
6.4 CATV MEASUREMENT POPUP MENU
The CATV measurement page includes a popup menu that
provides quick access to information and several available
functions related to the CATV measurements. To The Popup
Menu listings are explained below.
PRG. NAME: The current channel number
LNBLocOsc: Provides user changes to the local oscillator
setting of the meter. This remains at 0 MHz for all typical TVRF input signal testing.
BUZZER FUNC: Provides a switch selection to turn the
alignment buzzer on or off.
BUZZ. TYPE: Provides a selection to produce a tone based
upon the received signal level or on the signal noise margin measurement.
TS_STREAMING: Provides a selection to setup streaming of selected services from
the RF demodulated transport stream to the LAN port or to a USB drive file.
VISUALIZE NIT: Provides a measurement screen with the information contained in the
DVB Network Information Table.
CHANNEL LOGGER: Monitors and charts the digital RF measurements of a satellite
transponder or channel.
Page 70 (124)
Page 71

SLM 1479 User Manual
HELP icon: Provides signal DISCOVERY to automatically determine a digital satellite
transponders signal type, modulation type, and symbol rate for automatic tuning.
6.42 MINISPECTRUM
The MINISPECTRUM feature provides a channel spectrum analyzer overlay on the
video display within the main measurement page. The overlay is enabled and disabled in
the main channel measurement MENU. To enable/disable press the MENU & ? field at
the bottom right of the measurement page. Touch the MINISPECTRUM field and
increment the field to ON or OFF to enable or disable the spectrum overlay.
6.43 VISUAL NIT
The SLM 1479 provides an information page of the data found in a DVB signal’s NIT
(Network Information Table). To view the NIT information, touch the MENU & ? field and
touch the VISUALIZE NIT listing. Press the large Control Knob to enter or initiate the
VISUALIZE NIT feature.
The VISUALIZE NIT page includes the following information.
Frequency: The transponder frequency
Pol: Polarity of the transponder signal
horizontal or vertical
Sym Rate: Symbol rate of the transponder
Mode: DVB standard
Type: Constellation depth
FEC: Forward Error Correction applied
Note: When the signal contains no NIT
table, the VISUALIZE NIT function cannot
find or read the data needed to populate the
screen. A NIT table is common in a DVB formatted signal such as a remote truck feed,
satellite DVB-S or DVB-S2 signal, a DVB-T/T2 signal, or DVB-C signal.
Page 71 (124)
Page 72

SLM 1479 User Manual
6.44 CHANNEL LOGGER
The SLM 1479 includes the ability to continuously monitor and chart/log the critical RF
analyzing measurements of a selected cable channel over a selected time period. The
charting allows you to see events or times of RF signal impairments or reception
interruptions. To select the Channel Monitoring feature touch the MENU & ? field when
in the main measurement
screen. In the popup menu
touch the CHANNEL LOGGER
field. The SINGLE CHANNEL
MONITORING screen with
multiple measuring graphs is
presented.
The Single Channel Monitoring
screen is divided into a top and
bottom chart or graph. Each
graph includes multiple
channel measurements as
described below:
Top Chart: The top chart of the monitoring screen provides charted values which
include 3 measurements on a single chart. The measurements are color coded to
indicate aBER (red), bBER ((blue), and packet errors (yellow). Menu when in the The
channel monitor provides a continuous graphing of the satellite transponder being
received.
Bottom Chart: The bottom chart provides charted values of the channel’s measured
power (red), and MER (blue).
When in the Single Channel Monitoring function a control
Menu provides selections applicable to the charting. The
Menu includes the time interval setting elapsed from the left to
right side of the chart. To access the control features touch
the MENU field at the bottom right of the touch display screen.
The selections provided are described below.
TIME INTVL: Time Interval of the graph shown on the
display. The displayed time interval of the graph.
SEND TO USB: Turns on the capability of writing channel monitoring values to a USB
memory stick file. When turned ON the graphed values of the channel measurements
are suspended and values are written to the USB stick file.
FILE NAME: Produces an entry menu to define a fine name to store channel
monitoring values on the USB memory stick.
RESET: Resets or clears the graph. Restarts the channel monitoring and graphing.
Page 72 (124)
Page 73

SLM 1479 User Manual
The Channel Logger provides a means to continuously sample and record the key
channel measurements to a file on
the USB stick. To do this insert a USB
stick into the meter USB-A port. Setup
meter to the desired channel to be
monitored/logged. Press the MENU
& ? menu and select Channel Logger
feature. Press the MENU field in the
SINGLE CHANNNEL MONITORING
screen. In the menu, select FILE
NAME and enter a file name for the
data to be stored on the USB stick.
Select the SEND TO USB field and increment to “ON.” Press the ENTER selection or
press the large control knob in to Enter. Measurements are active and the bottom of the
display indicates “SAVING DATA ON FILE. PRESS ENTER TO STOP.” Press the large
control knob in to stop the logging.
USB Logging File Data
Channel monitoring values that are written to the USB stick file can be opened and
viewed with a spreadsheet application. The values include a time reference from the
date/time settings of the meter. The values include the Power, MER, aBER, bBER and
packet errors.
Page 73 (124)
Page 74

SLM 1479 User Manual
PLAN MODE REF. PWR MRK.FRQ
USACBL DIGITAL 0 dBmV 593.00
SPAN
CHAN
20
34
MRK. P: -12 dBmV
MENU & ?
0 dB
10 dB
20 dB
30 dB
40 dB
50 dB
60 dB
SPEC
21 3 5
4
6
7
8
10 9
CATV
6.5 CATV Spectrum Analyzer
The CATV spectrum analyzer provides detailed spectral analysis of both analog and
digital CATV signals. To select the spectrum analyzer function from the HOME menu
with the TV icon highlighted, touch the SPEC icon. You may also access the spectrum
analyzer from any of the other measurement pages by pushing the SPEC pushbutton at
the right of the display.
The TV Spectrum Analyzer page contains header fields with many of the same sections
as the measurement page. However, some of the headings are different. Below is a
summary of all the header fields and an indication if the field may be highlighted for
change.
1. Plan: The channel plan selected in the CATV Broadcast Plan Selection Menu. It may
be the USACAB or a Manual or Auto plan. This field is not selectable.
2. MODE: Indicates the spectrum analyzer’s detector mode. Selectable field permits
digital or analog selection.
3. Reference Power: Indicates the level of the top line of the spectrum analyzer
commonly called the reference power level.
4. Marker Frequency: The frequency represented by the location of the vertical red
marker line on the spectrum analyzer display. A selectable field permits moving the
marker line. The marker may be moved automatically by touching points in the display or
by highlighting the MRK FRQ field and rotating the touch control knob.
5. Channel: The selected CATV channel being analyzed. Selectable field permits
channel selection. Note: A channel must be in the channel plan to be listed.
6. Span: The frequency span of the spectrum analyzer. A selectable field with 50MHz,
100MHz, 200MHz, 500MHz and FULL selections.
7. Avg. Level: Bar graph indicating the average channel digital level. Not selectable.
8. Menu &?: Popup Menu with selections to configure the meter’s cable TV receiver
and spectrum analyzer features. See the next section (6.6) for details.
9. Marker Line: The marker frequency cursor line. May be moved by touching the
display location you wish the marker to relocate.
10. Marker Power: The power indicated at the frequency location of the marker line.
The field is not selectable
Page 74 (124)
Page 75

SLM 1479 User Manual
6.6 CATV Spectrum Analyzer Popup Menu
The CATV Spectrum Analyzer includes a popup menu
that provides settings for the spectrum analyze. It further
provides a convenient access to the HELP DISCOVERY
function. Touch the MENU & ? section of the display to
access the Popup Menu. The Popup Menu listings are
explained below.
SPECTRUM: Provides a selection of the sweep or
update rate of the spectrum analyzer. Selections include
FAST and SUPERFAST.
BUZZER: Provides a switch selection to turn the
alignment buzzer on or off.
MRK. BW (Marker Bandwidth): Selections include
OFF, ON, and BW.PWR. The ON selection provides a variable BW with two vertical
markers on the display which may be varied by rotating the touch control knob. The
MRK BW selection adds a power measurement to the selected band at the bottom
center of the spectrum analyzer display.
DELTA MARKER: Turns on or off a white marker which along with the existing red
marker provide two adjustable frequency locations. At the center bottom of the spectrum
analyzer display is added a Delta Marker Power (Delta MRK.P) measurement which
indicates the level difference between the red and white frequency locations.
PICTURE: Changes how the spectral energy is displayed within the spectrum analyze
graph from a FULL to a CONTOUR view. The FULL selection fills in the displayed
spectral energy with color. The CONTOUR selection outlines the top of the spectral
energy with a colored line.
LOC. OSC: Provides user changes to the local oscillator setting of the meter. This
feature is rarely used with TV broadcast measurements and should remain at 0MHz.
dB DIV: Provides 1, 2, 5, 10 dB selections to change the resolution of the spectrum
analyzer’s vertical increments or dB level.
DC@RF: This feature is not available on the SLM 1479.
RBW Filter: Resolution Bandwidth Filter – This is fixed at 100 KHz
SAVE/RECALL: Provides memory for 20 captured spectrum analyzer screens which
may be recalled and viewed on the screen.
HELP ICON: Provides help to automatically determine a cable channel’s signal type,
modulation type, and symbol rate for automatic tuning.
Page 75 (124)
Page 76

6.62 CATV Spectrum Analyzer Delta Marker Measurement
PLAN MODE REF. PWR MRK.FRQ
USABRO DIGITAL 0 dBmV 212.00
SPAN
MRK. FR
10
2.556
MRK. P: -9.3 dBmV
MENU & ?
0 dB
10 dB
20 dB
30 dB
40 dB
50 dB
60 dB
MRK. P: -6.3 dBmV
The Spectrum Analyzer includes a Delta Marker measurement. The measurement
provides an additional white horizontal and vertical marker or cursor on the spectrum
analyzer display. The CHAN header is
replaced by a MRK. FR. (Marker
Frequency) header. This header field
indicates the frequency position of the
white marker. The header field may be
touched and selected to move the white
marker horizontally on the display
screen. You may also touch locations
on the screen and the white marker
moves to the touch point. The red
marker is not moveable in the Delta
Marker function. To select the DELTA
MARKER function touch the MENU&?
field and in the popup menu touch the
Delta (Triangle) Marker listing so it indicates “ON.” .
The Delta Marker measurement provides a frequency difference measurement and a
level difference measurement between the location of the red marker and the white
marker. The Delta Frequency is indicated under the MRK FR. Header. The Delta Marker
power or level is indicated in the bottom center measurement field.
6.63 Spectrum Analyzer Marker Bandwidth Measurement
The Spectrum Analyzer includes a marker bandwidth (MRK.BW.) measurement. This
measurement provides a means to select a bandwidth of interest for a level
measurement. The bandwidth is adjustable from 0 to 8MHz. When the MRK BW function
is turned ON the spectrum analyzer marker frequency field (MRK.FR.) is not selectable.
This Marker Bandwidth (MRK.BW) measurement anchors the reference marker (MRK.
FR) so it may not be selected or moved. The test produces two bandwidth markers, red
horizontal lines, which begin at the reference MRK FR. and move apart as the control
knob is rotated. The CHAN header is replaced by a MRK BW. header and the
associated marker bandwidth value is shown. The field may be touched and selected to
adjust the 2 red widening bandwidth markers with the control knob.
To select the MARKER BANDWITH feature from the Spectrum Analyzer screen, touch
the MENU&? Field. In the popup menu touch the MRK.BW field at the right so it
indicates “BW.PWR.” Touch EXIT and then touch the MRK BW header and rotate the
control knob to select the bandwidth. The bottom center field in the spectrum analyzer
display indicates the power measurement in the selected bandwidth.
SLM 1479 User Manual
Page 76 (124)
Page 77

SLM 1479 User Manual
BUZZ & NOIS. MARG. GR.
EXIT
SPECIAL FUNCTIONS
INGRESS
LEAKAGE
SPECIAL
FUNCT.
6.7 CATV Special Functions
The CATV Special Functions menu provides
several listings. The CATV Special Functions
Menu is selected by pressing the SPECIAL
FUNCT icon on the HOME Menu when the CATV
icon is highlighted. You may also press the
SPECIAL FUNCT icon when in the CATV PLAN
SELECTION MENU after choosing a channel
plan for your measurements. This section
provides an overview of the special functions
available for CATV signal testing.
LEAKAGE:
Measures the field intensity of a signal emitted or
“leaking” from the shielded cable system.
Elevated leakage levels indicate a shielding
problem which should be corrected.
INGRESS:
Shows the potential ingress interference problems in the upstream cable spectrum by
providing a spectrum analysis from 5 to 65 MHz. Includes a peak hold function for
capturing random noise or interference spikes.
BUZZ & NOISE MARG. GR.:
(Buzzer with Noise Margin Graph): Provides a buzzer to indicate the relative
improvement or degradation of a TV digital channel Noise Margin.. Provides an active
Noise Margin performance graph showing increases or decreases in signal performance
during a moving 7 second segment..
The following sections of this manual provide more information on these CATV special
functions.
Page 77 (124)
Page 78

6.71 CATV LEAKAGE TEST
BUZZ & NOIS. MARG. GR.
EXIT
SPECIAL FUNCTIONS
INGRESS
LEAKAGE
SPECIAL
FUNCT.
ANT. TYPE:
BACK
THRESH:
ANT. FACTOR:
DISTANCE:
DUCK
0
10 feet
25 uV/m
START
AREA :
USA
CATV
LEAKAGE GRAPH
65000
6500
650
65
0
LEAKAGE
FUNCTION
EXIT
MAX VALUE
1 0 uV/M
MIN. VALUE
6.3
LIVE VALUE
7.uV/m
uV/M
115.000 MHzFREQUENCY:
The Leakage Test measures the field intensity of a signal emitted or “leaking” from the
shielded cable system. Elevated leakage levels indicate a shielding problem which
should be corrected to prevent potential interference to other signal transmissions and
avionics. The Leakage Test further provides help in isolating leakage and in finding
points of ingress. To select the Leakage Test function, with the CATV icon highlighted
touch the SPECIAL FUNCT icon on the HOME MENU. Touch the LEAKAGE field in the
CATV SPECIAL FUNCTIONS Menu to advance to the Leakage Test Setup Menu.
LEAKAGE TEST SETUP:
The Leakage Test Setup menu provides settings used to set criteria for the Leakage
Test. Settings select a test frequency in the range of 100-150 MHz to match the leakage
test transmitter frequency and provide compensation for the antenna, antenna factors,
and distance.
Area
The Area setting adapts the leakage test to standards established in Europe and USA.
Set to USA for leakage testing in North America. This establishes the remaining
Leakage Setup fields in the menu for selections to match standards for cable system
leakage testing in the USA.
Antenna Type (USA ONLY)
The ANT. TYPE field provides selections for the type of antenna to be used for the
Leakage Test. The selections include: MONOPOLE, DUCK, or BIPOLE. To use the
supplied antenna set the antenna type to DUCK. Touch the ANT. TYPE field to highlight
the right selection box. Touch the selection box to increment through selections.
Antenna Factor
The Antenna Factor setting compensates the Leakage Test measurements to conform
with a calibrated or reference leakage field for a certain antenna type, mounted
condition, and system measurement components. Touch the ANT FACTOR field to
highlight the right selection field. Touch the selection field to increment through available
settings which may be used to increase or decrease values to match the relative gain or
Page 78 (124)
SLM 1479 User Manual
Page 79

SLM 1479 User Manual
loss of the antenna/system being used compared to the reference. When using the
supplied duck antenna a setting of 200 is recommended.
NOTE: The Antenna Type selections result in three programmed antenna factors,
100 for the dipole, 90 for the monopole, and 75 for the rubber duck antenna.
Distance
The Distance setting compensations the Leakage measurement based upon the
estimated distance from the leak source. Touch the DISTANCE field to highlight the
selection field at the right. Touch the field to increment distance settings to set a value
for the distance from the leak source.
Threshold
The Threshold setting determines the uV/M level at which an audible alarm on the unit is
sounded to indicate leakage. The audible sound varies in pitch based on the amount of
leakage present to indicate when you are getting closer to the leak. A setting of
20mV/meter is the FCC standard and the meter’s default setting.
To Perform a Leakage Test:
To perform a Leakage Test, connect the test antenna to the RF Input of the meter.
Touch the SPEC FUNCT icon with the CATV icon highlighted to access the CATV
Special Functions Menu. Touch the LEAKGE listing or field to advance to the Leakage
Setup Menu. After appropriate setup selections, touch the START field at the bottom to
begin measurements.
To change the Leakage Test frequency, touch the MENU &? field at the bottom right of
the display screen. Touch the FREQUENCY listing to enter the test frequency. Note:
The selected frequency does not need to exactly match your transmitter frequency as
the bandwidth of the meter is sufficiently wide to receive and measure properly. The
Leakage Test meter displays both the real time cable leakage factor (LIVE VAL) and the
maximum leakage factor detected during the same measurement session (PEAK VAL).
The PEAK VAL measurement holds the peak value until the Leakage Test session is
stopped and restarted. To restart a session, press the EXIT field and reselect the
SPECIAL FUNCTION and LEAKAGE TEST field to restart the test.
The measurement session does get stopped and reset when editing the test frequency,
therefore the PEAK VAL displays the maximum value of the cable leakage factor
detected by the meter on all the test frequencies set on the meter by the user while
performing the same measurement session.
Page 79 (124)
Page 80

SLM 1479 User Manual
MODE HOLD REF. PWR MRK.FRQ
INGRESS OFF 0 dBmV 35.00
SWEEP
dB/DIV
0.5 s
10
MRK. Level: -45.5 dBmV
MENU & ?
0 dB
10 dB
20 dB
30 dB
40 dB
50 dB
60 dB
INGRESS
STOP FREQ:
BACK
HOLD:
66.000 MHz
Disable
START
START FREQ :
4.000 MHz
6.72: CATV INGRESS TEST
The CATV Ingress Test is a special function which shows potential ingress interference
problems in the upstream cable spectrum by providing a spectrum analysis from 5 to 65
Mhz. Connect the upstream cable signal to the RF input on the top left of the meter.
From the HOME Menu with the CATV icon highlighted touch the SPECIAL FUNCTION
icon. Touch the INGRESS listing in the SPECIAL FUNCTION Menu to advance to the
INGRESS TEST.
The Ingress Test shows a spectrum analyzer display with a frequency span selected for
the Ingress Test. To measurement an ingress signal, touch the MRK. FREQ. header
field and touch the screen location in which you want the marker to relocate. You may
also use the Control Knob to move the cursor. The signal level at the marker location is
displayed at the display bottom row (MRK Level) with the relevant measurement unit. A
horizontal dotted line shows the real time signal level value at the current marker
position (current frequency value).
REF. PWR: Reference Value
With the Standard Navigation Mode highlight the top level (end of scale) value on the yaxis and set the appropriate end of scale value.
HOLD:
Touch the HOLD header to select the field. Touch the field to increment to “ON.” The
max HOLD feature saves and shows a line above the normal signal signature indicating
the spurious noise levels. This feature is useful for finding spurious or intermittent noise
frequencies.
MRK. FRQ: Moving the Marker (Frequency Value)
Touch the MRK. FREQ. header field and touch the screen location in which you want the
marker to relocate. You may also use the Control Knob to move the cursor. The
relevant signal level measurement at the marker location is indicated at the bottom of the
display (bottom row, MRK).
SWEEP: Edit the Sweep Time
This field changes the sweep time. Touch the SWEEP header to highlight the field.
Touch the field below to increment through available sweep speeds from 50mS to 50s.
MRK. LEVEL - Marked Level: The level of a signal at the selected marker frequency.
NOTE: You may use the MENU & ? Popup Menu to gain access and adjust the
spectrum analyzer’s ingress start and stop frequencies.
Page 80 (124)
Page 81

SLM 1479 User Manual
PLAN MODULAT CONST DC@RF
BRAS75 VSB 8VSB VL/12
CHAN
FREQ
TP2BE
1453.00
BUZZER & NOISE MARGIN GRAPH
EXIT
NOISE MARG
8.0 dB
MAX. N. MARG
8.3 dB
NOISE MARGIN GRAPH
20
15
10
5
0
TV
SPECIAL
FUNCT.
EXIT
SPECIAL FUNCTIONS
BUZZ& NOIS MAR GR.
ATTENUATION TEST
6.73 CATV BUZZER & NOISE MARGIN GRAPH TEST
The BUZZER & NOISE MARGIN GRAPH test, abbreviated BUZZ&NOIS. MAR. GR, is a
special function which provides a time charted graph of the Noise Margin measurement
of a selected satellite transponder. It further is accompanied by the alignment buzzer.
The test may be used for satellite dish alignment or to monitor the received signal
performance of a satellite dish or LNB
To select the BUZZ&NOIS MAR.GR. function from the Home Menu, touch the SPECIAL
FUNCT icon with the CATV icon highlighted. If the CATV icon is not highlighted, touch
the CATV icon and from the CATV PLAN SELECTION MENU, after selecting the
desired channel plan, touch the SPECIAL FUNCT icon at the right. Then touch the
BUZZ&NOIS MAR.GR listing which takes you directly to the test function.
Measurements in
the BUZZ&NOISE
MAR.GR function
include the
following:
NOISE MARG:
The Current Noise
Margin
measurement
MAX N. MARG:
Maximum or best Noise Margin measurement since the test began – signal lock
MIN N. MARG: Minimum or worst noise margin measurement since test began – signal
lock.
The received signal performance (noise margin) is graphed from left to right scrolling a 7
second window of performance. Each horizontal increment represents a 1 second time
interval. Interruptions are marked as a yellow line falling to the bottom of the chart
moving to the left. Variations in noise margin are clearly seen as rising or falling levels
along the top of the chart. Levels on the right of the graph clearly indicate the maximum
and minimum variations since the onset of the test began.
Page 81 (124)
Page 82

MEMORY
SLM 1479 User Manual
6.8 CATV Memory Management
The MEMORY MENU provides channel plan
creating, test logging features and channel plan
management functions. The MEMORY MENU is
accessed by pressing the MEMORY icon with
the head/brain picture on it. On the Home
Menu or in the TV BROADCAST PLAN SELECTION Menu
touch the MEMORY icon. The MEMORY MENU functions
are summarized below: The following sections of this
manual provide more details.
AUTOMEMORYtv: Scans channels of a master TV or
cable channel plan and automatically discovers active channels and builds an AUTO
named channel plan with channels found meeting minimum level settings.
SAVE DATALOGGER: Scans the channels in a channel plan and records
performance measurements to a log file. The scanning progress and test summary is
shown during the scanning.
RECALL DATALOGGER: Selects and recalls a previously scanned and stored log
file by name for reviewing the test results
MANUMEMORY: Provides creation and editing of manually created
transponder/channel plans.
FILE MANAGER: Provides selection of logger and satellite manual created channel
plans for renaming or deleting.
Touch a listing in the MEMORY MENU to begin a function as listed above.
6.81 AUTOMEMORYtv – Scan CATV Channels to Create a Channel Plan
The AUTOMEMORYtv feature found in the MEMORY MENU provides the ability to
automatically scan CATV channels in a standard tuning plan and discover the active
digital and analog channels. The active channels are retained creating a channel tuning
plan for the meter. The file containing the active channels is named as an AUTO plan
with a numeric reference (Example: AUTO 1).
Auto scanning channels and creating a channel plan provides the convenience of only
listing the channels available in your area for meter selection. All inactive channels are
removed from the channel plan. Auto scanning channels to create a channel plan further
configures each available channel as either analog or digital so the meter automatically
applies the proper signal measurements.
Page 82 (124)
Page 83

To perform the
AUTOMEMORY tv
MANUMEMORY
SAVE DATALOGGER
RECALL DATALOGGER
FILE MANAGER
EXIT
MEMORY MENU
FROM PLAN:
BACK
DISCOVERY:
LEVEL:
POWER:
AUTO 3
> - 13 dBmV
TERR. ONLY
START SAVE?
TO FILE N :
USABRO
> - 17 dBmV
AUTOMEMORY tv scan, with
the CATV icon highlighted on
the HOME MENU touch the
MEMORY icon. The meter
advances to the MEMORY
MENU. Touch the
AUTOMEMORY tv listing
which brings up a
configuration box. The listing
in the configuration box are
listed and explained below.
FROM PLAN: Selects the master tuning plan to use for scanning for channels. Use
USABRO for scanning broadcast TV channels in North America. Use USACBL for
scanning cable TV channels in North America.
TO FILE N: Selects the AUTO channel plan name for reference. This is the new or
existing channel plan name which channel data is to be stored during the scan. This
name may be selected and used for CATV meter tuning after the channel scan is
complete and the plan is successfully created.
LEVEL: Defines the minimum signal level of an analog channel required to consider
the analog signal a valid channel prior to adding it to the channel plan.
POWER: This defines the minimum signal level of a digital channel during the channel
scan required to consider the digital signal a valid channel.
DISCOVERY: This defines the modulation signal types that the meter looks for during
the channel scan. This field may offer TERRESTRIAL ONLY, CABLE ONLY, or TERR &
CABLE selections. Select CATV ONLY when scanning for cable channels as this
provides the fastest auto-scan time.
START SAVE?: Starts the automemory scan saving channel information to the AUTO
file specified.
To Create an AUTOMEMORY Channel Plan:
1. Navigate to the MEMORY MENU
and touch the AUTOMEMORYtv
field.
2. Set the FROM PLAN field to
USACBL. This is set by selecting
the CATV measure function. Then
press the PLAN pushbutton and
select the Master channel plan as
needed. Then push the HOME
button and from the start menu
touch the Memory field to return to
the AUTOMEMORYtv menu.
SLM 1479 User Manual
Page 83 (124)
Page 84

SLM 1479 User Manual
3. Set the TO FILE N field to select an AUTO file name. Note: If the AUTO file selected
already contains channel data, the bottom field changes from START SAVE? to START
OVERWRITE? Touching the START OVERWRITE? field begins a scan replacing the
data in the existing AUTO file.
4. Touch the LEVEL and/or POWER fields and set as desired.
5. Touch the START SAVE? field to being the channel scan.
6. Wait a few minutes and watch the display screen which illustrates the scanning
process and indicates the channels as discovered. The meter indicates complete when
all the channels have been scanned.
7. Touch the Exit field to exit the scan. The Auto scanned plan is automatically selected
for use by the meter. The plan is then available for use.
6.82 SAVE DATALOGGER – CATV Auto Measure & Store
The SAVE DATALOGGER feature within
the MEMORY MENU scans the channels in
a selected manual channel plan and
captures performance measurements for
each channel to a log file. The logged data
file is stored in one of the 99 available
memory locations in the meter or may be
written to a file on the USB memory stick.
The file is named for latter recall and test
result viewing.
To begin a data logger capture, select the
SAVE DATALOGGER by touching the
MEMORY icon on the Home Menu with the
TV icon highlighted. Touch the SAVE
DATALOGGER listing in the MEMORY
MENU.
The SAVE DATALOGGER has a
configuration menu with several fields which
impact the function. Following is a brief description of these fields.
FROM FILE: This field indicates the selected channel plan in which the individual
channels will be scanned and tested. This field may be highlighted and a channel plan
selected.
Data File: This is the file name where the scanned measurement data is to be stored.
Point: This is a name for the test point associated with the log file data.
STOP&GO: Provides for stopping the log measurements when changing from a cable
channel to DOCSIS test providing the user a time to change connections.
LCN: Turns the logging of the language channels on or off so as to include or exclude
in the gathered channel data.
MEMORY DEV: Determines if the logging data is saved to internal meter memory or
to an external USB Memory stick inserted into the USB-A jack.
File Name: Provides a file name entry for the data saved to the USB memory stick.
Page 84 (124)
Page 85

SLM 1479 User Manual
START SAVE?: Starts the logging saving transponder performance testing data to the
Data File name in the Date File field.
AVAILABLE LOGGER: 99: Indicates the available memory locations for storing
logging data files.
To begin the collection of test data
with the SAVE DATALOGGER
function touch the START
OVERWRITE or START SAVE field
to begin. When the DATA LOGGER
begins scanning channels in the
channel plan, a LOGGER
FUNCTION screen shows the
scanning/logging progress. A Total
Test Report section, on the right of
the display screen, indicates the
progress of the scan and
summarizes the performance of each transponder tested. The transponder is color
coded in the report indicating a pass, marginal or fail status. Near the bottom of the
LOGGER FUNCTION screen the transponder currently being tested is highlighted. A
picture indication shows if the transponder was digital or analog.
Data logging measurements and data are written to the USB stick csv file. The data can
be opened and reviewed with a spreadsheet program such as Excel.
Page 85 (124)
Page 86

SLM 1479 User Manual
DATA FILE:
BACK
Point:
RECALL?
POINT 1
LOG. 1
AUTOMEMORY tv
MANUMEMORY
SAVE DATALOGGER
RECALL DATALOGGER
FILE MANAGER
EXIT
MEMORY MENU
MEMORY
6.83 RECALL DATALOGGER - View CATV Data Log File
The RECALL
DATALOGGER within the
MEMORY MENU provides
a means to recall existing
memory log files
containing CATV channel
performance test data.
The log files available for
recall are files created with
a SAVE DATALOGGER
function covered in the
previous section.
To recall a data logger file touch the MEMORY icon on the HOME Menu with the CATV
icon highlighted. Touch the SAVE DATALOGGER listing in the MEMORY MENU. In the
DATA FILE field of the selection box, touch the listing on the right and rotate the touch
Control Knob to increment through the available log files. Press the RECALL field to
view the file’s measurement contents.
The DATALOGGER viewer
shows the file name and point
number in the upper left to identify
the logger file. The channel
number is shown in the left
column. The digital or analog
signal type is listed and the
associated performance
measurements are shown
horizontally for each channel
included in the log file.
An indication of transponder
signal performance is provided with a color coded box at the left of the channel name. A
green box indicates the channel passed test performance criteria and is good. A red box
indicates a performance issue with the channel measurements.
Page 86 (124)
Page 87

6.84 MANUMEMORY – Creating or Editing CATV Channel Plans
AUTOMEMORY tv
MANUMEMORY
SAVE DATALOGGER
RECALL DATALOGGER
FILE MANAGER
EXIT
MEMORY MENU
PLAN:
BACK
(Press ENTER and
Select The Plan)
START EDIT
MAN 6
MEMORY
The MANUMEMORY feature found in the MEMORY MENU provides the ability to
manually create a tuning plan which may include a list of broadcast channels.
The file containing the active channels is named as a MANU plan with a numeric
reference (Example: MANU 1). Manually creating a channel plan provides the
convenience of only listing a few channels available in your area or desired for special
testing application. Only the channels created and added to the list are available in the
MANU channel plan for selection and measurement.
The MANUMEMORY feature permits entry of individual channels one at a time. For this
reason it is ideal for creating a channel plan in which there is a small number of
channels. When creating a channel plan with many channels the AUTOMEMORYtv or
use of the SMART software is recommended.
The SLM 1479 provides
management features
for the MANU files. The
MANUMEMORY feature
permits edits or changes
to listed channels within
a previously created
manual (MANU) channel
plan. The following
sections provide
information on creating
and editing a MANU
channel plan.
To Manually Create a Plan:
1. To create a transponder/channel plan navigate to the MANUMEMORY feature by
touching the MEMORY icon and touching the MANUMEMORY listing in the MEMORY
MENU.
2. In the PLAN field at the top of the configuration box touch the listing at the right to
highlight the field. Move your finger over the arrow portion of the touch control knob to
increment through available memory channels.
3. Select a manual channel plan number of choice. Press the START EDIT field to
begin construction of a manual plan. NOTE: The name of the selected manual file can
be renamed. See the next section of this manual for instructions on how to rename an
existing manual file.
4. The ITEM EDITING menu appears to enable entry of transponder. Touch the SAVE?
field to add a listing after changing the individual fields to the desired values.
Page 87 (124)
SLM 1479 User Manual
Page 88

ACTION
MODIFY ITEM
ADD BELOW
RETURN
EXIT
ACTIVE PLAN: MANU 25
8VSB
8VSB
8VSB
8VSB
MODE
8VSB
201.0
213.0
479.0
605.0
731.0
FREQ
11
13
15
36
47
TR/CHAN
1
2
1
2
3
N
ADD ABOVE
DELETE ITEM
4.5 FM
MODE
BACK
FREQ:
AUDIO:
8 VSB
CHAN:
201 MHz
NAME
ITEM EDITING
SAVE?
PR 1
11
MANUMEMORY ACTIONS
MODIFY ITEM: Produces the ITEM EDITING menu which permits changes to the
settings for the transponder listing highlighted
ADD BELOW: Produces the ITEM EDITING menu in which you may select the
parameters of a transponder signal and dish characteristic to add a listing below the
currently highlighted field.
ADD ABOVE: Produces the ITEM EDITING menu in which you may select the
parameters of a transponder signal and dish characteristic to add a listing below the
currently highlighted field.
DELETE ITEM: Deletes the highlighted listing from the selected plan.
EXIT: Returns to previous menu
To Edit an Existing Plan:
1. To make changes or additions to an existing manual memory plan navigate to the
MANUMEMORY feature by touching the MEMORY icon followed by touching the
MANUMEMORY listing in the MEMORY MENU.
2. In the PLAN field at the top of the configuration box touch the listing at the right side to
highlight the file name. Rotate the control knob to increment through the available
memory plans.
3. Select the file name in which you want to edit or add listings. Press the START EDIT
field to begin editing.
4. Touch MODIFY ITEM from the listings to produce the ITEM EDITING Menu. Modify
the items in the Menu to match the transponder and satellite dish characteristics as
needed. Press the SAVE? field to write the changes to the highlighted channel listing.
Press BACK to return to the previous menu without making changes.
Page 88 (124)
SLM 1479 User Manual
Page 89

6.85 CATV FILE MANAGER – Renaming or Deleting Files
AUTOMEMORY tv
MANUMEMORY
SAVE DATALOGGER
RECALL DATALOGGER
FILE MANAGER
EXIT
MEMORY MENU
SELECT ITEM
5048
2300
1368
2328
88
56
56
56
152
1784
440
24
SIZE
US-QAM
LOG. 1
AUTO 2
MANU 2
MANU 3
SLIM 5
TEST 1
USATS
NAME
AUTO 1
MANU 4
MANU 5
MANU 6
LOG
AUTO
AUTO
MANU
MANU
MANU
TYPE
MANU
MANU
MANU
MANU
MANU
MANU
1
2
1
2
3
4
N
5
6
7
8
9
10
ACTION
RENAME FILE
DELETE FILE
RETURN
EXIT
MEMORY
The FILE MANAGER, found in the MEMORY MENU, provides management of the
logger and transponder/channel plan files. The FILE MANAGER provides the ability to
rename or delete files from the meter’s memory. To access the FILE MANAGER from
the Home Menu, touch the MEMORY icon followed by a touch of the FILE MANAGER
listing in the MEMORY MENU.
You can rename or delete files that were created with the DATA LOGGER as in
scanning a TV channel plan and capturing performance measurement data to a test file.
These test files are identified as LOG file types and are typically named as LOG 1,
LOG2, etc. You can also rename or delete files that were created by the
AUTOMEMORY feature or with a MANUMEMORY feature of the meter. These are
channel plan files and are typically named “AUTO 1,” “AUTO 2”, etc. or “MANU 1,” “MAN
2, etc. by the meter. However, these file names can be changed to a more recognized or
descriptive name as desired. The following section summarizes how to rename, or
delete these files in the FILE MANAGER function.
To Rename a File:
1. Navigate to the MEMORY MENU. Touch the FILE MANAGER listing.
2. Scroll up or down in the listed files to find the file you want to rename. Touch the
listing to select or highlight the listing and press the ENTER pushbutton in the center of
the larger touch Control Knob.
3. Touch the RENAME FILE listing in the ACTION MENU which appears.
4. A naming overlay appears on the screen. Touch letters to enter into naming boxes.
Press > to advance to the next box. Continue until the name is complete. Touch the
EXIT box.
To Delete an Existing File:
1. Navigate to the MEMORY MENU. Touch the FILE MANAGER listing.
2. Scroll up or down in the listed files to find the file you want to delete. Touch the listing
to select or highlight the listing and press the ENTER pushbutton in the center of the
larger touch Control Knob.
3. Touch the DELETE FILE listing in the ACTION MENU which appears to delete the
selected file: NOTE: DELETION IS PERMANENT – THE FILE CANNOT BE
RECOVERED.
Page 89 (124)
SLM 1479 User Manual
Page 90

PLAN MODULAT CONST DC@RF
USACAB
J83-B
QAM256 OFF
CHAN
FREQ
13
213.00
EXIT
HELP FUNCTION
WAIT
SEARCHING MODULATION
WAIT
SEARCHING FREQUENCY
WAIT
SEARCHING SYMBOL RATE
HELP
CATV
SLM 1479 User Manual
6.9 CATV HELP
The HELP icon on the SLM 1479 refers to help or assistance tuning in a digital channel.
The HELP function is designed to help determine for a user the RF type of signal within
a cable TV channel.
Initiating a HELP function on the SLM 1479 directs the meter to automatically analyze
the TV channel and determine the RF modulation type, bandwidth/center frequency, and
RF symbol rate. The SLM 1479 methodically analyzes the digital signal to determine
these parameters. If the parameters are within the receiver capabilities the meter
finishes by advancing to the measurement page with the channel displayed. If the
channel has no recognizable signal or is a proprietary modulation scheme, the SLM
1479 reports “NO SIGNAL.”
To initiate a HELP function simply locate a HELP icon and touch it. The HELP icon is
located within the Spectrum Analyzer’s popup menu. When in the Spectrum analyzer
touch the MENU & ? field at the bottom right of the screen. Touch the HELP icon. If the
channel spectrum is not centered, touch the spectrum analyzer touch screen to center
the vertical cursor on the signal or channel center frequency. Initiate a HELP function to
enable the meter to identify and lock to the digital channel.
The HELP FUNCTION screen informs you of the meter’s progress in determining the
type of digital signal or detecting an analog signal within the channel. The boxes on the
right in the center list the modulation, frequency, and symbol rates as discovered by the
meter. When the search is completed, “FOUND” is displayed on all three measurement
status boxes at the right.
The HELP FUNCTION screen maintains the same header fields as in the CATV
measurement page. The fields indicate the plan, channel, channel frequency,
constellation, and modulation for the selected channel. To return to the previous menu,
press the EXIT field at the bottom right of the display.
For CATV channel signal analysis or HELP:
1. Touch or select the CATV icon.
2. Touch the CHAN field header and select the TV channel.
Page 90 (124)
Page 91

SLM 1479 User Manual
MRK. P: -9 dBmV
MENU & ?
0 dB
10 dB
20 dB
30 dB
40 dB
50 dB
60 dB
PLAN REF. PWR dB/Div MRK. CHAN
USACBL 0 dBmV 10 dBmV 13
SPAN
20
212.97
MRK. FR
CATV
BAR SCAN
1 2 3 4 5 6
7
3. Touch the “MENU & ?” field at the bottom right of the display. Touch the HELP icon in
the Popup Menu.
4. Wait while the meter analyzes and determines the channel symbol rate, frequency
and modulation type. FOUND is shown in all three boxes when successful. When
successful the meter defaults to the measurement page for the transponder or channel.
Touch EXIT at any time to exit the search.
6.10 CATV BAR SCAN Test
The BAR SCAN measurement shows multiple bars forming a bar chart. Each bar of the
chart represents the level of a TV-RF channel within the selected channel plan. The Bar
Scan is essentially a simplified spectrum display in which multiple channel levels through
a frequency span are indicated with bars on a level chart. The number of channels
plotted in the bar chart is determined by the selected span (SPAN). For a CATV Bar
Scan measurement touch the BAR SCAN icon with the CATV icon highlighted. The
following sections provide more information on the Bar Scan measurement and fields on
the Bar Scan display screen.
Bar Scan Basics
Each bar displays the signal level measured in a specific channel within the channel
plan. The SPAN value determines the number of channels or bars displayed in the bar
chart. A yellow bar represents a digital signal channel while a solid blue bar represents
an analog signal channel. The marker, a vertical red dotted line, is initially positioned on
the channel near the center of the display which is the center of the span of channels.
Bar Scan Measurement Initialization
Page 91 (124)
Page 92

SLM 1479 User Manual
When the Bar Scan measurement is selected the meter automatically defaults the center
channel of the span to the last channel selected in the Channel Measurement function of
the meter. To select the center channel for the Bar Scan test prior to a measurement,
press the MEAS button and select the desired channel. Press the HOME button to return
to the HOME menu and with the CATV icon highlighted touch the BAR SCAN icon. The
Bar Scan measurement further selects a level reference based upon the selected
channel’s signal level. Be sure to select an active channel so a proper reference (REF)
level is automatically selected.
1. PLAN: Indicates the channel plan selected for measurement. The plan includes the
channel list that will be measured and plotted into the BAR SCAN test results.
2. REF PWR Reference Power: The reference value establishes the level of the top
horizontal bar of the bar graph. To change the reference value, touch the REF field
header and touch the value field below to see selections. Touch the desired selection.
3. dB/DIV.: The db/Div field displays the level change represented between adjacent
horizontal lines or divisions in the bar graph. This field may be highlighted and changed
to predetermined values (5 dB/DIV, 10 dB/DIV).
4. MRK CHN: The Bar Scan display or span is centered upon a selected channel
shown in the field under the CHAN header. The CHAN field is selectable and the
channel value may be changed. Changing the value moves the red cursor or marker on
the display. Highlight the CHAN field and use the UP and DOWN arrow pushbuttons to
move the marker to the desired channel or bar.
5. MRK FREQ. - Marker Frequency: The Bar Scan display or span is centered upon
a selected channel which has a standard frequency reference. The MRK FR field is
selectable and the value may be changed. Changing the value moves the red cursor or
marker on the display. When the MRK FR is selected and changed, the channel value
changes to dash lines indicating the frequency is no longer standard for the channel
selected.
6. SPAN: The SPAN field determines the number of channels and a relative frequency
span included in the bar graph or scan. To change, highlight the field and use the UP or
DOWN key to change the span between pre-defined values, from (10, 20, 32, 64, 128).
7. MARKER P – Marker Power or Level Measurement: This field indicates the
level of the channel marked by the red cursor on the display. The unit of measurement is
set in the METER CONFIGURATION MENU. A horizontal dotted line shows the real
time signal level value measured in the currently selected channel
MENU &?: Touch this field to gain access to the Popup Menu which contails a
selection for configuring the BarScan Special Test from a BarScan measurement to a
TILT measurement. Highlight the selection field and select the “BARS” setting to
configure for a BarScan Test. Select the “TILT” setting to configure the test for a Tilt Test
explained in the next section.
Page 92 (124)
Page 93
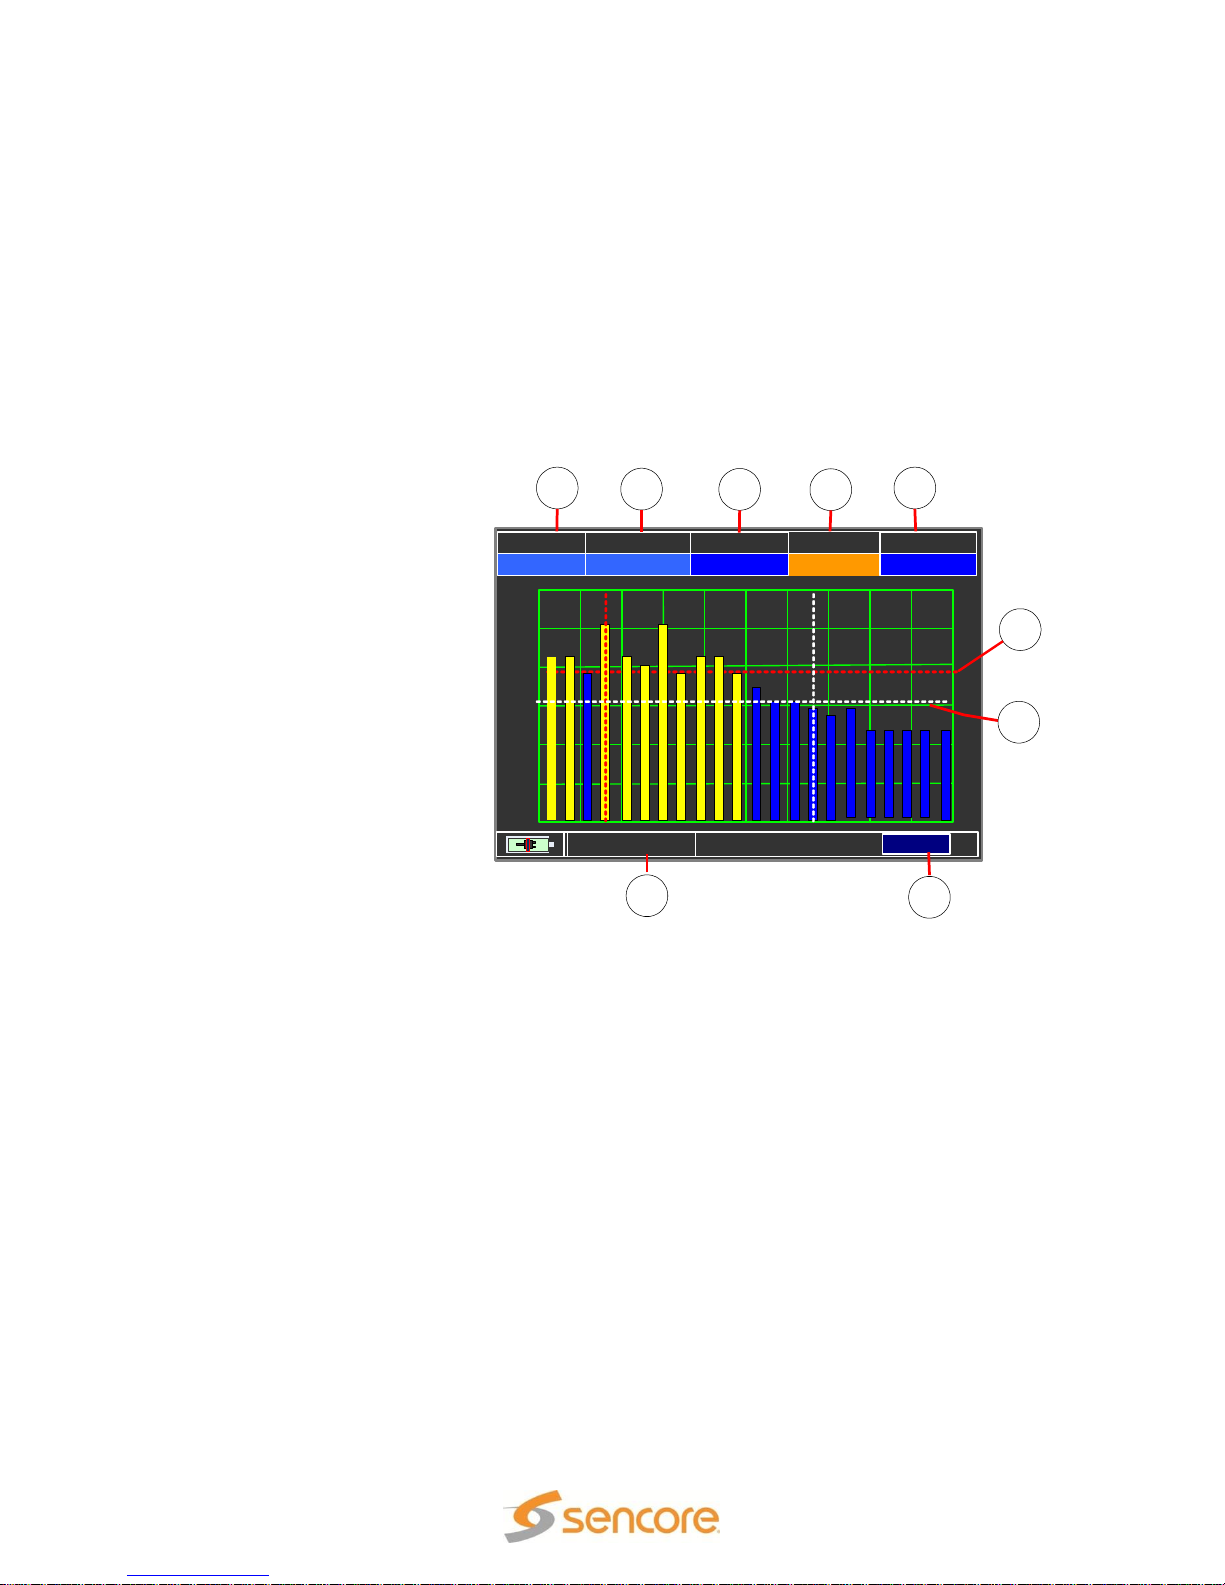
6.11 CATV BAR SCAN – TILT Test
TiLT: 9 dBmV
MENU
0 dB
10 dB
20 dB
30 dB
40 dB
50 dB
60 dB
PLAN REF. PWR PILOT 1
USACBL 0 dBmV 13 10
84
dB/Div
PILOT 2
9
1
2
3
4
5
6
7
8
In the Tilt measurement the signal level difference between two user-defined channels is
measured. The channels included in the Tilt Test are enabled in the Channel Plan using
the SMART software. The two channels for the tilt measurement can be directly set
while the Tilt Test is running. A bar display is used and cursors show the signal level
difference between the two specified channels. The display shows the analog channels
as solid blue bars and digital channels as dashed yellow bars. To enter the Tilt
measurement, highlight the TILT icon on the Home Menu and press the ENTER button.
The following sections describe the functions within the Tilt measurement screen.
To select the CATV TILT
test, touch the CATV icon
and select the channel plan
to use for the test. Touch the
BAR SCAN icon. Touch the
MENU field at the bottom
right of the BARSCAN
display to open the menu.
Touch the BARS TYPE field
to highlight the selection on
the right side. Touch the
highlighted field on the right
side until it reads “TILT.”
Touch EXIT.
1. PLAN: The currently
selected channel plan.
2. Reference Power –
REF PWR:
The reference value establishes the dBmV level of the top horizontal bar of the bar
graph. This field may be changed by red highlighting the field and pressing the UP and
DOWN arrow pushbuttons.
3. 4. Selecting Tilt Channels (Pilot 1, Pilot 2): The CH1 and CH2 fields at the top
center of the display specify the measurement channels. The triangle shapes at the
bottom of the scale indicate the measurement channels. To edit the signal level end-ofscale value, with the Standard Navigation Mode highlight the top level (end of scale)
value on the y-axis and select the requested end of scale value.
5. Edit the Scale dB/Div: This field displays the level change represented between
adjacent horizontal lines or divisions in the bar graph. This field may be highlighted and
the changed to predetermined values.
6. PILOT 1 Marker: The marker that shows the selected PILOT 1 channel.
7. PILOT 2 Marker: The marker that shows the selected PILOT 2 channel.
8. Menu: Menu used to change the BAR SCAN function between the Bar Scan
measurement and the TILT measurement.
10. Tilt Measurement: The Tilt Measurement value indicates the difference in level
between channel 1 and channel 2 which are specified in the CH1 and CH2 fields
SLM 1479 User Manual
Page 93 (124)
Page 94

SLM 1479 User Manual
Section 7: DOCSIS Measurements
The SLM 1479 contains an RF modem that is
DOCSIS 3.0 compatible and may be used for
testing both upstream and downstream
performance in a DOCSIS cable network. The
internal modem simulates a cable modem
for testing and verification. To access the
DOCSIS MENU, from the Home Menu
screen, touch the DOCSIS icon. You may also
select by pushing the DOCSIS CABLE
MODEM pushbutton. The starting DOCSIS MENU contains three sections which
provide DOCSIS related setup and testing functions. These sections are briefly
described in this section. Subsequent sections provide detailed informaiton on the
DOCSIS measurements.
SETTINGS - MODEM SETUP
The SETTINGS menu provides sections and fields used to configure the internal
MODEM for system testing. The settings insure proper integration with the cable system
to perform and provide Docsis analyzing measurements. The settings should be
configured properly prior to performing any DOCSIS measurements. The settings insure
the DOCSIS tests are configured to operate with the DOCSIS system to be tested.
Details on the SETTINGS is found on the next page in this section of the manual.
DOCSIS MEASURE
The DOCSIS MEASURE selection establishes a connection with the CMTS and
provides test analysis of the DOCSIS upstream and downstream cable network. See the
DOCSIS MEASURE section of this manual starting on page xx.
Page 94 (124)
Page 95

SLM 1479 User Manual
TONE GENERATOR:
The TONER GENERATOR selection is used to generate a test signal to evaluate
reverse signal path attenuation or signal performance. The generator provides a QAM
test signal, with selectable types, and variable output level to insure flexibility in
troubleshooting and testing upstream paths. See the Tone Generator section of this
manual starting on page 101 for details.
Page 95 (124)
Page 96

SLM 1479 User Manual
7.1 DOCSIS - Modem Setup – Settings
The DOCSIS MODEM SETTINGS menu provides sections and fields within each
section used for configuring the internal cable modem of the SLM 1479. The settings
should be configured properly prior to performing any DOCSIS measurements. The
settings insure the DOCSIS tests are configured to operate with the DOCSIS system to
be tested. From the initial DOCSIS MENU, touch the SETTINGS field in the upper left
corner of the display.
The SETTINGS screen is
divided into 3 sections
including the SEARCH
SETTINGS, TEST
SETTINGS, and IP
SETTINGS. These sections
and the settings provided
are covered in the remainder
of this section.
7.11 SEARCH SETTINGS
The SEARCH SETTINGS are important in configuring the meter's internal cable modem
as to the DOCSIS downstream channels to use to get a connection and data from the
cable's CMTS.
SEARCH - Ranging Method
There are two method used by the SLM 1479 to search for a downstream DOCSIS
channel(s). The SEARCH selection may be set to AUTOMATIC or FIXED. Touch or
Highlight the SEARCH field and use the control knob to increment to FIXED or
AUTOMATIC to select the desired method.
FIXED: When set to a FIXED ranging method, a specific DOCSIS channel must be
known and referenced for testing. It is likely that the cable system uses multiple
channels for DOCSIS. You may use any of these active DOCSIS channels for the test.
You may contact the cable provider for more specific information as to the best channel
to use. When using the Fixed method be sure that a DOCSIS downstream channel of
the cable system is selected and that the center frequency is correct for the specified
channel.
AUTOMATIC: In this mode the meter will scan the channels and search for a DOCSIS
channel on a cable system. This is helpful if the active DOCSIS channel is not known.
However, it does take a lot longer to scan and search for a DOCSIS channel which adds
considerable time to the DOCSIS testing.
Page 96 (124)
Page 97

SLM 1479 User Manual
7.12 TEST SETTINGS.
The TESTS SETTING section in the middle of the
SETTINGS MENU provides instructions for the SLM1479's
cable modem as to requirements relative to the CMTS
receive (RX) level and if you desire the cable modem to be
registered with the CMTS to complete the Ping and IP testing
measurements.
RX Level
The RX LEVEL defines the receive level required by the
CMTS. If known, set the RX LEVEL field in the DOCSIS
MENU to the value known to be the level required by the
CMTS. If the level is not known, use the default value, 0
dBmV. To select a receive level, touch the field or rotate the control knob to highlight the
RX LEVEL field and press the knob to enter the level field. Rotate the large knob to
increment or decrement the value.
The RX LEVEL is used by the DOCSIS MEASURE for determining the US channel
attenuation. The receive level in combination with the meter's modem output level are
used to calculate the value as shown in the ATT test results for the US channel. For
example, if the CMTS responds to an Upstream signal at -5 dBmV from the SLM 1479's
modem outputting 40dBmV, then the upstream attenuation is 45dB. (ATT: 45 dB).
REG. MODE
The REG MODE (Registration Mode) may be set to ON or OFF. Touch the field on the
display or rotate the control knob to highlight the REG MODE field and press the knob to
select the On/Off selection field. Rotate the knob or touch the field to increment from ON
to OFF. If you configure the registration mode to off, the SLM 1479's cable modem
during a DOCSIS test will not request registration with the system CMTS. If not
registered the PING and IP Report testing is not available and will not populate the
MEASUREMENT display section.
7.13 IP SETTINGS
The DOCSIS ADDRESS CONFIG. field provides selection
of the CMTS Address and MAC Address required for
network connection. The address can be the pinged
address (Gateway) or a user defined address. This menu
provides entry of the network address used to connect to
the cable CMTS.
The DOCSIS IP Menu configures the CMTS Gateway and
MAC Addresses required for network connection between
the CMTS and the meter's internal modem.
ADDRESS (CMTS Address)
Page 97 (124)
Page 98

SLM 1479 User Manual
This address can be the pinged address (Gateway) or a user defined address which
may be manually entered. Highlight the ADDRESS field and select the pinged address
as the current Gateway address (GATEWAY) or a user defined address (USR DEF.).
MAC ADDRESS
To access a cable system’s DOCSIS network, the SLM 1479 requires a unique MAC
address. The address can either be setup by provisining the MAC address of the meter's
internal modem by the cable administrator on the DOCSIS network or by emulating the
MAC address of an already provisioned cable modem. Therefore, the MAC ADDRESS
can be a DEFAULT value or USER DEFINED.
USER DEFINED Address
The CMTS Address and the MAC address may be user defined. Each couple of the
hexadecimal digits in the value can be highlighted and entered from “00” to “ff”. To do
so, set the address to “User Def.” and touch the individual 2 digit fields in the MAC
address fields. A popup menu appears to enter the digit values. Enter values in each 2
digit group until the desired address value is entered.
7.2 DOCSIS MEASURE
Prior to performing the DOCSIS MEASUREMENTs requires proper setup of the modem
and CMTS address. Please perfrom MODEM SETUP and ADDRESS CONFIG prior to
performing the DOCSIS MEASUREMENTS as explained in the previous section 7.1.
There are 3 fundamental and automated steps performed by the DOCSIS test when
performing the DOCSIS MEASUREMENTs.
1. Modem reboot - Establish a downstream channel(s). (SELECT CMTS DOWN
STREAM CHAN)
2. Establish a connection/authorization/registration with the CMTS (CONNECTING
TO CMTS)
3. Perform DOCSIS Measurement tests including:
a. Downstream Channel(s) performance report information
b. Upstream Channel (s) performance report Information
c. PING Report based upon file transfer data to and from CMTS
d. IP Report based upon network IP address/gateway assignments
These steps are automated by the DOCSIS test of the SLM1479 and do not require any
user action. You may observe the progression of the automated connecting process by
viewing the upper middle section of the DOCSIS testing screen below the DOCSIS
MEASURE field.
7.21: DOCSIS Downstream & Upstream Channel Search Mode
To begin DOCSIS testing touch the DOCSIS MEASURE field at the top center of the
display. Or rotate the large conrol knob until the field is highlighted and press the knob
in to select and start the DOCSIS testing.
Page 98 (124)
Page 99

SLM 1479 User Manual
When the DOCSIS test is initiated it begins an automated process inwhich the internal
cable modem of the meter is initialized (Rebooted) and connection ot the cable
company's CMTS is attempted. Once connected and authorized the automated testing
continues until the downstream (DS) channel measurements and upstream (US)
channels are established and test measurements completed.
Additional PING REPORT and IP CONFIGURATION measurement sections and data is
provided. Progress or steps within the automatic DOCSIS test is reported by the meter's
MODEM STATUS indications on the second line down from the top in the DOCSIS
MEASURE menu. The following section provides a summary of the DOCSIS
measurements provided.
7.22 DOCSIS Measurements
The DOCSIS MEASUREMENT page show all the test progress and parameters
regarding the DOCSIS network and its performance.
Page 99 (124)
Page 100

SLM 1479 User Manual
DOWN STREAM (DS) CHANNEL MEASUREMENT Report
After the meter's cable modem is connected to the CMTS the DOWN CHAN or DOWN
STREAM (DS) sections are populated. There may be one DS section shown with
populated measurements or up to eight sections depending on the downstream channel
bonding of the DOCSIS system. Each of the channel sections indicates specific
performance data regarding that DOCSIS down stream channel.
The down stream DOCSIS channel performance measurements include the include the
frequency modulation constelation type, symbol rate, average power, MER, BER and
Block Errors.
FR: Frequency center of the downstream DOCSIS channel
QAM: Modulation constellation of the downstream DOCSIS channel
SR: Symbol Rate of the downstream DOCSIS channel
Pow: Channel Average Power of the downstream DOCSIS channel
MER: Modulation Error Ratio measurement of the downstream DOCSIS channel
bBER: Bit Error Ratio before FEC applied of the downstream DOCSIS channel
aBER: Bit Error Ratio after FEC applied of the downstream DOCSIS channel
ERR: Packet Error counter indicating downstream DOCSIS channel errors
UPSTREAM CHANNEL (US) MEASUREMENT Report
The DOCSIS UPSTREAM (US) analysis is provided at the bottom section of the
DOCSIS MEASUREMENT screen upon connection to the CMTS. This section shows
upstream DOCSIS channel information. Imformation includes the modulation type,
frequency, symbol rate, transmit level of the meter, and attenuation from the meter to the
CMTS as reported by the CMTS and calculated by the meter using the known TX level.
Page 100 (124)
 Loading...