

Page 1
Working in Easy mode
5.5 Evaluating the measured data
You can use the Commander to view the measured data read out from a logger and to
analyse it in greater detail.
5.5.1 Calling up the measured values
To call up the measured data of a logger, proceed as follows:
Step Description
1
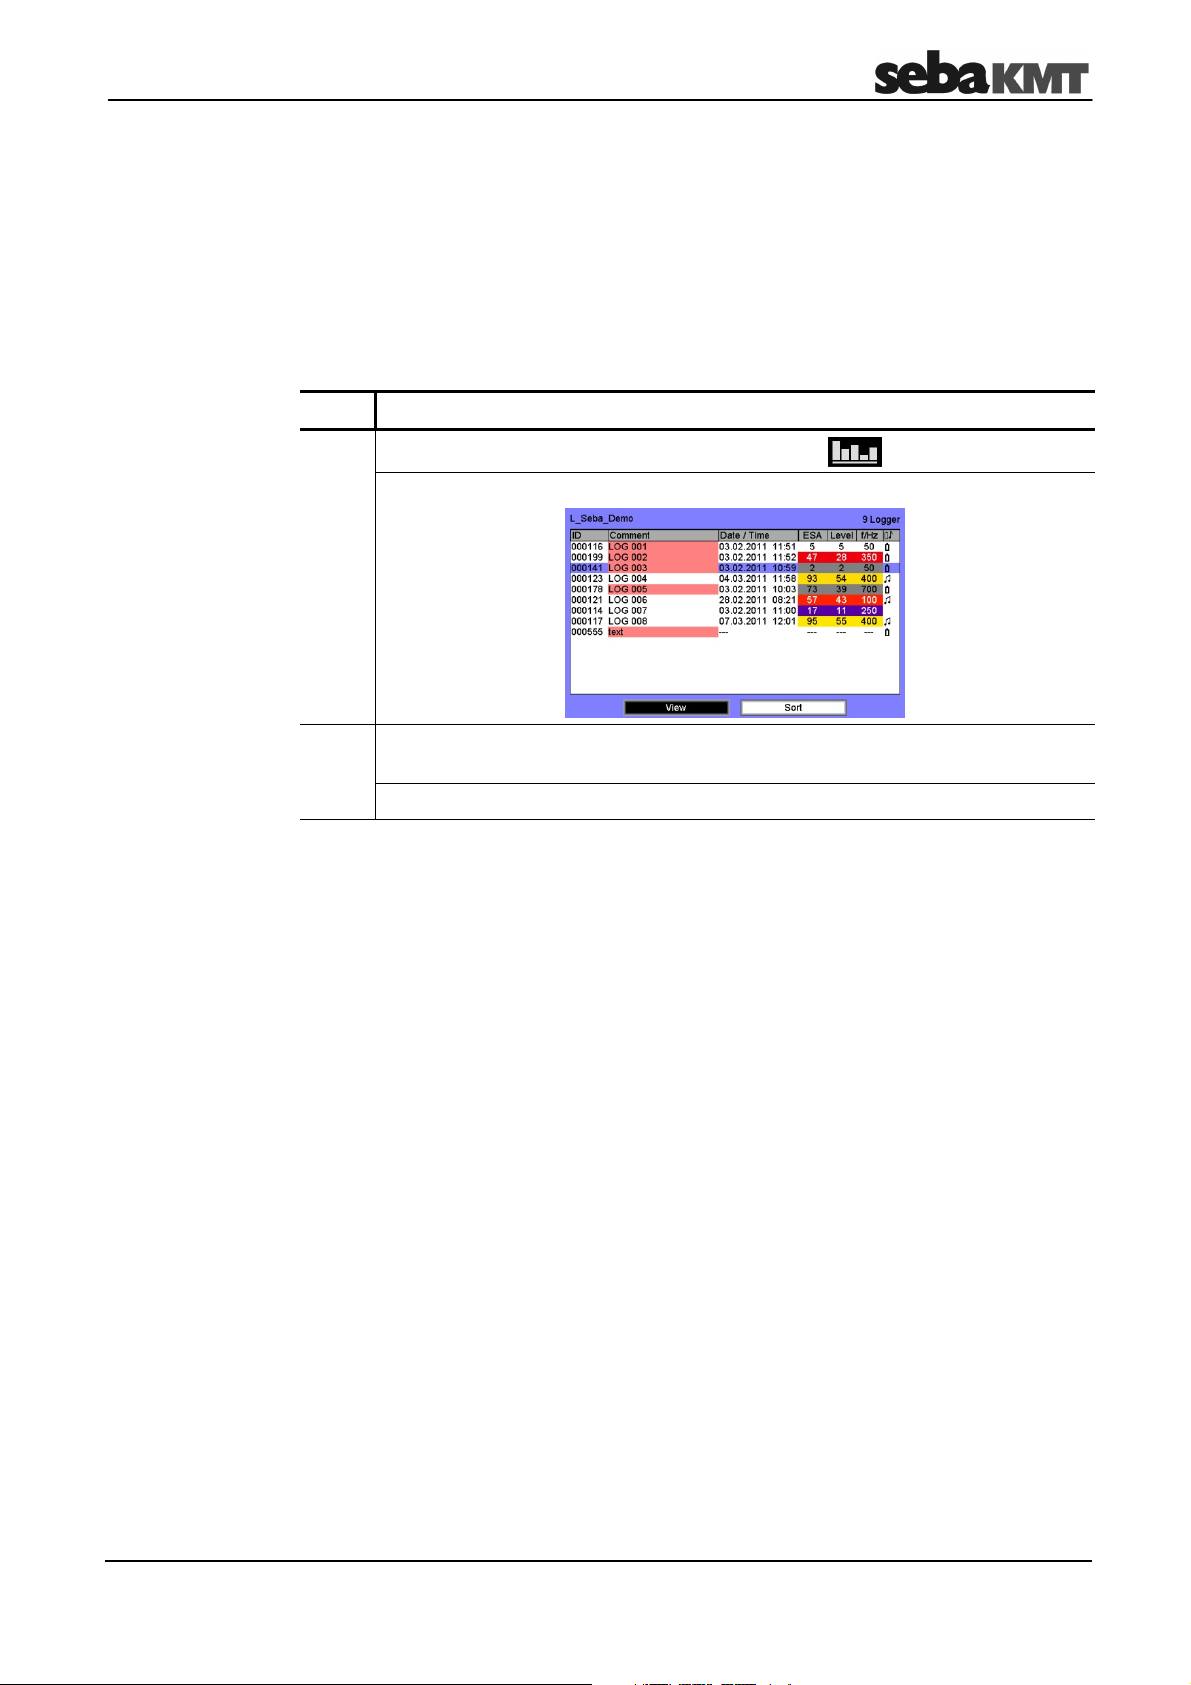
In the main menu, select the Display logger data button.
Result: The loggers in the workgroup are listed in the next view.
2 Call up the data of the highlighted logger using the View button or select
another logger in the list.
Result: The logger’s measured data is shown (see page 42).
41
Page 2
Working in Easy mode
4
3
2
1
5.5.2 Displaying the measured values
View
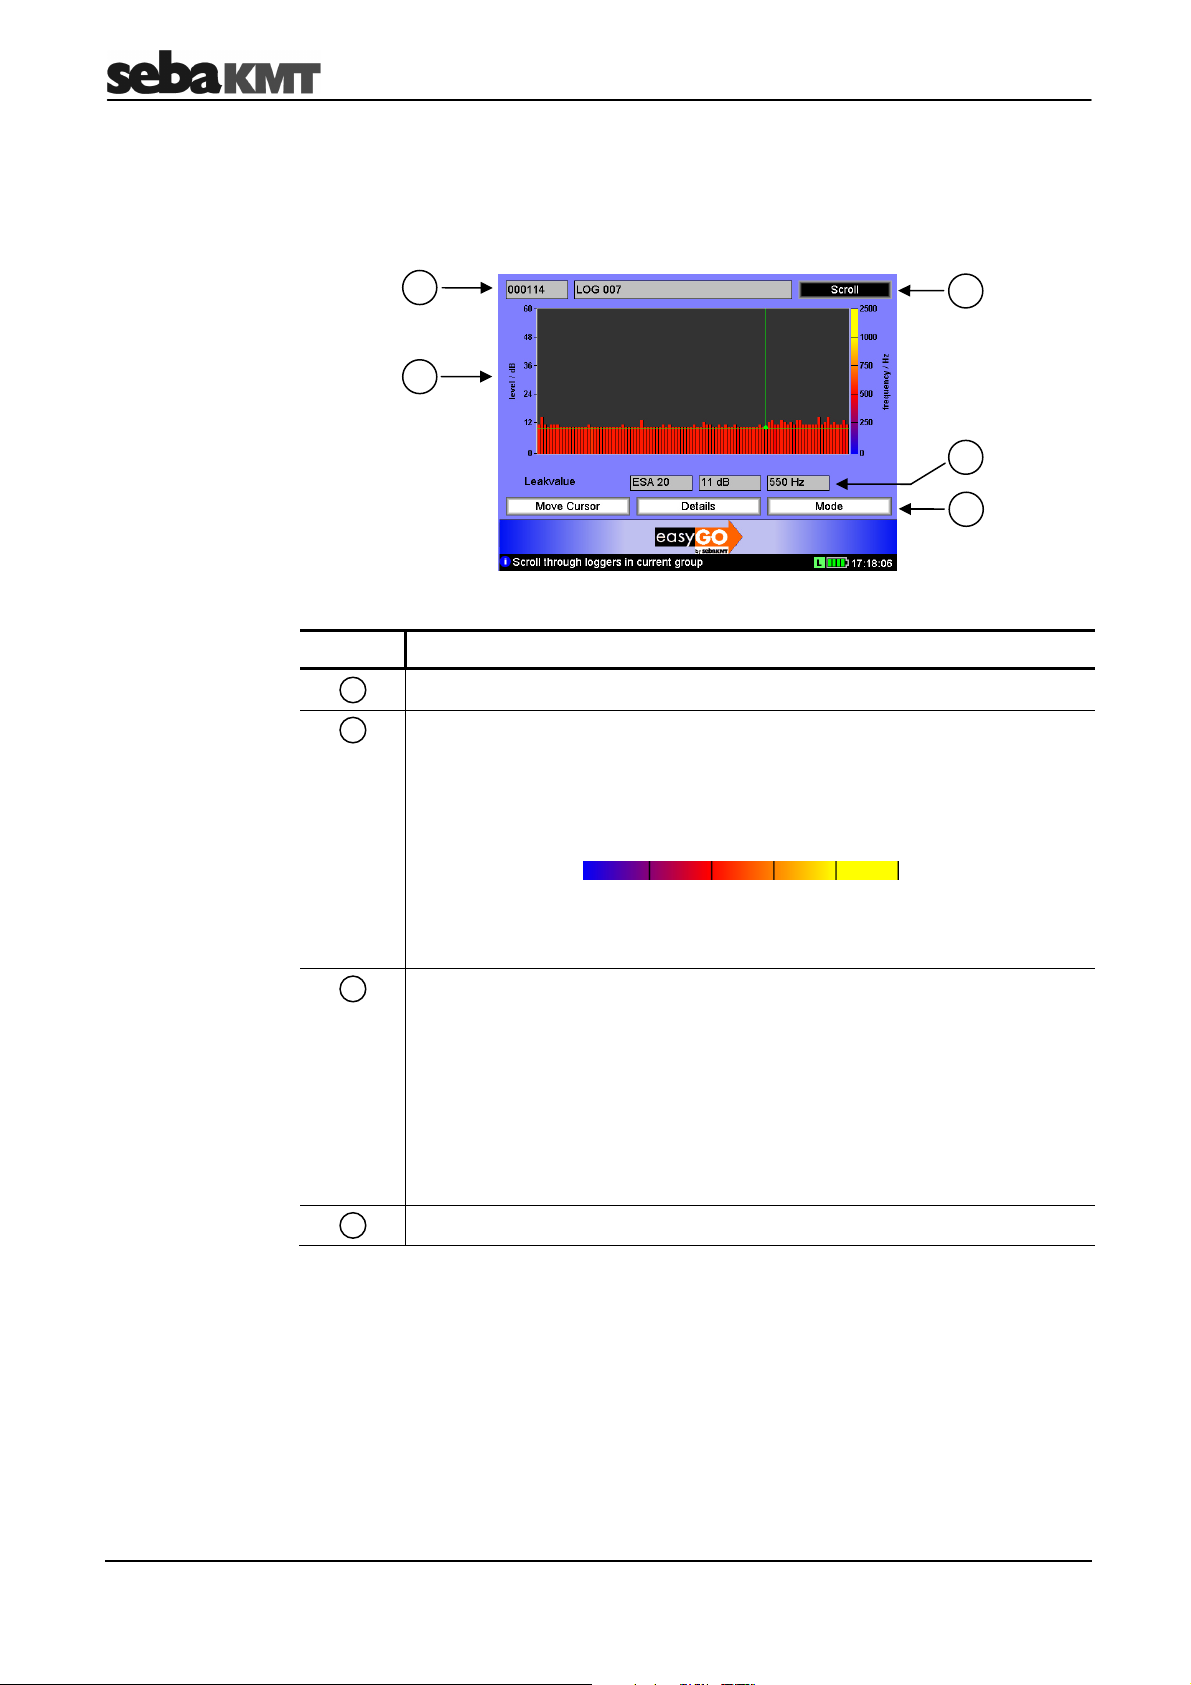
The measured data from the loggers are shown as a bar diagram on the screen.
1
4
2
3
4
Element Description
Identification number and comment of the displayed logger
Diagram
Each bar represents a single noise recording.
X-axis ... course of measurement over time
Y-axis ... noise level in dB
The colour of the bar shows the approximate frequency of the noise.
Blue
0 Hz
Yellow
2,500 Hz
The point where the two green lines intersect marks the quietest recording in
the displayed measurement, the so-called “leak value”.
Leak value (lowest value to be displayed)
The leak value refers to the quietest recording in the displayed measuring
period. The values of this recording are shown in the three fields directly
under the diagram:
Left-hand field … ESA value of the recording
Centre field … Noise level in dB for the quietest measurement
Right-hand field … Frequency of the noise in Hz
Buttons to access individual functions (see below)
42
Page 3
Working in Easy mode
Functions
There are the following functions for analyzing the displayed data:
Button Description
Scroll
You can use this function to view in the diagram the measurement
results of the other loggers in the group.
To do so, apply the button and turn the selector knob to select a logger.
Apply the button again to confirm your selection.
Move
Cursor
You can use this function to move the vertical green line in the diagram
from one bar to the next. The values of the particular noise measurement
(volume, frequency, ESA) and the time of the recording are shown.
To do so, apply the button and turn the selector knob. Apply the button
again to end the function.
Details
This function opens a new window on the screen. It shows the
configuration data of the particular logger at the time of the measurement.
You can use the Scroll button to view the configuration data of the other
loggers in the group. Use the OK button to return to the measured data
display.
Mode
You can use this function to change the measurement unit on the Y-axis
in the diagram.
Standard view … The Y-axis shows the volume of the noises. Each bar
in the diagram represents a single recording.
ESA view
… The Y-axis shows the ESA value.
Each bar represents the quietest recording of a
measuring day.
43
Page 4
Working in Professional mode
6 Working in Professional mode
6.1 Starting up the Commander
6.1.1 Switching on the Commander
Switching on
Changing the
user mode
Changing the language
Use the I/O button to switch on the Commander.
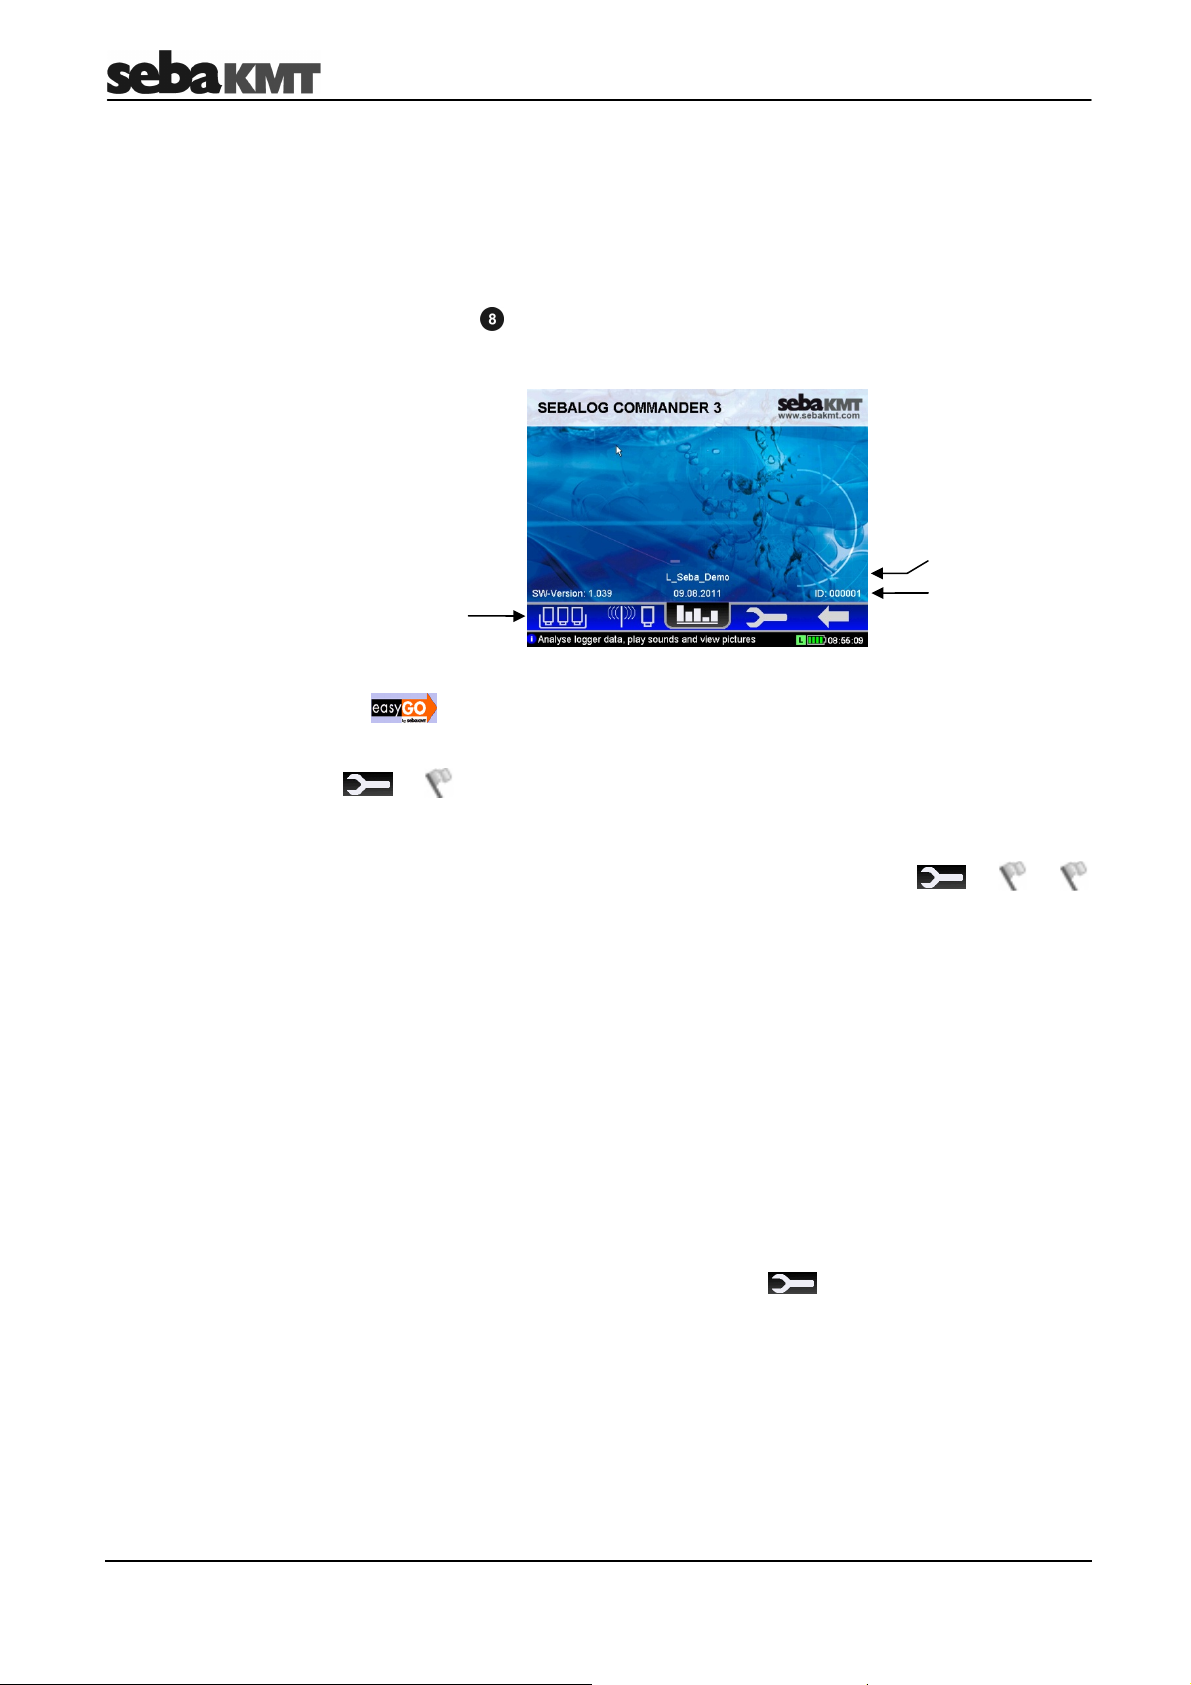
The Professional mode start image appears on the screen:
Workgroup
Firmware version,
Main menu bar
If the symbol is shown at the bottom in the middle of the screen, the
Commander is not in Professional mode but Easy mode instead. To switch to
Professional mode, open the system settings menu. Beginning at the start screen, follow
the symbols and, in the first line of the menu, select the “Professional
mode” setting from the list.
The screen might not be displaying the correct language. The language can be changed
in the system settings. Beginning at the start screen, follow the
symbols and select your language from the list.
System date,
Identification number of
the Commander
6.1.2 Checking the system settings
Before a measuring session, check that the Commander’s system settings are up-todate and correct (see page 25). The date and time settings in particular must be correct.
6.1.3 Registering loggers in the Commander and specifying the
workgroup
The loggers to be used for an impending measurement must be registered and
combined in a group (see page 23) in the Commander.
To specify the workgroup (see page 14), select the symbol in the main menu bar,
open the Group Management menu and select a group in the list of registered logger
groups (marked with an X).
However, a lot of menus in Professional mode also have a drop-down list at the very top
of the screen. It can be used to access a group list directly and select a workgroup.
44
Page 5
Working in Professional mode
6.2 Managing the loggers
All loggers to be used for a measurement must be registered in the Commander
beforehand. Only registered loggers can be programmed and read. Registration is
performed either by manually inputting the logger ID or by automatic wireless detection.
The registered loggers are combined in groups.
6.2.1 Managing logger groups in the Commander
Introduction
Managing groups
Defining a workgroup
Creating a new group
All loggers registered in the Commander must be assigned to a group. The Commander
can only communicate with one of the logger groups created, the so called “workgroup”
(see page 14).
Logger groups can be created, deleted, copied and renamed directly on the
Commander.
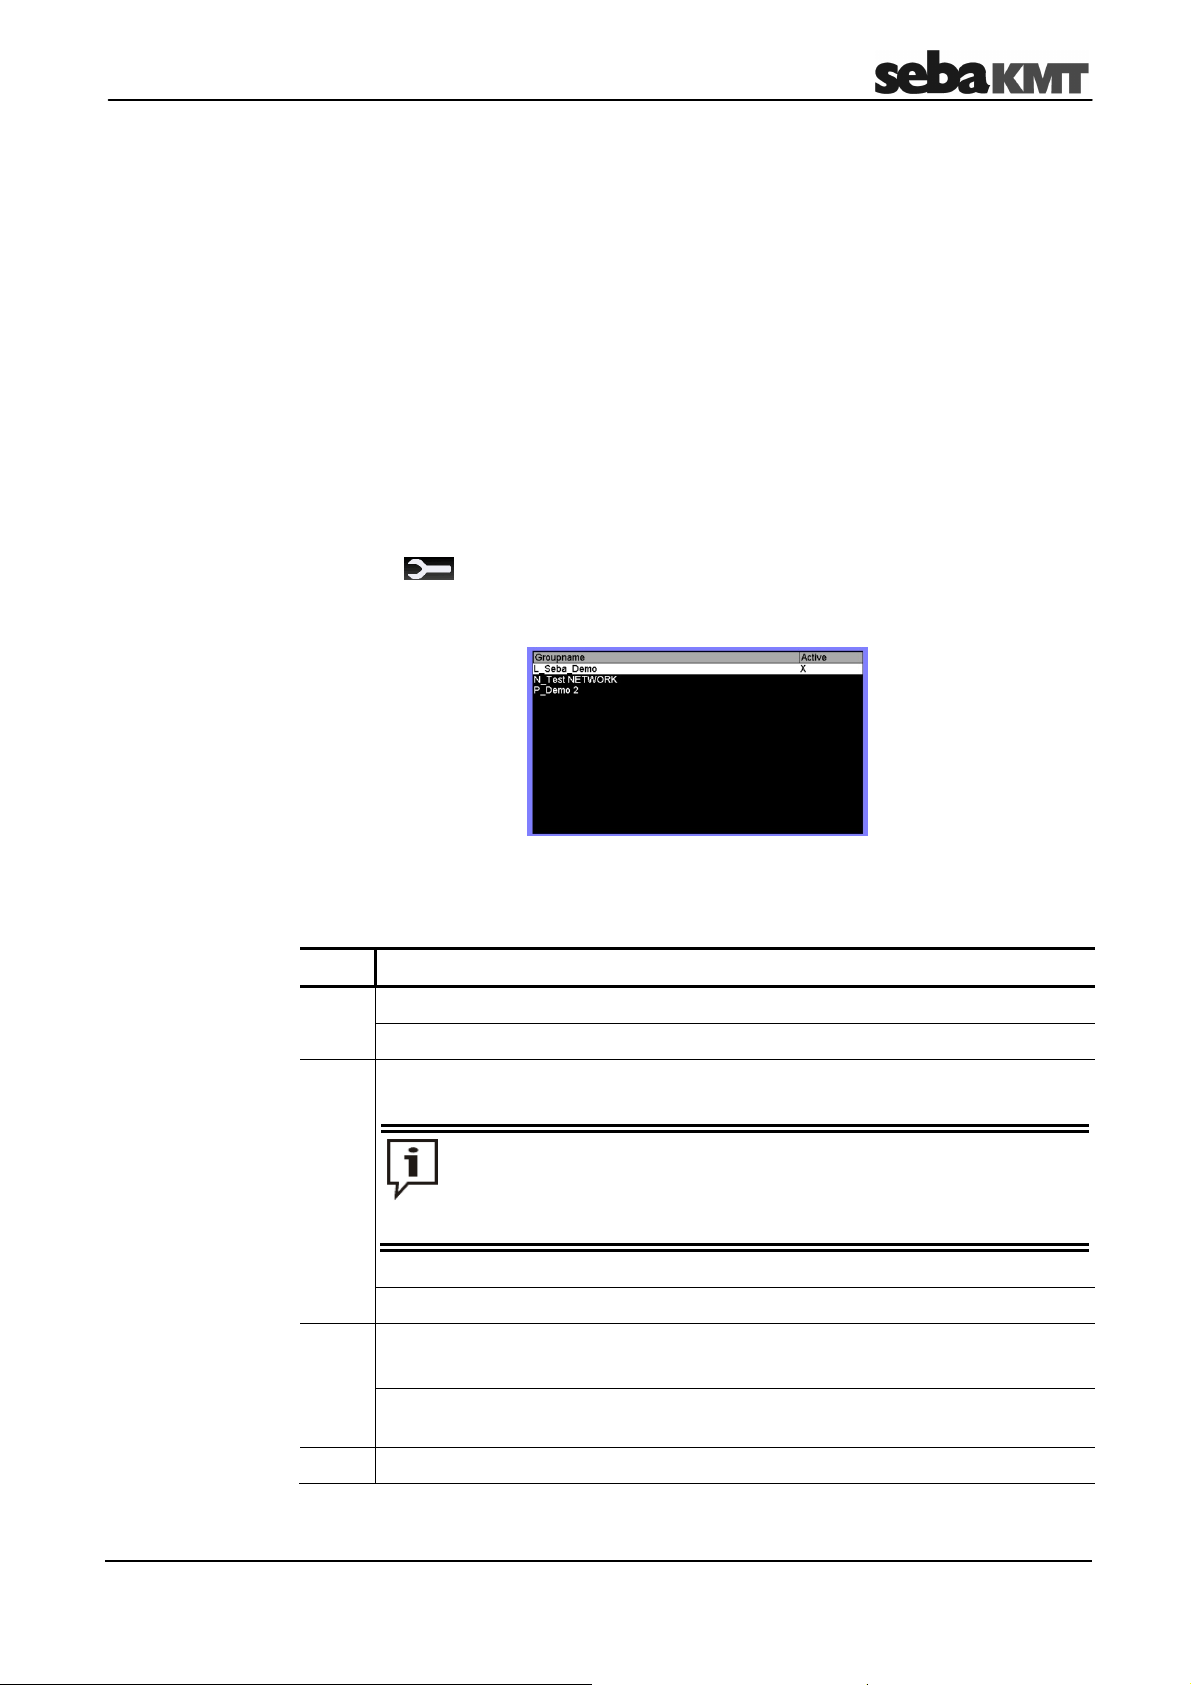
Select the symbol in the main menu, and the Group Management button in the
next view, to go to the menu for managing logger groups. All the registered logger
groups are listed.
The workgroup is marked with an X in the view. To turn another logger group into the
workgroup, select the list and then a group.
To create a completely new logger group in the Commander, proceed as follows:
Step Description
1 Select the Add button.
Result: A new view opens.
2
Select the group mode (see page 13) for the new group and confirm with OK.
After the group is created, the group mode can no longer be changed.
All loggers in a group must belong to the same group mode as the
group itself (e.g. a “Lift&Shift” group may only contain “Lift&Shift”
loggers).
Result: A new view opens.
3
Enter a name for the new group. Use the virtual keyboard for this.
To complete the input, select the ENTER button.
Result: The new group is now created in the Commander. The display jumps
automatically to the Logger Management menu.
4
Use this menu to assign loggers to the newly created group (see page 47).
45
Page 6

Working in Professional mode
Renaming a group
Copying a group
Deleting a group
You can rename an existing logger group.
First select the particular group in the list and then select the Rename button. In the
following screen views, enter a group mode (see page 13) and the new name of the
group.
The group then appears with the new name in the group list.
You can copy an existing logger group, with all its loggers, within the list and allocate a
new name and new group mode to this copy. (This can be useful if, for example, you
wish to use the loggers of an existing “Lift&Shift” group for the next measuring
assignment, but would like to read out data by “Patrolling”.) The new group
automatically adopts the configuration data of the original group but contains no
measured data at all.
First select the particular group in the list and then select the Copy button. In the
following screen views, enter the group mode (see page 13) and the name of the new
group.
The new group then appears in the group list. If needed, more new loggers can now be
allocated to it (see page 47).
You can delete a logger group from the Commander.
First select the particular group in the list. Then select the Delete button and answer the
confirmation query with Yes.
If the loggers in this group are not contained in any other existing groups, deleting
simultaneously de-registers them from the Commander. The measured data of the
group is retained in the history as long as the “History” function is active (see page 26).
Otherwise the data will be lost.
46
Page 7
Working in Professional mode
6.2.2 Managing the loggers in the Commander
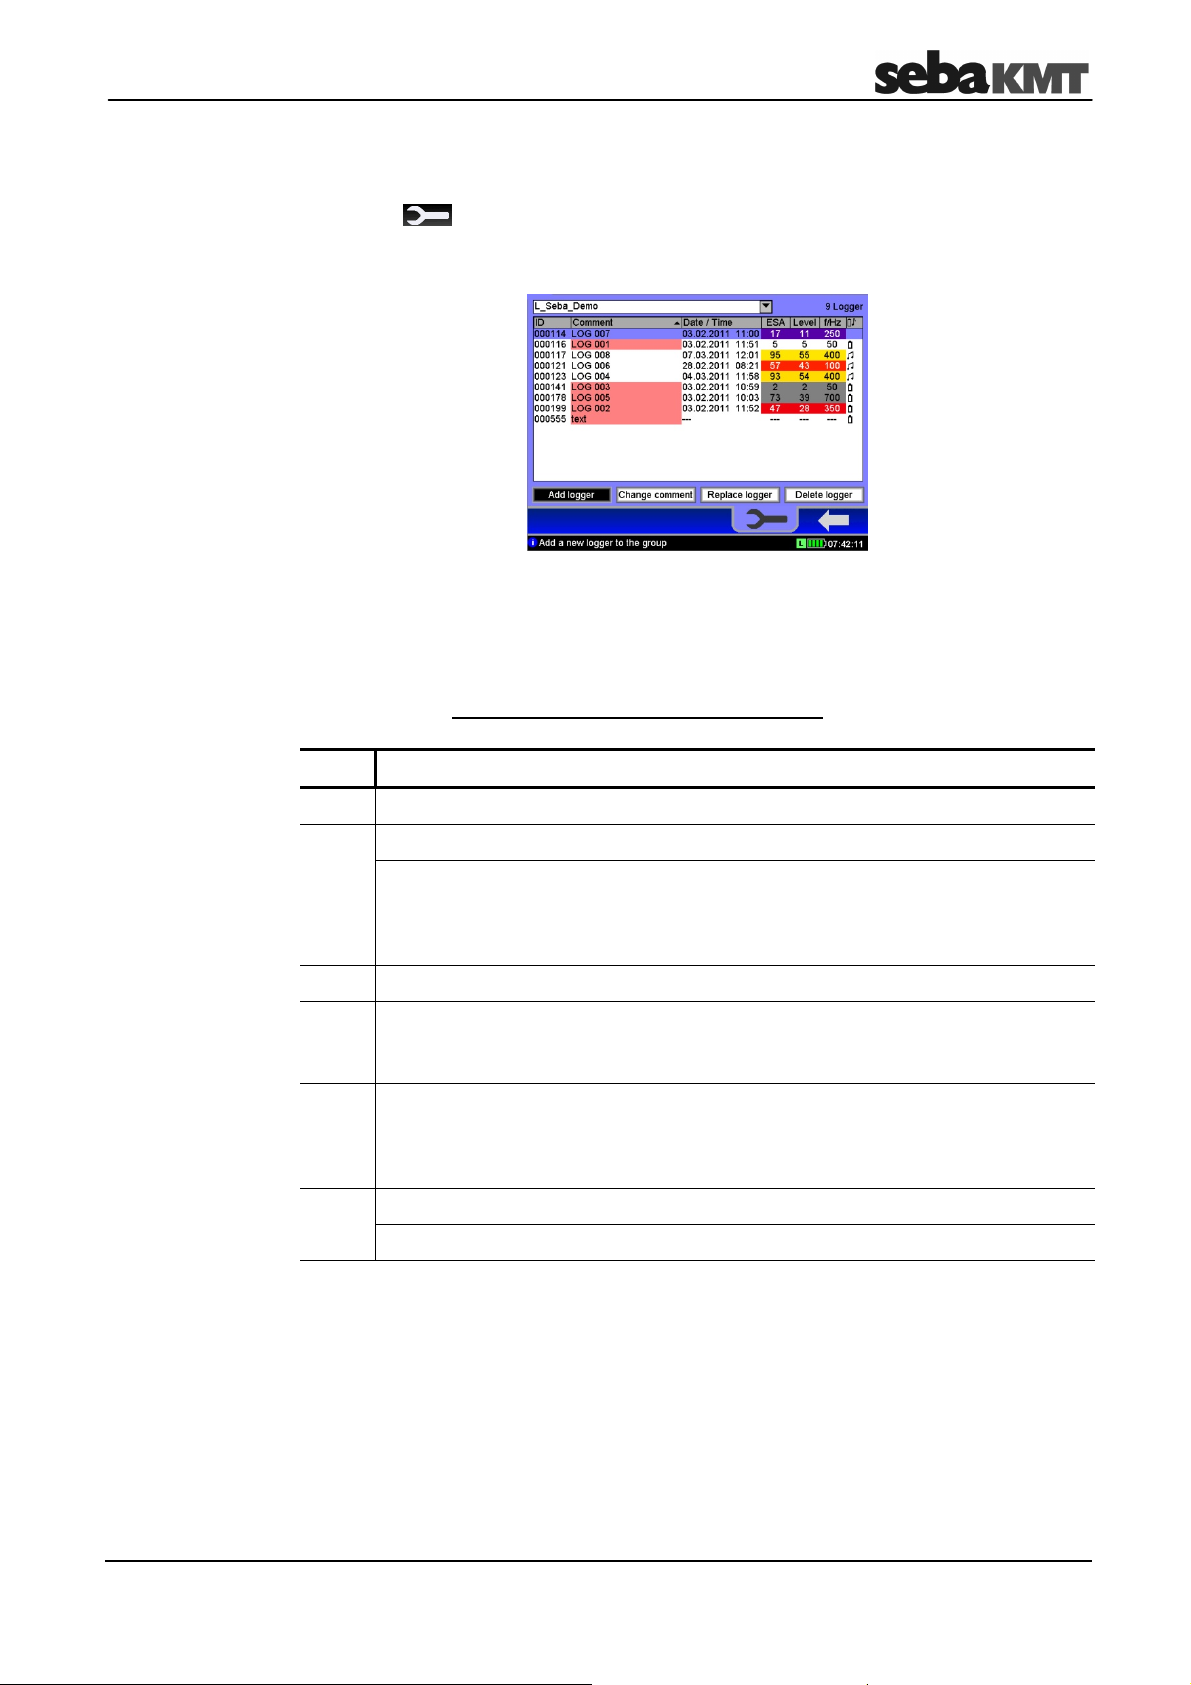
Select the symbol in the main menu, and the Logger Management button in the
next view, to go to the menu for managing loggers. The loggers of the workgroup (see
page 45) are listed.
If the incorrect group is displayed, you can use the pull-down menu at the top edge of
the screen to change the workgroup.
If you do not wish to allocate a new logger to an existing but to a completely new group
instead, this new group must be created beforehand (see page 45).
Registering loggers
using automatic
detection
A logger can be registered using “automatic detection”. For this purpose, it has to be
close to the Commander and switched off. Proceed as follows:
Step Description
1 Apply the Add logger button.
2
Switch the logger on.
Result: Directly after it is switched on, the logger sends a signal with its
identification number a few times. Once the logger is detected by the
Commander, New ID found appears on the screen. The ID of the logger is
displayed underneath.
3 Select Accept to add the logger to the group or Decline to discard it.
4
If you want to number the loggers consecutively, stick the supplied selfadhesive label with the number of the automatically assigned comment on the
logger (see below).
5
Use the same method to add all the other new loggers to the group. When
loggers need to be switched on, always bring them close to the Commander
singly. This is because only the last detected ID is shown on the screen and
able to be registered.
6 Apply the Finish button to complete the procedure.
Result: The registered loggers are now shown in the list.
47
Page 8
Working in Professional mode
Registering loggers
manually
Numbering loggers
Changing a comment
A logger can be registered manually by entering its ID. Proceed as follows:
Step Description
1 Apply the Add logger button.
2
Type in the logger’s six-digit ID using the displayed keyboard (see page 14).
Confirm the input with the ENTER button.
Result: The registered logger is now shown in the list.
3
If you want to number the loggers consecutively, stick the supplied selfadhesive label with the number of the automatically assigned comment on the
logger (see below).
4
To add further loggers to the group, repeat steps 1 to 3.
A comment is automatically left on every logger, when it is registered. The first
registered logger gets the comment “LOG001”, the second one “LOG002” and so on.
This way, the loggers of a group are consecutively numbered.
Self-adhesive labels with the same numbers come supplied. Sometimes it can be
helpful to put the labels, with the relevant numbers, on the loggers directly after
registration. Thus, the loggers can easier be identified on-site.
You are able to change the automatically assigned comment of a logger in the displayed
group. Proceed as follows:
Exchanging loggers
Step Description
1
Select the logger in the list to change its comment.
2 Apply the Change comment button and use the displayed keyboard to change
the text in the following view.
Confirm the input with the ENTER button.
Result: The changed comment is now shown in the list.
You are able to delete a logger in one step from the displayed group and to replace it
with another logger. This may be necessary if, for example, an individual logger
develops a fault and needs to be replaced with a new one. Proceed as follows:
Step Description
1
Select the logger that needs to be replaced in the list.
2 Apply the Replace logger button and use the displayed keyboard to enter the
ID of the new logger to be put in the group.
Result: The new logger appears in the list instead of the old one.
If the old logger is not contained in any other existing group, deleting simultaneously deregisters it from the Commander.
The measured data of the old logger is deleted within the group. However, it is retained
in the history as long as the “History” (see page 26) function is active. Otherwise the
data will be lost.
48
Page 9

Working in Professional mode
Deleting loggers
You can delete a logger from the displayed group. Proceed as follows:
Step Description
1
Select the logger in the list.
2 Apply the Delete button and answer the confirmation query with Yes.
Result: The logger is no longer contained in the list.
If the logger is not contained in any other existing group, it is simultaneously deregistered from the Commander.
The measured data of the logger is deleted within the group. However, it is retained in
the history as long as the “History” (see page 26) function is active.
49
Page 10

Working in Professional mode
n
6.3 Programming the loggers
Introduction
Opening the
configuration window
Each logger must be configured before each measuring session. They are assigned
with all the relevant parameters before the impending measurement.
Even loggers that have already been programmed and installed can usually be
reprogrammed. However, to save power, all loggers in group mode “Patrol” can
only receive the Commander’s signal every 10 seconds, even in the time when
they are ready for wireless operation. It can therefore take a very long time to
program these loggers.
Where possible, we recommend that all the loggers are changed to configuration
mode before programming, i.e. to switch them off for at least 3 minutes and then
to switch them back on again. Loggers can be reliably programmed in
configuration mode.
Proceed as follows to open the configuration window for a logger:
Step Description
1
Select the symbol in the main menu bar.
2 In the next menu, select the Program Logger / Group button.
Result: The menu for logger programming opens. The loggers in the current
workgroup are listed here.
If you would like to program loggers not in the workgroup, you can use the drop-
down list at the very top of the screen to call up another registered logger
group.
3
If you wish to program all the loggers i
the displayed group, apply the
Prog. Group button.
Result: The input window for configuring the loggers opens on the screen.
If you wish to program a single logger
in the group, first select the list and
then choose the logger. Then apply the
Prog. Single button.
50
Page 11

Working in Professional mode
Measuring parameters
The following parameters must be stated in order to define the measuring window:
Parameter Description
Measurement
(from … to)
Beginning and end of the daily measuring window.
Select from: 0:00 to 24:00 hours
Default: 2 a.m. to 4 a.m.
Explanation: The logger performs measurements and saves the
measurement values within the stated window. Interference from
background noise (traffic, water use, etc.) should be at a minimum at
this time.
Values per
measuring
window
Number of saved measured values per day.
Select from: All 100 measured values or the 50/20/10/5 lowest values
of the measuring window
Default: 50
Explanation: A logger performs 100 measurements in each measuring
window. A maximum of 100 pairs of values (noise level and frequency)
can be saved in the internal memory. The pull-down menu is used to
specify whether all 100 measured values in the logger are to be saved
or just the lowest 50/20/10/5 values in the period.
If, for example, “100 pairs per measuring window” is specified, the
logger must be read after each measuring day so that no measured
data is overwritten in the subsequent day.
If “20 measurement values per measuring window” is specified, the
logger only has to be read after 5 measuring days.
Leak
threshold
value
Measuring
days
(Mon to Sun)
Noise level from which to classify a noise as a leak.
Select from: 0 to 60 dB
Default: 10 dB
Explanation: If the lowest measured noise level in a measuring period
is above this threshold, this is an indication to the user that there is a
leak in the pipe system. Loggers where the threshold is exceeded are
pointed out in particular during the data read-out and analysis.
Experience shows that it is often sensible to have a value of
10 dB as the leak threshold.
In order to gain an impression of the average noise level in the
pipe and to gauge whether the default leak threshold of 10 dB
is too high or too low, one possibility would be to perform a real
time measurement before programming the loggers at the
place of use (see page 58).
If, during the first few measuring days, the selected leak
threshold is always far too low or far too high, you should once
again reprogram the loggers concerned and adjust the leak
threshold.
Days of the week when measurements are to be taken.
Select from: Monday to Sunday
Default: Monday to Sunday
Explanation: No measurements are performed on the other days.
51
Page 12

Working in Professional mode
Radio parameters
Continuous wireless availability and frequent wireless exchange of data have a
detrimental effect on the lifetime of a logger’s battery. To spare the battery, the periods
of wireless availability and activity can be restricted. To do this, the following parameters
must be entered:
Parameter Description
Radio signal
(from … to)
Beginning and end of the daily transmission window.
Select from: 0:00 to 24:00 hours
Default: 9:00 to 15:00 hours (in group mode “Patrol”) or
8:00 to 17:00 hours (in group mode “Lift&Shift”)
Explanation: The logger is ready to receive during this time and can
be configured or read. Furthermore, when a logger is in group mode
“Patrol”, it regularly transmits packets with measured data during this
time.
It is not possible to communicate with the logger outside the
given transmission window.
Transmission
interval
Transmission interval in “Patrol” mode.
Select from: 2/3/4/5/10/15 seconds
Default: 4 sec.
Explanation: Number of seconds after which a logger in group mode
“Patrol” repeats the transmission of the recorded measured data
(during the time span entered in radio signal only!).
The shorter the transmission interval, the faster a logger is detected by
the reading device as it passes by. However, long transmission
intervals spare the battery of the logger.
Battery symbol
Transmission
days
(Mon to Sun)
Days of the week when the set transmission window applies.
Select from: Monday to Sunday
Default: Monday to Friday
Explanation: It is not possible to communicate with the logger on the
other days of the week.
The colour of the battery symbol on the bottom left of the input window indicates how
much the entered configuration will affect the service life of the logger’s battery.
Green … battery lifetime not or hardly affected
Yellow … battery lifetime badly affected
Red … battery lifetime very badly affected
If the factory-set, default configuration is used, a noise logger can be operated for about
5 years without interruption. Any extension of the measuring window or transmission
window reduces the battery’s life accordingly.
52
Page 13

Working in Professional mode
Continuing
programming
Proceed as follows to continue the programming process:
Step Description
1
Enter the data in turn for the group or the single logger.
2 Apply the Program button in order to finish the programming.
Result: The configuration data is
transferred from the Commander to the
group.
A new view opens on the screen with
two windows:
The left-hand window shows the
loggers in the group that have been
successfully programmed.
The right-hand window shows the
loggers that have yet to be
programmed.
The antenna symbol indicates that the
Commander is wirelessly operational.
The Stop and Start buttons can be
used to cancel and continue the
procedure at any time.
Data transfer ends automatically once
all the loggers in the group have been
successfully programmed.
Result: The configuration data is
transferred from the Commander to the
individual logger.
A blue bar shows the progress of the
data transfer.
From now on, do not place the loggers on their head because switching
off would cause them to lose their configuration data and they would
need to be reprogrammed.
If a logger could not be programmed, it may have been switched off, not ready
for wireless operation or it was outside the Commander’s wireless range.
The loggers are now ready to be installed for use on location.
6.4 Installing the loggers
You can find detailed information on installing the loggers in the previous chapter (see
page 35).
53
Page 14
Working in Professional mode
6.5 Reading out the measured data
After a group has been installed for at least one measuring day, the recorded data can
be called up with the Commander.
The same group mode for which the workgroup was configured is used (see page 13).
Furthermore, you can always read just a single logger instead of a group.
6.5.1 Quick query of the workgroup
The button on the very left of the main menu bar is always used as a quick-start button
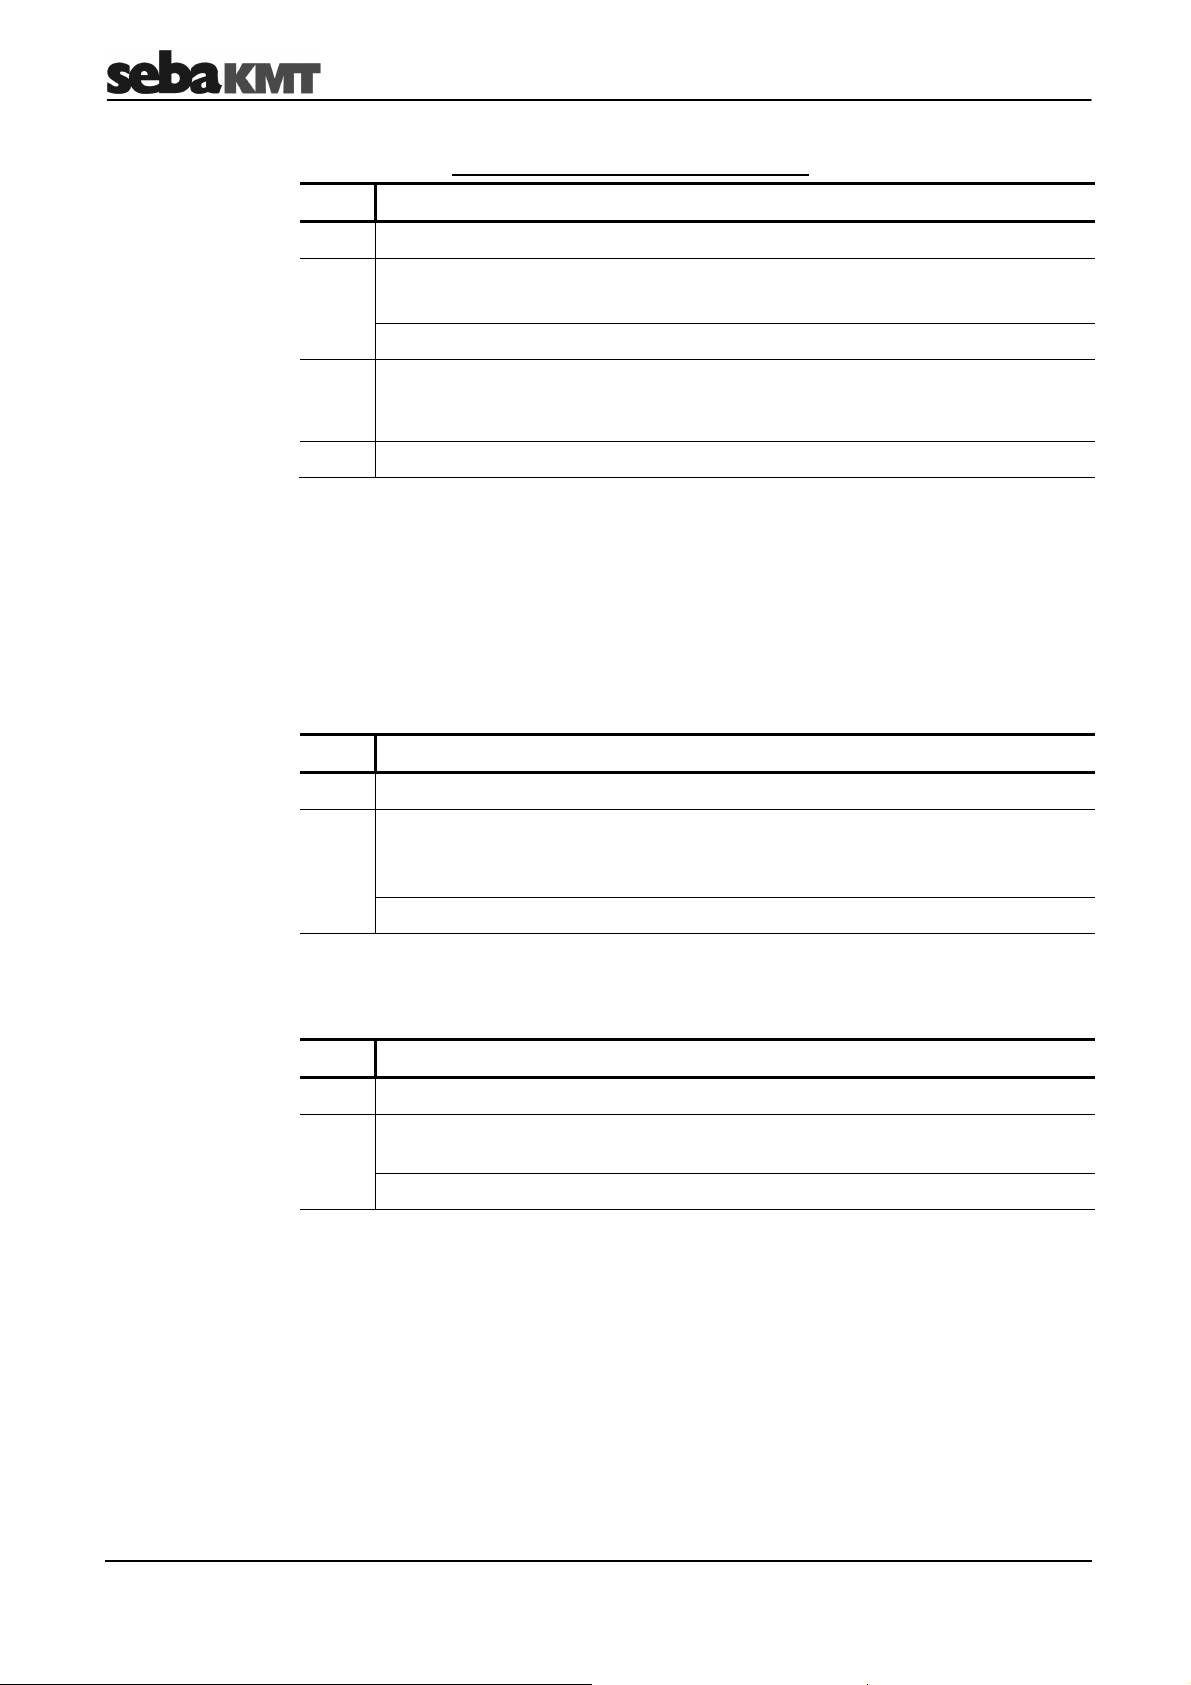
for reading the workgroup. Depending on the workgroup’s group mode, the quick-start
symbol is as follows:
Starts reading a
“Lift&Shift” group
When this button is applied, reading immediately begins for the current workgroup.
Make sure a wireless connection with the loggers or the GSM-Box can be established.
The Commander and logger are connected and the measured data is transferred.
Starts
“Patrol”
Starts reading data of a
“Network” group
from the GSM-Box
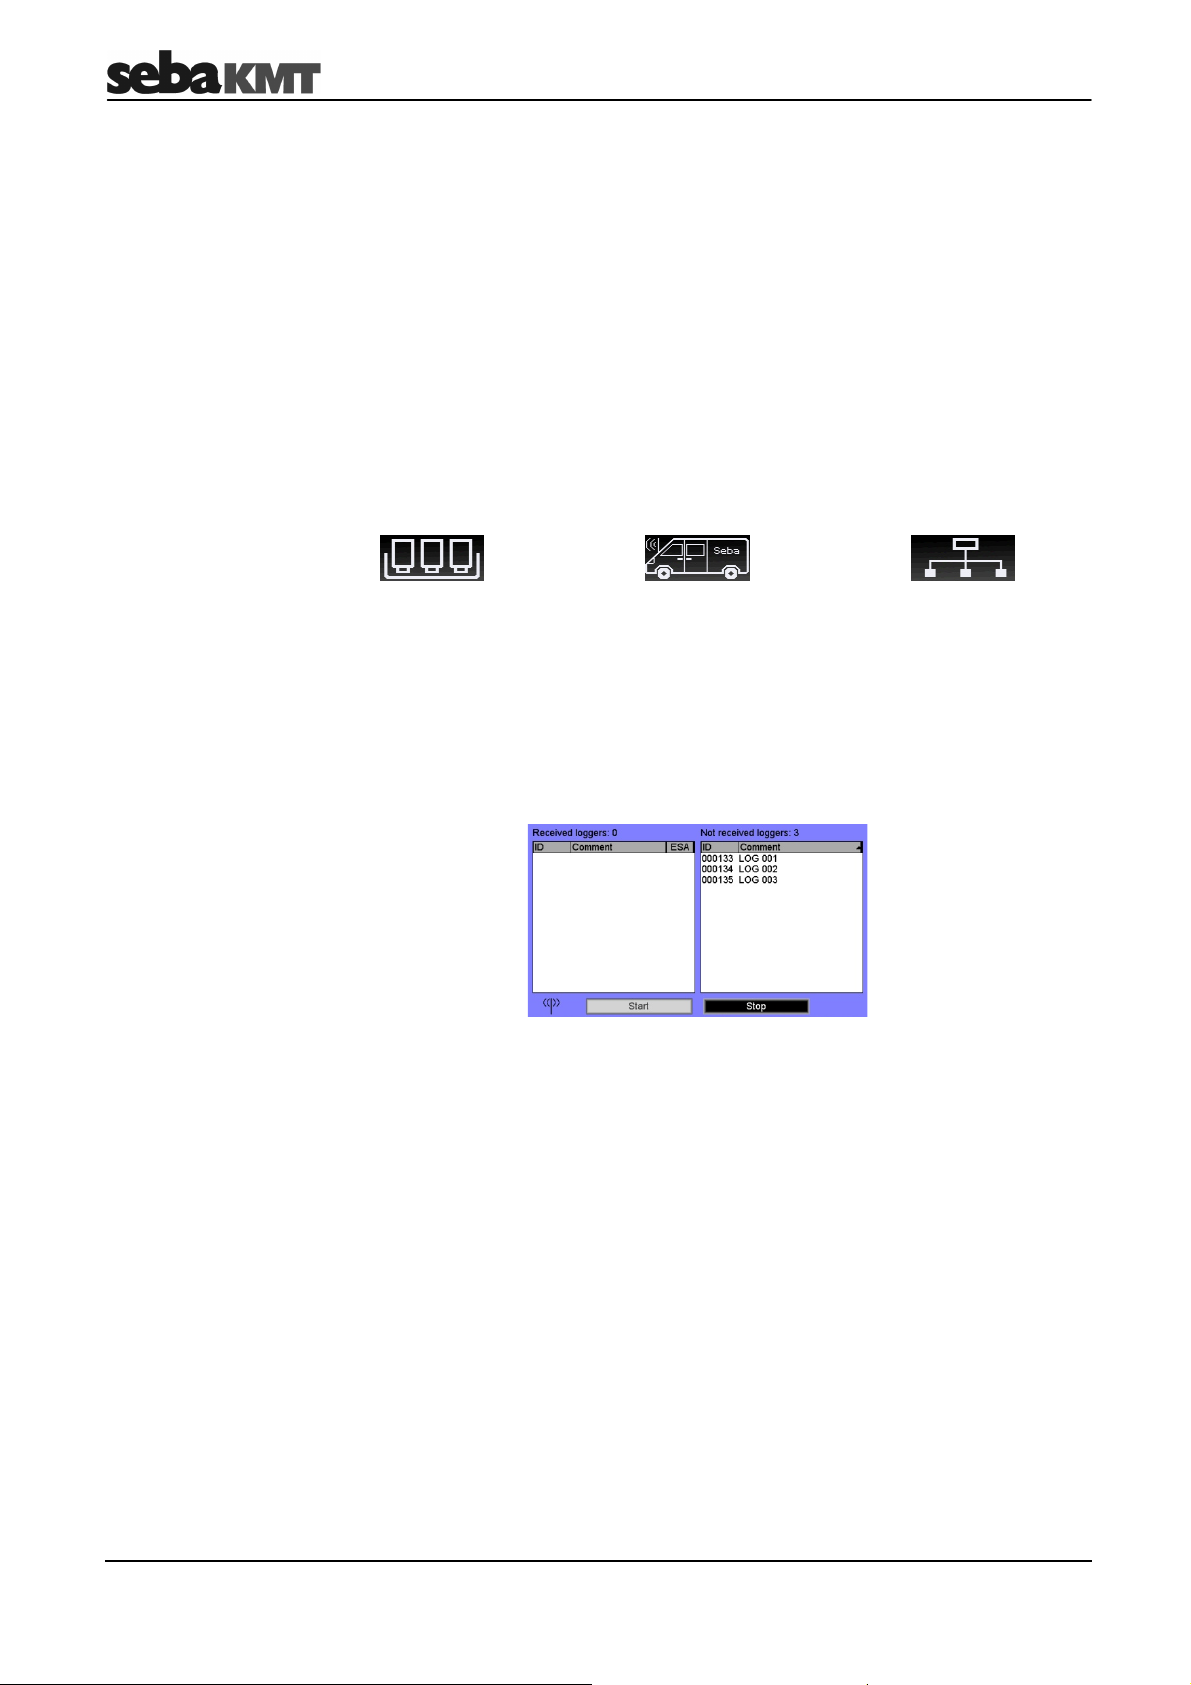
The following view opens:
The left-hand window shows the loggers in the group that have been successfully read.
The right-hand window contains all the loggers that have yet to be reached. The
antenna symbol indicates that the Commander is wirelessly operational.
Reading finishes automatically once the Commander has received and saved the
measured data from all the loggers in the group.
If a logger cannot be read, it may be switched off, not ready for wireless operation or it
may be outside the Commander’s wireless range.
54
Page 15

Working in Professional mode
It is not possible to read a “Patrol” group or a “Network” group using this method.
6.5.2 Standard query of a single logger
If you only wish to read a single logger with the commander, proceed as follows:
Step Description
1
Select the symbol in the main menu bar.
2 In the next menu, select the Read measurement data button.
Result: The loggers in the workgroup are listed in the next view.
3
If necessary, call up another logger group using the drop-down list at the very
top of the screen.
4 Select the concerning logger in the list. Then apply the Read Single button.
Result: The identification number and name of the logger are shown in the next
view.
5 Apply the Read button.
Result: The Commander and logger are connected and the measured data is
transferred.
A blue bar shows the progress of the data transfer.
After the transfer has been successfully completed, the display automatically
switches to the menu for showing the measured data (see page 42).
An error message appears if the data transfer fails. Ensure the Commander is
in the wireless range of the logger/group/GSM-Box concerned. The logger must
be ready for wireless operation. Press Read again to repeat the procedure.
6.5.3 Standard query of a “Lift&Shift” group
If you wish to read a “Lift&Shift” group, proceed as follows:
Step Description
1
Select the symbol in the main menu bar.
2 In the next menu, select the Read measurement data button.
Result: The loggers in the workgroup are listed in the next view.
3
If necessary, call up the group concerned using the drop-down list at the very
top of the screen.
4 Apply the Read Group button.
Result: The Commander and logger/GSM-Box are connected and the
measured data is transferred. The same view opens on the screen as with the
“Quick query”.
For them, please use the “Quick query” (see page 54).
55
Page 16

Working in Professional mode
6.6 Evaluating the measured data
6.6.1 Calling up the measured values
Calling up recent
measured data
Calling up older
measured data
To view the measured values from a logger on the Commander’s screen, select the
symbol in the main menu and then the Display logger data button.
The loggers in the workgroup are listed in the next view:
If necessary, you can call up a different group using the drop-down list at the very top of
the screen.
Use the View button to call up the measured data of the highlighted logger. To call up
the data of another logger in the list, select the list and then the logger. The measured
data is shown.
If the History function has been activated in the Commander’s system settings (see
page 26), you are not only able to access recent data read from the logger but also
older sets of data.
To do so, select the Actual line and then, from the drop-down list, the date of the data
set that you wish to view. The date refers to the day of the read-out.
56
Page 17

Working in Professional mode
6.6.2 Displaying the measured values
Introduction
Comparing
measured data
In Professional mode the measured data from the loggers is shown as a bar diagram on
the screen just as in Easy mode (see page 42). But, additionally the Professional mode
provides the opportunity to compare the measured data of two loggers.
After the measured data of a logger has been called up, this data can be compared to
the data of another logger in the group.
To do so, select the Compare button. The list of loggers in the workgroup opens on the
screen. Select the table and choose a logger for comparison. The following view
appears on the screen:
The two diagrams show the values of the loggers graphically. The values of the logger
selected first are above, the values of the logger for comparison below.
The leak value of the first and second logger are shown numerically under the diagrams.
After applying the Move Cursor button, you can move the vertical green line in the
diagrams to view the values of the individual recordings in greater detail.
You can use the Mode button to change the measurement unit on the Y-axis in the
diagram (see page 43).
To choose another logger in the group for comparison, use the arrow key to return to the
logger list and select a different logger.
57
Page 18
Additional measuring functions
7 Additional measuring functions
7.1 Real time measurement
Introduction
Purpose
Requirements
Procedure in
Easy mode
The “Real time measurement” function allows you to follow, in real time, the current
noise level and the frequency in a pipe directly on location and without additional
measuring devices. A logger measures continuously and immediately transfers the data
to the Commander.
The real time measurement can be useful in many situations. Here are some examples:
• Before a measurement session, you can use the real time measurement to gain a
first impression of the noises in the section of pipe concerned. This enables you, for
example, to estimate a sensible leak threshold for the measurement.
• With real time measurements at various points on the pipe network, you can already
distinguish during the day the non-critical pipe sections from the potentially critical
ones. They can then be examined more closely using a night measurement.
If the pipe noise in a section is already very low during the day, the probability of a
leak is not very high. A night measurement may then no longer be necessary at this
position and the logger can be used at a more critical point in the pipe network.
• When “patrolling”, you can use a real time measurement to check the results there
and then from the loggers indicating a high leak probability.
The logger used for the real time measurement must be switched on and ready for
wireless operation. You can install a logger in configuration mode (see page 14) at a
position on the pipe or use a logger already installed for the function. The logger does
not have to be programmed for the function!
In Easy mode, proceed as follows to perform the real time measurement:
Step Description
Procedure in
Professional mode
1
In the main menu, select the Real time measurement button.
Result: The loggers in the workgroup are listed in the next view.
2
Select the list and there select the logger that you wish to observe.
Result: Observation of the logger begins. The view for the real time
measurement appears on the screen (see further down in the text).
In Professional mode, proceed as follows to perform the real time measurement:
Step Description
1
Select the symbol in the main menu.
2 In the next menu, select the Real time measurement button.
Result: The loggers in the workgroup are listed in the next view.
3
If necessary, you can call up another group using the drop-down list at the very
top of the screen.
4
Select the list and there select the logger that you wish to observe.
Result: Observation of the logger begins. The view for the real time
measurement appears on the screen (see further down in the text).
58
Page 19

Additional measuring functions
6
5
4
3
2
1
Display of
measured data
The course of the real time measurement is shown on the Commander’s screen with a
running bar diagram:
1
2
4
5
3
6
Element Description
Identification number and comment of the observed logger
Diagram
Each bar represents a single noise recording.
X-axis ... course of measurement over time
Y-axis ... noise level in dB
The colour of the bar represents the frequency of the noise.
Blue
0 Hz
Yellow
2,500 Hz
The point where the two green lines intersect marks the quietest recording in
the displayed measurement, the so-called “leak value”.
Antenna symbol
indicates that the Commander is wirelessly operational
Minimum value of the display (leak value)
Left-hand field … ESA value of the recording
Centre field … Noise level in dB for the quietest measurement
Right-hand field … Frequency of the noise in Hz
Current value of the display
Noise level (bar height) and frequency (bar colour) of the current measuring
value (including numeric values).
Buttons
Stop and Start can be used to cancel and continue the observation at any
time. However, the time gap between cancellation and continuation is not
shown.
Use the ESC button to end the function and return to the main menu.
The permanent wireless connection during the real time measurement requires a
lot of power. This has a detrimental effect on the lifetime of the logger’s battery.
Please consider this when using the function.
59
Page 20

Additional measuring functions
7.2 Audio recordings
Loggers in the Sebalog N-3 series are able to save recorded noises as audio files and to
send them to the reading device. This means the user is no longer reliant on the
measurement values alone (level/frequency/ESA value) when evaluating a noise. You
can actually listen to the suspected leak.
Firstly, the loggers automatically save the quietest noise in the measuring period as an
audio file. This file can, for example, be called up later with the Commander and
replayed.
Secondly, you can get a recording of the current noise in the pipe from each installed
logger. This allows you to listen on a pipe, almost in real time, without any additional
equipment (sensor rod microphone or similar).
7.2.1 Reading out the audio data
Introduction
Procedure
Each logger automatically records the quietest noise (leak noise) in a measuring period
and saves it as an audio file. To spare the logger’s battery, this file is not automatically
sent to the reading device when the logger is read. It must be queried separately.
To query audio data in a logger, proceed as follows:
Step Description
1
In Easy mode … In Professional mode …
… select the button in the
main menu.
2 Select the Read / Play audio data
button.
Result: The loggers in the workgroup are listed in the next view.
3
4
Select the logger list and then the logger from which you wish to call up the leak
noise.
5 Apply the Read audio data button to continue.
Result: The ID and comment of the logger, from which the audio data is called
up, are shown once again in the next view. Data transfer starts automatically. A
blue bar shows the progress of the transfer. After the transfer has been
successfully completed, the display automatically switches to the menu for
playing back audio data (see page 61). You can then listen to the leak noise
that has just been read.
An error message appears on the screen if the data transfer fails. Ensure the
Commander is in the wireless range of the logger concerned. Press Start to
repeat the procedure.
… select the symbol in the main
menu bar.
Select the Read audio data button.
If necessary, you can call up another
group using the drop-down list at the
very top of the screen.
60
Page 21

Additional measuring functions
7.2.2 Playing back the audio data
Introduction
Procedure
After an audio file is sent from a logger to the Commander, it can be played back with
the Commander and listed to over headphones.
First, connect the supplied headphones to the Commander via the 5-pin headphone
socket . White markings on the plug and socket show the correct position of the plug.
You must feel the plug engage.
To play back an audio file, proceed as follows:
Step Description
1
In Easy mode … In Professional mode …
… apply the button in the
main menu of the Commander.
2 Select Read / Play audio data once
again in the next view.
3 Apply the Play button.
Result: The menu for playing back audio files opens.
… select the symbol in the main
menu bar of the Commander.
Apply the Play audio data button in
the next view.
If necessary, you can call up another
group using the drop-down list at the
very top of the screen.
4
Select the logger list and then the logger from which you wish to play back the
audio data.
A note symbol , on the very right of the list indicates the loggers from which
audio data is saved in the Commander. Only loggers with this symbol have a
leak noise saved.
5 Apply the Play button.
Result: The three-second recording of the leak noise is played back and
continuously repeated.
The yellow bar indicates the playback.
You can adjust the headphone volume. To do so, apply the VOL +/- button and
turn the selector knob. The blue bar above the button shows the current setting.
Before playing an audio file, it is advisable to first have the headphone
volume on a medium setting (e.g. level 18).
In Professional mode the frequency range of the recorded noise can be
displayed using the Spectrum button (see next page).
Playback can be ended at any time with the Stop button.
61
Page 22

Additional measuring functions
7.2.3 Displaying the frequency spectrum of the leak noise (in Professional
mode only)
Introduction
Purpose
Procedure
In Professional mode, you can view the frequency spectrum of the saved leak noise for
an even more in-depth analysis.
Sometimes the assumed leak noise stems from a known source of interference (e.g.
50 Hz/100 Hz mains voltage or a pump in operation). However, you should not
prematurely believe the conspicuous noise to be non-critical because there could still be
a real leak noise next to the background noise. By analysing the frequency spectrum,
you can check the saved noise for frequency peaks other than those of the interference.
Apply the Spectrum button in the menu for playing back audio files (see previous page).
The following view opens on the screen:
The diagram shows the spectrum of frequencies producing the saved leak noise (0 to
about 3,250 Hz).
X-axis … Frequency spectrum of the leak noise
Y-axis … The most dominant frequency of the noise
corresponds to “1” on the dimensionless scale. All the
other frequencies occurring are shown in relation to
this.
You can move the vertical green line in the diagram in order to view in greater detail the
frequencies at individual points on the curve. To do so, apply the Move Cursor button
and turn the selector knob.
Close the view with the OK button and return to the menu for playing back audio files.
The recorded frequency spectrum of a noise is influenced by many factors
(position of the logger, logger’s contact with the pipe, reflections in the pipe, etc.).
Even small changes in these factors can considerably change the displayed
frequency spectrum of the same noise. The inexperienced user can quickly make
misjudgements. Therefore, the frequency spectrum analysis should above all be
performed by experienced users who, for example, know how to use correlators.
Sometimes the frequency shown under “leak value” can diverge slightly from the
maximum frequency in the diagram display. This is not an error. This is caused
by the finer graduation of the displayed frequency band in the Commander,
compared to the internal graduation in the loggers. The value shown in the
diagram is therefore somewhat more precise.
62
Page 23
Additional measuring functions
7.2.4 Recording a noise directly (in Professional mode only)
Introduction
Requirements
Procedure
The “Direct recording” function of a Log N-3 logger enables you to listen in on the
current noise in a pipe without using additional equipment (sensor rod microphone or
similar).
If “Direct recording” is performed with a logger already installed, you do not even have to
open the shaft to listen to the pipe.
With this function, the logger creates a three-second recording of the current noise in
the pipe. This audio file is then immediately sent to the Commander where it can be
replayed. The pipe noise can thus be tracked almost in real time.
You can perform “Direct recording” with any logger already installed, if it is programmed
in “Lift&Shift” or “Patrol” group mode and if it is within its programmed “Wireless on”
time. (Unfortunately, the system will not allow loggers in “Network” group mode to be
used for this.)
However, you can also use a logger that has not been installed yet. The logger does not
have to be programmed after being switched on. It can simply remain in configuration
mode instead (see page 14).
To record a noise directly, a logger must be switched on, installed on the pipe and
located within the wireless range of the Commander. The distance is preferably between
1 and 10 m.
Proceed as follows to record the pipe noise directly:
Step Description
1
Select the symbol in the main menu and the Direct recording button
in the next view.
Result: The loggers in the workgroup are listed in the next view.
2
If necessary, you can call up another logger group using the drop-down list at
the very top of the screen.
3
Select the table and then the logger for recording the current noise.
4 Apply the Start recording button.
Result: The ID and comment of the logger to perform the recording are shown
once again in the next view. The Commander and the logger are connected.
The noise recording and following transfer of the audio file to the Commander
take place automatically. A bar shows the progress.
After the data has been transferred successfully, the menu for playing back
audio files opens automatically on the Commander’s screen (see page 61).
63
Page 24

Increasing the wireless range of the loggers with repeaters when patrolling (in
Professional mode only)
8 Increasing the wireless range of the loggers with repeaters when
patrolling (in Professional mode only)
Introduction
Requirements
The actual wireless range of a noise logger depends on the conditions at the place of
use. If a logger is installed in a shaft, its radio signal sometimes does not reach far
enough above the surface to be received properly during “patrolling”. In such cases a
repeater can be used. The repeater passes on the logger’s radio signal, therefore
extending the wireless link.
In principle, any repeater can work with any Log N-3 noise logger. However, a repeater
in “Patrol” group mode can only ever pass on the signal of a single logger.
The particular logger must be “paired up” with the repeater before the measurement.
The logger must already have been programmed beforehand (group mode: “Patrol”).
The logger should already be installed at the place of use.
64
Page 25

Increasing the wireless range of the loggers with repeaters when patrolling (in Professional mode only)
8.1 Repeater design
Design
A repeater has the following features:
Element Description
Status LED
•
Flashes blue … ready to receive
•
Lights up blue … receiving data
•
Flashes red … transmitting data
•
Lights up yellow then red … switching off
•
Lights up red then quickly
flashes blue
… update is being installed
Switching on/off
Power supply
•
No light … switched off
On/Off contact field
The repeater is switched on using a magnetic switch.
Move the supplied magnet over the On/Off contact field of the repeater. The status
LED first lights up red; after the magnet is removed it flashes green three times.
Regular blue flashing then indicates that the repeater is switched on and ready to
receive.
To switch off the repeater, keep the magnet at the On/Off contact field for a few
seconds. The LED first lights up yellow. As soon as it lights up red, you can remove the
magnet. The repeater then switches off and the LED goes out.
Each repeater has an internal lithium battery. It can power the device for up to five
years. The actual battery lifetime depends on the wireless settings of the “paired”
loggers.
When you query a repeater’s configuration, its battery status is also shown.
Flat batteries cannot be recharged. They must be replaced.
SebaKMT or an authorised service partner must change the batteries.
Otherwise, water- and dirt-resistance of the repeater cannot be guaranteed.
65
Page 26
Increasing the wireless range of the loggers with repeaters when patrolling (in
Professional mode only)
8.2 Installing the wireless extension
Before the wireless extension via repeaters can be set up, the logger concerned must
already be programmed and installed at its place of use.
Proceed on location as follows:
Step Description
1
Select the symbol in the main menu and the
Connect Repeater to Logger button in the next view.
If this button is not shown, the current workgroup is probably not a “Patrol”
group. In this case you must first specify a new workgroup (see page 45).
Result: The loggers in the workgroup are listed.
2
If necessary, you can call up another logger group using the drop-down list at
the very top of the screen.
3
Select the logger list and then the logger to be connected to the repeater. If the
respective reader is already preset, apply the “Select Repeater” button.
Result: A window for registering the repeater in the Commander automatically
opens on the screen.
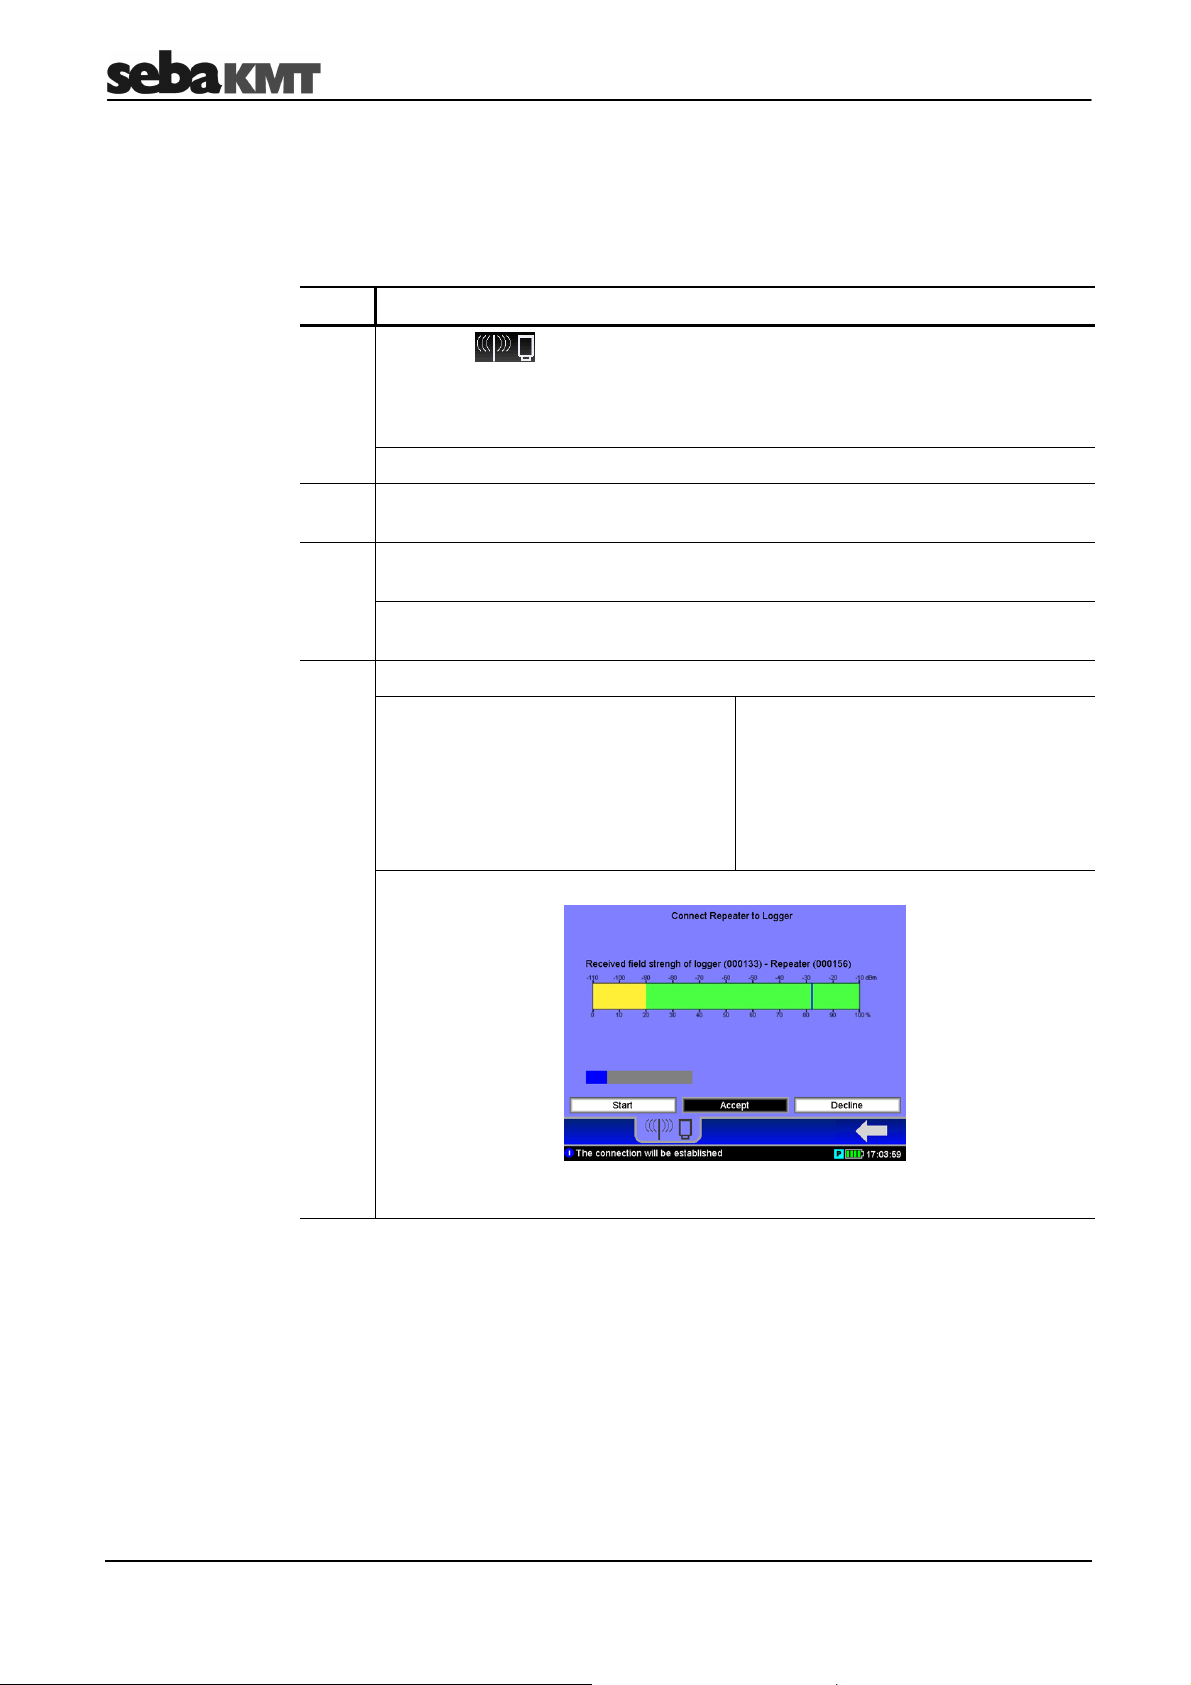
4
Use one of these two methods to register the repeater:
Automatic detection: Move the
switched off repeater close to the
Commander and switch it on. Once the
repeater is detected, New ID found
appears on the screen. The ID of the
repeater is displayed underneath. Use
the Accept button to confirm.
Result: The following display opens on the screen:
This display can be used to test the quality of the wireless connection between
the logger and repeater and to find a suitable location for the repeater.
Manual input: Enter the repeater’s sixdigit ID with the virtual keyboard. Use
the ENTER button to confirm.
66
Page 27
Increasing the wireless range of the loggers with repeaters when patrolling (in Professional mode only)
Step Description
5 Apply the Start button.
The logger and repeater are connected.
The vertical blue line in the bar indicator shows the strength currently of the
wireless connection between the logger and repeater.
Installing the repeater
• Green area
• Yellow area
6
Look for a suitable place around the installed logger for fitting the repeater.
… … good connection
poor connection
When doing so, keep an eye on the signal strength indicator on the
Commander, or watch the status LED on the repeater:
…
• Lights up green
• Lights up yellow
• Flashes blue
good connection
…
poor connection
…
no connection to the logger
7 When you have found a suitable position for the repeater, apply the Accept
button on the Commander.
Result: The logger and repeater are now “paired” with each other.
Any communication with the logger now automatically takes place via the
repeater.
This is the case until the repeater is switched back off.
When installing the repeater, you should observe the following:
• The wireless signal between the logger and repeater should be as strong as
possible (green); if the connection is poor (yellow) interference can easily occur,
causing the read-out to fail.
• The place of installation should be somewhat elevated, e.g. at a height of 2 m
on a lamp post, or similar.
• The repeater should not be too easily accessible, to prevent theft or vandalism.
• The repeater must not be a nuisance to anyone or infringe any property laws.
• While measurement takes place, no impairment of the wireless connection
should be expected due to external influences.
You can, for example, attach the repeater to a street lamp, house wall or, if necessary,
to a tree. To do so, use the supplied cable ties, for example, or any other form of
fastening that does not cause damage.
67
 Loading...