

Page 1
Consultation with SebaKMT
Abwassernetze
User Manual
Data Logger
Sebalog D-3
Mess- und Ortungstechnik
Measuring and Locating Technologies
Elektrizitätsnetze
Power Networks
Kommunikationsnetze
Communication Networks
Rohrleitungsnetze
Water Networks
Sewer Systems
Leitungsortung
Line Locating
Issue: 03 (09/2015) - EN
Article number: 83914
1
Page 2

Consultation with SebaKMT
2
Page 3

Consultation with SebaKMT
Consultation with SebaKMT
The present system manual has been designed as an operating guide and for
reference. It is meant to answer your questions and solve your problems in as fast and
easy a way as possible. Please start with referring to this manual should any trouble
occur.
In doing so, make use of the table of contents and read the relevant paragraph with
great attention. Furthermore, check all terminals and connections of the instruments
involved.
Should any question remain unanswered or should you need the help of an authorized
service station, please contact:
Seba Dynatronic
Mess- und Ortungstechnik GmbH
Dr.-Herbert-Iann-Str. 6
D - 96148 Baunach
Phone: +49 / 9544 / 68 – 0
Fax: +49 / 9544 / 22 73
E-Mail: sales@sebakmt.com
http://www.sebakmt.com
Hagenuk KMT
Kabelmesstechnik GmbH
Röderaue 41
D - 01471 Radeburg / Dresden
Phone: +49 / 35208 / 84 – 0
Fax: +49 / 35208 / 84 249
SebaKMT
All rights reserved. No part of this handbook may be copied by photographic or other means unless SebaKMT
have before-hand declared their consent in writing. The content of this handbook is subject to change without
notice. SebaKMT cannot be made liable for technical or printing errors or shortcomings of this handbook.
SebaKMT also disclaims all responsibility for damage resulting directly or indirectly from the delivery, supply,
or use of this matter.
3
Page 4

Terms of Warranty
Terms of Warranty
SebaKMT accept responsibility for a claim under warranty brought forward by a
customer for a product sold by SebaKMT under the terms stated below.
SebaKMT warrant that at the time of delivery SebaKMT products are free from
manufacturing or material defects which might considerably reduce their value or
usability. This warranty does not apply to faults in the software supplied. During the
period of warranty, SebaKMT agree to repair faulty parts or replace them with new parts
or parts as new (with the same usability and life as new parts) according to their choice.
This warranty does not cover wear parts, lamps, fuses, batteries and accumulators.
SebaKMT reject all further claims under warranty, in particular those from consequential
damage. Each component and product replaced in accordance with this warranty
becomes the property of SebaKMT.
All warranty claims versus SebaKMT are hereby limited to a period of 12 months from
the date of delivery. Each component supplied by SebaKMT within the context of
warranty will also be covered by this warranty for the remaining period of time but for 90
days at least.
Each measure to remedy a claim under warranty shall exclusively be carried out by
SebaKMT or an authorized service station.
This warranty does not apply to any fault or damage caused by exposing a product to
conditions not in accordance with this specification, by storing, transporting, or using it
improperly, or having it serviced or installed by a workshop not authorized by SebaKMT.
All responsibility is disclaimed for damage due to wear, will of God, or connection to
foreign components.
For damage resulting from a violation of their duty to repair or re-supply items,
SebaKMT can be made liable only in case of severe negligence or intention. Any liability
for slight negligence is disclaimed.
Since some states do not allow the exclusion or limitation of an implied warranty or of
consequential damage, the limitations of liability described above perhaps may not
apply to you.
4
Page 5

Terms of Warranty
Contents
Consultation with SebaKMT ........................................................................................... 3
Terms of Warranty ........................................................................................................... 4
1 Safety Instructions ........................................................................................... 7
1.1 General Safety Instructions and Warnings ......................................................... 7
1.2 General Notes .................................................................................................... 7
2 Technical description ...................................................................................... 9
2.1 Design ................................................................................................................ 9
2.1.1 Controls and indicators ....................................................................................... 9
2.1.2 Connectors ....................................................................................................... 10
2.2 Function ............................................................................................................ 10
2.3 Communication ................................................................................................ 11
2.3.1 Log RI or Log RI+ radio interface ..................................................................... 12
2.3.2 Reader-3 used as radio interface ..................................................................... 12
2.4 Power supply .................................................................................................... 13
2.5 Memory............................................................................................................. 14
2.6 Technical data .................................................................................................. 15
2.7 Scope of delivery .............................................................................................. 16
2.8 Available versions ............................................................................................ 17
3 Commissioning the logger ............................................................................ 18
3.1 Preparations for mobile communication ........................................................... 18
3.2 Preparing the logger for GSM .......................................................................... 18
3.3 Switching the logger On/Off ............................................................................. 20
3.4 Programming the logger ................................................................................... 20
4 Connecting the logger and installing it on-site ........................................... 21
4.1 Connecting sensors to the logger .................................................................... 21
4.1.1 Fixed channel allocations ................................................................................. 21
4.1.2 Connecting a hose to the internal pressure sensor ......................................... 22
4.1.3 Connecting sensors .......................................................................................... 23
4.1.4 Connecting devices to the switching Inputs / Outputs ..................................... 24
4.1.5 Wiring diagram examples ................................................................................. 25
4.2 Positioning the logger ....................................................................................... 26
4.3 Positioning the GSM antenna .......................................................................... 27
5 SebaDataView-3 software .............................................................................. 28
5.1 Installation ........................................................................................................ 28
5.2 Function and structure ...................................................................................... 29
5.3 Device administration ....................................................................................... 31
5.3.1 Creating / deleting folders ................................................................................ 31
5.3.2 Creating / deleting zones.................................................................................. 31
5
Page 6

Terms of Warranty
5.3.3 Creating / deleting groups ................................................................................ 32
5.3.4 Adding / deleting single devices ....................................................................... 33
5.4 Map function ..................................................................................................... 35
5.4.1 Creating a map ................................................................................................. 35
5.4.2 Executing a map ............................................................................................... 36
5.5 System settings ................................................................................................ 38
5.5.1 Managing the storage location of the measurement database ........................ 38
5.5.2 Saving access data for FTP server and email account .................................... 39
5.5.3 Getting information about the current device state .......................................... 40
5.6 Updating the firmware of a device .................................................................... 40
6 Programming the logger................................................................................ 42
6.1 Selecting the logging interval ........................................................................... 43
6.2 Configuring a measuring channel .................................................................... 43
6.2.1 Selecting the type of sensor ............................................................................. 44
6.2.1.1 Configuring an Internal Pressure Sensor ......................................................... 44
6.2.1.2 Configuring a ‘user defined’ sensor .................................................................. 45
6.2.1.3 Input type examples ......................................................................................... 46
6.2.2 Configuring alarm conditions (Threshold monitoring) ...................................... 48
6.2.3 Finishing the sensor configuration ................................................................... 50
6.3 Configuring the alarm inputs ............................................................................ 51
6.4 Configuring the mobile communication ............................................................ 53
6.4.1 Explanations about the GSM configuration dialogue ....................................... 54
6.4.2 Testing the mobile connection ......................................................................... 57
6.5 Adjusting the start time of data recording ......................................................... 58
6.6 Adjusting the memory mode............................................................................. 58
6.7 Checking the device status .............................................................................. 58
6.8 Finishing the programming ............................................................................... 58
7 Retrieving and evaluating data ..................................................................... 59
7.1 ‘Realtime Measurement’ function ..................................................................... 59
7.2 Retrieving measurement data .......................................................................... 60
7.2.1 Reading out data using the PC/Laptop ............................................................ 60
7.2.2 Downloading data from a FTP server .............................................................. 60
7.3 Managing saved measurement data ................................................................ 61
7.4 Displaying measurement data .......................................................................... 62
7.4.1 Calling up a measurement ............................................................................... 62
7.4.2 Using the measurement data display ............................................................... 62
7.4.3 Displaying pressure surges .............................................................................. 64
8 Miscellaneous functions of the SebaDataView-3software ......................... 65
8.1 Receiving an ‘Event List’ .................................................................................. 65
8.2 Exporting data in CSV format ........................................................................... 66
6
Page 7
Safety Instructions
1 Safety Instructions
1.1 General Safety Instructions and Warnings
• Do not drop the device / the system’s components or subject it / them to
strong impacts or mechanical shocks.
• The limits described under Technical Data may not be exceeded.
• The device / system must be in a technically perfect condition for
measurement.
• The indicated degree of protection can only be ensured if plugs or the
provided protection caps are put in all sockets of the device.
• The plugs of the supplied connection cables are only compliant to the
indicated degree of protection as long as they are plugged in. Plugs
which are not connected or which are connected in a wrong way are not
protected from water and dust ingress.
• If the O-ring seal of a socket is obviously damaged, it must be replaced
in order to ensure the total protection against water and dust ingress.
1.2 General Notes
Safety precautions
Labelling of safety
instructions
This manual contains basic instructions for the commissioning and operation of the
device / system. For this reason, it is important to ensure that the manual is always
available to the authorised and trained operator. He needs to read the manual
thoroughly. The manufacturer is not liable for damage to material or humans due to nonobservance of the instructions and safety advices provided by this manual.
Locally applying regulations have to be observed!
The following signal words and symbols are used in this manual and on the product
itself:
Signal word /
Description
symbol
CAUTION
Indicates a potential hazard which may result in moderate or minor
injury if not avoided.
NOTICE
Indicates a potential hazard which may result in material damage if not
avoided.
Serves to highlight warnings and safety instructions.
As a warning label on the product it is used to draw attention to
potential hazards which have to be avoided by reading the manual.
Serves to highlight important information and useful tips on the
operation of the device/system. Failure to observe may lead to
unusable measurement results.
Check contents
Check the contents of the package for completeness and visible damage right after
receipt. In the case of visible damage, the device must under no circumstances be taken
into operation. If something is missing or damaged, please contact your local sales
representative.
7
Page 8

Safety Instructions
For FCC:
- User Information acc. to FCC15.21:
Changes or modifications not expressly approved by the party responsible for
compliance could void the user's authority to operate the equipment.
- Part 15 Statement gem. FCC 15.19/RSS Gen Issue 3 Sect. 7.1.3
This device complies with Part 15 of the FCC Rules and with Industry Canada licenseexempt RSS standard(s). Operation is subject to the following two conditions:
(1) this device may not cause harmful interference, and (2) this device must accept any
interference received, including interference that may cause undesired operation.
This equipment should be installed and operated with a minimum distance of 20
centimeters between the radiator and your body.
Working with products
from SebaKMT
Repair and
maintenance
Special transportation
requirements
Electromagnetic
radiation
It is important to observe the generally applicable electrical regulations of the country in
which the device will be installed and operated, as well as the current national accident
prevention regulations and internal company directives (work, operating and safety
regulations).
After working on the system, it must be voltage-free and secured against reconnection
as well as having been discharged, earthed and short-circuited.
Use genuine accessories to ensure system safety and reliable operation. The use of
other parts is not permitted and invalidates the warranty.
Repair and maintenance work has to be carried out by SebaKMT or authorised service
partners using original spare parts only. SebaKMT recommends having the system
tested and maintained at a SebaKMT service centre once a year.
SebaKMT also offers its customers on-site service. Please contact your service centre if
needed.
The lithium batteries of the device are dangerous goods. The transport of the batteries
itselves and of devices which contain such batteries is subject to regulations based on
the UN Model Regulations “Transport of Dangerous Goods” (ST/SG/AC.10-1).
Please inform yourself about the transportation requirements and follow them when
shipping the device.
This device is designed for industrial use. When used at home it could cause
interference to other equipment, such as the radio or television.
The interference level from the line complies with the limit curve B (living area), the
radiation level complies with the limit curve A (industrial area) according to EN 55011.
Given that living areas are sufficiently far away from the planned area of operation
(industrial area), equipment in living areas will not be impaired.
8
Page 9

Technical description
2 Technical description
2.1 Design
2.1.1 Controls and indicators
The following figure shows the loggers’ ON/OFF switch and control lamp.
Control lamp states
Item Description
On/Off contact area
I/O control lamp
Here you find some possible states of the logger’s control lamp .
LED status Description
green (1 x per second) logger is switched on
red (regularly) logger is sampling (flashing is according to log interval)
blue (1x each 10 seconds) logger is checking for radio signal
blue (rapidly) during data transfer via radio
blue (constantly) during connection to radio signal
green (unsteady) GSM operations are done, data are transmitted
green (constantly) logger is dialing in to GSM network
red (constantly) Error !!
• common GSM error, e.g. powering up modem failed,no
SIM card detected, dial in unsuccessful, error during ftp
data transfer - (LED turns off when modem was
successfully turned down)
• wrong PIN code - (flashing red 3x before turning on
constantly)
• SIM-card blocked, PUK needed - (flashing white 3x
before turning on constantly)
9
Page 10

Technical description
2.1.2 Connectors
The following figure shows the connectors of a fully equipped logger. Which connectors
are part of the assembly depends on the configuration of the logger.
Item Description
IN socket
for connecting sensors, alarm triggering or peripheral devices
DC ext. socket
for connecting an external power supply
Connector P (internal pressure sensor)
for connecting hoses via quick-release coupling
GSM socket
for connecting the external GSM antenna
Venting membrane
2.2 Function
Sebalog D-3 (in short: Log D-3) is a compact, robust and extremely versatile data
logger. The device can record the readings of various sensor types in user-defined
intervals. Depending on the configuration, up to 4 freely programmable channels can be
connected to sensors for data recording.
The logger also can provide an internal pressure sensor hoses can be connected to
directly. When using the internal pressure sensor, in addition to the standard pressure
measurement the recording of sudden pressure fluctuations (known as ‘pressure
surges’) is possible.
Using the ‘real-time measurement’ function or the ‘Step Test’ function, a measurement
can be carried out and observed ‘live’ on a computer.
The logger can be used for monitoring purposes, as it is able to trigger user-defined
alarm signals (e.g. signal lights, SMS or e-mail) if a threshold is exceeded or special
alarm equipment is triggered.
10
Page 11
Technical description
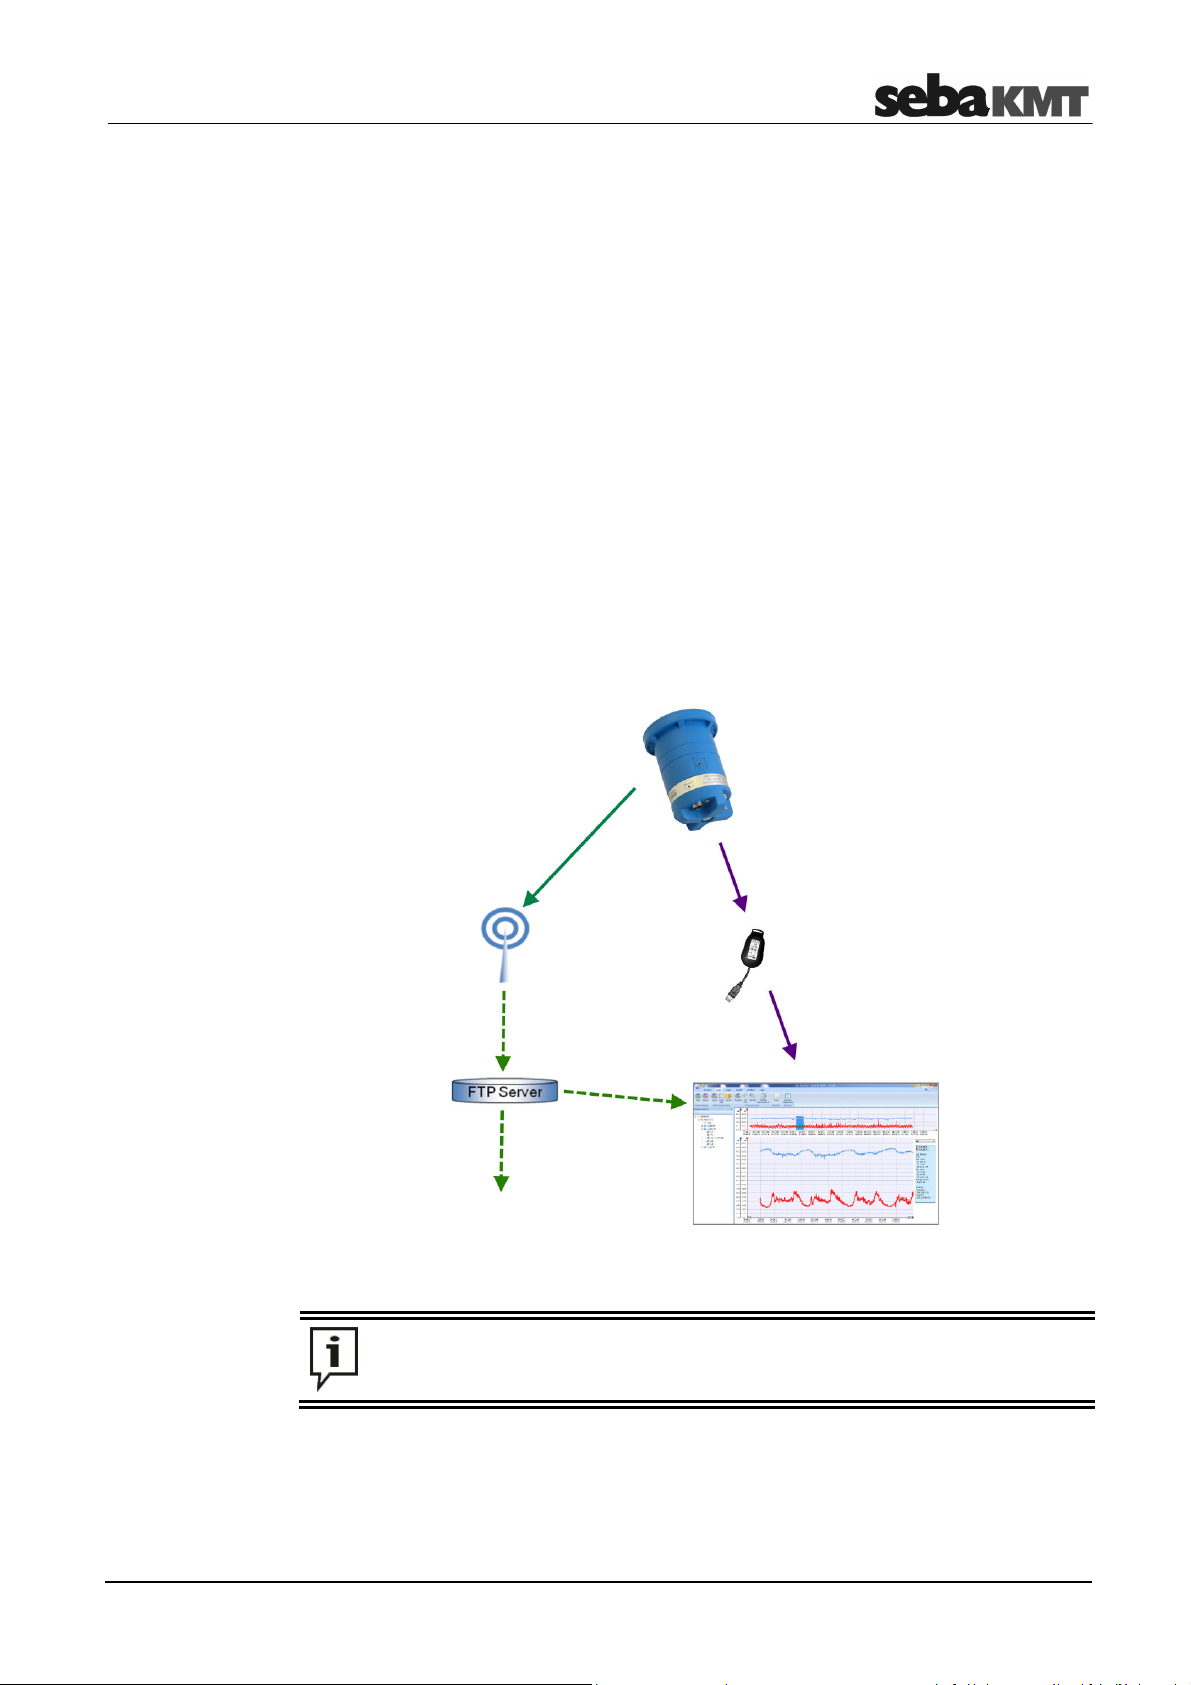
Externes GIS oder
Recorded measuring data are stored in the loggers memory and can be retrieved via
short range radio. Loggers equipped with a GSM module can also send the data
regularely to an FTP server, from where they can be downloaded to any Internetcapable computer.
Programming of the device, as well as retrieving and evaluating the recorded measuring
data is performed by the help of the ‘SebaDataView-3’ PC software.
2.3 Communication
The SebaDataView-3 software is used on a PC/laptop to program the logger before the
measurement and to retrieve the collected data after the measurement.
Short range radio is used for communication between the devices. The computer must
have a radio interface. For that purpose the ‘Log RI’ / "Log RI+"or the ‘Reader-3’ from
SebaKMT can be connected.
Furthermore, if your logger is equipped with an internal GSM module, measurement
data uploads to an FTP server or configuration data downloads to the logger are
possible.
GSM / GPRS
Funk
Internet
SCADA-System
Loggers, which are to be contacted via radio, have to be switched on and must
be situated within the wireless range of the computer or reading device.
PC-Software SDV-3
11
Page 12
Technical description
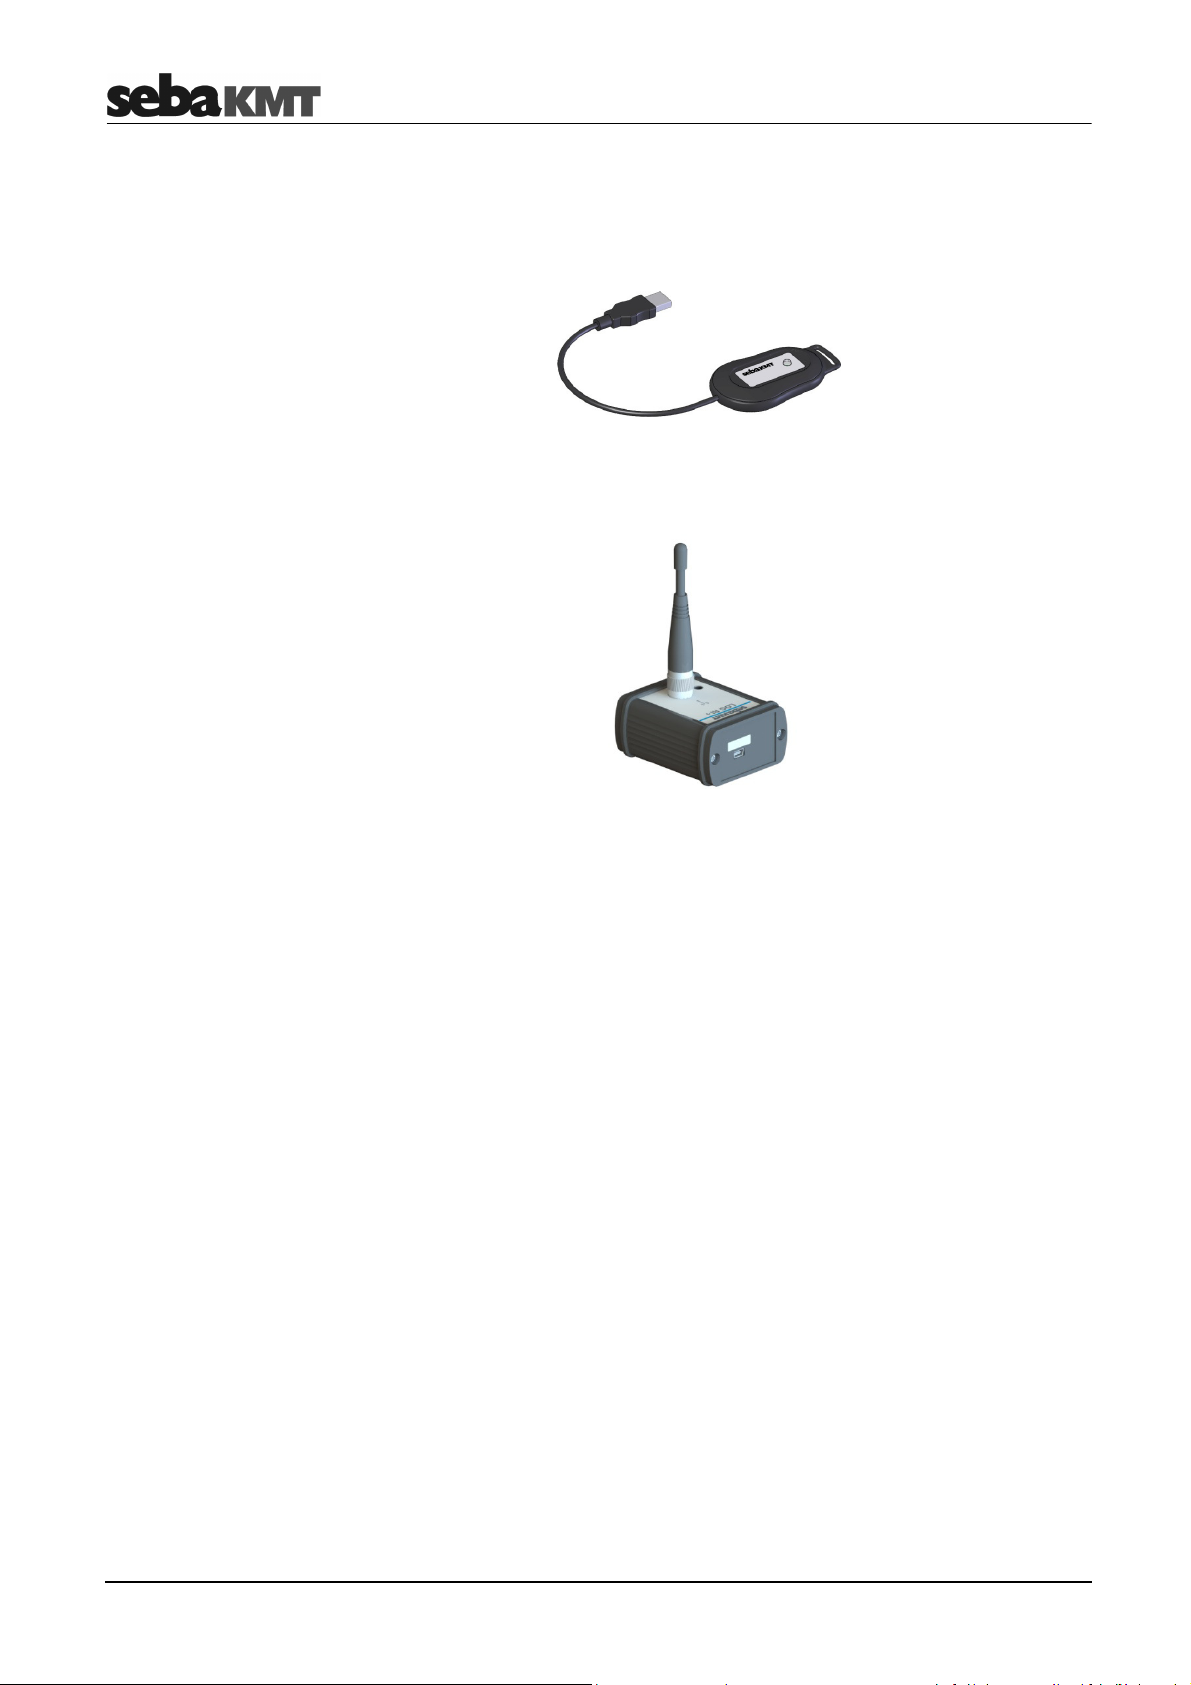
2.3.1 Log RI or Log RI+ radio interface
‘Log RI’
'Log RI+'
The compact ‘Log RI’ is the standard radio interface for communicating with devices of
the Sebalog series.
The radio interface ‘Log RI+’ is available as accessory from SebaKMT. Compared to the
Log RI the device has a higher-performing radio module which allows a higher radio
range.
Simply connect the ‘Log RI’ / ‘Log RI+’ to a USB port of the computer. The device
Use
switches itself on. The device is automatically detected by the computer and
immediately ready to establish the radio link. There are no further adjustments to be
done.
Status LED
The device has a status LED:
• flashing 1x red, 1x green …
• blue light …
• red light …
switching on
data transfer in progress
malfunction
Update
We recommend that the device is always operated with the latest firmware. More exact
information on how to update the firmware in Sebalog N-3 series devices is available in
its own section in this operating manual (see page 40).
2.3.2 Reader-3 used as radio interface
The ‘Reader-3’ reading device from SebaKMT can be used to establish radio
communication, too.
Connect the Reader-3 to the USB port of your PC using the Docking Station and switch
it on. The device automatically starts in USB mode. It is automatically detected by the
computer and immediately ready to establish the radio link. There are no further
adjustments to be done. For further information please consult the operating instructions
of your Reader-3.
12
Page 13
Technical description
2.4 Power supply
The device is powered by two internal Lithium batteries.
Battery lifetime
Battery status
The effective lifetime of the batteries strongly depends on which functions are used and
how often they are used.
Using the following settings and under the following conditions a logger can be operated
for up to five years without changing the batteries.
Parameter Setting
Channel 1 Internal pressure sensor
Channel 2 External sensor; Input signal: Pulse
Channel 3 External sensor; Input signal: Pulse
Channel 4 External sensor; Input signal: Pulse
Log interval 15 min
Event Number
Data transfer via GSM Once a day (SMS / e-mail / FTP upload)
Pressure surge recording Once a day
Alarm events per day No
In order to obtain information about a logger's battery condition, you can call the
'program' input screen of the SDV-3 software. For that, select the relevant logger in the
directory tree and click on Program in the menu bar. The State segment, inter alia,
provides information about the battery (see page 40).
Empty batteries
External power supply
When the batteries get low, the logger switches itself off. Measurement data, logged up
to that point, remain safely in the loggers’ memory until the next programming.
Empty batteries cannot be recharged. They need to be replaced. The battery
replacement must be carried out by SebaKMT or an authorized service station, in order
to warrant the loggers’ protection against water and dust ingress.
In order to expand the operating time of the measuring system, the data logger can be
supplied by an external energy source.
The Logger is connected to this source using the VK 76 connection cable (see page 24).
• Supply voltage: 12 V
• Supply current: approx. 0.5 A (if the GSM function is not used)
approx. 1.5 A (when using the GSM function)
Peaks of 4 A can occur.
NOTE
13
Page 14

Technical description
External rechargeable
battery pack
2.5 Memory
In order to expand the operating time of the measuring system, the data logger can be
connected to an external rechargeable battery pack which can be ordered from
SebaKMT.
The logger is connected to the external battery pack by means of the VK88 connection
cable. The 10-pole connector (red) of the cable has to be plugged in the DC ext.
socket of the logger. Then the 5-pole connector has to be plugged in one of the sockets
of the battery, no matter which one. From now on the logger is powered by the external
battery only, until the connection is cut or the capacitance of the external battery gets
low. In that case, the logger switches back to internal power supply.
Use the supplied mains adapter to recharge the external battery pack. Plug the round
5-pole connector in one of the sockets of the battery, no matter which one. Once the
battery is connected to the mains, it is charging. The charging process for a fully loaded
battery takes 12 to 13 hours. Overcharging of the battery cannot occur if the supplied
mains adapter is used.
The device has 4 MB internal memory. For example, if 4 sensors are connected and a
recording interval of 5 minutes is specified, this is sufficient for 5 years non-stop data
recording. As part of the programming process, the logger can be set to "ring memory
mode". As the memory fills up with data in this mode, the device keeps logging and the
respective oldest value is overwritten.
14
Page 15

Technical description
2.6 Technical data
Depending on the configuration, the Sebalog D-3 is specified by the following
parameters:
Parameter Value
Communication Short-range radio
868 MHz (in Europe)
913,02 MHz (in the US)
913 / 916 MHz (depending on the country)
Mobile radio (GSM / GPRS / UMTS)
850 / 900 / 1800 / 1900 / 2100 MHz
Inputs / outputs
Internal pressure sensor optional (16 bar / 25 bar / 35 bar);
Log interval
standard measurement
pressure surge meas.
Memory 4 MB internal memory
Alarm Switching input and threshold monitoring for each channel
2 or 4 freely programmable channels,
digital: 0…5 V / pulse / frequency
analogue:4…20 mA (max. 2 channels);
Up to 2 switching inputs (alarm trigger);
Up to 2 switching outputs (alarm installation);
Connectors for internal pressure sensor
accuracy: +/- 1 %
resolution: 0.006 bar (16 bar sensor)
Standard measurement
1 sec up to 24 hrs selectable
Pressure surge measurement
0.1 sec or 1 sec selectable
block or roll memory selectable
possible;
Triggering of switching output(s);
Alarm messages via SMS / e-mail;
Measuring data upload to FTP server in case of alarm
Battery Internal lithium batteries
Ext. power supply 12 V DC
Operating temperature -20°C … +70°C
Storage temperature -20°C … +70°C
Dimensions (L x W x H) 115 x 115 x 180 mm
Weight approx. 0.9 kg (incl. batteries)
Degree of protection IP 68
15
Page 16
Technical description
2.7 Scope of delivery
Standard
accessory parts
Optional
accessory parts
Besides of the logger unit and a magnet, the Sebalog D-3 package contains the
following accessories:
Accessory part Description Item No.
CSW Dataview-3
PC software
VK86
connection cable (green)
VK76
connection cable (red)
GSM antenna, magnetic,
with connection cable,
2 m
Special PVC pneumatic
hose, 2 m, 35 bar
In addition to the standard scope of delivery, there are optional accessory parts which
can be ordered from SebaKMT.
standard user software for programming the
logger and retrieving or evaluating
measurement data
for connecting up to 4 sensors;
must be connected to the IN socket
for connecting up to 2 switching inputs /
outputs (alarming);
must be connected to the DC ext. socket
only for loggers with GSM modem;
must be connected to the GSM socket
only for loggers with internal pressure sensors;
to be connected to the nipple of an internal
pressure sensor
118302210
820019262
820012450
820020888
118304220
Accessory part Description Item No.
LOG RB-3
Sebalog Reader-3 set
incl. docking station
LOG D-EB
external accumulator set
VK84
connection cable
portable device for wireless on-site data
readout without PC;
can be used to establish a radio link between
the logger and a PC
external power supply for the logger 820021915
for connecting a UDM 200 to the data logger 820018168
118304287
16
Page 17
Technical description
LOG D
-
3 4 G 16
- 868
2.8 Available versions
The Sebalog D-3 data logger is available in a wide variety of configurations. The type
code on the logger’s label showshow the device is equipped..
Type code
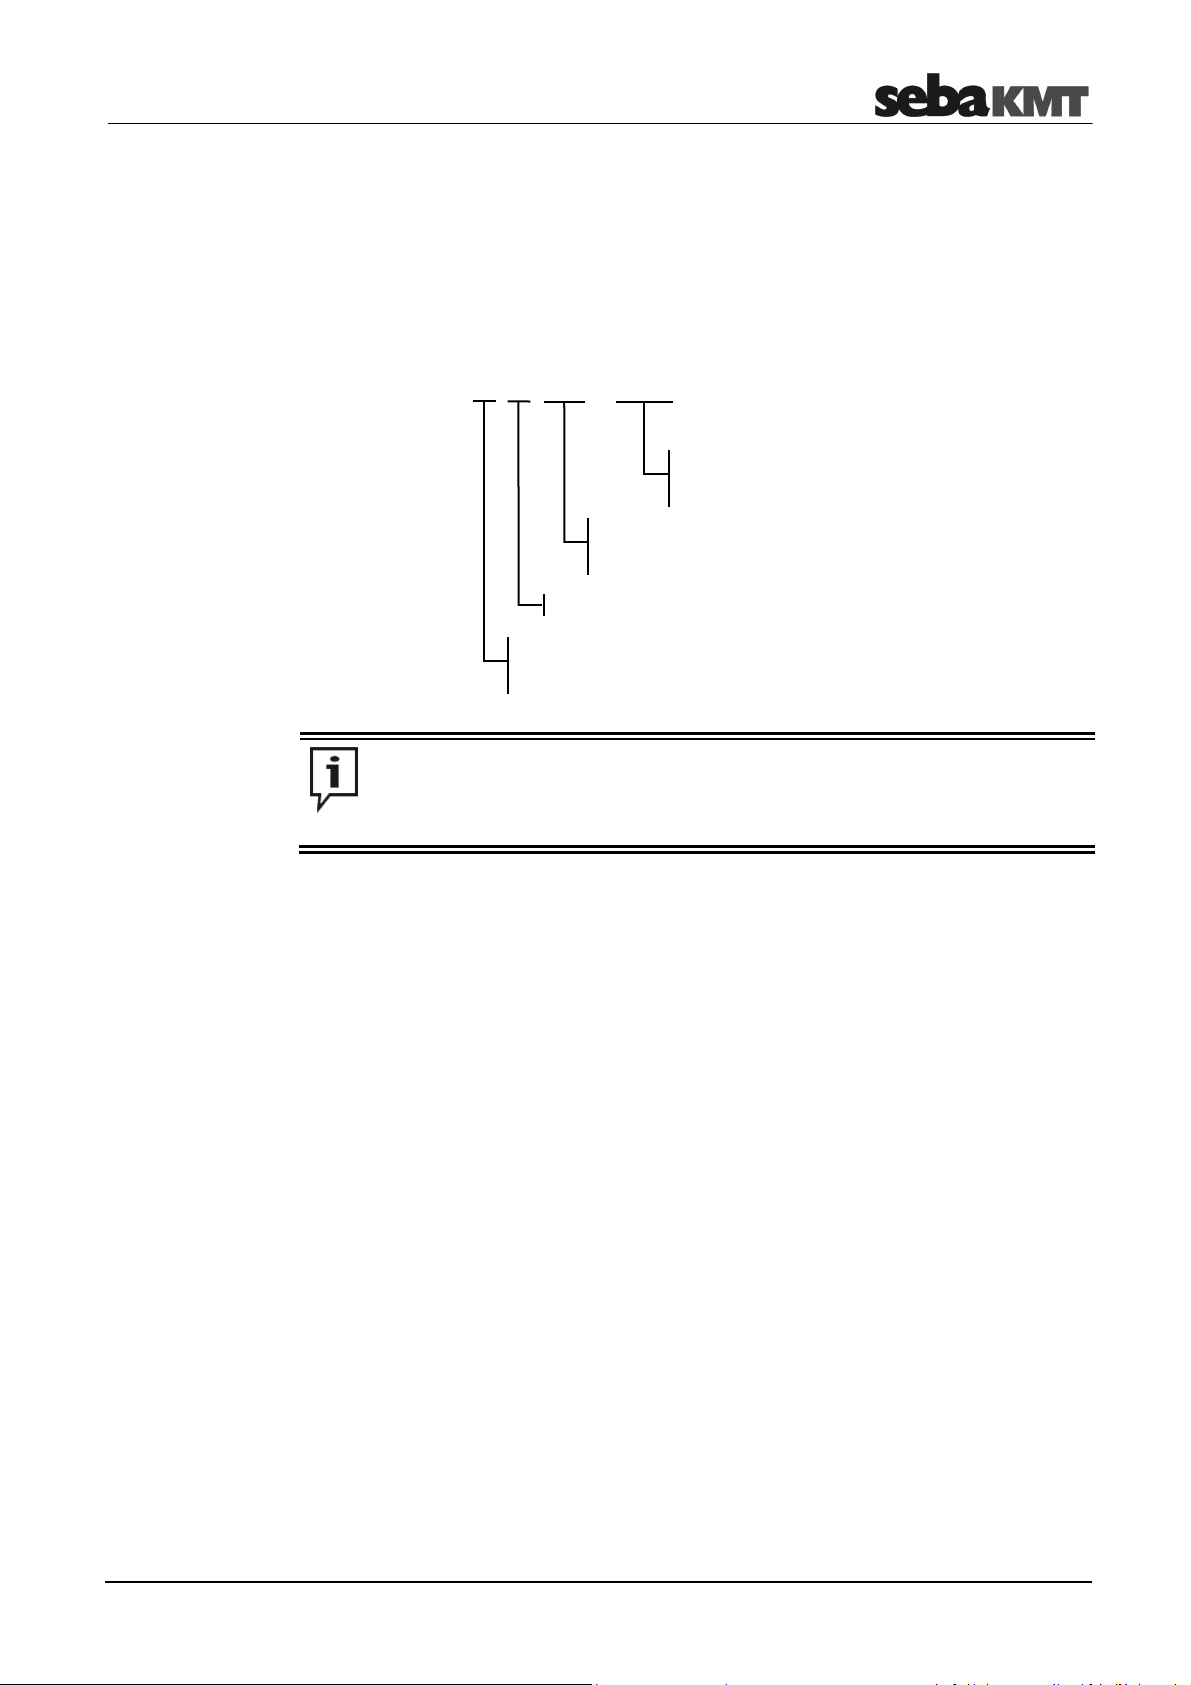
The type code consists of the following segments:
frequency of the internal radio module in MHz
(here: 868 MHz)
top level of the internal pressure sensor's measuring range
in bar (here: max. 16 bar)
the logger is equipped with a GSM modem
number of logging channels
(here: the device has 4 measuring channels)
Due to the large amount of possible configurations, this manual cannot state
explicitly whether or not a described function applies to your device. Please use
the information provided within this section to identify the specific capabilities of
your logger.
17
Page 18
Commissioning the logger
3 Commissioning the logger
3.1 Preparations for mobile communication
If your data logger is equipped with an internal GSM modem for mobile radio
communication, alarm messages and status messages can be sent via e-mail or SMS.
Furthermore, collected data can be transferred to an FTP server. From there they can
be downloaded with any Internet-capable computer anywhere in the world.
UMTS / GPRS
FTP server
E-mail messages
3.2 Preparing the logger for GSM
For data transfer via mobile radio you have to close a suitable contract with a mobile
phone service provider, in order to get a SIM card enabled for data transfer via
UMTS / GPRS.
For measuring data uploads, free memory space on an FTP server is needed. You can
ask your administrator to set up an FTP server using the server infrastructure of your
company or you can rent a server from a commercial internet service provider.
You can also rent FTP space from SebaKMT. Please contact your SebaKMT distributor.
Under certain conditions the demo server run by SebaKMT can be used.
If you wish to receive alarm messages or status messages via e-mail, an e-mail account
is needed from which the messages are to be sent. If the mail server of your company is
not capable for this task (e.g. due to a firewall), a webmail account from an internet
service provider (e.g. Yahoo or Google) can be used instead.
Under certain conditions the demo account run by SebaKMT can be used.
Please note that the mobile radio link function increases the loggers’ energy
demand, which has a strong negative influence on the battery life of the logger.
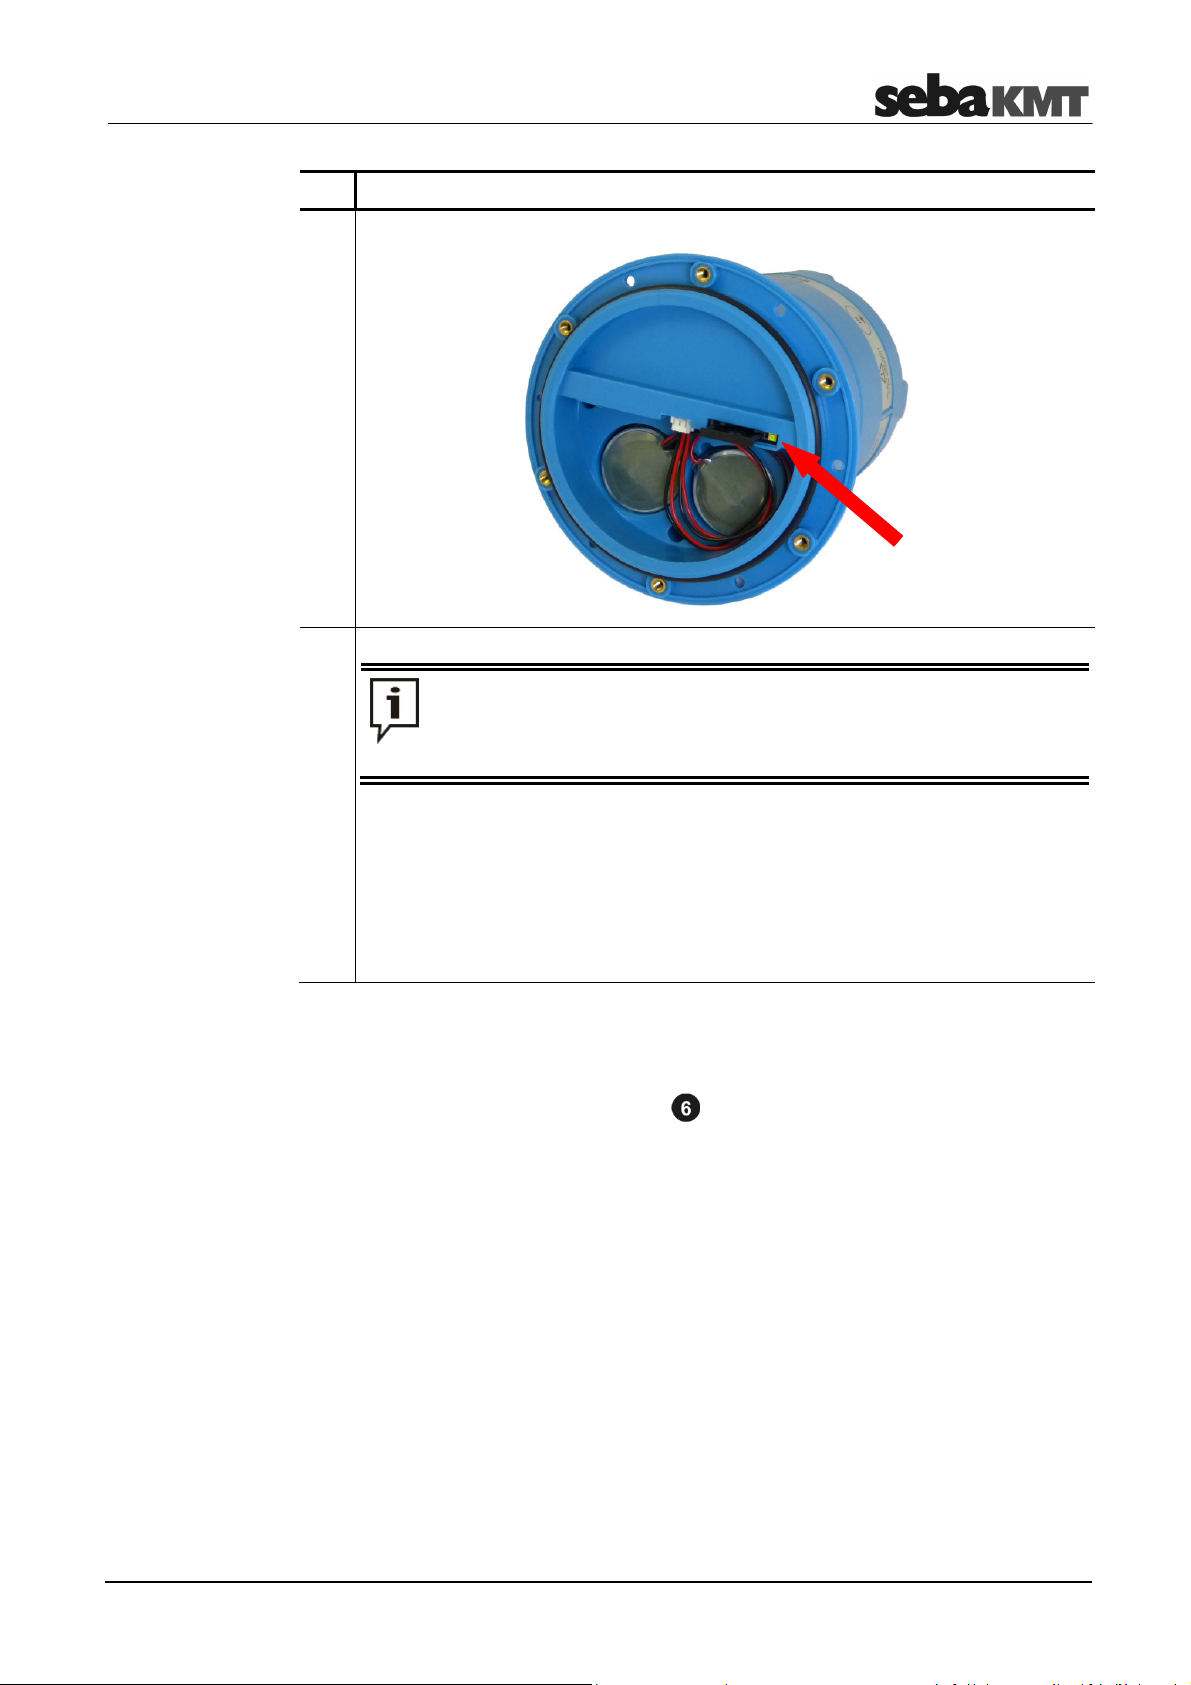
Insert SIM card
In order to prepare the logger for GSM connectivity, the SIM card you received from
your mobile operator has to be inserted and the GSM antenna must be connected.
Proceed as follows:
Step Description
1
Loosen the six screws and remove the cover of the device.
Result: Inside the housing you have access to the batteries and SIM card slot.
2
Insert the SIM card.
Please be careful not to damage any parts. Don't use any force.
NOTE
To remove the tray for the SIM card from its fastener, press the yellow spring
mechanism (see picture), e.g. by the help of a screwdriver or a pen. Remove the
tray and place the SIM card on it so it fits. Then push the tray back into the
bracket until it locks into place.
18
Page 19
Commissioning the logger
Step Description
3
Attach the cover to the housing again.
The rubber seal inside the cover is not glued in and may possibly fall out.
Therefore, when re-assembling the device, it may be helpful not to put
the cover on the housing but to take both parts upside down and then put
the housing on the cover.
Connect GSM antenna
To ensure that the housing remains waterproof, please observe the following
points:
• The rubber seals and the housing and cover surfaces which touch each other
must be free of dirt.
• Be careful not to jam the housing parts against each other.
• Tighten the screws finger-tight (1 Nm). Do not overtighten!
The logger has no internal or external antenna. To enable the GSM connectivity the
delivered external GSM antenna must be connected to the device.
Connect the antenna to the GSM socket . Make sure that the guide on the plug fits in
the groove in the socket and that you feel the plug latch in.
19
Page 20
Commissioning the logger
3.3 Switching the logger On/Off
The logger is switched on by the help of a magnetic switch.
Before switching the logger on, all connected devices have to be
disconnected (unplug connectors) because the internal relays of the logger
are initiated during the switch-on process. Thus, connected devices could be
NOTE
Move the supplied magnet in front of the contact area . After the magnet switch has
been activated, the I/O control lamp
blue after the logger has been started up. The device is now in energy saving mode.
Whenever a radio or GSM connection is established and whenever a data transfer takes
place, the logger automatically switches to data transfer mode.
In order to switch the logger off, the magnet must be held in front of the contact area
for a few seconds while the I/O control lamp
switches to red, the magnet has to be taken away from the contact area. Afterwards, the
logger switches off and the lamp goes out. Make sure to take the magnet away
immediately after the lamp switches to red. Otherwise, the logger reboots right after it
has been switched off.
turned on and off unexpectedly and unintentionally.
is lit green for a moment and starts flashing
is lit orange. As soon as the lamp
Switching the device off has no effect on the measurement data stored. The
measurement data remain in the logger’s memory up to the time at which the device
receives new configuration data.
After being switched off and on again, the logger’s latest configuration still is
stored and can be retrieved, but it is no longer valid. The logger does not resume
measuring.
Furthermore, after being switched off and on again, the logger’s system time is
no longer current.
Therefore, the logger needs to be programmed anew after every restart.
3.4 Programming the logger
Prior to its on-site installation, the logger must be properly configured using the supplied
SebaDataView-3 software. In doing so, the logger has to be provided with the channel
allocation, the alarm conditions and the wireless connection parameters among other
things.
Please refer to the according chapter in order to get a detailed description of how to
program the logger.
20
Page 21
Connecting the logger and installing it on-site
4 Connecting the logger and installing it on-site
4.1 Connecting sensors to the logger
Depending on its configuration, the following peripheral and measuring devices can be
connected to a logger:
• up to 4 sensors can be attached and the data can be logged (e.g. pressure, flow)
• up to 2 alarm-triggering devices (e.g. a light barrier) can be connected to the
switching inputs
• up to 2 devices (e.g. signal lamp, pump) can be connected to the switching outputs
and can be triggered in the case of an alarm
• one hose can be directly connected to the internal pressure sensors
Depending on the type of sensors / alarm devices connected, the appropriate parameter
values have to be provided to the logger using the SebaDataView-3 software. Please
refer to the according chapter in order to get a detailed description of the necessary
configuration steps (see page 42).
External sensors connected cannot be supplied by the data logger. They need a
separate power supply.
4.1.1 Fixed channel allocations
2-channel loggers
4-channel loggers
The internal pressure sensor is always linked to measuring channel 1. The respective
channel is in use and must not be connected to an external sensor.
Due to the internal wiring of the logger, current loops can only be connected to the
channels 2 and 4.
Corresponding to these conventions, the following channel allocations apply for
2-channel loggers which are equipped with a pressure sensor:
Channel 1 Channel 2 Channel 3 Channel 4
Int. pressure sensor
Current loop
X
X
The following channel allocations apply for 2-channel loggers without pressure sensor:
Channel 1 Channel 2 Channel 3 Channel 4
First current loop
Second current loop
X
X
The following channel allocations apply for loggers with 4 measuring channels:
Channel 1 Channel 2 Channel 3 Channel 4
Int. pressure sensor
First current loop
Second current loop
X
X
X
21
Page 22

Connecting the logger and installing it on-site
sensor, the following instructions
4.1.2 Connecting a hose to the internal pressure sensor
If your logger is equipped with a pressure sensor, a hose can be connected directly to
the connector P . In order to do so, your hose has to be equipped with a female
quick-fit connector.
When connecting a hose to the internal
must be noted:
NOTE
The sensors are capable of measuring the pressure of both liquid and gaseous media.
• Pressure sensors are sensitive to overpressure. Do not exceed the
measuring range in order to avoid irreparable damage to the sensor.
• Make sure no dirt or rust can ingress inside the sensors. In case of
doubt, use a filter.
• There must not be any water inside the sensor after use. Otherwise,
frost can damage the sensor.
• After a sensor has been in use or in storage for a longer period, it must
be cleaned with compressed air.
22
Page 23

Connecting the logger and installing it on-site
4.1.3 Connecting sensors
Any connection of a sensor is established via the VK86 connection cable attached to the
IN socket .
One end of the connection cable is equipped with a box providing a terminal block the
colour-coded wires coming from the logger are connected to. Each colour represents a
specific input / output of the logger.
green
(to be connected to IN)
The VK86 connection cable has the following pin assignment:
Wire Description
white
brown
green
yellow
Channel 1 +
Channel 1 –
Channel 2 +
Channel 2 –
Channels up to 4 sensors can be connected to.
grey
pink
blue
red
black
purple
Channel 3 +
Channel 3 –
Channel 4 +
Channel 4 –
not used
not used
To connect a sensor, lead its connecting wires into the box using one of the four cable
glands and connect them to the respective terminal of the terminal block.
When you connect the cable to the IN socket of the logger, make sure that the guide on
the plug fits in the groove in the socket and that you feel the plug latch in.
When you install the measuring system please keep in mind that water and
dust can penetrate the box.
NOTE
23
Page 24

Connecting the logger and installing it on-site
4.1.4 Connecting devices to the switching Inputs / Outputs
The switching input / output connections and the external power supply are established
via the VK76 connection cable attached to the DC ext. socket .
One end of the cable is uncoated and ten colour-coded wires stick out of it. According to
its colour, each of these wires represents a specific input / output of the logger and can
be directly connected to the respective terminal of a peripheral device.
red
(to be connected to
DC ext.)
The VK76 connection cable has the following pin assignment:
Wire Description
white
green
brown
yellow
pink
red
Switching Input 1 An alarm-triggering device with a voltage output of
Switching Input 2
0 … 5 V can be connected between a switching input
and the purple wire (GND).
Relay 1 OUT An electric circuit with an external DC power supply up
Relay 2 OUT
Relay 1&2 IN
to 12 V / 1 A can be connected to each switching
output. If an internal relay is triggered by an alarm
event, the respective circuit is closed and the
connected load is activated / triggered.
External power
supply
An external power supply with 12 V DC can be
connected between this wire and the purple wire
(GND). The internal battery cannot be charged by an
external power supply.
purple
grey
blue
black
GND
not used
not used
not used
If no adequate terminals are existent, a luster terminal or other accessories can be used
to connect a peripheral device. A proper electrical insulation must be ensured.
Make sure that the guide on the plug of the VK76 cable fits in the groove in the
DC ext. socket and that you feel the plug latch in.
24
Page 25

Connecting the logger and installing it on-site
4.1.5 Wiring diagram examples
In the following, some connection examples are described. Depending on the sensor,
the actual wiring diagram and the terminal designation may differ. Please refer to the
respective sensor manual for detailed information.
Output signal type
voltage/frequency/
pulse
Output signal type
current
The following example describes how to connect a sensor with a
0 - 5 V voltage output or 0 Hz - 6000 Hz frequency output or pulse output:
Sensor
Signal
GND
Logger
Channel +
Channel –
The following example describes how to connect a sensor to a 4 … 20 mA current loop:
Sensor
Logger
I +
I –
Channel +
Channel –
A current loop can only be connected to channel 2 or 4.
25
Page 26

Connecting the logger and installing it on-site
Example of an
alarm loop
The following example shows an electrical circuit with DC power source connected to
the switching input of the loggers. If an alarm is raised by the alarm device (e.g. light
barrier) is activated, the circuit is closed and the switching input is triggered. Depending
on the alarm configuration, one or two of the internal relays are switched in order to
activate / trigger the load connected to the respective switching output (in this case a
signal lamp) and a SMS and / or e-mail can be sent to predefined receivers.
Alarms can also be triggered when the value of a monitored measurement crosses a
predefined threshold. Please refer to the corresponding section for detailed information
on how to configure the threshold monitoring (see page 48).
4.2 Positioning the logger
The logger housing is protected against the ingress of dust and water and, thus,
especially qualified for the operation in pipeline shafts where it can be installed next to
the measuring point.
The logger can be installed in vertical and horizontal position or even upside-down and it
can also be hung up using, e.g., a cable tie.
During field installation the following instructions must be observed, in order to ensure
proper operation of the logger:
• Make sure that all connections to sensors of other peripheral devices are
established in a professional manner and that the connection points are properly
insulated.
• When you plug a connection cable in the respective socket, make sure you feel the
plug latch in. Only proper and positive locking connections provide protection
against ingress of water and ensure error-free data transfer.
• Care shall be taken to ensure that cables and their connections are not subjected to
tensile load.
• Do not hang the logger on its connection cables.
• Do not bend the connection cables.
• Make sure the logger is switched on before you leave the site.
26
Page 27

Connecting the logger and installing it on-site
4.3 Positioning the GSM antenna
You have to observe the following instructions when positioning the GSM antenna:
• The GSM antenna must be properly connected to the logger. Make sure that the
guide on the plug fits in the groove in the GSM socket and that you feel the plug
latch in.
• Be aware that thick walls and other barriers do affect the signal strength negatively.
• If the logger is installed underground, e.g. in a pipeline shaft, the antenna should be
positioned as near as possible to the ground surface. The deeper the antenna is
positioned, the smaller is the chance of an adequate reception.
Check the GSM connectivity using the GSM test function of the SebaDataView-3
software (see page 57) right after the GSM antenna has been positioned. If no
connection can be established, a better position has to be found. If necessary, lead the
antenna out of the shaft and bury it a few centimetres under the ground surface.
27
Page 28

SebaDataView-3 software
5 SebaDataView-3 software
SebaDataView-3 (abbreviation: SDV-3) is the multifunctional application software for
working with devices in the ‘Sebalog’ series. You can use it to configure the majority of
devices and read out the measurement data from the devices. The measurement data
can be displayed and analysed in greater detail using various functions on the
computer.
5.1 Installation
System requirements
Installation
Software start
Language selection
Software update
Your machine must meet the following minimum system requirements in order to run the
SebaDataView-3 software:
• PC or notebook with Windows 7® or higher
• min. Pentium IV compatible CPU (at least 2 GHz)
• min. 2 GB memory
• USB interface
• CD ROM drive
To install the software insert the provided CD, execute the installation file and follow the
instructions on the screen. The application is installed to the following folder:
C:\Program Files\SebaKMT\SebaDataView.
Furthermore, a database is created in the Windows standard folder for application data
(see page 38).
Start the application by double-clicking on the desktop icon created during the
installation process. Alternatively, the application can be started via the Windows start
menu.
During start-up you are asked to select the language of the user interface. Make your
choice from the drop-down-list and click on OK.
During start-up, the current version of the software is displayed on the screen. Please
check www.sebakmt.com regularly for updates. To install a new version of the software,
store the respective file on your PC, execute it and follow the instructions on the screen.
28
Page 29

SebaDataView-3 software
Segments
Multifunction
bar (ribbon)
5.2 Function and structure
Introduction
User interface
SebaDataView-3 (SDV-3) is the multifunctional user software for working with devices of
the Sebalog series. Using the software, loggers can be programmed prior to the
measurement. After measurement the recorded data can be queried from the loggers,
displayed and analyzed.
The SDV-3 user interface is based on the Microsoft Office suite (2007 and later).
In all menu levels the display shows the following structure:
Multifunction bar
Directory tree
All function and command buttons are arranged in a panel, called ‘ribbon’, as it is known
from Microsoft Office applications.
Every Sebalog device series that can be managed using the SDV-3 software has its
own ‘tab’. All the commands needed when working with this device are grouped in the
‘segments’ of this tab.
Tabs
Display area
29
Page 30
SebaDataView-3 software
Directory tree
On the left of the screen the directory structure of the software database is displayed. All
the devices added to the database by means of their identification number can be found
in this so called ‘directory tree’.
The directory tree shows the following structure of folders and sub-folders:
Main folder
Folder
Zone
Group
Type of device
Single device (ID)
Display area
All dialogue and display windows of the various functions appear in the display area.
30
Page 31

SebaDataView-3 software
5.3 Device administration
5.3.1 Creating / deleting folders
Create a folder
Delete a folder
To create a new folder in the directory tree, proceed as follows:
Step Description
1
Mark the folder ‘SebaData’, or any other existing folder which the new folder
should be added to as a sub-directory.
2 Open the tab Directory in the multifunction bar.
3 In the segment Folder, click on New.
4 In the window which opens, enter the Name and a Comment for the new folder
and confirm the entries by pressing OK.
Result: The new folder has now been created in the database and will appear in
the directory tree.
To remove a folder from the directory tree, proceed as follows:
Step Description
1
Mark the folder to be deleted.
2 Open the tab Directory in the multifunction bar.
3 In the segment Folder, click on Delete.
4 Answer the security query with Yes.
Result: The corresponding folder is removed from the directory tree.
If a folder is deleted, all loggers/devices assigned and all the collected data are
deleted, too.
5.3.2 Creating / deleting zones
Create a zone
To create a new zone in the directory tree, proceed as follows:
Step Description
1
Mark the folder in the directory tree in which the new zone should be created.
2 Open the tab Directory in the multifunction bar.
3 In the segment Zone, click on New.
4 In the window which opens, enter the Name and a Comment for the new zone
and confirm the entries by pressing OK.
Result: The new zone has now been created in the database and will appear in
the directory tree.
31
Page 32

SebaDataView-3 software
Delete a zone
To remove a zone from the directory tree, proceed as follows:
Step Description
1
Mark the zone to be deleted.
2 Open the tab Directory in the multifunction bar.
3 In the segment Zone, click on Delete.
4 Answer the security query with Yes.
Result: The corresponding zone is removed from the directory tree.
If a zone is deleted, all loggers/devices assigned and all the collected data are
deleted, too.
5.3.3 Creating / deleting groups
Create a group
To create a new group in the directory tree, proceed as follows:
Step Description
Delete a group
1
Mark the zone in the directory tree in which the new group should be created.
2 Open the tab Directory in the multifunction bar.
3 In the segment Group, click on New.
4 In the window which opens, enter the Name and a Comment for the new group
and confirm the entries by pressing OK.
Result: The new group has now been created in the database and will appear in
the directory tree.
To remove a group from the directory tree, proceed as follows:
Step Description
1
Mark the group to be deleted.
2 Open the tab Directory in the multifunction bar.
3 In the segment Group, click on Delete.
4 Answer the security query with Yes.
Result: The corresponding group is removed from the directory tree.
If a group is deleted, all loggers/devices assigned and all the collected data are
deleted, too.
32
Page 33

SebaDataView-3 software
5.3.4 Adding / deleting single devices
Add a device
To add a device to a group in the directory tree, e.g. a logger, proceed as follows:
Step Description
1
Mark the group in the directory tree to which the device should be added.
2 In the multifunction bar, open the tab LogD3.
3 In the segment Administration, click on New.
4
In the window which opens, enter the Identification Number (ID) of the device or
use the "Automatic detection" (find more information below in the text).
Click on OK to add the device to the group.
Result: The new device has now been created in the database and will appear in
the directory tree.
Add more devices to the group successively or close the window.
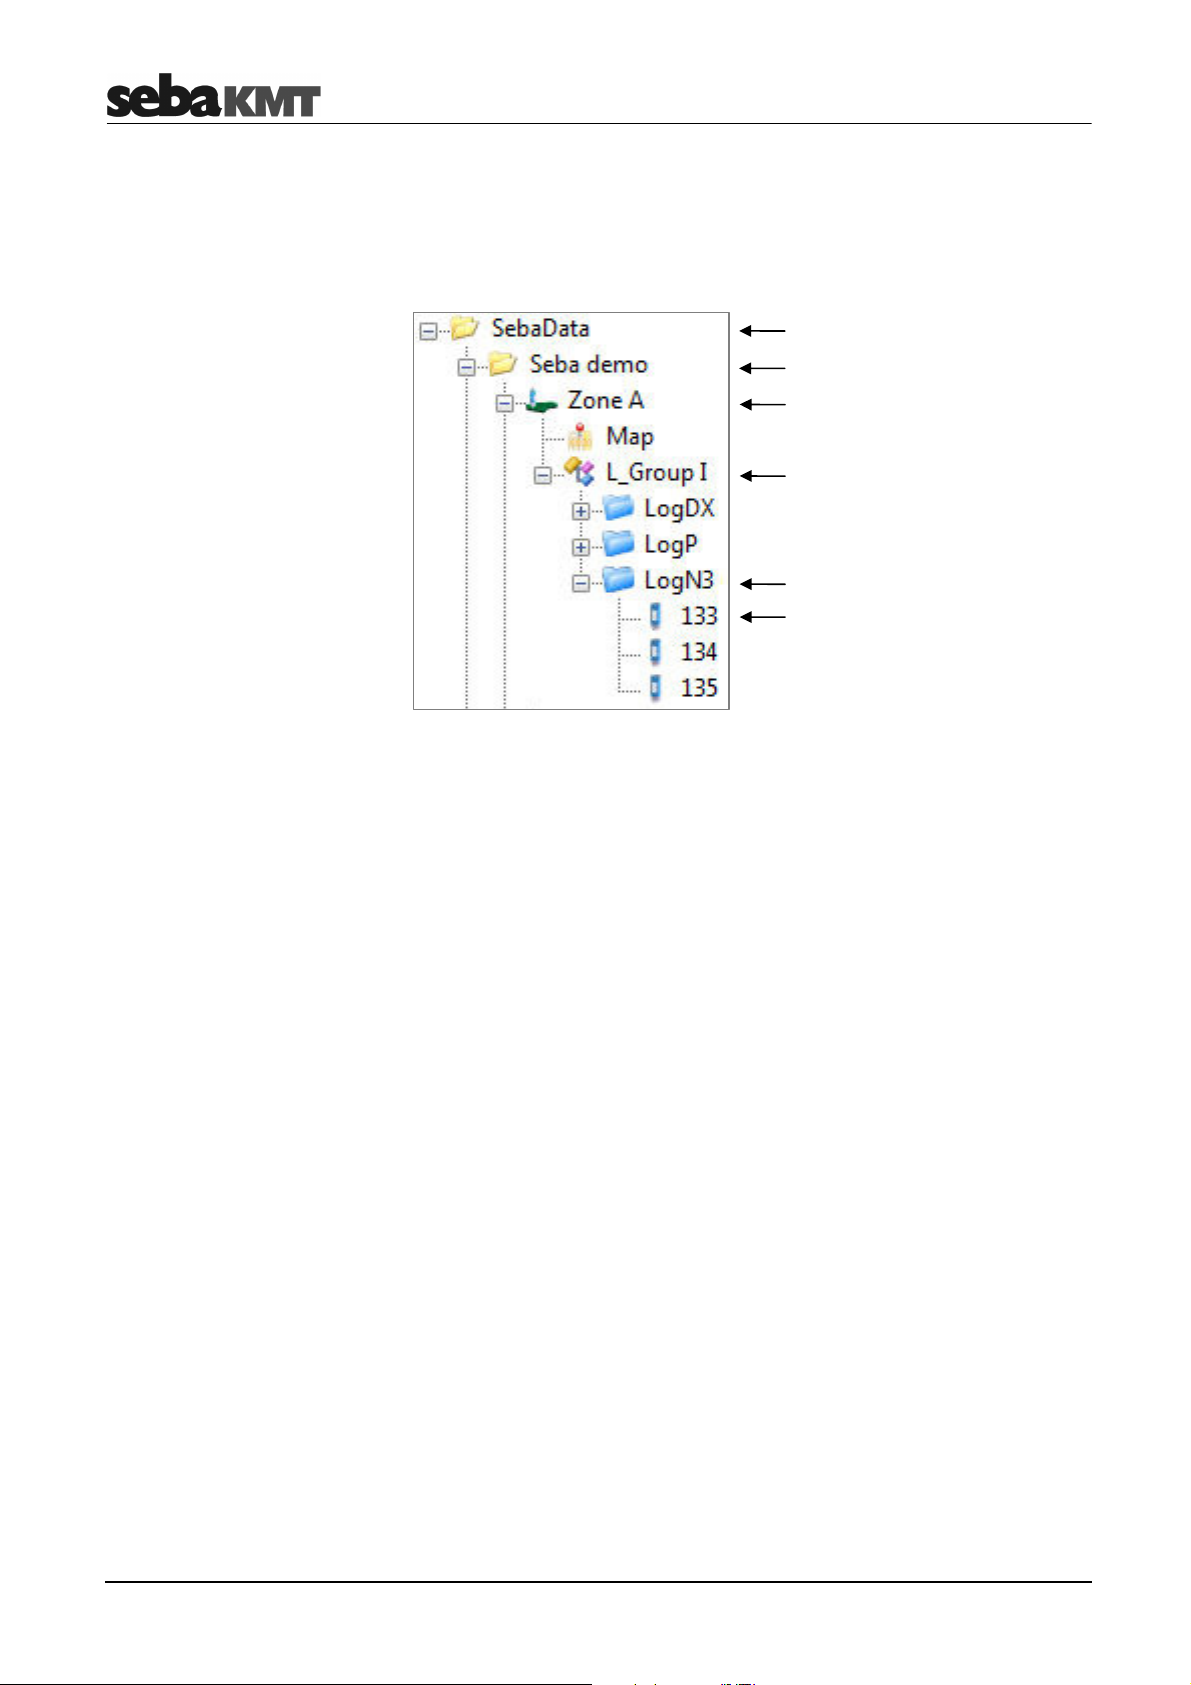
There is the possibility to add devices of different types to the same group. Then,
automatically new sub-directories are created by the software to which the
various devices are added according to their type.
Example: "Group I" has LogDX, Log P and Log N3 loggers:
Automatic detection
A radio interface (e.g. Log RI) needs to be connected to the computer in order to be able
to use the „Automatic detection“ when signing on devices.
Tick the checkbox „Automatic detection“ in the window which opens. Then bring the
device which has to be turned off near the computer and switch it on. The identification
number of the device will be recognised and displayed on the screen.
Click OK or Insert in order to accept the ID and to add the device to the group.
If you tick the checkbox „Automatic insertion“, the recognised devices will be added
automatically to the group.
33
Page 34

SebaDataView-3 software
Delete a device
To remove a device from the directory tree, proceed as follows:
Step Description
1
Mark the device to be deleted.
2 In the multifunction bar, open the tab LogD3.
3 In the segment Administration, click on Delete.
4 Answer the security query with Yes.
Result: The corresponding device with all its measuring data is removed from the
directory tree.
34
Page 35

SebaDataView-3 software
5.4 Map function
You have the opportunity to mark the location of installation of each of your devices on a
virtual map. Thus, you obtain an overview of the zone and all the devices used.
5.4.1 Creating a map
Introduction
Import an image file
You have the chance to import any image file into the software - e.g., a sector of a pipe
network plan or a detail of a map, etc.
If you have access to the Internet, the software also provides the possibility to call up
the ‘Google Maps’ web service, in order to create a map of the respective zone.
To import an image file and add it to a zone in the directory tree, proceed as follows:
Step Description
1
Mark the zone in the directory tree to which the map should be added.
2 Open the tab Directory in the multifunction bar.
3 In the segment Pipe network, click on Graphic file.
4
Use the window that opens to navigate to the source folder, from where the image
file is to be imported (‘jpg’, ‘bmp’ and ‘png’ format are possible).
Select the file and click on OK.
Result: The image file is imported into the software and now appears in the
directory tree in the form of a sub-folder called Map.
A new window opens, where the newly created map is shown.
5
To mark the place of installation of a device, in the directory tree click on the
device concerned, keep the left mouse button pushed and drag the device to the
point desired on the map displayed.
Proceed in the same way to place the other devices of the zone on the map.
Create a map using
‘Google Maps’
To create a map using the ‘Google Maps’ web service and add it to a zone in the
directory tree, proceed as follows:
Step Description
1
Mark the zone in the directory tree to which the map should be added.
2 Open the tab Directory in the multifunction bar.
3 In the segment Pipe network, click on Google Maps.
Result: A connection to ‘Google Maps’ is established. A new window opens,
showing the known ‘Google Maps’ user interface. Aditionally, you find some input
fields and controls.
4
To get a certain destination area displayed, use one of the following options:
• Mark the checkbox Address and enter the destination adress desired into the
field right beside, or
• mark the checkbox Coordinate and enter a GPS position, using the fields
Latitude and Longitude.
Confirm your entry by pressing the ENTER key on your keyboard.
5
Use the known tools of the ‘Google Maps’ user interface (moving, zooming, etc.)
to customize the map section displayed.
(continued on the next paage)
35
Page 36

SebaDataView-3 software
Symbol of the
Step Description
6 Click on OK.
Result: The adjusted map section is stored as an image file and now appears in
the directory tree in the form of a sub-folder called Map.
A new window opens, where the newly created map is shown.
7
To mark the place of installation of a device, in the directory tree click on the
device concerned, keep the left mouse button pushed and drag the device to the
point desired on the map displayed.
Proceed in the same way, in order to place the other devices of the zone on the
map.
5.4.2 Executing a map
To open the map window of a zone, in the directory tree double-click on the Map
sub-folder of the zone concerned.
Menu bar
Map section
The markings, indicating the positions of the single devices on the map, show the
following design:
type of device
Text box
Thanks to the pictogram (symbol), the type of device marked can easily be recognized.
The text box shows ‘type & identification number’ or the ‘comment’ of the device marked
- depending on the settings made in the Pipe network segment of the multifunction bar
(see page 36).
Create a marking
To mark the place of installation of a device, in the directory tree click on the device
concerned, keep the left mouse button pushed and drag the device to the point desired
on the map displayed.
36
Page 37

SebaDataView-3 software
To move a marking on the map, proceed as follows:
Description
In the menu bar of the window, click on
Click on the marking concerned, keep the left mouse button pushed
to a new position.
Finally, click on the
You have the chance to
Proceed as follows:
Description
In the menu bar of the window, click on
On the map
For this,
cursor diagonal
In order to undo the last steps click the arrow button
In order to leave the magnified map view click once again the
You have the chance to costumize the map view. For this purpose, open the
tab of the multifunction bar. There, in the
checkboxes are available:
ymbol
device
omment
button once again in order to deactivate it.
get a section of the map magnified in an extra window.
to mode „enlarge“
click on the map, keep the left mouse button pressed and move the
in the menu bar.
Zoom
he map section is
corresponding to the size of the window displayed
is disabled, the size of the map remains static.
he text box of the markings is
of the markings is
text box of a marking shows
” of the device.
text box of a marking shows
Move a marking
Zoom function
Undo last step
Step
1
2
3
Step
1
2
Result:
Result:
(
Result:
Select.
The mode of the cursor changes from ‘show’
Select
Zoom.
The cursor changes from mode „show“
, mark the area that is to be magnified.
ly across the area of interest.)
The map section selected is magnified.
to ‘select’ .
and move it
.
Costumize the view
Option
100 %
Show text
Show s
Show
Show c
Pipe network
Description
If this checkbox is enabled, t
If it
If this checkbox is disabled, t
If this checkbox is disabled, the pictogram
ID
If this checkbox is enabled, the
and the identification number
If this checkbox is enabled, the
comment/name of the device.
button.
Directory
segment, the following
scaled up or down
hidden.
hidden.
the type
the
37
Page 38

SebaDataView-3 software
5.5 System settings
In the System settings menu you can make various basic settings for use of the SDV-3
software or specify frequently recurring parameters etc.
To open the menu, first click the water drop symbol in the top left. Then, click the
Settings button in the appearing context menu.
A new window appears showing the system settings menu:
5.5.1 Managing the storage location of the measurement database
During installation of the software, a directory with the name ‘data’ is created on the
computer by default. All recorded data is saved to this directory.
In the system settings of the software, you have the option to display the current storage
location of the measurement data or set up another storage location.
To get access to the storage location management tools, you have to open the Default
tab.
Displaying the
storage location
Changing the
storage location
To display the current storage location of the measurement data, click Open in the
Database storage location segment. The current target directory opens in an Explorer
window. (With the default setting, it is the ‘data’ directory mentioned above.) The precise
target path is displayed in the address line.
You have the option to define another storage location in place of the standard target
directory of ‘data’.
Select the Other radio button in the Database storage location segment. Then click
Search (Browse) and use the Explorer window that opens to set a new target directory.
After the next restart of the software, all newly saved measurement data will be saved in
this folder. All previously saved measurement data remains in the previous target folder.
There is no longer access to this data from SDV-3.
If you define a new storage location and want to still have access to the previously
saved measurement data, you need to first move the entire previous target directory to
the new storage location. Only after you do this should you set the new target path, as
described above, by selecting the Other checkbox and defining the new target path by
pressing the Search (Browse) button.
38
Page 39

SebaDataView-3 software
5.5.2 Saving access data for FTP server and email account
Introduction
Procedure
Various devices in the Sebalog series are equipped with an integrated GSM modem.
This means that they can
• send messages per SMS or email (e.g. alarm messages), as well as
• upload measurement data to an FTP server.
Every time the devices are programmed the access data for the sending email account
or the access data for the FTP server being used must be entered.
If you wish you can save the data for an email account as well as the FTP server data
permanently in the software. When programming the saved access data can then simply
be accepted into the input screen ‘with a click of the mouse’.
To store access data in the software, proceed as follows:
Step Description
1 In system settings open the FTP tab.
Result: The following entry screen then appears in the window:
The FTP Settings segment contains boxes for entering access data for your FTP
server. You can ask your company's system administrator or the server operator
for this data or it is available in your FTP usage agreement.
The Email Settings segment contains boxes for entering the access data for the
sender email account, if messages are to be sent per email. The data will be
assigned to you by the operator of the mail account, or by your system
administrator. In the Sender name field, you can enter any name, which will
subsequently be used to identify the device which is the sender of the alarm
message.
2 Click the relevant Use own settings checkbox.
3
Enter the access data in the input fields.
4 Click on OK to confirm the details and to close the window.
Result: The access data are now permanently stored in the software. When
programming the devices a checkbox is shown for each of the steps in the entry
area, with which the stored access data can then be inserted.
Only when the Use own settings checkbox has been activated will it be possible
at a later stage to access the stored data for programming purposes.
If the checkbox has not been activated, the user is then offered a choice of using
a SebaKMT demo FTP server and/or a demo email account.
39
Page 40

SebaDataView-3 software
5.5.3 Getting information about the current device state
When programming a device, in the configuration window the State segment can be
found. This segment provides various information about the device's current state, e.g.
the battery level, the system date and time or the firmware version used.
The data refer to the time of the last data readout.
In order to get the latest information, you can read the device's configuration. (For this,
locate the switched on device within the computer's radio range, select the device in the
directory tree of the SDV-3 software, click on Program in the multifunction bar and then
on Read in the appearing configuration window.)
5.6 Updating the firmware of a device
Introduction
SebaKMT makes improved versions of the firmware available in the download area of
www.sebakmt.com on a regular basis. We recommend that you keep the firmware of all
devices current at all times.
In order to determine which firmware version is currently installed on a device, you can
read the device's configuration. (For this, locate the switched on device within the
computer's radio range, select the device in the directory tree of the SDV-3 software,
click on Program in the multifunction bar and then on Read in the appearing
configuration window.) The version of the firmware is displayed in the State segment of
the configuration window.
All data stored in the device’s internal memory may be deleted by the firmware
update. Therefore, retrieve all data from the device before carrying out an
update.
40
Page 41
SebaDataView-3 software
List of the devices
that are to be
Procedure
To update the firmware of one or more devices, proceed as follows:
Step Description
1
Download the file for the update from the download area of www.sebakmt.com
onto your computer.
2
Open the SebaDataView-3 software.
3
Click the water drop symbol on the top left of the window and select the
option Firmware Update in the window that opens.
Result: The Firmware Update screen opens.
List of the devices
that were updated
updated
4
In the drop-down list in the top left, select the type of devices whose firmware is to
be updated.
Several devices can be updated at the same time. However, they all need to be of
the same type – just LogN3 loggers or just LogDX loggers, for example.
5
At the top of the list on the left, click the folder symbol .
A new input field opens.
There, enter the identification number (ID) of the relevant device, and confirm with
the ENTER key on your keyboard.
Repeat the process until all devices to which the firmware update is to be
transferred are in the list.
If you want to remove a device from the list, select the relevant ID and click the
symbol for ‘Delete’ at the top of the list.
If you want to change the position of a device within the list, select the relevant ID
and move it up or down with the arrow keys .
6 In the Update file segment on the lower left of the window, enter the location
where you saved the update file that you downloaded to your computer in step 1.
To do this, click the folder symbol and use the Explorer window that opens.
7 Click OK to start the firmware update.
Result: The update file is transferred to the devices and installed there. A bar
under the list on the right shows the progress of this process. After the file is
installed, each device restarts automatically. The IDs of the successfully updated
devices switch from the left to the right side on the screen. As soon as the
firmware update is successfully completed for all devices, a corresponding
message appears in the update window.
41
Page 42

Programming the logger
6 Programming the logger
Introduction
Requirements
Procedure
Before a logger can be installed in the field, the device has to be properly configured. In
doing so, you can specify the inputs, the logging intervals, the alarm conditions and the
radio communication settings, among other things.
The device must be switched on and a connection between the device and the
computer is needed.
For a radio link
• an interface must be connected to the computer (e.g. Log RI),
• the device must be within the computer’s wireless range.
In order to program the device, proceed as follows:
Step Description
1
In the SDV-3 software, select the relevant device in the directory tree.
2 In the menu bar, in the segment Communication, click on Program.
Result: The window for programming opens.
3
If the fields displayed can not be edited, you have to retrieve the effective
configuration data from the device, first. (This usually has to be done when a
device has newly been added to the software.)
Click on Read to read
out the data directly from
the device.
Click on Read settings to download the data from a
FTP server.
(Requirements:
• internet access
• the FTP access information must have been stored
in the SDV-3 settings (see page 39)
4
Enter all the required data.
5
To finish the entry and to transmit the configuration settings to the device, click on
Program.
You find detailed information about the necessary programming steps in the following
sections.
42
Page 43

Programming the logger
6.1 Selecting the logging interval
You can select the time interval in which the measured values are logged from the
Log Interval drop-down list.
6.2 Configuring a measuring channel
Introduction
Activating channels
Depending on its configuration, up to 4 sensors can be connected to a logger. In order
to evaluate the logged data in the right way, the logger needs to know which type of
sensor is connected to which channel.
Make sure that the sensor configuration is consistent with the effective connection
setup. Each channel is linked with specific wires of the VK86 connection cable (see
page 23).
Please pay regard to the fixed channel allocations (see page 21) when configuring
internal pressure sensors or sensors with current output.
Make sure you enter the values in the same format as shown in the figures.
First of all, you have to specify which channels are in use (connected to a sensor) during
the upcoming operation period. A channel can be activated by marking the respective
On/Off checkbox exemplified by the following figure:
Configuring a channel
After a channel has been activated, it has to be specified which type of sensor is
connected to the channel. Click the respective Configure button. The following window
appears:
43
Page 44

Programming the logger
6.2.1 Selecting the type of sensor
Introduction
Procedure
The physical value measured by the sensor is transformed into an electrical signal (e.g.
voltage, pulses, frequency) which is used to transmit the data to the logger. In order to
transform this carrier signal back into the original physical values, the logger needs to
know how the ranges are correlated to each other.
Select the sensor connected to the channel from the drop-down list on the upper left of
the window. If your sensor type is not contained in the drop-down list, select the
User-defined entry.
The sensors contained in the list are parameterized. The signal conversion data are
already populated and cannot be edited. Usually, no further configuration is required.
In some cases you have the chance to specify the unit for the recorded values e.g. ‘m3/h‘ or ‘l/sec‘.
Furthermore, with some flow sensors you have the chance to compare your results to
the values of a water meter. For this purpose, enter the water meters’ meter reading into
the displayed field prior to the measurement. The logger will then accept this count as a
starting point for the measurement.
6.2.1.1 Configuring an Internal Pressure Sensor
Most parameters of the internal pressure sensor are filled in automatically and cannot
be edited.
Unit
Recording
pressure surges
You have the chance to select the unit for the recorded pressure. Use the drop-down
list.
If you want sudden pressure fluctuations, known as pressure surges, to be recorded in
addition to the standard pressure measurement, select the Record Press Shocks
checkbox
Using the input field to the right of the checkbox, you specify how much a measuring
value has to differ from the previous value in order to classify a pressure fluctuation as a
‘pressure surge’.
Example: If ‘0.5’ is set, pressure surge recordings start as soon as a measuring value
is min. 0.5 bar higher or lower than the preceding value.
By means of the High resolution checkbox you can specify which sampling interval
should be used for the 60 second pressure surge recordings:
• checkbox de-selected: 1 sec sampling interval
• checkbox selected: 0.1 sec sampling interval
Using the short 0.1 sec interval allows a more detailed recording.
Please note that the high resolution recording of pressure surges requires more
energy and, thus, has a strong negative impact on the logger’s battery life.
The recording of pressure surges is parallel to the standard pressure measurement and
has no effect on this.
44
Page 45
Programming the logger
6.2.1.2 Configuring a ‘user defined’ sensor
Introduction
Configuring the
input type
In the case of a ‘user defined’ sensor which is not contained in the mentioned
Drop-Down-List, the input type (carrier) and the unit of the physical value have to be
specified manually. Furthermore, the upper and lower thresholds of the input signal and
the correlating measurement values have to be specified.
Perform the following steps to configure the input type of a ‘user defined’ sensor:
Step Description
1
Select the type of signal, the sensor uses to pass the measured data to the logger
from the Input type drop-down list.
2
Select the unit of the physical value measured by the sensor from the Unit dropdown list.
3
Depending on the selected input type and value, some additional fields may need
to be populated with the upper and lower thresholds of the input signal and the
correlating measurement values.
Input signal thresholds Correlating measured values
For detailed information about the input type and the ranges, please refer to the
manual of the connected sensor.
45
Page 46
Programming the logger
6.2.1.3 Input type examples
Input type Voltage
A 10 bar pressure sensor with voltage output is connected to a channel of the logger.
Input type:
Unit:
The lower limit of the measuring range (0 bar) is indicated by a voltage value of 0 V
while the upper limit (10 bar) correlates with 5 V. As a result, the fields must be
populated as follows:
NOTE
Voltage 0-5V
bar
The maximum permissable input voltage is 5 V.
Input type Frequency
A level meter with frequency output is installed in a 430 l tank.
Input type:
Unit:
The maximum level of 430 l is indicated by a frequency of 6000 Hz. As a result, the
fields must be populated as follows:
The maximum permissable frequency is 6000 Hz. If the connected sensor
transmits higher frequencies, a frequency divider must be interconnected.
Frequency
l
46
Page 47

Programming the logger
Input type Pulse
A flowmeter with a digital pulse output is connected to a channel of the logger. The
flowmeter transmits one pulse per 16 litres.
Input type:
Unit:
The checkbox Fast-pulse-mode must be activated if a sensor is used with a
pulse rate >50 Hz (ie, more than 50 pulses per second). Otherwise, it may result in
inaccurate measurements.
Select whether the flow shall be measured per hour or per second.
If you want to compare your results to the values of a water meter, you have the chance
to enter the water meters’ counter reading into the respective field prior to the
measurement.
Pulse
l
Determining the flow
direction
A flowmeter is connected to channel 3. In addition to the flow rate itself, the flow
direction shall be determined. For this purpose, a sensor which indicates the flow
direction by means of voltage values is connected to another channel of the logger.
Input type:
First of all, it has to be specified which direction is indicated by the 5 V value. A voltage
value of 0 V automatically indicates the opposite direction.
Furthermore, the channel (flow), the determined flow direction applies to, has to be
selected (in this case Channel 3).
Sign slave for other channel
47
Page 48

Programming the logger
6.2.2 Configuring alarm conditions (Threshold monitoring)
Introduction
Configuring
alarm destinations
The device can trigger an alarm whenever a specified minimum or maximum threshold
is crossed. That way,
• alarm messages can be sent via SMS and / or e-mail (if GSM connectivity has been
established and properly configured)
• an unscheduled measuring data upload to your FTP server can be performed (if
GSM connectivity has been established and properly configured)
• up to two connected devices (e.g. a pump or a valve) can be triggered by the
internal relays
Alarm thresholds have to be specified for each channel individually.
Specify under Alarm Destinations which Internal Relay shall switch to trigger the
connected device and which type of alarm message shall be sent
(SMS and / or e-mail and / or data upload to FTP server).
If a maximum level is set, the activated relay will trigger a connected device to switch on
as soon as the max. level is exceeded. The device is switched off, as soon as the signal
falls back below the threshold. This process takes place vice versa for a minimum level.
The minimum and the maximum threshold cannot be assigned to different relays. If both
levels are set, each of the activated relays will switch as soon as one of the thresholds is
crossed, no matter which one.
A relay cannot be assigned to more than one alarm. If a relay is already included in an
existing channel configuration, it cannot be used in combination with any other channel
or switching input.
48
Page 49

Programming the logger
Configuring
alarm trigger
Perform the following steps to configure the alarm thresholds:
Step Description
1 In the segment Alarm Trigger – Settings specify whether there is a minimum
and / or a maximum threshold to be monitored by activating the respective
checkbox(es).
2
Enter the minimum and / or the maximum threshold into the respective field(s).
3
A hysteresis can be defined for alarm input preventing a constant triggering of the
alarm by measuring values fluctuating marginally around the threshold.
Enter a Hysteresis value. The Hysteresis value in percent designates a
symmetrical range around the specified threshold the input signal can fluctuate in
without having an impact on the current alarm status.
Example: (pressure sensor)
Min. level: 2.0 bar
Hysteresis: 10 %
The alarm does not switch on until the input signal reaches 90 %
of the specified threshold (here 1.8 bar). After this, the alarm does not
switch off until the input signal exceeds 110 % of the threshold
(here 2.2 bar).
Select a Debounce value. The input signal must cross the specified threshold not
only one time in order to switch an alarm on or off, but two times more after
specific periods of time. These periods of time, called ‘debounce’, always are a
multiple of the specified logging interval.
Example: (pressure sensor)
Logging interval: 5 sec
Min. level: 2.0 bar
Debounce: 15 sec
The alarm does not switch on until the input signal crosses the specified
threshold (2.0 bar) three times in succession (15 seconds).
4
Select the days of the week alarming should be active on by marking the
respective checkbox(es).
49
Page 50

Programming the logger
Defining exceptions
The segment Alarm Trigger – Exceptions offers the possibility to modify the alarm
setting, entered under Alarm Trigger - Settings, for specific periods of time (certain
days of the week or even periods of time in a day).
Example: The following picture shows a possible setting:
Here, from Monday to Friday an alarm is switched on as soon as the input signal
falls below a value of 2.0 bar (set in Alarm Trigger – Settings segment), but from
2 to 4 o’clock in the morning a threshold of 4.0 bar is valid (set in Alarm Trigger –
Exceptions segment).
6.2.3 Finishing the sensor configuration
Confirm and save the configuration of a channel by clicking the OK button.
Perform the configuration for the remaining channels.
50
Page 51

Programming the logger
6.3 Configuring the alarm inputs
Introduction
Activating an
alarm input
Depending on its configuration a logger can be equipped with up to two switching inputs
(alarm inputs) which can be connected to active circuits. For each of these inputs it can
be specified which input voltage value causes an alarm.
As known from the channel configuration, an alarm can trigger up to two internal relays.
If your logger is equipped with a GSM modem, alarm messages can be sent via SMS
and / or e-mail. Furthermore, an unscheduled measuring data upload to your FTP server
can be performed in case of alarm. For that, GSM connectivity must be established and
properly configured.
First of all, you have to activate the Alarm Inputs which are going to be part of an alarm
input during the upcoming operation period by marking the respective On/Off checkbox:
Configuring an
alarm input
After an alarm input has been activated, it must be specified which input voltage value
causes an alarm and which actions are triggered by an alarm.
Click the respective Configure button. The following window appears:
Proceed as follows to configure an alarm input:
Step Description
1
Specify the input voltage value which does, when present at the switching input,
trigger an alarm.
51
Page 52

Programming the logger
Step Description
The input voltage threshold is 2.5 V. Any voltage value below 2.5 V is interpreted
as 0 V while voltages higher than 2.5 V are interpreted as 5 V. In order to ensure
a reliable classification, the actual voltage values should not be too close to 2.5 V.
2 Specify under Alarm Destinations which type of alarm message shall be sent
(SMS and / or e-mail and / or data upload to FTP server) and which
Internal Relay shall switch to trigger the connected device.
3 Confirm and save the settings by clicking the OK button.
A relay cannot be assigned to more than one alarm. If a relay is already included
in an existing channel configuration, it cannot be used in combination with any
other channel or switching input.
52
Page 53

Programming the logger
6.4 Configuring the mobile communication
Introduction
Procedure
If your logger is equipped with an internal GSM modem, data transfer and alarm
messaging via UMTS / GPRS can be realised.
For this purpose, a UMTS / GPRS-enabled SIM card (data contract) is required which
can be obtained from almost any local mobile network operator.
Usually, all the data required to set up mobile data transfer is provided within the
mobile network contract. Further information can be obtained from the website or
the hotline of the mobile network operator. If necessary, request guidance for
setting up data communication in particular. SebaKMT cannot provide any
specific technical advice in this case.
Proceed as follows to set up data communication via UMTS / GPRS:
Step Description
1
Make sure the logger has been properly prepared for GSM connectivity (see
page 18).
2 In the Communication segment of the window, select the GSM active checkbox
in order to enable the GSM function.
3 Click the Configure GSM button.
Result: The GSM configuration dialogue appears.
4
Enter all the requested data. (You find more information about the configuration
dialogue below in the text).
5 Carry out a GSM test to check the functionality of the GSM connection. (You find
more information about testing the GSM connection below in the text).
6 Confirm and save the settings by clicking the OK button.
53
Page 54

Programming the logger
6.4.1 Explanations about the GSM configuration dialogue
The picture shows the GSM configuration dialogue:
You find explanations on the individual segments of the configuration dialogue in the
following table:
Segment Parameter
SIM Card Settings
FTP transfer
Enter the PIN code of the SIM card which is being used in the
device (see mobile communication contract or ask your provider).
If you want the logged data to be transferred to a FTP server
daily, select the Active checkbox. Under Daily upload time you
have the chance to specify the time at which this upload should
take place.
If you wish a second measuring data upload every day, select the
2nd upload checkbox and specify the desired time for this second
upload.
If you select the send Event List checkbox, simultaneously with
the measuring data upload another file is sent to the FTP server
containing the last 100 alarm events and GSM connection
establishments of the device. These information can then be
added to the device’s ‘event list’.
If you want the upcoming measurement to be a StepTest, select
the FTP Step Test checkbox. As a result, the device starts
logging right after having received its configuration data.
54
Page 55

Programming the logger
Segment Parameter
SMS checkbox
and
E-Mail checkbox
Every recorded value is immediately uploaded to the FTP server,
so that the measurement can be monitored from any Internetcapable computer.
If you select the Configurable via FTP checkbox, the device
checks the FTP server for new configuration data after every
measuring data upload. The new configuration data is
downloaded and immediately installed on the device.
To enable the alarm messaging service via SMS (regular status
messages and/or alarm messages), select the SMS checkbox.
To enable the alarm messaging service via e-mail (regular status
messages and/or alarm messages), select the E-Mail checkbox.
Use the radio buttons to select, which messages you want to
receive:
• Alarm only
You will receive alarm messages only
• Status daily
You will receive alarm messages and, beyond, a status
message once a day
• Status weekly
You will receive alarm messages and, beyond, a status
message once a week
Furthermore, specify the point in time and, if required, the day of
the week, the status message shall be sent. (Time values are
specified in 24-hour format.)
Each alarm message contains:
• ID of the sender device
• sending date and time
• number of the measuring channel concerned
• alarm reason and alarm value
Each status message contains:
• ID of the sender device
• sending date and time
• the highest and the lowest measured values of each
measuring channel (seit der letzten Statusmeldung)
• flow rate seit der letzten Statusmeldung (nur bei
Durchflusssensoren)
SMS Destination
Specify up to three mobile phone numbers here to which
summary or alarm messages should be sent.
E-mail Destination
Specify up to two e-mail addresses here to which summary or
alarm messages should be sent.
E-mail Settings Enter the SMTP server address, user name and password for
the e-mail account from which alarm or status messages are to be
sent.
55
Page 56

Programming the logger
Segment Parameter
(Usually, this kind of information can be obtained from the ‘How to
configure an e-mail client’ tutorial on the providers’ website.
Username and password can be specified during the account
setup procedure or can be requested from the operator of the mail
account or from your system administrator. SebaKMT does not
provide e-mail accounts.)
Maybe the access data for your e-mail account are already stored
in the database of the software (see page 39). To use these
stored data, select the Use own server checkbox. The data are
then filled in automatically.
The Seba Demo Mode checkbox offers the chance to use a
demo account run by SebaKMT. The respective data are filled in
automatically. However, the Seba Demo Account is for
demonstration purposes only!
Internet Settings
Enter the data required for internet access (see mobile
communication contract or ask your provider).
If you can find your provider in the Templates drop-down list and
you select it, then the aforementioned data will be entered
automatically.
FTP Settings Enter the Server address, port, user name and password for
the FTP server. (These information can be obtained from your
administrator or your internet service provider.)
Maybe the access data for your FTP server are already stored in
the database of the software (see page 39). To use these stored
data, select the Use own server checkbox. The data are then
filled in automatically.
The Seba Demo Mode checkbox offers the chance to use a
demo FTP server run by SebaKMT. The respective data are filled
in automatically. The logged measuring data will be transferred to
this server. However, the Seba Demo Server is for demonstration
purposes only!
56
Page 57

Programming the logger
6.4.2 Testing the mobile connection
You have the chance to check the functionality of the GSM connection.
Please note that the GSM test will reprogram the GSM settings of the device.
Furthermore, all measurement data in the device will be lost.
Requirements
Procedure
Test FTP file
Test SMS / e-mail
In order to perform a GSM test,
• the GSM configuration must have been already finished (see previous sections),
• a radio interface has to be connected to the computer (e.g. Log RI),
• the device must be within the computer’s wireless range and it has to be switched
on.
Proceed as follows to carry out a GSM test:
Step Description
1
In the SDV-3 software open the GSM configuration dialogue of the respective
device (see previous sections).
2 On the upper right of the window, click on the Test button.
Result: The device dials into the mobile network. It sends a test SMS or e-mail
respectively. Furthermore, it tries to create a test file in the target folder of your
FTP server.
If the transmission has been successfully completed, you find a test file with the name
“ftp-test.txt” on your FTP server. It contains date and time of the test.
All addressees should receive a SMS or e-mail containing the following information:
• Type of device and identification number
• Date and time of the test
• Signal quality
0-1 … bad
2-15 … average
16-30 … good
In the case of bad signal quality (SignalQ 0 or 1), it may help to move the GSM antenna
in a better position.
Debugging
If no file is created in the folder of the FTP server or no SMS / e-mail has been received,
the test failed. Then, use the Event list button to retrieve the event list from the device.
There, information can be found which can help to identify the problem.
57
Page 58

Programming the logger
6.5 Adjusting the start time of data recording
The point in time, the device shall start logging, has to be defined under Record.
Use the controls to specify a start date and time or click on the Current time button to
get the system date and time of the computer filled in.
If the entered recording start lies in the past, seen from the point in time the device is
receiving the configuration data, the device starts data storage immediately.
6.6 Adjusting the memory mode
The device has 4 MB internal memory.
By checking the Ring memory checkbox under Memory Mode, the logger can be set to
‘ring buffer’ mode. As the memory fills up with data in this mode, the device keeps
logging and the respective oldest value is overwritten.
If the Ring memory checkbox is not selected, measuring data storage stops as soon as
the logger’s memory is full.
6.7 Checking the device status
6.8 Finishing the programming
Adding a comment
Transmitting the
configuration data
Some characteristic data about the device are listed under State (e.g. remaining
memory, battery condition, system time, firmware version etc.).
The data has been derived during the last data or configuration readout.
By adding a comment to the Comment field you can take some notes, e.g., on the
location of the device.
Click on the Program button in order to finalize the configuration.
Thereupon, the data is transmitted to the data logger. After the settings have been
saved on the device, a confirmation message appears.
If no connection to the device can be established, an error message appears. Check the
link between device and computer and try to transmit the data again.
58
Page 59

Retrieving and evaluating data
7 Retrieving and evaluating data
7.1 ‘Realtime Measurement’ function
Using the real-time measurement function you have the chance to carry out a
measurement and observe the data recording in real-time. Also a current measurement
can be observed.
Requirements
Procedure
For the realtime measurement the device must be switched on and a connection
between device and computer is needed.
For a radio link
• a radio interface must be connected to the computer (e.g. Log RI)
• the device must be within the computer’s wireless range.
Proceed as follows to retrieve and display live data:
Step Description
1
Select the relevant device in the directory tree of the SDV-3 software.
2 In the menu bar in the segment Communication, click on
Realtime measurement.
3
From the context menu select if the ‘live’ measuring values should be displayed
graphically (select: graph) or numerically (select: digital).
In the digital view the measured value of each active channel is displayed
numerically in a table:
In the graphical view, the continuous curves in the top diagram show the last 10
taken values. The bottom diagram shows the entire realtime measurement:
Storing the data set
Result: If a measurement already is in process, the values of this recording are
displayed. Otherwise, a new measurement is started and the taken ‘live’ data is
shown.
You finish the realtime measurement function using the Stop button or by closing the
display window.
After having closed the graphical view, a dialogue appears asking if you’d like to store
the data set of this realtime measurement. If you answer with Yes, the measuring data
is stored in the software database and can from now on be found in the data records list.
59
Page 60

Retrieving and evaluating data
7.2 Retrieving measurement data
The measuring data is stored in the memory of the device. It can be read out using the
computer or another reading device (e.g. Reader-3).
If measuring data have been transmitted from the device to a FTP server, it can be
downloaded from there to your computer.
7.2.1 Reading out data using the PC/Laptop
You can read out the measuring data from the device using your computer with
SebaDataView-3 software.
Requirements
The device must be switched on and a connection between the device and the
computer is needed.
For a radio link
• a radio interface must be connected to the computer (e.g. Log RI),
• the device must be within the computer’s wireless range.
Procedure
Proceed as follows:
Step Description
1
Select the relevant device in the directory tree of the SDV-3 software.
2 In the menu bar in the segment Measurement data, click on Read.
3 Select RF from the appearing context menu.
Result: The connection between the computer and the device is established and
the data readout starts. In a small window the progress of the data transfer is
displayed.
As soon as the transfer is completed, a new window opens and the measuring
data is displayed.
7.2.2 Downloading data from a FTP server
Requirements
Procedure
Depending on the device's configuration the measuring data may have been transmitted
to a FTP server. From there it can be downloaded to your computer.
The following requirements must be met:
• computer with SDV-3 software and Internet access
• the FTP access data must have been entered and stored in the database of the
software (see page 39)
Proceed as follows to download data from the FTP server:
Step Description
1
Select the relevant device in the directory tree of the SDV-3 software.
2 In the menu bar in the segment Measurement data, click on Read.
3 Select FTP from the appearing context menu.
Result: The download starts. In a small window the progress of the data transfer
is displayed.
60
Page 61
Retrieving and evaluating data
Step Description
4 As soon as the download is finished, click the OK button.
Result: The small window closes. Measuring data and event list data of the
respective device are now available in the software database and can be
displayed.
7.3 Managing saved measurement data
In the database of the software, a large number of measurement data records can be
saved for each device.
You can display all measurement data records of a device in a list. Proceed as follows:
Step Description
1
Select the relevant device in the directory tree of the SDV-3 software.
2 In ihe menu bar in the segment Measurement data, click on Show data.
Result: A new window opens. It shows a table where all measurement data
records of the device are listed (see figure).
If only one measurement data record is saved for the device, this window does
not appear. Instead, the measurement data display opens immediately.
Data records list
The window contains a table in which all measurement data records saved for this
device in the database of the software are listed. These are results from standard
measurements as well as recordings of real-time measurements.
Functions
Using the buttons at the bottom of the window, you can call up and manage the
individual measurement data records.
Select the relevant line in the list and click the desired button:
Show
Edit
Delete
Export
… The measurement data is shown.
(Alternatively, you can simply double-click the respective line in the
table.)
… A window that can be used to edit the comment text for this
measurement opens.
… The data record is deleted from the database of the software. Answer
the confirmation prompt with Yes.
… The data record can be exported and stored in CSV format to the
hard disk or any other memory. The saved file can be accessed using
any CSV-capable application (e.g. Microsoft Excel).
61
Page 62

Retrieving and evaluating data
7.4 Displaying measurement data
7.4.1 Calling up a measurement
Calling up the most
recent measurement
Calling up a particular
measurement
7.4.2 Using the measurement data display
Design
To call up the most recently saved measurement data of a device, double-click this
device in the directory tree of the software. The window for displaying the measurement
data opens (see below).
To call up the results of a particular measurement, proceed as follows:
Step Description
1
Select the relevant device in the directory tree.
2 In the menu bar in the segment Measurement data, click on Show data.
Result: The data records list opens.
If only one measurement data record is saved for this device, this list does not
appear. Instead, the measurement data display opens immediately.
3 Select the required data record in the list and click Show or double-click the
concerning line.
Result: The measurement data is shown.
The following figure shows the window for displaying measurement data:
Selecting a channel
In the top diagram the entire measurement is displayed. Up to four different coloured
curves can be seen. Each curve is representing the results of one of the logger’s
measuring channels.
The bottom diagram is used for viewing enlarged subareas of the measurement curves
(known as the “ZoomView” – see below).
The X-axis corresponds to the chronological sequence of a measurement. The Y-axis
corresponds to the measured values.
To focus on the data of one measuring channel you can either select the channel from
the blue info window on the right or click directly on the respective curve in the bottom
diagram.
62
Page 63

Retrieving and evaluating data
The curve is shifted to the foreground. If there are alarm thresholds set for this channel,
they are indicated by horizontal black lines.
If the curve represents a pressure measurement, all recorded pressure s
indicated by vertical black lines.
Some important
The information relate exclusively to the section of the measurement that is currently
displayed in the bottom diagram.
anywhere in the diagram to end focusing on one individual channel.
You have the following options for displaying an enlarged subarea of the overall
measurement curve:
Free selection of a section of the curve
Select the desired are
inside the diagram, hold down the left mouse button and guide the cursor diagonally
across the relevant area. The selected area will be displayed in the bottom diagram.
If you click the coloured
button, you can freely move the selection within the top diagram. This function is
practical for use as a “magnifying glass”.
Selecting time frames from the list
Using the drop
frame of the displayed area to a month, a week, a day or an hour. By means of the
defined" option you have the the chance to specify the start and end time of
the span to be displayed.
Using the mouse wheel (if available), you can move within the diagram along the axes:
Mouse wheel
Shift key +
context menu
functions for working with the diagram are available here:
measurement are displayed in the blue window.
a of the measurement in the top diagram. To do this, click
area that was selected and hold down the left mouse
t to the diagram, you can restrict the time
click in the diagram
You can use this function to select an area in the diagram for enlarged
. Left
hold down the button and guide the cursor to the desired area.
You can use this function to grab and move the displayed
. Left
move the image section in all
You can use this function to display the time span and pressure
difference between any two points on the displayed measurement
ick in the diagram on the desired starting point, hold down the
button and guide the cursor to the desired ending point. The time span
urges are
characteristics of the
Specifying the
zoom area
Moving in the diagram
Other functions
Click
•
•
•
•
A
"User-
-down list on the right nex
… Movement along the X-axis
mouse wheel … Movement along the Y-axis
opens after you right-
view. A number of other
Function
Zoom in
Pan
Select
Measure
Description
display.
The cursor symbol switches from to
measurement area.
The cursor symbol switches from to
hold down the button and freely
directions.
Use this command to end the functions Zoom
curve.
Left-cl
between the two points is displayed.
-click in the diagram,
-click in the diagram,
in and Pan.
63
Page 64

Retrieving and evaluating data
Function Description
Print
Reset initial view
7.4.3 Displaying pressure surges
Insert label
Hide / Show
grid
If you want to print the actual diagram view, right-click in the bottom diagram and select
Print from the appearing context menu.
If you want to cancel all active functions in the window and return to the initial diagram
view, right-click in the bottom diagram and select Reset from the appearing context
menu.
You can use this function to create text fields (labels) within the
diagram. These fields can be used to add comments to any points in
the diagram. Labels remain saved after the diagram display is closed.
Edit text … Double-click the text field – input text – then click
once outside of the field
Move label … Click the text field once – then “grab onto it” (click it
and hold down the left mouse button) and move it
wherever you would like
Delete label … Click the text field once – then press the “Delete”
key on your keyboard
You can use this option to decide whether there should be a grid shown
in the bottom diagram’s background or not.
If pressure surges were recorded in addition to the standard pressure measurement,
you will see a drop-down list at the very top of the displayed window. All recorded
pressure surges are in this list.
In order to display the one-minute recording of an individual pressure fluctuation, click
the desired recording time point in this list. The corresponding measurement curve will
be displayed in the bottom diagram.
With the tools described above, you can view the recording in detail and carry out a
closer analysis.
To return to the standard measurement display, click Overview in the drop-down list.
64
Page 65

Miscellaneous functions of the SebaDataView-3 software
8 Miscellaneous functions of the SebaDataView-3 software
8.1 Receiving an ‘Event List’
Introduction
By the help of the Event List function you get information about
• a device's alarm events up to now,
• a device's GSM connection establishments up to now.
These events are listed in a table on the screen.
If measuring data have been sent from the device to a FTP server, the event list is part
of these data and is available right after the download.
For energy saving reasons, the event list is not part of the data transferred to the
computer via radio. In this case, the event list still needs to be retrieved from the logger,
before it can be displayed on the screen.
Requirements
Procedure
A maximum of 600 events can be listed. After 600 entries have been reached, the
respective oldest values are overwritten.
The device must be switched on and a connection between the device and the
computer is needed.
For a radio link
• a radio interface must be connected to the computer (e.g. Log RI),
• the device must be within the computer’s wireless range.
Proceed as follows to call the event list of a device:
Step Description
1
Select the relevant device in the directory tree.
2 In the menu bar in the segment Event list click on Show.
Result: The event list window opens (see picture above).
If the list is empty, there are no events stored for this logger in the software
database. Maybe the list has not yet been read out from the device.
3 In order to retrieve the current list from the device now, click the Read button.
Result: The transfer of the event data from the device starts. A small window
indicates the progress.
After data transfer is finished, all alarms and GSM establishments of the
respective device are shown in the event list. If the list still is empty, no events
have been stored by the device.
65
Page 66

Miscellaneous functions of the SebaDataView-3 software
Deleting events
8.2 Exporting data in CSV format
Introduction
Export all data records
Export one data record
You can remove events from the list and delete them in the software database by
selecting them in the window and clicking the Delete button.
The data collected from a device and stored in the SDV-3 database can be exported in
CSV (‘Comma Separated Values’) format. In doing so a file containing all logged valuetime pairs line by line is saved to the hard disk or any other memory. The saved file can
be accessed using any CSV-capable application (e.g. Microsoft Excel).
To export all the stored measurement data of one device, proceed as follows:
Step Description
1
Select the device whose data you want to export in the directory tree.
2 In the multifunction bar in the segment Measurement data click on Export.
Result: An Explorer window opens.
3
Browse to the desired target folder and save the data there.
To export the data of one individual measurement, proceed as follows:
Step Description
1
Select the device whose data you want to export in the directory tree.
2 In the multifunction bar in the segment Measurement data click on Show data.
Result: A new window shows all measurement data records saved for this device
(see page 61).
3 Select the relevant data record and click on Export.
Result: An Explorer window opens.
4
Browse to the desired target folder and save the data record there.
66
Page 67

Miscellaneous functions of the SebaDataView-3 software
Tento symbol indikuje, že výrobek nesoucí takovéto označení nelze likvidovat společně s běžným domovním odpadem. Jelikož se jedná o produkt obchodovaný mezi
podnikatelskými subjekty (B2B), nelze jej likvidovat ani ve veřejných sběrných dvorech. Pokud se potřebujete tohoto výrobku zbavit, obraťte se na organizaci specializující
se na likvidaci starých elektrických spotřebičů v blízkosti svého působiště.
Dit symbool duidt aan dat het product met dit symbool niet verwijderd mag worden als gewoon huishoudelijk afval. Dit is een product voor industrieel gebruik, wat betekent
dat het ook niet afgeleverd mag worden aan afvalcentra voor huishoudelijk afval. Als u dit product wilt verwijderen, gelieve dit op de juiste manier te doen en het naar een
nabij gelegen organisatie te brengen gespecialiseerd in de verwijdering van oud elektrisch materiaal.
This symbol indicates that the product which is marked in this way should not be disposed of as normal household waste. As it is a B2B product, it may also not be disposed
of at civic disposal centres. If you wish to dispose of this product, please do so properly by taking it to an organisation specialising in the disposal of old electrical equipment
near you.
Този знак означава, че продуктът, обозначен по този начин, не трябва да се изхвърля като битов отпадък. Тъй като е B2B продукт, не бива да се изхърля и в
градски пунктове за отпадъци. Ако желаете да извърлите продукта, го занесете в пункт, специализиран в изхвърлянето на старо електрическо оборудване.
Dette symbol viser, at det produkt, der er markeret på denne måde, ikke må kasseres som almindeligt husholdningsaffald. Eftersom det er et B2B produkt, må det heller ikke
bortskaffes på offentlige genbrugsstationer. Skal dette produkt kasseres, skal det gøres ordentligt ved at bringe det til en nærliggende organisation, der er specialiseret i at
bortskaffe gammelt el-udstyr.
Sellise sümboliga tähistatud toodet ei tohi käidelda tavalise olmejäätmena. Kuna tegemist on B2B-klassi kuuluva tootega, siis ei tohi seda viia kohalikku jäätmekäitluspunkti.
Kui soovite selle toote ära visata, siis viige see lähimasse vanade elektriseadmete käitlemisele spetsialiseerunud ettevõttesse.
Tällä merkinnällä ilmoitetaan, että kyseisellä merkinnällä varustettua tuotetta ei saa hävittää tavallisen kotitalousjätteen seassa. Koska kyseessä on yritysten välisen kaupan
tuote, sitä ei saa myöskään viedä kuluttajien käyttöön tarkoitettuihin keräyspisteisiin. Jos haluatte hävittää tämän tuotteen, ottakaa yhteys lähimpään vanhojen
sähkölaitteiden hävittämiseen erikoistuneeseen organisaatioon.
Ce symbole indique que le produit sur lequel il figure ne peut pas être éliminé comme un déchet ménager ordinaire. Comme il s’agit d’un produit B2B, il ne peut pas non plus
être déposé dans une déchetterie municipale. Pour éliminer ce produit, amenez-le à l’organisation spécialisée dans l’élimination d’anciens équipements électriques la plus
proche de chez vous.
Cuireann an siombail seo in iúl nár cheart an táirgeadh atá marcáilte sa tslí seo a dhiúscairt sa chóras fuíoll teaghlaigh. Os rud é gur táirgeadh ghnó le gnó (B2B) é, ní féidir
é a dhiúscairt ach oiread in ionaid dhiúscartha phobail. Más mian leat an táirgeadh seo a dhiúscairt, déan é a thógáil ag eagraíocht gar duit a sainfheidhmíonn i ndiúscairt
sean-fhearas leictrigh.
Dieses Symbol zeigt an, dass das damit gekennzeichnete Produkt nicht als normaler Haushaltsabfall entsorgt werden soll. Da es sich um ein B2B-Gerät handelt, darf es
auch nicht bei kommunalen Wertstoffhöfen abgegeben werden. Wenn Sie dieses Gerät entsorgen möchten, bringen Sie es bitte sachgemäß zu einem Entsorger für
Elektroaltgeräte in Ihrer Nähe.
Αυτό το σύµβολο υποδεικνύει ότι το προϊόν που φέρει τη σήµανση αυτή δεν πρέπει να απορρίπτεται µαζί µε τα οικιακά απορρίµατα. Καθώς πρόκειται για προϊόν B2B, δεν
πρέπει να απορρίπτεται σε δηµοτικά σηµεία απόρριψης. Εάν θέλετε να απορρίψετε το προϊόν αυτό, παρακαλούµε όπως να το παραδώσετε σε µία υπηρεσία συλλογής
ηλεκτρικού εξοπλισµού της περιοχής σας.
Ez a jelzés azt jelenti, hogy az ilyen jelzéssel ellátott terméket tilos a háztartási hulladékokkal együtt kidobni. Mivel ez vállalati felhasználású termék, tilos a lakosság
számára fenntartott hulladékgyűjtőkbe dobni.Ha a terméket ki szeretné dobni, akkor vigye azt el a lakóhelyéhez közel működő, elhasznált elektromos berendezések
begyűjtésével foglalkozó hulladékkezelő központhoz.
Questo simbolo indica che il prodotto non deve essere smaltito come un normale rifiuto domestico. In quanto prodotto B2B, può anche non essere smaltito in centri di
smaltimento cittadino. Se si desidera smaltire il prodotto, consegnarlo a un organismo specializzato in smaltimento di apparecchiature elettriche vecchie.
Šī zīme norāda, ka iztrādājumu, uz kura tā atrodas, nedrīkst izmest kopā ar parastiem mājsaimniecības atkritumiem. Tā kā tas ir izstrādājums, ko cits citam pārdod un lieto
tikai uzņēmumi, tad to nedrīkst arī izmest atkritumos tādās izgāztuvēs un atkritumu savāktuvēs, kas paredzētas vietējiem iedzīvotājiem. Ja būs vajadzīgs šo izstrādājumu
izmest atkritumos, tad rīkojieties pēc noteikumiem un nogādājiet to tuvākajā vietā, kur īpaši nodarbojas ar vecu elektrisku ierīču savākšanu.
Šis simbolis rodo, kad juo paženklinto gaminio negalima išmesti kaip paprastų buitinių atliekų. Kadangi tai B2B (verslas verslui) produktas, jo negalima atiduoti ir buitinių
atliekų tvarkymo įmonėms. Jei norite išmesti šį gaminį, atlikite tai tinkamai, atiduodami jį arti jūsų esančiai specializuotai senos elektrinės įrangos utilizavimo organizacijai.
Dan is-simbolu jindika li l-prodott li huwa mmarkat b’dan il-mod m’għandux jintrema bħal skart normali tad-djar. Minħabba li huwa prodott B2B , ma jistax jintrema wkoll
f’ċentri ċiviċi għar-rimi ta’ l-iskart. Jekk tkun tixtieq tarmi dan il-prodott, jekk jogħġbok għamel dan kif suppost billi tieħdu għand organizzazzjoni fil-qrib li tispeċjalizza fir-rimi ta’
tagħmir qadim ta’ l-elettriku.
Dette symbolet indikerer at produktet som er merket på denne måten ikke skal kastes som vanlig husholdningsavfall. Siden dette er et bedriftsprodukt, kan det heller ikke
kastes ved en vanlig miljøstasjon. Hvis du ønsker å kaste dette produktet, er den riktige måten å gi det til en organisasjon i nærheten som spesialiserer seg på kassering av
gammelt elektrisk utstyr.
Ten symbol oznacza, że produktu nim opatrzonego nie należy usuwać z typowymi odpadami z gospodarstwa domowego. Jest to produkt typu B2B, nie należy go więc
przekazywać na komunalne składowiska odpadów. Aby we właściwy sposób usunąć ten produkt, należy przekazać go do najbliższej placówki specjalizującej się w
usuwaniu starych urządzeń elektrycznych.
Este símbolo indica que o produto com esta marcação não deve ser deitado fora juntamente com o lixo doméstico normal. Como se trata de um produto B2B, também não
pode ser deitado fora em centros cívicos de recolha de lixo. Se quiser desfazer-se deste produto, faça-o correctamente entregando-o a uma organização especializada na
eliminação de equipamento eléctrico antigo, próxima de si.
Acest simbol indică faptul că produsul marcat în acest fel nu trebuie aruncat ca şi un gunoi menajer obişnuit. Deoarece acesta este un produs B2B, el nu trebuie aruncat nici
la centrele de colectare urbane. Dacă vreţi să aruncaţi acest produs, vă rugăm s-o faceţi într-un mod adecvat, ducând-ul la cea mai apropiată firmă specializată în colectarea
echipamentelor electrice uzate.
Tento symbol znamená, že takto označený výrobok sa nesmie likvidovať ako bežný komunálny odpad.Keďže sa jedná o výrobok triedy B2B, nesmie sa likvidovať ani na
mestských skládkach odpadu. Ak chcete tento výrobok likvidovať, odneste ho do najbližšej organizácie, ktorá sa špecializuje na likvidáciu starých elektrických zariadení.
Ta simbol pomeni, da izdelka, ki je z njim označen, ne smete zavreči kot običajne gospodinjske odpadke. Ker je to izdelek, namenjen za druge proizvajalce, ga ni dovoljeno
odlagati v centrih za civilno odlaganje odpadkov. Če želite izdelek zavreči, prosimo, da to storite v skladu s predpisi, tako da ga odpeljete v bližnjo organizacijo, ki je
specializirana za odlaganje stare električne opreme.
Este símbolo indica que el producto así señalizado no debe desecharse como los residuos domésticos normales. Dado que es un producto de consumo profesional,
tampoco debe llevarse a centros de recogida selectiva municipales. Si desea desechar este producto, hágalo debidamente acudiendo a una organización de su zona que
esté especializada en el tratamiento de residuos de aparatos eléctricos usados.
Den här symbolen indikerar att produkten inte får blandas med normalt hushållsavfall då den är förbrukad. Eftersom produkten är en så kallad B2B-produkt är den inte
avsedd för privata konsumenter, den får således inte avfallshanteras på allmänna miljö- eller återvinningsstationer då den är förbrukad. Om ni vill avfallshantera den här
produkten på rätt sätt, ska ni lämna den till myndighet eller företag, specialiserad på avfallshantering av förbrukad elektrisk utrustning i ert närområde.
67
 Loading...