

SAMSUNG SLSRGBW815TS Technical data
ISSUE NO :
Rev:
00008083789
DATE OF ISSUE :
SPECIFICATION
MODEL : SLSRGBW815TS
[Approved Rank : VF(S), λD(A,B,C,D), IV(S)]
RGBW TOP VIEW
CUSTOMER : 대표 승인원
2007. 07. 12
SAMSUNG ELECTRO-MECHANICS
DRAWN CHECKED APPROVED
CUSTOMER :
DRAWN CHECKED APPROVED
대표 승인원
SAMSUNG ELECTRO-MECHANICS
SAMSUNG ELECTRO-MECHANICS CO,.LTD.
314. MAETAN3-DONG, YEONGTONG-KU,
SUWON-SI,GYUNGKI-DO,KOREA,442-743
PAGE 1/19
Contents
1. Product outline-------------------- 3
2. Absolute Maximum Rating------------ 3
3. Characteristics ------------------- 3
4. Typical Characteristic Graph --------- 5
5. Color Mixing Characteristics ---------- 6
6. Outline Drawing and Dimension ------- 7
7. Reliability Test Items and Conditions --- 8
8. Solder Conditions ------------------ 9
9. Taping Dimension ------------------ 10
10. Label Structure ------------------- 11
11. Lot Number ---------------------- 11
12. Reel Packing Structure ------------- 12
13. Aluminum Vinyl Bag----------------- 13
14. Precaution for Use ----------------- 14
15. Hazard Substance Analysis------------16
16. Revision History ------------------- 19
SAMSUNG ELECTRO-MECHANICS
PAGE 2/19
1. Product Outline
1) Feature
. Lead Frame Type LED Package ( 5.2 * 6.0 * t 1.3mm )
0
.BeamAngle(△θ:120
.AlGaInP,GaN/Al
Chip&LongTimeReliability
2O3
)
2) Applications
. Indoor, Outdoor Display and etc.
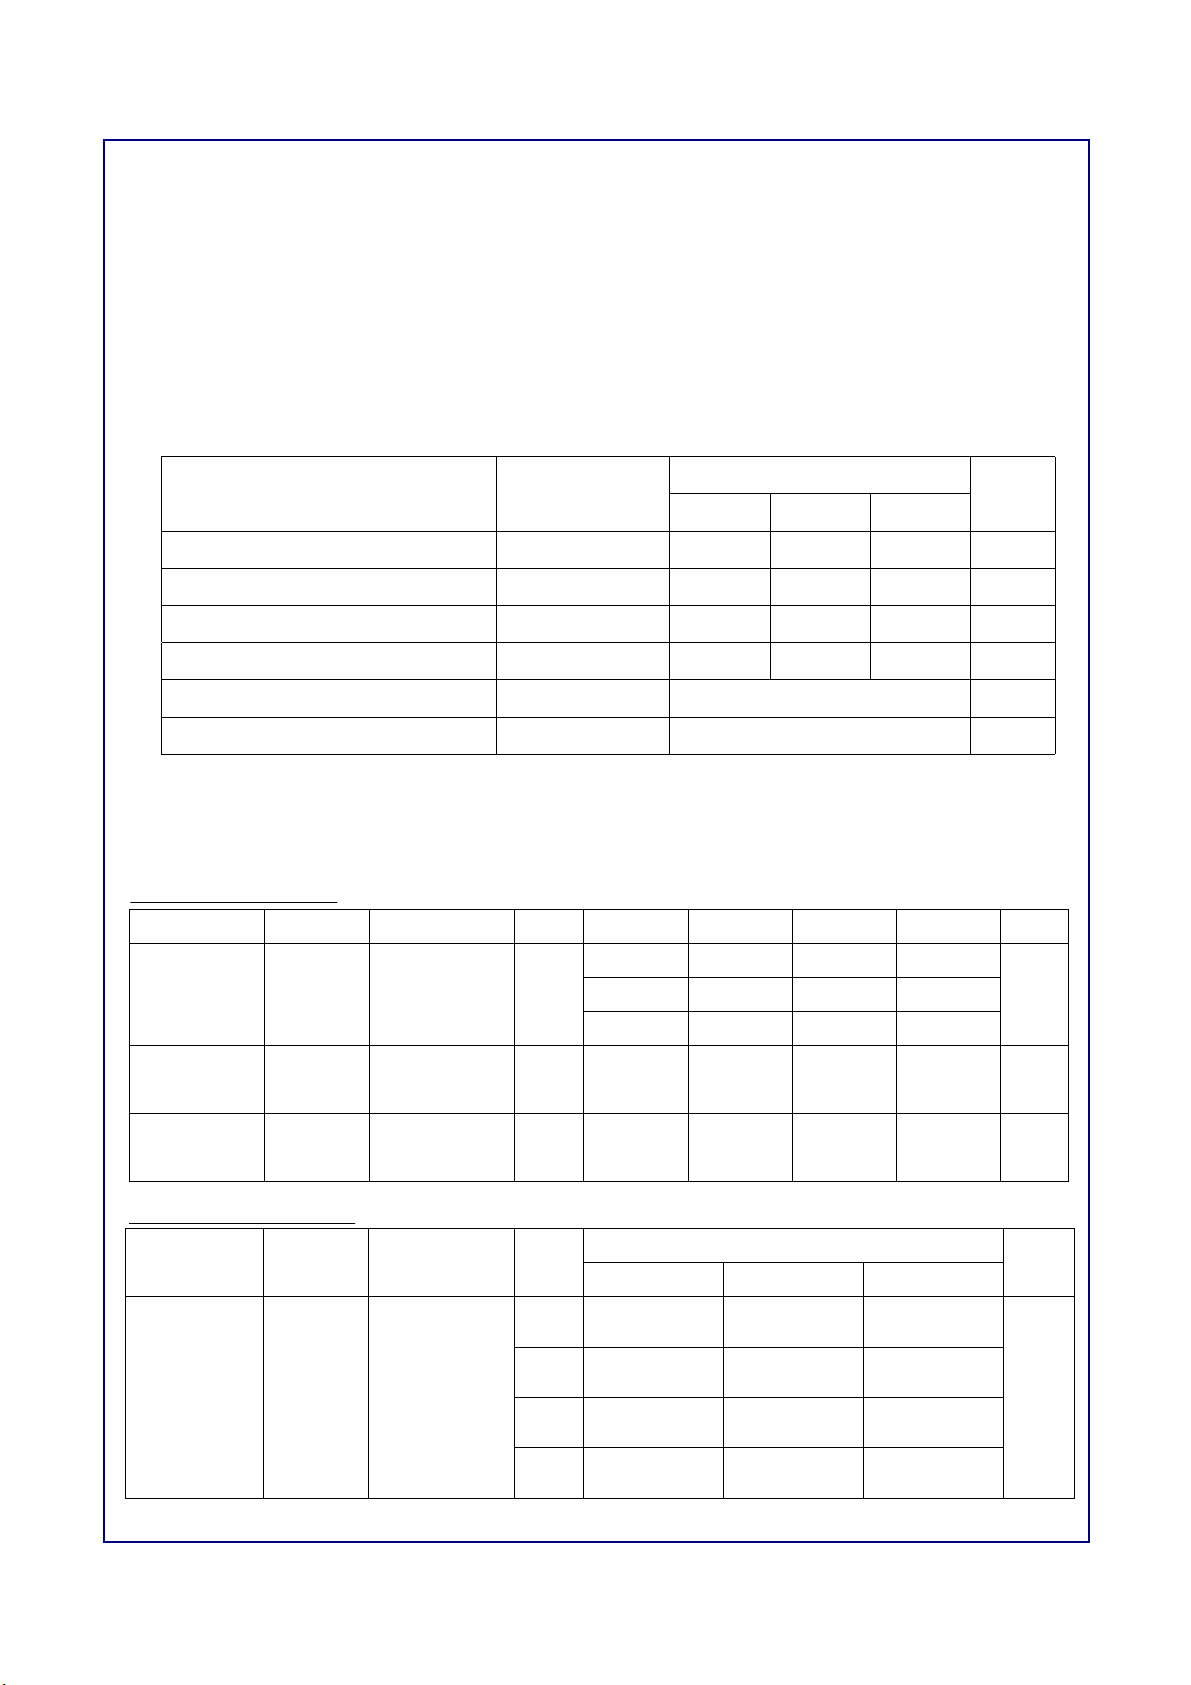
2. Absolute Maximum Rating
Item Symbol
Forward Current I
Pulse Forward Current I
Reverse Voltage V
Reverse Current I
Operating Temperature T
Storage Temperature Range T
-. IFPConditions : Duty 1/10 Pulse Width 10msec
3. Characteristics
Electrical properties
Item Symbol Condition Rank Color min. Typ. MAX. Unit
Forward
Voltage
(
*)
Reverse
Current
V
F
I
R
IF=20㎃ S
VR=5V - R - - 100 ㎂
Absolute Maximum Rating
Red Green Blue
F
FP
r
R
opr
stg
30 30 30 ㎃
100 100 100 ㎃
5--V
-8585㎃
-30 ∼ 85 ℃
-40 ∼100 ℃
Red 1.8 2.1 2.6
Blue 2.9 3.2 3.6
Unit
(Ta:25OC)
VGreen 2.9 3.2 3.7
Reverse
V
Voltage
r
Dominant Wavelength
Item Symbol Condition Rank
Dominant
Wavelength
(*)
SAMSUNG ELECTRO-MECHANICS
λ
D
IR=10㎃ - G, B 0.6 - 2.0 V
(Ta:25
Color
Red Green Blue
A 619 ~ 627 523 ~ 528 460 ~ 466
B 619 ~ 627 523 ~ 528 466 ~ 472
IF=20㎃
C 619 ~ 627 528 ~ 533 460 ~ 466
D 619 ~ 627 528 ~ 533 466 ~ 472
O
C)
Unit
㎚
PAGE 3/19
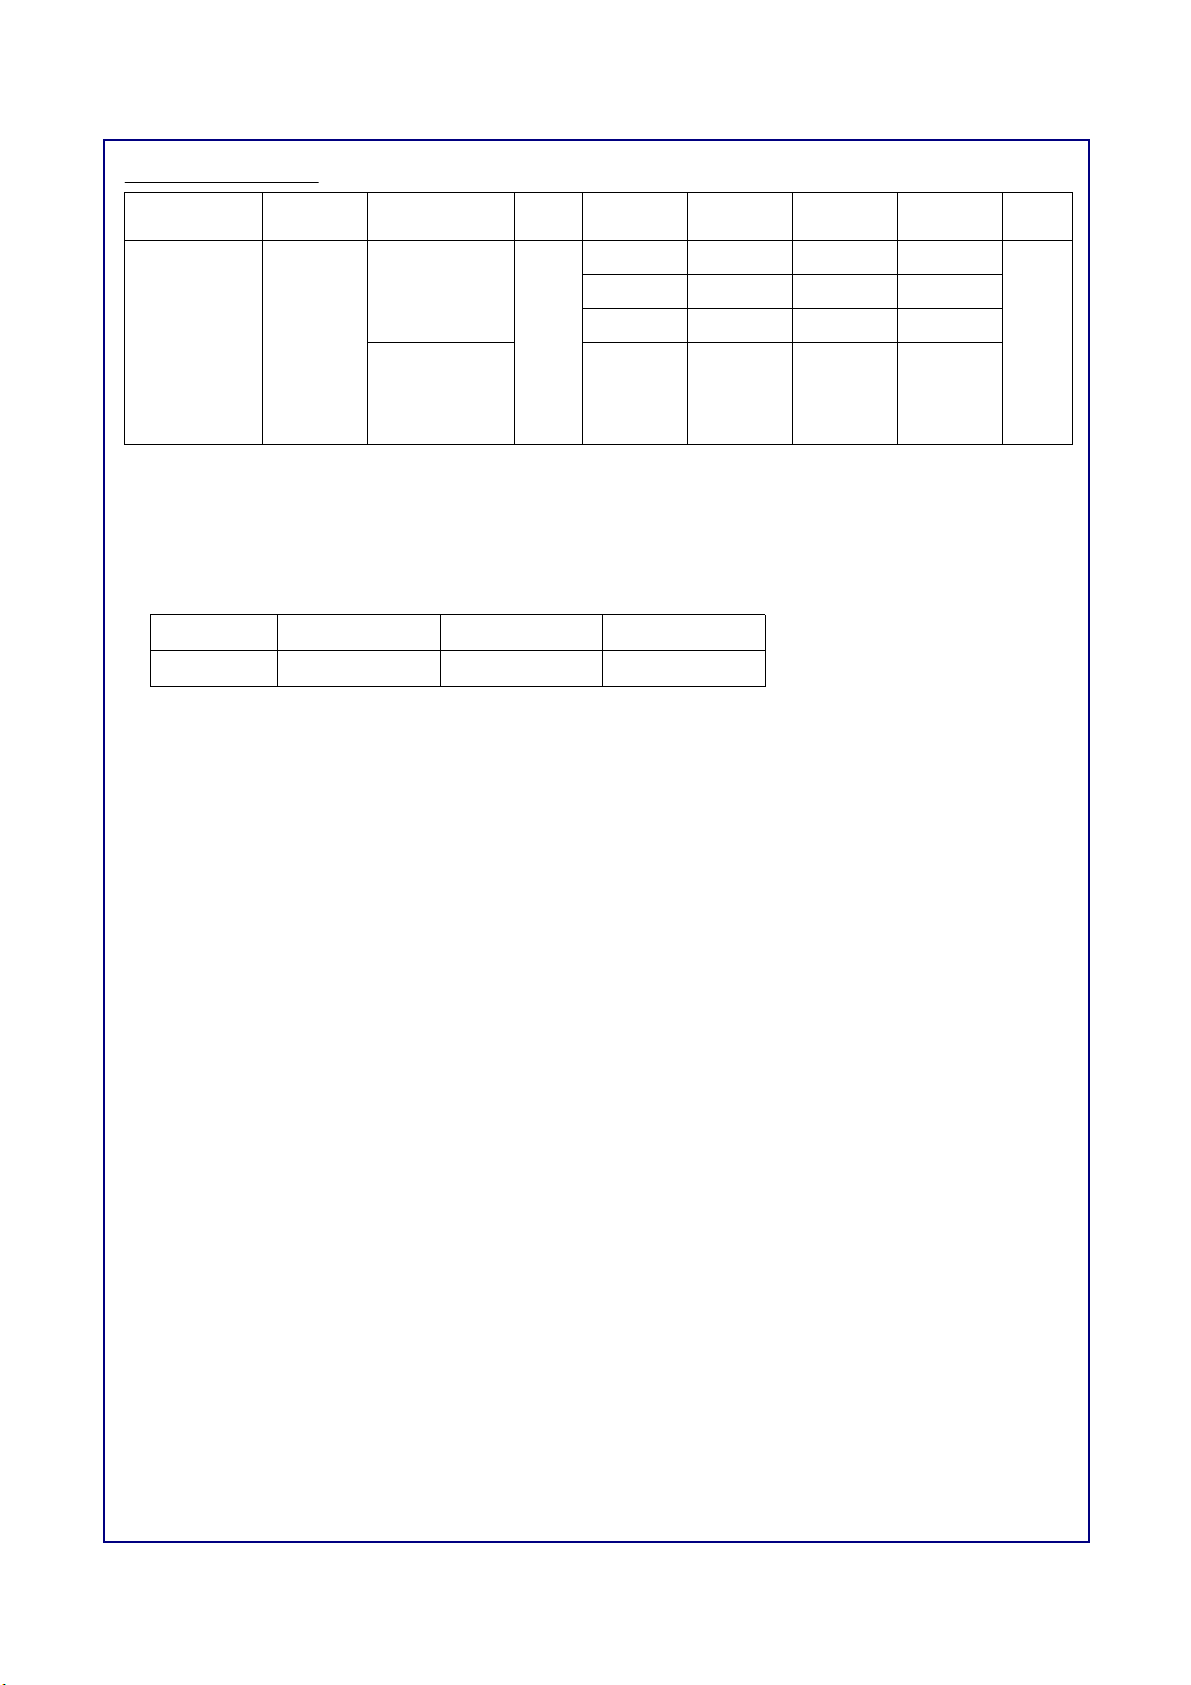
Luminous Intensity
(Ta:25OC)
Item Symbol Condition Rank Color min. typ. MAX. Unit
Red 550 700 880
IF=20㎃
Green 1200 1400 1700
Luminous
Blue 250 400 650
Intensity
(
*)
I
V
IF=60㎃
(R,G,B
I
=20㎃)
F
S
- 1900 2400 3050
* Tolerance : VF;±0.1V,λD;±2㎚,IV;±10%,
* Luminous intensity measuring equipment : CAS140 B
※ Approved Rank
Item V
F
λ
D
I
v
Rank S A,B,C,D S
* Each reel contains only one of the A, B, C or D, a segment (1/4) of the λDrank.
mcd
SAMSUNG ELECTRO-MECHANICS
PAGE 4/19
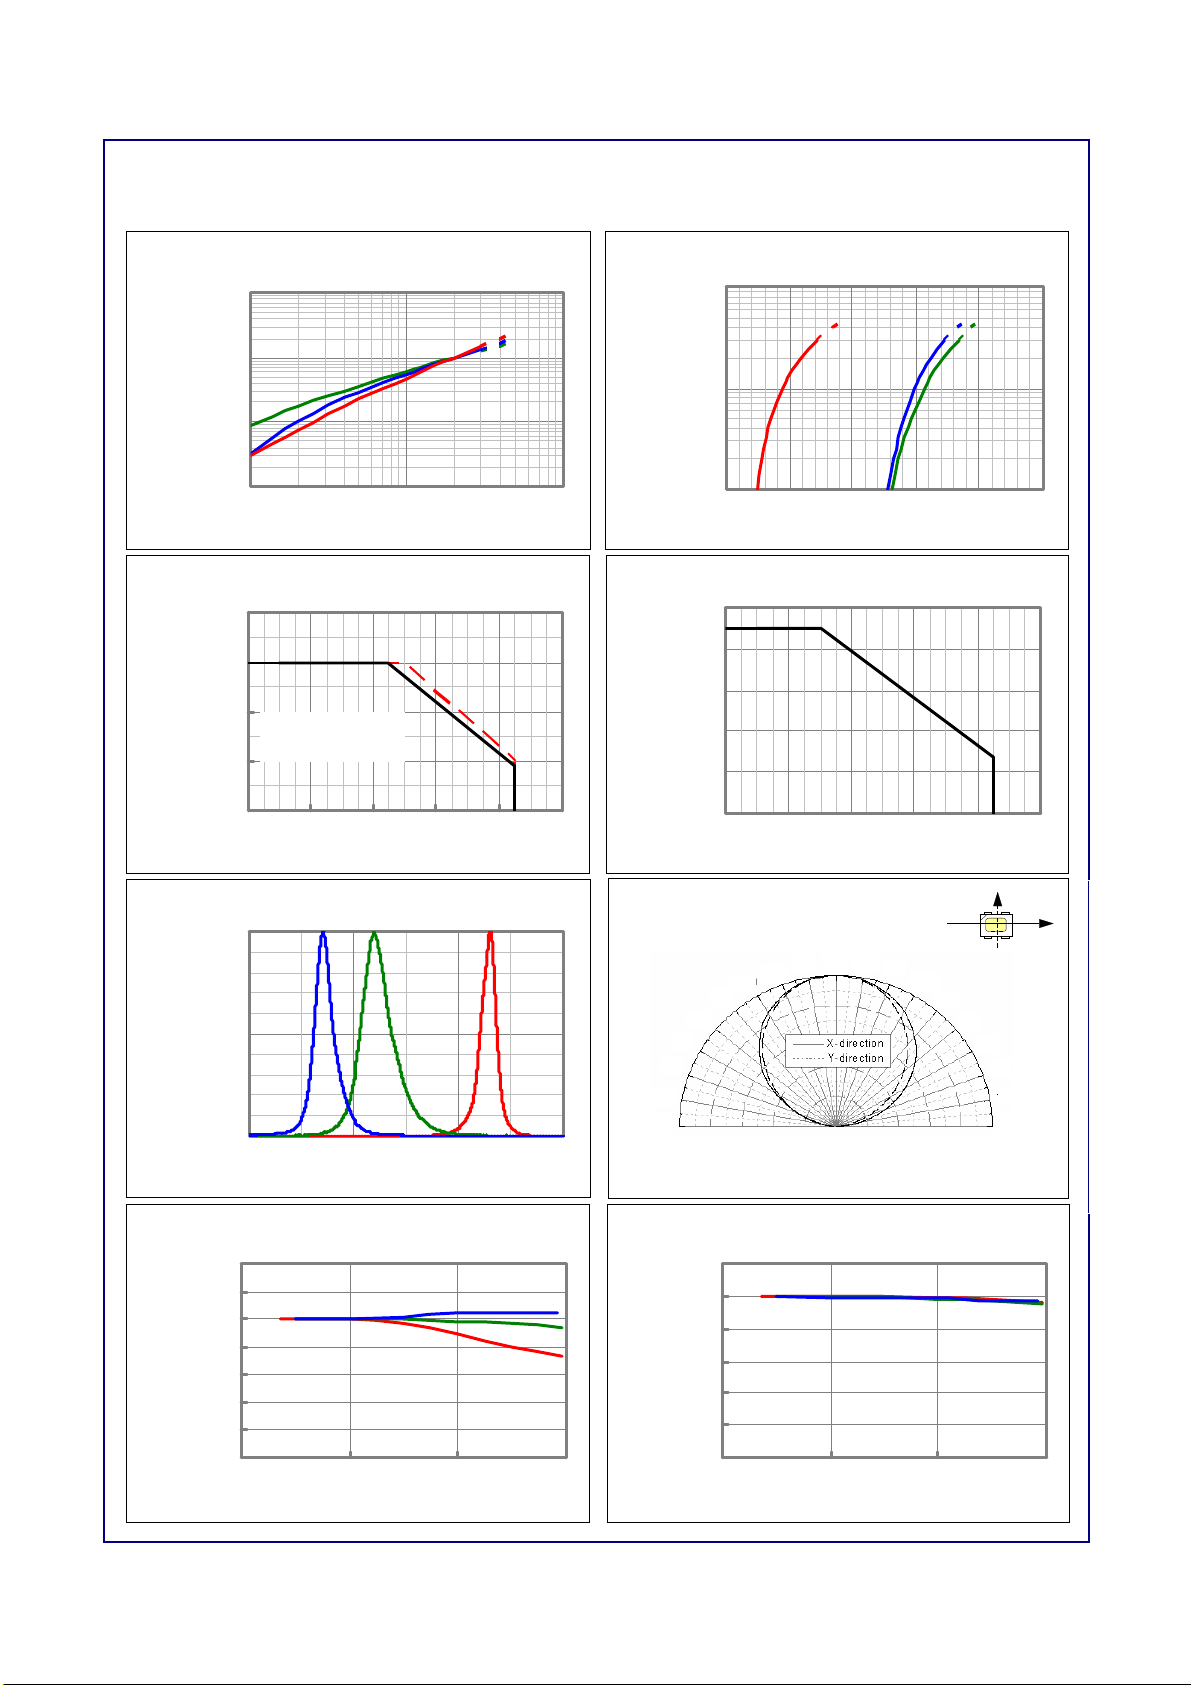
4. Typical Characteristics Graph
s
t
s
d
* These graphs show typical values.
(Ta:25OC)
Relative Luminous Intensity vs.
Forward Current vs. Forward Voltage
Forw ard Current
1000
100
100
R
10
G
R
10
BG
B
Intensity (%)
Relative Luminou
1
1 10 100
Forward Current(mA)
Forward Current Derating Curve
(Discrete Color)
40
30
20
IF(mA)
Forward Curren
--- Blue, Green
- - Red
10
Forward Current
0
0 20406080100
Ambient Temp(deg)
1
Forward Current IF(mA)
1.5 2.0 2.5 3.0 3.5 4.0
Forward Voltage VF(V)
Forward Current Derating Curve
100
80
60
IF(mA)
40
20
0
0 20 40 60 80 100
(Full Color)
Ambient Temp(deg)
Spectrum Distribution
100
50
BG
R
Intensity(%)
Relative Emissio
0
I
=20㎃
F
T
=R.T
a
20
10
0
40
30
400 500 600 700
Wave L e ngth( n m)
Relative Luminous Intensity vs.
Forward Voltage vs. Ambient Temperature
Radiation Diagram
90
80
70
60
50
40
402020406080100 8060 1000
50
60
70
80
Relative Luminous Intensity(%)
Y
X
30
20
10
0
Ambient Temperature
120
110
B
100
90
80
70
Intensity (%)
60
Relative Luminou
G
R
50
20 40 60 80
Ambient Temperature Ta (℃)
SAMSUNG ELECTRO-MECHANICS
110
100
90
80
70
Voltage (%)
60
Relative Forwar
50
20 40 60 80
Ambient Temperature Ta (℃)
PAGE 5/19
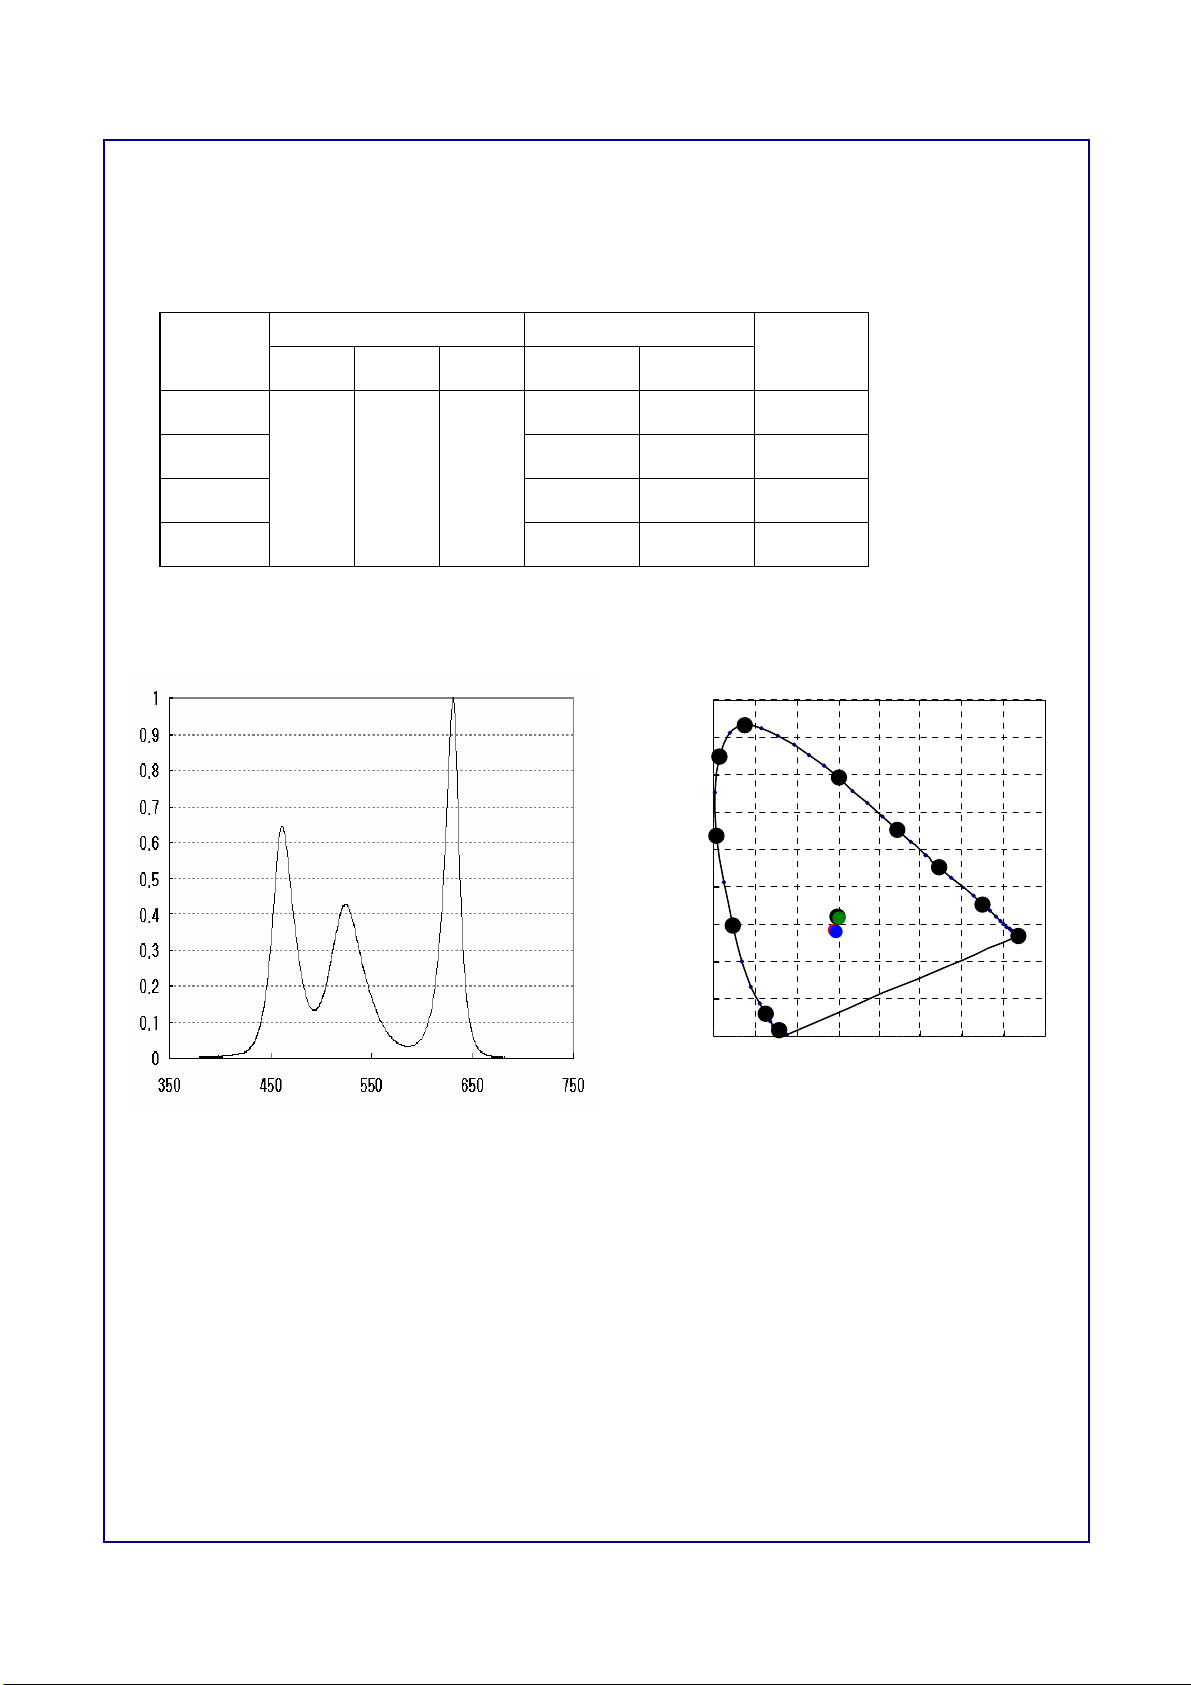
5. Color Mixing Characteristics
※ These graphs and data are example values.
Color Mixing Data :
Bias Current : Red 20mA, Green 20mA, Blue 10mA
Standard
Rank
SAS
Red Green Blue x y
Color CIE
0.292 0.283 2.18
SBS 0.298 0.3167 2.30
20mA 20mA 10mA
SCS 0.294 0.280 2.20
SDS 0.30 0.316 2.29
Color Mixing Spectrum
Red
Blue
Green
Chromaticity Diagram
0.9
0.8
0.7
0.6
0.5
y
0.4
0.3
0.2
0.1
0.0
0.0 0.1 0.2 0.3 0.4 0.5 0.6 0.7 0.8
520
510
500
490
470
IV
A
450
550
570
590
B
D
C
x
610
700
SAMSUNG ELECTRO-MECHANICS
PAGE 6/19
 Loading...