

DP15H*/DP17L* 2-1
2 Product Specifications
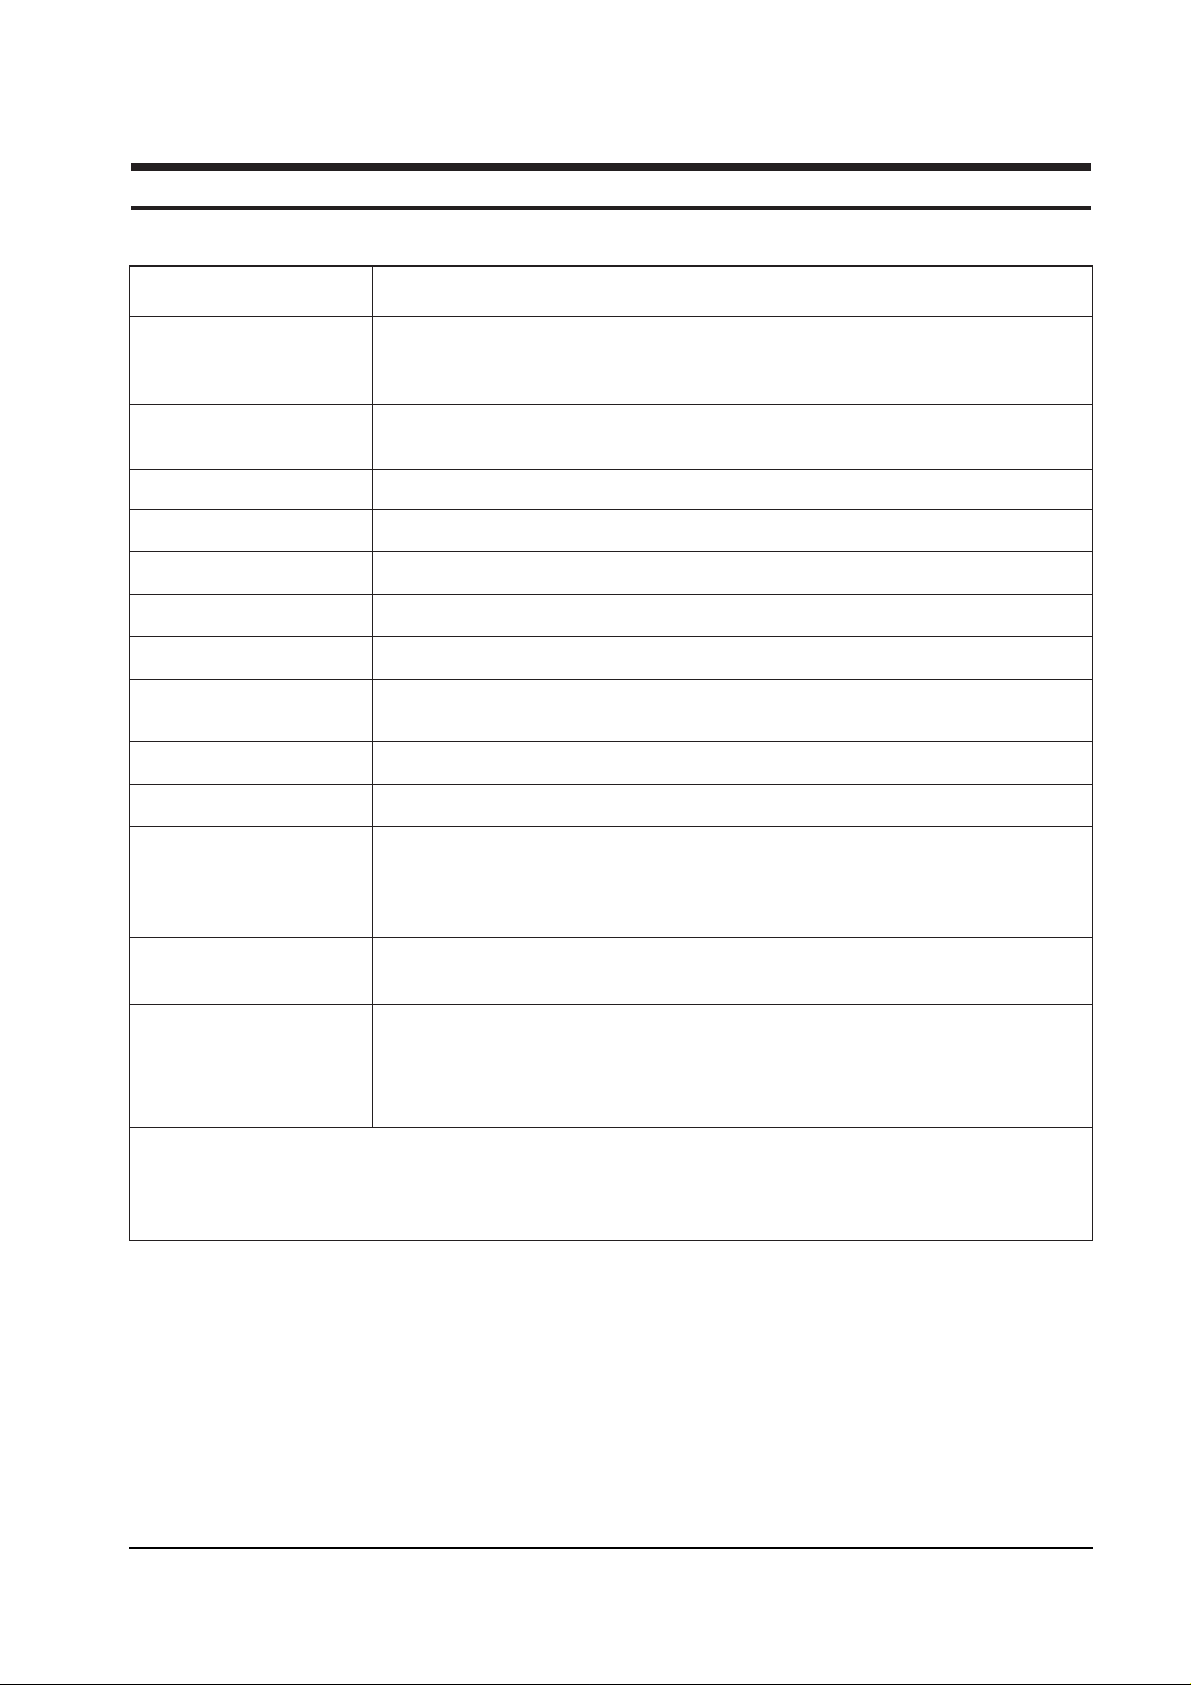
2-1 Specifications
Picture Tube: 15-Inch (38 cm): 13.8-inch (35 cm) viewable, 17-Inch (43 cm): 16-inch (40.6 cm) viewable,
Full-square flat-face tube, 90˚ Deflection, Semi- tint, Non-glare, Invar shadow mask,
Anti-static silica coating, 0.28 mm Dot pitch
Scanning Frequency Horizontal : 30 kHz to 70 kHz (Automatic)
Vertical : 50 Hz to 160 Hz (Automatic)
Display Colors Unlimited colors
Maximum Resolution Horizontal : 1280 Dots Vertical : 1024 Lines
Input Video Signal Analog, 0.7 Vp-p positive at 75 Ω, internally terminated
Input Sync Signal Separate Sync: TTL level positive/negative
Maximum Pixel Clock rate 110 MHz
Active Display 15” ; Horizontal : 267 mm ± 4 mm, Vertical : 200.5 mm ± 4 mm
17” ; Horizontal : 306 mm ± 4 mm (4:3 ratio), Vertical : 230.5 mm ± 4 mm
Input Voltage AC 90 to 264 Volts, 60 Hz or 50 Hz ± 3 Hz
Power Consumption 80 Watt (max) : 15”, 90 Watt (max) : 17”
Dimensions Unit ; 15” : 14.25 x 15.11 x 15.11 Inches (362 x 384 x 384 mm)
(W x D x H) 17” : 16.22 x 16.54 x 16.36 Inches (412 x 420 x 415.5 mm)
Carton ; 15” : 17.87 x 19.57 x 17.52 Inches (454 x 497 x 445 mm)
17” : 21.02 x 21.73 x 18.39 Inches (534 x 552 x 467 mm)
Weight 15” : 26.5 lbs (12.0 kg) / 31.5 lbs (14.3 kg)
(Net/Gross) 17” : 33.1 lbs (15.0 kg) / 38.6 lbs (17.5 kg)
Environmental Considerations Operating Temperature : 32°F to 104°F (0°C to 40°C)
Humidity : 10 % to 80 %
Storage Temperature : -4°F to 113°F (-20°C to 45°C)
Humidity : 5 % to 95 %
• Above models comply with SWEDAC (MPR II) recommendations for reduced electromagnetic fields.
• Designs and specifications are subject to change without prior notice.
Item Description
2 Product Specifications
2-2 DP15H*/DP17L*
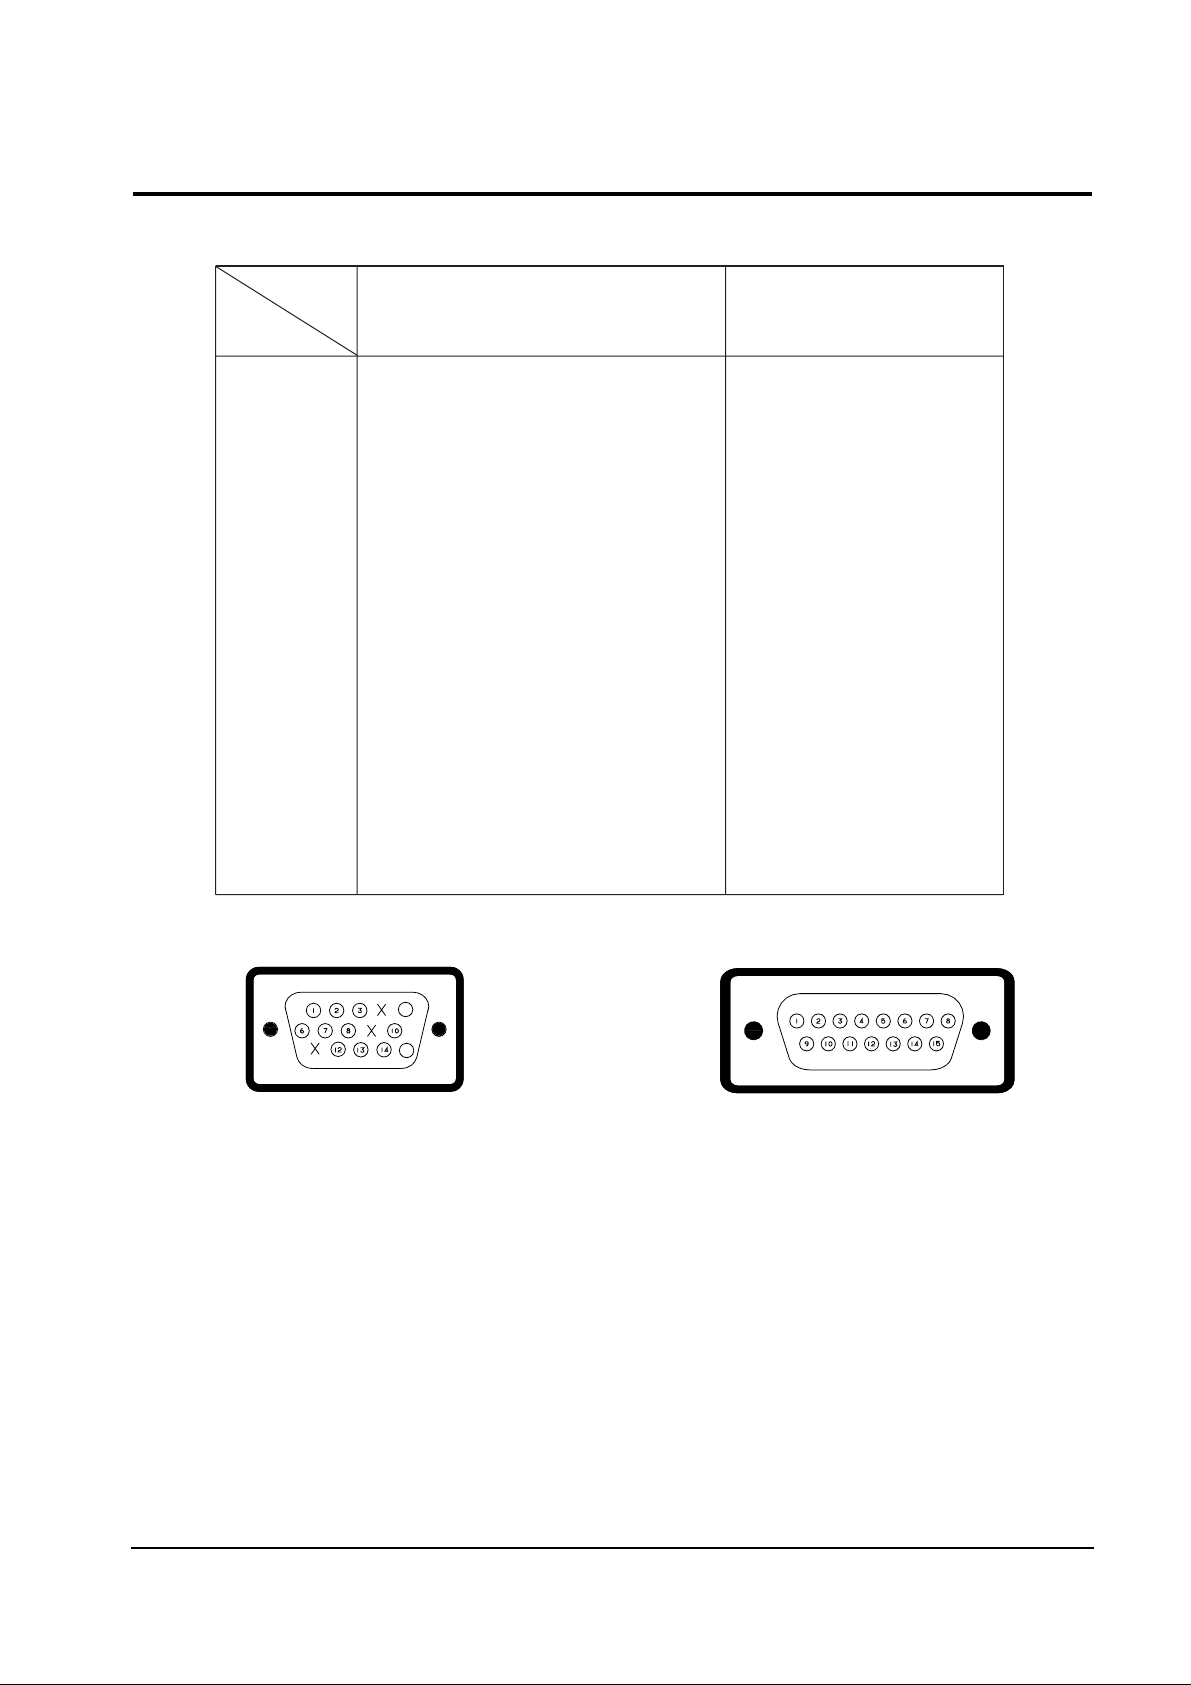
2-2 Pin Assignments
5
15
Figure 2-1. Male Type Figure 2-2. Male Type
Sync
Type
Pin No.
Macintosh
Separate
1
2
3
4
5
6
7
8
9
10
11
12
13
14
15
Red
Green
Blue
N-C
DDC Return
GND-R
GND-G
GND-B
N-C
GND-Sync/Self-raster
N-C
DDC Data
H-Sync
V-Sync
DDC Clock
GND-R
Red
H/V Sync
Sense 0
Green
GND-G
Sense 1
Reserved
Blue
Sense 2
GND
V-Sync
GND-B
GND
H-Sync
2 Product Specifications
DP15H*/DP17L* 2-3
QRS
P
O
Video
Sync
Sync
Horizontal
Vertical
CDE
P
O
B
A
Video
Sync
Sync
Separate Sync
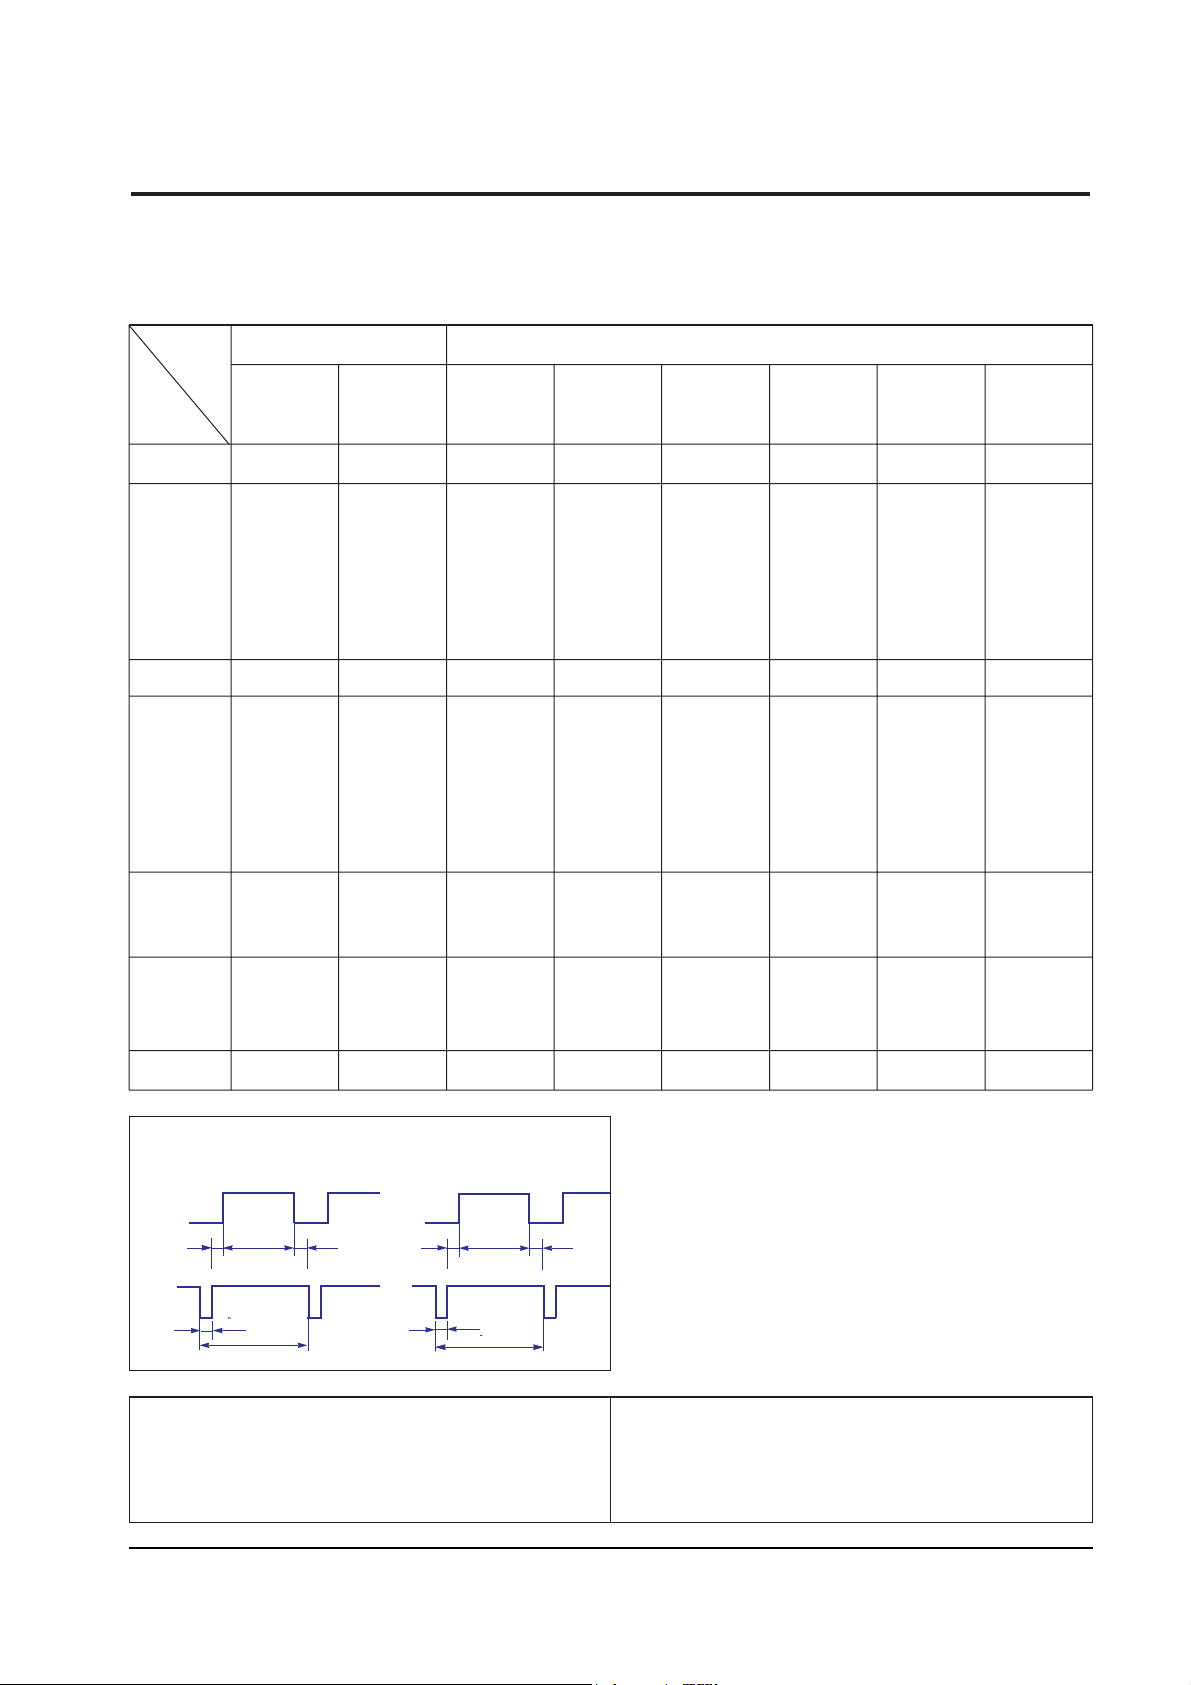
2-3 Timing Chart
This section of the service manual describes the timing that the computer industry recognizes as standard
for computer-generated video signals.
C D
A
O
E
B
P
Video
Sync
Sync
Video
Q R S
A : Line time total B : Horizontal sync width O : Frame time total P : Vertical sync width
C : Back porch D : Active time Q : Back porch R : Active time
E : Front porch S : Front porch
fH (kHz)
A µsec
B µsec
C µsec
D µsec
E µsec
fV (Hz)
O msec
P msec
Q msec
R msec
S msec
Clock
Frequency
(MHz)
Polarity
H.Sync
V.Sync
Remark
IBM VESA
800/85 Hz
800 x 600
1024/75 Hz
1024 x 768
1024/85 Hz
1024 x 768
VGA3/60 Hz
640 x 480
VGA2/70 Hz
720 x 400
31.469
31.777
3.813
1.907
25.422
0.636
70.087
14.268
0.064
1.080
12.711
0.413
28.322
Negative
Positive
Separate
31.469
31.778
3.813
1.907
25.422
0.636
59.940
16.683
0.064
1.048
15.253
0.318
25.175
Negative
Negative
Separate
37.500
26.667
2.032
3.810
20.317
0.508
75.000
13.333
0.080
0.427
12.800
0.027
31.500
Negative
Negative
Separate
43.269
23.111
1.556
2.222
17.778
1.556
85.008
11.764
0.671
0.578
11.093
0.023
49.500
Negative
Negative
Separate
46.875
21.333
1.616
3.232
16.162
0.323
75.000
13.333
0.064
0.448
12.800
0.021
36.000
Positive
Positive
Separate
53.674
18.631
1.138
2.702
14.222
0.569
85.061
11.756
0.056
0.503
11.179
0.019
56.250
Positive
Positive
Separate
60.023
16.660
1.219
2.235
13.003
0.203
75.029
13.328
0.050
0.466
12.795
0.017
78.750
Positive
Positive
Separate
68.677
14.561
1.016
2.201
10.836
0.508
84.997
11.765
0.044
0.524
11.183
0.015
94.500
Positive
Positive
Separate
800/75 Hz
800 x 600
640/75 Hz
640 x 480
640/85 Hz
640 x 480
Table 2-1. Timing Chart
Mode
Timing

2 Product Specifications
2-4 DP15H*/DP17L*
Memo

4-1-1 Before Making Adjustments
4-1-1 (a) ORIENTATION
When servicing, always face the monitor to the
east.
4-1-1 (b) MAGNETIC FIELDS
Whenever possible, use magnetic field isolation
equipment such as a Helmholtz field to surround
the monitor. If a Helmholtz field is not available,
frequently degauss the unit under test.
Caution: Other electrical equipment may cause
external magnetic fields which may
interfere with monitor performance.
Use an external degaussing coil to limit magnetic
build up on the monitor. If an external degaussing
coil is not available, use the internal degaussing
circuit. However, do not use the internal
degaussing circuit more than once per 30 minutes.
4-1-1 (c) WARM-UP TIME
The monitor must be on for 30 minutes before
starting alignment. Warm-up time is especially
critical in color temperature and white balance
adjustments.
4-1-1 (d) SIGNAL
Analog, 0.7 Vp-p positive at 75 ohm, internal
termination
Sync: Separate
(TTL level negative/positive)
4-1-1 (e) SCANNING FREQUENCY
Horizontal: 30 kHz to 70 kHz (Automatic)
Vertical: 50 Hz to 160 Hz (Automatic)
Unless otherwise specified, adjust at the
17Ó: 1024 x 768 mode (68 kHz/85 Hz),
15Ó: 800 x 600 mode (54 kHz/85 Hz) signals.
Refer to Table 2-1 on page 2-3.
.4-1-2 Required Equipment
The following equipment may be necessary for
adjustment procedures:
4-1-2 (a) DISPLAY CONTROL ADJUSTMENT
1. Non-metallic (Ð) screwdriver:
1.5, 2.5, 3 mm
2. Non-metallic (+) screwdriver:
1.5, 2.5, 3 mm
3. Digital Multimeter (DMM), or
Digital Voltmeter
4. Signal generator, or
DM200 software
5. Software: Softjig or DM200
6. Interface Board Ver. 2.0 Code No.
BH81-90001K
7. Parallel communications cable (25-pin to
25-pin); Code No. BH81-90001H
8. Signal cable (15-pin to 15-pin cable with
additional 3-pin connector); Code No.
BH81-90001J
9. 5 V DC adapter, not supplied
10. Personal computer
Note: Softjig AssÕy (includes items 6, 7 and 9)
Code No. BH81-90001L
4-1-2 (b) COLOR ADJUSTMENTS
1. All equipment listed in 4-1-2 (a), above
2. Color analyzer, or any luminance
measurement equipment
DP15H*/DP17L* 4-1
4 Alignment and Adjustments
This section of the service manual explains how to make permanent adjustments to the monitor. Directions
are given for adjustments using the monitor Interface Board Ver. 2.0 and software (Softjig).
4-1 Adjustment Conditions
Caution: Changes made without the Softjig are saved only to the user mode settings. As such, the
settings are not permanently stored and may be inadvertently deleted by the user.
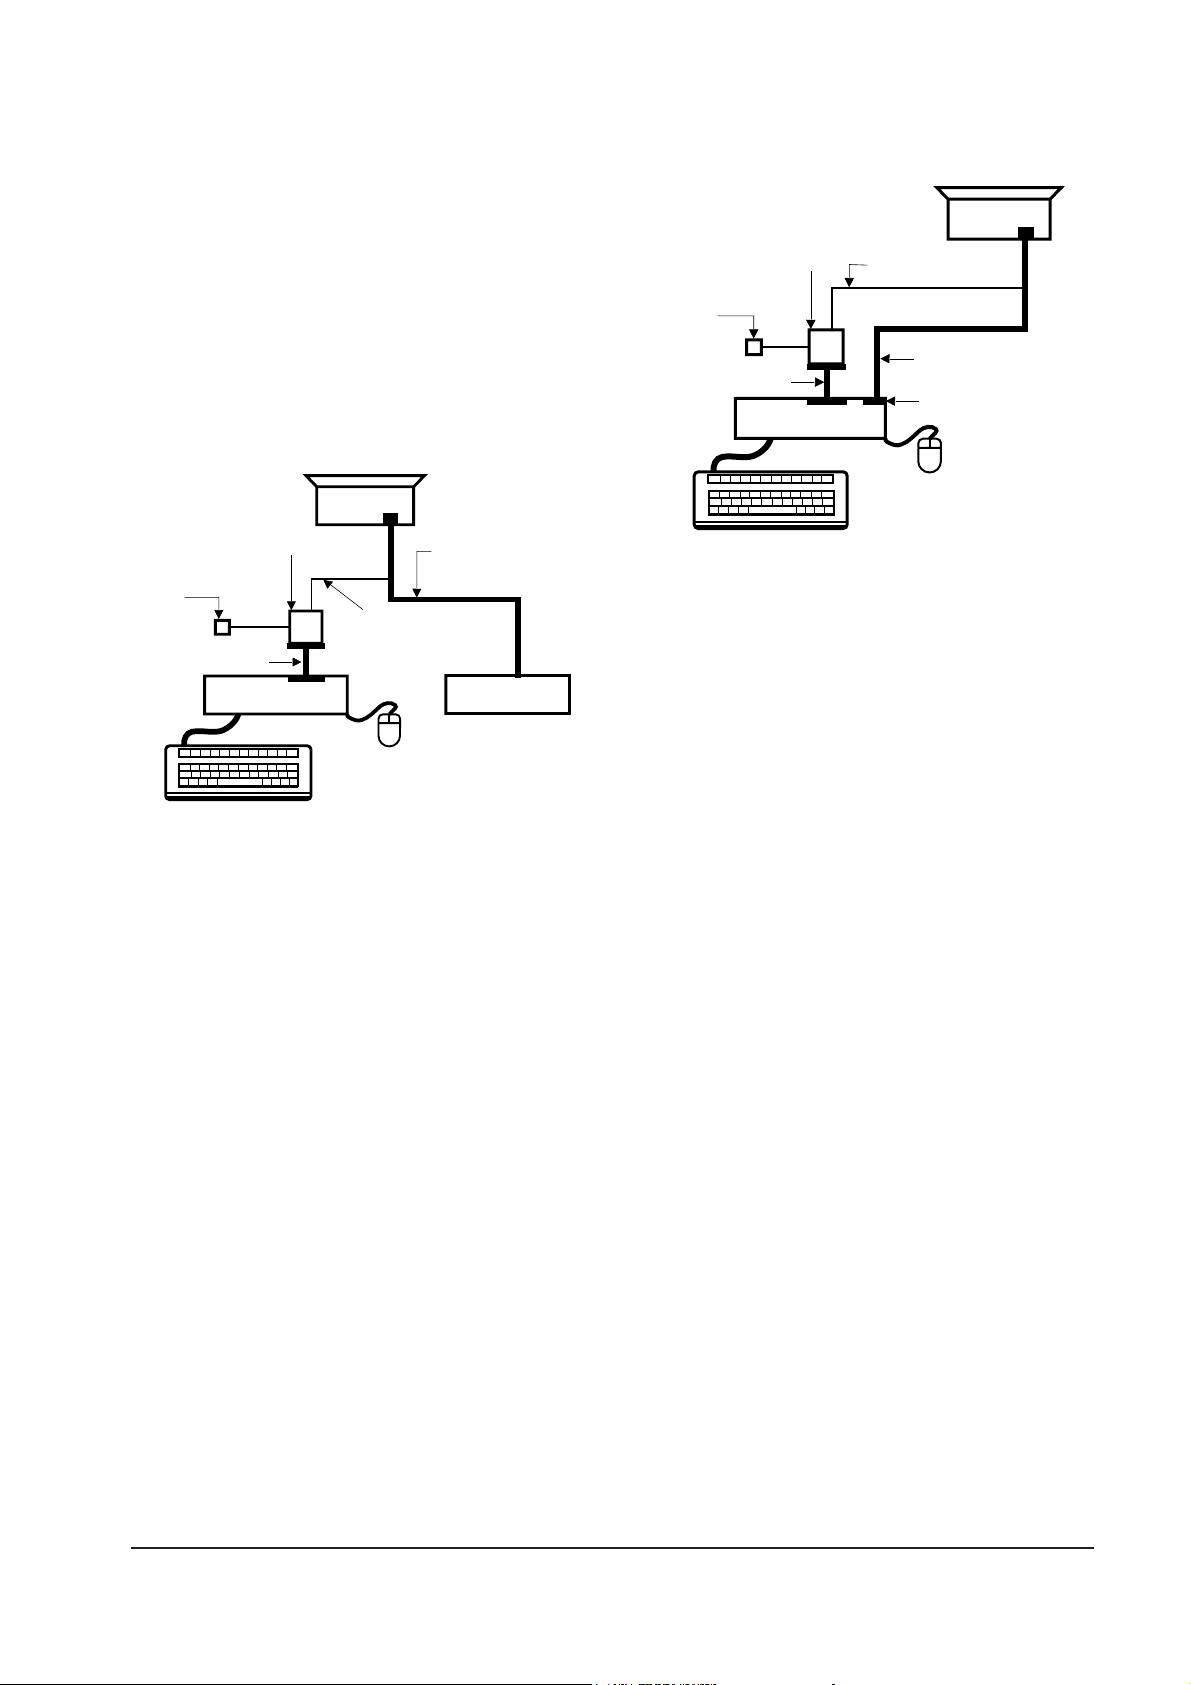
4-1-3 Connecting the SoftJig
Connect the monitor to the signal generator and/
or PC as illustrated in Figures 4-1 and 4-2.
Note: The signal cable connector which includes
the 3-wire cable must connect to the
monitor. If you use Setup 2 (PC only, no
signal generator) you can only make
adjustments to the signal timing available
on that computer system. To make
corrections to all factory timings requires
the use of an additional signal generator.
4 Alignment and Adjustments
4-2 DP15H*/DP17L*
MONITOR
INTERFACE
BOARD VER. 2.0
PC
SIGNAL
GENERATOR
3-WIRE
CABLE
SIGNAL CABLE
5V DC
ADAPTOR
PARALLEL CABLE
Figure 4-1. Setup 1, With Signal Generator
MONITOR
INTERFACE
BOARD VER. 2.0
PC
3-WIRE CABLE
SIGNAL CABLE
PARALLEL CABLE
D-SUB
CONNECTOR
5V DC
ADAPTOR
Figure 4-2. Setup 2, Without Signal Generator
4-2-1 HIGH VOLTAGE ADJUSTMENT
Signal: 1024 x 768 (68 kHz/85 Hz) (17Ó)
800 x 600 (54 kHz/85 Hz) (15Ó)
Display image: DonÕt care
Contrast: Minimum
Brightness: Minimum
Limit: 26.5 kV ± 0.2 kV (17Ó)
25 kV ± 0.2 kV (15Ó)
exception) 26.0 kV ± 0.2 kV for 17Ó SDD CRT that
the DY type is DMX-1791AT
Measure the hight voltage level at the anode cap.
High voltage should be within the limit as above.
If the high voltage needs adjustment use the
following procedure.
PROCEDURE
1. Turn the power off and disconnect the AC line
cord from the power source.
2. Turn the power on after connecting high
voltage Probe.
3. Using the jig, adjust the high voltage to the
specification.
* High Voltage Adjustment PROCEDURE using Softjig
① Select matching model name in ÒModelÓ field.
➁ Select Ò @7: Zero BeamÓ in menu after
selecting ÒExtra 1Ó
➂ Adjust high voltage using control bar after
selecting ÒHV MINÓ
➃ Turn the power off/on after adjustment
finished.
➄ Check the high voltage has been fixed with
adjusted value after reselecting Ò@7: Zero BeamÓ.
4-2-2 SCREEN VOLTAGE ADJUSTMENT
CONDITIONS
Signal: 1024 x 768 (68 kHz/85 Hz) (17Ó)
800 x 600 (54 kHz/85 Hz) (15Ó)
Display image: DonÕt care
Contrast: Minimum
Brightness: Minimum
Limit: 26.5 kV ± 0.2 kV (17Ó)
25 kV ± 0.2 kV (15Ó)
Screen Voltage adjustment procedure using softjig
is all the same as 4-2-1 but selecting ÒG2 CONTÓ
on the contrary to ÒHV MINÓ.
Table 4-1
4-2-3 CENTER RASTER
Adjust SW401 so that the back raster comes to the
center when you apply each basic mode for 15Ó
and 17Ó.
4-2-4 Centering
Centering means to position the center point of
the display in the middle of the display area.
Horizontal size and position and vertical size and
position control the centering of the display.
Adjust the horizontal size and vertical size to their
optimal settings: 306 mm (H) x 230 mm (V) for
17Ó, 267 mm (H) x 200 mm (V) for 15Ó.
Adjust the horizontal position and vertical
position to ² 4.0 mm of the center point of the
screen.
|A-B| ² 4.0 mm. |C-D| ² 4.0 mm.
Figure 4-3. Centering
* In Softjig window, ÒGeometryÓ has to be
selected for GD adjustment.
4-2-4 (a) HORIZONTAL SIZE ADJUSTMENT
CONDITIONS
Scanning frequency: 68 kHz/85 Hz (17Ó)
54 kHz/85 Hz (15Ó)
Display image: Crosshatch pattern
Brightness: Maximum
Contrast: Maximum
4 Alignment and Adjustments
DP15H*/DP17L* 4-3
4-2 Display Control Adjustments
C
A
DISPLAY AREA
EDGE OF BEZEL
B
D
17”
15”
CRT type Screen Voltage
M41QAR361X11*(*)
M41QAQ261X11*(*)
M41LFQ903X28(L), etc
M41EHN325X160/3F**U
M41EHN323X160/3F**U
M41LLJ507XX43*(F5), (F5W3)
M41LLH507XX43*(F5)
M36QAM351X11*(*)
M36LGE128X2**(*)
M36KUK35X02(*/LP), etc
480V
±
10V
500V
±
10V
630V
±
10V
560V
±
10V
600V
±
10V
520V
±
10V
Use control bar after selecting ÒH-SIZEÓ in left
menu to adjust the horizontal size of the display
pattern to 306 mm (17Ó) and 267 mm (15Ó).
(Tolerance: ± 3 mm.)
If ÒH-SIZEÓ is not enough to adjust it, select
ÒSIZE B+Ó by turns.
4-2-4 (b) VERTICAL SIZE ADJUSTMENT
CONDITIONS
Scanning frequency: 68 kHz/85 Hz (17Ó)
54 kHz/85 Hz (15Ó)
Display image: Crosshatch pattern
Brightness: Maximum
Contrast: Maximum
Use control bar after selecting ÒV-SIZEÓ in left
menu to adjust the vertical size of the display
pattern to 230 mm (17Ó) and 200 mm (15Ó).
(Tolerance: ± 3 mm.)
4-2-4 (c) HORIZONTAL POSITION ADJUSTMENT
CONDITIONS
Scanning frequency: 68 kHz/85 Hz (17Ó)
54 kHz/85 Hz (15Ó)
Display image: Crosshatch pattern
Use control bar after selecting ÒH-POSITIONÓ in
left menu to center the horizontal image on the
raster.
4-2-4 (d) VERTICAL POSITION ADJUSTMENT
CONDITIONS
Scanning frequency: 68 kHz/85 Hz (17Ó)
54 kHz/85 Hz (15Ó)
Display image: Crosshatch pattern
Use control bar after selecting ÒV-POSITIONÓ in
left menu to center the vertical image on the
raster.
4-2-5 Linearity
Linearity affects the symmetry of images as they
appear on the screen. Unless each row or column
of blocks in a crosshatch pattern is of equal size,
or within the tolerances shown in Tables 4-2 and
4-3, an image appears distorted, elongated or
squashed.
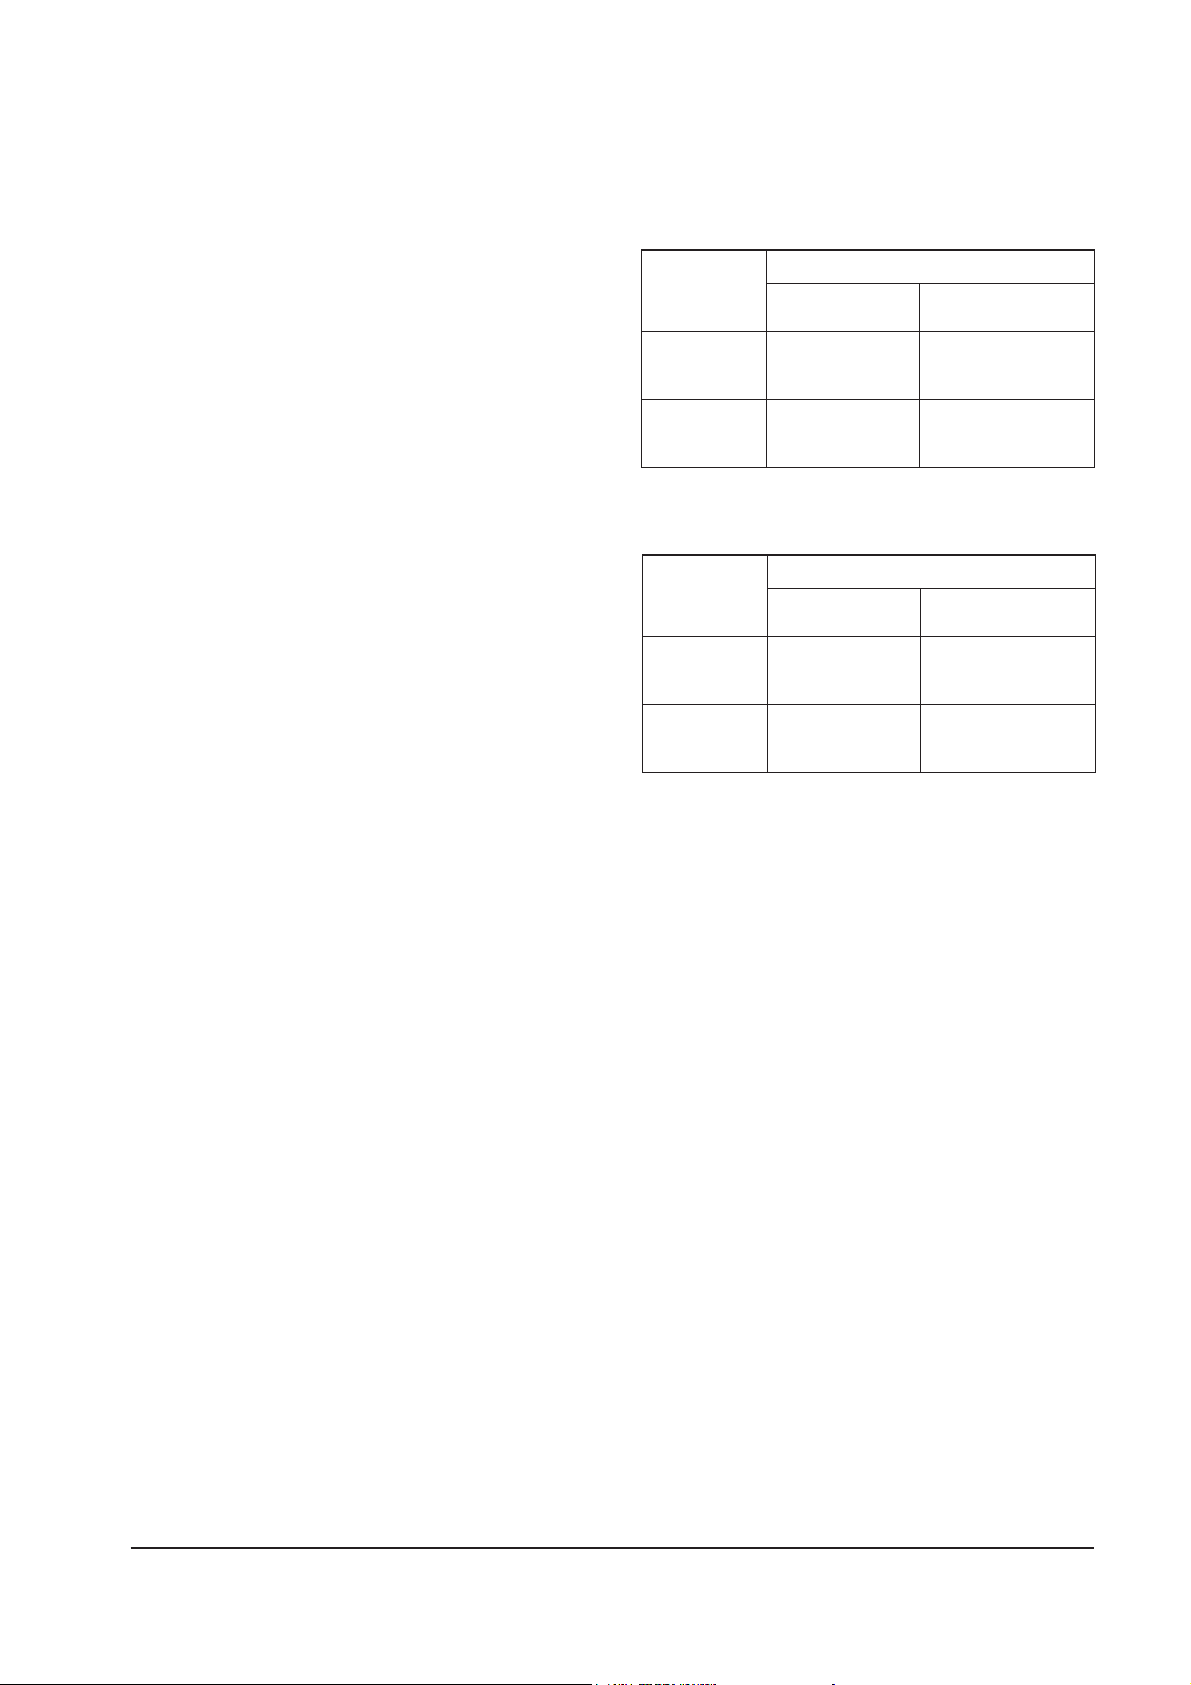
Table 4-2. Standard Modes Linearity: 640x480/75Hz,
800x600/85Hz and 1024x768/85Hz
Table 4-3. Other Modes Linearity: VGA, SVGA, XGA,
MAC, etc.
4-2-5 (a) HORIZONTAL LINEARITY ADJUSTMENT
CONDITIONS
Scanning frequency: 68 kHz/85 Hz (17Ó)
54 kHz/85 Hz (15Ó)
Display image: Crosshatch pattern
Brightness: Maximum
Contrast: Maximum
To adjust the Horizontal Linearity, refer to Tables
4-2 and 4-3 for the tolerance range.
Increase or decrease H_LIN to optimize the
image.
4-2-5 (b) VERTICAL LINEARITY ADJUSTMENT
CONDITIONS
Scanning frequency: 68 kHz/85 Hz (17Ó)
54 kHz/85 Hz (15Ó)
Display image: Crosshatch pattern
Brightness: Maximum
Contrast: Maximum
To adjust the Vertical Linearity, refer to Tables 4-2
and 4-3 for the tolerance range.
Use control bar after selecting ÒV-LINEARITY
BALÓ in left menu to optimize the image.
4 Alignment and Adjustments
4-4 DP15H*/DP17L*
Figure 4-5. Pinbalance
4 : 3
5 : 4
Horizontal: 17.8~20.5
Vertical : 17.8~20.5
Horizontal: 16.7~19.2
Vertical : 17.8~20.5
Supported Timing Mode
Each block (10 %)
Difference between
adjacent blocks (5 %)
Horizontal: Less than 0.96 mm
Vertical : Less than 0.96 mm
Horizontal: Less than 0.90 mm
Vertical : Less than 0.96 mm
4 : 3
5 : 4
Horizontal: 18.2~20.1
Vertical : 18.2~20.1
Horizontal: 17.1~18.9
Vertical : 18.2~20.1
Standard Modes Linearity
Each block (10 %)
Difference between
adjacent blocks (4 %)
Horizontal: Less than 0.77 mm
Vertical : Less than 0.77 mm
Horizontal: Less than 0.72 mm
Vertical : Less than 0.77 mm
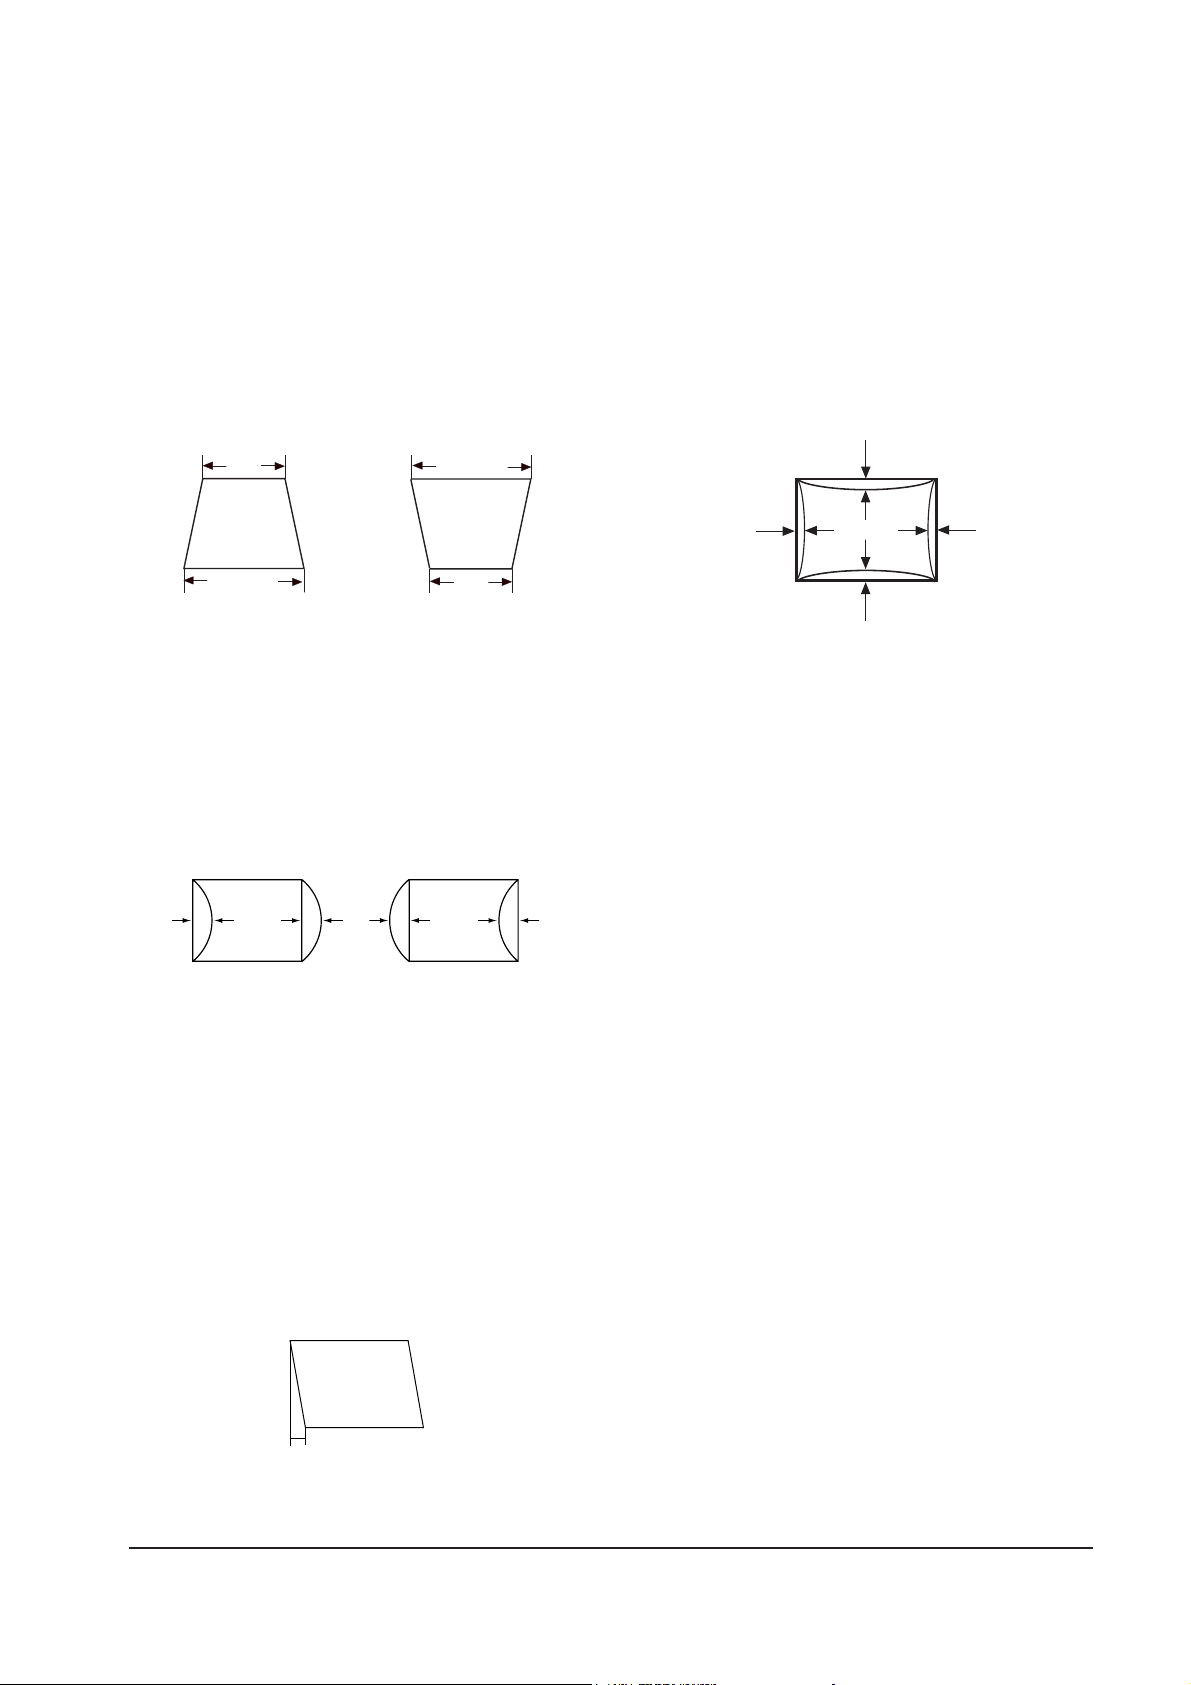
4-2-6 Trapezoid Adjustment
CONDITIONS
Scanning frequency: 68 kHz/85 Hz (17Ó)
54 kHz/85 Hz (15Ó)
Display image: Crosshatch pattern
Brightness: Maximum
Contrast: Maximum
Use control bar after selecting ÒTRAPEZOIDÓ in
left menu to make the image area rectangular.
Figure 4-4. Trapezoid
4-2-7 Pinbalance Adjustment
CONDITIONS
Scanning frequency: 68 kHz/85 Hz (17Ó)
54 kHz/85 Hz (15Ó)
Display image: Crosshatch pattern
Brightness: Maximum
Contrast: Maximum
Figure 4-5. Pinbalance
Use control bar after selecting ÒPINBALANCEÓ in
left menu to optimize the image.
4-2-8 Parallelogram Adjustment
CONDITIONS
Scanning Frequency: 68 kHz/85 Hz (17Ó)
54 kHz/85 Hz (15Ó)
Display image: Crosshatch pattern
Brightness: Maximum
Contrast: Maximum
Use control bar after selecting ÒPARALLELÓ in
left menu to make the image area rectangular.
Figure 4-6. Parallelogram
4-2-9 Side Pincushion Adjustment
CONDITIONS
Scanning frequency: 68 kHz/85 Hz (17Ó)
54 kHz/85 Hz (15Ó)
Display image: Crosshatch pattern
Use control bar after selecting ÒPINCUSHIONÓ in
left menu to straighten the sides of the image area.
4-2-10 Tilt Adjustment
CONDITIONS
Scanning Frequency: 68 kHz/85 Hz (17Ó)
54 kHz/85 Hz (15Ó)
Display image: Crosshatch pattern
Brightness: Maximum
Contrast: Maximum
Use control bar after selecting ÒROTATIONÓ in
left menu to correct the tilt of the display.
4-2-11 Degauss
No adjustments are available for the degaussing
circuit. The degaussing circuit can effectively
function only once per 30 minutes.
4-2-12 To Delete the User Mode Data
To delete the adjustment data from the user
modes, click Ò@4: USER DELETEÓ in right ment.
4-2-13 Save the Data
To save the adjustment data for a mode, press
Ò@3: ALL MODE SAVEÓ in right ment.
4 Alignment and Adjustments
DP15H*/DP17L* 4-5
| A - B | < 4 mm
A
4 mm
B
B
A
D1 D2 D1
| C1 |, | C2 | ≤ 2.0 mm, | D1 |, | D2 | ≤ 2.0 mm.
Figure 4-7. Pincushion
C2
C1
D1 D2
CAUTION:Check below condition before color
adjustment
Video signal : Analog 0.7 Vp-p (at 75 Ω)
Sync : TTL level (H, V seperate signal)
* Select ÒColorÓ in Softjig menu for color adjustment.
4-3-1 Color Coordinates (Temperature)
Color temperature is a measurement of the
radiant energy transmitted by a color. For
computer monitors, the color temperature refers
to the radiant energy transmitted by white. Color
coordinates are the X and Y coordinates on the
chromaticity diagram of wavelengths for the
visible spectrum.
CONDITIONS
Measurement instrument: Color analyzer
Scanning frequency: 68 kHz/85 Hz (17Ó)
54 kHz/85 Hz (15Ó)
Display image: White flat field at
center of display area
Luminance: Maximum
PROCEDURE
Use the directions in sections 4-3-2 through 4-3-3
to adjust the color coordinates for:
9300K to x = 0.283 ± 0.02, y = 0.298 ± 0.02
6500K to x = 0.313 ± 0.02, y = 0.329 ± 0.02
4-3-2 Color Adjustments for 9300K
4-3-2 (a) BACK RASTER COLOR ADJUSTMENT
CONDITIONS
Scanning frequency: 68 kHz/85 Hz (17Ó)
54 kHz/85 Hz (15Ó)
Display image: Back raster pattern
Brightness: Maximum
Contrast: Maximum
1. Select Ò@1: CHANNEL 1Ó in right menu to
control the color for 9300K.
2. Adjust the luminance of the back raster to
between 0.5 to 0.7 ft-L using contron bar after
selecting ÒGREEN CUTOFFÓ in the menu.
3. Use control bar after selecting ÒBLUE
CUTOFFÓ in left menu to set the ÒyÓ
coordinate to 0.298 ± 0.02.
4. Use control bar after selecting ÒRED
CUTOFFÓ in left menu to 0.283 ± 0.02.
* If color values would not be matched desirable
values, repeat sequence 3 and 4 after readjusting
ÒGREEN CUTOFFÓ control a little different.
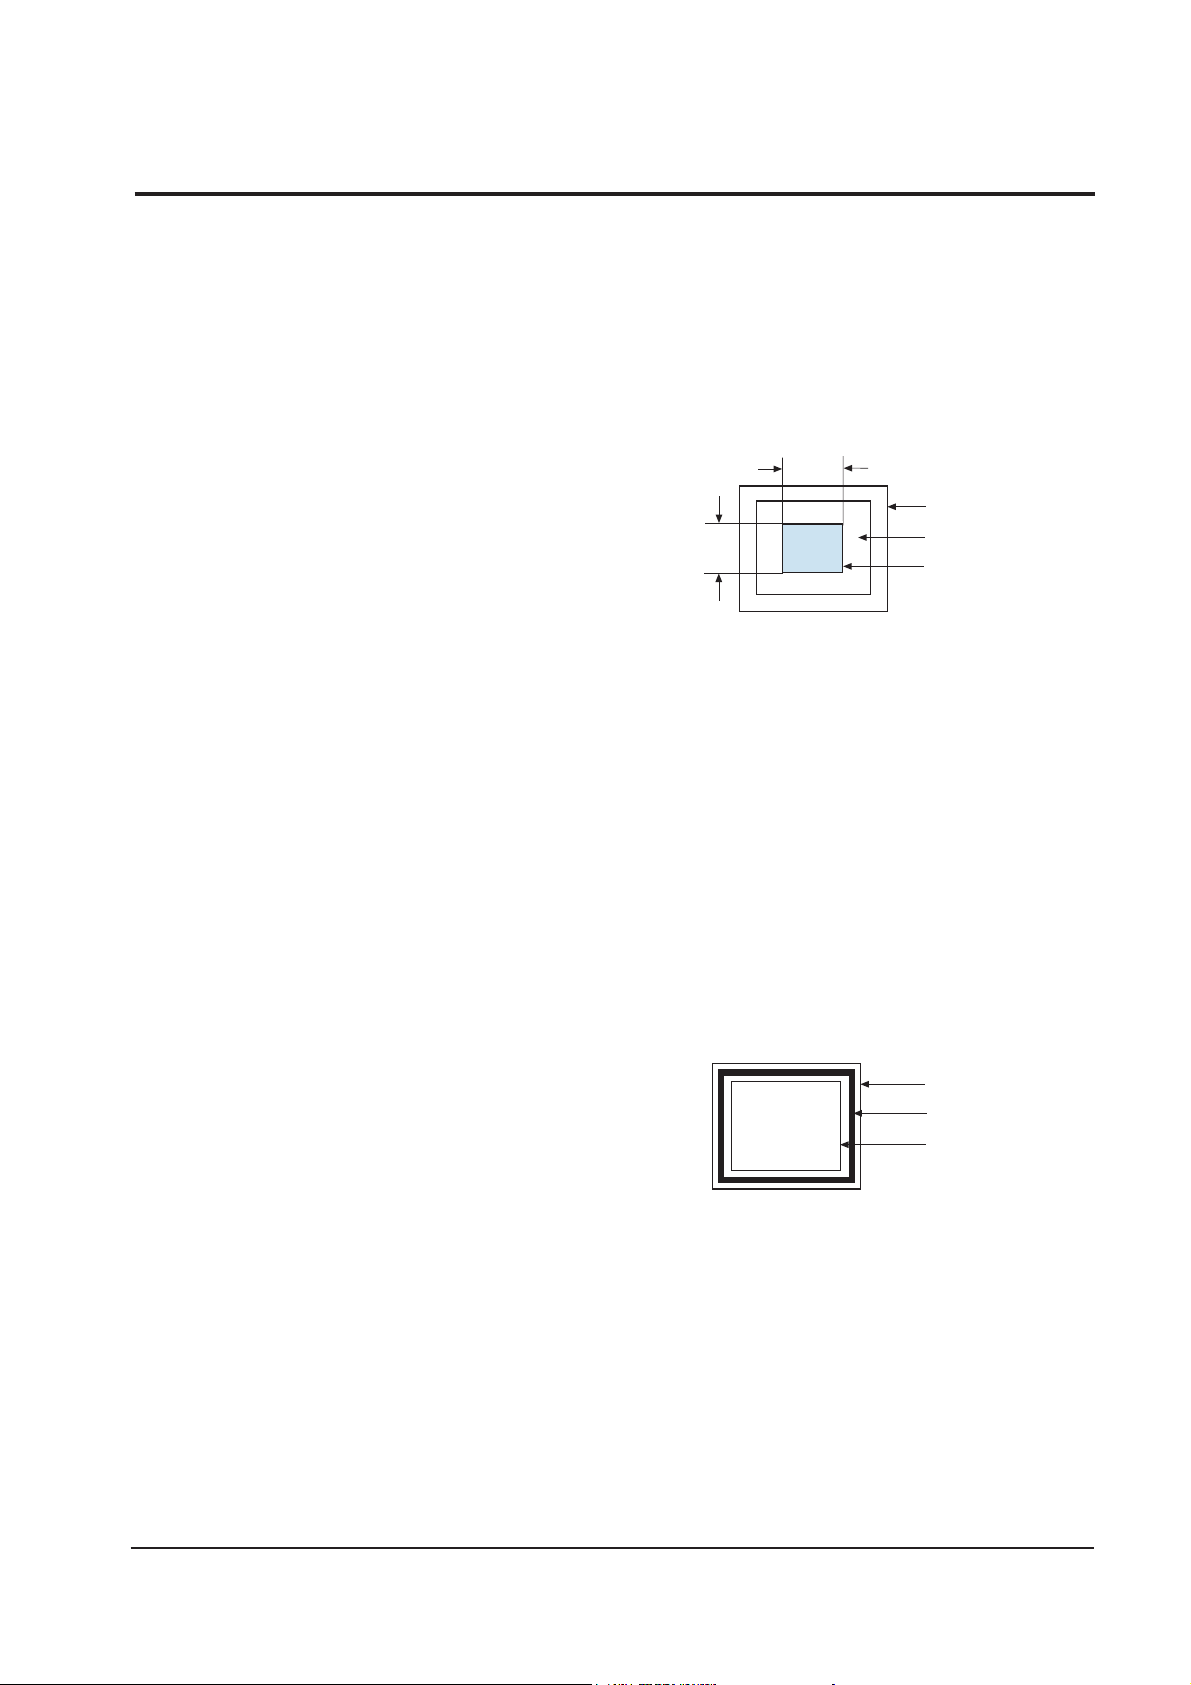
4-3-2 (b) WHITE BALANCE ADJUSTMENT
CONDITIONS
Scanning frequency: 68 kHz/85 Hz (17Ó)
54 kHz/85 Hz (15Ó)
Display image: White box pattern
Brightness: 0.06ft-L at Back Raster
Pattern Display
Contrast: Maximum
Figure 4-8. White Box Pattern
1. Use control bar after selecting ÒRED GAINÓ,
ÒGREEN GAINÓ and ÒBLUE GAINÓ to adjust
the luminance to 45 ft-L (15Ó) and 46 ft-L
(17Ó) with the color coordinates ranged for
9300K to x = 0.283 ± 0.02, y = 0.298 ± 0.02.
exception) 17Ó SDD CRT type-named
(*/S-2) : 42ft-L.
4-3-2 (c) ABL ADJUSTMENT
CONDITIONS
Scanning frequency: 68 kHz/85 Hz (17Ó)
54 kHz/85 Hz (15Ó)
Display image: Full white pattern
Brightness: Maximum
Contrast: Maximum
Figure 4-9. Full White Pattern
1. Check the ABL. If it is not within the
specifications, use the ABL controls to adjust
it. (15Ó: 33 ± 1 ft-L, 17Ó: 36 ± 1 ft-L )
2. Select Ò@4: COLOR SAVEÓ to save the data.
3. Select Ò@6: ALL COLOR SAVEÓ to save the
CH2.
4 Alignment and Adjustments
4-6 DP15H*/DP17L*
4-3 Color Adjustments
1/3H-1/2H
1/3V-1/2V
FRONT BEZEL OPENING
BACK RASTER
WHITE WINDOW
FRONT BEZEL OPENING
BACK RASTER
WHITE WINDOW

4-3-2 (d) WHITE BALANCE ADJUSTMENT VERIFICATION
CONDITIONS
Scanning frequency: 68 kHz/85 Hz (17Ó)
54 kHz/85 Hz (15Ó)
Display image: Back raster pattern
Full White Pattern
X-Y Coordinates: x = 0.283 ± 0.02,
y = 0.298 ± 0.02
ABL Luminance Refer to 4-3-2(c)
Brightness: Maximum
Contrast: 5 ft-L, 24 ft-L
1. Check whether the color coordinates of the
back raster satisfy the above spec.
If they do not, return to 4-3-2 (a) and readjust
all settings.
2. Display a full white pattern.
3. Select ÒGeometryÓ in softjig menu.
4. Select Ò@7: 5-ft Ò in right menu.
5. Check whether the white coordinates of the
video meet the above coordinates spec.
6. Select Ò@8: 24-ft Ò in right menu.
7. Check whether the white coordinates of the
video satisfies the above spec.
If they do not, return to 4-3-2 (a) and readjust
all settings.
Select ÒColorÓ and click Ò@2: CHANNEL 2Ó
for color ajdustment for 6500K
Repeat the sequence of 9300K adjustment.
The luminance values the same as 9300K, but
the color coordinated of back raster and white
box are : x = 0.313
± 0.02 y = 0.329 ± 0.02
4-3-3 Luminance Uniformity Check
Luminance is considered uniform only if the ratio
of lowest to highest brightness areas on the screen
is not less than 7.5:10.
CONDITIONS
Scanning frequency: 68 kHz/85 Hz (17Ó)
54 kHz/85 Hz (15Ó)
(1024 x 768)
Display image: White flat field
Brightness: Cut off point at 24 ft-L
Contrast: Maximum
PROCEDURE
Measure luminance at nine points on the display
screen (see figure below).
4-3-4 Focus Adjustment
CONDITIONS
Scanning frequency: 68 kHz/85 Hz (17Ó)
54 kHz/85 Hz (15Ó)
(1024 x 768)
Display image: ÒHÓ character pattern
Brightness: Cut off point
Contrast: Maximum
PROCEDURE
1. Adjust the Focus VR on the FBT to display the
sharpest image possible.
2. Use Locktite to seal the Focus VR in position.
4-3-5 Color Purity Adjustment
Color purity is the absence of undesired color.
Conspicuous mislanding (unexpected color in a
uniform field) within the display area shall not be
visible at a distance of 50 cm from the CRT
surface.
CONDITIONS
Orientation: Monitor facing east
Scanning frequency: 68 kHz/85 Hz (17Ó)
54 kHz/85 Hz (15Ó)
Display image: White flat field
Luminance: Cut off point at the center
of the display area
Note: Color purity adjustments should only be
attempted by qualified personnel.
4 Alignment and Adjustments
DP15H*/DP17L* 4-7
Figure 4-10. Luminance Uniformity Check Locations
PROCEDURE
For trained and experienced service technicians
only.
Use the following procedure to correct minor
color purity problems:
1. Make sure the display is not affected by
external magnetic fields.
2. Very carefully break the glue seal between the
2-pole purity convergence magnets (PCM), the
band and the spacer (see Figures 4-12).
3. Make sure the spacing between the PCM
assembly and the CRT stem is 29 mm ± 1 mm.
4. Display a green pattern over the entire display
area.
5. Adjust the purity magnet rings on the PCM
assembly to display a pure green pattern.
(Optimum setting: x = 0.295 ± 0.015,
y = 0.594 ± 0.015)
6. Repeat steps 4 and 5 using a red pattern and
then again, using a blue pattern.
Table 4-4. Color Purity Tolerances
(For 9300K color adjustment: x = 0.283 ± 0.02, y = 0.298 ± 0.02)
7. When you have the PCMs properly adjusted,
carefully glue them together to prevent their
movement during shipping.
4 Alignment and Adjustments
4-8 DP15H*/DP17L*
Red: x = 0.640 ± 0.015 y = 0.323 ± 0.015
Green: x = 0.295 ± 0.015 y = 0.594 ± 0.015
Blue: x = 0.142 ± 0.015 y = 0.066 ± 0.015
DP15H*/DP17L* 5-1
5 Troubleshooting
5-1 Parts Level Troubleshooting
Notes: 1. If a picture does not appear, fully rotate the brightness and contrast controls clockwise and reinspect.
2. Check the following circuits.
• No raster appears: Power circuit, Horizontal output circuit.
• High voltage develops but no raster appears: Video output circuits.
• High voltage does not develop: Horizontal output circuits.
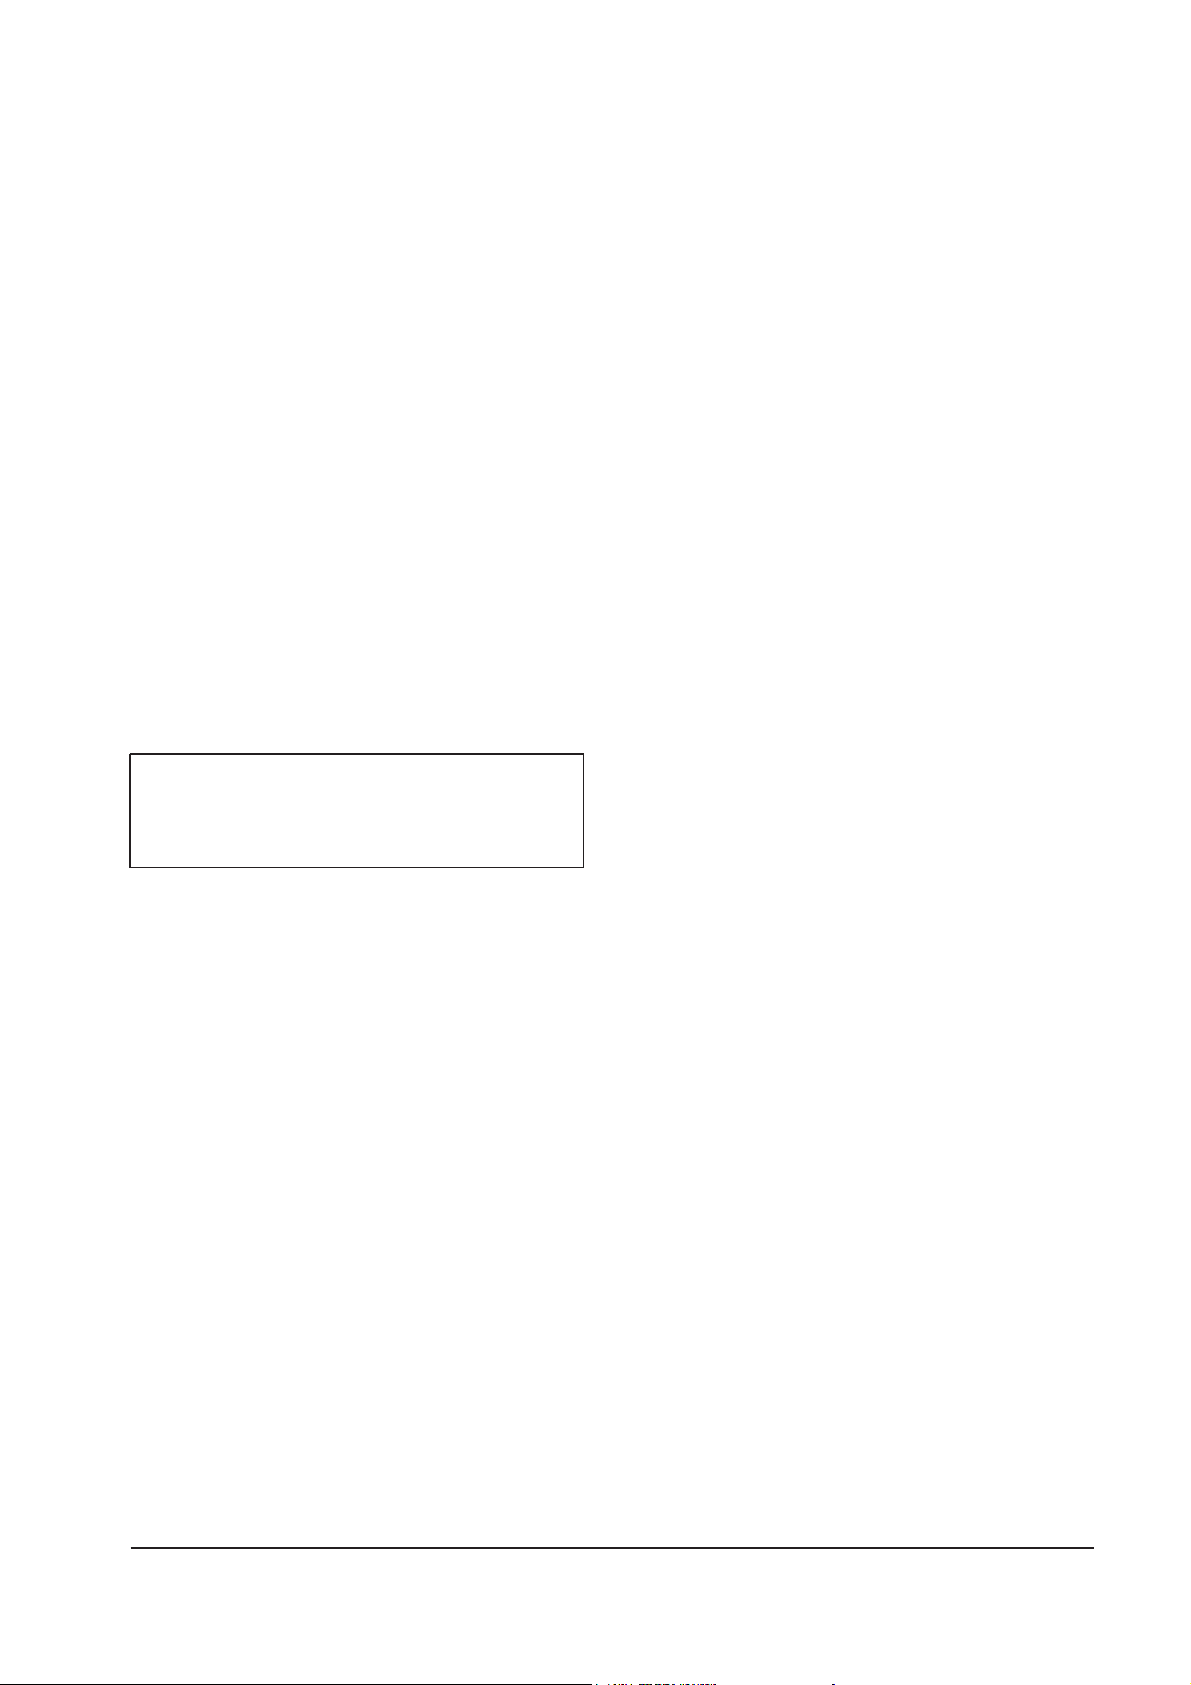
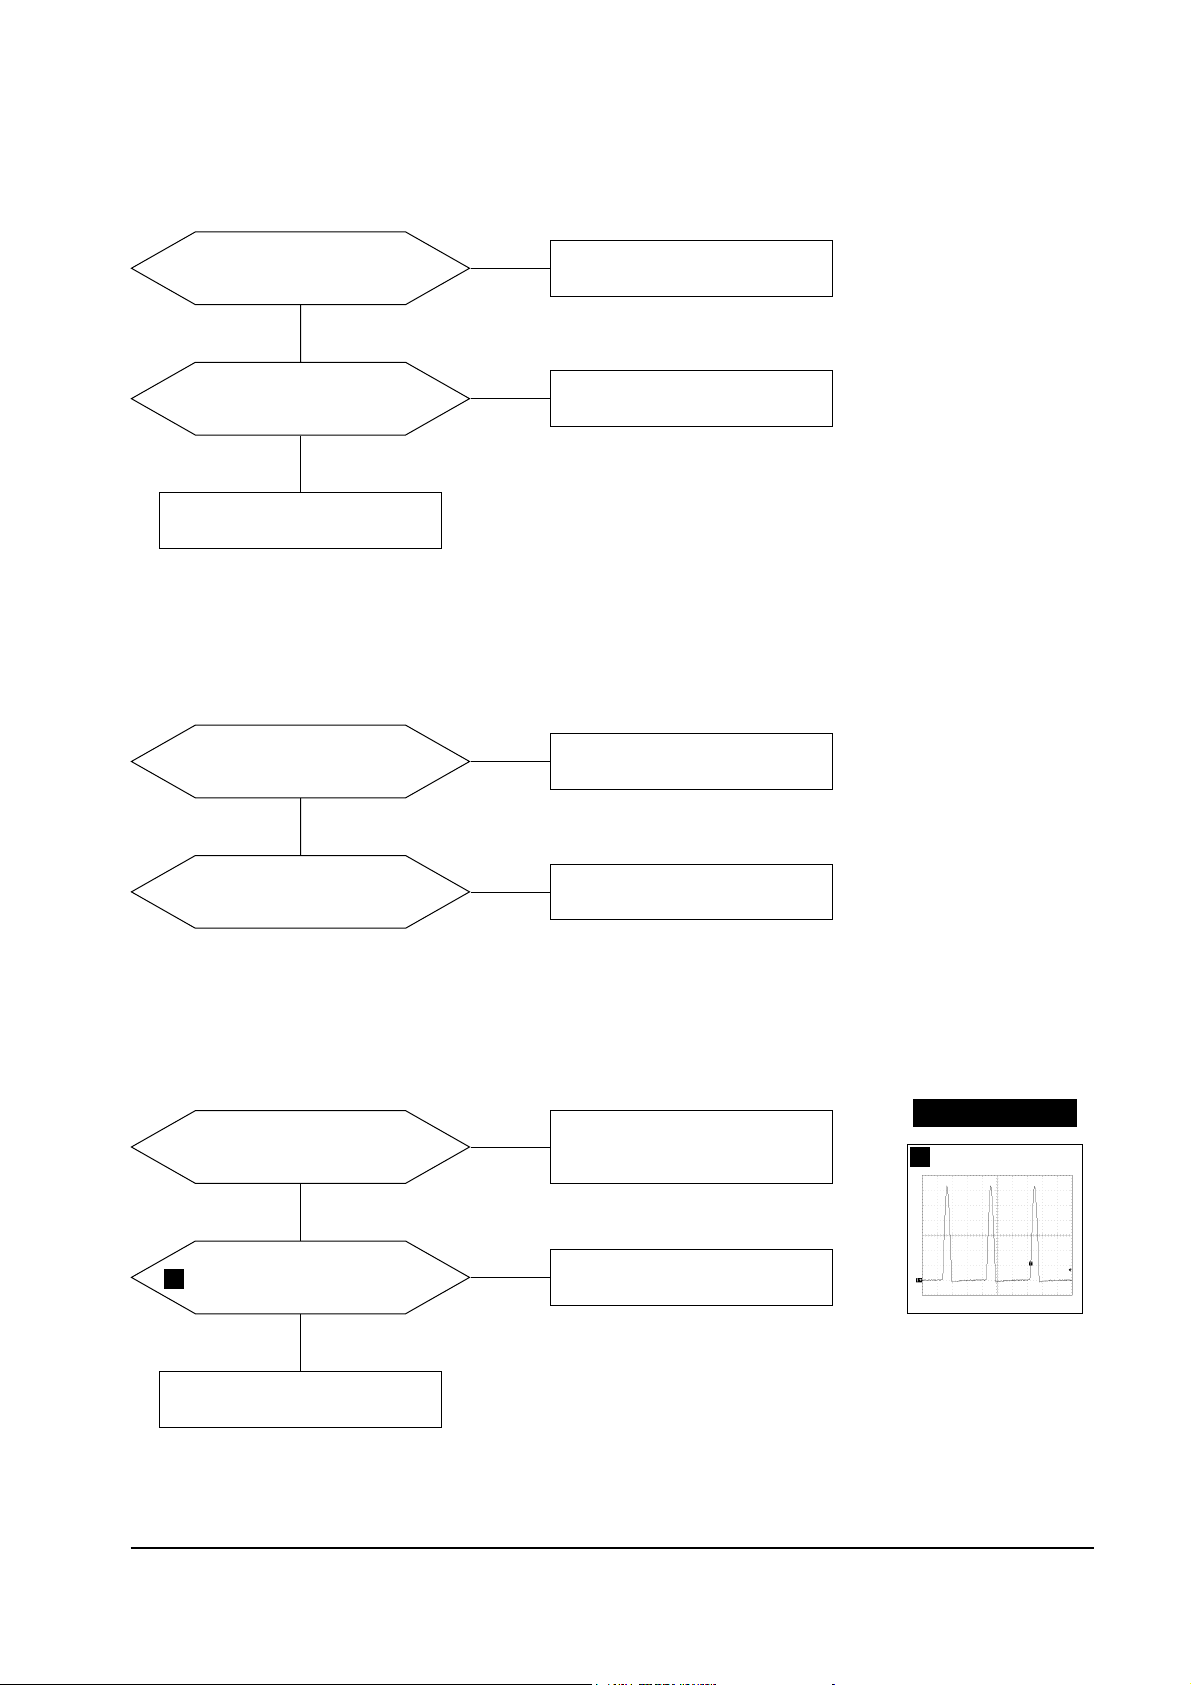
5-1-1 No Power Supply
Chirping noise exists?
Check and replace IC601.
Check and replace D601, FH1
Done.
No
Yes
Repeating start?
Check and replace D606.
No
Yes
IC601 Pin 1 waveform is right?
Check and replace D614, IC601,
Q602, ZD601.
Yes
No
C622 Voltage is 13 V ± 0.5V?
Check and replace IC201, IC301,
IC401, Q402, Q404.
Yes
No
Normal operation
Replace Main board.
Yes
Verify voltages.
Yes
No
WAVEFORMS
1
1
100 V (IC601, #1)
CH1 P-P = 100 V CH1 RMS = 350.2 V
5 Troubleshooting
5-2 DP15H*/DP17L*
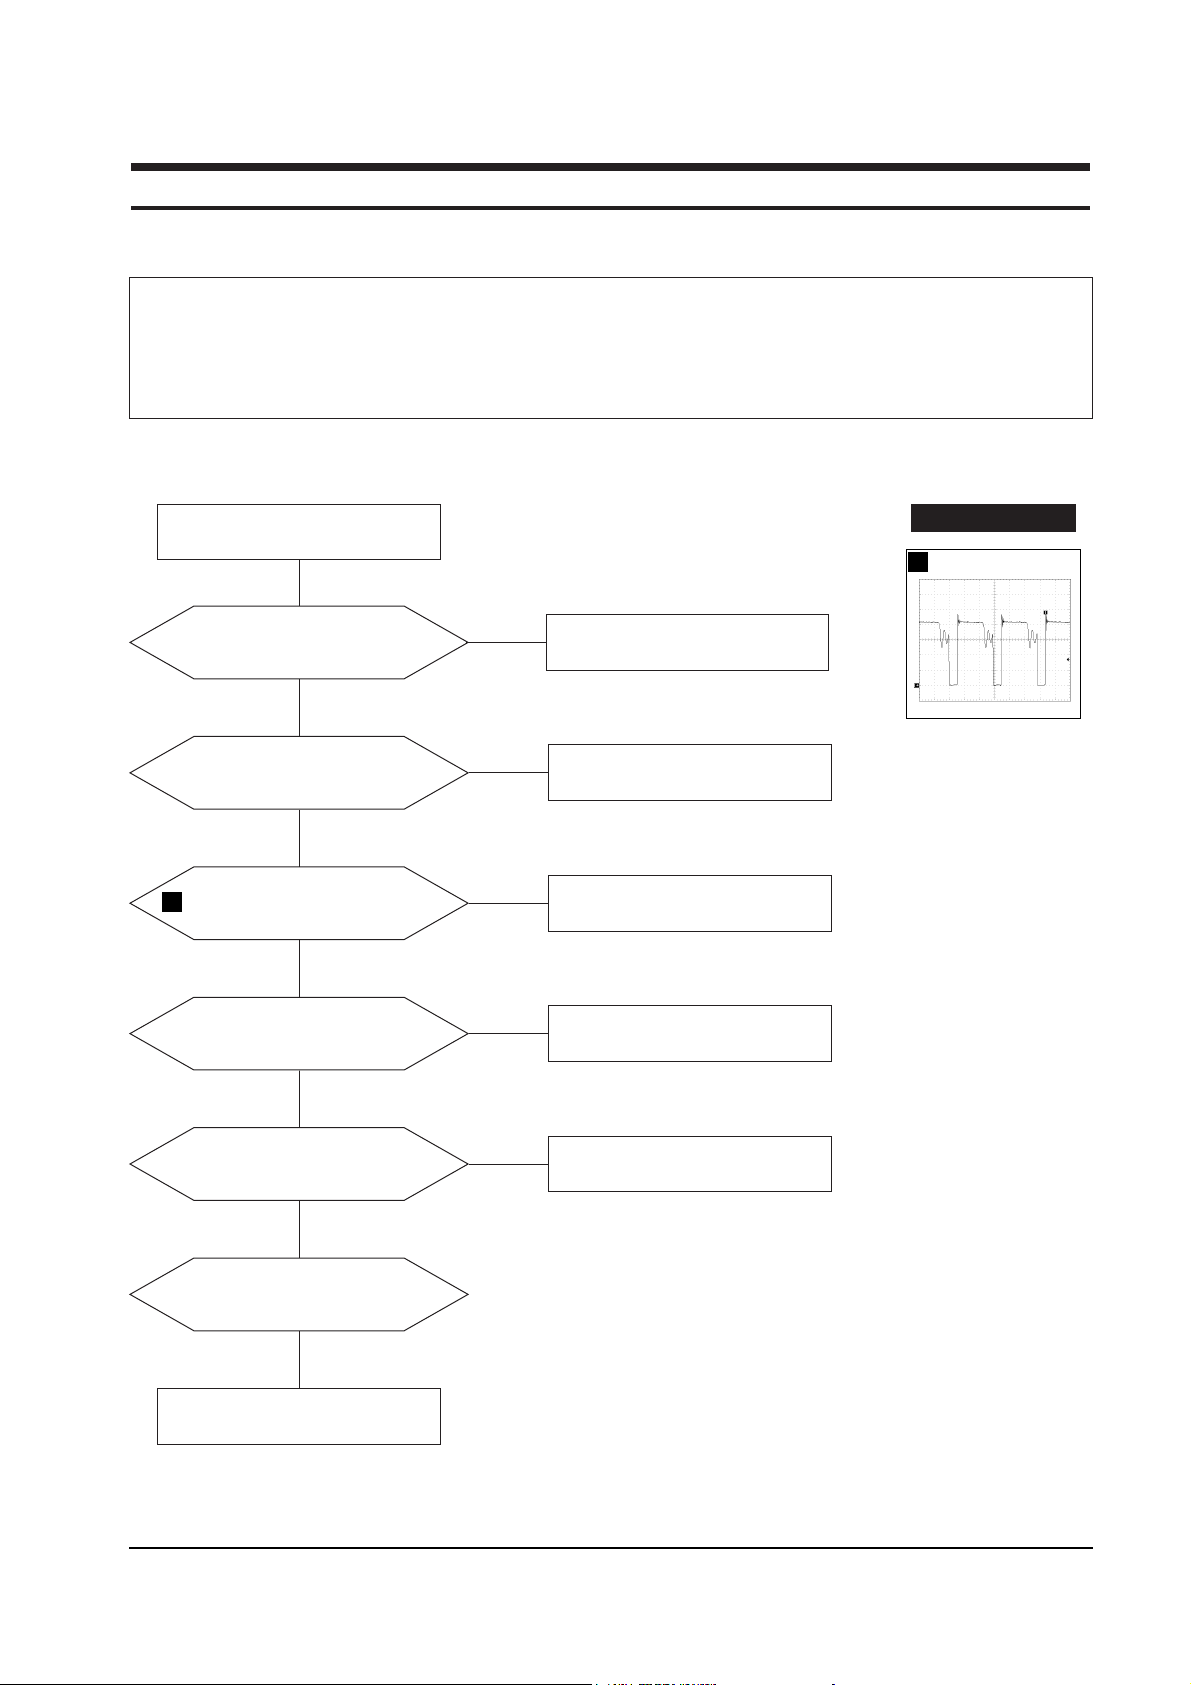
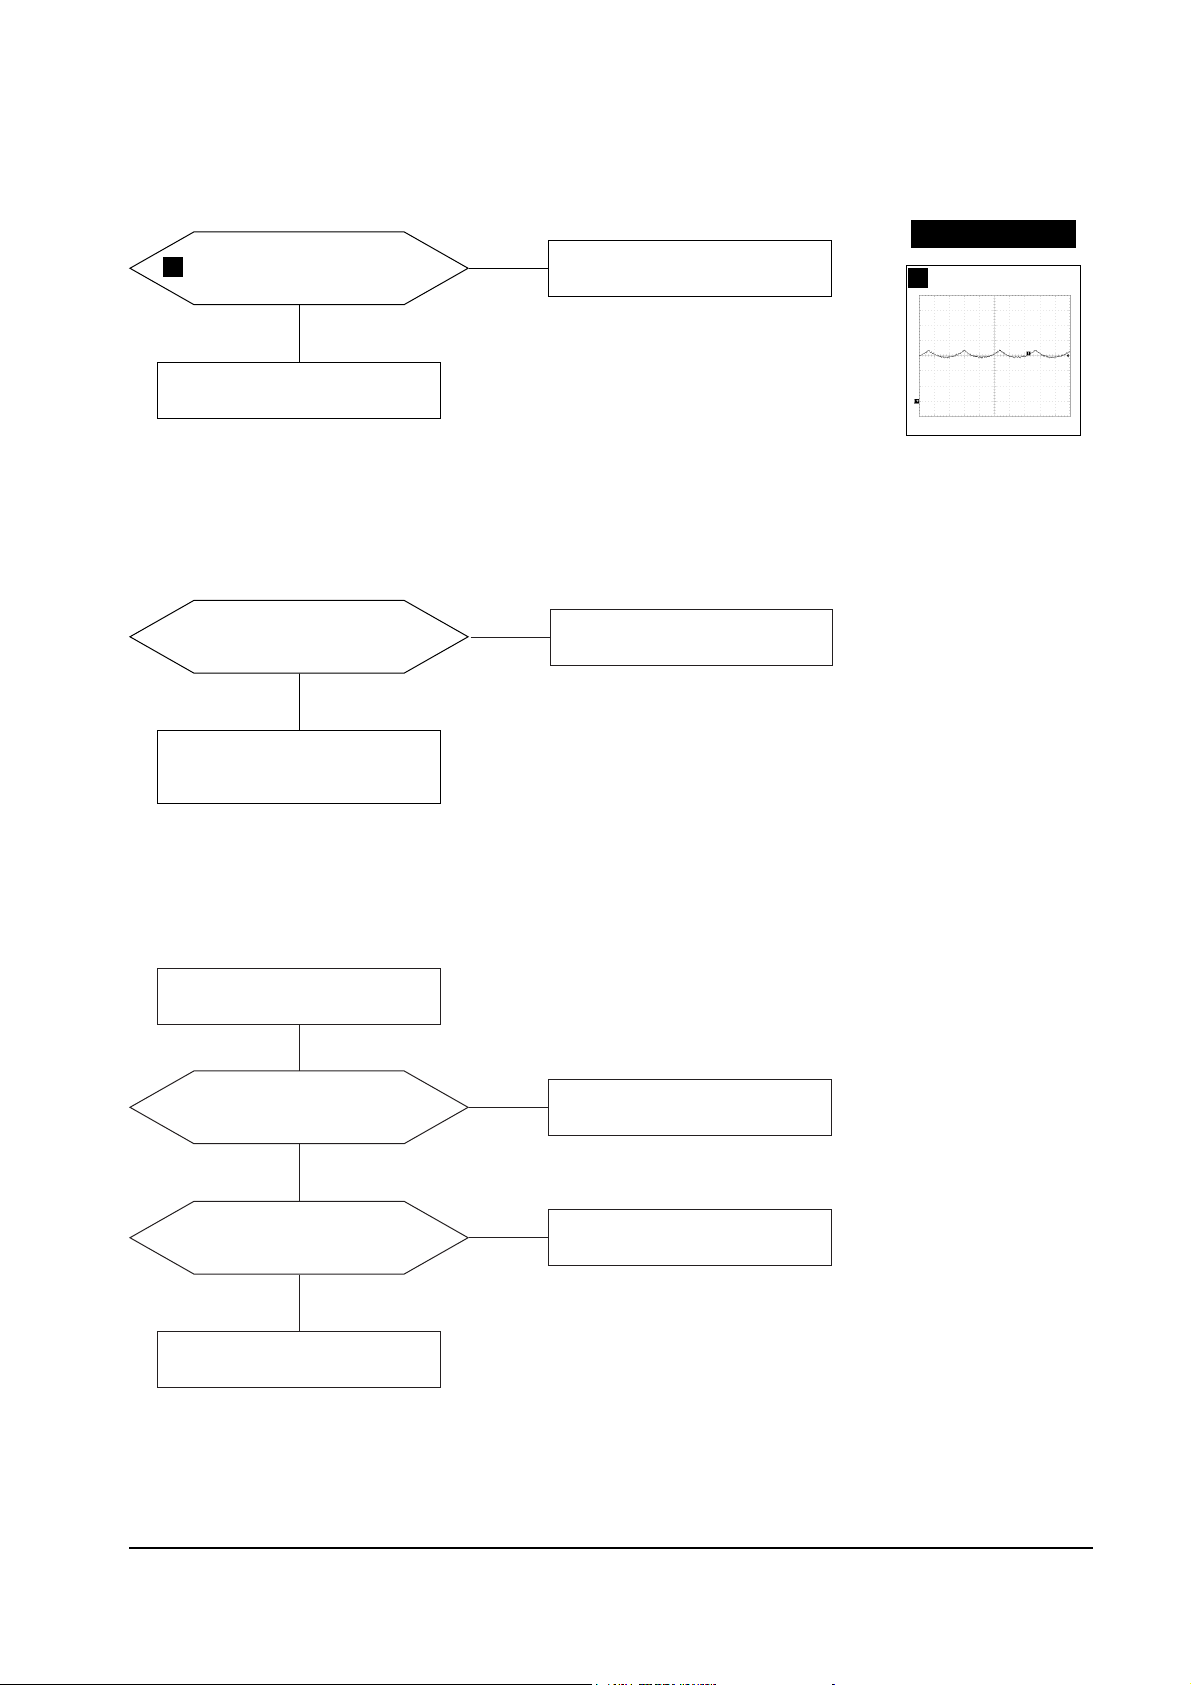
5-1-2 DPMS Failure
Make No H/V sync (power off
mode)
Check signal source
H/V sync video level.
LED blinks
Check IC201 Pin 40.
Yes
No
+12 V line off
Check IC201 Pin 5.
Yes
No
IC602 Pin 4
voltage exists?
Check IC201 Pin 6.
Check and replace IC602.
No
Yes
IC601 Pin 1 output
voltage exists?
Refer to 5-1-1 No Power Supply.
Done
Yes
No
WAVEFORMS
2
2
100V (IC601, #1)
CH1 P-P = 100V CH1 RMS = 325.8 V
5 Troubleshooting
DP15H*/DP17L* 5-3
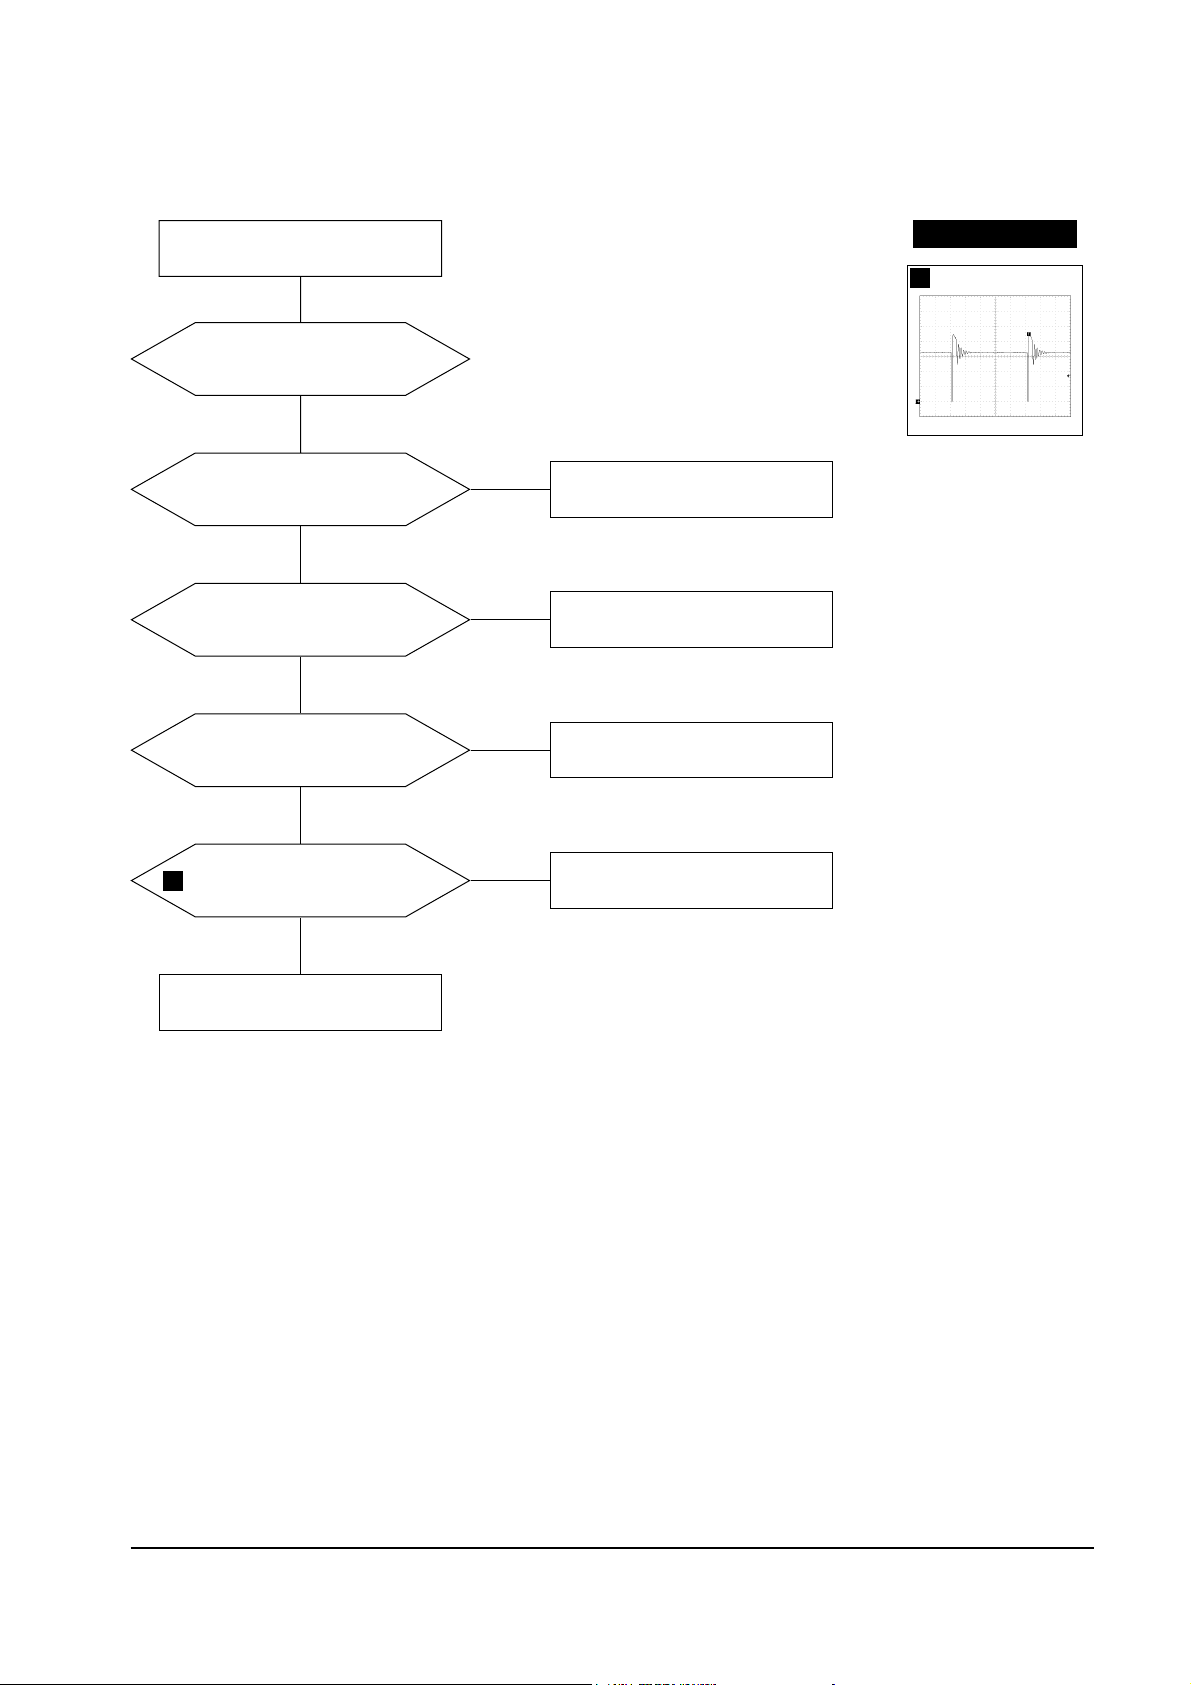
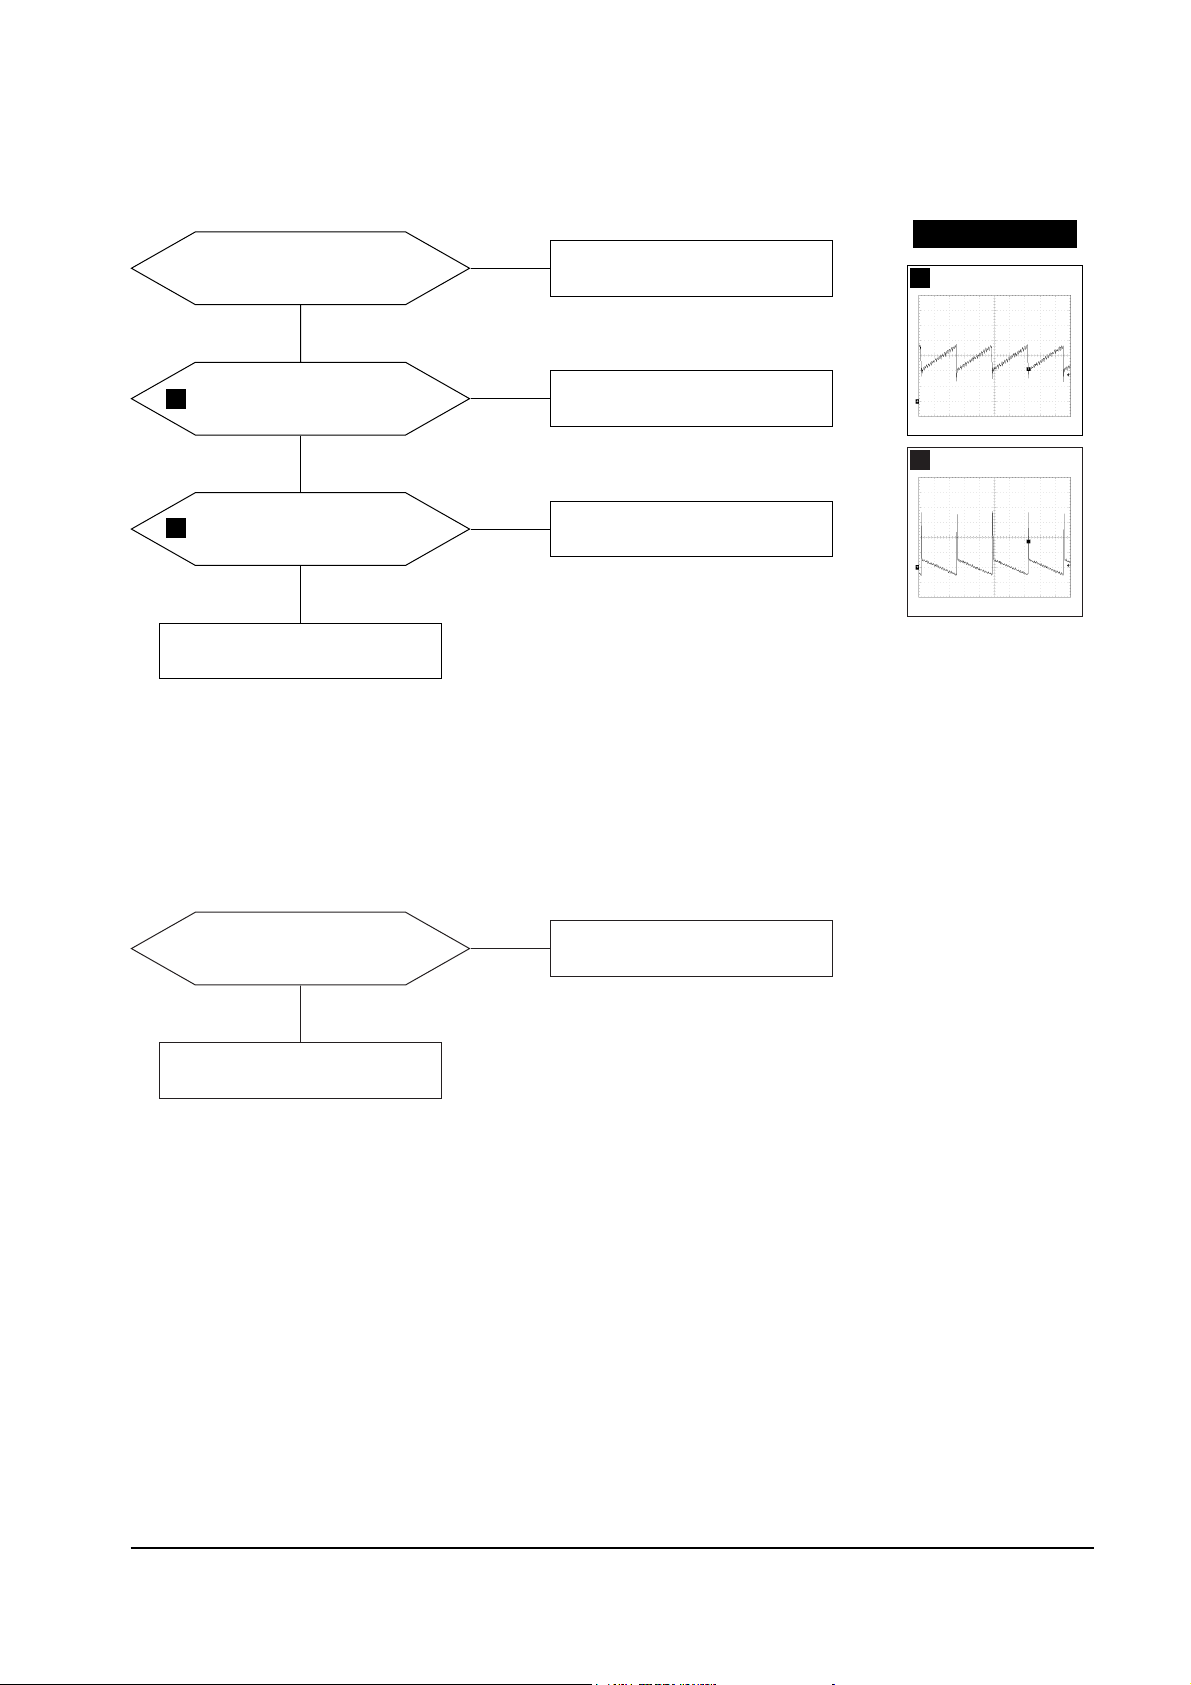
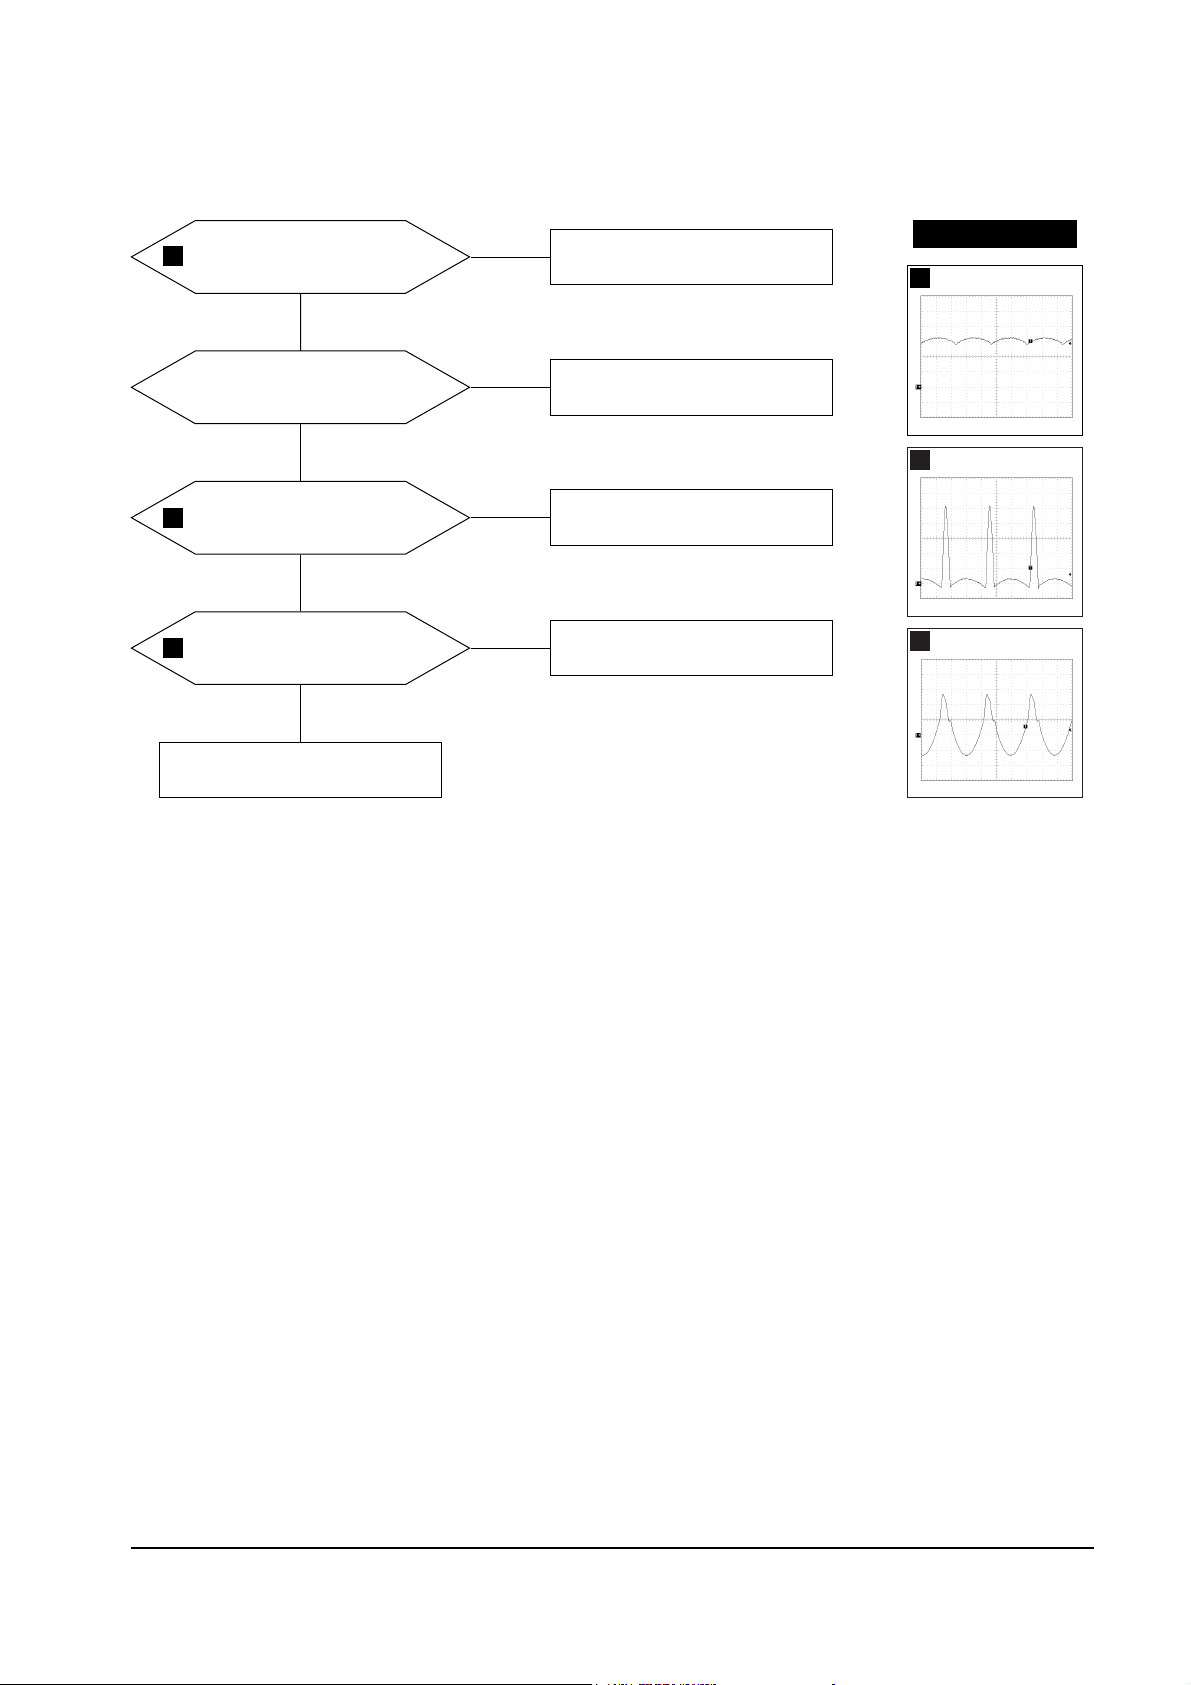
5-1-3 H_Deflection Failure
Does Horizontal paluse signal
appear at at Pin 8 of IC401?
Check IC401.
Yes
No
Does 110 Vp-p signal appear
at Collector of Q403?
Check Q443.
No
No
Check Q402, Q404, T401.
WAVEFORMS
4
3
2.00 V (IC401, #6)
CH1 P-P = 2.00V CH1 RMS = 5.868V
4
1.00V (IC401, #8)
CH1 P-P = 1.00V CH1 RMS = 1.298V
5
20.0 V (Q403, Collector)
CH1 P-P = 20.0 V CH1 RMS = 46.80V
Does PWM output signal appear
at Pin 6 (H_out) of IC401?
Check IC401.
Check 12 V line.
Yes
No
Does DC 12V appear at
Pin 10 of IC401?
Yes
No
3
7-1-4 S Correction Failure
S1~S3 signals are right at each
frequency block?
Check S1 ~ S3 signal.
Check and replace Q404, Q409, Q410,
Q414, Q415, Q416
Yes
Check and replace IC201.
No
5
5 Troubleshooting
5-4 DP15H*/DP17L*
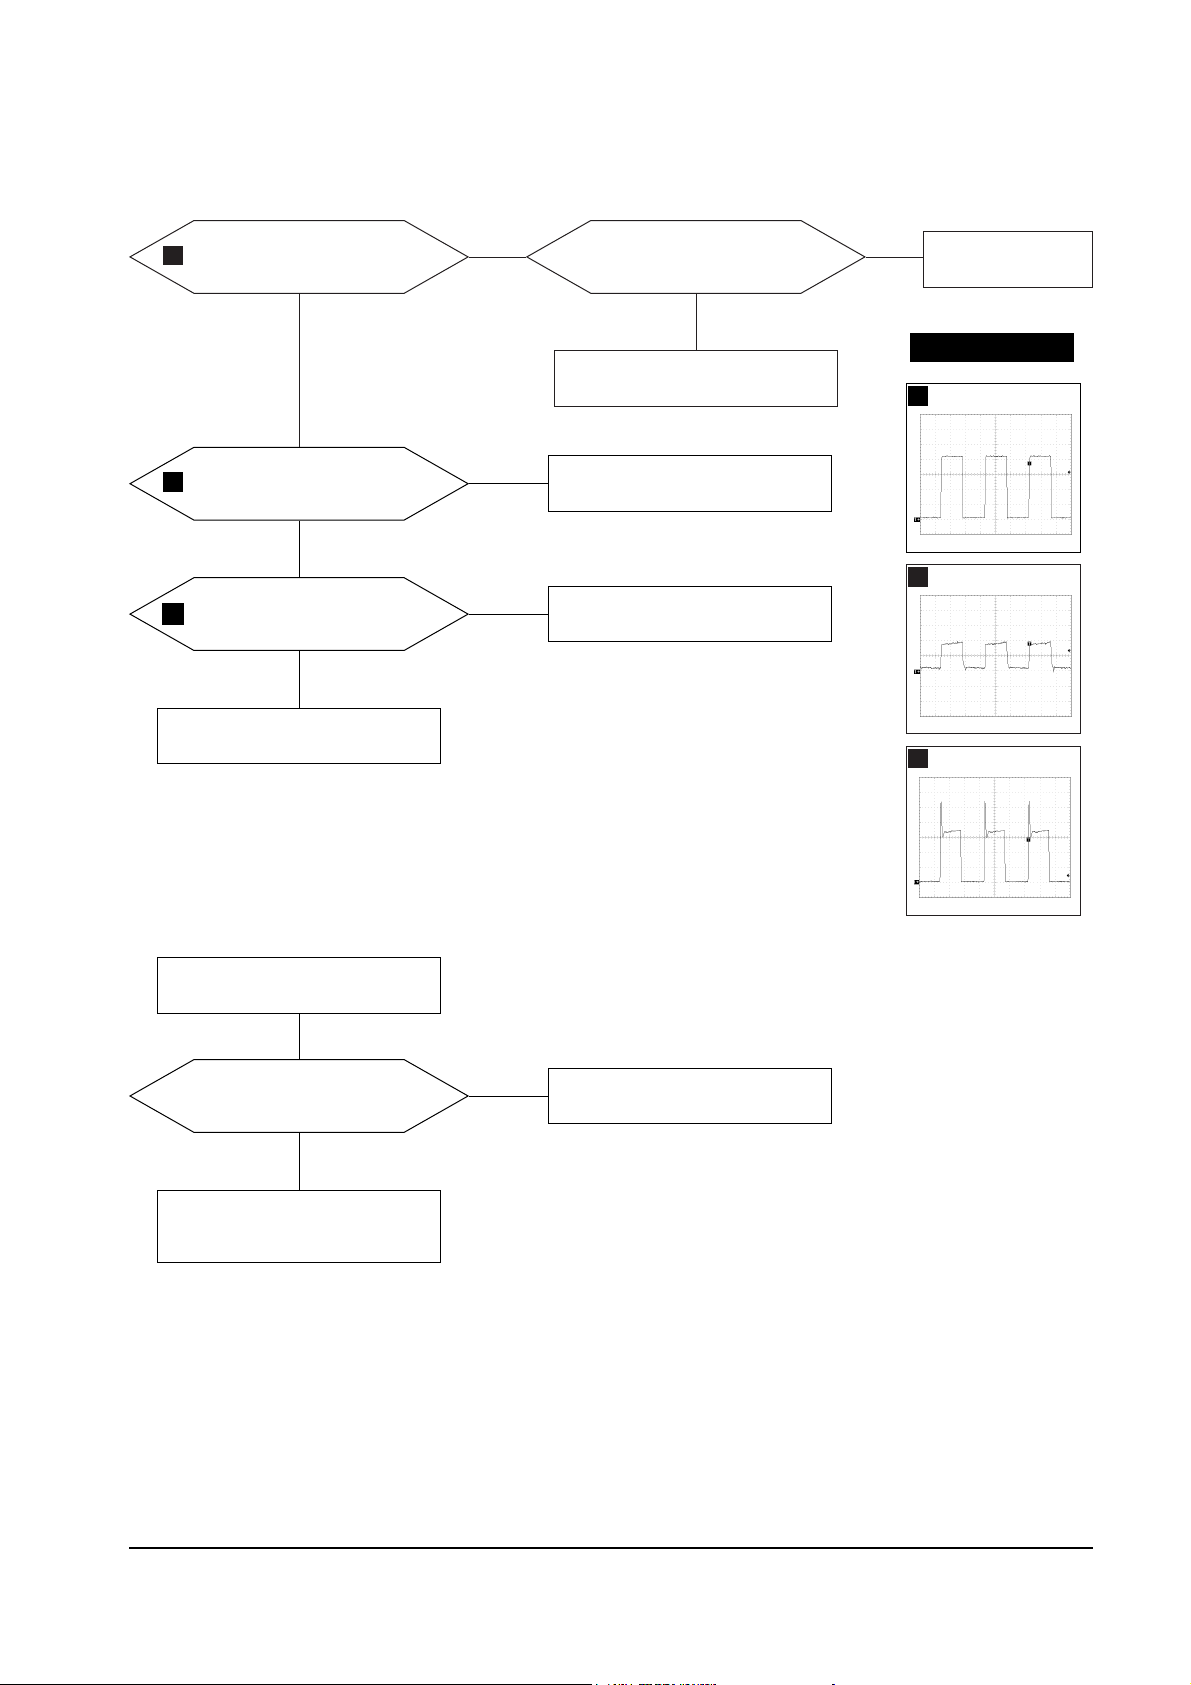
5-1-5 H_Lin. Failure
IC201 Pin 21 voltage varies with
different H_Lin. DAC values?
IC603 Pin 9 voltage varies with
different H_Lin. DAC values?
Check +12 V, –10 V line.
Check some parts around IC603.
Check Q412, Q413, T402.
Yes
Yes
No
Replace IC201.
No
5-1-6 Invariable H_Size
IC401 Pin 6 voltage varies with
different B_Out DAC values?
Q402 Gate output duty varies with
different B_Out DAC values?
Check some parts around Q402,
IC401 Pin 3 ~ 6.
Yes
No
Check and replace IC401.
No
5-1-7 Abnormal H_Size
IC401 Pin 11 output duty
varies with different B+ offset
DAC values?
Q408 Collector waveform is
right?
Check and replace Q405, Q406, Q407,
Q408.
Check some parts around D409, L401.
Yes
Yes
No
Check and replace IC201.
No
WAVEFORMS
6
6
200 V (Q408, Collector)
CH1 P-P = 200V CH1 RMS = 387.2V
5 Troubleshooting
DP15H*/DP17L* 5-5
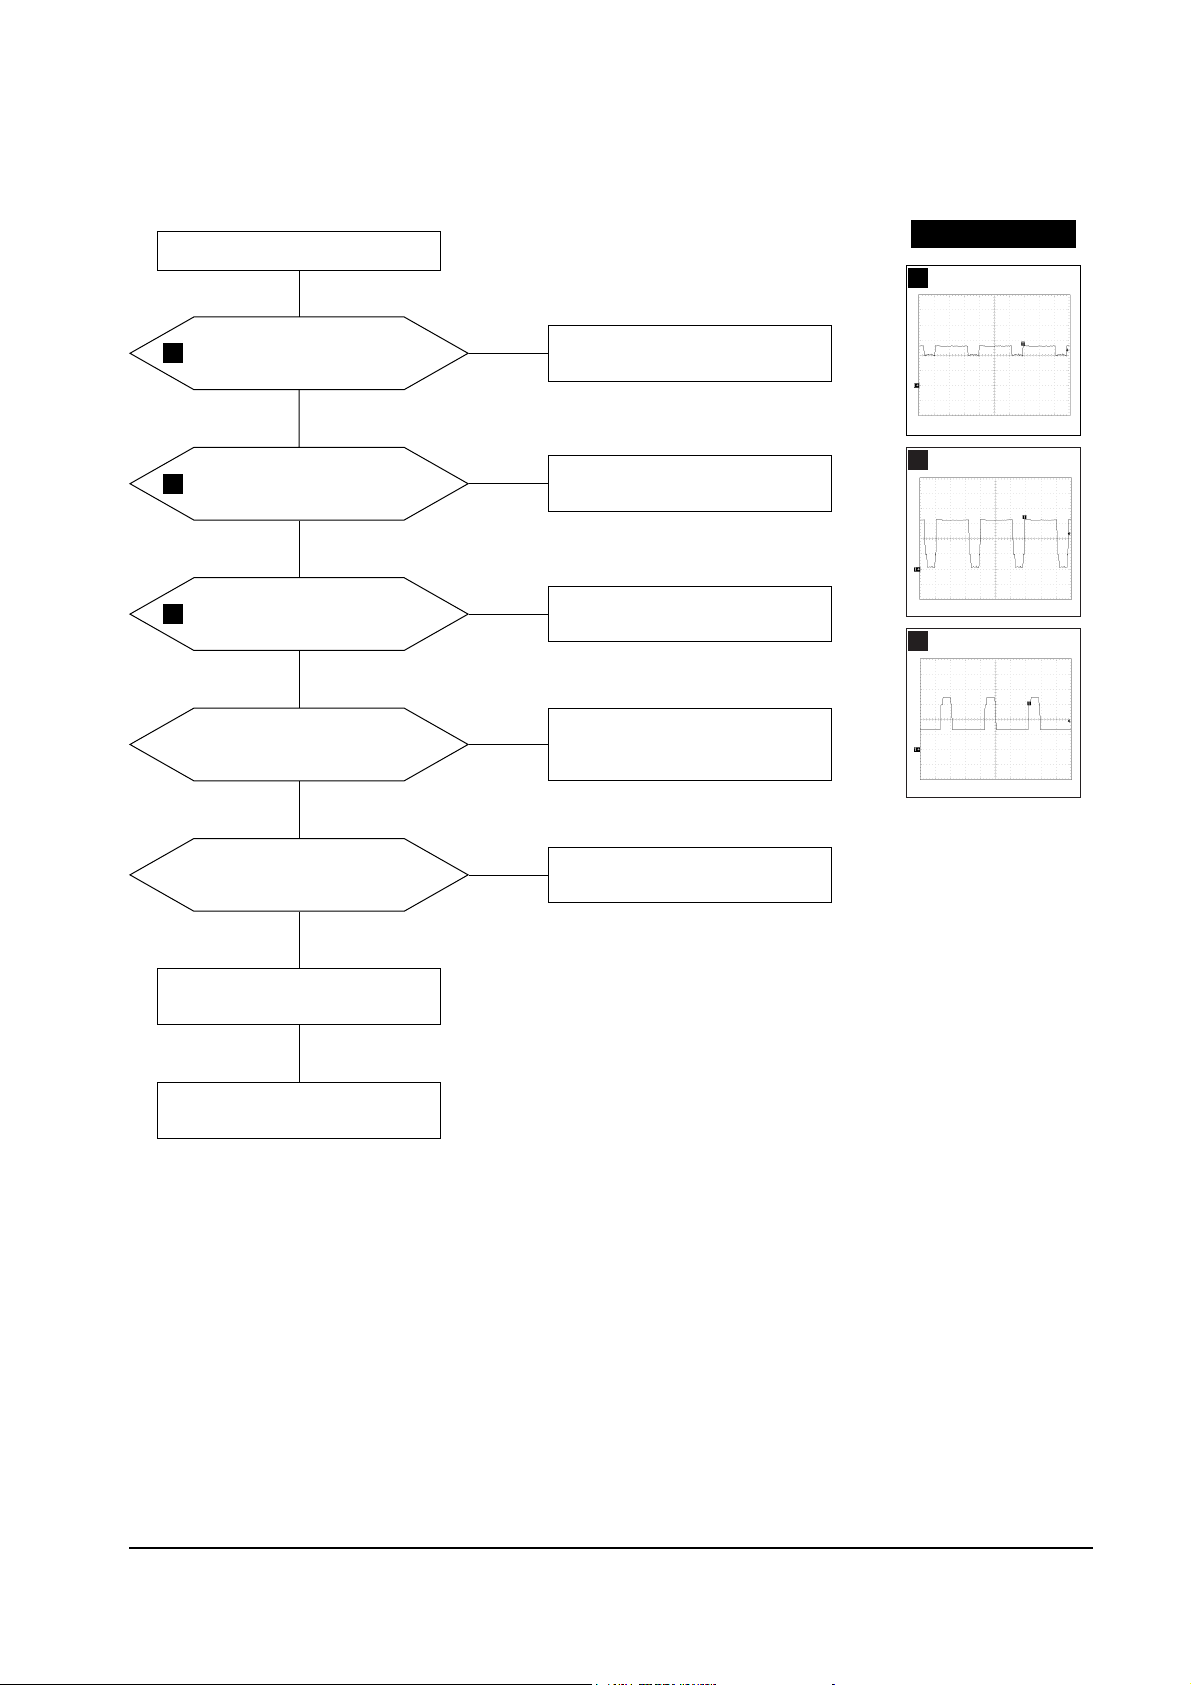
5-1-8 Side Pin or Trap Failure
IC401 Pin 11 output exists?
Yes
Check and replace IC401.
Refer to 5-1-7
Abnormal H_Size
.
5-1-9 Para. or Pin Balance Failure
IC401 Pin 11 output varies with
different DAC values?
No
Replace IC401.
No
WAVEFORMS
7
7
1.00 V (IC401, #11)
CH1 P-P = 1.00V CH1 RMS = 3.008 V
5-1-10 Tilt Failure
IC201 Pin 20 output duty varies
with different DAC values?
IC603 Pin 13 output varies with
different DAC values?
Check and replace IC603.
Check and replace Q301, Q302.
Yes
Yes
No
Check and replace IC201.
No
Check tilt connector connection
Refer to 5-1-7
Abnormal H_Size
.
Yes
5 Troubleshooting
5-6 DP15H*/DP17L*
5-1-11 V Deflection Failure
13 V, –10 V line is on?
IC401 Pin 12 output exists?
Check and replace IC401.
Yes
Yes
No
Refer to 5-1-1 No Power Supply
No
IC301 Pin 6 output exists?
Check and replace some parts
around IC301.
Yes
No
Check DY connector connection.
WAVEFORMS
8
9
8
500 V (IC401, #12)
CH1 P-P = 500 V CH1 RMS = 1.425 V
9
10.0 V (IC301, #6)
CH1 P-P = 10.0 V CH1 RMS = 5.06 V
5-1-12 V Size or Pos. Variation Failure
IC401 Pin 12 output varies with
different DAC values?
Yes
Check and replace IC201, IC401.
Check and replace IC301.
No
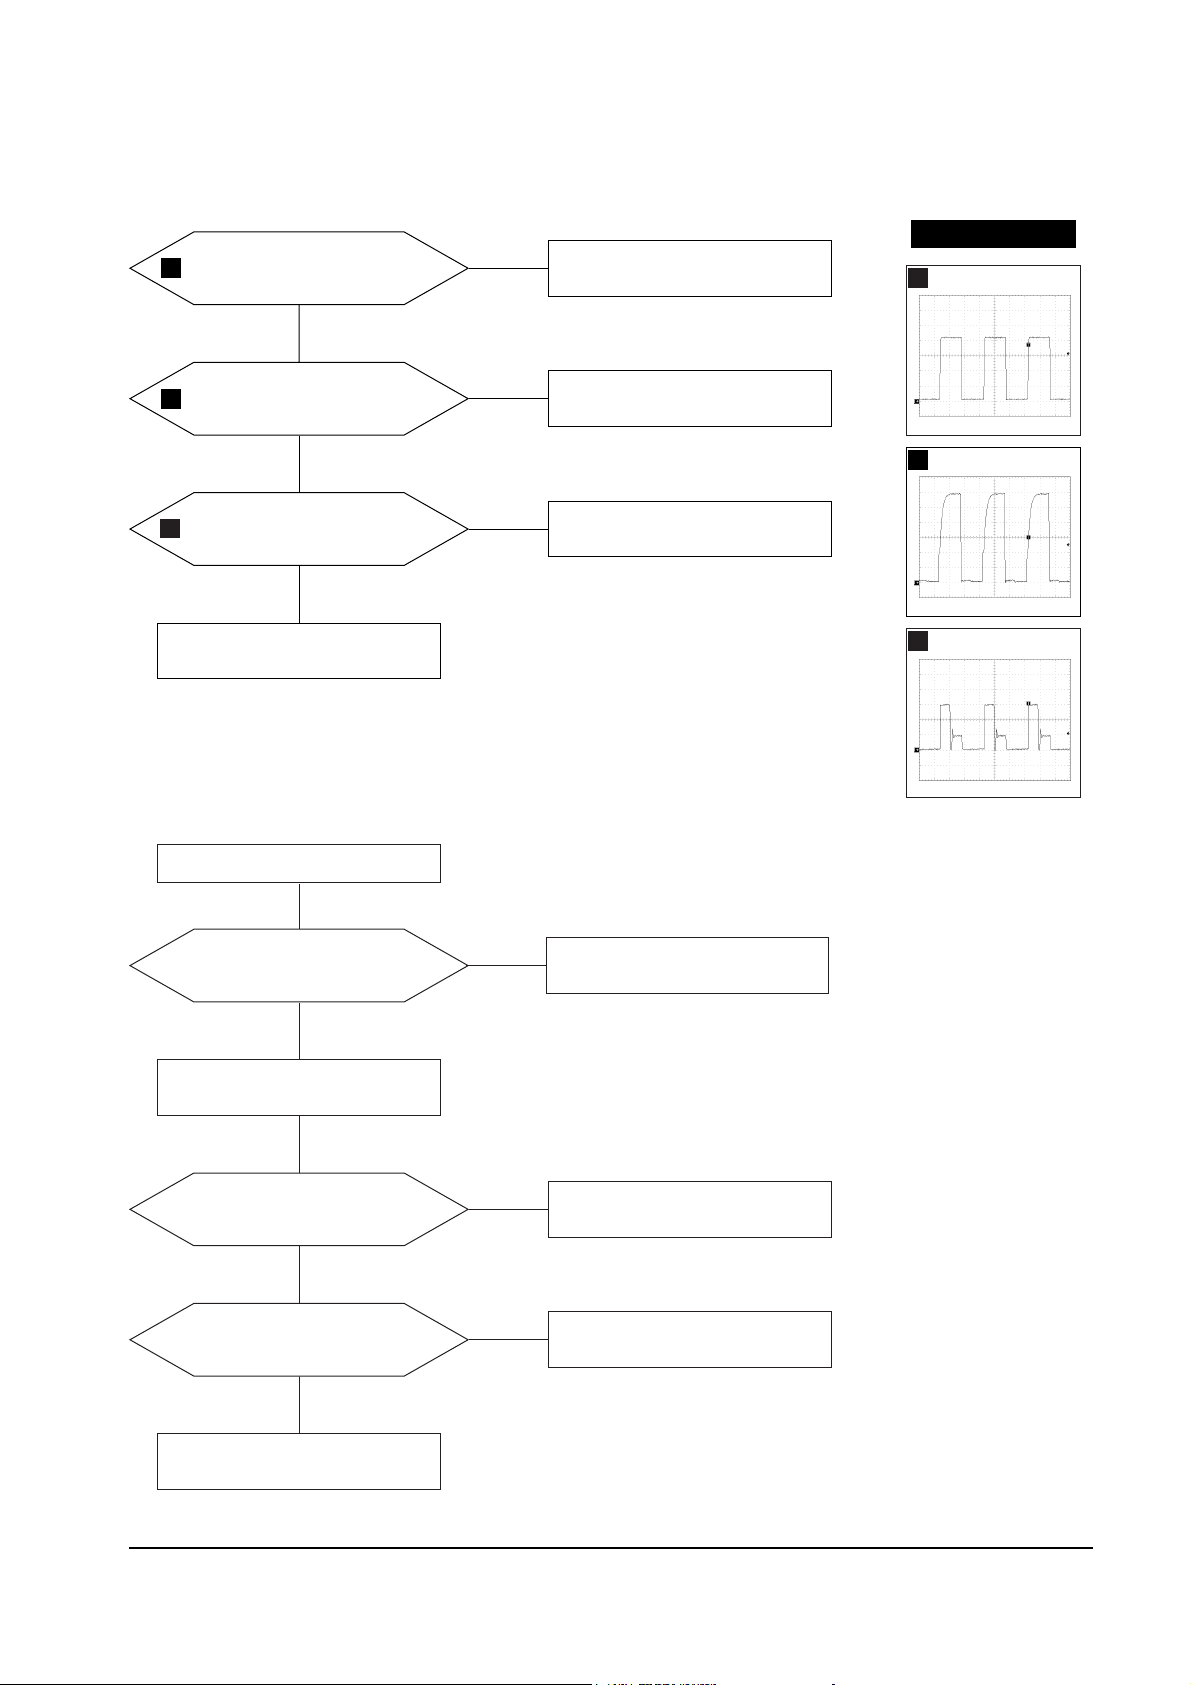
5 Troubleshooting
DP15H*/DP17L* 5-7
5-1-13 High Voltage Failure
IC401 Pin 6 OSC pulse exists?
Q402 Gate driving pulse exists?
Check and replace Q401.
Yes
Yes
No
Check and replace IC401
and +12 V line.
No
Q402 Drain pulse exists?
Check and replace Q403,
L402.
Yes
No
Done
WAVEFORMS
10
3
11
2.00 V (Q402, Gate)
CH1 P-P = 2.00 V CH1 RMS = 7.692V
3
2.00 V (IC401, #6)
CH1 P-P = 2.00 V CH1 RMS = 5.868 V
11
50.0 V (Q402, Drain)
CH1 P-P = 50.0 V CH1 RMS = 73.7V
IC101 Pin 12 input exists and
varies with different patterns?
Check and replace IC101.
Input full white pattern to monitor.
No
Yes
No
T501 Pin 8 output exists?
Check and replace T501.
Yes
No
IC201 Pin 26 output exists and
varies with different patterns?
Check and replace IC201.
Yes
No
Done
Check CN102.
5-1-14 ABL Failure
11
5 Troubleshooting
5-8 DP15H*/DP17L*
5-1-15 Dynamic Focus Failure
IC401 Pin 32 output is right?
Some parts around Q551 are right?
Replace failed part.
Yes
Yes
No
Replace the IC401.
No
T502 Pin 6 input is right?
Check and replace C432.
Yes
No
T502 Pin 1 output is right?
Replace the T502.
No
No
Check the connection between FBT
Focus pin, CRT Socket PCB.
WAVEFORMS
13
14
12
12
2.00 V (IC401, #32)
CH1 P-P = 2.00V CH1 RMS = 6.124V
13
50.0 V (T502, #6)
CH1 P-P = 50.0V CH1 RMS = 75.6V
14
100 V (T502, #1)
CH1 P-P = 100V CH1 RMS = 124.0V
5 Troubleshooting
DP15H*/DP17L* 5-9
5-1-16 No Video
IC101 Pins 5, 8 and 10 inputs
are right?
IC101 Pins 21, 24 and 26
outputs are right?
Check I2C bus and +12 V line.
Yes
Yes
No
Check the signal cable connection.
No
IC103 Pins 1, 2 and 3 outputs
are right?
Check +12 V, +72 V line.
Check and replace IC103.
Yes
No
Cathode DC levels are right?
Check +72 V line.
Check and replace QR01, QR02,
QG01, QG02, QB01, QB02.
Yes
No
G2 voltage is right?
Check G2 wire, CRT Socket board,
and FBT.
Change CRT.
Yes
Done.
No
Check signal cable and connection.
WAVEFORMS
15
16
17
15
1.00 V (IC101, #5, 8, 10)
CH1 P-P = 1.00V CH1 RMS = 2.452V
16
1.00 V (IC101, #21,24,26)
CH1 P-P = 1.00V CH1 RMS = 2.792V
17
20.0 V (IC103, #1, 2, 3)
CH1 P-P = 20.0V CH1 RMS = 40.52V
 Loading...