

Page 1

S3601 Series Vector Network Analyzer
User Manual
Saluki Technology Inc.
Page 2

Tel: 886.2.2175 2930 Email: [email protected]
2
Part No.
Name
Description
S3601A-01
75Ω port impedance
Notes:After choosing this option, the main unit will not
has 50Ω port impedance system.
S3601A-02
N-type testing cable
GORE-OSZKUZKU0240, dual male, 60cm
S3601A-03
N-type testing cable
GORE-OSZKUZKV0240, female male, 60cm
S3601A-05
20205 N-type calibration kit
DC - 3GHz
S3601A-06
20204 N-type 75Ω calibration kit
\
S3601A-07
Economical stable phase testing cable
Saluki-N/J.SMA/J.197C-800, N-type to 3.5mm connector,
dual male, 80cm
S3601A-08
Economical stable phase testing cable
Saluki-N/J.N/K.197C-800, N-type connector,
female-male, 80cm
S3601A-09
Economical stable phase testing cable
Saluki-N/J.N/J.197C-800, N-type connector, dual
male, 80cm
S3601A-10
75Ω testing cable
24-0800-51M1-51M1
S3601A-11
20402 Electronic calibration Kit
300kHz - 18GHz, N Type (female to male), 2 port
S3601A-12
20403 Electronic calibration Kit
10MHz - 26.5GHz, 3.5mm (female to male), 2 port
S3601A-13
20405 Electronic calibration Kit
10MHz - 20GHz, 3.5mm (female), 4 port
S3601A-16
Aluminum carrying case
\
S3601A-17
Front panel jumper
Supports 4-port extension and receiver through test
S3601A-18
2813A 4-port test equipment
Need option S3656A-17
S3601A-19
Cabinet
Easy to build system
www.salukitec.com
The manual applies to the vector network analyzers of the following models:
S3601A vector network analyzer (100kHz-3GHz).
S3601B vector network analyzer (100kHz-8.5GHz).
Options of the S3601 series vector network analyzer in addition to standard accessories:
S3601A options
Page 3

3
S3602B Options
Part No.
Name
Description
S3601B-02
N-type testing cable
GORE-OSZKUZKU0240, dual male, 60cm
S3601B-03
N-type testing cable
GORE-OSZKUZKV0240, female-male, 60cm
S3601B-07
Economical stable phase testing cable
Saluki-N/J.SMA/J.197C-800, N-type to 3.5mm connector,
dual male, 80cm
S3601B-08
Economical stable phase testing cable
Saluki-N/J.N/K.197C-800, N-type connector,
female-male, 80cm
S3601B-09
Economical stable phase testing cable
Saluki-N/J.N/J.197C-800, N-type connector, dual
male, 80cm
S3601B-11
20402 Electronic calibration kit
300kHz - 18GHz, N -type (female to male), 2 port
S3601B-12
20403 Electronic calibration kit
10MHz - 26.5GHz, 3.5mm (female to male), 2 port
S3601B-13
20405 Electronic calibration kit
10MHz - 20GHz, 3.5mm (female), 4 port
S3601B-16
Aluminum carrying case
\
S3601B-18
2813A 4-port test equipment
Need option S3601B-29
S3601B-19
Cabinet
Easy to build system
S3601B-21
20201 N-type calibration kit
DC - 9GHz
S3601B-22
20202 3.5mm calibration kit
DC - 9GHz
S3601B-23
32111 waveguide calibration kit
1.72GHz - 2.61GHz
S3601B-24
32112 waveguide calibration kit
2.6GHz - 3.95GHz
S3601B-25
32113 waveguide calibration kit
3.94GHz - 6.0GHz
S3601B-26
32114 waveguide calibration kit
4.64GHz - 7.05GHz
S3601B-27
32115 waveguide calibration kit
5.88GHz - 8.17GHz
S3601B-28
32116 waveguide calibration kit
7.0GHz - 10.0GHz
S3601B-29
Front panel jumper
Supports 4-port extension and receiver through test
Tel: 886.2.2175 2930 Email: [email protected]
www.salukitec.com
Page 4

Tel: 886.2.2175 2930 Email: [email protected]
4
www.salukitec.com
Preface
Thanks for choosing S3601 vector network analyzer produced by Saluki Technology Inc. Please read this user manual carefully for
your convenience.
We devote ourselves to meeting your demands, providing you high-quality measuring instrument and the best after-sales service. We
persist with “superior quality and considerate service”, and are committed to offering satisfactory products and service for our clients.
Manual No.
S3601-03-01
Version
Rev03 2019.04
Saluki Technology
Manual Authorization
The information contained in this User Manual is subject to change without notice. The power to interpret the contents of and terms
used in this Manual rests with Saluki.
Saluki Tech owns the copyright of this User Manual which should not be modified or tampered by any organization or individual, or
reproduced or transmitted for the purpose of making profit without its prior permission, otherwise Saluki will reserve the right to
investigate and affix legal liability of infringement.
Product Quality Certificate
The product meets the indicator requirements of the manual at the time of delivery. Calibration and measurement are completed by
the measuring organization with qualifications specified by the state, and relevant data are provided for reference.
Quality/Environment Management
Research, development, manufacturing and testing of the product comply with the requirements of the quality and environmental
management system.
Precautions
"Warning" indicates danger. It reminds the user to pay attention to a certain operation process, operation method or similar situations.
Noncompliance with the rules or improper operation may result in personal injuries. You must fully understand the warning and all the
conditions in it shall be met before the next step
"Attention" indicates important prompts and no danger. It reminds the user to pay attention to a certain operation process, operation
method or similar situations. Noncompliance with the rules or improper operation may result in damage to the instrument or loss of
important data. You must fully understand the caution and all the conditions in it shall be met before the next step.
Page 5

5
Contacts
Service Tel:
886. 909 602 109
Website:
www.salukitec.com
Email:
Address:
No. 367 Fuxing N Road, Taipei 105,Taiwan (R.O.C.)
Tel: 886.2.2175 2930 Email: [email protected]
www.salukitec.com
Page 6

6
Tel: 886.2.2175 2930 Email: [email protected]
www.salukitec.com
Content
1. Brief Introduction................................................................................................................................................11
2. Safety Instruction...............................................................................................................................................12
2.1. Device safety............................................................................................................................................. 12
2.2. Precautions on personal safety.............................................................................................................. 12
3. Overview............................................................................................................................................................. 14
3.1. Front Panel.................................................................................................................................................14
3.1.1. Adjust Zone........................................................................................................................................15
3.1.2. Utility Zone.........................................................................................................................................15
3.1.3. Response Zone.................................................................................................................................16
3.1.4. Trace/Chan Zone..............................................................................................................................17
3.1.5. Stimulate Zone.................................................................................................................................. 18
3.1.6. Mkr/Analysis Zone............................................................................................................................ 19
3.1.7. Entry Zone..........................................................................................................................................19
3.1.8. Soft-keys............................................................................................................................................ 21
3.1.9. USB Interface.................................................................................................................................... 21
3.1.10. Display Screen.................................................................................................................................. 22
3.1.11. 【On/Standby】Key and Indicator Light.......................................................................................22
3.1.12. Measure Ports...................................................................................................................................23
3.2. Rear Panel Tour.........................................................................................................................................23
3.2.1. 10MHz Reference Connector.........................................................................................................24
3.2.2. GP-IB Connector...............................................................................................................................24
3.2.3. VGA Output Connector....................................................................................................................24
3.2.4. LAN Connector..................................................................................................................................25
3.2.5. USB Connector................................................................................................................................. 25
3.2.6. External Trigger Input Connector................................................................................................... 25
3.2.7. External Trigger Output Connector................................................................................................26
3.2.8. Power Socket and Power Switch...................................................................................................26
3.3. Display Screen / User Interface..............................................................................................................26
3.3.1. Front Panel Interface........................................................................................................................26
3.3.2. Mouse Interface................................................................................................................................ 27
3.4. Traces, Channels and Windows.............................................................................................................28
3.4.1. Traces................................................................................................................................................. 28
Page 7

7
Tel: 886.2.2175 2930 Email: [email protected]
www.salukitec.com
3.4.2. Channels............................................................................................................................................ 28
3.4.3. Window...............................................................................................................................................29
4. Measurement Setting....................................................................................................................................... 31
4.1. Resetting Analyzer....................................................................................................................................31
4.1.1. Reset state.........................................................................................................................................31
4.1.2. User reset state.................................................................................................................................34
4.1.3. Reset Analyzer..................................................................................................................................35
4.2. Selecting Measure Parameter................................................................................................................ 35
4.2.1. S parameter.......................................................................................................................................35
4.2.2. Arbitrary ratio Measure.................................................................................................................... 36
4.2.3. Non-ratio power Measure................................................................................................................37
4.2.4. Changing Measure Type of Trace..................................................................................................38
4.3. Setting Frequency Range........................................................................................................................41
4.3.1. Setting Frequency Range............................................................................................................... 41
4.4. Setting Signal Power Level..................................................................................................................... 42
4.4.1. Setting Power Level......................................................................................................................... 42
4.4.2. Turning Port Power Off.................................................................................................................... 43
4.5. Sweep Setup..............................................................................................................................................44
4.5.1. Sweep type........................................................................................................................................ 44
4.5.2. Setting of Sweep Type.....................................................................................................................44
4.5.3. Sweep Time....................................................................................................................................... 51
4.6. Selecting Triggering Mode.......................................................................................................................53
4.6.1. Simple Trigger Settings....................................................................................................................53
4.6.2. Detailed Trigger Settings.................................................................................................................53
4.7. Selecting Data Format and Scale.......................................................................................................... 57
4.7.1. Data Format.......................................................................................................................................57
4.7.2. Setting of Data Format.....................................................................................................................59
4.7.3. Scale...................................................................................................................................................60
4.8. Observing Multi-Trace and Enabling Multichannel..............................................................................61
4.8.1. Measure Settings for Pre-Configuration....................................................................................... 61
4.8.2. Window Arrangement.......................................................................................................................63
4.8.3. Moving Traces................................................................................................................................... 64
4.9. Setting Analyzer Display.......................................................................................................................... 64
4.9.1. Status Bar.......................................................................................................................................... 64
Page 8

8
Tel: 886.2.2175 2930 Email: [email protected]
www.salukitec.com
4.9.2. Tool Bar.............................................................................................................................................. 65
4.9.3. Tables..................................................................................................................................................67
4.9.4. Measure Display............................................................................................................................... 69
4.9.5. Triggering of Data Trace and Memory Trace Display.................................................................71
4.9.6. Title Bar.............................................................................................................................................. 72
4.9.7. User Configuration Display............................................................................................................. 73
5. Calibration...........................................................................................................................................................74
5.1. Selecting Calibration Type.......................................................................................................................74
5.1.1. Open Response................................................................................................................................ 74
5.1.2. Short Response................................................................................................................................ 74
5.1.3. Through Response...........................................................................................................................74
5.1.4. Through Response and Isolation...................................................................................................74
5.1.5. Enhanced Response Calibration................................................................................................... 75
5.1.6. 1- Port (Reflection)........................................................................................................................... 75
5.1.7. Quick SOLT........................................................................................................................................75
5.1.8. Full Dual-port SOLT..........................................................................................................................76
5.1.9. Full Dual-port TRL............................................................................................................................ 76
5.2. Calibration Setup.......................................................................................................................................77
5.2.1. Starting Calibration...........................................................................................................................77
5.2.2. Calibration User Configuration....................................................................................................... 80
6. Data Analysis..................................................................................................................................................... 81
6.1. Marker......................................................................................................................................................... 81
6.1.2. Moving the marker............................................................................................................................83
6.1.3. Marker Search...................................................................................................................................84
6.1.4. Marker Function................................................................................................................................ 86
6.1.5. Advanced Marker Option Setting...................................................................................................87
6.1.6. Marker Table......................................................................................................................................89
6.2. Trace Math and Statistics........................................................................................................................ 90
6.2.1. Trace Math......................................................................................................................................... 90
6.2.2. Trace Statistics..................................................................................................................................92
6.3. Limit Test.....................................................................................................................................................93
6.3.1. Creating and Editing Limit Line...................................................................................................... 93
6.3.2. Setting Limit Test...............................................................................................................................95
6.4. Bandwidth Test.......................................................................................................................................... 97
Page 9

9
Tel: 886.2.2175 2930 Email: [email protected]
www.salukitec.com
6.4.1. Open and set bandwidth test..........................................................................................................97
6.4.2. Display bandwidth test result..........................................................................................................98
6.4.3. Close bandwidth test........................................................................................................................98
6.5. Bandwidth Searching................................................................................................................................99
6.5.1. Open and close bandwidth searching...........................................................................................99
6.5.2. Display bandwidth searching result...............................................................................................99
6.5.3. Filter test.......................................................................................................................................... 100
6.6. Ripple Test................................................................................................................................................101
6.6.1. Create and edit ripple limit line.....................................................................................................102
6.6.2. Set ripple test.................................................................................................................................. 103
6.6.3. Display ripple test result................................................................................................................ 104
6.7. Fixture Simulator.....................................................................................................................................105
6.7.1. Reference impedance conversion of port.................................................................................. 105
6.7.2. Network De-embedding.................................................................................................................106
6.7.3. Matching circuit embedding..........................................................................................................107
6.8. Parameter Transformation.....................................................................................................................110
6.8.1. Parameter transformation..............................................................................................................110
6.8.2. Function type of parameter transformation................................................................................ 110
6.9. Setting Time Domain Transformation Measure..................................................................................111
6.9.1. By mouse or touch screen.............................................................................................................111
6.9.2. By front panel keys—Time Domain Transform Dialog Box..................................................... 112
7. Data Output......................................................................................................................................................114
7.1. Saving and Calling back Files...............................................................................................................114
7.1.1. Saving File....................................................................................................................................... 114
7.1.2. Calling back file............................................................................................................................... 115
7.1.3. Data File........................................................................................................................................... 116
7.2. Printing Measure Display....................................................................................................................... 119
7.2.1. Setting Print Content...................................................................................................................... 119
7.2.2. Printing Measure Display.............................................................................................................. 121
7.2.3. Printing to File................................................................................................................................. 121
8. Time Domain Measure...................................................................................................................................123
8.1. Principle for Time Domain Measure.................................................................................................... 123
8.2. Resolution and Range of Time Domain Measure............................................................................. 124
8.2.1. Response Resolution.....................................................................................................................124
Page 10

10
Tel: 886.2.2175 2930 Email: [email protected]
www.salukitec.com
8.2.2. Display Resolution..........................................................................................................................125
8.2.3. Measure Range.............................................................................................................................. 126
8.3. Window Filtering......................................................................................................................................127
8.3.1. Advantages of Window Filtering.................................................................................................. 127
8.3.2. Setting Window Value Correctly...................................................................................................128
8.4. Time Domain Gate Filtering.................................................................................................................. 129
8.4.1. How to Use Gate Function............................................................................................................129
8.4.2. Gate Settings...................................................................................................................................129
8.4.3. Gate Form........................................................................................................................................130
8.5. Time Domain Measure Data................................................................................................................. 131
8.5.1. Screening.........................................................................................................................................131
8.5.2. Reflection Measure in Band Pass Mode....................................................................................132
8.5.3. Transmission Measure in Band Pass Mode.............................................................................. 133
8.5.4. Fault Location by the Use of Low Pass Mode...........................................................................134
8.5.5. Reflection Measure in Low Pass Mode...................................................................................... 134
8.5.6. Transmission Measure in Low Pass Mode................................................................................ 135
8.6. Band Pass and Low Pass Time Domain Modes............................................................................... 135
8.6.1. Modes Comparison........................................................................................................................ 135
8.6.2. Mode Selection............................................................................................................................... 136
8.6.3. Frequency Span and Number of Points.....................................................................................136
8.6.4. Impulse Response and Step Response.....................................................................................136
8.6.5. Useful Data Format........................................................................................................................ 137
8.7. Setting Time Domain Transformation Measure (Optional).............................................................. 137
8.7.2. By front panel keys—Time Domain Transform Dialog Box.....................................................139
Page 11

11
Tel: 886.2.2175 2930 Email: [email protected]
www.salukitec.com
1. Brief Introduction
S3601 Series Vector Network Analyzer is the new generation of economic products promoted upon the experience in research and
manufacture of vector network Analyzer for years. In terms of hardware, it adopts new technologies, which has greatly improved the
key performance indicators of complete machine; in terms of software, it adopts embedded computers with Pentium chips and
Windows operating system, which has greatly improved the connectivity and usability of complete machine.
S3601 Series Vector Network Analyzer has powerful functions such as time domain and frequency domain, and provide multiple
display in formats such as logarithm magnitude, linear magnitude, standing-wave ratio (SWR), phase, group delay, Smith circle
diagram Smith chart and polar coordinates as well as multiple calibrations including the calibration of response, single port, response
isolation and enhanced response, the calibration of full double ports and the electric calibration. The color LCD display in multiple
windows and channels and a number of interfaces such as USB interface, LAN network port, GP-IB interface and VGA interface are
also provided.
The S3601 Series Vector Network Analyzer can measure quickly and accurately the characteristics of the tested part DUT in respect
of magnitude, phase and group delay of S parameters. They have a high-efficiency and powerful error correction capability and are
extensively applied in military industry and civil fields such as element, unit component, radar, aerospace, electronic interference &
countermeasure, telecommunication, radio and TV.
Key Features
64 independent Measure channels
32 display windows, max. 8 traces are displayed in each.
Time domain analysis
Interfaces such as LAN, USB, GP-IB and VGA
Multiple display formats such as magnitude, phase, group delay, Smith chart, polar coordinates and standing-wave ratios
Windows XP/ 7 Operation System
10.4 true-color and high-resolution LCD providing simultaneous display in multiple windows and channels
Page 12

12
Tel: 886.2.2175 2930 Email: [email protected]
www.salukitec.com
2. Safety Instruction
Please read safety instruction carefully and Strictly follow!
We will spare no efforts to ensure that production process comply with latest safety standards so as to safeguard the safety of our
users. The design and tests of our products and accessory equipment comply with relevant safety standards. We have established
quality assurance system so that we can better supervise product quality and ensure that all products accord with standards in the
system. To maintain the sound state of equipment and ensure safe operation, please comply with the following instruction. Contact us
if you have any questions.
It is also your responsibility to use this product in correct manner. Suitable for industrial, laboratory and field uses, this equipment,
however, must be used in correct manner so as to prevent personal injuries and property damages. For problems caused by misuses,
liabilities rest on users. By proper use, it means that users should use this product according to prescriptions in the product document
and in the required conditions. As sufficient expertise is required, only professional technicians and people that have been strictly
trained and have mastered necessary skills are qualified to use this product. Please keep safety manual and product document in a
proper manner, and deliver them to the end user. To forestall personal injuries and property loss, please abide by these safety
instructions. Prior to using this product, please read carefully and comply with these instructions accordingly.
Device safety
2.1.
a) Use designated packing container in shipping and avoid falling or violent collisions in moving, which may cause damages to the
device.
b) Use AC-DC adapter shipped with the device to supply power to the product. Using other power adapters may case damages to
internal hardware.
c) Use 220V three-wire regulated voltage AC power supply to prevent high-power spike pulse interference from damaging internal
hardware.
d) Ensure that power supply is well connected to the ground to prevent damages to the device caused by poor connection or false
connection.
e) Take such anti-static measures as wearing anti-static wrist strap when operating this device so as to prevent static from
damaging the device.
f) Injection of DC signal into input end is prohibited. Signal power needs to be lower than 0.5W. If not, damage to the device may
occur.
g) If device uses external or internal batteries, replace these batteries with the same or equivalent type of batteries. When using
other types of batteries, blast may occur.
h) Both insertions of objects into the gap of the device housing and dumping of liquids over device housing or into device are
prohibited, which may cause short circuit, electric shock, fire or personal injuries.
i) Notches or gaps in the device, designed to help internal ventilation and whereby prevent overheat, must not be covered.
The device must not be put on couch, wrapped with carpet, or placed in airtight housing unless ventilation is good
j) This device must not be placed on radiator, dish heater and other heating devices. Ambient temperature must not surpass the
maximal temperature prescribed in this manual
k) Attention: Once this device is on fire, it may release toxic gases or liquids.
Precautions on personal safety.
2.2.
a) When moving the device, use proper tools and move the device softly so as to avoid personal injuries caused by the falling of
Page 13

13
Tel: 886.2.2175 2930 Email: [email protected]
www.salukitec.com
the device.
b) Device should be proper grounded so as to prevent personal injuries caused by poor or false grounding
c) When cleaning the device, please unplug the device to avoid electric shock. Use dry or moist soft cloth to clean the device. Do
not clean the internal of the device.
d) Before using this device, personnel need to be trained. When using the device, concentration is required. Operation by
unqualified people may cause personal injuries and property losses.
e) Use of this device when power line is broken is prohibited. Regular check on power line is necessary. Proper measures
should be taken to keep power line in good state and prevent stumble and electric shock.
f) Field use of the device when there is lightning is prohibited, which may cause personal injuries and property loss.
Page 14

14
Tel: 886.2.2175 2930 Email: [email protected]
1 Adjust Key Zone
2 Utility Key Zone
3
Response Key Zone
4 Trace/Chan Key Zone
5 Stimulus Key Zone
6
Marker/Analysis Key Zone
7 Entry Key Zone
8 Soft Key Zone
9
USB Interface
10 Screen
11 【on/Standby】Key and Indicator Light
12
Measure Ports
www.salukitec.com
3. Overview
This chapter will help the user get to know S3301 quickly. This chapter includes introductions of:
Front Panel
Rear Panel
Interface
Screen Area
Trace, Window and Channel
In this guide, the physical keys on the front panel are indicted as 【XXX】and XXX is the name of the keys. The menus and keys on
the screen (software UI) are displayed as [XXX] and XXX is the names of menus and keys.
3.1.Front Panel
The front panel of S3601 Series vector network analyzer is shown in the following figure, including a number of key functional zones,
display zones, USB interfaces and Measure ports. The section will describe the function and performance index of each part in
details.
Fig.3-1 Front Panel of the Analyzer
Page 15

15
3.1.1. Adjust Zone
It covers the navigation keys and Adjust knobs.
Tel: 886.2.2175 2930 Email: [email protected]
www.salukitec.com
Fig.3-2 Adjust Keys
Adjust Knobs
Turn the knob to adjust the setting value in the currently Stimulus input box.
【←Tab】 and 【→Tab】
Move the option menu towards left or right in operation interface of vector network procedure.
Switch stimulated options dialog box of operation interface of vector network procedure.
When operation interface of vector network procedure is not in action or shutdown, and any user operation interface other
than vector network procedure or the user interface of Help in vector network is entered, it is operatable by moving mouse
arrow towards both left and right. (Default position of mouse arrow is bottom right corner of the screen)
【↑】 and 【↓】
Move choice menu items in the menu upwards and downwards.
It plays the following roles in dialog box:
Change numeral value.
Select items in dropdown list.
Select the desired option in a group of option buttons.
When operation interface of vector network procedure is not in action or shutdown, and any user operation interface other
than vector network procedure or the user interface of Help in vector network is entered, it is operatable by moving mouse
arrow towards both left and right. (Default position of mouse arrow is bottom right corner of the screen)
【Click】
It has the same function with mouse click.
3.1.2. Utility Zone
For operation of instrument system.
Page 16

16
Fig.3-3 Utility Keys
Tel: 886.2.2175 2930 Email: [email protected]
www.salukitec.com
【
Save
】
It’s used for saving instrument status, calibration data or Measure data in specified files.
【System】
It’s used for some system-related configuration and selection of software language, etc.
【Preset】
It’s used to reset Analyzer to default (predefined) status.
【
Recall
】
It’s used for invoking files containing Analyzer status, calibration data and Measure data.
【Print】
It’s used to start printing function, select print settings and printer for printing.
【Micro/Local】
When Analyzer is in external control state, press this key to make the Analyzer re-respond to the buttons on front panel.
When Analyzer is in normal working state, press this key to access a set of user-defined macros associated with
executable files.
Analyzer can name and store 10 macros at most.
【F 1】
It is used to record shortcut keys in operating a certain Measure (the record can be effective only by operating with front-panel
keys).
【F 2】
It is used to record shortcut keys in operating a certain Measure (the record can be effective only by operating with front-panel
keys).
【Help】
It is used to open the user manual of the analyzer (a built-in file).
3.1.3. Response Zone
Page 17

17
It’s used for various operation of Measure data Trace.
Tel: 886.2.2175 2930 Email: [email protected]
www.salukitec.com
Fig.3-4 Response Keys
【
Meas
】
It is used to select the type of S parameter to be measured and the type of any specific-value or non-specific value power
Measure.
【
Format
】
It is used to select the format in which the Measure data are displayed on the analyzer.
【Scale】
It is used to set the scale at which the Measure trace is displayed on the analyzer.
【Display】
It is used to create a new window, select or Stimulus the current window, or make display settings.
【
】
Avg
With the key【Avg】, the noise can be reduced by use of the Measure averaging function. The analyzer reduces the effect of
random noise on the Measure result by executing complex exponential average of a number of sweeps for designated times
when the average factor is designated.
【Cal】
The Measure calibration can be started to make operations such as power calibration.
3.1.4. Trace/Chan Zone
Managing Trace and Channel on display of Analyzer.
Page 18

18
Fig. 3-5 Trace/Channel Keys
Tel: 886.2.2175 2930 Email: [email protected]
www.salukitec.com
【
Trace Prev
】
It is used to Stimulus previous trace curve.
【Channel Prev】
It is used to Stimulus previous channel curve.
【Trace Next】
It is used to Stimulus the next trace curve.
【
Channel Next
】
It is used to Stimulus the next channel curve.
【Trace】
The corresponding trace soft-key menu will be displayed. Press the corresponding soft-keys to make creation, deletion or
selection of the Stimulus traces.
【Channel】
Display the corresponding channel soft-key menu and make channel management with corresponding soft-keys.
3.1.5.
Stimulate Zone
Determining the range, sweep type or trigger mode of the measured data.
Page 19

19
Fig. 3-6 Stimulus Keys
【Start】
It is used to set the range of starting frequency value and the frequency offset.
【Stop】
It is used to set the stop frequency value.
Tel: 886.2.2175 2930 Email: [email protected]
www.salukitec.com
【
Center
】
It is used to set the center frequency value.
【Span】
It is used to set the frequency range.
【Sweep】
It is used to select the manner of signal source sweep and relevant properties.
【
Trigger
】
It is used to set how to start an initialized sweep Measure.
3.1.6.
Mkr/Analysis Zone
Controlling all aspects of data analysis, including marker and mathematical calculation.
Fig. 3-7 Marker/Analysis Keys
【
Marker
】
It is used to Stimulus the marker and set the stimulus value of the marker. The marker can provide digital reading of the
Measure result. The analyzer can support at most 9 markers and the reference marker R.
【
Search
】
It provides the marker search function. Press this key to Stimulus a marker if there are no markers displayed.
【Memory】
It is used to set the mathematical operation and saving of Measure data by the analyzer.
【Analysis】
It includes the functions such as limit test, trace statistic, conversion of gates, windows and time domains.
3.1.7. Entry Zone
Page 20

20
These keys are used to enter Measure settings.
Tel: 886.2.2175 2930 Email: [email protected]
www.salukitec.com
Fig. 3-8 Entry Keys
【OK】
It is used to confirm the setting and entry value in the dialog box and close the dialog box. It is equivalent to the “OK” button in
the dialog box.
【Esc】
It is used to ignore the setting and entry in the dialog box and close the dialog box. It is equivalent to the “cancel” button in the
dialog box.
【Menu】
Press the key【Menu】to browse the menu with the navigation key. Press this key and then press the utility key on the front
panel to quickly open the dialog box for utility setting. For example, press the key 【Menu】and then press the key 【Search】
to open the dialog box for search setting.
【←】
The marker will backspace to delete the previous entry by pressing this key, after the value is entered.
Numeric Key
The numbers 0 – 9 are included. It is used to enter the value in Measure setting and complete entry by pressing the
corresponding unit key.
Unit Key
It is used to end the value entry and allocate a unit to the entry value. The corresponding units to keys are as below:
【
G/n】G/n (109/10-9)
【M/μ】 M/μ (106/10-6)
【k/m】 k/m (103/10-3)
【 /En off】Basic unit: dB, dBm, degree, second, Hz or dB/GHz. It can be also used to enter the value without a unit. It
Page 21

21
has the function equivalent to Enter key.
Tel: 886.2.2175 2930 Email: [email protected]
www.salukitec.com
After entering the value, you need to press the unit key to finish the setting. When entering the value without units, press
to finish the entry. When using the external connected keypad, press the character key correspondent to the unit to finish the setting.
【•】
It is used to enter the decimal point when entering a decimal value.
【
Before inputting a value, press this key to Stimulus entry of a positive or negative value.
3.1.8.
They work with the keys in other utility areas on the front panel and can easily carry out all instrument operations without a mouse.
An additional key can be used as a user key.
Soft key menu associated with a key can be called up by pressing this key on front panel.
】
+/-
Soft-keys
【
/En off
】
Fig. 3-9 Soft-keys
3.1.9.
USB interface can be used to connect keyboard, mouse or other USB devices, a total of 2 USB interfaces meeting USB2.0
specifications are provided on front panel, the interface jack is A-type configuration (embedded 4 contacts: contact 1 on the left);
each interface has the following features:
Contact 1: Vcc: 4.75V~5.25V, maximum output current: 500mA.
Contact 2: data -.
Contact 3: data +.
Contact 4: ground.
USB Interface
Page 22

22
Fig. 3-10 USB Interfaces
3.1.10. Display Screen
Screen display of Analyzer is shown in the following figure.
Tel: 886.2.2175 2930 Email: [email protected]
www.salukitec.com
Fig. 3-11 Display Screen of the Analyzer
TFT LCD is adopted for the display screen of Analyzer, with technical specifications as follows:
TFT, 10.4 inches, LCD
Resolution: 800×600.
Vertical refresh rate: 60.31Hz.
Horizontal refresh rate: 37.88 kHz.
Brightness: >350NIT.
3.1.11. 【On/Standby】Key and Indicator Light
【On/Standby】switch the analyzer between On and Standbys condition.
For the On condition, the indicator light is green.
For the Standbys condition, the indicator light is orange.
When the analyzer is On, press 【On/Standby】, the analyzer will quit the application program, switch off the power and enter
Standbys condition automatically.
When the analyzer is Standby, press 【On/Standby】, the analyzer will automatically run
Windows XP Operation System and load the Measure application program of the analyzer.
Page 23

23
Tel: 886.2.2175 2930 Email: [email protected]
www.salukitec.com
The key 【On/Standby】 is only a standby switch that is not connected directly to the external power supply and can not cut off
connection of the analyzer with the external power supply. The external power supply to the analyzer can be disconnected with
the power switch on the rear panel. Removing the power cord can completely cut off connection of the analyzer with the
external power supply.
Fig. 3-12 【On/Standby】Key and Indicator Light
3.1.12.
Measure Ports
Fig. 3-13 Measure Ports of the Analyzer
Measure ports of Analyzer are two type-N female ports, which can be switched between RF source and receiver to measure the
measured piece in two directions; yellow lamp is used to indicate current source output port.
The input damage level: RF power: +26dBm, DC voltage: ±30V.
The damage level limit of the analyzer is +26dBm RF power or±30V DC voltage. The input exceeding the above range may burn
the instrument.
3.2.Rear Panel Tour
The rear panel of Analyzer is shown as the following figure:
Fig. 3-14 Analyzer Rear Panel
Page 24

24
Tel: 886.2.2175 2930 Email: [email protected]
www.salukitec.com
3.2.1. 10MHz Reference Connector
Fig. 3-15 10MHz Reference Connector
10MHz reference input connector
10MHz reference input BNC female connector is used for input of external reference signals. If a 10 MHz external reference signal is
detected at this port, it will be used as the instrument frequency references instead of the internal frequency reference. The
requirements of the analyzer to the 10MHz input reference signals are as follows:
Input frequency: 10MHz±10ppm.
Input level: -15dBm~+20dBm.
Input impedance: 200Ω.
10MHz reference output connector
10 MHz reference output BNC female connector provides reference signals with the following properties:
Output frequency: 10MHz ±10ppm.
Signal type: sine wave.
Output level: 10dBm±4dB.
Output impedance: 50Ω.
3.2.2. GP-IB Connector
GP-IB connector is a 24-pin D female connector for sending and receiving GP-IB/SCPI command, complying with IEEE-488
standard.
Fig. 3-16 GP-IB Connector
3.2.3. VGA Output Connector
This is a 15-pin D female connector connecting VGA display with the corresponding resolution externally, therefore, we can use
internal and external displays to observe Measure at the same time, and wherein, the default resolution of external monitor is
800×600, which is the same as the resolution of LCD screen of Analyzer.
Fig. 3-17 VGA Output Connector
In the Windows table, click the right button of the mouse and with the right click menu, the multi-monitor mode can be configured.
Page 25

25
Tel: 886.2.2175 2930 Email: [email protected]
www.salukitec.com
Fig. 3-18 Configuration of Multi-Display Mode
When [Monitor] is checked, only the external VGA monitor can be used to observe the display and there is no display on the
internal LCD.
When [Computer] is checked, only the internal LCD can be used to observe the display and there is no display on the external
VGA.
When [Monitor+Computer] is checked, the external VGA monitor and the internal LCD can be used at the same time.
3.2.4.
LAN Connector
This is a 10/100 BaseT Ethernet connector with standard 8-pin structure, which can automatically select one from the two data rates.
Fig. 3-19 LAN Connector
3.2.5.
USB Connector
The plughole of the connector is Type A configuration (embedding 4 contacts: Contact 1 is on the left), providing two interfaces
complying with USB 2.0 specification, and the property of every interface is as below:
Contact 1: Vcc, 4.75V~5.25V, 500mA (maximum output current).
Contact 2: Data-.
Contact 3: Data+.
Contact 4: Ground.
This connector can connect USB mouse, keyboard and other USB interface devices.
Fig. 3-20 USB Connector
3.2.6. External Trigger Input Connector
The Trig In port is used for external trigger signal input..
Page 26

26
Fig. 3-21 External Trigger Input Connector
3.2.7. External Trigger Output Connector
After the system is all set, the vector network can output trigger signals.
Fig. 3-22 External Trigger Output Connector
Tel: 886.2.2175 2930 Email: [email protected]
www.salukitec.com
3.2.8.
Power Socket and Power Switch
Fig. 3-23 Power Socket and Power Switch
3.2.8.1. Power socket
The power socket is used to connect power cords and the three-core power cord with ground wire (provided along with instrument) is
recommended.
3.2.8.2.
Power switch
During the normal working process of Analyzer, the power switch shall be kept in “ON” position, and please do not turn off the
instrument by the power switch or unplug the power cord, which may cause faults on software or hardware of Analyzer.
Display Screen / User Interface
3.3.
The Analyzer interface refers to the method of setting and operating Analyzer by users, including front panel interface and
mouse-driven user interface:
3.3.1.
Users can use front panel key to set and operate Analyzer by 2 ways.
Using soft-key toolbar
Front Panel Interface
Page 27

27
Tel: 886.2.2175 2930 Email: [email protected]
www.salukitec.com
This method can make a setting of Analyzer quickly in 4 steps:
a) Press the corresponding utility keys of the front panel to Stimulus the soft-key toolbar of the item.
b) Observe the function options of active project toolbar.
c) Select required function based on the corresponding soft-key.
d) Enter values (if necessary).
Use a Drop-down List
This method can use all functions of Analyzer, but the operation is relatively complicated and trivial, and the specific steps are as
below:
a) Press 【Menu】 key to switch to the Menu/Dialog mode.
b) Press the【Tab】keys and【↑】,【↓】keys to browse the menu; press the【Click】key to make a selection.
c) Browse and set the dialog box through the【Tab】key (if the dialog box is open).
d) Entry values (if necessary).
e) Press the 【OK】in the ENTRY area to close the dialog box (if the dialog box is opened).
3.3.2. Mouse Interface
The following operations can be done by using mouse:
a) Click on the menu bar to display the drop-down list.
b) Click the existing item soft-key toolbar to select the function.
c) Click the Measure toolbar to add Measure tracks.
d) Click the Control toolbar to control the sweep.
e) Click the Stimulus toolbar to set the Sweep excitation.
f) Click the Marker toolbar to set the marker.
g) Right click on the screen to display the right click menu.
Page 28

28
Tel: 886.2.2175 2930 Email: [email protected]
www.salukitec.com
Fig. 3-24 Analyzer User Interface
3.4.Traces, Channels and Windows
3.4.1. Traces
Trace is a series of measured data points and its setting will influence arithmetical operation and display of measured data, and only
when Trace is in the Stimulus state, it can change its setting. Single click the corresponding Trace state button to activate the Trace,
and the detailed setting method is shown in “Changing Stimulus State of Trace” Part of “Selecting Measure Parameter” in Section 2
of Chapter V, and the setting for Trace includes:
Parameters
Format
Scale
Calibration ON / OFF
Trace Math
Marker
Electrical Delay
Phase Bias
Smoothing
Time Domain Transformation
3.4.2. Channels
Channels contain traces. The analyzer supports up to 64 independent channels. Channel settings determine how the trace data is
Page 29

29
Tel: 886.2.2175 2930 Email: [email protected]
www.salukitec.com
measured. All traces that are assigned to a channel share the same channel settings. A channel must be selected (active) to modify
its settings. When the traces in a channel are active, the channel is also active. The following are channel settings:
Frequency span
Power
Calibration data
IF bandwidth
Number of Points
Sweep Setup
Average
Trigger (some settings)
3.4.3.
Window
Window is used to observe Measure traces. The analyzer supports up to 32 windows, with each window displaying up to eight traces.
Window and channel are completely independent. Through the [Response] menu, window display can be set.
Creating a new window
By mouse or touch screen
Click [Response] and in the drop-down list, click [Display]; select [New Window] in the [Windows], and the analyzer will create a
window, which is defaults for no traces.
Fig. 3-25 Creating a New Window
By front panel keys
a) Press 【Display】 key in the RESPONSE area.
b) In the soft-key menu displayed on the right screen, press [Windows] corresponding soft-key to display the lower
soft-key menu.
c) Press [New Window] corresponding soft-key, and the analyzer will create a new window, which are defaults for no
traces.
Viewing a Window with the Full Screen View
When there are too many windows on the screen, the windows will be too small and the traces will not be clear; then the full screen
Page 30

30
can be used to display a particular window for better viewing of the traces.
By mouse or touch screen
When you operate with the mouse, there are 3 following ways:
1) When the title bar is open, click the [Max] button on the bar.
2) When the title bar is closed, click the window you want to view with the full screen so that the corresponding window
is set as the current active window, click [Response], in the Response menu, click [Display], and in the lower menu,
select [Max] in the [Windows].
3) Point the mouse to the window you want to view with the full screen and press the right button of the mouse. Click
[Max] in the right button menu.
By front panel keys
1) Press the【Display】key in the RESPONSE menu. Press [Windows] corresponding soft key on the right side of the
screen to display the lower menu; press [More] corresponding soft-key.
2) Press [Select Window] corresponding soft-key, select the window to be Stimulus in the dialog box of Active Window
by【↑】, 【↓】 keys and press [Max] corresponding soft-key.
Tel: 886.2.2175 2930 Email: [email protected]
www.salukitec.com
Page 31

31
Tel: 886.2.2175 2930 Email: [email protected]
www.salukitec.com
4. Measurement Setting
This chapter will introduce how to make the measurement settings. Normally, following setting operations should be done during a
test. This chapter will introduce these operations in sequence.
Resetting Analyzer
Selecting Measure parameter
Setting frequency range
Setting signal power level
Sweep Setup
Selecting triggering mode
Setting data format and scale
Observing multi-Trace and enabling multichannel
Setting Analyzer display
Configure 4-port Measure
4.1.Resetting Analyzer
4.1.1. Reset state
When [Preset] key is pressed, the Analyzer will be returned to a default state which is known as reset state, and the reset state for
S3601 Series Vector Network Analyzer is set as follows:
Measure parameter: S11
Frequency setting:
Start frequency: 100kHz
Stop frequency: 3GHz/8.5GHz
CW Time: 2GHz
Power setting:
Measuring port power: 0dBm
Coupled port power: on Attenuation :
automatic attenuation Attenuation
value : 0dB
Sweep Setup:
Sweep type: linear frequency
Sweep time: automatic
Sweep spot number: 201
Segment Sweep Setup:
Number of started segment: 1
Start frequency: 100kHz
Page 32
32
Stop frequency: 8.5GHz
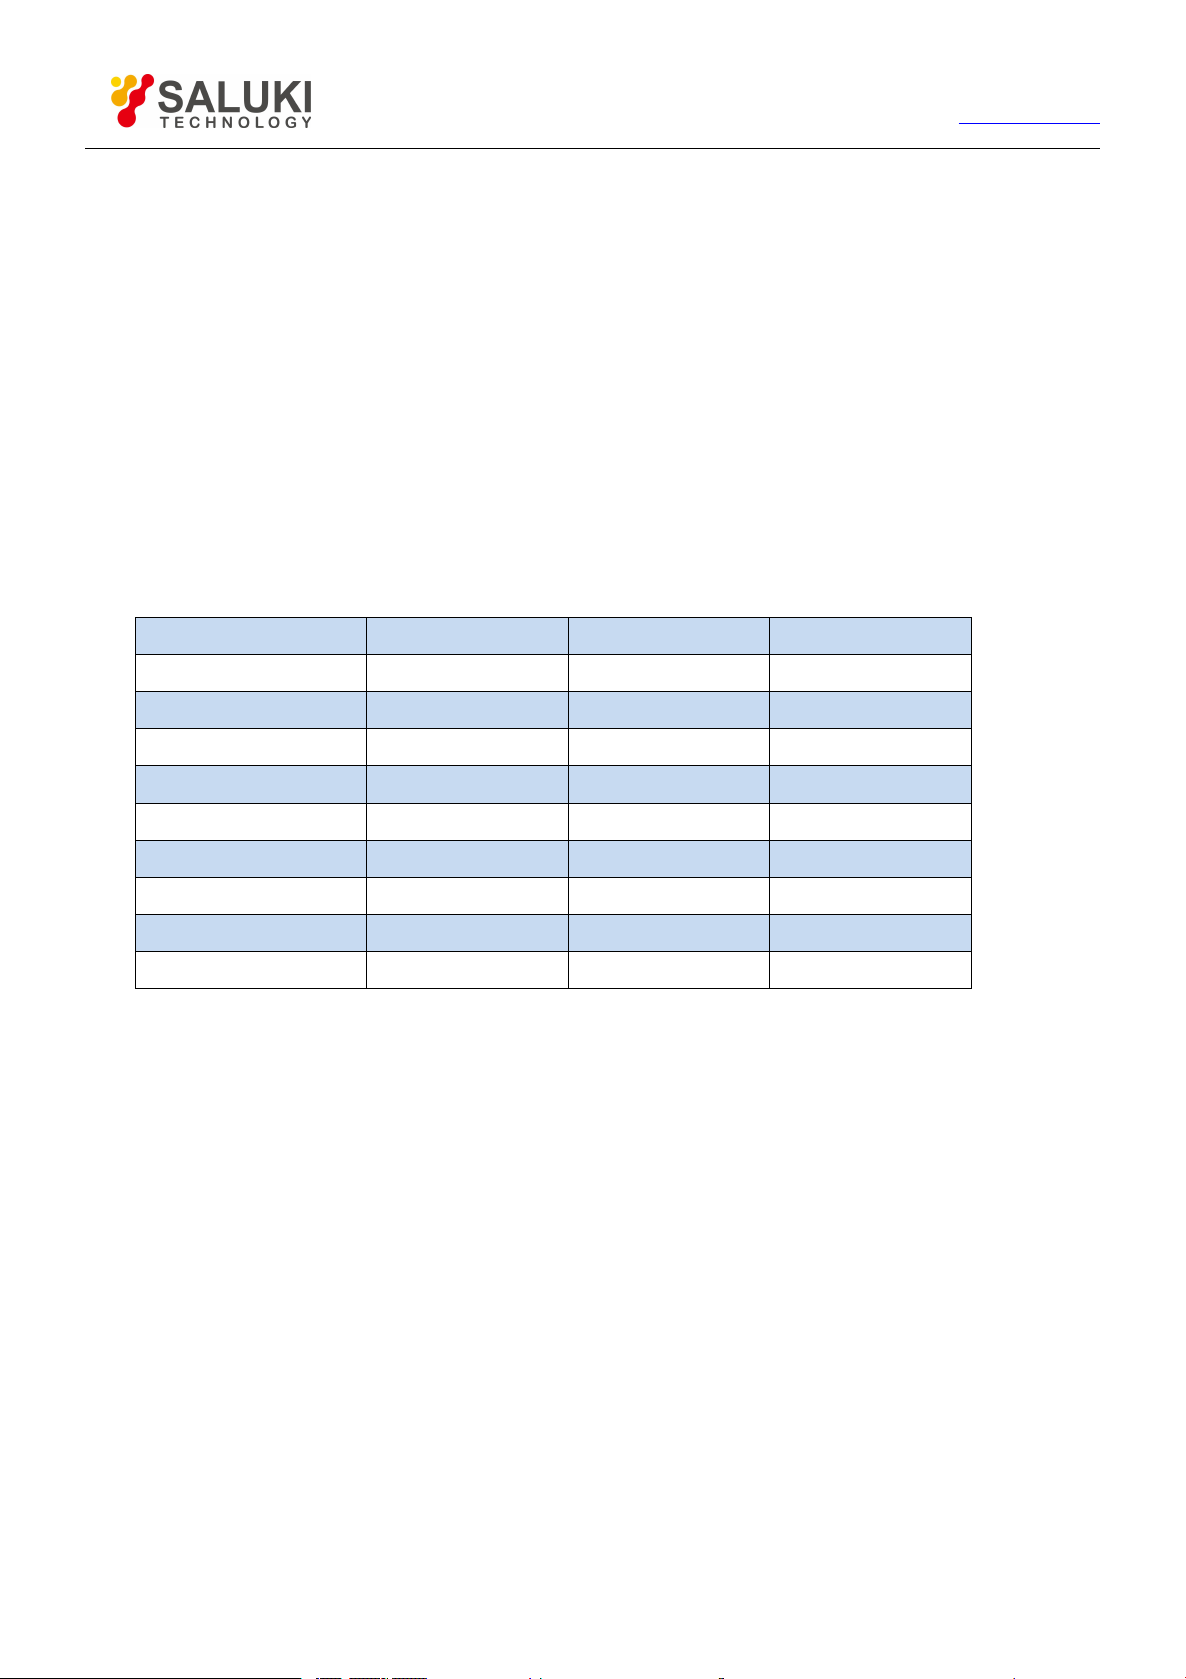
Format
Scale
Reference Position
Reference Value
Log-magnitude
10dB50dB
Phase
45o50o
Group Delay
10ns510fs
Linear Magnitude
100mU
5
500mU
Standing Wave Ratio
1U56U
Real Part
2U50U
Imaginary Part
2U50U
Polar Coordinate
1U
None
1U
Smith Chart
1U
None
1U
Points: 21
Power: 0dBm
IFBW: 30kHz
Trigger setting:
Trigger source: internal
Trigger mode: continuous
Display format:
Format: log-magnitude
When different formats are chosen, the corresponding setting in detail is as follows:
Table 4-1 Default Setting of Different Display Formats
Tel: 886.2.2175 2930 Email: [email protected]
www.salukitec.com
Response setting
Number of channel: 1
Intermediate frequency bandwidth: 30kHz
Avg: off
Avg factor: 1
Smoothing: off
Smoothing factor: 2.49% of value range
Electrical delay: 0s
Velocity factor: 1
Phase offset: 0
o
Display Trace: data Trace
Calibration setting
Correction: off
Insertion: on
Page 33

33
Calibration type: none
impedance: 50Ω.
Port extension: off
Port extension value: 0s
Marker setting
Original frequency: 1.50005GHz(S3601A) / 4.25005GHz (S3601B)
Reference marker R: off
Discrete marker: off
Format: Trace format
Type: standard
Marker search type: minimum
Search domain: full span
Tel: 886.2.2175 2930 Email: [email protected]
www.salukitec.com
Marker table: blank
Marker coupling: off
Displaying all Trace markers: on
Limit test setting:
Limit test: off
Limit line display: off
Failure sound warning: off
Limit table setting
Type: OFF
Start activation: 100kHz
Stop activation: 8.5GHz
Start response: -100dB
Stop response: 100dB
Time domain transformation setting
Time domain transformation: off
Transformation mode: band-pass
Transformation start: -10ns
Transformation stop: 10ns
Gaesarian window β factor: 6.0
Time domain gate: off
Gate start: -10ns
Gate stop: 10ns
Gate shape: standard
Page 34
34
Tel: 886.2.2175 2930 Email: [email protected]
www.salukitec.com
Gate type: band-pass
Global display setting
Status bar of Trace: on
Frequency/activation: on
Marker reading: on
4.1.2. User reset state
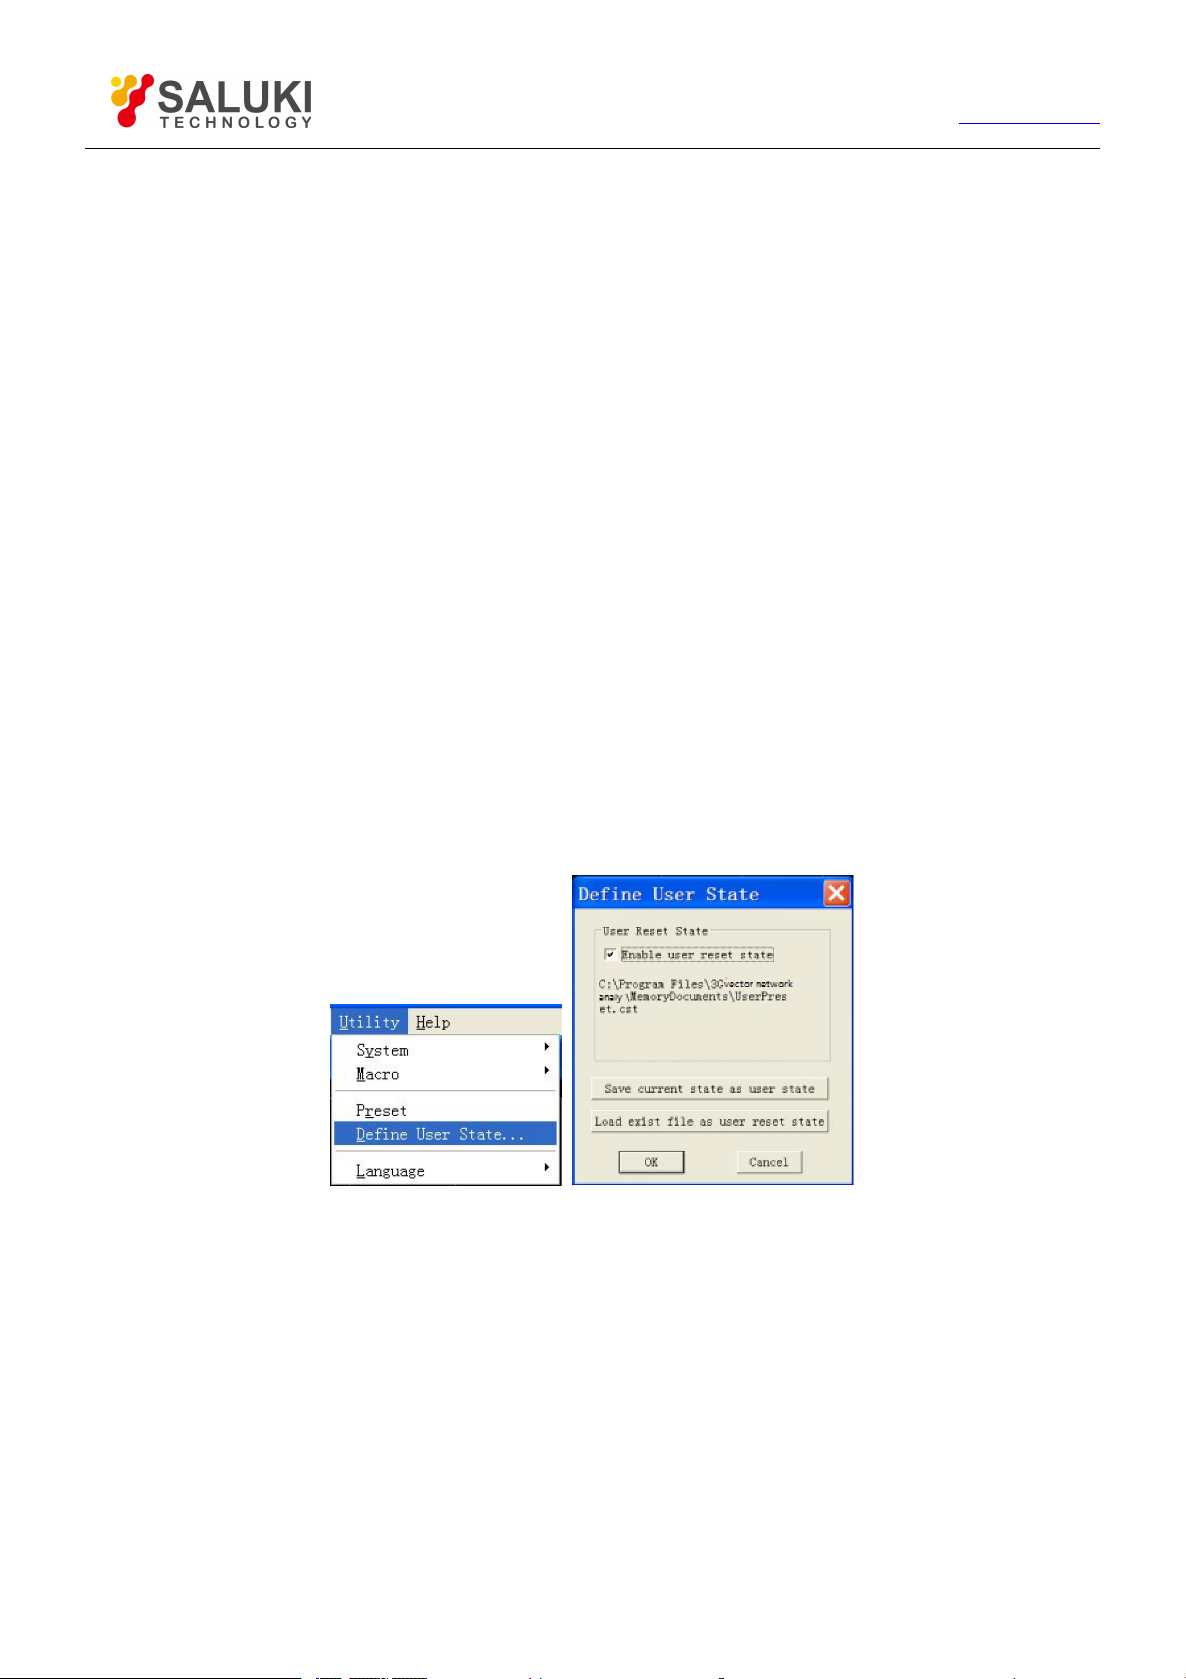
The Analyzer can be reset to a known default state or a state defined by user. Under the default condition, the Analyzer is reset to the
default state defined before leaving factory and it can be reset to the state specified by user via setting.
4.1.2.1.
Setting user reset state
1) By mouse or touch screen
2) Single click [Utility] and then single click [Define User State..] in the system menu to display the dialog box of defining user
reset state.
3) Single click [save current state as user state] button, the Analyzer will save the current instrument setting as user reset
state.
4) If you want to use the existing state, single click [load exist file as user reset state] button, select state file from the opened
dialog box to enable it, and the selected file is used as state file for user reset by Analyzer.
5) Click [Enable user reset state] to mark check box.
6) Single click [OK] button to close the dialog box.
Fig.4-1 Define User Reset State
By front panel keys
1) Press 【Menu】 key in ENTRY area.
2) Press 【Tab】 key in ADJUST area to switch to the [Define User State] menu item under the system menu and press
【
Click】key in Adjust area to display the dialog box of Define User Reset State.
3) If you want to amintain the current setting of Analyzer at user reset state, press【Tab】to switch to [Save Current State
as User Preset] button and then press【Click】.
4) If you want to use the existing state, press【Tab】to switch to [Load Existed File as User reset State] button and then
press 【Click】, and select state file from the opened dialog box to enable it and the selected file is used as state file for
reset.
Page 35
35
Tel: 886.2.2175 2930 Email: [email protected]
5) Press 【Tab】in ADJUST area to switch to [Enable User Reset State] and press 【Click】to mark check box.
6) Press 【OK】in ENTRY area to close dialog box.
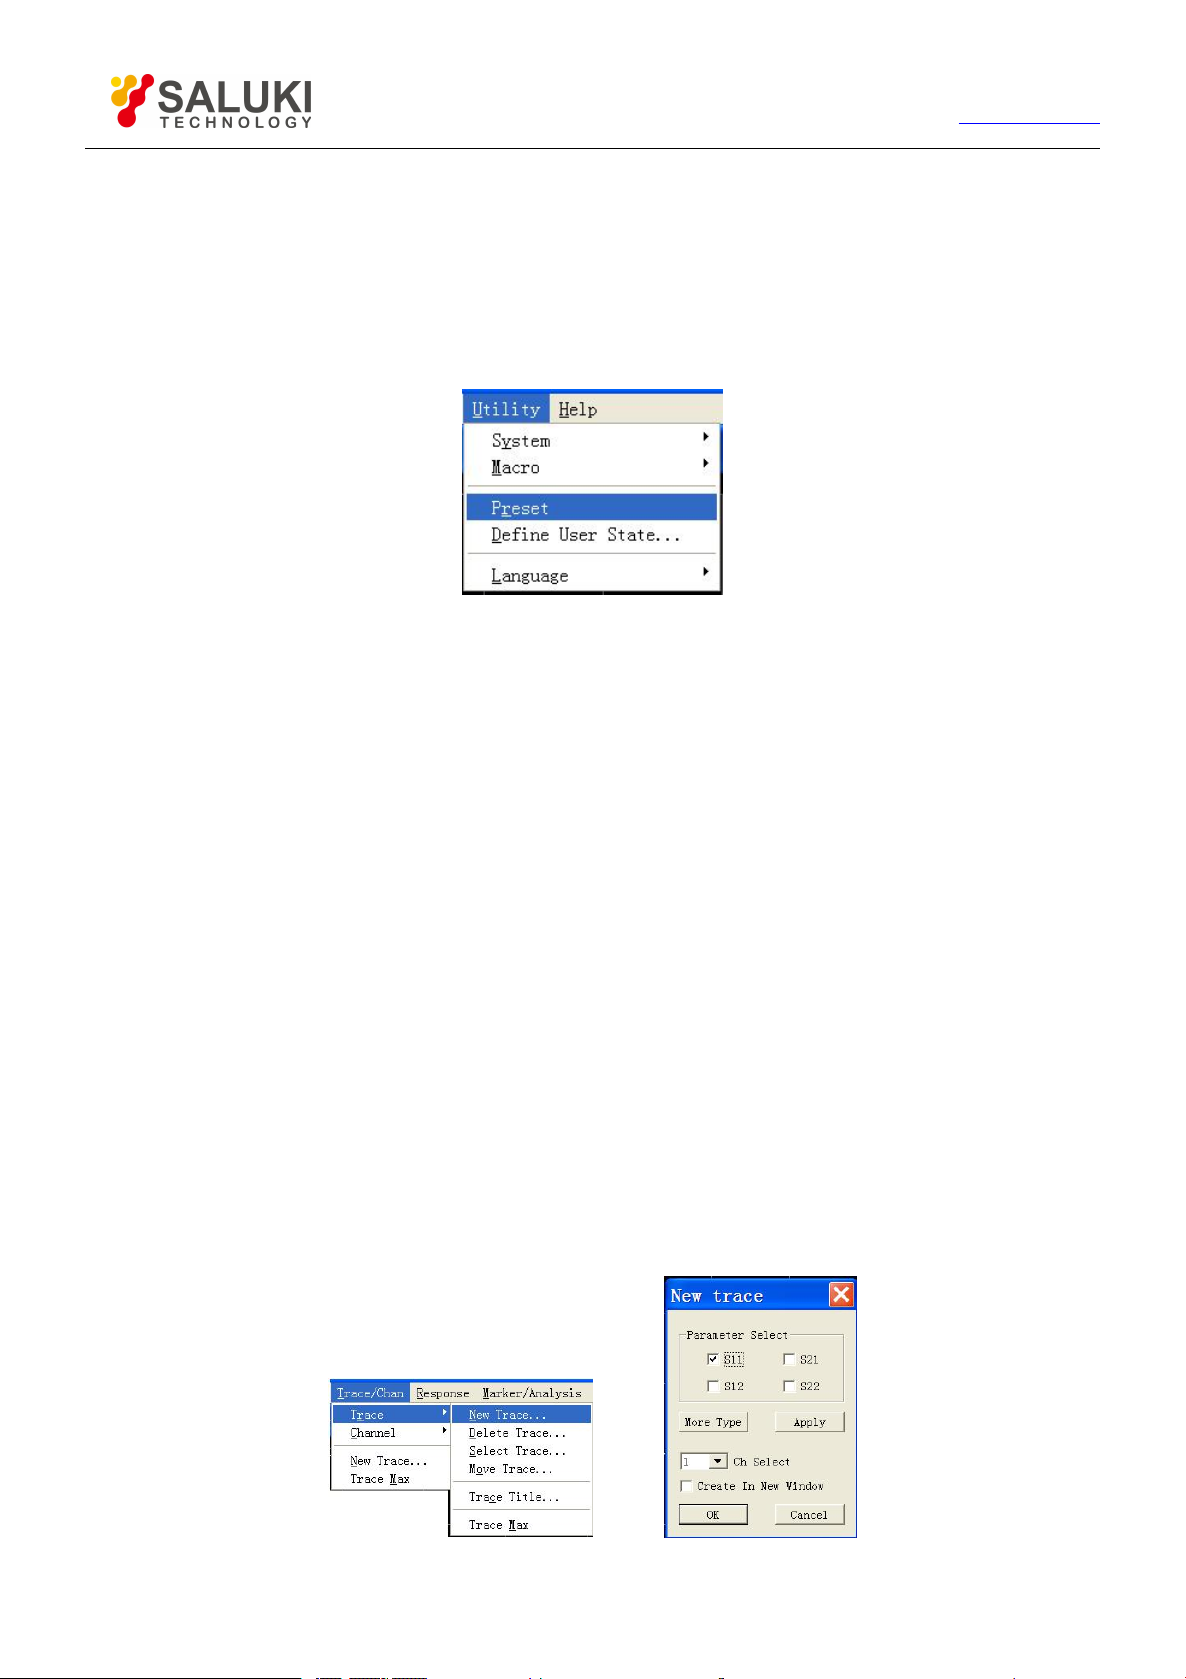
4.1.3. Reset Analyzer
By mouse or touch screen
Single click [Utility], and then single click [Preset] in the Utility menu.
Fig. 4-2 Resetting Analyzer
www.salukitec.com
By front panel keys
Press【Preset】in UTILITY area.
Selecting Measure Parameter
4.2.
We can set the Analyzer to use the following parameters to measure electrical properties of a device:
S parameter (fixed ratio)
Arbitrary ratio (Measure of user-defined ratio)
Measure of non-ratio power (absolute power Measure)
4.2.1.
S parameter
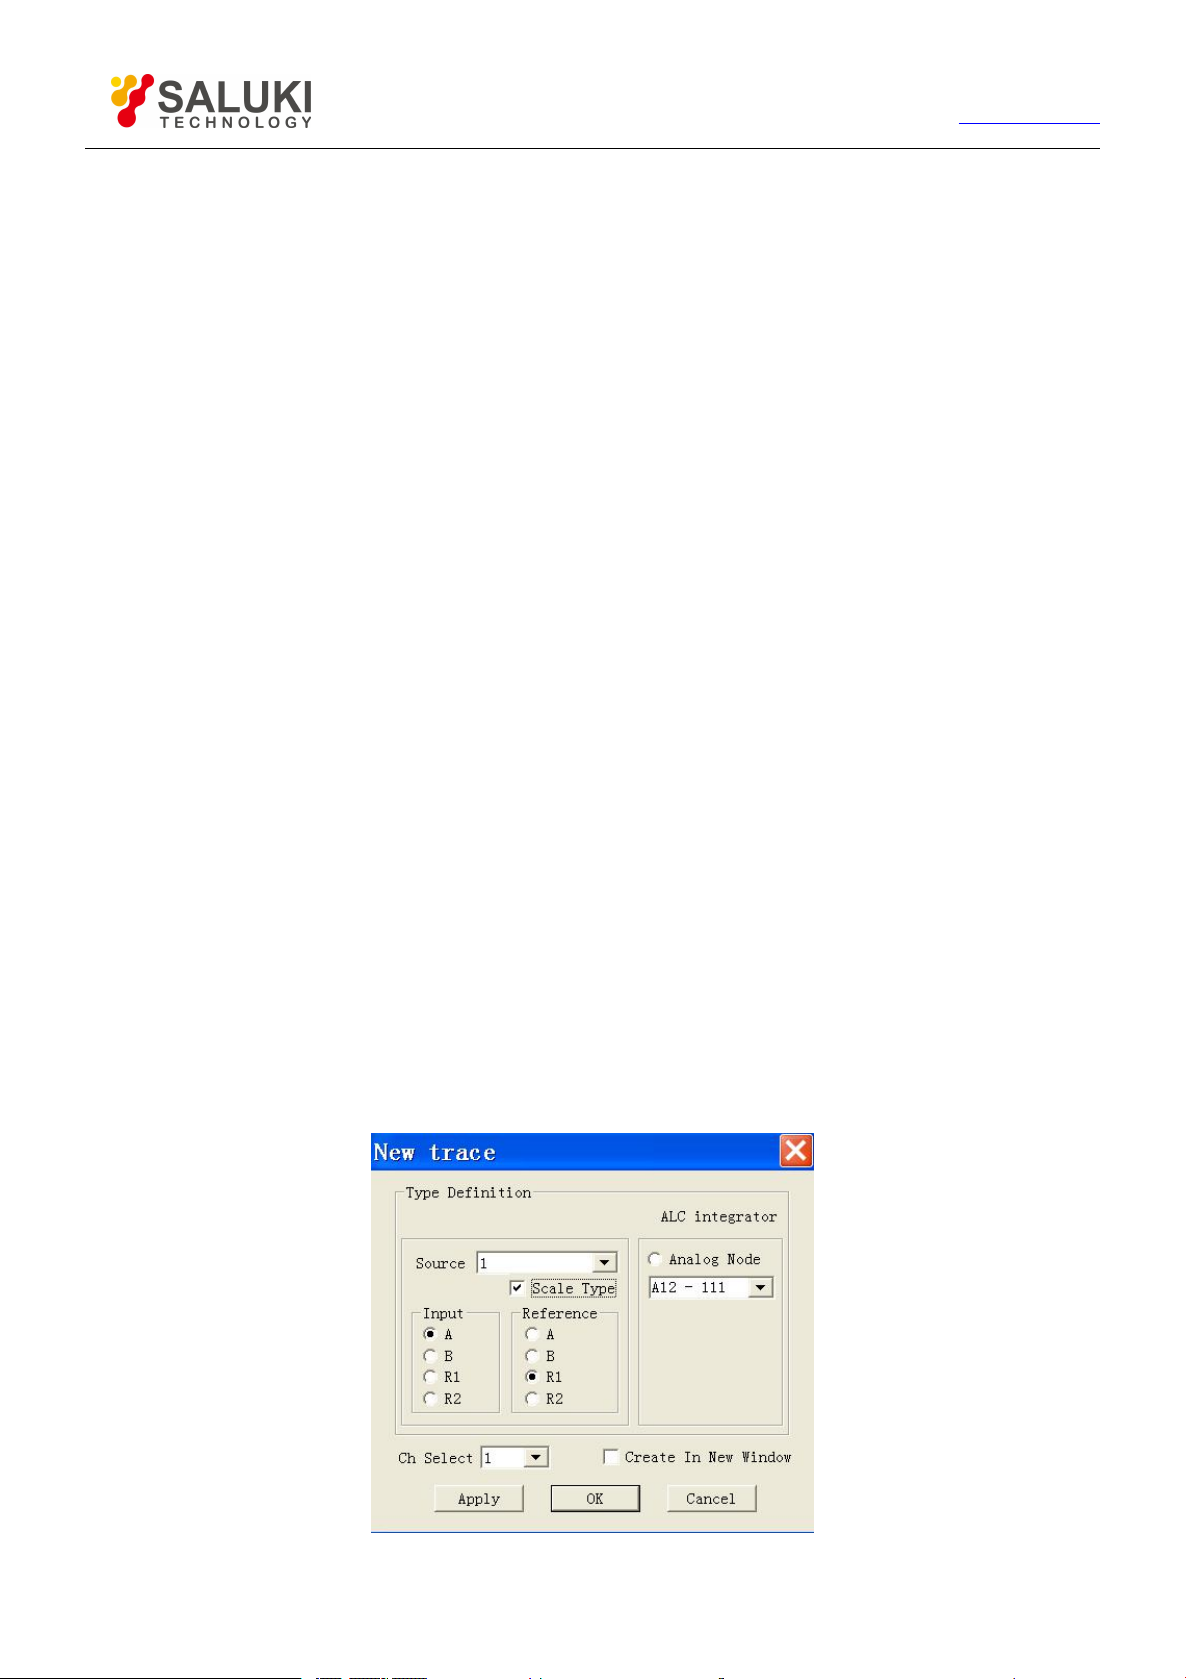
4.2.1.1. Creating new S parameter Measure Trace
By mouse or touch screen
1) Single click [Trace], single click [New Trace...] in [New Trace] menu, and display the dialog box of New Create Trace.
2) Select new S parameter Measure Trace to be created in the dialog box.
3) Single click [OK] button to close the dialog box after the setting is completed.
Fig. 4-3 Create New S Parameter Trace
Page 36
36
Tel: 886.2.2175 2930 Email: [email protected]
By front panel keys
1) Press【Trace】key in TRACE/CHAN area.
2) Press the corresponding soft-key of [New S-Param] to create new Traces.
4.2.1.2. Creating new Trace dialog box
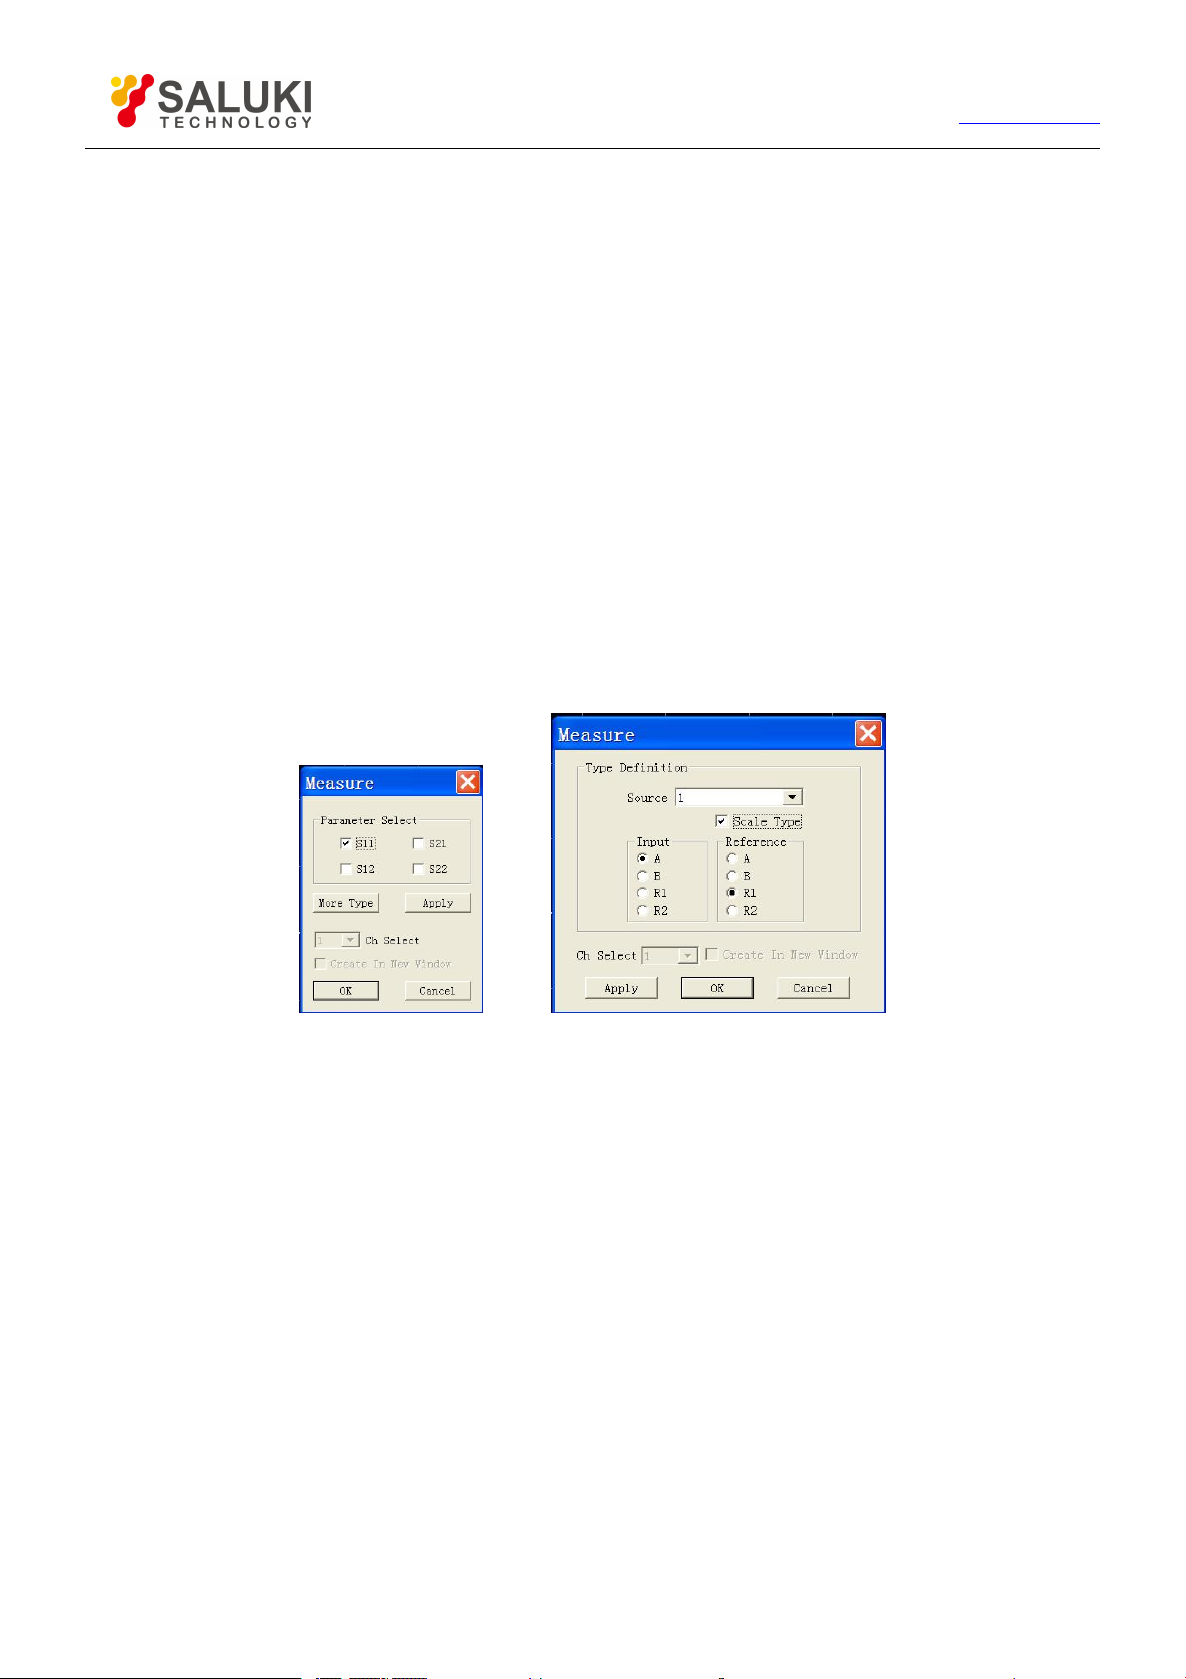
Parameter select zone
It is used to select new S parameter Measure Trace to be created.
[More Type]
Opening the dialog box to create new arbitrary ratio or non-ratio power Measure Traces.
[Ch Select]
It is used for selecting the channel for a new Trace.
[Create in New Window]
A Trace is created in a new window when it is checked and is generated in the current window at the elimination.
www.salukitec.com
4.2.2. Arbitrary ratio Measure
The arbitrary ratio Measure allows to select input signals and reference signals for ratio Measure from receivers (A, B, R1 and R2).
4.2.2.1.
By mouse or touch screen
1) Single click [Trace/Chan], single click [New Trace...] in [Trace] menu, and display the dialog box of Create New Trace.
2) Single click [More Type] button in the dialog box to display the dialog box of New Trace.
3) Select the output port of Analyzer source signals from [Source] box.
4) Click [Scale Type] to mark check box.
5) Select input receiver for ratio Measure from Input zone.
6) Select reference receiver for ratio Measure from Reference zone.
7) Single click [OK] button to close the dialog box.
Creating new arbitrary ratio Measure Trace
Fig. 4-4 Creating New Arbitrary Ratio Measure Trace
Page 37

37
Tel: 886.2.2175 2930 Email: [email protected]
www.salukitec.com
By front panel keys
1) Press【Trace】in TRACE/CHAN area and press the soft-key corresponding to [New Trace…] in soft-key menu displayed
on the right of screen to show New Trace dialog box.
2) Press【Tab】in ADJUST area to switch to [More Type] button and press【Click】to display New Trace dialog box.
3) Press 【Tab】in ADJUST area to switch to [Source] box and press 【↑】 and 【↓】 or rotate knob to select source output
port of Analyzer.
4) Press 【Tab】 in ADJUST area to switch to [Scale Type] and press 【Click】to mark check box.
5) Press 【Tab】 in ADJUST area to switch to Input zone and press 【↑】 and 【↓】 or rotate knob to select input receiver
of ratio Measure.
6) Press 【Tab】 in ADJUST area to switch to Reference zone and press【↑】 and 【↓】or rotate knob to select reference
receiver of ratio Measure.
7) Press [OK] in ENTRY area to close dialog box.
4.2.3.
The non-ratio power Measure parameter can measure the absolute power entering receivers (i.e. A, B, R1 and R2), but Measures of
phase and group delay and any other Measures enabling average functions cannot be performed.
Non-ratio power Measure
4.2.3.1. Creating new non-ratio power Measure Trace
By mouse or touch screen
1) Single click [Trace/Chan], single click [New Trace...] in [Trace] menu, and display the dialog box of Create New Trace.
2) Single click [More Type] button to display the dialog box of New Trace.
3) Select the source output port of Analyzer from [Source] box.
4) Click [Scale Type] to eliminate check box (if marked).
5) Select Measure receiver of signals from Input zone.
6) Single click [OK] button to close the dialog box after the setting is completed.
By front panel keys
1) Press【Trace】in TRACE/CHAN area and press the soft-key corresponding to [New Trace…] in the corresponding
soft-key menu to show New Trace dialog box.
2) Press 【Tab】 in ADJUST area to switch to [More Type] button and press 【Click】 to display New Trace dialog box.
3) Press【Tab】in ADJUST area to switch to [Source] box and press【↑】and【↓】or rotate knob to select source
output port of Analyzer.
4) Press 【Tab】 in ADJUST area to switch to [Scale Type] and press 【Click】 to eliminate check box (if marked).
5) Press 【Tab】 in ADJUST area to switch to Input zone and press 【↑】 and 【↓】 or rotate knob to select Measure
receiver of signals.
6) Press【OK】in ENTRY area to close dialog box.
4.2.3.2. Creating new Trace dialog box (arbitrary ratio and non-ratio power Measure)
[Source]
Page 38
38
Tel: 886.2.2175 2930 Email: [email protected]
www.salukitec.com
Select output port of Analyzer source signals.
[Scale Type]
Create new arbitrary ratio Measure Trace when it is checked a new non-ratio power Measure Trace during elimination.
[Input]
Select input receiver for measuring response signals of DUT.
[Reference]
Select reference receiver for performing ratio Measure.
[Ch Select]
It is used for selecting the channel for a new Trace.
[Create in New Window]
A Trace is created in a new window when it is checked and another one is created in current window during elimination.
4.2.4. Changing Measure Type of Trace
For Analyzer, if some Trace needs to be set and modified, the Trace must be changed to the current Active Trace, and then can be
modified.
4.2.4.1.
By mouse or touch screen
Single click Trace Status Bar on the upper part of window and the corresponding Trace becomes the current Active Trace.
By front panel keys
Press [Trace Prev] or [Trace Next] in TRACE/CHAN area. Or, the following operation methods can be employed:
Press 【 Trace 】 in TRACE/CHAN area and press the soft-key corresponding to [Select Trace] in the corresponding
soft-key menu to show Current Trace dialog box.
Press【↑】and【↓】in ADJUST area or rotate knob to select the Trace requiring to be Stimulus in Current Trace dialog
box.
4.2.4.2.
By mouse or touch screen
Changing Stimulus state of Trace
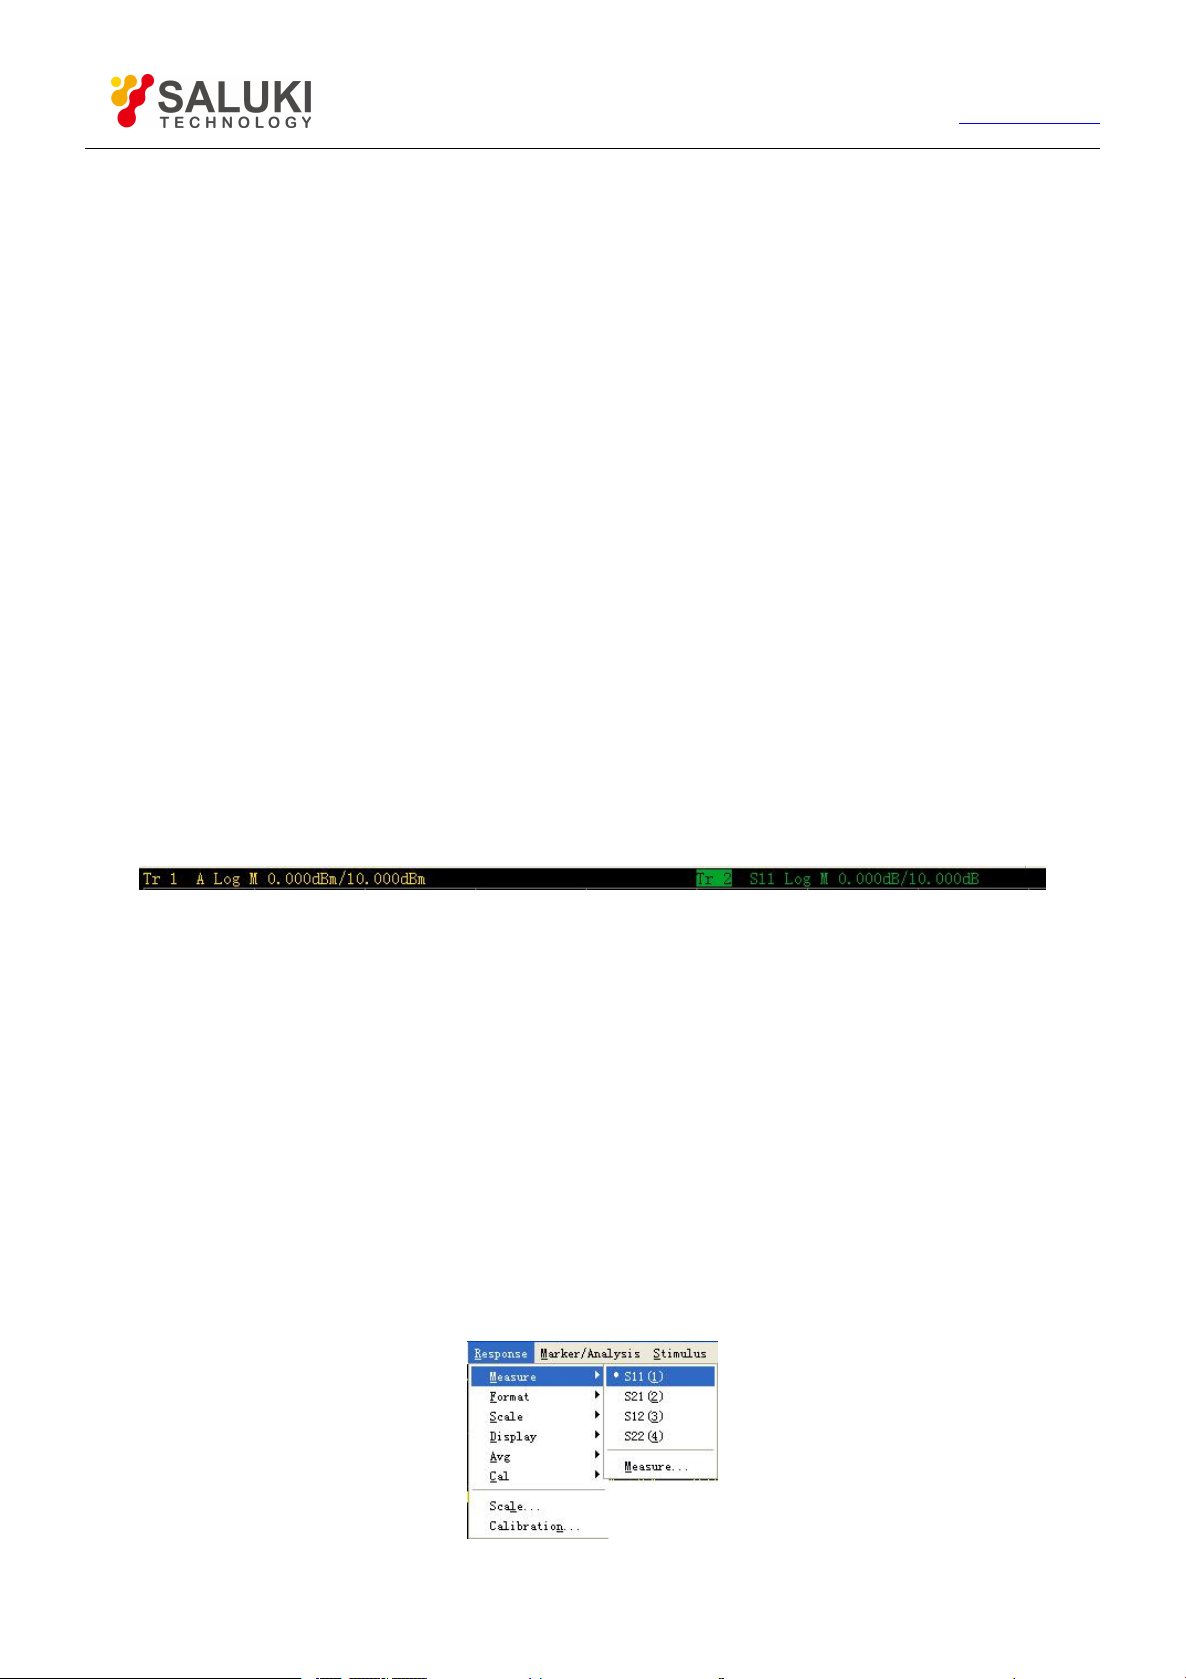
Fig. 4-5 Changing Stimulus State of Trace
Setting S parameter Measure type of current Active Trace
1) Single click [Response] and point to [Measure] in Response menu to display submenu of Measure.
2) Single click S parameter Measure type to be selected from the submenu.
Fig. 4-6 Setting S Parameter Measure Type of Current Active Trace
Page 39
39
Tel: 886.2.2175 2930 Email: [email protected]
By front panel keys
1) Press【Meas】in RESPONSE area.
2) Press the corresponding soft-key to select S-parameter Measure type on existing soft-key menu.
4.2.4.3. Changing current Active Trace to be arbitrary ratio type
By mouse or touch screen
1) Single click [Response] and point to [Measure] in Response menu to display submenu of Measure.
2) Single click menu item of [Measure…] in submenu to display Measure dialog box.
3) Single click [More Type] button to display Measure dialog box.
4) Select the source output port of Analyzer from [Source] box.
5) Click [Scale Type] to mark check box.
6) Select input receiver for ratio Measure from Input zone.
7) Select reference receiver for ratio Measure from Reference zone.
www.salukitec.com
8) Single click [OK] button to close the dialog box after the setting is completed.
Fig. 4-7 Changing Current Active Trace to be Arbitrary Ratio Type
By front panel keys
1) Press【Meas】in RESPONSE area and single click the soft-key corresponding to [Measure…] to display Measure dialog
box.
2) Press【Tab】in ADJUST area to switch to [More Type] button and press【Click】to display Next-level Measure dialog
box.
3) Press 【Tab】 in ADJUST area to switch to [Source] box and press 【↑】 and 【↓】or rotate knob to select source output
port of Analyzer.
4) Press 【Tab】 in ADJUST area to switch to [Scale Type] and press 【Click】 to mark check box.
5) Press 【Tab】in ADJUST area to switch to Input zone and press 【↑】 and 【↓】or rotate knob to select input receiver
of ratio Measure.
6) Press 【Tab】in ADJUST area to switch to Reference zone and press 【↑】and 【↓】 or rotate knob to select reference
receiver of ratio Measure.
7) Press【OK】in ENTRY area to close dialog box.
Page 40

40
Tel: 886.2.2175 2930 Email: [email protected]
www.salukitec.com
4.2.4.4. Changing current Active Trace to be non-ratio power Measure type
By mouse or touch screen
1) Single click [Response] and point to [Measure] in Response menu to display submenu of Measure.
2) Single click [Measure…] in submenu to display Measure dialog box.
3) Single click [More Type] to display Measure dialog box.
4) Select the source output port of Analyzer from [Source] box.
5) Click [Scale Type] to eliminate check box (if marked).
6) Select Measure receiver from Input zone.
7) Single click [OK] to close the dialog box after the setting is completed.
By front panel keys
1) Press【Meas】in RESPONSE area and single click the soft-key corresponding to [Measure…] to display Measure dialog
box.
2) Press【Tab】in ADJUST area to switch to [More Type] button and press【Click】to display Next-level Measure dialog
box.
3) Press【Tab】in ADJUST area to switch to [Source] box and press【↑】and【↓】or rotate knob to select source output
port of Analyzer.
4) Press 【Tab】 in ADJUST area to switch to [Scale Type] and press 【Click】 to eliminate check box (if marked).
5) Press 【Tab】 in ADJUST area to switch to Input zone and press 【↑】 and 【↓】 or rotate knob to select Measure
receiver.
6) Press 【OK】in ENTRY area to close dialog box after the setting is completed.
Page 41
41
Tel: 886.2.2175 2930 Email: [email protected]
Wave Band
S3601 A Frequency Range
S3601 B Frequency Range
B0
100kHz~5MHz
100kHz~8MHz
B1
5MHz~10MHz
8MHz~8500MHz
B2
10MHz~748MHz
B3
748MHz~1500MHz
B4
1500MHz~3000MHz
www.salukitec.com
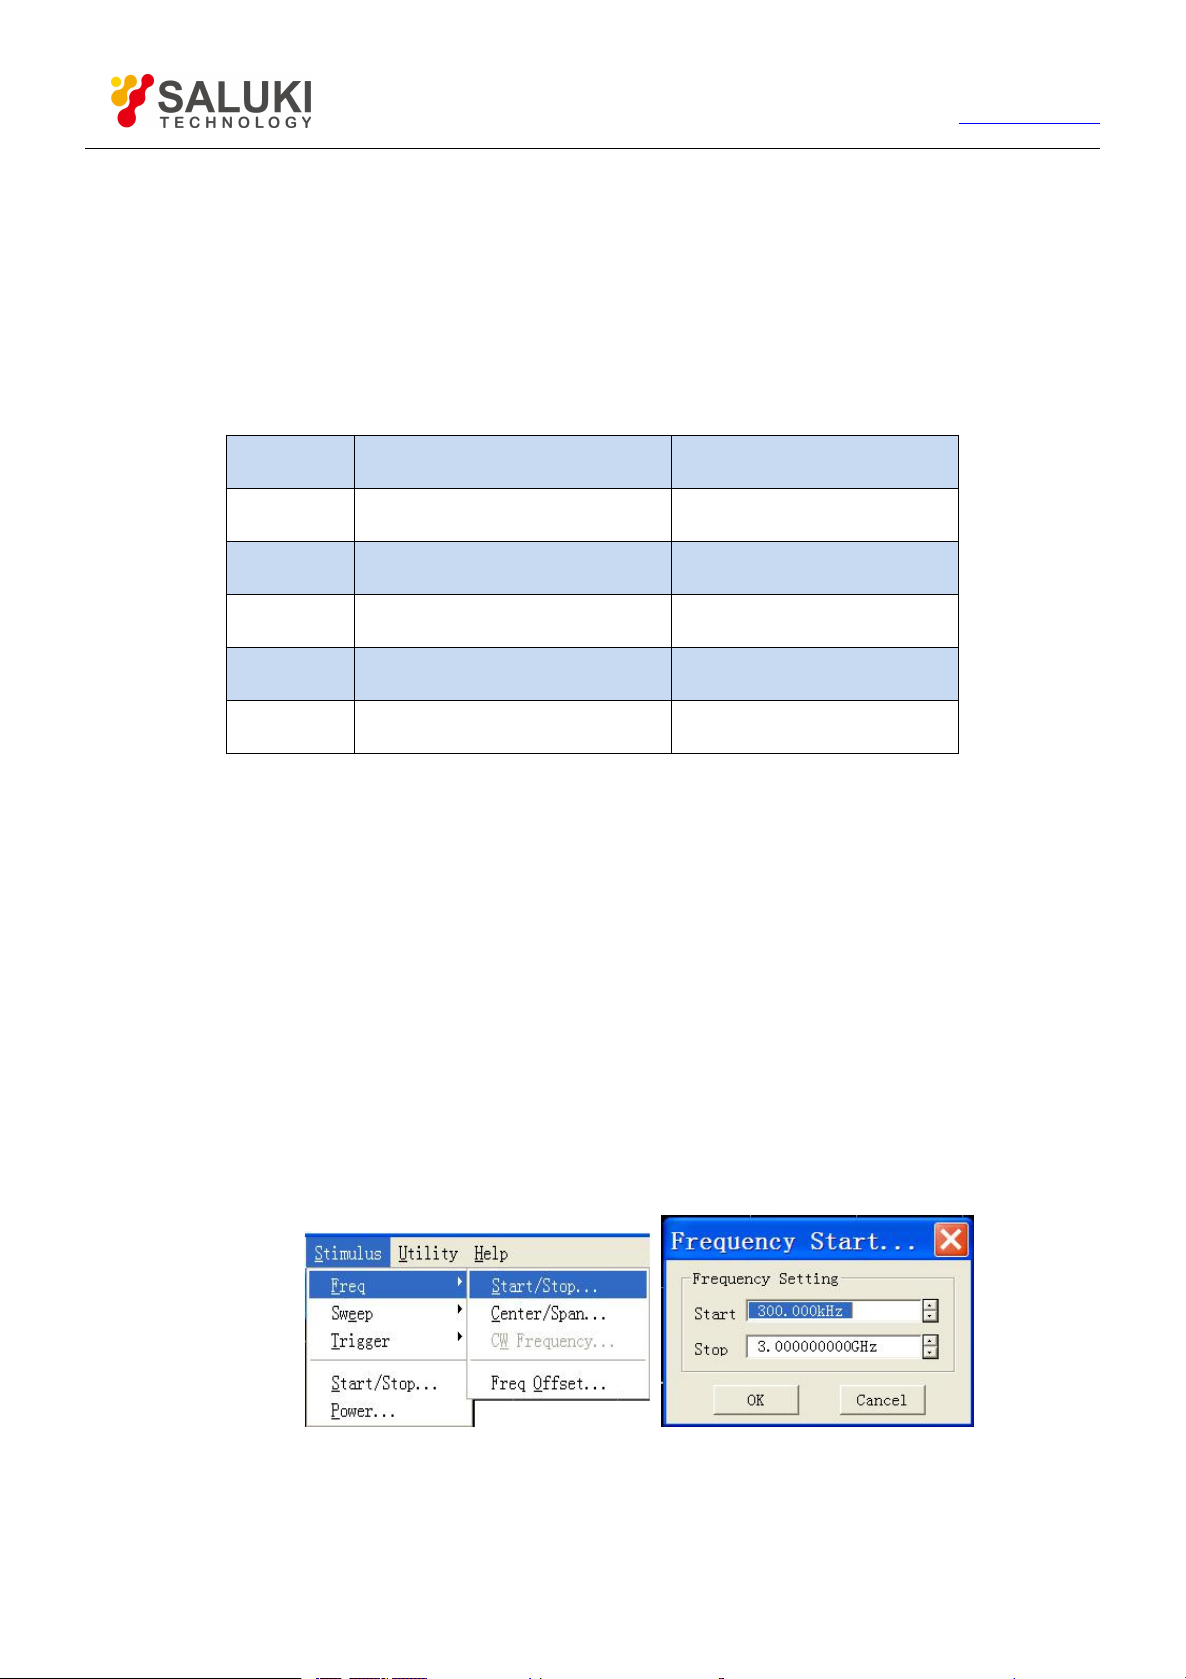
4.3.Setting Frequency Range
The frequency range refers to the frequency span of device Measure and the frequency resolution of S3601 Series vector Network
Analyzer is 1Hz. The whole frequency range includes several wave bands, and when frequency Sweep passes through switching
points of these wave bands or sweeps the highest frequency of setting for retracing Sweep, the power input to DUT will be adjusted
to minimum to prevent oversized peak power from burning up DUT. If the frequency range of Sweep only consists of one wave band,
the power will be kept unchanged at retracing Sweep. The frequency range of every wave band of Analyzer is shown as follows:
Table 4-2 Wave Band Division of S3601 Series
4.3.1. Setting Frequency Range
There are two methods of setting frequency range:
Designating start frequency and stop frequency
Designating center frequency and frequency span
4.3.1.1. Setting start frequency and stop frequency
By mouse or touch screen
1) Single click [Stimulus], point to [Freq] in Stimulus menu, and single click menu item of [Start/Stop…] to display Frequency
Start/ Stop dialog box.
2) Single click [Start] and input start frequency value.
3) Single click [Stop] and input stop frequency value.
4) Single click [OK] to close the dialog box after the setting is completed.
By front panel keys
Fig. 4-8 Designating Start Frequency and Stop Frequency
1) Press【Start】key in STIMULUS area to set start frequency value in existing input bar.
Page 42
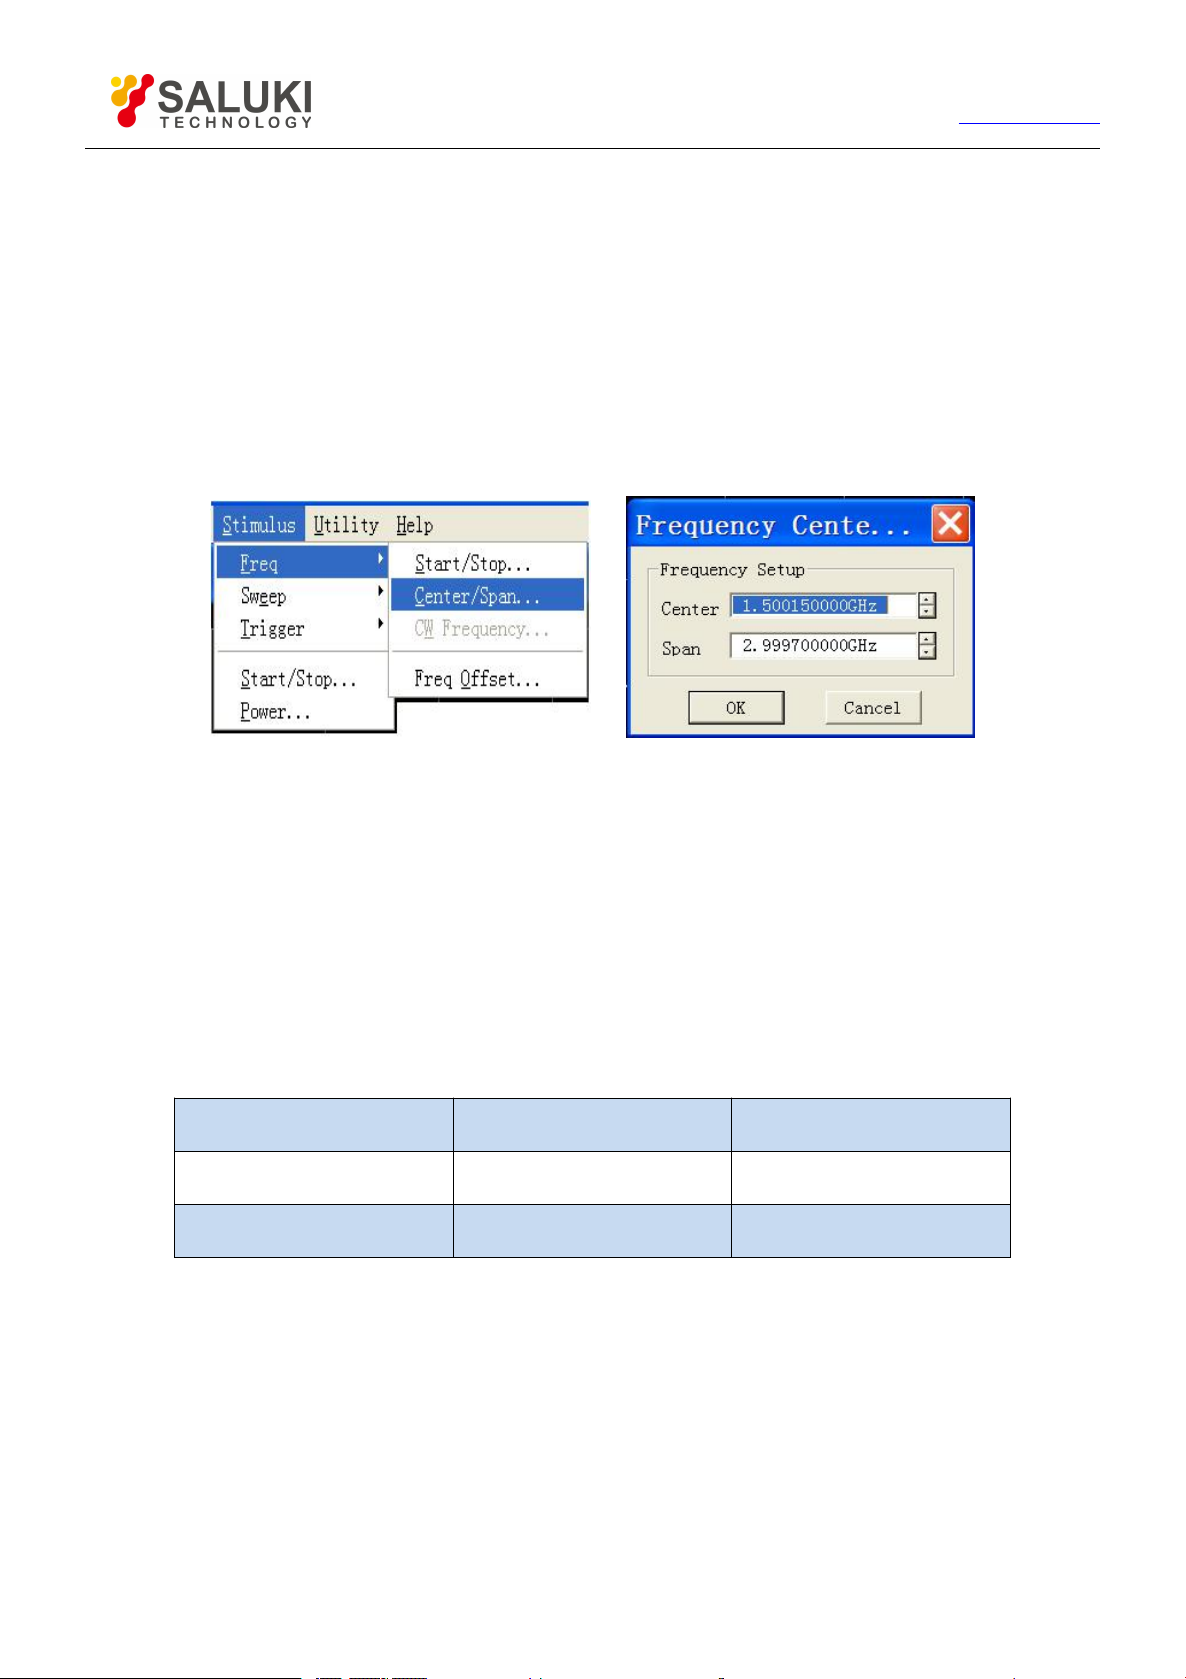
42
Tel: 886.2.2175 2930 Email: [email protected]
Frequency
Source Power Range (dBm)
Resolution (dB)
S3601A (100kHz~3GHz)
-45~+10
0.01
S3601B (100kHz~8.5GHz)
-55~+10
0.01
2) Press【Stop】key in STIMULUS area to set stop frequency value in existing input bar.
www.salukitec.com
4.3.1.2.
Setting the center frequency and frequency span
By mouse or touch screen
1) Single click [Stimulus], point to [Freq] in Stimulus menu, and single click menu item of [Center/Span…] to display
Frequency Center/Span dialog box.
2) Single click [Center] and input center frequency value.
3) Single click [Span] and input frequency span value.
4) Single click [OK] to close the dialog box after the setting is completed.
Fig. 4--9 Designating Center Frequency and Frequency Span
By front panel keys
1) Press【Center】in STIMULUS area to set center frequency value in existing input bar.
2) Press【Span】in STIMULUS area to set frequency span value in existing input bar.
4.4.Setting Signal Power Level
Power level refers to the power level for Analyzer measuring port output source signals and the technical index for power level of
output signals at port of S3601 Series Vector Network Analyzer is as below:
Table 4-3 Source Signal Power Level Index
4.4.1.
4.4.1.1.
Setting Power Level
By mouse or touch screen
1) Single click [Stimulus] and single click [Power…] in Stimulus menu to show Power dialog box.
2) Single click [Port Power Level] and input power level from Port 1. The port power is coupled under default condition, so
the power level of Port 2 is also set.
3) If the power level for every port shall be set independently, eliminate [Port Power Coupled] check box, select setting port
4) Single click [OK] to close the dialog box.
in [Port], and set power level in [ Port Power ].
Page 43
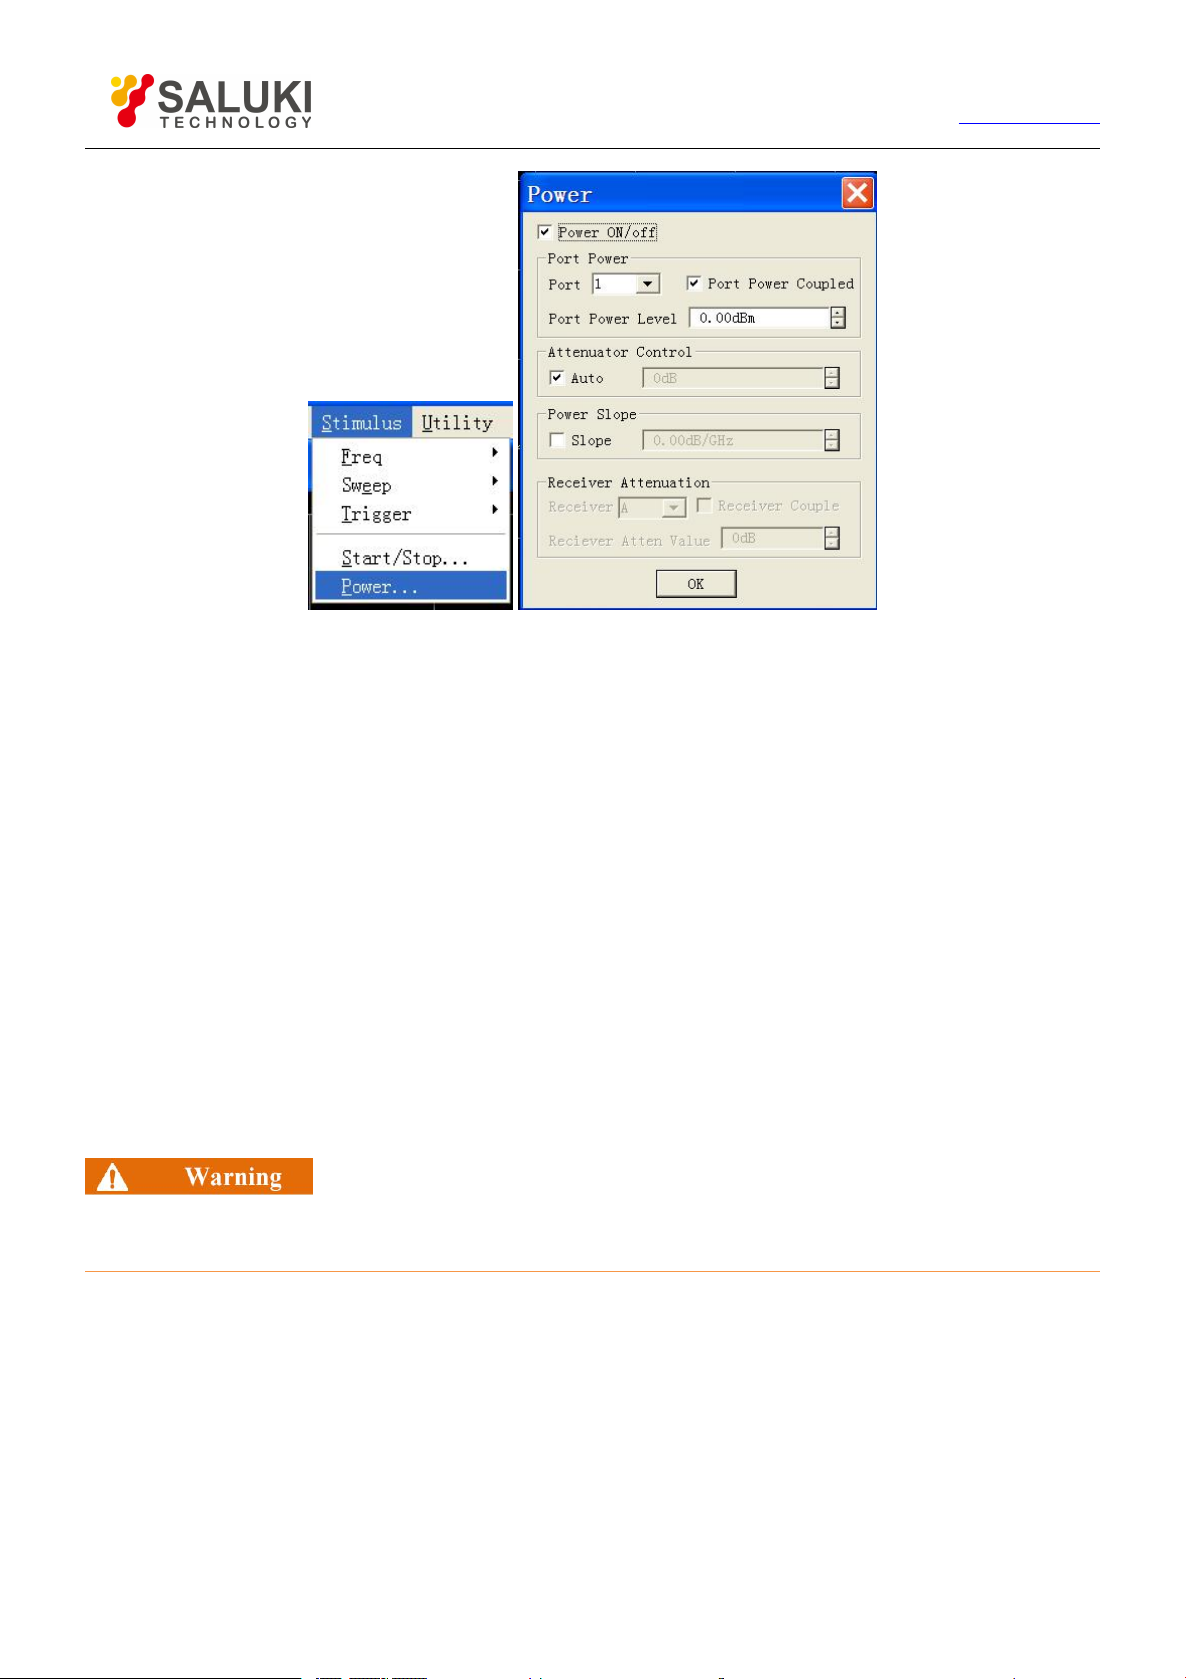
43
Fig. 4-10 Setting Power Level
Tel: 886.2.2175 2930 Email: [email protected]
www.salukitec.com
4.4.1.2. By front panel keys
1) Press 【Sweep】in STIMULUS area and press the soft-key corresponding to [Power] on existing soft-key menu.
2) Input power level in Power Level dialog box.
4.4.1.3. Power dialog box
[Power ON/off]
During marking, power can be output normally from port and the output power from port turned off during elimination.
Selecting port zone
[Port]
Select the port for setting power level.
[Port Power Coupled]
By default, Mark [Coupled Port Power] check box and the power level settings for 2 ports of Analyzer are identical. When
[Coupled Port Power] check box is eliminated, the Analyzer allows to set power level for every port respectively.
If the input power at Measure port of Analyzer is too large, it may burn the receiver of Analyzer and the maximum input
radio-frequency power level at Measure port of Analyzer is: +26dBm
[Port Power Level]
It is used to set power level of port.
Attenuator control zone
[Auto] and [Attenuation control]
When [Auto] check box is marked, the Analyzer can be set as any power level within the allowable power range and
[Attenuation Setting] is forbidden, and the Analyzer can select automatically attenuator setting so as to utilize optimum power
range.
4.4.2.
Turning Port Power Off
Page 44

44
Tel: 886.2.2175 2930 Email: [email protected]
By mouse or touch screen
1) Single click [Stimulus] and single click [Power…] in Stimulus menu to show Power dialog box.
2) Eliminate [Power ON/off] check box.
3) Single click [OK] to close the dialog box.
By front panel keys
1) Press【Sweep】in STIMULUS area and press the soft-key corresponding to [Power] on existing soft-key menu.
2) Press the corresponding soft-key in [Power ON | off] menu on the corresponding soft-key menu.
Sweep Setup
4.5.
Sweep refers to the measuring process of continuous data points with stimulus values in specified sequence.
www.salukitec.com
4.5.1.
The Analyzer supports five types of sweep as follows:
Linear frequency
This is the default sweep type for Analyzer. The frequency intervals between two neighbor measuring points are equal.
Logarithmic frequency
Under the setting of logarithmic frequency, source frequency increases in logarithmic step size and frequency ratios between two
neighboring measuring points are the same.
Power sweep
Power sweep is adopted for power-sensitive parameters, such as gain compression or AGC (automatic gain control) slope. Power
sweep is conducted in CW Time. The maximum vailable sweep range is 25dB and the default power sweep range is
-15dBm~+10dBm. During sweep, the power is swept with scattered step value from start value to end value and the step size is
decided by Sweep spot number and power range.
CW Time
For this sweep type, Analyzer is set to single sweep frequency. The measuring data is sampled continuously and precisely in time
interval decided by Sweep time and measuring points, showing the change of measuring data over time.
Segment sweep
Sweep type
This sweep type is made up with several segments, each of which can be defined with independent power level, IF bandwidth and
Sweep time. When calibrations are completed for all segments, Measures can be conducted for one or more segments. The
segments are defined in the sequence of frequency increase and the frequency range cannot overlap. The attenuator setting for
power level of all segments must be the same so as to prevent the attenuator from being damaged by frequent switching of
attenuator. When the attenuator setting for current defined segment is different from that for defined segment, Analyzer will
automatically change the power level and attenuator setting of defined segment.
4.5.2. Setting of Sweep Type
4.5.2.1. Setting of sweep type - linear frequency
By mouse or touch screen
1) Click [Stimulus], then click [Sweep Type...] in menu [Sweep] to show Sweep Type dialog box.
2) Click [Linear Frequency] option button in Sweep Type.
Page 45
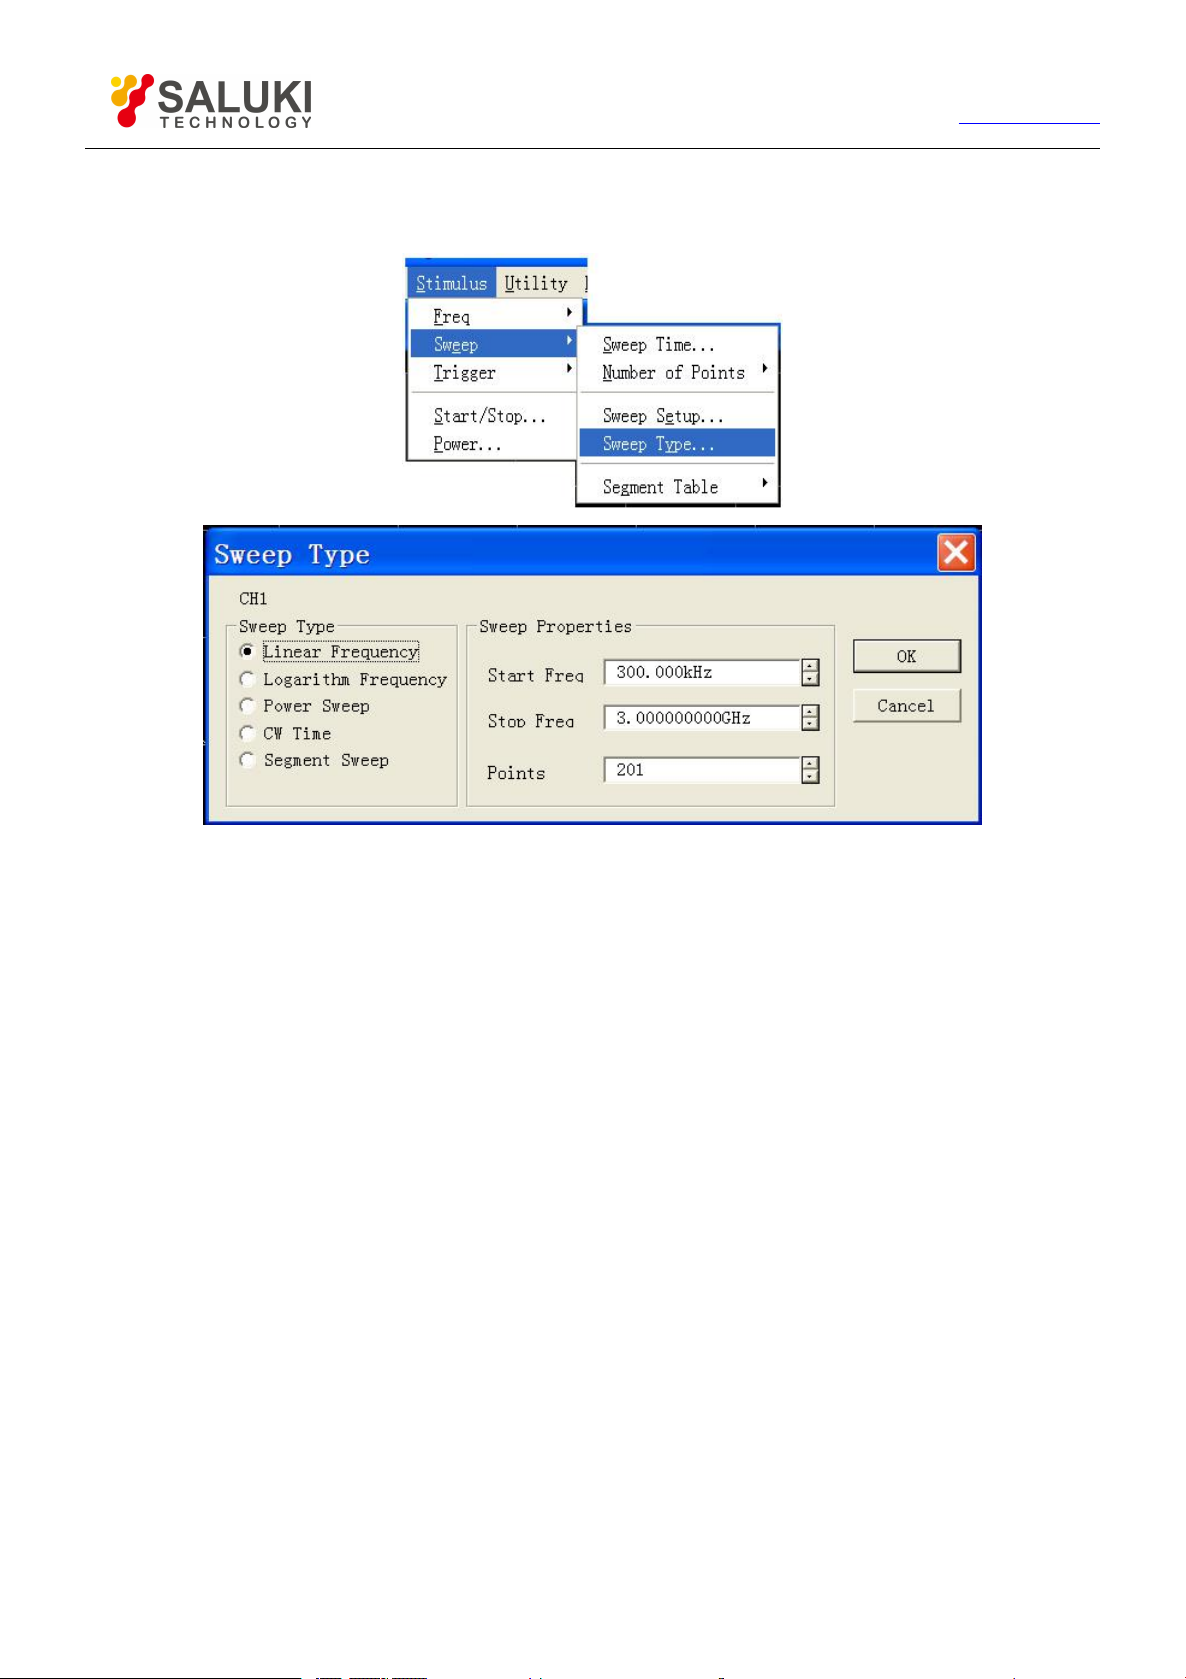
45
Tel: 886.2.2175 2930 Email: [email protected]
3) Set start frequency, stop frequency and Sweep spot number in Sweep Feature.
4) Click [OK] to close the dialog box.
www.salukitec.com
Fig.4-11 Setting of Sweep Type - Linear Frequency
By front panel keys
1) Press 【Sweep】in STIMULUS area and press the soft-key in soft-key menu corresponding to [Sweep Type].
2) Press the soft-key corresponding to [Linear Frequency] to select the sweep type.
3) Press【Start】in STIMULUS area and enter start frequency in Start Frequency box; press【Stop】in STIMULUS area
and enter stop frequency in Stop Frequency box.
4) Press 【Sweep Setup】in STIMULUS area, press the soft-key corresponding to [Number of Points] and enter Sweep
spot number in Number of Points box.
4.5.2.2. Setting of sweep type - logarithm frequency
By mouse or touch screen
1) Click [Stimulus], then click [Sweep Type...] from menu [Sweep] to show Sweep Type dialog box.
2) Click [Logarithm Frequency] option button from Sweep Type.
3) Set start frequency, stop frequency and Sweep spot number in Sweep Feature.
4) Click [OK] to close the dialog box.
Page 46
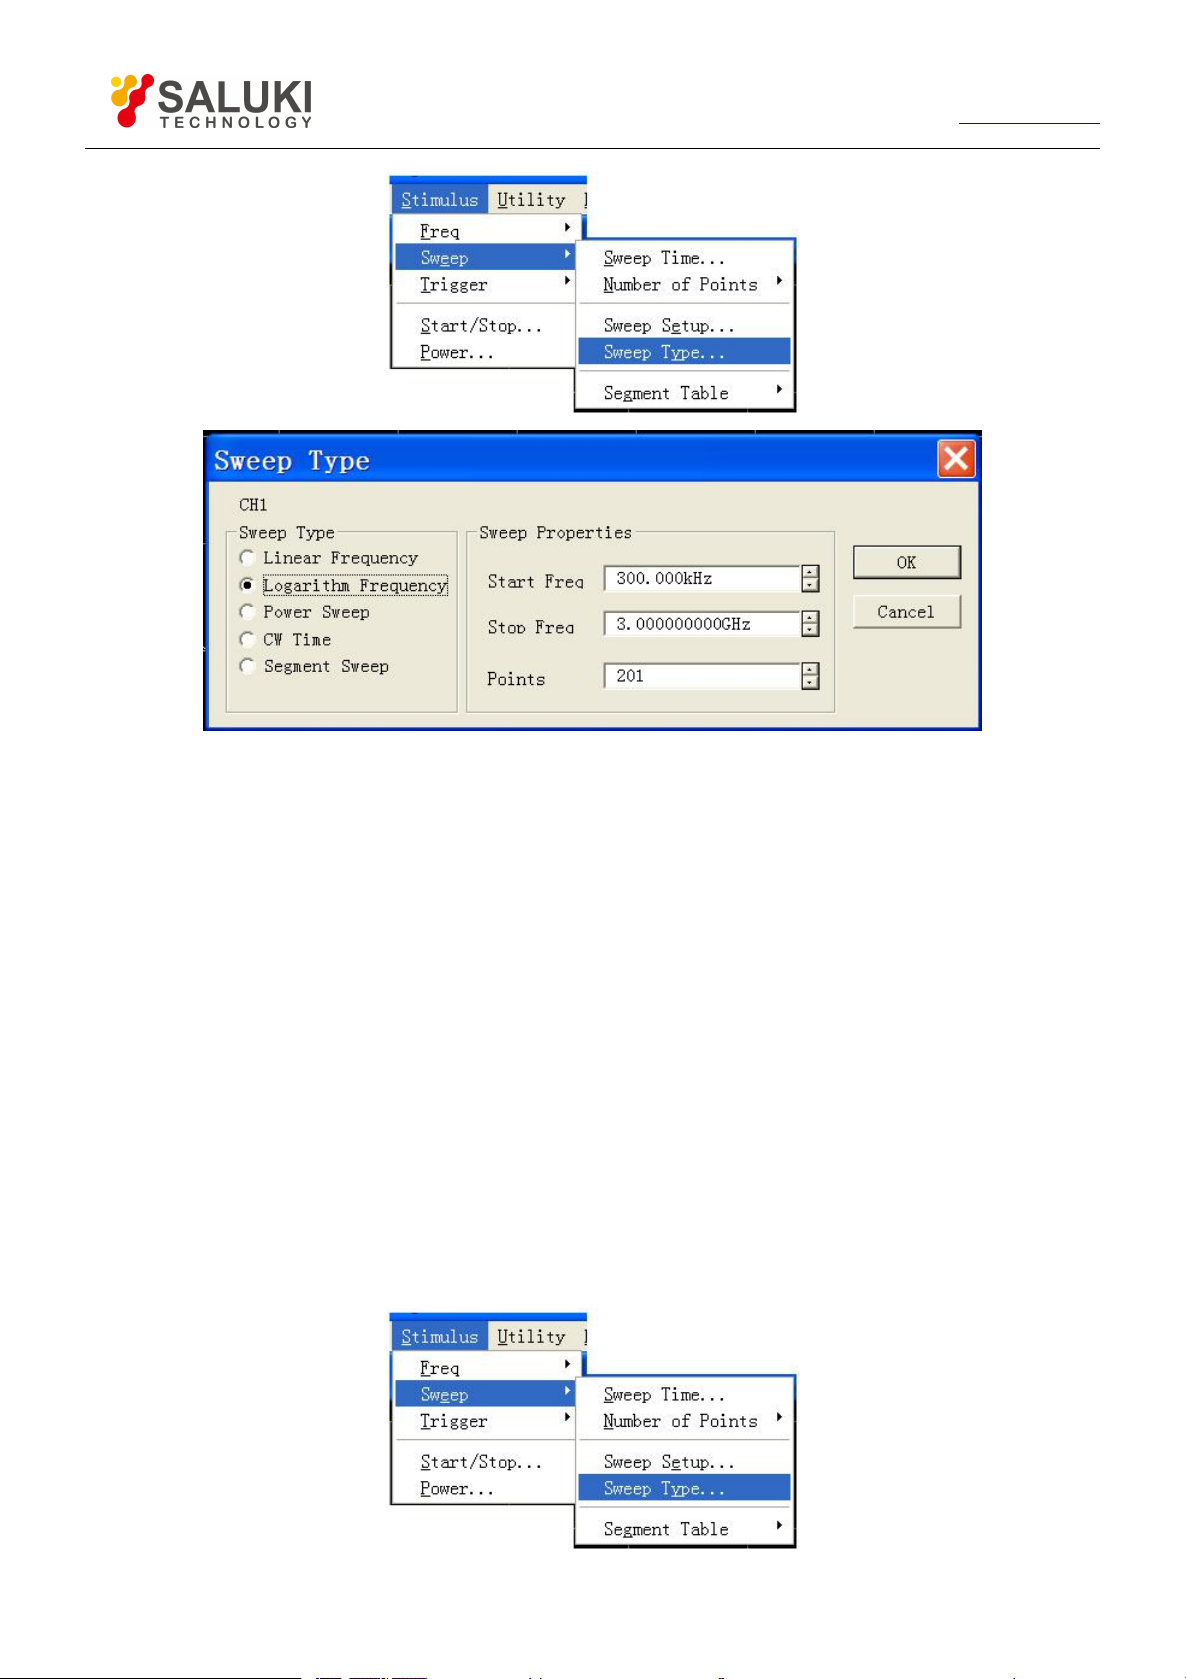
46
Tel: 886.2.2175 2930 Email: [email protected]
www.salukitec.com
Fig. 4-12 Setting of Sweep Type - Logarithmic Frequency
By front panel keys
1) Press 【Sweep】 key in STIMULUS area and press the soft-key in soft-key menu corresponding to [Sweep Type].
2) Press the soft-key corresponding to [Logarithm Frequency] to select the sweep type.
3) Press 【Start】in STIMULUS area and enter start frequency in start frequency box; press 【Stop】in Stimulus area and
enter stop frequency in stop frequency box.
4) Press【Sweep】in STIMULUS area, press the soft-key corresponding to [Number of Points] and enter Sweep spot
number in Number of Points box.
4.5.2.3.
Setting of power sweep type
By mouse or touch screen
1) Click [Stimulus], then click [Sweep Type...] from menu [Sweep] to show dialog box Sweep Type.
2) Click [Power Sweep] option button from Sweep Type.
3) Set start power, stop power and center frequency in Sweep Feature.
4) Click [OK] to close the dialog box.
Page 47
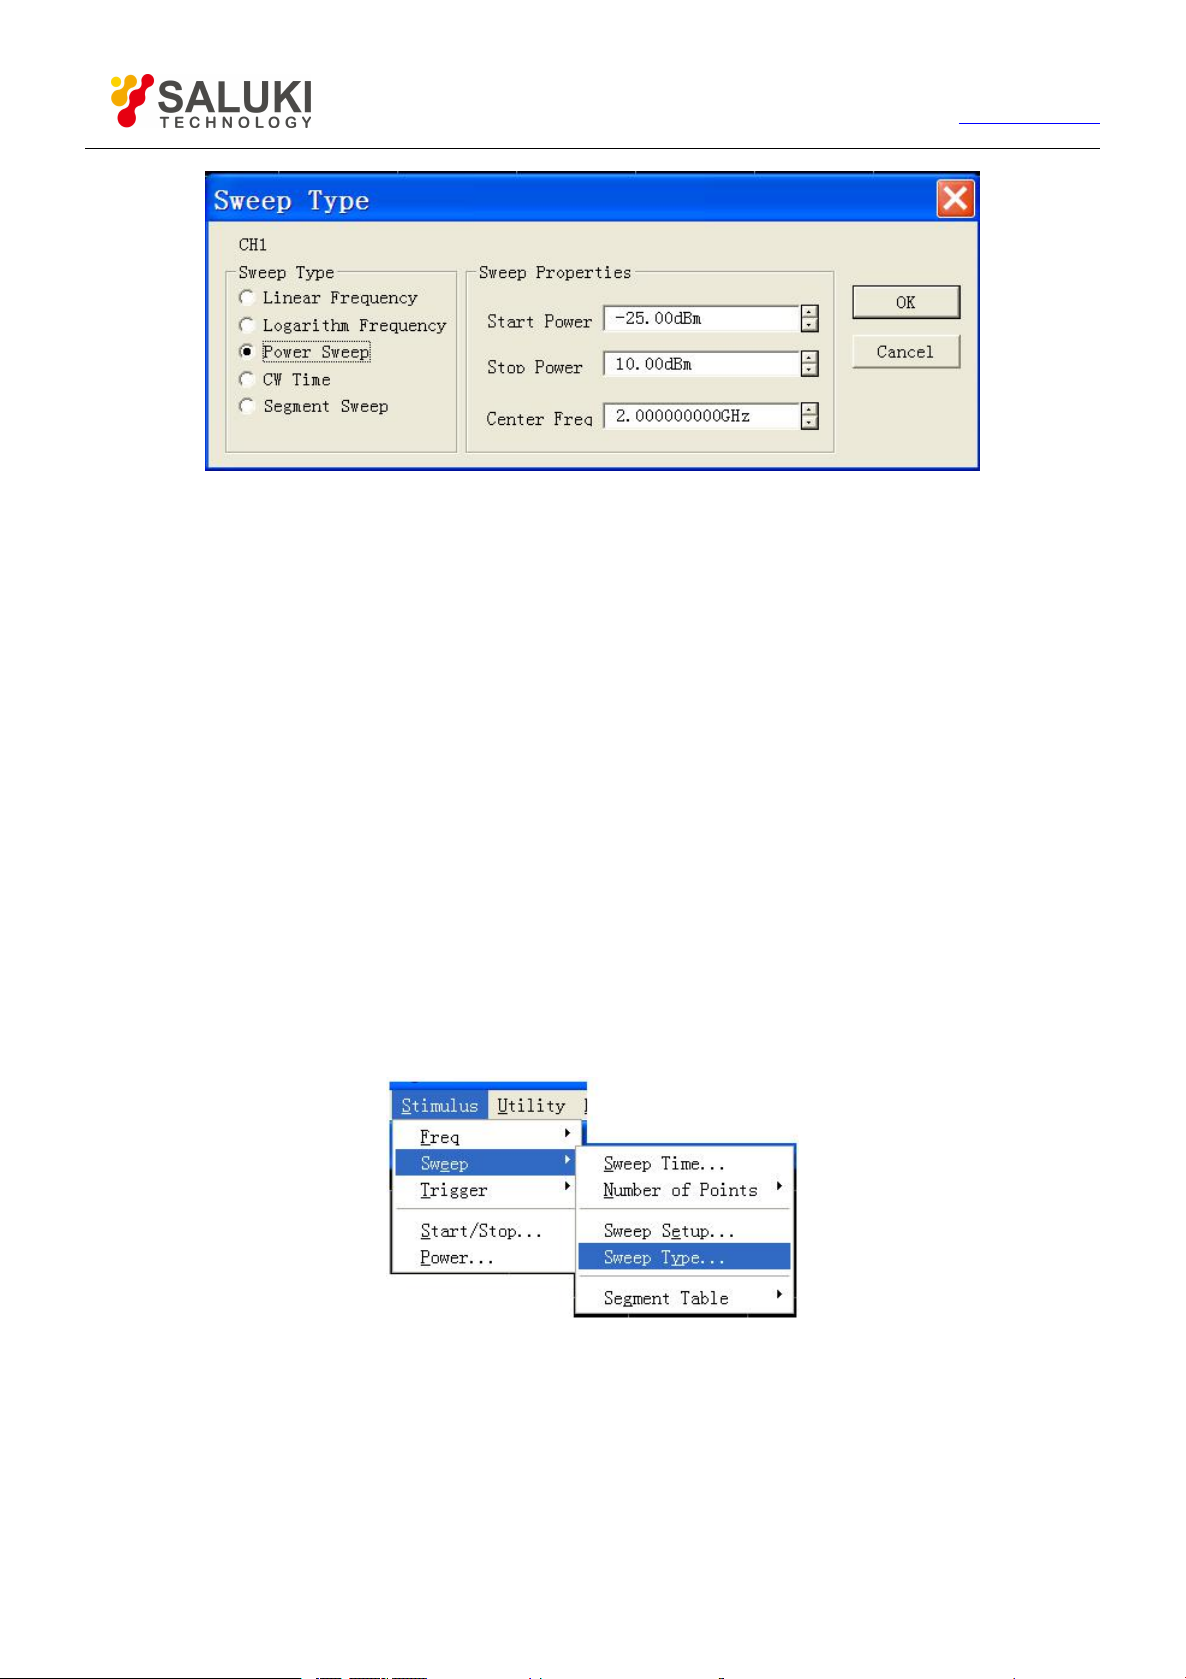
47
Tel: 886.2.2175 2930 Email: [email protected]
Fig. 4-13 Setting of Power Sweep Type
By front panel keys
1) Press 【Sweep】in STIMULUS area and press the soft-key on soft-key menu corresponding to [Sweep Type].
2) Press the soft-key corresponding to [Power Sweep] to select the sweep type.
www.salukitec.com
3) Press【Start】in STIMULUS area to show corresponding soft-key menu. Press soft-key corresponding to [CW Frequency]
and enter center frequency value in CW Frequency box.
4) Press【Sweep】in STIMULUS area, press in soft-key menu the soft-key corresponding to [Power]; press in submenu the
soft-key corresponding to [Start Power] and input start power in Start Power box; press the soft-key corresponding to
[Stop Power] and enter stop power in Stop Power box.
4.5.2.4. Setting of CW Time sweep type
By mouse or touch screen
1) Click [Stimulus], then click [Sweep Type...] from menu Sweep to show Sweep Type dialog box.
2) Click [CW Time] option button from Sweep Type.
3) Set center frequency, Sweep time and Sweep spot number in Sweep Feature.
4) Click [OK] to close the dialog box.
Page 48
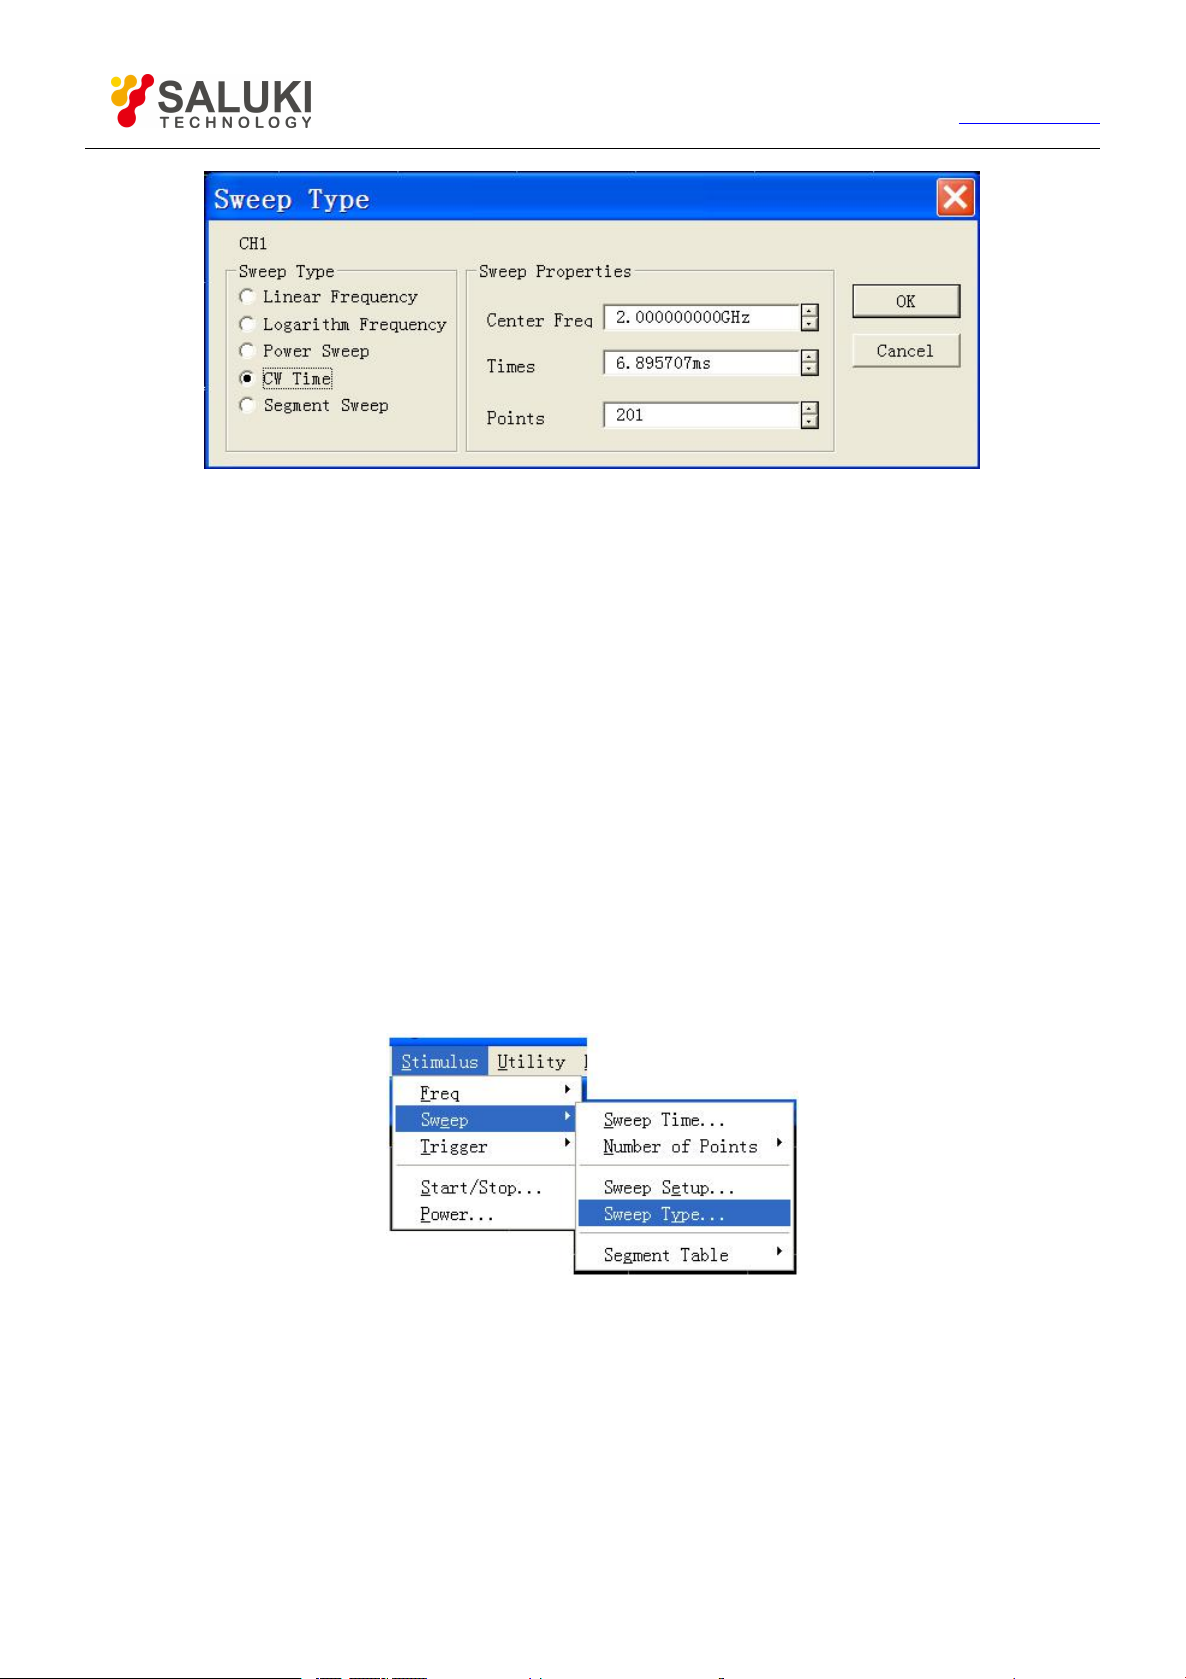
48
Tel: 886.2.2175 2930 Email: [email protected]
Fig.4-14 Setting of CW Time Sweep Type
By front panel keys
1) Press 【Sweep】in STIMULUS area and press the soft-key in soft-key menu corresponding to [Sweep Type].
2) Press the soft-key corresponding to [CW Time] to select the sweep type.
www.salukitec.com
3) Press 【Start】in STIMULUS area to show corresponding soft-key menu. Press soft-key corresponding to [CW Time] and
enter center frequency value in CW Frequency.
4) Press【Sweep Setup】in STIMULUS area, press the soft-key corresponding to [Sweep Time] and enter Sweep time in
Sweep Time box; press the soft-key corresponding to [Number of Points] and enter Sweep spot number in Number of
Points.
4.5.2.5. Setup of segment sweep type
By mouse or touch screen
1) Click [Stimulus], then click [Sweep Type...] from menu [Sweep] to show the dialog box of Sweep Type.
2) Click [Segment Sweep] option button from Sweep Type.
3) Click [OK] to close the dialog box.
Page 49
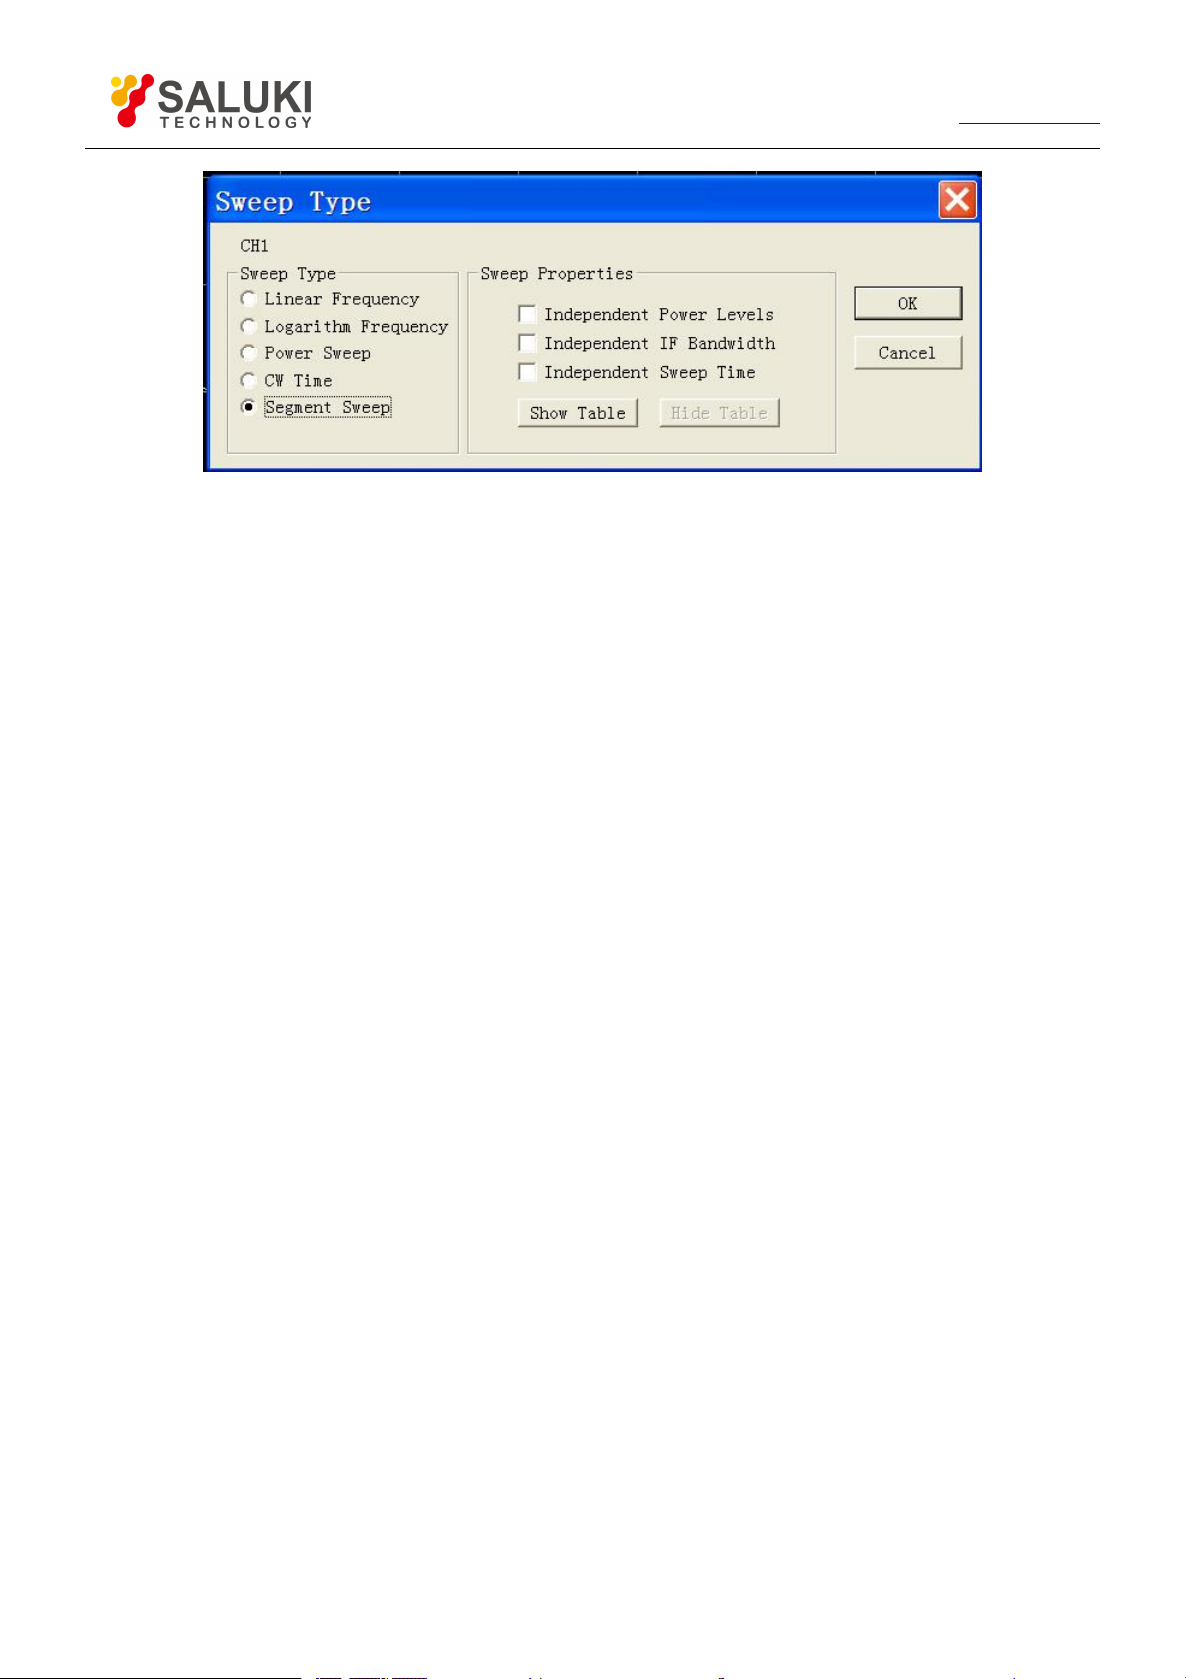
49
Tel: 886.2.2175 2930 Email: [email protected]
www.salukitec.com
Fig.4-15 Setup of Segment Sweep Type
Options in Sweep Feature zone
[Independent Power Level] check box: when selected, independent power level can be set for each segment which
must be of the same attenuator setting.
[Independent IF Bandwidth] check box: when selected, independent IF bandwidth can be set for each segment.
[Independent Sweep Time] check box: when selected, independent Sweep time can be set for each segment.
[Show Table]: click the button to show segment table, then create and edit the segment table.
[Hide Table]: click to hide segment sweep list.
By front panel keys
1) Press【Sweep】in STIMULUS area and press the soft-key in soft-key menu corresponding to [Sweep Type].
2) Press the soft-key corresponding to [Segment Sweep] to select the sweep type.
3) Press the soft-key corresponding to [Segment Table on | OFF] to show segment table for edit.
4.5.2.6. Insertion and deletion of segment
The segment table can be edited only when it's in display status.
By mouse or touch screen
1) Click [Stimulus], point to [Segment Table] in Sweep submenu to show the submenu of segment table.
2) Select [Show Table] in Segment Table submenu.
3) Click [Insert Segment] in Segment Table submenu to insert a new segment before the selected segment.
4) Click [Delete Segment] in Segment Table submenu to delete all selected segments. Click [Delete All Segment] to delete all
segments.
Page 50
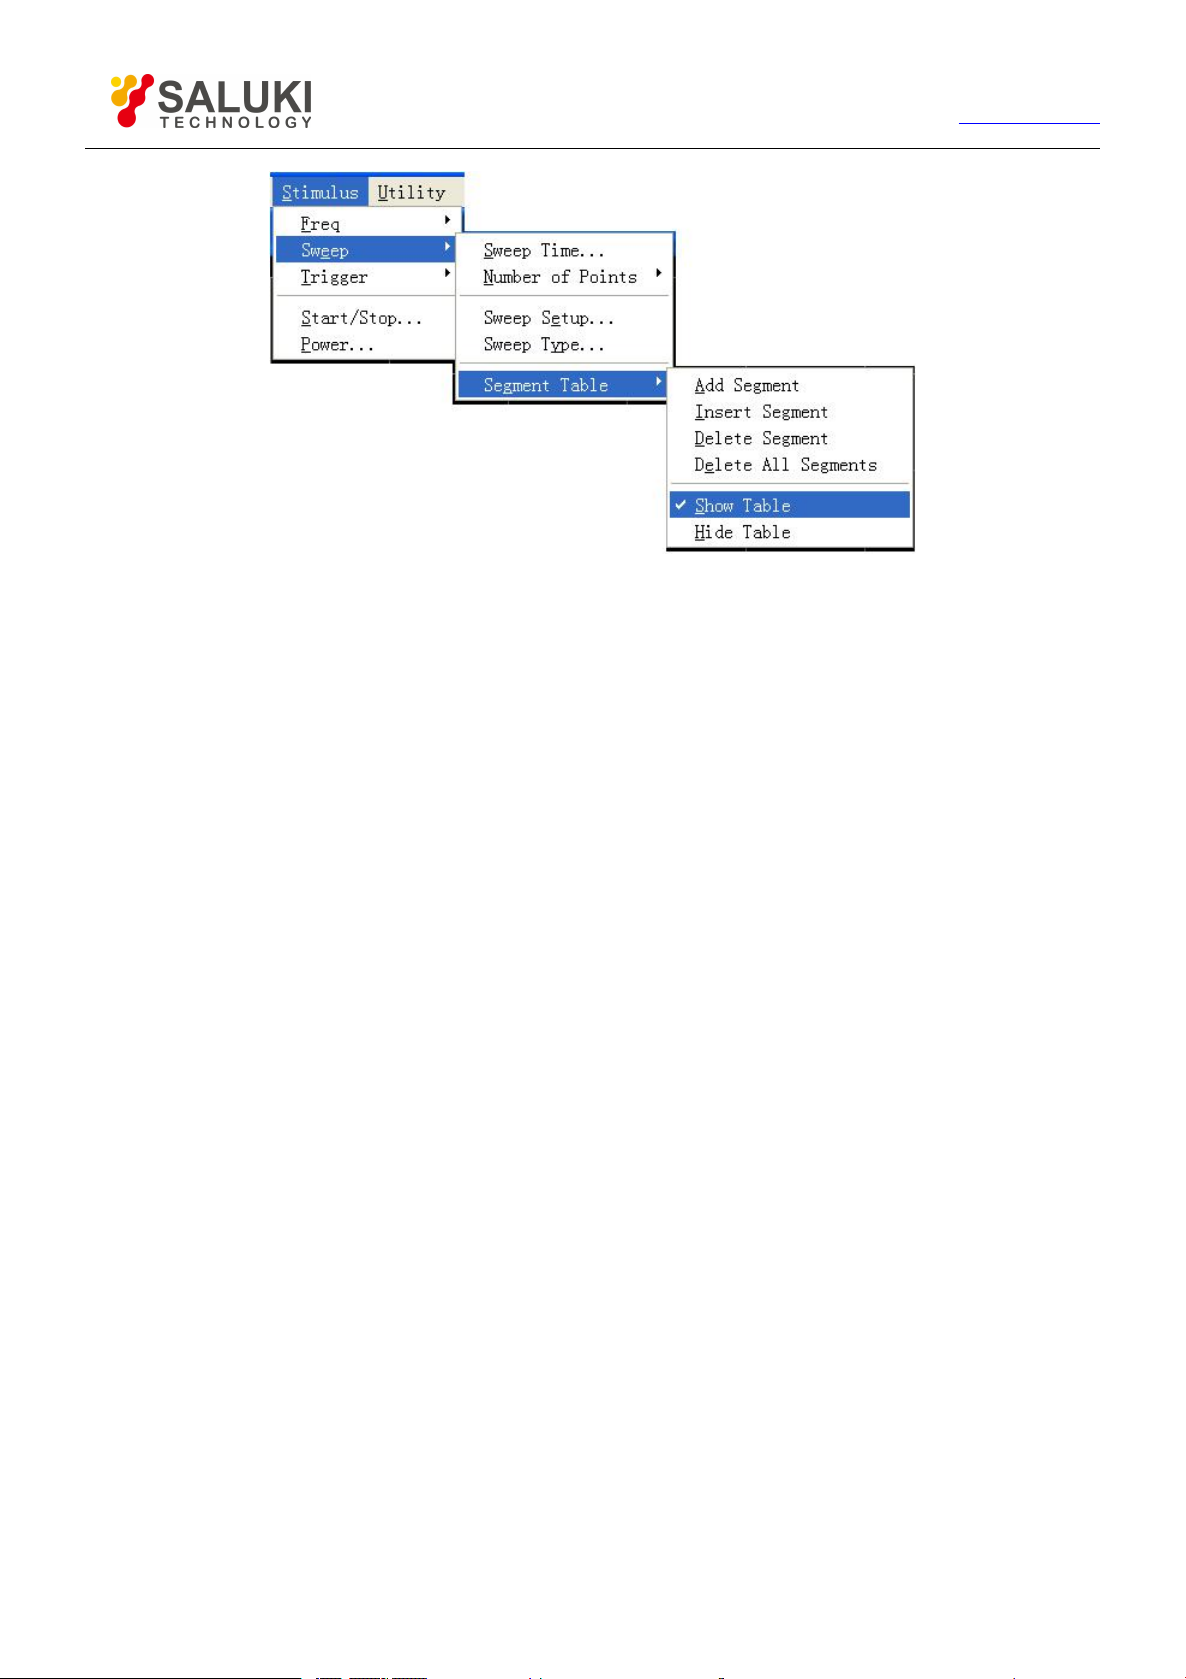
50
Fig. 4-16 Insertion and Deletion of Segment
By front panel keys
1) Press 【Sweep】in STIMULUS area to show corresponding soft-key menu.
Tel: 886.2.2175 2930 Email: [email protected]
www.salukitec.com
2) Press the soft-key corresponding to [Segment Table] menu and press the soft-key corresponding to [Segment Table on |
OFF] to show segment table.
3) Press the soft-key corresponding to [Insert Segment] menu to insert a new segment before the selected segment.
4) Press the soft-key corresponding to [Delete Segment] menu to delete all selected segments.
When the last segment of the segment table is ON, Analyzer will add automatically one segment in OFF; when the last segment of
the segment table is in Stimulus status, several segments can be added quickly by continuously pressing【↓】in ADJUST area or
turning the knob.
4.5.2.7.
Edit segment table
By mouse or touch screen
1) Double click [State] for segment, select ON or OFF to open or close segment.
2) Double click [Start] for segment and enter start frequency of the segment.
3) Double click [Stop] for segment and enter stop frequency of the segment.
4) Double click [Points] for segment and enter Sweep spot number of the segment.
5) Double click [PWR] for segment and enter power level of the segment (when Independent Power Level option is enabled).
6) Double click [IFBW] for segment and enter IF bandwidth (when Independent IF Bandwidth option is enabled).
7) Double click [Time] for segment and set Sweep time (when Independent Sweep Time option is enabled).
By front panel keys
1) Press 【↑】,【↓】 in ADJUST area or turn the knob to select the segment to be edited.
2) Press【Tab】in ADJUST area to [Status], press
【 】
in ENTRY area to enable submenu, press【↑】,【↓】or
turn the knob to select ON and press【 】to select enabled segment. When OFF is selected, the segment will be closed.
3) Press 【Tab】to [Start], press 【 】in Stimulus Input box, then enter start frequency.
4) Press 【Tab】in [Stop], press 【 】in Stimulus Input box, then enter stop frequency.
Page 51
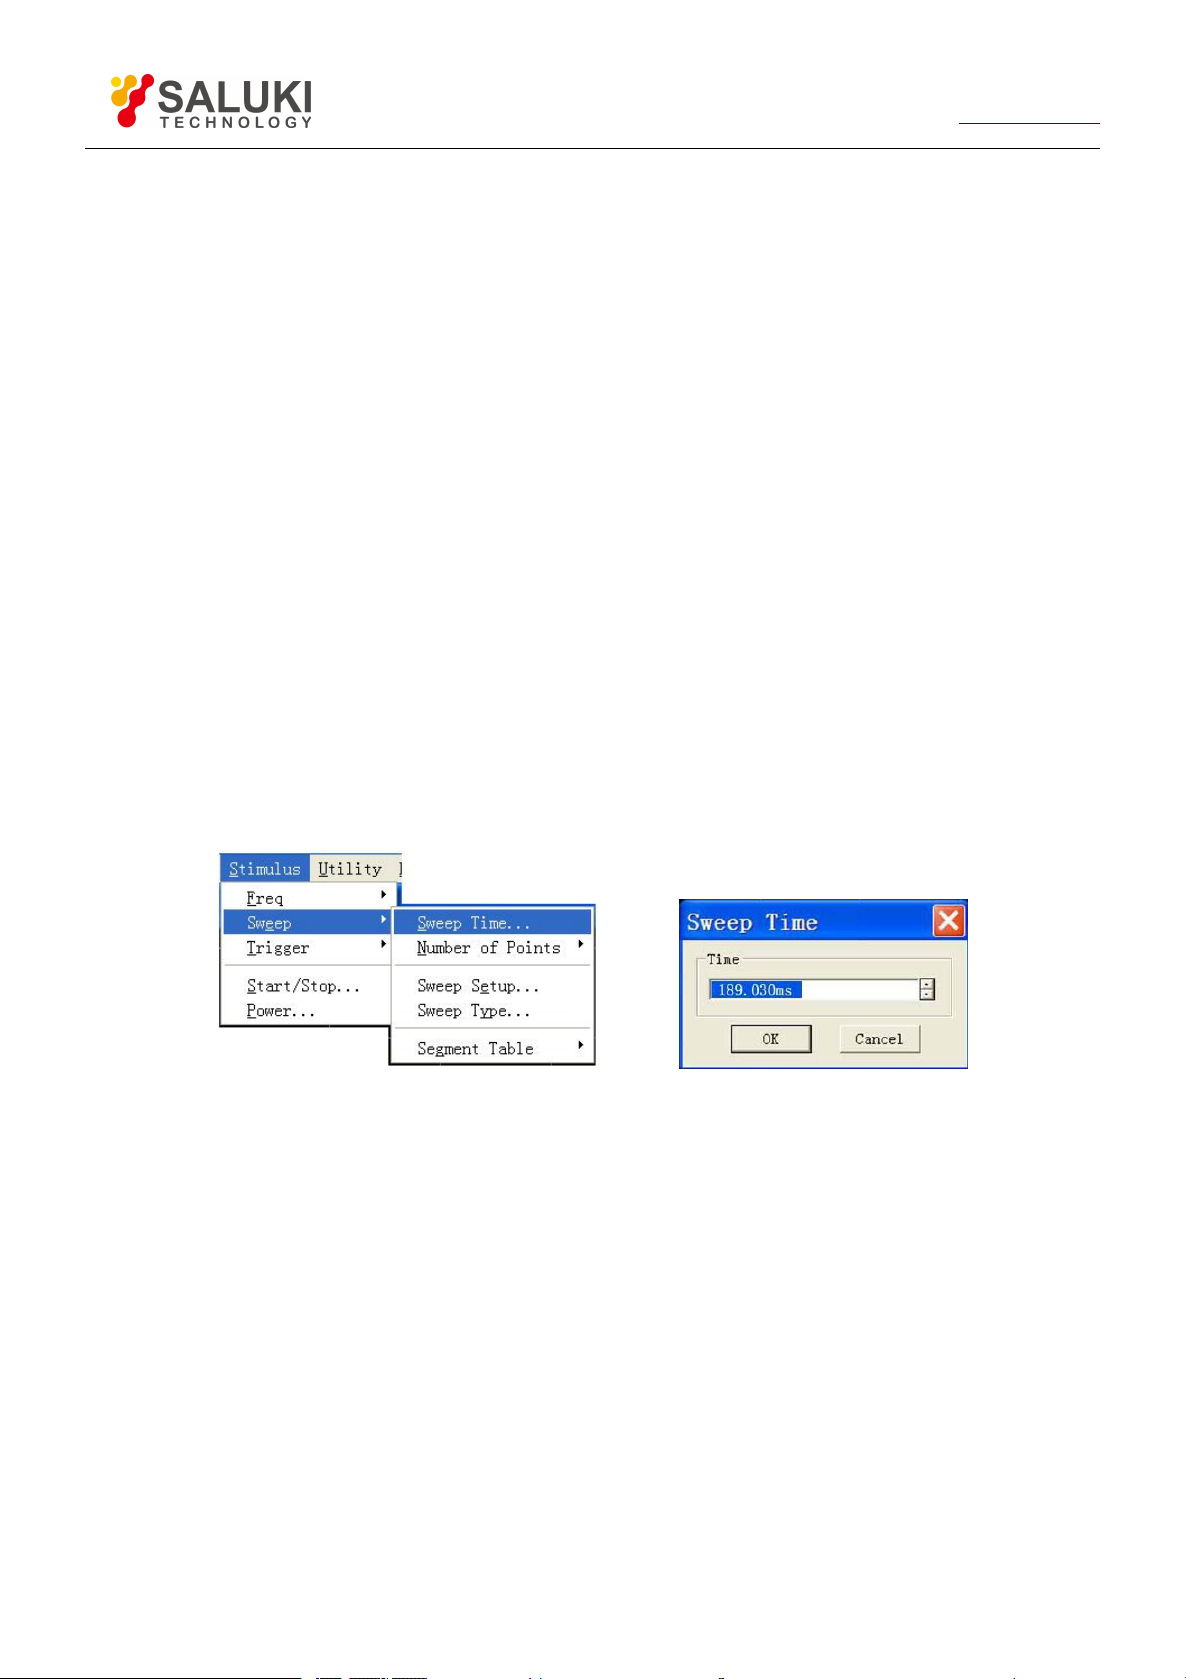
51
Tel: 886.2.2175 2930 Email: [email protected]
www.salukitec.com
5) Press 【Tab】in [Points], press 【 】in Stimulus Input box, then enter Sweep spot number.
6) Press 【Tab】in [PWR], press 【 】 in Stimulus Input box, and then enter power level (when Independent Power Level
option is enabled).
7) Press 【Tab】in [IFBW], press 【 】in Stimulus Input box, then enter IF bandwidth (when Independent IF Bandwidth
option is enabled).
8) Press【Tab】in [Time], press
is enabled).
4.5.3.
When Measure settings are completed, Analyzer will adopt the fastest Sweep time as possible, but more Sweep time may be added
to meet specific Measure needs. The maximum settable Sweep time is 86400 seconds. If Sweep time is set to be 0 second, Analyzer
will select automatically the fastest Sweep time. When Sweep time is more than or equal to 300 milliseconds, Analyzer will display a
Sweep indicator to indicate a point-to-point Measure Sweep. Sweep indicator is an upward small arrow, pointing to the point on the
Trace which just finished Measure.
4.5.3.1.
By mouse or touch screen
Sweep Time
Setting of Sweep time
1) Click [Stimulus], then click [Sweep Time...] in menu Sweep to show Sweep Time dialog box.
2) Enter Sweep time in [Sweep Time] box.
3) Click [OK] to close the dialog box.
【 】
in Stimulus Input box, then enter Sweep time (when Independent Sweep Time option
Fig. 4-17 Setting of Sweep Time
By front panel keys
1) Press 【Sweep】in STIMULUS area.
2) Press the soft-key corresponding to [Sweep Time] and enter Sweep time in Sweep time box.
4.5.3.2. Sweep Setup
By mouse or touch screen
1) Click [Stimulus], then click [Sweep Setup...] in menu Sweep to show Sweep Setup dialog box.
2) Click [Channel] to select setting channel.
3) If the default Step Sweep mode is adopted, click [Dwell Time] and set the dwell time of each measuring point; if analog
sweep mode takes priority, clear [Step Sweep].
4) If Alternate Sweep mode is to be selected, select [Alternate Sweep].
5) If external fixed amplitude is needed, select [External ALC].
Page 52
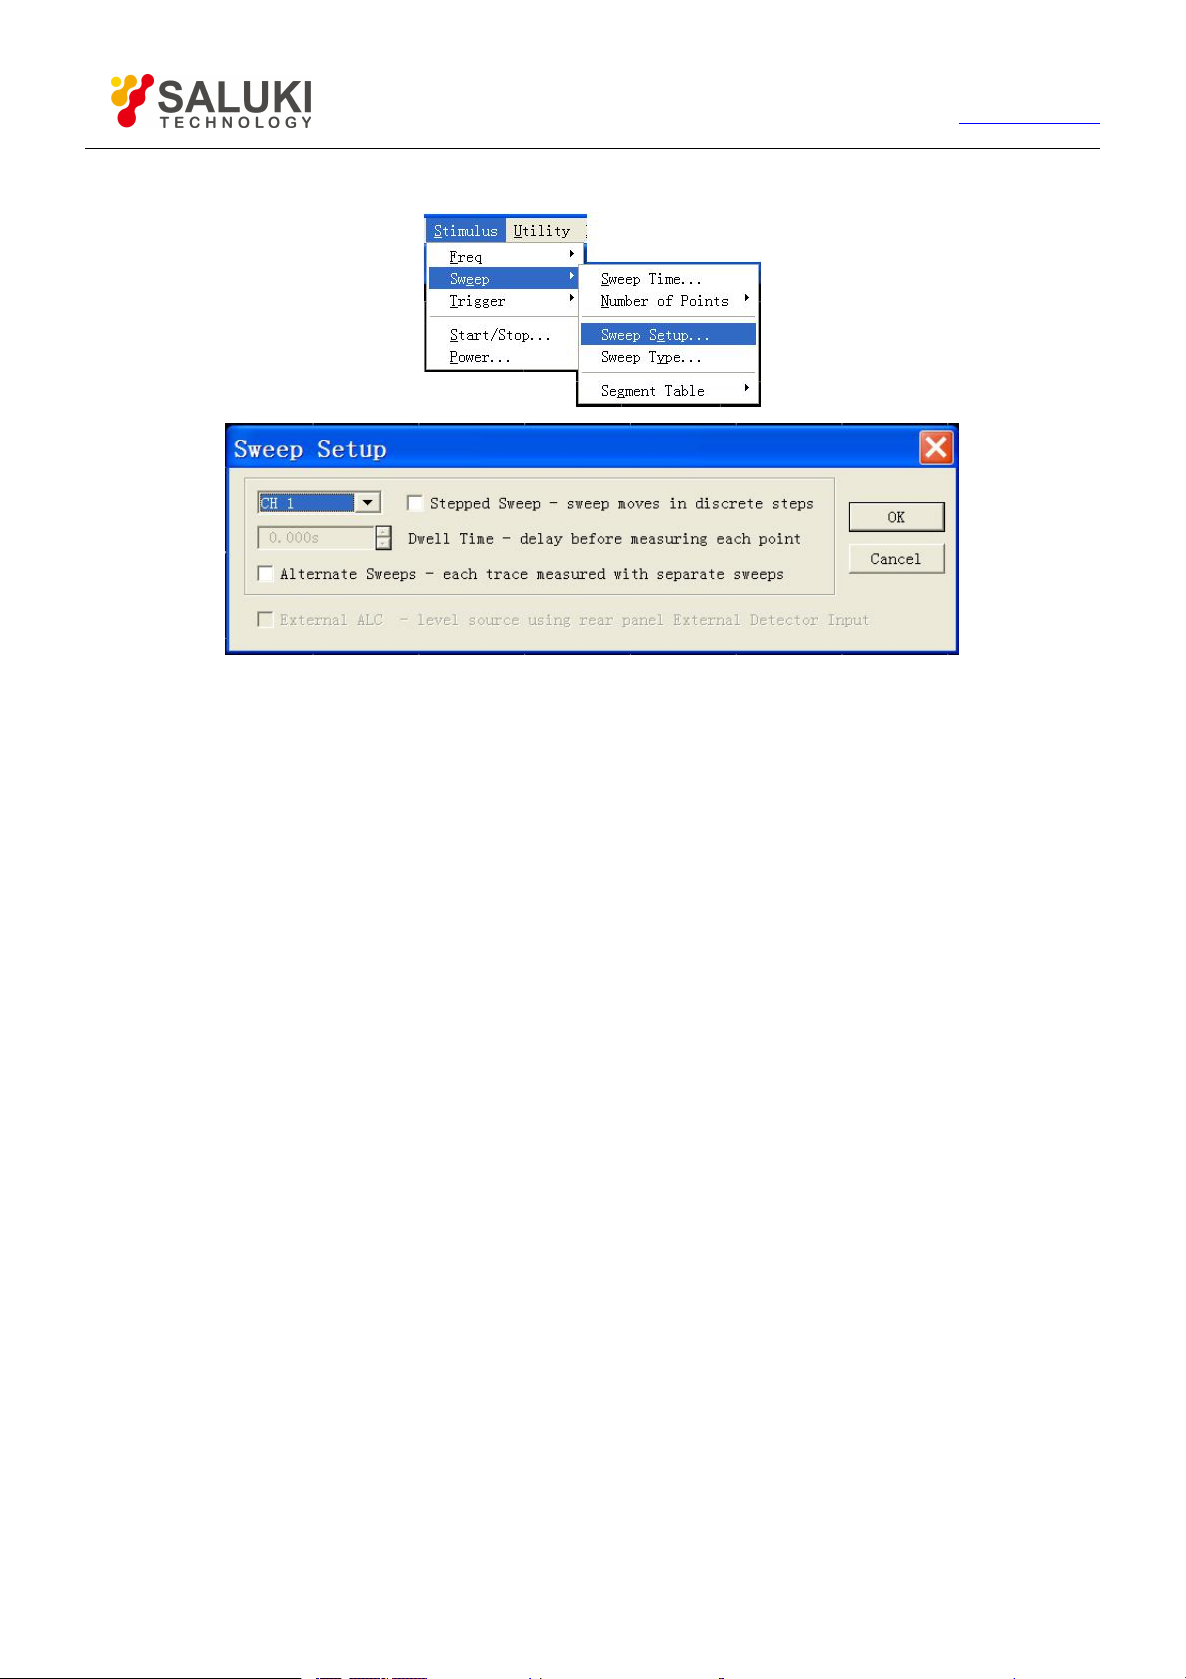
52
6) After setting, click [OK] to close the dialog box.
Tel: 886.2.2175 2930 Email: [email protected]
www.salukitec.com
Fig. 4-18 Sweep Setup
By front panel keys
1) Press 【Sweep】 key in STIMULUS area to show corresponding soft-key menu. Press the soft-key corresponding to
[Sweep Setup…] to show Sweep Setup dialog box.
2) Press【Tab】in ADJUST area to [Channel]. Press【↑】,【↓】in ADJUST area or turn the knob to select channel setting.
3) If the default Step Sweep mode is adopted, press 【Tab】 in [Dwell Time] to set dwell time of each measuring point.
4) If Alternate Sweep mode is to be selected, press 【Tab】 in [Alternate Sweep], and press 【Click】 to select the check
box.
5) If external fixed amplitude is needed, press【Tab】in [External ALC], and press【Click】to select the check box.
6) After setting, press 【OK】in ENTRY area to close the dialog box.
4.5.3.3. Sweep Setup dialog box
[Channel] box:
Select the channel adaptable to Sweep Setup.
[Step Sweep] check box
When Step Sweep mode is selected, the source will be tuned to a frequency measuring point, waiting for measuring of this frequency
point after a specified dwell time, and then it will be tuned to the next frequency point. This working mode is slower than Analog
Sweep mode, but can conduct precise Measure for devices with long electrical delay. When this check box is cleared, Analyzer may
operate either in Analog Sweep mode or Step Sweep mode, which depends on the setting of Sweep time and IF bandwidth but
preferentially selects Analog Sweep mode based on Measure settings.
[Dwell Time] input box
It will appoint the dwell time of Analyzer at each point before Measure data is obtained, which is suitable for Step Sweep working
mode only.
Page 53
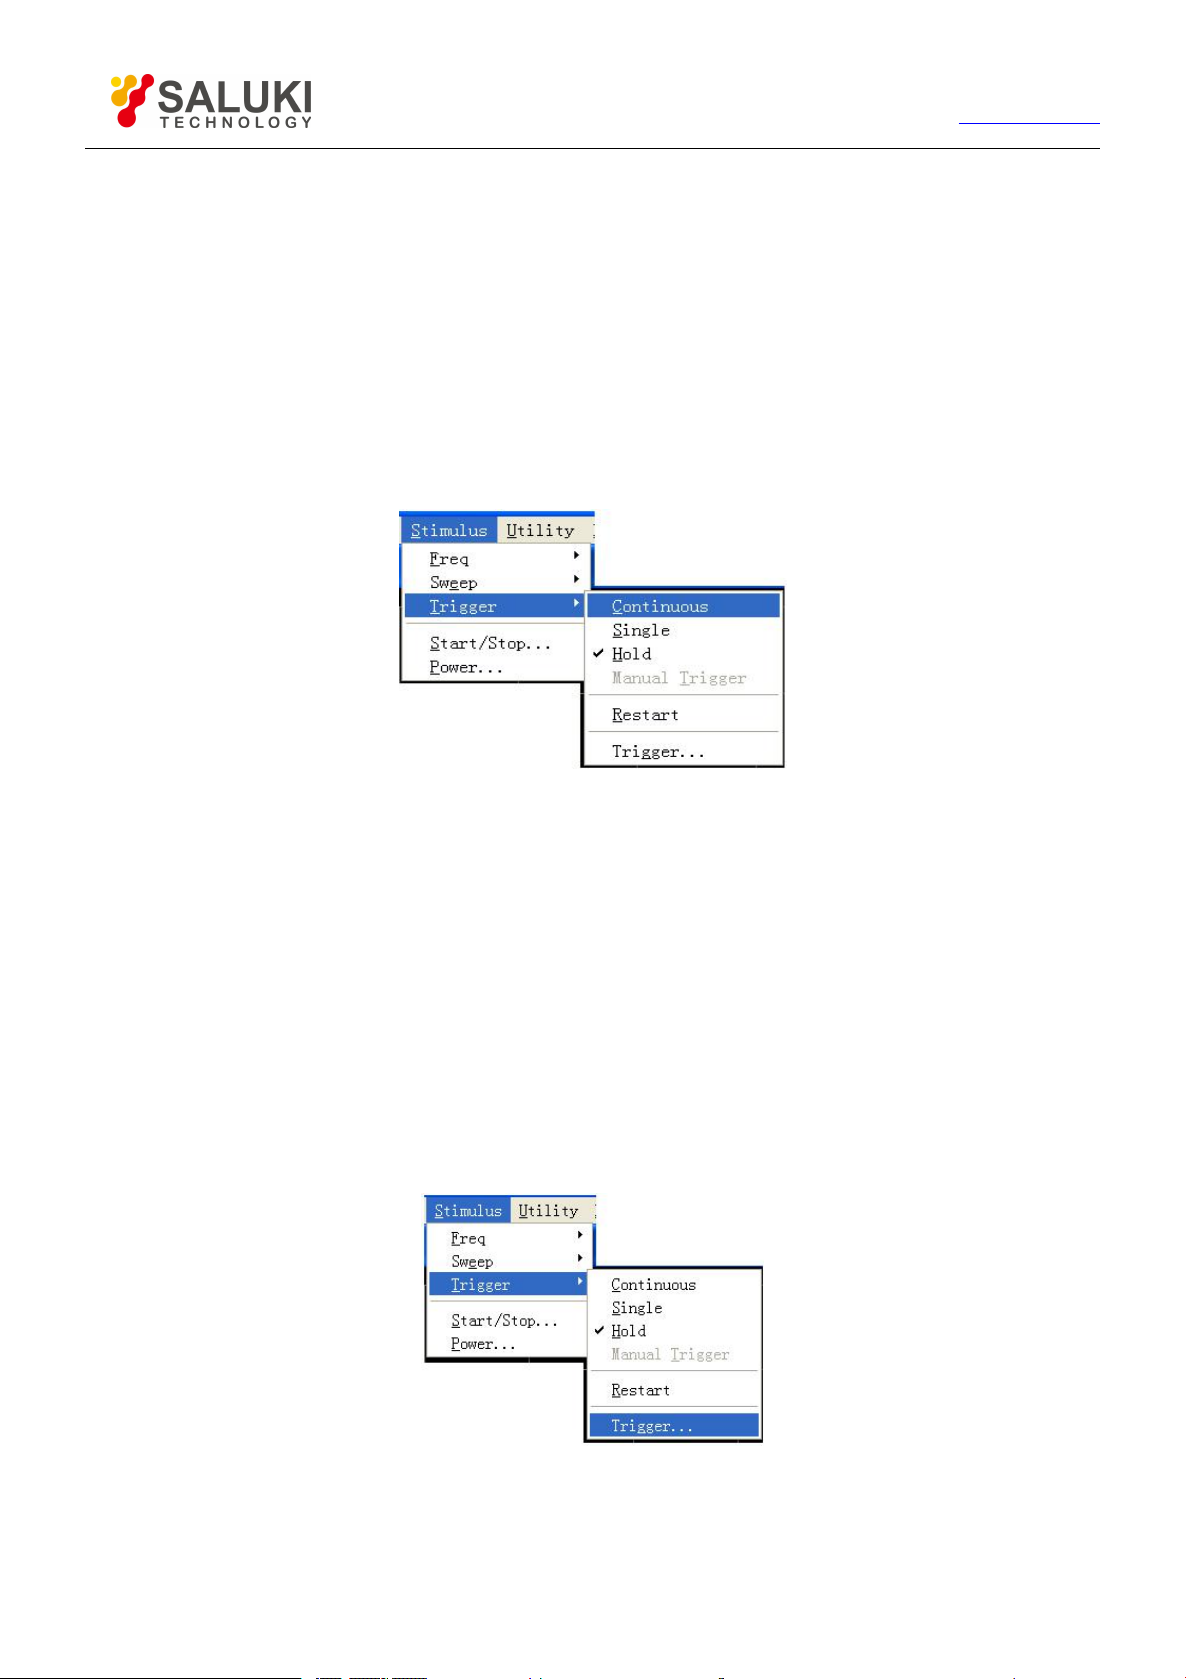
53
Tel: 886.2.2175 2930 Email: [email protected]
www.salukitec.com
4.6.Selecting Triggering Mode
Trigger signal is the signal controlling the Analyzer for Sweep Measure. Trigger settings determines the Sweep mode of Analyzer and
when the sweep stops and returns to hold mode. The Analyzer is quite flexible in trigger function settings.
4.6.1.
Simple trigger settings can set the trigger mode for the current Stimulus channel only.
By mouse or touch screen
By front panel keys
Simple Trigger Settings
1) Click [Stimulus] and point to [Trigger] in Stimulus menu to show the submenu of Trigger.
2) Select the trigger mode needed in the submenu.
Fig. 4-19 Simple Trigger Mode
1) Press【Trigger】in STIMULUS area to show corresponding soft-key menu.
2) Press the corresponding soft-key to select the trigger mode needed.
4.6.2.
4.6.2.1.
Detailed Trigger Settings
By mouse or touch screen
1) Click [Stimulus], point to Trigger in Stimulus menu and click [Trigger...] in the submenu of Trigger to show Trigger dialog
box.
2) Complete trigger settings in the dialog box.
3) After setting, click [OK] to close the dialog box.
Fig. 4-20 Submenu of Trigger
Page 54
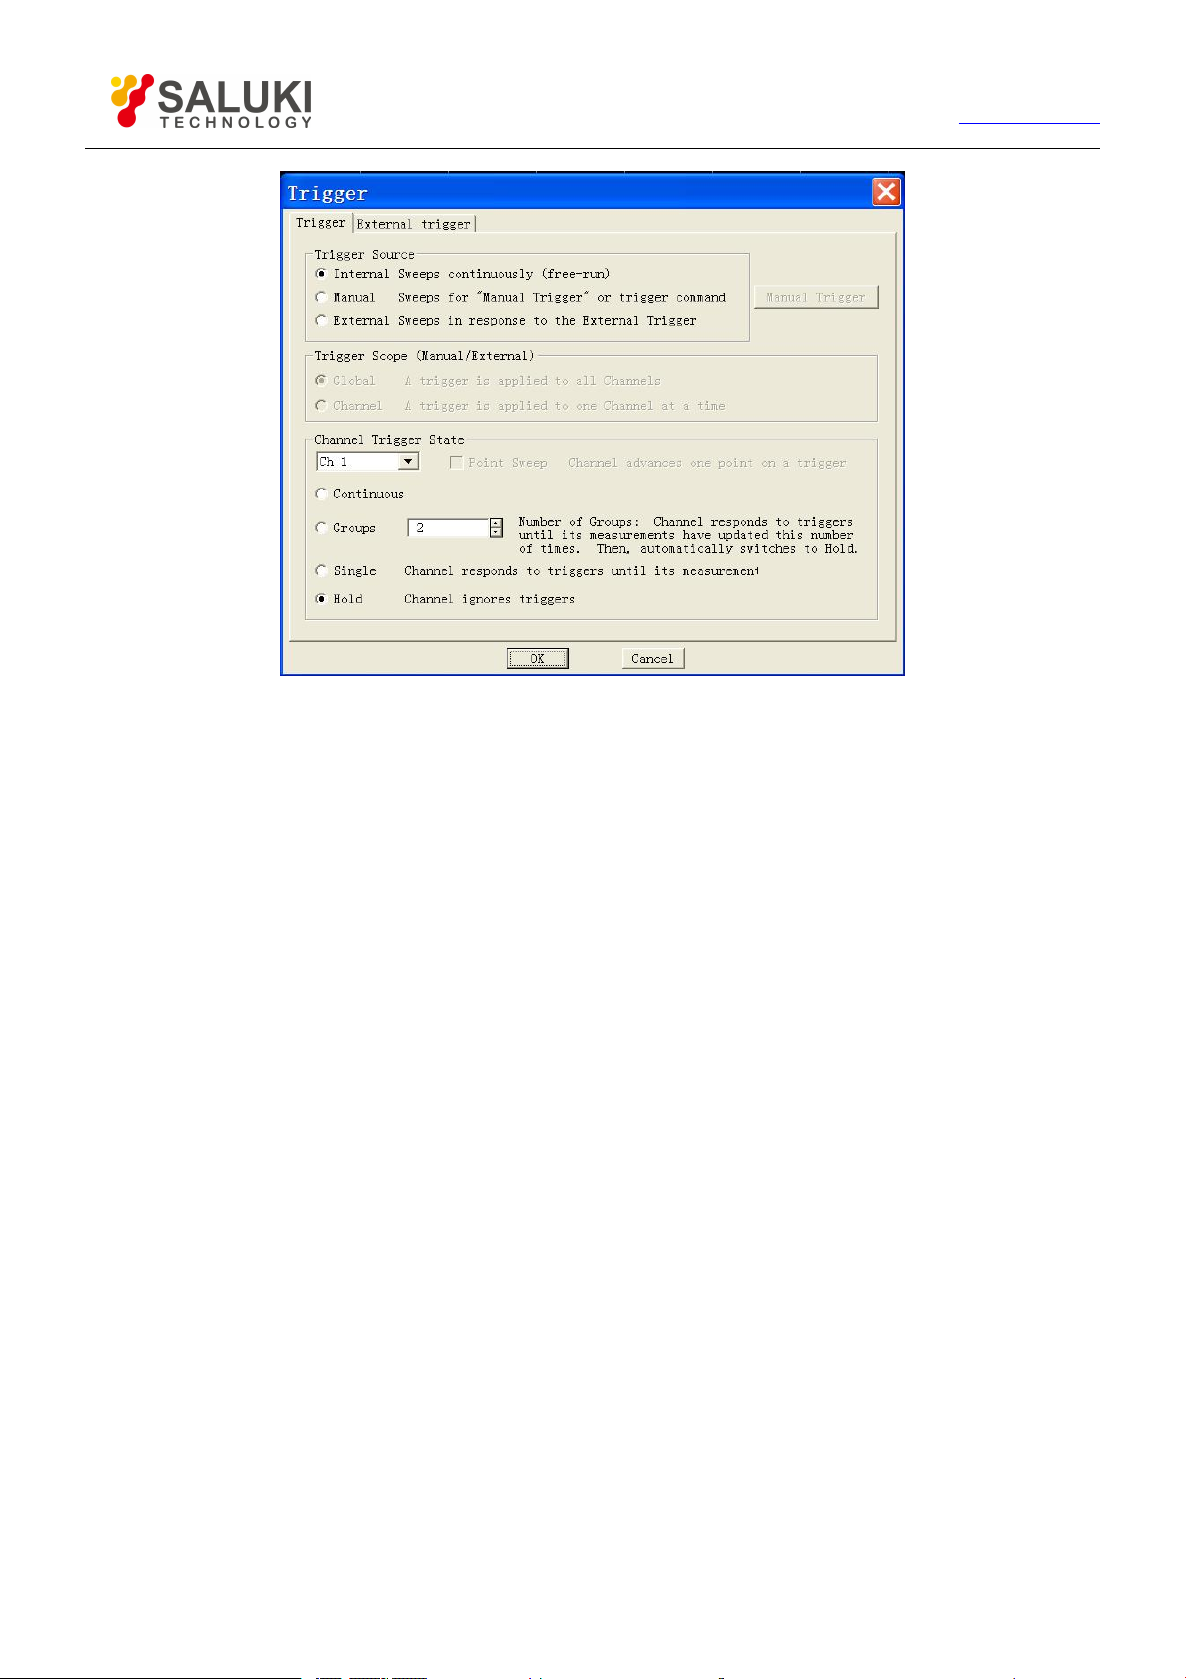
54
Tel: 886.2.2175 2930 Email: [email protected]
www.salukitec.com
Fig. 4-21 Trigger Dialog Box
4.6.2.2. By front panel keys
1) Press 【Trigger】 Key in STIMULUS area to show corresponding soft-key menu.
2) Press the soft-key corresponding to [Trigger…] to show Trigger dialog box.
3) Complete trigger settings in the dialog box.
4) After setting, press 【OK】 key in ENTRY area to close the dialog box.
4.6.2.3. Trigger dialog box
Trigger Source
Trigger source settings determine where the trigger signal is from. Effective trigger signal will yield only when the Analyzer is not
Sweep. The Analyzer may select 3 types of trigger source: internal, manual and external. Once the trigger source is set, the Analyzer
will apply this trigger source to all channels.
[Internal] (default)
The Analyzer will automatically control the generation of trigger signal.
The Analyzer will generate a trigger signal immediately after a Measure.
[Manual]
Manual trigger signal may be created by the following averages:
Click [Manual Trigger] in Trigger dialog box.
Press the Trigger key in front panel and press the corresponding soft-key to [Manual Trigger] in soft-key toolbar.
Call program control command.
[External]
Trigger signal is input from external trigger input connector on the rear panel.
The signal is TTL level.
Page 55

55
Tel: 886.2.2175 2930 Email: [email protected]
www.salukitec.com
Level trigger, active level (high active or low active) is set via External Trigger dialog box.
Pulse width shall be at least 1us but not longer than Sweep time (several triggers may be aroused when pulse width
is longer than Sweep time).
Trigger Scope zone
Trigger range settings determine what Measure channels of Analyzer will receive trigger signal. There are two settings for trigger
range: All and Channel:
[All]
This is the default setting for Analyzer. All the other channels will receive trigger signal except for the channel in Hold mode.
[Channel]
Only the next channel not in Hold mode will receive trigger signal. When Measure is completed for the current channel, Analyzer will
select automatically the next channel to receive trigger signal. All the other channels will be selected in order except for the channel
in Hold mode. This setting has no evident influence on Measure unless Trigger Source is set to be manual status. When Channel
setting is selected, spot sweep function will be available.
Channel Trigger State zone
Trigger settings determine how many trigger signals will be received by one channel. There are four channel trigger status:
[Continuous]
The channel will receive unlimited trigger signals and continue to sweep.
[Group]
The channel will receive the trigger signal with the number specified in [Group] input box to conduct Sweep for specified times and
then enter into Hold mode.
[Single]
The channel will receive one trigger signal to conduct one Sweep, and then enter into Hold mode.
[Hold]
The channel will not receive trigger signal and stop Sweep.
[Channel Selection]
Select the channel adaptable to trigger settings.
[Spot Sweep]
This trigger mode can be selected only when trigger source is manual or external and trigger range is channel. Under spot sweep
mode, when the channel receives trigger signal, the next data point in the Sweep will be measured. The channel will receive trigger
signal until all Measures in the channel are complete, and then it will trigger the next channel not in Hold mode.
4.6.2.4. External trigger dialog box
Page 56
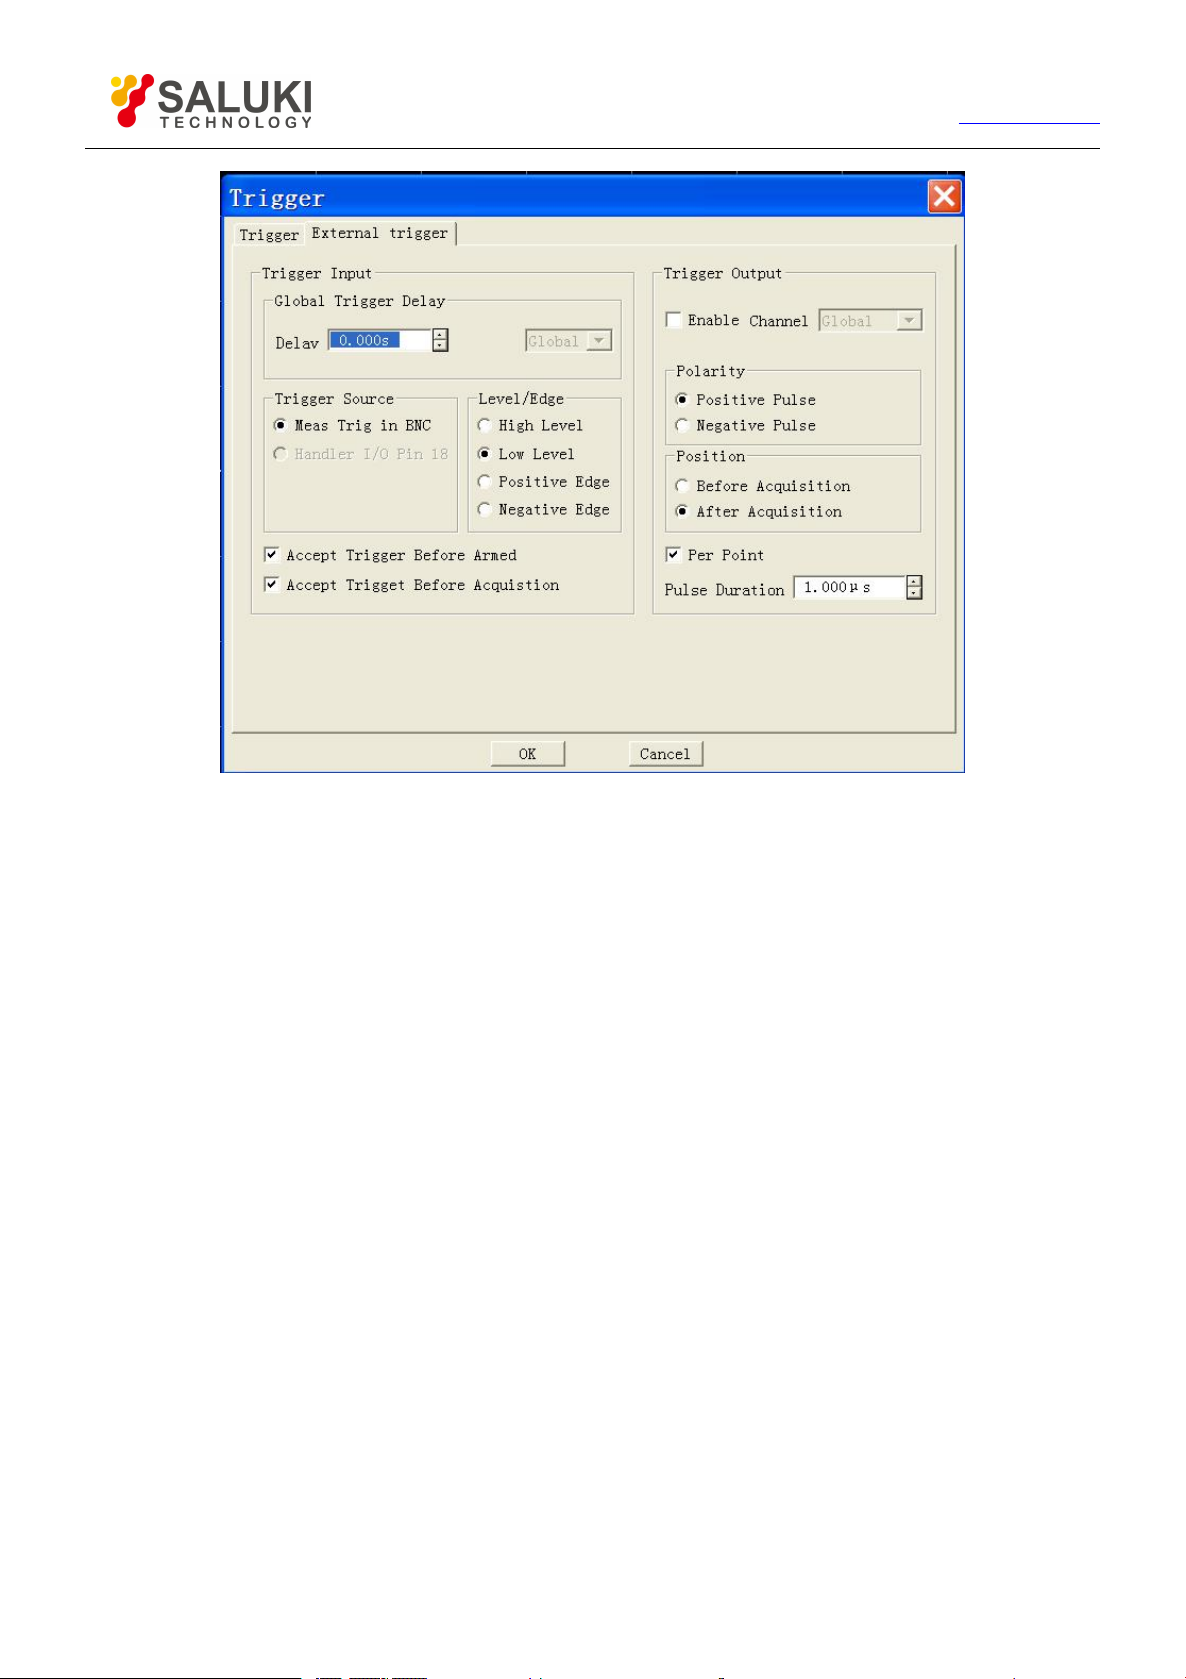
56
Tel: 886.2.2175 2930 Email: [email protected]
www.salukitec.com
Fig. 4-22 External Trigger Dialog Box
Trigger input zone
Global trigger delay zone
When external trigger signals are received, the Analyzer will start Sweep after the delay time as set in Time Delay dialog box.
Trigger source zone
It can be set that through which rear panel connector the Analyzer will receive trigger signals.
Level/edge zone
High level
When the Analyzer is ready for triggering, it will trigger at the high level of the selected TTL input signal.
Low level
When the Analyzer is ready for triggering, it will trigger at the low level of the selected TTL input signal.
Positive edge
When the Analyzer is ready for triggering, it will trigger at the next rising edge of the received signal.
Negative edge
When the Analyzer is ready for triggering, it will trigger at the next falling edge of the received signal.
Trigger output zone
Enable channel
When selected, it may trigger output.
Polarity zone
Set the polarity of trigger output.
Page 57
57
Tel: 886.2.2175 2930 Email: [email protected]
www.salukitec.com
Position zone
Set where the trigger output may occur and the width of trigger pulse.
Selecting Data Format and Scale
4.7.
Data format refers to the way the Analyzer graphically displays Measure data. The data format most suitable for understanding the
property of measured piece shall be selected during the Measure. This section introduces 9 data formats and how to set the scale so
as to better display measuring information.
4.7.1. Data Format
4.7.1.1. Rectilinear coordinate format
7 among the 9 data formats display measuring data information in rectilinear coordinate, which is also called Descartes format, X/Y
format or linear grid format. This is most suitable for displaying frequency response information of the measured piece. Rectilinear
coordinate will display the following information:
By default, X axis displays stimulus value in linear scale (frequency, power or time).
Y axis displays the corresponding response value at different stimulus values.
Fig. 4-23 Rectilinear Coordinate Format
The 7 data formats displayed in rectilinear coordinate are:
Log-magnitude format
Display magnitude information (without phase information).
Y axis unit: the unit is dB when ratio is measured and it is dBm when non-ratio power is measured.
Suitable typical Measure: return loss, insertion loss and gain.
Phase format
Display phase information (without magnitude information).
Y axis unit: phase (degree).
Suitable typical Measure: linear phase deviation.
Group delay format
Display the transfer time of signal passing through the measured piece.
Page 58

58
Tel: 886.2.2175 2930 Email: [email protected]
Y axis unit: time (second).
Suitable typical Measure: group delay.
Linear magnitude format
Only positive value will be displayed.
Y axis: no unit (U) when ratio is measured and the unit is watt (W) when non-ratio power is measured.
Suitable typical Measure: reflectance and transfer factor (magnitude value), time domain transformation.
SWR format
It display reflection Measure data through the formula:(1+ρ)/(1-ρ), in which ρ is the reflectance.
It is effective only reflection Measure is conducted.
Y axis: no unit.
Suitable typical Measure: standing wave ratio format.
Real format
www.salukitec.com
Display the real part of measuring complex data.
Similar with linear magnitude format, but may display positive and negative value.
Y axis: no unit.
Suitable typical Measure: time domain Measure, auxiliary input voltage signal Measure for maintenance purpose.
Imaginary format
Display the imaginary part of measuring complex data only.
Y axis: no unit.
Suitable typical Measure: impedance Measure when matching network is designed.
4.7.1.2.
Polar coordinate format
Polar coordinate format includes magnitude and phase information, and the vector value is read by the following averages:
The magnitude for any point is determined by the displacement from this point to the center point (or zero point). By default, the
magnitude is in linear scale and the outer circle is set to be at the ratio 1.
The phase value of any point is determined by its included angle to X axis.
As there is no frequency information, frequency information is read through marker. By default, the marker format is
real/imaginary part. The other formats may be selected through the Marker dialog box in Marker menu.
Page 59
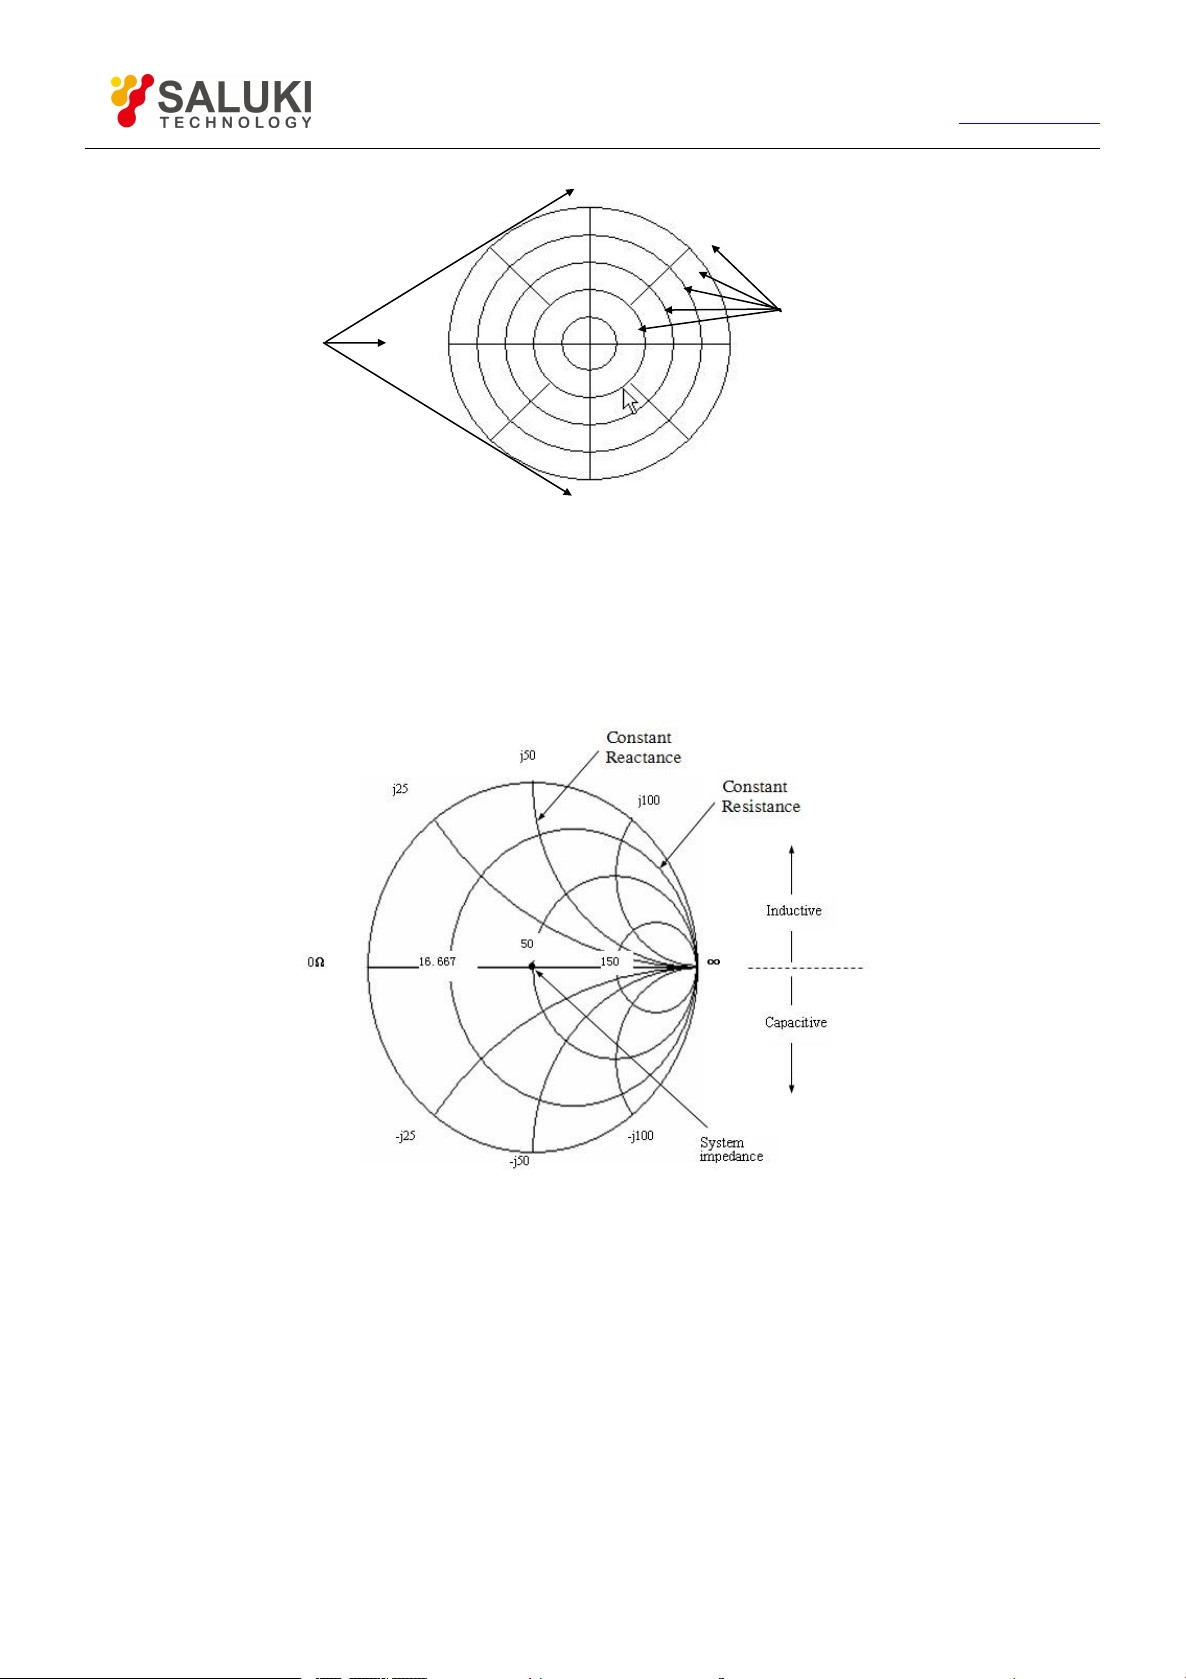
59
Tel: 886.2.2175 2930 Email: [email protected]
Phase Angle
Magnitude
0
o
90
o
±180
o
0.2
0.4
0.6
0.8
1
-90
o
www.salukitec.com
Fig. 4-24 Polar Coordinate Format
4.7.1.3. Smith Chart format
Smith Chart is a tool for mapping the reflection Measure data of the measured piece to impedance. Each point on the chart
represents one complex impedance made up of real resistance (R) and virtual reactance (±jX). The resistance value, reactance
value and reactance equivalent capacitance or inductance of the measured piece may be read through the marker.
Fig. 4-25 Smith Chart Format
The central horizontal axis of Smith Chart represents pure resistance, and the center point of horizontal axis represents system
impedance; the far left resistance is zero which represents short circuit; the far right resistance of horizontal axis is infinite which
represents enabled circuit.
On the chart, the points on the circle intersecting with horizontal axis have the same resistance value.
On the chart, the points on the circle (or arc) tangent with horizontal axis have the same resistance value.
On the chart, the reactance of the upper part is positive, therefore it's inductive zone; the reactance of the lower part is negative,
therefore it’s capacitive zone.
4.7.2.
Setting of Data Format
By mouse or touch screen
Page 60
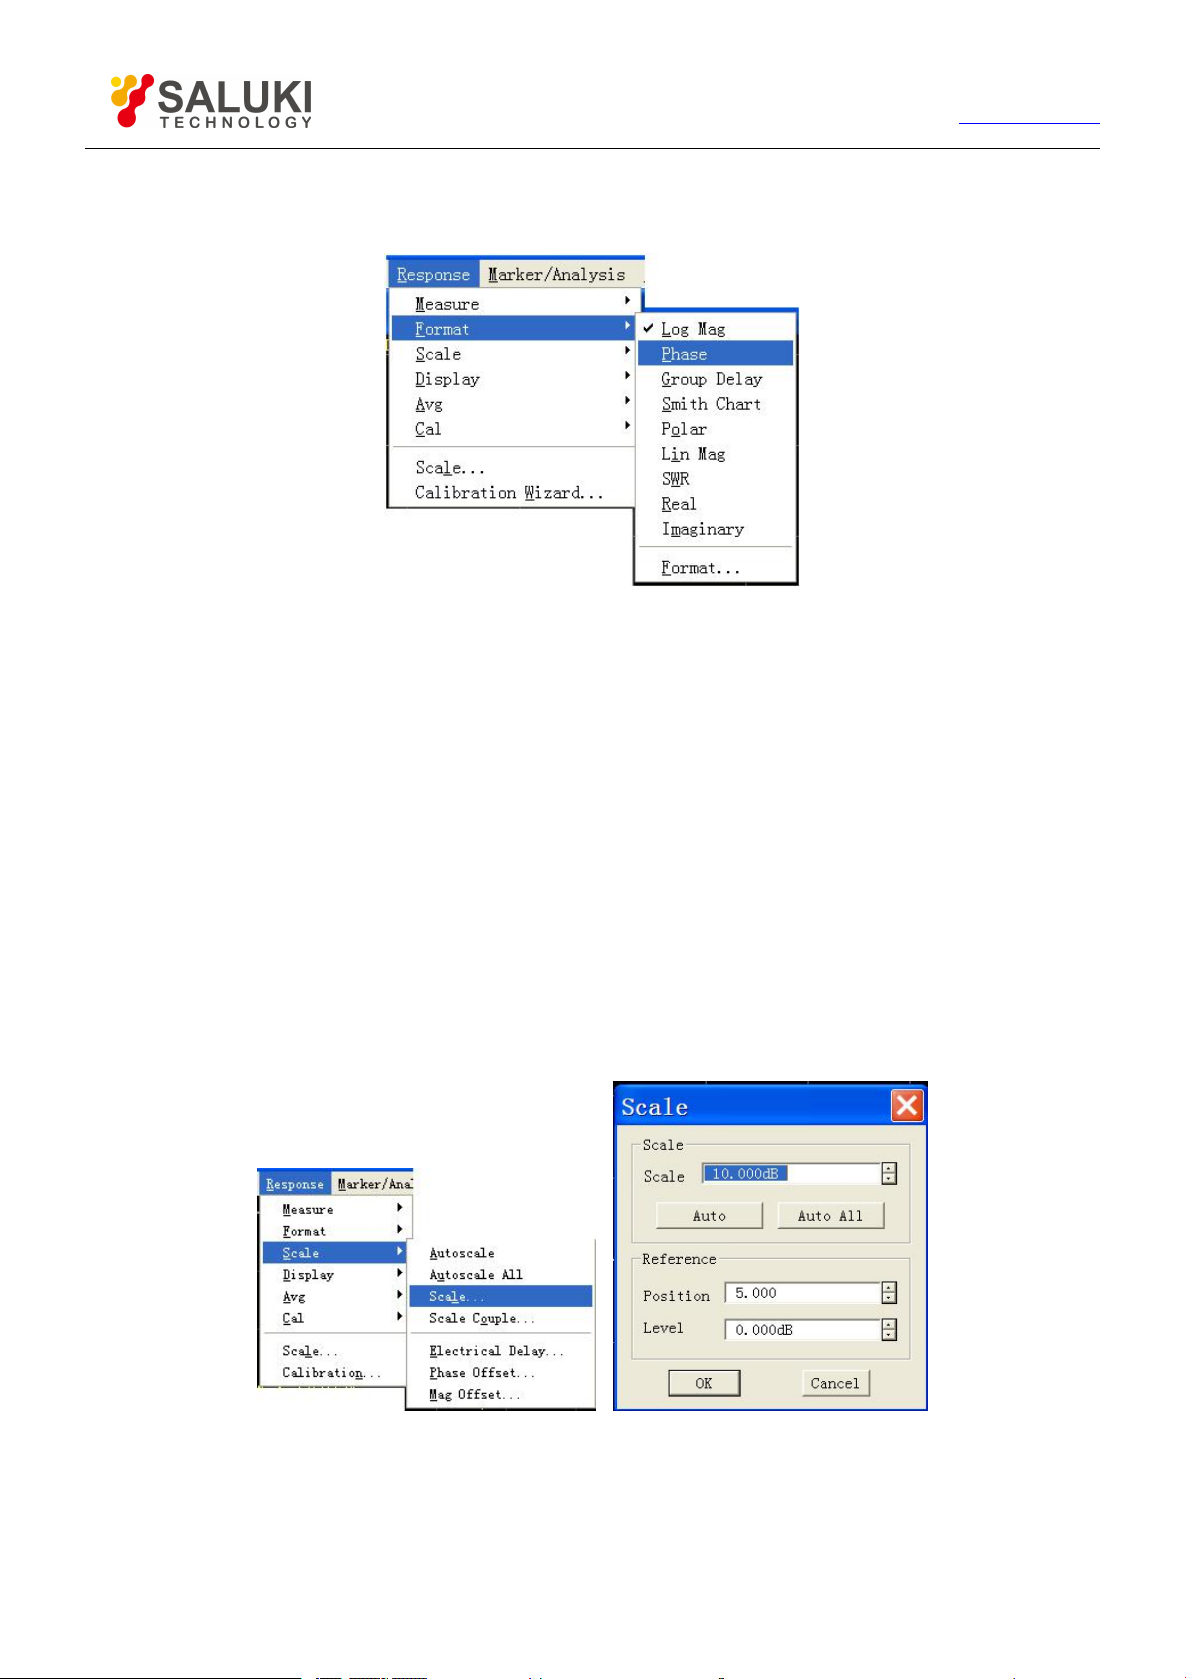
60
Tel: 886.2.2175 2930 Email: [email protected]
1) Click [Response] and point to [Format] in Response menu to show the submenu of Format.
2) Select the format needed in the submenu.
Fig. 4-26 Data Format Settings
By front panel keys
www.salukitec.com
1) Press 【Format】 key in RESPONSE area to show corresponding soft-key toolbar.
2) Press the corresponding soft-key to select the format needed.
4.7.3. Scale
Scale is used to set the scale of the vertical part of grid shown. In Polar coordinate format or Smith Chart format, it is used to set the
full scale of the outer circle. The scale and format settings determine the display mode of measuring data on the screen. In
Logarithmic format, the scale setting range is: 0.001dB/grid~500dB/grid.
4.7.3.1.
1) Click [Response], point to [Scale] in Response menu to show submenu. Click [Scale...] to show Scale dialog box.
2) Click the corresponding input zone or button to set suitable scale, reference position and reference value.
3) After setting, click [OK] button to close the dialog box.
By mouse or touch screen
Fig. 4-27 Scale Settings
4.7.3.2. By front panel keys
1) Press【Scale】in RESPONSE area to show corresponding soft-key toolbar.
2) Press the soft-key corresponding to [Autoscale ] and Analyzer will set automatically suitable scale and reference level.
Page 61

61
Tel: 886.2.2175 2930 Email: [email protected]
www.salukitec.com
3) Press the soft-key corresponding to [Scale] and set suitable scale in Scale Per division.
4) Press the soft-key corresponding to [Reference Level] and set reference level in Reference Level.
5) Press the soft-key corresponding to [Reference Position] and set suitable reference position in Reference Position.
4.7.3.3. Scale settings dialog box
Scale zone
[Scale]
Set the scale.
[Auto Scale]
Click [Auto Scale] button, the Analyzer will select automatically vertical scale to better show the Active Trace in the vertical grid of the
screen. The stimulus value is not influenced, but the scale and reference value will be changed.
The Analyzer will select suitable scaleality factor to show the data in 80% zone of the screen.
If the reference position is at the center of the screen, the reference value will select the center value of the Trace on
the screen.
[Auto All]
Click [All Auto Scale] button, the Analyzer will set suitable scale for all Traces in the window to better show them in the vertical grid of
the window.
Reference setting zone
[Position]
Reference position refers to the position of the reference line in rectangular chart. In the chart, the position of the line at the bottom is
0, the position of the line at the top is 10 and the default value at reference position is 5.
[Level]
Reference value refers to the value of reference line in rectangular coordinates format and the value of outer circle in polar
coordinate and Smith Chart format. Its setting range in log-magnitude format is -500dB~+500dB.
4.8.Observing Multi-Trace and Enabling Multichannel
4.8.1. Measure Settings for Pre-Configuration
The pre-configuration of Analyzer provides a most convenient way to conduct Measure for multi-Trace, multichannel and
multi-window. The Analyzer provides for four Measure settings for pre-configuration, each of which, when selected, shall close the
current Trace and window and create new Trace and window. The arrangement for the window of the four pre-configurations is as
follows:
Page 62
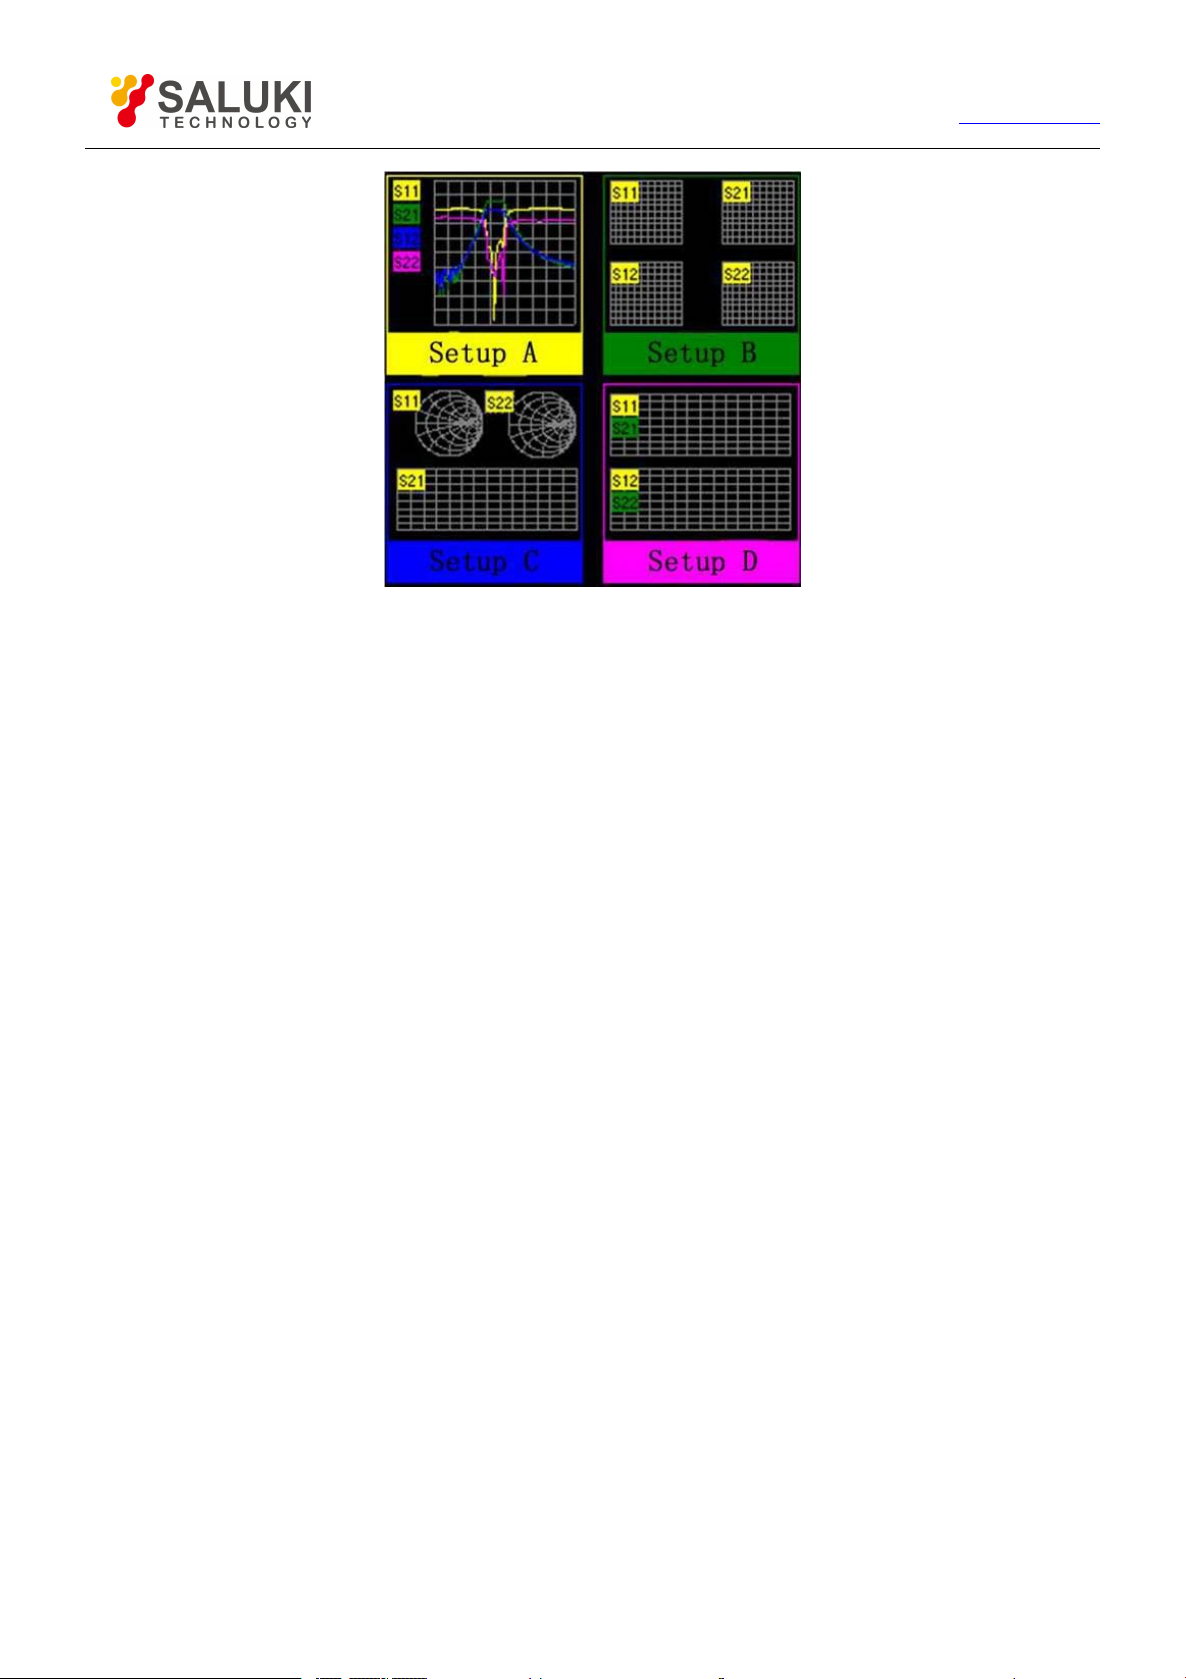
62
Setup A
Tel: 886.2.2175 2930 Email: [email protected]
www.salukitec.com
Fig. 4-28 Arrangement for Pre-Configuration Window
Setting A will create four Traces in window 1: S11, S21, S12 and S22, log-magnitude format and channel 1 setting.
Setup B
Setting B will create four Traces in four windows, log-magnitude format, and channel 1 setting.S11 displays in window 1, S21 displays
in window 2, S12 displays in window 3 and S2displays in window 4.
Setup C
Setting C will create three Traces in three windows and channel 1 setting. S11, Smith Chart format displays in window 1; S22, Smith
Chart format displays in window 2; and S21, log-magnitude format displays in window 3.
Setup D
Setting D will create four Traces in two windows, two channel settings and log-magnitude format.S11 and S21 display in window 1,
channel 1 setting; S12 and S22 display in window 2, channel 2 setting.
4.8.1.1. Pre-Configuration Measure Settings
By mouse or touch screen
1) Click [Response], point to [Display] in Response menu and select [Meas Setups] in the submenu.
2) Select the pre-configuration Measure needed in the pop-up dialog box.
Page 63
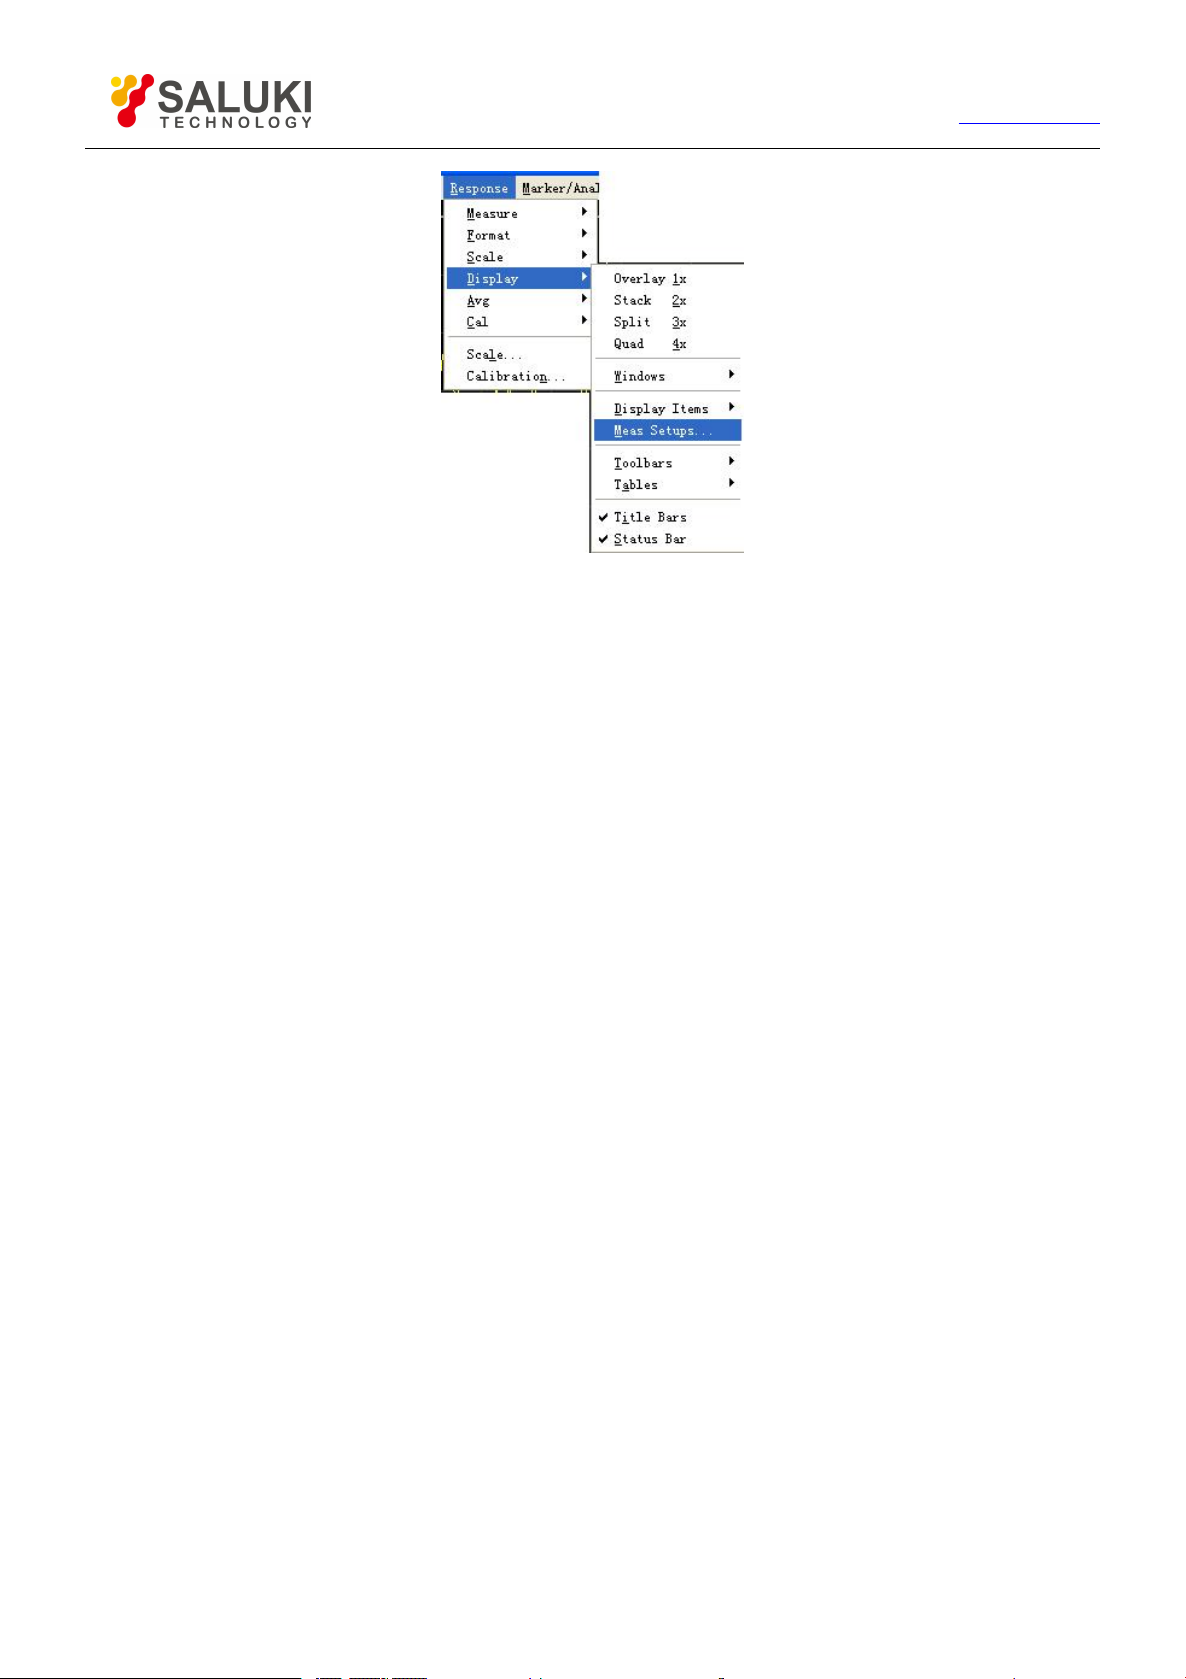
63
Fig. 4-29 Pre-Configuration Meas Setups
By front panel keys
1) Press 【Display】 key in RESPONSE area to show corresponding soft-key toolbar.
Tel: 886.2.2175 2930 Email: [email protected]
www.salukitec.com
2) Press [Meas Setups…] and press the corresponding soft-key to select pre-configuration Measure.
4.8.2. Window Arrangement
The Analyzer provides several methods to adjust window display:
Move the window and adjust the window of the Analyzer with mouse.
Arrange the window of the Analyzer with [Tile], [Cascade], [Minimize] and [Maximize] menu item.
Click [Display] in Response menu and select four window arrangements.
Adjust or hide the display of Analyzer window by use of [Minimize], [Maximize/Restore Down] and [Close].
Press 【Display】on Response keypad on front panel to show corresponding soft-key toolbar. Press corresponding soft-key to
[Window], select the window to be Stimulus, and press the soft-key corresponding to [More...] to set window display.
The [Display] menu item in Response menu of Analyzer provides four window arrangements, which can allocate the existing Traces
to different windows according to certain arithmetic. The said window arrangement modes include:
Overlay 1×
For this type of arrangement, all Traces overlaying by each other can be displayed in one window.
Stack 2×
For this type of arrangement, all Traces can be displayed in two windows which are vertically stacked.
Split 3×
For this type of arrangement, all Traces can be displayed in three windows, two of which are at the top and one at the bottom.
Quad 4×
For this type of arrangement, all Traces can be displayed in four windows, each of which takes up 1/4 of the screen.
4.8.2.1. Window arrangement settings
By mouse or touch screen
1) Click [Response] and point to [Display] in Response menu to show the submenu.
Page 64
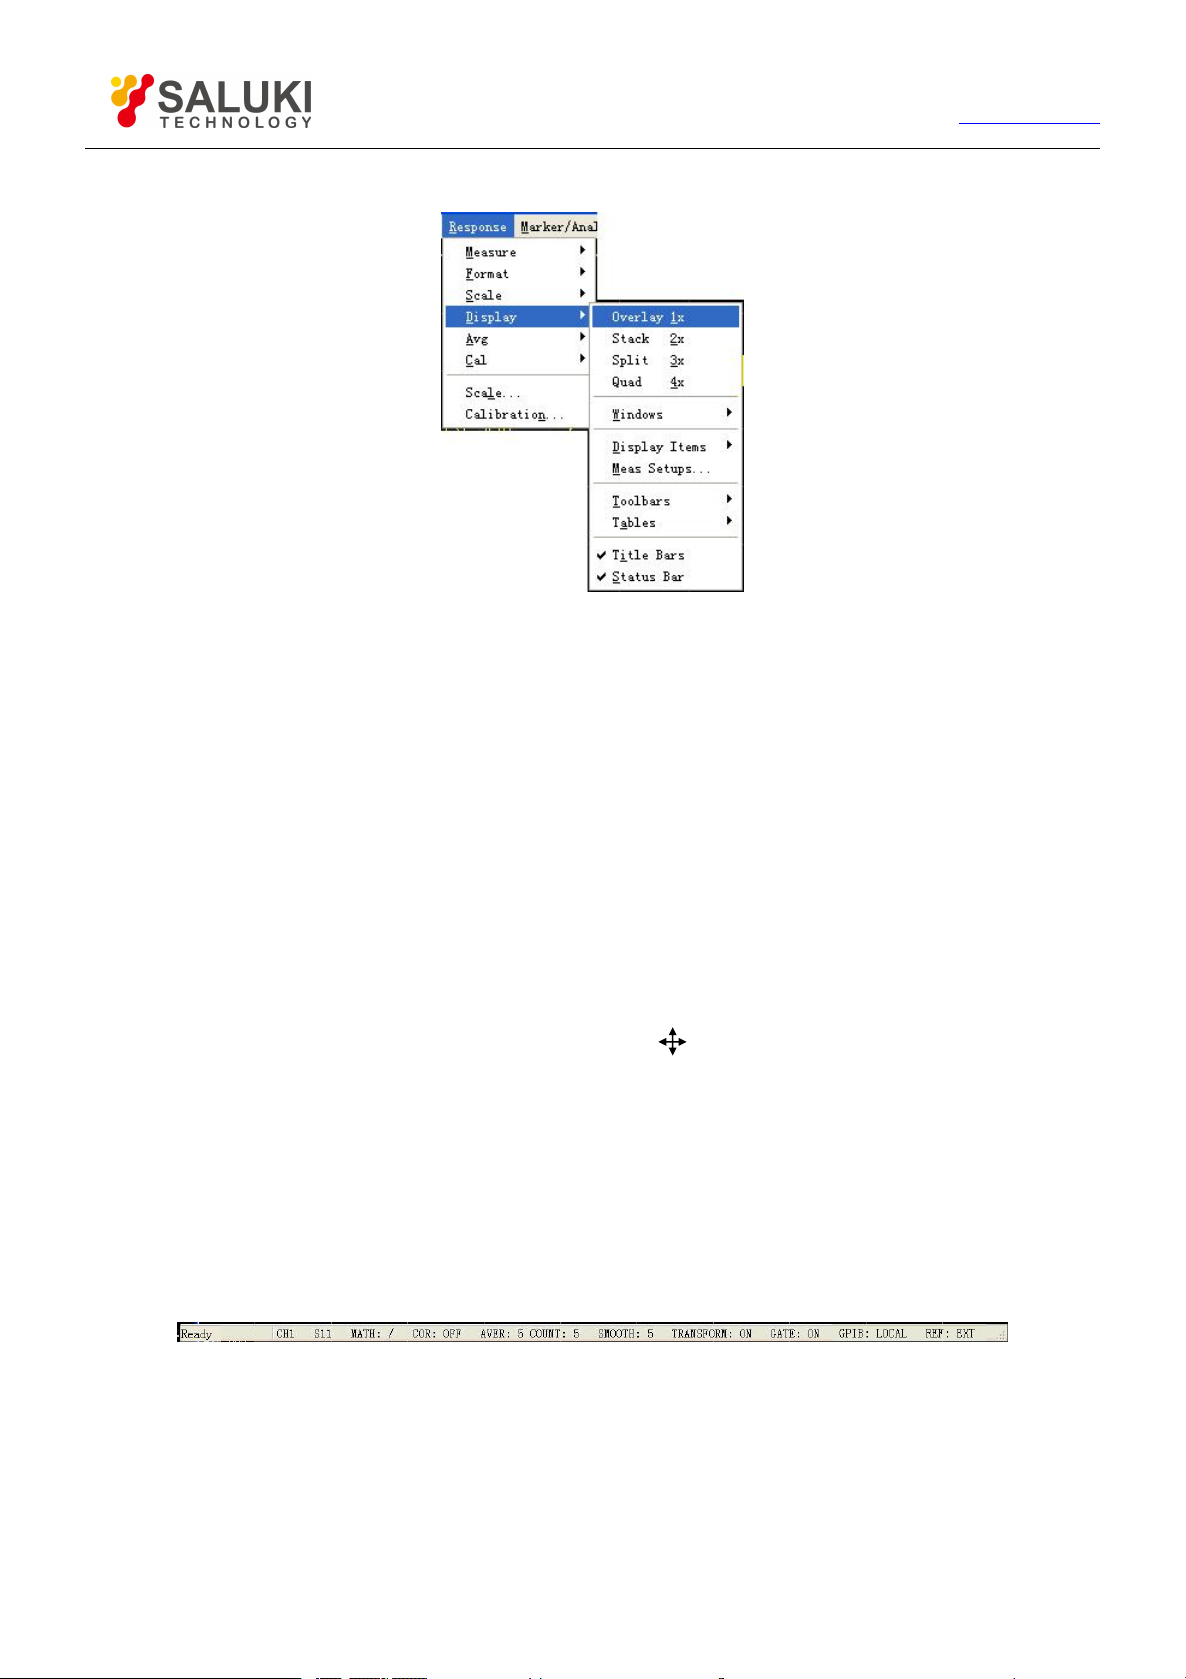
64
2) Select the arrangement mode of window in the submenu shown.
Fig. 4-30 Window Arrangement Settings
By front panel keys
Tel: 886.2.2175 2930 Email: [email protected]
www.salukitec.com
1) Press【Display】in RESPONSE area to show soft-key toolbar.
2) Press the corresponding soft-key to select the window arrangement mode needed.
4.8.3.
The Analyzer supports the dragging of mouse to move Traces in Measure window. If the Measure channel for moving Traces is not
included in the purpose window, the purpose window will create corresponding channel after Trace movement. The setting method is
as follows:
If there are several Traces in the window, click the up-down arrow button at the Trace status bar for roll display until the Trace
Activate the Trace status button corresponding to the moving Trace with mouse. Press the left key of mouse and hold on.
Drag the mouse until the mouse pointer turns to motion indicator “ ”, pull the mouse pointer to Trace status bar of the
4.9.
We can define OSD (on screen display) by means of Display menu in Response menu of the Analyzer. Optional screen display
elements contain the status bar, tool bar, form, Measure setting, Trace status, title bar, etc., and they are quite useful for observation,
setup and Measure modification.
Moving Traces
status button required shows in the Trace status bar.
purpose window, release the left key and the Trace moving is over.
Setting Analyzer Display
4.9.1. Status Bar
When the status bar is enabled, it is displayed at the bottom of screen, and displayed contents are as follows:
Current Stimulus channel
Measure parameters of current Active Trace
Display the arithmetical operation carried out by Active Trace when the Trace math function is enabled
Error modification condition of Stimulus channel
Average factors of current Stimulus channel and times of average operation carried out are displayed, when average function is
Page 65
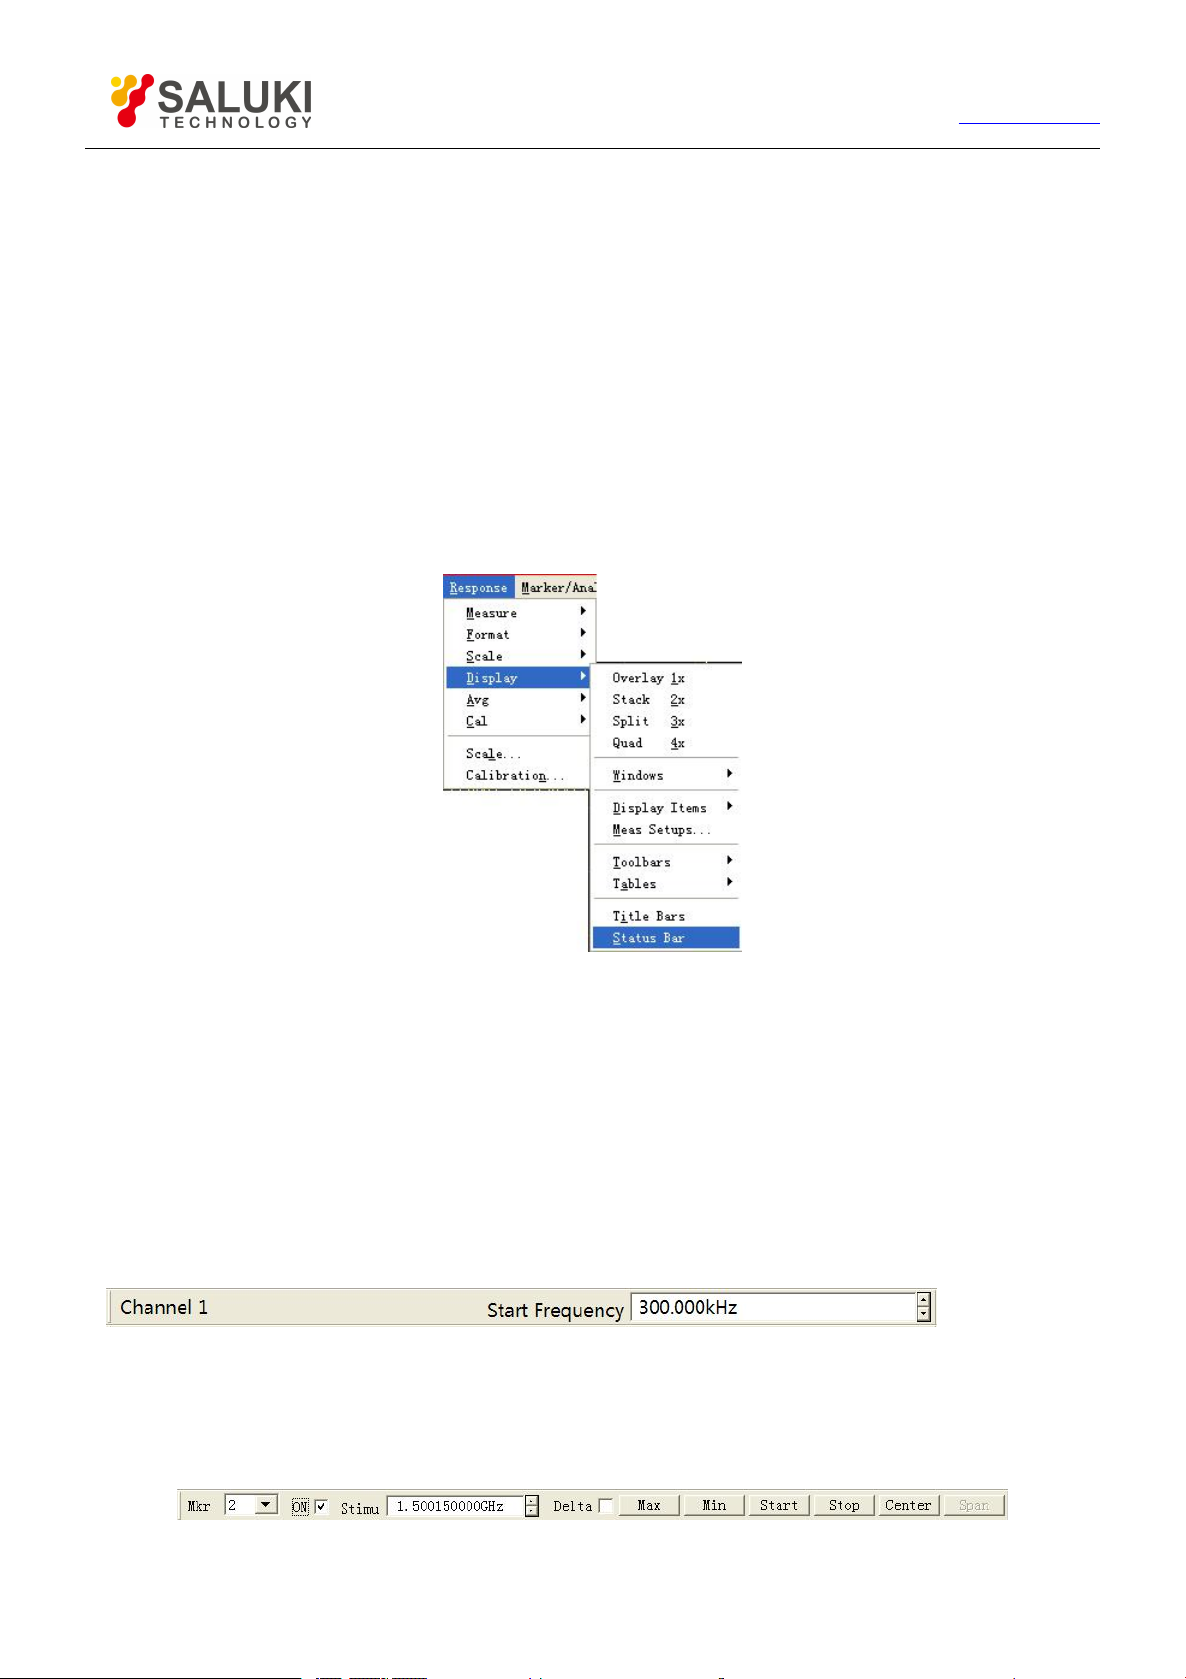
65
Tel: 886.2.2175 2930 Email: [email protected]
www.salukitec.com
enabled.
Smoothing spots are displayed when smoothing function is enabled.
TRANSFORM:ON is displayed when time domain transformation function is enabled.
GATE:ON is displayed when gate function is enabled.
GP-IB condition: LOCAL or REMOTE
Clock reference signal condition: INT or EXT
4.9.1.1. Triggering of status bar display
By mouse or touch screen
Click [Response] once, point at [Display] on dropdown menu to get the submenu, click and tick [Status bar] to enable status bar
display, and remove the tick to close status bar display.
Figure 4-31 Triggering of Status Bar Display
By front panel keys
1) Press【Display】in RESPONSE area, the corresponding soft-key tool bar turns up, and press soft-key corresponding to
[More].
2) Press soft-key corresponding to [Status bar on/OFF] in the displayed soft-key tool bar to enable the status bar display.
4.9.2. Tool Bar
The Analyzer can simultaneously display 6 different tool bars at most, and it is quite easy to set up Measure by the tool bar.
Active input tool bar
The active input tool bar is displayed at the top of screen and under the menu bar; press different Utility keys on the front panel,
different active input tool bars will be displayed, and it is feasible to input corresponding numerical value if names of tool bars
correspond to names of keys.
Marker tool bar
The marker tool bar is used to set up and modify marker, as well as change Analyzer setup. By the marker tool bar, it is feasible to
Page 66
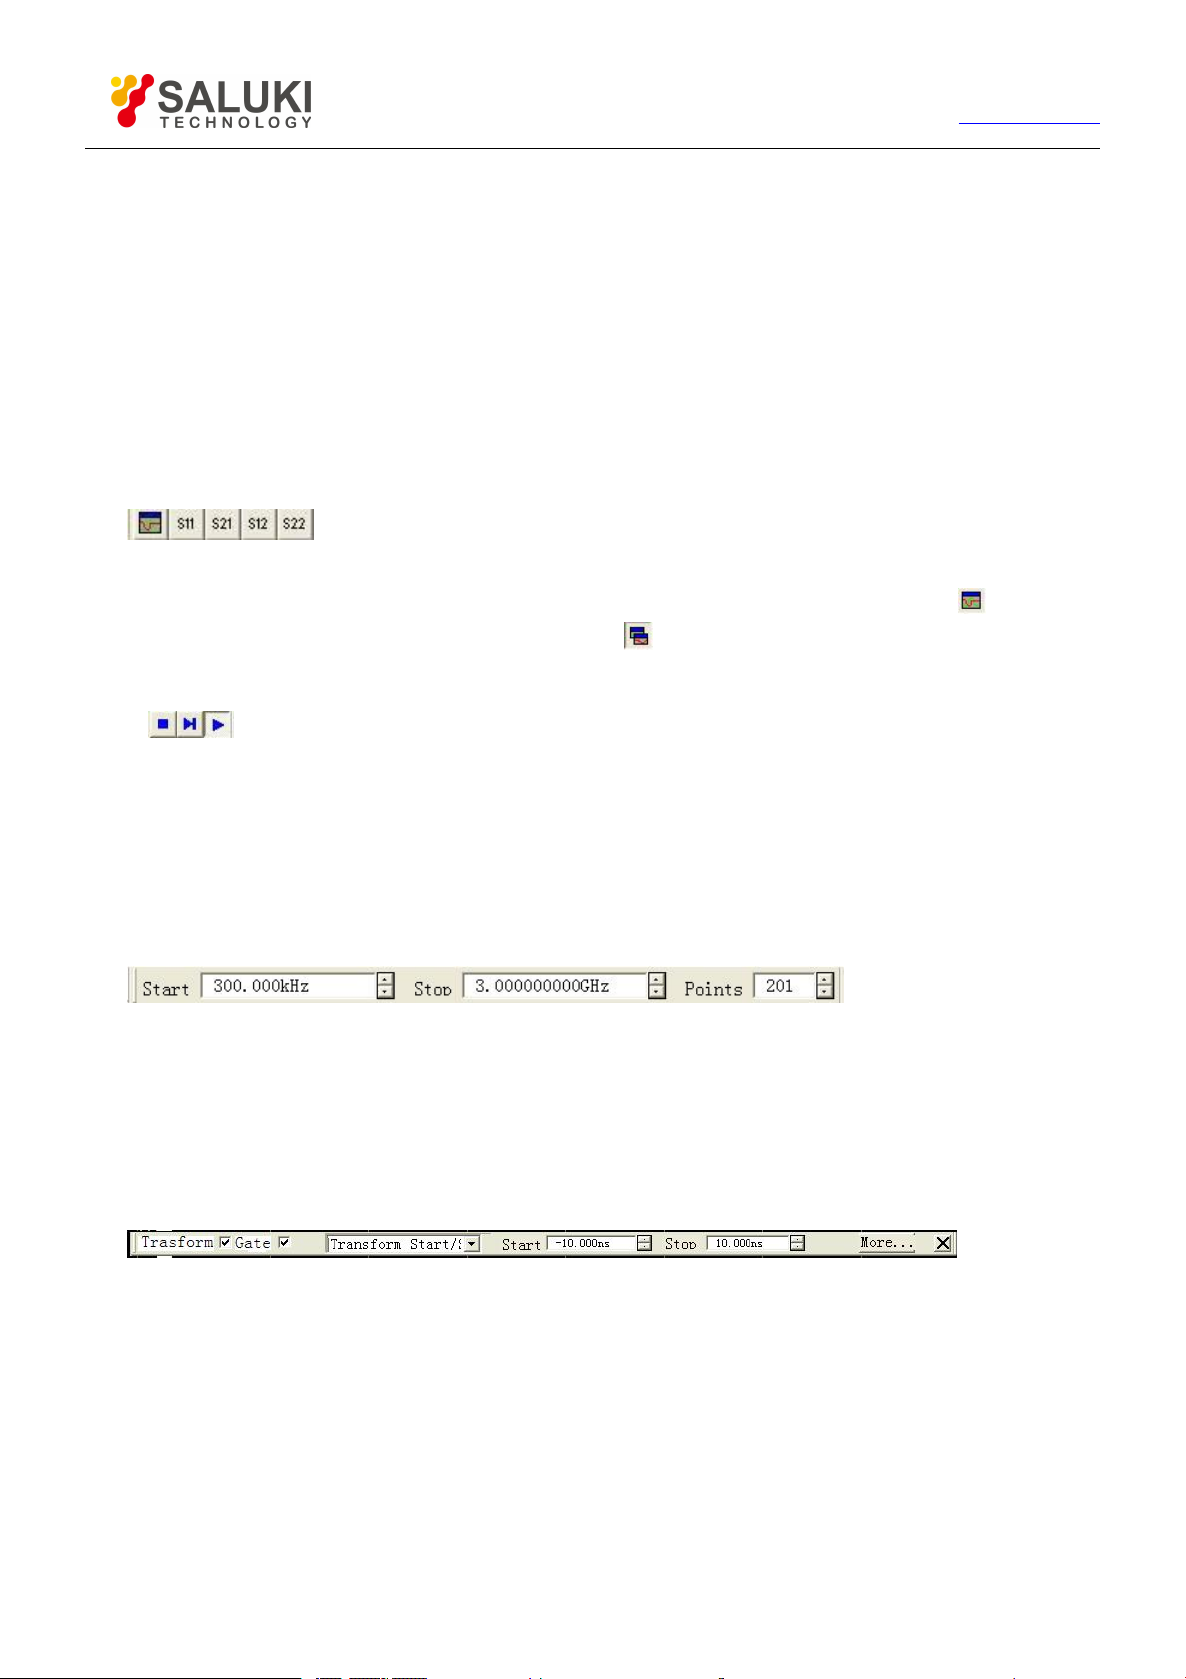
66
Tel: 886.2.2175 2930 Email: [email protected]
www.salukitec.com
set up:
Current Stimulus marker
stimulus value of Stimulus marker
△
marker, carry out maximum/minimum value search, and set up start/stop and center/span stimulus value of the
Analyzer according to the marker position.
When the marker tool bar is enabled, if you want to change the position of Stimulus marker by the knob on the front panel, firstly click
[Stimulus] frame in the marker tool bar, and then turn the knob to change the marker position, referring to Section 1 “Marker” in
Chapter VIII for detailed information about marker.
Measure tool bar
The Measure tool bar is used to create required S parameter Trace in the current Stimulus window or new window, create S
parameter Trace in the current Stimulus window when the leftmost button in the Measure tool bar is uplifted ( ), and create S
parameter Trace in the new window when the button is pressed down ( ).
Sweep control tool bar
Buttons on the sweep control tool bar respectively set up the trigger way of the Stimulus channel to be:
Hold mode
Single Sweep, and then enter into Hold mode
Continuous Sweep
Stimulus toolbar
The Stimulus toolbar is used to observe and set up sweep activation, and it is able to set up:
Start stimulus value
Stop stimulus value
Sweep spot number
Time domain toolbar
The following settings can be carried out by using the time domain toolbar:
Enable or stop the time domain transformation and the time gate functions.
Change settings of start/stop or center/span of the time domain transformation and the time gate time.
Click [More…] button to open the Time Domain Transformation dialog box.
Click [X] button to close the time domain toolbar.
Close all menus
Click [All OFF] menu, and all toolbars can be closed once.
Page 67
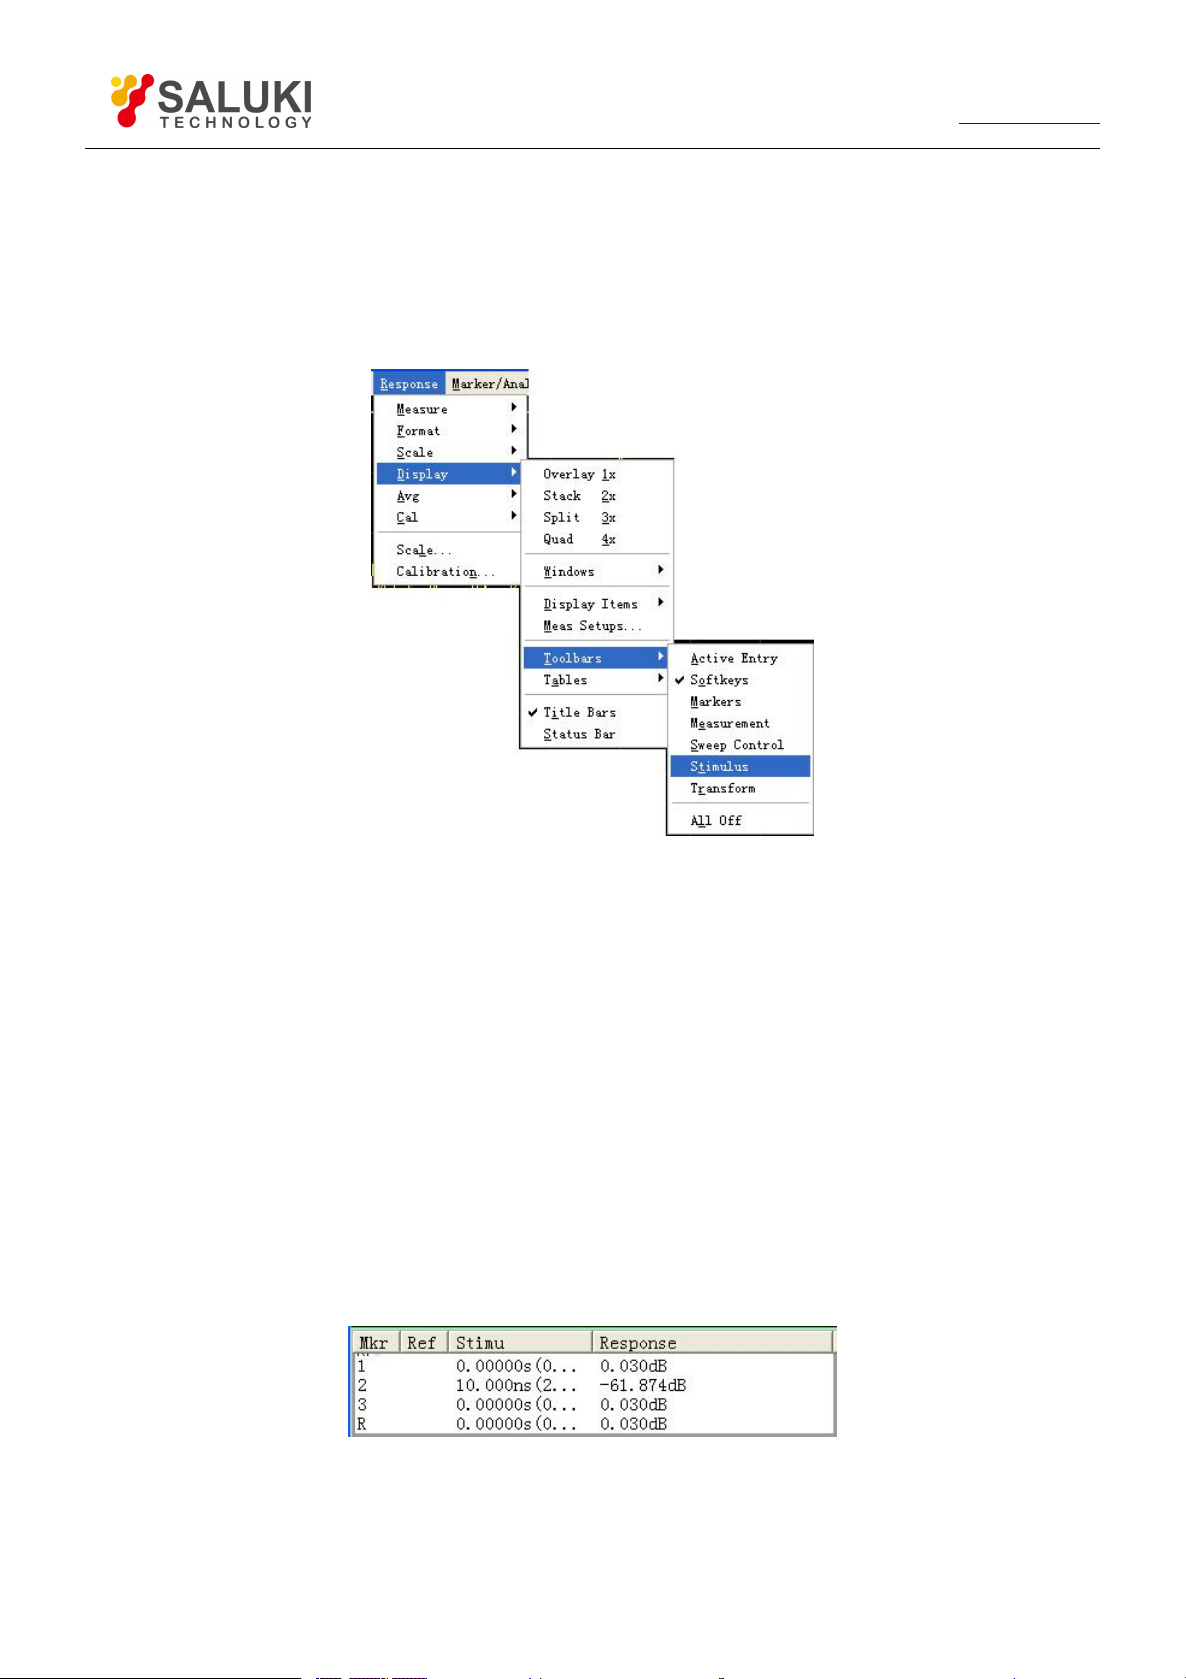
67
Tel: 886.2.2175 2930 Email: [email protected]
www.salukitec.com
4.9.2.1. Triggering of toolbars display
By mouse or touch screen
1) Click [Response], point at [Display] on the Response menu, and point at [Toolbars] on the display submenu.
2) Click the tool bar to be set up in Toolbars submenu, enable toolbar display when checking, and close toolbar display when
removing the tick.
Figure 4-32 Triggering of Toolbars Display
By front panel keys
1) Press [Display] in RESPONSE area to display the corresponding soft-key tool bar, and press soft-key corresponding to
[More].
2) Press the soft-key corresponding to [Toolbars] to display the Toolbars submenu.
3) Press the wanted toolbar soft-key, enable the toolbar display when it is “On”, and close toolbar display when it is “Off”.
4.9.3.
Tables
The Analyzer can display the marker table, limit table and segment table, and it can observe and modify their settings (can not edit
the marker table).
The table is displayed under the corresponding window.
Every window can display only one table every time.
4.9.3.1. Marker table
Figure 4-33 Marker Table
The marker table is used to display settings of marker, and these settings contain:
Marker number
Page 68
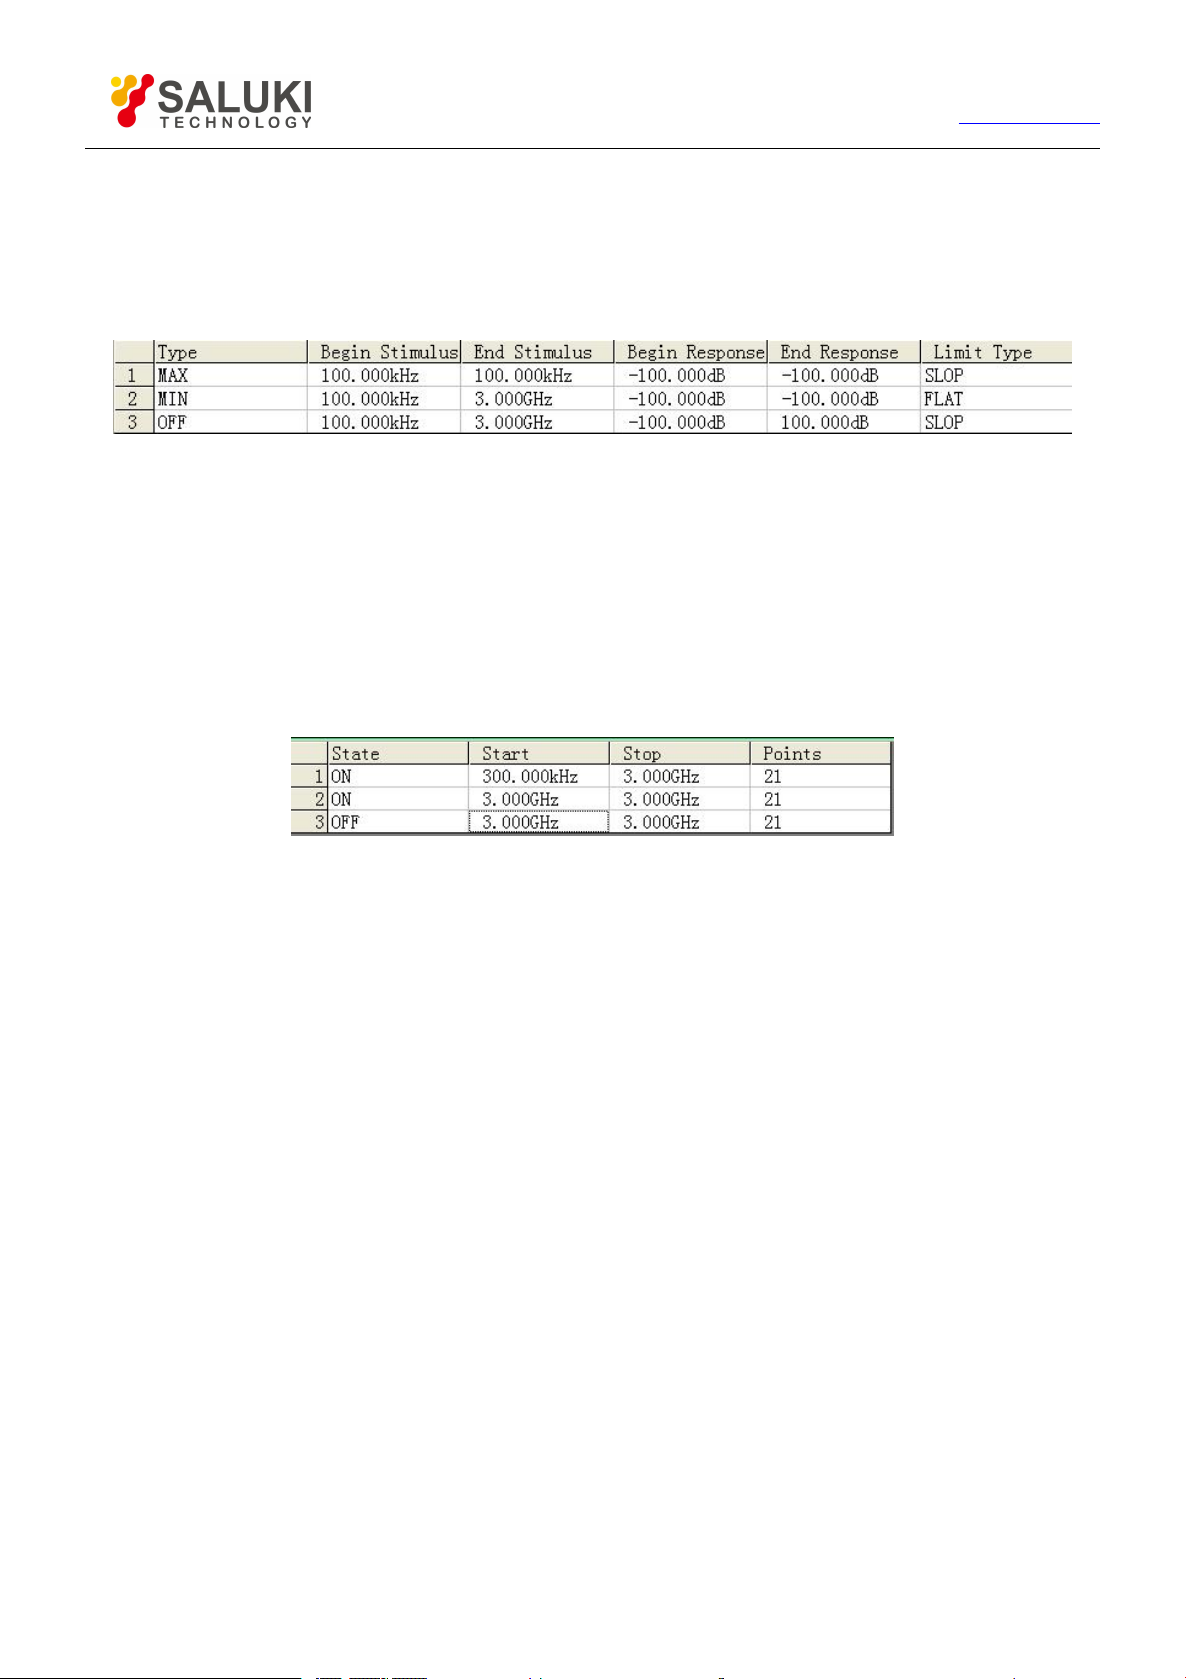
68
Tel: 886.2.2175 2930 Email: [email protected]
Reference marker (used for the relative Measure)
stimulus value of marker
Response valve at the place of marker
4.9.3.2. Limit table
Figure 4-34 Limit Table
The limit table is used to display and modify the limit test settings, and these settings contain:
Type of limit test (MAX, MIN or OFF)
Start and stop stimulus values of the limit line segment
Start and stop response values of the limit line segment
www.salukitec.com
Display type of the limit line segment (SLOT, FLAT or POINT)
4.9.3.3. Segment table
Figure 4-35 Segment Table
The segment table is used to set up and modify the segment Sweep, and these settings contain:
Segment condition (ON/OFF)
Start and stop stimulus values of the segment
Sweep spot number of the segment
Power level (each segment can be set up individually)
Intermediate-frequency bandwidth (each segment can be set up individually)
Sweep time (each segment can be set up individually)
4.9.3.4. Triggering of table display
By mouse or touch screen
1) Click [Response], point at [Display] on the Response menu, and point at [Tables] on the display submenu.
2) Click the table to set up in the Tables submenu, enable the table display when checking, and close table display when
removing the tick.
Page 69
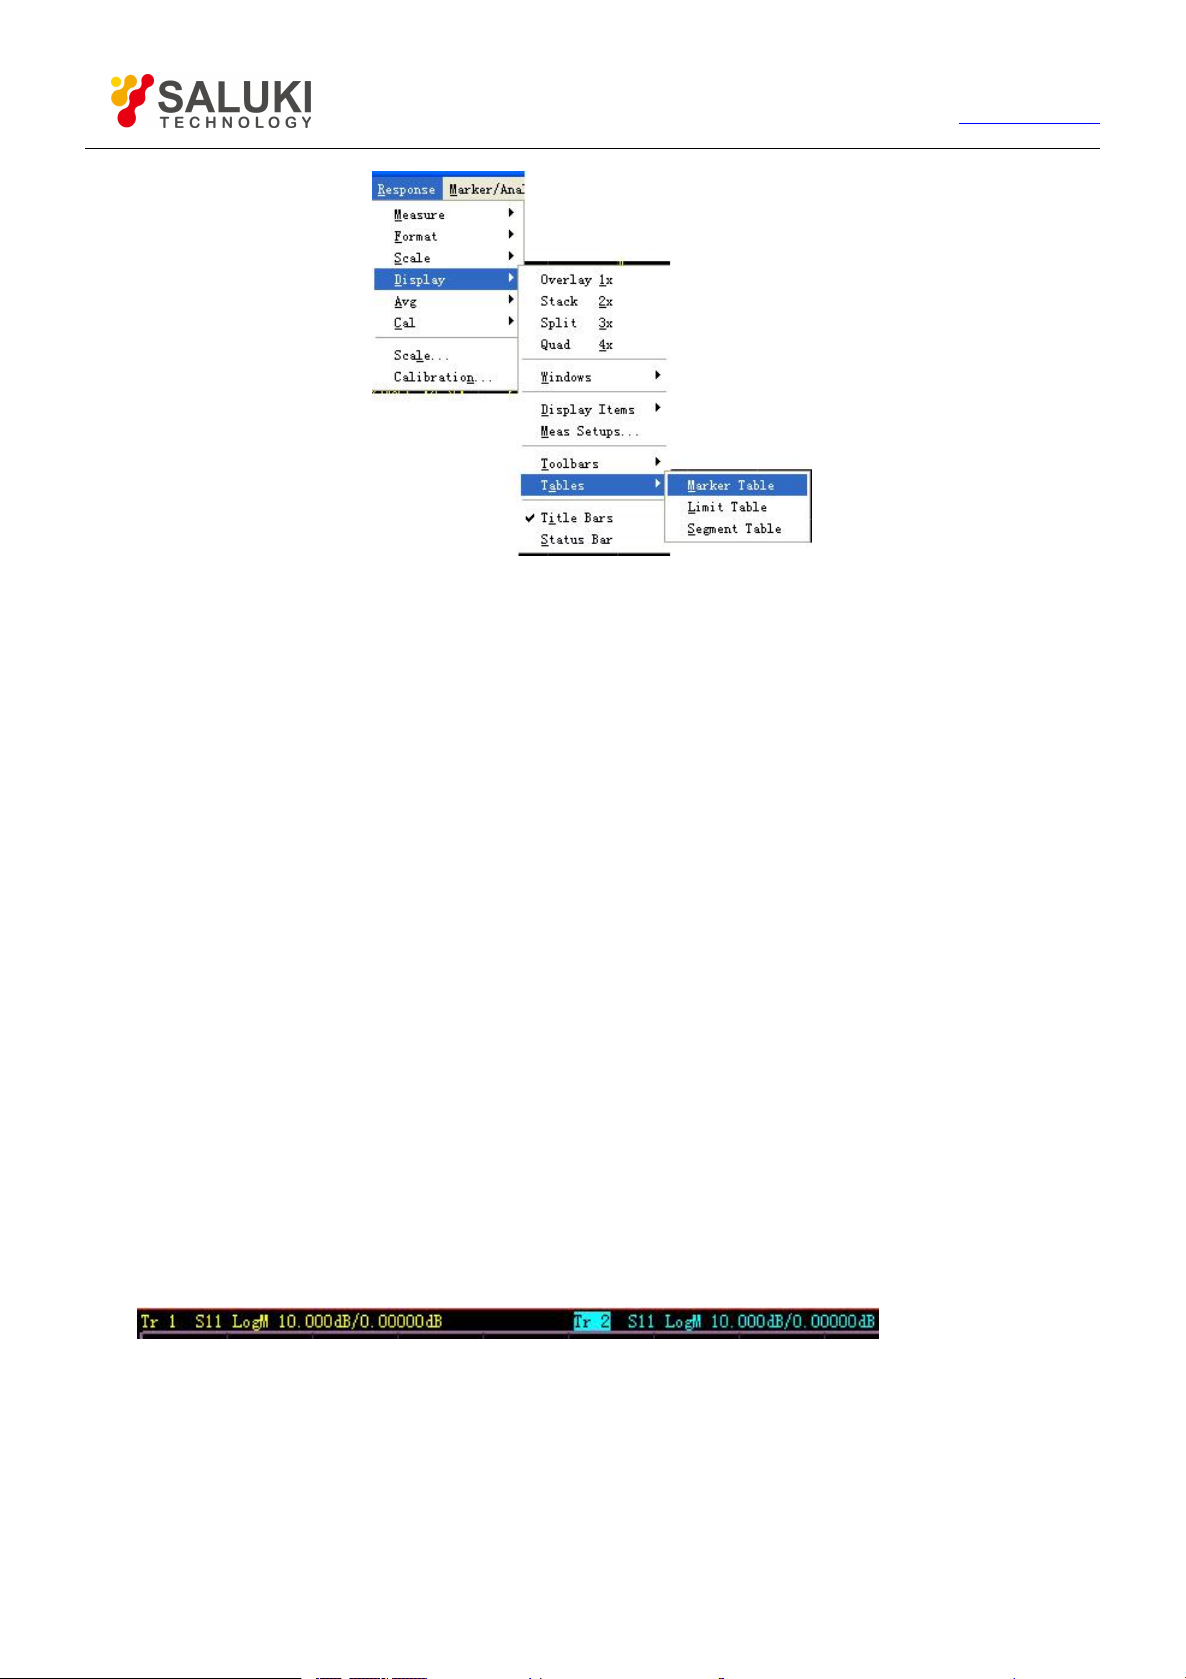
69
By front panel keys
Tel: 886.2.2175 2930 Email: [email protected]
www.salukitec.com
Figure 4-36 Triggering of Tables Display
1) Press 【Display】 in RESPONSE area to display the corresponding soft-key tool bar, and press soft-key corresponding to
[More].
2) Press the soft-key corresponding to [Tables] to display Tables submenu.
3) Press the corresponding soft-key to select the table to be enabled.
4.9.4. Measure Display
We can display and hide 6 kinds of Measure information to set up and observe Measure, and the information contains:
Trace status bar
Frequency/Activation
Marker reading
One marker for each Trace
Big marker
Limit test result
Limit line
Title
4.9.4.1. Trace status bar
The Trace status bar is displayed above each window on the screen, and displayed contents are as follows:
Measure parameter and format
Scale
Reference value
Clicking the Trace status bar can make the corresponding Trace change to the current Active Trace so as to set up the Trace. Click
the right mouse button when the marker is on the Trace status, use right key menu to delete the Trace or set up the scale, color and
line type of the Trace.
Page 70
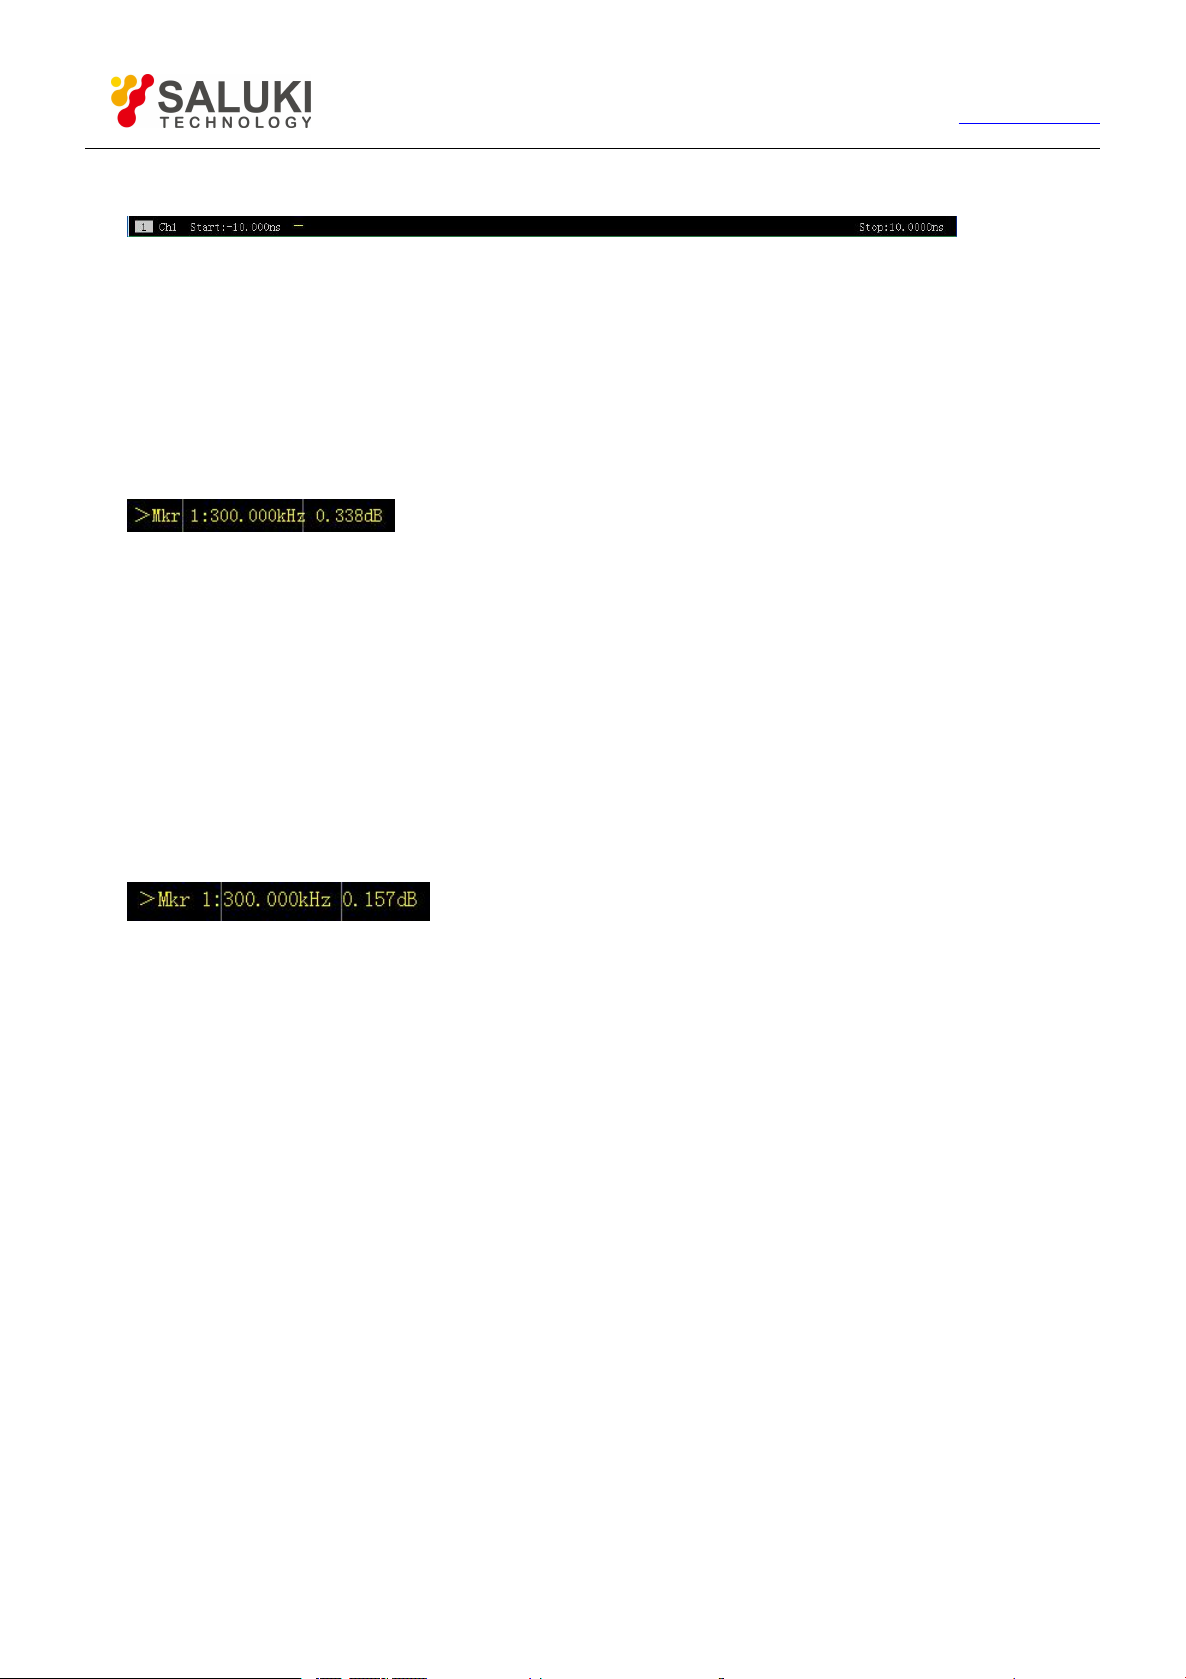
70
Tel: 886.2.2175 2930 Email: [email protected]
www.salukitec.com
1) Frequency/stimulus value
The frequency/activation information is displayed under each window on the screen, this display can be hidden for the purpose of
keeping secret. The information it displays is as follows:
Channel No.
Start stimulus value
Stop stimulus value
4.9.4.2.
The marker reading information is displayed at the top right corner of each window on the screen, and it displays information as
follows:
Marker No.
stimulus value of marker
Response value of marker selection format
Marker reading
4.9.4.3. One marker for each Trace
When checking this item, only 1 marker can be enabled on each Trace.
4.9.4.4. Big marker
When checking this item, the typeface of marker reading becomes bigger.
4.9.4.5. Limit test result
The limit test result (PASS or FAIL) is displayed at the lower right corner of each window.
4.9.4.6. Limit line
The limit line targets at Active Trace display in the designated window, and its position depends on following settings;
Limit table
Format
Scale
Reference level
4.9.4.7.
Each window can have a title, the title can be created by the Title Input dialog box below, and it is displayed at the upper right corner
of the window. If you want to remove the title, delete it in [Input] of the dialog box and click [OK] to close the dialog box.
Title
Page 71
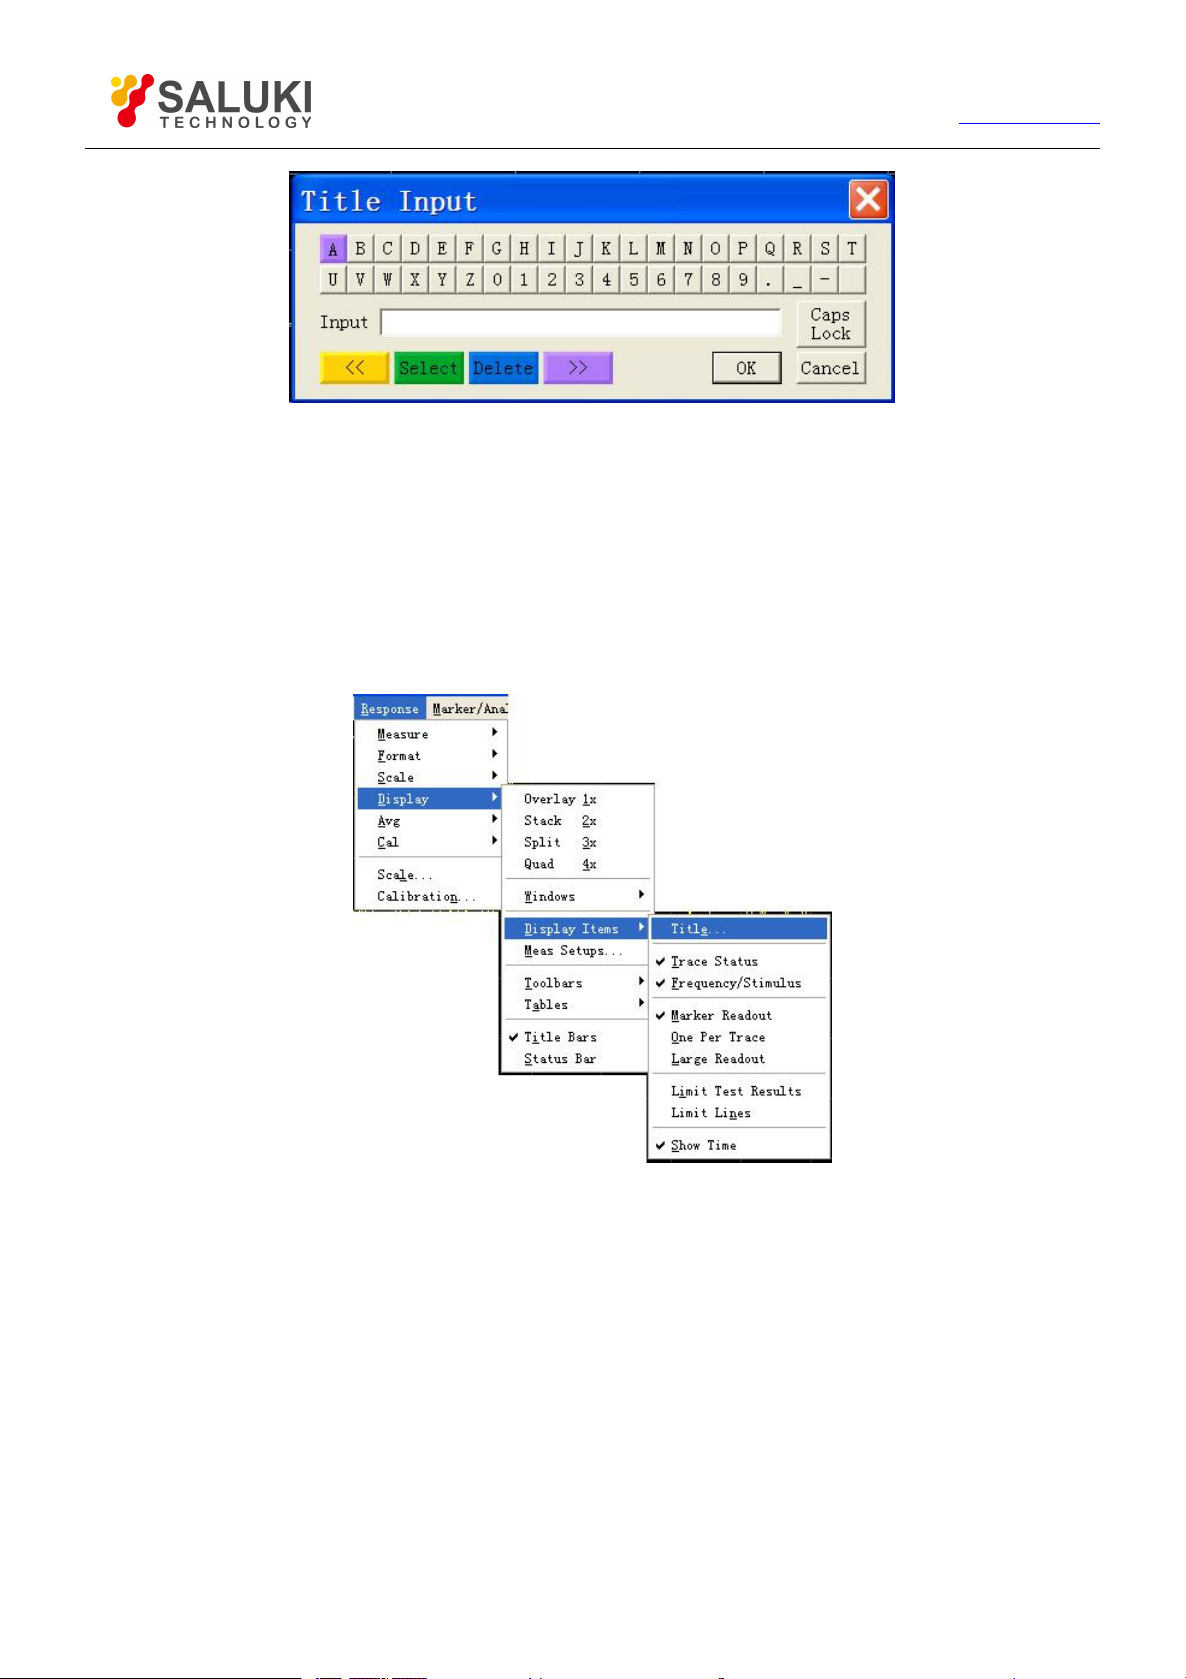
71
Tel: 886.2.2175 2930 Email: [email protected]
www.salukitec.com
Figure 4-37 Title Input Dialog Box
Refer to the part of “Triggering Measure display” in the section for the method of displaying the Title Input dialog box.
4.9.4.8. Triggering of Measure display
By mouse or touch screen
1) Click [Response], point at [Display] on the dropdown menu, and point at [Display Items] on the display submenu.
2) Click the Measure display item to be displayed or hidden on the Display Items submenu, show the Measure display item
when checking, and hide the Measure display item when removing the tick.
Figure 4-38 Triggering of Measure Display
By front panel keys
1) Press【Display】key in RESPONSE area, and press the soft-key corresponding to [Display Items] on the soft-key menu.
2) Press the soft-key corresponding to [Marker Display] on the soft-key menu. The three items of [Mkr Readout ON |off],
[One per Trace on|OFF] and [Larde Readout on|OFF] will turn up, press the corresponding soft-key to select the desired
Measure display.
3) Press 【Analysis】 in the MKR/ANALYSIS area, the soft-key menu turns up, press the soft-key corresponding to [Limits],
the [Limit Test on|OFF] and [Limit Line on|OFF] turn up, and press the corresponding soft-key to select the desired
Measure display.
4.9.5. Triggering of Data Trace and Memory Trace Display
4.9.5.1.
By mouse or touch screen
Page 72
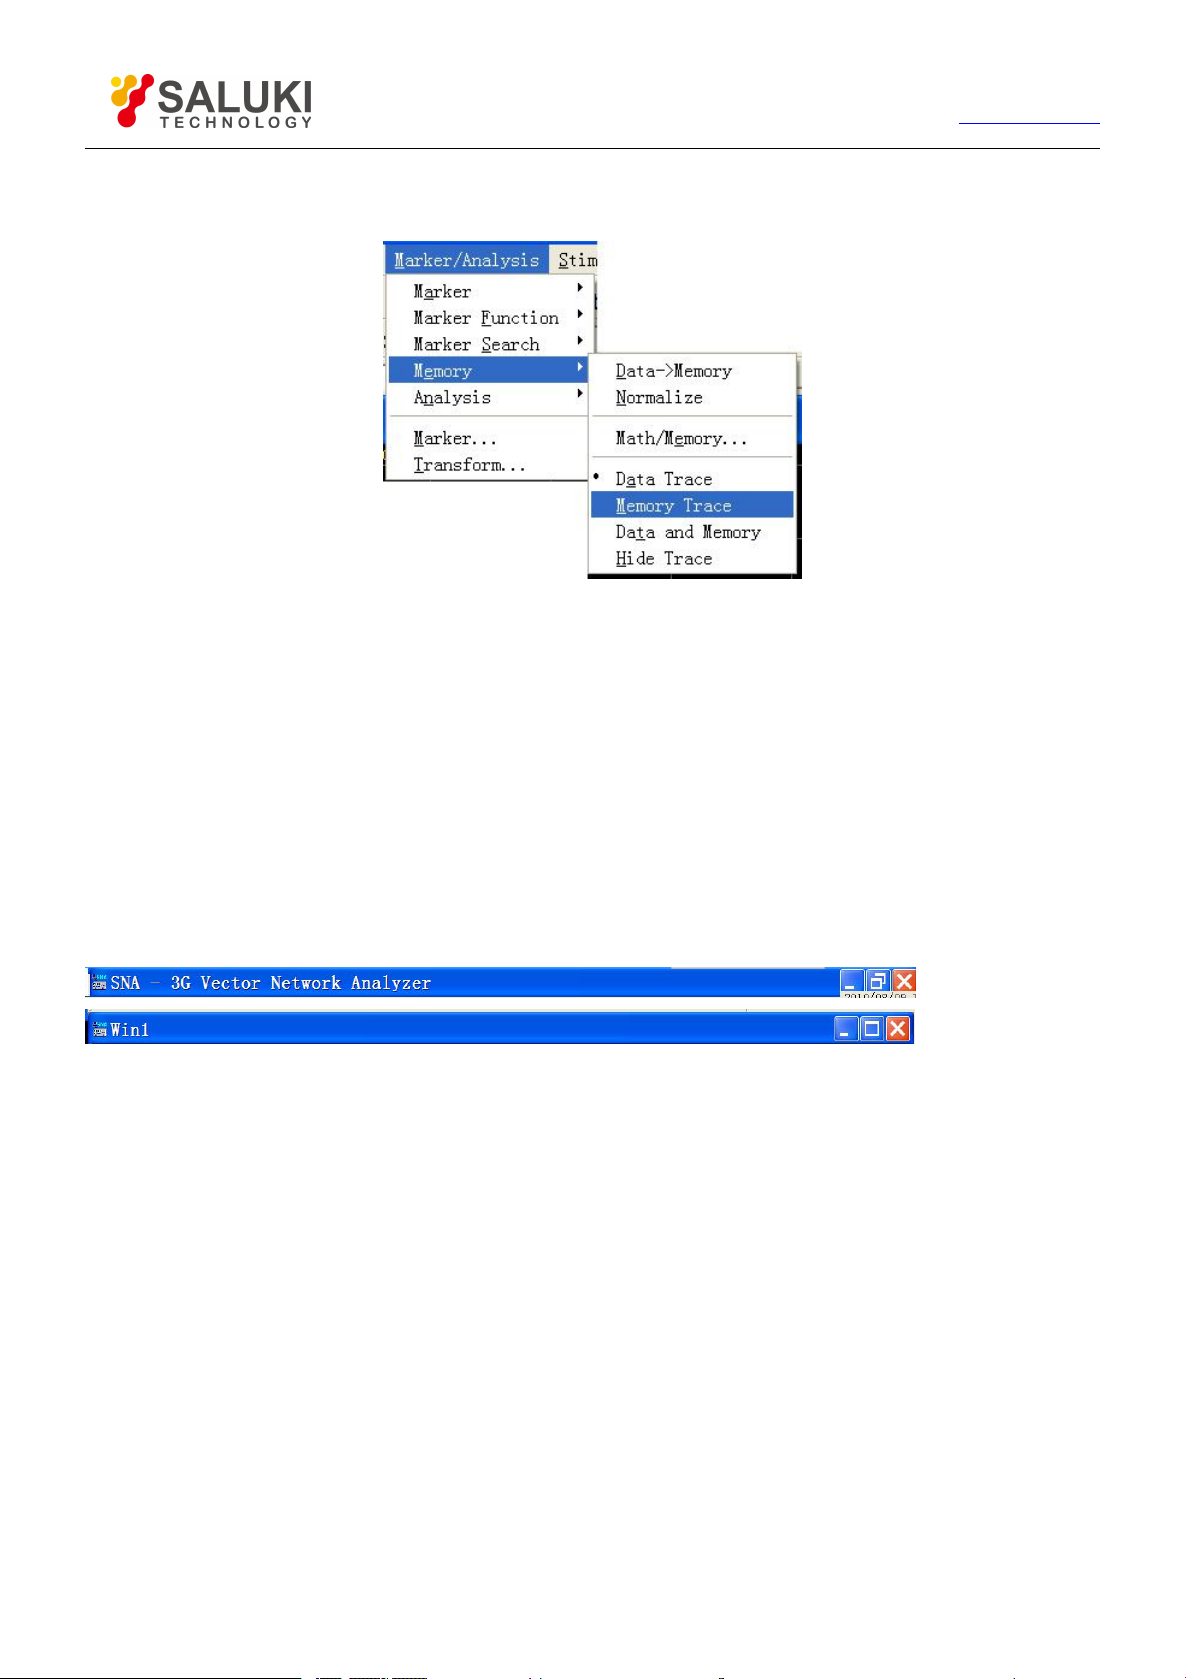
72
Tel: 886.2.2175 2930 Email: [email protected]
www.salukitec.com
Click [Marker/Analysis], point at [Memory] on the submenu, and click [Data Trace] or [Memory Trace] on the Save menu. Display the
corresponding Trace when checking, and hide the corresponding Trace when removing the tick.
Figure 4-39 Triggering of Data Trace and Memory Trace Display
If you want to observe the saved Trace, you must save the Trace into memory firstly, and then you can carry out arithmetical
operation, including plus, minus, multiply and divide on the data Trace and saved Trace. .
4.9.5.2. By front panel keys
Press【Memory】in the MKR/ANALYSIS area to display the corresponding soft-key menu, it is feasible to display corresponding
Trace when pressing and checking the soft-key corresponding to [Data Trace] or [Memory Trace], hide the corresponding Trace when
removing the tick.
4.9.6. Title Bar
The title bar contains the main Measure applications title bar and window title bar, and it displays window titles and window control
buttons. Hiding the title bar is able to hide all title bars on the screen, so that there is a bigger screen to display the Measure result.
4.9.6.1. Triggering of title bar display
By mouse or touch screen
Click [Response], and click [Display] on the submenu, then click [Title Bars] on the Display submenu. Display the title bar when
checking, and hide the title bar when removing the tick.
Page 73
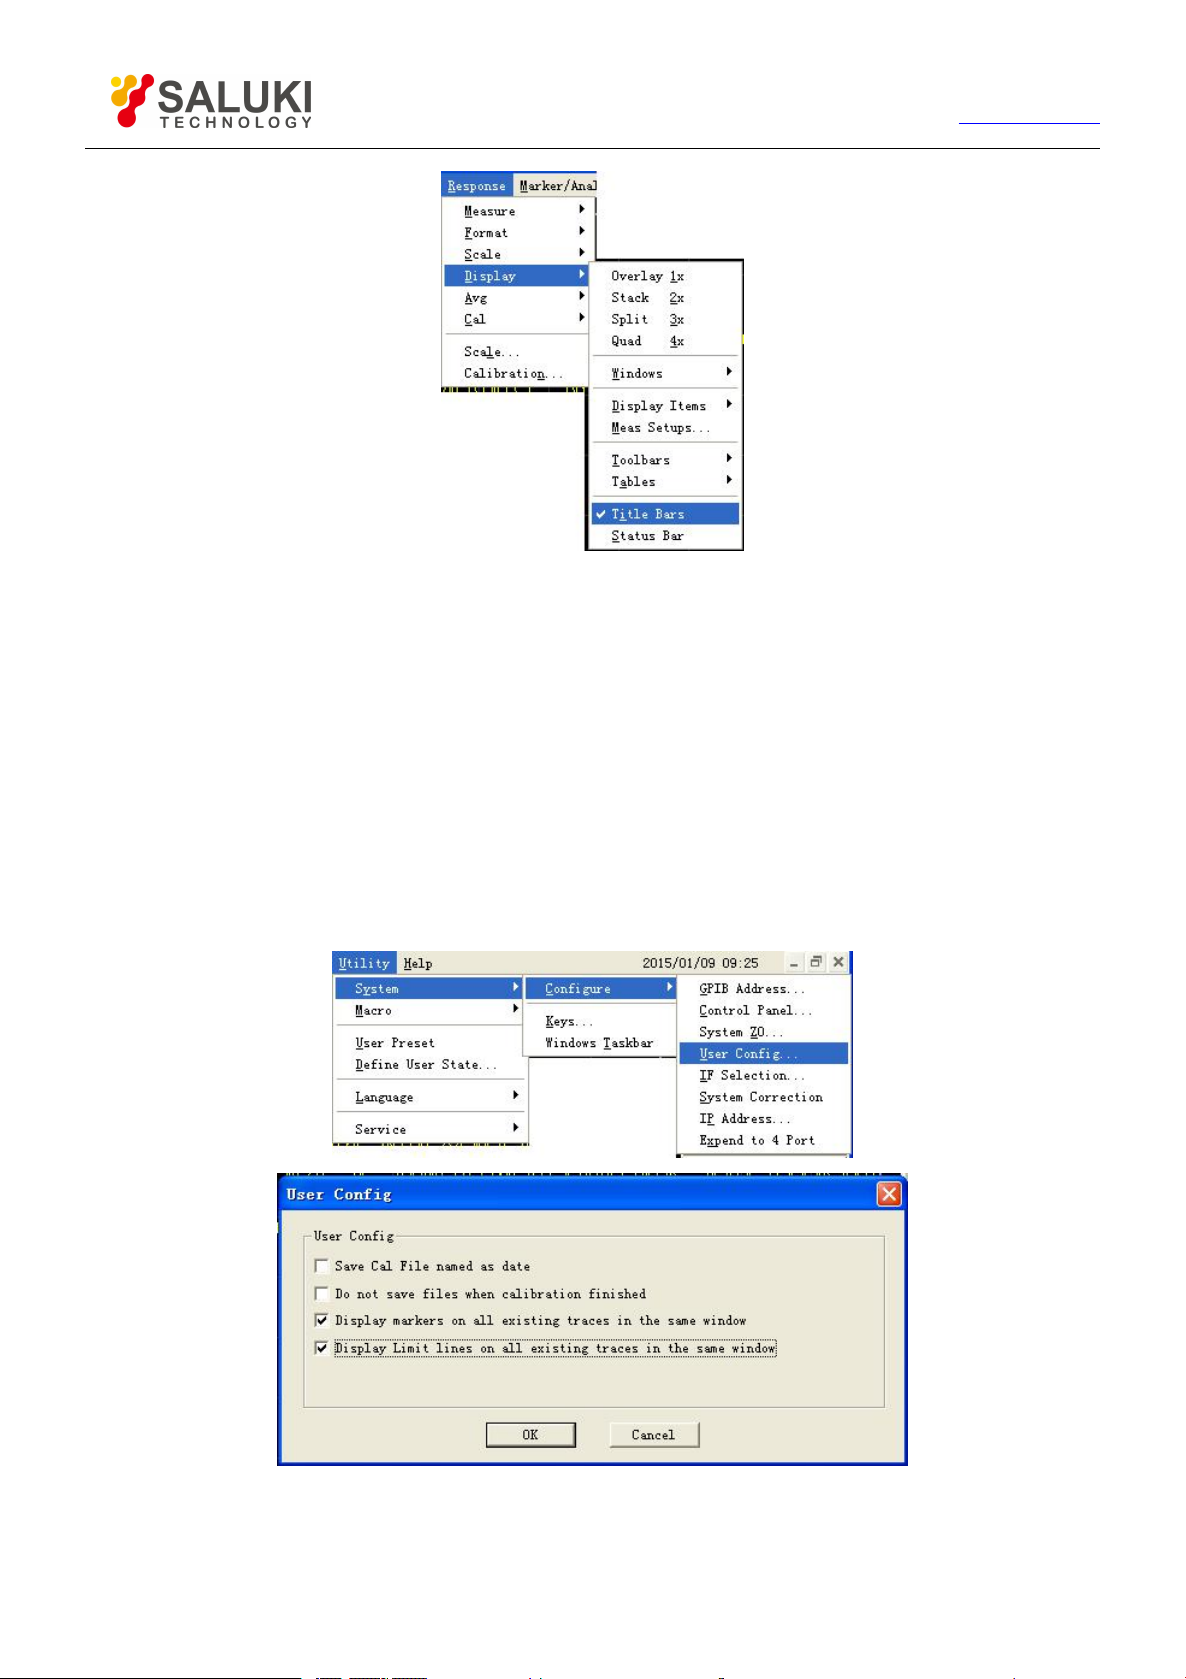
73
Tel: 886.2.2175 2930 Email: [email protected]
www.salukitec.com
Figure 4-40 Ttriggering of Title Bars Display
By front panel keys
1) Press【Display】in RESPONSE area, the corresponding soft-key tool bar turns up; Press soft-key corresponding to [More],
and the submenu turns up.
2) Press the soft-key corresponding to [Title Bar on|OFF], display the title bar when it is “ON”, and hide the title bar when it is
“OFF”.
4.9.7. User Configuration Display
4.9.7.1. By mouse or touch screen
Single click [UTILITY], single click [Configure] on the [System] menu, and single click [User Config…] on the appearing
submenus to display the User Configure dialog box.
Figure 4-41 User Configuration Dialog Box
Tick the option “Display markers on all exiting trace in the same window” and the option “Display Limit lines on all existing
traces in the same window”.
Page 74

74
Tel: 886.2.2175 2930 Email: [email protected]
www.salukitec.com
5. Calibration
5.1.Selecting Calibration Type
S3601 Series Vector Network Analyzer supports 7 calibration types. The detailed information on each calibration type is as follows:
5.1.1. Open Response
Calibration precision: low to medium.
Measure parameters: S11 and S22.
The required calibration standard: open-circuit device.
The corrected system errors:
Reflection Tracing
Measure application:
Reflection Measure on any port.
5.1.2.
Calibration precision: low to medium.
Measure parameters: S11 and S22.
The required calibration standard: short-circuit device.
The corrected system errors:
Measure application:
Short Response
Reflection Tracing
Reflection Measure on any port.
5.1.3. Through Response
Calibration precision: medium.
Measure parameters: S12 and S21.
The required calibration standard: through standard.
The corrected system errors:
Transmission Tracing
Measure application:
Transmission Measure in any direction.
5.1.4. Through Response and Isolation
Calibration precision: medium.
Measure parameters: S12 and S21.
The required calibration standards: through standard, two loads (each port needs one load).
The corrected system errors:
Transmission Tracing
Page 75

75
Tel: 886.2.2175 2930 Email: [email protected]
Crosstalk
Measure application:
Transmission Measure in any direction.
Measure requiring isolation calibration to improve system dynamic range.
If each port can not connect one load at the same time, isolation calibration can not be conducted.
5.1.5. Enhanced Response Calibration
Calibration precision: medium to high.
Measure parameters: S12 and S21 or S22 and S12.
The required calibration standards: through standard, open-circuit device, short-circuit device and load.
The corrected system errors:
Directivity
www.salukitec.com
Source matching
Reflection Tracing
Transmission Tracing
Measure application:
Transmission Measure in any direction.
Reflection Measure on any port.
5.1.6.
Calibration precision: high.
Measure parameters: S11 and S22.
The required calibration standards: open-circuit device, short-circuit device and load.
The corrected system errors:
Measure application:
1- Port (Reflection)
Directivity
Source matching
Reflection Tracing
Reflection Measure on any port.
5.1.7. Quick SOLT
Calibration precision: medium.
Measure parameters: all.
The required calibration standards: open-circuit device, short-circuit device, load and through standard.
The corrected system errors:
Directivity
Page 76

76
Tel: 886.2.2175 2930 Email: [email protected]
Source matching
Reflection Tracing
Crosstalk
Transmission Tracing
Load matching
Measure application:
Measure of all S parameters.
5.1.8. Full Dual-port SOLT
Calibration precision: high.
Measure parameters: all.
The required calibration standards: open-circuit device, short-circuit device, load and through standard.
The corrected system errors:
www.salukitec.com
Directivity
Source matching
Reflection Tracing
Crosstalk
Transmission Tracing
Load matching
Measure application:
Measure of all S parameters.
Measure requiring 12 errors correction to improve the Measure precision.
5.1.9. Full Dual-port TRL
Calibration precision: very high.
Measure parameters: all.
The required calibration standards: through standard, reflection standard, and transmission standard.
The corrected system errors:
Directivity
Source matching
Reflection Tracing
Crosstalk
Transmission Tracing
Load matching
Measure application:
Measure of all S parameters.
Page 77
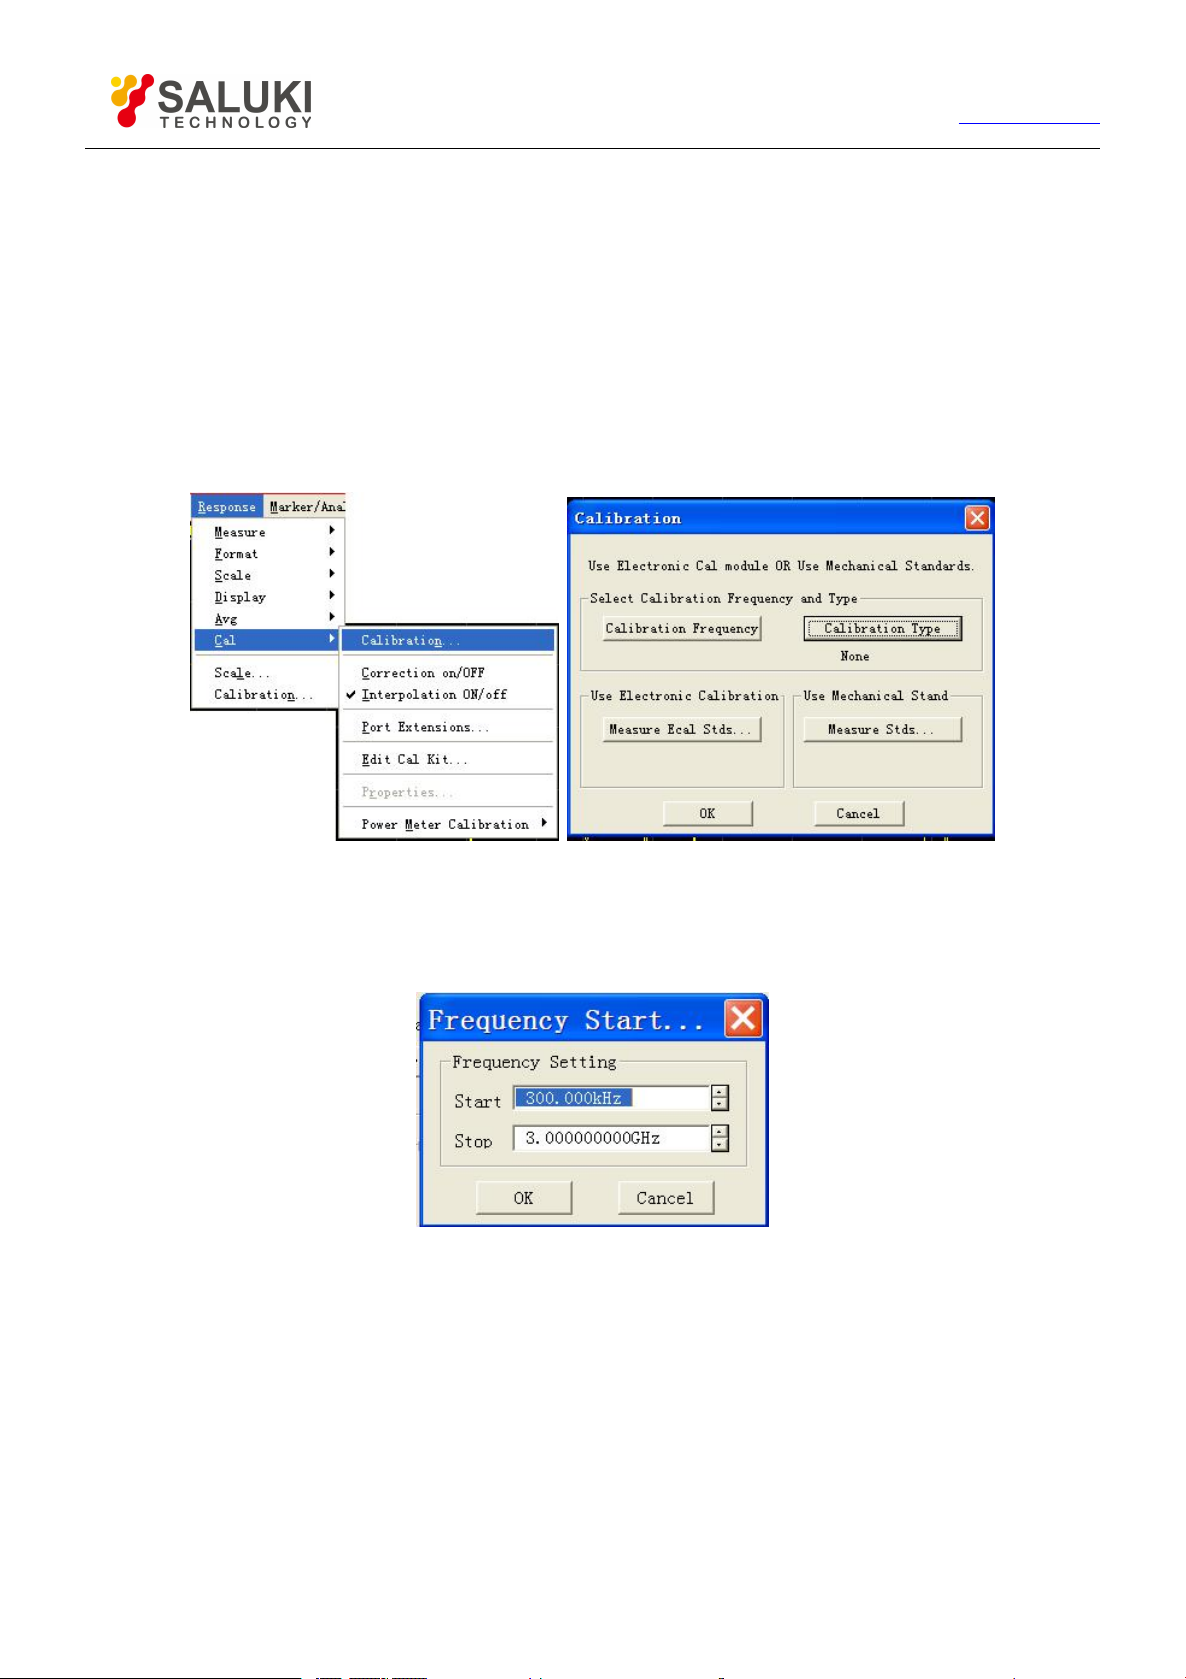
77
Tel: 886.2.2175 2930 Email: [email protected]
Measure requiring 12 errors correction to improve the Measure precision.
Measure requiring the maximum calibration precision.
Calibration Setup
5.2.
Calibration can be set up and conducted by using the Calibration menu of th Analyzer.
5.2.1. Starting Calibration
By mouse or touch screen
1) Click [Response], and click [Calibration …] on the [Cal] submenu, to display the Calibration dialog box.
www.salukitec.com
Figure 5-1 Starting Calibration Wizard
2) If it is required to set the frequency range of calibration, click [Calibration Frequency] button in Calibration dialog box, to
display the Frequency Start/Stop dialog box. Click [OK] to close Frequency Start/Stop dialog box after completing
frequency setting.
Figure 5-2 Setting Calibration Frequency
3) Click [Calibration Type] in Calibration dialog box, to display the Calibration Type dialog box, and Click [OK] to close
Calibration Type dialog box after completing calibration type selection.
The selectable calibration type is relevant to the Measure parameters of the current Stimulus channel. For instance,
when Measure parameter is S11, Through Response as well as Through Response and Isolation Calibration can not be
selected.
When conducting full dual-port calibration, if isolation calibration is not required, tick the [Omit Isolation (2-Port
Types)] check box.
Page 78
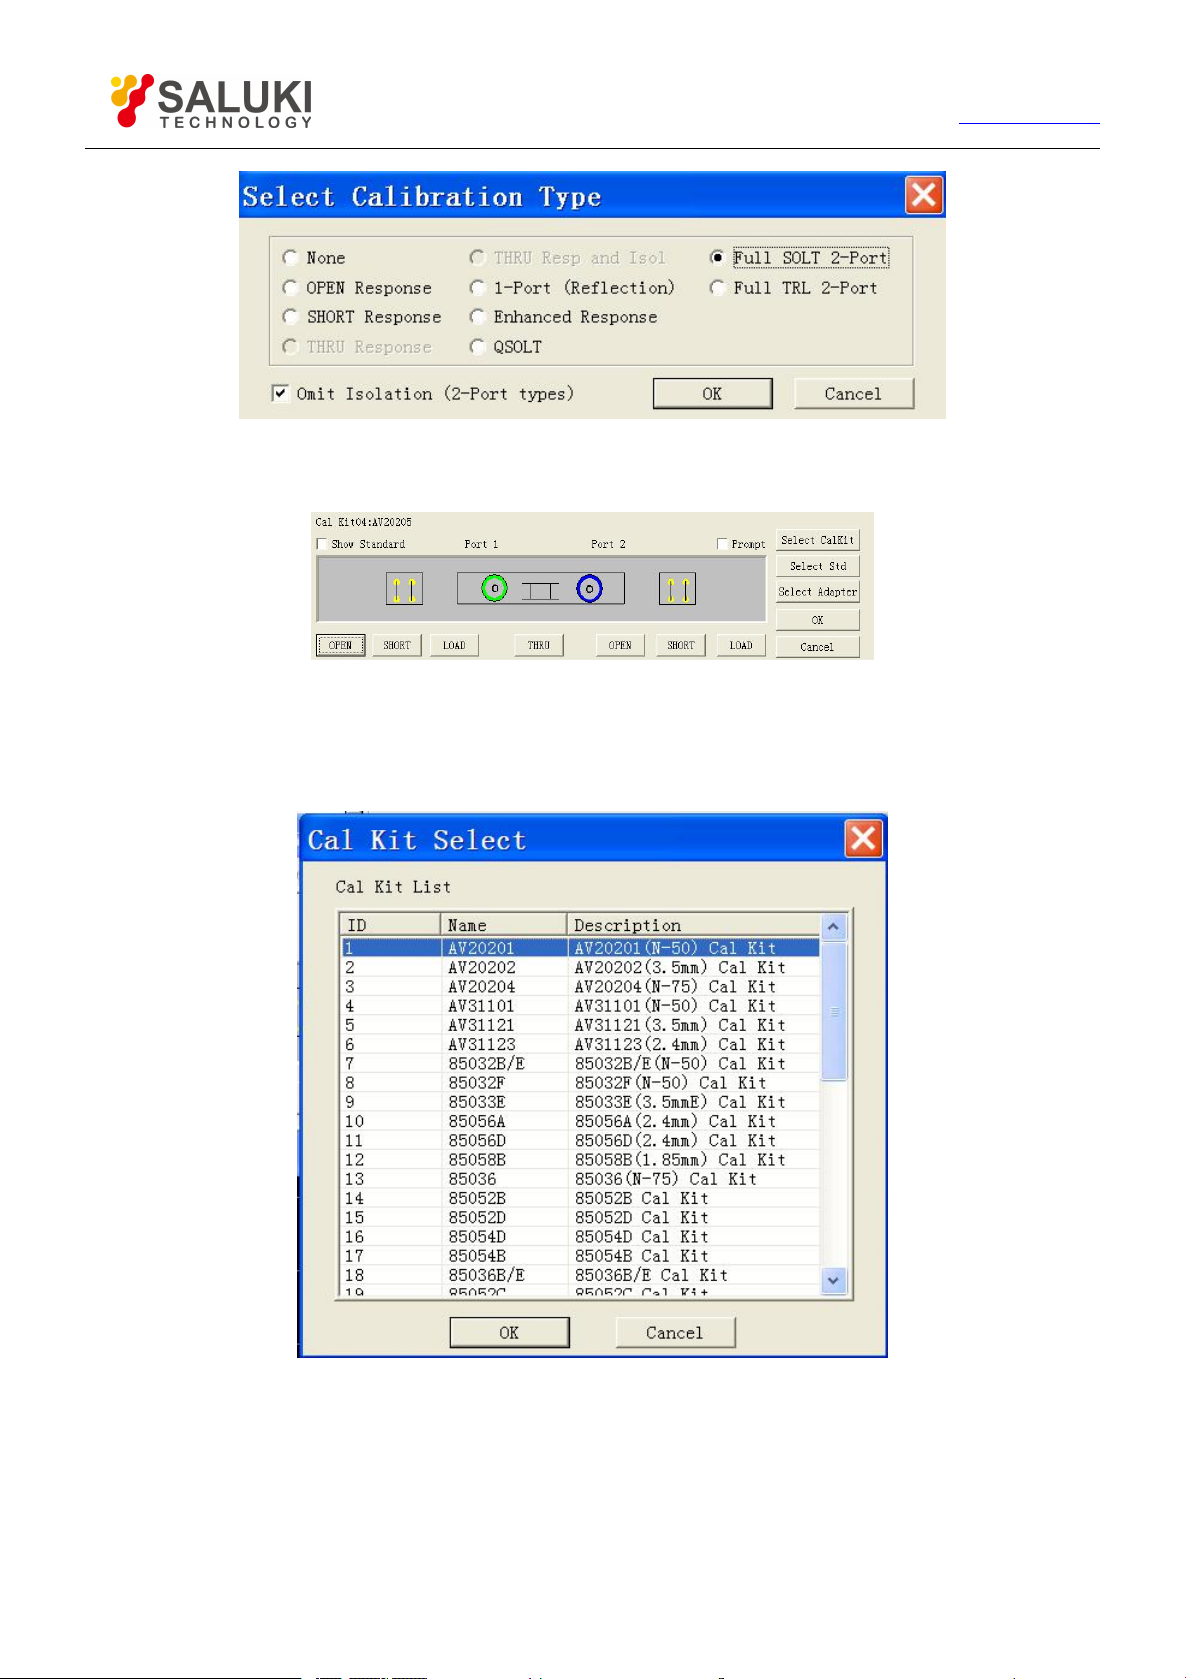
78
Tel: 886.2.2175 2930 Email: [email protected]
www.salukitec.com
Figure 5-3 Selecting Calibration Type
4) Click [Measure Stds] in the Calibration dialog box, to display the Measure Mechanical Standard dialog box.
Figure 5-4 Measure of Mechanical Standard Dialog Box
5) If the used calibration kit is different from the default calibration kit of Analyzer, click [Select CalKit] in the Measure
Mechanical Standard dialog box, to display the Select Calibration Kit dialog box and select the used calibration kit in the
box. Click [OK] to close the Select Calibration Kit dialog box.
Figure 5-5 Selecting Calibration Kit
6) If it is required to set calibration standard, click [Select Std] in the Measure Mechanical Standard, to display the Type
Information dialog box, and click [OK] to close the Type Information after completing setting.
Page 79
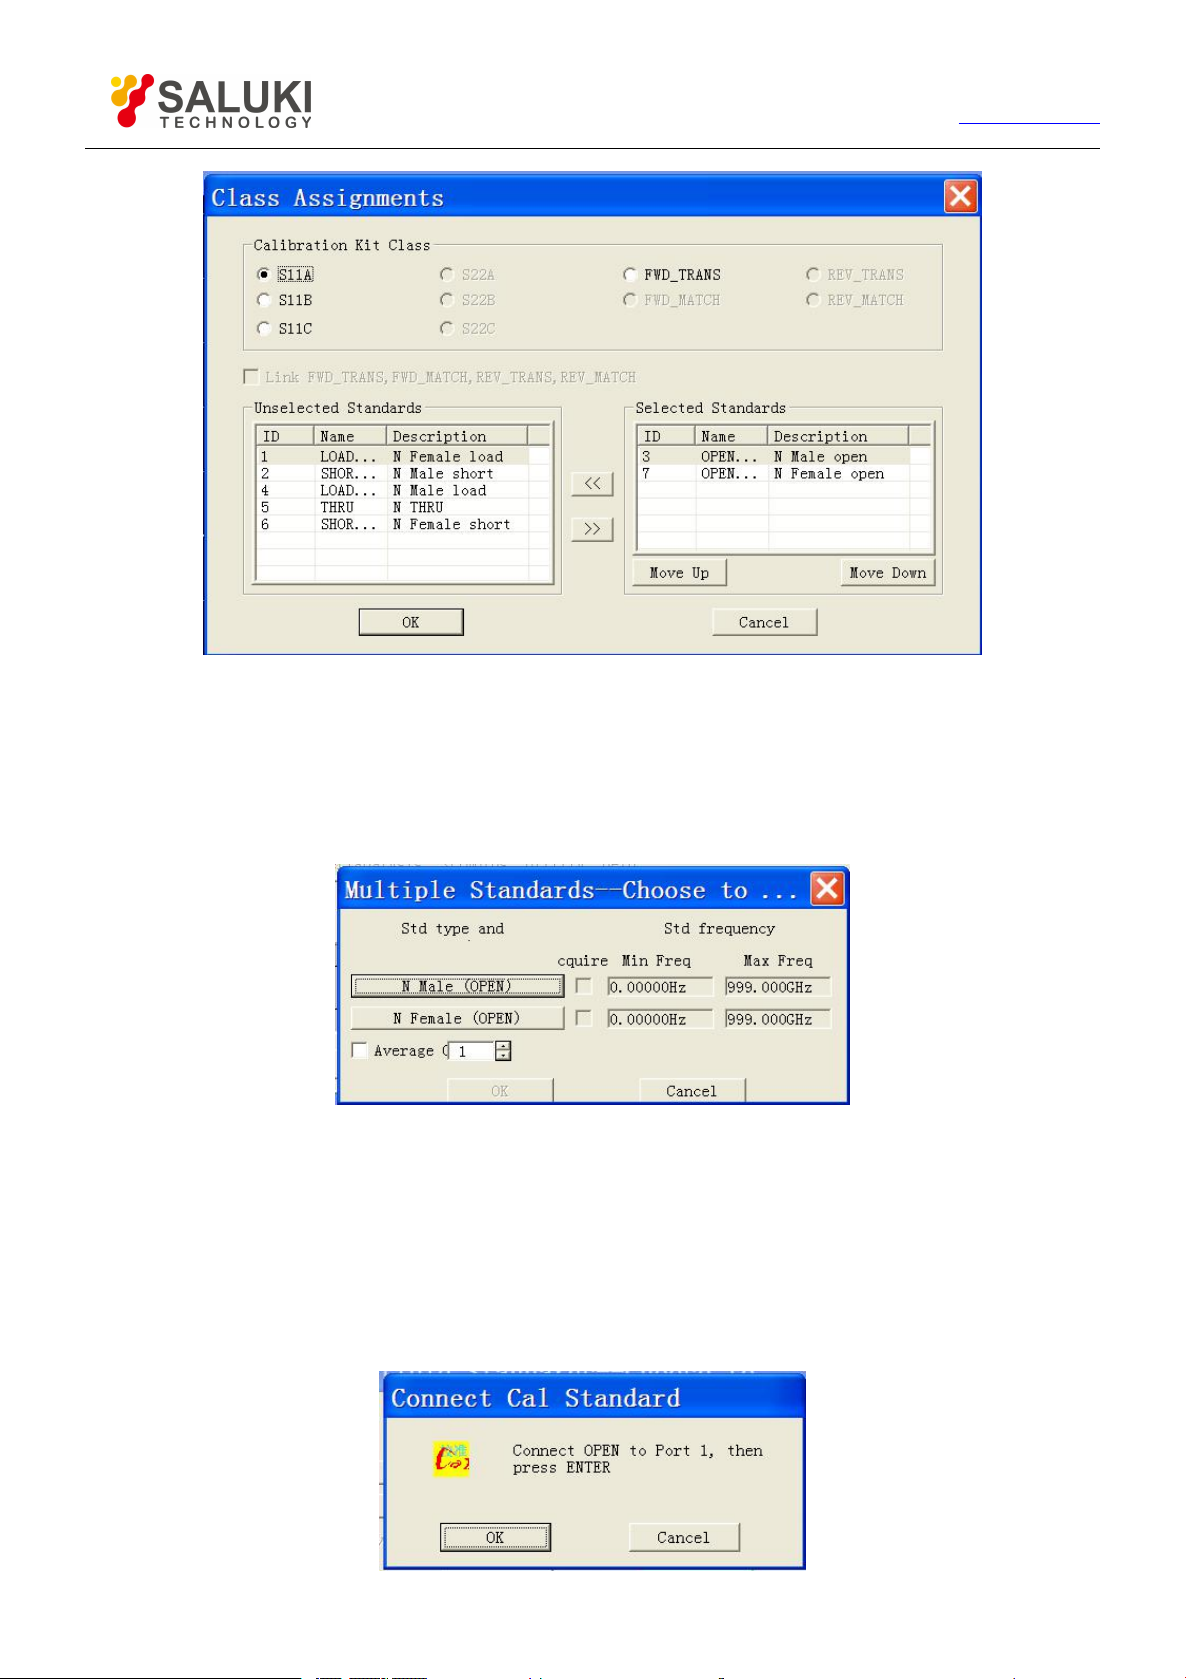
79
Tel: 886.2.2175 2930 Email: [email protected]
www.salukitec.com
Figure 5-6 Type Information Dialog Box
7) Connect calibration standard on the port, and tick the [Show Standard] dialog box in the top left corner of Measure
Mechanical Standard dialog box. When the button corresponding to the calibration standard to be measured (such as
[OPEN]) is clicked, the Multiple Standards dialog box will be displayed. If the average function should be used to reduce
noise effects during Measure of calibration standard, click to tick the [Average] check box, and set suitable average
factors.
Figure 5-7 Multiple Standards Dialog Box
8) If the [Prompt] dialog box in the top right corner of Measure Mechanical Standard dialog box is ticked, when the button
corresponding to the calibration standard, e.g. [N Male (OPEN)], is clicked in the Multiple Standards dialog box, the
Prompt for Connect Cal standard dialog box will be displayed. Click [OK] button to start Measure after confirming the
connected calibration standard is correct, and the Analyzer automatically ticks the corresponding [Acquire] check box in
the Multiple Standards dialog box after Measure is completed. Click [OK] button to close the Multi-calibration Kit Measure
dialog box after completing all the required calibration standard Measures. Button of the calibration standard whose
Measure is completed in the Measure Mechanical Standard dialog box turns into green.
Page 80
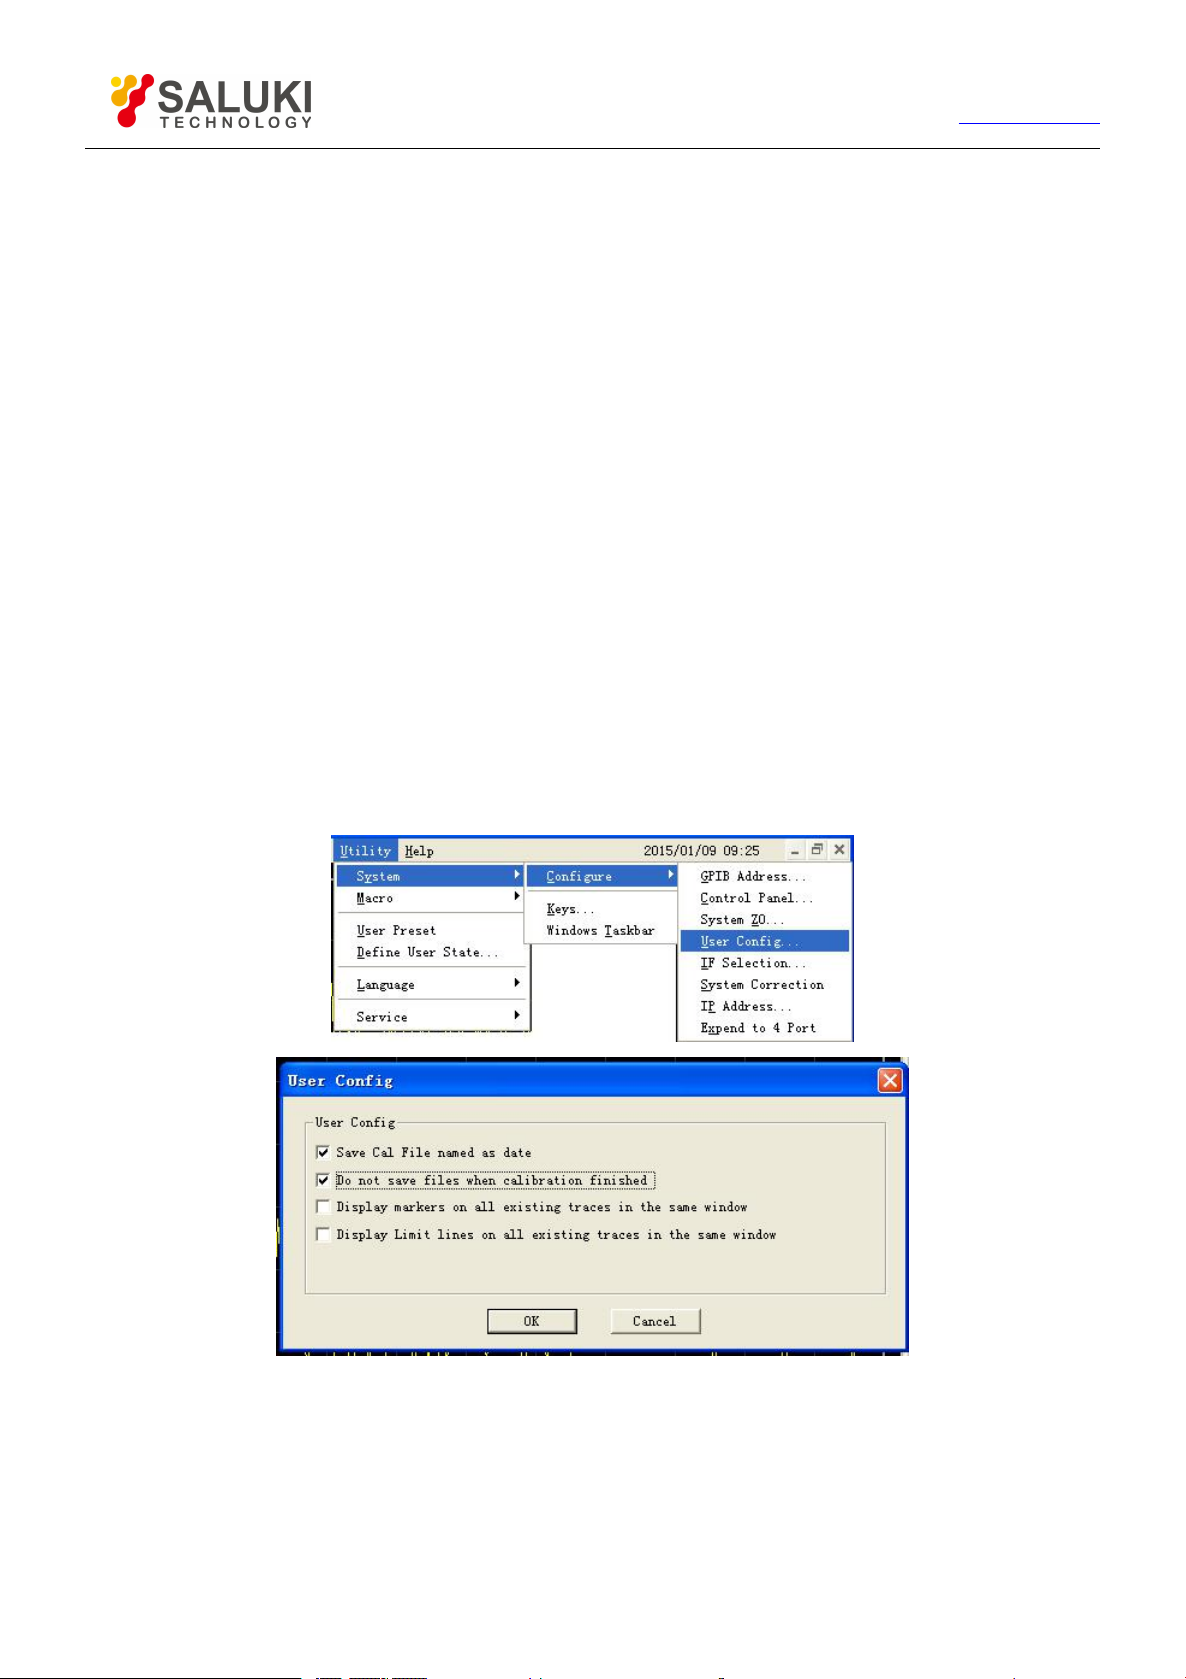
80
Tel: 886.2.2175 2930 Email: [email protected]
www.salukitec.com
Figure 5-8 Connect Calibration Standard Dialog Box
9) Repeat steps g) through h), to complete all the calibration standard Measures. Click [OK] to close the Measure
Mechanical Standard dialog box, to complete calibration.
By front panel keys
1) Press 【Cal 】 in RESPONSE area, press the soft-key corresponding to [Cal Kit] to display the sub soft-key menu, and
press the soft-key corresponding to the required calibration kit model to select calibration kit.
2) Press the soft-key corresponding to [Mechanical Calibration], and select calibration type in the displayed sub soft-key
menu.
3) Conduct a calibration Measure by taking Thru Response calibration Measure for example. Press the soft-key
corresponding to [Response], and press the soft-key corresponding to [Thru Response] in the sub soft-key menu. Press
the soft-key corresponding to [FWD THRU]. After this menu item turns into [FWD THRU], a calibration Measure is
completed by pressing [DONE Response].
4) Repeat steps b) through c), to complete the required calibration standard Measures.
5.2.2.
Calibration User Configuration
Calibration User Configuration includes two settings, Save Cal File named as date and Do not save files when calibration finished.
5.2.2.1. Mouse or touch screen procedure
1) Single click [UTILITY], click [Configure] in the [System] menu, and click [User Config] in the submenu to display the User
Config dialog box.
Figure 5-9 User Config dialog box
2) Tick Save Cal File named as date in the dialog box.
3) Tick Do not save files when calibration finished in the dialog box.
Page 81
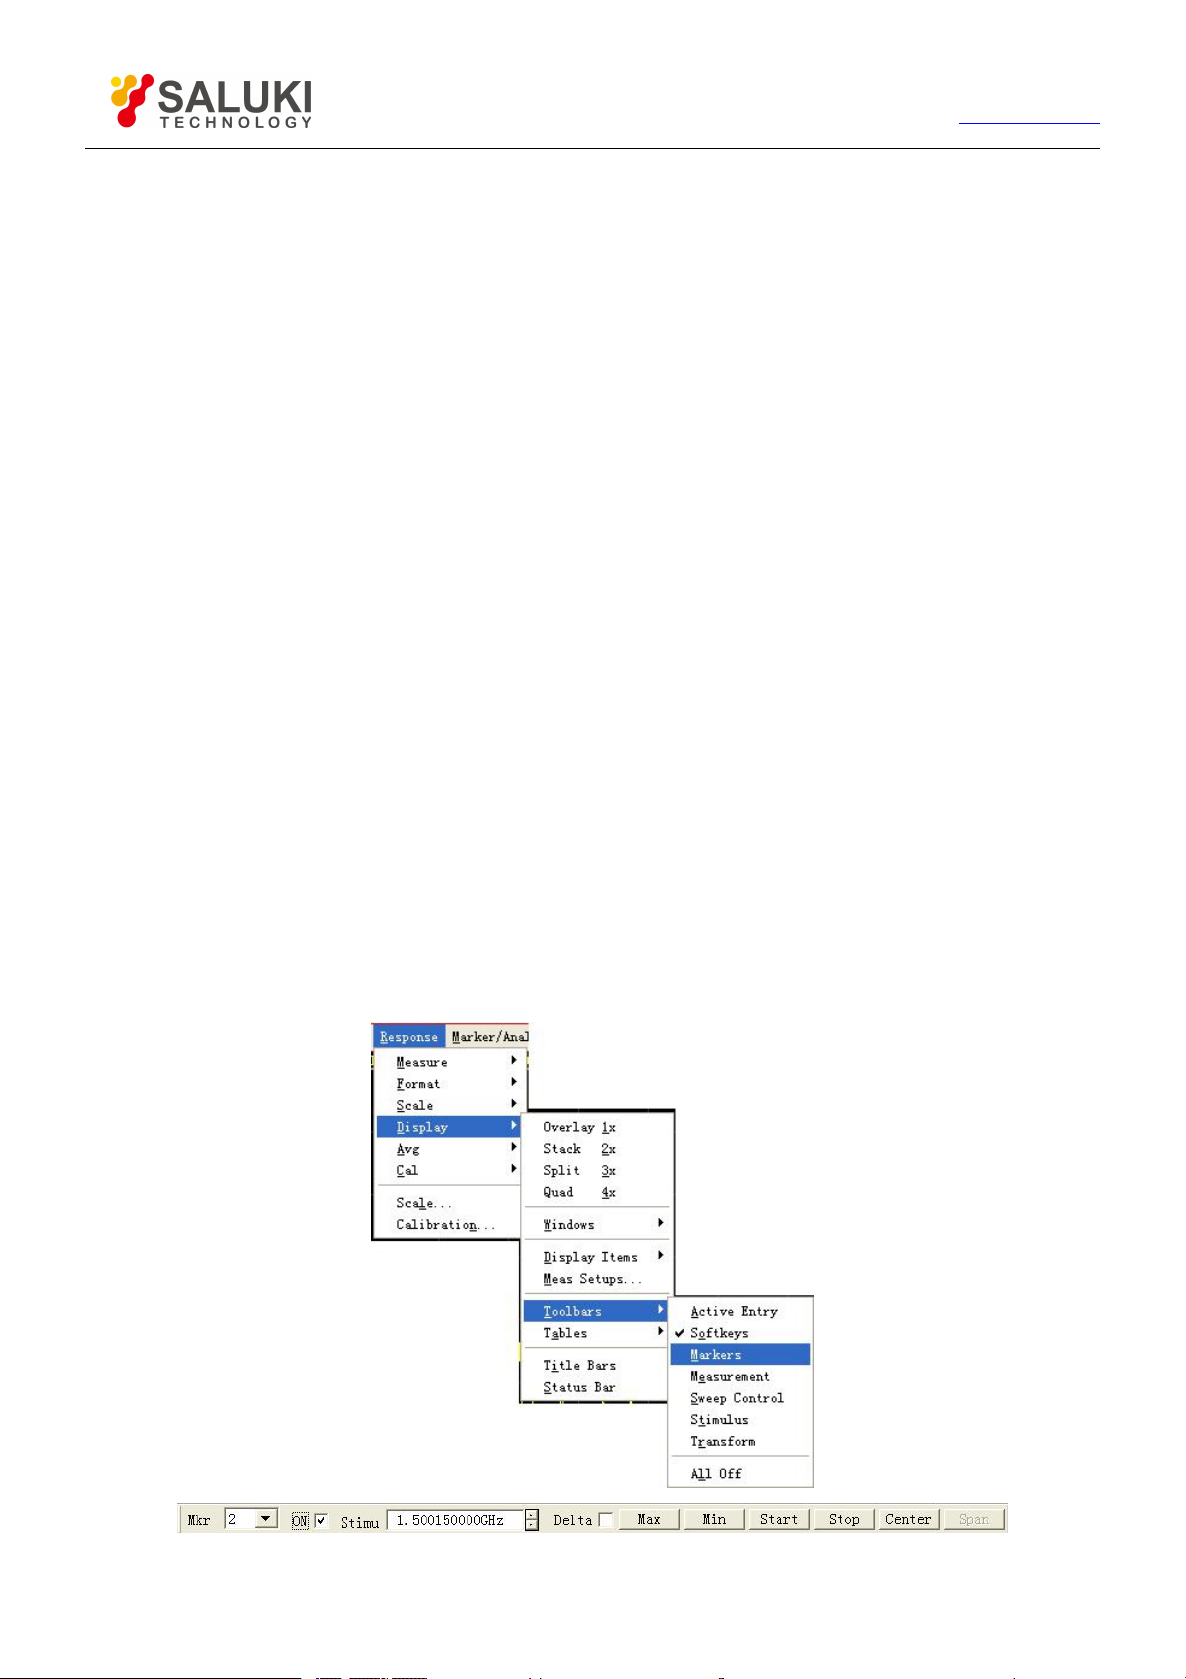
81
Tel: 886.2.2175 2930 Email: [email protected]
www.salukitec.com
6. Data Analysis
This chapter intends to describe how to read Measure result and calculate and Analysis the result, including following contents:
Marker
Trace math and statistics
Limit test
Bandwidth test
Bandwidth searching
Ripple test
Fixture Simulator
Parameter Transformation
Marker
6.1.
Marker can be used to read measured data, search measured values of specified types and change the settings of Analyzer. Each
Trace can use 9 normal markers and 1 reference marker.
6.1.1.1.
By mouse or touch screen -marker toolbar
Create a marker
1) Click [Response], point to [Toolbars] on [Display] menu, click and check [Markers] on Toolbar submenu, then the
Analyzer displays Marker toolbar.
2) Select the marker to be enabled in [Mkr] box of the toolbar.
3) Click and check [ON] check box.
4) Set stimulus values of the marker in [Stimu] box.
Fig. 6-1 Using Marker Toolbar to Create the Marker
Page 82
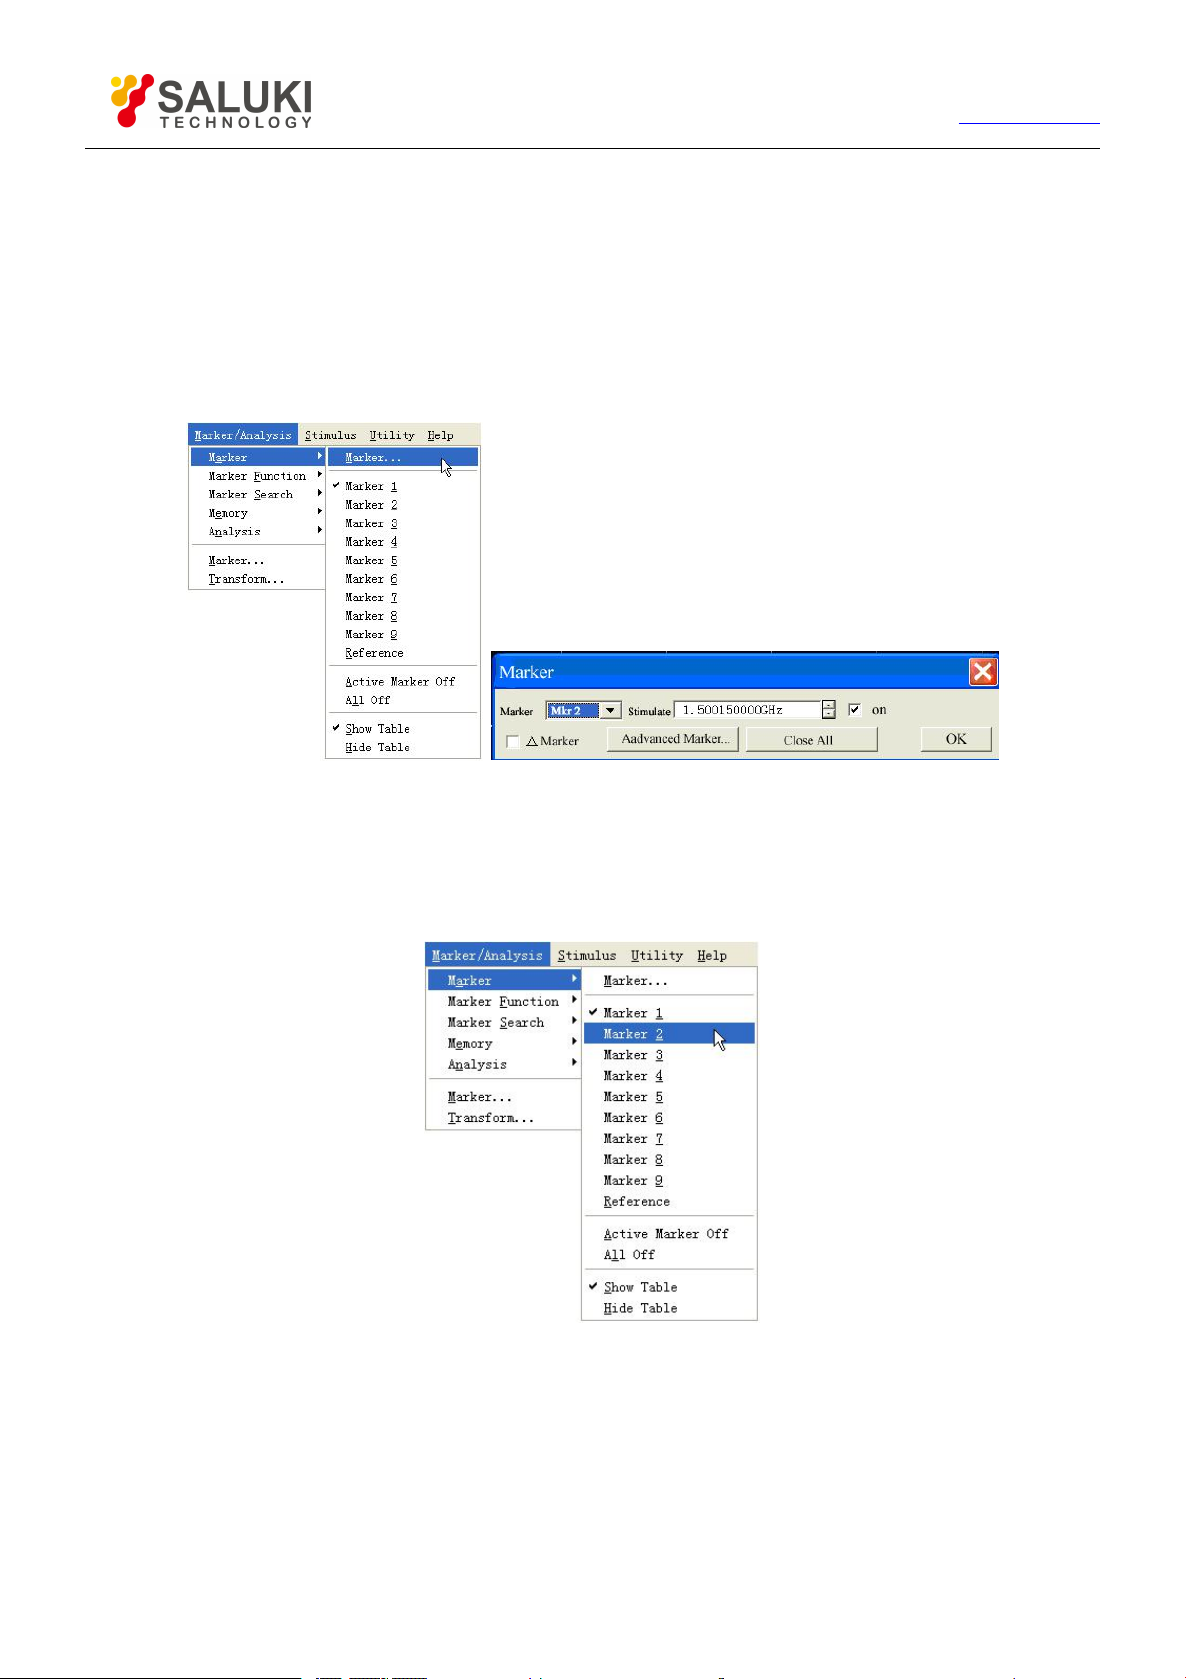
82
6.1.1.2. By mouse or touch screen - marker dialog box
1) Click [Marker/Analysis], click [Marker…] on [Marker] menu, display Marker dialog box.
2) Select the marker to be enabled in [Marker].
3) Click and check [on] check box.
4) Set stimulus values of the marker in [Stimulate].
5) Click [OK] to close the dialog box.
Tel: 886.2.2175 2930 Email: [email protected]
www.salukitec.com
Fig 6-2 Using Marker Dialog Box to Create the Marker
6.1.1.3. By mouse or touch screen -marker menu
1) Click [Marker/Analysis], point to [Marker] on Marker/Analysis menu, display Marker submenu.
2) Click and select the marker to be enabled on submenu.
Fig 6-3 Using Marker Menu to Create Marker
6.1.1.4.
6.1.1.5.
By front panel keys
1) Press 【Marker】 at MKR/ANALYSIS area, display the marker to be enabled in appropriate soft-key menu toolbar.
2) Press the soft-key corresponding to the marker to be enabled to enable the marker.
3) Set marker stimulus values in Marker box of the toolbar.
Marker dialog box
Page 83

83
Tel: 886.2.2175 2930 Email: [email protected]
www.salukitec.com
[Marker]
Used to select the marker to be defined.
[Stimulate]
Set and select the stimulus values of marker axle X.
[on]
Check it to enable the marker in [Marker], clear and close the marker in [Marker].
[△ Marker]
When checking it, the Analyzer displays the relative values between selected marker and marker R. If marker R is not enabled, it will
be enabled automatically.
[Advanced Marker]
Click it and display [Marker Advanced Options] dialog box.
[Close All]
Click it and close all enabled marker.
6.1.2.
Moving the marker
1) Select the marker to be moved by one of the methods mentioned above to make it be the current Stimulus marker.
2) Use appropriate methods to move the marker
a.Click [Stimu] in Marker toolbar, and move the marker by following methods:
Directly input marker stimulus values.
Revolve the knob to move the marker.
Click UpDown on [Stimu] to move the marker.
Press 【↑】or【↓】 in ADJUST area to move the marker.
b.Click [Stimulate] box in Marker dialog box, and move the marker by following methods:
Directly input marker stimulus values.
Revolve the knob to move the marker.
Click UpDown on [Stimulate] box to move the marker.
Press 【↑】or【↓】in ADJUST area to move the marker.
c.Move the marker by following methods in the Marker box of Marker corresponding to the soft-key toolbar.
Directly input stimulus values.
Revolve the knob to move the marker.
Click UpDown on Marker box to move the marker.
Press 【↑】or【↓】 in ADJUST area to move the marker.
For above described methods of moving the marker, the marker can only be moved after it is activated. Besides, S3601 Series
Vector Network Analyzer supports moving the marker by dragging the mouse directly, and the method is:
Point the mouse to indicator “ ” (active marker) or “△” (inactive marker) of the marker to be moved, press left mouse button, then
after the mouse pointer becomes horizontal Adjust indicator “↔”, drag the mouse to the position where the marker is required to be
Page 84
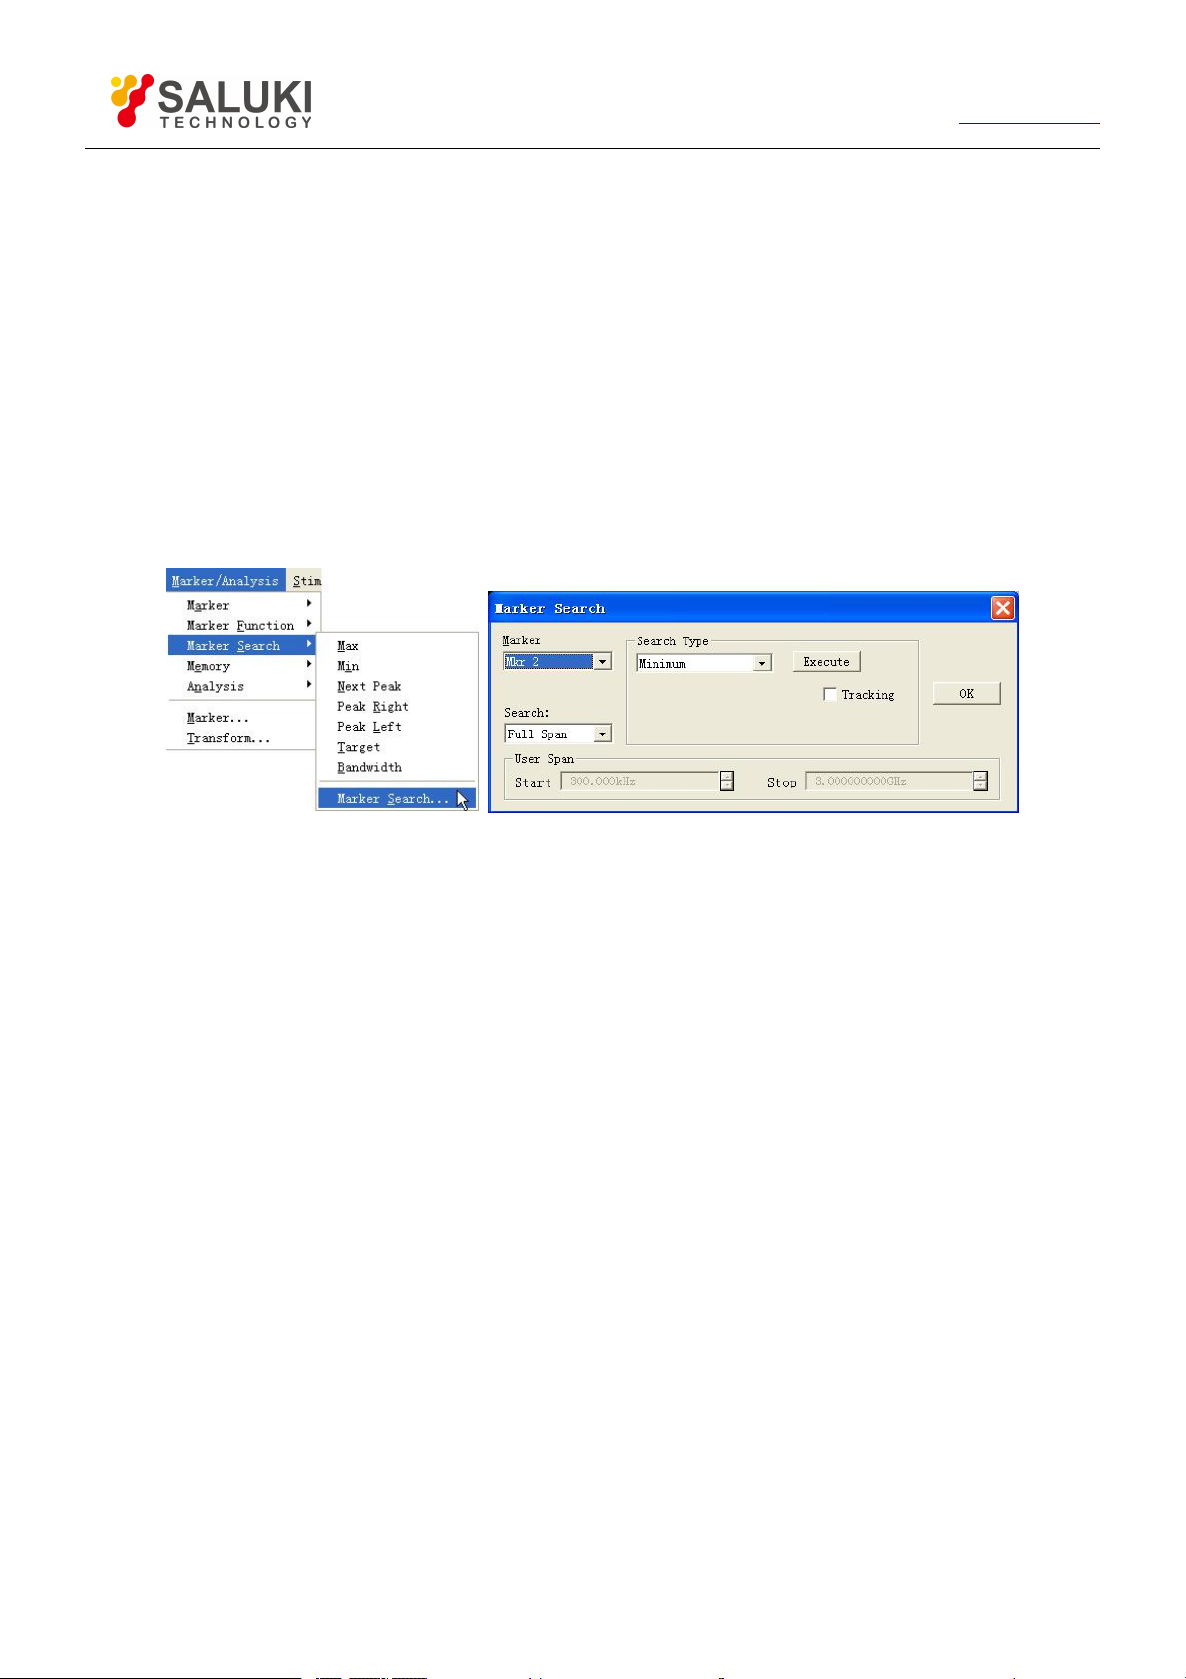
84
Tel: 886.2.2175 2930 Email: [email protected]
www.salukitec.com
moved, release the left mouse button and complete moving the marker.
6.1.3. Marker Search
Marker search function can be used to search special measured value. Without matching measured data, marker will retain
unchanged in the current position.
6.1.3.1.
By mouse or touch screen
1) Click [Marker/Analysis], click [Marker Search…] on [Marker Search] menu, and then Marker Search dialog box will
be displayed.
2) Select the marker used for searching measured value in the [Marker].
3) Set up search type and search domain in the dialog box, and click [Execute] to search measured value.
4) Click [OK] to close the dialog box.
6.1.3.2. By front panel keys
Figure 6-4 Marker Search
1) Press【Search】in MKR/ANALYSIS area.
2) Press corresponding soft-key to select search function in soft-key search toolbar.
6.1.3.3. Marker Search dialog box
[Marker]
Select the marker which makes search definition and implements search function.
[Search]
It is used to define the search scope of marker; the default search scope is full bandwidth, and in addition, it supports 9 users’
settings. When selecting the search scope of user settings, definition must be made for user settings in the scope of user domain.
The search scopes of user settings can be mutually overlapped, and different markers can use the same search domain; the
following figure shows a set of search scopes of user settings.
Page 85
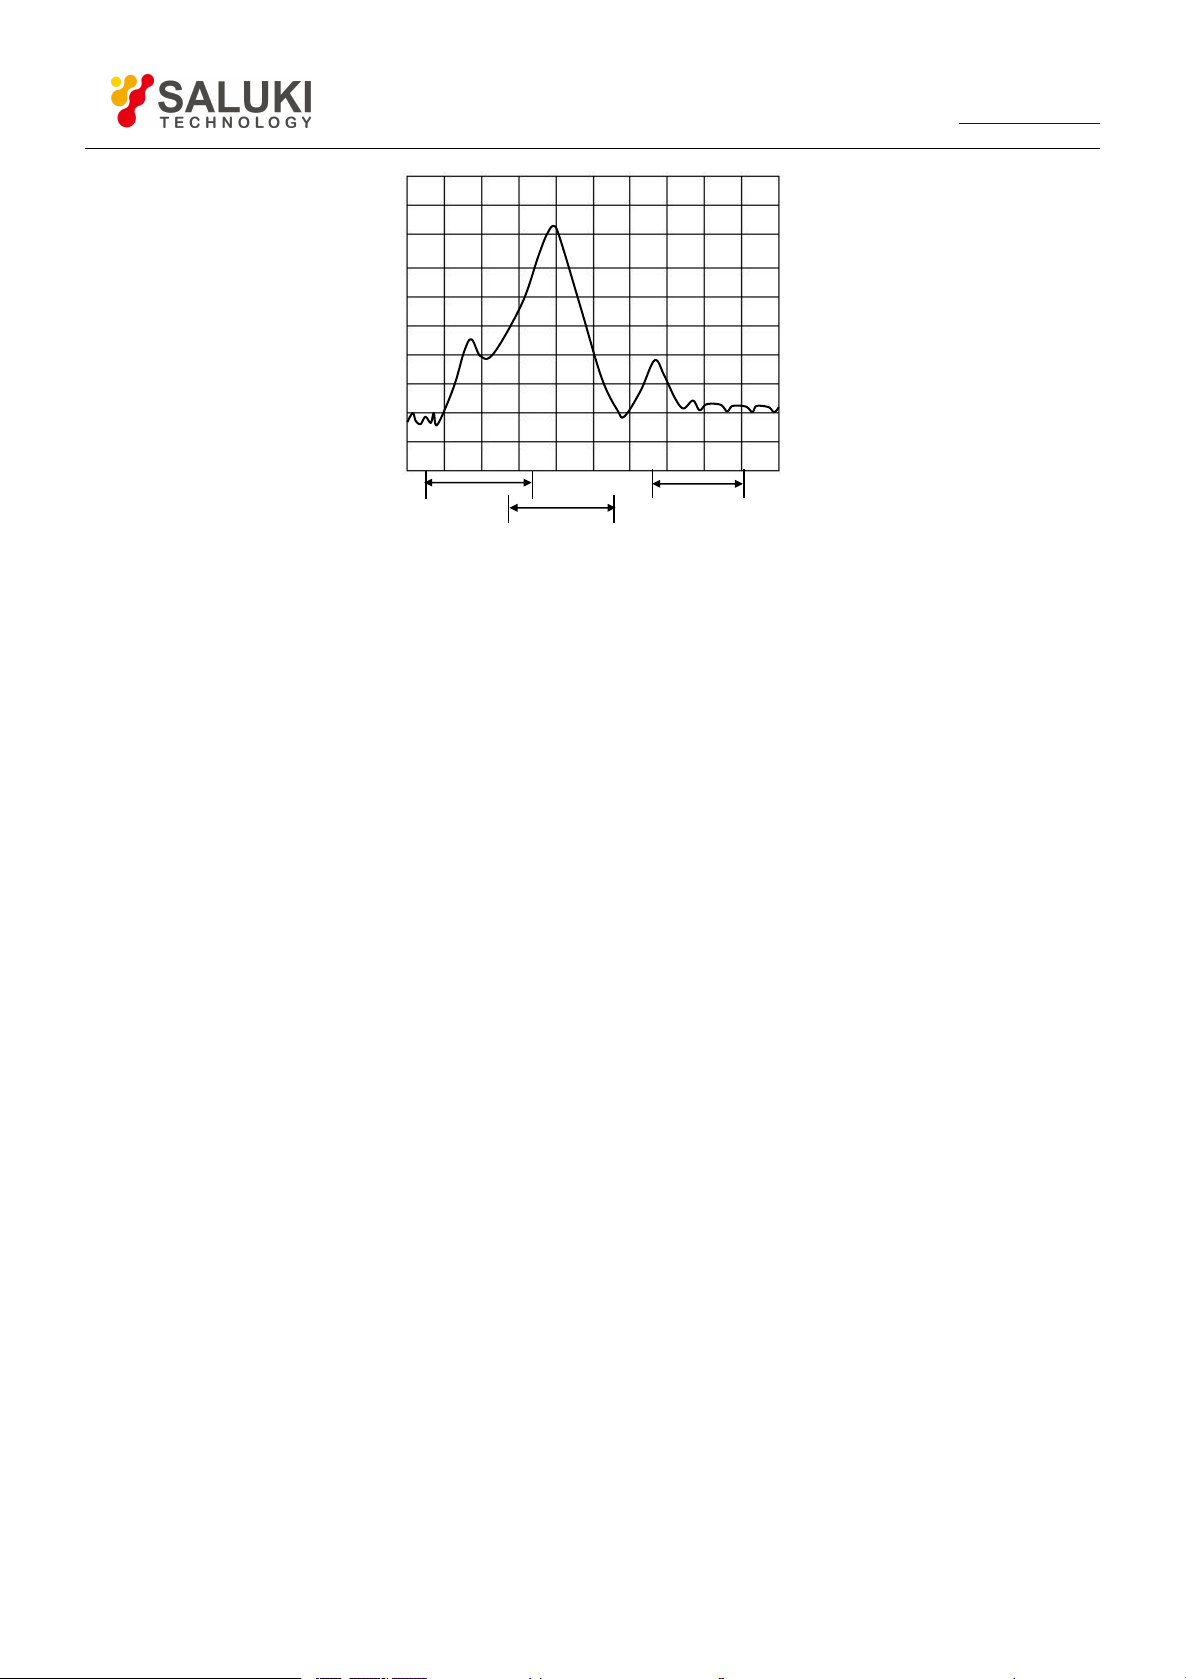
85
User 1
User 2
User 3
Figure 6-5 Search Scope of User Settings
User Span
Define search scope of user settings through [Start] and [Stop] box.
Tel: 886.2.2175 2930 Email: [email protected]
www.salukitec.com
Search Type Zone
a) [Type]
It is used to select search type of marker; the Analyzer supports the following 7 search types.
Minimum value: to search the minimum measured data point.
Maximum value: to search the maximum measured data point.
Right peak value: to search the next effective peak value at the right side of marker.
Left peak value: to search the next effective peak value at the left side of marker.
Next peak value: to search the next peak value lower than current marker amplitude value.
When searching peak value, definition of peak must be made at first. Definition of peak is made through [threshold] and [shift] boxes.
[Threshold] defines the minimum peak point. The peak point of effective peak must be above threshold, and valleys at both sides can
be lower than threshold. [Bias] defines the minimum vertical distance between peak point and valley point, the vertical distance
between the peak value of effective peak and valleys at both sides must be larger than offset value. The default threshold value is
-100dB, and offset value is 3dB. Definition and settings of peak value for Analyzer are as below:
Threshold: -50dB
Bias: 10dB
Scale: 10dB/grid
In the following figure, A is an effective peak, threshold and offset of which satisfy requirements; B is not an effective peak, without
satisfactory offset; C is also not an effective peak, without satisfactory threshold.
Page 86
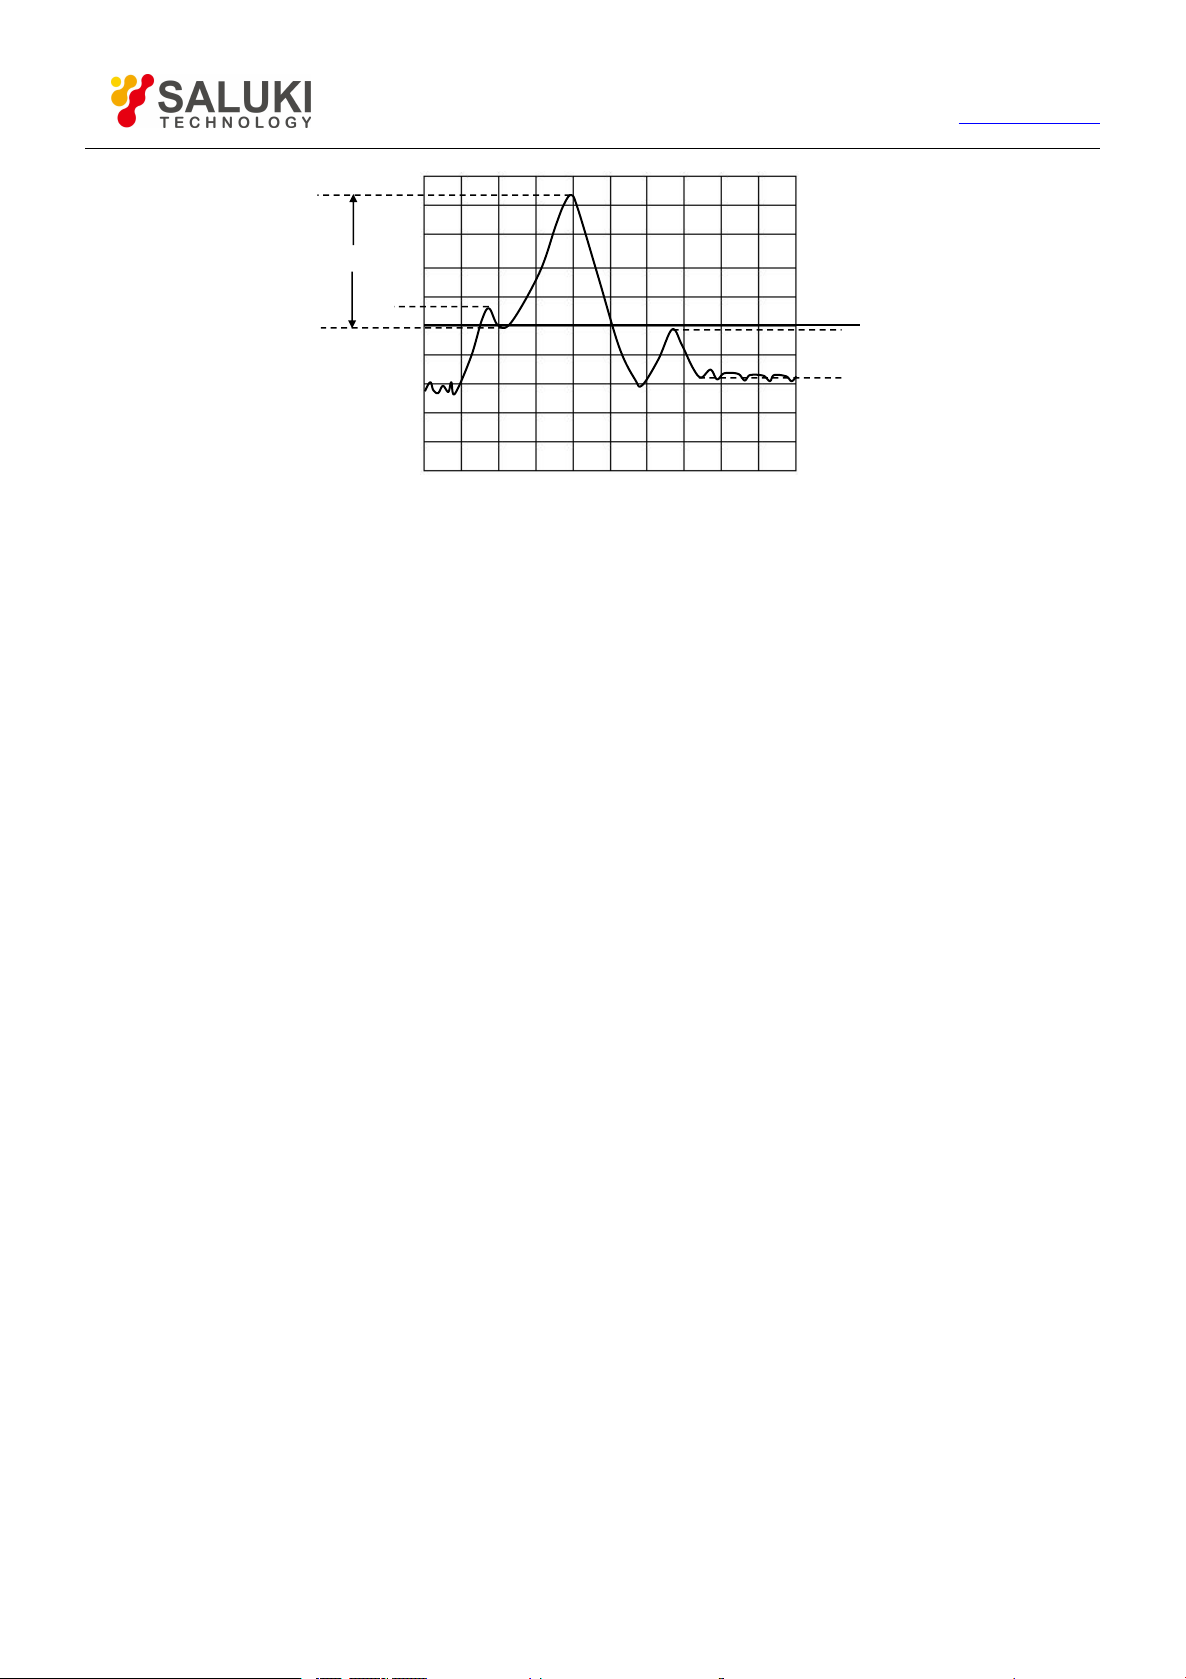
86
Tel: 886.2.2175 2930 Email: [email protected]
BCA
-50dB
www.salukitec.com
Figure 6-6 Definition of Peak
Target: input the target value to be searched in the [Logarithm Value], and click [Execute] value. When marker moves to
the first target value at the right side of current marker position, continuously click [Execute] to make marker move to the next
target value at the right side until to the highest end of stimulus value, and then return to the lowest end of stimulus value to
search target value.
When selecting [Discrete Marker] in the [Marker Advanced Options], if a data point is respectively at both sides of
interpolative target value, marker will move to the discrete data point most close to the target value.
When clearing [Discrete Marker] in the [Marker Advanced Options], marker will move to the interpolative data point
equal to target value.
Left target: only searching the target value at the left side of current marker.
Right target: only searching the target value at the right side of current marker.
Bandwidth: when selecting bandwidth search function, set up level which drops from peak value at both sides in [level]
(defaulted as -3dB), click [Execute] to make bandwidth Measure at this level. Use marker 1~4 during Measure, marker 1
searches the maximum peak value, marker 2 searches the point at the left side of peak value dropping to the specified level,
marker 3 searches the point at the right side of peak value dropping to the specified level, and marker 4 searches the center
point of bandwidth, and the following data will be shown after the completion of Measure:
Marker1: X-axis value and Y-axis values of peak point.
Bandwidth: X-axis D-value of marker 2 and 3.
Center: X-axis center value between marker 2 and 3.
Q-value: Ratio of center frequency to bandwidth.
Loss: Y-axis value of marker 4, this is the loss value of filter center.
b) [Execute]
Click [Execute] button to carry out marker search with specified type once.
c) [Tracking]
When selecting [Tracing] check box, Analyzer shall implement search function after the completion of Sweep each time according to
the current search type and settings of search domain, thus it can be ensured that marker is at the expected position after Sweep
every time. If marker Tracing function is on, the stimulus value of search marker can be manually set up.
6.1.4.
Marker Function
Status settings of Analyzer can be changed by Stimulus marker position, such as initial frequency and stop frequency.
6.1.4.1.
Set up Measure by marker function
Page 87
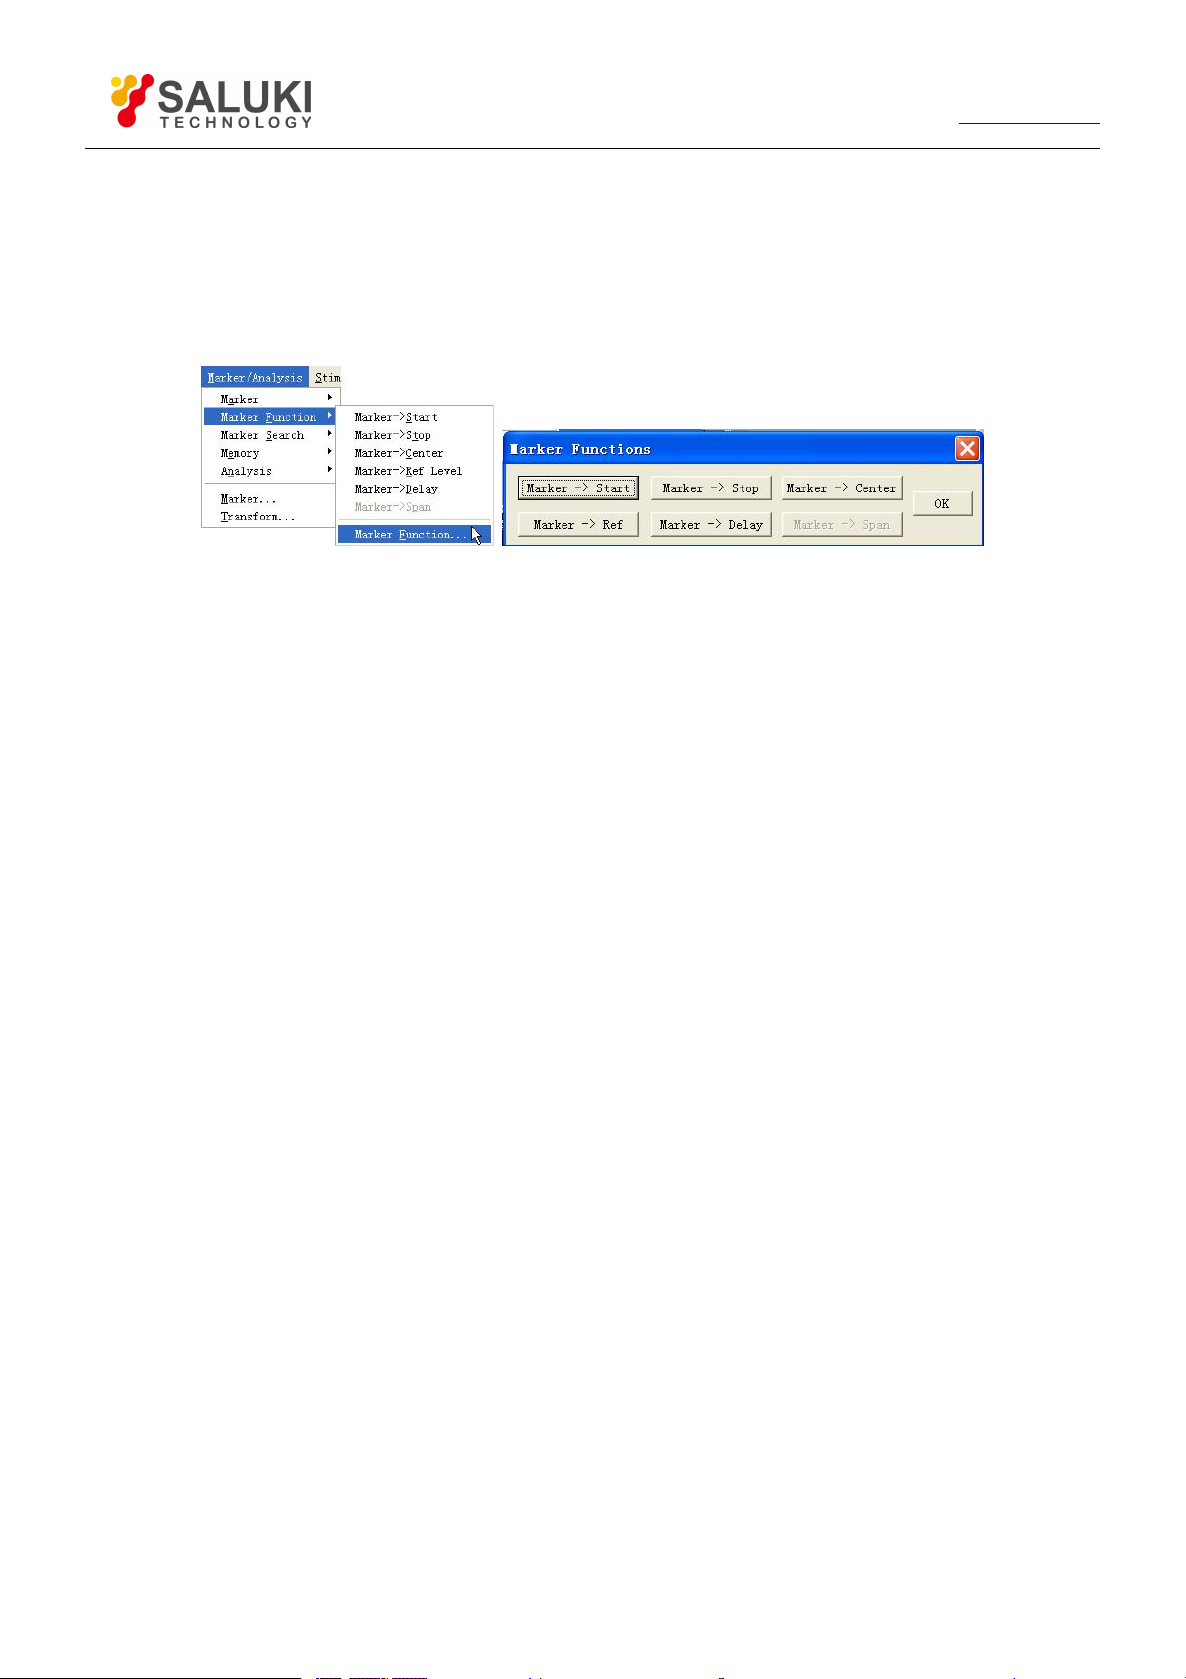
87
By mouse or touch screen -marker function dialog box
1) Click [Marker/Analysis], and click [Marker Function…] on the [Marker Function] menu to display Marker Function
dialog box.
2) Select the required Analyzer function settings in the dialog box.
3) Click [OK] to close the dialog box after setting is complete.
Figure 6-7 Measure by Use of Marker Function Dialog box Settings
By mouse or touch screen -marker toolbar
1) Click [Response], point to [Toolbar] of the [Display] submenu, click and select [Marker] on the Toolbar submenu to
display Marker toolbar.
Tel: 886.2.2175 2930 Email: [email protected]
www.salukitec.com
2) Select the required Analyzer function settings in the Marker toolbar.
By front panel keys
1) Press 【Marker】in MKR/ANALYSIS area.
2) Press corresponding soft-key of [Marker Functions], and press corresponding soft-key to select Analyzer setting
functions in the arisen marker function soft-key toolbar.
Marker function dialog box
[Marker->Start]
When clicking, start value of Sweep Setup is equal to the value for Stimulus marker.
[Marker->Stop]
When clicking, stop value of Sweep Setup is equal to the value for Stimulus marker.
[Marker->Center]
When clicking, center value of Sweep Setup is equal to the value for Stimulus marker.
[Marker->Ref Level]
When clicking, reference value settings are equal to response values for Stimulus marker.
[Marker->Delay]
When clicking [Marker->Delay] button, Analyzer will use phase slope to adjust Electrical delay of receiving path, thus the phase locus
near the Stimulus marker can be flatten. This function can be used to make electrical length and phase offset Measure, and it is only
applicable for ratio Measure.
[Marker->Span]
When clicking it, span value of Sweep Setup is equal to activation D-value between Stimulus marker and marker R (△ marker value),
and this button is only valid when marker is Stimulus and △ marker function is on.
6.1.5.
Advanced Marker Option Setting
Page 88
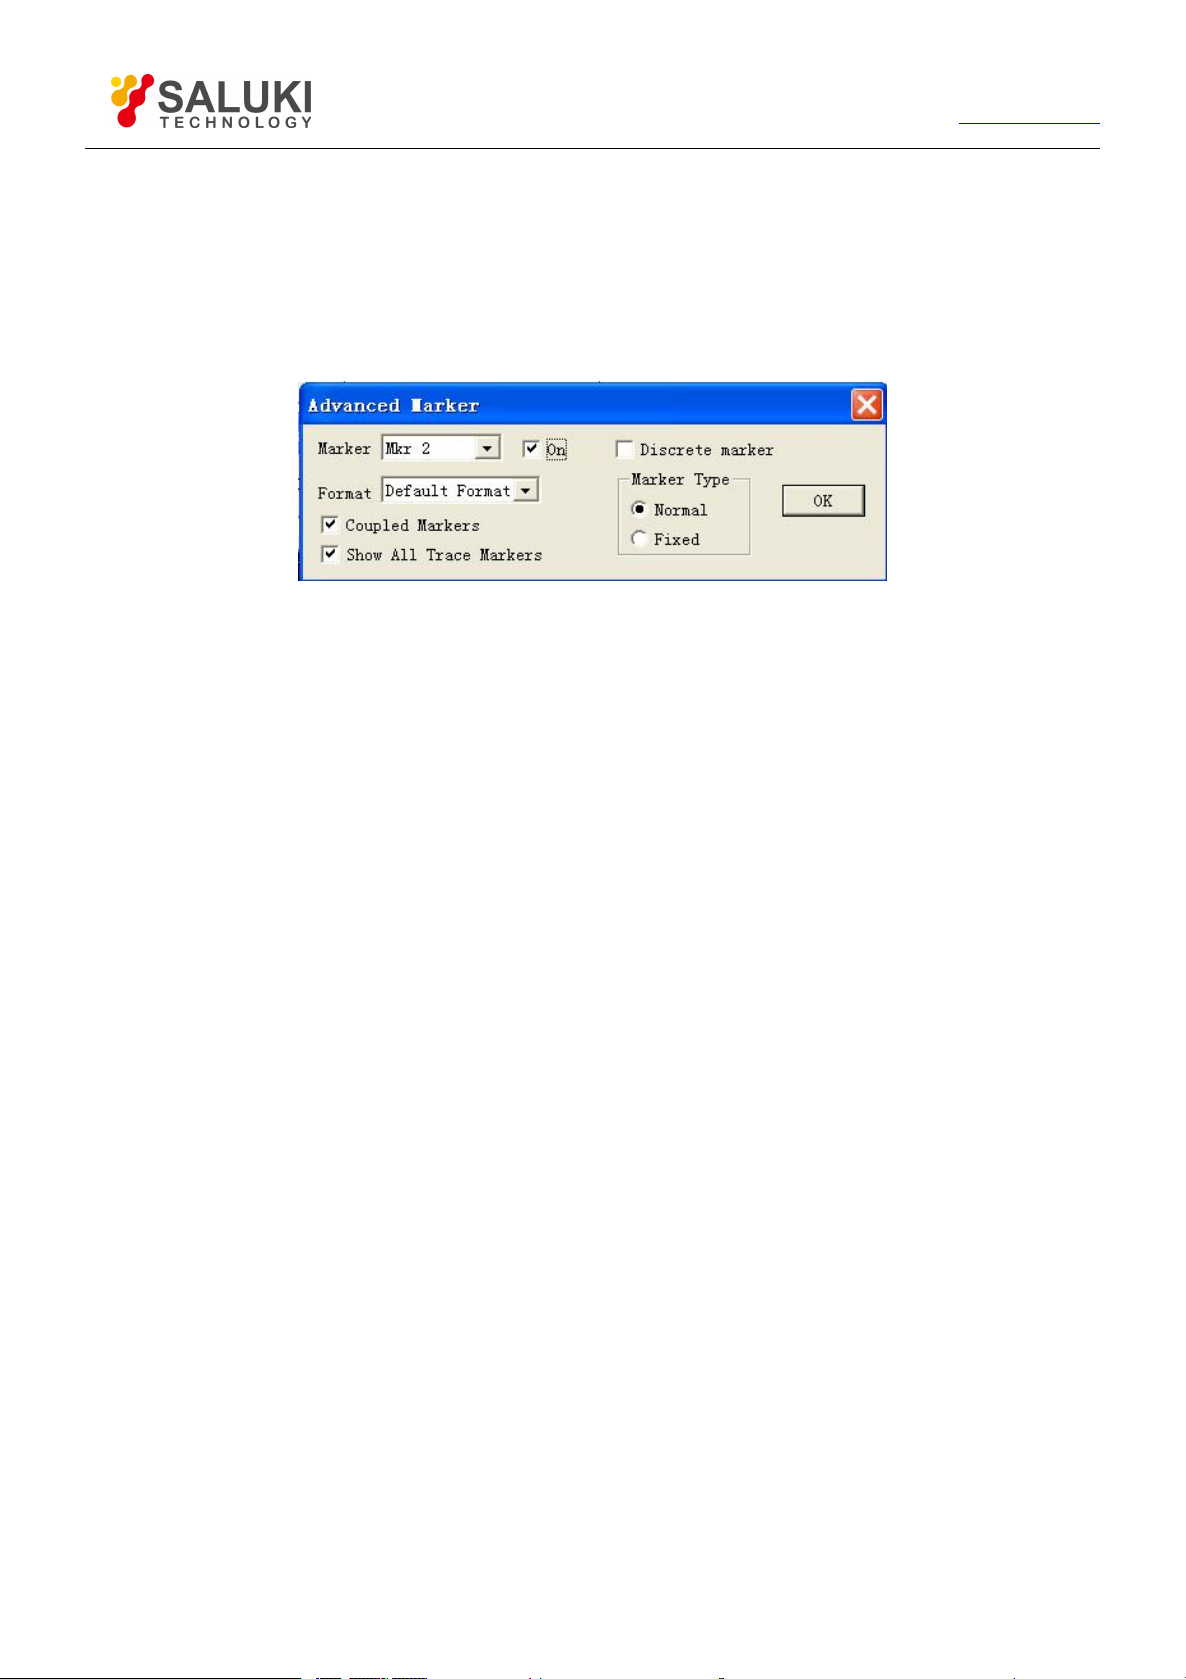
88
6.1.5.1. By mouse or touch screen
1) Click [Marker/Analysis], and click [Marker …] on the [Marker] menu to display Marker dialog box.
2) Click [Advanced Marker…] button to display Advanced Marker dialog box.
3) Set up marker in the dialog box.
4) Click [OK] to close the dialog box.
Figure 6-8 Marker Advanced Options Dialog box
6.1.5.2. By front panel keys
Tel: 886.2.2175 2930 Email: [email protected]
www.salukitec.com
1) Press 【 Marker 】 in MKR/ANALYSIS area, and press corresponding soft-key of [Marker Properties] i the arisen
soft-key menu.
2) Press corresponding soft-key of [Advanced Marker] to display Advanced Marker dialog box.
3) Set up marker in the dialog box.
4) Press 【OK】in the input keypad to close the dialog box after settings are completed.
6.1.5.3.
[Marker]
Select the marker to be set up.
[On]
When it is selected, marker in [Marker] box will be displayed on screen, and corresponding marker display will be close if it is cleared.
[Discrete Marker]
When it is selected, marker only displays data at actual measuring point, and it also displays interpolative data point between
measuring points when it is cleared.
[Format]
Select the format of marker to display measured data, the format of marker data can be different from that of screen Trace data, but
they are same under the default condition.
Advanced Marker dialog box
[Coupled Marker]
When selecting and enabling marker coupling function, markers with the same number on different Traces and corresponding
markers on Active Traces have the same stimulus value settings. Change of Stimulus settings of Stimulus marker can also change
Stimulus settings of markers with the same number on other Traces at the same time. If domains of X-axis are identical (for instance,
the same as frequency domain or time domain), all markers of channels, Traces and windows are coupled, and the markers on
Traces different from Active Traces X-axis will not be coupled. When clearing the check box, only settings for Stimulus marker can be
changed.
[Show All Trace Markers]
Page 89
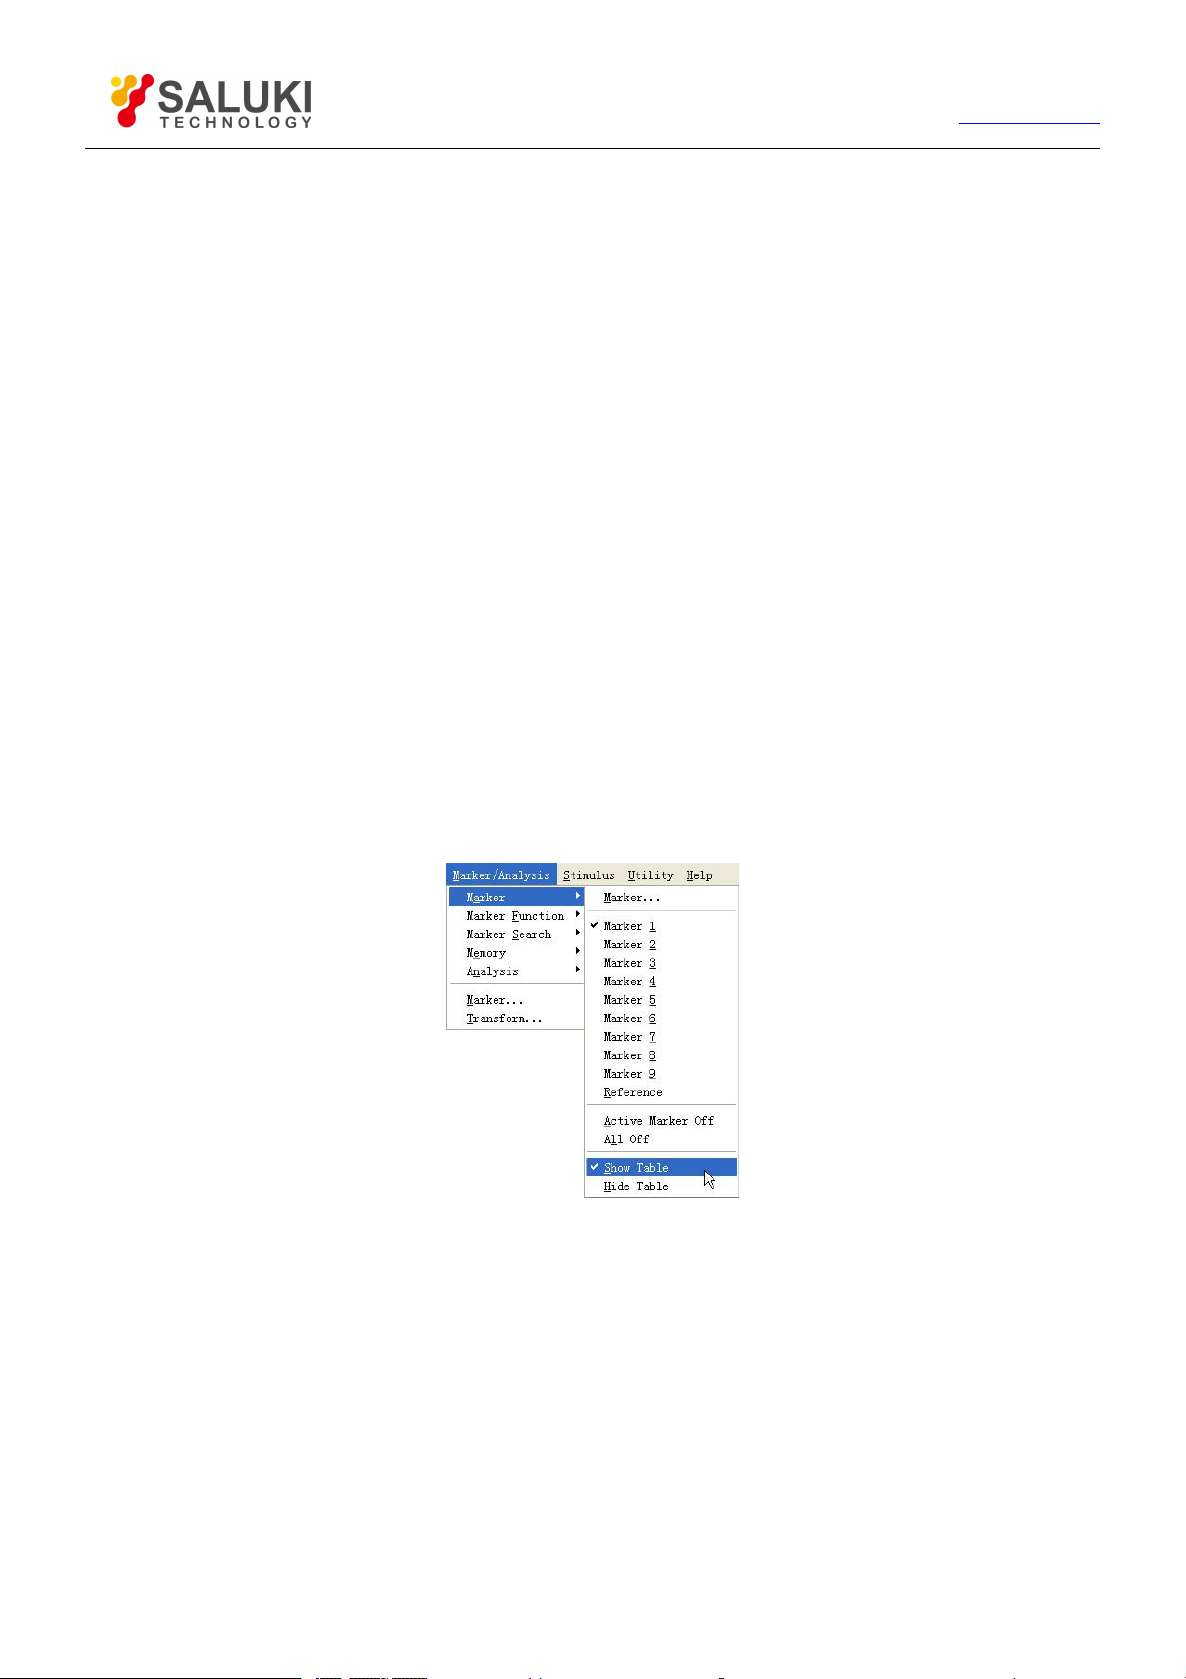
89
Tel: 886.2.2175 2930 Email: [email protected]
www.salukitec.com
When selecting it, markers of all Traces will be displayed, and when clearing it, only markers of Active Traces will be displayed.
Marker type
[Normal]
Standard marker has fixed X-axis position, Y-axis position will change with amplitude of Trace data, and marker can be shifted left
and right on X-axis by changing stimulus value of marker.
[Fixed]
According to the position on Traces when it is set up as Fixed type marker, the marker will constantly keep fixed X-axis and Y-axis
coordinates unchanged; it will not fluctuate with change of Trace data amplitude. Its position on X-axis can be shifted by changing its
stimulus value, but coordinate on Y-axis can remain unchanged. This type of marker is mainly used to observe change of Trace
marker, for example, the fixed type marker can be used to compare variance of insertion loss before and after tuning wave-filter.
6.1.6.
Marker Table can be enabled to display all marker data of Active Traces, and marker data will be displayed in specified format of
each marker.
Marker Table
6.1.6.1. Settings of show table
By mouse or touch screen -marker menu
1) Click [Marker/Analysis], point to [Marker] in Marker/Analysis menu.
2) Select [Show Table] in submenu to enable Show table.
3) Select [Hide Table] in submenu to close Show table.
Figure 6-9 Settings of Show table via Marker Menu
By mouse or touch screen -view menu
1) Click [Response], point to [Table] in [Display] menu.
2) Select [Marker Table] in submenu of Table to enable Marker Table display.
3) Click clear and select [Marker Table] in submenu of Table to close Marker Table display.
Page 90
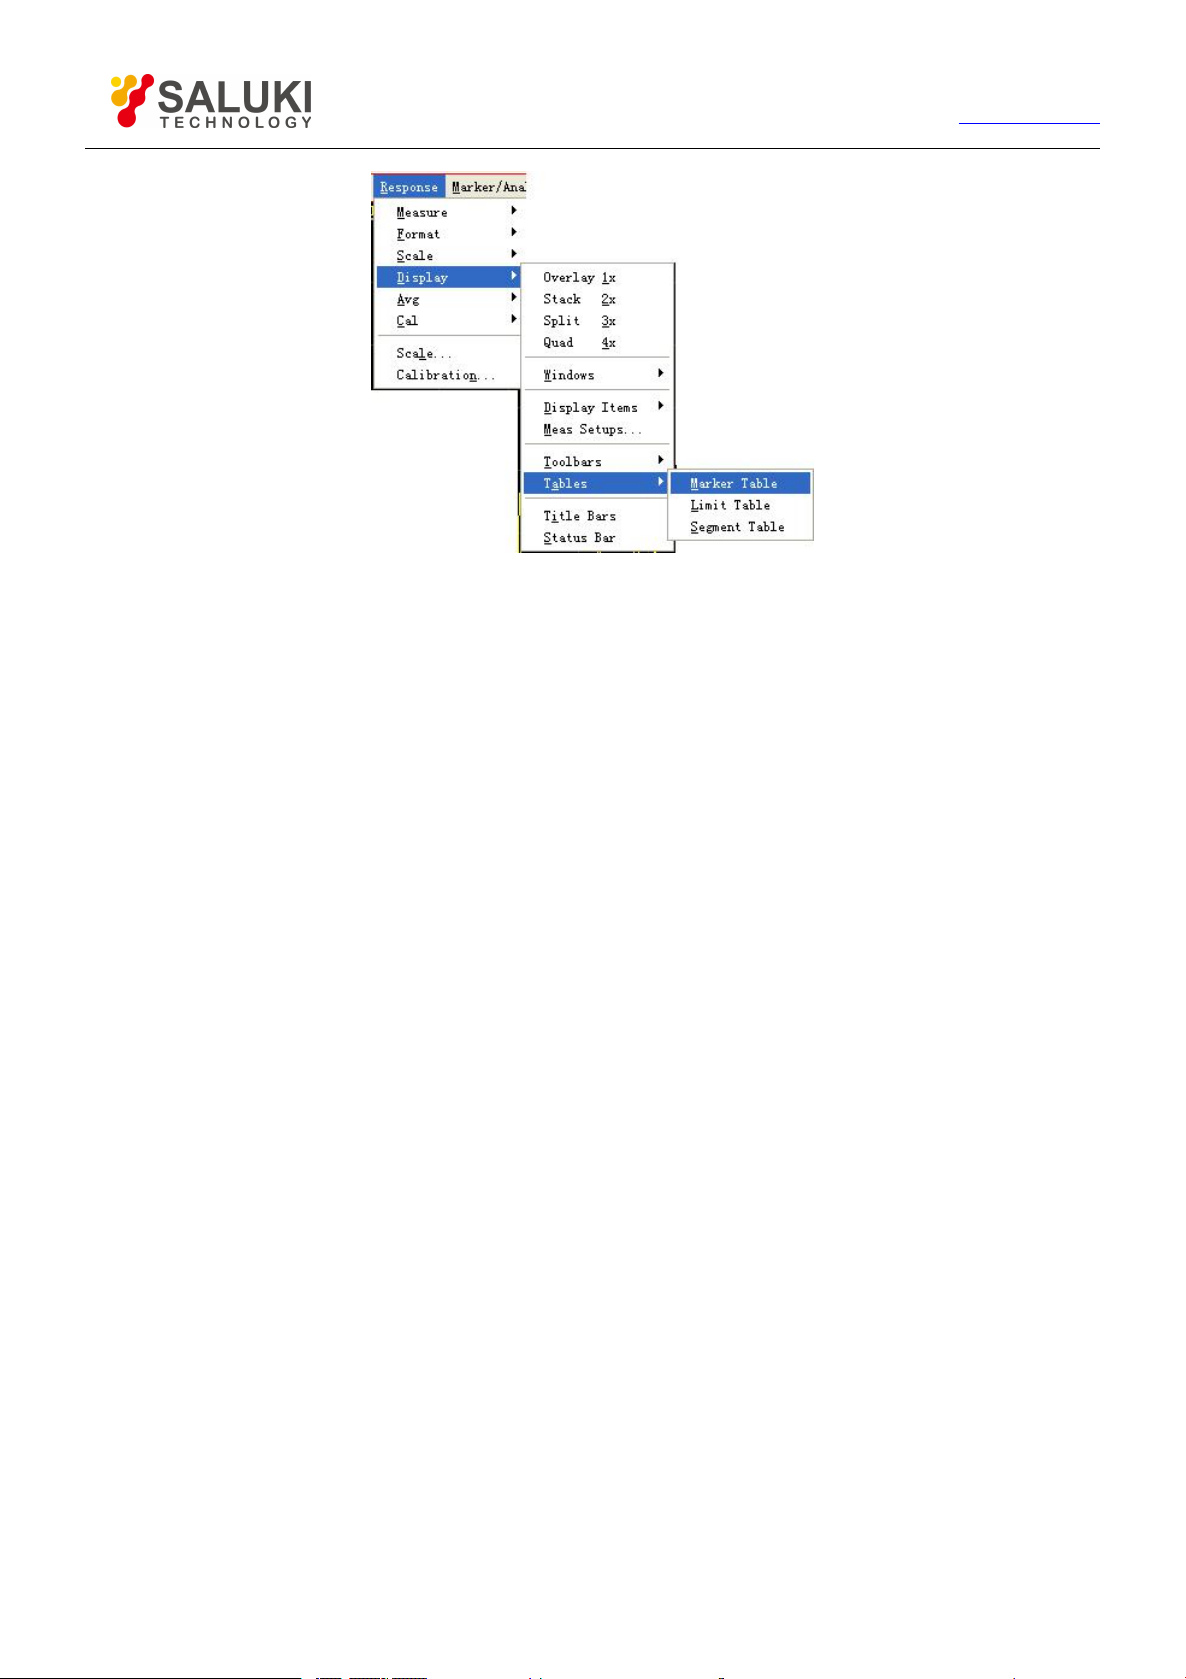
90
By front panel keys
Tel: 886.2.2175 2930 Email: [email protected]
www.salukitec.com
Figure 6-10 Settings of Marker Table Display by View Menu
1) Press 【Display】in RESPONSE area, and press [More] corresponding soft-key on arisen soft-key menu.
2) Press corresponding soft-key of [Tables], press corresponding soft-key of [Marker Table] in arisen soft-key menu to
select and enable Marker Table display.
3) Press corresponding soft-key of [Hide Table] to select and close Marker Table display.
6.2.Trace Math and Statistics
Analyzer can carry out 4 types of mathematical operation to current Active Trace and storage Trace; in addition, it also provides 3
kinds of Trace statistical functions.
6.2.1.
Before Execution of any type of Trace math, a Trace must be saved in memory, and Trace math is vector operation made on complex
data before formatted display.
6.2.1.1.
By mouse or touch screen
Trace Math
Settings of Trace math
1) Click [Marker/Analysis], and click [Math/Memory] on [Memory] menu to display Math/Memory dialog box.
2) Set up math and display of Trace in the dialog box.
3) Click [OK] button to close the dialog box.
Page 91
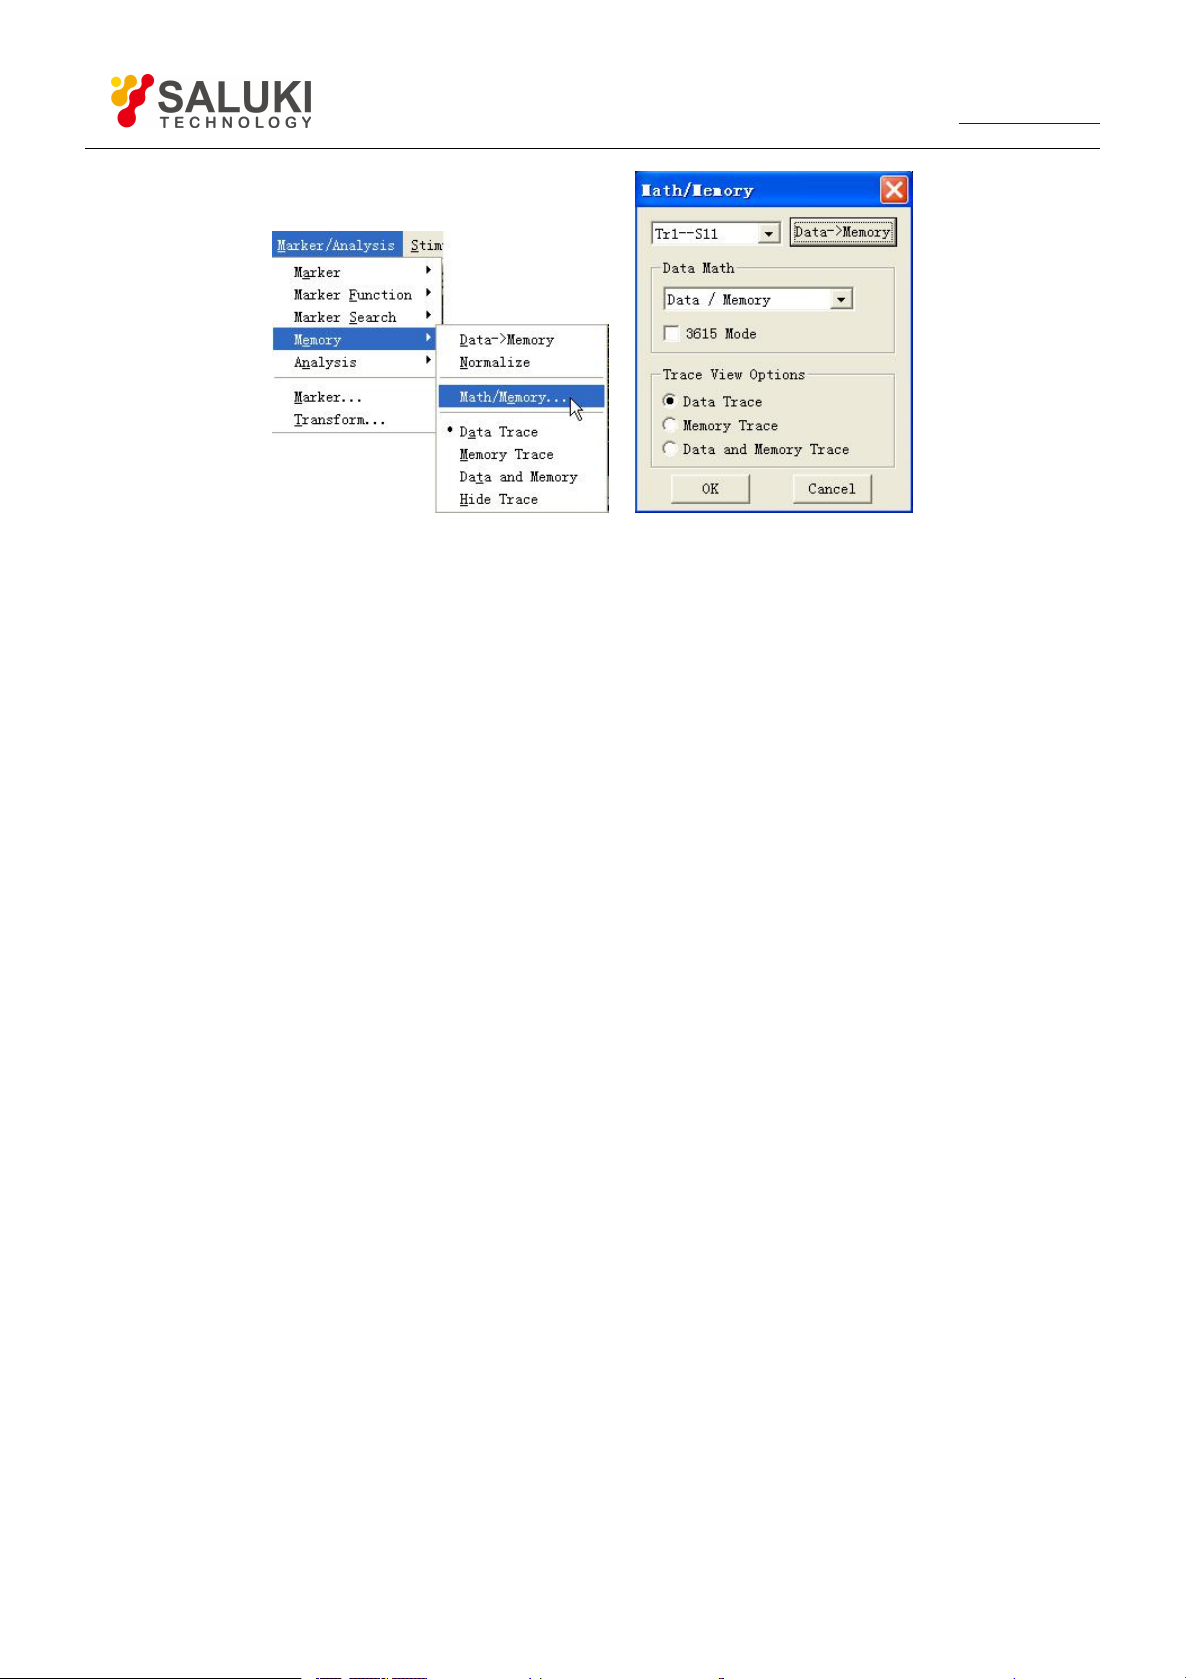
91
By front panel keys
1) Press【Memory】key in MKR/ANALYSIS area.
Tel: 886.2.2175 2930 Email: [email protected]
www.salukitec.com
Figure 6-11 Settings of Trace Math
2) Press corresponding soft-key of [Data->Memory] to save current measured Trace data in memory.
3) Press corresponding soft-key of [Date Math Off] to display various mathematical operation and set up computation of
Trace according to corresponding soft-key.
4) Press corresponding soft-key of [Data Trace] to display measured data.
5) Press corresponding soft-key of [Memory Trace] to only display measured data.
6) Press corresponding soft-key of [ Data and Memory] to display measured data and stored data at the same time.
Computation/ Storage dialog box
[Data->Memory]
When clicking it, current measured data will be saved in memory.
[Data Math]
It is used to select Trace math type, and the Analyzer supports the following Trace math:
Data: it will not make any type of mathematical operation.
Data + Memory: it will implement addition computation for measured data and stored data.
Data – Memory: it implements subtraction operation for measured data and stored data, and this function can be used for
simple error correction; firstly save vector error data in memory, and then subtract error data from measured data of the part.
Data * Memory: it will implement multiplication operation for measured data and stored data.
Data / Memory: it implements division operation for measured data and stored data, and this function is mainly used to make
ratio Measure, such as gain and attenuation Measure.
Trace View Option Zone
[Data Trace]
When it is selected, data after Trace math will be only displayed.
[Memory Trace]
When it is selected, stored Trace data will be only displayed.
Page 92
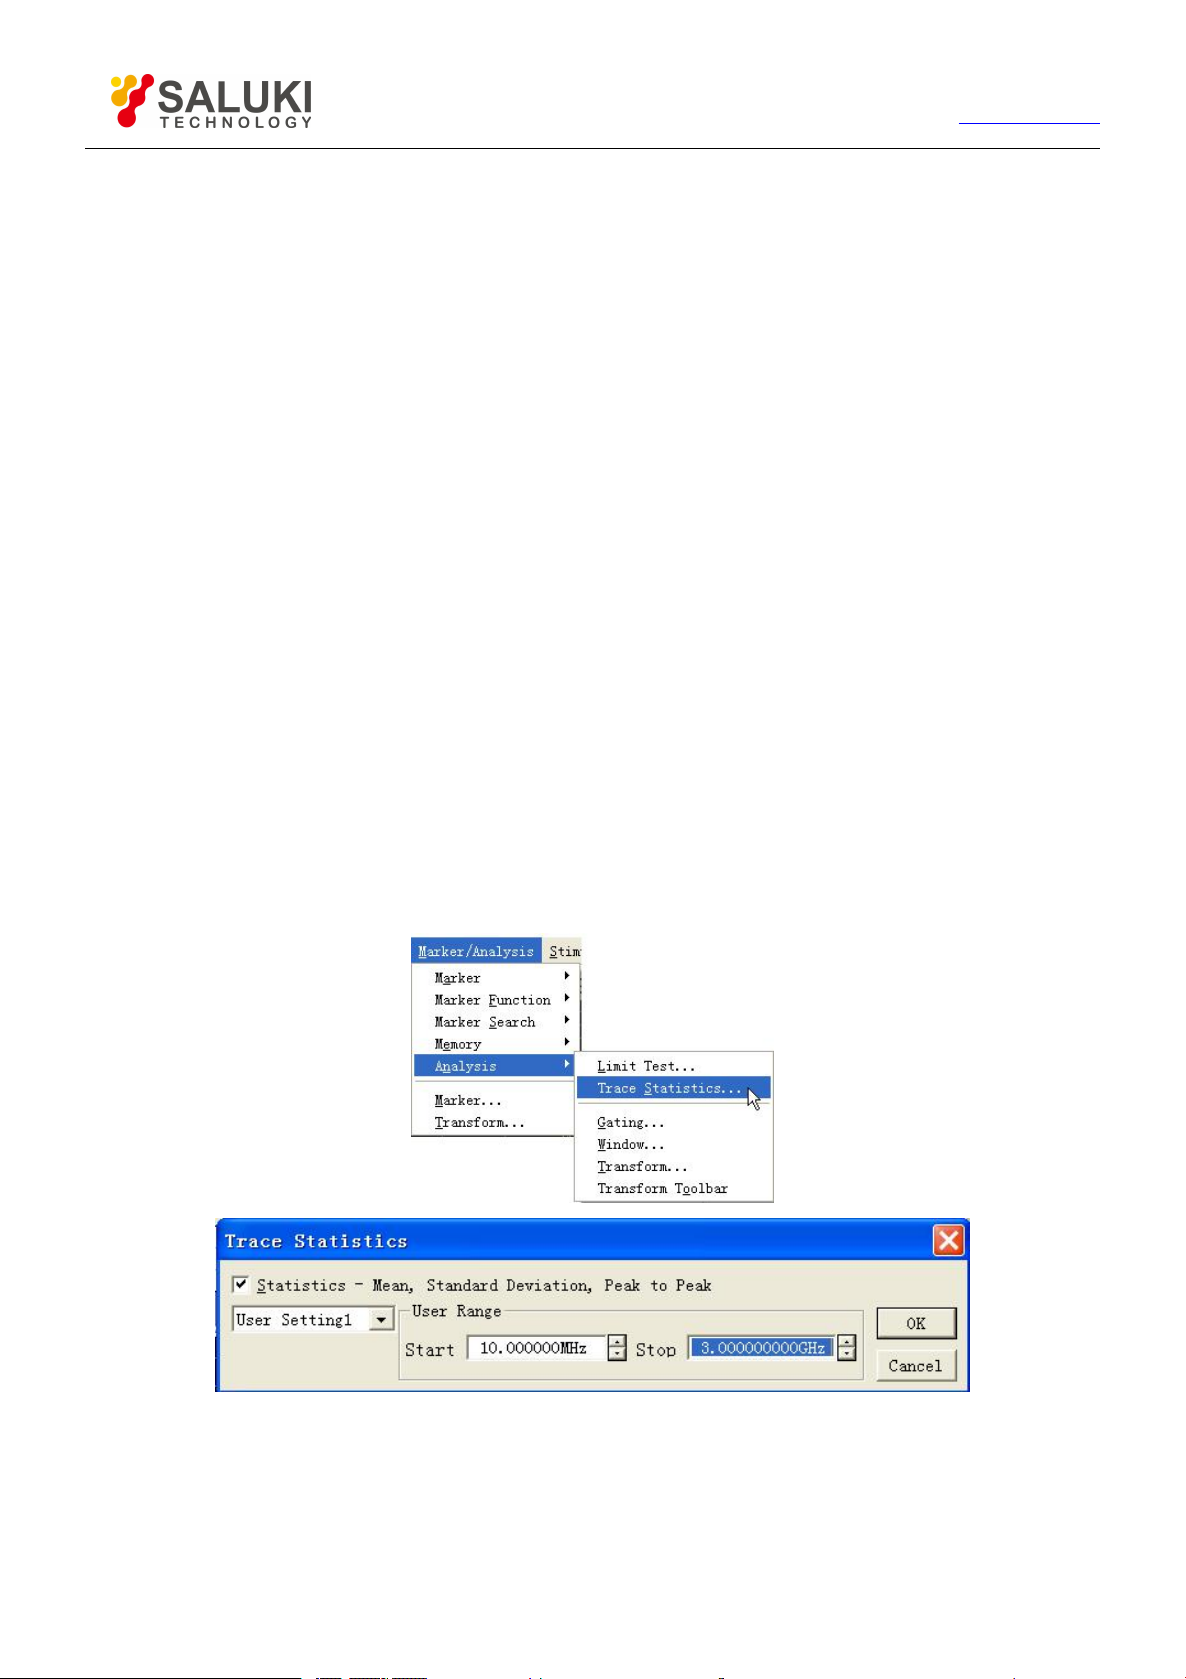
92
Tel: 886.2.2175 2930 Email: [email protected]
[Data and Memory Trace]
When selecting it, data Trace and storage Trace after Trace math will be displayed at the same time.
www.salukitec.com
6.2.2.
The Analyzer provides statistics functions for average, standard deviation and peak-to-peak value Traces, which can be used to
calculate full Stimulus bandwidth or statistical value within user definition scope. Each channel supports full bandwidth and statistical
ranges of 9 user settings, these ranges are identical to search domain of user settings in marker search, they use the same memory
address, therefore, they share the same Stimulus settings. If search domain of channel user settings is defined through marker
search function, the same range settings can be called by selecting corresponding user settings in Trace statistics.
Trace statistical function can easily measure peak-peak value of pass-band ripple wave without searching maximum value and
minimum value. Statistic of Trace is calculated according to data display format:
Rectangular Coordinates Format: statistic is calculated according to displayed scalar data.
Polar Coordinates and Smith Chart Format: statistic is calculated according to display value of data in log-magnitude format.
Trace Statistics
6.2.2.1. Settings of Trace statistics
By mouse or touch screen
1) Click [Marker/Analysis], and click [Trace Statistics…] on the [Analysis] menu to display Trace Statistics dialog box.
2) Click [Statistics] and select check box to enable Trace statistical function.
3) Click [User Range] box to select setting of Trace statistical range.
4) If select user settings range, click [Start] and [Stop] in definition zone of user domain, and input definition of user
settings range.
5) Click [OK] to close the dialog box after settings are completed.
By front panel keys
Figure 6-12 Settings of Trace Statistics
1) Press 【 Analysis】 in MKR/ANALYSIS area, and press corresponding soft-key of [Statistics] on arisen soft-key
menu.
2) Press corresponding soft-key of [Trace Statistics…] to display Trace Statistics dialog box.
Page 93

93
Tel: 886.2.2175 2930 Email: [email protected]
3) Press 【Tab】in ADJUST area to shift to [Statistics] check box, press 【Click】and select check box to enable Trace
statistical function.
4) Press【Tab】to shift to [User Range] box, press【↑】and【↓】in ADJUST area or rotate knob to select settings
of Trace statistical range. If select user settings range, click【Tab】to shift to [Start] and [Stop] in definition scope of
user domain so as to input definition of user settings range.
5) Press【OK】in the input keypad to close the dialog box after settings are completed.
Trace statistical dialog box
[Statistics]
When it is selected, Trace statistical function will be on, and when it is cleared, Trace statistical function will be off.
[User Bandwidth]
It is used to select range settings of Trace statistics, and full bandwidth or 9 user-defined settings can be selected.
Definition Zone of User Range
[Start]
www.salukitec.com
It is used to define starting value of user settings range.
[Stop]
It is used to define ending value of user settings range.
Limit Test
6.3.
Limit test function can compare measured data with defined constraint (limit), and the user-defined limit will be displayed on screen in
the form of limit line. There are the following advantages for using limit line.
It provides the debugging personnel with an intuitive indication.
It provides index properties of a device meeting required standard.
It provides intuitive comparison between measured data of device and index requirements.
Limit test function can compare measured data with defined limits, and provide PASS and FAIL information; each Trace can support
more than 100 separate limit line sections to make precise definition for limit.
6.3.1.
Analyzer can create limit lines for all measured Traces; a limit line is composed of multiple separate limit line sections, each line
section is determined by 4 coordinates: start and stop stimulus values of X-axis and starting and ending response values of Y-axis,
and limit line is created and edited by using limit table.
Creating and Editing Limit Line
6.3.1.1. By mouse or touch screen
1) Click [Marker/Analysis], and click [Limit Test …] in the [Analysis] menu to display Limit Test dialog box.
2) Click [Show Table] in the dialog box to turn on limit table display.
3) Click [OK] to close the dialog box.
4) Click [Type] box of limit table, and select limit test type in drop-down box.
5) Double-click [Begin Stimulus] to set up start stimulus value.
6) Double-click [End Stimulus] to set up stop stimulus value.
Page 94
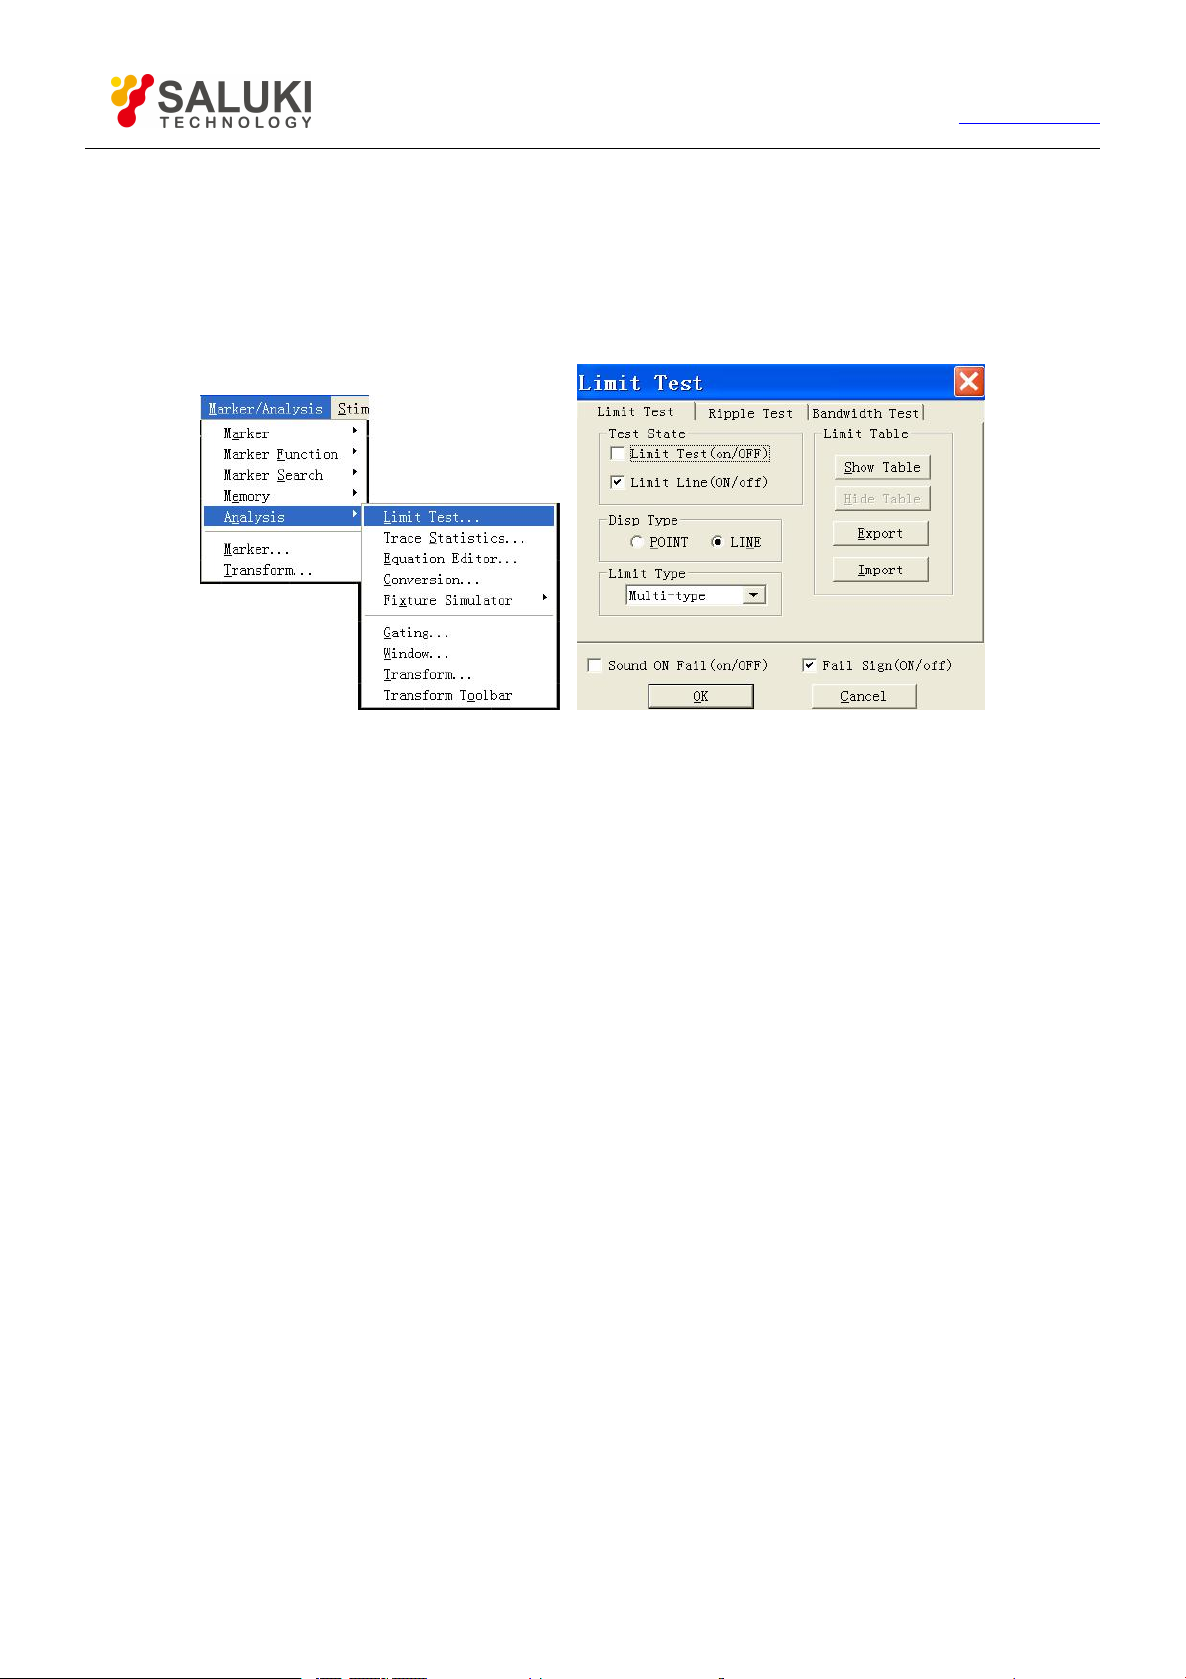
94
Tel: 886.2.2175 2930 Email: [email protected]
www.salukitec.com
7) Double-click [Begin Response] to set up initial response value.
8) Double-click [End Response] to set up stop response value.
9) Click [Limit Type] of limit table, and select limit line display type in drop-down box.
10) After opening limit line section of last row, Analyzer will automatically add a row under limit table, repeat steps 4)~8)
to complete edition and addition of all limit sections.
6.3.1.2. By front panel keys
1) Press 【Analysis】 in MKR/ANALYSIS area, press corresponding soft-key of [Limits] in arisen soft-key menu,
press corresponding soft-key of [Edit Limit Table],and press corresponding soft-key of [Limit Table on/Off] to turn on
Limit Table Display.
2) Press【Tab】in ADJUST area to shift to [Type] of limit table, press【Click】in ADJUST area to open Type drop-down
box, rotate knob or press 【↑】 and 【↓】 in ADJUST area to select limit test type and press【Click】for confirmation
of choice.
3) Press 【Tab】to shift to [Begin Stimulus], and press 【Click】to Stimulus start activation input box, and set up start
stimulus value.
4) Press【Tab】to shift to [End Stimulus] box, and press 【Click】to Stimulus stop activation input box, and set up start
stimulus value.
5) Press【Tab】to shift to [Begin Response] box, and press【Click】to Stimulus start response input box, and set up
start response value.
6) Press 【Tab】to shift to [End Response] box, and press 【Click】 to Stimulus stop response input box, and set up
stop response value.
Figure 6-13 Display Limit Table
7) Press 【Tab】to shift to [Limit Type] box of limit table, and press 【Click】to open the drop-down box of limit type,
rotate the knob or press the【↑】, 【↓】in ADJUST area to select the limit line display type, and press 【Click】
to confirm the selection.
8) After opening limit line sections of last row, Analyzer will automatically add a row under limit table, different row can
be selected to edit by pressing【↑】 and 【↓】. When active region is at the last row, a row will automatically add
under limit table when pressing【↓】.
9) Repeat Steps 2)~8) to complete addition and edition of all limit line sections.
Page 95
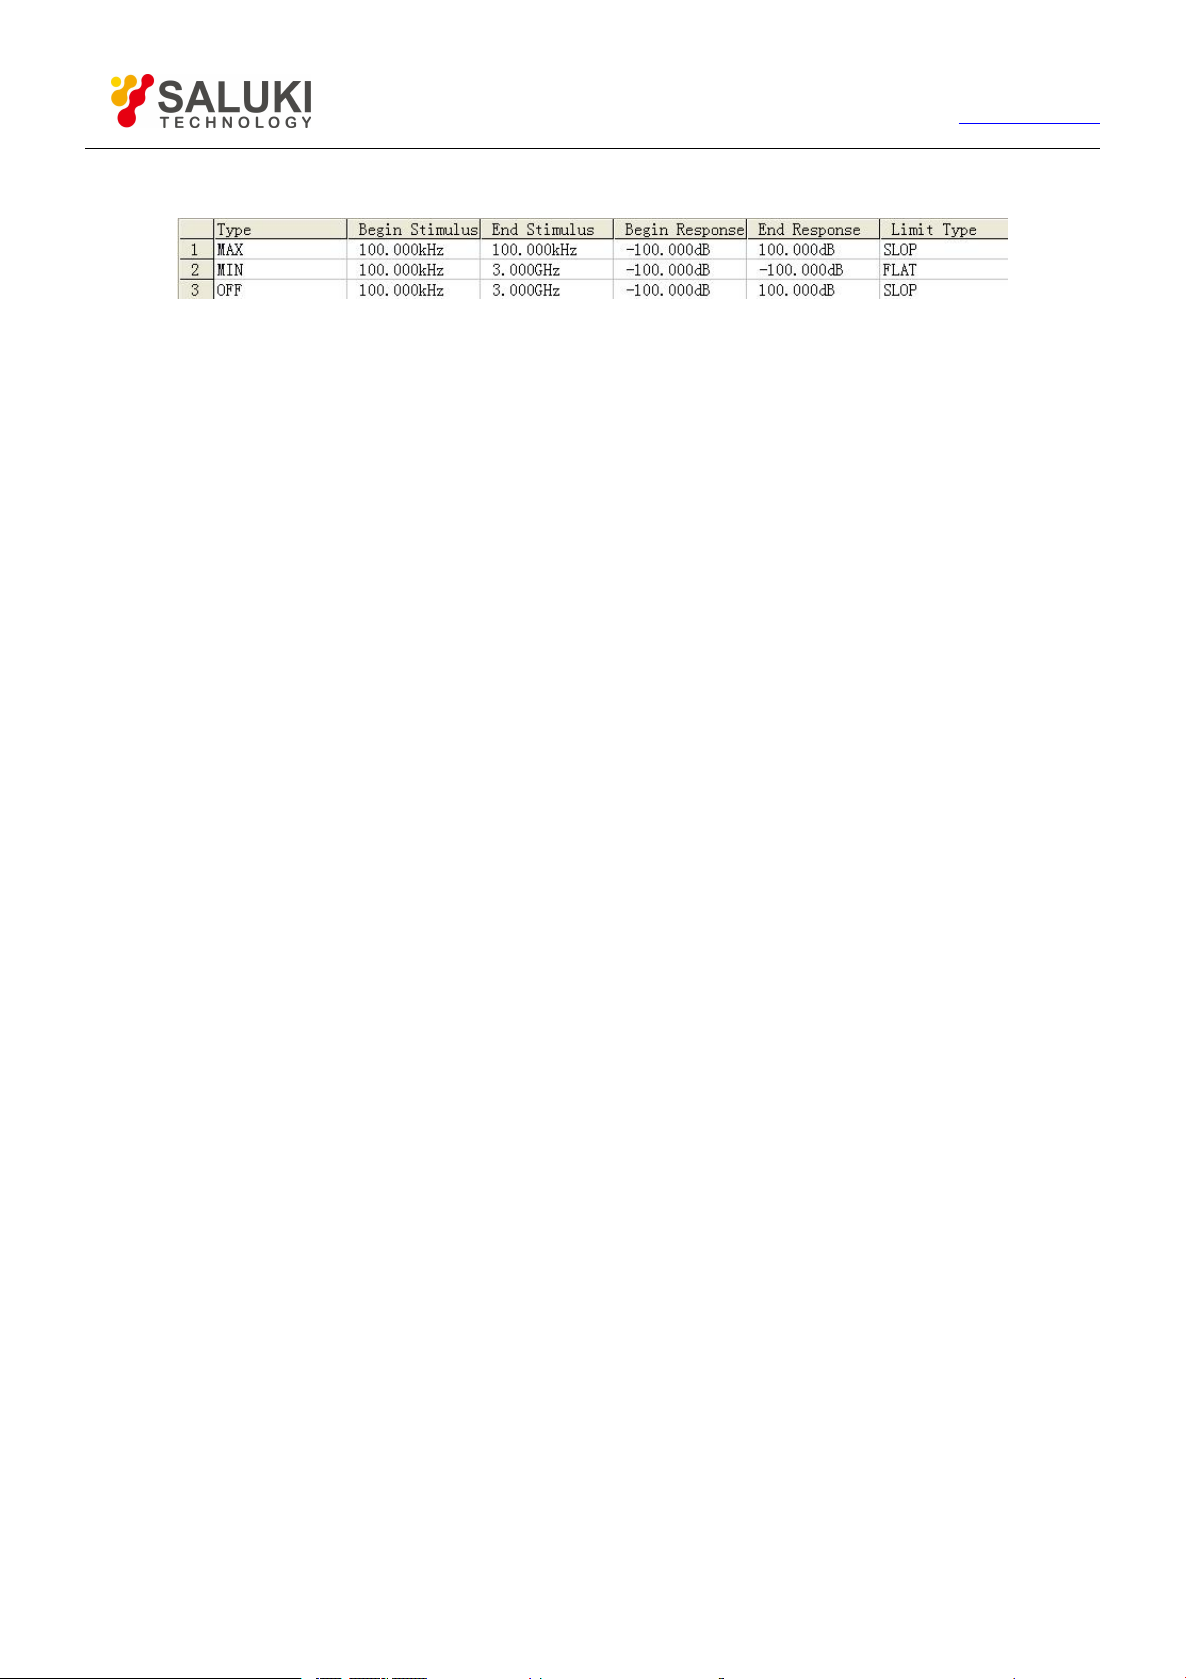
95
Tel: 886.2.2175 2930 Email: [email protected]
www.salukitec.com
6.3.1.3. Limit Table
Figure 6-14 Limit Table
Type
Setting limit test types in type box:
MAX: When Trace is above limit line section, limit test fails.
MIN: When Trace is below limit line section, limit test fails.
OFF: Stop the limit section test
Begin Stimulus Box and End Stimulus
They are used to set up begin and end stimulus values of limit line section (X-axis start and stop coordinates of limit line
section).
Begin Response Box and End Response
They are used to set up begin and end response values of limit line section (Y-axis start and stop coordinates of limit line
section).
Limit Type
Setting the limit line display types:
· SLOP:display declined limit line
· FLAT:display horizontal limit line
· POINT:display punctual limit line
6.3.2.
After limit line is created, the limit line of some Trace can be chosen to display or hide. When the limit line is hidden, corresponding
limit test is still effective. For limit test which can not be made for stored Traces, it can be chosen to send out alarming and display
FAIL information to instruct limit test. When enabling limit test function, failed part of traces for limit test will be displayed as red, and
passed parts of traces will remain unchanged. You can change the color of FAIL information through the color setup item in the right
key menu of the mouse.
Setting Limit Test
6.3.2.1. By mouse or touch screen
1) Click [Marker/Analysis], and click [Limit Test …] on [Analysis] menu to display Limit Test dialog box.
2) Set up limit test in the dialog box.
3) Click [OK] button to close the dialog box.
6.3.2.2. By front panel keys
1) Press 【Analysis】in MKR/ANALYSIS area, and press corresponding soft-key of [Limit] in arisen soft-key menu.
2) Press corresponding soft-key of [Limit Test on/OFF] to trigger enable and close of limit test function.
3) Press corresponding soft-key of [Limit Line on/OFF] to trigger display of limit line.
4) Press corresponding soft-key of [Sound on Fail on/OFF] to enable failure sound prompt.
Page 96

96
Tel: 886.2.2175 2930 Email: [email protected]
www.salukitec.com
5) Press corresponding soft-key of [Fail Sign on/OFF] to trigger display of FAIL Mark of limit test.
6) Press corresponding soft-key of [Edit Limit Table] , and press corresponding soft-key of [Limit Table on/OFF] on the
sub-menu to trigger display of limit table.
Limit test is only made at actual Sweep measured point, when Sweep points are less, performance index of measured piece may not
meet requirements, but it still can pass limit test, therefore during actual Measure, adequate canning points must be used to make
limit test.
6.3.2.3. Limit Test dialog box
[Limit Test(ON/off)]
When it is selected, limit test function of Active Trace will be enabled, when it is cleared, limit test function of Active Trace will be
closed.
[Limit Line(ON/off)]
When it is selected, limit line of Active Trace will be displayed on screen, when it is cleared, display of limit line of Active Trace will be
closed, but it will not affect limit test function.
[Sound on Fail]
When it is selected, if Trace data point test is failed, buzzer will send out warning tone.
[FAIL Mark(ON/off)]
When it is selected, if Trace data point test is failed, the mark of fail will be displayed on the screen.
[Dot]
Use symbol “v” (Measure type as MAX) and “^”(Measure type as MIN)to indicate corresponding discrete limit value of measured data
point during selecting.
[Line]
Use line to connect all discrete limit set point during selecting.
[Show Table]
When it is clicked, limit table will be showed for edition, and when the limit table is enabled, the button will change into forbidden
status.
[Hide Table]
When it is clicked, limit table display will be closed, and if it is closed, the button will change into forbidden status.
[Export Table]
When it is clicked, storage dialog box will turn up, you can select storage route and store the file with *.csv format.
[Import Table]
When it is clicked, storage dialog box will turn up, select the storage route of the file to be opened and you can open file with *.csv
format.
[Limit Test Type]
Single-click the drop-down box, you can select limit test type. There are totally four types: Multi-type limit line、Declined limit line、
Punctual limit line and Horizontal limit line.
Page 97
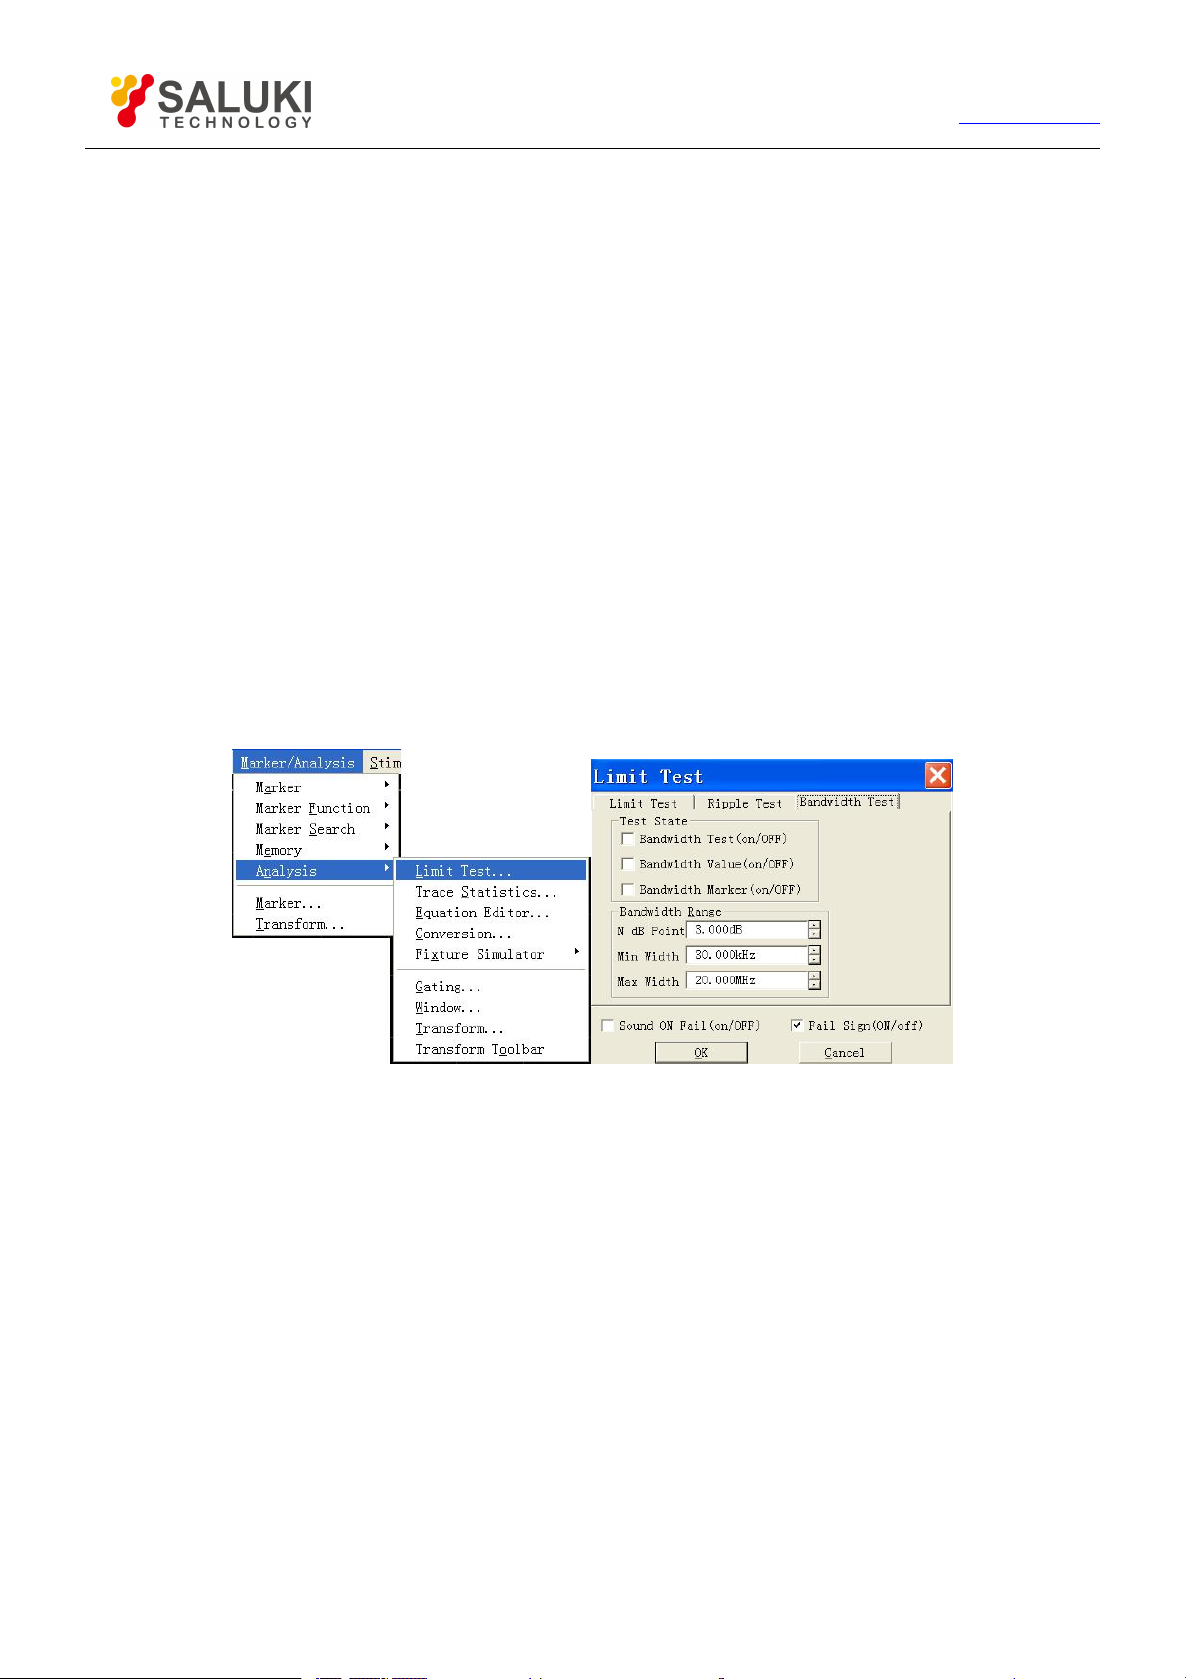
97
Tel: 886.2.2175 2930 Email: [email protected]
www.salukitec.com
6.4.Bandwidth Test
Bandwidth test function is mainly applied to test the bandwidth of band-pass filter.
Bandwidth test can find out signal peak value in the pass band and locate two points on specified amplitude on the two sides of the
pass band. The amplitude is lower than the signal peak value and can be adjusted through setting N dB point (default value is 3 dB).
The frequency range between the two points is the bandwidth of the filter under test.
Bandwidth test can set the minimum bandwidth and maximum bandwidth that the users allow before testing and the tested
bandwidth will compare automatically with the two values. If the result is not satisfactory, the users will see the fail information on the
screen or hear the sound hint, which are convenient for the the users to see if the characteristics of the device under test can meet
the requirement.
6.4.1.
The bandwidth threshold(N dB point)、maximum bandwidth and minimum bandwidth must be set before making bandwidth test and
multiple traces can be set.
Open and set bandwidth test
6.4.1.1. By mouse or touch screen
1) Click [Marker/Analysis],and click [Limit Test...] on [Analysis] menu to display Limit Test.
2) Click [Bandwidth Test] button in the dialog box to display bandwidth test dialog box.
Figure 6-15 Bandwidth Test Dialog Box
6.4.1.2.
3) Click [Bandwidth Test(on/OFF)] in the check box to enable the bandwidth test.
4) Click [Bandwidth Value(on/OFF)] check box to display the tested bandwidth on the screen.
5) Click [Bandwidth Marker (on/OFF)] check box to display the bandwidth locating mark on the screen.
6) Click [N dB Point] to set the threshold of bandwidth.
7) Click [MIN width] to set Minimum bandwidth.
8) Click [MAX width] to set Maximum bandwidth.
9) Click [Sound On Fail(on/OFF)] to make sound alarm when the bandwidth test fails.
10) Click [Fail Sign(on/OFF)] to display FAIL when bandwidth test fails.
11) Click [OK] to finish the setup of bandwidth test.
By front panel keys
1) Press 【Analysis】 in MKR/ANALYSIS area,and press corresponding soft-key of [Bandwidth Test] in the soft-key
Page 98
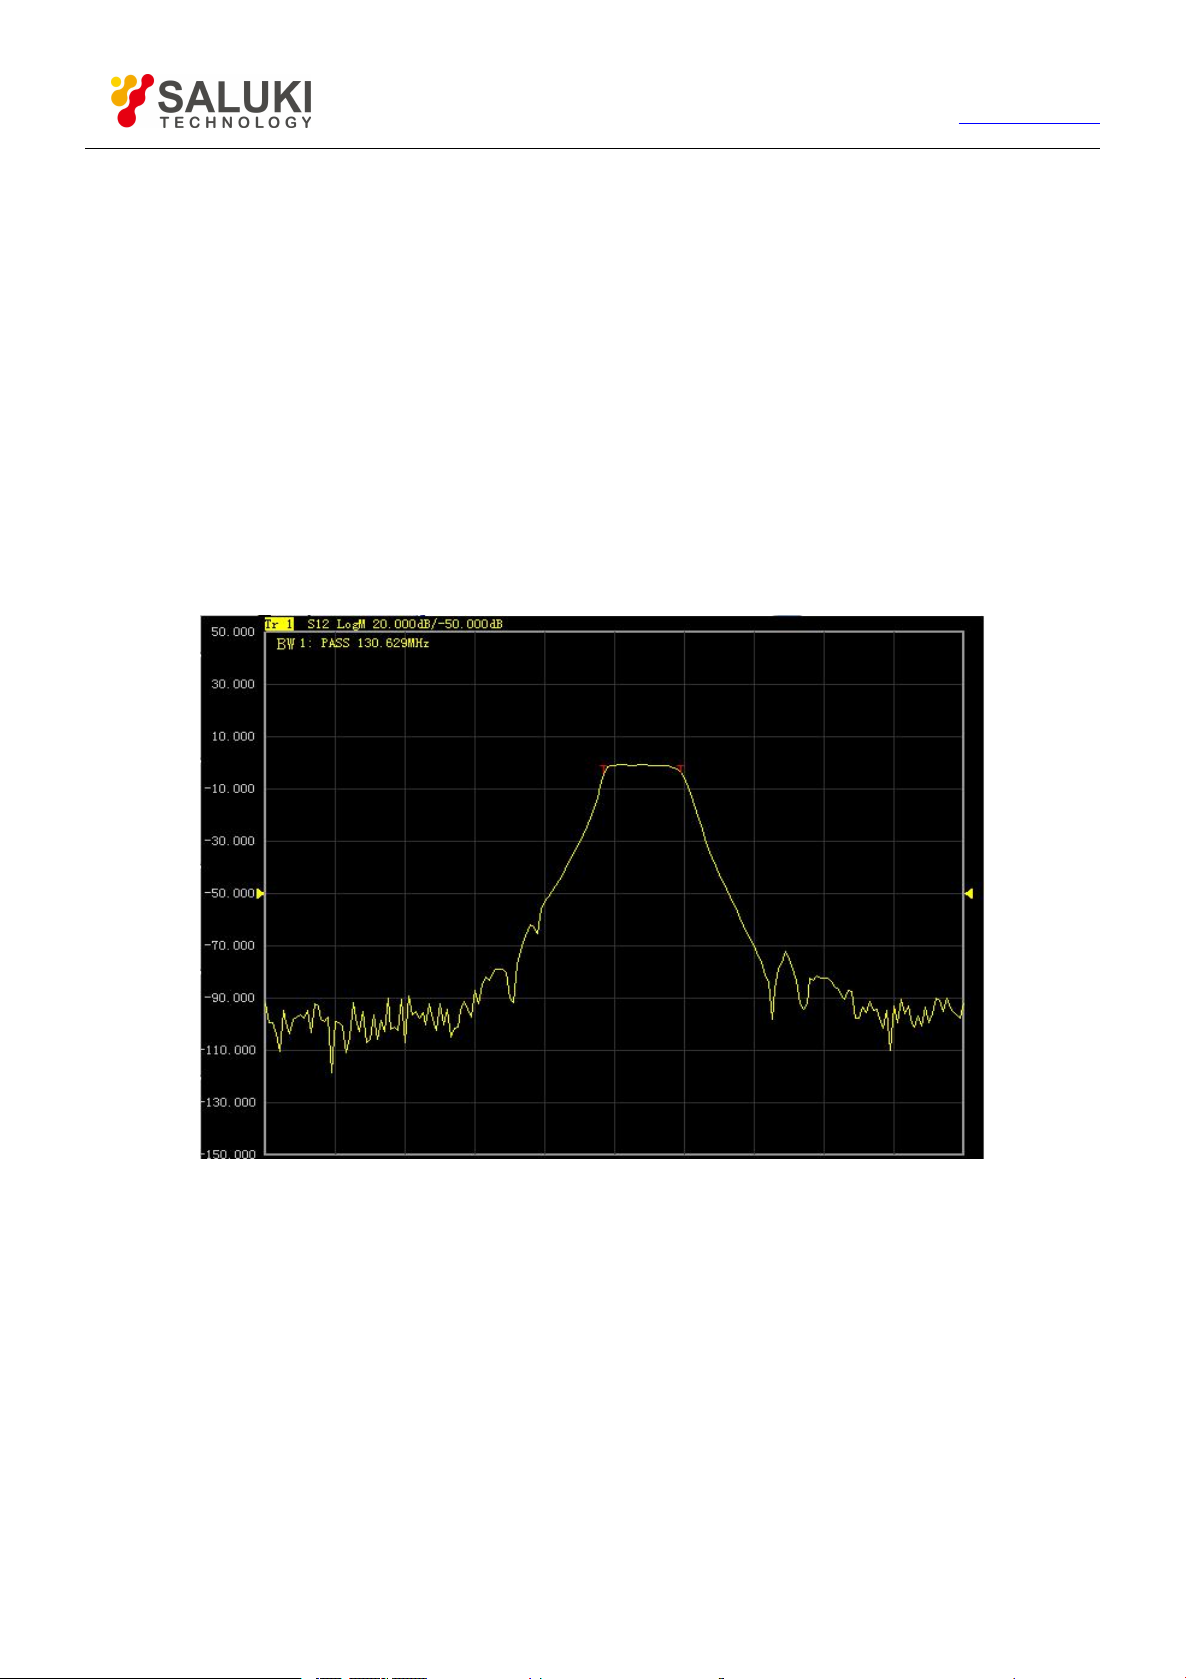
98
Tel: 886.2.2175 2930 Email: [email protected]
www.salukitec.com
menu that turns up.
2) Press corresponding soft-key of [BW Test on|OFF ] to enable bandwidth test.
3) Press corresponding soft-key of [BW Display on| OFF] to enable bandwidth display function.
4) Press corresponding soft-key of [BW Marker on|OFF] to enable bandwidth locating marker.
5) Press corresponding soft-key of [Fail Sign on|OFF] to enable the display of fail mark of bandwidth test.
6) Press corresponding soft-key of [N dB Points], and set bandwidth threshold in the input box.
7) Press corresponding soft-key of [Min BW] and set minimum bandwidth in the input box.
8) Press corresponding soft-key of [Max BW] and set maximum bandwidth in the input box.
6.4.2.
The result of bandwidth test is displayed on the upper left side of the trace, if the test is passed, the word “ PASS”will turn up on the
screen. The red T shaped bandwidth mark distribute on the two sides of bandwidth.
Display bandwidth test result
6.4.3. Close bandwidth test
6.4.3.1. By mouse or touch screen
1) Click [Marker/Analysis] and click [Limit Test...] on the menu of [Analysis] to display limit test dialog box.
2) Click [Bandwidth Test] in the dialog box to display the bandwidth test dialog box.
3) Click [Bandwidth Test(on/OFF)] to close bandwidth test.
4) Click [Bandwidth Value(on/OFF)] to close the display of bandwidth test.
5) Click [Bandwidth Marker (on/OFF)] to close the display of bandwidth locating marker.
6) Click [OK] to close bandwidth test.
6.4.3.2.
By front panel keys
Figure6-16 Bandwidth Test Result Display
Page 99

99
Tel: 886.2.2175 2930 Email: [email protected]
www.salukitec.com
1) Press【Analysis】in MKR/ANALYSIS area and press corresponding soft-key of [Bandwidth Test]in the soft-key menu
that turns up.
2) Press corresponding soft-key of [BW Test ON|off] to close bandwidth test function.
3) Press corresponding soft-key of [BW Display ON|off] to close the display of bandwidth .
4) Press corresponding soft-key of [BW Marker ON|of] to close the locating marker of bandwidth.
5) Press corresponding soft-key of [Fail Sign ON|off] to close the display of fail mark of bandwidth test.
6.5.Bandwidth Searching
Bandwidth searching is a function to confirm trace bandwidth、center frequency、cut-off point、Q value and insertion loss through
searching signal peak value in the band.
Bandwidth searching function menu has newly increased the filter test function, which is used for the automatic test of filter. The
tested parameters of filter is automatically displayed on the screen, this function simplifies the setup of filter test process and
improves the test speed of filter.
6.5.1.
Bandwidth searching can only be set through soft-key menu.
6.5.2.
The six parameters of bandwidth will be displayed on the upper right of the trace.
Open and close bandwidth searching
1) Press 【Search】in MKR/ANALYSIS area, press corresponding soft-key of [Bandwidth] on the soft-key menu that
turns up.
2) Press corresponding soft-key of [Bandwidth] to enable bandwidth searching function.
3) Press corresponding soft-key of [Bandwidth Level] and set bandwidth level in the input box which can change the
bandwidth cut-off frequency.
4) Press corresponding soft-key of [Tracking on|OFF] to enable search and track function.
5) Press corresponding soft-key of [Bandwidth Off] to close bandwidth searching function.
Display bandwidth searching result
Page 100
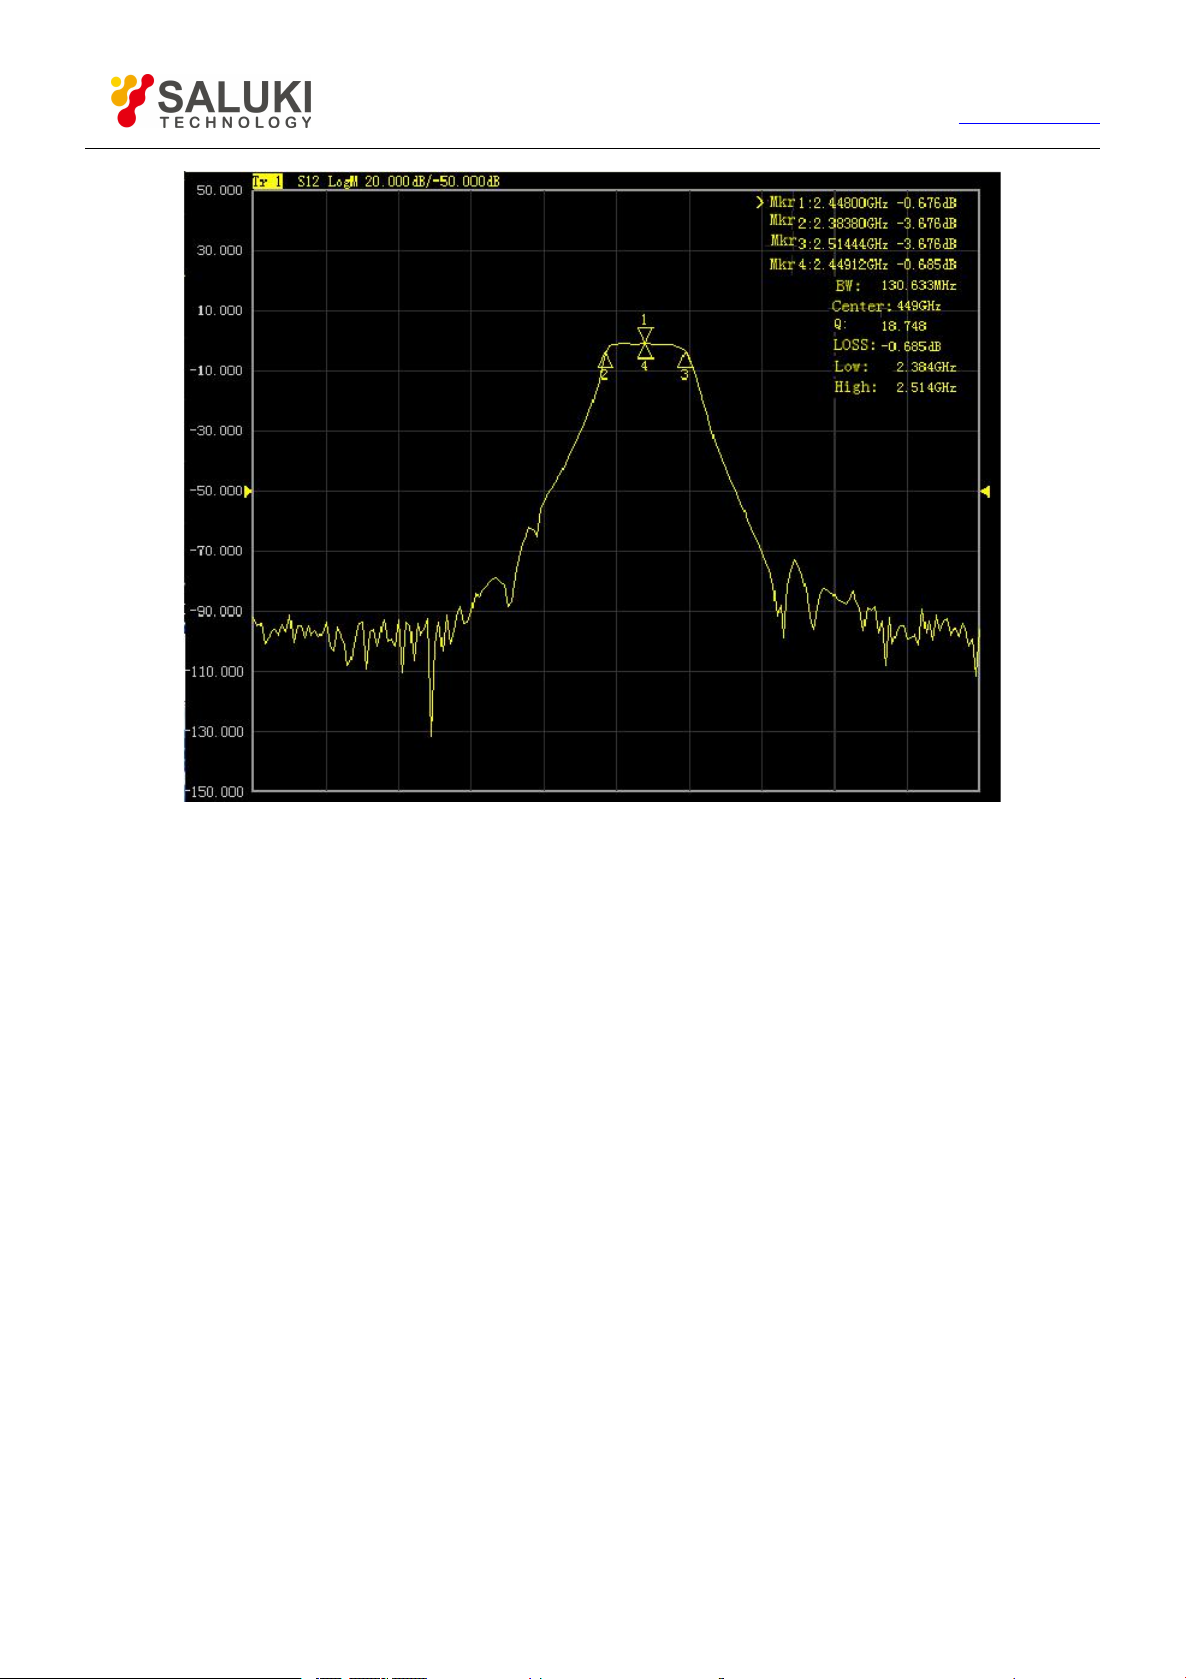
100
Tel: 886.2.2175 2930 Email: [email protected]
www.salukitec.com
Figure 6-17 Bandwidth Searching
6.5.2.1.
BW
Frequency difference between right and left cut-off frequency point.
Center
The middle frequency between right and left cut-off frequency point.
Q
The value of dividing bandwidth with central frequency.
LOSS
The tested value of bandwidth central frequency point.
Low
The lower frequency of the two points which are lower than the signal peak value on specific bandwidth level.
High
The higher frequency of the two points which are lower than the signal peak value on specific bandwidth level .
Parameter definition
6.5.3. Filter test
The analyzer is installed with a shortcut function for the test of filter. All the tested parameters will be displayed on the screen and it is
very convenient for users to see the test results. The filter test function decreases the manual setup during the test process and
improves the test speed greatly.
6.5.3.1. Open and close filter test
 Loading...