

Page 1
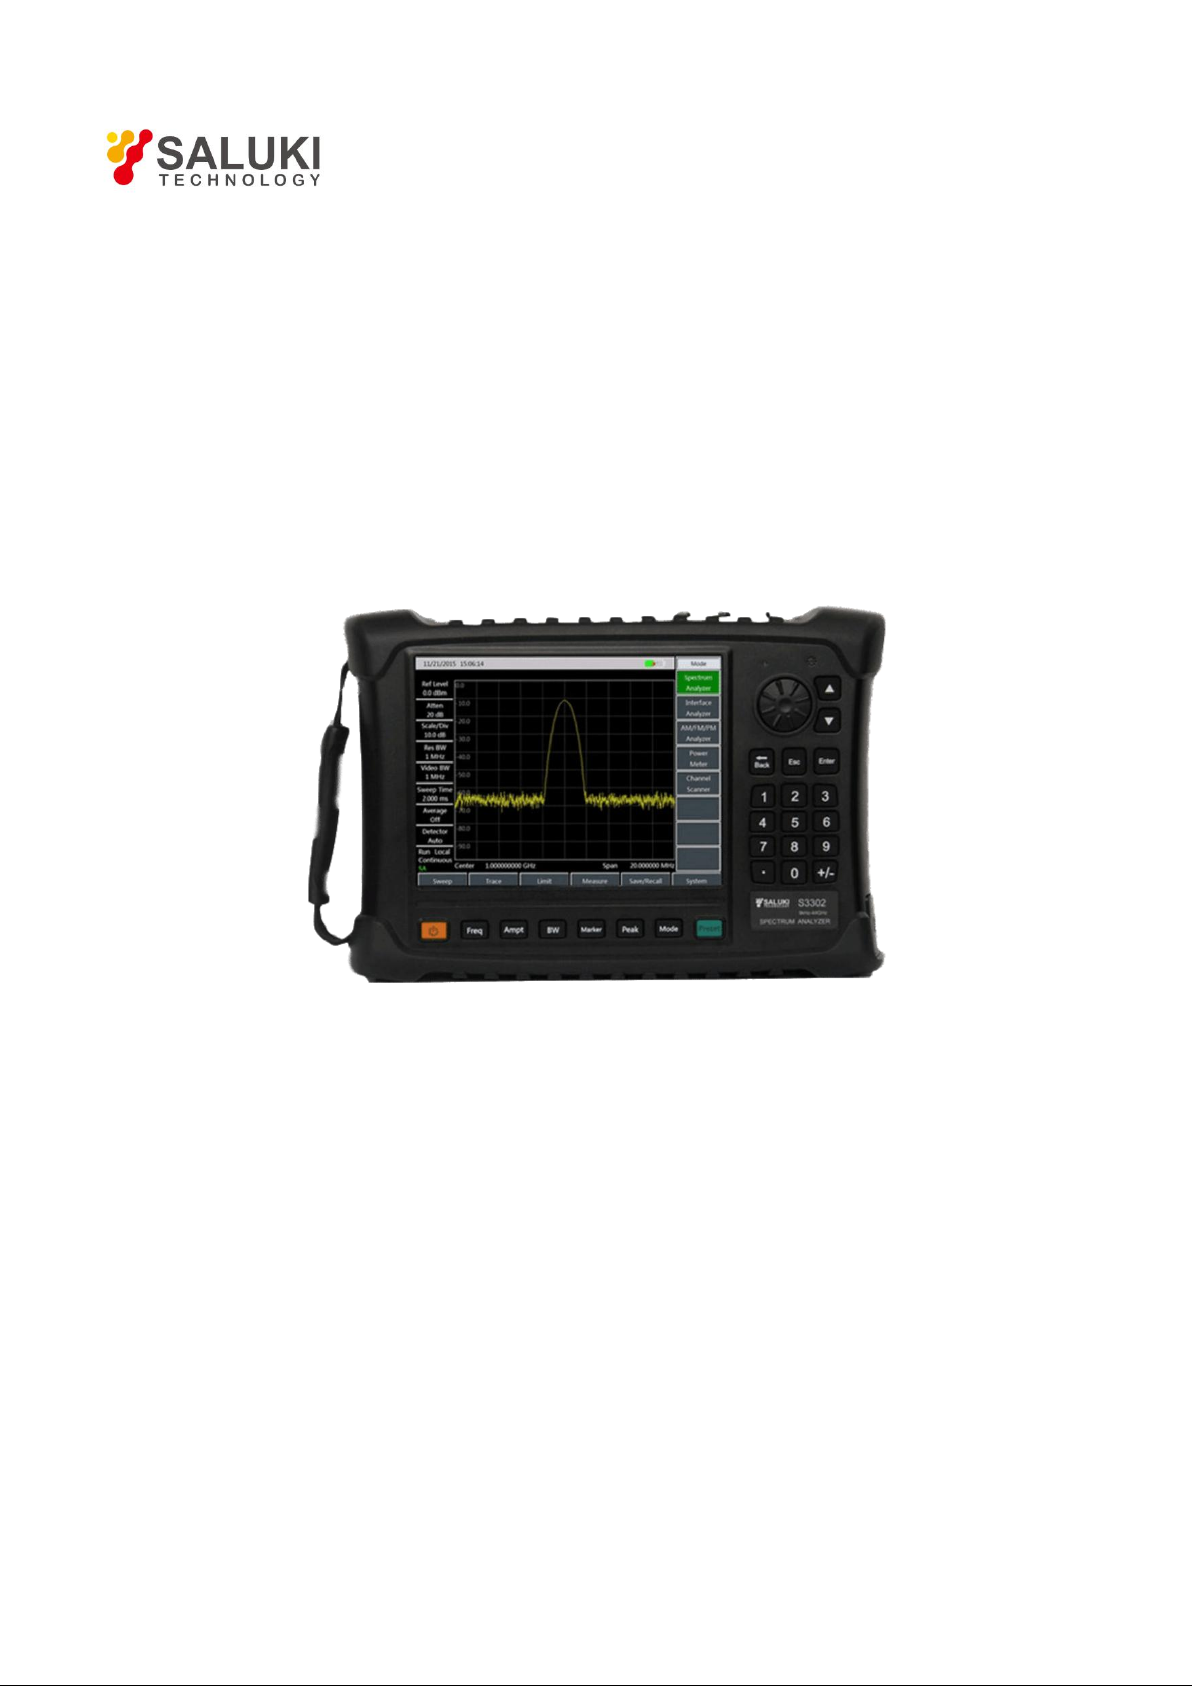
S3302 Series Spectrum Analyzer
Quick Start Guide
Saluki Technology Inc.
Page 2

Tel: 886.909 602 109 Email: [email protected]
1
!
WARNING
A “WARNING” sign indicates for an existing danger. It reminds the user to pay
attention to a certain operation process, operation method or the similar. Any
violation against the indicated rules or incorrect operation may lead to personal
injury. It is not allowed to proceed until the warning conditions are fully
comprehended and satisfied.
www.salukitec.com
Preface
Thanks for choosing S3302 series spectrum analyzer produced by Saluki Technology Inc. Please read this quick
guide carefully for your convenience.
We devote ourselves to meeting your demands, providing you high-quality measuring instrument and the best
after-sales service. We persist with “superior quality and considerate service”, and are committed to offering
satisfactory products and service for our clients.
Manual No.
S3302-04-01
Version
Rev01 2019.05
Saluki Technology
Manual Authorization
The information contained in this Quick Start Guide is subject to change without notice. The power to interpret the
contents of and terms used in this guide rests with Saluki.
Saluki Tech owns the copyright of this document which should not be modified or tampered by any organization or
individual, or reproduced or transmitted for the purpose of making profit without its prior permission, otherwise
Saluki will reserve the right to investigate and affix legal liability of infringement.
Product Quality Certificate
The product meets the indicator requirements of the manual at the time of delivery. Calibration and measurement are
completed by the measuring organization with qualifications specified by the state, and relevant data are provided for
reference.
Quality/Environment Management
Research, development, manufacturing and testing of the product comply with the requirements of the quality and
environmental management system.
Precautions
For the purpose of this manual, the following safety symbols apply, and please be familiar with them and their
meanings before operating this instrument!
Page 3

2
A “CAUTION” sign provides prompt on important information but not dangerous
situations. It reminds the user to pay attention to a certain operation process, operation
method or the similar. Any violation against the indicated rules or incorrect operation
may lead to instrument damage or loss of important data. It is not allowed to proceed
until the cautioning conditions are fully comprehended and satisfied.
CAUTION
Contacts
Service Tel:
886.909 602 109
Website:
www.salukitec.com
Email:
Address:
No. 367 Fuxing N Road, Taipei 105, Taiwan (R.O.C.)
Tel: 886.909 602 109 Email: [email protected]
www.salukitec.com
Page 4

Tel: 886.909 602 109 Email: [email protected]
3
www.salukitec.com
CONTENTS
Chapter 1 Manual Overview......................................................................................................................................... 5
Chapter 2 Ready for Use................................................................................................................................................ 6
2.1 Preparation before Operation...................................................................................................................................6
2.1.1 Environmental requirements.........................................................................................................................6
2.1.2 Power supply requirements............................................................................................................................6
2.1.3 Electrostatic discharge (ESD) protection......................................................................................................7
2.2 Description of Start for Use.....................................................................................................................................8
2.3 Front Panel Overview..............................................................................................................................................8
2.3.1 Power key and indicator................................................................................................................................8
2.3.2 Function key zone.........................................................................................................................................9
2.3.3 Preset key...................................................................................................................................................... 9
2.3.4 Photosensitive hole....................................................................................................................................... 9
2.3.5 Numeric keypad............................................................................................................................................ 9
2.3.6 Loudspeaker................................................................................................................................................10
2.3.6 Label display area....................................................................................................................................... 10
2.4 Operation Interface Overview............................................................................................................................... 10
2.5 Top Panel Overview...............................................................................................................................................10
2.5.1 Power interface............................................................................................................................................11
2.5.2 Test ports..................................................................................................................................................... 11
2.5.3 Digital interfaces......................................................................................................................................... 11
2.5.4 Device symbols........................................................................................................................................... 12
2.6 Battery Installation or Replacement...................................................................................................................... 12
Chapter 3 Typical Application.....................................................................................................................................14
3.1 Basic Signal Measurement.................................................................................................................................... 14
3.2 How to Improve the Accuracy of Frequency Measurement................................................................................. 17
3.3 How to Measure Small Signals............................................................................................................................. 18
3.3.1 Reduce RF attenuation decrement to measure small signals......................................................................18
Page 5

Tel: 886.909 602 109 Email: [email protected]
4
www.salukitec.com
3.3.2 Reduce resolution bandwidth to measure small signals.............................................................................20
3.3.3 Measuring small signals by using average detection and increasing sweep time......................................21
3.3.4 Measuring small signals by using video average....................................................................................... 22
3.4 How to Identify Signal with Closely Spaced Frequency...................................................................................... 23
3.4.1 Description of resolution bandwidth.......................................................................................................... 23
3.4.2 Measurement for distinguish two signals with same amplitude.................................................................23
Chapter 4 Getting Help................................................................................................................................................ 26
4.1 Basic Inspection.....................................................................................................................................................26
4.2 Help Information....................................................................................................................................................26
4.3 Repair Methods......................................................................................................................................................27
Appendix 1 Technical Specifications...........................................................................................................................28
Appendix 2 List of Accessories/ Options.................................................................................................................... 31
Page 6

Tel: 886.909 602 109 Email: [email protected]
5
www.salukitec.com
Chapter 1 Manual Overview
This manual describes the structure and use of the S3302 series spectrum analyzer (hereinafter referred to as
S3302 or the spectrum analyzer) in an all-around and three- dimensional manner from aspects of instrument panel,
power supply, start to use, typical applications and after-sales help. By reading this Manual, you will have an
overall understanding of S3302 and quickly master the basic operations of this device in a systematic manner. For
the convenience of operation, please carefully read the manual before operating the instrument, and properly
operating it according to the guidance in the manual.
S3302 Series Spectrum Analyzer Quick Start Guide includes the following chapters and sections:
Preparation for Use
This chapter introduces S3302 preparation before use, start to use, panel introduction and battery replacement. By
reading this chapter, you will gain the perceptual knowledge of S3302 as a whole and make preliminary
preparations for correct and safe operation of this device.
Typical Applications
This chapter explains basic measurement methods of S3302 and operating steps of basic measurement functions in
details through test instances on how to distinguish closely spaced signals, how to improve frequency
measurement accuracy and how to measure small signals. In addition, this chapter also briefly describes the skills
used in tests. By reading this chapter, you can use S3302 to complete certain typical tests independently.
Getting Help
This chapter consists of after-sales repair and its procedures with the emphasis on problem solving, maintenance
and repair of this device during use.
Page 7
Tel: 886.909 602 109 Email: [email protected]
6
!
WARNING
To prevent damage to the instrument and avoid electric shock, fire and personal
injury:
Do not open this device without authorization;
Do not disassemble or modify any part which is not described in this manual.
Any disassembly without authorization may result in reduction of
electromagnetic shielding performance or damage to the parts inside the device,
thus comprising product reliability. We shall not offer free repair service to any
product which is disassembled without authorization even if the product is still
within warranty period.
!
WARNING
As the battery storage temperature range is -20℃ to +60℃, the battery must not work
continuously in a long time at high temperature, so as to avoid risks arising from high
temperature. It is recommended to use the adapter to supply power.
www.salukitec.com
Chapter 2 Ready for Use
The S3302 series spectrum analyzer is characterized by wide operating frequency band, high performance index,
fast sweeping, multiple test functions and easy operation. In terms of performance index, this series has good
average noise level, phase noise, fast sweep speed and multiple measurement functions. Adopting the 8.4-inch
integrated liquid crystal and capacitive touchscreen and portable structure with small volume and light weight, this
series features flexible power supply and is particularly suitable for field use. This chapter emphatically introduces
the test environment, power supply, structure and battery replacement of this device.
2.1 Preparation before Operation
This section describes the precautions before initial use of the S3302 series spectrum analyzer. S3302 meet the
safety requirements of GJB3947A-2009. Please read the following safety instructions carefully so as not to cause
damage to the instrument or unintentional personal injury.
2.1.1 Environmental requirements
To ensure long service life and effective and accurate measurement of the S3302 series instrument, test it under the
following environmental conditions:
1. Temperature range:
Storage temperature range: -40℃ to +70℃
Operating temperature range: -10℃ to +50℃
Operating temperature range of power supply by Li-ion battery: -10℃ to +50℃
2. Low atmospheric pressure:
Low atmospheric pressure (altitude): 0 - 4,600m
2.1.2 Power supply requirements
Three power supply forms are supported by S3302:
Page 8
Tel: 886.909 602 109 Email: [email protected]
7
Power supply parameter
Applicable range
Input voltage
Rated input currency
Work frequency
Output Voltage/Current
100V - 240VAC
1.7A
50/60Hz
15.0V/4.0A
CAUTION
The working voltage and frequency ranges are subject to the parameters provided on the
nameplate of the power adapter.
CAUTION
The rechargeable battery must not be exposed to fire or high-temperature environments
(above 70℃), or placed in fresh water or salt water, or made wet. It must be kept away from
children.
The rechargeable battery is reusable and should be stored in proper container to avoid
short circuit. Heavy metals such as nickel and chromium in the battery can pollute natural
environment. Waste battery shall not be discarded but shall be put into a special battery
recycle box.
www.salukitec.com
1. AC power supply and power supply with adapter
The accompanying AC-DC adapter must be used for AC power supply. The input power supply of the adapter
is 100~240V, 50/60Hz AC.
When transported and carried in a backpack, please do not connect the AC-DC adapter to the device to
avoided overheating. The AC-DC adapter has a wide range of voltage input. When in use, please make sure
the power supply voltage is within the scope specified in Table 2.1.
Table 2.1 Power supply requirements
2. DC power supply
Voltage: 15V
Current: 3A (min.)
3. Power supply with built-in battery
S3302 can be powered by rechargeable li-ion battery. The battery will discharge if it is not used for a long time.
Therefore, the battery must be recharged before use. Please refer to Section 2.6 for details about battery use. Basic
parameters of accompanying battery are as follows:
Nominal voltage: 10.8V
Nominal capacity: 7,800mAh
2.1.3 Electrostatic discharge (ESD) protection
Electrostatic discharge is extremely destructive to electronic components and equipment, so the powered
instrument must be operated on a workbench with ESD protection. So please pay attention to ensuring ESD
protection when using the instrument. The following ESD protection measures can be taken if conditions are met:
1. Before connecting the cable to the instrument for testing, be sure to ground the center conductor of the cable
first. The following steps can be used: Connect a short-circuiter at one end of the cable to short the center
Page 9
Tel: 886.909 602 109 Email: [email protected]
8
www.salukitec.com
conductor and outer conductor of the cable. Wearing wrist straps with ESD protection, grasp the cable connector
housing, connect the other end of the cable, and then remove the short-circuiter.
2. The operator should be grounded before cleaning or checking the test port of the device or connection. This can
be realized by holding on to the metal casing of grounded device or the casing of test cable connector.
2.2 Description of Start for Use
Check the power supply unit based on the “power supply requirements” in Section 2.1.2 before powering on the
S3302. Power on for testing after no problem is found.
Press the POWER key [ ] on the front panel for more than 3s, a beep can be heard. Then, release the ON/OFF
key and the device will enter host program after about 30 seconds. To ensure the stability of performance indexes
of parts inside the device in order to achieve better test results, a 30-minute warming period is recommended
before measurement..
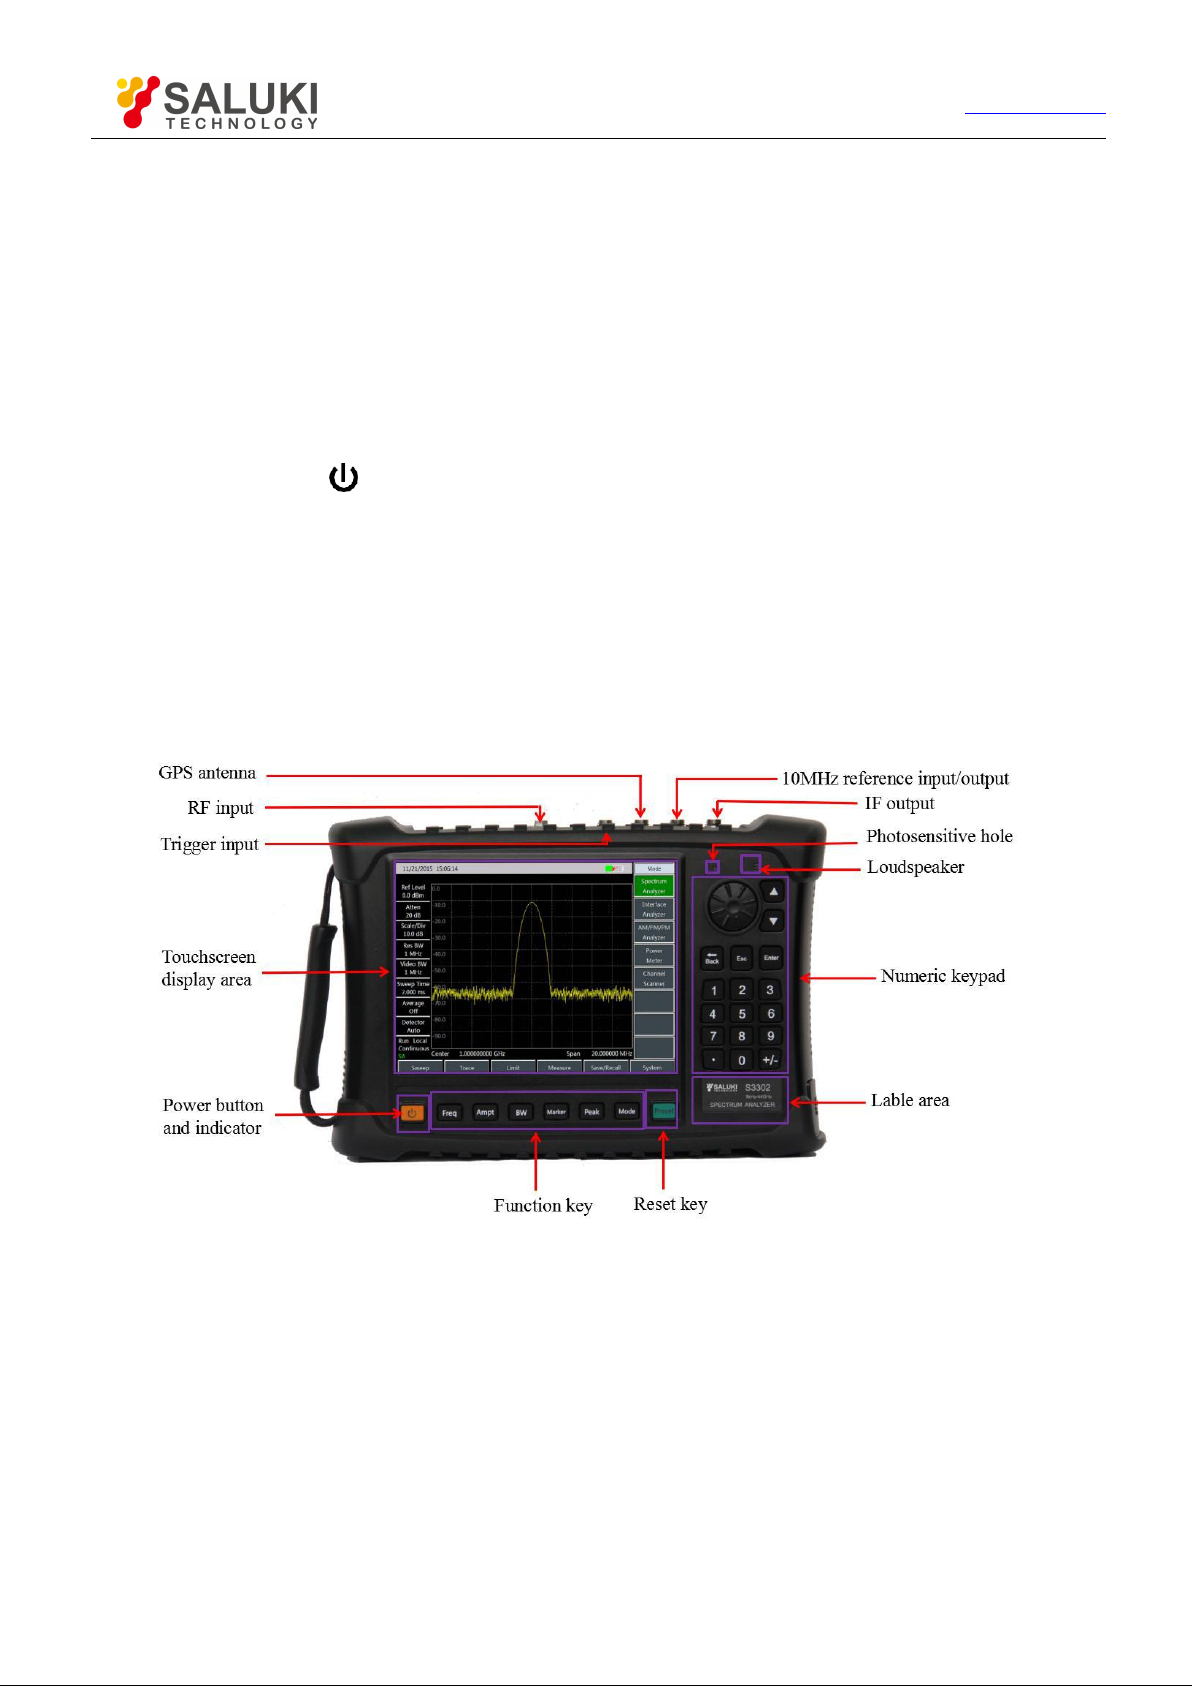
2.3 Front Panel Overview
The front panel of the S3302 series spectrum analyzer is as shown in Fig. 2.1.
Fig.2.1 Front panel of S3302 series spectrum analyzer
2.3.1 Power key and indicator
Power key and the indicator are located at the lower left of the front panel. The power indicator is inside the
yellow power key. The indicator for power off is yellow and that for power on is green. The correlation between
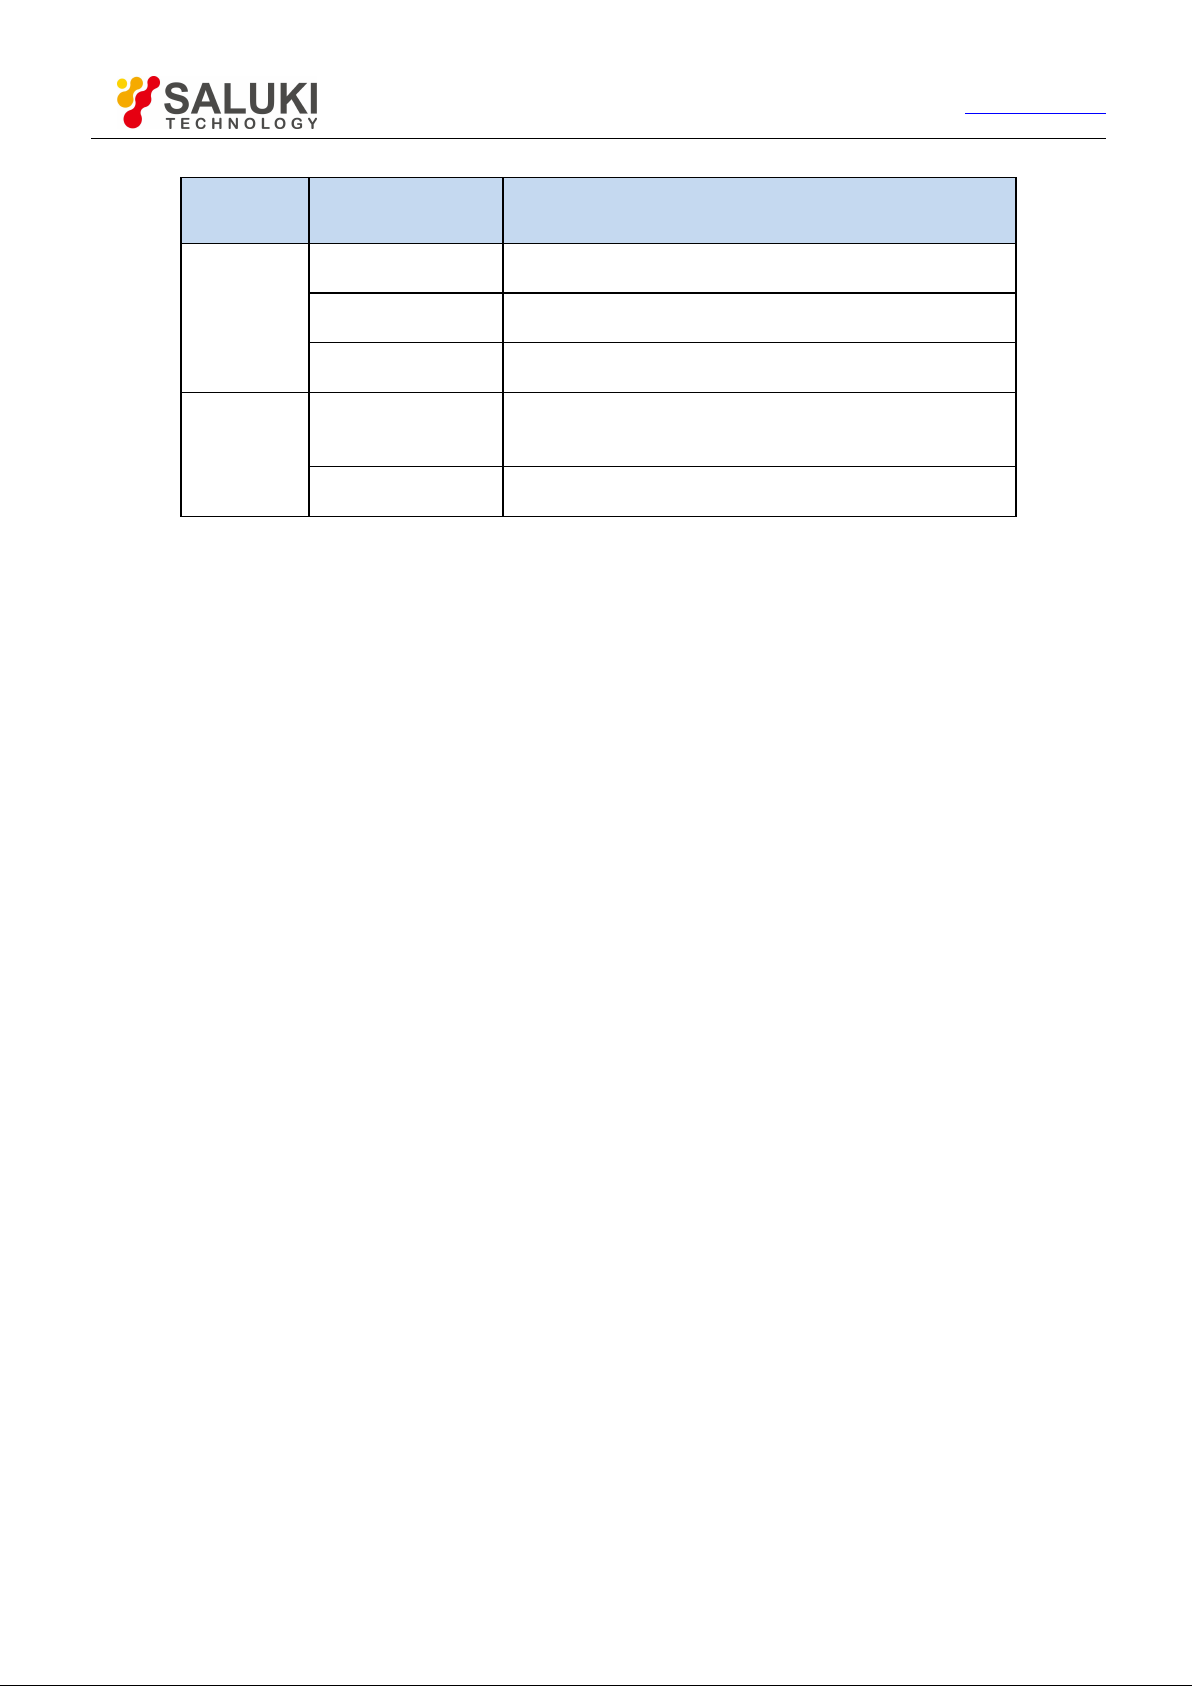
color of the indicator and physical status of the device is shown in the Table2.2.
Page 10
9
Table 2.2 Description of indicator status
Instrument
status
Indicator status
Physical status of the Spectrum Analyzer
Power off
Off
battery installed, power not connected.
battery not installed, power not connected.
Yellow normally on
a) battery not installed, power connected.
b) battery installed and full, power connected.
Yellow flickering
Battery installed but not full, power connected.
Power on
Status
Green normally on
a) battery not installed, power connected.
b) battery installed and full, power connected.
c) battery installed, power not connected.
Green flickering
Battery installed but not full, power connected.
2.3.2 Function key zone
Commonly-used functional keys are described as follows:
Tel: 886.909 602 109 Email: [email protected]
www.salukitec.com
【Freq】: Set the scope of frequency measured, frequency step, signal standard, etc.
【 Ampt 】 : Set the amplitude of measurement results displayed, including display format, display
scale and control of pre-amplifier.
【 BW 】 : Set the resolution bandwidth, video bandwidth, detector type, average value and other
measurement parameters.
【 Marker 】 : Enable function menu related to the marker. When enabled, the marker can be operated
by dragging, clicking or other touch modes.
【Peak】: Enable the peak search function.
【Mode】: Select the operating mode of the device, including spectrum analyzer, interference analyzer,
AM-FM-PM analyzer, power meter, channel scanner and other modes.
2.3.3 Preset key
Preset or reboot the system to restore to default initial state. Preset can be realized by pressing and releasing this
key.
2.3.4 Photosensitive hole
This hole can sense the intensity of external light for auto adjustment of liquid crystal brightness.
2.3.5 Numeric keypad
Numeric keys: the value corresponding to the selected parameter can be input via the numeric keys on the
front panel, and the corresponding unit can be selected in the soft menu.
【•】: Input the decimal point for decimal value when entering a decimal value with a decimal point.
【+/-】: Positive/negative sign, before inputting a numerical value, you can use this key to input a positive or
negative value.
【↑】and 【↓】: Control the step upward and downward, or select the current item up and down.
Page 11
Tel: 886.909 602 109 Email: [email protected]
10
www.salukitec.com
【Cancel】: Used to exit any functional operation without changing the current parameter. Deactivate the
function, exit the digital zone operation, and exit the file dialog box.
【Backspace】: Remove a character before the marker in the input area.
【Enter】: In the case of an input area, press the key to receive data in accordance with the default unit.
Knob: Used to move the marker and change the current parameter value. It is generally used for fine tuning
of the parameters to optimum values.
2.3.6 Loudspeaker
The S3302 series spectrum analyzer is equipped with a speaker. Keep the speaker opening clean so as not to affect
sound effects.
2.3.6 Label display area
It shows the corresponding model, frequency range, label, and name of the S3302 series spectrum analyzer.
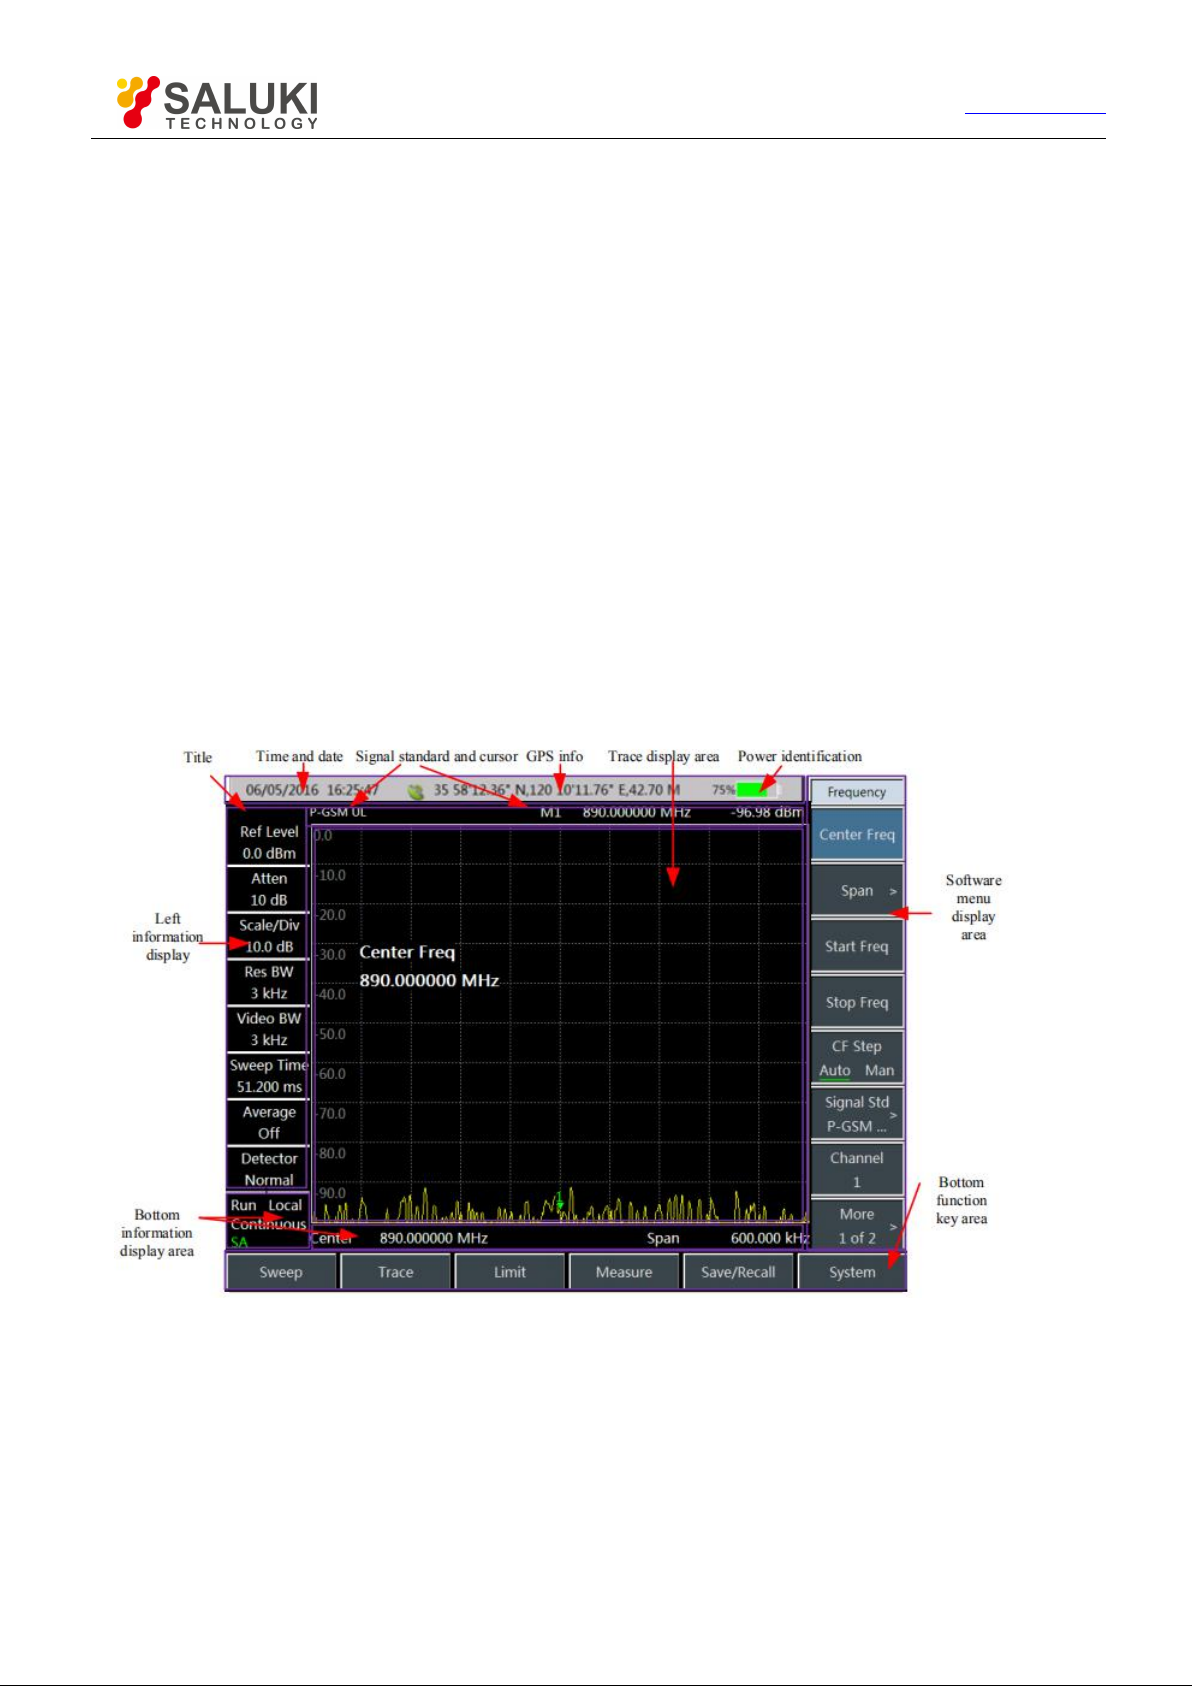
2.4 Operation Interface Overview
The S3302 series spectrum analyzer has an integrated 8.4-inch integrated liquid crystal and capacitive touch screen,
and the operation interface is shown in Fig.2.2.
Fig.2.2 Operation interface of S3302 series spectrum analyzer
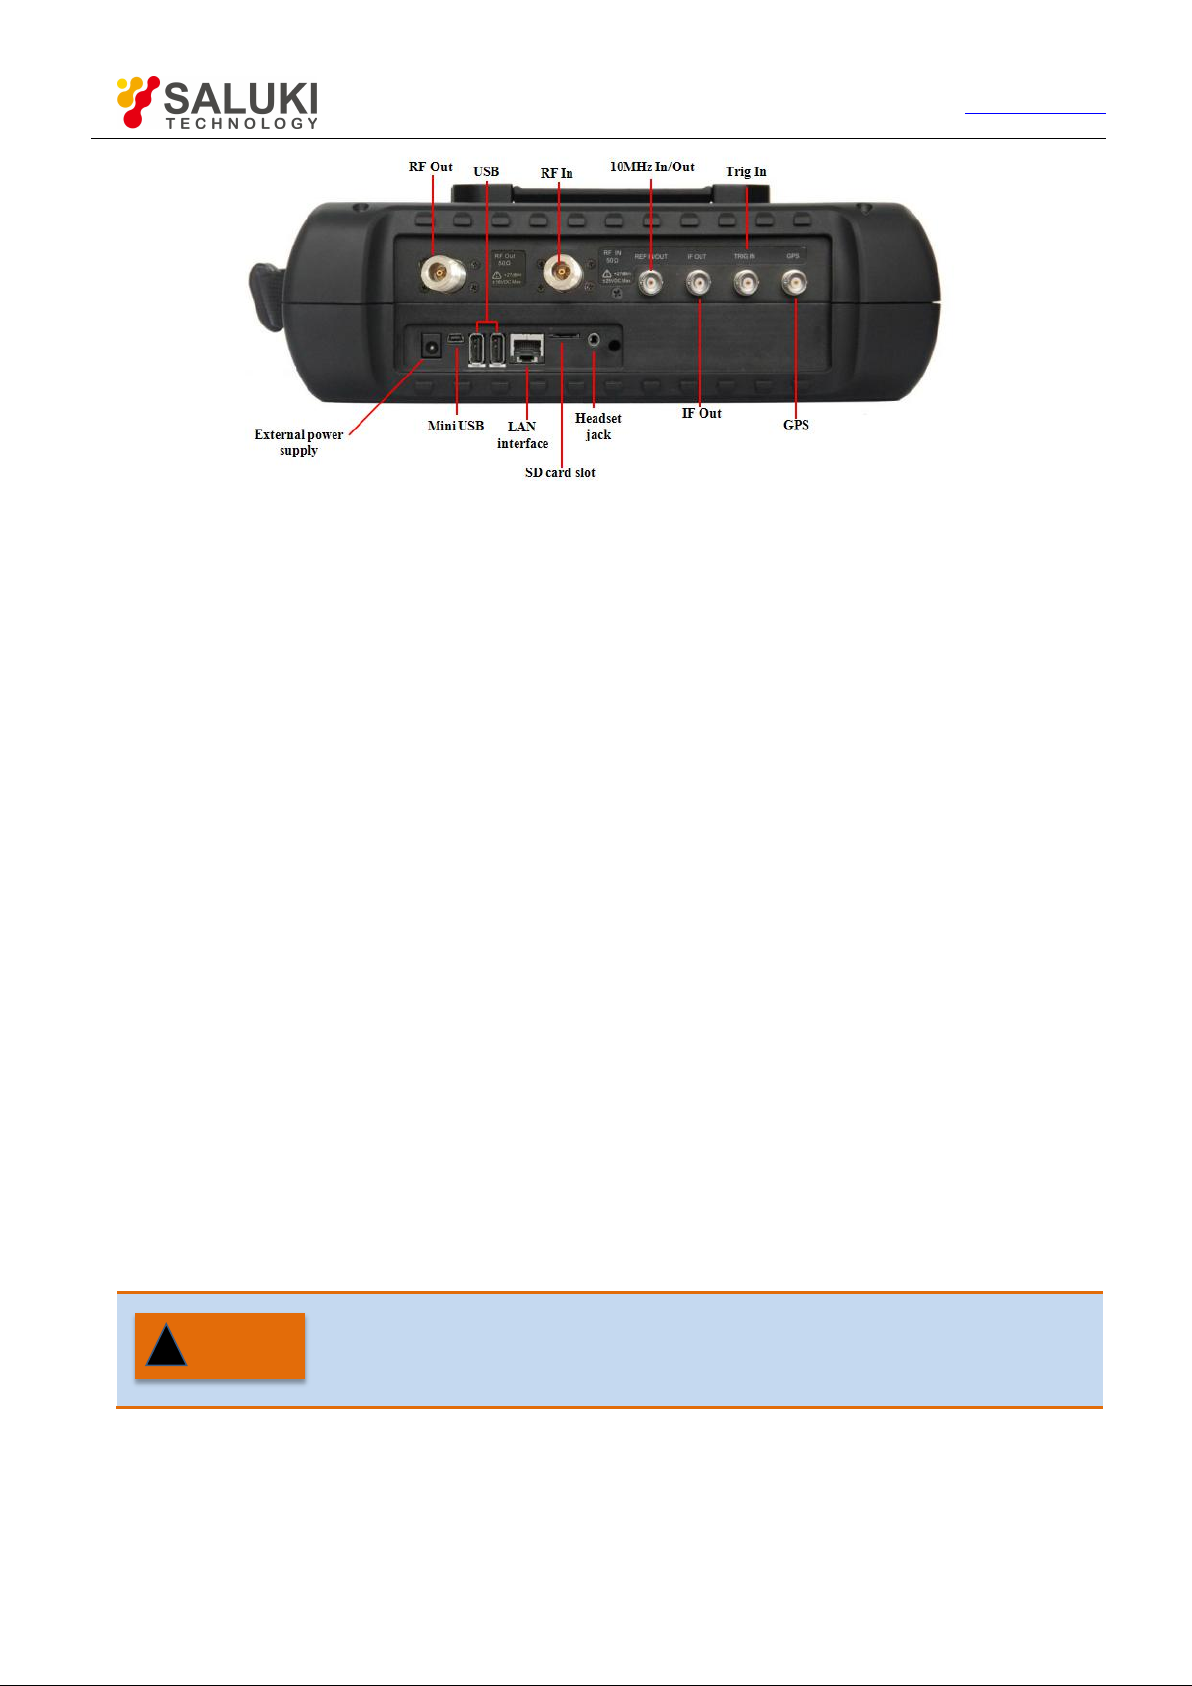
2.5 Top Panel Overview
The top panel of S3302 is shown in Fig. 2.3 and it consists of a power interface, a digital interface and a test port.
Page 12
Tel: 886.909 602 109 Email: [email protected]
11
!
WARNING
In order to protect the spectrum analyzer, the instrument test ports are provided with
some signs. To use the spectrum analyzer, be sure to read these signs to avoid
permanent damage to the instrument.
For details of the instrument signs, see section 2.5.4.
www.salukitec.com
Fig.2.3 Top Panel of S3302 Series Spectrum Analyzer
2.5.1 Power interface
The power interface of the device is for powering the device through DC output of AC-DC adapter or through
external DC power source. The conductor inside the external power interface is positive and the external
conductor is grounded.
2.5.2 Test ports
(1) RF input port: This port is for inputting tested signal. The test signal input port of S3302 is 50Ω. 4GHz,
6.5GHz, 9GHz, 20GHz and 26.5GHz models use N type female port and 32GHz and 44GHz models use 2.4mm
male port.
(2) RF output port: This port is for signal output. 50Ω impedance, N-type female port, provided only when
customers need the tracking generator option.
(3) 10MHz input/output port: This port is for connecting 10MHz signal of other devices as the reference signal
of the analyzer. It can also be used for outputting the internal 10MHz reference signal for other devices.
(4) IF output port: Under zero span, this port can be used for outputting the IF signals for other devices
through software configuration.
(5) Trigger input port: External trigger mode can be set for S3302. The scope of trigger source must be -5V to
+5V when connecting the external trigger source to the trigger input port of the Spectrum Analyzer. Rising edge
trigger or fall edge trigger can be set by the software.
(6) GPS antenna port: This port can be used for connecting GPS antenna device for locating current position of
the Spectrum Analyzer.
2.5.3 Digital interfaces
(1) Mini USB interface: This interface is used for connecting external PC which realizes program control or
data transmission for S3302 through program control commands or function library.
Page 13
Tel: 886.909 602 109 Email: [email protected]
12
CAUTION
Equipment drive should be installed for connecting the device to PC through USB
interface for the first time.
CAUTION
To guarantee the longer service life of the battery, the battery should be removed from
battery holder during the transportation and long-time storage, and try not to make the
battery power less than 5%, otherwise the battery may not be able to charge.
www.salukitec.com
(2) A-type USB interface: This interface is used for connecting USB peripheral equipment, such as USB storage
device, USB power detector.
(3) LAN (network) port: This interface is a 10/100Mbps network interface through which a PC can be
connected to the device through a network cable. PC can realize program control or data transmission for S3302
through program control commands or function library.
(4) SD card slot: This Micro SD card slot can be used to extend the storage space of the device.
(5) Headset jack: This is a standard headset jack for 3.5mm/3 line for audio output of FM/AM/SSB
demodulation. When a headset is not connected to this jack, the audio output will be realized through the
loudspeaker of the device. When a headset is connected to this jack, audio output will be automatically switched
from the loudspeaker to the headset.
2.5.4 Device symbols
Device symbols indicated in the Fig. below indicate that the maximum power of RF IN and the maximum input
DC level. When the device is in operation, the user is not allowed to connect signal exceeding this range to the
port. Otherwise, the device may be destroyed.
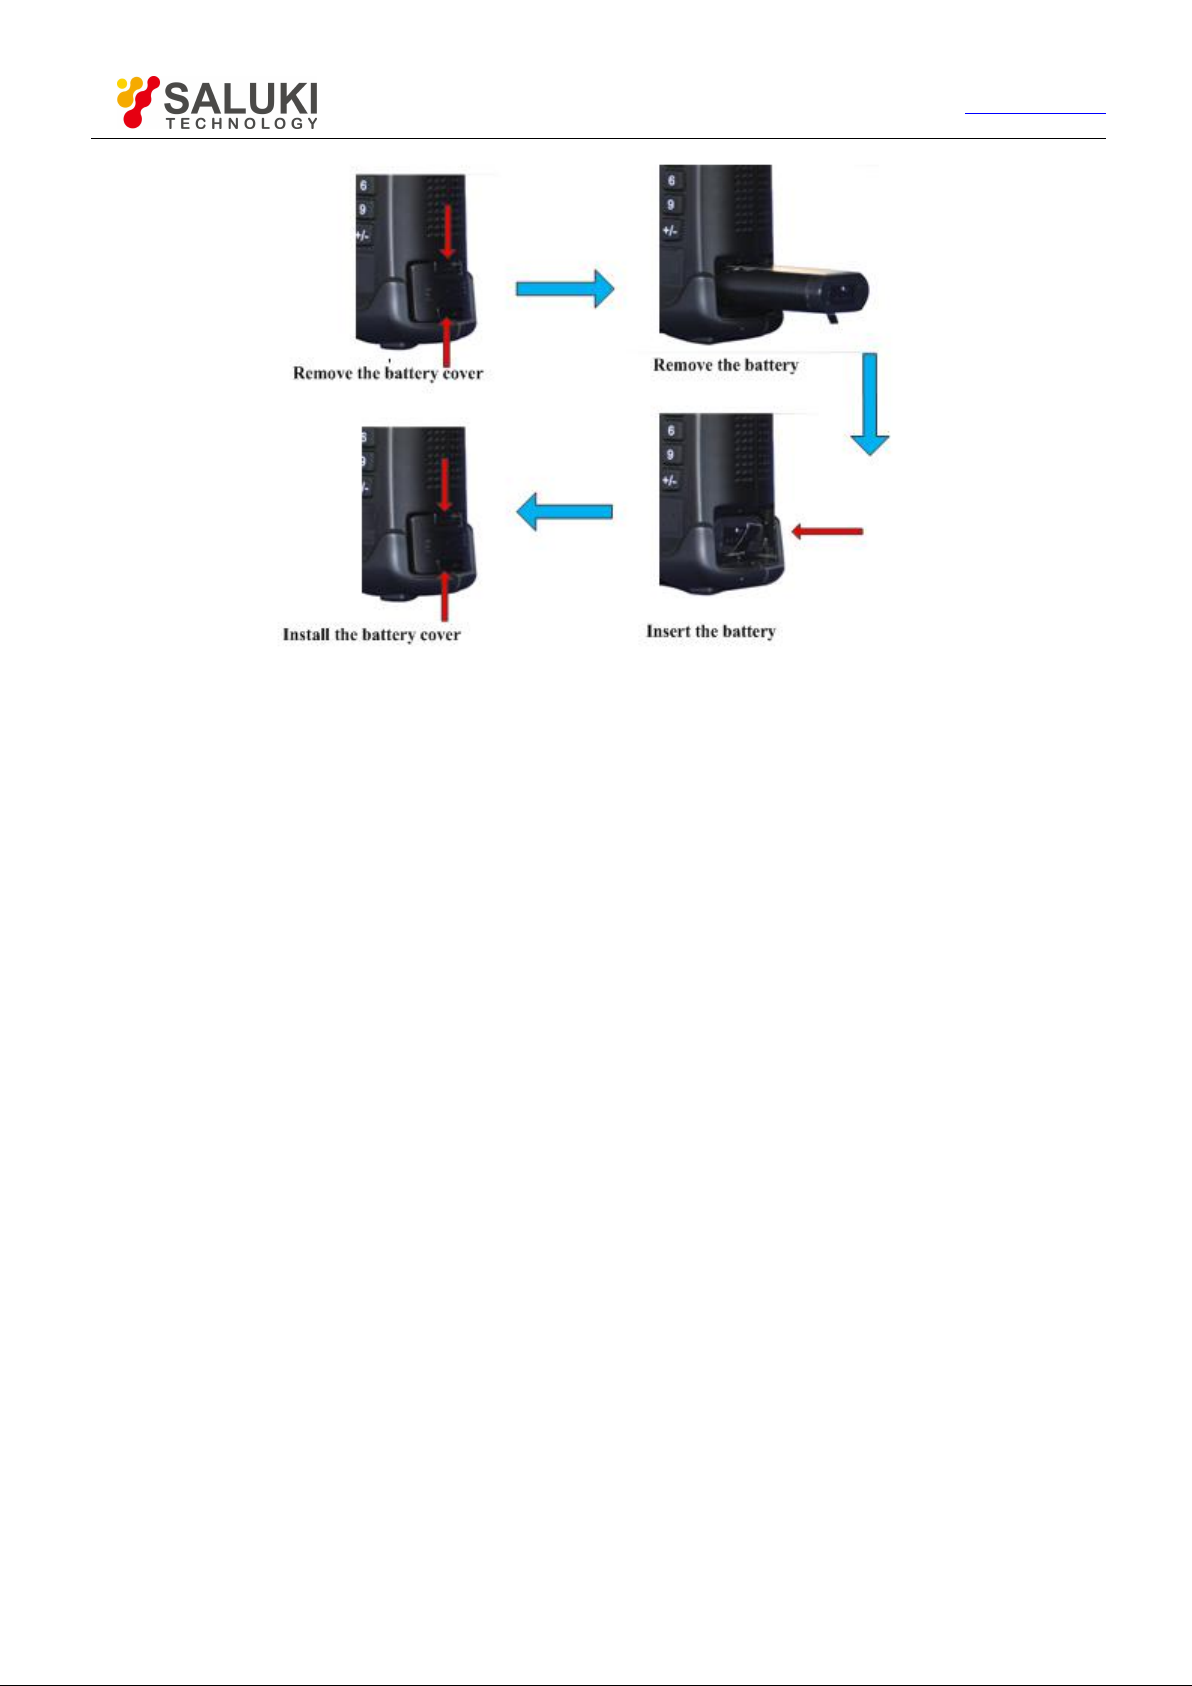
2.6 Battery Installation or Replacement
S3302 accompanies with a large-capacity rechargeable Li-ion battery with a battery life of 2.5 hours. For field test
for long period, it is recommended to purchase a battery of same mode as a standby battery.
Installation or replacement of battery can be carried out by reference to Fig. 2.4 for battery installation or
replacement of S3302.
Page 14
Tel: 886.909 602 109 Email: [email protected]
13
www.salukitec.com
Fig. 2.4 Install or replace the battery
Page 15
Tel: 886.909 602 109 Email: [email protected]
14
CAUTION
In this guide, the keys on the front panel are indicated in the form of 【XXX】, and
XXX is the name of the key; the bottom keys on the touch screen are indicated in the
form of 【XXX】, and XXX is the name of the key; the menu
buttons on the right are indicated in the form of [XXX], and XXX is the menu name.
www.salukitec.com
Chapter 3 Typical Application
The S3302 series spectrum analyzer provides several working modes, including spectrum analysis, interference
analyzer (option), AM-FM-PM analyzer (option), power meter (option) and channel scanner (option). Several
intelligent measurement functions are provided for each working mode. This chapter mainly describes basic tests
under spectrum analyzer mode. For detailed operation of each optional mode, please refer to the User Manual of
S3302 Spectrum Analyzer.
3.1 Basic Signal Measurement
The basic measurement includes the frequency and amplitude of the signal marked on the spectrum analyzer
screen with markers. Follow the procedures below to measure the input signal and save the current measurement
result by using the file menu:
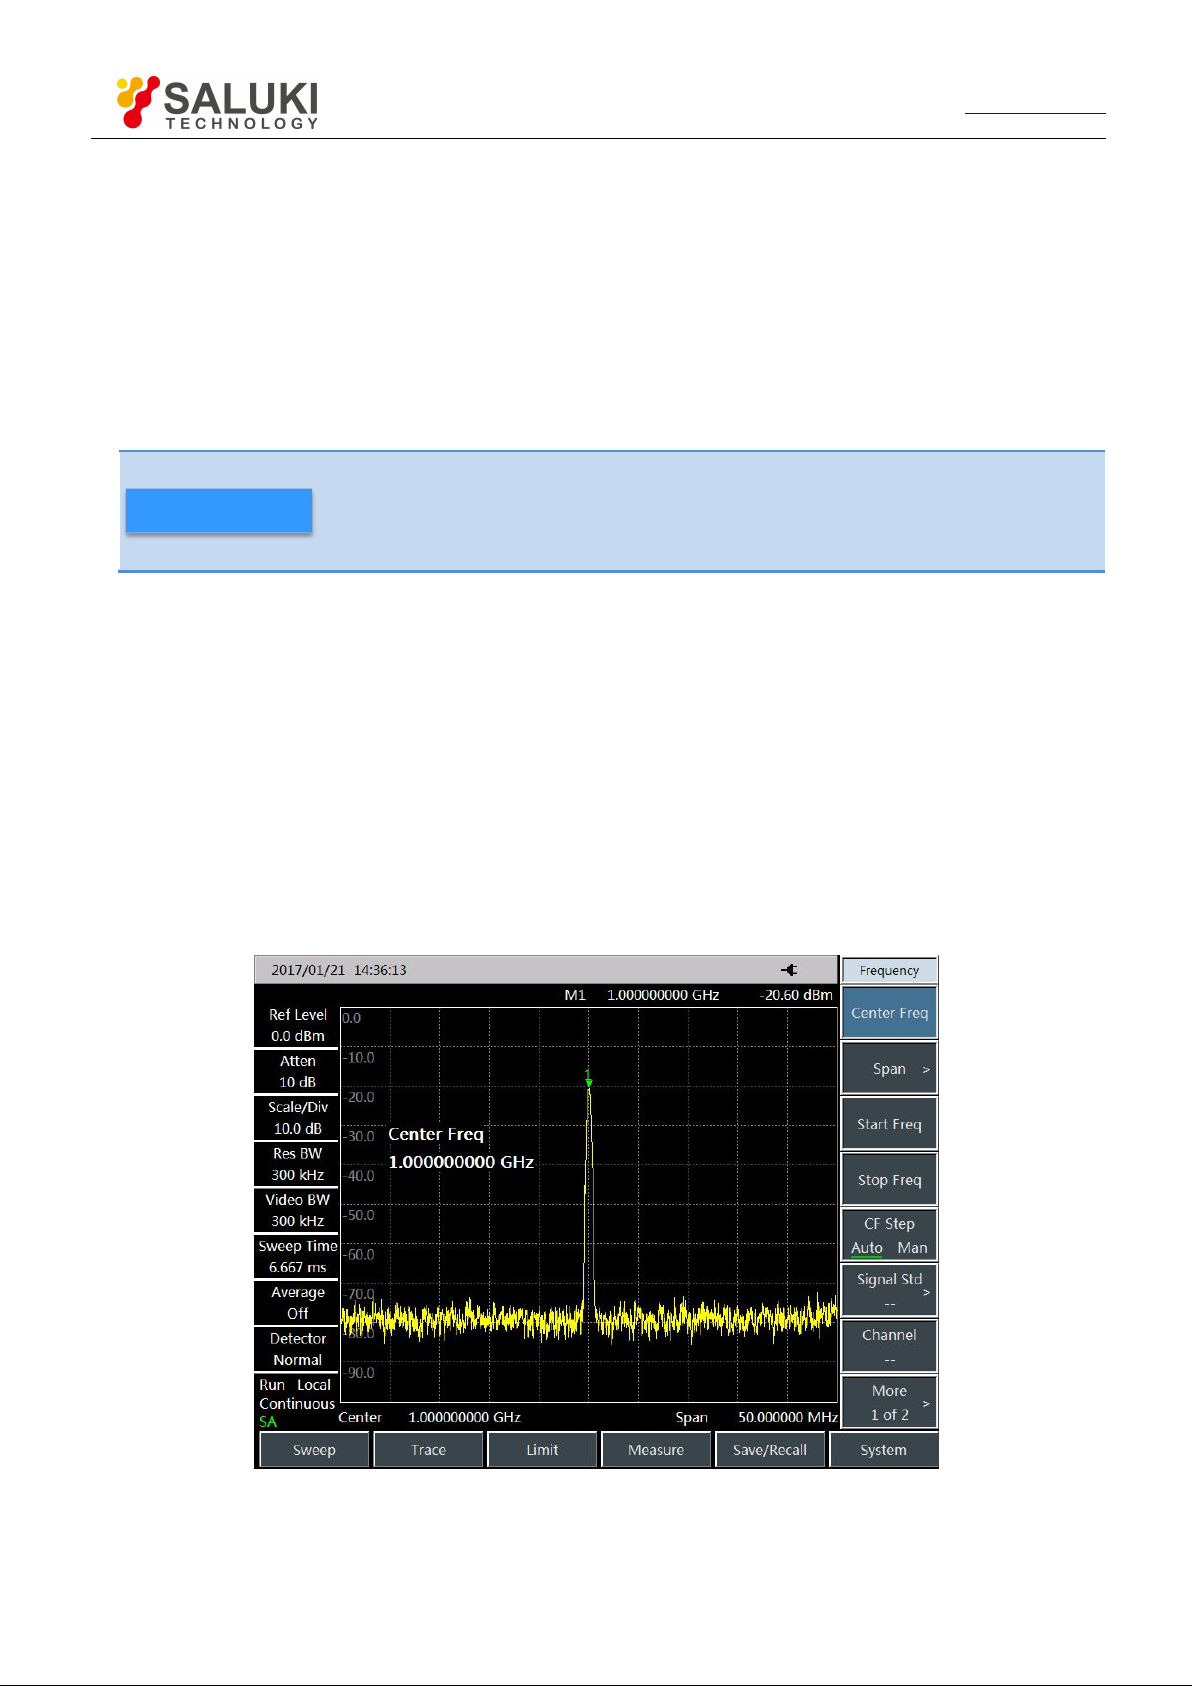
a) Set the center frequency
Set the frequency of the external signal generator to 1GHz. Set the center frequency of the spectrum analyzer.
Press 【Freq】, select [Center Freq] and set the center frequency to 1GHz. Enter 【1】[GHz] directly with the key
in the front panel data zone. These numerical keys can be used for setting the exact value of current parameter.
The value of center frequency can also be changed by the step key and knob, as shown in Fig. 3.1.
Fig. 3.1 Center Frequency of 1 GHz
Page 16
Tel: 886.909 602 109 Email: [email protected]
15
www.salukitec.com
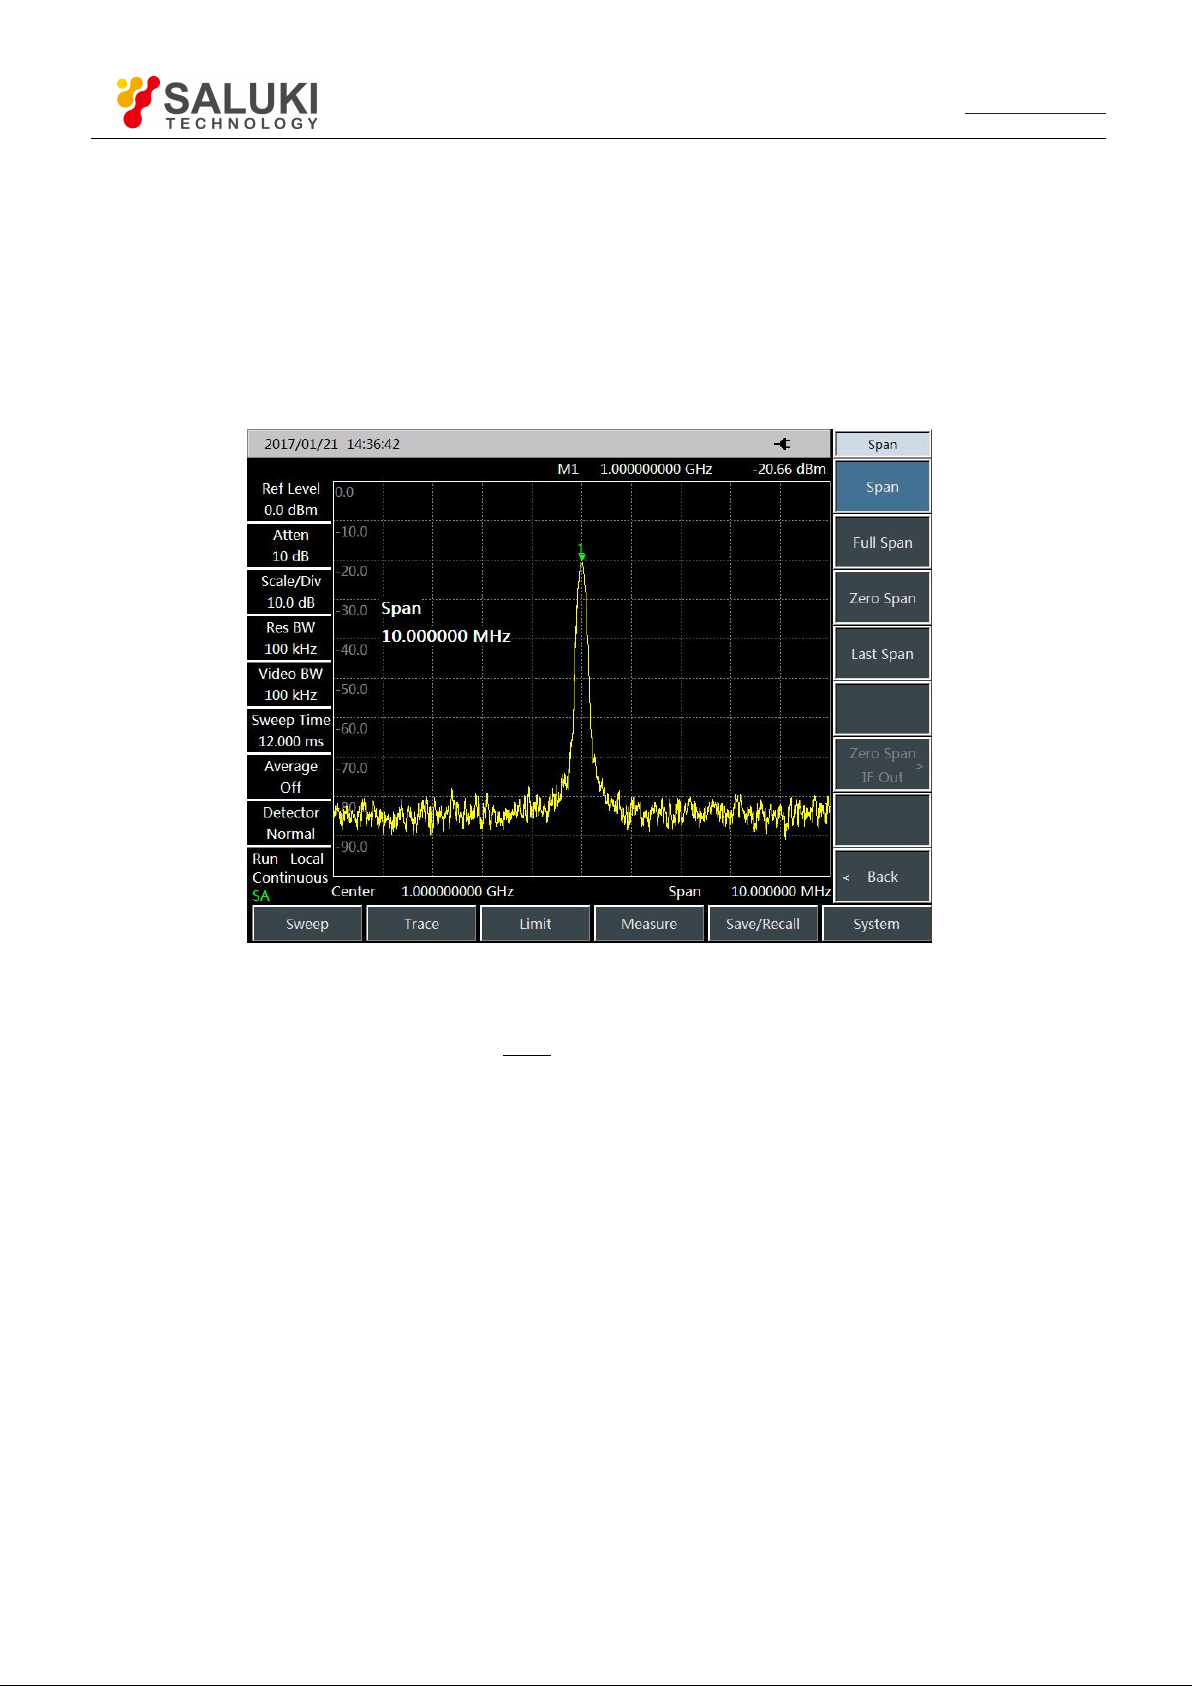
b) Set the span
Press 【Freq】 →[Span]. Please note if the span is shown in the active function area in order to confirm currently
activated parameter. To reduce the span to, for example, 10MHz, you can input [1] [0] using the numerical keypad
and select the unit as [MHz], or you can use 【 ↓ 】 key to reduce to this value by step (the numerical keys and
step keys can be used for changing the value of current parameter). The result is shown in Fig. 3.2. Attention
should be paid to check if the resolution bandwidth and the video bandwidth are adaptable to the span as they will
be automatically adjusted to a proper value based on the given span value. The sweep time is also adaptable.
Fig. 3.2 Center Frequency of 1GHz and Span of 10MHz
c) Set the sweep time
Press 【Sweep】key and select [Sweep Time Auto Man] soft key. The soft key can be used to set auto or manual
control of the sweep time, and the currently active option is underlined. For example, when “Auto” is underlined,
the sweep time will be automatically adaptable to other relevant parameter settings.
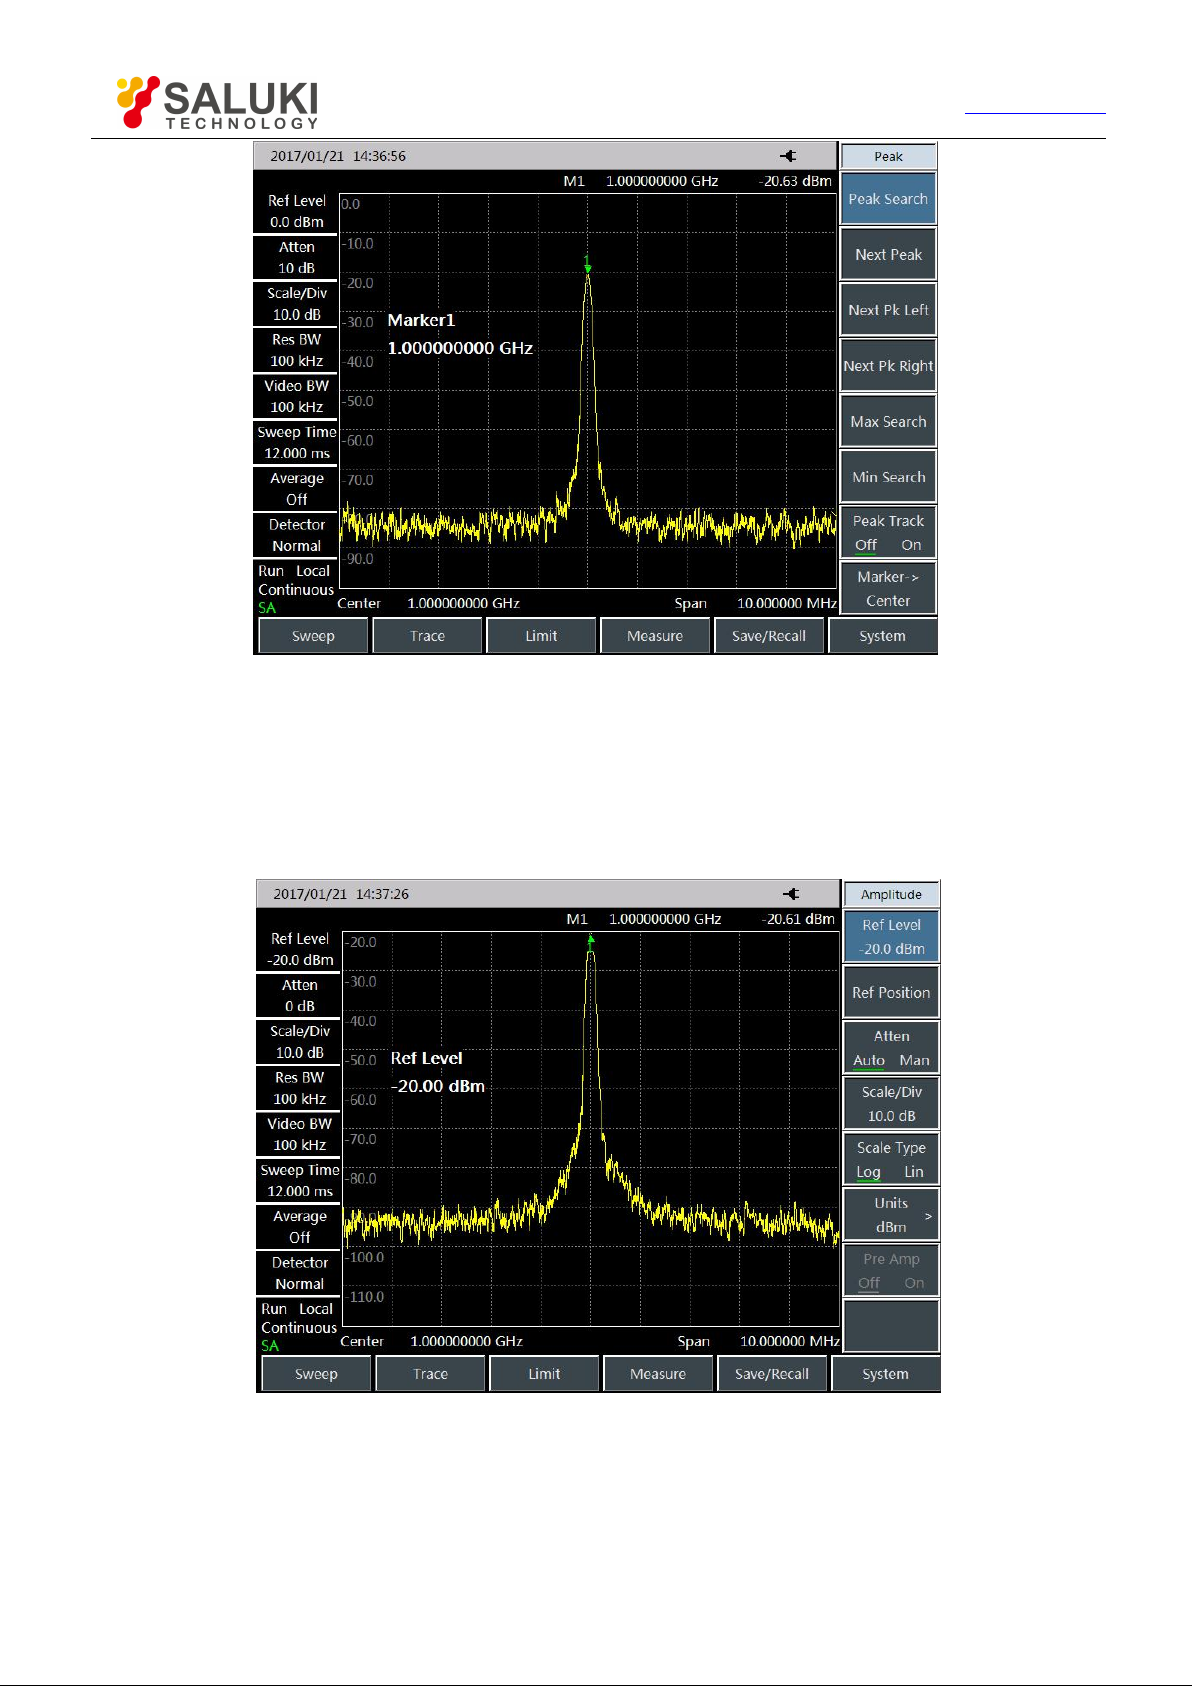
d) Activate the marker
By pressing 【Marker】, common marker will be activated and displayed in the center of the horizontal coordinates
(the frequency and amplitude will be read by the marker and shown in the active function area). The marker reads
the frequency as 1GHz and amplitude as -20dBm, as shown in Fig. 3.3.
If the marker is not at the peak, you can press 【Peak】 key to enable the marker to automatically jump to the peak
of the signal or use the knob on the front panel to manually position the marker on the maximum value of the
signal.
Page 17
Tel: 886.909 602 109 Email: [email protected]
16
www.salukitec.com
Fig. 3.3 Activating the Marker
e) Adjust the amplitude parameter
Generally, optimal amplitude measurement accuracy can be obtained by putting the signal peak at the reference
level position, as shown in Fig. 3.4. Press 【 Ampt 】 →[Ref Level] to set the reference level as the amplitude of
the marker.
Fig. 3.4 -20dBm Reference Level
f) Save the test results
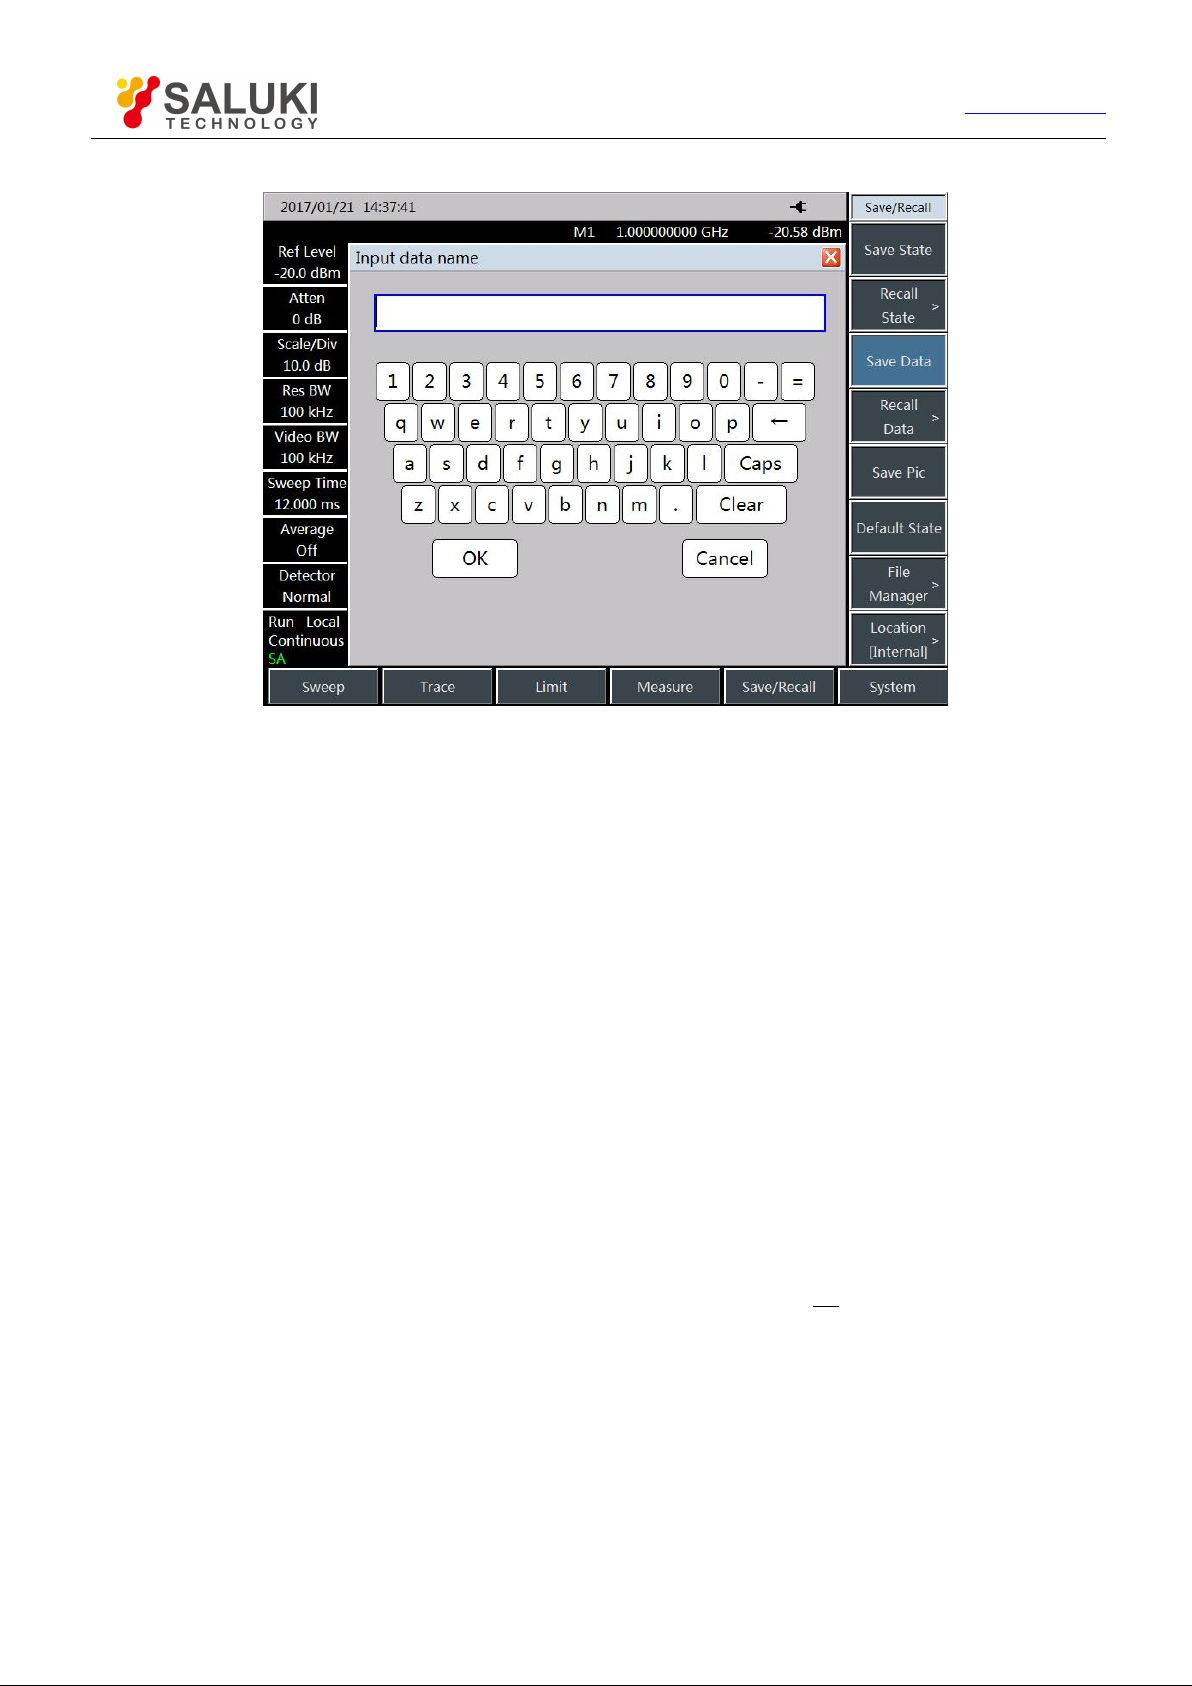
Press 【File】→[Save Data] (or select the save state or picture) and an interface shown in Fig. 3.5 will pop up.
Page 18
17
Input the name on the interface and then press [OK] to save.
Tel: 886.909 602 109 Email: [email protected]
www.salukitec.com
Fig. 3.5 File Saving
3.2 How to Improve the Accuracy of Frequency Measurement
This section will take the measurement of external 1GHz signal as an instance to describe how to use the marker
count function to improve the frequency reading accuracy for measurement. The test steps are as follows:
a) Reset the spectrum analyzer
Press 【Preset】key to restart the spectrum analyzer.
b) Set the center frequency
Set the frequency of the external signal generator to 1GHz. Set the center frequency of the Spectrum Analyzer.
Press 【Freq】, select [Center Freq] and set the center frequency as 1GHz. Or you can directly input [1] [GHz]
using the keys in numerical keypad on the front panel. These numerical keys can be used for setting the exact
value of current parameter. The value of center frequency can also be changed by the step key and knob.
c) Enable the marker count function
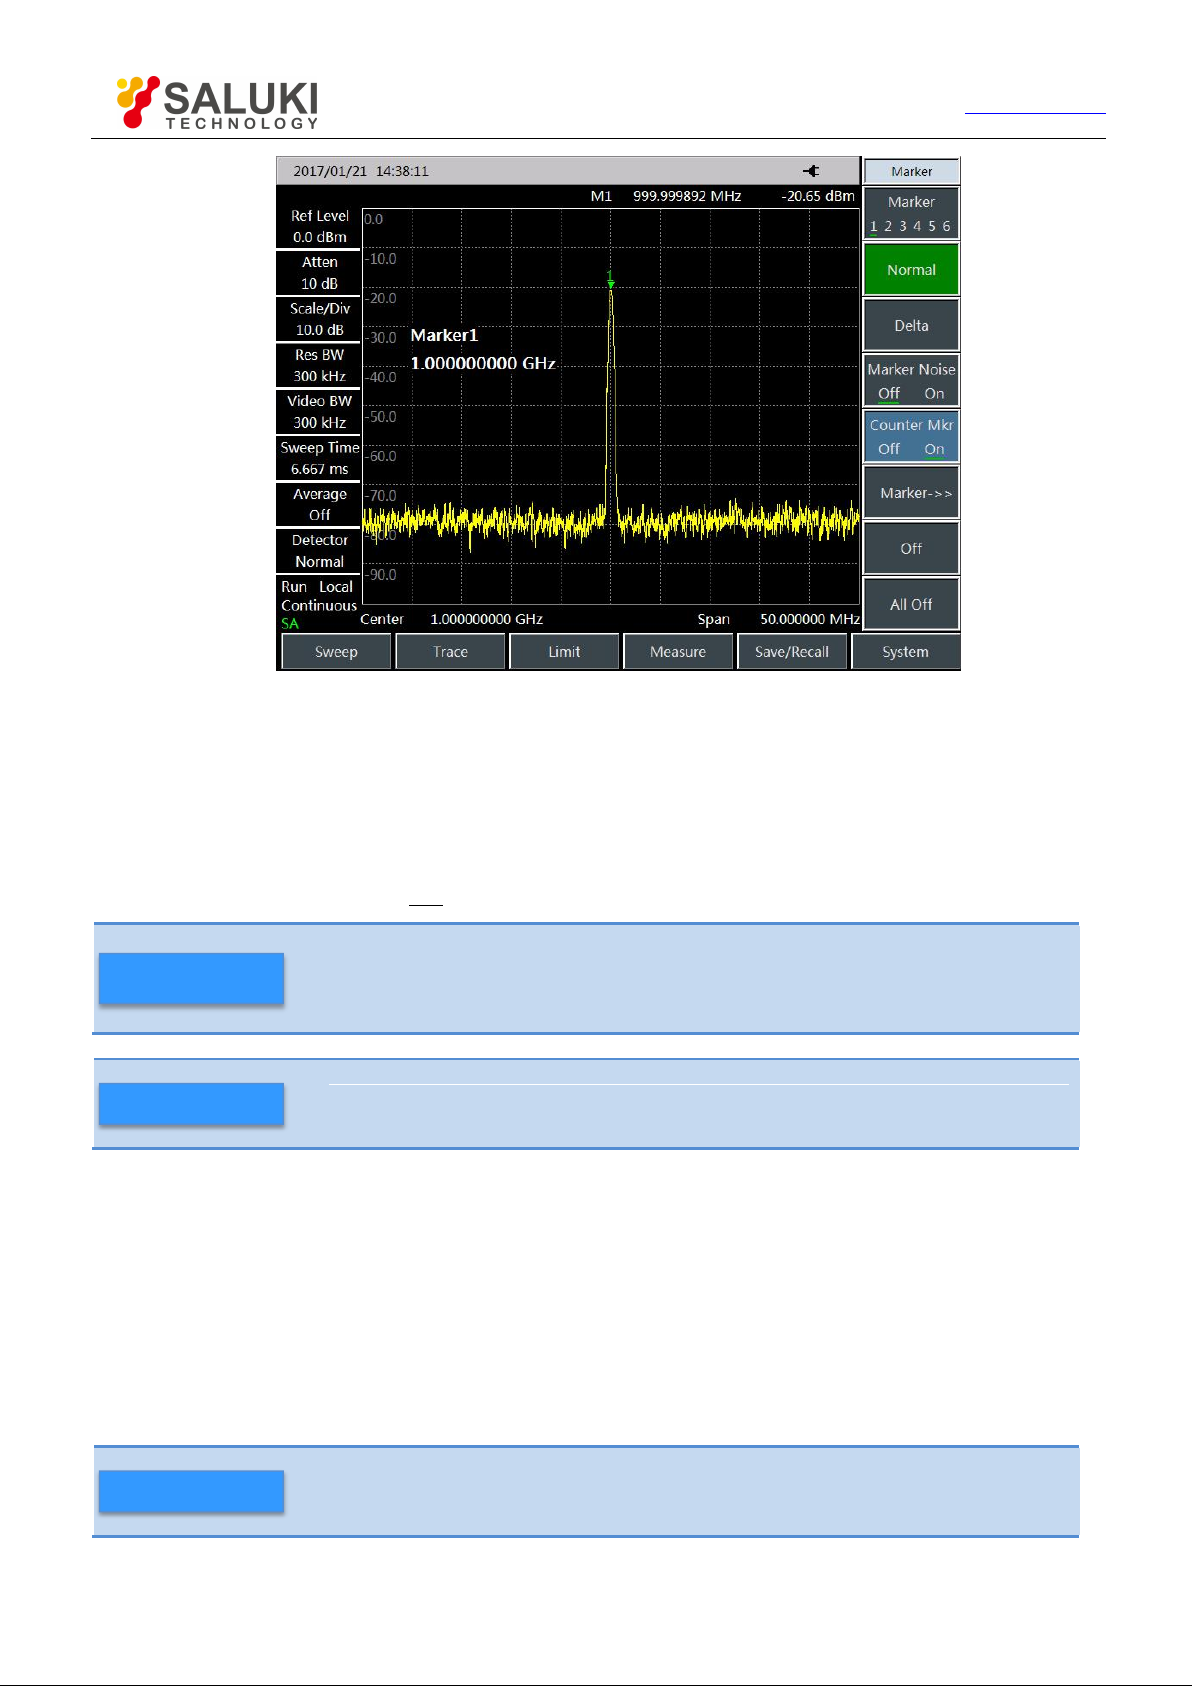
Press 【Marker】 to activate the marker. Press 【Marker】→[Counter Mkr Off On] to enable the marker count
function. Press 【 Peak 】 to position the marker on the signal frequency. Observe the reading of the marker and
the resolution of frequency can reach 1Hz. As shown in Fig.3.6.
Page 19
Tel: 886.909 602 109 Email: [email protected]
18
CAUTION
When executing frequency count function, if the sweep speed of the Spectrum Analyzer
slows down, this is normal as the Spectrum Analyzer is taking some time for accurate
positioning of signal and IF count in the background!
CAUTION
When executing frequency count function, to accurately measure the frequency, the tested
signal generator should share the same time base with the Spectrum Analyzer!
CAUTION
The total power of all signals input to the spectrum analyzer shall be less than +30dBm
(1W).
www.salukitec.com
Fig. 3.6 Improving the Accuracy of Frequency Measurement by Using Marker Function
The marker counting function can be only used to measure continuous wave signals or discrete spectrum
components that their amplitudes are greater than -50dBm and such amplitudes must be 30dB higher than noise
levels.
d) Disable the marker counter function
Press 【Marker】→[Counter Mkr Off On] to disable the marker count function.
3.3 How to Measure Small Signals
The noise generated inside the spectrum analyzer determines its ability to measure small signals. The following
methods can be used to change the measurement setting, thus improving the measurement sensitivity of the
Spectrum Analyzer.
3.3.1 Reduce RF attenuation decrement to measure small signals
The input attenuator affects the signal level of the input instrument. If the input signal is very close to the
noise base, by reducing the decrement of the attenuator, the signal can be extracted from the noise.
Page 20
Tel: 886.909 602 109 Email: [email protected]
19
www.salukitec.com
a) Reset the spectrum analyzer
Press 【Preset】key to restart the spectrum analyzer.
b) Set the center frequency, the span, and the reference level
Set the frequency of the external signal generator to 300MHz and set the amplitude to -80dBm, and connect the
radio frequency output end of the signal generator to the radio frequency input end of the spectrum analyzer. Set
the center frequency of the spectrum analyzer. Press 【 Freq 】 and select [Center Freq] to set the center
frequency to 300MHz, and then select 【Span】 to set the span to 5MHz. Press 【Ampt】and select [Ref Level]
to set the reference level to -40dBm.
c) Move the signal peak to the center frequency (300MHz in this case)
Press 【Peak】and [Marker→Center] to move the signal peak to the center frequency.
d) Reduce bandwidth
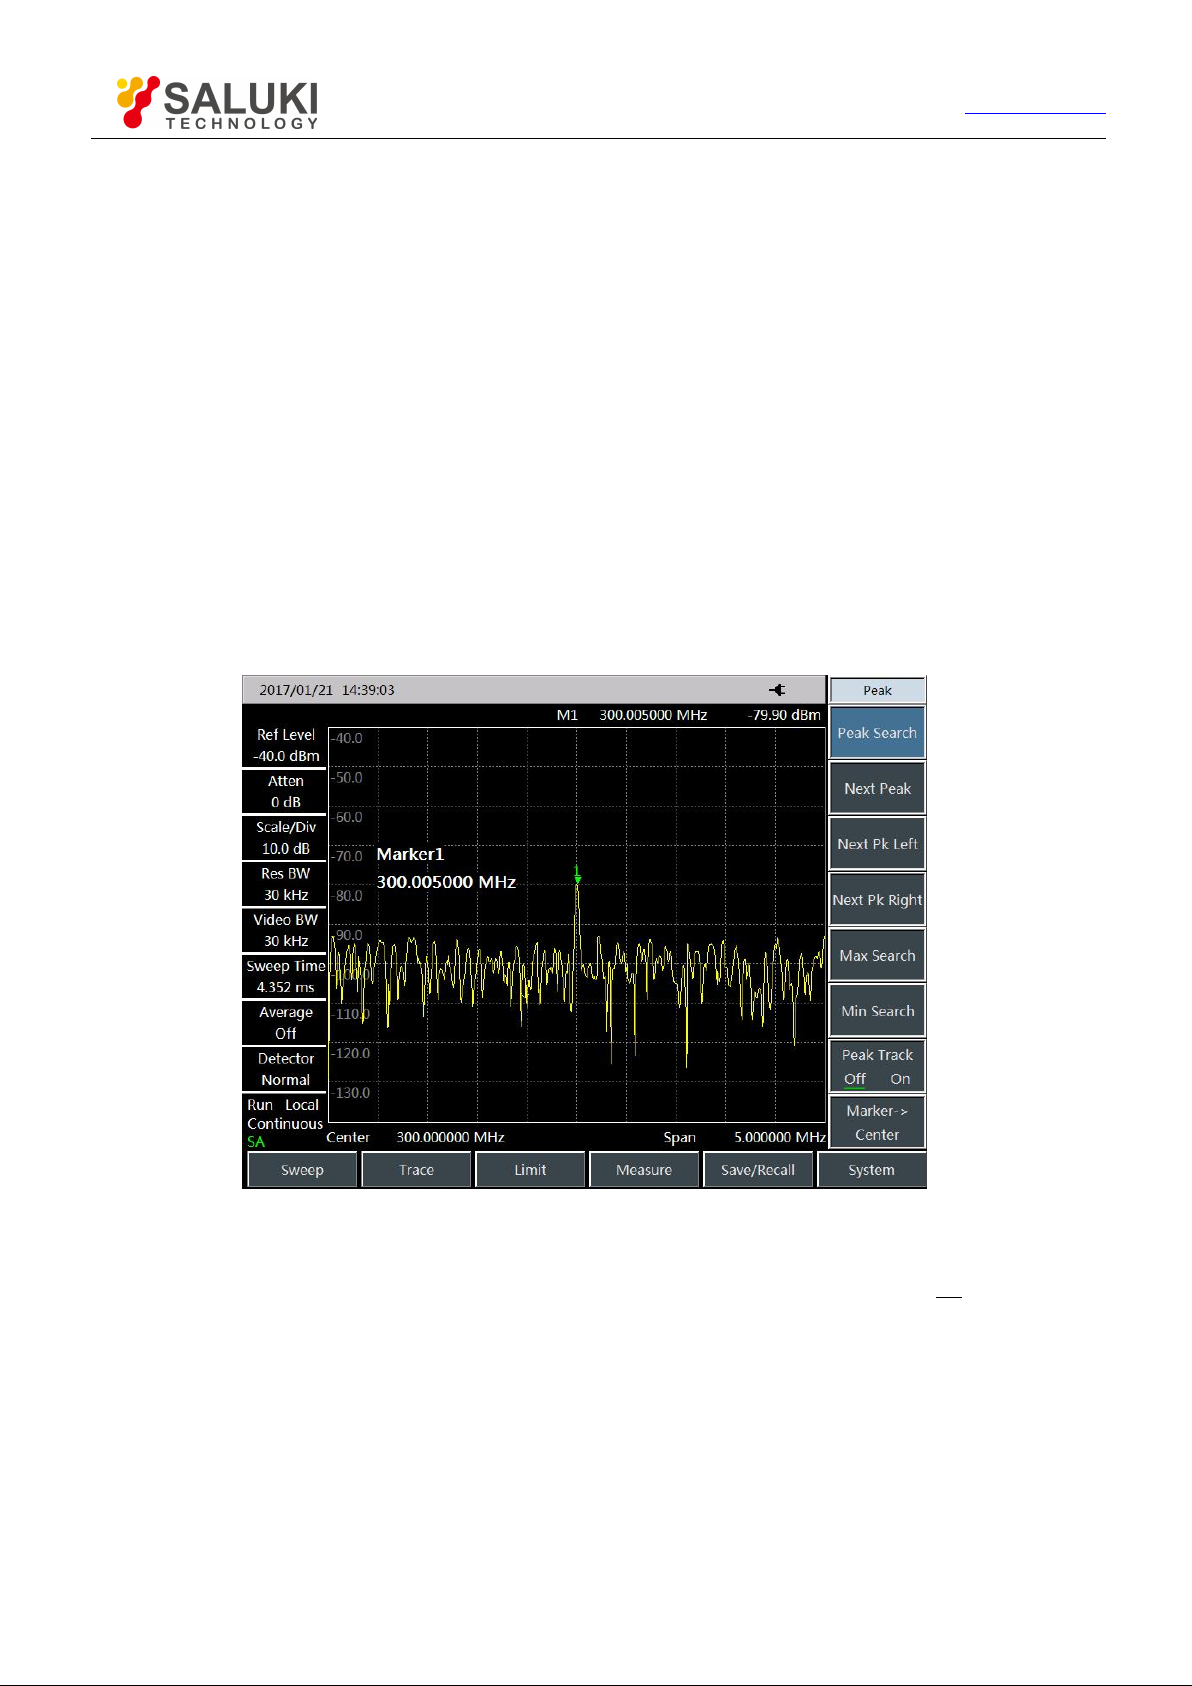
Press 【BW】and set the bandwidth as 1MHz. If necessary, repeat Step c) to ensure that the signal peak is the
center frequency of the Spectrum Analyzer. As shown in Fig. 3.7.
Fig. 3.7 Small Signals when pre-amplifier Off
e) Enable the pre-amplifier
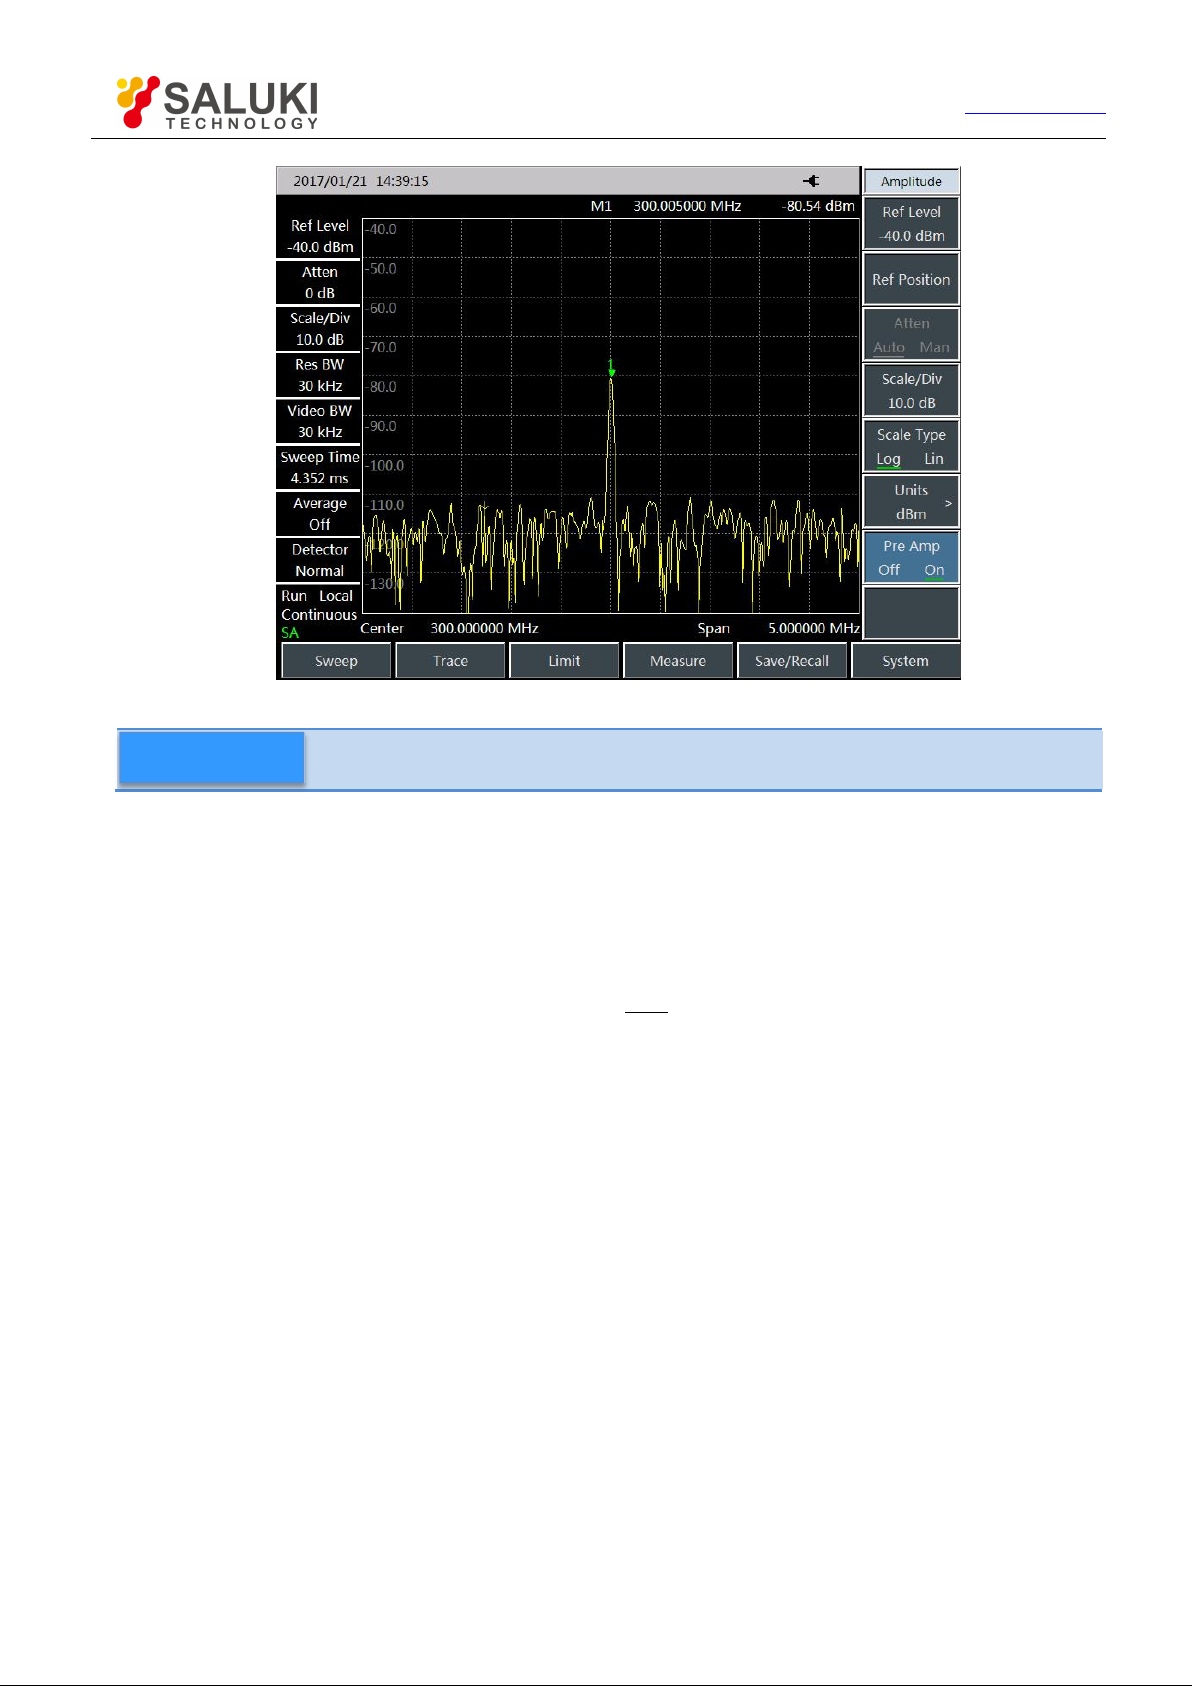
On this basis, you can further enable the pre-amplifier by pressing 【 Ampt 】 →[Pre Amp Off On], as shown in
Fig. 3.8.
Page 21
Tel: 886.909 602 109 Email: [email protected]
20
CAUTION
After finishing the test, please remember to increase the attenuation of the Spectrum
Analyzer to protect the RF input port of the Spectrum Analyzer.
www.salukitec.com
Fig. 3.8 Small Signals when pre-amplifier On
3.3.2 Reduce resolution bandwidth to measure small signals
The resolution bandwidth affects the internal noise base of the Spectrum Analyzer but will not affect the level of
measured continuous wave signal. The relation between noise reduction and resolution bandwidth can be
expressed with the following formula:
BW
BW
1
2
L 10log
Where, ∆L is the change of the noise amplitude, expressed in dB.
BW1, BW2are different resolution bandwidths, expressed in Hz.
Therefore, when the frequency bandwidth is reduced by 10 times, the noise floor will be reduced by 10 dB.
a) Reset the spectrum analyzer
Press 【Preset】key to restart the spectrum analyzer.
b) Set the center frequency, the span, and the reference level
Set the frequency of the external signal generator to 300MHz and set the amplitude to -80dBm, and connect the
radio frequency output end of the signal generator to the radio frequency input end of the spectrum analyzer. Set
the center frequency of the spectrum analyzer. Press 【Freq 】 and select [Center Freq] to set the center
frequency to 300MHz, and then select 【Span】 to set the span to 5MHz. Press 【Ampt】and select [Ref Level]
to set the reference level to -40dBm.
Page 22
Tel: 886.909 602 109 Email: [email protected]
21
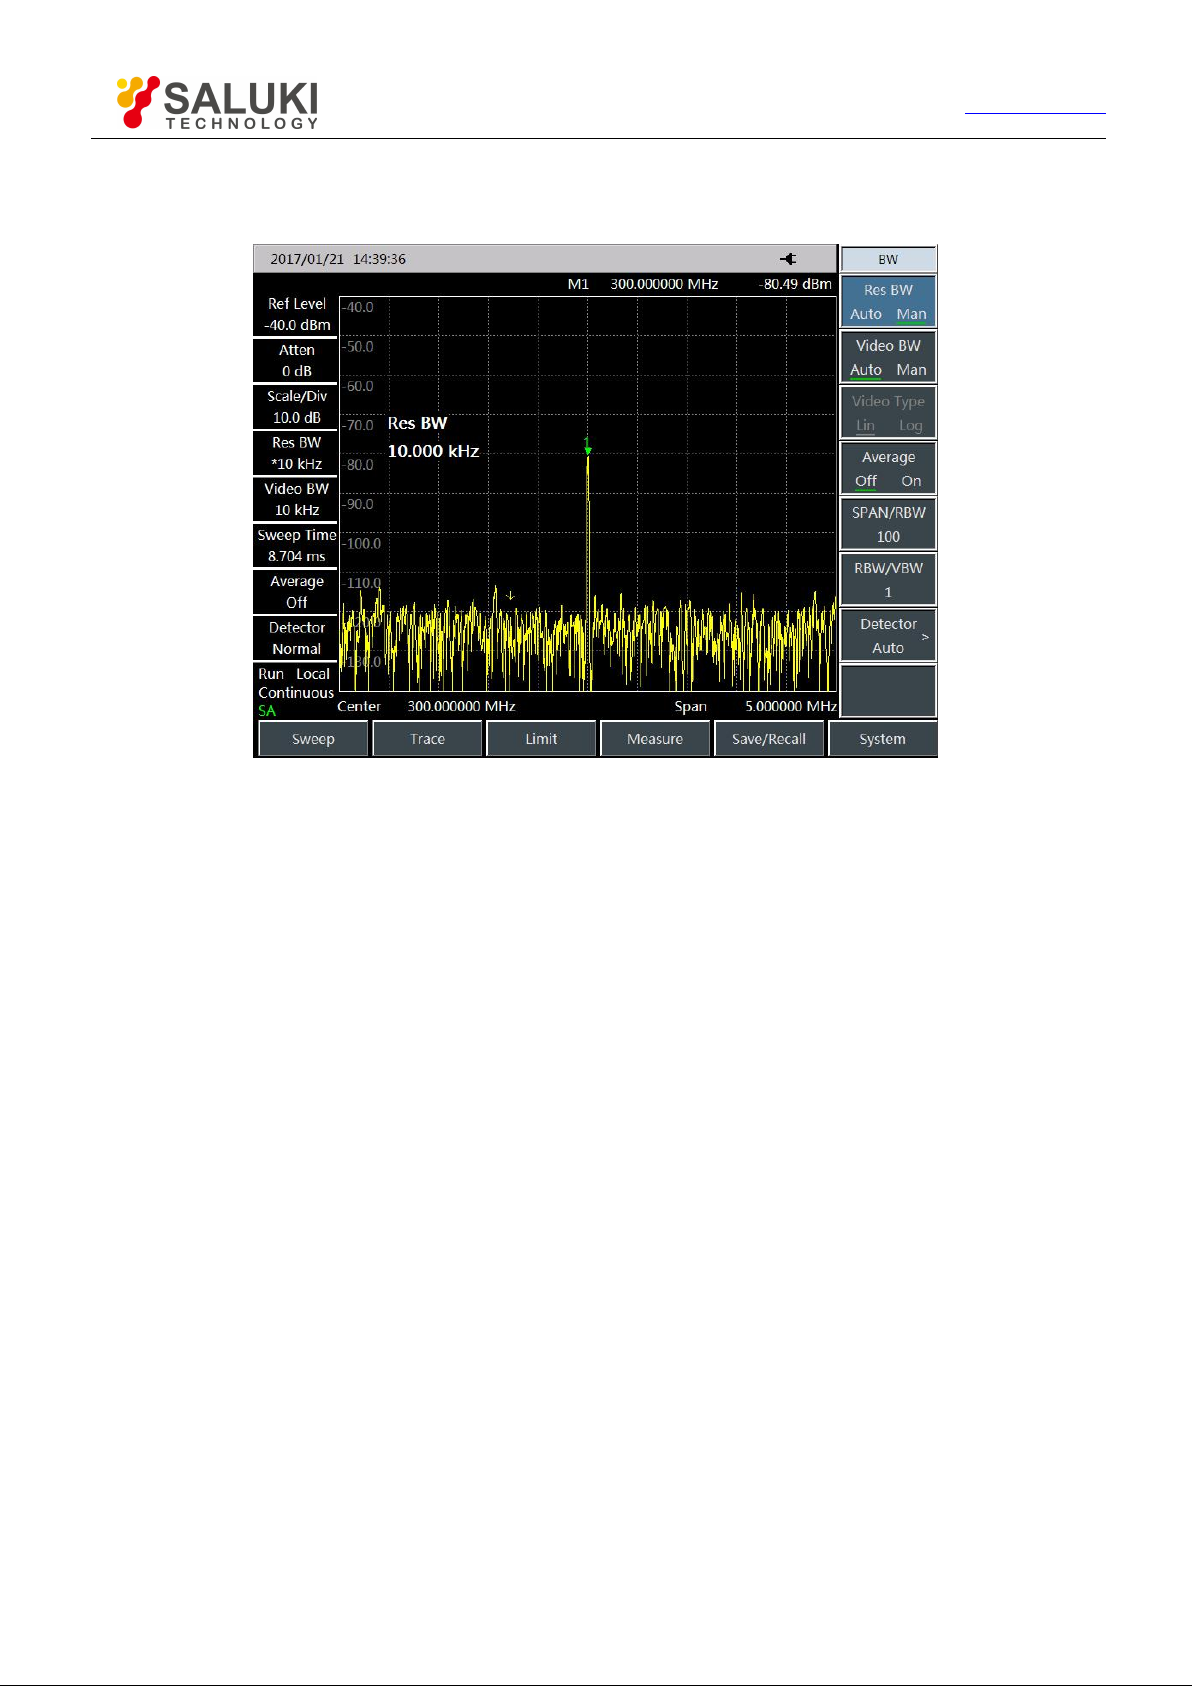
c) Reduce the resolution bandwidth with the step key 【↓】
As shown in Fig. 3.9, the noise floor reduces and therefore we can see the signal more clearly.
www.salukitec.com
Fig. 3.9 Measuring Small Signals by Reducing Resolution Bandwidth
As the reduction of resolution bandwidth will increase the sweep time, in the S3302 Spectrum Analyzer, resolution
bandwidth 1Hz - 10MHz is realized by step 1-3-10. Proper resolution bandwidth should be selected to realize
delicate compromise between sweep time and resolution bandwidth.
3.3.3 Measuring small signals by using average detection and increasing sweep time
When the noise floor of the spectrum analyzer masks small signals, the noise can be smoothed by using the
average detector and increasing the sweep time so as to improve the visibility of such signals. A slower sweep
speed can result in a better mean square error of noise.
a) Reset the spectrum analyzer
Press 【Preset】key to restart the spectrum analyzer.
b) Set the center frequency, the span, and the reference level
Set the frequency of the external signal generator to 300MHz and set the amplitude to -80dBm, and connect the
radio frequency output end of the signal generator to the radio frequency input end of the spectrum analyzer. Set
the center frequency of the spectrum analyzer. Press 【 Freq 】 and select [Center Freq] to set the center
frequency to 300MHz, and then select 【Span】 to set the span to 5MHz. Press 【Ampt】and select [Ref Level]
to set the reference level to -40dBm.
c) Select the detection method of the spectrum analyzer to the average detection.
Press 【BW】, [Detector] and [Average] to select the average detection method. At this time, the information
bar at the left of the display screen appears “Detection Average”, showing it is set to the mean detection
Page 23

Tel: 886.909 602 109 Email: [email protected]
22
www.salukitec.com
manually.
d) Increase the sweep time of the spectrum analyzer
Press 【Sweep】and [Sweep Time Auto Man] and increase the sweep time with the step key 【↑】. By increasing
the sweep time, there may be more time for averaging data at each trace pixel point.
3.3.4 Measuring small signals by using video average
In video average function, digi tal method is used to average the mean value s of current trace point for
sweepi ng and previo us same trace posit ion. Enable vi deo average to set the numbe r of vi deo av erage.
The video average gets different res ult from the avera ge de tector.
a) Reset the spectrum analyzer
Press 【Preset】key to restart the spectrum analyzer.
b) Set the center frequency, the span, and the reference level
Set the frequency of the external signal generator to 300MHz and set the amplitude to -80dBm, and connect the
radio frequency output end of the signal generator to the radio frequency input end of the spectrum analyzer. Set
the center frequency of the spectrum analyzer. Press 【Freq 】 and select [Center Freq] to set the center
frequency to 300MHz, and then select 【Span】 to set the span to 5MHz. Press 【Ampt】and select [Ref Level]
to set the reference level to -40dBm.
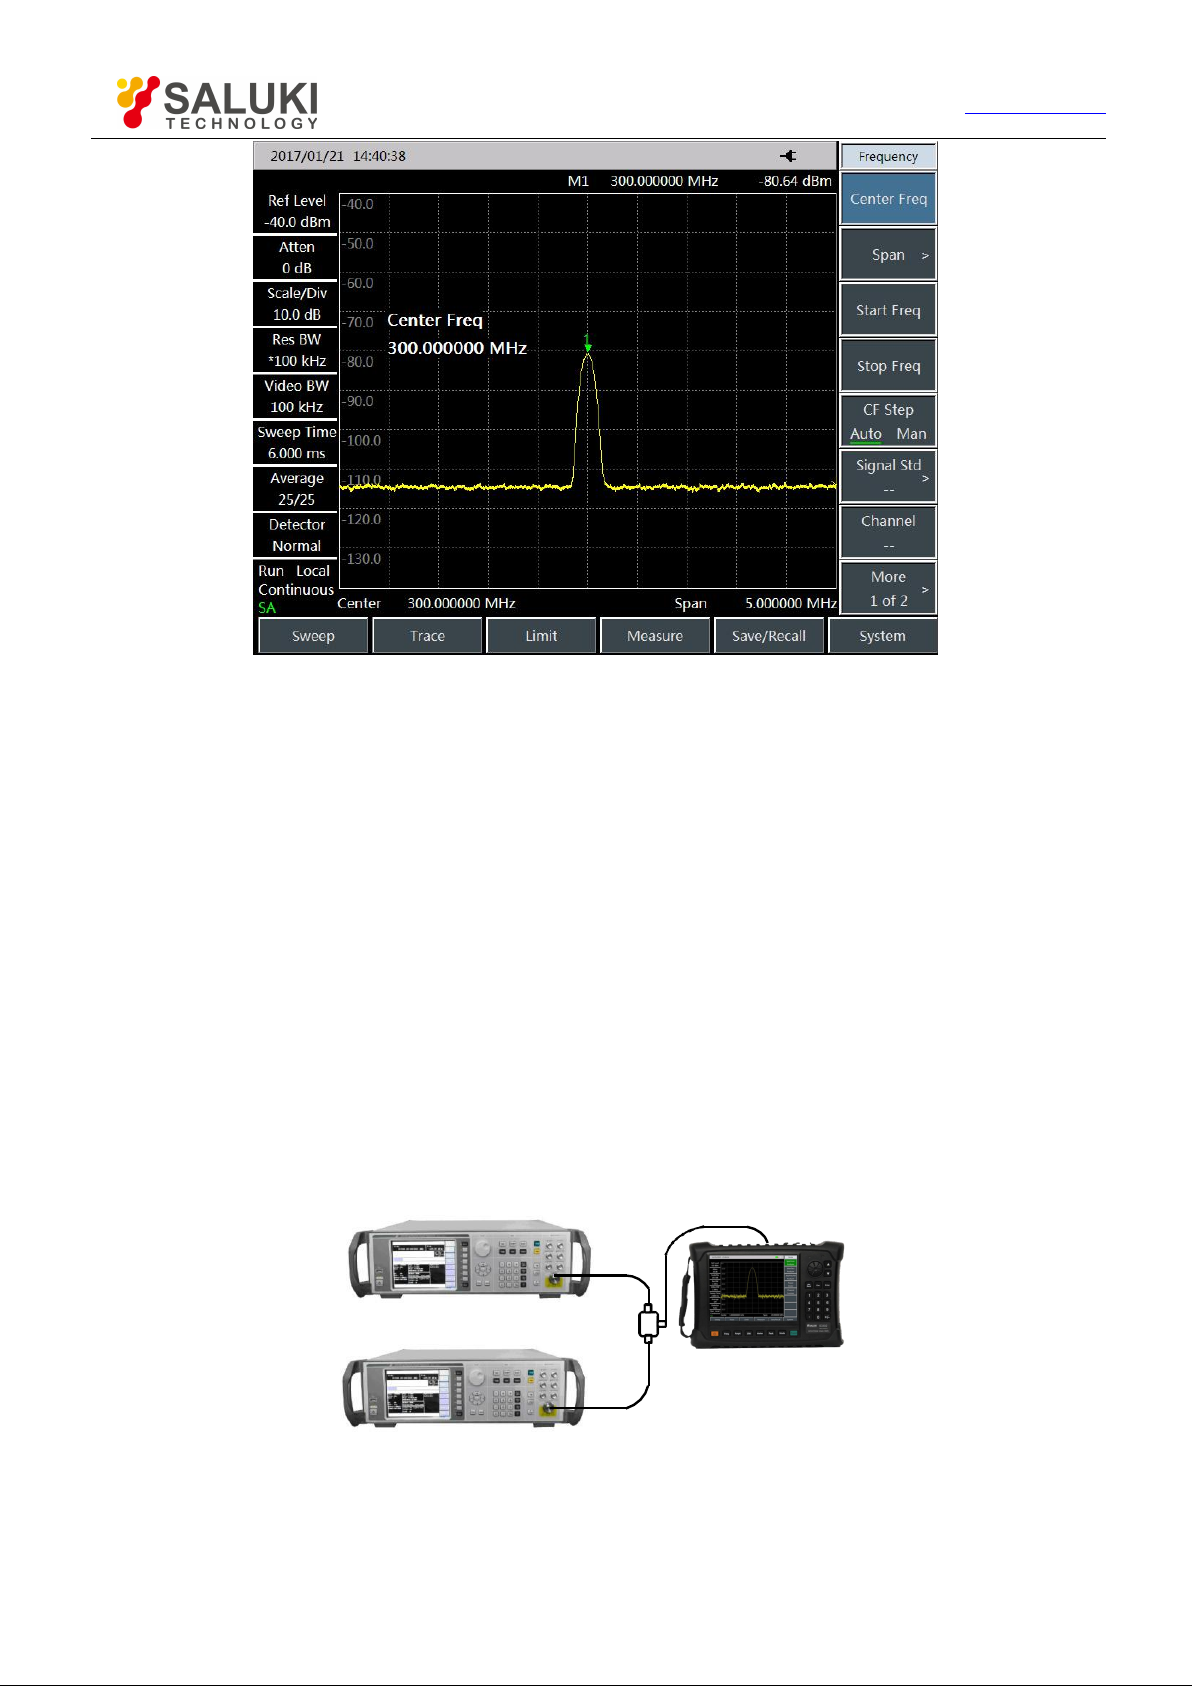
c) Enable the video average function
Press 【BW】 and [Average On Off]. As the average program averages the trace, the small signal becomes
clearer. The default number of averages is 16.
d) Set the number of averages to 25
Input the number 25 by the numerical keypad on the front panel and press [ok], or【 Enter 】key on the soft menu,
as shown in Fig. 3.10. The Remarks window at the left of the screen will display the number of average. Once the
set number of average is reached, the Spectrum Analyzer will continue to perform average computation on this
data basis. If you want to stop the measurement after the number of average is reached, you may use single sweep
function. Press 【Sweep】and [Sweep Cont Single].
Page 24
Tel: 886.909 602 109 Email: [email protected]
23
Signal generator
Spectrum analyzer
T connector
Signal generator
www.salukitec.com
Fig. 3.10 Measuring Small Signals by Using Track Average
3.4 How to Identify Signal with Closely Spaced Frequency
3.4.1 Description of resolution bandwidth
Signal resolution is determined by the bandwidth of IF filter of the Spectrum Analyzer, i.e. the resolution bandwidth
(RBW) When a signal passing through the IF filter, the Spectrum Analyzer uses the signal to sweep the band pass
shape of the IF filter. When the Spectrum Analyzer receives two signals with the same amplitude and closely spaced
frequency, the top of a band pass filter waveform swept by one signal will cover the other signal, and as a result, the
two signals may look like one signal. If the two signals have different amplitudes but the frequency is still close, then
the small signal may be covered up by the response of large signal.
3.4.2 Measurement for distinguish two signals with same amplitude
In general, in order to distinguish two signals of same amplitude, the resolution bandwidth must be less than or
equal to the frequency spacing of two signals. Taking distinguishing signals of same amplitude with a spacing of
100 kHz as an example, the user should select the resolution bandwidth of the Spectrum Analyzer as less than or
equal to 100 kHz.
a) Reset the spectrum analyzer
Fig. 3.11 Test instrument connection diagram of two input signals
Page 25

Tel: 886.909 602 109 Email: [email protected]
24
www.salukitec.com
Press 【Preset】key to restart the spectrum analyzer.
b) Set the signal generator
Use a T connector to connect the output of two signal generators to the RF input port of the Spectrum Analyzer, as
shown in Fig. 3.11. Set the frequency of one signal generator as 300MHz and the other as 300.1MHz and set the
output amplitude of two signal generators as -20dBm. Adjust the signal output amplitude of two signal generators
and observe the signal displayed on the Spectrum Analyzer so that the amplitude of these two signals displayed on
the Spectrum Analyzer is the same.
c) Set the center frequency, span and resolution bandwidth of the spectrum analyzer
Press 【Freq】and [Center Freq] to set the center frequency of the spectrum analyzer to 300MHz, select 【Span】
to set the span to 2MHz, and press【BW】 and [RBW Auto Man] to set the RBW to 300kHz.
d) Observe the signal in the spectrum analyzer
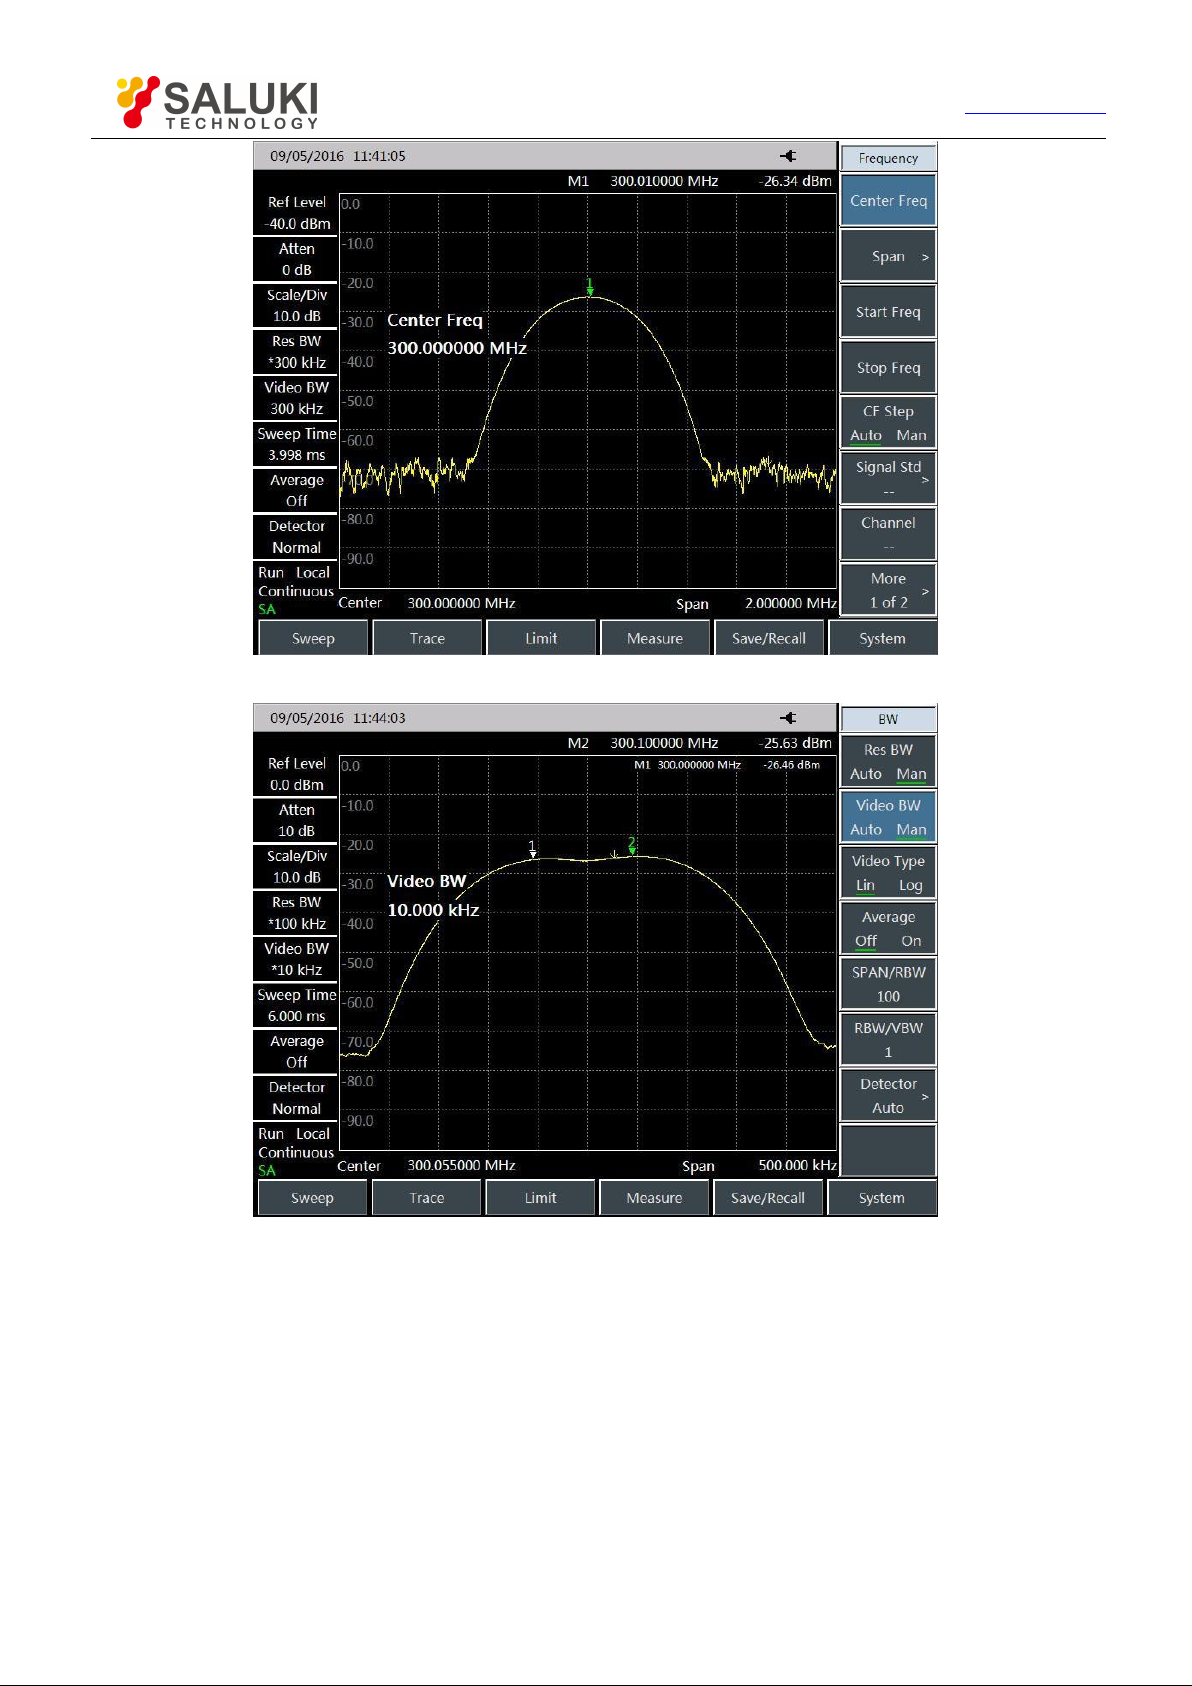
On the display screen of the Spectrum Analyzer, only one signal peak can be seen and signals with close frequency
spacing cannot be distinguished, as shown in Fig. 3.12.
e) Adjust the resolution bandwidth
Press 【BW】and [RBW Auto Man] to adjust the resolution bandwidth to 100kHz so that the resolution bandwidth
is less than or equal to the frequency interval of such two signals. It can now be seen that the signal peak on the
screen becomes flat, which indicates that there may be two signals.
f) Reduce the video bandwidth
Press 【BW】 and [VBW Auto Man] to adjust the video bandwidth to 10kHz. wo signals can be seen on the screen,
as shown in Fig. 3.13. Use the knob or 【 ↓ 】 key on the front panel to continue to reduce the resolution
bandwidth to show two signals more clearly.
For spectrum analyzer which the resolution bandwidth steps in the form of 1-3-10, to distinguish two signals with
the frequency spacing of 200 kHz, the resolution bandwidth must be 100 kHz. As the primary filter on the spectrum
analyzer is 300 kHz which is higher than the 200 kHz frequency spacing, the two signals cannot be distinguished.
Page 26
Tel: 886.909 602 109 Email: [email protected]
25
www.salukitec.com
Fig. 3.12 Unable to distinguish two signals of same amplitude
Fig. 3.13 Distinguishable two signals with same amplitude
Page 27

Tel: 886.909 602 109 Email: [email protected]
26
www.salukitec.com
Chapter 4 Getting Help
In general, once a problem arises from hardware, software or improper use. In case of any problem, check and
save error information, analyze possible causes, and perform preliminary troubleshooting with reference to the
method prescribed in “4.1 Basic inspection”. You can also contact our customer service center and provide the
collected error information. We will assist you to solve the problem as soon as possible. Refer to Section 4.2 for
specific contact information, or query our website ww w.s a l u kit ec. com online so as to get the contact
information of the nearest technical support center.
4.1 Basic Inspection
You can inspect the S3302 as per the following instructions in the case of any failure in your device. Please contact
us if the failure cannot be removed.
If the S3302 series can’t be started when the Power key is pressed, check whether the power supply is
normal, whether the adapter indicator is ON and whether the power supply battery is normal. If the above items
are normal, the instrument failure may occur. In this case, contact us for repair.
If the S3302 series can’t enter the system or application procedure after start, please press【Preset】button
to restore the S3302 to a known state. If S3302 still cannot work properly, an instrument failure may occur. In this
case, contact us for repair.
Press 【System】-[More 1/2]-[System Info], and you can view details about self- inspection of relevant parts.
If self-inspection fails, please press【Preset】key to restore the S3302 to a known state. If self-inspection still fails,
an instrument failure may occur. In this case, contact us for repair.
If there is something wrong with the response of S3302 touch screen, please press 【Preset】 key to restore
the S3302 to a known state. If it still fails, an instrument failure may occur. In this case, contact us for repair.
If the performance indicator of S3302 is abnormal, please check whether the test tools and test environment
conform to the requirements, whether the test connector is damaged and whether the performance indicator of the
test unit is normal. If there is no problem, the device will be deemed to have faults, please contact us for repair.
If S3302 fails to communicate via the LAN, firstly confirm the IP address setting of the spectrum analyzer
and check the yellow LED next to the LAN interface on the rear panel. If this indicator is off, check LAN cable and
connection. If it still fails, an instrument failure may occur. In this case, contact us for repair.
4.2 Help Information
S3302 series spec t rum analy z er has the “Error Log” function. When a problem occurs, the instrument will
automatically generate an “Error Log” which will record abnormalities such as hardware, file loss and program
control operation of the instrument. The log has three levels which are prompting, warning and error for assisting
the analysis of instrument fault. The user can view the error log through 【 System 】→ [Page Down] → [Error
Log].
In addition, our customer service support center can help you at any time. We can provide you with
comprehensive and convenient technical support and related services.
Page 28
Tel: 886.909 602 109 Email: [email protected]
27
Service Tel:
886.909 602 109
Website:
www.salukitec.com
Email:
Address:
No. 367 Fuxing N Road, Taipei 105, Taiwan (R.O.C.)
!
WARNING
We shall not be held responsible for any damage to the instrument or personal injury
caused by improper operation or rule-breaking operations!
www.salukitec.com
Contacts:
All instruments supplied by us pass inspection by the Quality and Safety Department of the company, and they
are guaranteed for 36 months from the date of delivery and maintained for a long time. During the warranty period,
the instrument will be repaired free of charge if its failure is caused for non-human causes. If the warranty period
expires, the instrument repair will be charged according to the repair cost. Depending on different failures of the
instrument, the problems you have encountered will be solved in different ways including answering by telephone
or on-site repair.
In addition, please contact us in time in the case of the instrument failure. We will provide you with the help you
need and, if necessary, you may return it to the factory for repair. The user is strictly forbidden to disassemble the
instrument to avoid damages to internal circuits and components due to improper operation.
4.3 Repair Methods
Please contact us by phone or email when your S3302 incurs an unsolvable problem. If the instrument has to be
repaired, please pack it according to the following steps:
(1) Write a hard copy of file describing the failure phenomenon of this instrument and put it into the
packing box with the Spectrum Analyzer.
(2) Use the original packaging materials to pack the instrument properly to minimize damage.
(3) Place pads properly in the four corners of the external packaging before the instrument is put into
the external packaging;
(4) Seal the external packaging with adhesive tape and secure it with nylon tape;
(5) Mark “Fragile! No touch! Handle with Care” on the packing case.
(6) Ship this instrument as a precision instrument, and keep a copy of all the shipping documents.
Page 29

Tel: 886.909 602 109 Email: [email protected]
28
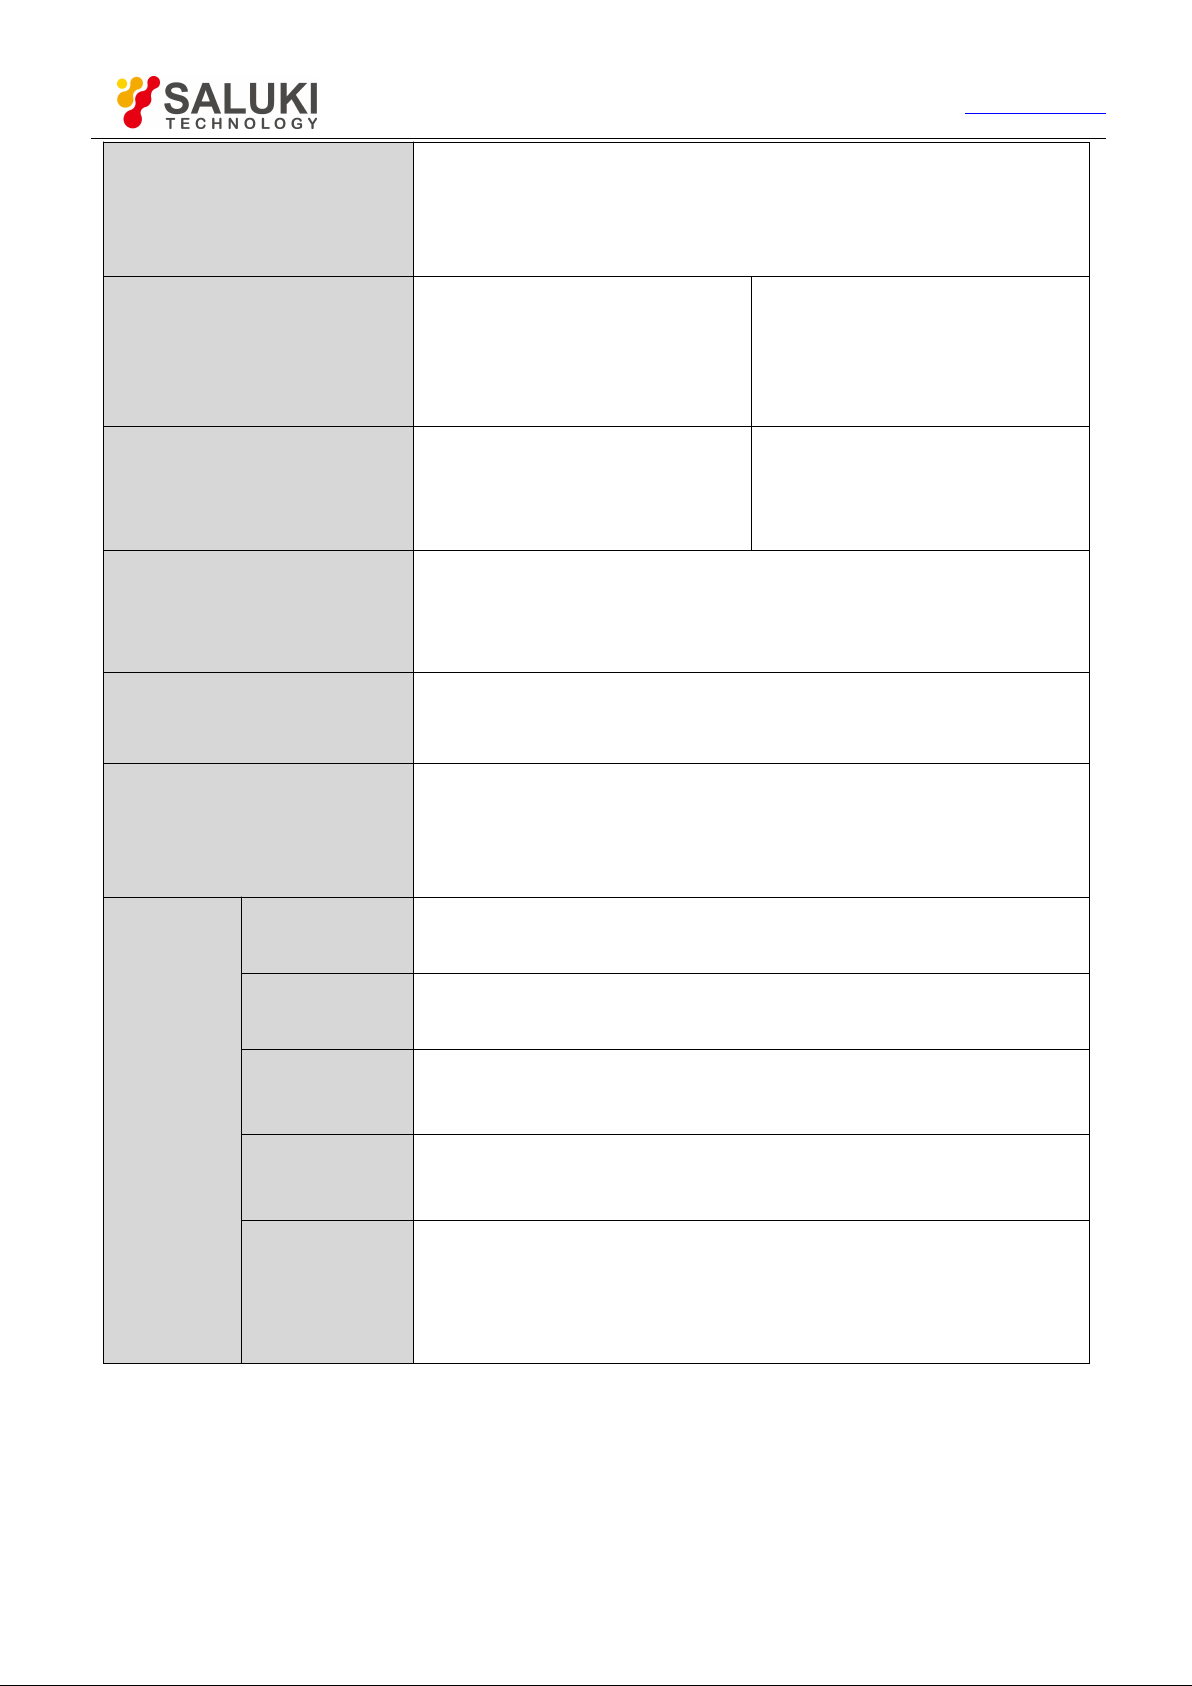
Test Item
Technical Specifications
Model
S3302SA/SB/SC, S3302A/B/C/D
Frequency range
S3302SA: 9 kHz - 4 GHz S3302SB: 9kHz - 6.5GHz
S3302SC: 9kHz - 9GHz
S3302A: 9 kHz - 20 GHz S3302B: 9 kHz - 26.5 GHz
S3302C: 9 kHz - 32 GHz S3302D: 9 kHz - 44 GHz
Frequency readout accuracy
(Frequency reading × frequency reference error + 2% × span + 10% ×
resolution bandwidth)
Frequency reference
Frequency reference error: (Last calibration date × aging rate + temperature
stability + calibration accuracy)
Aging rate: 510-7/year
Temperature stability: 110-7(-10°C 50°C, relative to 255°C) Initial
calibration accuracy: 310
-7
Note: The default time elapsed since the last calibration date is one year.
Frequency span
Range: 100 Hz - upper limit of the frequency of the corresponding model;
0 Hz (zero span)
Accuracy: ±2.0%
Sweep Time
Range: 10 μs - 600 s (zero span)
Accuracy: ±2.00% (zero span)
Resolution Bandwidth
Range: 1 Hz - 10 MHz (1-3 times step)
Video Bandwidth
Range: 1 Hz - 10 MHz (1-3 times step)
SSB phase noise
(Carrier 1 GHz, 20℃-30℃)
S3302SA/SB/SC :
≤-108 dBc/Hz@10 kHz frequency offset
≤-112 dBc/Hz@100 kHz frequency offset
≤-118 dBc/Hz@1MHz frequency offset
≤-129 dBc/Hz@10MHz frequency offset
www.salukitec.com
Appendix 1 Technical Specifications
The technical indexes of S3302 series spectrum analyzer are subject to strict test when ex-factory. The user
can test and verify the device based on the technical indexes in this manual. Main technical indexes of
S3302 are shown in the table below.
Table 1 Technical Specifications of S3302 Series Spectrum Analyzer
Page 30

Tel: 886.909 602 109 Email: [email protected]
29
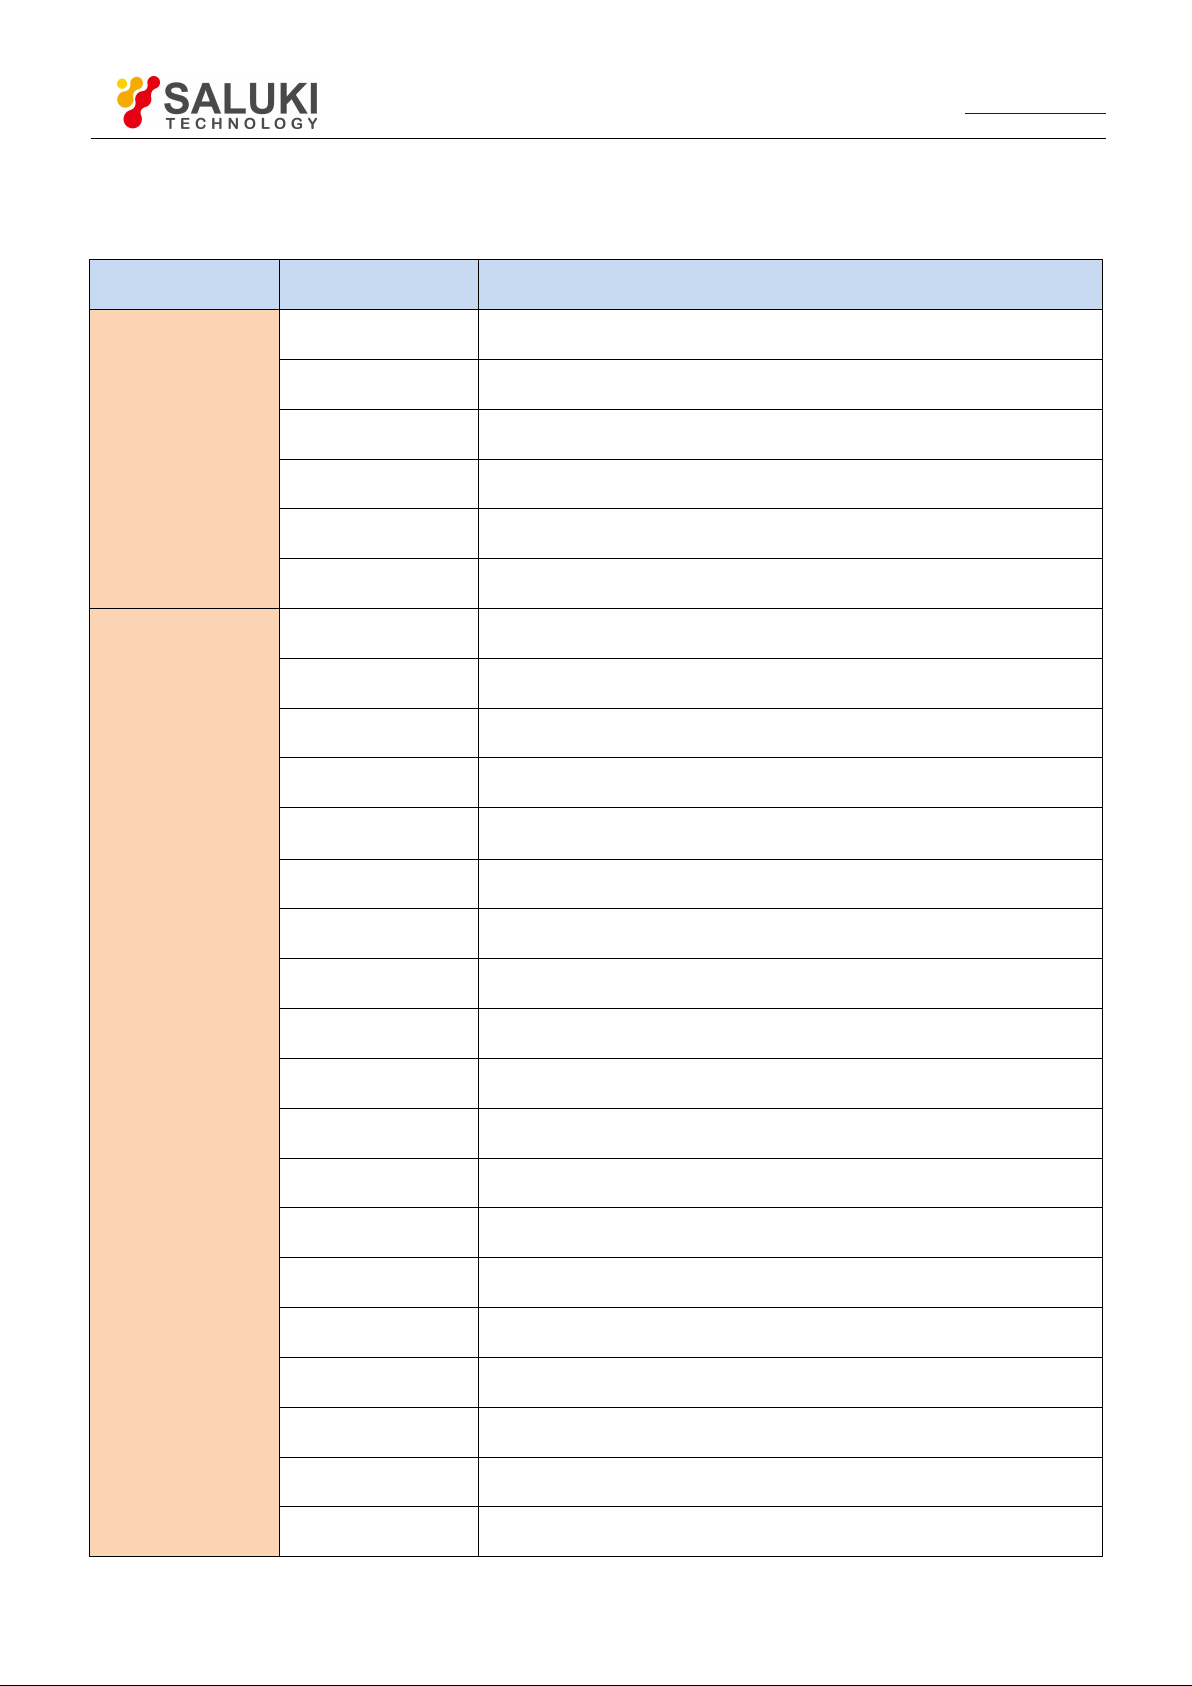
S3302A/B/C/D :
≤-102 dBc/Hz@10 kHz frequency offset
≤-106 dBc/Hz@100 kHz frequency offset
≤-111 dBc/Hz@1MHz frequency offset
≤-123 dBc/Hz@10MHz frequency offset
Displayed average noise level
(0Ω load at the input end, 0dB
input attenuation, average
detector mode, logarithmic
Video Type, RBW normalized
to 1 Hz, 20℃-30℃, tracking
generator off)
Preamplifier off
≤-138 dBm (10 MHz - 20 GHz) ≤-135 dBm (20 GHz - 32 GHz)
≤-127 dBm (32 GHz - 40 GHz) ≤-120 dBm (40 GHz - 44 GHz)
Preamplifier on
≤-157 dBm (10 MHz - 20 GHz) ≤-154 dBm (20 GHz - 32 GHz)
≤-148 dBm (32 GHz - 40 GHz) ≤-140 dBm (40 GHz - 44 GHz)
Second harmonic distortion
(0 dB attenuation, -30 dBm
input signal)
S3302SA/SB/SC :
<-65 dBc
S3302A/B/C/D :
<-60 dBc
Third-order intermodulation
distortion
(-15 dBm double tone signal,
100 kHz interval, 0 dB
attenuation, preamplifier off)
S3302SA/SB/SC :
≥+10 dBm 50 MHz - 9 GHz
S3302A/B/C/D :
≥+7 dBm 50 MHz - 4 GHz
≥+6 dBm 4 GHz - 13 GHz
≥+6 dBm 13 GHz - 44 GHz
1 dB gain compression
(Dual-tone method test,
signal interval 10 MHz)
S3302SA/SB/SC :
≥+2 dBm 50 MHz - 9 GHz
S3302A/B/C/D :
≥-2 dBm 50 MHz - 4 GHz
≥-3 dBm 4 GHz - 13 GHz
≥-3 dBm 13 GHz - 44 GHz
Image, multiple and
out-of-band response
(-10 dBm mixer level)
≤-65 dBc 10 MHz - 20 GHz
≤-60 dBc 20 GHz - 44 GHz
Residual response
(RF input matching, 0 dB
attenuation, Tracking
Generator off)
S3302SA/SB/SC :
Exceptional frequency 3,200 MHz
Preamplifier on:
≤-95 dBm 10 MHz - 9 GHz
Preamplifier off:
≤-82 dBm 10 MHz - 9 GHz
S3302A/B/C/D :
Exceptional frequency 3,200 MHz
Preamplifier on:
≤-100 dBm 10 MHz - 20 GHz
≤-95 dBm 20 GHz - 44 GHz
Preamplifier off:
≤-90 dBm 10 MHz - 13 GHz
≤-85 dBm 13 GHz - 20 GHz
≤-80 dBm 20 GHz - 44 GHz
Scale fidelity
±1.00 dB
www.salukitec.com
Page 31
Tel: 886.909 602 109 Email: [email protected]
30
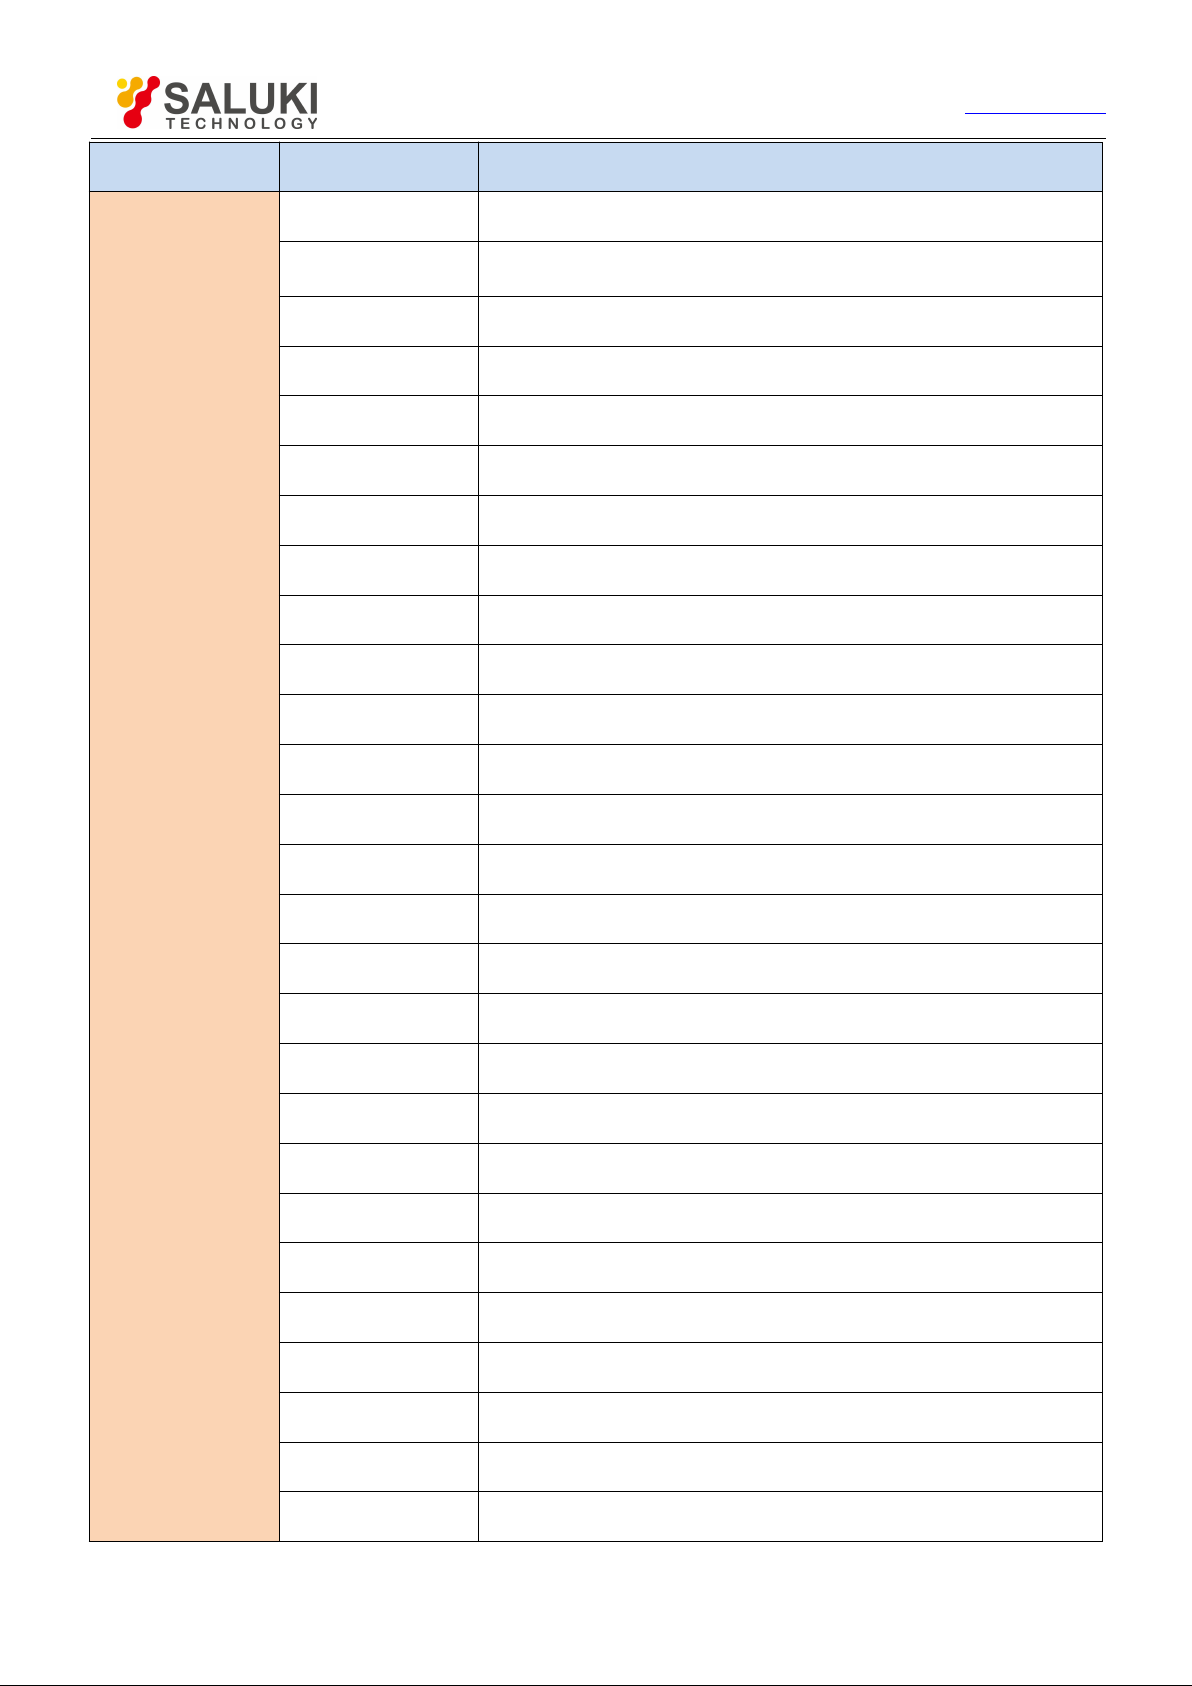
Total level uncertainty
(after 30 minute warm-up,input
signal 0 dBm to -50 dBm, all
set as auto coupling,20℃-30℃)
±1.8 dB (10 MHz - 13 GHz)
±2.3 dB (13 GHz - 40 GHz)
Input attenuator
S3302SA/SB/SC :
Attenuation range: 0 dB - 30 dB, 5
dB step
Conversion uncertainty: ±1.20 dB
S3302A/B/C/D :
Attenuation range: 0 dB - 50 dB,
10 dB step
Conversion uncertainty: ±1.20 dB
Maximum safe input level
(CW input)
S3302SA/SB/SC :
+27dBm, typical value (≥10dB
attenuation, pre-amplifier off) preamplifier off
S3302A/B/C/D :
+30dBm, typical value (≥10dB
attenuation, pre-amplifier off)
Reference Level
Logarithmic scale: -120 dBm to +30 dBm, 1 dB step Linear scale: 22.36
uV - 7.07 V, 0.1% step
Conversion uncertainty: ±1.20 dB (reference level: 0 dBm to -60 dBm)
Input voltage standing-wave
ratio (>10 dB input
attenuation)
≤ 1.80:1 50 MHz - 20 GHz
≤ 2.20:1 20 GHz - 44 GHz
Display scale
Logarithm scale 0.1-10dB per scale, 0.1dB step minimum (10 - scale
display)
Linear scale: 10 scale display
Scale unit: V, A, W, dBm, dBW, dBV, dBmV, dBuV, dBA, dBmA, dBuA
Tracking
Generator
(Option)
Frequency
range
S3302SA: 9 kHz - 4 GHz S3302SB: 9kHz - 6.5GHz
S3302SC: 9kHz - 9GHz
Amplitude
range
0 dBm to -40dBm
Minimum
Amplitude step
0.1dB
Amplitude
accuracy
±2.50dB(Frequency Range 10MHz - 9GHz, Amplitude Range
0dBm to -40dBm ,20℃-30℃)
Sideband noise
1GHz frequency point,0dBm output:
≤-90dBc/Hz@10kHz frequency offset
≤-95dBc/Hz@100kHz frequency offset
≤-110dBc/Hz@1MHz frequency offset
www.salukitec.com
Page 32
Tel: 886.909 602 109 Email: [email protected]
31
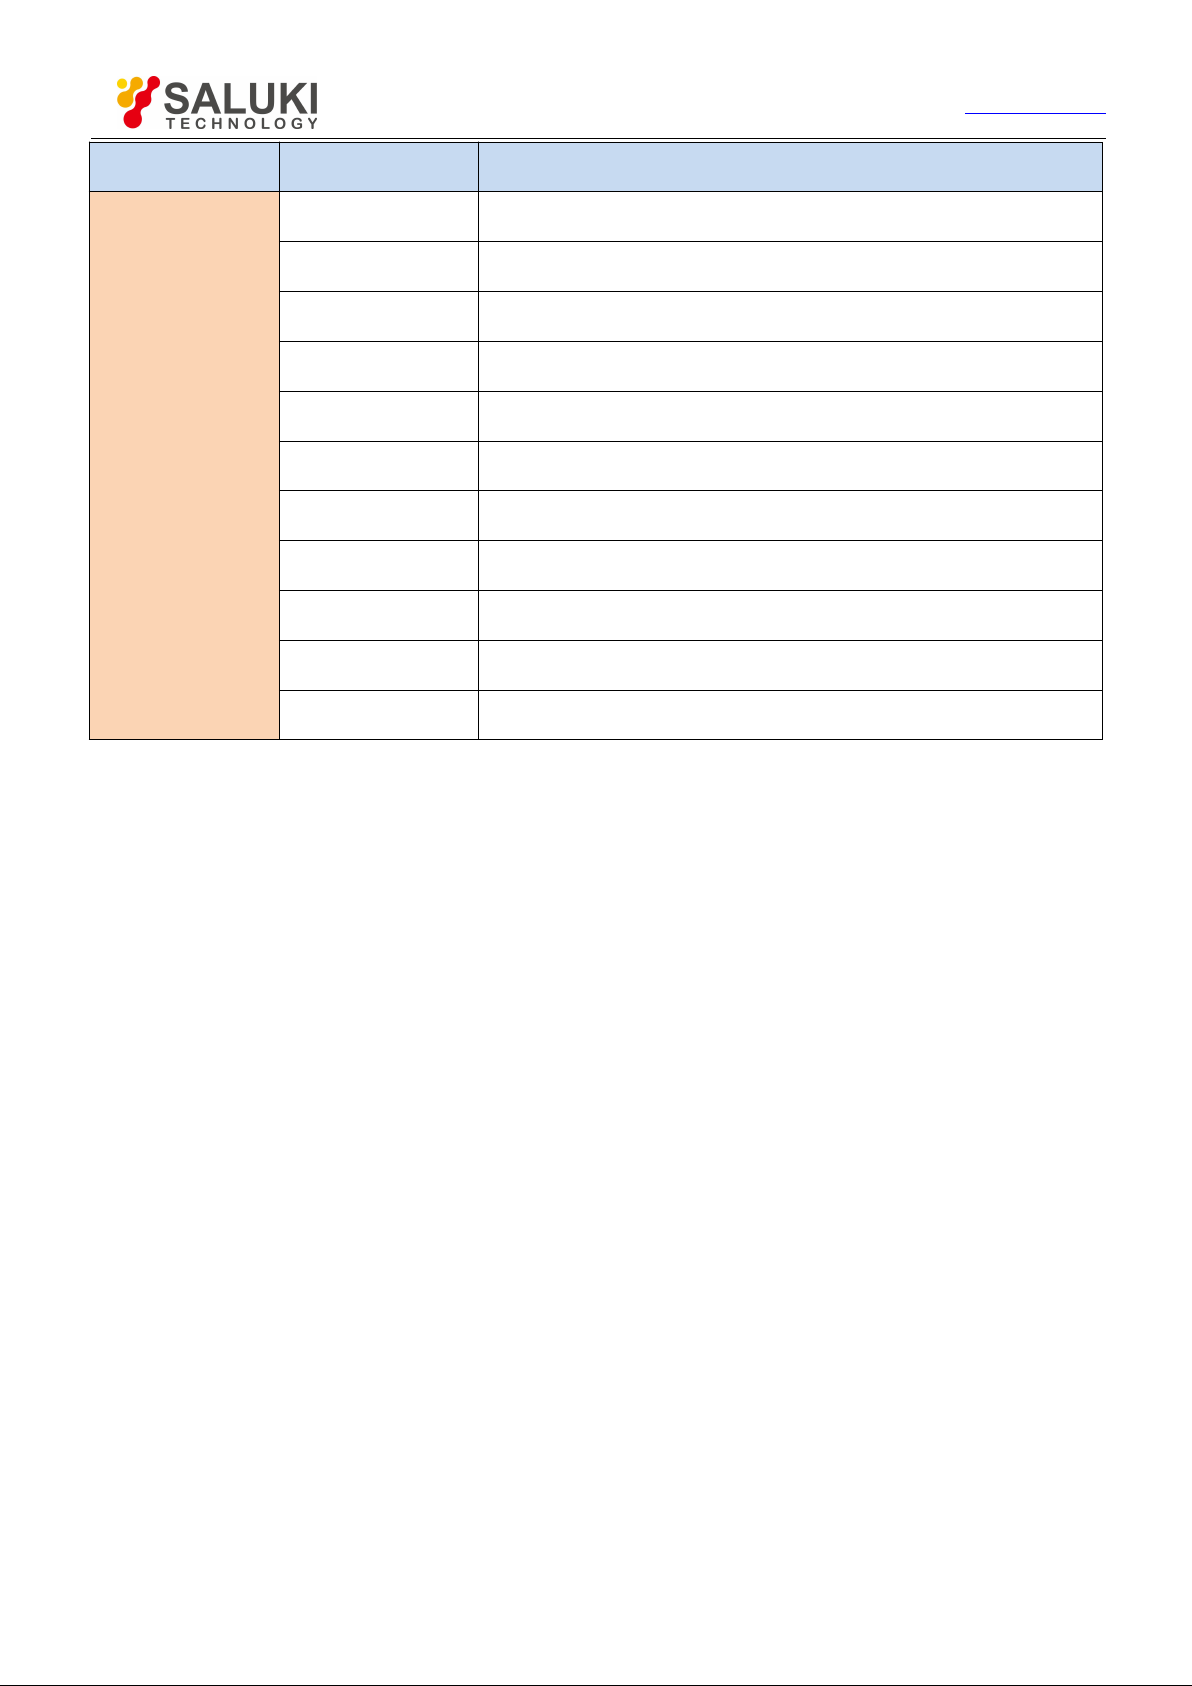
Affiliation
Number of Part
Accessory / Option
Attachment
---
Power cable 1 piece
---
Power adapter 1 piece
---
Rechargeable Li-ion battery 1 piece
---
USB interface cable 1 piece
---
Quick Start Guide 1 piece
---
Certificate of Conformity 1 piece
Options
S3302-05
Programming manual
S3302-06
Power adapter
S3302-07
Rechargeable lithium-ion battery
S3302-08
CAT5 LAN cable
S3302-09
Micro SD card
S3302-10
GPS option
S3302-11
USB power meter option
S3302-12
S87230 USB power continuous wave power sensor (9kHz - 6GHz)
S3302-13
S87231 USB power continuous wave power sensor (10MHz - 18GHz)
S3302-14
S87232 USB power continuous wave power sensor (50MHz - 26.5GHz)
S3302-15
S87233 USB power continuous wave power sensor (50MHz - 40GHz)
S3302-16
Interference analyzer option
S3302-17
AM/FM/PM analyzer option
S3302-18
Channel scanner option
S3302-19
List sweep option
S3302-20
Zero span IF output
S3302-21
S89101A antenna (10kHz - 20MHz)
S3302-22
S89101B antenna (20MHz - 200MHz)
S3302-23
S89101C antenna (200MHz - 500MHz)
Appendix 2 List of Accessories/ Options
Table 2 List of Accessories/Options of S3302 Series Spectrum Analyzer
www.salukitec.com
Page 33
Tel: 886.909 602 109 Email: [email protected]
32
Affiliation
Number of Part
Accessory / Option
Options
S3302-24
S89101D antenna (500MHz - 4GHz)
S3302-25
S89401 antenna amplifier (10kHz - 4GHz,N(f))
S3302-26
S89901 antenna (1GHz - 18GHz, N(f))
S3302-27
S89902 antenna (18GHz - 40GHz, 2.92mm(f))
S3302-28
Functional bag
S3302-29
Backpack
S3302-30
Carrying case
S3302-31
S89901 antenna handle
S3302-32
S89902 antenna handle
S3302-33
Signal analyzer
S3302-34
Field strength option
S3302-35
Tracking generator (100kHz - 4GHz)
S3302-36
Tracking generator (100kHz - 6.5GHz)
S3302-37
Tracking generator (100kHz - 9GHz)
S3302-38
Orientation analysis option
S3302-39
Coverage map option
S3302-40
Charger of power supply by vehicle
S3302-41
Portable omnidirectional antenna
S3302-42
700MHz - 4GHz directional antenna
S3302-43
700MHz - 6GHz directional antenna
S3302-44
680MHz - 10GHz directional antenna
S3302-45
680MHz - 20GHz directional antenna
S3302-46
400MHz - 4GHz directional antenna
S3302-47
400MHz - 6GHz directional antenna
S3302-48
380MHz - 10GHz directional antenna
S3302-49
380MHz - 20GHz directional antenna
S3302-50
External electric compass
www.salukitec.com
Page 34
Tel: 886.909 602 109 Email: [email protected]
33
Affiliation
Number of Part
Accessory / Option
Options
S3302-51
6GHz omnidirectional antenna (680MHz - 6GHz)
S3302-52
8GHz omnidirectional antenna (300MHz - 8GHz)
S3302-53
VHF/UHF portable antenna
S3302-54
Passive directional antenna (700MHz - 4GHz)
S3302-55
Passive directional antenna (700MHz - 6GHz)
S3302-56
Passive directional antenna (680MHz - 10GHz)
S3302-57
Passive directional antenna (680MHz - 18GHz)
S3302-58
Passive directional antenna (680MHz - 25GHz)
S3302-59
Passive directional antenna (680MHz - 35GHz)
S3302-60
N/SMA-JJ RF cable (2m)
S3302-61
N/SMA-JJ RF cable (1m)
www.salukitec.com
- End of Document -
 Loading...