


SAF CFOL Series Point-to-Point
User Guide
SAF Tehnika A/S 2009

Contents
1. Status........................................................................................................4
1.1 Information ..............................................................................................4
1.1.1 System...................................................................................................5
1.1.2 Network ..................................................................................................5
1.1.3 Wireless..................................................................................................6
1.2 Statistics .................................................................................................7
1.3 Graphs ...................................................................................................9
2. Configuration ............................................................................................. 12
2.1 Network ................................................................................................ 12
2.2 Radio...................................................................................................13
2.1.1 Instant Changes ......................................................................................13
2.3 System................................................................................................. 14
2.3.1 Link Settings...........................................................................................14
2.3.2 System Date...........................................................................................15
2.3.3 Administrative Account ..............................................................................16
2.3.4 System Log............................................................................................17
2.3.5 OLED Control ......................................................................................... 18
2.4 Service................................................................................................. 18
2.4.1 SNMP Configuration .................................................................................18
2.4.2 System Alerts ......................................................................................... 19
2.4.2.1 SNMP Traps Settings............................................................................. 20
2.4.2.2 SMTP Settings..................................................................................... 20
2.5 Maintenance...........................................................................................21
2.5.1 System Functions .................................................................................... 21
2.5.2 Firmware Update .....................................................................................22
2.5.3 Device License........................................................................................ 23
3. Tools.......................................................................................................25
3.1 Antenna Alignment................................................................................... 25
3.2 Site Survey ............................................................................................25
3.3 Link Test............................................................................................... 26
4. SAF Tehnika A/S Contacts.............................................................................28

User Guide
“CFOL Series”, User Guide
© SAF Tehnika A/S 2009
3
SAF CFOL Series Point-to-Point User Guide
SAF Tehnika point-to-point products are designed to provide superior performance at
long range distances. With a proprietary wireless driver that was written for the sole
purpose of optimizing wireless point to point links, one can achieve much higher
throughput, especially at longer links, than standards based products.

User Guide
1. Status
Use the Status menu to check current status of the point-to-point unit and established
link (this is the default page when accessing the device web management interface).
1.1 Information
The Information page displays generic information and status of the point-to-point unit.
The page is divided into three main categories: System, Ethernet and Wireless. The
System section displays the identification information of the point-to-point unit. The
Wireless section presents main wireless settings. The Ethernet section describes the
point-to-point unit's network identity and connectivity.
The information in the page can be updated using Refresh button.
“CFOL Series”, User Guide
© SAF Tehnika A/S 2009
4

User Guide
“CFOL Series”, User Guide
© SAF Tehnika A/S 2009
5
1.1.1 System
Product name - displays the product name.
Link name - displays the link name which is used to identify the point-to-point unit on
the network.
Link location - displays the link location, which is used to identify the point-to-point unit
on the network.
Latitude - displays the latitude coordinates of the device.
Longitude - displays the longitude coordinates of the device.
Firmware version - displays the device hardware version.
Uptime - displays the time, expressed in days, hours and minutes since the system was
last rebooted.
Average load - displays the average load of the device processor in the period of the
last 1 minute, 5 minutes and 15 minutes (a larger value means a larger average load on
the processor).
<1.0 - System is idle
=1.0 - Normal load
>1.0 - Processor is busy.
Total memory, kB - displays total system memory.
Free memory, kB- displays free system memory.
System time - displays current system time.
License status - displays a status of the current license.
1.1.2 Network
Ethernet link status - displays the status of the Ethernet link. A State UP indicates that
the Ethernet link is established. A state DOWN indicates that the Ethernet link is not
established.
Ethernet speed/duplex - displays the negotiated speed and duplex of the Ethernet
interface specified in Mbps. The N/A will be displayed if the Ethernet status is down. Full
duplex means that data can be transmitted in both directions on a signal carrier at the
same time. Half duplex means that data can be transmitted in both directions on a signal
carrier, but not at the same time. Auto means that the system will detect link speed and
duplex mode automatically.
MAC address - displays MAC address of the device.
Local IP - displays IP address of the local unit.
Remote IP - displays IP address of the remote unit. The N/A will be displayed if there is
no point-to-point link established.

User Guide
“CFOL Series”, User Guide
© SAF Tehnika A/S 2009
6
1.1.3 Wireless
Wireless link status - displays the status of the Wireless link. A State UP indicates that
the Wireless link between local and remote units is establish ed. A state DOWN indicates
that the Wireless link between local and remote units is not established.
Operating mode - displays the operating mode of the device. The operating mode can
be Master or Slave.
Link ID - displays point-to-point link ID, specified by the user.
Encryption - displays encryption method: none or AES.
Peer MAC - displays MAC address of the remote unit.
Frequency, MHz - displays frequency in MHz at which the point-to-point link
communicates.
Channel width, MHz - displays the channel width (5/10/20/40) at which the point-to-
point link communicates.
Data rate, Mbps - displays data rates at which the point-to-point link communicates.
Antenna gain, dBi - displays device radio antenna gain in dBi.
Transmit power, dBm - displays TX power value of the local point-to-point unit.
Remote transmit power, dBm - displays TX power value of the remote point-to-point
unit.
Management packet rate, Mbps - displays administrator defined maximum count of
frames in transfer block between point-to-point units.
Transmit queue length, frames - displays administrator defined transmit queue length
in frames between point-to-point units.
Aggregation limit, bytes - displays administrator defined maximum packet count in
bytes to be aggregated in one frame.
Aggregation limit, packets - displays administrator defined maximum packet count to
be aggregated in one frame.
Link state - displays the state of the wireless link between point-to-point units:
Initiating - displays amount of time the device was in initiating state from the last
reboot.
Scanning - displays amount of time the device was in scanning state from the
last reboot.
Authenticating - displays amount of time the device was in authenticating state
from the last reboot.
Associating - displays amount of time the device was in associating state from the
last reboot.
Running - displays the time, expressed in hours, minutes and seconds since the
system was last rebooted.
User Guide
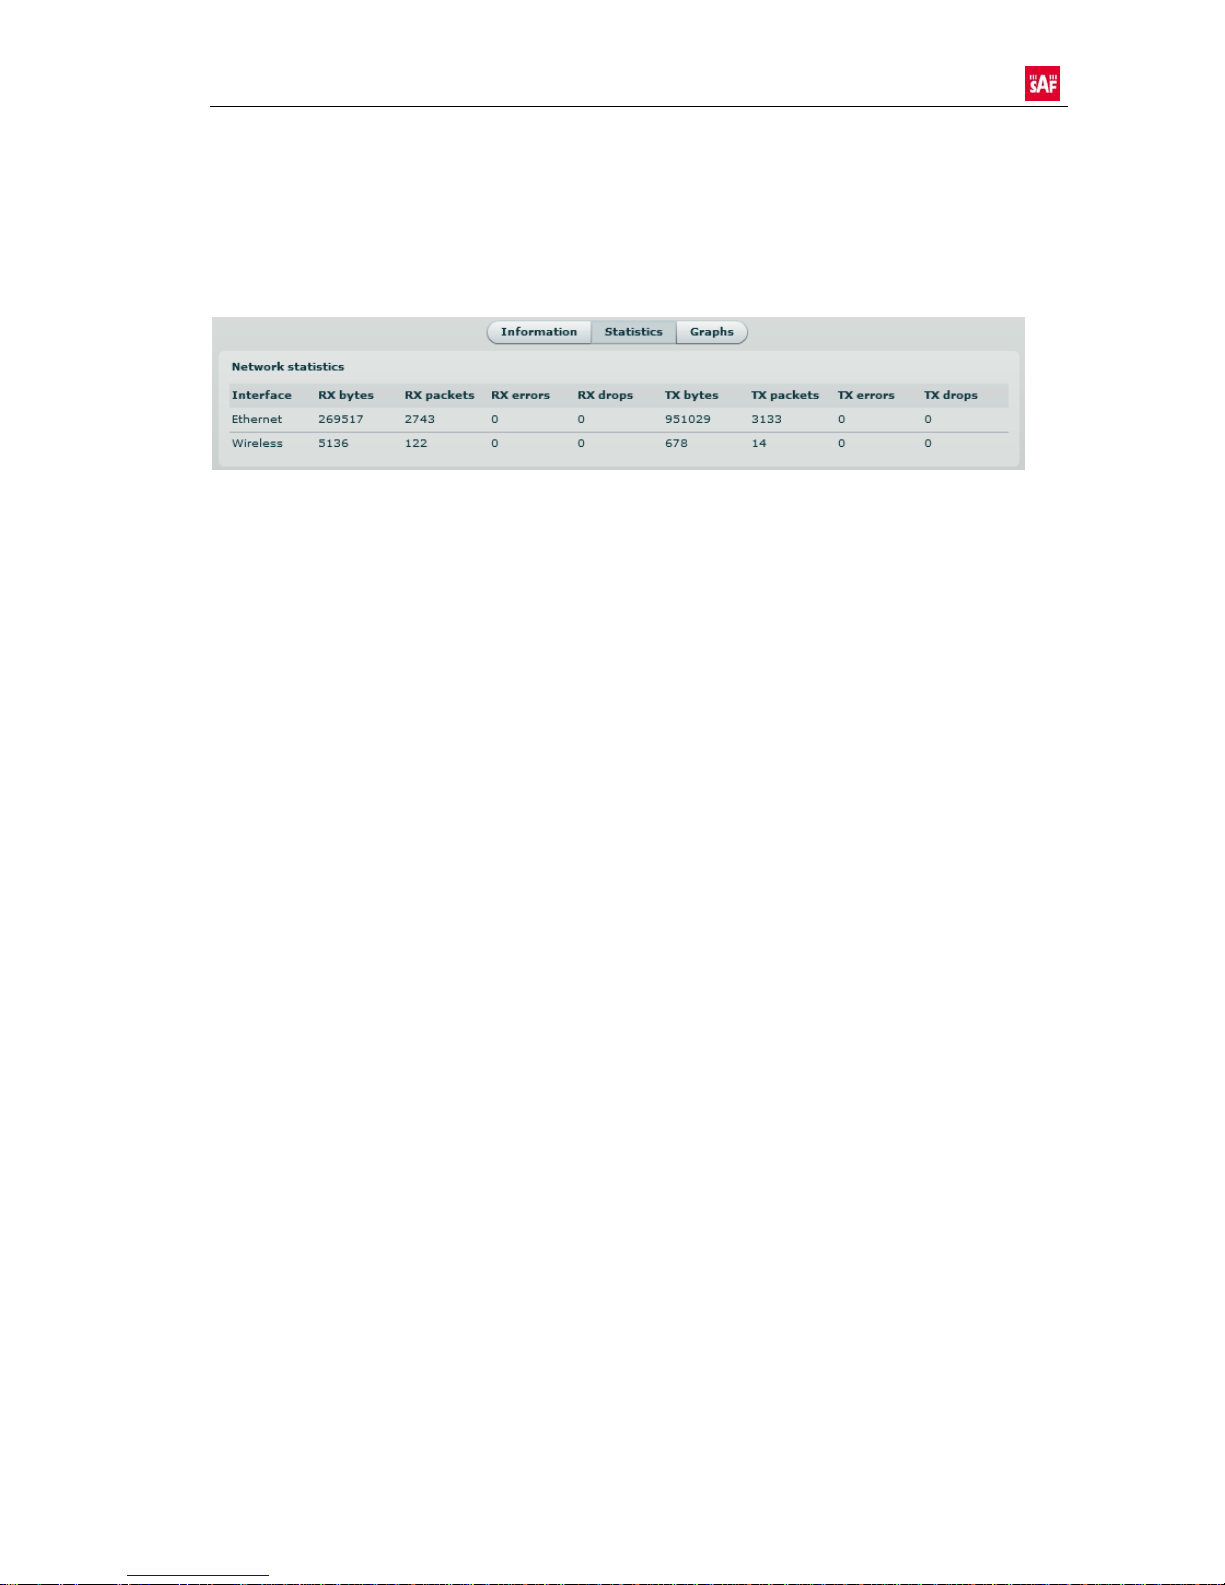
1.2 Statistics
The statistics page displays detailed statistics of the point-to-point link performance. The
Statistics page is divided into two sections: Networks statistics and W-Jet statistics.
Network statistics contains detailed statistics of Ethernet and Wireless interfaces:
RX bytes - displays the total number of received bytes by the Ethernet or Wireless
interface of the point-to-point link.
RX packets - displays the total number of received packets by the Ethernet or Wireless
interface of the point-to-point link.
RX errors - displays the total number of received corrupted packets by the Ethernet or
Wireless interface of the point-to-point link.
RX drops - displays the total number of dropped packets by the Ethernet or Wireless
interface of the point-to-point link.
TX bytes - displays the total number of sent bytes by the Ethernet or Wireless interface
of the point-to-point link.
TX packets - displays the total number of sent packets by the Ethernet or Wireless
interface of the point-to-point link.
TX errors - displays the total number of sent corrupted packets by the Ethernet or
Wireless interface of the point-to-point link.
TX drops - displays the total number of dropped packets by the Ethernet or Wireless
interface of the point-to-point link.
“CFOL Series”, User Guide
© SAF Tehnika A/S 2009
7
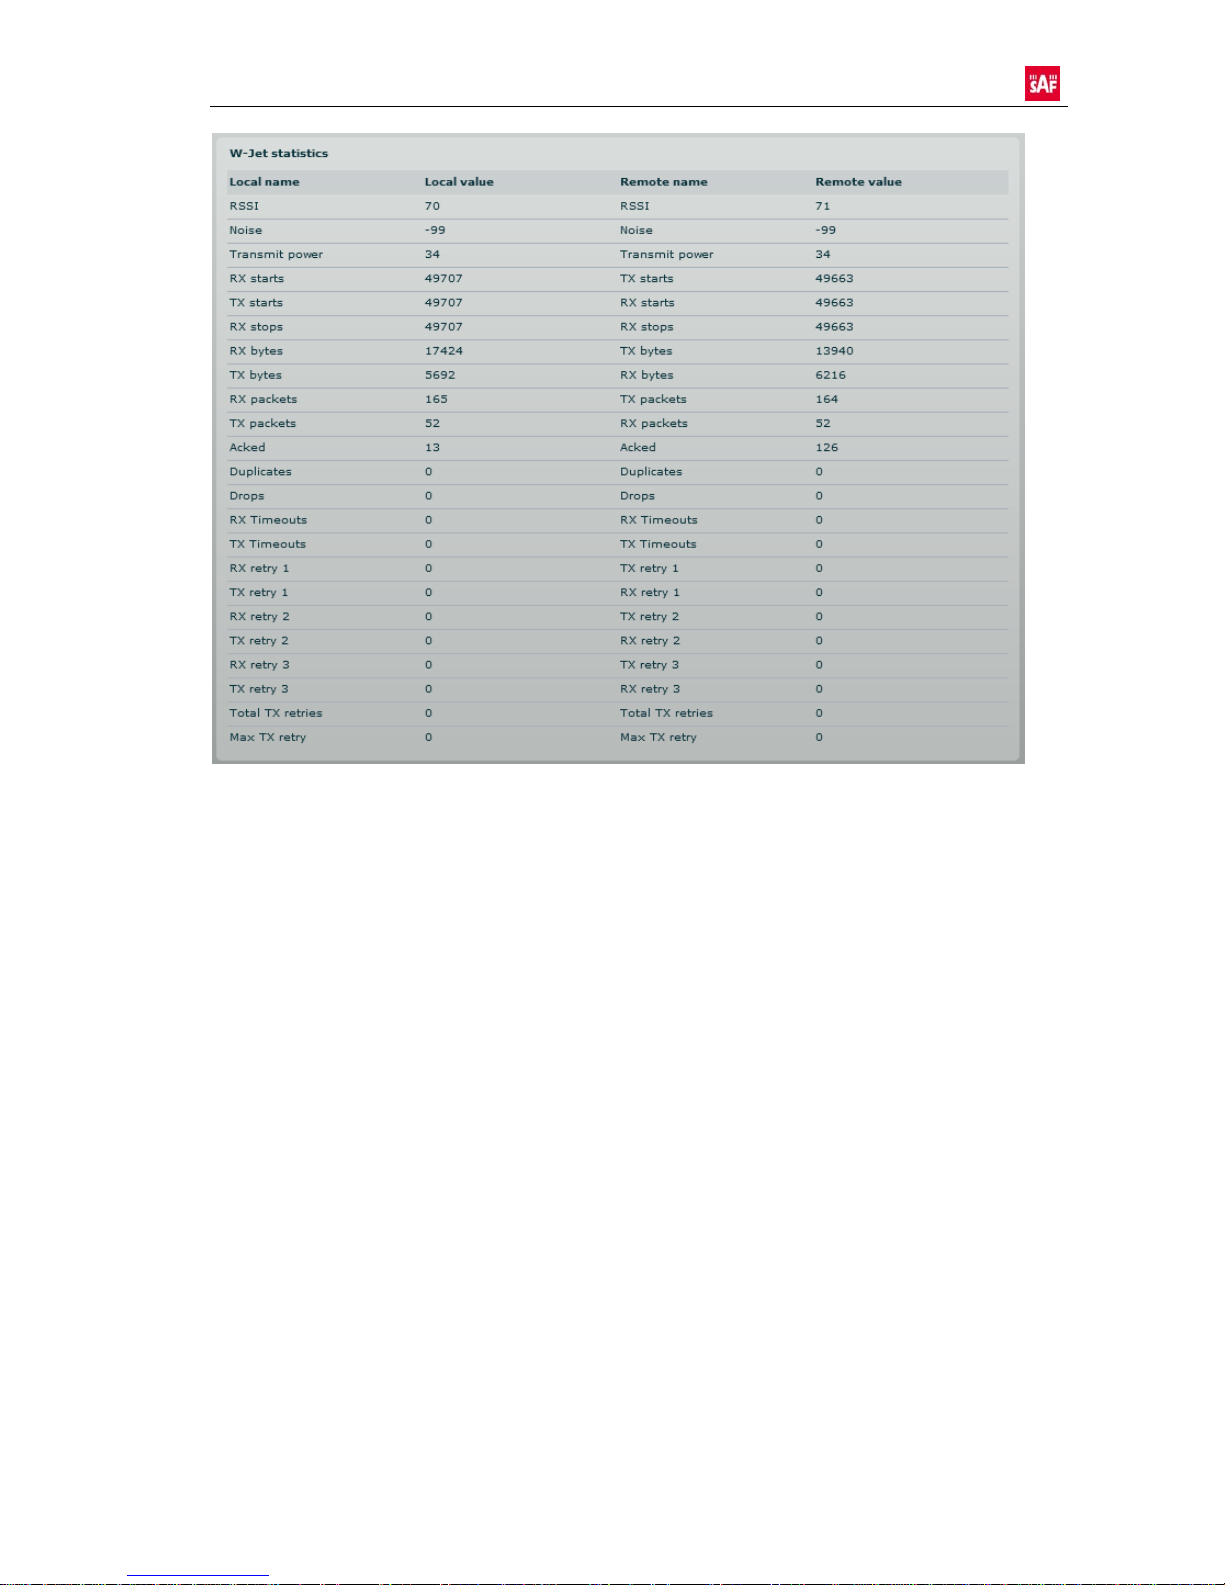
User Guide
Local - statistics of the Local unit.
Remote - statistics of the Remote unit.
RX starts - number of RX window Start packets received. The number in brackets (+xx)
displays the data change since the last page refresh.
TX starts - number of TX window Start packets transmitted. The number in brackets
(+xx) displays the data change since the last page refresh.
RX stops - number of RX window Stop packets received. There is no TX stops displayed
as it will always be equal to number of the TX start packets. The number in brackets
(+xx) displays the data change since the last page refresh.
RX bytes - number of transmitted bytes. The number in brackets (+xx) displays the
data change since the last page refresh.
TX bytes - number of the received bytes. The number in brackets (+xx) displays the
data change since the last page refresh.
RX packets - number of received data packets The number in brackets (+xx) displays
the data change since the last page refresh.
TX packets - number of transmitted data packets. The number in brackets (+xx)
displays the data change since the last page refresh.
“CFOL Series”, User Guide
© SAF Tehnika A/S 2009
8

User Guide
“CFOL Series”, User Guide
© SAF Tehnika A/S 2009
9
Acked - the number of the packets acknowledged by the receiver. The number in
brackets (+xx) displays the data change since the last page refresh.
Duplicates - the number of duplicated packets. The number in brackets (+xx) displays
the data change since the last page refresh.
Drops - number of dropped packets. The number in brackets (+xx) displays the data
change since the last page refresh.
RX timeouts - number of RX timeouts. The number in brackets (+xx) displays the data
change since the last page refresh.
TX timeouts - number of TX timeouts. The number in brackets (+xx) displays the data
change since the last page refresh.
RX retry 1.3 - number of packets received in 1-3 attempts. The number in brackets
(+xx) displays the data change since the last page refresh.
TX retry 1.3 - number of packets transmitted in 1-3 attempts. The number in brackets
(+xx) displays the data change since the last page refresh.
Total TX retries - total number of attempts to retransmit data packets. The number in
brackets (+xx) displays the data change since the last page refresh.
Max TX retry - the maximal attempt to retransmit data packets. For example if data
packet was retransmitted in 9th attempt, the value of this field will be 9. The number in
brackets(+xx) displays the data change since the last page refresh.
1.3 Graphs
The Graphs page contains device statistics in graphic diagrams and is used for device
monitoring. Select the required statistics (RSSI, Traffic, RX/TX errors, Memory, CPU load
or Frequency change) and the corresponding graphic diagrams will be displayed. The
statistics in diagrams are displayed on hourly, daily, weekly, monthly or yearly basis. To
update statistics data click Refresh button.
(!) Point the mouse cursor on the diagram line and you will get the numeric expression
of the particular statistic.

User Guide
RSSI diagram displays RSSI change of the Local and Remote point-to-point units at the
chosen period:
Traffic diagram displays Incoming and Outcoming traffic statistical data:
RX/TX errors diagram displays statistical data of RX drop of the Local and Remote
units, TX try of the Local and Remote units:
“CFOL Series”, User Guide
© SAF Tehnika A/S 2009
10

User Guide
Memory diagram displays memory usage data:
CPU load diagram displays device CPU load in appropriate time basis:
Frequency diagram displays device operating frequency in GHz:
“CFOL Series”, User Guide
© SAF Tehnika A/S 2009
11

User Guide
2. Configuration
2.1 Network
The network configuration as described below is required for point-to-point management
purposes. Use the
Configuration|Network menu to setup network settings of the point-to-point unit:
Method - specify IP configuration mode:
Static IP - choose to specify static IP of the device.
Dynamic IP - choose to use dynamic IP given by the DHCP server (running DHCP
server is required).
IP address - specify the device IP address [digit and dots]. When shipped from the
factory or reset to factory settings, device defaults to a static IP address of
192.168.2.66.
Subnet mask - specify the device subnet mask [digit and dots]. When shipped f rom the
factory or reset to factory settings, the device defaults to a subnet mask of
255.255.255.0.
Default gateway - specify the IP address of the device gateway [digit and dots]. When
shipped from the factory or reset to factory settings, the device defaults to a gateway IP
address of 192.168.2.1.
DNS server 1 - specify the IP address of the primary DNS server [digit and dots]. The
DNS (Domain Name Service) service translates Internet host names into their IP
addresses.
DNS server 2 - specify the IP address of the secondary DNS server.
Ethernet configuration - configures the Ethernet link speed and the duplex mode of
the Ethernet port. Choose "auto" for automatic detection of link speed and duplex mode.
VLAN ID - specify the management VLAN ID [2-4094].If a management VLAN is
enabled, all traffic received by the device must by tagged with the management VLAN ID
to access the network. All non-tagged traffic will be dropped, thus reducing the risk of
unauthorized access.
“CFOL Series”, User Guide
© SAF Tehnika A/S 2009
12

User Guide
Restrict Management VLAN to interfaces - select interfaces on which management
access will be restricted.
2.2 Radio
Use the Configuration | Radio menu to set up radio settings for the point-to-point link:
Operating mode - specify the operating mode of the local device to create point-to-
point link [Master/Slave]. The device mode depends on the network topology.
Master - in this mode local device is the controlling point-to-point link unit.
Slave - in this mode local device connects to the Master unit.
Link ID - specify known network name of the remote device to establish a point-to-point
link.
2.1.1 Instant Changes
The goal of the instant changes is that after settings has been changed, there is no need
to reboot the device.
Country - choose from drop-down list the country in which the device will operate.
According to the country chosen the regulatory domain settings change. You are not
allowed to select radio channels and RF output power values other th e permitt ed values
for your country and regulatory domain.
Frequency - specify frequency at which the point-to-point lin k will be operating.
(!) The available Frequencies list varies depending on the selected Country and
Channel width.
Channel width - choose the channel width in MHz [5/10/20/40].
“CFOL Series”, User Guide
© SAF Tehnika A/S 2009
13

User Guide
Encryption - select the security level for the point-to-p oint link:
None - means no security on link.
AES - means encryption with passphrase.
Passphrase - specify passphrase of the AES security [8-63 characters]. This parameter
appears and is mandatory when AES security is chosen.
Transmit power - specify the radio transmit power at which the device will transmit
data, using slider or enter the value manually. When entering transmit power value
manually, the slider position will change according to the entered value. The transmit
power level that is actually used is limited to the maximum value allowed by your
country's regulatory agency.
Data rate - select the device data transmission rates in Mbps from the drop-down list.
Management packet rate - select the rate at which the acknowledgment will be
transmitted.
Txq max length - specify the maximum number of the data frames in transmit window
for point-to-point link.
Aggregation limit, bytes - specify maximal packet count in bytes to be aggregated in
one radio frame.
Aggregation limit, packets - specify maximal packet count in packets to be aggregated
in one radio frame.
2.3 System
2.3.1 Link Settings
“CFOL Series”, User Guide
© SAF Tehnika A/S 2009
14

User Guide
Link name - specify name of the point-to-point link that is used to identify the unit on
the network [maximum 255 ASCII characters].
Link location - describe the location of the point-to-point unit [maximum 255 ASCII
characters].
Longitude - specify the longitude coordinates of the point-to-point unit [s pecific decimal
format, e.q. 54.869446].
Latitude - specify the latitude coordinates of the point-to-point unit [specific decimal
format, e.q. 23.891058]. Both coordinates helps indicate accurate location of the pointto-point units.
2.3.2 System Date
Use this section to manage the system time and date on the device automatically, using
the Network Time Protocol (NTP), or manually, by setting the time and date on the
access point.
The NTP (Network Time Protocol) client synchronizes the clock of the device with a
selected time server.
Choose the configuration mode as NTP and specify the following settings:
Configuration - choose the system clock configuration mode [NTP/Manual].
Timezone - select the timezone. Time zone should be specified as a difference between
local time and GMT time.
Save last known time - select to recall the timestamp that was saved on last reboot.
When the NTP is enabled, this option will set system clock to last reboot time if no NTP
servers are available.
NTP server - specify the trusted NTP server IP or hostname for synchronizing time with
[IP address].
To adjust the clock settings manually, choose the configuration mode as Manual and
specify the following settings:
“CFOL Series”, User Guide
© SAF Tehnika A/S 2009
15

User Guide
Configuration - choose the system clock configuration mode [NTP/Manual].
Timezone - select the timezone. Time zone should be specified as a difference between
local time and GMT time.
Save last known time - select to recall the timestamp that was saved on last reboot.
Date - specify the new date value in format MM.DD.YYYY
Time - specify the time in format hh:mm.
(!) If device hardware has no internal clock, the configured manual time will be reset to
the specified date and time after each device reboot.
2.3.3 Administrative Account
(!) We recommend changing the default administrator password as soon as possible.
The Administrative Account menu is for changing the administrator's password.
Old password - enter the old administrator password.
New password - enter the new administrator password for user authentication.
Verify password - re-enter the new password to verify its accuracy.
“CFOL Series”, User Guide
© SAF Tehnika A/S 2009
16

User Guide
(!) The only way to gain access to the web management if you forget the administrator
password is to reset the device to factory default settings.
(!) Default administrator login settings are:
User Name: admin
Password: admin01
2.3.4 System Log
Use the Configuration | System menu to configure device to save log messages to the
local or remote server using standard syslog facility:
Message level - specify the message level you need to trace. The level determines the
importance of the message and the volume of messages generated by the SAF AP. The
levels are in order of increasing importance [emergency, alert, critical, error, warning,
notice, information, debug]. Default: info.
The SAF AP can be configured to send system log messages to a remote server:
Syslog forward - select to enable remote system logging.
Forward server - specify the remote host IP address or hostname where syslog
messages will be sent.
Forward port - specify the port to which syslog messages will be forwarded [0-65535].
Default: 514.
Forward message level - specify the message level that will be sent to the remote
syslog server. The level determines the importance of the message and the volume of
messages generated by the SAF AP. The levels are in order of increasing importance
[emergency/alert/critical/error/warning/notice/information/debug].
Default: information.
Forward backup - select to enable remote syslog logging backup.
“CFOL Series”, User Guide
© SAF Tehnika A/S 2009
17

User Guide
Backup server - specify the backup host IP address or hostname where syslog
messages will be send to.
Backup port - specify the port to which syslog messages will be forwarded [0-65535].
Default: 514.
2.3.5 OLED Control
(!) OLED control settings are available for point-to-point unit s with OLED display only.
The OLED display can be enabled or disabled using this control. We recommend to
disable OLED after establishing point-to-point link to prevent undesirable users from
using and configuring point-to-point unit by OLED.
Enable OLED - select to enable, or deselect to disable OLED control for users.
2.4 Service
2.4.1 SNMP Configuration
SNMP is the standard protocol that is widely used for network management over the
Internet. With the SNMP service enabled, the point-to-point unit can act as SNMP agent.
(!) To communicate with SNMP manager you must configure SNMP communities and
identifiers on both ends (manager and agent).
Enable SNMP - specify the SNMP service status.
Name - displays an administratively assigned name. This
System location - specify the physical location of the point-to-point unit [string].
“CFOL Series”, User Guide
© SAF Tehnika A/S 2009
18

User Guide
R/O community - specify the read-only community name for SNMP version 1 and
version 2c [string]. The read-only community allows a manager to read values, but
denies any attempt to change values.
R/O user - specify the user name for read-only SNMPv3 access [string]. The read-only
community allows a manager to read values, but denies any attempt to change values.
R/O user password - specify the password for read-only SNMPv3 access [string].
2.4.2 System Alerts
The point-to-point unit able to send alerts outside when there are system errors. The
alerts can be send via SNMP Traps or/and SMTP notifications.
Enable alerts - select to enable alert notifications on the system.
System check intervals - specify interval in seconds at which the device will send
notifications of unexpected system behavior.
System alerts:
Wireless link status change - system will send notification on Wireless link status
change.
“CFOL Series”, User Guide
© SAF Tehnika A/S 2009
19

User Guide
“CFOL Series”, User Guide
© SAF Tehnika A/S 2009
20
Ethernet link status change - system will send notification on Ethernet link status
change.
RSSI level lower than - system will send notification when RSSI reach value lower
Than specified. Default: 25 dBm.
Noise level greater than - system will send notification when signal noise will
reach value greater than specified. Default: -60 dBm.
RX drop greater than - system will send notification when RX drops will reach
Value greater than specified packets per second. Default: 250 packets per seconds.
TX retry greater than - system will send notification when TX retries will reach
more than specified packets per second. Default: 250 packets per seconds.
Device reboot - system will send notification about unexpected or administrator
initiated device reboot.
DFS channel change - system will send notification on DFS channel change.
2.4.2.1 SNMP Traps Settings
Manager address - specify the IP address or hostname of Trap receiver.
Manager port - specify the port number of the Trap receiver. Default port number is
162.
Trap community - specify the SNMP community string. This community string acts as
password between SNMP manager and point-to-point unit. by default Trap community
string is "public".
Use inform - select to wait an acknowledgment from SNMP manager that trap was
received.
Retry count - specifies maximum number of times to resend an inform request [1-10].
Default: 5.
Retry timeout - specifies number in seconds to wait for an acknowledgment before
resending request [1-10]. Default: 1.
2.4.2.2 SMTP Settings
Server address - specify the IP address or hostname of the networked SMTP server.
Server port - specify the SMTP Port Number is the port number used by the networked
SMTP server. By default the port number is 25.
Source e-mail - specify the e-mail address that will be used by the point-to-point unit.
Destination e-mail - specify the e-mail address where the point-to-point unit will send
the alert messages.
E-mail notification interval - specify interval in seconds at which the e-mail
notification will be send from the point-to-point unit [0-86400]. If 0 specified, then
device will send an e-mail notification immediately after unexpected system behavior.

User Guide
2.5 Maintenance
2.5.1 System Functions
Reboot device - reboot device with the last saved configuration.
Reset device to factory defaults - click to reset the device to factory default values.
(!) Resetting the device is an irreversible process. Current configuration and the
administrator password will be set back to the factory default. Nevertheless the device
license will be still valid after resetting the device to defaults.
Download troubleshooting file - click to download the troubleshooting file. The
troubleshooting file contains valuable information about device configuration, routes, log
files, command outputs and etc. Using the troubleshooting file the device itself gathers
information instead of you. This is helpful for submitting problems to support team.
Backup configuration file - click to save current configuration file. Saved configuration
file is useful to restore configuration in case of device misconfiguration or to upload
multiple devices with correct configuration.
Restore configuration from file - click to upload existing configuration file to the
device.
View system log - click to view current trace messages. The Syslog viewer utility
provides debug information for system services and protocols should a malfunction occur.
The syslog capability can help operators to locate misconfiguration and system errors.
“CFOL Series”, User Guide
© SAF Tehnika A/S 2009
21

User Guide
2.5.2 Firmware Update
To update your device firmware use the Firmware upgrade section under the
Maintenance menu, select the firmware file and click the Upload button:
Current version - displays version of the current firmware.
Upload - click the button to select the new image and upload new firmware on the
device.
“CFOL Series”, User Guide
© SAF Tehnika A/S 2009
22

User Guide
(!) When updating FW image with different main version, a new license key should be
uploaded on the device first. Otherwise the device will be inactive after reboot and the
default configuration will be uploaded with the dynamic IP address given by the local
DHCP server.
The device system firmware upgrade is compatible with all configuration settings. When
the device is upgraded with a newer version or the same version builds, all the system's
configuration will be preserved after the upgrade.
The new firmware image is uploaded to the controller's temporary memory. It is
necessary to save the firmware into the device permanent memory. Click the Upgrade
button:
Upgrade - upgrade device with the uploaded image and reboot the system.
(!) Do not switch off and do not disconnect the device from the power supply during the
firmware update process as the device could be damaged.
2.5.3 Device License
When the device is installed and ready for use, the valid license file should be uploaded
on the device to activate a full set of the device features. The license status is displayed
on the device System Information page:
“CFOL Series”, User Guide
© SAF Tehnika A/S 2009
23

User Guide
License status - displays the license validity status:
valid - this license status means that devise has full functionality of the
purchased firmware release. With a valid license, you can get all service
releases of the purchased FW version for free.
not valid - this license status provides only a very limited functionality.
(!) The license will be still valid after resetting the device t o defaults.
If the device has an invalid license uploaded, only very limited set of the device
functionality is enabled:
It runs only with a default configuration. DHCP client runs on WAN interface, DHCP
servers run on LAN and radio interfaces.
It is impossible to change the configuration. All features are locked down until a
valid license is presented. Any changes made in configuration will be stored in the flash
memory of the device. Thus only a default setting will be used after the reboot .
To manage the license file, use the Configuration | Maintenance menu:
License status - displays the validity status of current license.
“CFOL Series”, User Guide
© SAF Tehnika A/S 2009
24

User Guide
Download current license file - click to download current device license file to your
local PC.
Upload new license - click for the license file upload on the device.
To upload a new valid license file on the device use the Upload button:
(!) Be sure for certain you are uploading a valid license file.
In case the fault license file has been uploaded, the device becomes inactive after reboot
and the default configuration will be uploaded with the dynamic IP address given by the
local DHCP server.
3. Tools
3.1 Antenna Alignment
The antenna alignment test measures signal quality between the master and slave units.
For best results during the antenna alignment test, turn off all wireless networking
devices within range of the device except the device(s) with which you are trying to align
the antenna. Watch the constantly updated display in the antenna alignment test window
as you adjust the antenna.
The Antenna Alignment test results appear when you click th e Start button, and finishes
when you click Stop button.
3.2 Site Survey
The Site Survey test shows overview information for wireless networks in a local
geographic area.
“CFOL Series”, User Guide
© SAF Tehnika A/S 2009
25

User Guide
Using this test, an administrator can scan for working access points, check their
operating frequency, encryption, see signal/noise levels and view either device has
enabled W-Jet or not.
An administrator can use this feature to identify a clear channel to set the device to that
will not receive interference from adjacent working devices.
(!) Note that Site Survey function can take several minutes to perform.
To perform the Site Survey test currently, click the Start scan button:
Start scan - click to perform the Site Survey test.
Show only W-Jet AP - select this option to sort Site Survey results.
3.3 Link Test
(!) We recommend ensuring that there is no traffic on the link before running the Link
Test as results may not be completely accurate.
Use the Link test tool to check the quality of the established point-to-point link. This tool
tests the throughput at selected packet sizes and iterations. Link test can be run from
either the Remote unit or Local unit. Results represent the maximum, minimum and
average value of the performed test.
“CFOL Series”, User Guide
© SAF Tehnika A/S 2009
26

User Guide
Iterations - specify number of test iterations.
Packet sizes - specify packet sizes in bytes at which the test will be performed.
Start - click to start the throughput test.
Stop - click to stop the throughput test.
“CFOL Series”, User Guide
© SAF Tehnika A/S 2009
27

SAF Tehnika A/S contacts
“CFOL Series”, User Guide
© SAF Tehnika A/S 2009
28
4. SAF Tehnika A/S Contacts
The most up to date contacts of SAF Tehnika A/S can be found on the web site
www.saftehnika.com.
SAF Tehnika A/S technical support could be reached at:
- Email: techsupport@saftehnika.com
- Telephone: +371 67046840
- Fax: +371 67046809
 Loading...