

Page 1
Dew Point Mirror 973
Operation and
Maintenance Manual
MBW Calibration Ltd.
Seminarstrasse 57
CH-5430 Wettingen / Switzerland
+41 56 426 21 33 phone
+41 56 427 14 00 fax
0Hwww.mbw.ch
info@mbw.ch
Page 2

Warranty
MBW Calibration Ltd. (MBW) warrants the products it manufactures or distributes to be free of
defects in material and workmanship under normal use and service when operated within the
specified design limitations for a period of 12 months from date of initial shipment. Under this
Warranty, MBW will, at its discretion, repair or replace any component that upon examination
by MBW or its duly authorized representatives proves to be defective during the warranty
period provided the system is returned to the factory for inspection and repair shipping
prepaid. Improper or unauthorized maintenance, storage, repair, or alteration of any kind by
personnel other than MBW or its duly authorized representatives may void all warranties.
Warranty may also be voided for misuse, neglect, accident, corrosion, and improper
installation. This Warranty is exclusive and in lieu of any and all other warranties of
merchantability, fitness for a particular purpose, or any other warranty, expressed or implied,
and all other liabilities and obligations on the part of MBW. MBW will not be liable for any
other claims or damages, either direct, indirect, or consequential arising out of the use of its
products.
Page 3

Table of Contents
Table of Contents ..................................................................................................................... i
Welcome................................................................................................................................... 1
How to Use This Manual ......................................................................................................... 1
For More Information ............................................................................................................. 1
OPERATION.........................................................................................................3
Getting Started......................................................................................................................... 3
Turning the 973 On and Off................................................................................................... 3
What You See........................................................................................................................ 3
The Touch Screen.................................................................................................................. 5
The Measuring Head Assembly.............................................................................................9
Dew Point Measurement........................................................................................................ 9
System Configuration ........................................................................................................... 12
Menu Options....................................................................................................................... 12
Display Parameters.............................................................................................................. 13
Graphing Data...................................................................................................................... 13
Control Setup....................................................................................................................... 15
Changing Units..................................................................................................................... 18
Changing Color.................................................................................................................... 19
Analog Outputs .................................................................................................................... 20
Back Panel Connections....................................................................................................... 22
Power Plug........................................................................................................................... 22
Power Switch ....................................................................................................................... 22
RS-232................................................................................................................................. 22
External Temperature.......................................................................................................... 22
Analog Outputs .................................................................................................................... 23
Gas Input and Output........................................................................................................... 23
Barometric Pressure Input................................................................................................... 23
Measurement Tips................................................................................................................. 24
Understand the Measuring Range....................................................................................... 24
Connecting Hoses................................................................................................................ 24
Cooling Requirements ......................................................................................................... 26
INSTALLATION..................................................................................................27
Facility Requirements ........................................................................................................... 27
Environmental...................................................................................................................... 27
Power................................................................................................................................... 27
Preparation for Use ............................................................................................................... 27
Benchtop Use....................................................................................................................... 27
Preparation for Shipping or Transportation ....................................................................... 27
i
Page 4

REMOTE COMMUNICATION ............................................................................29
Introduction............................................................................................................................ 29
Hardware Connection & Cabling.......................................................................................... 29
Communications Settings .................................................................................................... 30
Command Syntax .................................................................................................................. 30
General Usage..................................................................................................................... 30
Termination Characters ....................................................................................................... 30
Leading and Trailing Spaces ............................................................................................... 31
Case Sensitivity.................................................................................................................... 31
Numeric Values.................................................................................................................... 31
Command Reference............................................................................................................. 32
Commands Listed By Functional Group.............................................................................. 33
MAINTENANCE .................................................................................................
Mirror Cleaning...................................................................................................................... 37
Exterior Cleaning................................................................................................................... 38
Front Panel........................................................................................................................... 38
Rear Fan Grills..................................................................................................................... 38
37
ii
Page 5

Welcome
Congratulations! With the 973 Dew Point Mirror you will be able to perform precision dew
point and frost point measurements as well as measurements of other parameters such as
relative humidity. The 973 utilizes a full color active matrix liquid crystal display with an
integral touch panel. It has a high contrast ratio and a wide viewing angle for easy readability.
Data is displayed in large easy to read fonts. Using the on screen buttons and menus, you
can easily configure each line of the display for a variety of humidity, temperature, and
pressure parameters that may be viewed in either SI or non-SI units.
How to Use This Manual
If you have the time and inclination, you can read this manual from front to back. Since we
realize your time is valuable and that you may not wish to do that yet, we recommend the
following approach to familiarize yourself with the 973 and start using it right away.
1. With the 973 at hand, go straight to the
you can quickly learn to use the 973 to make a dew point measurement.
2. Next, read the
configure the system to meet your preferences.
3. Finally, read the
identifies all the electrical and gas connections available on the back panel and explains
how and when to use them.
System Configuration section beginning on page 12 to learn how to
Back Panel Connections section beginning on page 22. That section
Getting Started section on page 3. From there,
For More Information
For a more thorough understanding of the 973 and other humidity measurement information,
please read the remaining sections of this manual.
Installation section covers bench space, environmental, and power requirements.
The
Remote Communication section discusses the RS-232 interface both from a hardwa re
The
and software perspective. It gives details relating to cabling to connect the 973 to a
computer, and gives the syntax and examples of each of the commands that the 973
recognizes.
Maintenance section covers topics such as Mirror Cleaning and general maintenance
The
required to keep your 973 performance at its best.
If the information you seek is not in one of the manual’s included sections, never hesitate to
contact us with your questions. Relevant phone, fax, and email contact information is on the
front page of this manual.
Welcome 1
Page 6

Page 7
Operation
Getting Started
This section allows you to set up and start using the 973 right away. You’ll turn the system on
and quickly familiarize yourself with the layout and features of the display and touch screen.
Next, you’ll learn about the optical mirror assembly for later care and cleaning that may be
required. Finally, you’ll use the 973 to measure the dew point temperature. Set your 973 on the
bench and let’s get started!
Turning the 973 On and Off
The 973 needs a source of normal AC power. Have a look at the label on the back panel of the
instrument for the voltage required. Ensure that the required voltage matches that of your
standard laboratory power receptacles.
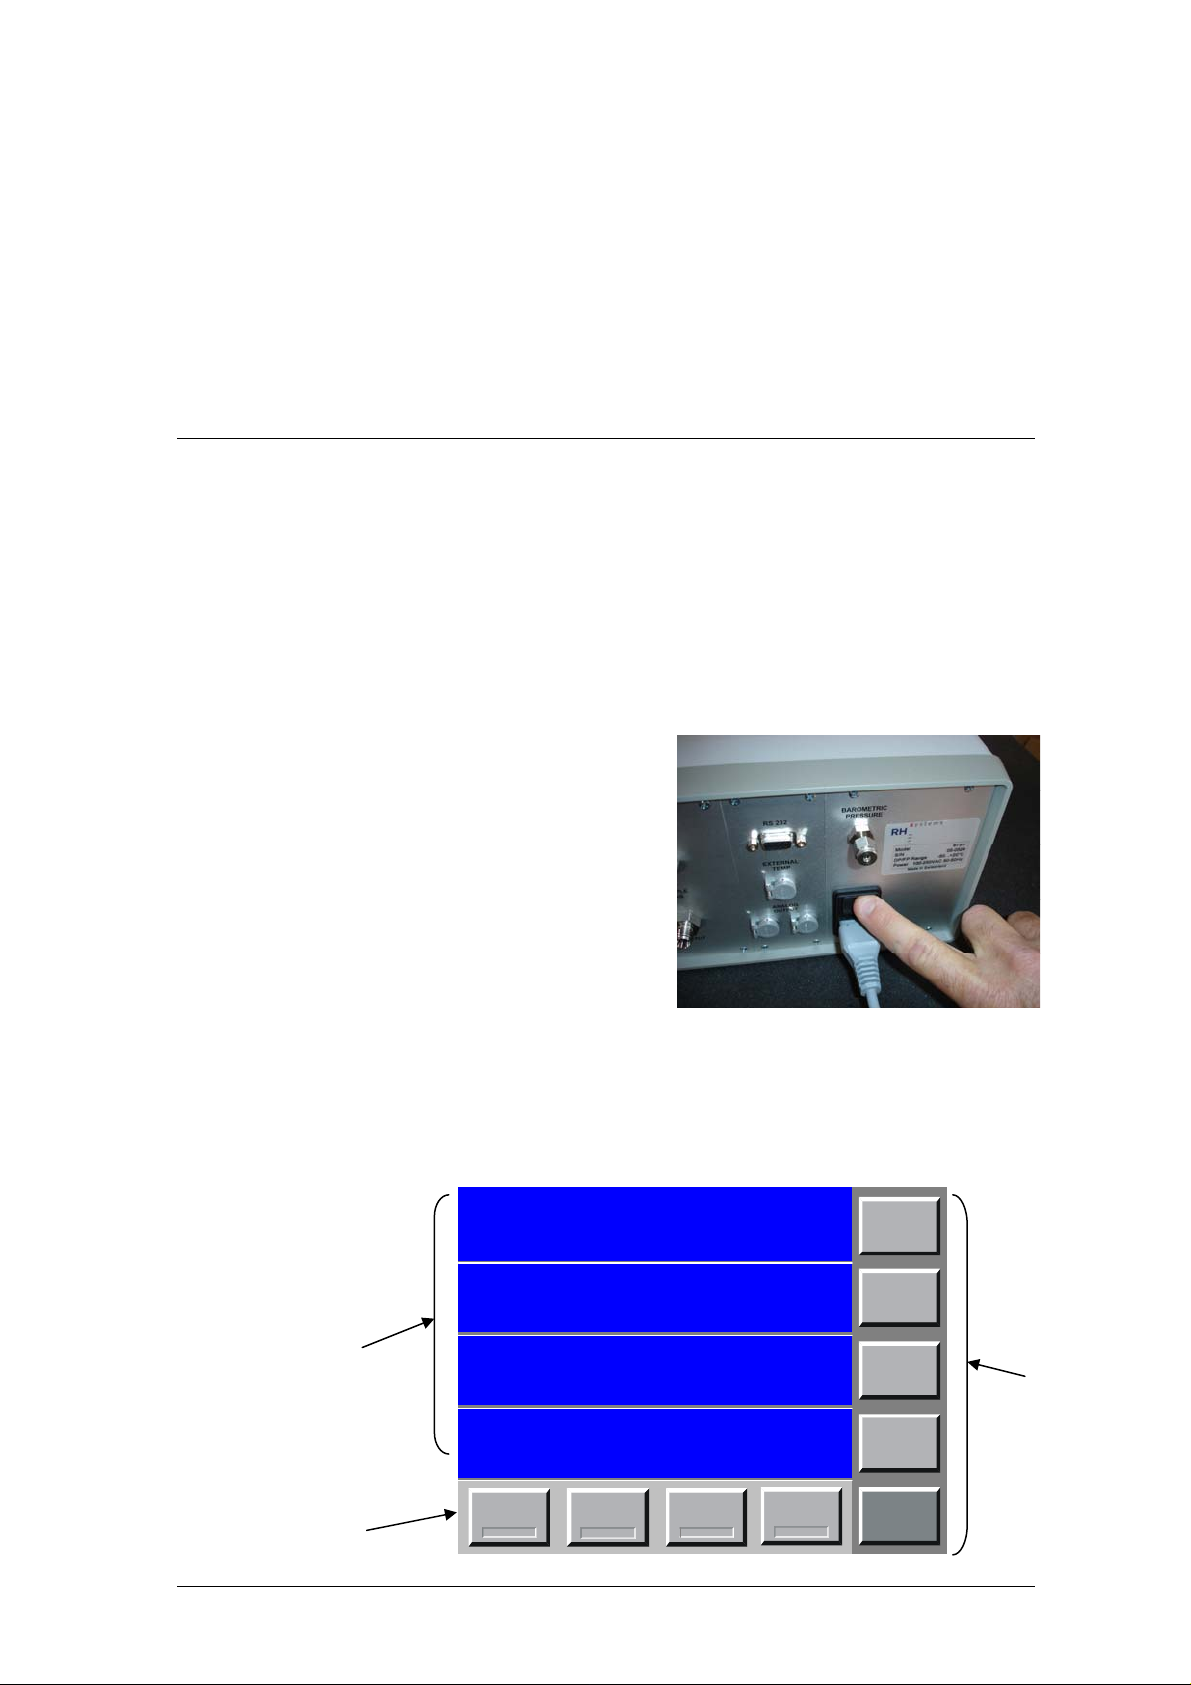
1. Using the supplied AC power cord, supply the
proper voltage to the instrument by plugging the
cord into the back of the instrument, then into an
AC receptacle of the proper voltage.
2. The power switch is located on the back panel
next to the power cord input. Turn it ON.
The display should become visible within a few
seconds. If nothing seems to happen, check the
power source. There may also be some fuses
located next to the power switch. You can remove
and replace them with known good ones. Suspect
fuses can be tested for continuity with an ohmmeter.
What You See
When power is applied to the 973, the display will activate within a few seconds. A typical
display configuration is depicted below. If you or someone else previously configured your
system, it may look slightly different. But don’t worry, we’ll show you how to set it up the way
you like.
Relative Humidity
10.00
25.41
Data
Lines
-8.41
14.695
Fixed
Function
Keys
Getting Started 3
Pump
Mirror
Check
%
External Temp
°C
Frost Point
°C
At m Pr e ss u r e
psia
M irror
Cleaning
Dew/Frost
Control
Menu
Keys
Page 8
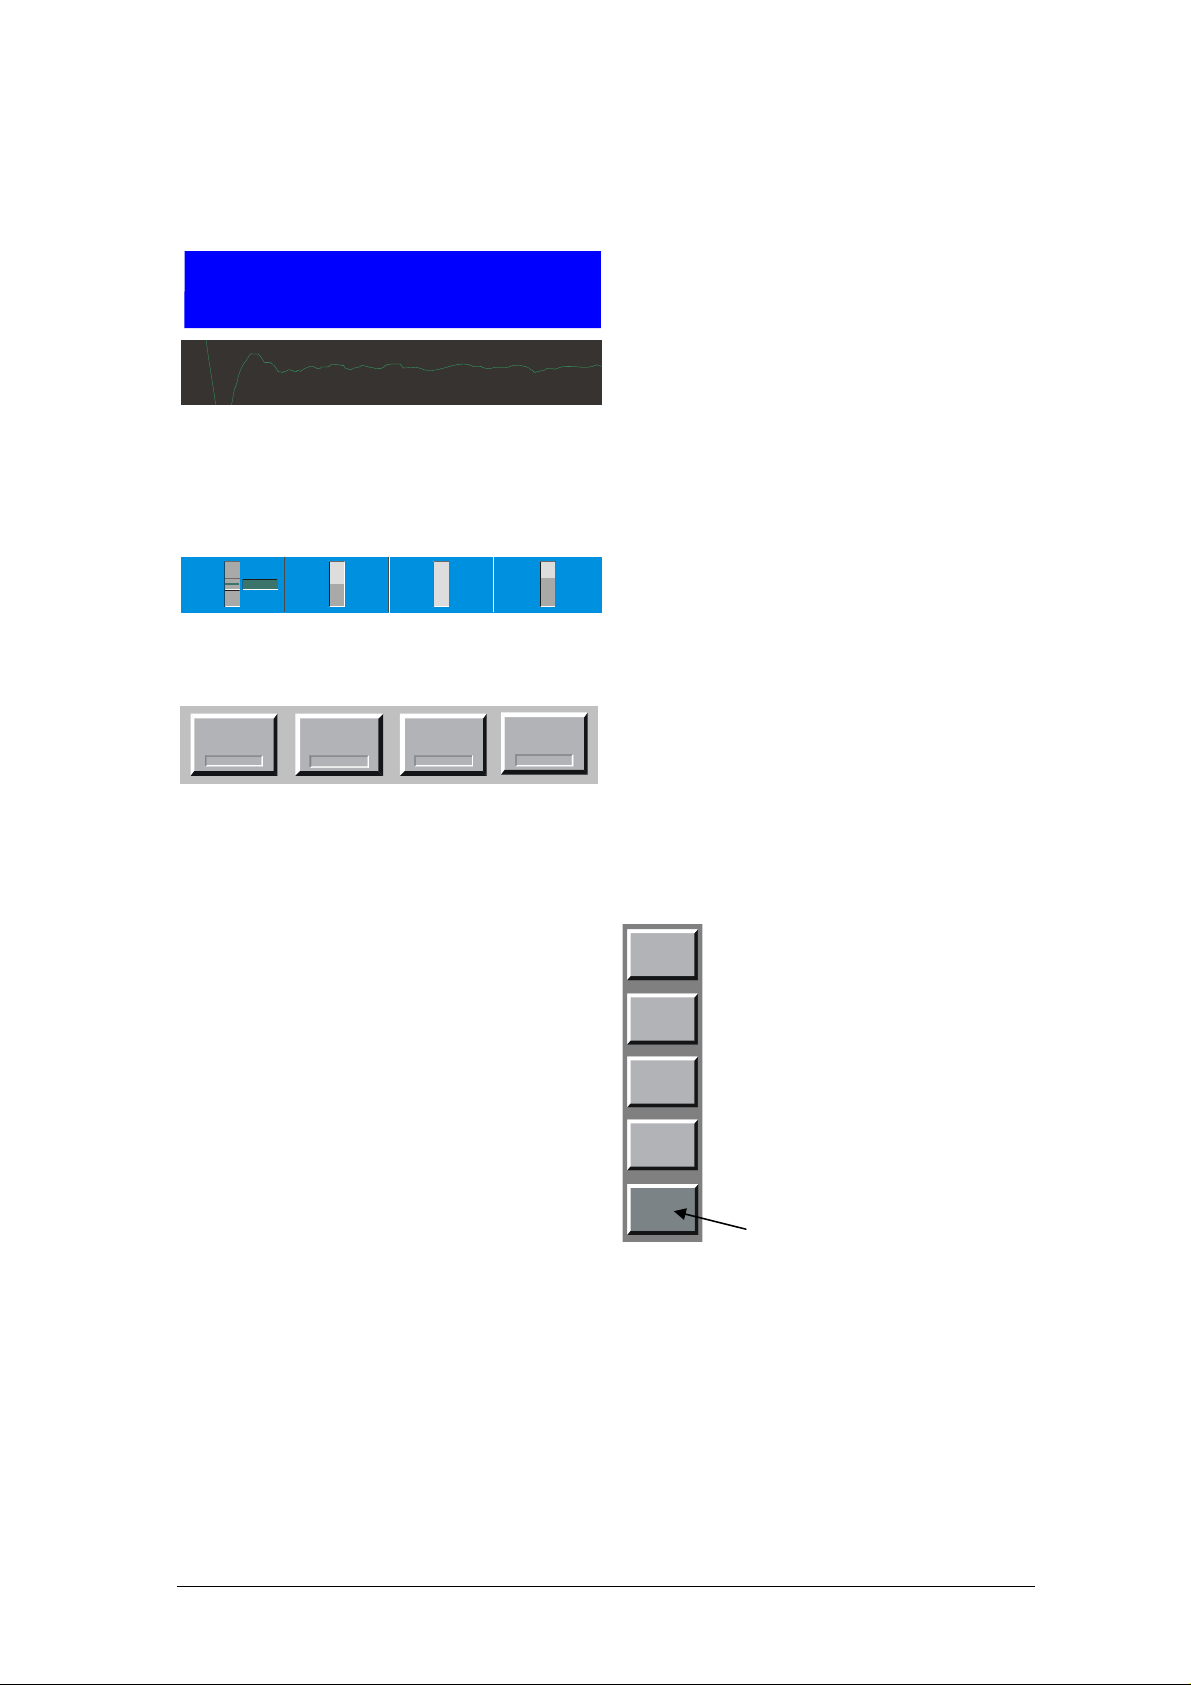
Data Lines
The first four lines of the display are for numeric or graphic representation of the measured data.
We refer to those first four lines as data lines.
If numeric, a data line contains the value to the
10.00
Relative Humidity
%
left, with the parameter description and units to
the right.
-9.8
If graphic, a data line shows a simple graph of
the data over time.
Time Span 20.16.30
-10.2
-9.65
Time Span 00:30:00
The choice of which parameter is shown on which data line, as well as whether a data line is
viewed as numeric or graphic, is easily selectable. You’ll see how to make these selections
shortly.
Status Bar
Balance
Indicator
+
STABLE
-
Frost
Density
Hi
0
Mirror
Residue
Hi
Flow Rate
0
60
30
0
The status bar contains balance, density,
contamination, and flow rate indicators. The
configuration of the status line is fixed and
never changes.
Fixed Function Keys
Pump
Mirror
Check
Mirror
Cleaning
Dew/Frost
Control
The bottom line of the display contains a row of
fixed function keys. You’ll use these keys to
start and stop the pump, enable and disable
measurement of dew point, and other things.
The function of each of these keys never
changes, and they are always available for
use.
Menu Keys
To the right side of the display is a column of
menu keys. Each of these keys changes
function as needed.
Notice that the bottom key in this column is
different from the rest. The bottom key is used
to cycle the upper keys through the various
menu options. The text on the bottom key
changes to indicate the currently selected
menu option. The text of the upper keys
change based on the functions available in the
menu.
Use this key to change menus
4 Getting Started
Page 9
The Touch Screen
The 973 utilizes a touch screen for user interaction. To activate a menu option or toggle a
function on or off, simply touch the screen directly over the key or object desired.
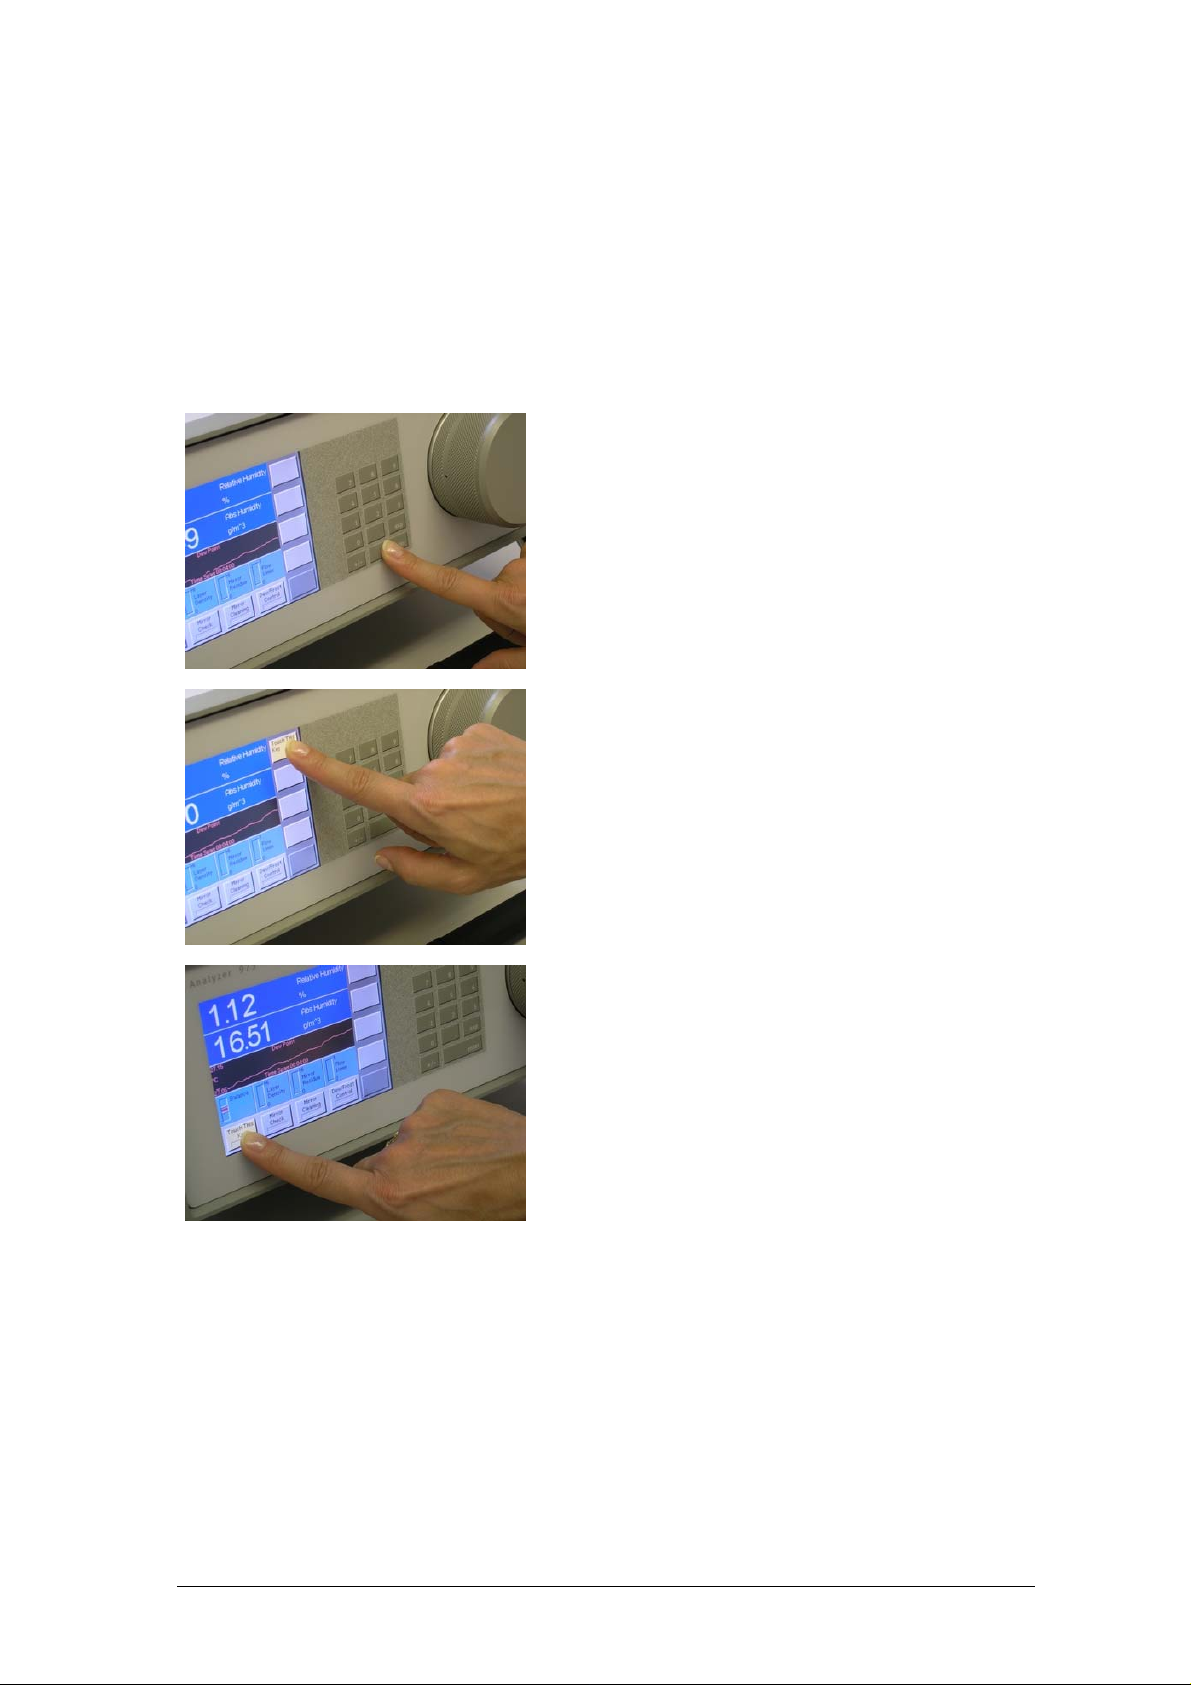
Calibrate the Touch Screen
Before using the 973 for the first time, you may need to calibrate the touch screen to your finger
positioning preference. Here’s how –
1. Press and hold the enter key on the numeric
keypad for 3 or 4 seconds. If you’ve done it
correctly, you’ll hear two loud short beeps.
If not, release the key and try again.
2. With the tip of your finger, press the center
of the yellow key in the upper right corner of
the touch screen. It is labeled ‘Touch This
Key’. Once you touch it, the yellow color
goes away and another key turns yellow.
3. Now, touch the yellow key that’s in the lower
left corner of the touch screen. Once you
touch it, the yellow color goes away and you
have successfully calibrated the touch
screen.
4. Test your new touch screen calibration by pressing each of the six blank menu keys on the
right side of the touch screen several times. If they seem not to work well, just repeat the
calibration steps again from the beginning.
You may recalibrate the touch screen as often as needed, however, it is rarely required.
Getting Started 5
Page 10
Navigating the Menus
The various menus of the right column of keys are navigated by using the key in the lower right
corner of the touch screen. Each time you press the lower right key, a new menu appears on
the keys directly above it. The menu is circular, meaning that once you go past the last menu,
the first one appears again and the process starts over. You can use the +/- key on the keypad
to move backward through the menus. Use the enter key to clear the menu.
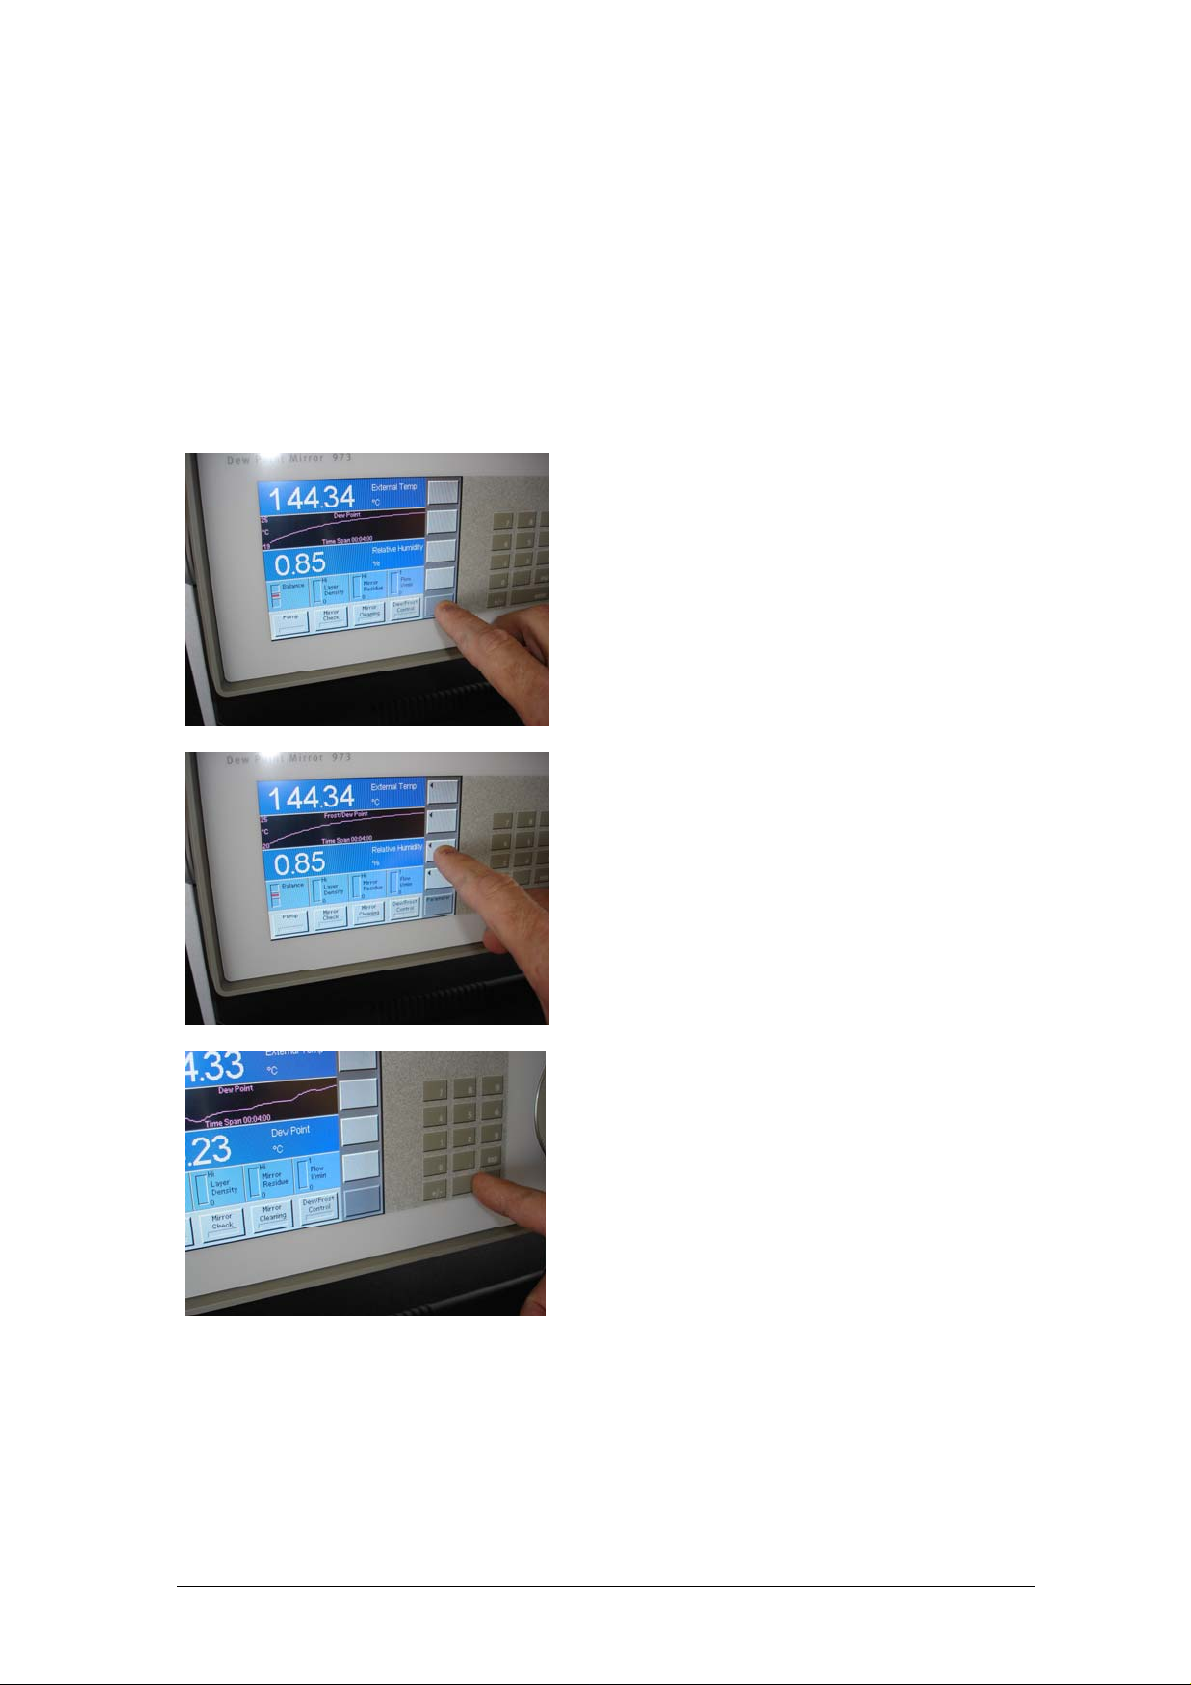
Selecting Parameters to Display
Selecting which parameters to display on the data lines is easy. It is done with the Parameter
menu.
1. Use the lower right menu key to select the
Parameter menu. ‘Parameter’ appears on
the key, and the keys above get left pointing
arrows. Notice that each key corresponds
to the data line it points toward.
2. Press the arrow key corresponding to the
data line you wish to change. Notice that
each time you press the arrow key, the
parameter of the data line changes. The
parameter selection is circular, meaning that
once you reach beyond the last available
parameter the first one is again displayed
and the cycle starts over.
3. Change the parameters on any of the other
data lines with the same method.
4. If you like, you may clear the menu keys
when finished by cycling through all the
menus using the lower right key on the
touch screen, or by pressing the enter key
once. Note that this is not required and
nothing is wrong with leaving the Parameter
menu (or any other menu) on the screen.
6 Getting Started
Page 11
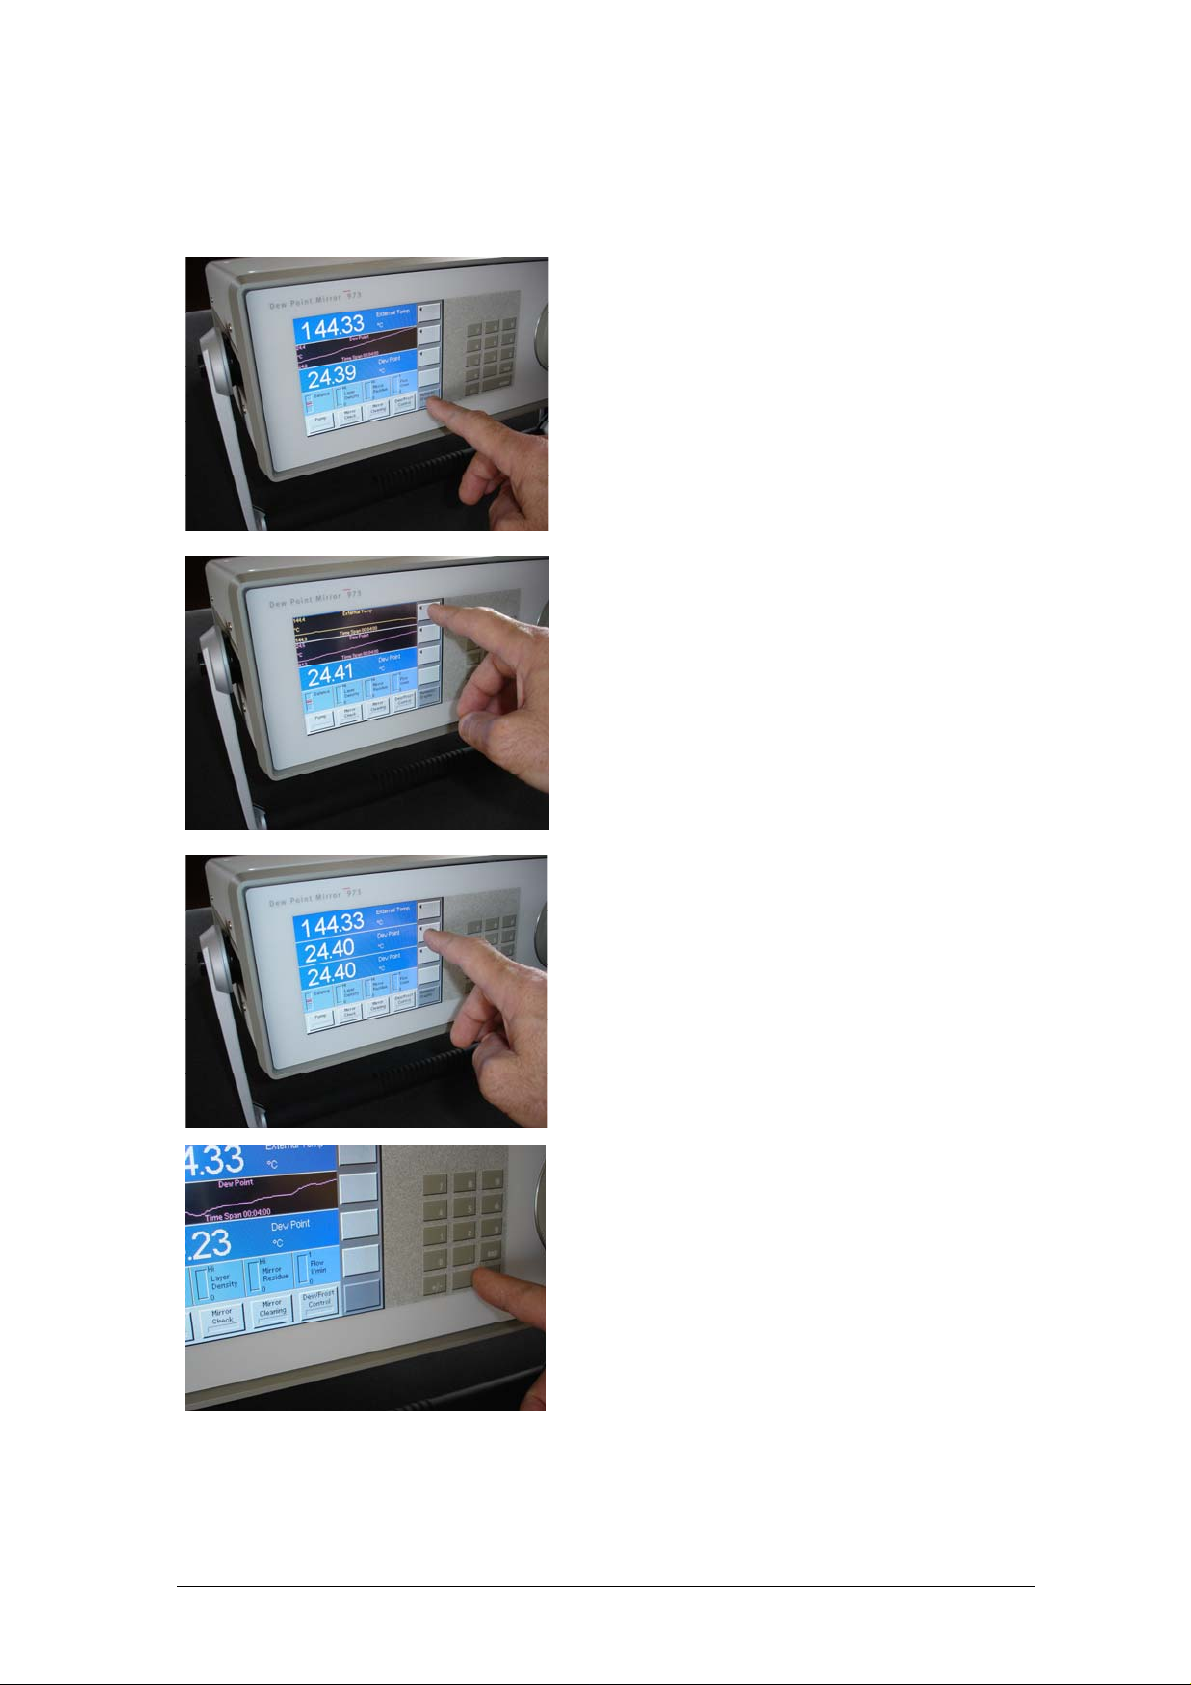
Selecting Graph vs. Numeric Data
Any data line may be viewed either as numeric or as a graph. The Numeric/Graphic menu is
used to toggle any data line between numeric and graph mode.
1. Use the lower right menu key to select the
Numeric/Graphic menu. ‘Numeric/Graphic’
appears on the key, and the keys above
contain left pointing arrows. Notice that
each key corresponds to the data line it
points toward.
2. Press the arrow key corresponding to the
data line you wish to change. Notice that
the data line toggles between numeric or
graph mode each time you press the key.
3. Select numeric or graph mode on any of the
other data lines with the same method.
Notice that if a line is currently displaying the Status
[
Bar, no arrow appears on the adjacent menu key. The
Status Bar is not changeable in the Numeric/Graphic
menu.
]
4. If you like, you may clear the menu keys
when finished by cycling through all the
menus using the lower right key on the
touch screen, or by pressing the enter key
once. Note that this is not required and
nothing is wrong with leaving the
Numeric/Graphic menu (or any other menu)
on the screen.
Getting Started 7
Page 12
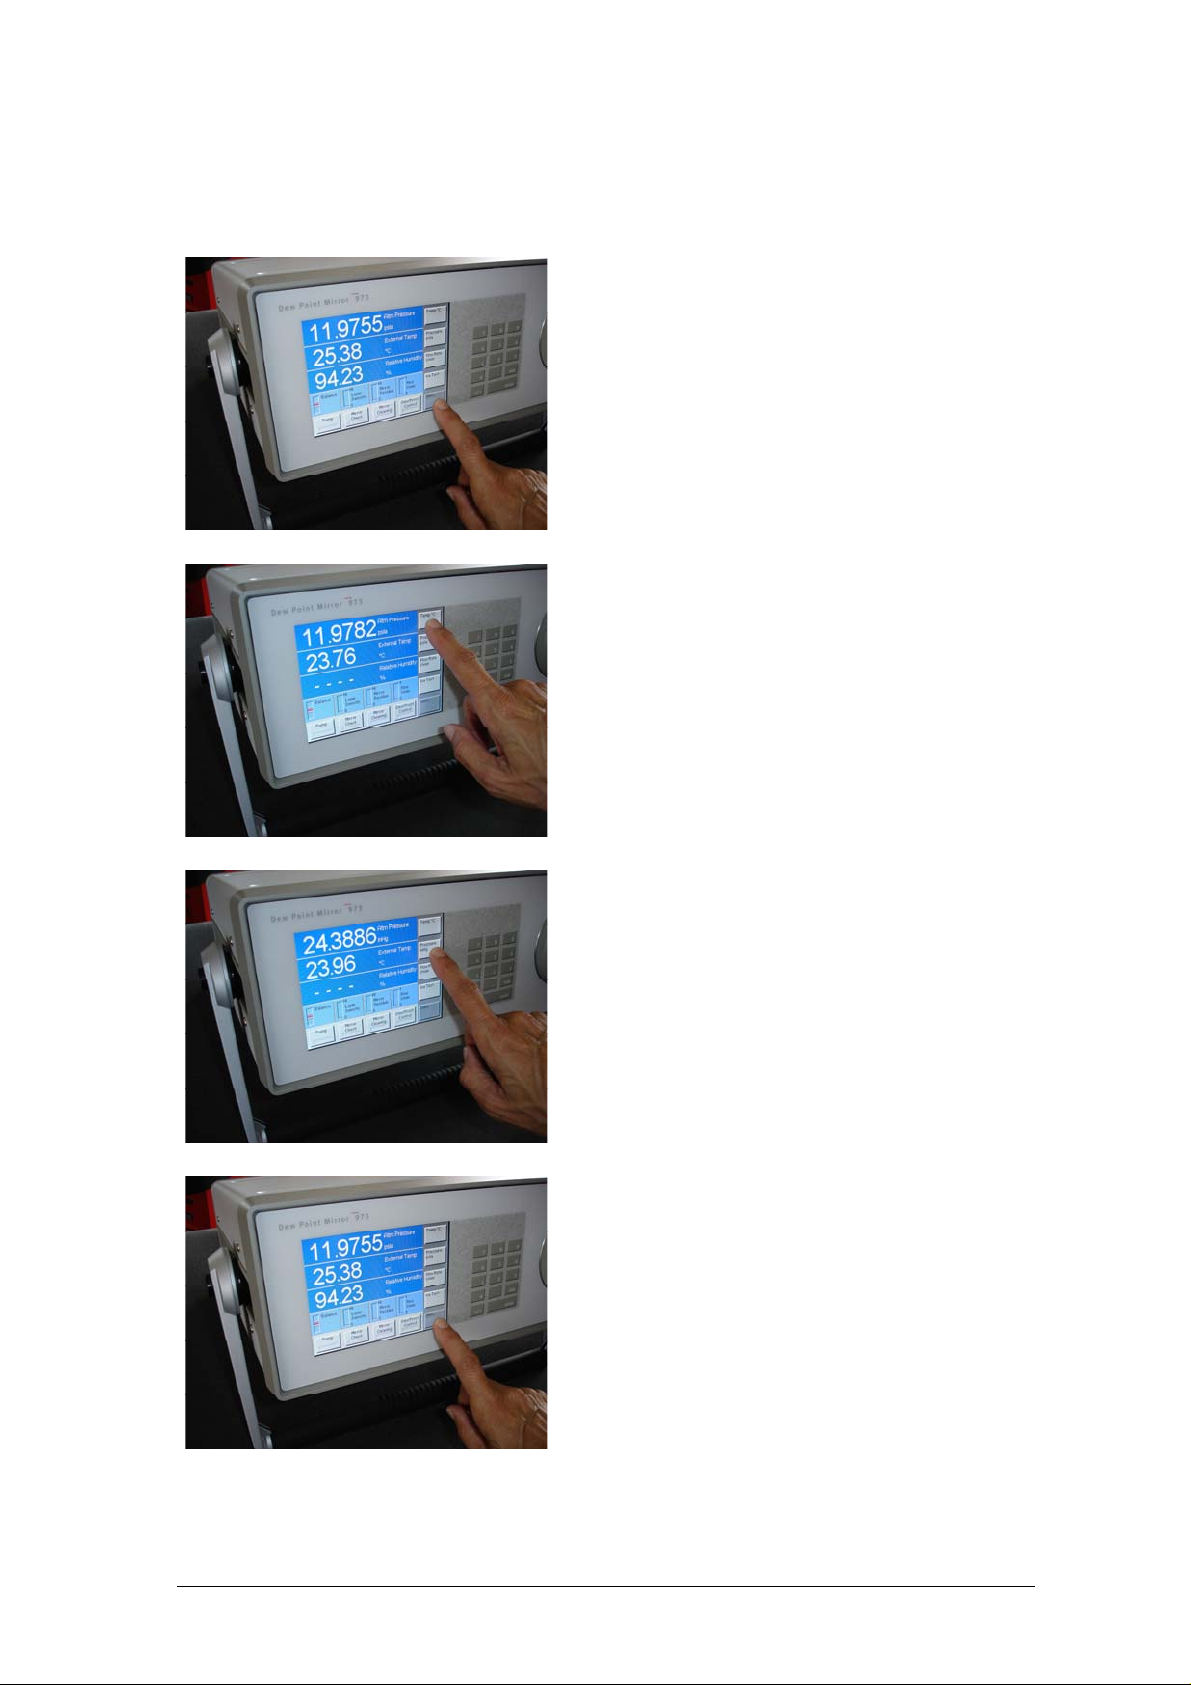
Selecting Units
The data may be viewed in any of the many available units. There are two Units menus used to
change the units of displayed data.
1. Use the lower right menu key to select the
Units menu. ‘Units’ appears on the key, and
the keys above contain current units
indications such as ‘Temp °C’. Notice that
each of the keys contain different types of
units. In this case, the keys do not correspond
to the adjacent data lines, but rather to
different units types.
2. To change temperature units, press the key
labeled ‘Temp’. Notice that the corresponding
units change each time the key is pressed.
Also notice that any data line that is currently
indicating temperature data also changes to
reflect the newly selected units.
3. Change other units (such as pressure, flow
rate, etc.) with the same method.
4. Note that there are two Units menus since
there are so many types of units that may be
changed. The second Units menu is obtained
by pressing the lower right menu key again.
5. If you like, you may clear the Units keys when
finished by cycling through all the menus using
the lower right key on the touch screen, or by
pressing the enter key once. Note that this is
not required and nothing is wrong with leaving
the Units menu (or any other menu) on the
screen.
8 Getting Started
Page 13
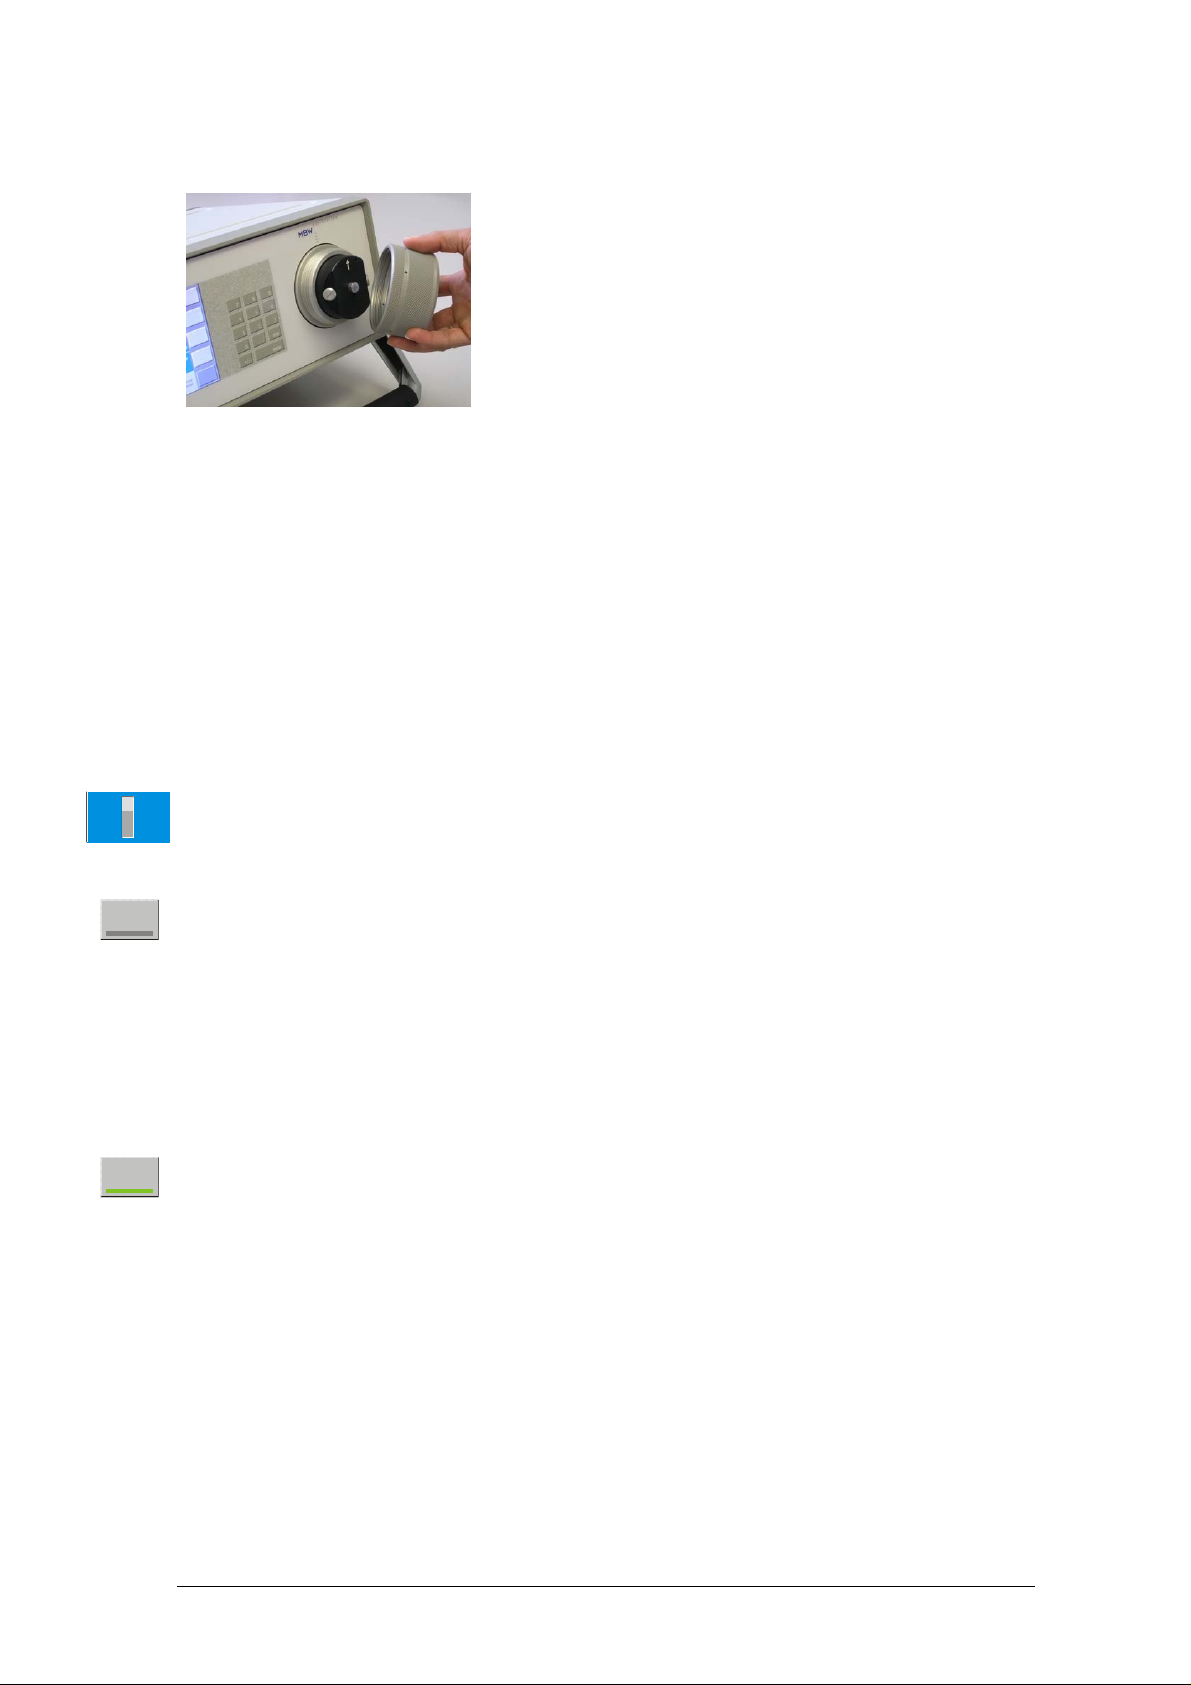
The Measuring Head Assembly
The heart of the 973 Dew Point Mirror instrument is
the measuring head assembly. It is designed to be
highly sensitive and accurate, yet rugged and easily
accessible for periodic mirror cleaning. Although not
required prior to initial operation, you may wish to
familiarize yourself with the location and accessibility
of the mirror and the other optical components within
this assembly.
For further discussion of the measuring head, and
the mirror cleaning procedure, refer to
Cleaning on page
37.
Mirror
Dew Point Measurement
When you power the 973 on, it begins in an idle state. In this state, it measures and displays
temperature, pressure, and flow transducers, but does not yet provide any meaningful humidity
related data. In order to provide humidity data (dew point, frost point, %RH, etc.), the Dew/Frost
Control mode must be enabled and gas must be flowing across the mirror. If %RH is desired,
note also that an external temperature probe must be connected. For external temperature
probe use, see
External Temperature on page 22.
Flow Rate
60
30
0
Pump
Dew/Frost
Control
Starting / Stopping the Pump
Some gas flow is required over the mirror when measuring the dew or frost point temperature.
The nominal gas flow desired is approximately 20 to 60 liters/hour (0.2 to 1.0 liters/minute). If
your 973 is equipped with an internal gas pump, you can use it to provide the necessary gas
flow. If not, then you may need to provide for gas flow in some manner.
Use the Pump key on the bottom row of the touch screen to toggle the pump on/off. The Flow
Rate indicator on the status line should indicate that gas is flowing. The actual rate of flow is not
critical, but is best when within the limits previously mentioned. The gas flow may be adjusted
with an external valve, or by changing the pump control parameters. See
17.
page
Pump Control on
Measuring the Room Ambient Dew Point Temperature
Enable Control
Lets use the 973 to measure the dew point temperature of the room by enabling the portion of
the system responsible for cooling and maintaining the mirror at the dew or frost point
temperature. Do so by pressing the Dew/Frost Control key. When enabled, a green bar on
the key illuminates and any dew or frost point temperature indication begins to drop as the
mirror cools toward the dew or frost point temperature. See
6 to select one of those parameters for display.
page
What You’ll See
When the Dew/Frost Control is enabled, have a look at the Status Bar (if you have your screen
set up to show it). The Status Bar has visual bar graphs that represent Balance, Density, Mirror
Residue, and Flow Rate.
Selecting Parameters to Display on
Getting Started 9
Page 14

Balance
Indicator
Frost
Density
+
STABLE
-
Hi
0
Dew/Frost
Control
The Balance Indicator
Although it is directly obtained from the intensity of the mirror’s reflected light signal, the Balance
Indicator is effectively the first derivative of the dew thickness. In other words, it indicates the
rate of growth or decay of the condensed layer on the mirror. While the dew or frost layer is
growing in thickness due to an increase in condensation on the mirror surface, the indicator is
above center. The faster the layer grows the higher the indication. Conversely, if the layer is
evaporating from the mirror surface thereby becoming thinner, the indicator is below center.
The faster it decays the lower the indication. When the indicator is in the center, it indicates that
the thickness of the dew or frost layer is neither growing nor decaying and that the layer on the
mirror surface is in equilibrium with the gas. In this center-balanced indication, there is no net
exchange of water vapor between the gas and the mirror surface. If the humidity of the gas
sample is homogeneous and of low enough variability for the control system to sense a steady
value, the Balance Indicator will illuminate a green ‘Stable’ message, and the system will emit a
few short audible beeps.
The Density Indicator
The Density Indicator graphically depicts the approximate relative thickness of the dew or frost
layer currently on the mirror surface. Since the 973 has the ability to differentiate between dew
and frost layers, it will also indicate which state the mirror’s layer is in. The label within the
density indicator will change from Layer Density (when it the state of the layer is uncertain) to
either Dew Density or Frost Density (when either dew or frost is assumed). For more
information regarding Dew/Frost point determination see
Dew / Frost Control on page 15.
Disable Control
To disable the control system, press the Dew/Frost Control key again. The green bar on the key
disappears indicating that the control is no longer enabled. Any dew or frost point temperature
indications will begin to rise toward the temperature of the measuring head, often within several
degrees of the ambient room temperature. Also, the density indication drops off and the
balance indication moves downward but eventually returns toward center.
External Temperature Connection
The 973 is equipped with an external
temperature sensor. This sensor, along with the
dew point and pressure measurement, allows
the 973 to accurately determine and display
relative humidity. The external temperature
probe connection is made at the back panel.
Gas Inlet Connection
While the previous example did not rely on any external gas connections, the 973 is equipped
with fittings for connection of gas inlet and outlet tubing. This allows the 973 to measure the
dew or frost point of chambers and other devices that can be connected to it via tubing. If you
have a gas source you wish to measure, such as a humidity generator or chamber, connect a
tube between it and the 973 gas inlet on the back of the unit.
10 Getting Started
Page 15

The input and output connectors are clearly
labeled on the Sample Gas section of the back
panel. Depending on the specific model and
ordered options, the stainless steel gas input
and output connections may be 6 mm
Swagelok, ¼ inch Swagelok, or ¼ inch Cajon
VCR.
Note that you should never attempt to measure
any gas with a dew point temperature that is at
or above the temperature of the room. If you
high dew point measurements, a Model 373H or 373HX with
heated internal components and heated hoses is required.]
do, condensation will form inside the tubing.
[For
Swagelok® Tube Fittings
Swagelok® brand tube fittings are generally used to connect the gas inlet and outlet tubes to the
973 system. Depending on the configuration of your specific 973, the back panel fittings are
either ¼” or 6 mm. When ordering tube fittings from your local Swagelok® supplier, be sure to
specify the correct size for your instrument. Swagelok® tube fittings come to you completely
assembled, finger-tight and ready for immediate use. Disassembly before use is unnecessary and
can result in dirt or foreign material getting into the fitting and causing leaks.
SWAGELOK® Tube Fittings are installed in three (3) easy steps:
Simply insert the tubing into the SWAGELOK
Make sure that the tubing rests firmly on the shoulder of
the fitting and that the nut is finger-tight.
®
Tube Fitting.
®
Before tightening the SWAGELOK
nut, scribe the nut at the 6
o’clock position.
Hold the fitting body steady with a backup wrench and tighten
the nut 1-1/4 turns.c Watch the scribe mark, make one
complete revolution and continue to the 9 o’clock position.
By scribing the nut at the 6 o’clock position as it appears to you,
there will be no doubt as to the starting position. When the nut is
tightened 1-1/4 turns to the 9 o’clock position, you can easily
see that the fitting has been properly tightened.
Use of a Swagelok
®
Gap Inspection Gage (1-1/4 turns from
finger-tight) ensures sufficient pull-up.
c
For 1/16“, 1/8“, 2 mm, 3 mm and 4 mm size tube fittings, only ¾ turn from finger-tight is necessary.
Getting Started 11
Page 16

System Configuration
You may configure many aspects of the 973 based on your preferences at the time. For
instance, you may easily select which humidity, temperature, and pressure values to indicate on
the screen, the order in which they should appear, their units, and whether each will be shown
as a number or as a graph. In addition to display configuration, you can also change how the
973 performs its control functions such as Dew/Frost determination, ORIS control, tube heating,
mirror pre-cooling, etc. Most configuration settings that you change remain valid until the next
time you change them, even if you shut the 973 off.
Menu Options
The 973 has several menus available which are used to configure the system to your
requirements. To activate each of the menus, press the lower right menu key. Notice that it is a
slightly different color than all the other keys on the touch screen.
Each time you press this menu key, the 973 advances to the next menu and the key’s label
changes to indicate which menu is currently active. Once you’ve reached the last menu item,
and press the menu key again, the menu options just start over again at the beginning.
Pressing +/- on the keypad steps backward through the menus. Pressing enter on the keypad
clears all menus from the screen. Note however, that there is no requirement to clear the
menus from the screen for any reason other than cosmetic, or for fear of accidentally changing a
configured option.
Simplified descriptions of each menu follows.
Parameter
Numeric /
Graphic
Control Setup
Units
Fore Color
Back Color
Analog
Outputs
The Parameter menu is used to select which parameter to display on each of the four
data lines. Each menu item key contains an arrow and directly corresponds with its
adjacent data line.
The Numeric/Graphic menu is used to toggle a data line between displaying the data
as numbers or as a graph. Each menu item key contains an arrow and directly
corresponds with its adjacent data line.
The Control Setup menu is used to configure such things as dew/frost control, pump
control, internal and external heater control, cooling water control, etc.
The Units menu is used to change units used for displaying data. Unit changes are
system global, meaning that if the temperature units are changed, then all temperature
values displayed (including dew and frost point temperatures) will appear in the new
units. Since there are so many units that may be configured, there are two units
menus.
The Fore Color menu is used to temporarily change the color of the lines drawn on
graphs and the color of text (number and letters). Each data line may be changed
individually. Unlike other selections, changing colors is only temporary and cycling the
power causes the 973 to return to standard color settings.
The Back Color menu is used to temporarily change the color of the background dra wn
on graphs and numeric data lines. Each data line may be changed individually. Unlike
other selections, changing colors is only temporary and cycling the power causes the
973 to return to standard color settings.
The Analog Outputs menu is used to configure the calibration, scaling, and parameter
selection for output of data to the Analog Output connectors on the back panel if your
unit is so equipped. Both analog output ports are separately configurable.
12 System Configuration
Page 17

Display Parameters
Use the Parameters menu to select which parameters to display on the data lines. When you
select parameters for display on any of the four data lines, those selections remain valid until
you change them again, even if you turn the 973 off. See
6 to select which values to display. A list of the available parameters follows. Note that
page
Selecting Parameters to Display on
not all parameters are available on all systems since some systems may not contain the
associated hardware components.
Dew Point
Frost Point
%RH
%RH WMO
Volume Ratio
Weight Ratio
Absolute Humidity
Specific Humidity
Vapor Pressure
Head Pressure
Atmospheric Pressure
Flow Rate
External Temperature
Head Temperature
Graphing Data
Any value that you can view numerically can also be viewed as a graph at any time. The 973
automatically maintains a short history of each and every selectable parameter so that a graph
may be seen instantly whenever a data line is toggled from a numeric mode to a graph mode.
Selecting Between Numeric Data and Graph
Selecting between numeric and graph modes is done with the Numeric / Grap hic menu. See
Selecting Graph vs. Numeric Data on page 7.
Changing Graph Attributes
To change the graph attributes, you need to
bring up the graph dialog. Do this by pressing
the touch screen directly on the graph whose
attributes you’d like to change.
System Configuration 13
Page 18

Scaling
Each graph can have its own scaling (or y-axis)
values. There are three distinctly different
scaling modes to choose from:
Autoscale
Fixed Range
Maximum / Minimum
You may also change the Time Span of the
graph from this dialog.
• Autoscale
Autoscale mode determines the scaling automatically so that all of the stored data will be visible
on the graph at the best possible resolution. As the range of the data changes, so does the
range of the graph. In autoscale mode, you can select a minimum that you want the graph to
scale to. This is very useful for data that is very stable with little variation. This prevents the
973 from setting the scaling to such a small range that even the highly stable data appears
visibly as wildly variable. For viewing dew or frost point graphs, setting this Autoscale Minimum
to a value of at least 0.2 or more is generally preferable. This allows the graph range to close in
on the data as it stabilizes at a point without becoming too narrow. You can experiment with this
value to determine your personal preferences with different parameters. Autoscale mode is the
power up default.
• Fixed Range
Fixed Range scaling allows you to select a fixed graph range, but automatically centered on the
current data point. In other words, as the current data varies so does the graph center point, but
the overall range remains fixed. This fixed range auto centering is mostly used to monitor data
for stability.
• Maximum / Minimum
You can specify the maximum and minimum values used for the graph. This is completely fixed
scaling. If the data falls outside the maximum and minimum values you specify, you will not see
them on the graph. If you wish to see the data that is outside the values you specified, you’ll
need to specify maximum and minimum values with a larger spread.
You can change the graph scaling at any time, and freely switch between the three scaling
modes as well. Try it.
1. Using the touch screen, press directly on the graph you which to change. A graph scaling
dialog box will appear. One of the buttons in the Description column will have a green
indicator. That shows you the currently selected mode. Note that there are three buttons –
one for each mode.
2. Press the button of the mode you’d like to change to. Note that for the MinMax option, only
the Maximum button need be pressed (as Minimum is then automatically assumed).
3. Press the corresponding button in the Change To column for the range you selected.
4. Using the numeric keypad, enter the value needed. If the number shown in the Value
column is already correct, no entry is needed here. If you make a mistake while entering
the value, use the touch screen and press on the number in error. Each time you press the
touch screen there, the number will backspace one, erasing the flawed digits.
14 System Configuration
Page 19

5. Once the value is shown is what you want press the Ok button (or the enter key) to accept
the new value, or press the Cancel button to abort all changes made to the mode and to any
values.
The only values that get accepted by the system are those that correspond with the selected
mode. In other words, if you change the value of the Autoscale Minimum, but Fixed Range is
the selected mode, the Autoscale Minimum value remains unchanged.
Time Span
Changing the time span allows you to see a longer or shorter history period for the data. The
973 stores a fixed number of data points independent of the selected time span. Changing the
time span changes the interval used for data storage. With a 15 minute time span, the graph
data is sampled and stored every few seconds. However, with a 2 hour time span, the graph
data is only sampled, stored, and updated about once a minute.
When you change the time span, the old data previously sampled and stored at the old interval
will be incrementally replaced by new data sampled at the new interval. The Time Span as
indicated on the graph will always reflect the actual time span of the currently stored data, and
will eventually agree with the time span you select. Regardless of the graph selected, the
selected time span is common to all graphs so that they all have the same time relationship to
one another.
The result of a time span change might not be seen instantaneously. It will take some time for
the old data at the old time interval to be replaced by data at the new time interval as
determined by your selected time span.
Viewing Data both as Numeric and as a Graph
Since all displayable data may be viewed either numerically or as a graph, it does not matter
which parameters are selected on which lines of the display. Often times you may even want to
select the same parameter on two different data lines. That way you can have one of them set
for numeric mode and the other one showing you a graph of that same data.
Control Setup
With the Control Setup, you can control the manner in which the 973 operates. The control
setup capabilities are accessible through the Control Setup menu. See
on page
6.
Dew / Frost Control
The 973 can control on either dew point or frost point, and has the ability to distinguish the
difference through a function known as Force Frost. The Dew / Frost Control setup menu is
used to control the Force Frost function and also allows for setup of the ORIS (Optimal
Response Injection System) operation.
Force Frost Below
For mirror temperatures above 0°C, water vapor condenses on the mirror as liq uid water (dew).
A condensation layer resulting from a mirror temperature above 0°C is considered a dew point.
For mirror temperatures far below 0°C (generally mirror temperatures below –40°C), water
vapor condenses on the mirror as solid ice (frost). A condensation layer resulting from a mirror
far below 0°C is considered a frost point.
Navigating the Menus
System Configuration 15
Page 20

However, for mirror temperatures between 0 and approximately –30°C, the state of the
condensed layer is generally indeterminate since dew can, and does, exist on the mirror in a
meta-stable state at temperatures well below 0°C. In reality, the condensed layer on the mirror
could be dew, frost, or some combination of the two. Significant errors can result if wrongful
assumptions are made and can be in excess of 2°C.
To eliminate this problem, the 973 can automatically force all sub-zero condensation to a known
state of frost using the Force Frost function. Force Frost works by rapidly cooling the mirror
below –40°C forcing the condensate to solidify to a layer of ice or frost. The mirror will then restabilize at the frost point temperature. Once the condensed layer is in a state of frost, it will
remain frost for all sub-zero mirror temperatures.
You can enable or disable the Force Frost function, and also decide at which temperature it
begins to work. From the Control Setup menu, press Dew/Frost Control (the top menu key).
Change the value of the Force Frost Below field. Mirror temperatures below this value will be
forced to frost.
Now enable or disable the Force Frost function by pressing the Force Frost Below button. A
green indicator light on the button means that the function is enabled. If the light is not
illuminated, then the Force Function is disabled, and no Force Frost will be performed.
Complete your preference by pressing Ok or the keypad’s enter key.
Enable ORIS Below
If the option is installed, the Optimal Response Injection System is used to speed system
response for very low frost point measurements typically when the gas is drier than
approximately –60°C. ORIS works by momentarily injecting a small amount of water vapor into
the dry gas stream to rapidly seed the initial formation of frost on the mirror. This process allows
the required layer to build within a matter of minutes rather than hours. ORIS is typically used
for frost point measurements below about –60°C, but allows you to set it to any reasonable
value.
You can enable or disable the ORIS function, and also decide at which temperature it begins to
work. From the Control Setup menu, press Dew/Frost Control (the top menu key). Change the
value of the Enable ORIS Below field. Mirror temperatures below this value, when there is not
yet any frost formation on the mirror, will use ORIS to more rapidly form the initial frost layer.
Now enable or disable the ORIS function by pressing the Enable ORIS Below button. A green
indicator light on the button means that the function is enabled. If the light is not illuminated,
then ORIS is disabled, and no rapid layer formation will be performed. Complete your
preference by pressing Ok or the keypad’s enter key.
Mirror Cleaning Control
When the fixed Mirror Cleaning key at the bottom of the screen is pressed, the mirror
immediately warms to a pre-specified temperature, readying the measuring head for removal of
the cover and optical assembly. If the mirror and other internal measuring head components
become exposed to normal atmospheric air while cold, the possibility of undesired condensation
exists. By warming the mirror and other internal components to a safe head removal
temperature prior to accessing the mirror, this adverse condensation is avoided.
The safe temperature to which the mirror and internal components will be warmed during a
Mirror Cleaning procedure is selectable from the Mirror Cleaning key of the Control Setup menu.
Enter a value between 20 and 50°C for the Min Head Removal Temp.
16 System Configuration
Page 21

Mirror Check Control
Mirror Check is the process of warming the mirror to evaporate all condensatio n, look for the
presence of contamination and account for it if necessary, then re-initiating a new dew or frost
point measurement. Mirror Check may be initiated manually with the fixed Mirror Check key, or
if enabled to do so, it may trigger automatically at pre-specified time intervals. During a mirror
check function, whether triggered automatically or manually, the fixed mirror check key indicates
red while heating, brown while holding at the high temperature, then yellow while allowing the
mirror to cool to reform the dew or frost layer again. Once the system has again established a
dew or frost layer, and become stable at that value, the mirror check function is complete and
the color indications are removed. To view or edit the Mirror Check parameters, press the
Mirror Check key of the Control Setup menu.
Cycle Time
If Automatic Mirror Check is desired, enable it by pressing the Cycle Time button. A green light
on the Cycle Time button indicates that automatic mirror check is enabled. Even if automatic
mirror check is not enabled, manual mirror check may be initiated at any time simply by pressing
the fixed Mirror Check key at the bottom of the screen. When automatic mirror check is
enabled, the fixed Mirror Check key also displays a countdown timer indicating the time until the
next automatic mirror check function.
Changing the Cycle Time changes the time interval between automatic mirror check operations.
Heating Time
The Heating Time determines how long to hold at the mirror check temperature before allowing
another dew or frost point measurement. A heating time of 0 results in no hold, meaning that
once the mirror check temperature has been reached, the function ends and dew/fro st contro l
resumes immediately. If a heating time greater than 0 is entered, then the mirror will heat and
remain at that temperature for the duration of the heating time value. Heating time is effective
regardless of whether mirror check was triggered automatically or manually.
Heat To
Edit the Heat To field to change the temperature that the mirror will be heated to, and optionally
held at, during Mirror Check.
Pump Control
The pump, if your system is so equipped, is a diaphragm type driven by a brushless DC motor.
Pump speed, and thus flow rate, is controlled by changing the amount of power applied to the
motor. Pump power can be set from 0 to 100%, accessed through the Pump key of the Control
Setup parameters menu. When connections to the system are made with short tubing of ¼”
diameter resulting in very little flow restriction, settings for pump power of 10 to 25% are often
acceptable. However for long tubing runs, small tubing diameters, or when restrictions are
induced (by externally installed flow meters for instance) higher pump power settings may be
required. Experiment to determine the lowest pump power setting needed to obtain the de sired
flow rate. Turn the pump on and off with the fixed Pump key.
Depending on your system configuration, a pump may not be needed. Or if a pump is installed,
it may not necessarily need to be enabled if you are sampling from a positive pressure system.
The pump, if installed, is configured with forward flowing check valves that open easily. This
allows even a slight positive pressure to be used flow gas through the head, even if the pump is
installed but not enabled.
System Configuration 17
Page 22

Changing Units
You can display system data in any of a wide variety of units. When you make a new units
selection, that selection remains until you change it again. To change units, follow the
instructions given in the Selecting Units section on page 8. Units selections are global acro ss
the system, meaning that all values of that parameter type change to reflect the chosen units.
For instance, changing the temperature units to °C forces all temperature data to appear in °C.
Note:
Data retrieved via RS-232 will always be in SI units regardless of the units chosen for display.
Also note that settings within dialog boxes used for changing system parameters are also
entered and displayed in SI units. Units only affects the four data lines of the normal display
window.
Temperature Units
Temperature values may be displayed in units of °C, °F, or K. When changing temperature
units, all temperature values, whether displayed as numeric or in a graph, change to reflect the
new units selection. Notice that the chosen units will appear on the screen both on the units
selection key and next to any temperature related values currently displayed.
Pressure Units
Pressure values may be displayed in units of Pa, hPa, kPa, MPa, atm, bar, mb, inHg, mmHg,
cmHg, inH
values (not including vapor pressure), whether displayed as numeric or in a graph, change to
reflect the new units selection. Notice that the chosen units will appear on the screen both on
the units selection key and next to any pressure related values currently displayed.
O, mmH2O, cmH2O, Torr, and psia. . When changing pressure units, pressure
2
Flow Rate Units
The gas flow rate may be displayed in units of l/min, ml/min, l/h, cfm, and cfh. When changing
flow units, an indicated flow rate will change to reflect the new units selection, whether displayed
numerically or as a graph. Notice that the chosen units will appear on the screen both on the
units selection key and next to the flow rate when displayed.
Volume Ratio Units
Humidity expressed as a volume ratio may be displayed in units of PPMV (Parts Per Million by
Volume) or PPB
change to reflect the new units selection, whether displayed numerically or as a graph. Notice
that the chosen units will appear on the screen both on the units selection key and next to the
volume ratio when displayed.
(Parts Per Billion by Volume). When changing these units, volume ratio will
V
Weight Ratio Units
Humidity expressed as a weight ratio may be displayed in units of PPMW (Parts Per Million by
Weight) or PPB
change to reflect the new units selection, whether displayed numerically or as a graph. Notice
that the chosen units will appear on the screen both on the units selection key and next to the
weight ratio when displayed.
(Parts Per Billion by Weight). When changing these units, weight ratio will
W
Absolute Humidity Units
Absolute humidity may be displayed in units of g/l, g/m3, and lb/ft3. When changing these units,
absolute humidity will change to reflect the new units selection, whether displayed numerically
or as a graph. Notice that the chosen units will appear on the screen both on the units selection
key and next to absolute humidity when displayed.
18 System Configuration
Page 23

Specific Humidity Units
Specific humidity may be displayed in units of g/g, g/kg, and lb/lb. When changing these units,
specific humidity will change to reflect the new units selection, whether displayed numerically or
as a graph. Notice that the chosen units will appear on the screen both on the units selection
key and next to specific humidity when displayed.
Vapor Pressure Units
Vapor pressure may be displayed in units of Pa, hPa, kPa, MPa, atm, bar, mb, inHg, mmHg,
cmHg, inH
pressure will change to reflect the new units selection, whether displayed numerically or as a
graph. Notice that the chosen units will appear on the screen both on the units selection key
and next to vapor pressure when displayed.
O, mmH2O, cmH2O, Torr, and psia. . When changing vapor pressure units, vapor
2
Changing Color
You are free to change the foreground and/or background color of any data line with the Fore
Color and Back Color menus. Access the Fore Color and Back Color menus with the menu
selection key discussed in the
color changes are retained. To revert to the standard system default color scheme, press and
hold the 9 key for a few seconds while in the Fore Color or Back Color menu.
Fore Color
Fore color affects the color of number and letters, and the plotting color of graphs. If you
change the fore color of a data line that is displayed numerically, the graph attributes of that line
are not affected. Likewise, if you change the fore color of a line displayed as a graph, the
numeric display attributes of that line are unaffected. Which aspect of the data line that is
affected is determined by whether that line is currently displayed as a number or as a graph
when changing the fore color.
To change a data line’s fore color:
1. Access the Fore Color menu as described in the
appears on the key, and the keys above contain left pointing arrows. Notice that each key
corresponds to the data line it points toward.
2. Press the arrow key corresponding to the data line you wish to change. Notice that the fore
color of the data line changes with each press of the key.
3. Change the fore color on any of the other data lines with the same method.
Menu Keys section on page 4. Like other system settings, these
Menu Keys section on page 4. ‘Fore Color’
Back Color
Back color affects the background color of number and letters, and the background col or of
graphs. If you change the back color of a data line that is displayed numerically, the graph
attributes of that line are not affected. Likewise, if you change the back color of a line displayed
as a graph, the numeric display attributes of that line are unaffected. Which aspect of the data
line that is affected is determined by whether that line is currently displayed as a number or as a
graph when changing the back color.
To change a data line’s back color:
1. Access the Back Color menu as described in the
Color’ appears on the key, and the keys above contain left pointing arrows. Notice that
each key corresponds to the data line it points toward.
2. Press the arrow key corresponding to the data line you wish to change. Notice that the back
color of the data line changes with each press of the key.
3. Change the back color on any of the other data lines with the same method.
System Configuration 19
Menu Keys section on page 4. ‘Back
Page 24

Analog Outputs
If this option is installed, the 973 is equipped with at least two analog outputs that are
independently configurable. For each of the analog outputs, you may easily select which
parameter to track and how to scale the selected parameter to the analog output range. These
selections are made for each of the analog outputs via the Analog Outputs menu.
1. Access the Analog Outputs menu with the menu selection key discussed in the
section on page
2. To access the selections for the first analog output, press the ‘Analog Output 1’ key. This
brings up the appropriate analog output configuration window.
3. Make necessary changes as identified in
the Output to the Data below.
4. Follow the same procedures for the second or any subsequent analog outputs as needed.
4.
Selecting Which Parameter to Track and Scaling
Selecting Which Parameter to Track
With the appropriate analog configuration window displayed, you may select which parameter to
attach to that analog output. The parameter is identified as a number in the Parameter field of
the window. Using the following list as a guide, change the parameter field to the number
indicated.
For this parameter
Dew Point [°C] 0
Frost Point [°C] 1
Units
Enter this
number
Menu Keys
RH [%] 2
RH WMO [%] 3
Volume Ratio [PPMv] 4
Weight Ratio [PPMw] 5
SF6 Volume (available on SF6 only) [%] 6
Absolute Humidity [g/m3] 7
Specific Humidity [g/kg] 8
Vapor Pressure [Pa] 9
Atmospheric Pressure (available only
when equipped with high accuracy
barometer option)
Head Pressure [Pa abs] 11
Relative Head Pressure (not available
on 973)
Flow Rate [l/min] 13
External Temperature [°C] 14
Head Temperature [°C] 15
As an example, suppose that you wish to have %RH output as an analog voltage. Since %RH
is identified as parameter 2 in the list, enter the number 2 into the parameter field of the analog
configuration window.
[Pa abs] 10
[Pa] 12
20 System Configuration
Page 25

Scaling the Output to the Data
With the appropriate configuration window displayed, you may change the data scaling of the
analog output vs. the parameter. Continuing with the example in the previous paragraph,
assume that you wish to have 0 to +1 VDC on the analog output represent 0 to +100 %RH.
Based on the example,
For this field Enter this value
Min Value 0
Max Value 100
Min Voltage 0
Max Voltage 1
Depending on the factory configuration and calibration of your specific 973, it may be equipped
with one of several different output options. Options have included ±1, ±5, or ±10 VDC.
Additionally, some units have been equipped with 4-20 mA outputs. While the most common
option is ±10 VDC (with 16-bit resolution), many older units where equipped with ±5 VDC (with
12-bit resolution). You may wish to experiment with your 973 output to determine which
configuration you have.
Voltmeter Connections
Analog output connectors are clearly identified on the instrument back panel. With the anal og
output parameters selected and properly scaled, connect a cable between the analog output
and a voltmeter. Pre-wired cables are available. If you wish to make your own cables, see
Analog Outputs on page 23 for pin-out information.
System Configuration 21
Page 26

Back Panel Connections
Power Plug
The power requirements are identified on the serial number label on the back of the instrument.
Depending on the model, fuse access may also be available on or near the power plug.
Power Switch
The main power switch is mounted on the back panel near the power plug. Use the power
switch to turn the system ON and OFF.
RS-232
The RS-232 connector is used when connecting the 973 to an external com puter. Use a
standard 9 pin cable to connect between the 973 and a desktop or laptop computer. The cable
is wired straight through with pins 1 through 9 of the male end wired to pins 1 through 9
respectively of the female end. The RS-232 extender cable is a common accessory item easily
obtained at most any computer accessory dealer.
Remote Communication on page 29 for complete discussion of the RS-232 command
See
reference and hardware connections.
External Temperature
The External Temperature plug on the back panel is used for connection of an external
temperature probe. External temperature measurements are required if certain humidity
parameters are to be computed, such as %RH. External temperature measurements are not
required for dew or frost point measurements.
If you wish to connect your own thermometers, the 973 requires
a 5 pin connector, LEMO (www.lemo.ch) part number FGG 1B
305 CLAD 42.
Red Dot aligns with Pin 1
When wiring the cable, note that pin numbering of the socket in
the back panel starts at the top and goes counter-clockwise (as
viewed from the rear of the unit). ). When viewing the solder
tubs of a disassembled 5-pin LEMO connector, pin 1 is usually
identified with a full or partial circle drawn around it, followed by
a line to the other pins in order.
After identifying pin 1, follow the line counter-clockwise from pin 1 to all other pins in succession.
Wire the cable according to the following:
Pin Position Signal
1 Top Shield
2 10 o’clock +I
3 7 o’clock +V
4 5 o’clock -V
5 2 o’clock -I
When the 5-pin LEMO connector is properly assembled, you will notice that the red dot of the
connector housing will be aligned at the top directly above pin 1.
22 Back Panel Connections
Page 27

Analog Outputs
Analog outputs, if this option is installed, are used for connection of external voltmeters or chart
recorders. The analog outputs are independently configurable.
If you wish to make your own cables, the 973 requires a 2 pin
connector, LEMO (www.lemo.ch) part number FGG 1B 302
CLAD 42.
Red Dot
aligns with
Pin 1
Wire the cable according to the following:
When the 2-pin LEMO connector is properly assembled, you will notice that the red dot of the
connector housing will be aligned at the top directly above pin 1.
When viewing the solder tubs of a disassembled 2-pin LEMO
connector, pin 1 is usually identified with a full or partial circle
drawn around it. Pin 2 should have no identifier.
Pin Position Signal
1 Top +V
2 Bottom -V
Gas Input and Output
The gas input and output fittings are used for connection of the 973 to the sample gas. Based
on the original configuration of your system, it will generally contain ¼” or 6 mm Swagelok
fittings.
While a connection to the gas input is most likely required, the gas output connection is often left
unconnected. If the fittings are capped, you’ll need to remove those caps for operation or
connection of sample lines.
®
tube
Barometric Pressure Input
Some systems are equipped with a high accuracy barometric pressure sensor for measurement
of the atmospheric pressure. Systems with a barometric pressure sensor have the pneumatic
fitting of that sensor brought to the back panel. This fitting must remain open for operation.
Back Panel Connections 23
Page 28

Measurement Tips
Since each particular 973 model is best suited for a specific dew/frost point range, it is important
to have some minimal knowledge of the expected value of the measurement in order to ensure
that the proper system is being used. In addition to proper system selection, your success will
depend on other factors as well, such as selection and connection of hoses, cooling and/or
heating requirements, flow rate, mirror cleanliness, and dew vs. frost determination. These and
other topics are discussed here in order to ensure that you achieve success with your
measurements.
Understand the Measuring Range
The 973 has a specific dew / frost point measuring range. It also has a specific range of
temperature that it can measure. These values are also converted into the appropriate relative
humidity measurement range. The typical 973 measurement range is listed below.
973 (-50°C Frost Point … +20 °C Dew Point)
The standard 973 is generally useful over a measuring range of -50°C frost point to +20°C dew
point. The mirror cooling capability and the materials used within the measuring head limit the
low end. The room ambient temperature limits the upper end. You should never attempt to
measure a dew point temperature that is at or above the temperature of the room. If you do,
condensation will form inside the tubing.
The measuring range of the dew / frost point, coupled with the measurement of temperature
allow the 973 to be useful for measurement of relative humidity from approximately 1% to 100%
RH when measured at approximately 25°C. Since relative humidity is relative to the prevailing
temperature, the RH range will change with changes in temperature.
Connecting Hoses
Your success with dew or frost point measurement may likely depend on proper selection and
connection of the hoses you use in configuration of your gas sampling system.
Types of Hoses
There are various types of hoses available for use in your gas sampling system. You should
consider the suitability for your application.
Teflon
Teflon tubing is flexible, easy to use, and is well suited for frost/dew point measurements in the
range of approximately –60 to +20 °C, and is therefore well suited for use with the 973.
Stainless Steel
Stainless steel tubing, while less convenient to use, is a good choice for all measurement
ranges.
Tygon, Nylon, Poly
Tygon, nylon, and poly tubing are not recommended for use with the 973. They are often
affected by permeation of water vapor through their shells which can adversely affect the
measurements.
24 Measurement Tips
Page 29

Hose Input and Output
Preferred Connections
When comparing two or more instruments, make the conne ction s in parallel.
Pr
Flow
Flow
Pump
Pr
Pump
Troublesome Connections
Never connect instruments in series, because of the interference between the two instruments.
Pr
Flow
Flow
Pump
Pr
Pump
Measurement Tips 25
Page 30

Cooling Requirements
Air Cooling
All 973 systems are equipped with air cooling. When air cooled, the fan speed is controlled
automatically by the computer. Air cooling is generally sufficient for measurements of frost/dew
points from approximately –50 to +20°C. Air cooling operates automatically and requires no
user input.
Water Cooling
The 973 is not equipped with any provisions for water cooling.
26 Measurement Tips
Page 31

Installation
Facility Requirements
Environmental
Your 973 is a precise laboratory quality instrument. While it does not require any special
environmental control, it works best when the temperature is stable and free of rapid transitions.
For operation, it is best when used under the following conditions:
Operating Temperature 15 to 35°C
Operating Humidity 5 to 95%RH non-condensing
Power
The 973 is equipped with a universal power supply capable of operation from 100 to 250 VAC at
50 to 60 Hz. If different, the specific power requirements will be identified on the back panel.
Preparation for Use
Prior to first measurement the instrument should be switched on for 30 minutes to warm up.
Benchtop Use
All 973 models are ready for benchtop use. Bench space of at least 24” x 24” (0.6 x 0.6 m) is
recommended.
Preparation for Shipping or Transportation
All shipping and transportation should be done in suitable padded containers. A heavy duty
container with at least 2 to 4 inches of clearance for foam padding is recommended.
Due to the design of the 973 systems, any shipping carton used should be constructed to
provide support only on the top and bottom of the side panels and on the front and rear frame of
the unit. Try not to have any load bearing directly on the face, nor on the top or bottom center of
the front or rear frame. Reusable shipping containers are available. Please contact the factory
for pricing and availability.
Prior to shipping, always cap the gas inlet and outlet fittings to prevent excess moisture and/or
contamination from entering the gas path, and to prevent damage to the fittings.
Ensure the optical head assembly and cover screw are firmly attached.
Facility Requirements 27
Page 32

Page 33

Remote Communication
Introduction
The 973 is equipped with a bidirectional RS-232 communications interface that allows it to be
connected to a remote computer. This section is intended to provide necessary information
for programming personnel regarding the use of the interface, including the hardware
connections, communications settings, and the command syntax.
Hardware Connection & Cabling
Connect a computer to the 973 using a standard RS-232 9-pin extender cable. The extender
cable has a male connector on one end and a female connector o n the other end. It is wired
straight through with pins 1 through 9 on one end wired to pins 1 through 9 on the other end.
If your computer has a 25-pin serial port connector rather than a 9-pin connector, you’ll also
need a 25-pin to 9-pin port adapter. Both the 9-pin RS-232 extender cable and the 25-pin to
9-pin port adapter are commonly available from most computer hardware dealers.
The 973 ignores the DSR and CTS handshaking signals. While th ere is no harm in
connecting all 9 pins, the 973 only requires connection of three of the pins (pins 2=TxD,
3=RxD and 5=GND). For your reference, the complete connector pin-out is listed in the
following table. Note that those signals identified by * are required, while the others are
completely optional.
Signal 973
(9 pin)
1 1 8
*TxD 2
*RxD 3
DSR 4
*GND 5 5 7
DTR 6
CTS 7
RTS 8
9 9 22
* Denotes a required connection. All others are optional.
Direction Computer
(9 pin)
Æ
Å
Å
Æ
Å
Æ
2 3
3 2
4 20
6 6
7 4
8 5
Computer
(25 pin)
Introduction 29
Page 34

Communications Settings
To communicate with the 973, set your computer to the following settings.
Baud Rate: 9600
Data Bits: 8
Stop Bits: 1
Handshaking: None
Command Syntax
This section details the general syntax guidelines regarding termination, leadin g and trailing
spaces, case sensitivity, and numeric values. Throughout this section, characters originating
from the computer will be shown for illustrative purposes in this font. Characters
originating from the 973 will be shown in this font.
General Usage
All commands require either a question mark or an equal sign to indicate whether you are
requesting data or setting new setpoints or parameters. When requesting data from the 973,
follow the command with ?, the question mark character. For example, the following requests
the current Automatic Mirror Check timing interval..
AMC.cycleTime?
The 973 replies with the current AMC cycle time. This value may have been entered from the
touch screen or as you will now see, via RS-232.
When setting new values or parameters, use =, the equal sign. For example, the following
command changes the Automatic Mirror Check timing interval to 20 minutes.
AMC.cycleTime=20
Most commands that can be set with an equal sign, such as the one in the above example,
may also be read with the question mark. That makes sense. However, there are several
commands that are considered read only, and have no corresponding ability to be set.
Examples of read only capability are measured parameters, such as dew point, frost point,
RH, etc.. While it is perfectly valid to read dew point with a command such as dp?, it
obviously makes no sense to be able to set the dew point value. Therefore, a command such
as dp=1.23 is considered invalid, and will be ignored by the 973.
Termination Characters
All commands must be terminated with either a carriage return
combination
CRL
.
F
Regardless of the command sent, the 973 will reply with a carriage return linefeed
end of the response, provided the command is recognized as valid. Here is an example:
C
(sent by the computer to the 973)
DP?
R
-10.015
CRL
(sent by the 973 back to the computer)
F
30 Communications Settings
C
or a carriage return linefeed
R
CRL
at the
F
Page 35

Even if the command is not a request for data, but rather is a command to change a setpoint
or parameter, the 973 still responds with a carriage return line feed combi nation. The
following turns on the pump (if your unit is so equipped). Notice that no data is returned, but
the 973 sends a
Pump.on = 1
CRL
CRL
acknowledgement that the command was valid.
F
C
(sent by the computer to the 973)
R
(the acknowledgement from the 973)
F
However, if the command is unrecognized, the 973 does not respond. See the example.
Abcdef?
C
(invalid command sent from the computer)
R
(no response from the 973)
Leading and Trailing Spaces
The 973 ignores leading and trailing spaces. It also ignores spaces before and after equal
signs and question marks. For example, each of the following command s is perfectly valid.
However, the following commands are invalid since spaces are embedded within the
keywords.
C
Dp?
R
C
Dp ?
Pump.on=1
R
C
R
Pump.on = 1
C
D p?
Pu mp.on=1
R
C
R
C
R
Case Sensitivity
All commands are insensitive to case. In other words, it does not matter if the command is
sent in upper case letters, lower case letters, or as some combination of the two. For
example, the commands DP?, Dp?, dP?, and dp? are identical to the 973 and will return the
measured dew point value.
Numeric Values
All numeric data sent to or received from the 973 is done so in either standard or scientific
notation. Sending a number as 12.34 is the same as sending it as 1234e-2 or as 1.234e1.
Depending on the value of numeric responses the 973 sends out, it may send the numbers in
either standard or scientific notation.
Numeric data is never appended with text of any kind. In other words, if requesting a
temperature related value, only the numeric portion of the value is sent. The units are
assumed but never sent.
The following table lists the units that numeric data adheres to, regardless of the units
selection on the touch screen display or set via the RS-232. In other words, when you
change units (even if you changed them via RS-232), you affect only what is seen on the
display. All numeric values retrieved from the RS-232 will always be in the following units.
Also, when sending data of any kind, do so in these same units.
Command Syntax 31
Page 36

Parameter Units via RS-232
Temperature °C
Pressure Pa
Flow l/m
RH %
Absolute Humidity g/m
Specific Humidity g/kg
Volume Ratio PPMv
Weight Ratio PPMw
PRT Resistance Ohms
Some values simply require integer numbers such as 1 and 0 for On and Off, while others
might need real numbers with a decimal point. The 973 recognizes both types of numbers
and will attempt to convert the values you send to the correct format. For example, the
number 0 means Off, while 1 or any other real or integer value means On.
3
Command Reference
The available commands listed here are grouped by function. If a command is considered as
a read only value, then it is shown with a question mark only. For instance, the following is
considered as read only and does not have the ability to be set.
Dp?
A command that has both read and set capability is shown in a slightly different manner. The
question mark and equal signs are shown for illustrative purposes within brackets. Those
brackets indicate that either one or the other is required. Furthermore, [=i] indicates that
the value is an integer, while [=n] indicates that the value is a real number and may
therefore include a decimal point.
Consider a command with syntax listed in the manner
ForceFrost.on[=i][?]
This indicates the following valid possibilities.
ForceFrost.on = 0
ForceFrost.on = 1
ForceFrost.on?
Now consider a command with syntax listed as
UseOris.below[=n][?]
Any of the following are valid possibilities.
UseOris.below?
UseOris.below = -5
UseOris.below = -10.25
Note that a value entered as –5.00 would be equally as valid as –5. While it makes no
sense to use a value above 0 for this UseOris example, in general the syntax listing [=n]
indicates any real number, either positive or negative, with or without a decimal point.
32 Command Reference
Page 37

Commands Listed By Functional Group
Measurement Data
Syntax Function
DP?
FP?
RH?
RHw?
PPMv?
PPMw?
AH?
SH?
VP?
P?
Pa?
Flow?
Tx?
Tp?
Tm?
Th?
Om?
Ox?
Stability Indication
Syntax Function
Stable?
Dew Point, °C
Frost Point, °C
Relative Humidity, %
Relative Humidity (WMO), %
Volume Ratio, PPMv
Weight Ratio, PPMw
Absolute Humidity, g/m3
Specific Humidity, g/kg
Vapor Pressure, Pa
Head Pressure, Pa
Atmospheric Pressure, Pa
Flow Rate, l/m
External Temperature, °C
Precooler Temperature, °C
Mirror Temperature, °C
Head Temperature, °C
Mirror PRT Resistance, Ohms
External PRT Resistance, Ohms
1Æsystem is stable, 0Ænot stable
Force Frost Settings
Syntax Function
ForceFrost.on[=i][?]
ForceFrost.below[=n][?]
ForceFrost.coolTo[=n][?]
ForceFrost.holdBelow[=n][?]
ForceFrost.dispHold[=i][?]
SaveCfg=973
1 enables Force Frost, 0 disables Force Frost
Temperature below which Force Frost activates, °C
Temperature to cool to in order to force frost, °C
Keep mirror below this temp during force frost, °C
1 freezes DP display during Force Frost
Save these and other configuration parameters
Water Valve Settings
Syntax Function
WaterValve.armed?
WaterValve.on?
WaterValve.below[=n][?]
WaterValve.hyst[=n][?]
SaveCfg=973
1Æ valve mode is ready
0Æ valve mode is disabled
1Æ valve is On, 0Æ valve is Off
Temperature below which valve activates, °C
Hysteresis amount to prevent valve chatter, °C
Save these and other configuration parameters
Command Reference 33
Page 38

ORIS Settings
Syntax Function
UseOris.on[=i][?]
UseOris.below[=n][?]
SaveCfg=973
1 enables ORIS, 0 disables ORIS
Temperature below which ORIS activates, °C
Save these and other configuration parameters
Mirror Cleaning Preparation
Syntax Function
MinHeadRemovalTemp[=n][?]
SaveCfg=973
Head and inner cooler are warmed above this temp
when Mirror Cleaning button has been pressed
prior to head removal, °C
Save these and other configuration parameters
Automatic Mirror Check
Syntax Function
AMC.on[=i][?]
AMC.cycleTime[=n][?]
AMC.heatTime[=n][?]
AMC.temp[=n][?]
AMC.dispHold[=i][?]
SaveCfg=973
1 enables AMC, 0 disables AMC
AMC cycle time in minutes
Time in mins to hold at high temperature during
Manual or Automatic Mirror Check
Temperature to heat to during Manual or Automatic
Mirror Check, °C
1 freezes DP display during Manual or Automatic
Mirror Check
Save these and other configuration parameters
Pump Control Parameters (if available)
Syntax Function
Pump.on[=i][?]
Pump.freq[=n][?]
Pump.dutyCycle[=n][?]
SaveCfg=973
1Æpump On, 0Æpump Off
Pump solenoid frequency, Hz
Pump solenoid on/off duty cycle
Save these and other configuration parameters
Analog Outputs
See Analog Outputs on page 20 for explanation of the parameters.
Syntax
Ana1.param[=i][?]
Ana1.paramMin[=n][?]
Ana1.paramMax[=n][?]
Ana1.OutMin[=n][?]
Ana1.OutMax[=n][?]
Ana1.calGain[=n][?]
Ana1.calZero[=n][?]
Ana1.output=n
Ana1.hold[=i][?]
SaveCfg=973
Function
Parameter to track with analog output #1
Min Value
Max Value
Min Voltage
Max Voltage
Gain calibration factor for D/A converter
Zero calibration factor for D/A converter
Use to set analog output when calibrating D/A
converter. Automatically sets Ana1.hold=1. You
must send Ana1.hold=0 when finished with
calibration.
1ÆCalibration mode. Analog output is set with the
command Ana1.output=n.
0ÆNormal mode. Analog output tracks the
parameter set with Ana1.param=i.
Save these and other configuration parameters
34 Command Reference
Page 39

Analog Outputs (continued)
Syntax Function
Ana2.param[=i][?]
Ana2.paramMin[=n][?]
Ana2.paramMax[=n][?]
Ana2.OutMin[=n][?]
Ana2.OutMax[=n][?]
Ana2.calGain[=n][?]
Ana2.calZero[=n][?]
Ana2.output=n
Ana2.hold[=i][?]
SaveCfg=973
Parameter to track with analog output #2
Min Value
Max Value
Min Voltage
Max Voltage
Gain calibration factor for D/A converter
Zero calibration factor for D/A converter
Use to set analog output when calibrating D/A
converter. Automatically sets Ana2.hold=1. You
must send Ana2.hold=0 when finished with
calibration.
1ÆCalibration mode. Analog output is set with the
command Ana2.output=n.
0ÆNormal mode. Analog output tracks the
parameter set with Ana2.param=i.
Save these and other configuration parameters
Mirror Temperature Calibration Coefficients
Syntax Function
MirrorTempCal.r0[=n][?]
MirrorTempCal.a[=n][?]
MirrorTempCal.b[=n][?]
MirrorTempCal.c[=n][?]
MirrorTempCal.avg[=n][?]
MirrorTempCal.avgBand[=i][?]
MirrorTempCal.sensCode[=i][?]
MirrorTempCal.coefType[=i][?]
SaveCal=973
Callendar VanDusen R0 coefficient, ~ 100.00
Callendar VanDusen A coefficient, ~ 3.9083e-3
Callendar VanDusen B coefficient, ~ –5.775e-7
Callendar VanDusen C coefficient, ~ -4.183e-12
Amount of averaging applied to measurement, ~40
Only average when measurements remain within
this band, ~ 0.2 °C
=42 for 385 RTD
=3 for Callendar VanDusen type coefficients
Save these and other calibration parameters
External Temperature Calibration Coefficients
Syntax Function
ExtTempCal.r0[=n][?]
ExtTempCal.a[=n][?]
ExtTempCal.b[=n][?]
ExtTempCal.c[=n][?]
ExtTempCal.avg[=n][?]
ExtTempCal.avgBand[=i][?]
ExtTempCal.sensCode[=i][?]
ExtTempCal.coefType[=i][?]
SaveCal=973
Callendar VanDusen R0 coefficient, ~ 100.00
Callendar VanDusen A coefficient, ~ 3.9083e-3
Callendar VanDusen B coefficient, ~ –5.775e-7
Callendar VanDusen C coefficient, ~ -4.183e-12
Amount of averaging applied to measurement, ~40
Only average when measurements remain within
this band, ~ 0.2 °C
=42 for 385 RTD
=3 for Callendar VanDusen type coefficients
Save these and other calibration parameters
Command Reference 35
Page 40

Head Temperature Calibration Coefficients
Syntax Function
HeadTempCal.a0[=n][?]
HeadTempCal.a1[=n][?]
HeadTempCal.a2[=n][?]
HeadTempCal.a3[=n][?]
HeadTempCal.avg[=n][?]
HeadTempCal.avgBand[=i][?]
Polynomial 0th order (Zero) coefficient, ~ 0
Polynomial 1
Polynomial 2nd order (Linearity) coefficient, ~0
Polynomial 3
Amount of averaging applied to measurement, ~40
Only average when measurements remain within
this band, ~ 1°C
HeadTempCal.sensCode[=i][?]
HeadTempCal.coefType[=i][?]
SaveCal=973
=37 for 10K thermistor
=2 for polynomial type coefficients
Save these and other calibration parameters
Flow Sensor Calibration Coefficients
Syntax Function
FlowCal.a0[=n][?]
FlowCal.a1[=n][?]
FlowCal.a2[=n][?]
FlowCal.a3[=n][?]
FlowCal.avg[=n][?]
FlowCal.avgBand[=i][?]
FlowCal.sensCode[=i][?]
FlowCal.coefType[=i][?]
SaveCal=973
Polynomial 0th order (Zero) coefficient
Polynomial 1
Polynomial 2nd order (Linearity) coefficient
Polynomial 3
Amount of averaging applied to measurement, ~0
Only average when measurements remain within
this band, ~ 0 l/m
=21 for voltage output sensor
=2 for polynomial type coefficients
Save these and other calibration parameters
st
order (Span) coefficient, ~ 0.01
rd
order (Linearity2) coefficient, ~ 0
st
order (Span) coefficient
rd
order (Linearity2) coefficient
System Identification
Syntax Function
ID?
Returns a string containing instrument
identification, ie. DPM 973
IDN?
Returns only numeric portion of identifier, ie. 973
Saving Changes
Syntax Function
SaveCfg=973
SaveCal=973
SavePID=973
Save configuration parameters
Save calibration parameters
Save PID parameters
36 Command Reference
Page 41

Maintenance
Mirror Cleaning
The heart of the 973 dew point measuring instrument is the measuring head assembly. It is
designed to be highly sensitive and accurate, yet rugged and easily accessible for periodi c
mirror cleaning.
Removing the Head Cover Screw or Retaining Bar
The measuring head is located on the right side of the
973 front panel. To gain access to the mirror and optoelectronic components, you must first remove the cover
screw by twisting it counterclockwise. It requires
approximately three full turns to completely unscrew,
allowing you to remove it.
Once the cover screw has been removed, the black
optical assembly (optical head) is now removed by
pulling it straight toward you. This piece contains the
light emitting and light sensing opto-electronic elements.
There is an oval shaped o-ring on the face of the optical
assembly that is used to seal it to the measuring head.
There are also some gold contacts on the face. Avoid
touching the face of the optical assembly with your
fingers to prevent contamination of the contacts, the oring, the optical area, and the gas channel.
Inspecting / Cleaning the Mirror
The mirror requires occasional periodic cleaning to maintain high accuracy measurements.
The flush mounted mirror is easily accessible by removing the cover screw and optical mirror
assembly. Look at the mirror with the naked eye or with a magnifying glass. If signs of
contamination are present, or suspected of being present, use the following procedure to
clean the mirror.
1. Clean the mirror with a clean, wet cotton swab or
lint free tissue.
2. Follow with a damp cotton swab or tissue.
Mirror Cleaning 37
Page 42

Although a clean mirror is important to accurate measurements and sound measurement
practices, please take the following comments into consideration.
• Never attempt to polish the mirror. It is slightly roughe ned at the factory to allow for better
nucleation sites and thus better dew formation.
• If needed, the mirror may also be cleaned with methanol or alcohol. Always follow the
use of these cleaning chemicals with water to ensure they are completely rinsed from the
mirror surface.
Reassemble the Mirror Components
Reassemble the mirror components in the reverse order of disassembly.
1. Install the optical assembly, taking note
of guide pin.
2.
3. Replace the cover screw. Hand tighten
until snug. Do not over tighten.
Guide Pin
Exterior Cleaning
Front Panel
The 973 front panel is completely sealed and easily cleaned with liquid glass cleaner or other
mild cleaning chemicals moistened on a cloth. Clean the front panel periodically as needed.
Rear Fan Grills
The rear fan grills may require cleaning periodically to ensure adequate airflow within the
system. Use compressed air to blow dirt and dust from the grill and from inside the system.
38 Exterior Cleaning
 Loading...