

Page 1
D-M-LOG-HC2-V1_00
Document code Unit
Rotronic AG
Bassersdorf, Switzerland
LOG-HC2 Universal datalogger:
User manual
Document title
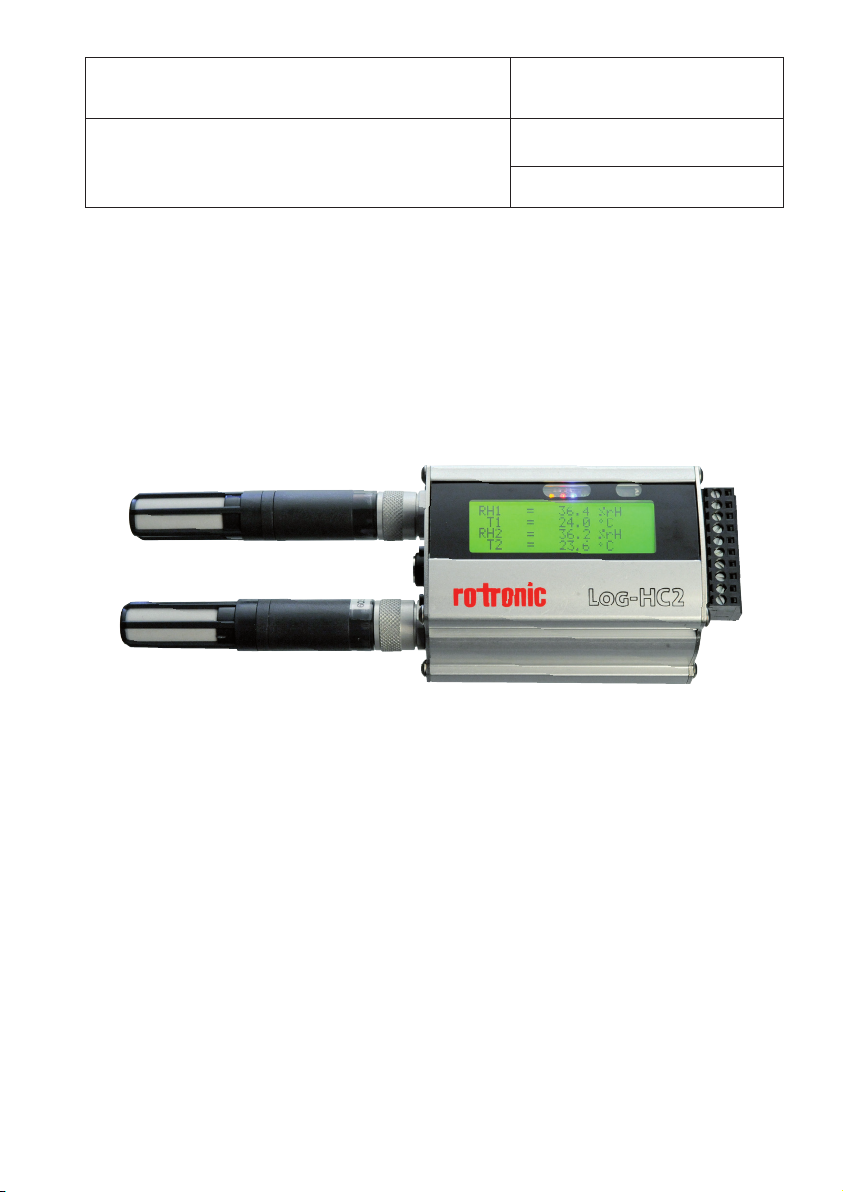
LOG-HC2
Universal datalogger
with LCD screen
User manual
User manual
Document Type
Page 1 of 60
© 2011; Rotronic AG EN-M-LOG-HC2-V1_00
Page 2

D-M-LOG-HC2-V1_00
Document code Unit
LOG-HC2 Universal datalogger:
User manual
Document title
Rotronic AG
Bassersdorf, Switzerland
Page 2 of 60
User manual
Document Type
Table of contents
Important notes regarding this user manual. . . . . . . . . . . . . . . . . . . . . . . . . . . 7
Safety instructions and warnings . . . . . . . . . . . . . . . . . . . . . . . . . . . . . . . . . . . .8
Operating Instructions . . . . . . . . . . . . . . . . . . . . . . . . . . . . . . . . . . . . . . . . . . . . . 9
Overview . . . . . . . . . . . . . . . . . . . . . . . . . . . . . . . . . . . . . . . . . . . . . . . . . . . . . . . 10
Controls. . . . . . . . . . . . . . . . . . . . . . . . . . . . . . . . . . . . . . . . . . . . . . . . . . . . . . . . 10
Turning the unit on / saving measurement parameters . . . . . . . . . . . . . . . . . 11
Logger display / Logger operation . . . . . . . . . . . . . . . . . . . . . . . . . . . . . . . . . . 12
Logger states . . . . . . . . . . . . . . . . . . . . . . . . . . . . . . . . . . . . . . . . . . . . . . . . . 12
Logger display and logger operation . . . . . . . . . . . . . . . . . . . . . . . . . . . . . . . .13
Indicator LED’s . . . . . . . . . . . . . . . . . . . . . . . . . . . . . . . . . . . . . . . . . . . . . . . . . . 14
Maintenance . . . . . . . . . . . . . . . . . . . . . . . . . . . . . . . . . . . . . . . . . . . . . . . . . . . .15
User checks. . . . . . . . . . . . . . . . . . . . . . . . . . . . . . . . . . . . . . . . . . . . . . . . . . . 15
Cleaning. . . . . . . . . . . . . . . . . . . . . . . . . . . . . . . . . . . . . . . . . . . . . . . . . . . . . . 15
Charging the battery. . . . . . . . . . . . . . . . . . . . . . . . . . . . . . . . . . . . . . . . . . . . . 15
Specifications . . . . . . . . . . . . . . . . . . . . . . . . . . . . . . . . . . . . . . . . . . . . . . . . . . . 16
Defining the axes . . . . . . . . . . . . . . . . . . . . . . . . . . . . . . . . . . . . . . . . . . . . . . . . 16
Terminal assignment (only LOG-HC2-RO1) . . . . . . . . . . . . . . . . . . . . . . . . . . .17
Operating, transport and storage conditions . . . . . . . . . . . . . . . . . . . . . . . . . 18
Troubleshooting . . . . . . . . . . . . . . . . . . . . . . . . . . . . . . . . . . . . . . . . . . . . . . . . . 18
Packing list . . . . . . . . . . . . . . . . . . . . . . . . . . . . . . . . . . . . . . . . . . . . . . . . . . . . . 19
Disposal. . . . . . . . . . . . . . . . . . . . . . . . . . . . . . . . . . . . . . . . . . . . . . . . . . . . . . . . 19
PC software . . . . . . . . . . . . . . . . . . . . . . . . . . . . . . . . . . . . . . . . . . . . . . . . . . . .20
Setup . . . . . . . . . . . . . . . . . . . . . . . . . . . . . . . . . . . . . . . . . . . . . . . . . . . . . . . . . . 28
Basic settings. . . . . . . . . . . . . . . . . . . . . . . . . . . . . . . . . . . . . . . . . . . . . . . . . . 29
Prediction . . . . . . . . . . . . . . . . . . . . . . . . . . . . . . . . . . . . . . . . . . . . . . . . . . 30
Reducing the volume of data . . . . . . . . . . . . . . . . . . . . . . . . . . . . . . . . . . .31
Conditional recording of measurement parameters (limits). . . . . . . . . . . . . . 31
Setting the alarm limit . . . . . . . . . . . . . . . . . . . . . . . . . . . . . . . . . . . . . . . . . 31
LED behaviour . . . . . . . . . . . . . . . . . . . . . . . . . . . . . . . . . . . . . . . . . . . . . . 32
Transferring basic settings to several loggers . . . . . . . . . . . . . . . . . . . . . . .32
User settings . . . . . . . . . . . . . . . . . . . . . . . . . . . . . . . . . . . . . . . . . . . . . . . . . . 33
Adjusting the channel properties . . . . . . . . . . . . . . . . . . . . . . . . . . . . . . . . . 34
Change basic parameter. . . . . . . . . . . . . . . . . . . . . . . . . . . . . . . . . . . . . . . 36
Calibrating the sensors . . . . . . . . . . . . . . . . . . . . . . . . . . . . . . . . . . . . . . .37
Changing the display parameter . . . . . . . . . . . . . . . . . . . . . . . . . . . . . . . . . 38
Defining the logger display . . . . . . . . . . . . . . . . . . . . . . . . . . . . . . . . . . . . . 39
© 2011; Rotronic AG EN-M-LOG-HC2-V1_00
Page 3

D-M-LOG-HC2-V1_00
Document code Unit
LOG-HC2 Universal datalogger:
User manual
Document title
Rotronic AG
Bassersdorf, Switzerland
Page 3 of 60
User manual
Document Type
Formatting the memory . . . . . . . . . . . . . . . . . . . . . . . . . . . . . . . . . . . . . . . . . . 40
Reader . . . . . . . . . . . . . . . . . . . . . . . . . . . . . . . . . . . . . . . . . . . . . . . . . . . . . . . . . 41
Viewer . . . . . . . . . . . . . . . . . . . . . . . . . . . . . . . . . . . . . . . . . . . . . . . . . . . . . . . . . 42
Online. . . . . . . . . . . . . . . . . . . . . . . . . . . . . . . . . . . . . . . . . . . . . . . . . . . . . . . . . . 48
Utility programs . . . . . . . . . . . . . . . . . . . . . . . . . . . . . . . . . . . . . . . . . . . . . . . . . 50
CSV . . . . . . . . . . . . . . . . . . . . . . . . . . . . . . . . . . . . . . . . . . . . . . . . . . . . . . . . . . . 51
Cutter. . . . . . . . . . . . . . . . . . . . . . . . . . . . . . . . . . . . . . . . . . . . . . . . . . . . . . . . . . 52
Calc . . . . . . . . . . . . . . . . . . . . . . . . . . . . . . . . . . . . . . . . . . . . . . . . . . . . . . . . . . . 53
Concat . . . . . . . . . . . . . . . . . . . . . . . . . . . . . . . . . . . . . . . . . . . . . . . . . . . . . . . . . 56
Additional software for PCs. . . . . . . . . . . . . . . . . . . . . . . . . . . . . . . . . . . . . . . .58
FreeMat . . . . . . . . . . . . . . . . . . . . . . . . . . . . . . . . . . . . . . . . . . . . . . . . . . . . . . . 59
© 2011; Rotronic AG EN-M-LOG-HC2-V1_00
Page 4

D-M-LOG-HC2-V1_00
Document code Unit
Rotronic AG
Bassersdorf, Switzerland
LOG-HC2 Universal datalogger:
User manual
Document title
Page 4 of 60
Document releasesw
Doc. Release Date Notes
_00 28.11.2011 Original release
User manual
Document Type
© 2011; Rotronic AG EN-M-LOG-HC2-V1_00
Page 5

User manual
Page 6

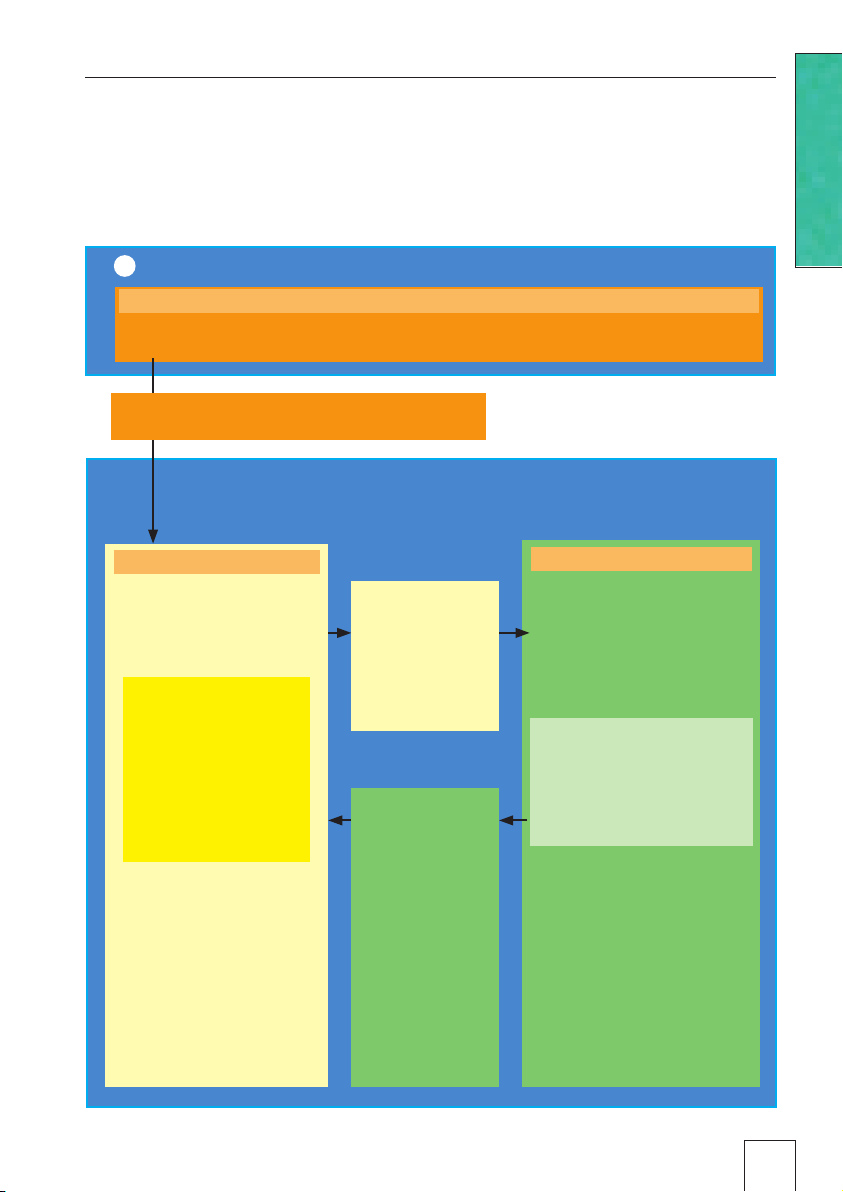
PC software
Operating instructions
Instructions
Utility programs
Setup
Reader
Viewer
Online
Setup
ReaderViewerOnline
Additional software for PCs
Page 7
Important notes regarding this user manual
CAUTION
WARNING
In this manual notes of particular importance are presented as follows:
Indicates that equipment may suffer damage or that there is a risk of injury to the operator or user should the instructions not be
followed correctly.
Indicates that equipment may suffer damage or that data loss may occur should the
instructions not be followed correctly.
Conventions
Instructions
Term / Symbol Description Example
Logger In this manual the term "logger"
is used to mean both "LOGHC2-RO1" and "LOG- HC2-P1".
Commands, programs,
menu items, functions,
field names
->
Commands, programs, menu
items, functions, field names are
shown in bold.
See page -> 5
• Reference to further
information
• Further information
Record
Setup
Reader
ViewerOnline
7
Page 8
Safety instructions and warnings
WARNING
CAUTION
• Read the operating instructions carefully before using the logger or the logger
software. This will protect you personally and avoid damage to the unit.
• The logger is a unit for recording and displaying measurement parameters
and may not be used for safety-related applications.
• Before using the logger check the unit itself and all cables for visible signs of
damage and never operate a damaged logger. A damaged logger can endanger operator safety! Should the logger not function perfectly or appear to be
damaged, send it to Rotronic for repair.
• Ensure that no fluids enter the logger's casing. Fluids cause corrosion
damage and short-circuits inside the logger.
• The logger must never be opened or modified. The manufacturer cannot be
held liable for damage resulting from use other than that for which the unit is
intended, or from improper operation of the unit.
• Never use a logger with a leaking battery. Should a battery leak be detected ensure that the electrolyte does not come into contact with the skin, the
eyes or the mouth. Should this occur, thoroughly rinse the affected area
with water for at least 15 minutes. Consult a doctor. Do not breathe in any
vapours emitted. Immediately clean the electrolyte from the logger using a
soft cloth and dispose of the cloth subsequently.
Instructions
Setup
Reader
ViewerOnline
• Ensure the proper disposal of an obsolete logger and USB connection cable
->17.
8
Page 9
Operating Instructions
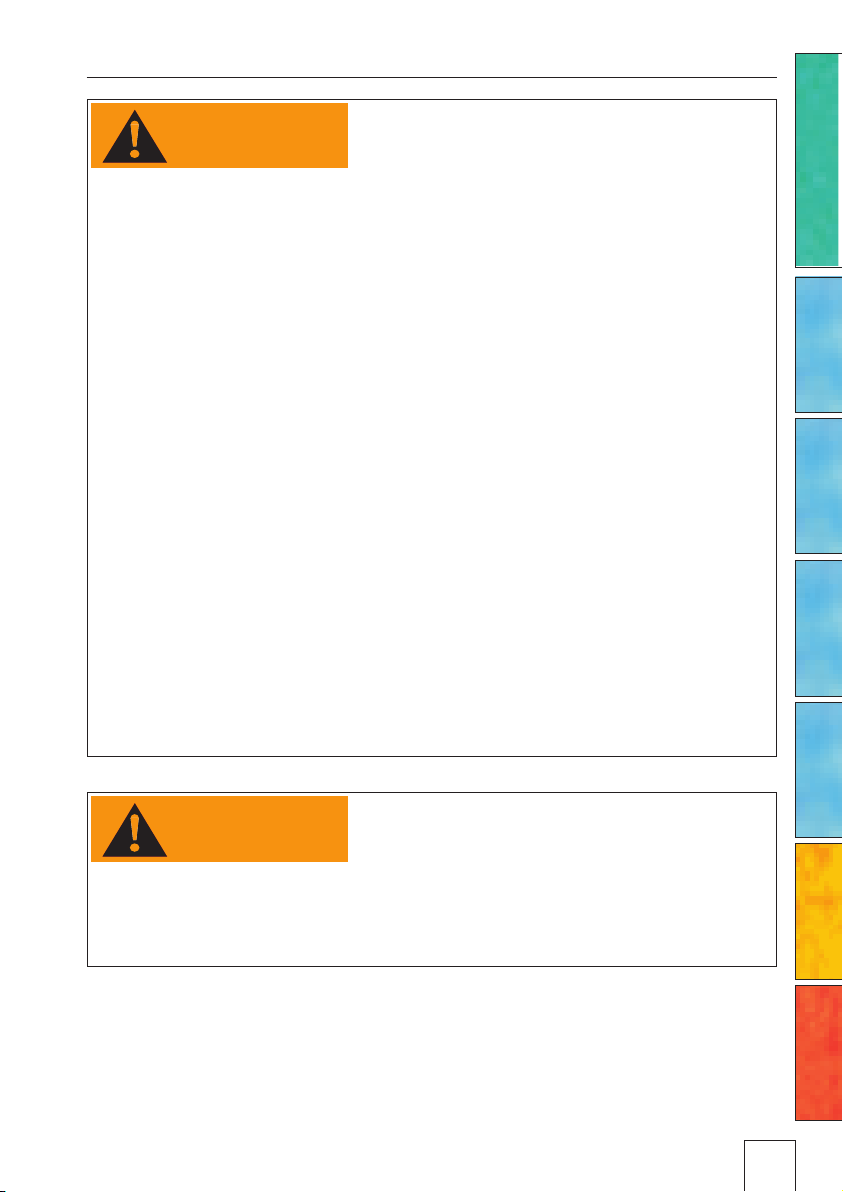
LOG-HC2-RO1
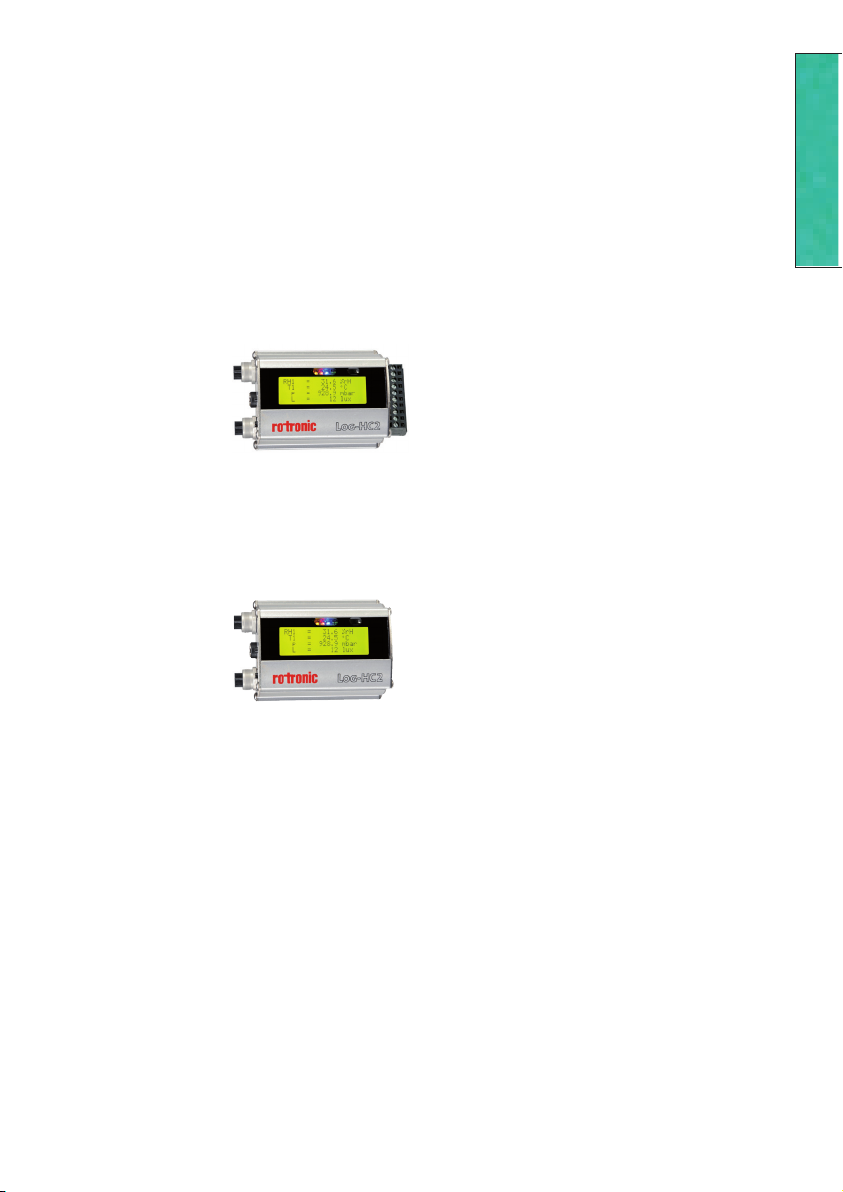
LOG-HC2-P1
Instructions
Page 10
Overview
The logger is a miniaturised universal datalogger for measuring and recording different physical measurement parameters.
For further information, see data sheets.
The Logger PC program enables users to customise the way in which the logger measures and records data according to their requirements. The integrated
clock (RTC) allows data from as many loggers as required to be synchronised and
merged into a single data record.
LOG-HC2-RO1
Instructions
LOG-HC2-P1
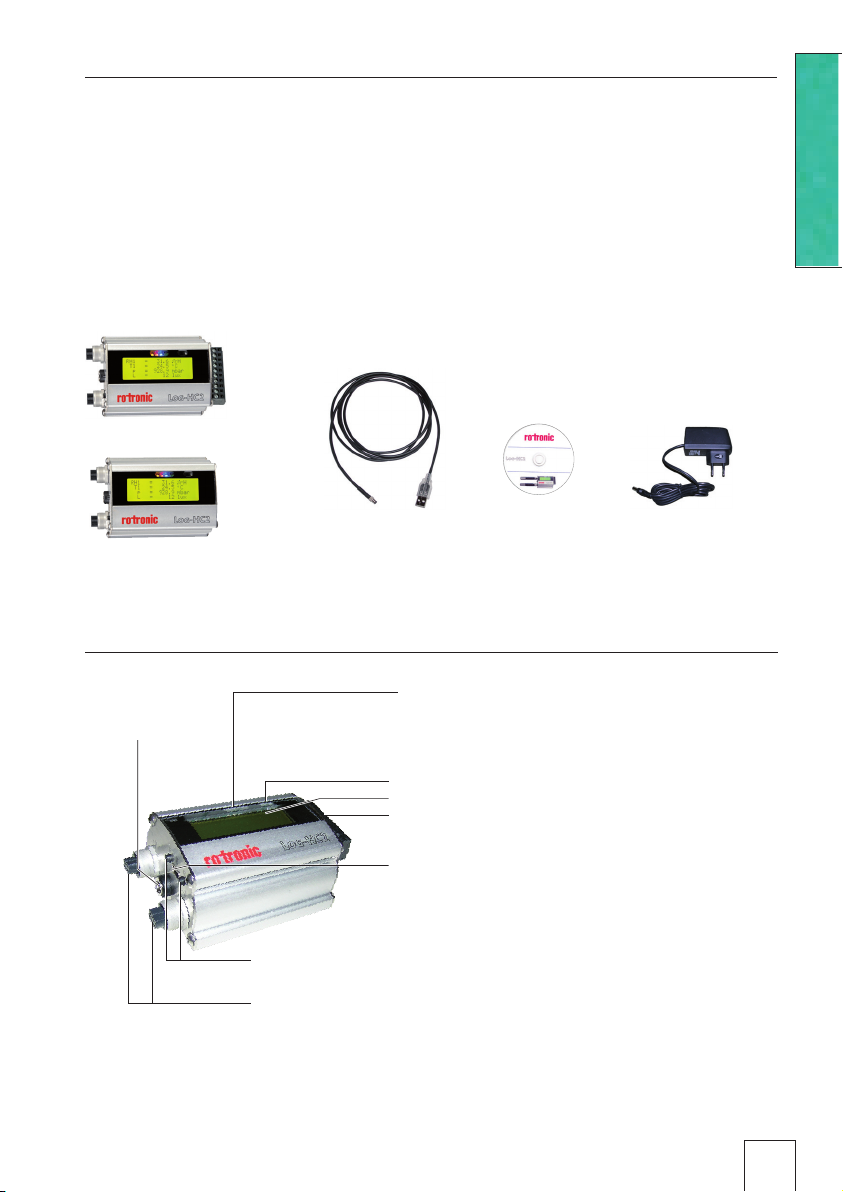
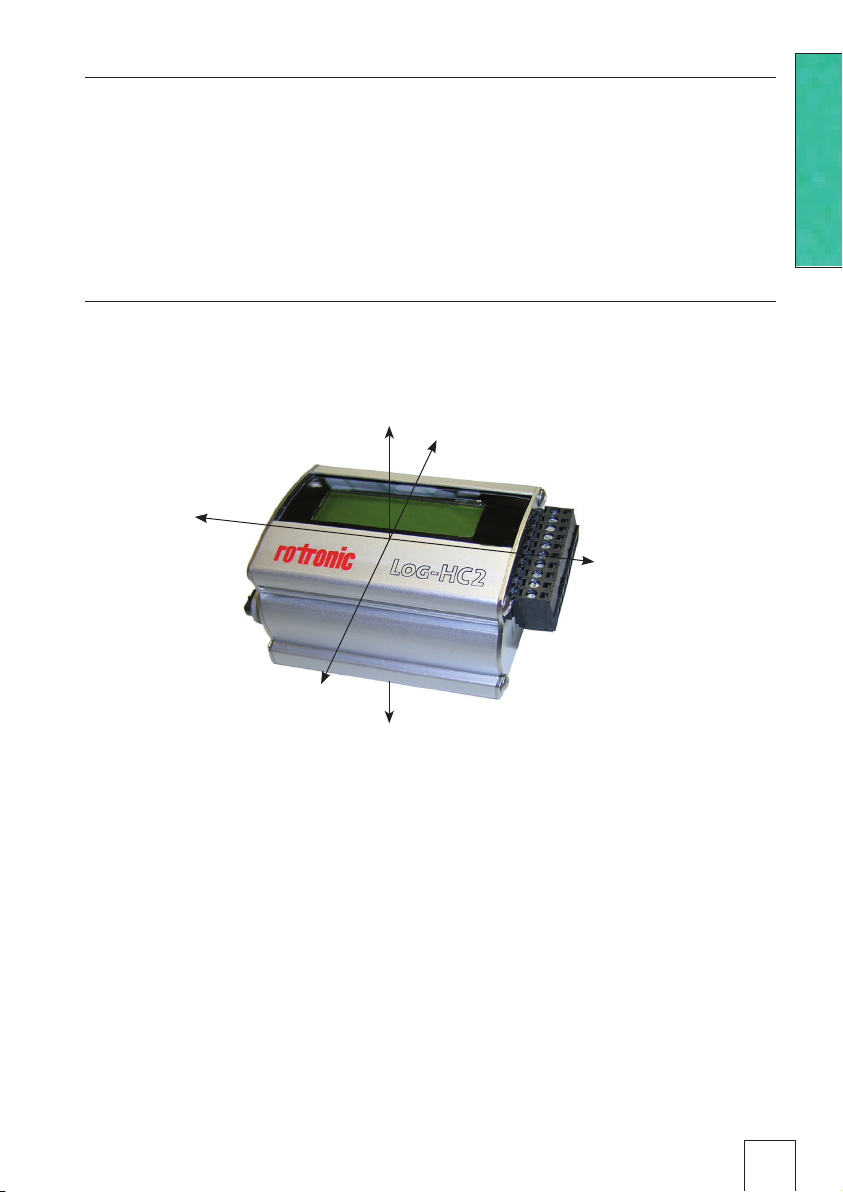
Controls
Power supply
connector
USB connection cable
Indicator LED’s
Blue:
Red: Alarm indicator ->31
Yellow:
Light sensor*
Display
Analogue connections*, see page 17 for terminal
assignment
USB PC-Interface
Push button T1 / T2
Connections for external Rotronic sensors
*LOG-HC2-RO1 only
CD with LOG
software
Record indicator ->32
Battery charge indicator ->14
Mains adapter
10
Page 11

Turning the unit on / saving measurement parameters
The storage properties of the logger are determined using the Setup program*.
Control of measurement parameter storage can be either time activated, value
activated or by pushing the push button.
See also chapter „Logger display / Logger operation“ on page 12.
*Setup is an LOG PC program (see below).
Instructions
11
Page 12
Logger display / Logger operation
When the logger is turned off 1 the display cannot be activated using the T1 or
T2 keys. The display and keys are activated by connecting the logger to a USB
port or charger 2. The display is operated using keys T1 and T2 (see the diagram "Display and operation").
Logger states
Display not available
1
Off (Factory defaults)
(No data recording, display not available)
2
Exit Off: Connect logger to USB port or
charger
Display available
(See next page for operation)
Instructions
Idle state
In the idle state the device is waiting for startup information from the
PC (setup).
The standard display
appears that was selected under Setup
> General. This may
show a single channel or a multiple display of 4 measurement parameters.
The display turns off
automatically. It can be
switched on by means
of T1 or T2.
Exit idle state
PC setup
Entry of start
info
Exit record
mode
Recording has
been stopped
from the PC or
the recording
period has terminated or the
memory is full
(ring memory
deactivated).
Record mode
Data is recording or the
device is waiting for startup (immediate start, programmed start time, start
on key press, external
start signal)
Recording mode is not
exited upon ‘stop on key
press’* (menu 0, T2).
(*Only possible if activated in setup)
12
Page 13
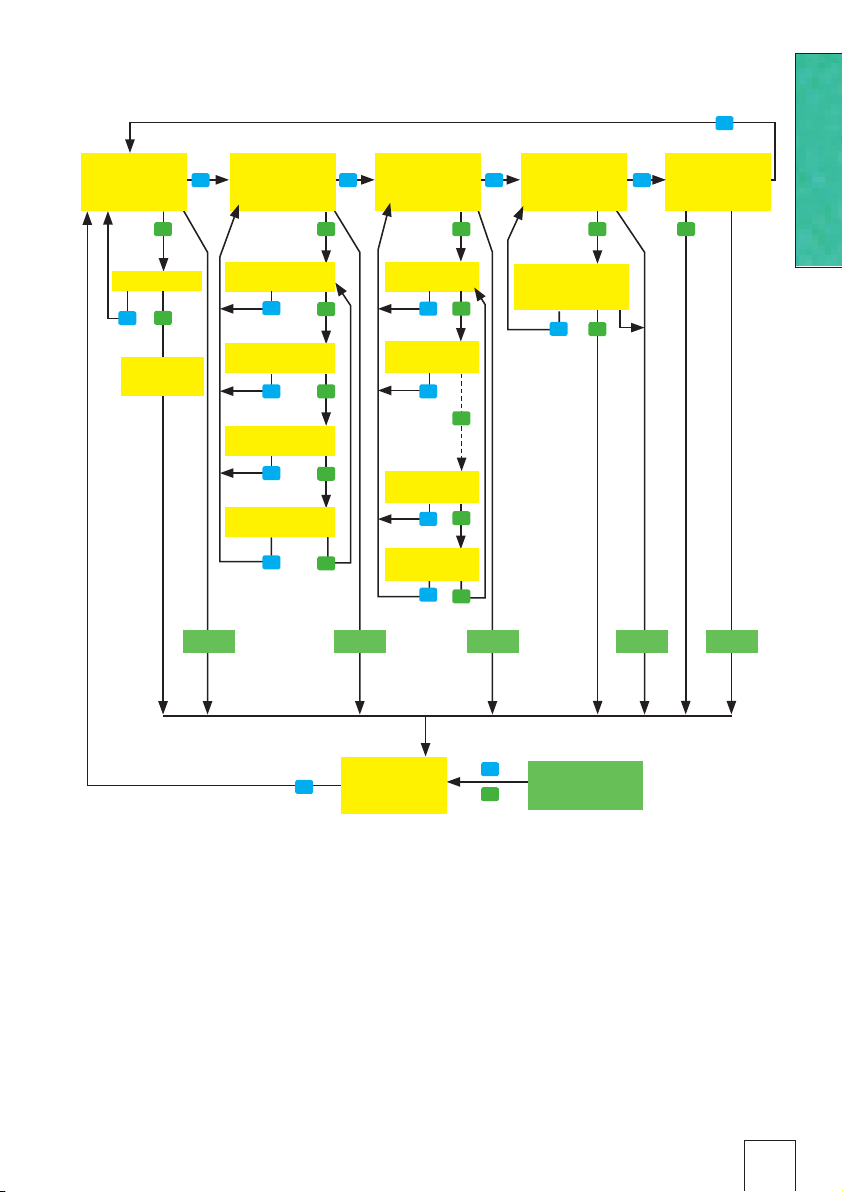
Logger display and logger operation
T1
Menu 0
Record control
State: on/stop by
KEY
T2 T2
Record stop?
T2
T1
Recording is
stopped.
T2
T2
T2
T2
Timeout
Menu 2
Select channel..
Channel
indication 0
T1
Channel
indication 1
T1
Channel
indication 13
T1
Channel
indication 14
T1
T2
T2
T2
T2
T2
Menu 1
*
Select predefined
T1 T1 T1 T1
groups..
Group indication 1
T1
Group indication 2
T1
Group indication 3
T1
Group indication 4
T1
Menu 3
show info..
T2
Logger name,
model, version, serial number
T1
T2
Timeout TimeoutTimeoutTimeout
Menu 4
Show last selected view..
T2
Instructions
Last group
*
indication or
T1
channel indication
For defining group indication and channel indication see „Defining the logger
*
T1
T2
Display turned off
through timeout
display“ on page 39.
13
Page 14
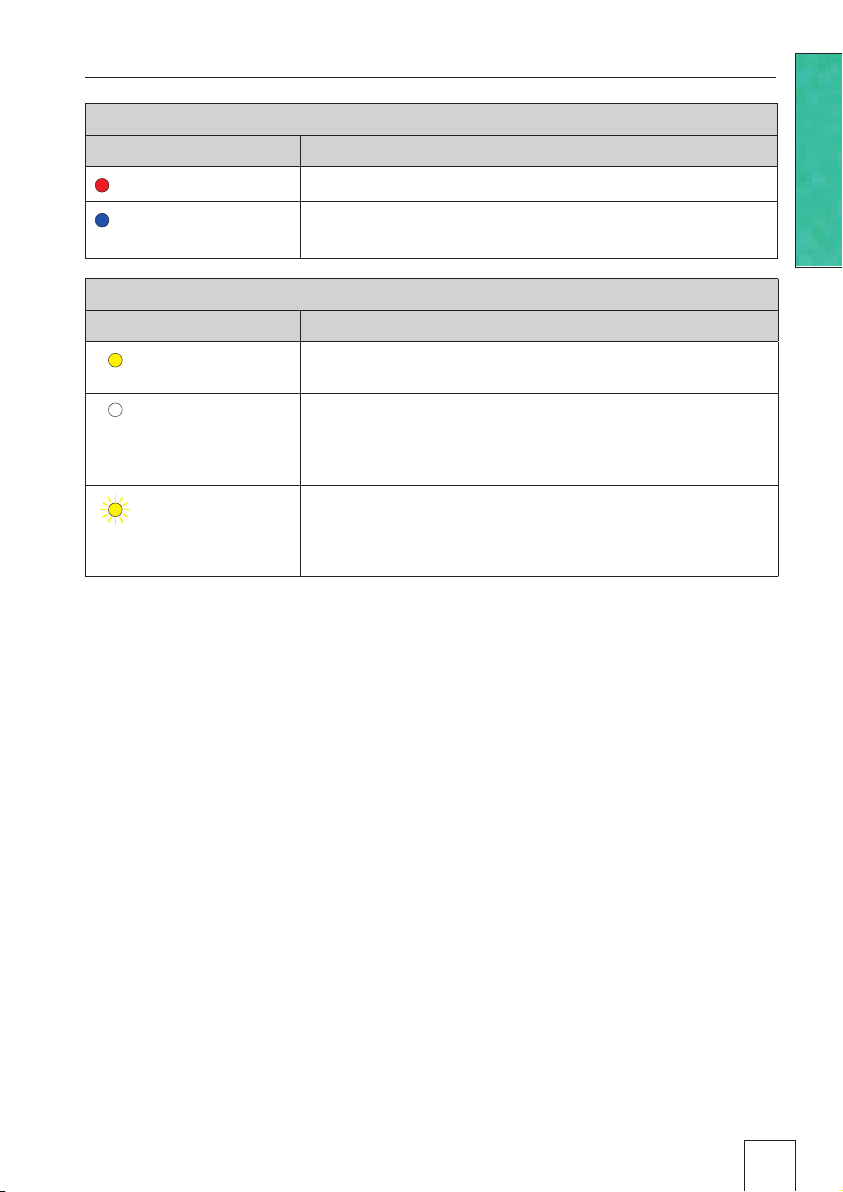
Indicator LED’s
Information displayed
LED Meaning
Red Alarm limit reached
Blue Define the behaviour of the blue LED via Setup > Ba-
sic settings. See the section Setup, LED behaviour.
Meaning of the yellow lamp during charging
LED Meaning
yellow
continuously
yellow off
yellow flashes
Charging in progress
• Fully charged
• No connection to PC
• PC turned off
• Power supply not connected
Fully charged
The battery is recharged for a short time, e.g. during
an online measurement or data recording
Instructions
14
Page 15
Maintenance
CAUTION
User checks
• Check the logger before each use.
• Before using the logger check for visible signs of damage.
• Check the functions of the logger.
• Never use a logger that is damaged or not functioning perfectly. Never use
damaged accessories.
• Ensure that the battery is sufficiently charged for the required period of use.
Should the logger not function perfectly or should damage become apparent
send the unit to Rotronic for repair. Repairs may only be carried out by Rotronic
or an authorised dealer. Defective or damaged components may only be replaced
with manufacturer’s original parts.
Cleaning
• Ensure that no fluids enter the logger's casing.
Fluids will cause corrosion damage and short
circuits.
• Never use corrosive or abrasive cleaning agents or polishes.
• Cleaning agents containing additives such as alcohol will cause the case to
become matt and/or brittle.
• Clean the logger when necessary.
• Always disconnect the logger from the PC or the power supply before cleaning.
• Use a cleaning agent suitable for plastic or a cloth dampened with water and
soap.
Instructions
Charging the battery
Before first use: The battery is not fully charged on delivery and should
be charged before using the logger for the first time.
Charge the logger
• At least every six months
Procedure:
• Connect the logger to the power supply or via USB connection cable to the PC
or an external USB mains adapter.
Notes:
• The meaning of the yellow warning light during charging is described on page 14.
• Charging an exhausted battery takes approx. 5 hours using the mains adapter.
Charging is also possible via the USB port with the backlight turned off (approx. 28 hours).
• Recorded data is non-volatile and remains in the unit’s memory even when the
battery is exhausted.
• Never store the logger with a discharged battery. See ->18 (storage conditions).
• Before each use
15
Page 16
Specifications
See data sheets
Defining the axes
-Y
Instructions
-Z
-X
Y
X
-Z
16
Page 17
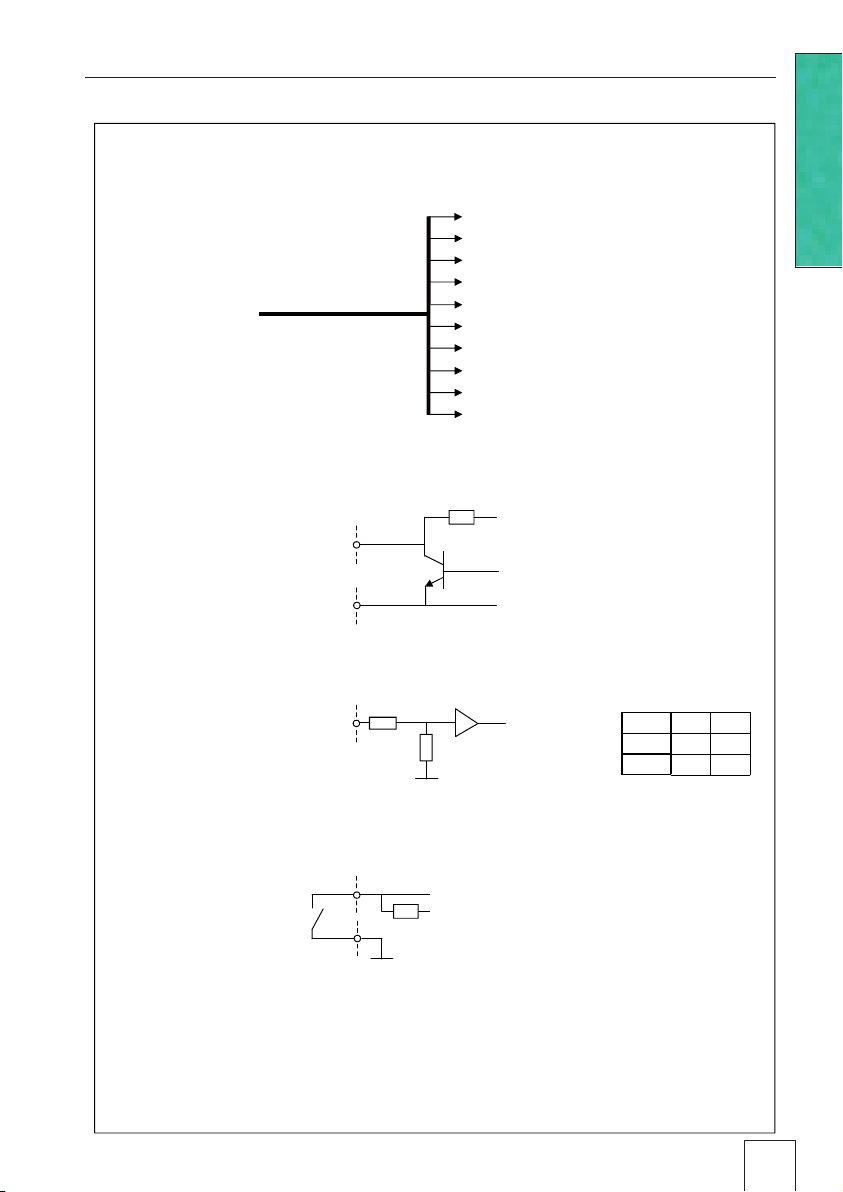
Terminal assignment (only LOG-HC2-RO1)
PinAssignment:
GND
(switched,max.50mA)
3VDC
ALARM
REC
10pol.
(ON/OFF)
NC
AGND
AIN4:0..5V
AIN3:0..5V
AIN2:4..20mA
AIN1:4..20mA
Instructions
Alarm:
AlarmOutput
V
CEO
=5V
I
CMAX
AIN1...AIN4:
I
RECStart/Stop:
•AlarmOutput
1M
=100mA
GND
•
•
BCR142
•AnalogInput(internal)
R1
•
R2
MAX
AIN
=40mA
GND
•RecordStart/Stop
REC
•
+3V
1M
GND
+3V
GND
P(0...2.5V)
0 120
510k 470k
GND:
•Ground
17
Page 18

Operating, transport and storage conditions
• Protect the logger from excessive exposure to the sun and other sources of
heat. Avoid heavy impacts.
• Do not place heavy objects on top of the logger.
• Only store the logger in a dry, dust-free environment.
Operating conditions:
Temperature: -20°C to +65 °C
Pressure: 500 mbar to 2500 mbar absolute
Humidity: 10-95 % relative humidity, non-condensing
Avoid contact with water and humidity
Optimal storage and transportation conditions:
Temperature: 5 °C bis 45 °C (ideal storage condition for the battery)
Humidity: 10-95 % relative humidity, non-condensing
Avoid contact with water and humidity
Battery charge level: Never store the logger with a discharged battery.
The ideal charge level is a 2/3 charge
(see „Charging the battery“ on page 15)
Troubleshooting
Instructions
Problem Possible cause Possible solution
The temperature
increases continuously when
the logger is
connected to the
mains adapter or
the PC
The LOG PC
programs do not
recognise the
connected logger
The battery warms up
because charging commences.
The COM port driver is not
installed correctly.
When making temperature
measurements disconnect
the logger from mains adapter
or the PC.
Observe the manufacturer’s
installation instructions.
http://www.ftdichip.com/
18
Page 19

Packing list
• LOG-HC2-RO1, or
LOG-HC2-P1
• CD including:
• User manual
• Logger PC software
• Logger USB connection cable
• Mains adapter
Disposal
Take the logger and the mains adapter to a municipal waste disposal
centre or return it to Rotronic. The logger and the mains adapter must
not be disposed of in normal domestic waste.
Options: • Additional sensors
• Adapter for connecting
further sensors
Instructions
19
Page 20

PC software
Setup
SetupReaderViewerOnline
Reader
Viewer
Online
20
Page 21

PC software
Overview
External processing of logger data is carried out using the LOG PC software programs Setup, Reader, Viewer and Online. The LOG PC programs can be used
for all logger types.
The Setup enables the properties of the logger to be customised to user’s requirements.
The Reader allows the user to transfer measurement parameters to a Windows
PC. The Viewer is used to display data graphically or in table form or to export it
as a text file (*.csv).
With the help of Online (and the built-in display) users can view measurement
parameters and curves “live” on a PC.
Installation of the LOG PC software on a PC
For installation you will require Windows administrator rights.
Insert the CD containing the LOG PC software into the computer’s CD-ROM
drive. The installation procedure starts automatically*.
Completing installation
SetupReaderViewerOnline
Initial installation: Select
Install USB driver.
Click on Finish.
The logger symbol appears on screen.
If the PC is not set up for automatic installation, proceed as follows:
1. Click Start > Run
2. Click Find > Look in: (set to CD drive).
3. Select the file Install_LOG_HC2.exe and Open.
4. In the Run dialog box click OK.
5. The installation process will begin.
6. Follow the instructions and select: Run LOG-program now.
7. During the initial installation select Install USB driver. See above, Complet-
ing installation.
* The program "Inno Setup" for installing the logger PC programs was written by Jordan Russell (www.jrsoftware.org, copyright Jordan
Russell).
21
Page 22

Starting the logger Software
The logger software may be started by clicking on the logger symbol or via Start
> Programs > LOG_HC2 X.XX.XX (folder) > LOG_HC2 X.XX.XX. The logger
program window appears:
Version number of CD
Logger program window
SetupReaderViewerOnline
Version numbers of LOG
PC programs
22
Page 23

Uninstalling
The software is uninstalled via the computer’s operating system (Programs >
LOG_HC2 > Uninstall LOG_HC2).
System Requirements
• Windows 2000 / XP / Vista / 7
• USB port
SetupReaderViewerOnline
23
Page 24

Preparation
Before using the LOG PC programs Setup, Reader and Online, the following
preparations must be completed:
• Use the USB connecting cable to connect the logger with the PC.
• Before first use: Using logger symbol open the logger program window, select
Settings > Logger.
• Select the rule by which the Setup, Reader and Online programs are to search
for the required
logger*.
• Enter the path to the
directory.
• See following page for
template
•
Select the required
language.
SetupReaderViewerOnline
Logger program window
* One of the following windows will appear if a connection to a logger cannot be
established using the current rule.
During Setup:
Starts the
Loader dialog
(see screenshot left)
Loader Dialog
Starts the
Setup demo mode
24
Page 25

Template
The template, selected via Setting > LOG-HC2 (*.mse), defines which
sensors the Reader reads out as standard or are displayed in Online. The
template sets the colour of the trace, the positioning of its axis (left, right)
and gives the sensors a name (“HUM, T1” is required to be displayed as
“outside temperature”, for example). Templates can be produced on the
basis of examples contained in Viewer (->34).
Example
The temperature curves are required to be blue and oriented on the right
hand axis in all display modes.
1. Assign right hand axis and blue colour shades to temperature in Viewer.
2. Save as template (Bluetemp.mse).
3. Generate new templates for Reader and Online: Select logger program
window, Settings LOG-HC2 > Template , enter new name and path
(Temperature.mse), then Open.
4. Open the still blank template (Temperature.mse) using .
5. Import the template that was created in Viewer (Bluetemp.mse).
Select the required sensors (tick in checkbox) in the Module column and
confirm with Accept.
6. Edit the displayed list: First select a sensor in the Module column and
then choose Edit.
7. Change the name “HUM, T1” to “Outside temperature”, and Accept.
8. Continue to make the necessary adjustments and confirm them with Accept.
SetupReaderViewerOnline
25
Page 26

Pre-adjustments - Reader
Enter the required options for the Reader** via Settings > Reader.
**Data records are transferred from the logger to a PC using the Reader.
Once data transfer is complete the Reader creates a data record (*.rog) from each
logged record, names it and saves it in the corresponding directory. The bottommost option allows the user to alter the suggested filename and location
Transfer only the most
recent data record logged
with the logger to the PC.
User defines which
records are transferred to
the PC
User defines which
records are transferred
to the PC, their filenames
Once the data has been transferred to the PC various options are available to the user. Details may be
found in the text window.
and their location.
.
SetupReaderViewerOnline
Example: "Automatically generate a text file"
In addition to the logger format file, the Reader creates a text file (*.csv), which can be opened with programs such as e.g. Microsoft Word or Excel.
26
Page 27

Completion of the preparatory measures
Upon exiting Settings the PC saves the settings that were last entered.
Once entry of the settings is complete, select Programs and start the required
program.
Note: The following instructions assume that the preparations for using the
LOG PC programs have been completed.
SetupReaderViewerOnline
27
Page 28

Setup
Setup is used to select the sensors for which the logger is required to save
measurement parameters, to enter the measurement frequency and to set the
behaviour of the logger’s memory. In Setup you can also define the start time for
data recording and stop data recording.
The following subjects are dealt with in the Setup chapter:
Basic settings . . . . . . . . . . . . . . . . . . . . . . . . . . . . . . . . .29
Prediction . . . . . . . . . . . . . . . . . . . . . . . . . . . . . . . . . . 30
Reducing the volume of data . . . . . . . . . . . . . . . . . . . . . . . . . 31
Conditional recording of measurement parameters (limits) . . . . . . . . . . . 31
Setting the alarm limit . . . . . . . . . . . . . . . . . . . . . . . . . . . . . 31
LED behaviour . . . . . . . . . . . . . . . . . . . . . . . . . . . . . . . . 32
Transferring basic settings to several loggers . . . . . . . . . . . . . . . . . 42
User settings . . . . . . . . . . . . . . . . . . . . . . . . . . . . . . . . . 33
Adjusting the channel properties. . . . . . . . . . . . . . . . . . . . . . . . 34
Changing the basic unit . . . . . . . . . . . . . . . . . . . . . . . . . . . . 36
Calibrating the sensors . . . . . . . . . . . . . . . . . . . . . . . . . . . . 37
Changing the display parameter . . . . . . . . . . . . . . . . . . . . . . . . 38
Defining the logger display. . . . . . . . . . . . . . . . . . . . . . . . . . . 39
Formatting the memory . . . . . . . . . . . . . . . . . . . . . . . . . . . . 39
Setup
28
Page 29

Basic settings
This page describes the most commonly used settings – the Basic settings. Information on further settings can be found on the following pages.
• Complete the preparations (->33).
• Start Setup (Setup symbol
• Edit the Basic settings according to your requirements.
• Transfer the new configuration and the start conditions to the logger with Write
basic settings.
).
Name of the
logger ->33
->40
->39
->33
->33
->30
Overwrite oldest
measurement parameters when memory
is full
Transfers the configuration, the start conditions and the PC time to the logger
Blue LED flashes during data recording ( ->32)
Currently no data is being recorded (inactive)
(active: data recording in progress)
Stop data recording
Exit setup
Read the information
and measurement
parameters
Freezes the selected
options in the Basic
settings and Limits
tabs so that these
can be transferred to
other logger units ->32
Enter the main
storage rates
Conditional recording of measurement
parameters ->31
Setup
Define the sensors from which the logger should record data, together with the storage
rate.
The 50Hz (3200 Hz) function is only available for the acceleration sensors (ACC).
50Hz (3200 Hz)
Acceleration values are measured at 3,200 Hz and saved at a frequency of approx.
50 Hz following digital filtration. Energy consumption increases for 50Hz (3200 Hz)
measurements.
29
Page 30

Prediction
The maximum amount of data that can be recorded is influenced by:
• The number of sensors
• The measurement rate
• The battery capacity
With each click on Prediction (Basic settings) the program generates an approximate prediction using the selected basic settings.
Note: The Limit settings are not taken into account here.
Setup
30
Page 31

Reducing the volume of data
When making extensive recordings it is recommended that all sensors that are
not required be “turned off”. This prevents unrequired measurement parameters
from being saved.
• Under Basic settings turn "off" all unused sensor groups (see next section).
• To turn off individual sensors within one sensor group proceed as follows: Set
the cut-in condition such that they are not activated during the planned recording (e.g. > 200 °C) (see next section).
Conditional recording of measurement parameters (limits)
If for example, you require only to record temperatures above 5°C and less than
20 °C, use the following procedure:
• Activate Limits active 1 and the cor-
responding temperature sensor 2.
• The Limits tab opens.
• 1
• 2
• In the columns Record Limit, Limit
L1 and Limit L2 enter the cut-in condi-
tions for the sensor.
• Return to the Basic settings with
and click Write basic set-
The logger only records measurement
parameters from the sensor T(p) above
5°C and less than 20 °C
tings. The limits will only be transferred to the logger with Write basic
settings
.
Setting the alarm limit
The logger can display an alarm if a certain measurement parameter drops below
or exceeds a certain value. When the alarm condition occurs the red LED flashes
once per second until the data recording is stopped.
Inputting the alarm condition is carried out in the same way as setting the cut-in
conditions (see section Conditional recording of measurement parameters).
Setup
In the Alarm Limit, Limit L1 and Limit L2 columns enter the
alarm conditions.
The alarm limits can be displayed in Viewer.
31
Page 32

LED behaviour
The behaviour of the blue LED is defined via Setup > Basic settings.
Situation Behaviour of the blue LED
Start time has
been transferred
to the logger
Data recording in
progress
First
5 seconds
Waiting for
start
First
5 seconds
After 5 seconds
Double-flashes 5 times at 1-second
intervals
Double-flashes at 5-second intervals
Flashes 5 times at 1-second intervals
LED flashes with
main storage rate t1
LED does not flash
Transferring basic settings to several loggers
Use the following procedure to transfer basic settings that have already been
input to several loggers:
• Start Setup.
• Connect the logger to the PC. (If several loggers are connected to the PC,
select the COM port of the required logger)
• Enter the required values in the Basic settings tab.
• Set the cut-in and alarm conditions in the Limits tab.
• Use Write basic settings to transfer the basic settings to the logger.
• Disconnect the logger just configured and connect the next logger to the PC.
• Select the new logger via COM Port.
• Caution! If you wish to import the information and measurement parameters
of the newly connected logger, you must first select the option Freeze ->24,
so that the settings in the Basic settings and Limits tabs are not overwritten!
• Transfer the basic settings to the logger with Write basic settings.
Setup
Note:
• It is also possible to configure differently equipped loggers with a single basic
setting. One logger may for example, not be equipped with any analogue inputs. The setup program then simply does not write any data to the settings
saved in the logger for those analogue inputs.
• If a connected logger deviates too greatly from the first logger, this message
appears:
32
Page 33

User settings
CAUTION
To display the configuration saved in the logger select the Basic settings tab 1
and click Read basic settings. The settings are now displayed in the User set-
tings tab.
The changes made in the User settings tab
and its sub-menus will only be transferred to
the logger after clicking Write user settings 2.
Check the checkbox in order to enter/change the date, notes
and „Calibrating the sensors“ on page 34.
1
Enter the name
of the logger
Only for analogue inputs: Input of a "warm-up time" to warmup analogue sensors before making measurements. A start-up
time of zero = the sensor voltage is always ON.
Enter date of last calibration
and comment
2
Setup
33
Page 34

Adjusting the channel properties
Select the tab Channels 3 in order to change the name, unit, display format and
calibration of a channel.
The following options are available (see following schematic):
• Change basic parameter (see page 36)
Changing the factory settings (name, unit, display format).
This information is used for calibration purposes among others.
• Calibration (see page 37)
Correction of the displayed values.
• Change display parameter (see page 38)
Change the factory settings or the information entered under Change basic
parameter.
This information is used for the logger and PC display.
Setup
34
Page 35

Measurement value X
User information
Basic unit
Use
calibration
User information
Display unit
Factory settings
Name
Unit
Display format
Yb=X
Yb
Ys=Yb
Ys
User information
Name
Unit
Display format
Yb = Gb * X + Ob
Ys=Gs * Yb+Gs
User information
Name
Unit
Display format
X Measurement value
Gb Base amplification
Ob Zero reference point
Yb Reference value
Yb Reference value
Px Calibration points (P1 and P2)
Gs = (P2
Os = P1
Ys Calibrated value
Ys Calibrated value
Ga Display gain
Oa Zero point display
Ya Display value
Setpoint value
Setpoint value
-P1
Setpoint value
– Gs * P1
)/(P2
Actual value
Actual value
-P1
Actual value
Setup
)
Ya=Ys
Logger and PC display
Ya = Ga * Ys + Oa
Ya
35
Page 36

Change basic parameter
Change basic parameter is used to adapt the factory settings (name, unit,
display format) to your requirements. These details are used among others, for
calibration purposes.
Select the desired channel (e.g. analogue input A2) and then click Change ba-
sic parameter. Enter your adjustments 5 (e.g. Mbar instead of Volt).
To enter the conversion factor (e.g. Volts to Mbar) the following options are available:
• Enter the amplification and the zero point
• Using the calculation assistant 6 enter the values for points P1 and P2 7.
The program will then calculate the amplification and the zero point.
Activate Apply user information by checking the checkbox 4 and then click
OK. Transfer the changes to the logger by clicking Write user settings.
Note: Should you wish to use a different display unit to that used for calibration,
then please use the function Change display parameter.
3
Max. 4 characters
5
6
4
Setup
Changes have been made to this channel.
6
7
Resetting channel properties to the factory settings:
Uncheck checkbox 4 (Apply user information) and transfer the changes to the
logger by clicking Write user settings.
36
Page 37

Calibrating the sensors
CAUTION
The sensors and analogue inputs can be calibrated using a 2 point calibration
process. Those sensors marked “not changeable” in the Calibration column
cannot be calibrated.
Calibration and adjustment of the HygroClip2
probe is carried out using the ROTRONIC
HW4 software.
Select User settings and at the bottom click on Read user settings. Under
General > Calibration, check the Change values checkbox.
Choose Channel 3.
Select a channel and then click Calibration.
3
Setup
4
Calibration can be carried out a) manually or b) by measuring the signal and subsequently entering the target value.
a) Manual calibration
First enter the actual value and then the associated target value for points P1 and
P2. Activate the completed calibration by checking the checkbox 4. Confirm
your selection with OK.
b) Calibration using the measurement function
Apply the desired signal for point P1 and click Measure. The
measured actual value is displayed. Enter the associated target value for point P1. Repeat this procedure for P2. Activate
the completed calibration by checking the checkbox 4. Confirm your selection with OK.
Activate the completed calibration by checking the checkbox 4 and then click
OK. If necessary, calibrate further sensors (channels). With Write user settings
2
you can simultaneously transfer all of the completed calibrations to the logger.
37
Page 38

Resetting the calibration to the factory defaults
CAUTION
Uncheck the checkbox 4 (Apply calibration) and transfer the change to the logger
by clicking Write user settings.
If, following calibration, changes are made via
„Changing the basic parameter“ on page 36, the
performed calibration will be lost.
Changing the display parameter
Changes that are made with Change display parameter have no effect on the
settings made with Change basic parameter. This allows you to always perform
calibration using the units selected with Change basic parameter.
Select the desired channel (e.g. analogue input A2) and then click Change dis-
play parameter. Enter your adjustments 5 (e.g. psi instead of Mbar).
To enter the conversion factor (e.g. Mbar to psi) the following options are available:
• Enter the amplification and the zero point
• Using the calculation assistant 6 enter the values for points P1 and P2 7. The
program will then calculate the amplification and the zero point.
Activate “Apply user information” by checking the checkbox 4 and then click
OK. Transfer the changes to the logger by clicking Write user settings.
3
Max. 4 characters
Setup
5
6
4
6
7
Resetting the properties to the factory settings:
Uncheck checkbox 4 (Apply user information) and transfer the changes to the
logger by clicking Write user settings 2.
38
Page 39

Defining the logger display
Select Display and then click Read user settings at the bottom.
Define what the device should display following a power-on-reset under Start-
up. A group of measurement parameters 1 defined under
a single channel 2 can be displayed.
1
2
Transfer the desired settings to the device by clicking Write user settings.
Defining the group indication
Define which channels should be displayed together in one group indication under Display > Group indication. 4 group indications each with 4 channels can
be shown. For each channel, the measurement parameter, limit L1 or limit L2 can
be displayed.
Transfer the desired settings to the
device by clicking Write user set-
tings.
Group indication
, or
Setup
Open group indication on the device: See „Logger display and logger operation“ on page 13.
39
Page 40

Formatting the memory
CAUTION
Formtting will erase all measurement parameters saved in the logger!
Formatting is used to delete all the measurement parameters saved in the logger.
Formatting the logger is carried out from the Format memory tab.
Deletes all measurement parameters saved in the logger
Setup
40
Page 41

CAUTION
Reader
With the Reader users can selectively transfer data records logged with the logger to a PC. It does however free measurement records that have already been
read out for overwriting.
Transferring data records to a PC
• Complete the preparations (->24) aus.
• Start the Reader (Reader symbol)
Once data transfer has started (Start) all data
records saved on the logger can be overwritten if required, even if the circular buffer is deac-
• Begin data transfer with Start.
The options selected under Settings > Reader (->26) influence the next steps:
• Under the option Read selected records the following data entry dialog box
appears
:
tivated in Setup.
• Select the data records
to be transferred.
• Click OK.
• Data records having
the same start time are
written together to
one file.
• With the option Read selected records and save with “Save dialog as”
under Settings > Reader (->26) the filenames and locations suggested by
Reader can be overwritten.
Once the data records have been saved on the PC a list of files created appears.
Filenames allocated by the
Reader
Serial number
Date (YYMMDD)
Recording start time (HHMMSS)
Copy number
Reader
41
Page 42

Viewer
Records created in Reader or Online may be viewed and edited on a PC with
the Viewer. The measurement parameters may be displayed either in graph or
in table form.
• Start the Viewer (Viewer symbol).
• Open a record (*.rog) via File > Open.
Switch between graphs,
tables and configuration
Text created
using the text
mode
Gridlines
Lock axis
Cross-hair on / off
Autoscaling
Undo last change
Text mode
Shift between
text tool and
graphics mode
Traces on / off
X and Y values:
Cross-hair 1, cross-hair 2
(The displayed Y value always
relates to the left-hand axis)
Viewer
X-axis = time
(seconds)
Difference between
cross-hairs 1 & 2
Alarm limit
Alarm limit exceedDisplayed as a table
42
Page 43

Move traces With right mouse button held down
Enlarge section Mark the required section with the left mouse
button held down. See also Graphics > Fixed
axis).
Cross-hair Move axis: Grab the axis, move with left mouse button.
Move centre:
Grab the centre, move with left mouse button
.
43
Viewer
Page 44

File
The File menu is used to Open records ,
Reopen (
and to
With Save time window as the measurement parameters of the displayed time window are saved.
(The measurement parameters of the hidden traces
are also saved). For further options see Cutter ->44.
Templates help to standardise the displays, enable
easy repetition when reselecting the same sensors
and the same printing format.
Creating templates: Adjust the display with Graph
and Configuration
template
Apply a template to the displayed record:
File > Use template then select the required tem-
plate (*mse).
Export Time window as text exports the measurement parameters of the displayed time window
in *.csv format. The measurement parameters of the
hidden traces are also exported.
The trace can be exported in Bitmap (*. bmp) or as
JPEG forma.
Open again
Save
the currently open record as displayed .
(file type: *.mse
) the most recently used records
and save via
).
File
>
to
Save as
Print preview
Print
Exit closes the Viewer. If changes were made the
user is asked whether the changes should be saved.
Note:
The program saves changes as “Template”
(*.mse). The template is automatically saved in the
record’s directory. Template (*.mse) and record
(*.rog) have the same name.
Upon Opening a record the Viewer searches for
the template associated with that record. Should the
template not be located in the same directory as the
record then the standard format will be opened.
opens a preview of the trace/graph.
opens the print dialog box
.
44
Viewer
Page 45

View, Graph ,Table, Configuration
Graph
Gridlines can be shown for each axis (bottom, left,
right).
Fixed axis simplifies the amount of detail shown
within a time window or range of values.
• Select the required section with the left mouse button held down. The section is displayed enlarged.
• For closer viewing, lock the time window ( ) or
range of values to the left or right axis ( / ). Several axes can be locked.
• With the left mouse button held down, select the
required detail. The enlargement is displayed without altering the time segment or range of values of
the locked axes.
A further click releases the lock.
Auto scal clears all locked axes.
Calculation functions
Using the two Crosshairs values can be measured
on the X and Y traces. X and Y differences can be
evaluated with the second cross-hair. The Y values
displayed are always associated with the left axis.
With Detailed legend traces can be turned on and
off in the list of sensors.
If available: Display of the alarm limits (see ->42).
The complete record is displayed by selecting
Auto scale .
Auto scale clears all locked axes.
Undo undoes the last enlargement. As long as
the Configuration dialog
allows the last changes made to the displayed configuration screen to be undone.
is not quitted,
Undo
45
Viewer
Page 46

Table (Tabelle)
Go to time allows users to jump straight to the
line in the table with the required time.
Jump to beginning of graph causes the table
to jump to the first measurement values displayed
in the graph.
Configuration
As long as the Configuration
ted, Undo
configuration screen to be undone.
Text mode
Using the text mode you can insert texts at any
place.
By clicking on
the text mode.
Insert text:
Delete text:
Text field with X and Y values:
allows the last changes made to the
you can activate and deactivate
• Click on . The viewer displays
"Text 1" in the upper left corner.
• Drag the text field to the desired
place.
• Double click on the text field and
enter your required text.
• Click with the right mouse button
on the text field and select Delete.
• place the crosshairs on your chosen position to adoddopt the X and
Y values you would like to use in
the text field.
• Create a text field (see above) and
click on the right mouse button.
Select the desired representation.
dialog is not quit-
Viewer
46
Page 47

Configuration allows the display method of the
CAUTION
measurement parameters to be set with the help of
the configuration screens.
Entering title and footer information is achieved via
Configuration > General.
The associated sensor name, assignment to the left
or right axis, the colour, line weight and style can be
set for each curve.
Axis > inactive allows the graph curve to be shown
or hidden as required.
Depiction of the curves using dots (Configuration
> Curves > Dot: Yes) requires more computing
power, possibly leading to problems.
Using Configuration >Time axis X, the time axis
can be annotated, the time segment to be displayed
can be set, and the Increment for the lettering and
ruled lines, together with the Format for numbers
can be entered.
Automatic axis annotation with an Increment of 0
(zero).
Viewer
Undo the last changes
Quit Configuration
The number Format for the displayed X and Y values
is entered via Configuration > Crosshairs.
The displayed Y value always relates to the left axis.
As long as Configuration is not quitted, users can
undo the last changes made to the displayed configuration screen with .
Quit Configuration via Graph or Table .
Upon quitting, the Viewer saves the configuration.
47
Page 48

Online
Online allows users to view the progress of the measurement parameters
directly on-screen.
Procedure:
• Complete the preparations ->24.
•
Start
Online
• Online displays the measurement parameters graphically and numerically.
(Online symbol)
• Select the sensors that you wish
to display.
• Click on Next.
Stop: A display
Continue: Continue
The logger is currently recording measurement parameters
Turn trace on and off
Online
Exits Online
48
Page 49

For recurring applications in Online, Templates assist in se-
lecting the required sensors and adjusting the display to suit.
Create template: Start Online and select the required sensors. Select Next>. Use
Graph > Properties,
Graph > Grid line,
Graph > Legend and
Graph > Start time to change the way the curve is displayed. Via Back return to the trace display. Interrupt recording with Stop. Save the template via File > Save as template.
Apply the template to Online: File > Use template and
select the required template (*mse).
Once recording has finished by clicking on Stop, the recorded
measurement parameters can be saved via File > Save as.
In the menu View the measurement parameters can be displayed as curves with Graph or as numerical values with
Monitor. The font displayed on the monitor can be selected
via the menu Monitor > Font.
Once recording has finished by clicking on Stop, the recorded measurement parameters and traces can be deleted via
Clear.
The display can be changed via Properties, Gridlines, Leg-
end and Start time.
Select the frequency (Refresh rate) with which measurement
parameters are to be transferred to the PC.
In the Time window you can define the time period repre-
sented by the time axis.
49
Online
Page 50

Utility programs
CSV
Cutter
Calc
Concat
50
Page 51

CSV
The CSV utility creates text files (*.csv or * .fmc) from data records (*.rog). Files
saved in *.csv format can subsequently be opened and edited in a word processing or spreadsheet application. The *.fmc files can be transferred to FreeMat1.
Creating a text file
•
Start CSV (Logger Program window > Tools > Csv).
• Select the output format (standard *.csv or
FreeMat * .fmc)
• Click on Start and select the data record from which
the text file is to be created. CSV creates a text file
(*.csv) and saves it in the corresponding directory
for that data record. Text file (*.csv) and data record
(*.rog) have the same name.
Note on creating *.csv files: If a template (*.mse) exists for the data record in question, CSV takes this into account when creating the text file (*.csv).
Example: Opening a CSV text file with Excel
• Start the word-processing or spreadsheet program.
• Open the CSV file via File > Open.
• Under File type, select Text Files
Data source
Logger name
Serial number
Logger revision number
Record start time: Date (Day.Month.Year) and
time of day (Hr:Min:Sec)
Modules for which measurement parameters
were recorded
Module version
Time difference between PC time and
Logger time (readout time)
Channel and sensor names
Unit for the displayed value
Excel file with measured data
Measured parameters (data) in
chronological order
Time of recording
CSV
1
Further details on FreeMat can be found in the section FreeMat ->59
51
Page 52

Cutter
The Cutter utility creates an extract from a data record (*.rog).
Creating an extract from a data record
•
Start the Cutter utility (Logger Program window > Tool > Cutter)
• Click on Start and select the data record from
which the extract is to be created.
• Select the time window. Beginning / End.
• Select the sensors for which the measurement
parameters are to be exported to a new data
record and click Next.
• Enter the name and directory for the new data
record. Click on Save.
52
Cutter
Page 53

Calc
With Calc curves from existing data records can be linked to each other using formulae and saved as a data record (*.rog). The saved data record can be displayed
and processed in the form of curves or as a table using the Viewer. Templates
simplify the processing of recurring tasks.
Note: For making comprehensive calculations the FreeMat math software is
available (see ->59).
Computing new curves
• Start Calc (Logger program window > Tools > Calc)
Open
data
record
1
1
Open data record (data origin)
Click on Open to open the data record for which you want to perform calcu-
lations on the curve. It is possible to open multiple data records.
2
Create new curves
From imported curves select the curve that you want to use for your calcu-
lations and drag it – with the left mouse button pressed – to the right into the
field for curves to be plotted. Repeat this procedure until the required number
of curves is shown on the right.
3
Enter formula
Enter the formula to be used for the new curve into the Formula column. For
this, use the capital letters on the left.
Example for a subtraction: A-C
You will find a list of the available functions at the end of this section or under
Help.
Modify the text for the new curves
The entries in the columns Module, Sensor and Unit can be modified.
2
Enter formulaNumber field
34
Calc
53
Page 54

Modify the order of the new curves
With the left mouse button pressed, drag the number field to
the required position.
Delete new curves
Click inside the number field of the curve to be deleted and
then press the delete key. Via Template > Delete plotted
curve, all new curves can be simultaneously deleted.
4
Note: The curves are saved as data records (*.mrs). The saved
Only curves that overlap timewise can be calculated.
Calculating and saving the new curves
Click on Calculate then enter the name and set the directory
for the new data record. Click on Save.
measurement parameters can be displayed and processed
as a curve or as a table by the Viewer. Intermediate values are
interpolated.
Creating a template for processing recurring tasks
Once you have created the new curves you can save their labels and formulae as a template (*.mse). (Template > Write).
Creating new curves using templates
Open the required template (*mse) via Template > Read.
This will automatically generate a number of new curves.
Multiple templates may be used to generate new curves.
Each template generates a number of new curves.
54
Calc
Page 55

Operators / brackets
+ - * / ^ Plus, minus, multiply, divide, to the power of
( ) Open brackets, close brackets
Functions
sqrt(no.) Square root of the number
ln(no.) Natural logarithm of the number (base e)
exp(no.) Raise basis e to the power of the number
abs(no.) Absolute value of the number
sgn(no.) no. >0: sgn = 1
no. =0: sgn = 0
no. <0: sgn = -1
cos(no.) Cosine of the number
sin(no.) Sine of the number
tan(no.) Tangent of the number
ctg(no.) Cotangent of the number
arcsin(no.) Arc sine of the number
arccos(no.) Arc cosine of the number
arctan(no.) Arc tangent of the number
arcctan(no.) Arc cotangent of the number
sinh(no.) Hyperbolic sine of the number
cosh(no.) Hyperbolic cosine of the number
tangh(no.) Hyperbolic tangent of the number
ctgh(no.) Hyperbolic cotangent of the number
toggleSgn(no.) Changes every second measurement parameter sign
(plus/minus)
Further functions on request
Calc
55
Page 56

Concat
With Concat (concatenate = to link) data records can be linked together and
saved as a new data record (*.rog). The newly created data record can be displayed and processed in the form of curves or as a table using the Viewer.
p
Data
record 1
Data
record 2
p
New Data record 3
TimeT2 T1 T0
Before concatenation After concatenation
TimeT2 T1 T0
Concatenating several data records
Start Concat (Logger program window > Tools > Concat)
List of data records to be concatenated
1
2
3
Number window
1
Select the data records to be concatenated
Status window
Open the data records that you want to concatenate by clicking Add. Note
that the list must be in chronological order such that the oldest data record
is at the top. Therefore either open the oldest data record first or sort the list
afterwards (see below).
Sort the list alphabetically
Use Sort to sort the list alphabetically.
Data records that have automatically generated filenames (->41) can be
chronologically sorted using Sort.
Modify the data record order
With the left mouse button pressed, drag the number field to the required
position.
Concat
56
Page 57

Delete all data records from the list
start times
New data record 3
p
TimeT2 T1 T0
Straight line created by Concat
Use Delete all to remove all data records from the list.
Delete one data record from the list
Select the data record to be deleted and click Delete line.
2
Enter the name and directory for the new data record
Set the path to the directory using Browse and enter the filename, or use
the input window to do this.
3
Calculating the new data record
Start the calculation process with Start. Cancel the calculation with Stop.
Note:
• Concat creates a straight line between the last
data record of the first curve (T1) and the first data
record of the second curve (T2).
• If, for the data records to be concatenated, there
are curves that overlap timewise and these have
the same name (same module and sensor names
with the same units), the calculation will be aborted
and a corresponding message* will appear in the
p
p1 p1
TimeOverlapping
status window.
• If the module names, sensor names or units of the
p
Sensor p1 Sensor p2
p
Sensor p1 Sensor p2
curves to be concatenated
do not correspond Concat
will be unable to join the
curves and will create two
Different sensor
names
Time
New data record
Time
curves.**
• With Concat you can
p
p
superimpose curves with
different module or sensor
names.
names and
TimeDifferent sensor
TimeNew data record
* Remove overlap
Use the Cut utility to create an excerpt from a
data record that does not overlap timewise with
the next data record.
p
p1 p1
TimeRemove overlap
** Modify module names, sensor names and units
Use the Calc utility to match the module names, sensor names and units for
the curves.
Concat
57
Page 58

Additional software for PCs
FreeMat
58
Page 59

FreeMat
FreeMat is open source math software that can be installed from the logger CD
(ADDITIONAL\FREEMAT). FreeMat can be used to carry out a wide variety of
calculations.
How are data records transferred to FreeMat?
The Reader transfers the data recorded with the logger (records) to the PC. From
these data records (*.rog) CSV creates FreeMat files (*.fmc). Using the scripts
included these can be opened and edited in FreeMat.
More information on FreeMat can be found at
http://freemat.sourceforge.net/index.html.
The following FreeMat scripts can be found on the logger CD under ADDITIONAL\FREEMAT\MSCRIPTS:
plotmsr.m Imports *.fmc files into the FreeMat environment and
presents the data records graphically.
loadmsr.m Imports *.fmc files into the FreeMat environment.
59
FreeMat
Page 60

60
11.2012
LOG-HC2 Firmware V1.12
LOG-HC2 PC-Software V2.00
 Loading...