

Page 1
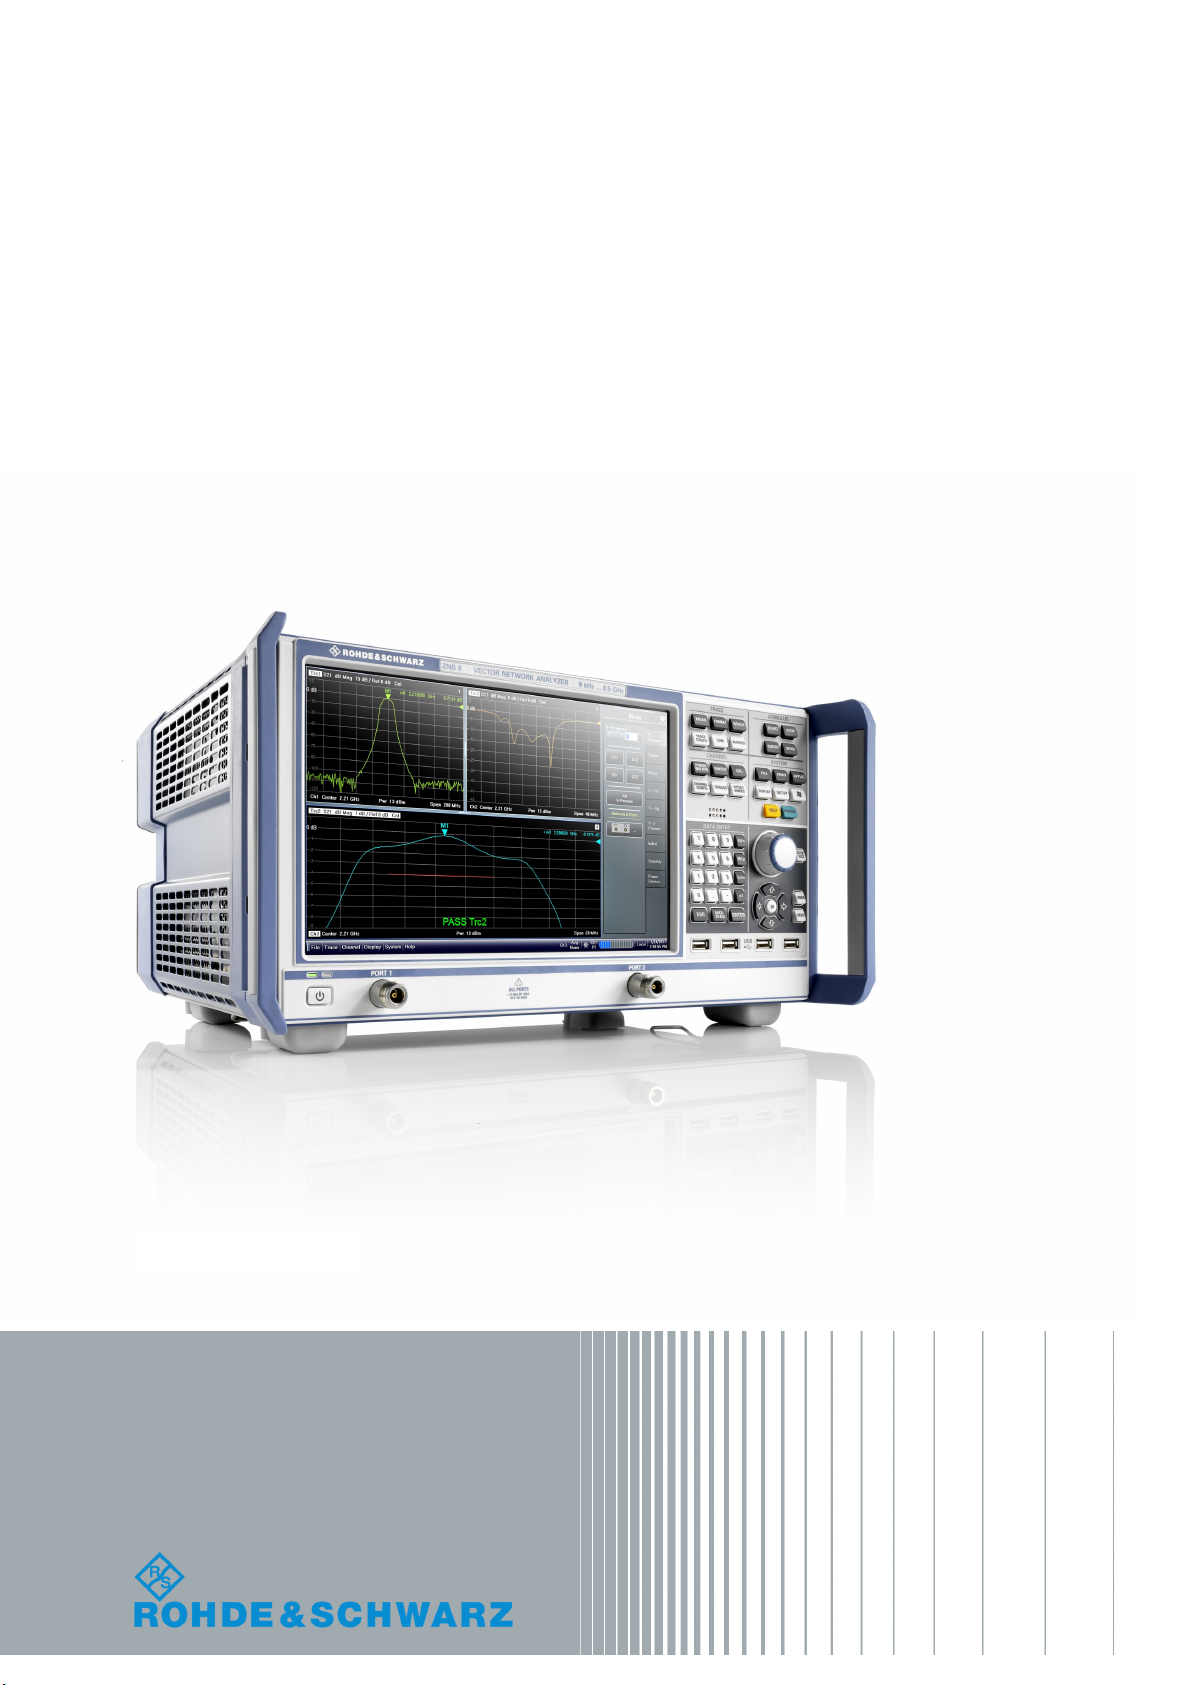
R&S® ZNB/ZNBT
Vector Network Analyzers
Getting Started
(=@0Ì2)
1316006202
Version 26
Getting Started
Page 2

This manual describes the following vector network analyzer types:
●
R&S® ZNB4, 9 kHz to 4.5 GHz, 2 test ports, order no. 1311.6010.22
●
R&S® ZNB4, 9 kHz to 4.5 GHz, 4 test ports, order no. 1311.6010.24
●
R&S® ZNB8, 9 kHz to 8.5 GHz, 2 test ports, order no. 1311.6010.42
●
R&S® ZNB8, 9 kHz to 8.5 GHz, 4 test ports, order no. 1311.6010.44
●
R&S® ZNB20, 100 kHz to 20 GHz, 2 test ports, order no. 1311.6010.62
●
R&S® ZNB20, 100 kHz to 20 GHz, 4 test ports, order no. 1311.6010.64
●
R&S® ZNB40, 10 MHz to 40 GHz, 2 test ports, order no. 1311.6010.72 (variant 72)
●
R&S® ZNB40, 100 kHz to 40 GHz, 2 test ports, order no. 1311.6010.82 (variant 82)
●
R&S® ZNB40, 100 kHz to 40 GHz, 4 test ports, order no. 1311.6010.84 (variant 84)
●
R&S® ZNBT8, 9 kHz to 8.5 GHz, 4 test ports (up to 24 ports optional), order no. 1318.7006.24
●
R&S® ZNBT20, 100 kHz to 20 GHz, 8 test ports (up to 24 ports optional), order no. 1332.9002.24
© 2018 Rohde & Schwarz GmbH & Co. KG
Mühldorfstr. 15, 81671 München, Germany
Phone: +49 89 41 29 - 0
Fax: +49 89 41 29 12 164
Email: [email protected]
Internet: www.rohde-schwarz.com
Subject to change – Data without tolerance limits is not binding.
R&S® is a registered trademark of Rohde & Schwarz GmbH & Co. KG.
Trade names are trademarks of the owners.
1316.0062.02 | Version 26 | R&S® ZNB/ZNBT
Throughout this guide R&S® is abbreviated as R&S.
Page 3
1
Safety Instructions
Risk of injury and instrument damage
The instrument must be used in an appropriate manner to prevent
electric shock, fire,
●
●
●
●
Keep the "Basic Safety Instructions" and the product documentation
Riesgo de lesiones y daños en el instrumento
El instrumento se debe usar de manera adecuada para p
descargas eléctricas, incendios, lesiones o daños materiales.
●
●
●
especificaciones técnicas pueden contener condiciones adicionales
●
Instrucciones de seguridad
Sicherheitshinweise
Consignes de sécurité
personal injury or instrument damage.
Do not open the instrument casing.
Read and observe the "Basic Sa fety Instructions" delivered as
printed brochure with the instrument.
Read and observe the safety instructions in the following sections.
Note that the data sheet may specify additional operating conditions.
in a safe place and pass them on to the subsequent users.
No abrir la carcasa del instrumento.
Lea y cumpla las "Instrucciones de seguridad elementales"
suministradas con el instrumento como folleto impreso.
Lea y cumpla las instrucciones de seguridad incluidas en las
siguientes secciones. Se debe tener en cuenta que las
para su uso.
Guarde bien las instrucciones de seguridad elementales, así como
la documentación del producto, y entréguelas a usuarios
posteriores.
revenir
1171.1307.42 - 05
Page 4
2
Gefahr von Verletzungen und Schäden am Gerät
Betreiben Sie das Gerät immer ordnungsgemäß, um elektrischen
Schlag, Brand, Verletzungen von Personen oder Geräteschäden zu
verhindern.
●
●
●
●
Risque de blessures et d'endommagement de l'appareil
L'ap
les électrocutions, incendies, dommages corporels et matériels.
●
●
●
suivantes. Il ne faut pas oublier que la fiche technique peut indiquer
●
Öffnen Sie das Gerätegehäuse nicht.
Lesen und beachten Sie die "Grundlegenden Sicherheitshinweise",
die als gedruckte Broschüre dem Gerät beiliegen.
Lesen und beachten Sie die Sicherheitshinweise in den folgenden
Abschnitten; möglicherweise enthält das Datenblatt weitere
Hinweise zu speziellen Betriebsbedingungen.
Bewahren Sie die "Grundlegenden Sicher h ei t s hinweise" und die
Produktdokumentation gut auf und geben Sie diese an weitere
Benutzer des Produkts weiter.
pareil doit être utilisé conformément aux prescriptions afin d'éviter
N'ouvrez pas le boîtier de l'appareil.
Lisez et respectez les "consignes de sécurité fondamentales"
fournies avec l’app ar eil sous forme de brochure imprimée.
Lisez et respectez les instructions de sécurité dans les sections
des conditions d’exploitation supplémentaires.
Gardez les consignes de sécurité fondamentales et la
documentation produit dans un lieu sûr et transmettez ces
documents aux autres utilisateurs.
1171.1307.42 - 05
Page 5

R&S® ZNB/ZNBT
1 Preface.................................................................................................... 7
1.1 For Your Safety..............................................................................................................7
1.2 Documentation Overview............................................................................................. 7
1.2.1 Getting Started Manual................................................................................................... 7
1.2.2 User Manual and Help.................................................................................................... 8
1.2.3 Service Manual............................................................................................................... 8
1.2.4 Instrument Security Procedures......................................................................................8
1.2.5 Basic Safety Instructions.................................................................................................8
1.2.6 Data Sheets and Brochures............................................................................................ 8
1.2.7 Release Notes and Open Source Acknowledgment (OSA)............................................ 9
1.2.8 Application Notes, Application Cards, White Papers, etc................................................9
Contents
Contents
1.3 Conventions Used in the Documentation...................................................................9
1.3.1 Typographical Conventions.............................................................................................9
1.3.2 Conventions for Procedure Descriptions.......................................................................10
1.3.3 Notes on Screenshots...................................................................................................10
2 Putting the Analyzer into Operation................................................... 11
2.1 Unpacking and Checking the Instrument................................................................. 11
2.2 Positioning the Instrument.........................................................................................12
2.3 Bench Top Operation..................................................................................................12
2.4 Operation in a 19" Rack..............................................................................................13
2.5 EMI Suppression......................................................................................................... 13
2.6 Connecting the Analyzer to the AC Supply.............................................................. 14
2.7 Starting the Analyzer and Shutting Down.................................................................14
2.8 Standby and Ready State........................................................................................... 15
2.9 Connecting External Accessories............................................................................. 16
2.9.1 Connecting a Monitor.................................................................................................... 16
2.9.2 Connecting a Keyboard.................................................................................................17
2.9.3 Connecting a Mouse..................................................................................................... 17
2.9.4 Connecting a Printer..................................................................................................... 17
2.9.5 Connecting a LAN Cable...............................................................................................18
2.9.6 Connecting a USB Cable for Remote Control...............................................................18
3Getting Started 1316.0062.02 ─ 26
Page 6

R&S® ZNB/ZNBT
2.10 Minimizing the VNA Application................................................................................ 18
2.11 Changing the Screen Resolution (R&S ZNBT).........................................................19
2.12 Remote Operation in a LAN....................................................................................... 20
2.12.1 Assigning an IP Address............................................................................................... 20
2.12.2 Remote Desktop Connection........................................................................................ 23
Contents
2.12.3
Windows® Firewall Settings...........................................................................................23
3 Instrument Tour.................................................................................... 25
3.1 Front Panel R&S ZNB................................................................................................. 25
3.1.1 Touchscreen.................................................................................................................. 26
3.1.2 Function Keys............................................................................................................... 26
3.1.3 Data Entry Keys............................................................................................................ 27
3.1.4 Rotary Knob.................................................................................................................. 28
3.1.5 Navigation Keys............................................................................................................ 28
3.1.6 Standby Key..................................................................................................................29
3.1.7 Front Panel Connectors................................................................................................ 29
3.2 Front Panel R&S ZNBT............................................................................................... 30
3.2.1 Test Ports...................................................................................................................... 31
3.2.2 Administrative Area....................................................................................................... 32
3.3 Rear Panel R&S ZNB...................................................................................................33
3.4 Rear Panel R&S ZNBT................................................................................................ 35
4 Operating the Instrument.................................................................... 38
4.1 Manual Operation .......................................................................................................38
4.2 Control Elements of the Application Window.......................................................... 43
4.2.1 Title Bar.........................................................................................................................44
4.2.2 Toolbar.......................................................................................................................... 44
4.2.3 Softtools........................................................................................................................ 45
4.2.4 Menu Bar.......................................................................................................................46
4.2.5 Menu Structure..............................................................................................................46
4.2.6 Hardkey Panel...............................................................................................................47
4.2.7 Status Bar..................................................................................................................... 48
4.3 Working with Dialogs..................................................................................................49
4.4 Handling Diagrams, Traces, and Markers.................................................................51
4.4.1 Adding New Traces and Diagrams................................................................................51
4Getting Started 1316.0062.02 ─ 26
Page 7

R&S® ZNB/ZNBT
4.4.2 Adding New Markers.....................................................................................................52
4.4.3 Deleting Display Elements............................................................................................ 53
4.4.4 Using Drag and Drop.................................................................................................... 54
4.5 Entering Data...............................................................................................................54
4.5.1 Using Front Panel Keys................................................................................................ 55
4.5.2 Using the Numeric Editor.............................................................................................. 56
4.5.3 Using the Analyzer's On-Screen Keyboard...................................................................56
Contents
4.5.4
4.6.1 Using the Graphical Zoom............................................................................................ 58
4.6.2 Setting the Sweep Range............................................................................................. 59
4.6.3 Reference Value and Position.......................................................................................60
4.6.4 Auto Scale.....................................................................................................................60
4.6.5 Circular Diagrams......................................................................................................... 61
4.6.6 Set by Marker................................................................................................................61
4.6.7 Enlarging a Diagram..................................................................................................... 62
Using the Windows® On-Screen Keyboard...................................................................57
4.6 Scaling Diagrams........................................................................................................ 58
5 Performing Measurements..................................................................64
5.1 Transmission S-Parameter Measurement.................................................................64
5.1.1 Connecting the Instrument for Transmission Measurements........................................65
5.1.2 Selecting the Sweep Range and Other Parameters..................................................... 66
5.1.3 Calibrating the Instrument............................................................................................. 67
5.1.4 Evaluating Data ............................................................................................................69
5.1.5 Saving and Printing Data ............................................................................................. 70
5.2 Reflection S-Parameter Measurement...................................................................... 71
6 Administrative Tasks........................................................................... 74
6.1 Windows Operating System.......................................................................................74
6.2 Firmware Update......................................................................................................... 75
7 Maintenance......................................................................................... 76
7.1 Cleaning....................................................................................................................... 76
7.2 Storing and Packing the Instrument......................................................................... 77
5Getting Started 1316.0062.02 ─ 26
Page 8

R&S® ZNB/ZNBT
7.3 Replacing Fuses..........................................................................................................77
8 Obtaining Technical Support.............................................................. 78
Contents
Index......................................................................................................79
6Getting Started 1316.0062.02 ─ 26
Page 9

R&S® ZNB/ZNBT
1 Preface
1.1 For Your Safety
Preface
Documentation Overview
This chapter provides safety-related information, an overview of the user documentation and the conventions used in the documentation.
The R&S ZNB/ZNBT is designated for the development, production and verification of
electronic components and devices in industrial and laboratory environments. Use the
R&S ZNB/ZNBT only for its designated purpose. Observe the operating conditions and
performance limits stated in the data sheet.
The product documentation helps you to use the R&S ZNB/ZNBT safely and efficiently.
Keep the product documentation in a safe place and pass it on to the subsequent
users.
Safety information is part of the product documentation. It warns you about the potential dangers and gives instructions how to prevent personal injury or damage caused
by dangerous situations. Safety information is provided as follows:
●
In the "Basic Safety Instructions", safety issues are grouped according to subjects.
For example, one subject is electrical safety. The "Basic Safety Instructions" are
delivered with the R&S ZNB/ZNBT in different languages in print.
●
Throughout the documentation, safety instructions are provided when you need to
take care during setup or operation. Always read the safety instructions carefully.
Make sure to comply fully with them. Do not take risks and do not underestimate
the potential danger of small details such as a damaged power cable.
1.2 Documentation Overview
This section provides an overview of the R&S ZNB/ZNBT user documentation. Unless
specified otherwise, you find the documents on the R&S ZNB/ZNBT product page at:
●
https://www.rohde-schwarz.com/manual/ZNB
●
https://www.rohde-schwarz.com/manual/ZNBT
1.2.1 Getting Started Manual
Introduces the R&S ZNB/ZNBT and describes how to set up and start working with the
product. Includes basic operations, typical measurement examples, and general information, e.g. safety instructions, etc.
A printed version is delivered with the instrument. A PDF version is available for download on the Internet.
7Getting Started 1316.0062.02 ─ 26
Page 10

R&S® ZNB/ZNBT
1.2.2 User Manual and Help
1.2.3 Service Manual
Preface
Documentation Overview
The user manual contains the description of all instrument modes and functions. It also
provides an introduction to remote control, a complete description of the remote control
commands with programming examples, and information on maintenance, instrument
interfaces and error messages. Includes the contents of the getting started manual.
The contents of the user manual is available as help in the R&S ZNB/ZNBT. The help
offers quick, context-sensitive access to the complete information for the instrument
and its firmware.
The user manual is also available for download or for immediate display on the Internet.
Describes the performance test for checking the rated specifications, module replacement and repair, firmware update, troubleshooting and fault elimination, and contains
mechanical drawings and spare part lists.
The service manual is available for registered users on the global Rohde & Schwarz
information system (GLORIS):
●
R&S ZNB Service Manual
●
R&S ZNBT Service Manual
1.2.4 Instrument Security Procedures
Deals with security issues when working with the R&S ZNB/ZNBT in secure areas. It is
available for download on the Internet.
1.2.5 Basic Safety Instructions
Contains safety instructions, operating conditions and further important information.
The printed document is delivered with the instrument.
1.2.6 Data Sheets and Brochures
The data sheet contains the technical specifications of the R&S ZNB/ZNBT. It also lists
the firmware applications and their order numbers, and optional accessories.
The brochure provides an overview of the instrument and deals with the specific characteristics.
See
●
https://www.rohde-schwarz.com/brochure-datasheet/ZNB
●
https://www.rohde-schwarz.com/brochure-datasheet/ZNBT
8Getting Started 1316.0062.02 ─ 26
Page 11
R&S® ZNB/ZNBT
1.2.7 Release Notes and Open Source Acknowledgment (OSA)
1.2.8 Application Notes, Application Cards, White Papers, etc.
Preface
Conventions Used in the Documentation
The release notes list new features, improvements and known issues of the current
firmware version, and describe the firmware installation.
The open source acknowledgment document provides verbatim license texts of the
used open source software.
See
●
https://www.rohde-schwarz.com/firmware/ZNB
●
https://www.rohde-schwarz.com/firmware/ZNBT
These documents deal with special applications or background information on particular topics.
See
●
https://www.rohde-schwarz.com/application/ZNB
●
https://www.rohde-schwarz.com/application/ZNBT
1.3 Conventions Used in the Documentation
1.3.1 Typographical Conventions
The following text markers are used throughout this documentation:
Convention Description
[Keys] Key and knob names are enclosed by square brackets.
"Graphical user interface elements"
File names, commands,
program code
Input Input to be entered by the user is displayed in italics.
Links Links that you can click are displayed in blue font.
"References" References to other parts of the documentation are enclosed by quota-
All names of graphical user interface elements on the screen, such as
dialog boxes, menus, options, buttons, and softkeys are enclosed by
quotation marks.
File names, commands, coding samples and screen output are distinguished by their font.
tion marks.
9Getting Started 1316.0062.02 ─ 26
Page 12

R&S® ZNB/ZNBT
1.3.2 Conventions for Procedure Descriptions
1.3.3 Notes on Screenshots
Preface
Conventions Used in the Documentation
When operating the instrument, several alternative methods may be available to perform the same task. In this case, the procedure using the touchscreen is described.
Any elements that can be activated by touching can also be clicked using an additionally connected mouse. The alternative procedure using the keys on the instrument or
the on-screen keyboard is only described if it deviates from the standard operating procedures.
The term "select" may refer to any of the described methods, i.e. using a finger on the
touchscreen, a mouse pointer in the display, or a key on the instrument or on a keyboard.
When describing the functions of the product, we use sample screenshots. These
screenshots are meant to illustrate as much as possible of the provided functions and
possible interdependencies between parameters. The shown values may not represent
realistic usage scenarios.
The screenshots usually show a fully equipped product, that is: with all options installed. Thus, some functions shown in the screenshots may not be available in your particular product configuration.
10Getting Started 1316.0062.02 ─ 26
Page 13
R&S® ZNB/ZNBT
2 Putting the Analyzer into Operation
Putting the Analyzer into Operation
Unpacking and Checking the Instrument
This section describes the basic steps to be taken when setting up the analyzer for the
first time.
Simple measurement examples are provided in Chapter 5, "Performing Measure-
ments", on page 64; for a description of the operating concept refer to Chapter 4,
"Operating the Instrument", on page 38. For all background and reference informa-
tion concerning manual and remote control of the instrument, refer to your analyzer's
help system or user manual. A more detailed description of the hardware connectors
and interfaces is also part of the help system or user manual.
Risk of injury due to disregarding safety information
Observe the information on appropriate operating conditions provided in the data sheet
to prevent personal injury or damage to the instrument. Read and observe the basic
safety instructions provided with the instrument, in addition to the safety instructions in
the following sections. In particular:
●
Do not open the instrument casing.
Risk of instrument damage due to inappropriate operating conditions
An unsuitable operating site or test setup can damage the instrument and connected
devices. Before switching on the instrument, observe the information on appropriate
operating conditions provided in the data sheet. In particular, ensure the following:
●
All fan openings are unobstructed and the airflow perforations are unimpeded. The
minimum distance from the wall is 10 cm.
●
The instrument is dry and shows no sign of condensation.
●
The instrument is positioned as described in the following sections.
●
The ambient temperature does not exceed the range specified in the data sheet.
●
Signal levels at the input connectors are all within the specified ranges.
●
Signal outputs are connected correctly and are not overloaded.
2.1 Unpacking and Checking the Instrument
Check the equipment for completeness using the delivery note and the accessory lists
for the various items. If you notice any damage, immediately contact the carrier who
delivered the instrument.
11Getting Started 1316.0062.02 ─ 26
Page 14
R&S® ZNB/ZNBT
Putting the Analyzer into Operation
Bench Top Operation
Packing material
Retain the original packing material. If the instrument needs to be transported or shipped later, you can use the material to protect the control elements and connectors.
Risk of injury during transportation
The carrying handles at the front and side of the casing are designed to lift or carry the
instrument. Do not apply excessive force to the handles. If a handle is ripped off, the
falling instrument can cause injury.
As the R&S ZNBT is very heavy (over 35 kg fully equipped), it must always be carried
by two people using both carrying handles to avoid personal injury or damage to the
instrument.
2.2 Positioning the Instrument
The network analyzer is designed for use under laboratory conditions, either on a
bench top or in a rack. Notice the general ambient conditions at the operating site
described under "Risk of instrument damage due to inappropriate operating conditions"
on page 11.
Instrument damage caused by electrostatic discharge
Electrostatic discharge (ESD) can damage the electronic components of the instrument
and the device under test (DUT). Electrostatic discharge is most likely to occur when
you connect or disconnect a DUT or test fixture to the instrument's test ports. To prevent electrostatic discharge, use a wrist strap and cord and connect yourself to the
ground, or use a conductive floor mat and heel strap combination.
2.3 Bench Top Operation
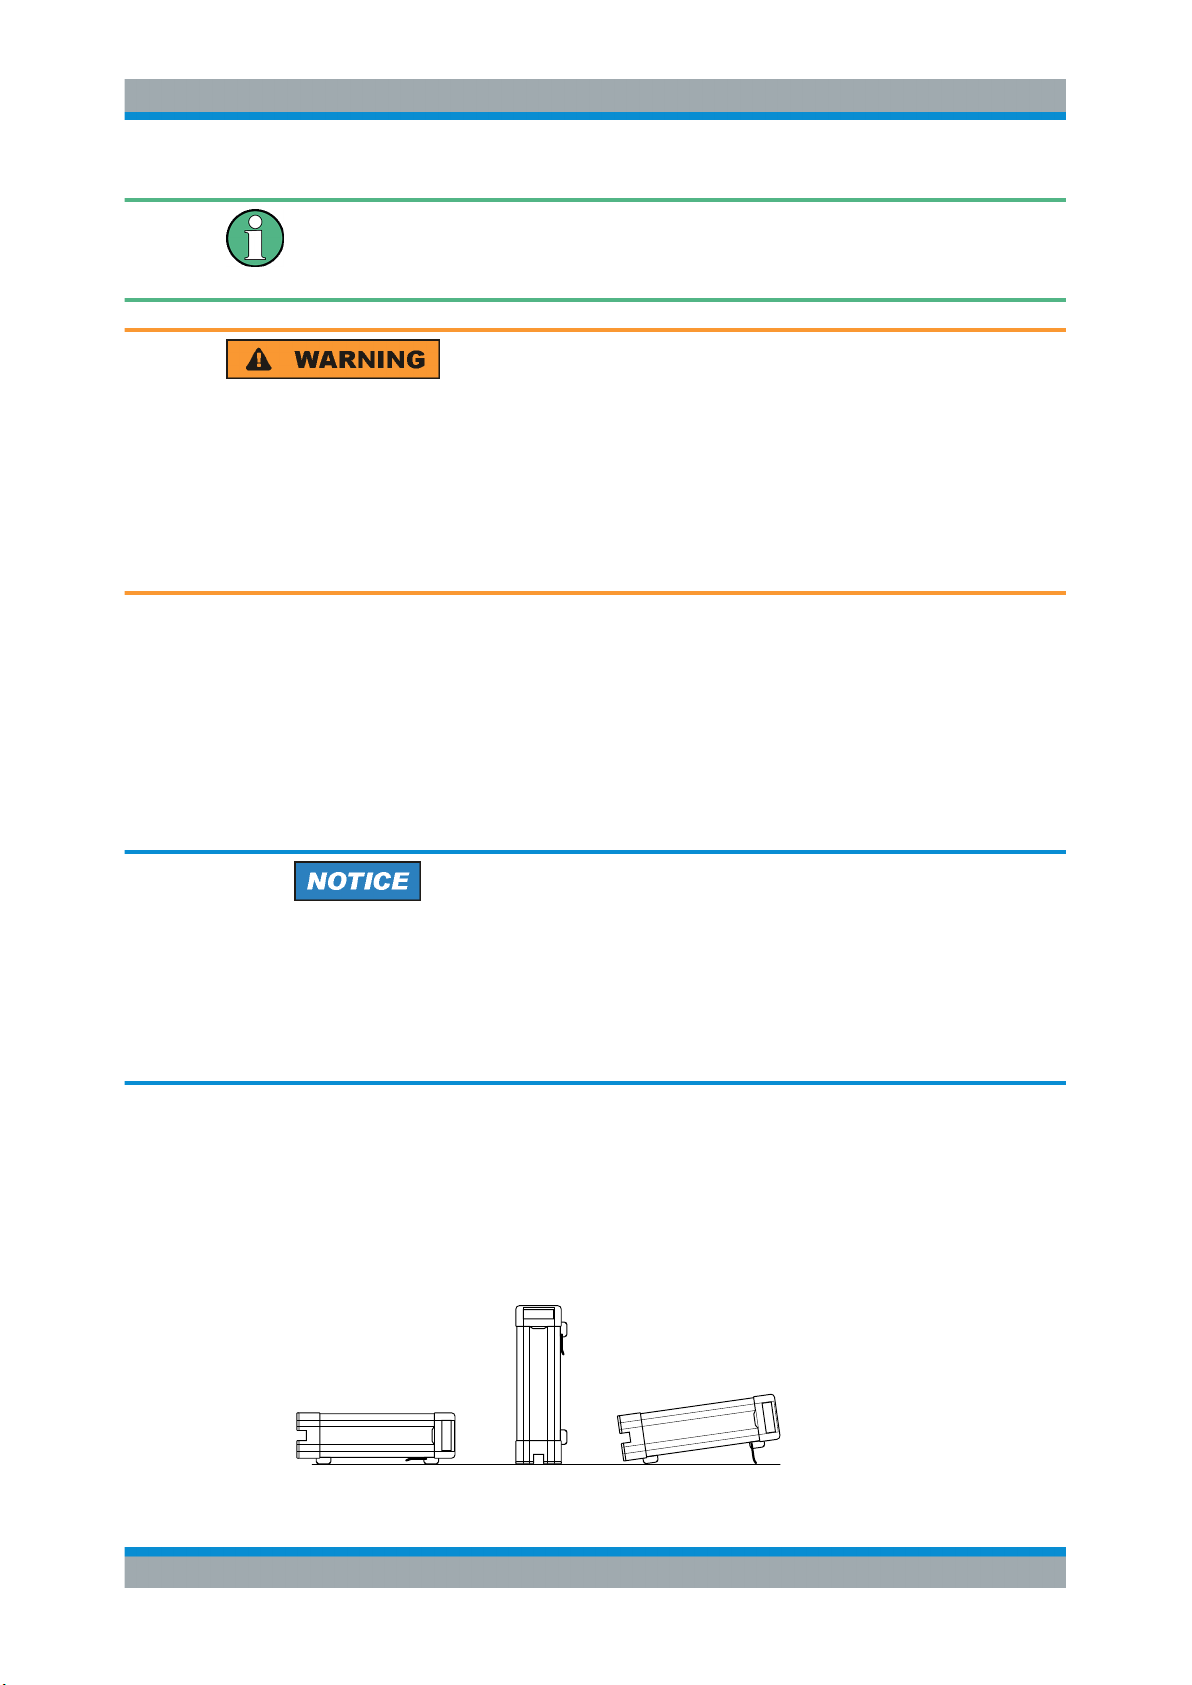
If the analyzer is operated on a bench top, the surface must be flat. The instrument can
be used in horizontal or vertical position, standing on its feet, or with the support feet
on the bottom expanded.
12Getting Started 1316.0062.02 ─ 26
Page 15
R&S® ZNB/ZNBT
Putting the Analyzer into Operation
EMI Suppression
Risk of injury if feet are folded out
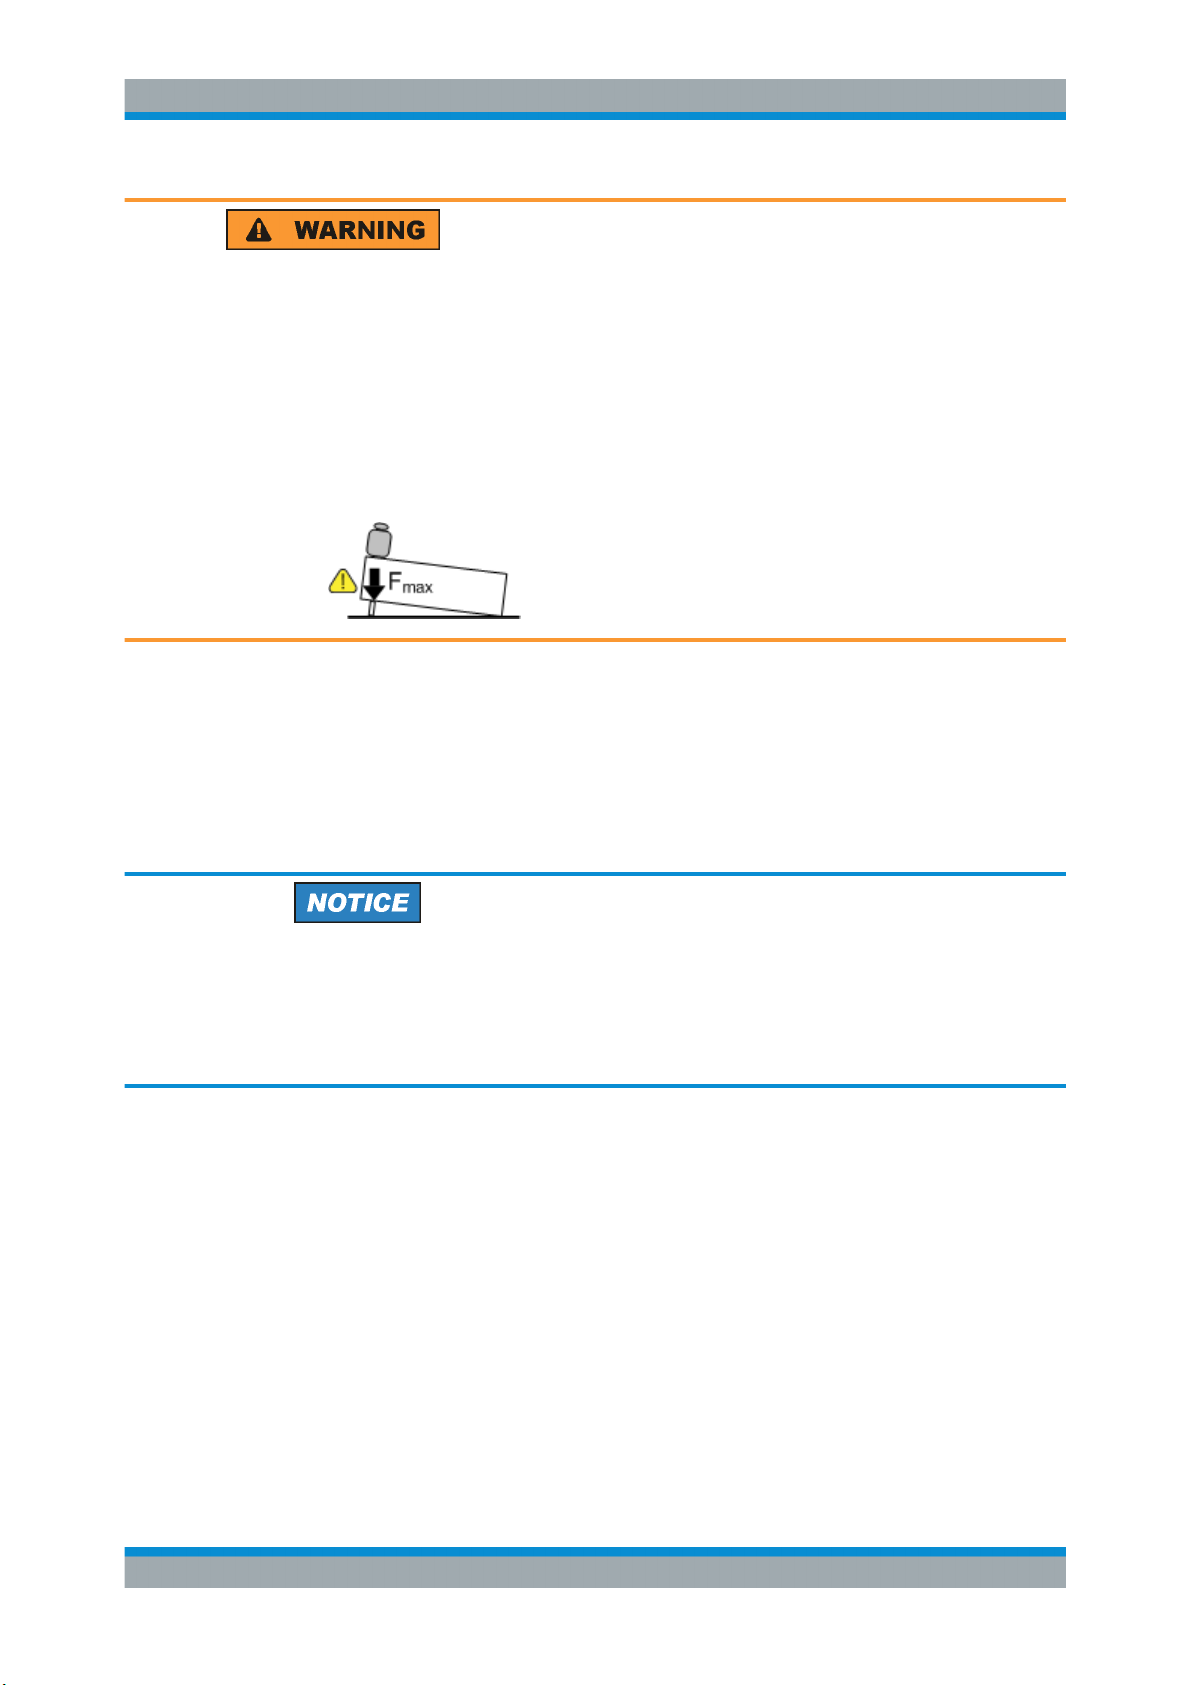
The feet can fold in if they are not folded out completely or if the instrument is shifted.
Collapsing feet can cause injury or damage the instrument.
●
Fold the feet completely in or out to ensure stability of the instrument. Never shift
the instrument when the feet are folded out.
●
When the feet are folded out, do not work under the instrument or place anything
underneath.
●
The feet can break if they are overloaded. The overall load on the folded-out feet
must not exceed 500 N.
2.4 Operation in a 19" Rack
The R&S ZNB/ZNBT can be mounted in 19" racks using the adapter R&S ZZA-KN5
(order number 1175.3040.00). Proceed according to the mounting instructions supplied
with the rack adapter.
Risk of instrument damage due to insufficient airflow in a rack
If the instrument is run with insufficient airflow for a longer period, the instrument overheats, which can disturb the operation and even cause damage.
Make sure that all fan openings are unobstructed, that the airflow perforations are
unimpeded, and that the minimum distance from the wall is 10 cm.
2.5 EMI Suppression
Electromagnetic Interference (EMI) can affect the measurement results.
To suppress generated Electromagnetic Interference:
●
Use suitable shielded cables of high quality (see table below)
●
Always terminate open cable ends
●
Note the EMC classification in the data sheet
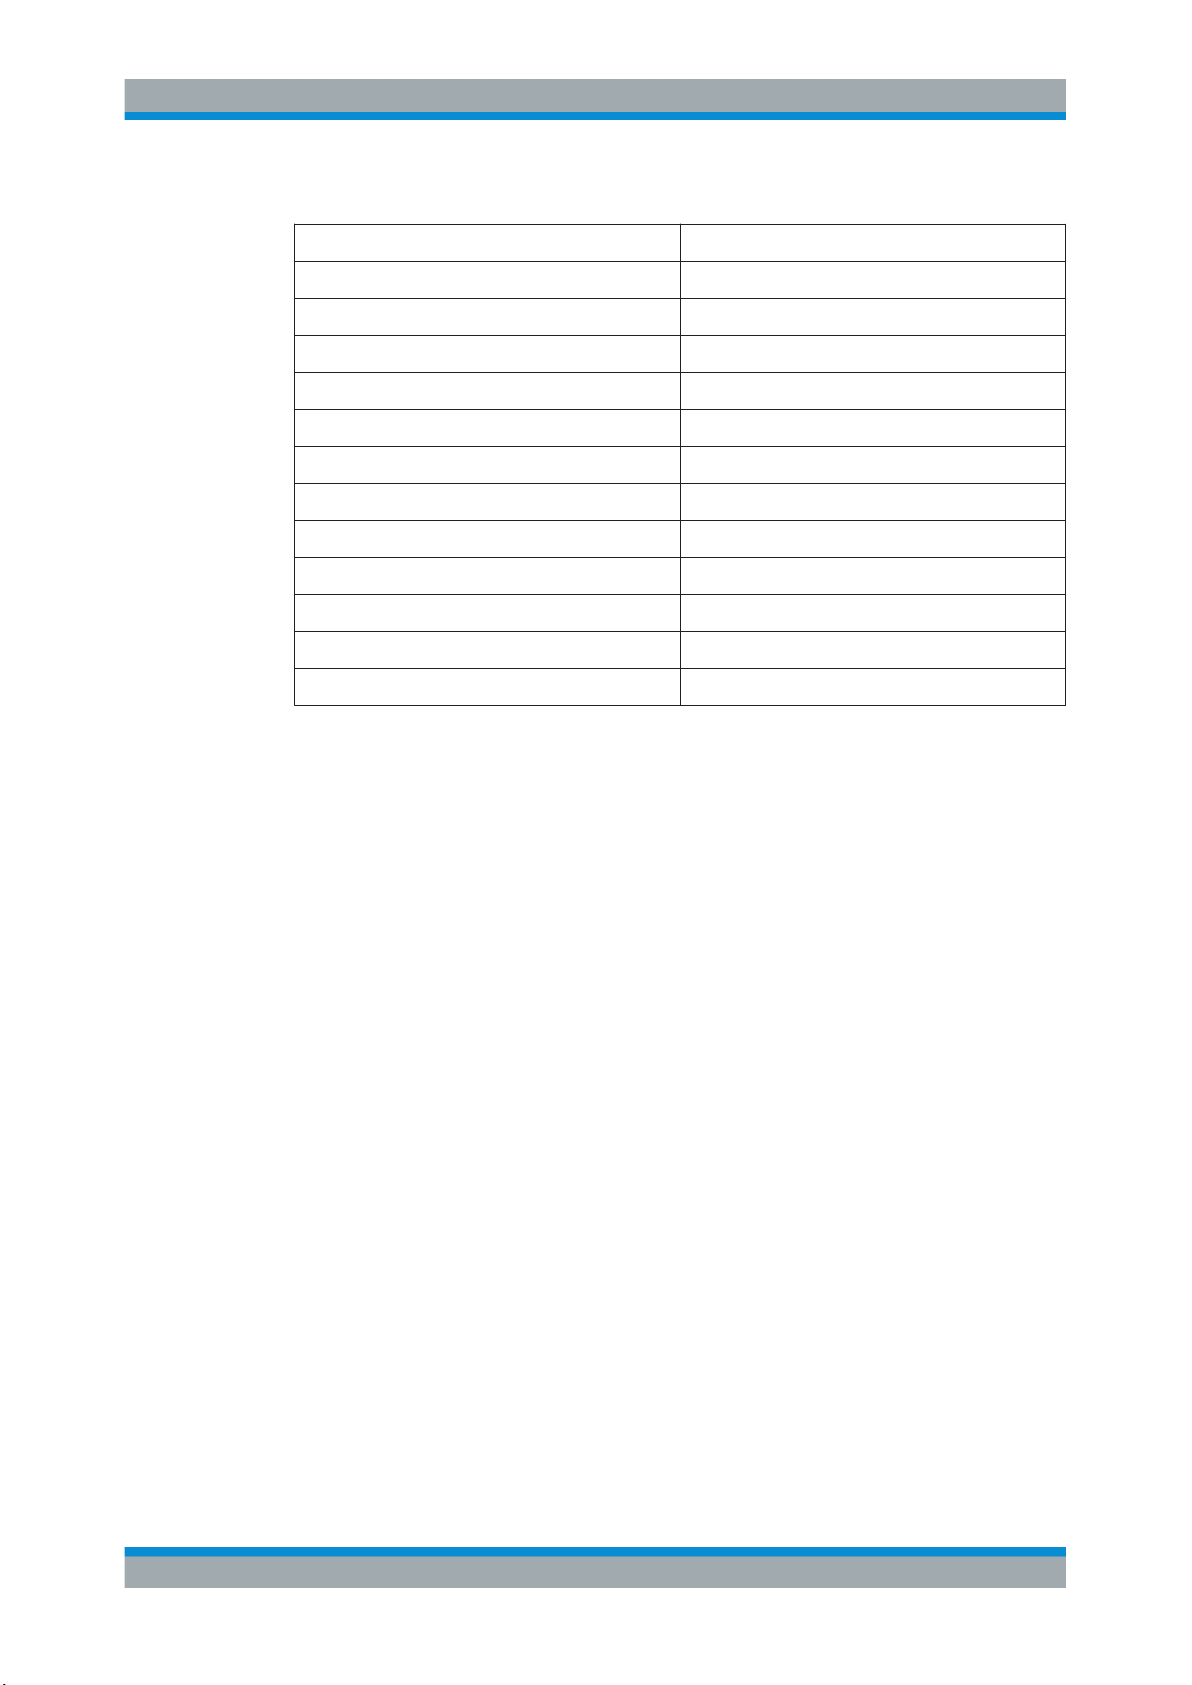
Regarding length and quality, the following requirements have to be met for cable that
are directly connected to the R&S ZNB/ZNBT:
13Getting Started 1316.0062.02 ─ 26
Page 16
R&S® ZNB/ZNBT
Putting the Analyzer into Operation
Starting the Analyzer and Shutting Down
Table 2-1: Cable Requirements
Cable Type (Connector) Requirement
RF cables (PORT 1, ..., PORT N) Double shielded
BNC cables (various) Double shielded
DB-25 (USER PORT) Single shielded
Digital I/Q (DIRECT CTRL, AUX CONTROL) R&S order no. 1402.4990.00 only
GPIB Standard cable
Handler I/O Standard cable
RFFE/GPIO R&S ZN-Z25 (order no. 1334.3424.02) only
DisplayPort (Monitor) Standard cable
DVI-D (Monitor) 2 ferrite cores
LAN At least CAT6, S/FTP
PCIe Standard cable
USB Standard cables, length ≤ 3m
2.6 Connecting the Analyzer to the AC Supply
The network analyzer is automatically adapted to the AC supply voltage, which must
be in the range of 100 V to 240 V at 50 Hz to 60 Hz. A line frequency of 400 Hz is also
supported.
The mains connector is located in the upper part of the rear panel (see Chapter 3.3,
"Rear Panel R&S ZNB", on page 33 or Chapter 3.4, "Rear Panel R&S ZNBT",
on page 35).
► Connect the network analyzer to the AC power source using the AC power cable
delivered with the instrument.
The maximum power consumption and the typical power consumption of the individual
analyzer models are listed in the data sheet.
The R&S ZNBT is protected by a fuse located below the AC power switch; see Chap-
ter 7.3, "Replacing Fuses", on page 77. There are no such fuses on the R&S ZNB.
2.7 Starting the Analyzer and Shutting Down
The AC power switch is located in the upper part of the rear panel, together with the
mains connector and the fuse drawer (R&S ZNBT only; see Chapter 3.3, "Rear Panel
R&S ZNB", on page 33 or Chapter 3.4, "Rear Panel R&S ZNBT", on page 35).
14Getting Started 1316.0062.02 ─ 26
Page 17
R&S® ZNB/ZNBT
Putting the Analyzer into Operation
Standby and Ready State
To start the analyzer, proceed as follows:
1. Switch the AC power switch to position I (On).
After power-on, the analyzer automatically goes to standby or ready state, depending on the state of the standby toggle key at the front panel when the instrument
was switched off last time.
2. If necessary, press the standby toggle key on the front panel to switch the instru-
ment to ready state (R&S ZNB: green LED goes on; R&S ZNBT PWR LED turns
from amber to green).
The instrument automatically performs a system check, boots the Windows® operating system and then starts the vector network analyzer (VNA) application. If it
was terminated regularly, the VNA application restores all recall sets and instrument settings of the previous analyzer session.
To shut down the analyzer, proceed as follows:
1. Press the standby key.
Pressing the standby key causes the instrument to save all loaded recall sets, to
close the VNA application, to shut down Windows®, and to go to standby state. Of
course, you can also perform these steps manually, like in any Windows session.
2. If desired, set the AC power switch to position O (Off).
Risk of data loss
It is strongly recommended to switch the analyzer to standby state before disconnecting it from the AC supply. If you set the power switch to 0 while the VNA application is
still running, you lose the current settings. Moreover, loss of program data cannot be
excluded if the application is terminated improperly.
The AC power switch can be permanently on. It is recommendable, however, to switch
it off if the instrument is not used for some time. When you switch the instrument back
on, be sure to comply with the extended warm-up phase specified in the data sheet.
2.8 Standby and Ready State
R&S ZNB: The standby toggle key is located in the bottom left corner of the front
panel. In standby state, the right, amber LED is on, in ready state, the left, green LED
is on.
R&S ZNBT: The standby toggle key is located in the bottom right corner of the front
panel. In standby state, the PWR LED light is amber, in ready state it is green.
The standby power only supplies the power switch circuits and the optional oven
quartz (option R&S ZNB-B4/R&S ZNBT-B4, "OCXO Frequency Reference"). In this
15Getting Started 1316.0062.02 ─ 26
Page 18
R&S® ZNB/ZNBT
2.9 Connecting External Accessories
Putting the Analyzer into Operation
Connecting External Accessories
state, it is safe to switch the AC power off and disconnect the instrument from the
power supply. In ready state, all modules are power-supplied. When switched to ready
state, the analyzer initiates its startup procedure.
Observe the instructions for startup and shutdown in Chapter 2.7, "Starting the Ana-
lyzer and Shutting Down", on page 14.
The analyzer's standard PC interfaces (Monitor, USB, LAN) can be used to connect
various accessories:
●
An external monitor expands/displays the Windows® desktop, which is, by default,
covered by the Vector Network Analyzer (VNA) application window in full-screen
mode.
●
External keyboard and mouse enable/simplify local control, in particular manual
(GUI) operation of the VNA application.
●
A printer can be used to create hard copies of the measurement diagrams and
traces from within the VNA application.
●
A LAN connection can be established to access the analyzer's mass storage or
control the analyzer from an external PC.
●
Instruments equipped with controller LPW11 can also be remote controlled via
USB.
For the R&S ZNBT, external monitor and mouse are required for local operation. The
R&S ZNB can be fully controlled by tapping the touchscreen and front panel keys.
2.9.1 Connecting a Monitor
A standard monitor can be connected to the DVI-D connector of the R&S ZNB/ZNBT.
No extra configuration is required.
Instruments equipped with controller LPW11 also offer a DisplayPort.
Safety aspects
The monitor must be connected while the instrument is switched off (or in standby
mode). Otherwise correct operation cannot be guaranteed.
Select SYSTEM > [DISPLAY] > "View Bar" > "Hard Key Panel On" from the menu bar
of the VNA application window to add the (virtual) "Hard Key Panel" to the application
window.
16Getting Started 1316.0062.02 ─ 26
Page 19
R&S® ZNB/ZNBT
2.9.2 Connecting a Keyboard
2.9.3 Connecting a Mouse
Putting the Analyzer into Operation
Connecting External Accessories
A keyboard can be connected to any of the USB connectors. After being auto-detected
by the operating system, it can safely be disconnected and reconnected even during
measurements.
Keyboard configuration
The default input language is English – US. Select "Control Panel" > "Clock, Language, and Region" > "Region and Language" > "Keyboards and Languages" from the
Windows® Start menu to configure the keyboard properties.
To access Windows®, press the Windows key on the front panel (R&S ZNB only) or on
the external keyboard.
A USB mouse can be connected to any of the USB connectors. After being auto-detected by the operating system, it can safely be disconnected and reconnected even during measurements.
Mouse configuration
Select "Control Panel" > "Hardware and Sound" > "Devices and Printers" > "Mouse"
from the Windows® "Start" menu to configure the mouse properties.
To access Windows®, press the Windows key on the front panel (R&S ZNB only) or on
the external keyboard.
2.9.4 Connecting a Printer
A printer can be connected to any of the USB connectors. After successful installation,
it can safely be disconnected and reconnected even during measurements.
Before printing (SYSTEM > [PRINT]), the analyzer checks whether a printer is connected and turned on and whether the appropriate printer driver is installed.
Printer driver installation
If necessary, the printer driver installation is initiated using the operating system's "Add
Printer Wizard". The wizard is self-explanatory. A printer driver must be installed only
once.
A great variety of printer drivers is available on the analyzer. To obtain the complete
list, select "Control Panel" > "Hardware and Sound" > "Devices and Printers" from the
Windows® "Start" menu.
17Getting Started 1316.0062.02 ─ 26
Page 20

R&S® ZNB/ZNBT
2.9.5 Connecting a LAN Cable
Putting the Analyzer into Operation
Minimizing the VNA Application
To access Windows®, press the Windows key on the front panel (R&S ZNB only) or on
the external keyboard.
You can load updated and improved driver versions or new drivers from an installation
disk, USB memory stick or another external storage medium. Alternatively, if the analyzer is integrated in a network, you can install driver data stored in a network directory.
In either case, use the "Add Printer" wizard to complete the installation.
Printer configuration
Use the "Printer Setup" dialog of the firmware (SYSTEM > [PRINT] > "Print...") or the
Windows® printer management to configure the printer properties and printing preferences.
A LAN cable can be connected to the LAN connector on the rear panel of the analyzer.
To establish a LAN connection, proceed as follows:
1. Refer to Chapter 2.12.1, "Assigning an IP Address", on page 20.
2. Connect a CAT6 or CAT7 LAN cable to the LAN port.
The LAN port of the analyzer is an auto-crossover Ethernet port. You can connect it to
a network, but you can also set up a direct connection to a computer or another instrument. For both connection types, you can use either crossover or straight through
(patch) cables.
The IP address information is shown in the SYSTEM > [SETUP] > "Remote Settings"
softtool tab. For the R&S ZNBT, it is also shown on the Mini display.
2.9.6 Connecting a USB Cable for Remote Control
Instruments equipped with controller LPW11 can also be remote controlled via USB. To
prepare for remote control operation, connect a suitable USB 2.0 or 3.0 cable to the
type B "USB Device" port on the rear panel of the instrument. With direct connection to
a master device, a connecting cable A-B (plug type A onto plug type B) must be used.
For more information, refer to the Remote Control chapter of your analyzer's help system or user manual.
2.10 Minimizing the VNA Application
With a minimized VNA application, you can access your analyzer's Windows® desktop
or run other applications.
18Getting Started 1316.0062.02 ─ 26
Page 21
R&S® ZNB/ZNBT
Putting the Analyzer into Operation
Changing the Screen Resolution (R&S
To exit the default full-screen mode of the VNA application, deselect SYSTEM > [DISPLAY] > "View Bar" > "Title Bar Task Bar". Then use the standard Windows® titlebar
functions to minimize/maximize/close the application window.
To start the VNA application with a minimized window
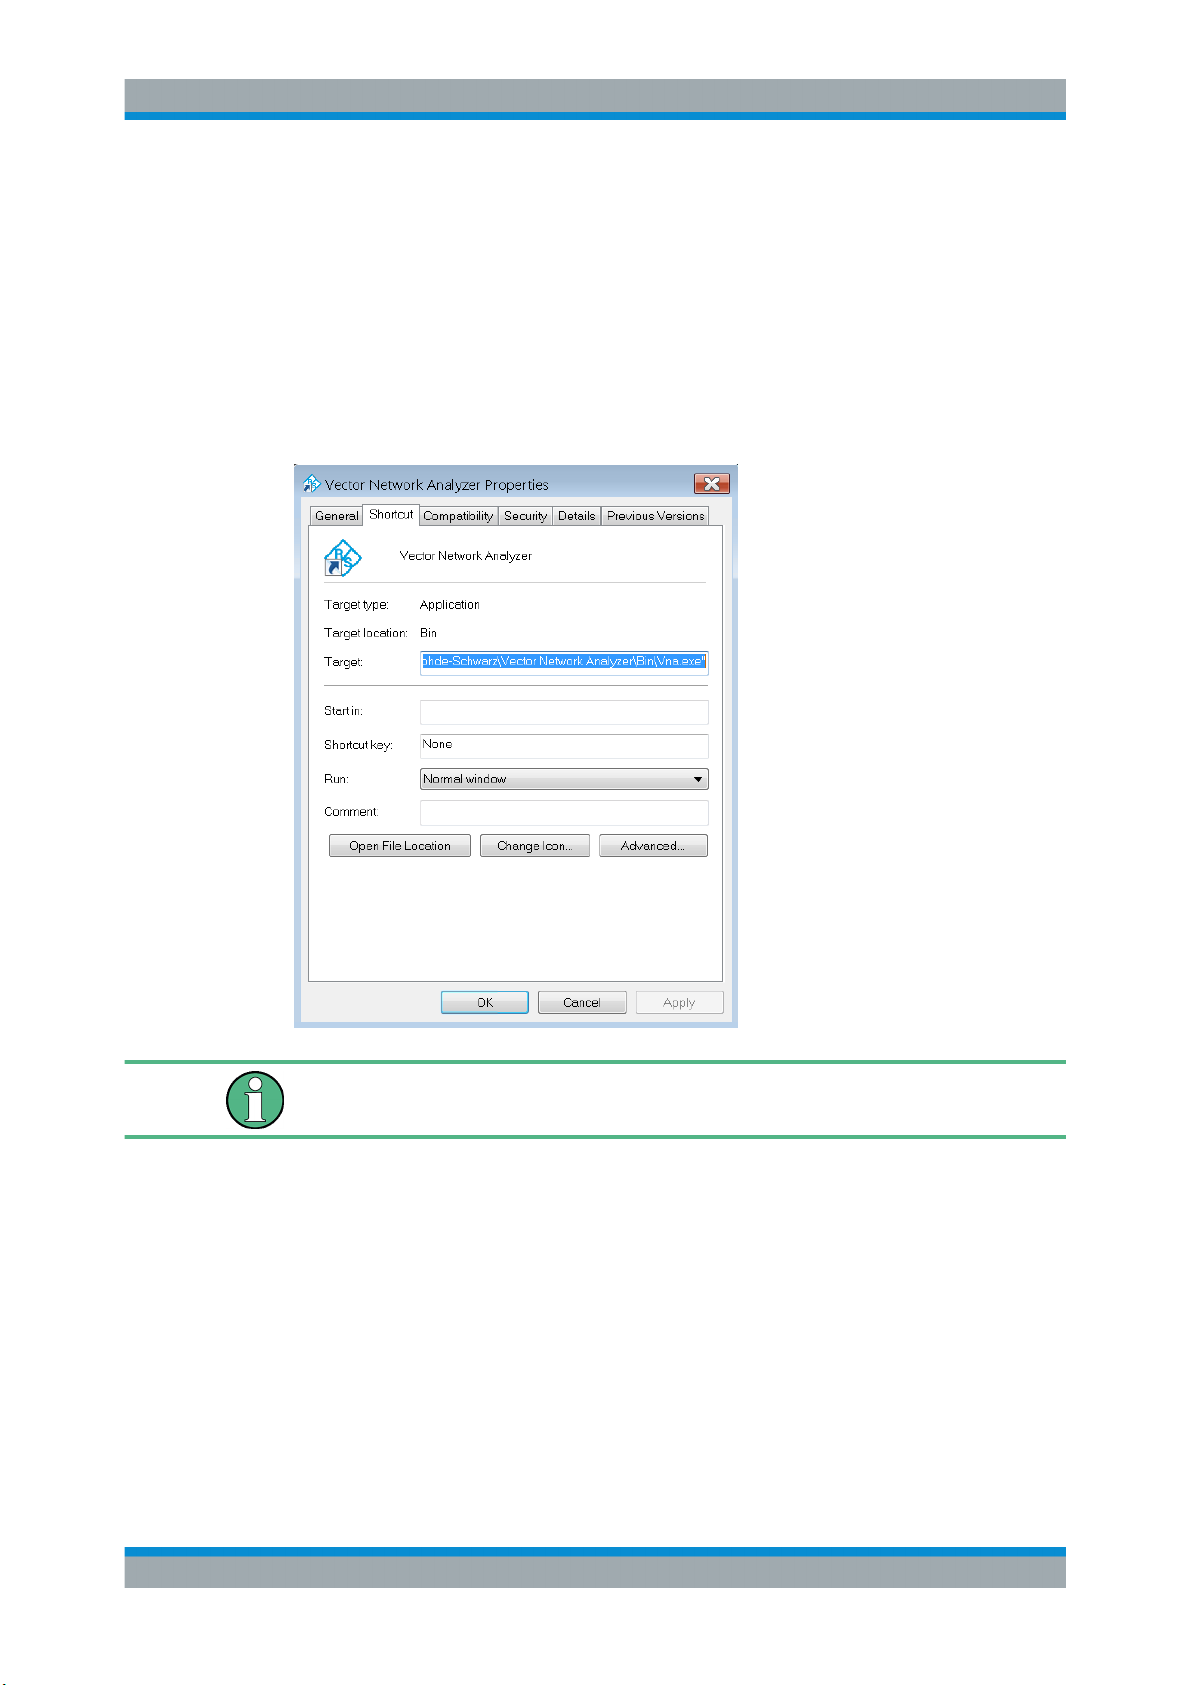
1. Right-click the Vector Network Analyzer shortcut icon on the desktop and open the
"Properties" dialog.
2. In the "Shortcut" tab, select "Run: Minimized".
ZNBT)
A software update restores the original shortcut properties.
2.11 Changing the Screen Resolution (R&S ZNBT)
In case the R&S ZNBT fails to adjust the display resolution properly when an external
monitor is connected, proceed as follows:
1. Connect a USB keyboard and mouse as described in Chapter 2.9, "Connecting
External Accessories", on page 16.
2. Hold the Ctrl key and press Esc to show the task bar.
19Getting Started 1316.0062.02 ─ 26
Page 22
R&S® ZNB/ZNBT
2.12 Remote Operation in a LAN
Putting the Analyzer into Operation
Remote Operation in a LAN
3. Click the rectangular button rightmost on the task bar to show the Windows desktop.
4. Right-click the Windows desktop and select "Screen resolution" from the context
menu
5. In the Windows Screen Resolution" management
a) Change the "Multiple displays" setting to "Show desktop only on 2"; apply and
confirm the modified settings ("Keep Changes")
b) Select Display 2 in the panel at the top.
c) Change the display "Resolution" to the desired value by dragging the slider;
click "OK" and confirm the modified settings ("Keep Changes")
A LAN connection is used to integrate the analyzer into a home/company network. This
offers several applications, e.g.:
●
Transfer data between a controller and the analyzer, e.g. to run a remote control
program.
●
Control the measurement from a remote computer using Remote Desktop or a similar application.
●
Use external network devices (e.g. printers).
Virus protection
An efficient virus protection is a prerequisite for secure operation in the network. Never
connect your analyzer to an unprotected network because this may cause damage to
the instrument software. For useful hints, see the following Rohde & Schwarz application note:
●
1DC01: Malware Protection Windows 7
The analyzer uses a user name and password as credentials for remote access; see
note on "User accounts and password protection" on page 74 for details. To protect
the analyzer from unauthorized access, it is recommended to change the factory setting.
2.12.1 Assigning an IP Address
Depending on the network capacities, the TCP/IP address information for the analyzer
can be obtained in different ways.
●
If the network supports dynamic TCP/IP configuration using the Dynamic Host
Configuration Protocol (DHCP), all address information can be assigned automatically.
20Getting Started 1316.0062.02 ─ 26
Page 23
R&S® ZNB/ZNBT
Putting the Analyzer into Operation
Remote Operation in a LAN
●
If the network does not support DHCP, or if the analyzer is set to use alternate
TCP/IP configuration, the addresses must be set manually.
By default, the analyzer is configured to use dynamic TCP/IP configuration and obtain
all address information automatically. This means that it is safe to establish a physical
connection to the LAN without any previous analyzer configuration.
Manual TCP/IP configuration
If your network does not support DHCP, or if you choose to disable dynamic TCP/IP
configuration, you must assign valid address information before you connect the analyzer to the LAN. Contact your network administrator to obtain a valid IP address,
because connection errors can affect the entire network.
Administrator account
You need administrator rights to change the TCP/IP configuration. See note on "User
accounts and password protection" on page 74 for details.
The R&S ZNBT provides a miniature display in the upper right-hand corner of the front
panel indicating the current IP address of the instrument. See "Mini display"
on page 32.
To enter the TCP/IP address information manually
1. Obtain the IP address and subnet mask for the analyzer and the IP address for the
local default gateway from your network administrator. If necessary, also obtain the
name of your DNS domain and the IP addresses of the DNS and WINS servers on
your network.
2. For the R&S ZNBT connect an external monitor, keyboard and mouse.
3. Press the Windows key in the SYSTEM keypad (R&S ZNB only) or on an external
keyboard to access Windows®.
4. Open the "Control Panel" > "Network and Internet" > "Network and Sharing Center"
> "Local Area Connection Status" dialog.
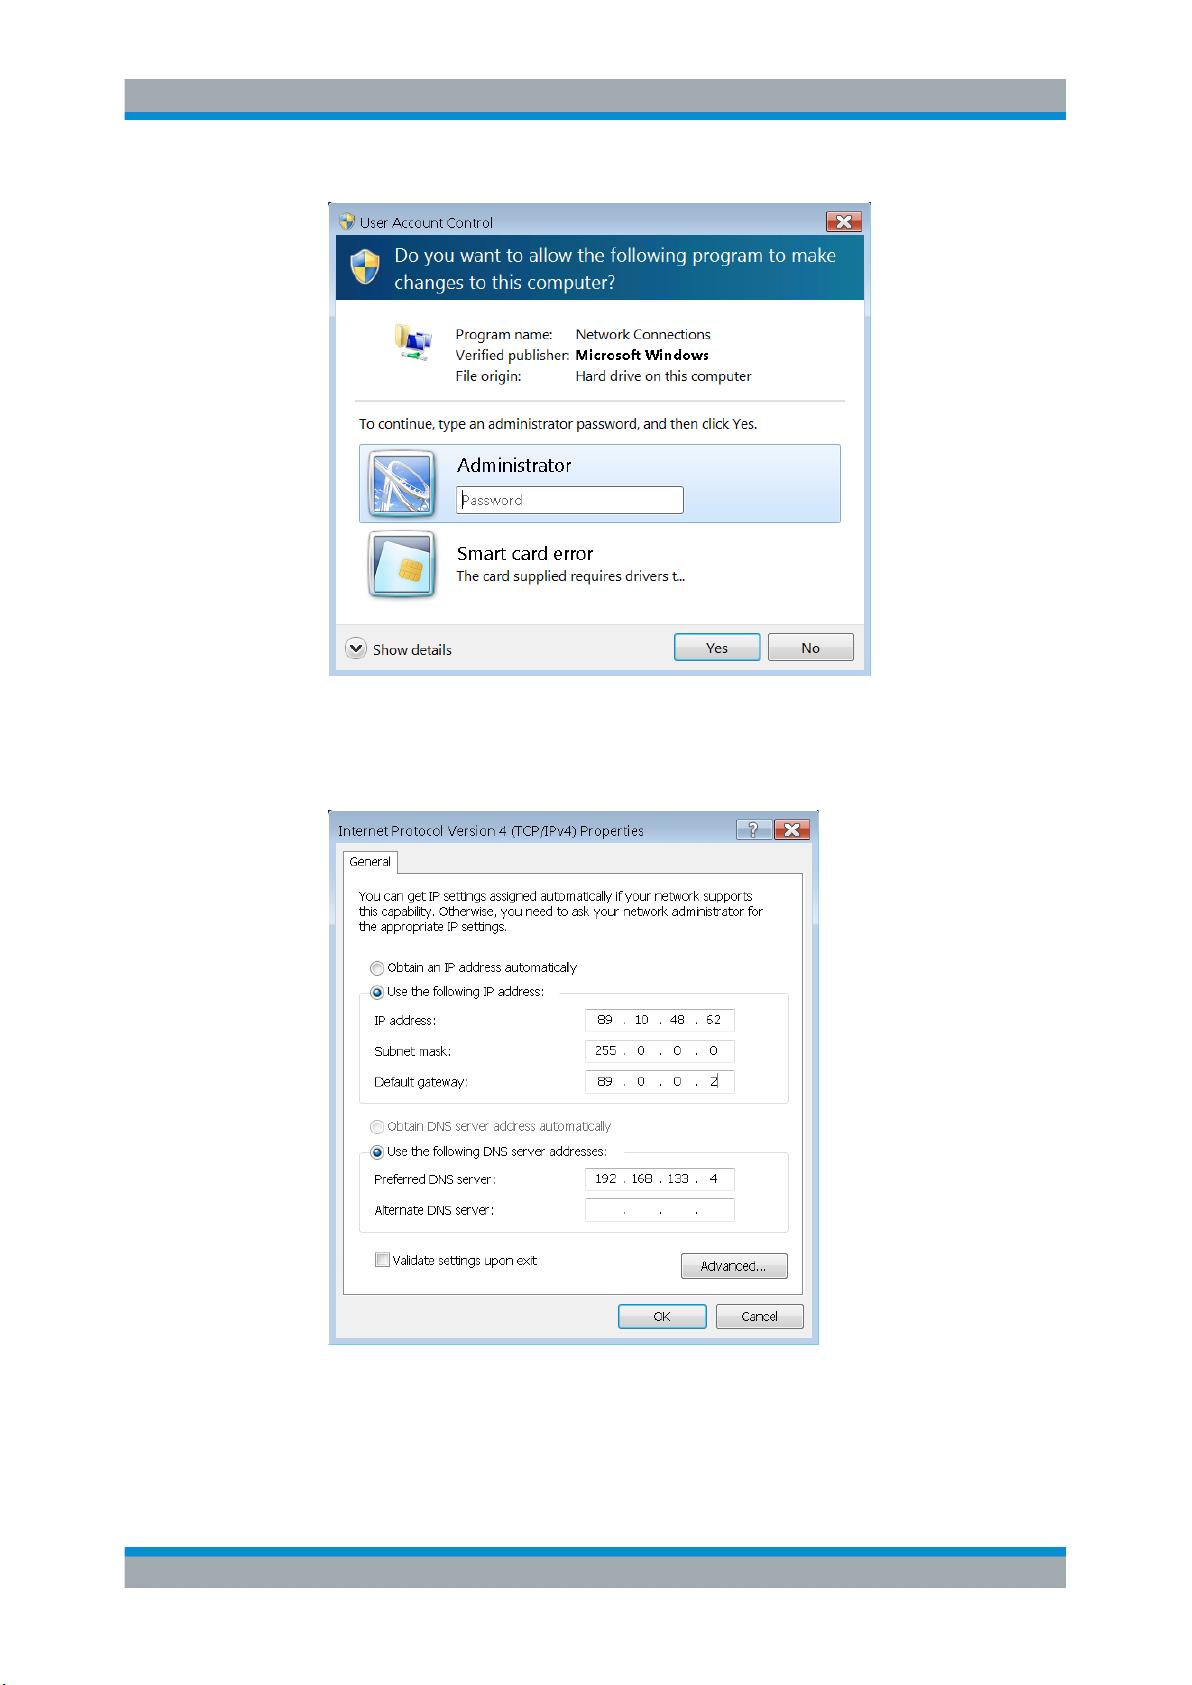
5. Select "Properties" and confirm the user account control message, depending on
your current user account.
● If your current account is an administrator account, select "Yes".
● If your account is an account with standard user rights, enter the password of
the administrator account and select "Yes".
21Getting Started 1316.0062.02 ─ 26
Page 24
R&S® ZNB/ZNBT
Putting the Analyzer into Operation
Remote Operation in a LAN
Figure 2-1: Windows 7 User Account Control dialog
6. In the "Local Area Connection Properties" dialog opened, select "Internet Protocol
Version 4 (TCP/IPv4) > Properties" and enter the IP address information.
22Getting Started 1316.0062.02 ─ 26
Page 25
R&S® ZNB/ZNBT
2.12.2 Remote Desktop Connection
Putting the Analyzer into Operation
Remote Operation in a LAN
Remote Desktop is a Windows® application which you can use to access and control
the analyzer from a remote computer through a LAN connection. While the measurement is running, the analyzer screen contents are displayed on the remote computer,
and Remote Desktop provides access to all of the applications, files, and network
resources of the analyzer.
At the R&S ZNB/ZNBT by default remote connections are enabled using a local group
policy and remote access is granted to users instrument and administrator.
For detailed information about Remote Desktop and the connection refer to the Windows® Help ("Windows Start Menu > Help and Support").
To establish a remote desktop connection, proceed as follows:
1. Connect remote Windows PC and VNA to the LAN and make sure an IP connection can be established.
2.12.3
2. At the remote Windows PC open a remote desktop connection (type "Remote
Desktop Connection" at the Windows Start/Search menu and hit enter).
3. In the "Remote Desktop Connection" dialog enter the VNA's computer name or IP
address and select "Connect"
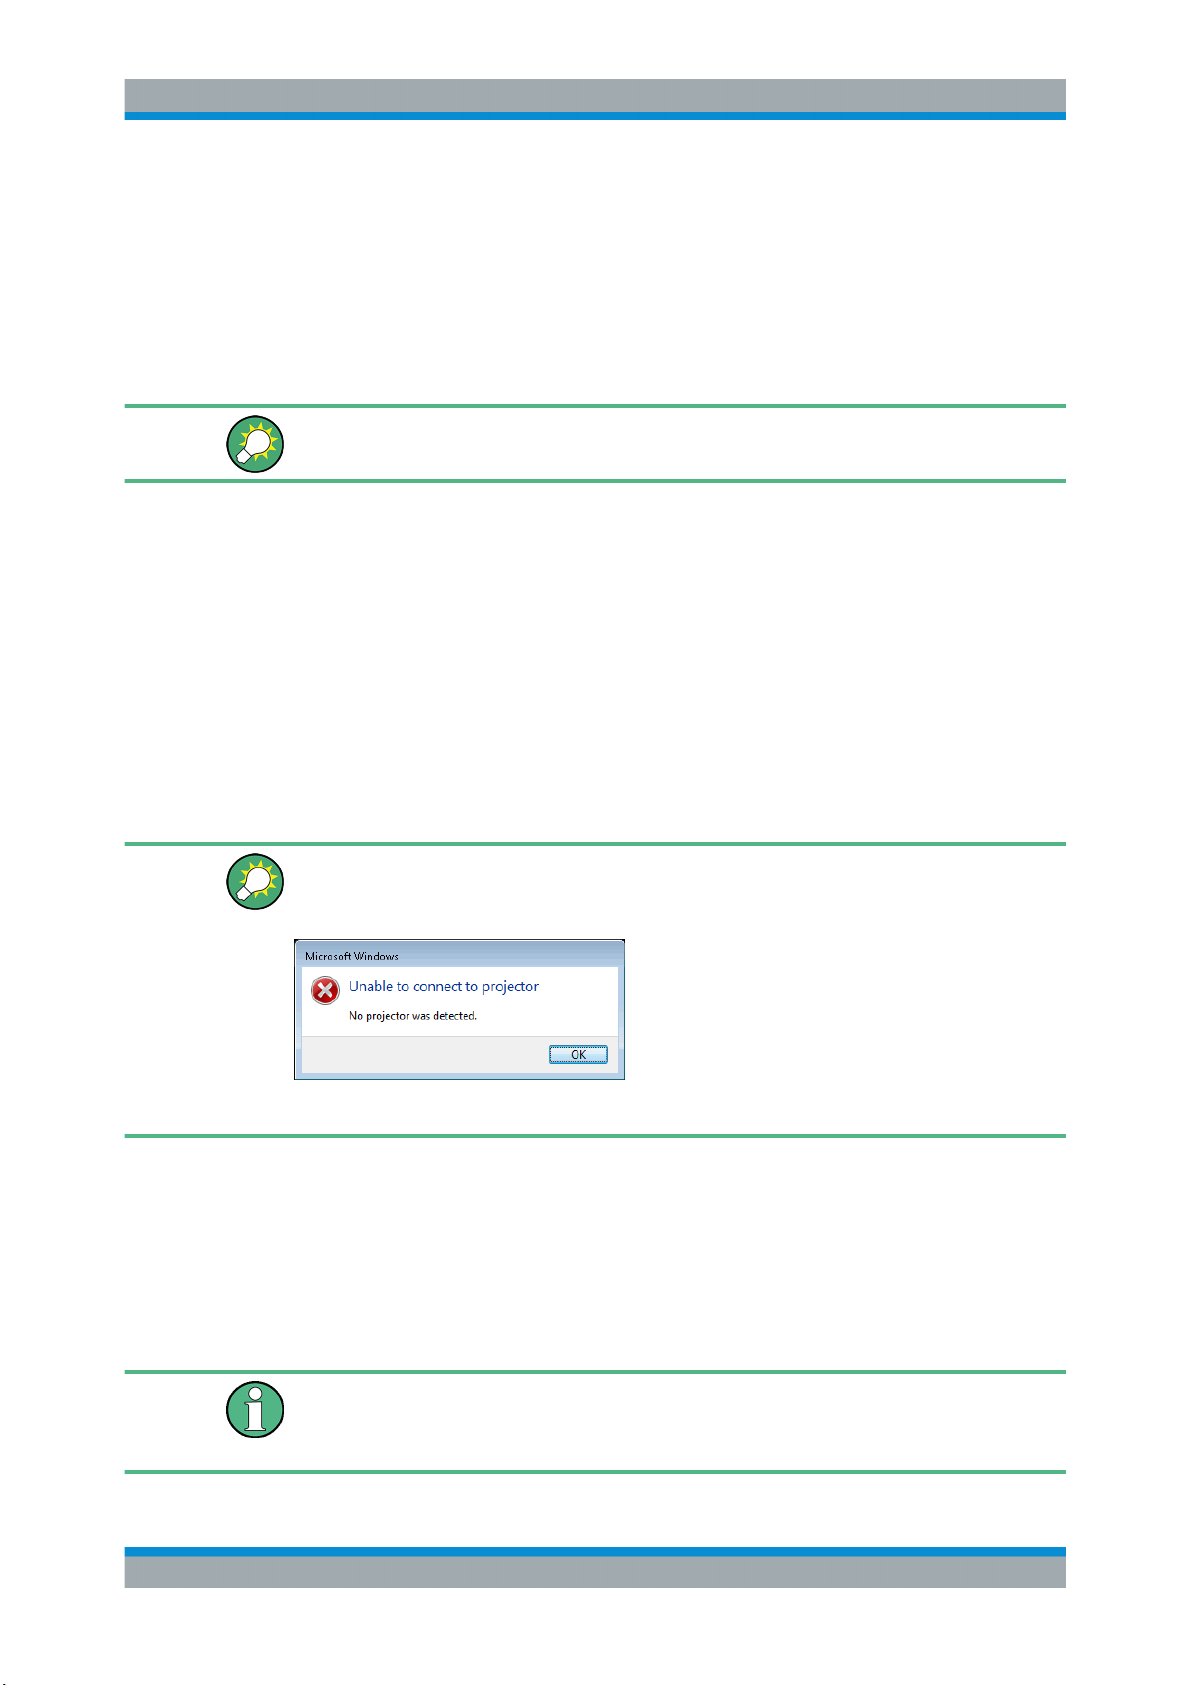
For instruments equipped with controller LPW11, if no external monitor is connected at
the time a user logs in to the instrument via remote desktop, Windows® displays the
following error message:
This can be safely ignored.
Windows
®
Firewall Settings
A firewall protects an instrument by preventing unauthorized users from gaining access
to it through a network. In the default configuration of the R&S ZNB/ZNBT the firewall
is enabled. A remote desktop connection does not require any changes in the firewall
settings.
Administrator account
You need administrator rights to change the firewall settings. See note on "User
accounts and password protection" on page 74 above for details.
23Getting Started 1316.0062.02 ─ 26
Page 26
R&S® ZNB/ZNBT
Putting the Analyzer into Operation
Remote Operation in a LAN
Some actions require a different firewall configuration, e.g.:
●
To transfer data with other hosts in the LAN, you have to allow "File and Printer
Sharing".
To change the firewall settings, proceed as follows:
1.
Access the operating system by pressing the Windows® key on the external keyboard. Open the "Control Panel".
2. Select "System and Security > Windows Firewall".
● Select "Change Settings > Allow a program or feature through Windows Fire-
wall" to enable "File and Printer Sharing".
● Select "Turn Windows Firewall on or off" to enable or disable the firewall.
You must confirm a user account control message to allow the desired changes (see
Figure 2-1). For detailed information about the firewall refer to the Windows® Help.
Risks of changing the firewall settings
Disabling the firewall or allowing exceptions may make your instrument more vulnerable to viruses and intruders. It is recommended to restore the default firewall configuration after completing a task which requires modified settings.
24Getting Started 1316.0062.02 ─ 26
Page 27
R&S® ZNB/ZNBT
3 Instrument Tour
3.1 Front Panel R&S ZNB
Instrument Tour
Front Panel R&S ZNB
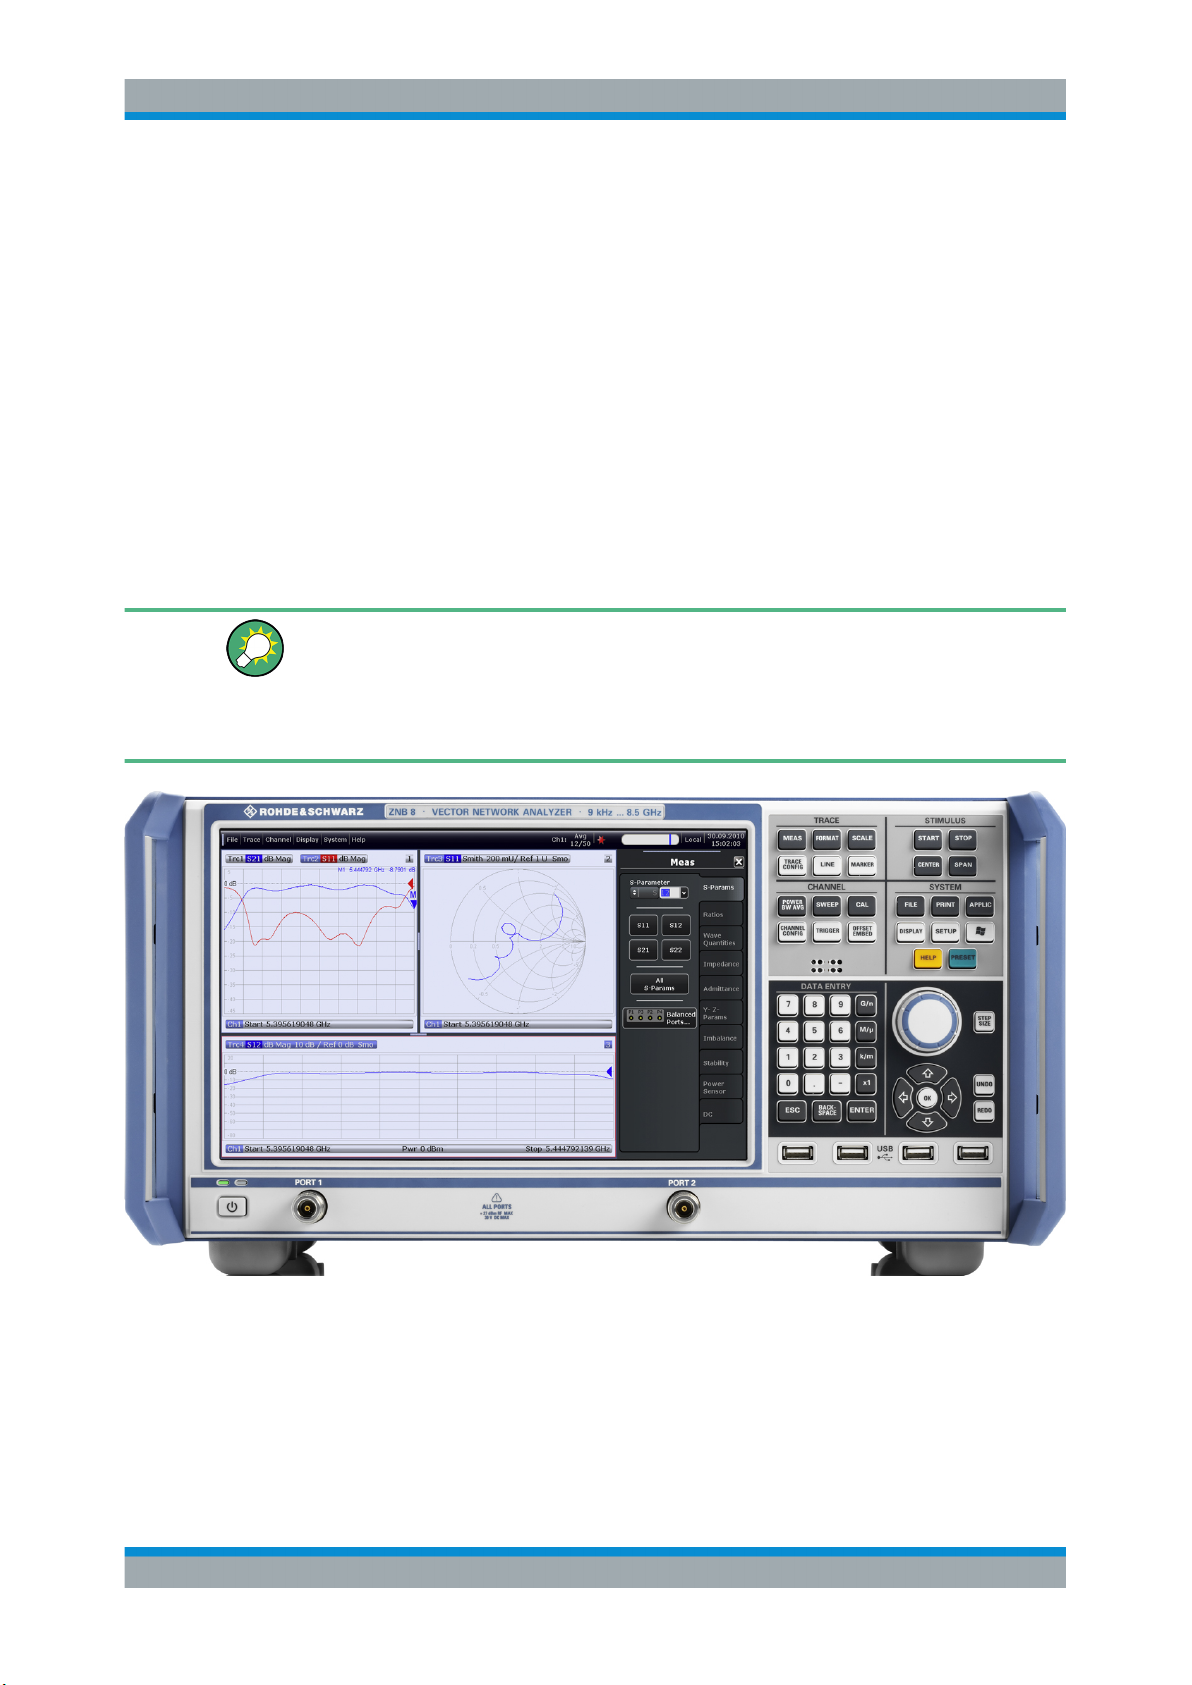
This chapter gives an overview of the control elements and connectors of the
R&S ZNB/ZNBT and gives all information that is necessary to put the instrument into
operation and connect external devices.
The front panel of a R&S ZNB consists of the touchscreen with the diagrams and softtool panels (left side), the hardkey area (right side) and the test port area below. Brief
explanations on the controls and connectors, the hardkey area and the rear panel can
be found on the next pages.
Two-port and four-port network analyzers
The figures and examples in this Getting Started guide show a two-port network analyzer. Everything described in this guide is also valid for four-port analyzers. The extended measurement functionality of the four-port instruments is described in the help system and in the user manual.
Figure 3-1: R&S
ZNB8 with two ports
25Getting Started 1316.0062.02 ─ 26
Page 28
R&S® ZNB/ZNBT
Instrument Tour
3.1.1 Touchscreen
The analyzer is equipped with a 12.1'' XGA color touchscreen. The touchscreen presents all measurement results, mostly in the form of diagrams. Besides, all instrument
functions can be accessed and operated by tapping the control elements on the touchscreen. For an introduction to touchscreen operation, refer to Chapter 4.1, "Manual
Operation ", on page 38.
The following sections contain further useful information about manual control of the
instrument.
●
Refer to the other sections in chapter Chapter 4, "Operating the Instrument",
on page 38 to learn how to handle traces and diagrams, and how to use menus,
keys and softtools.
●
Refer to chapter "Concepts and Features" in the user manual or help system to
obtain information about the results in the diagram.
●
Refer to section "Display Menu" in the user manual or help system to learn how to
customize the screen.
●
Refer to the data sheet for the technical specifications of the display.
Front Panel R&S
ZNB
Screen saver
The screen saver function of the operating system can be used to switch off the display
if the analyzer receives no command for a selectable period of time. The display is
switched on again if any front panel key is pressed.
To enable the screen saver, access the Windows® operating system (e.g. by pressing
the Windows key in the SYSTEM keypad) and tap "Control Panel > Hardware and
Sound > Power Options > Edit Plan Settings > Turn off the display".
3.1.2 Function Keys
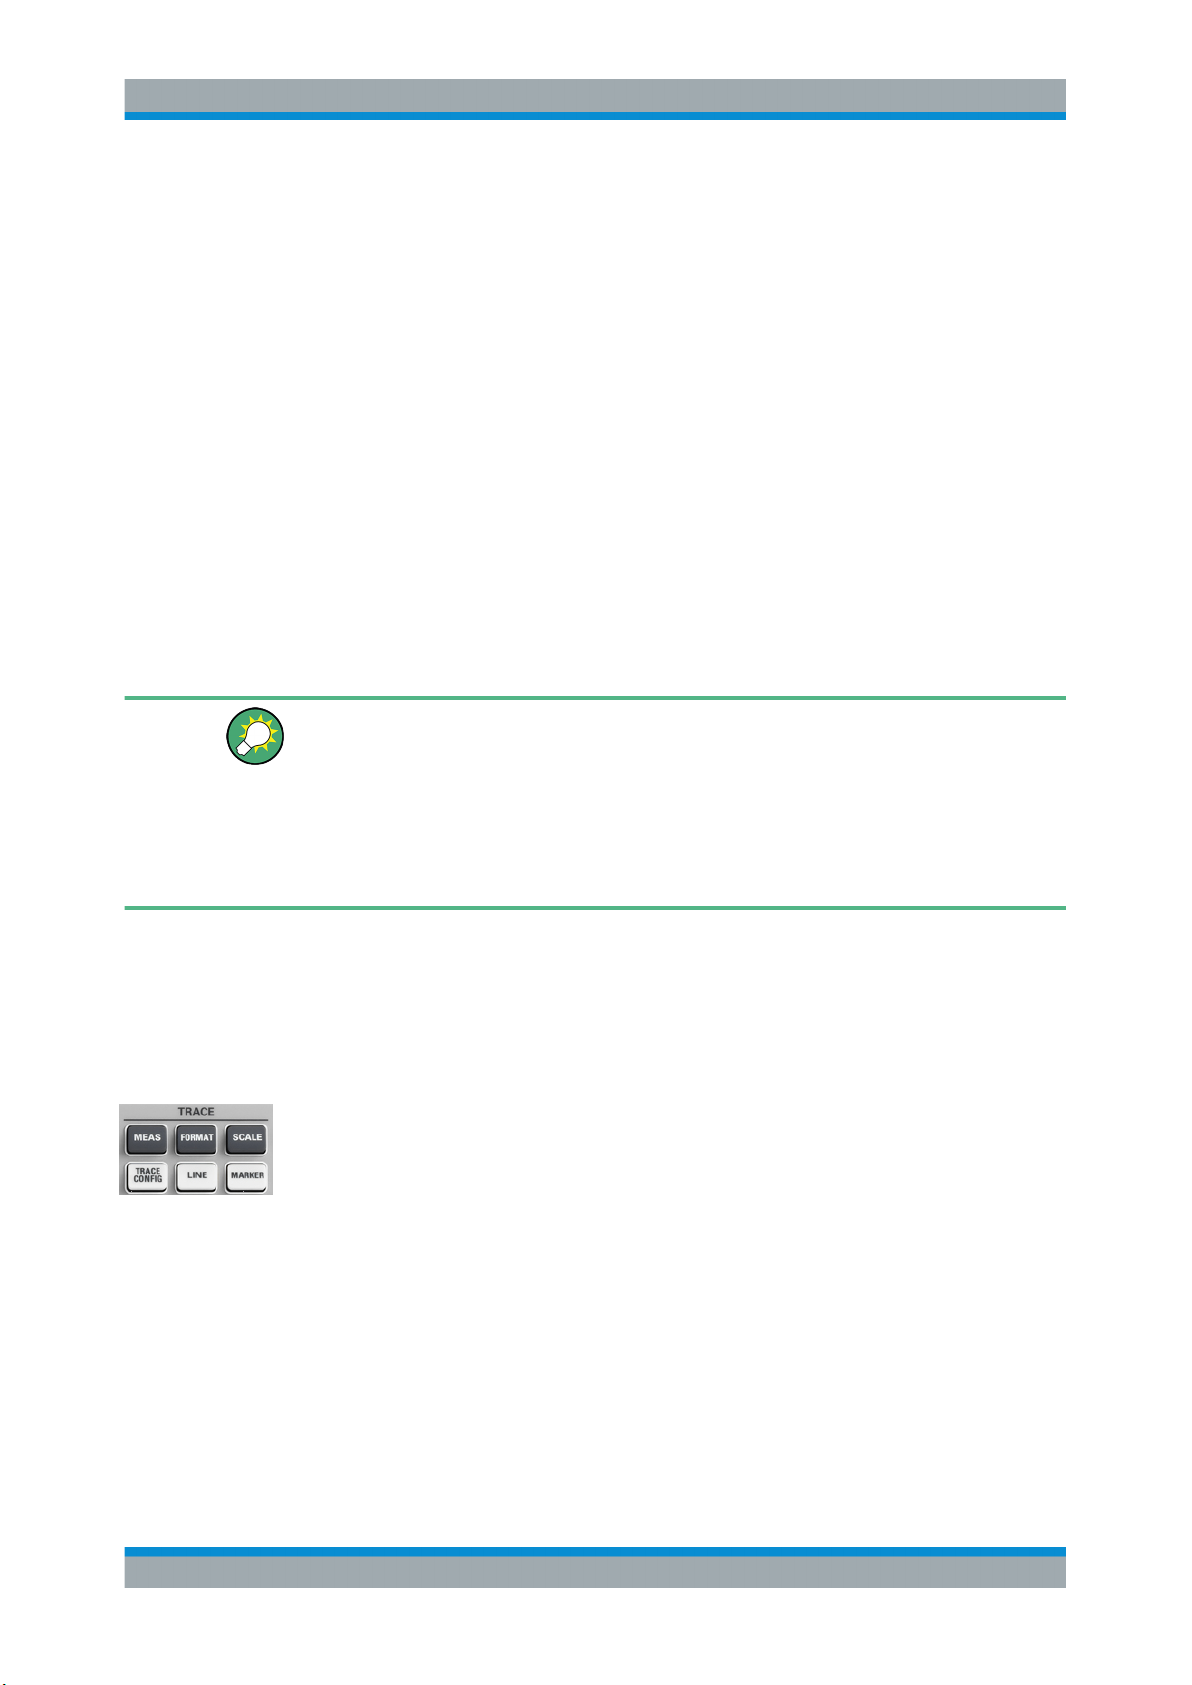
Most of the keys in the TRACE, CHANNEL, STIMULUS, and SYSTEM keypads call up
a related softtool of the analyzer GUI. Every softtool provides access to a group of related measurement settings.
The TRACE keys give access to all trace settings, to the limit check settings, and to
the marker functions including marker search.
●
The [MEAS] settings select the measured and displayed quantity.
●
The [FORMAT] settings define how measured data (traces) are presented.
●
The [SCALE] settings define how traces are scaled.
●
The [TRACE CONFIG] settings store traces to the memory and perform mathematical operations on traces.
●
The [LINES] settings define limits for the measurement results, visualize them in
the diagrams and activate/deactivate the limit check.
●
The [MARKER] settings position markers on a trace, configure their properties and
select the format of the numerical readout. Markers can also be used to locate specific points on the trace, define the sweep range, and scale the diagram.
26Getting Started 1316.0062.02 ─ 26
Page 29
R&S® ZNB/ZNBT
Instrument Tour
Front Panel R&S
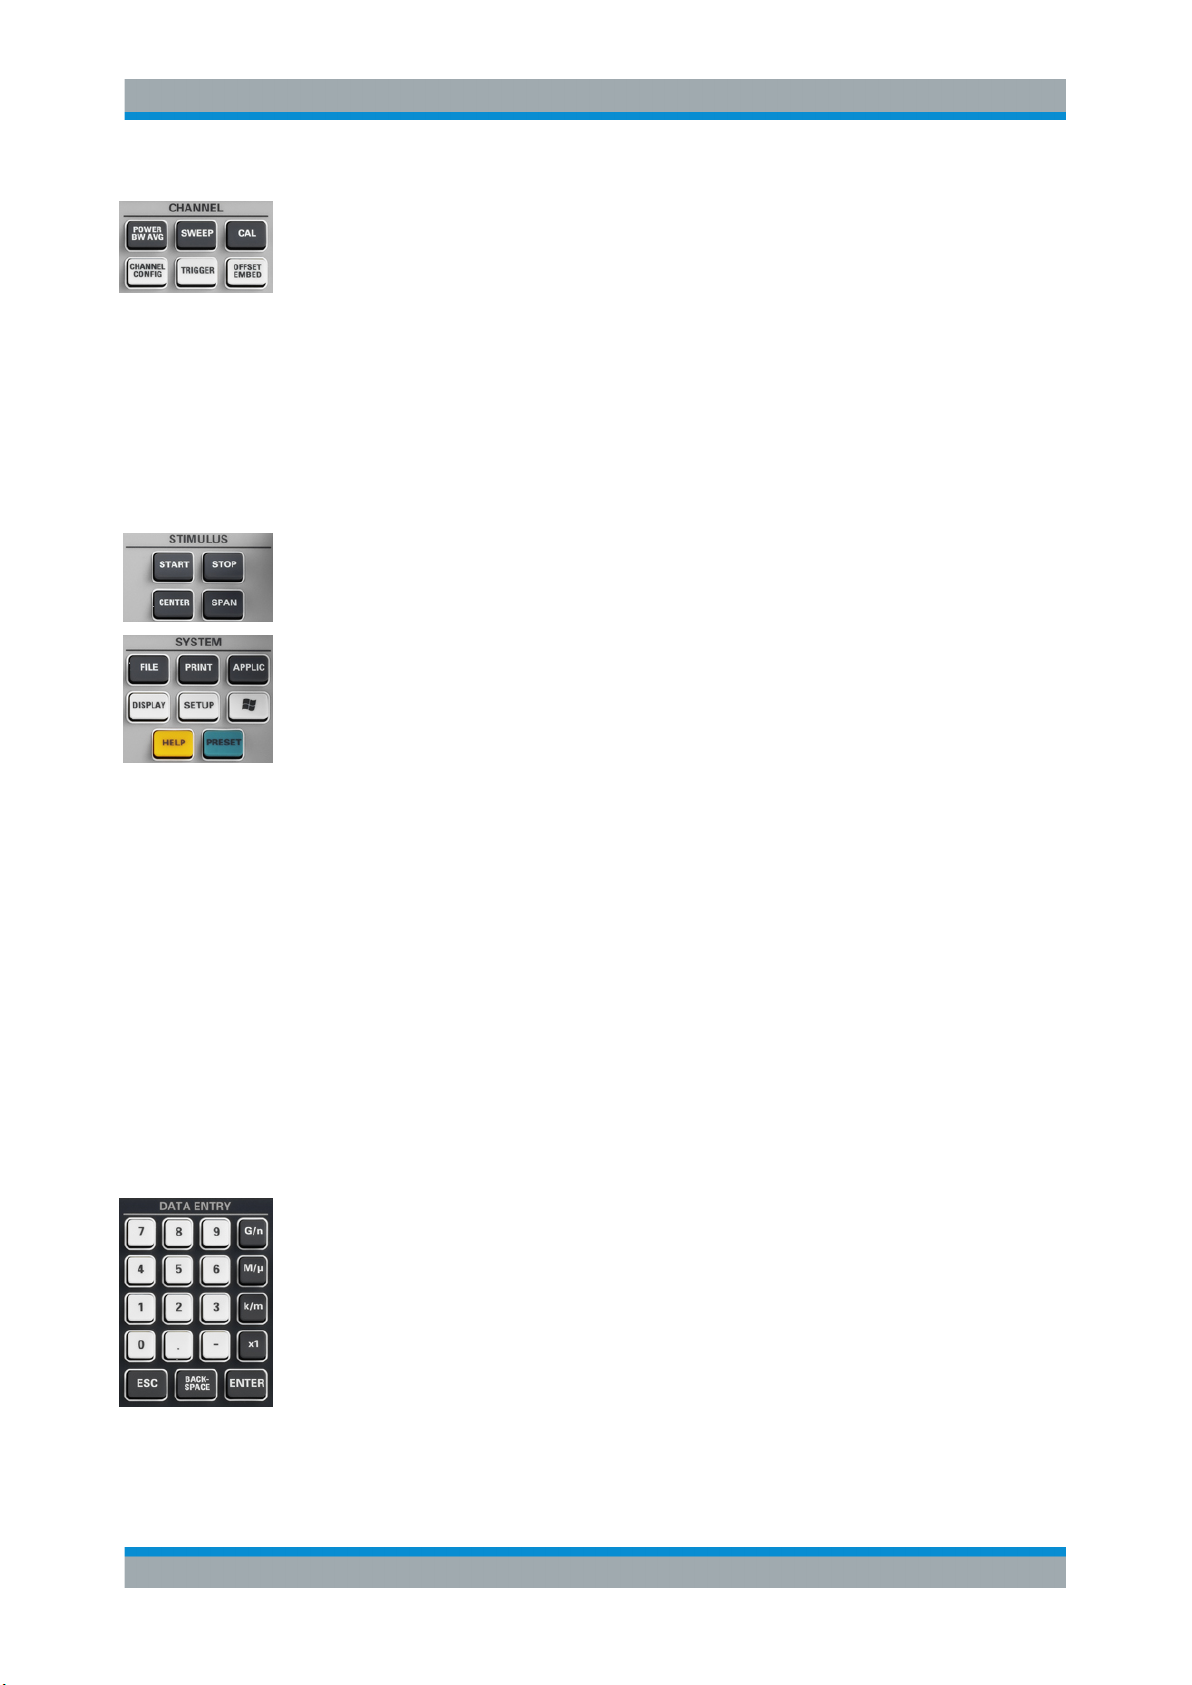
The CHANNEL keys give access to the hardware-related (channel) settings.
●
The [POWER BW AVG] settings define the power of the internal signal source, the
IF bandwidth, and the sweep average.
●
The [SWEEP] settings define the scope of measurement, including the sweep type
and the number of measured sweeps.
●
[CAL] provides all functions that are necessary to perform a system error correction
(calibration).
●
[CHANNEL CONFIG] provides functions for channel management.
●
The [TRIGGER] settings control the start of the measurement sequence.
●
[OFFSET EMBED] provides a selection of length offset parameters to shift the
measurement plane.
The STIMULUS keys ([START], [STOP], [CENTER], [SPAN]) define the sweep range,
depending on the sweep type.
The SYSTEM keys provide general system settings.
●
[FILE] provides standard Windows® functions used to create, save, recall or print
recall sets, to copy the active screen and to shut down the application.
●
The [PRINT] settings control an external printer that is used to print a hardcopy of
the current recall set.
●
[APPLIC] gives access to external software tools and optional extensions of the
analyzer firmware.
●
[DISPLAY] gives access to all display settings and to the functions which activate,
modify and arrange different diagrams.
●
[SETUP] provides general system settings which are not restricted to a particular
recall set.
●
The Windows® key opens the startup menu of the Windows® operating system
from where you can perform system configurations and call up additional software
utilities.
●
[HELP] opens the context-sensitive help system of the analyzer.
●
[PRESET] performs a preset of the instrument settings.
ZNB
3.1.3 Data Entry Keys
The keys in the DATA ENTRY keypad are used to enter numbers, units, and characters. The data entry keys are only enabled while the cursor is placed on a data input
field in a dialog or in the Help navigation pane.
●
The keys 0 to 9 enter the corresponding numbers.
●
The function of the "." and "–" keys depends on the data type of the active input
field:
– In numeric input fields, the keys enter the decimal point and a negative sign for
the entered numeric value. Multiple entries have not effect.
– In character input fields, the keys enter a dot and a hyphen, respectively. Both
entries can be repeated as often as desired.
27Getting Started 1316.0062.02 ─ 26
Page 30
R&S® ZNB/ZNBT
Instrument Tour
Front Panel R&S
●
The function of the four unit keys depends on the data type of the active input field;
see Chapter 4.5, "Entering Data", on page 54.
– In numeric input fields, the G/n, M/μ, k/m or x1 keys multiply the entered value
(-)9
(-)6
with factors of 10
, 10
(-)3
, 10
or 1 and add the appropriate physical unit. x1
is equivalent to ENTER and confirms the previous entry.
– In character input fields, the G/n, M/μ, k/m keys enter the letters G, M, K,
respectively. x1 is equivalent to ENTER and confirms the previous entry.
●
ESC is used to:
– Cancel entries / close dialogs without activating the entries made (equivalent to
the "Close" button).
– Close the Help system.
●
ENTER is used to:
– Activate the selected active control element, e.g. a button in a dialog or a link in
the "Contents" page of the Help system.
– Confirm selections and entries made and close dialogs (equivalent to the "OK"
button).
– Compress or expand menus or the Help table of contents
●
BACKSPACE deletes the last character before the cursor position or the selected
character sequence or numeric value.
ZNB
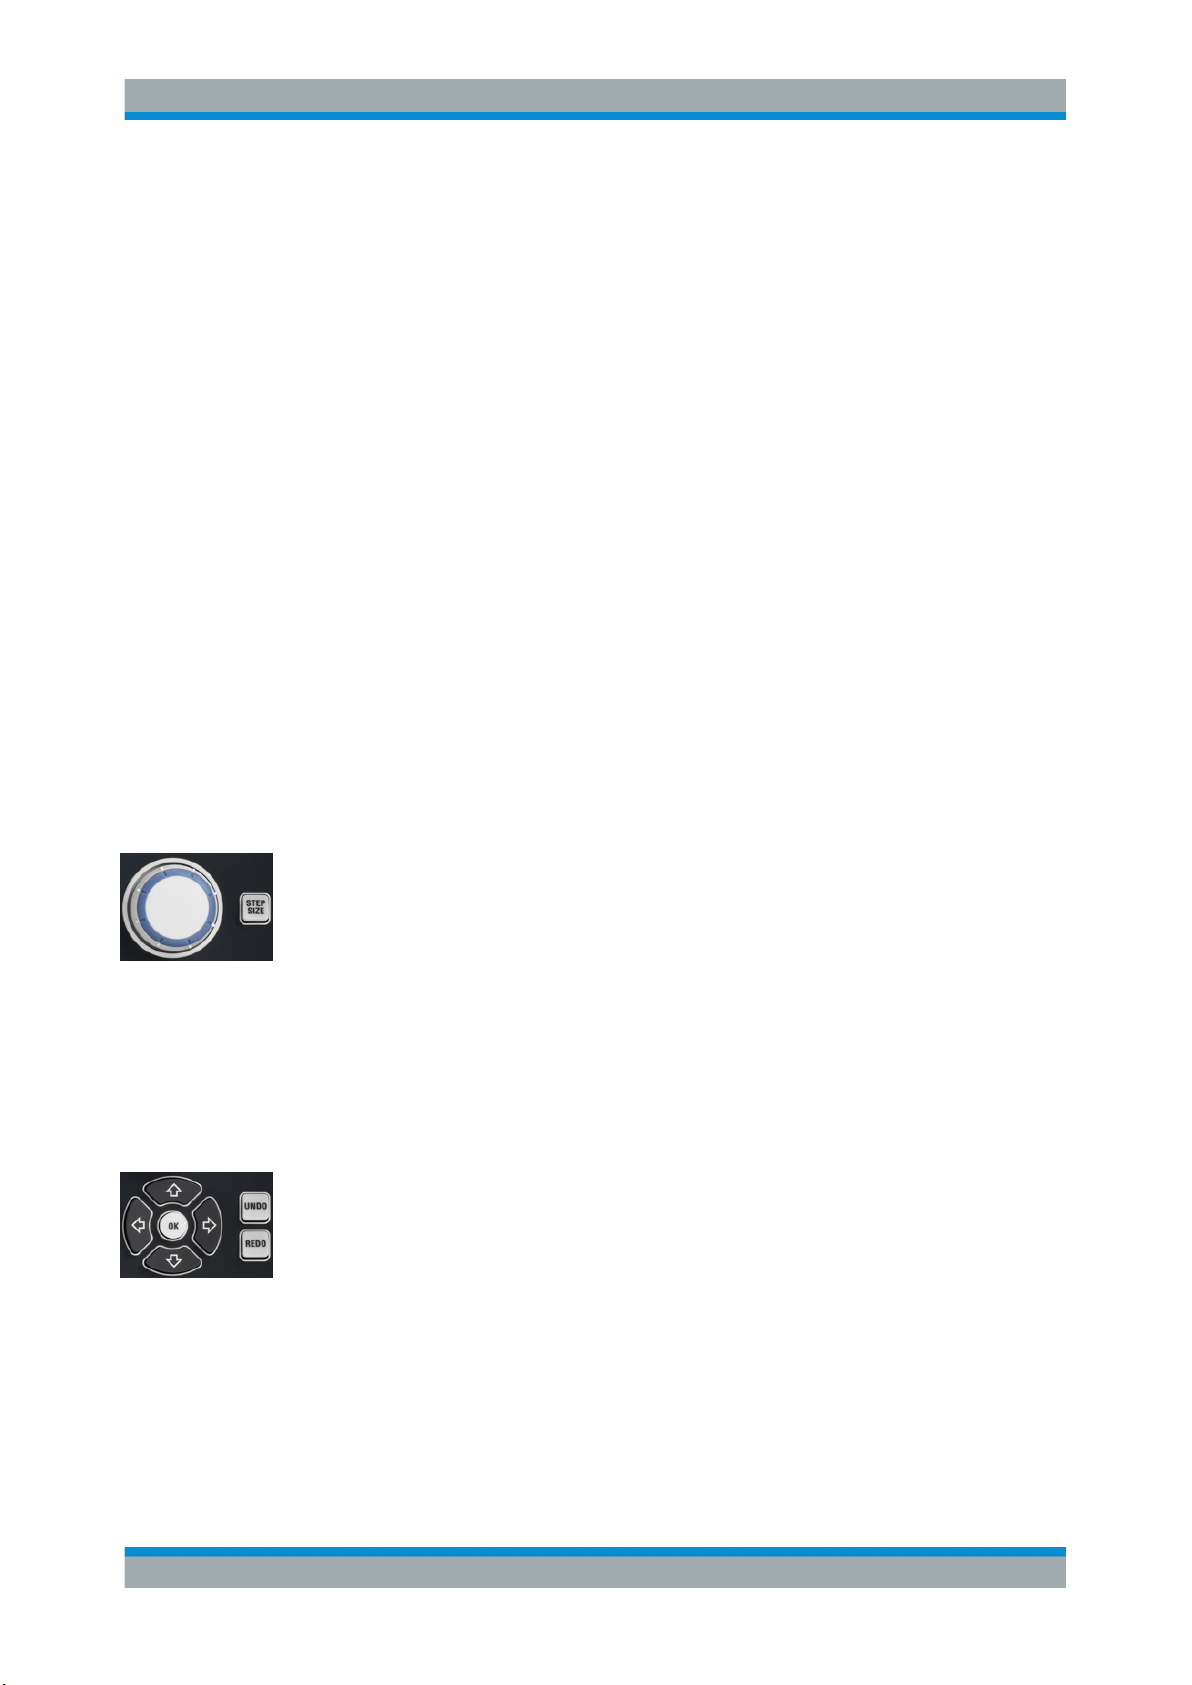
3.1.4 Rotary Knob
The rotary knob increases and decreases numerical values, scrolls within lists, activates controls and confirms entries. Turning or pressing the rotary knob is equivalent to
the action of the "Cursor Up" and "Cursor Down" navigation keys or of the ENTER key
in the DATA ENTRY keypad, respectively.
STEP SIZE opens an input box to select the steps (in units of the current physical
parameter) between two consecutive numerical values. The step size is also valid for
value changes using the "Cursor Up" and "Cursor Down" keys. See also Chapter 4.5.2,
"Using the Numeric Editor", on page 56.
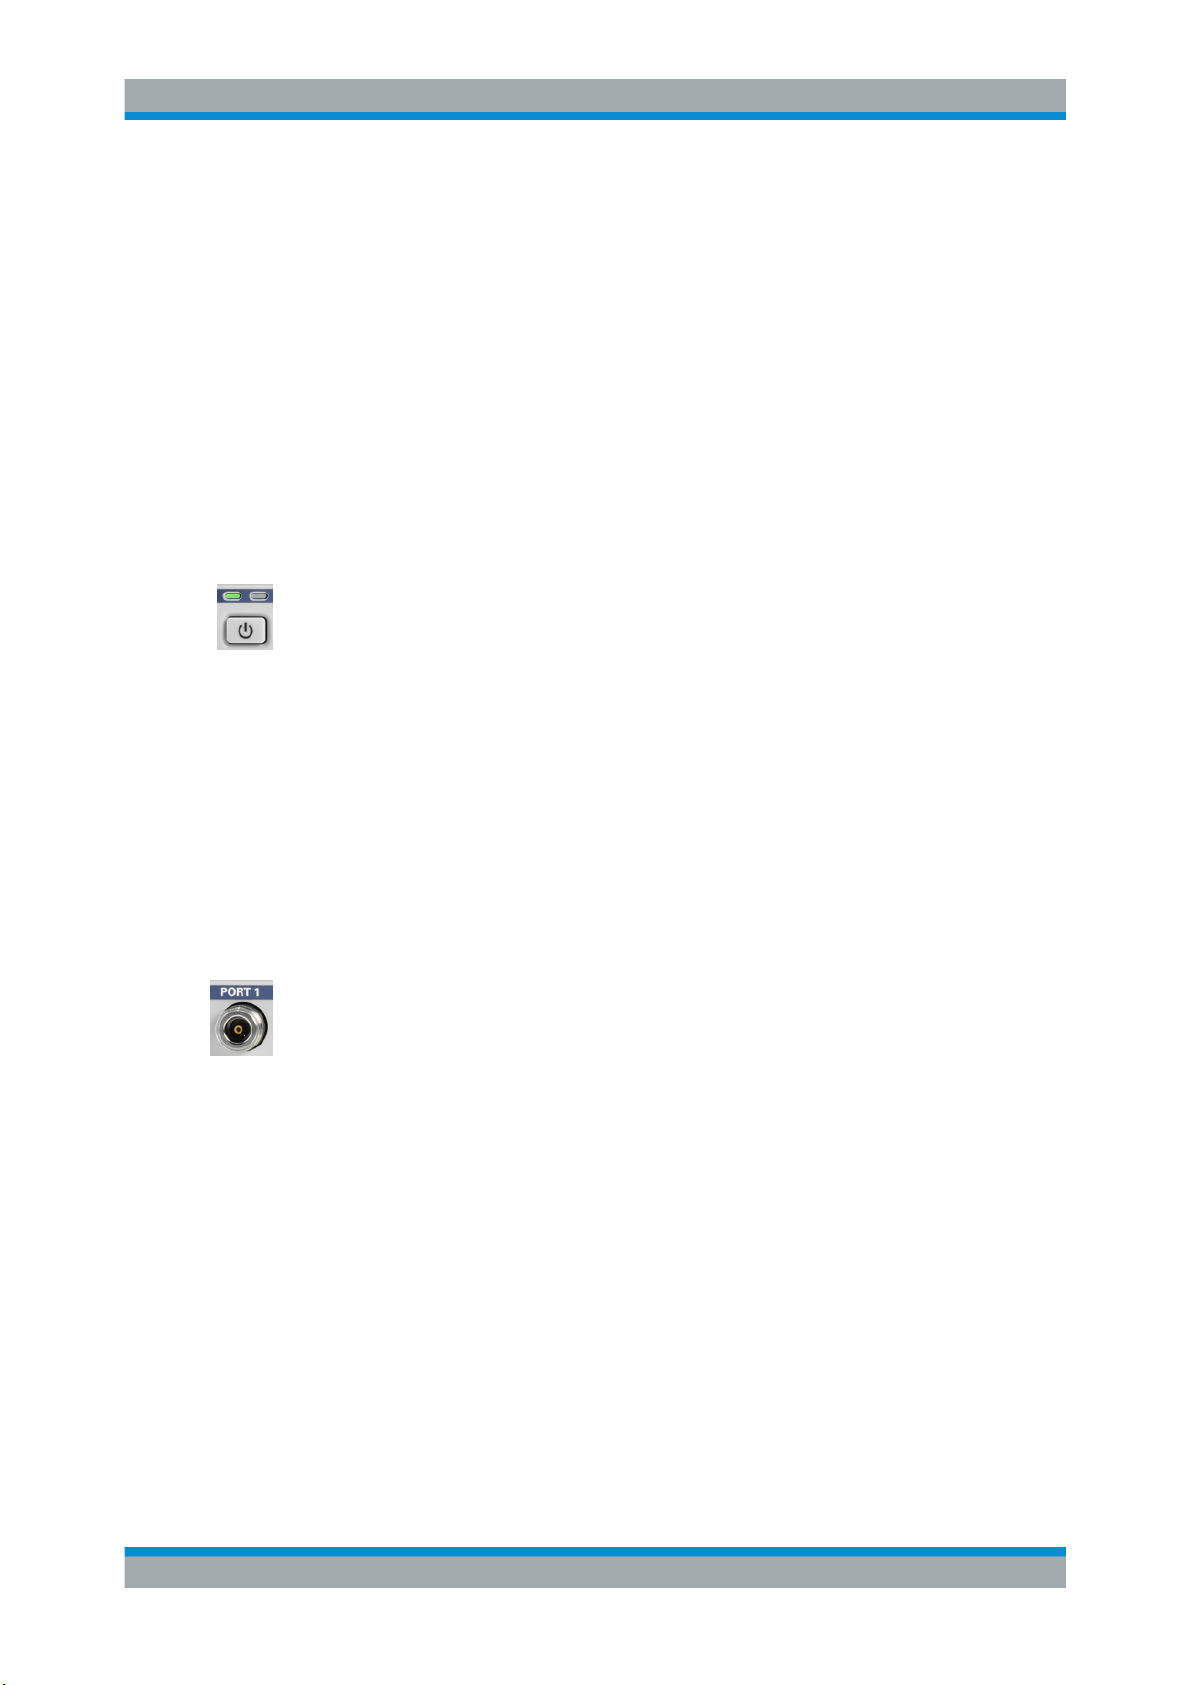
3.1.5 Navigation Keys
The keys in the NAVIGATION keypad are used to navigate within the touchscreen and
the help system, to access and control active elements.
The "Cursor Up" and "Cursor Down" keys are used to:
●
Scroll up and down in lists, e.g. among menu items, in a list of keywords, in the
Help table of contents, or in the Help index
●
Navigate between table rows in diagrams. Press "OK" to toggle between navigation
mode and data entries.
●
Increase and decrease numerical input values
"Cursor Up" (Down) become inactive as soon as the beginning of the list is reached.
"Cursor Up" (Down) is equivalent to a rotation of the rotary knob to the right (left).
28Getting Started 1316.0062.02 ─ 26
Page 31
R&S® ZNB/ZNBT
Instrument Tour
The "Cursor Left" and "Cursor Right" keys are used to:
●
Move the cursor to the left or right within input fields
●
Navigate between table columns in diagrams. Press "OK" to toggle between navigation mode and data entries.
●
Compress or expand menus or the Help table of contents
●
Move the highlighted item in the menu bar of the active application
ENT OK is equivalent to the action of the ENTER key in the DATA ENTRY keypad.
UNDO reverses the last action, if possible. REDO reverses the action of the UNDO
button.
3.1.6 Standby Key
The standby toggle switch is located in the bottom left corner of the front panel.
The key serves two main purposes:
●
Toggle between standby and ready state; see Chapter 2.8, "Standby and Ready
State", on page 15.
●
Shut down the instrument; see Chapter 2.7, "Starting the Analyzer and Shutting
Down", on page 14.
Front Panel R&S
ZNB
3.1.7 Front Panel Connectors
The test ports and four USB connectors are located on the front panel of the R&S ZNB.
3.1.7.1 Test Ports
Numbered connectors:
●
type N female for R&S ZNB4 and R&S ZNB8
●
3.5 mm male for R&S ZNB20
●
2.92 mm (K) male for R&S ZNB40
The test ports serve as outputs for the RF stimulus signal and as inputs for the measured RF signals from the DUT (response signals).
●
With a single test port, it is possible to generate a stimulus signal and measure the
response signal in reflection. For a measurement example, refer to Chapter 5.2,
"Reflection S-Parameter Measurement", on page 71.
●
With more than one test port, it is possible to perform full two-port, 3-port, ... , or nport measurements; see Chapter 5.1, "Transmission S-Parameter Measurement",
on page 64.
In the standard R&S ZNB configuration, all test ports are supplied by a common
source. Four-port instruments are available with an optional second source. For the
R&S ZNBT, an internal second source is automatically added if the instrument is
equipped with 12 ports or more.
29Getting Started 1316.0062.02 ─ 26
Page 32
R&S® ZNB/ZNBT
3.1.7.2 USB Connectors
Instrument Tour
Front Panel R&S ZNBT
Maximum input levels
The maximum input levels at all test ports according to the front panel labeling or the
data sheet must not be exceeded.
In addition, the maximum input voltages of the other input connectors at the rear panel
must not be exceeded.
Use a torque wrench when screwing RF cables on the test port connectors.
Four high-speed Universal Serial Bus connectors of type A (master USB).
The USB ports can be used to connect:
●
External PC accessories such as mouse or other pointing devices, a keyboard,
printer or external storage device (USB stick, CD-ROM drive etc.).
●
External measurement equipment such as a calibration unit, power meter, signal
generator or switch matrix.
3.2 Front Panel R&S ZNBT
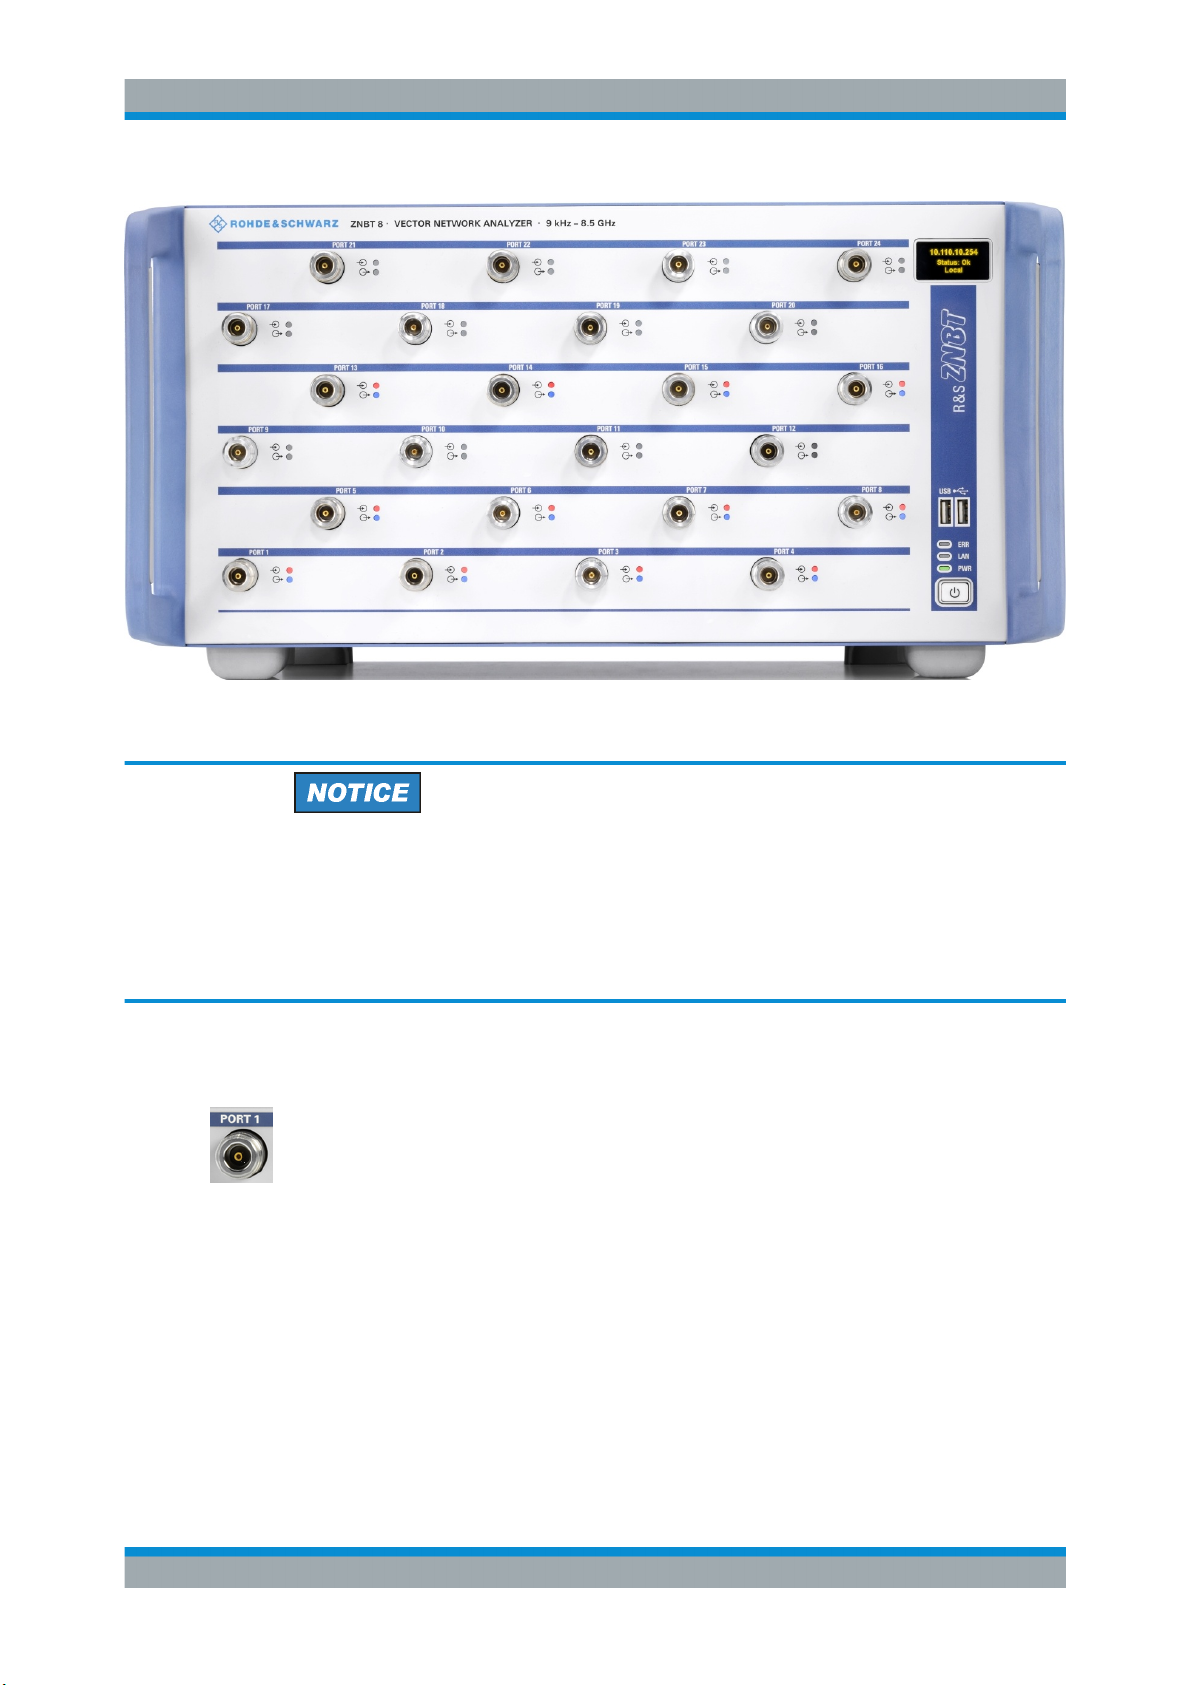
The largest part of R&S ZNBT front panel is reserved for the test ports, with an administrative area to the right. Brief explanations on the connectors and controls and the
rear panel can be found on the next pages.
30Getting Started 1316.0062.02 ─ 26
Page 33
R&S® ZNB/ZNBT
Instrument Tour
Front Panel R&S
Figure 3-2: Front view of R&S ZNBT8 (fully equipped with the maximum 24 ports)
ZNBT
Instrument damage caused by cleaning agents
Cleaning agents contain substances such as solvents (thinners, acetone, etc.), acids,
bases, or other substances. Solvents can damage the front panel labeling, plastic
parts, or screens, for example.
Never use cleaning agents to clean the outside of the instrument. Use a soft, dry, lintfree dust cloth instead.
3.2.1 Test Ports
Numbered test port connectors:
●
Type N female connectors for the R&S ZNBT8. Depending on the equipped port
options there are 4, 8, 12, 16, 20 or 24 test ports.
●
3.5 mm male connectors for the R&S ZNBT20. Depending on the equipped port
options there are 8, 12, 16, 20 or 24 test ports.
The test ports serve as outputs for the RF stimulus signal and as inputs for the measured RF signals from the DUT (response signals). With a single test port, it is possible
to generate a stimulus signal and measure the response signal in reflection. For a
measurement example, refer to Chapter 5.2, "Reflection S-Parameter Measurement",
on page 71. With more than one test port, it is possible to perform full two-port, 3port, ... , or n-port measurements; see Chapter 5.1, "Transmission S-Parameter Mea-
surement", on page 64.
31Getting Started 1316.0062.02 ─ 26
Page 34
R&S® ZNB/ZNBT
Instrument Tour
Front Panel R&S
Maximum input levels
The maximum input levels at all test ports according to the front panel labeling or the
data sheet must not be exceeded.
In addition, the maximum input voltages of the other input connectors at the rear panel
must not be exceeded.
It is recommended that you use a torque wrench when screwing RF cables on the test
port connectors.
Connector usage
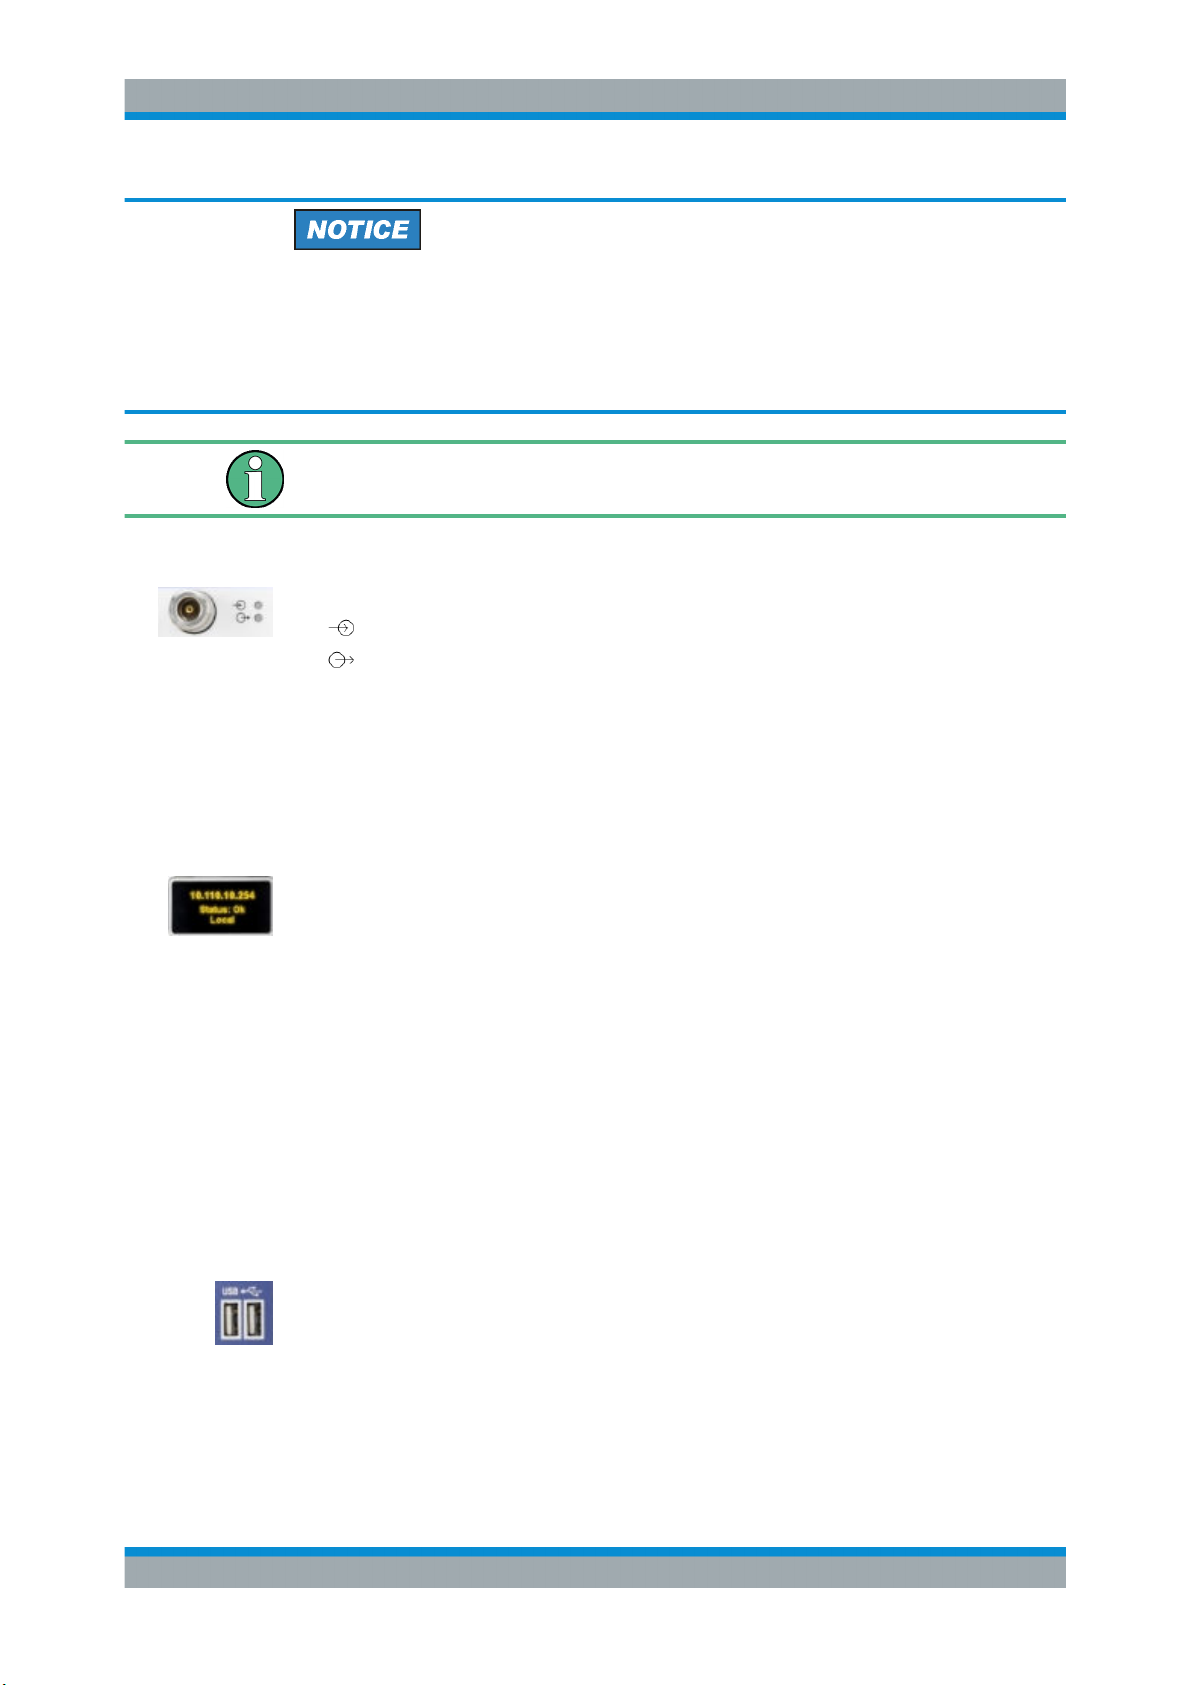
Two LEDs next to each test port indicate the connector usage:
●
on: connector is used as a source port
●
on: connector is used as a receive port
●
both LEDs on: connector is used as a bidirectional (source and receive) port
ZNBT
3.2.2 Administrative Area
Mini display
A miniature display is provided in the upper right-hand corner of the front panel to provide the following instrument information:
●
IP address
●
Operational "Status" or "Error <error code>"
– "OK": no error
– Info: general errors (e.g. related to external devices or remote control)
– Warning: setting errors (e.g. generator power out of range)
– Error <error code>: severe errors (e.g. FW boot errors, HW errors)
●
Control mode:
– "Local": manual interaction (e.g. via Remote Desktop)
– "Remote": remote control (using a script) via a LAN or GPIB connection
USB Connectors
Two USB 2.0 connectors of type A (master USB) are provided on the front panel. They
can be used to connect:
●
External PC accessories such as mouse or other pointing devices, a keyboard,
printer or external storage device (USB stick, CD-ROM drive etc.).
●
External measurement equipment such as a calibration unit, power meter, signal
generator or switch matrix.
32Getting Started 1316.0062.02 ─ 26
Page 35
R&S® ZNB/ZNBT
Instrument Tour
Rear Panel R&S ZNB
LED controls
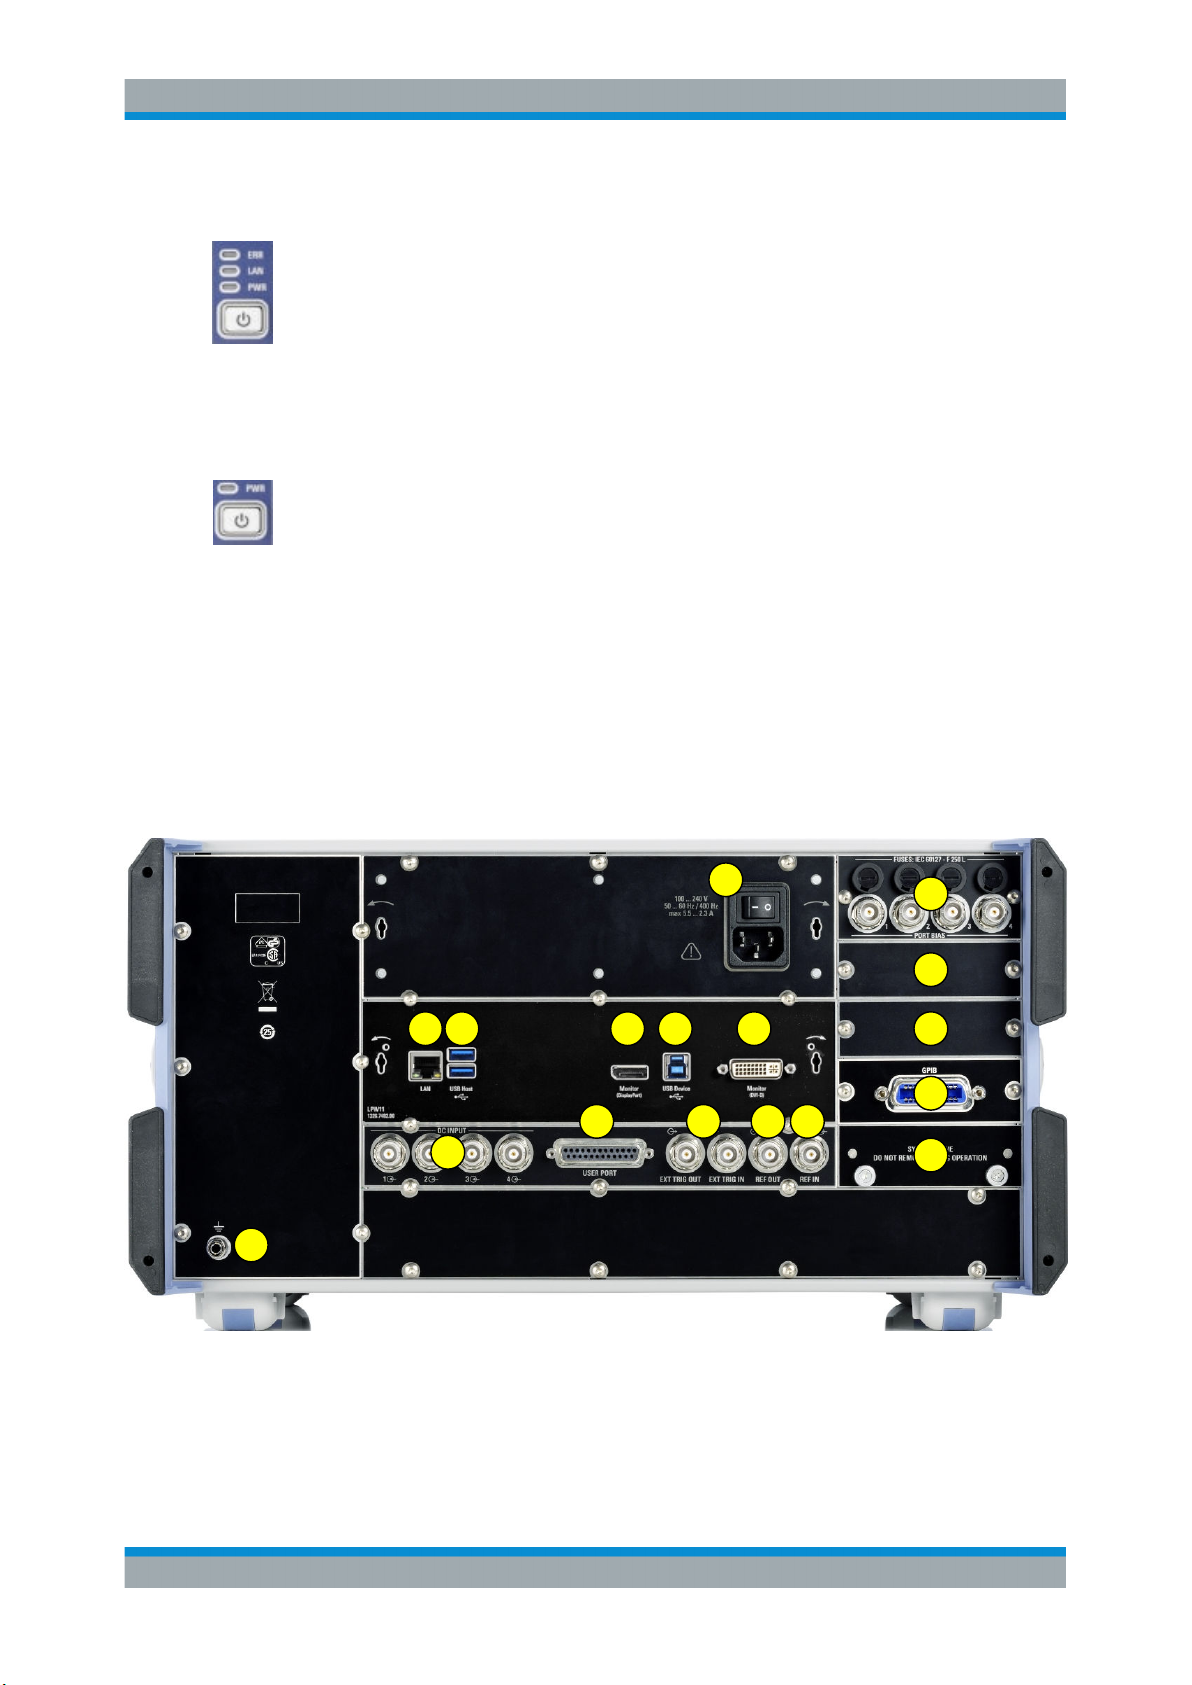
Above the standby toggle switch some LEDs indicate various status information:
●
[ERR]: operation state; if an error occurs, the LED lights up red; for more information on errors and troubleshooting see the R&S ZNB/ZNBT User Manual
●
[LAN]: LAN error occurred
●
[PWR]: power state (ready/standby); see Chapter 2.8, "Standby and Ready State",
on page 15
Standby key
The standby key is located at the lower right-hand corner of the front panel. It serves
two main purposes:
●
Toggle between standby and ready state; see Chapter 2.8, "Standby and Ready
State", on page 15.
●
Shut down the instrument; see Chapter 2.7, "Starting the Analyzer and Shutting
Down", on page 14.
3.3 Rear Panel R&S ZNB
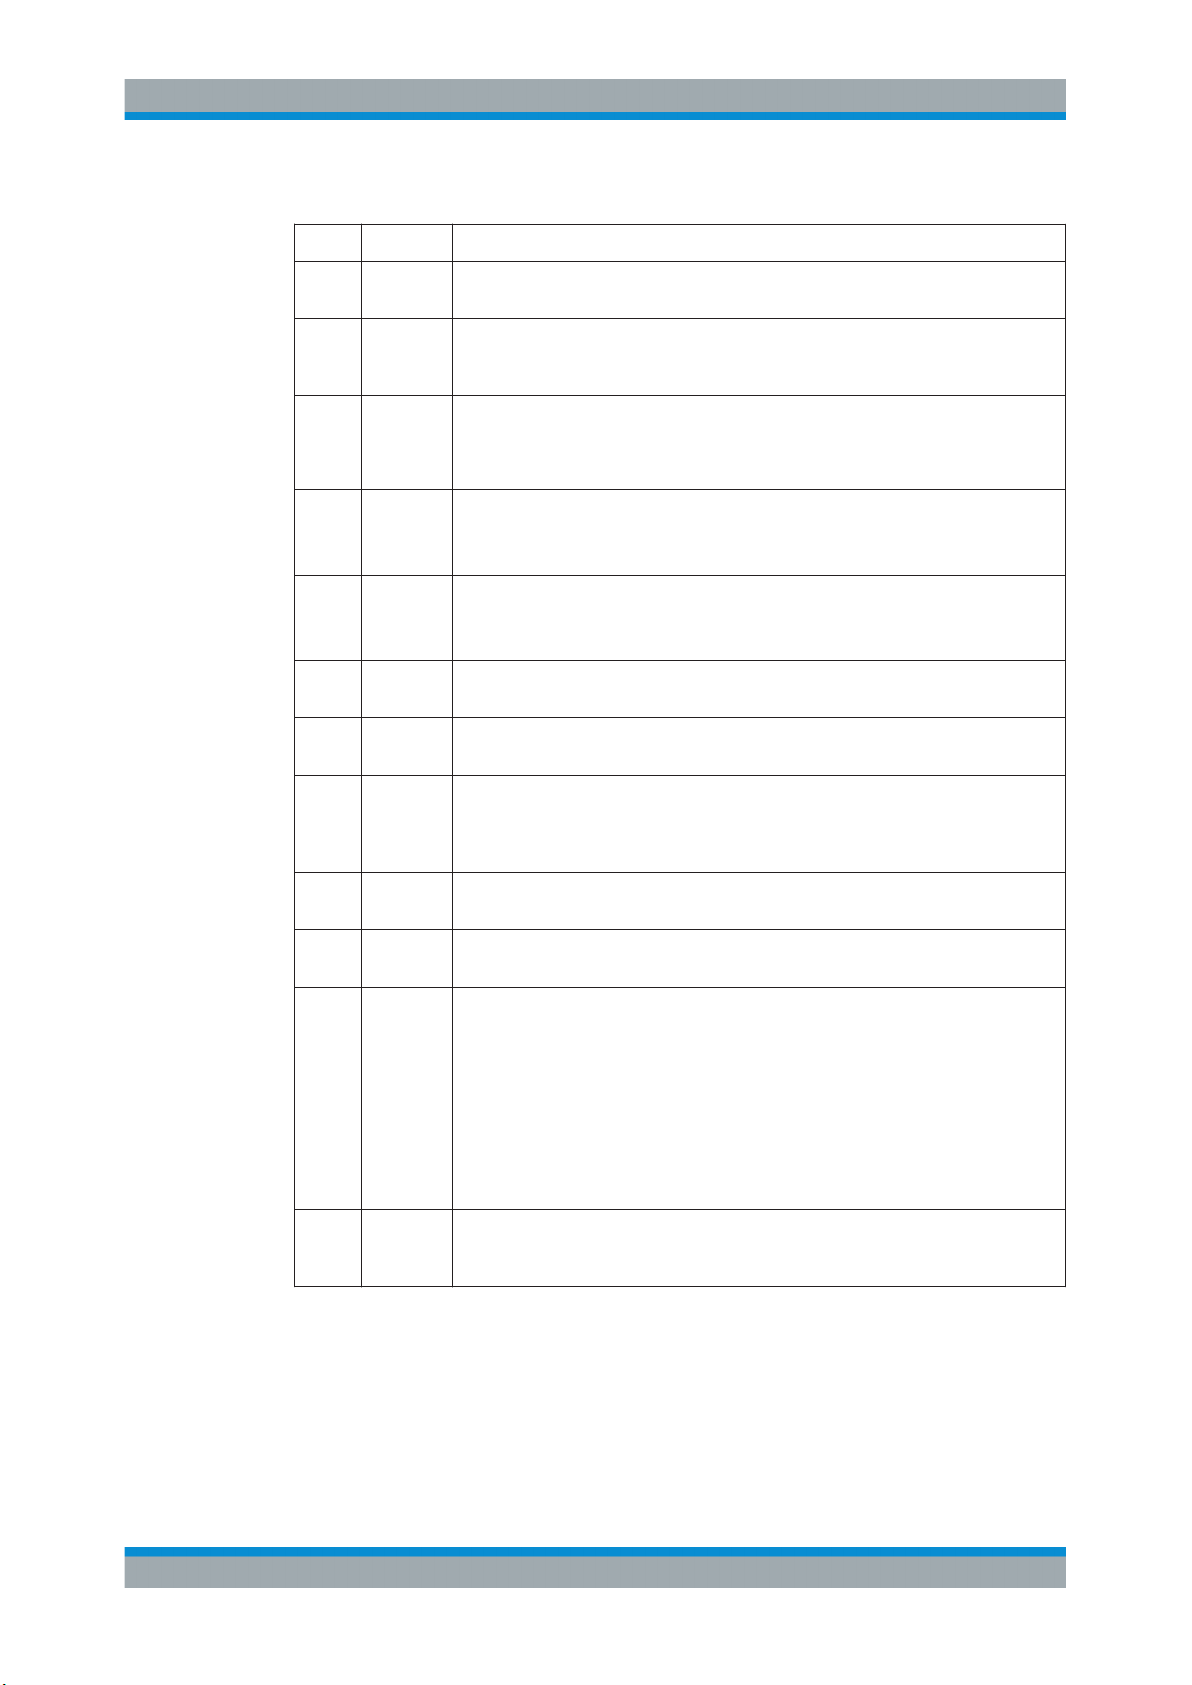
This section gives an overview of the rear panel controls and connectors of the network analyzer.
2123 4 5
17
1
13
14
6
15
16
7
8
9 10
11
Figure 3-3: R&S
ZNB rear view
33Getting Started 1316.0062.02 ─ 26
Page 36
R&S® ZNB/ZNBT
Instrument Tour
Rear Panel R&S ZNB
Table 3-1: Rear panel connectors available on all instruments
Index Label Description
1 (Power
I/O)
2 LAN RJ-45 connector to integrate the instrument to a Local Area Network, primarily for
3 USB /
USB Host
4 Monitor
(DisplayPort)
5 USB
Device
6 Monitor
(DVI-D)
7 USER
PORT
8 EXT TRIG
IN / EXT
TRIG
OUT
Power on / off switch, see Chapter 2.7, "Starting the Analyzer and Shutting Down",
on page 14
remote control purposes; see Chapter 2.12.1, "Assigning an IP Address",
on page 20.
Two additional type A USB host connectors, similar functionality as the USB connectors on the front panel (see Chapter 3.1.7.2, "USB Connectors", on page 30).
●
USB 3.0, labeled "USB Host" for a R&S ZNB equipped with controller LPW11
●
USB 2.0, labeled "USB" for a R&S ZNB equipped with controller LPW10
External monitor connector (DisplayPort); see Chapter 2.9.1, "Connecting a Moni-
tor", on page 16.
This connector is not available for a R&S ZNB equipped with controller LPW10.
Type B USB 3.0 device (slave) connector for remote control of the instrument (see
Chapter 2.9.6, "Connecting a USB Cable for Remote Control", on page 18)
This connector is not available for a R&S ZNB equipped with controller LPW10.
External monitor connector (DVI-D); see Chapter 2.9.1, "Connecting a Monitor",
on page 16.
25-pin D-Sub connector used as an input and output for low-voltage (3.3 V) TTL
control signals
Two BNC connectors for 5 V TTL external trigger signals
9 REF OUT BNC output for the internal reference frequency of the R&S ZNB. Use this connector
to synchronize other instruments to the analyzer.
10 REF IN BNC input for an external reference frequency. Use this connector to synchronize
the R&S ZNB to another device.
11 (System
drive)
12 (Ground
connector)
Contains the removable system hard disk of the R&S ZNB, containing all software
(including the operating system and the VNA application) and data. No other hard
disk is built in. Do not remove the disk during operation.
Option R&S ZNB-B19 Var. 10 provides an additional removable HD with 64bit operating system and firmware for instruments with controller LPW11.
Option R&S ZNB-B19 Var. 07 provides an additional removable HD with 64bit operating system and firmware for instruments with controller LPW10.
Option R&S ZNB-B19 Var. 02 provides an additional removable HD with 32bit operating system and firmware for instruments with controller LPW10.
The ground connector provides the ground of the analyzer's supply voltage. Use this
connector for ESD protection; see "Instrument damage caused by electrostatic dis-
charge" on page 12.
34Getting Started 1316.0062.02 ─ 26
Page 37
R&S® ZNB/ZNBT
Instrument Tour
Rear Panel R&S ZNBT
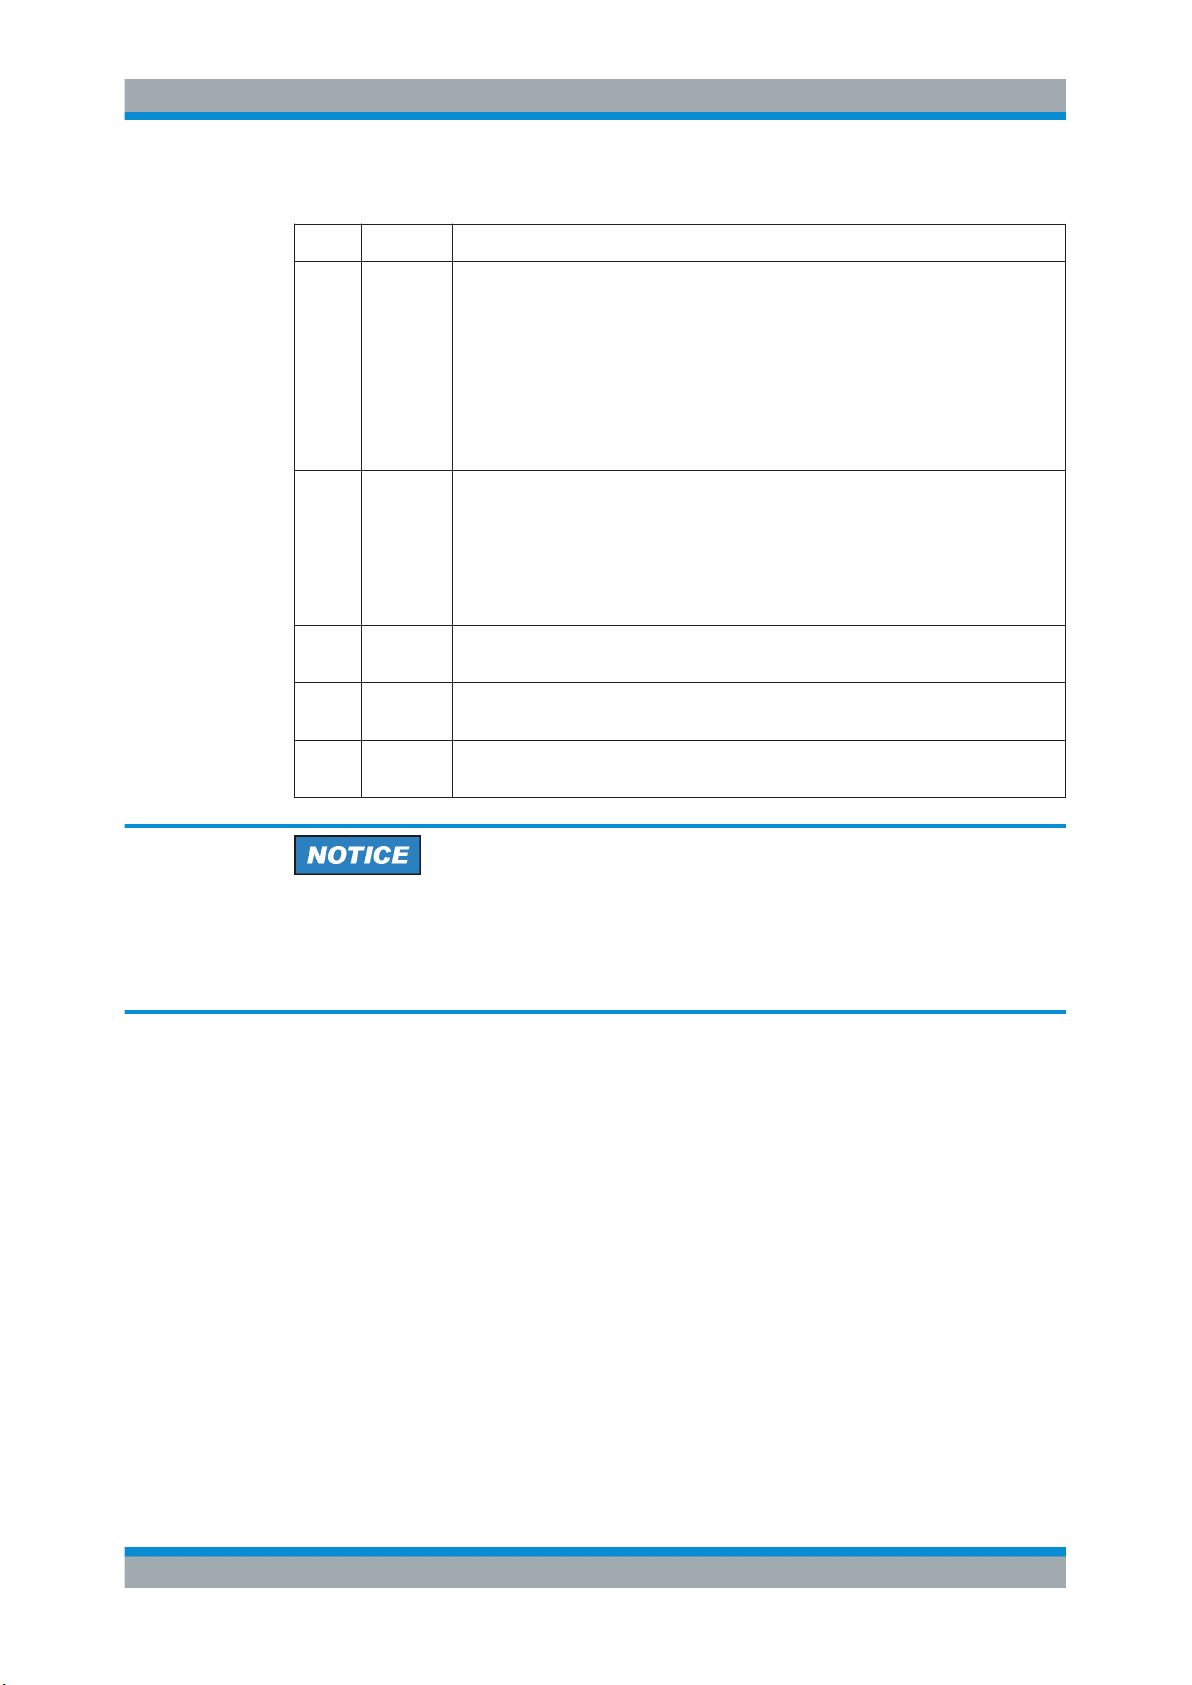
Table 3-2: Optional rear panel connectors
Index Label Description
13 Bias Tees
or
RFFE GPIO
Interface
14 Device
Control
15 Handler
I/O
16 GPIB Option R&S ZNB-B10 provides a GPIB bus connector according to standard IEEE
17 DC INPUT Option R&S ZNB-B81"DC Inputs" provides four BNC inputs for DC measurements
This slot can be equipped with one of the following options:
●
R&S ZNB-B1, "Bias Tees", providing two or four additional BNC inputs labeled
BIAS 1 ... 4 (for two-port or four-port analyzers). The inputs can be used to
apply an external DC voltage (bias) to the test ports. For fuse replacement,
refer to Chapter 7.3, "Replacing Fuses", on page 77.
●
R&S ZN-B15 "RFFE - GPIO Interface".
25-pin female connector, providing:
– 2 independent RF Front-End (RFFE) interfaces according to the MIPI® Alli-
ance "System Power Management Interface Specification".
– 10 General Purpose Input/Output (GPIO) pins.
Option R&S ZNB-B12 "Device Control" provides a PCIe and a Direct Control connector.
The Direct Control interface enables direct connections between the VNA measurement bus and one or more extension devices, such as:
●
An external RFFE GPIO interface R&S ZN-Z15.
●
Switch matrices R&S ZN-Z8x.
●
Multiport calibration units R&S ZN-Z154.
Option R&S ZN-B14, Handler I/O (Universal Interface), providing a Centronics 36
input/output connector.
488 / IEC 625.
(adjustable to different voltage ranges).
Input levels, EMC
The maximum input levels and voltages of the input connectors at the front and rear
panel must not be exceeded. Match signals with 50 Ω to comply with EMC directives.
See also Chapter 2.5, "EMI Suppression", on page 13.
3.4 Rear Panel R&S ZNBT
This section gives an overview of the rear panel controls and connectors of the
R&S ZNBT.
35Getting Started 1316.0062.02 ─ 26
Page 38
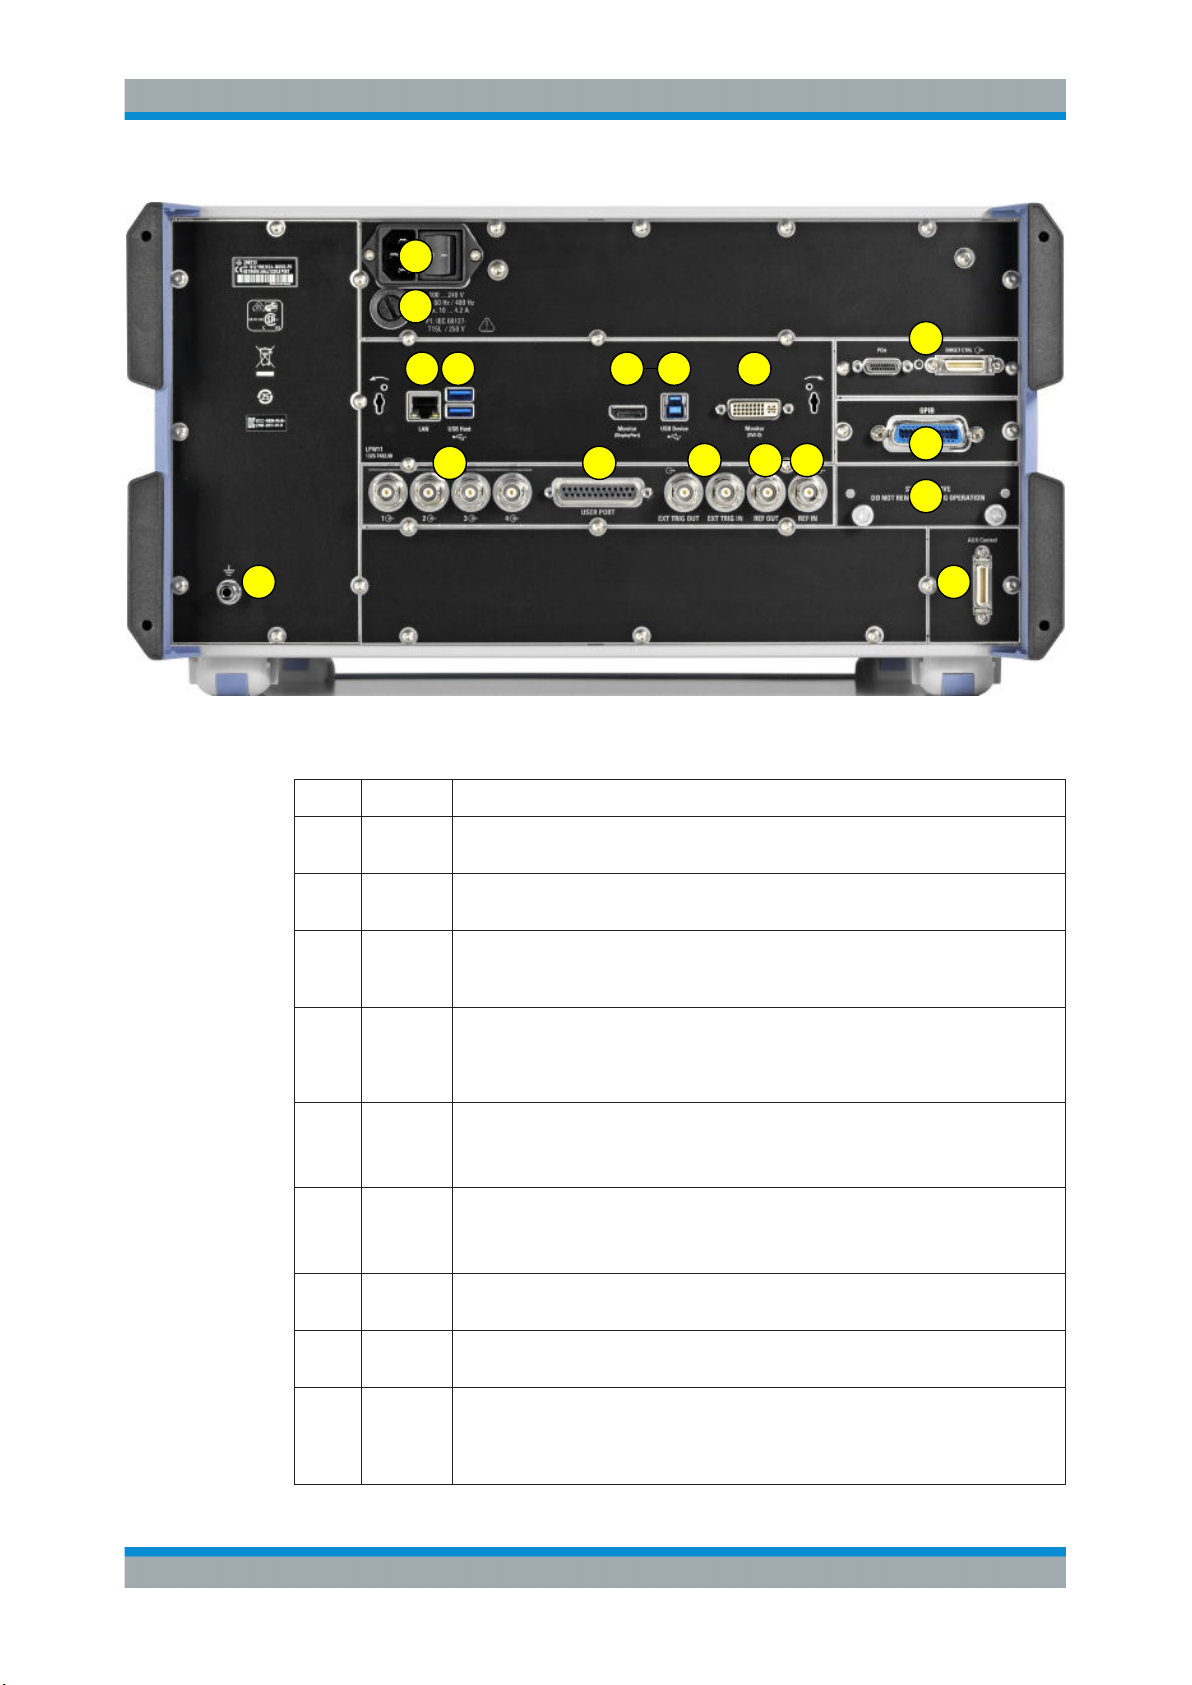
R&S® ZNB/ZNBT
1
2
3 4 5
Instrument Tour
Rear Panel R&S ZNBT
16
76
15
8
9 10
11
13
Figure 3-4: R&S ZNBT20 rear view
Table 3-3: Rear panel connectors available on all instruments
Index Label Description
1 (Power
I/O)
2 (Fuse
holder)
3 LAN RJ-45 connector to integrate the instrument to a Local Area Network, primarily for
4 USB /
USB Host
Power on/off switch, see Chapter 2.7, "Starting the Analyzer and Shutting Down",
on page 14
Fuse holder, see Chapter 7.3, "Replacing Fuses", on page 77
remote control purposes; see Chapter 2.12.1, "Assigning an IP Address",
on page 20.
Two additional type A USB host connectors, similar functionality as the type A host
connectors on the front panel (see "USB Connectors" on page 32).
●
USB 3.0, labeled "USB Host" for a R&S ZNBT equipped with controller LPW11
●
USB 2.0, labeled "USB" for a R&S ZNBT8 equipped with controller LPW10
17
12
14
5 Monitor
(DisplayPort)
6 USB
Device
7 Monitor
(DVI-D)
8 USER
PORT
9 EXT TRIG
IN / EXT
TRIG
OUT
External monitor connector (DisplayPort); see Chapter 2.9.1, "Connecting a Moni-
tor", on page 16.
This connector is not available for a R&S ZNBT8 equipped with controller LPW10.
Type B USB 3.0 device (slave) connector for remote control of the instrument (see
Chapter 2.9.6, "Connecting a USB Cable for Remote Control", on page 18)
This connector is not available for a R&S ZNBT8 equipped with controller LPW10.
External monitor connector (DVI-D); see Chapter 2.9.1, "Connecting a Monitor",
on page 16.
25-pin D-Sub connector used as an input and output for low-voltage (3.3 V) TTL
control signals
Two BNC connectors for 5 V TTL external trigger signals
36Getting Started 1316.0062.02 ─ 26
Page 39
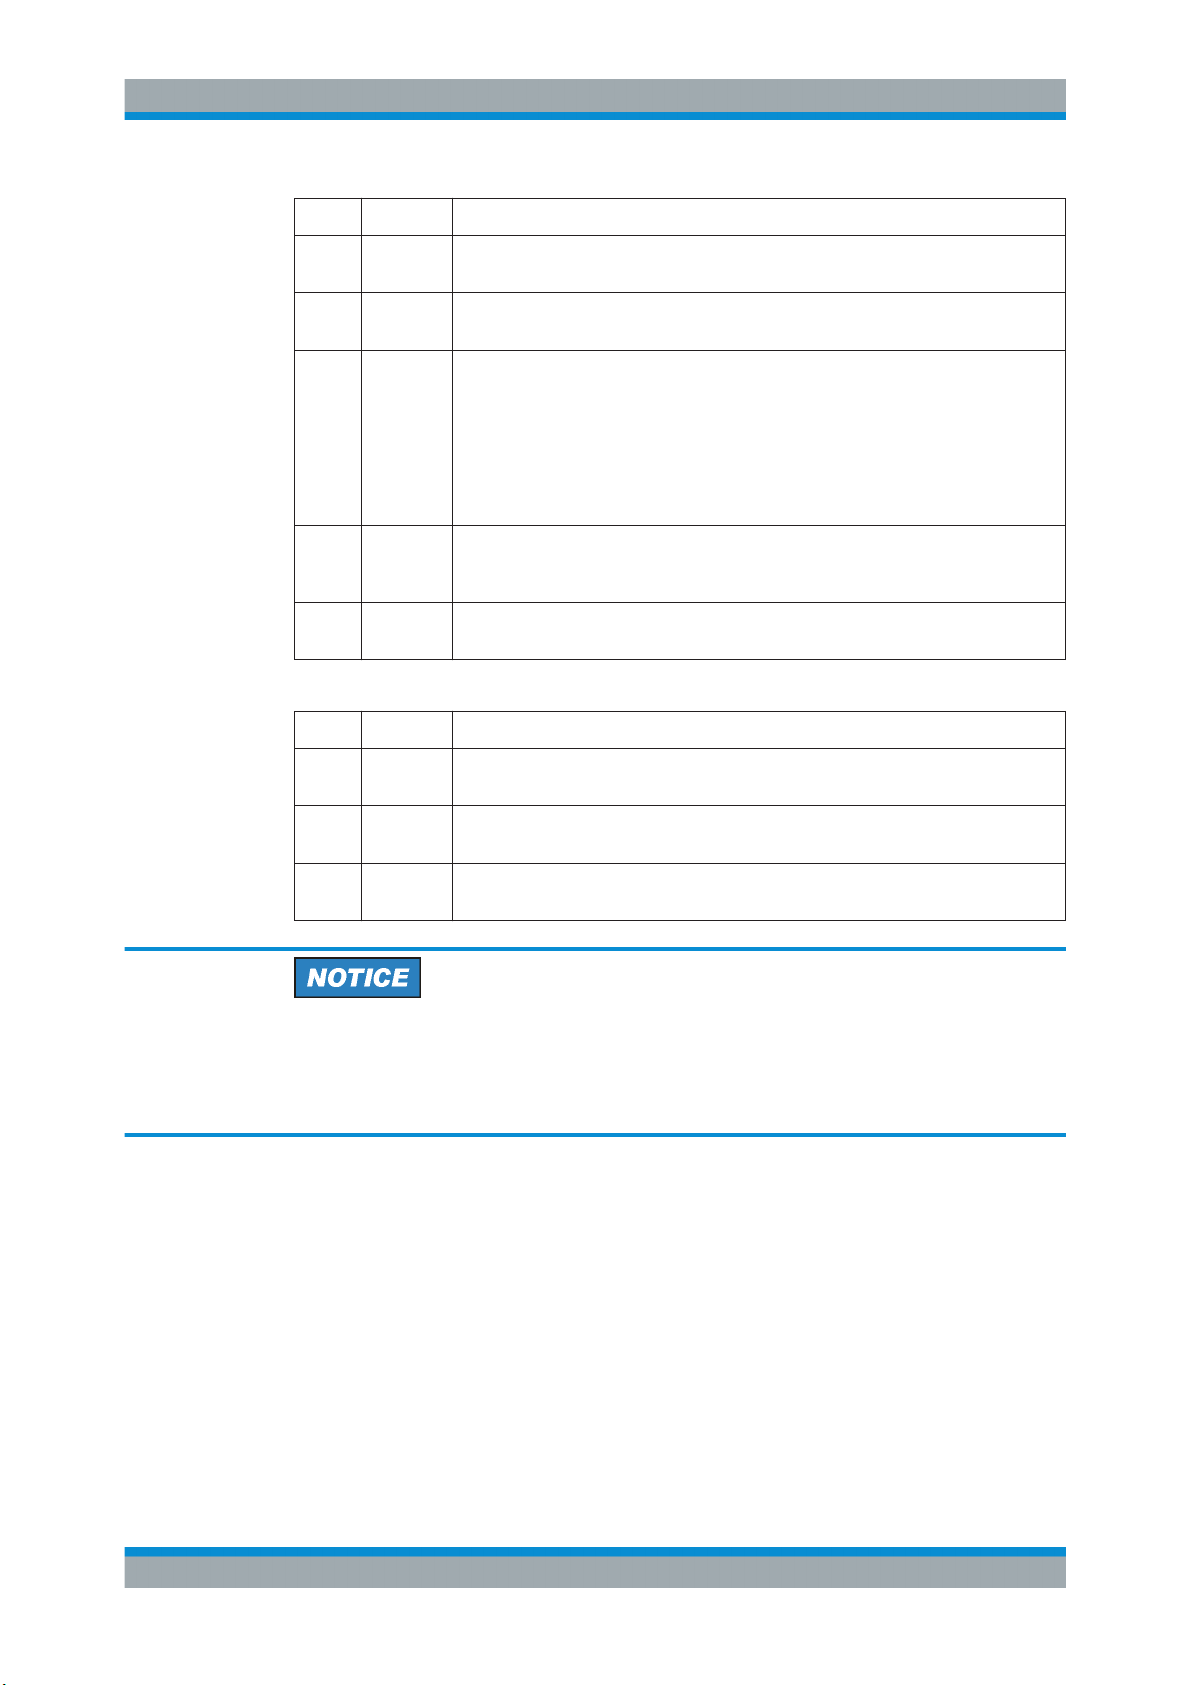
R&S® ZNB/ZNBT
Instrument Tour
Rear Panel R&S ZNBT
Index Label Description
10 REF OUT BNC output for the internal reference frequency of the R&S ZNBT. Use this connec-
tor to synchronize other instruments to the analyzer.
11 REF IN BNC input for an external reference frequency. Use this connector to synchronize
the R&S ZNBT to another device.
12 SYSTEM
DRIVE
13 (Ground
connector)
14 Digital I/O Used to connect an external Handler I/O (option R&S ZNBT-Z14), providing a Cen-
Table 3-4: Optional rear panel connectors
Index Label Description
15 DC INPUT Option R&S ZNBT-B81"DC Inputs" provides four BNC inputs for DC measurements
16 Device
Control
17 GPIB Option R&S ZNBT-B10 provides a GPIB bus connector according to standard IEEE
Contains the removable system hard disk of the R&S ZNBT, containing all software
(including the operating system and the VNA application) and data. No other hard
disk is built in. Do not remove the disk during operation.
Option R&S ZNBT-B19 Var. 11 provides an additional removable HD (including 64bit
operating system and firmware) for instruments equipped with controller LPW11.
Option R&S ZNBT-B19 Var. 10 provides an additional removable HD (including 64bit
operating system and firmware) for a R&S ZNBT8 equipped with controller LPW10.
The ground connector provides the ground of the analyzer's supply voltage. Use this
connector for ESD protection; see "Instrument damage caused by electrostatic dis-
charge" on page 12.
tronics 36 input/output connector.
(adjustable to different voltage ranges).
This slot can be equipped with option R&S ZNBT-B12, providing a PCIe and a Direct
Control connector.
488 / IEC 625.
Input levels, EMC
The maximum input levels and voltages of the input connectors at the front and rear
panel must not be exceeded. Match signals with 50 Ω to comply with EMC directives.
See also Chapter 2.5, "EMI Suppression", on page 13.
37Getting Started 1316.0062.02 ─ 26
Page 40

R&S® ZNB/ZNBT
4 Operating the Instrument
Operating the Instrument
Manual Operation
The following sections describe the basics of manual operation, i.e. how to access
instrument functions and settings via the analyzer GUI. Manual operation is particularly
useful for getting to know the instrument and for trouble shooting.
Manual and remote control of the instrument
In contrast to the R&S ZNB, the R&S ZNBT is primarily intended to be remote-controlled via the GPIB or LAN interface (see chapter 'Remote Control' in the user manual).
However, all instruments can be controlled manually, either using touchscreen and
frontpanel keys (R&S ZNB only), an external monitor in combination with a mouse (see
also Chapter 2.9, "Connecting External Accessories", on page 16) or via Remote
Desktop (see also Chapter 2.12, "Remote Operation in a LAN", on page 20).
To their full extent, manual operation and remote control are described in the GUI Reference and Command Reference chapters of the user manual, respectively. GUI functions and related remote commands are linked bidirectionally. Background information
is provided in the Concepts and Features chapter of the user manual.
4.1 Manual Operation
The analyzer functions are accessible via several tabbed softtools, each presenting
related functions and settings. The function keys on the front panel (R&S ZNB only) or
the on-screen "Hard Key Panel" open the most frequently used softtools.
Manual operation via function keys and softtools provides touch-friendly access to the
instrument functions and settings, avoiding complicated menu structures and long
operating sequences. In general, this approach is recommended. However, sometimes
the toolbar or an object's context menu can offer a shortcut. As a full-fledged alternative for manual operation via mouse and keyboard, also the menu bar provides access
to all instrument functions and settings.
38Getting Started 1316.0062.02 ─ 26
Page 41
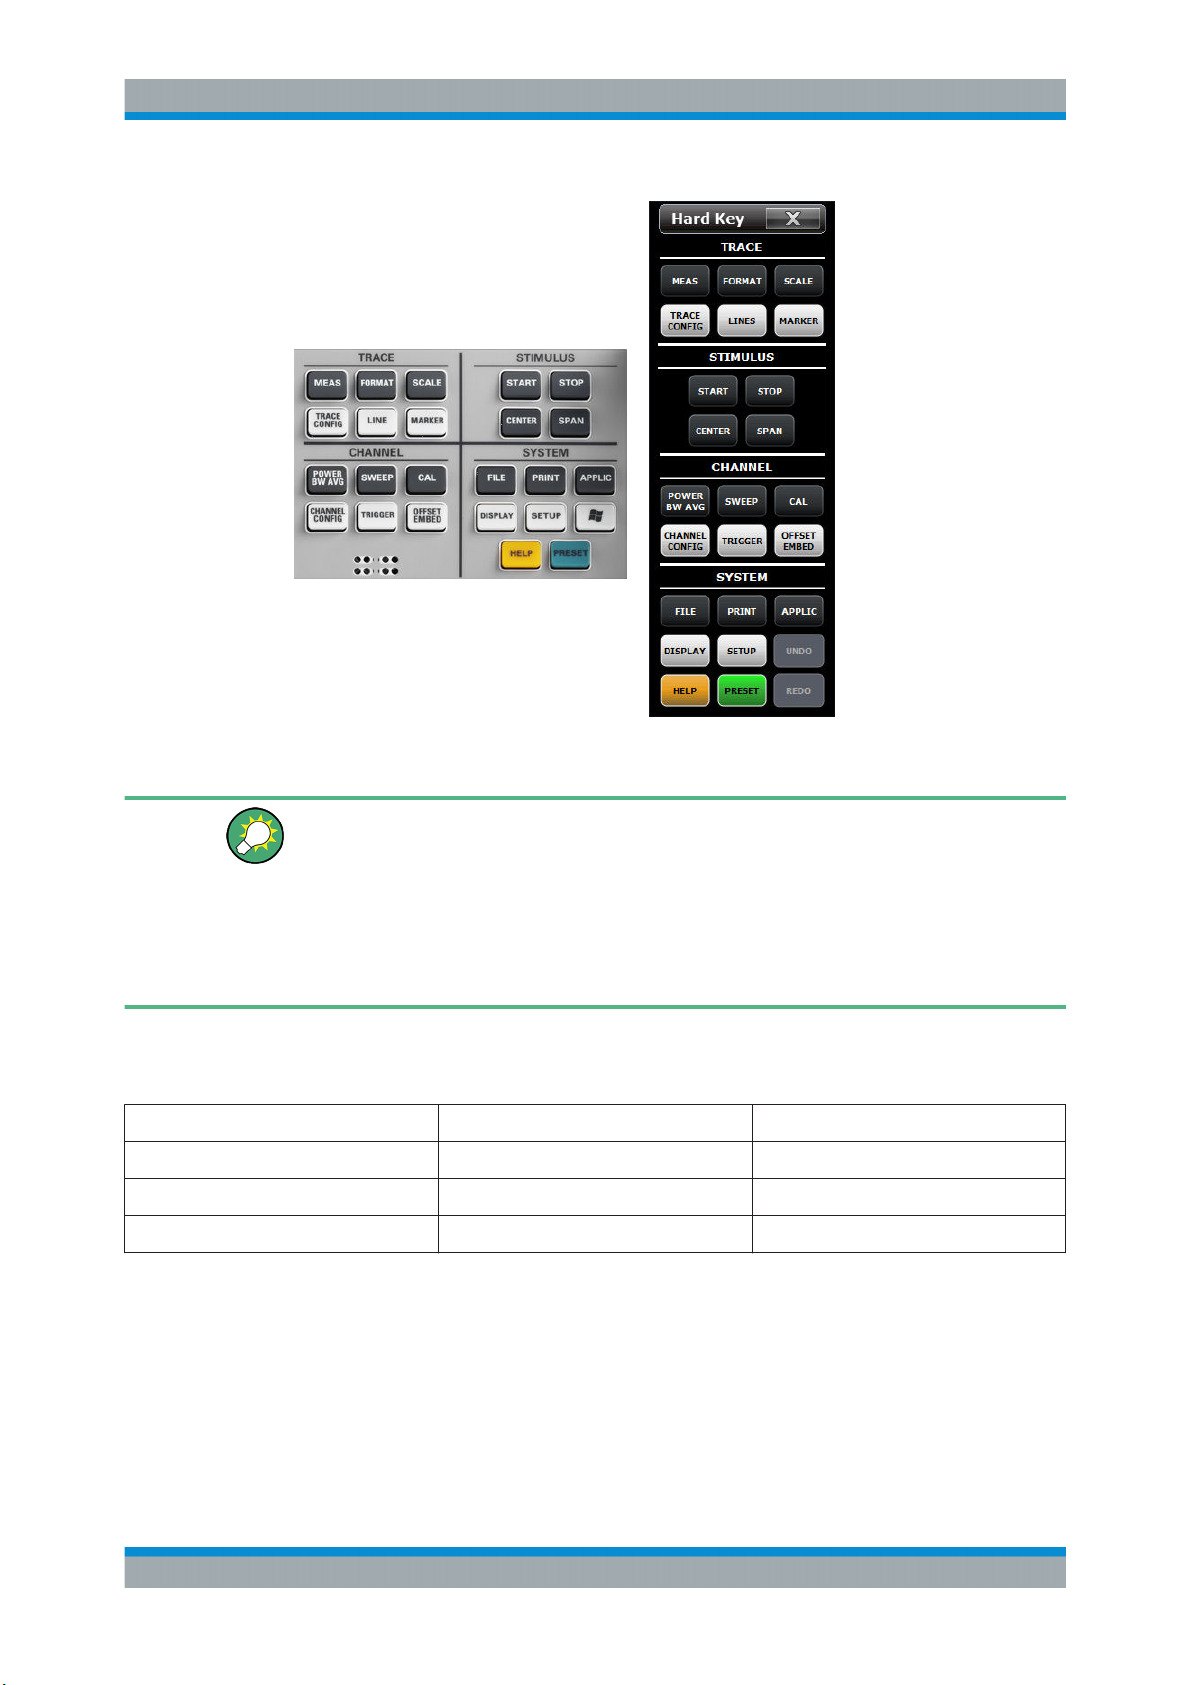
R&S® ZNB/ZNBT
Operating the Instrument
Manual Operation
Figure 4-1: Function Keys
Customizing the screen
The contents of the screen and the size and position of many display and control elements are not fixed. You can display or hide most elements. You can also drag and
drop traces, info fields, and even the softtool panel to your preferred position; see
Chapter 4.4.4, "Using Drag and Drop", on page 54.
For example, you can show/hide the on-screen hardkey panel by selecting/deselecting
"Display" > "View Bar" > "Hard Key Panel On" from the main menu.
The following table shows possible touchscreen operations (R&S ZNB only) with the
corresponding mouse operations.
Touchscreen Mouse Typical task
Tap control element for a short time Click control element (left mouse button) Select button or tab
Tap for an extended time (tap and hold) Click (right button) Open context menu
Tap twice (double-tap) Double-click (left button) Open on-screen keyboard
Using (Virtual) Hardkeys
To access an instrument function:
1. Press a (virtual) key, e.g. the [MEAS] key in the TRACE section.
The corresponding softtool expands at the current docking position.
39Getting Started 1316.0062.02 ─ 26
Page 42
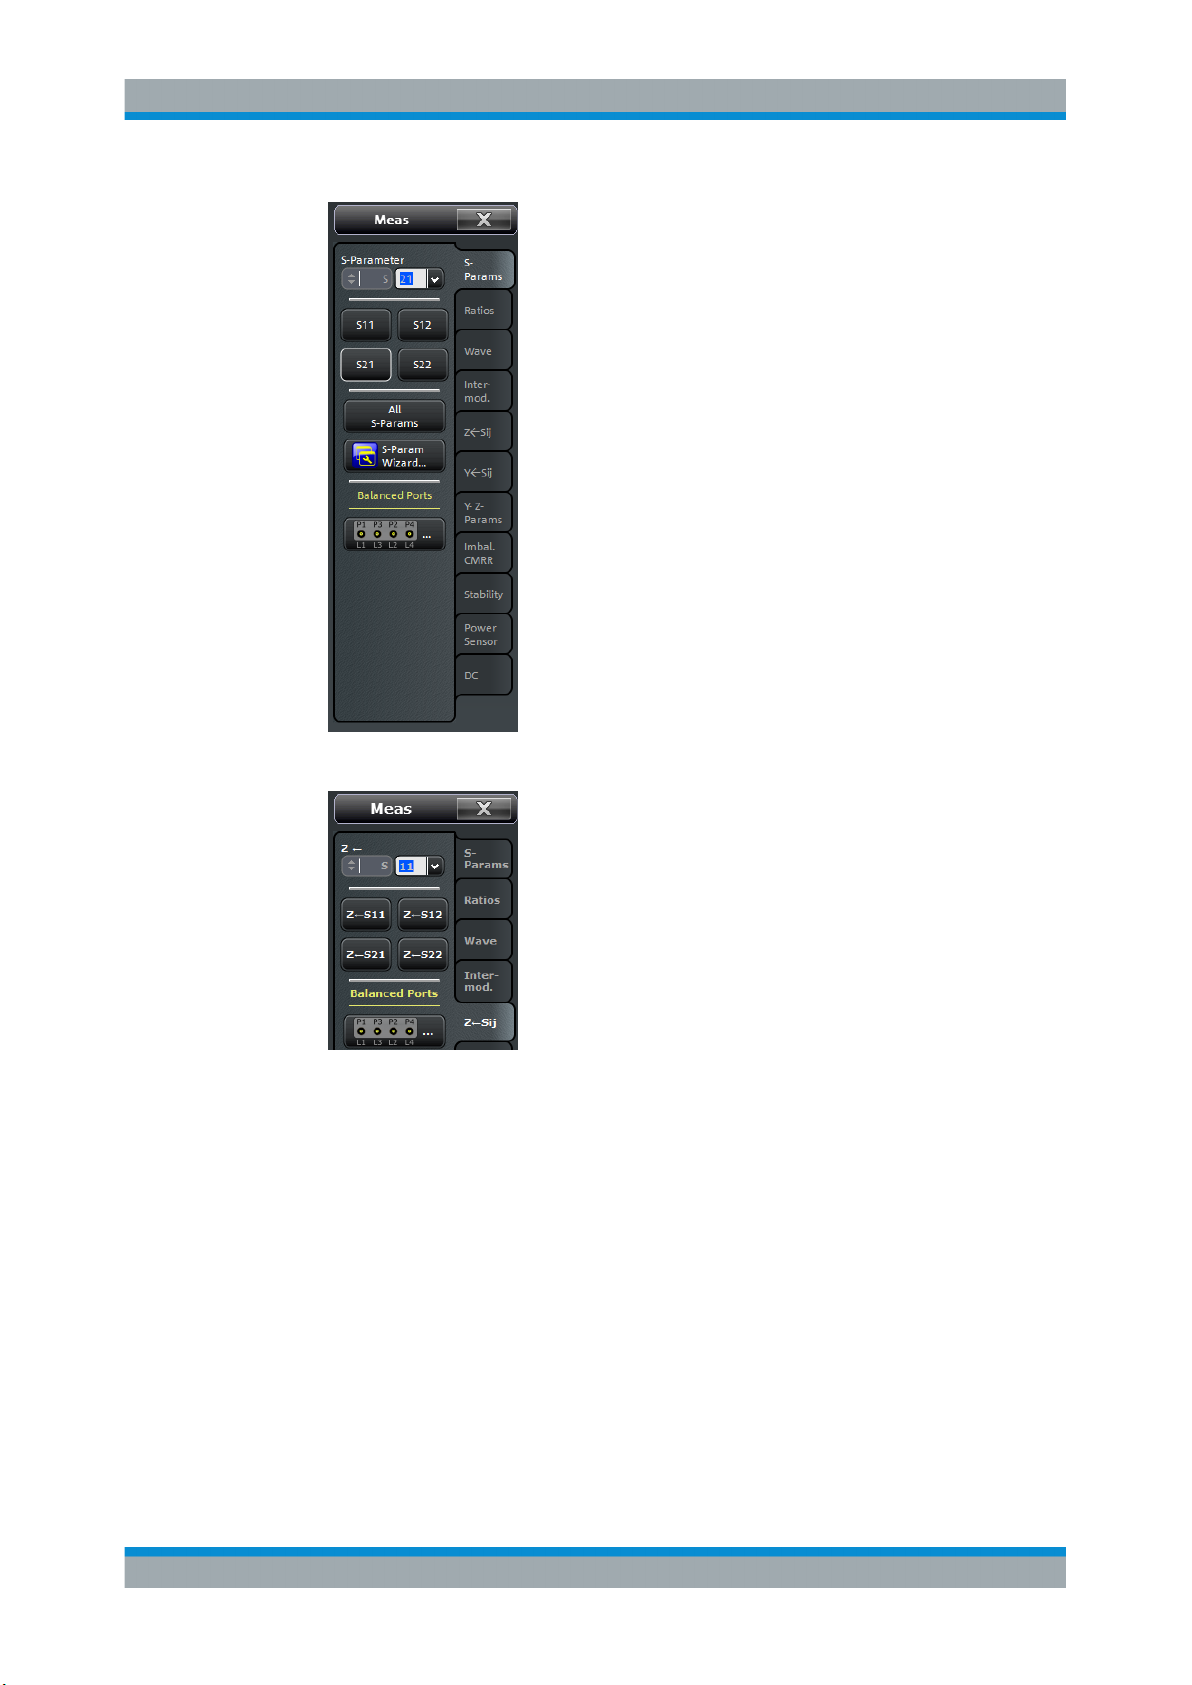
R&S® ZNB/ZNBT
Operating the Instrument
Manual Operation
2. Activate the desired softtool tab, e.g. "Z←Sij".
3. Select a control element, e.g. "Z←S11".
The diagram immediately reflects your selection. The active trace shows the measurement results for the selected measured quantity.
A control element with three dots (e.g. SYSTEM – [SETUP] > "Setup" > "System Config...") opens a dialog, containing a group of related settings, a wizard or additional
information.
40Getting Started 1316.0062.02 ─ 26
Page 43
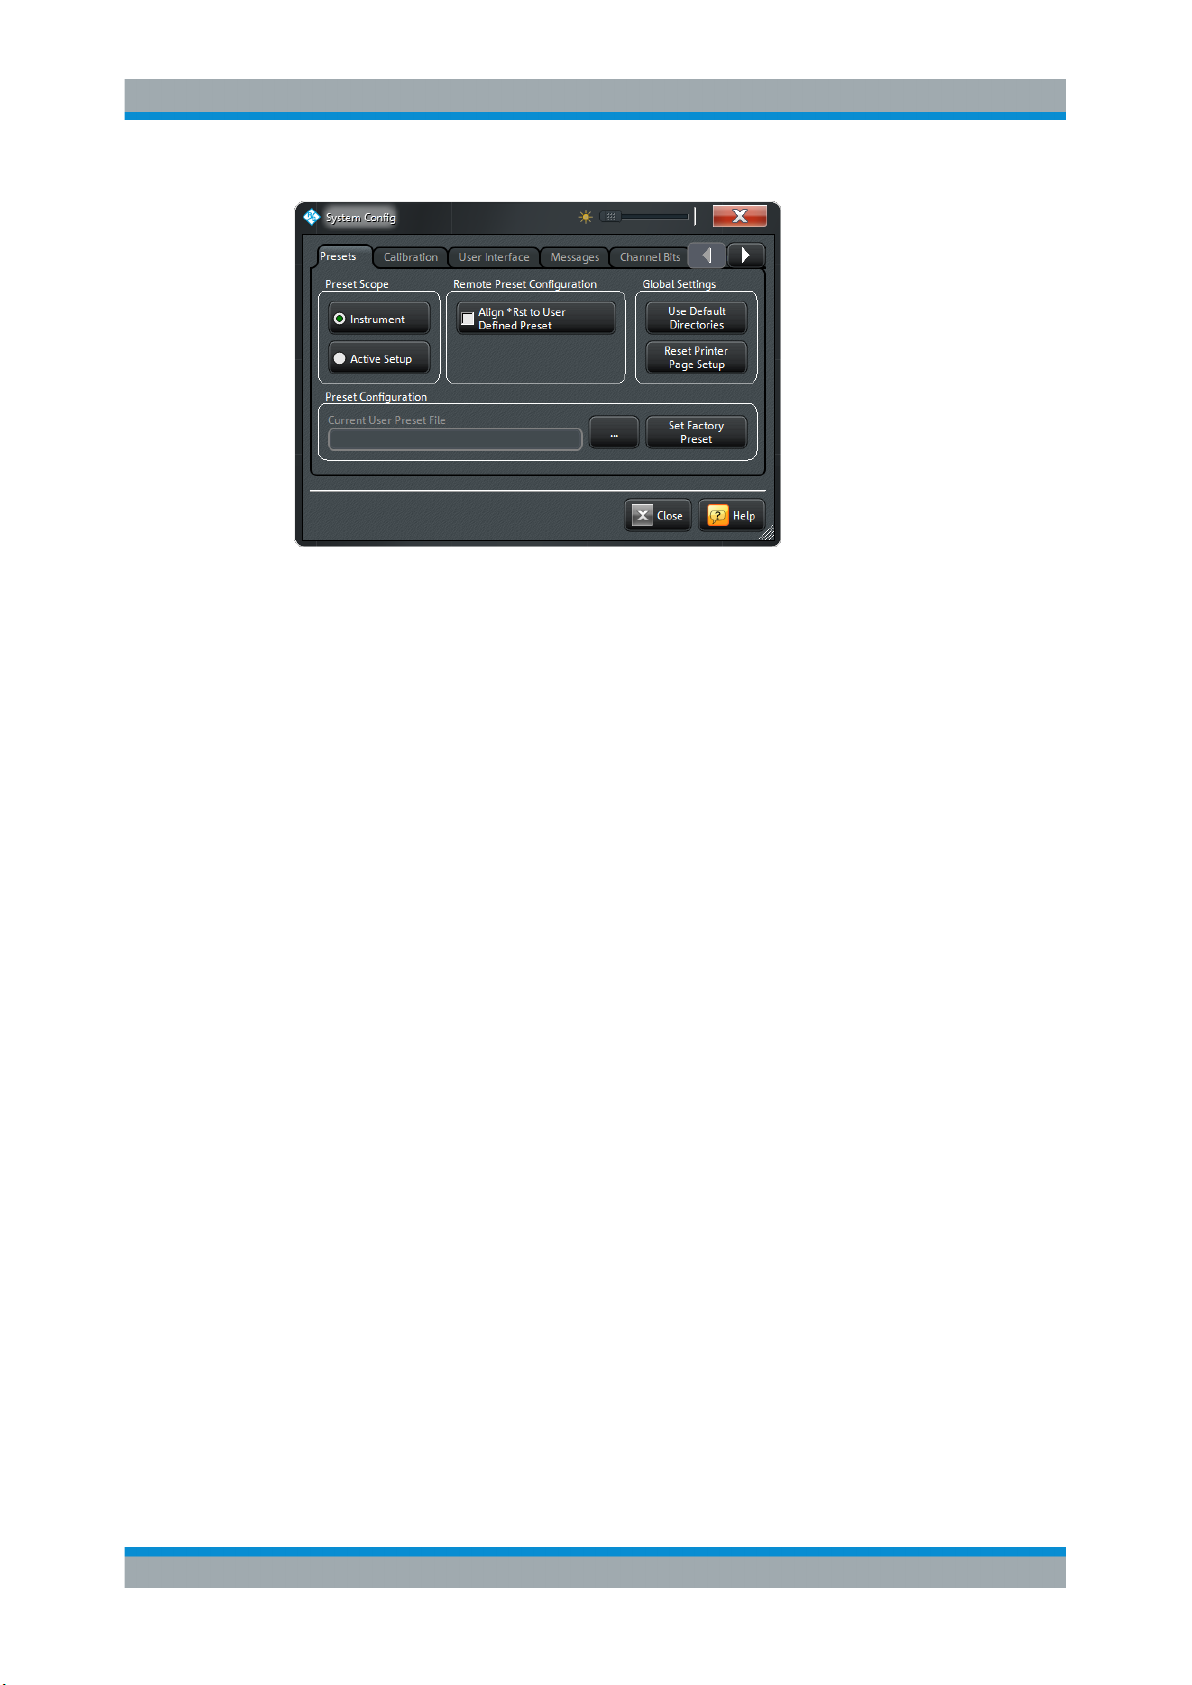
R&S® ZNB/ZNBT
Operating the Instrument
Manual Operation
Using the menu bar
The menu bar at the bottom of the application screen provides alternative access to all
instrument functions. To repeat the measured quantity selection described above,
► Select TRACE – [MEAS] > "Z←Sij" > "Z←S11".
The diagram immediately reflects your selection. The active trace shows the measurement results for the selected measured quantity. At the same time, the related
softtool tab is opened.
Using context menus
Context menus are another alternative for quick access to instrument settings.
1. Touch and hold (right-click) the measured quantity section in the trace info for a
couple of seconds until the context menu appears.
41Getting Started 1316.0062.02 ─ 26
Page 44
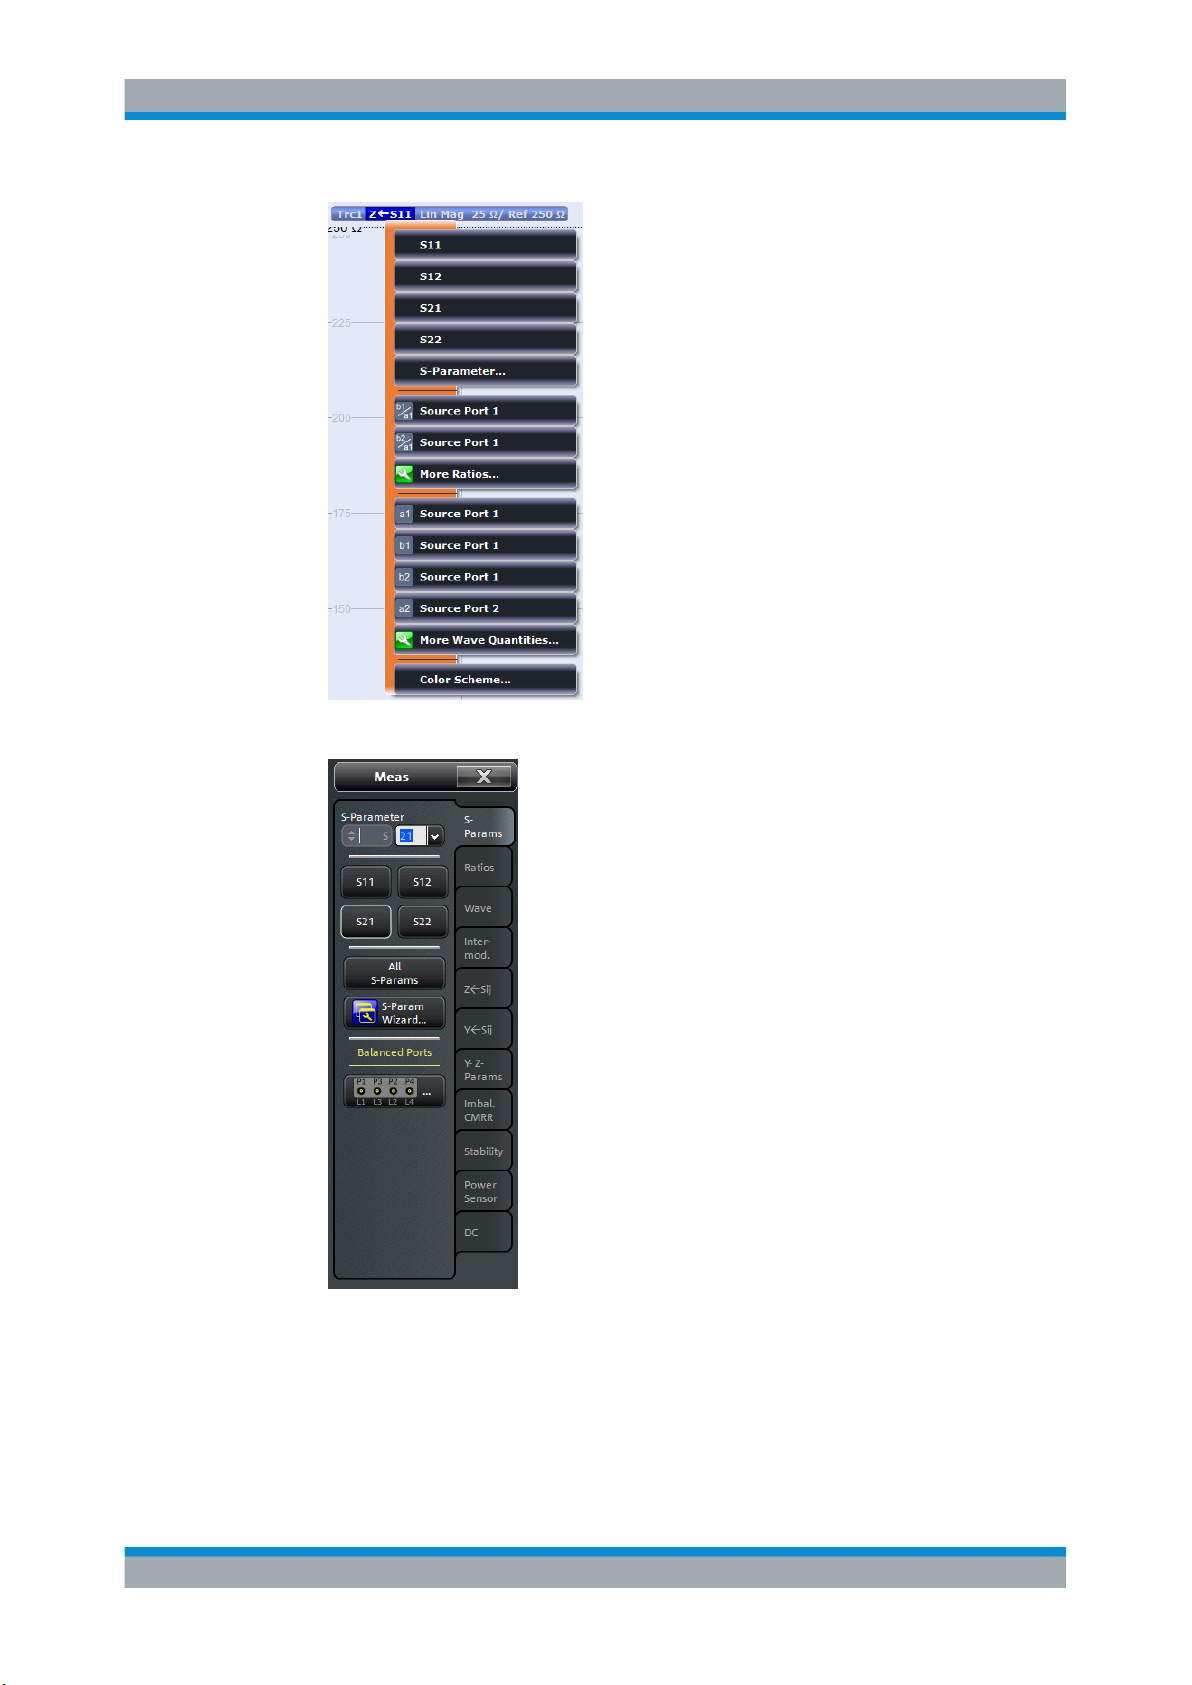
R&S® ZNB/ZNBT
Operating the Instrument
Manual Operation
2. Select "S-Parameter" to open the "Meas" > "S-Params" softtool tab.
3. Select "Z←Sij" > "Z←S11".
42Getting Started 1316.0062.02 ─ 26
Page 45
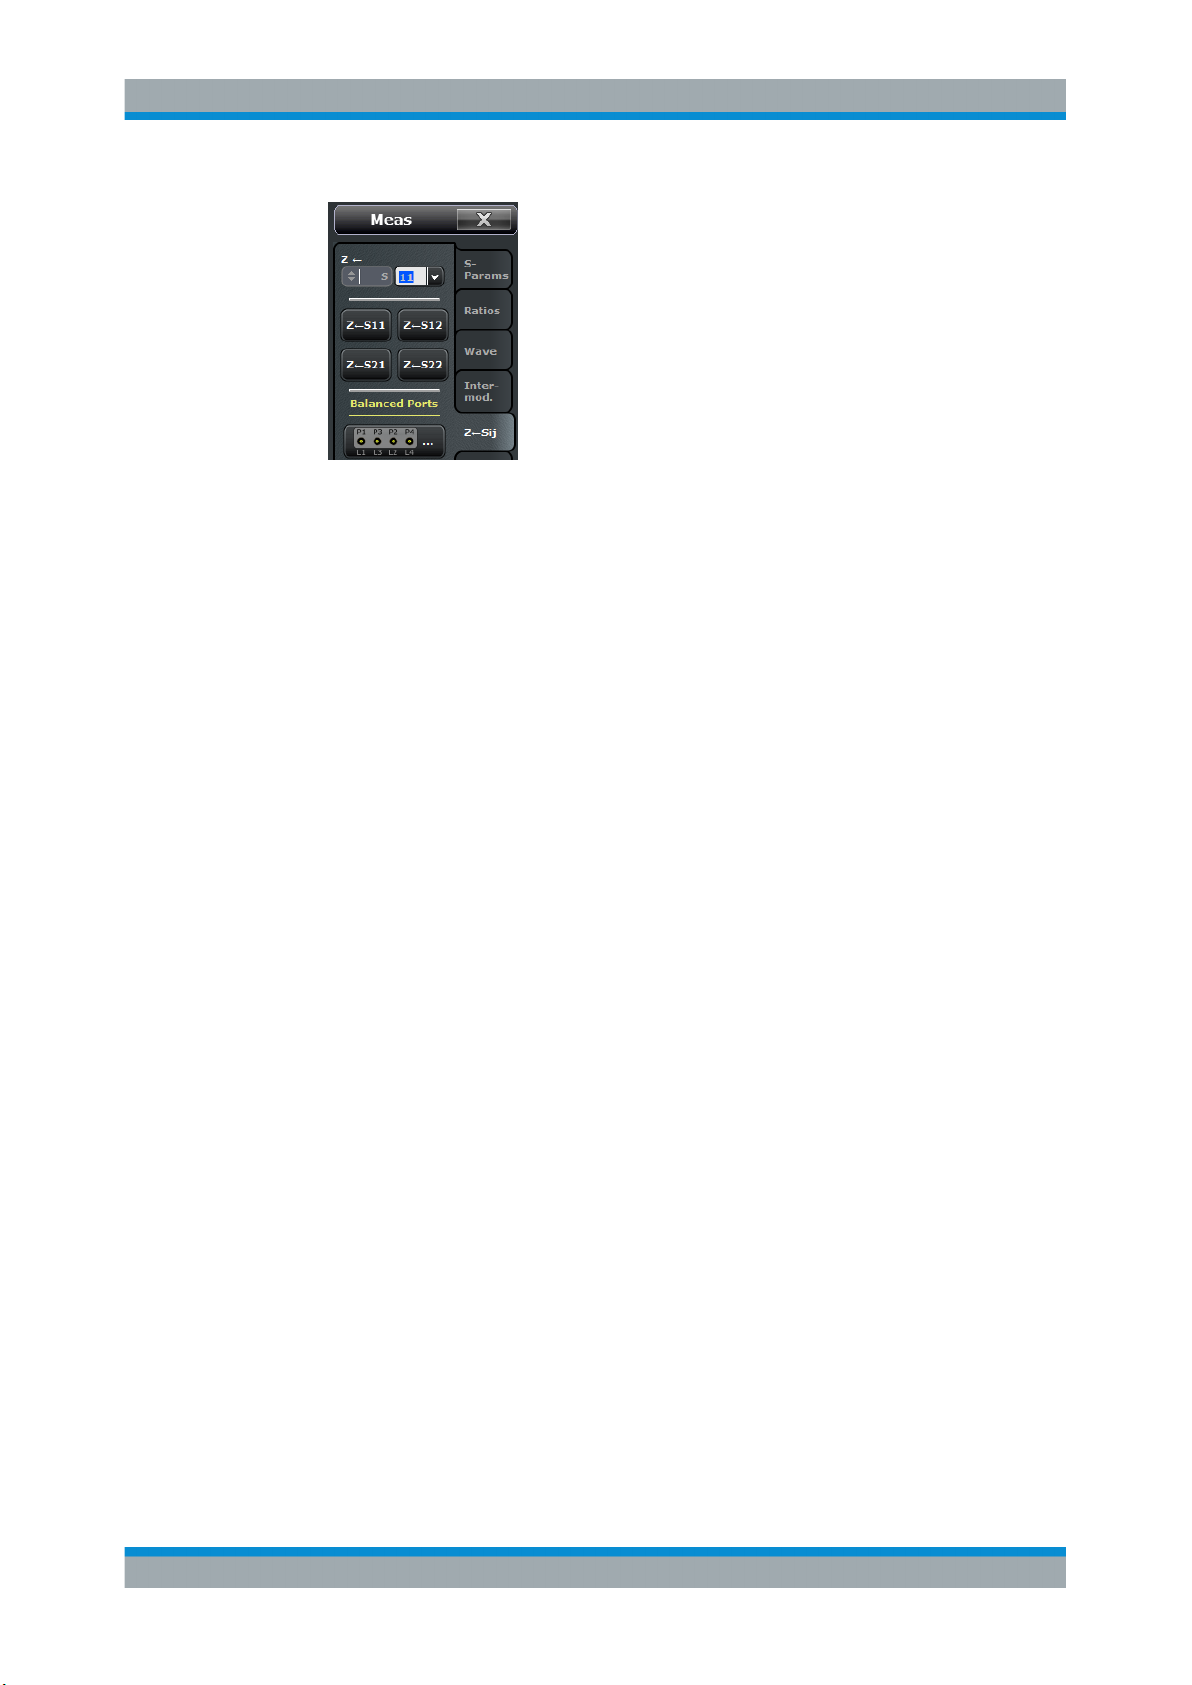
R&S® ZNB/ZNBT
4.2 Control Elements of the Application Window
Operating the Instrument
Control Elements of the Application Window
The application window of the analyzer provides all control elements for the measurements and contains the diagrams for the results. There are several alternative ways for
accessing an instrument function:
●
Using a function key on the (virtual) hardkey panel to open the related softtool (recommended, provides all settings)
●
Using the menus and submenus of the menu bar (alternative to the previous
method)
●
Using the context menus of certain display objects (for important actions in the
context of this object)
●
Using the icons in the toolbar above the diagram area (for frequent global actions)
43Getting Started 1316.0062.02 ─ 26
Page 46
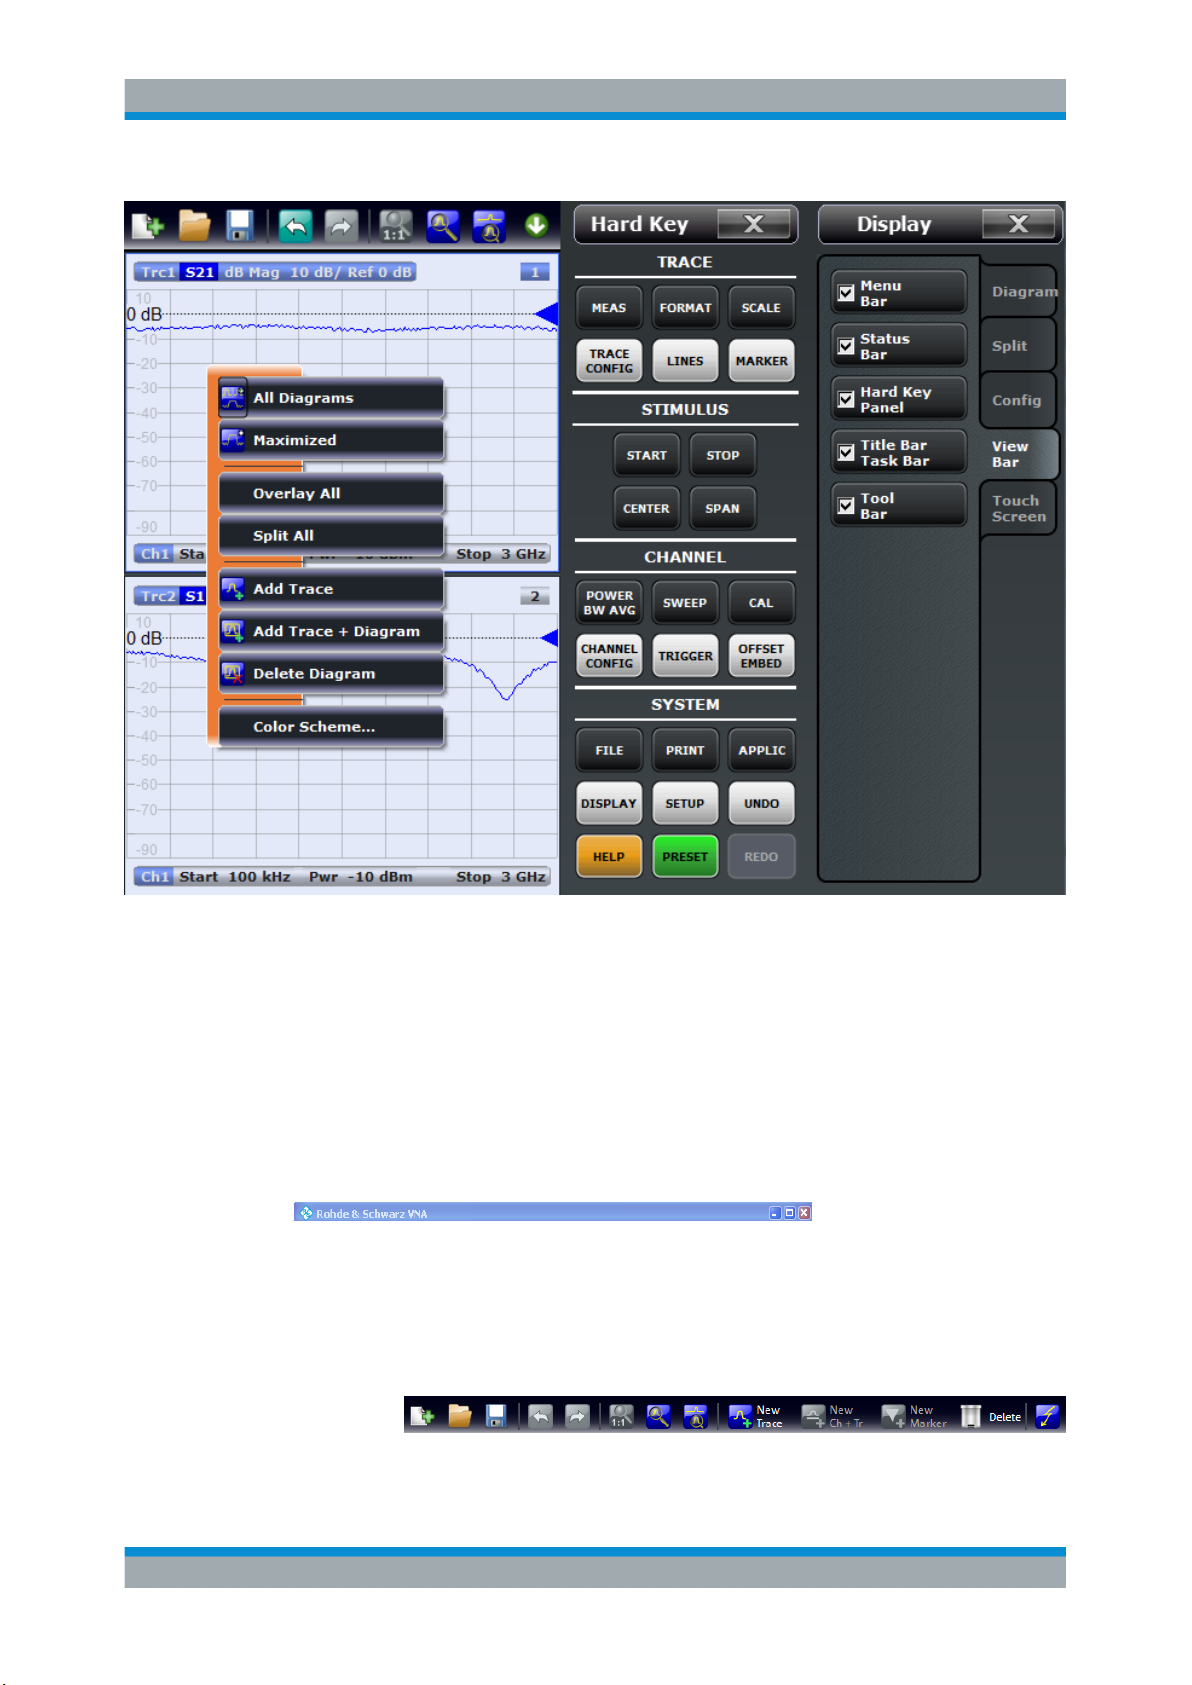
R&S® ZNB/ZNBT
Operating the Instrument
Control Elements of the Application Window
These methods are described in more detail in the following sections.
4.2.1 Title Bar
By default, the analyzer GUI is shown in full screen mode, covering the whole screen
and hiding the Windows taskbar. However, you can toggle the full screen mode using
SYSTEM – [DISPLAY] > "View Bar" > "Title and Task Bar On".
If full screen mode is switched off, the main application window of the vector network
analyzer application provides a standard Windows® title bar.
4.2.2 Toolbar
The toolbar above the diagram area contains the most frequently used control elements of the user interface. All controls are also accessible via Softtools.
44Getting Started 1316.0062.02 ─ 26
Page 47
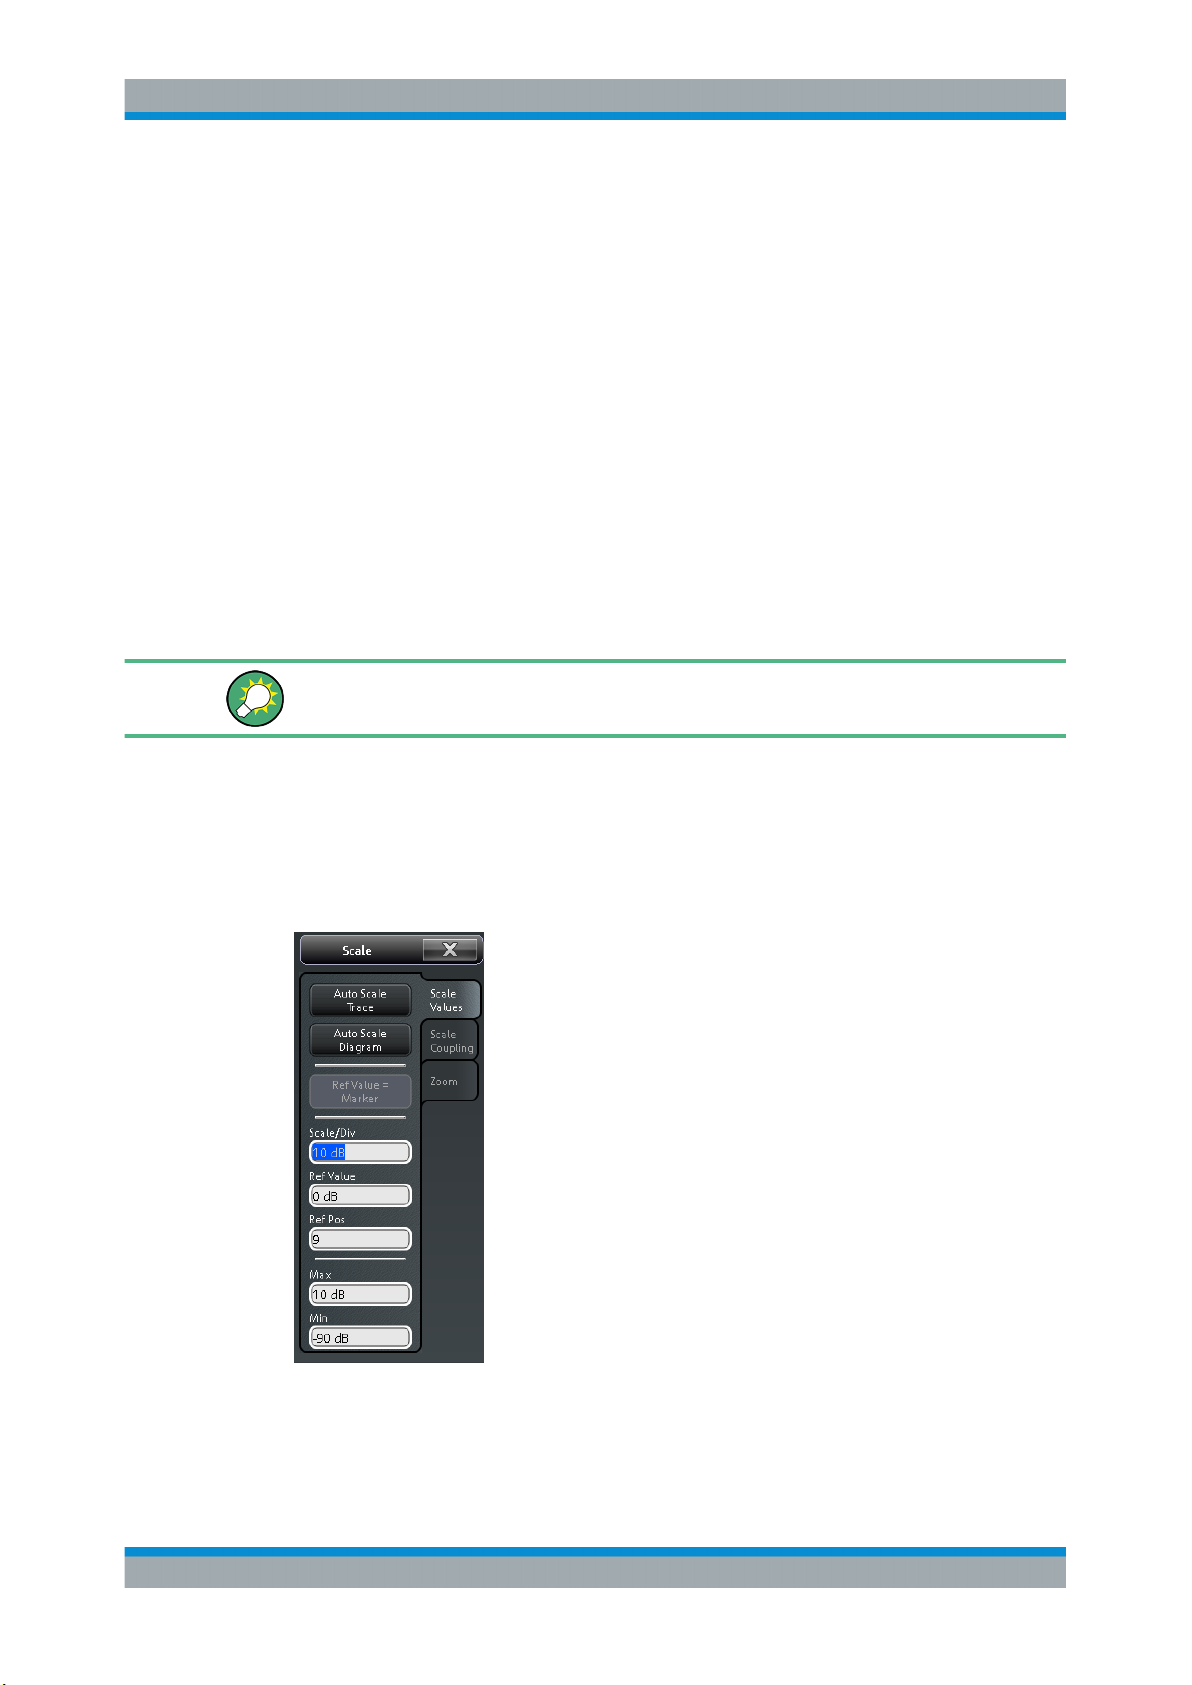
R&S® ZNB/ZNBT
Operating the Instrument
Control Elements of the Application Window
The toolbar is divided into five icon groups, separated by vertical lines.
●
The leftmost group comprises recall set actions (SYSTEM – [PWR BW AVG] >
"Recall Sets"): add a new recall set ("New..."), open a recall set file ("Open
Recall..."), save the active recall set to a file ("Save...").
●
The second group comprises the undo and redo actions that are also accessible
via the SYSTEM – [UNDO] and SYSTEM – [REDO] front panel keys.
●
The icons in the middle group control the graphical zoom function (TRACE –
[SCALE] > "Zoom"): "Zoom Reset", "Zoom Select", and "Overview Select".
●
The icons in the fourth group provide the following actions, from left to right:
– Add a new trace and (possibly) a new diagram (TRACE – [TRACE CONFIG] >
"Trace").
– Add a marker (TRACE – [MARKER] > "Markers")
– Delete a marker, trace, or diagram
●
The icon in the rightmost group allows you to restart the sweep in all channels
(CHANNEL – [SWEEP] > "Sweep Control" > "Restart Sweep").
You can hide the toolbar using SYSTEM – [DISPLAY] > "View Bar".
4.2.3 Softtools
Softtools display groups of related settings as a tabbed panel. They can be opened via
function keys on the front panel (R&S ZNB only) or the on-screen "Hard Key" panel, or
via menu bar and context menu items.
Figure 4-2: Scale softtool
45Getting Started 1316.0062.02 ─ 26
Page 48
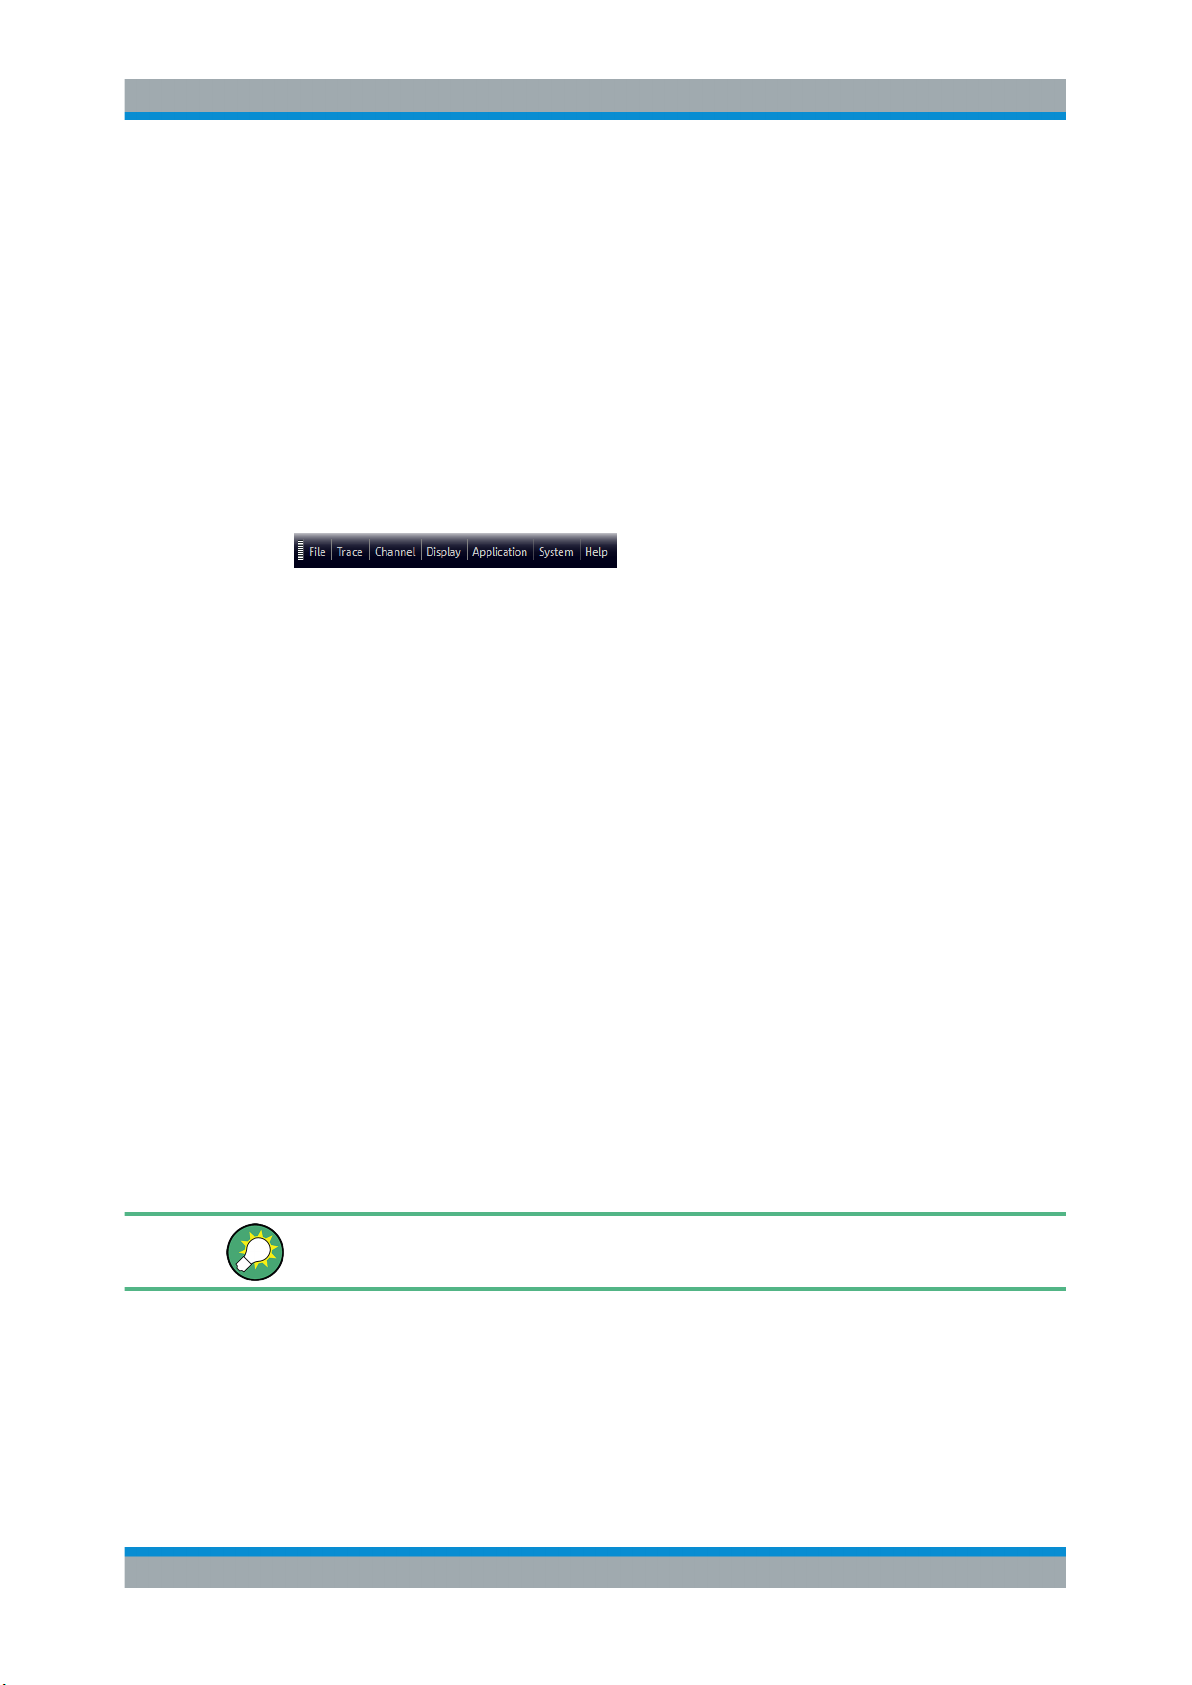
R&S® ZNB/ZNBT
4.2.4 Menu Bar
Operating the Instrument
Control Elements of the Application Window
A softtool consists of a title area with a close/re-open icon and a tabbed panel below it.
The title area remains displayed when the softtool is closed, which allows you to
reopen a closed softtool at any time.
Some controls on the softtool tabs allow you to read and modify settings (e.g. "Ref
Value" in the screenshot above), some perform actions (e.g. "Auto Scale Trace"), while
others open additional dialogs (button label ends with "...").
All analyzer functions are arranged in drop-down menus. The menu bar is located
across the bottom of the diagram:
As in any Windows® application, menus can be controlled with the touchscreen
(R&S ZNB only) or a mouse. A short tap (left mouse click) expands a menu or submenu. If a menu command has no submenu assigned, a short tap (left mouse click)
opens a dialog or directly activates the menu command. When a (sub)menu is
selected, the R&S ZNB/ZNBT displays the corresponding softtool.
Overview of menu functions
●
The "File" menu provides standard Windows® functions that can be used to create,
save, recall or print recall sets, to copy the current screen or to shut down the
application.
●
The "Trace" menu provides all trace settings, the limit check settings, and the
marker functions including marker search.
●
The "Channel" menu provides all channel settings and activates, modifies or stores
different channels.
●
The "Display" menu provides all display settings and the functions for activating,
modifying and arranging different diagrams.
●
The "Applications" menu gives access to applications and tools that extend the
functionality of the analyzer firmware.
●
The "System" menu provides functions that can be used to return to a defined
instrument state, reverse operations, access service functions and define various
system-related settings.
●
The "Help" menu provides assistance with the network analyzer and its operation.
You can toggle the visibility of the menu bar using SYSTEM – [DISPLAY] > "View Bar"
> "Menu Bar".
4.2.5 Menu Structure
All menus show an analogous structure.
46Getting Started 1316.0062.02 ─ 26
Page 49
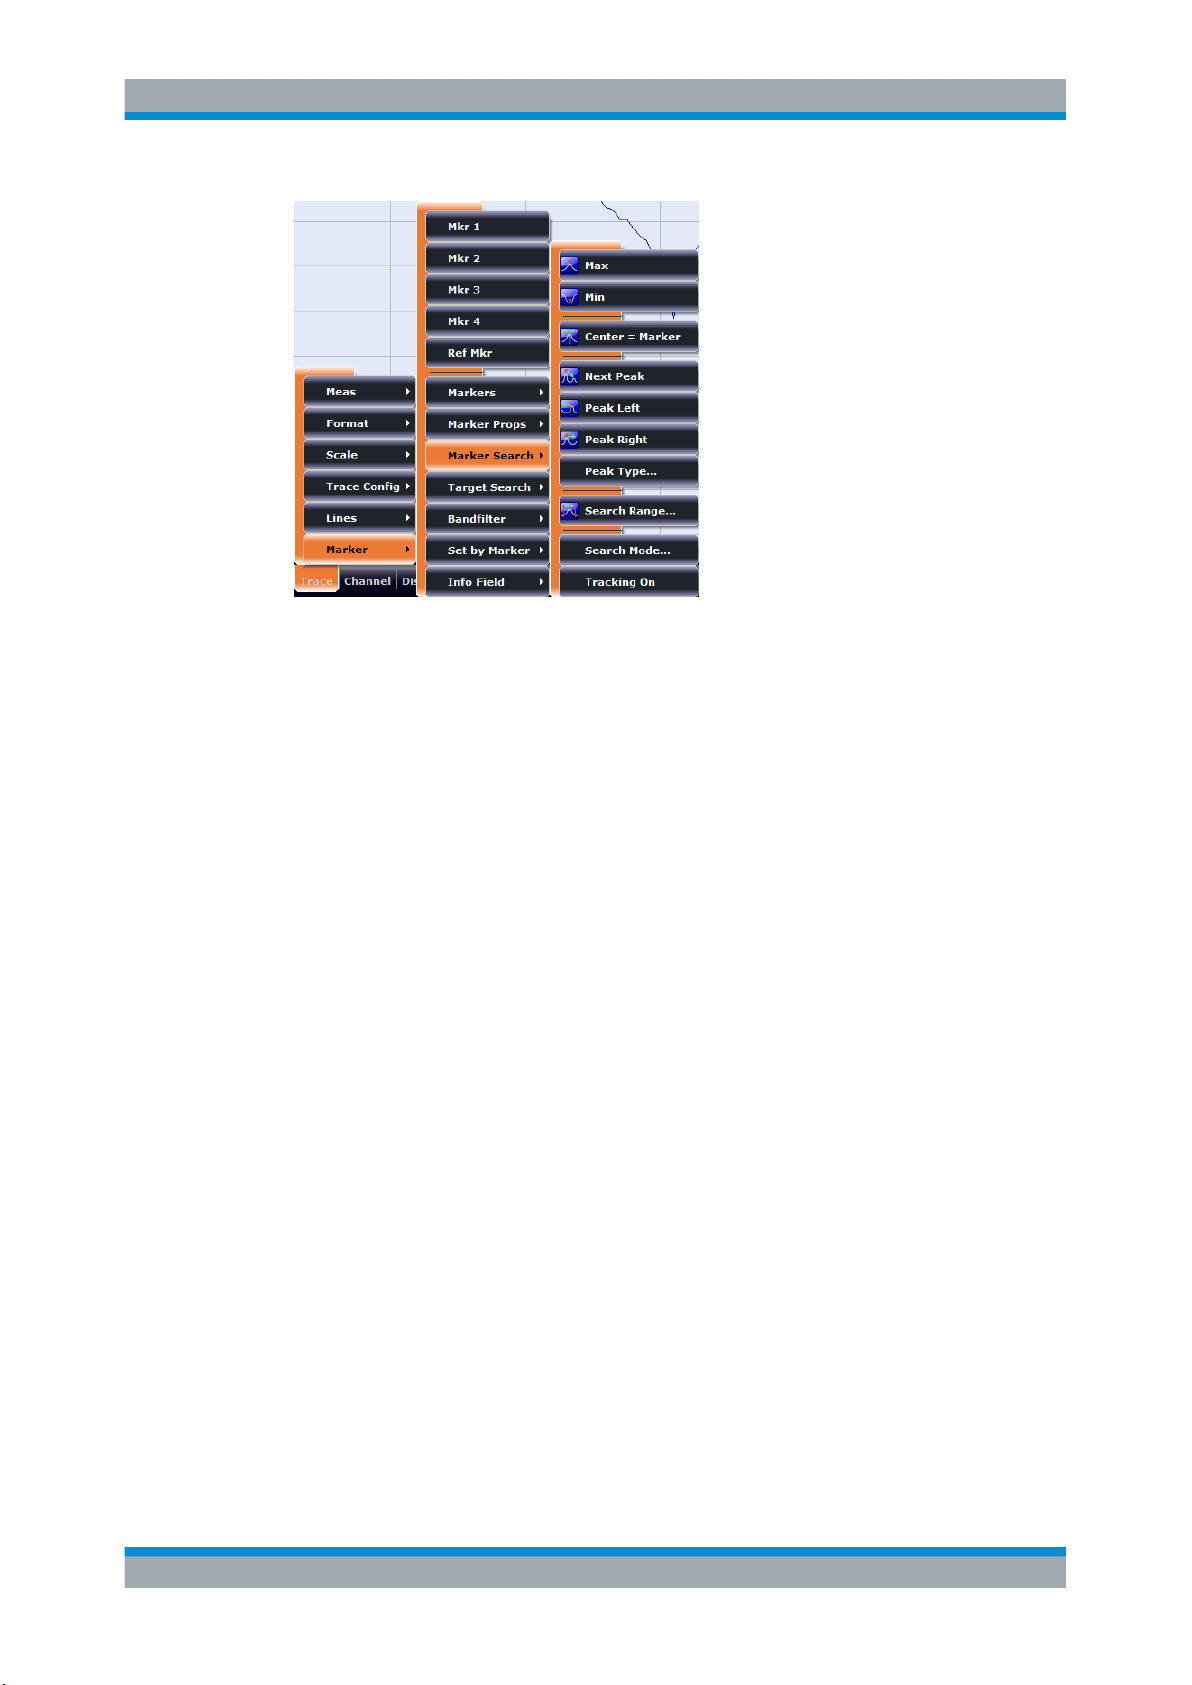
R&S® ZNB/ZNBT
Operating the Instrument
Control Elements of the Application Window
●
A menu command with a right arrow expands a submenu with further related settings.
Example: "Marker" expands a submenu with marker-related properties.
●
A menu command with three dots appended calls up a dialog providing several
related settings.
Example: "Search Range" opens a dialog to define the search range for the
marker search.
●
A menu command with no arrow or dots initiates an immediate action.
Example: "Max" sets the active marker to the maximum of the active trace.
4.2.6 Hardkey Panel
The (virtual) "Hard Key" panel provides on-screen access to the function keys (plus the
[UNDO] and [REDO] key) that are available at the front panel of a R&S ZNB. Most of
the function keys open a related softtool. For a short description, refer to section Chap-
ter 3.1.2, "Function Keys", on page 26.
47Getting Started 1316.0062.02 ─ 26
Page 50
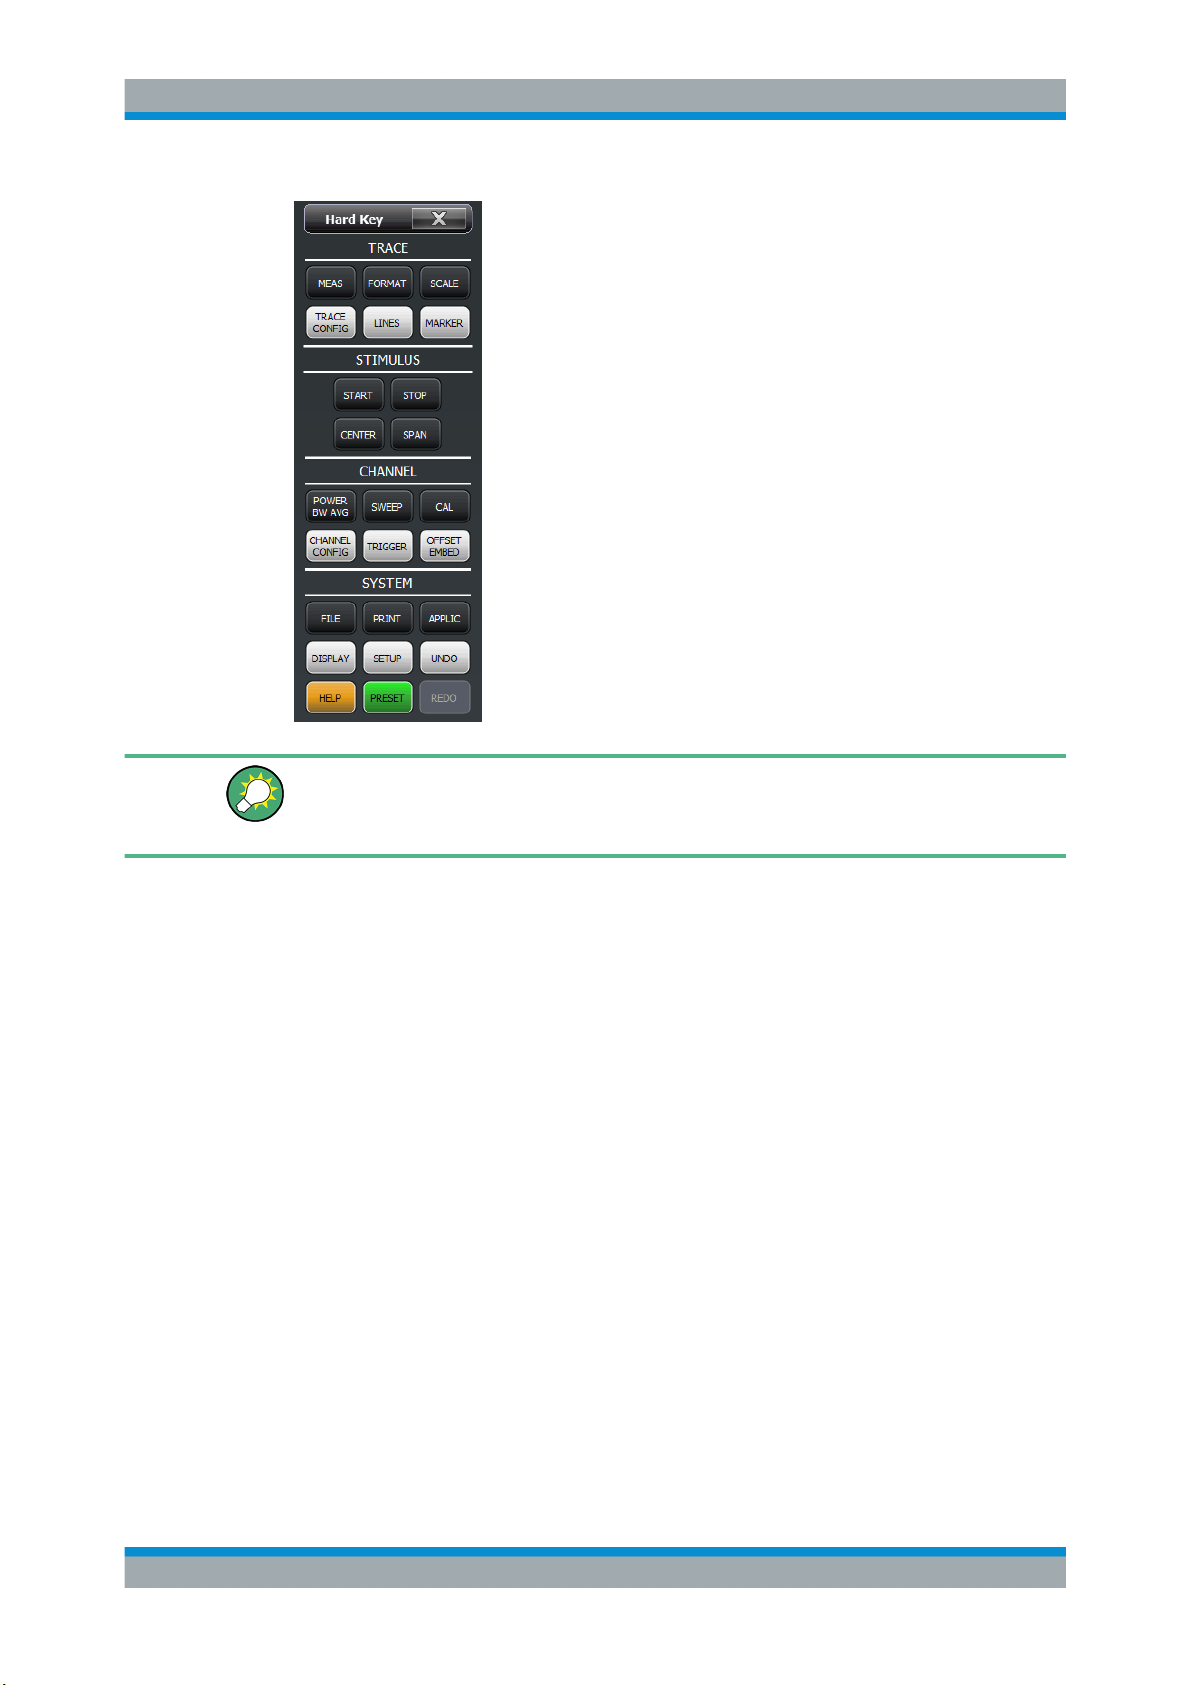
R&S® ZNB/ZNBT
Operating the Instrument
Control Elements of the Application Window
The "Hard Key" panel is particularly useful if the analyzer is controlled from an external
monitor or Remote Desktop.
For the R&S ZNB, it is hidden by default, for the R&S ZNBT it is visible by default.
You can display the "Hard Key" panel using one of the following methods:
●
Select SYSTEM – [DISPLAY] > "View Bar" > "Hard Key Panel".
●
Select "Display"> "View Bar" > "Hard Key Panel On" from the menu bar.
●
Select "Hard Key" from the context menu of the softtool panel.
4.2.7 Status Bar
The status bar shows
●
the current channel's sweep averaging counter (e.g. "Ch<i>: Avg 9/10"), or "Ch<i>:
Avg None" if averaging is disabled
●
the active channel and drive port (P1, P2 ...)
●
the progress of the sweep
The progress bar also shows when the R&S ZNB/ZNBT prepares a sweep with
new channel settings
●
the External Reference symbol, if an external reference clock is used for synchronization
●
the Redefined S-parameters symbol (if the physical ports have been redefined)
●
the LXI status symbol (if enabled; see SYSTEM – [SETUP] > "Remote Settings" >
"LXI")
48Getting Started 1316.0062.02 ─ 26
Page 51
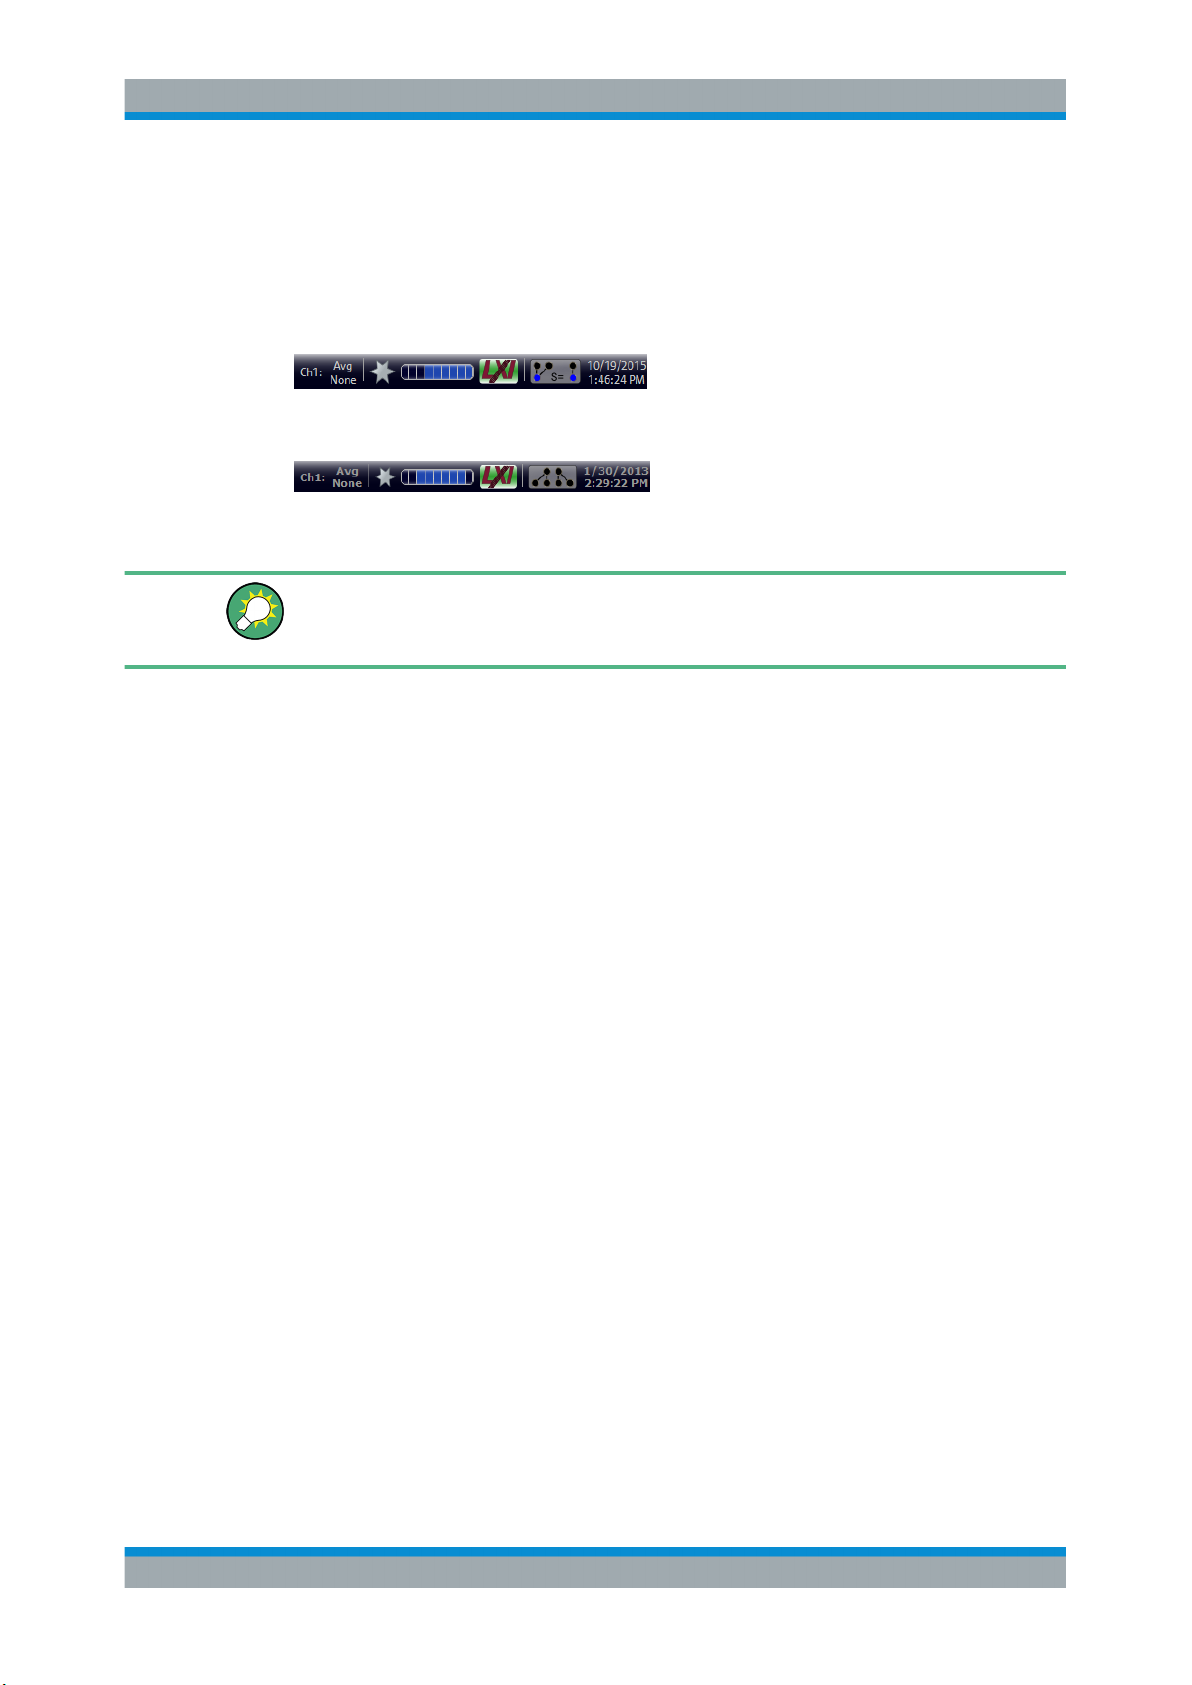
R&S® ZNB/ZNBT
Operating the Instrument
Working with Dialogs
A green LXI status symbol indicates that a LAN connection has been established;
a red symbol indicates that no LAN cable is connected.
●
the switch matrix status symbol, if a switch matrix is configured
(See the R&S ZNB/ZNBT User Manual)
●
the current date and time
Figure 4-3: R&S ZNB/ZNBT with redefined physical ports
Figure 4-4: R&S ZNB/ZNBT with switch matrix
The progress bar shows a moving color gradient if the current sweep is too fast to be
monitored, e.g. because the number of sweep points is low. You can hide/show the status bar using SYSTEM – [DISPLAY] > "View Bar" > "Status Bar".
4.3 Working with Dialogs
Dialogs provide groups of related settings and allow to make selections and enter data
in an organized way. The settings are visualized, if possible. An example is shown
below.
49Getting Started 1316.0062.02 ─ 26
Page 52
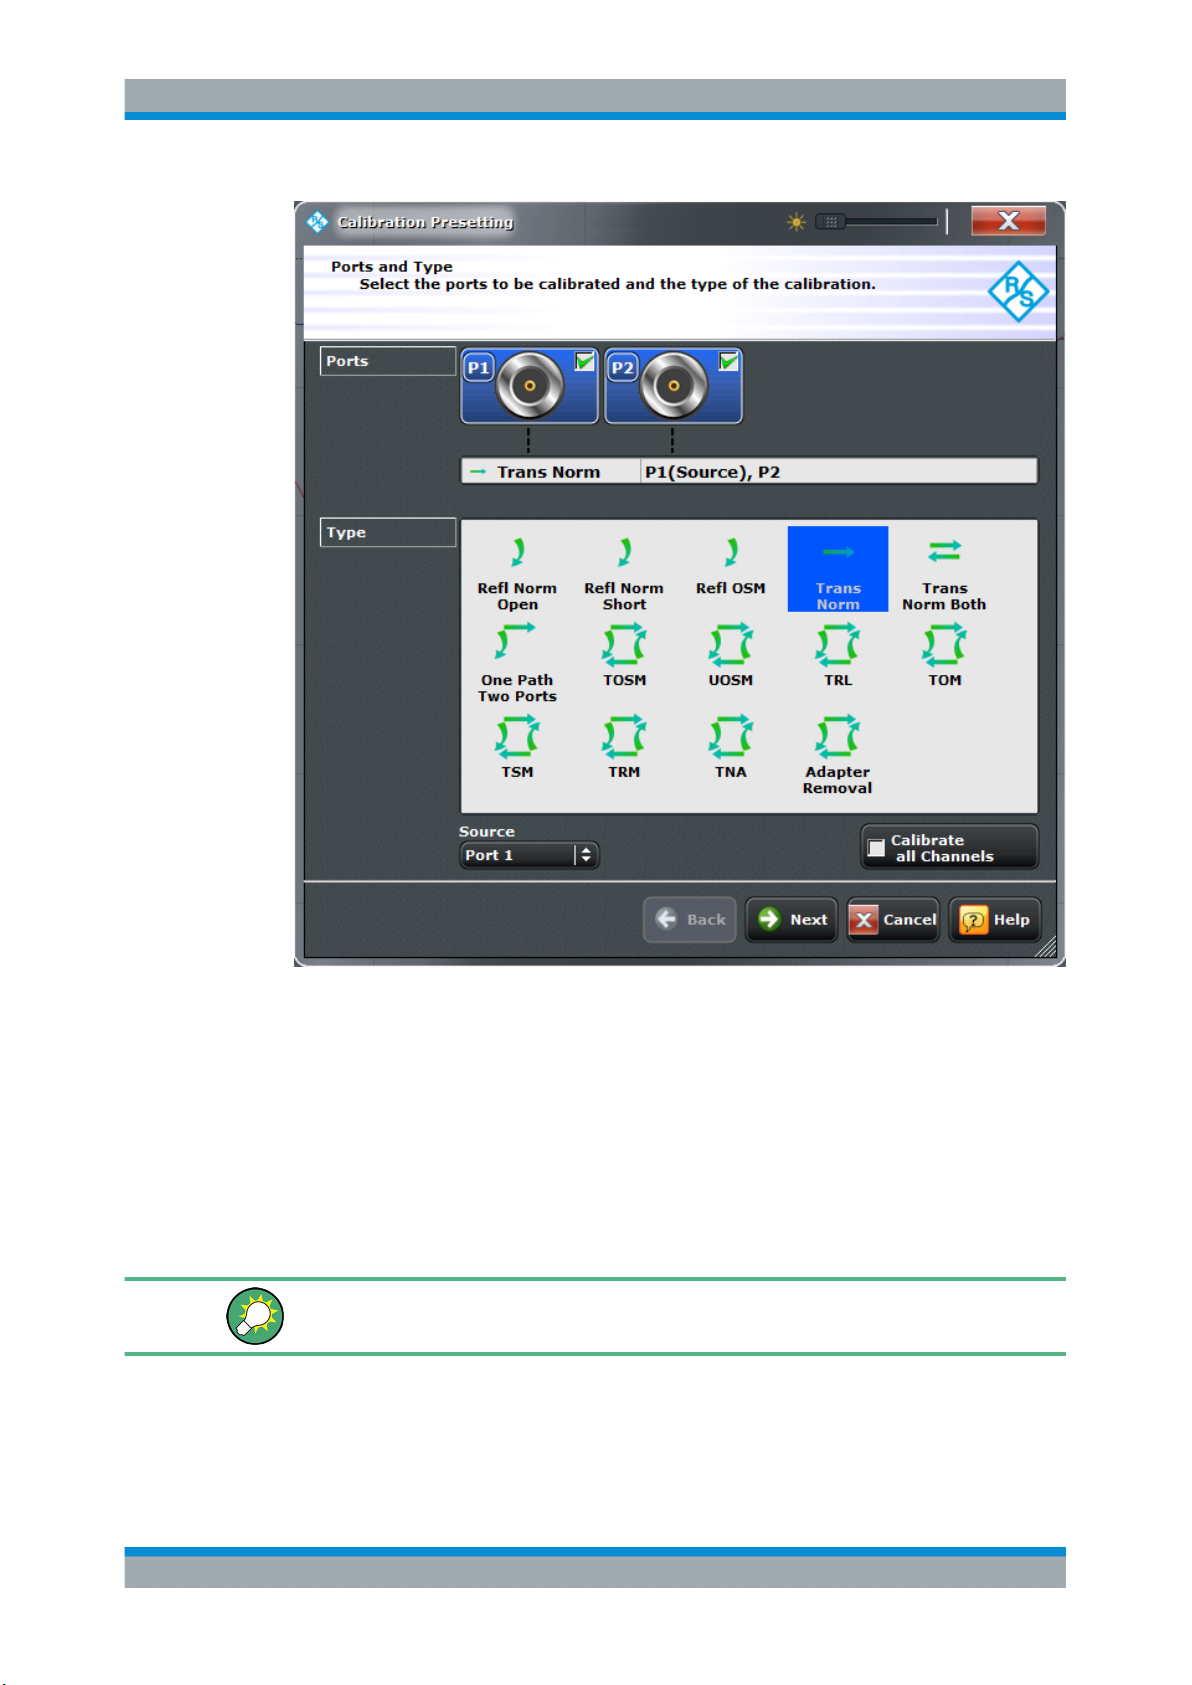
R&S® ZNB/ZNBT
Operating the Instrument
Working with Dialogs
All dialogs are operated in a similar way.
●
To open a dialog, select a softtool button with three dots appearing in its label (e.g.
"Start... (Manual)").
●
The title bar of each dialog contains some convenience functions:
– Use the "Dialog Transparency" slider to make the display elements behind the
dialog visible.
●
Drag and drop the lower right corner of the dialog to modify its size.
●
Some dialogs are subdivided into tabs, containing groups of related settings. Activate a tab to access those settings.
The Help system provides useful information about each dialog's specific settings.
Select "Help" to open the Help.
50Getting Started 1316.0062.02 ─ 26
Page 53
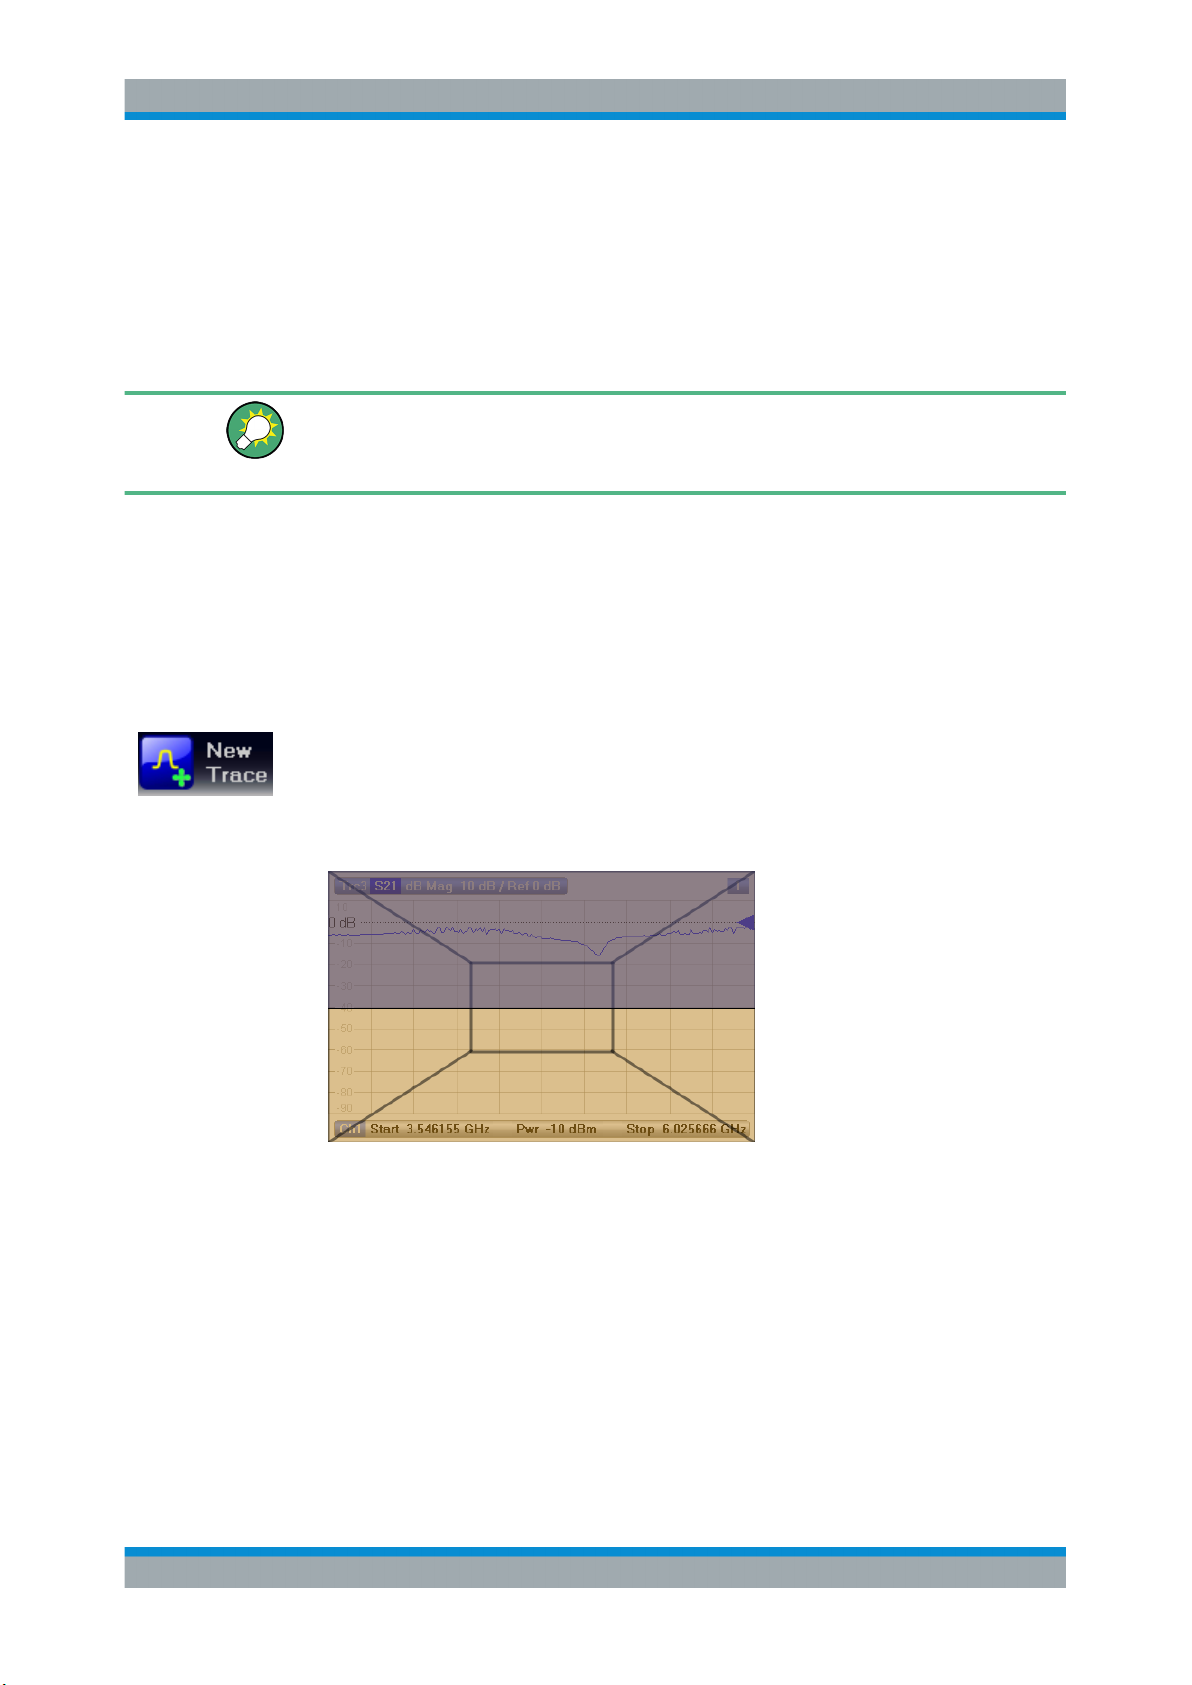
R&S® ZNB/ZNBT
4.4 Handling Diagrams, Traces, and Markers
4.4.1 Adding New Traces and Diagrams
Operating the Instrument
Handling Diagrams, Traces, and Markers
The analyzer displays measurement results as traces in rectangular diagrams. Markers
are used to read specific numerical values and to search for points or regions on a
trace. The following section presents some of the graphical tools the R&S ZNB/ZNBT
provides for trace and marker handling.
For further reference
Refer to chapter "Concepts and Features" in the R&S ZNB/ZNBT Help or in the User
Manual to learn more about traces, channels, and screen elements.
A new trace is required if you want to measure and display an additional quantity.
Typical scenario: The transmission coefficient S21 is measured as described in Chap-
ter 5.1, "Transmission S-Parameter Measurement", on page 64. A trace is added to
display the reflection coefficient S11 for comparison.
To create a trace:
1. Drag the "New Trace" icon from the toolbar into a diagram.
The diagram changes its color scheme and contents as shown below. A rectangle
with diagonal lines divides the diagram into different sectors.
2. Select the sector, depending on whether you want to display the new trace in the
existing diagram, or whether you want to add a new diagram.
51Getting Started 1316.0062.02 ─ 26
Page 54
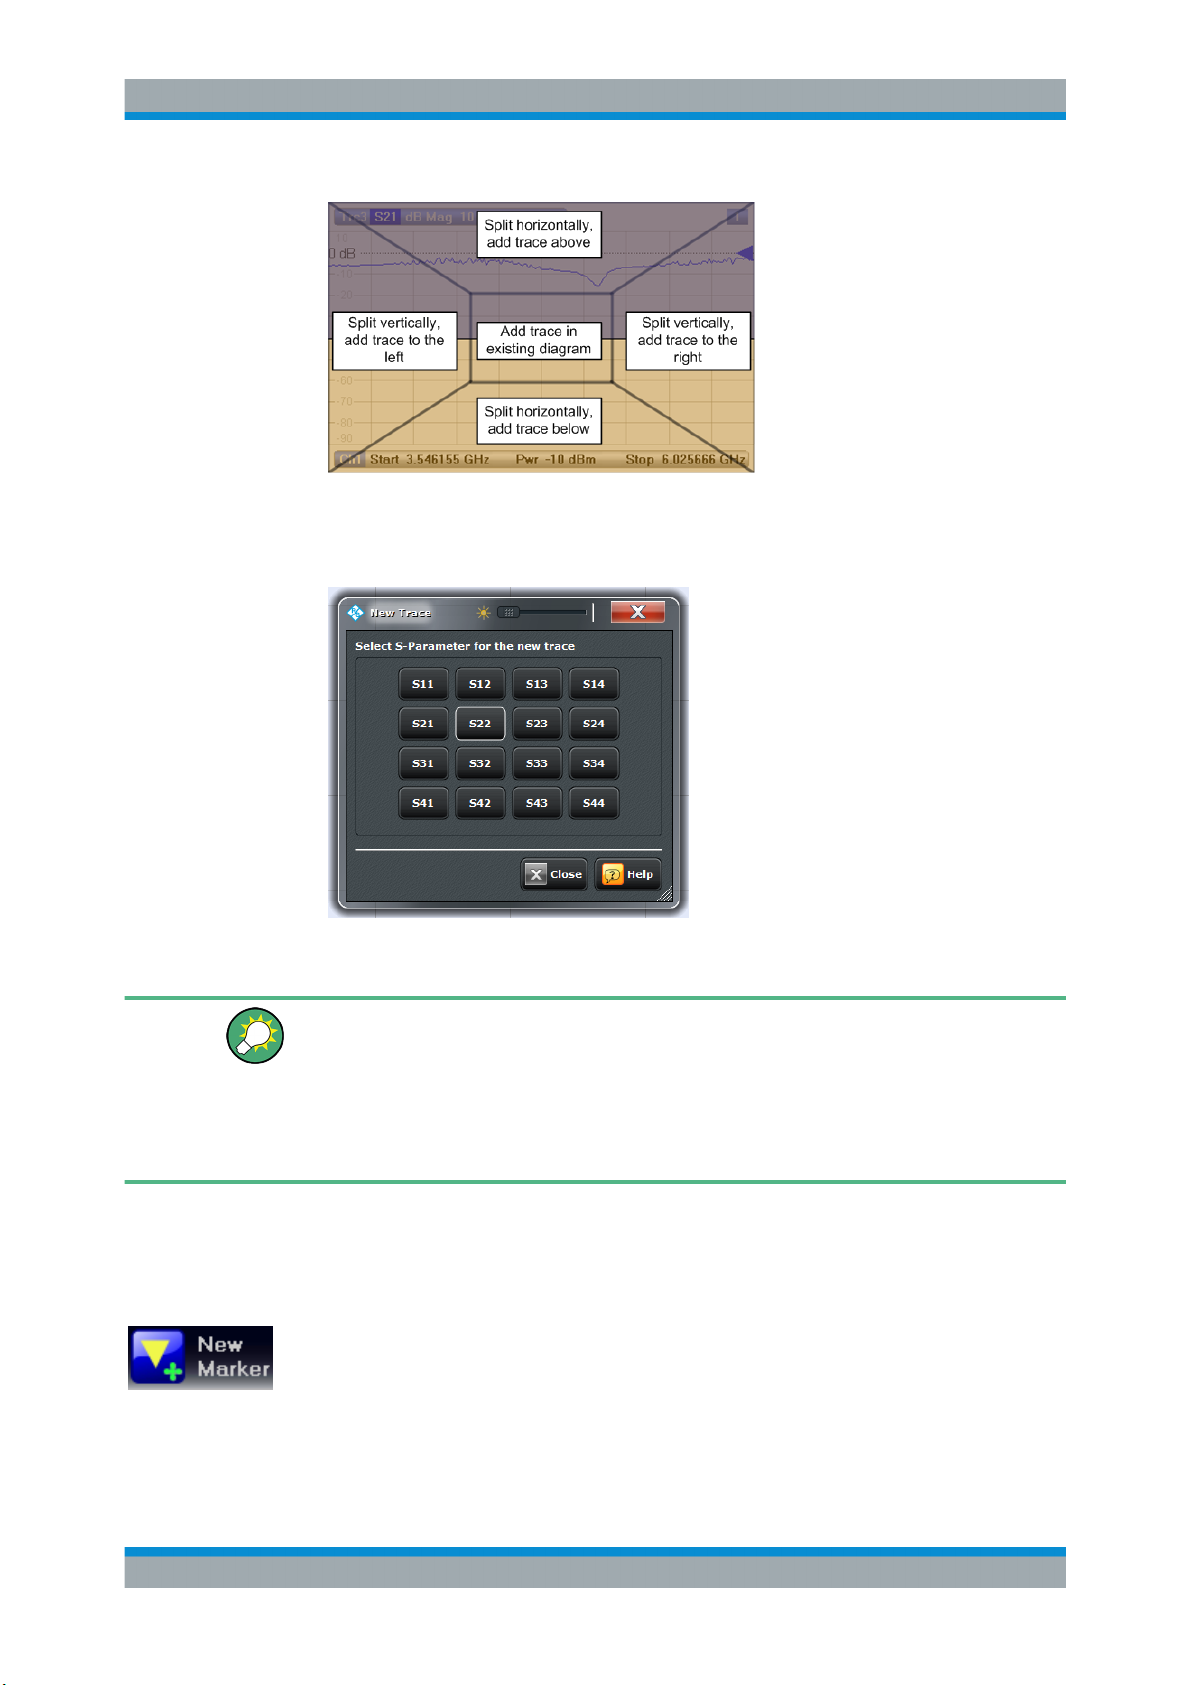
R&S® ZNB/ZNBT
Operating the Instrument
Handling Diagrams, Traces, and Markers
3. In the dialog box that is opened when you release the "New Trace" icon, select the
S-parameter to be measured.
For a four-port analyzer:
The R&S ZNB/ZNBT generates a new trace for the selected S-parameter.
Alternative control elements
To measure a different quantity, select TRACE – [MEAS]. Drag and drop a softkey representing a measured quantity to create a trace. Or simply select another softkey to
change the measured quantity of the active trace.
Select TRACE – [TRACE CONFIG] to access more trace handling functions. Select
SYSTEM – [DISPLAY] to access more diagram handling functions.
4.4.2 Adding New Markers
A marker is needed, for instance, to read a particular numerical trace value.
To add a new marker:
●
Drag and drop the "New Marker" icon from the toolbar to the desired position in the
target diagram.
The marker appears on the target diagram's active trace. The marker info field displays the stimulus value (x-axis value) and response value (y-axis value) at the
52Getting Started 1316.0062.02 ─ 26
Page 55
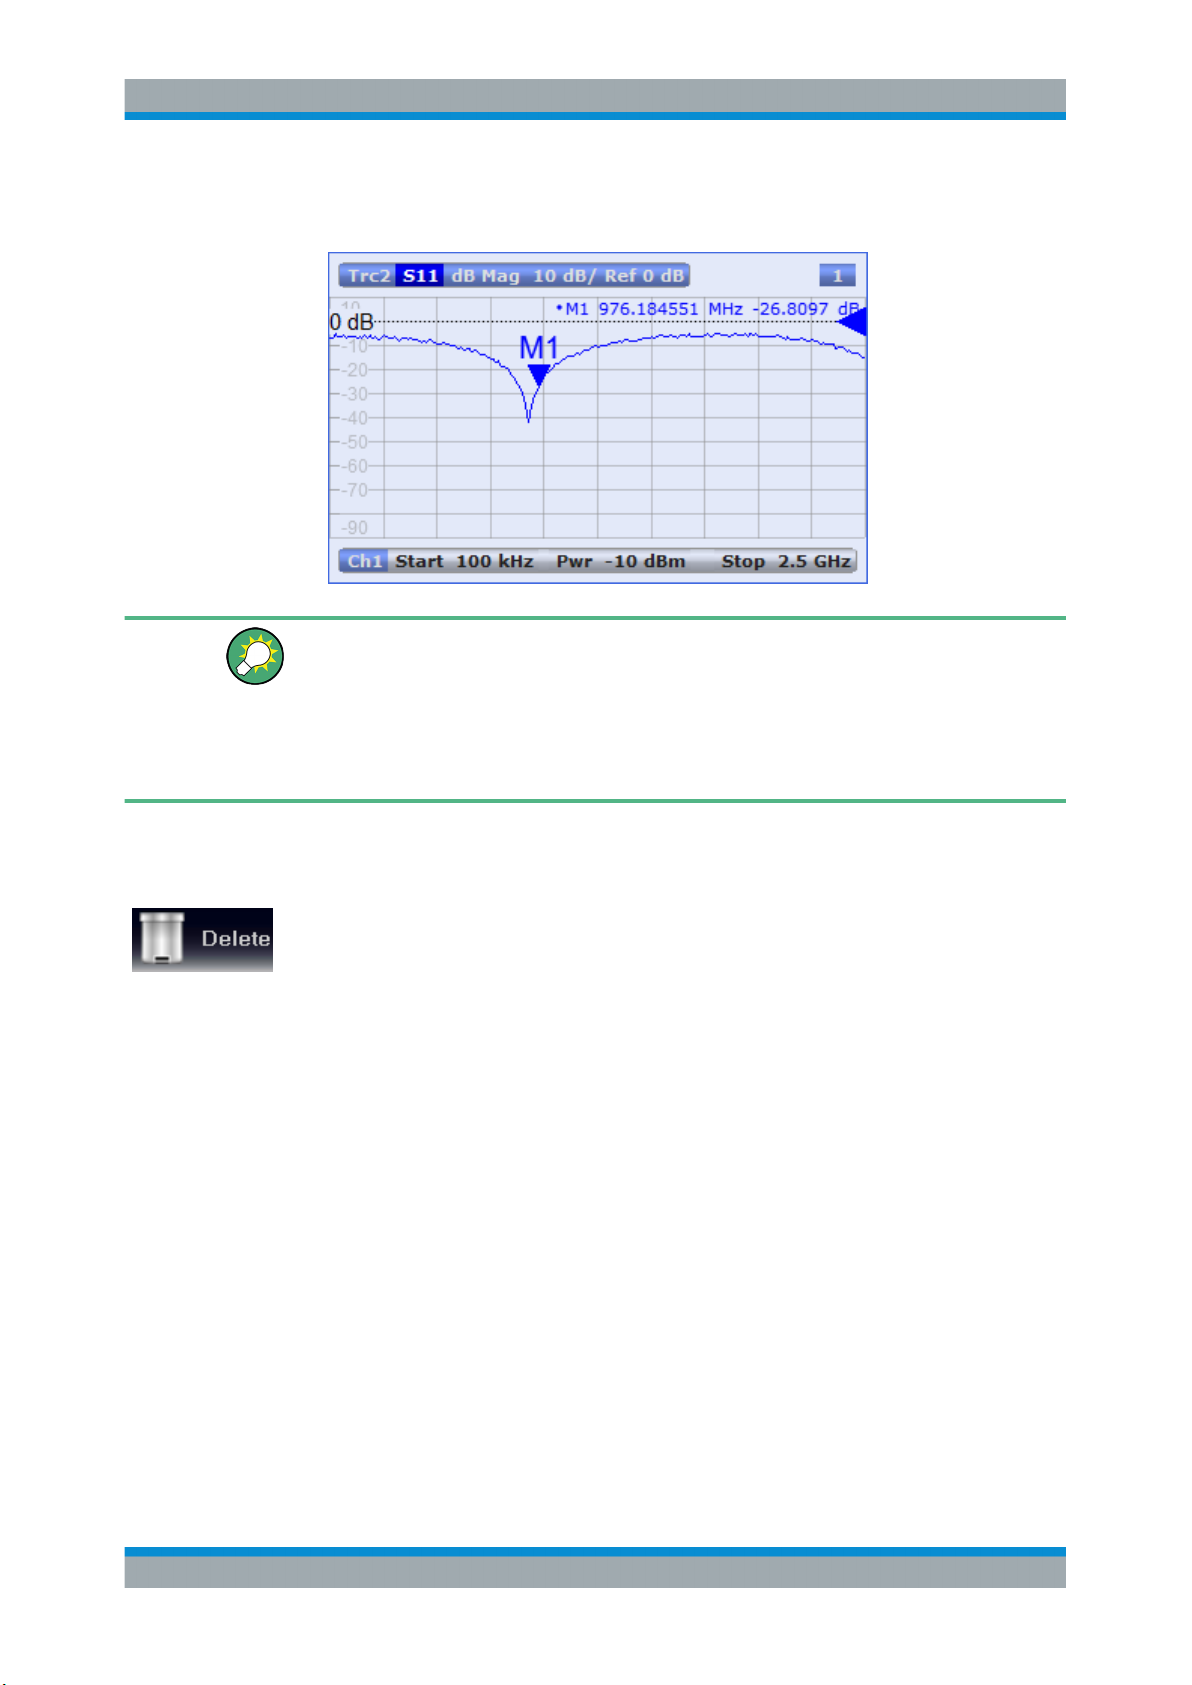
R&S® ZNB/ZNBT
Operating the Instrument
Handling Diagrams, Traces, and Markers
marker position. The response value varies as the analyzer continues performing
sweeps.
Active trace, alternative control elements
The trace line of the active trace in the upper part of the diagram is highlighted. If the
diagram contains several traces, first activate the target trace, then add the marker.
The TRACE – [MARKER] softtool provides more functions for marker handling. In particular, any marker offered in the "Markers" tab can be positioned on the active trace
using drag & drop.
4.4.3 Deleting Display Elements
Markers, traces, diagrams, and other display elements are most conveniently deleted
using the "Delete" icon in the toolbar above the diagram area.
●
To delete a single marker, drag it into vertical direction to release it from the trace
and drop it onto the "Delete" icon.
To delete a set of markers, drag and drop their marker info field onto the "Delete"
icon.
Deleting a marker and its info field also disables the associated marker function.
●
To delete a trace, drag and drop its trace line onto the "Delete" icon.
Note however, that the last remaining trace cannot be deleted.
●
To delete a diagram, drag and drop its diagram number label onto the "Delete"
icon.
Note however, that the last remaining diagram cannot be deleted.
●
To delete a channel, drag and drop all associated traces onto the "Delete" icon.
Note however, that the last remaining channel cannot be deleted.
●
To hide the limit lines and disable the limit check, drag and drop the PASS / FAIL
message onto the "Delete" icon. The limit line itself is not deleted; you can re-use it
any time.
The context menu of some display elements also provides the "Delete" function.
53Getting Started 1316.0062.02 ─ 26
Page 56
R&S® ZNB/ZNBT
Operating the Instrument
Entering Data
Undo function
If you happen to delete a display element unintentionally, you can restore it using the
"Undo" toolbar icon.
4.4.4 Using Drag and Drop
You can drag and drop many of the R&S ZNB/ZNBT's control and display elements to
change their size and position. The drag and drop functionality is often more convenient to use than the equivalent buttons of the softtool panels. The following table gives
an overview.
Table 4-1: Drag and drop functionality for various screen elements
Screen element Action Drag and drop...
Diagram Create See Chapter 4.4.1, "Adding New Traces and Diagrams", on page 51
Resize Separator between adjacent diagrams
Delete See Chapter 4.4.3, "Deleting Display Elements", on page 53
Trace Create See Chapter 4.4.1, "Adding New Traces and Diagrams", on page 51
Move vertically Reference line marker (right diagram edge)
Move into other or new
diagram
Delete See Chapter 4.4.3, "Deleting Display Elements", on page 53
Reset / suspend
graphic zoom
Marker Create See Chapter 4.4.2, "Adding New Markers", on page 52
Move horizontally Marker symbol
Delete Marker or marker info field --> "Delete" icon; see Chapter 4.4.3, "Deleting Display
Marker info field Add See Chapter 4.4.2, "Adding New Markers", on page 52
Move within diagram Marker info field (move to one of several pre-defined positions)
Delete See Chapter 4.4.3, "Deleting Display Elements", on page 53
Softtool panel Move Softtool panel (move to the right or left edge of the screen)
Trace line
"Zoom" element in additional trace line --> "Delete" icon; see Chapter 4.6.1,
"Using the Graphical Zoom", on page 58
Elements", on page 53
4.5 Entering Data
The analyzer provides dialogs with various types of input fields where you can enter
numeric values and character data. Data entry with a mouse and an external keyboard
is a standard procedure known from other Windows® applications. However, there are
various other ways to enter data.
54Getting Started 1316.0062.02 ─ 26
Page 57
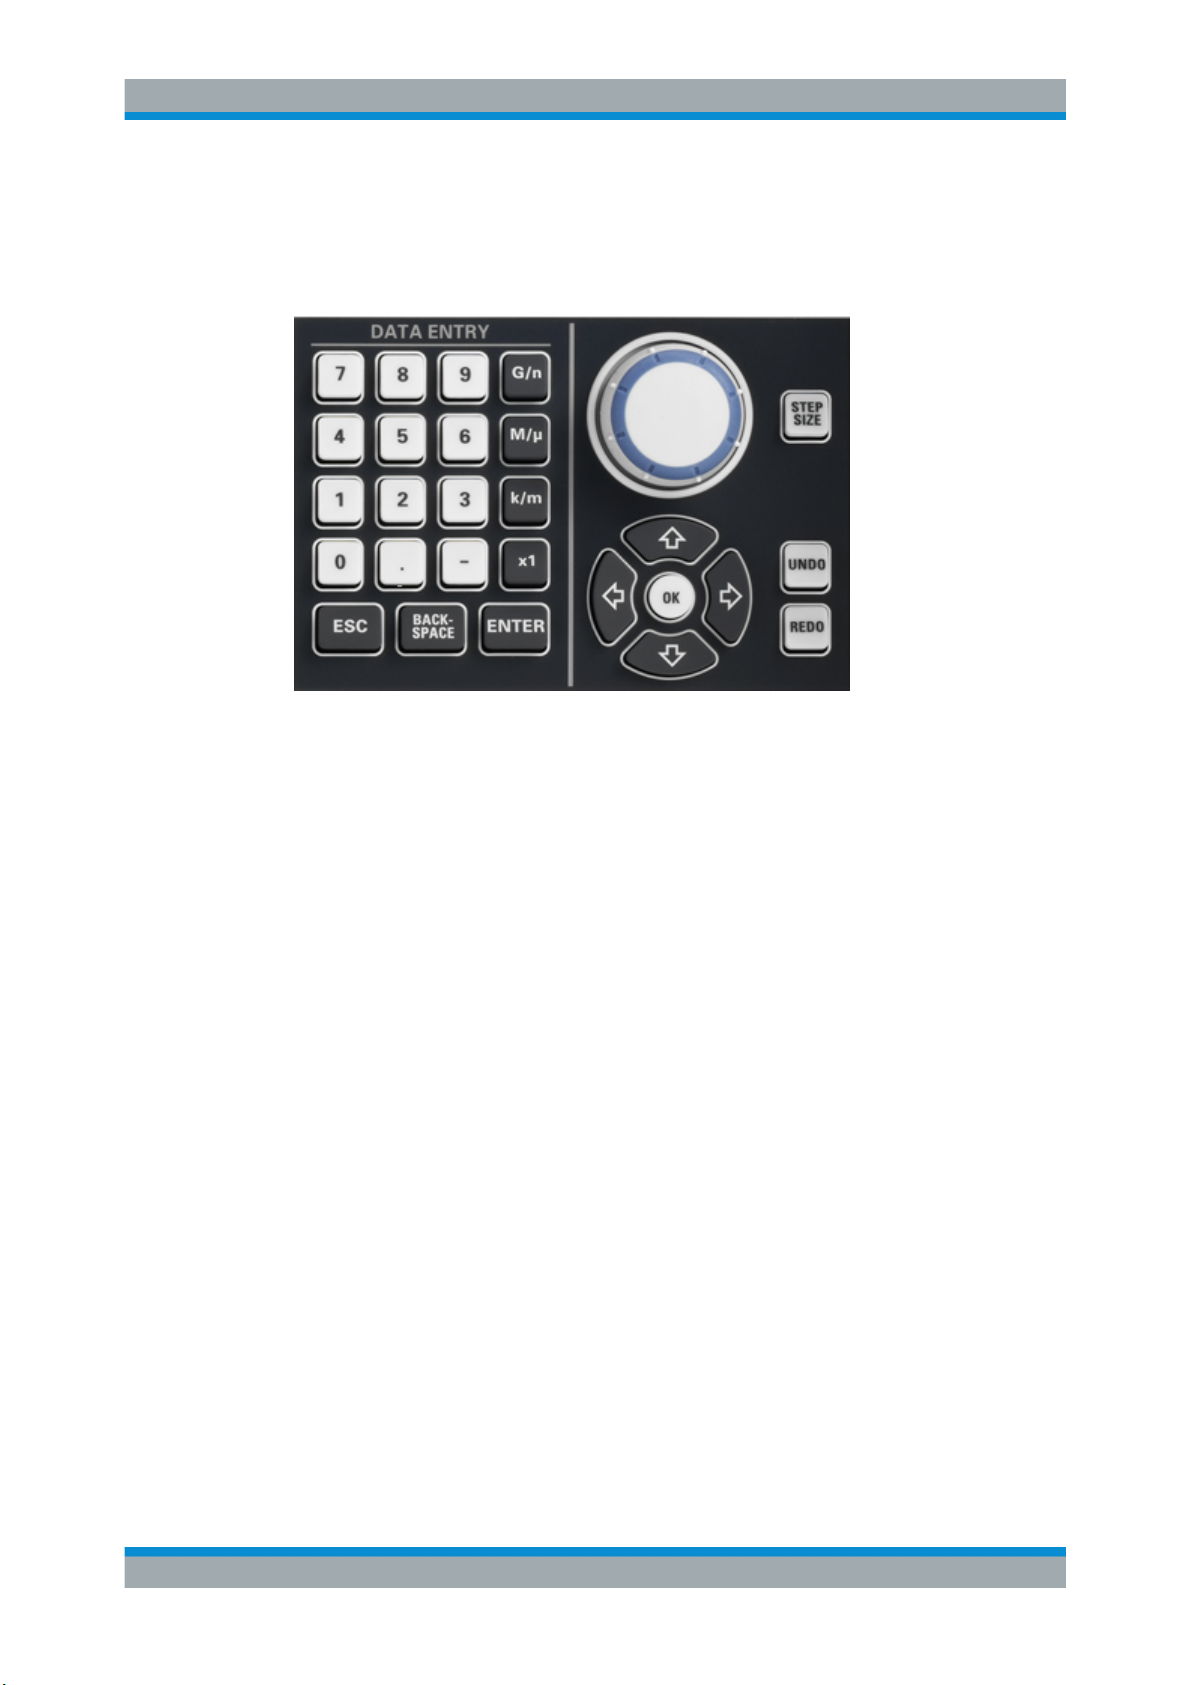
R&S® ZNB/ZNBT
4.5.1 Using Front Panel Keys
Operating the Instrument
Entering Data
On a R&S ZNB you can use the keys in the DATA ENTRY keypad to enter numbers,
units, and characters.
To enter a numeric value:
1. Select a numeric data input field to activate it.
2. Press the data entry keys.
● Use [0] to [9] to enter the corresponding numbers.
● Use [.] to enter a decimal point.
● Use [-] to change the sign of the value.
●
Use [G/n], [M/μ], [k/m], or [x1] to multiply the entered value with factors of 10
(-)6
10
(-)3
, 10
or 1 and to add the appropriate physical unit.
To enter a character string:
1. Tap a character data input field to activate it.
2. Press the DATA ENTRY keys as if you were writing a short message on your
mobile phone.
● Use [0] to [9] to enter the corresponding numbers.
● Use [.] and [-] to enter a dot or hyphen.
● Use Use [G/n], [M/μ], or [k/m] to enter the letters G, M or K (case-insensitive).
● Use the [←] key to correct wrong entries, deleting the character to the left of
the current cursor position.
● Press [ENTER] to complete an entry.
● Press [ESC] to discard the entries made.
(-)9
,
3. To enter letters other than G, M or K, you can also use one of the methods described in the following sections:
● Chapter 4.5.3, "Using the Analyzer's On-Screen Keyboard", on page 56
55Getting Started 1316.0062.02 ─ 26
Page 58
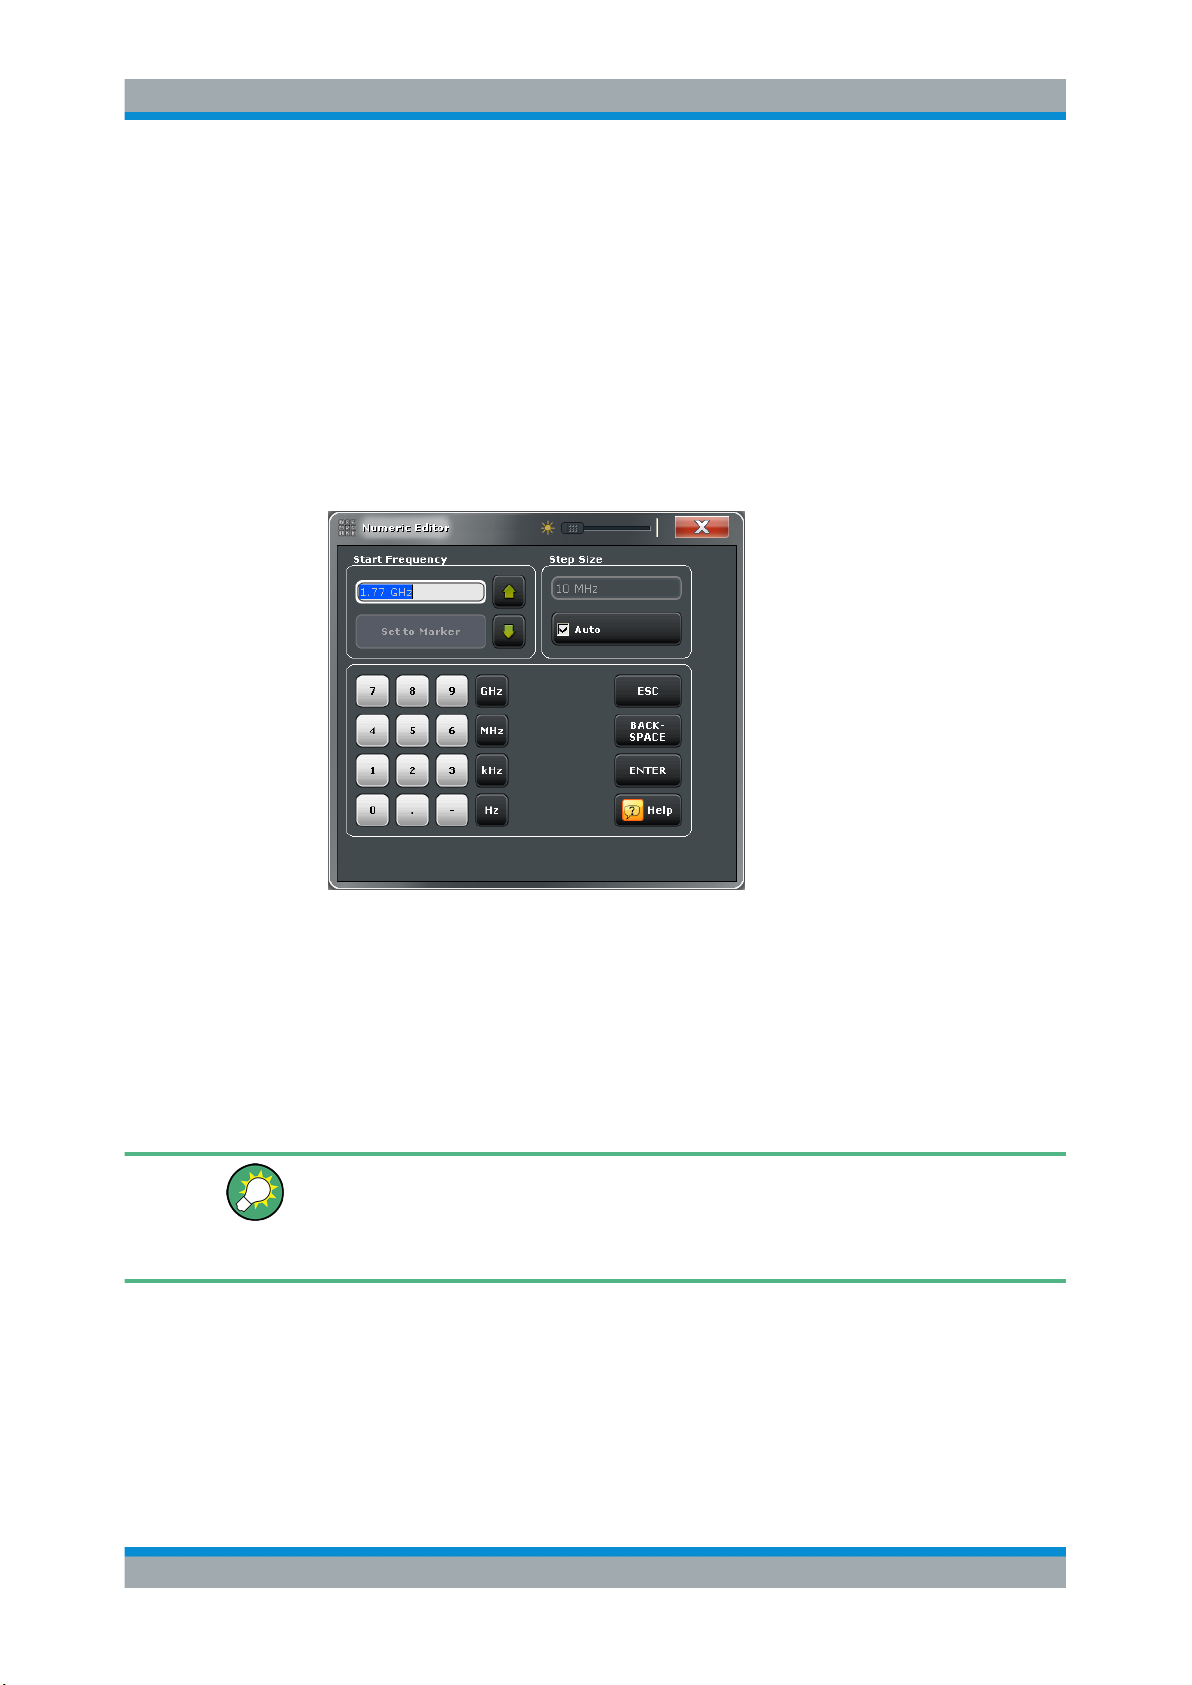
R&S® ZNB/ZNBT
4.5.2 Using the Numeric Editor
Operating the Instrument
Entering Data
●
Chapter 4.5.4, "Using the Windows® On-Screen Keyboard", on page 57
The "Numeric Editor" is a tool for convenient entry and modification of numeric values.
It is available for all numeric input fields in the analyzer GUI.
Operation with touchscreen or mouse:
1. Double-tap (double-click) a numeric input field in a dialog or on a softtool to open
the numeric editor.
2. Use the buttons in the numeric keypad to compose the numeric input value.
3. If desired, select a "Step Size" and use the cursor up/down buttons to increment/
decrement the current value. If a marker is active, you can also set the numeric
value to the current marker value ("Set to Marker").
4. After completing the input string, select "ENTER" to apply your selection and close
the numeric editor.
[STEP SIZE] key
If a numeric input field is active, the [STEP SIZE] front panel key opens a dialog box
containing the "Step Size" panel of the numeric editor. Use this box for efficient operation of the rotary knob (and mouse wheel).
4.5.3 Using the Analyzer's On-Screen Keyboard
The on-screen "Keyboard" allows you to enter characters, in particular letters, without
an external keyboard. It is available for all text input fields in the analyzer GUI.
56Getting Started 1316.0062.02 ─ 26
Page 59
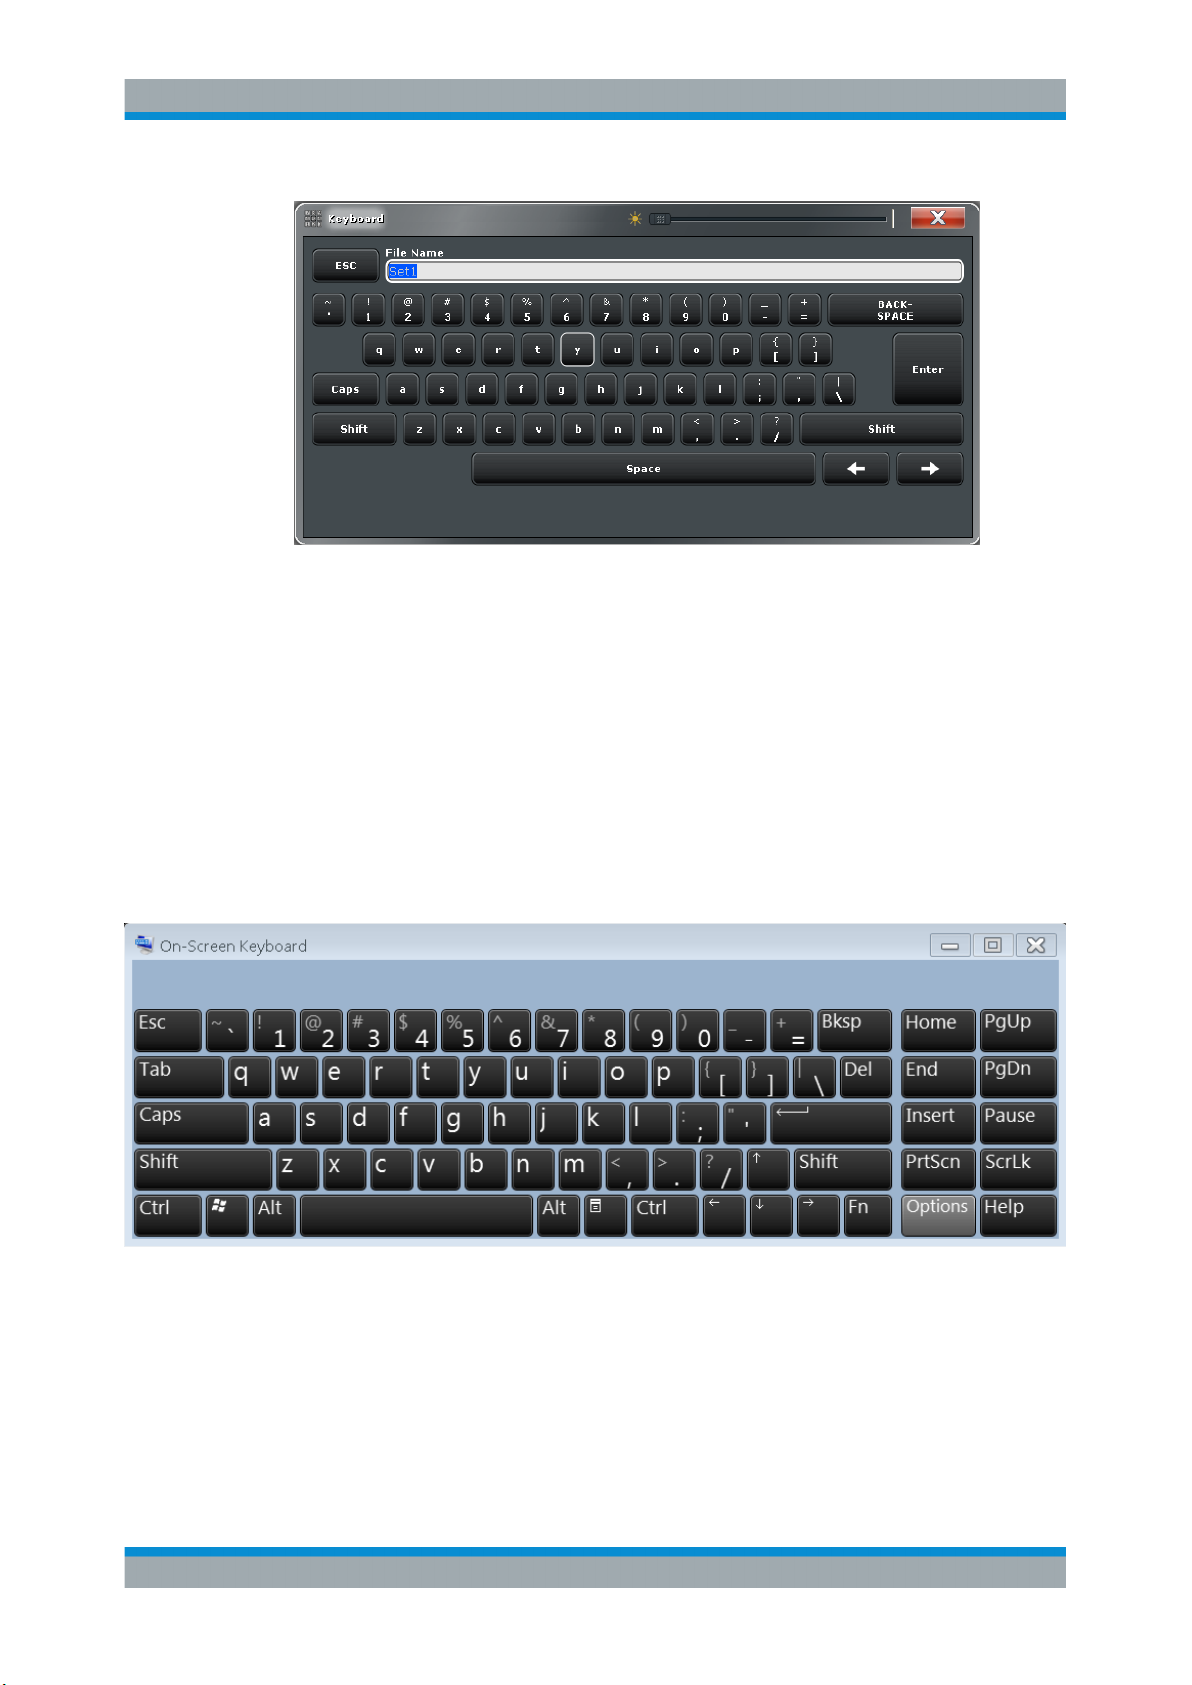
R&S® ZNB/ZNBT
Operating the Instrument
Entering Data
1. Activate a character data input field in a softtool or a dialog.
2. Double-tap/click the input field to open the on-screen keyboard.
3. Select character buttons to compose the input string.
4.5.4
4. Select "Enter" to apply your selection and close the keyboard.
Using the Windows
®
On-Screen Keyboard
The Windows® on-screen keyboard allows you to enter characters, in particular letters,
even if an input field cannot call up the analyzer's own on-screen keyboard. Examples
are input fields in standard Windows ® dialogs.
To call up the on-screen keyboard:
1. Open the SYSTEM – [APPLIC] softtool.
2. Select "External Tools"
3. Select "Screen Keyboard".
57Getting Started 1316.0062.02 ─ 26
Page 60
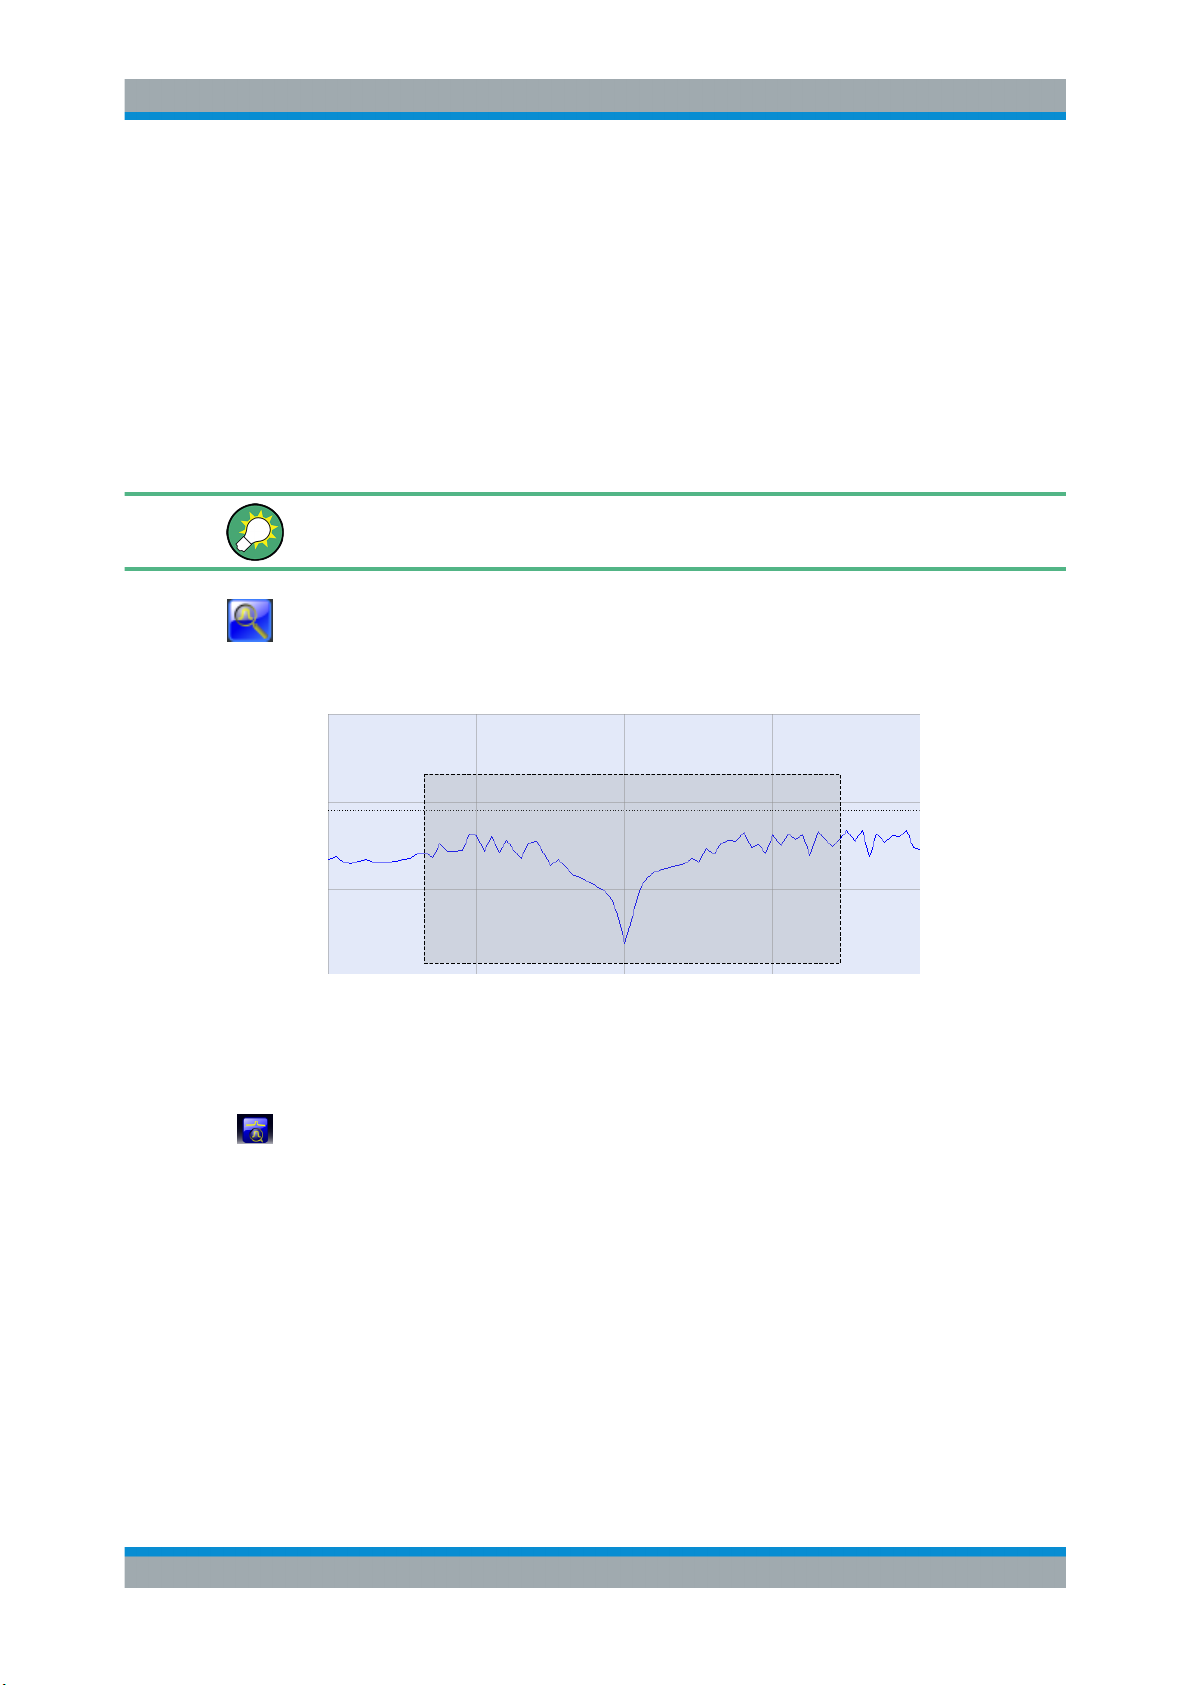
R&S® ZNB/ZNBT
4.6 Scaling Diagrams
4.6.1 Using the Graphical Zoom
Operating the Instrument
Scaling Diagrams
The analyzer provides various tools for customizing the diagrams and for setting the
sweep range. Choose the method that is most convenient for you.
The graphical zoom function magnifies a rectangular portion of the diagram (zoom window) to fill the entire diagram area. The sweep points are not affected.
The graphical zoom function is only supported for cartesian trace formats. For (inverted) Smith and polar diagrams, it is not available.
To activate the graphical zoom:
●
Select the "Zoom Select" toggle button in the toolbar above the diagram area.
The icon changes its background color from black to blue.
●
In the active diagram area, select an appropriate rectangular area.
The zoomed view shows the selected rectangle, scaled in both horizontal and vertical direction. In general, the zoom window covers only a part of the sweep range;
the horizontal distance between the sweep points increases. The reduced display
range is indicated in an additional zoom line in the channel info area.
If the active diagram is graphically zoomed, the "Overview Select" button in the toolbar
toggles an overview. The upper part of the diagram then shows a small version of the
unzoomed diagram. You can move the zoomed part of the trace by moving the
selected rectangular area in the overview.
58Getting Started 1316.0062.02 ─ 26
Page 61
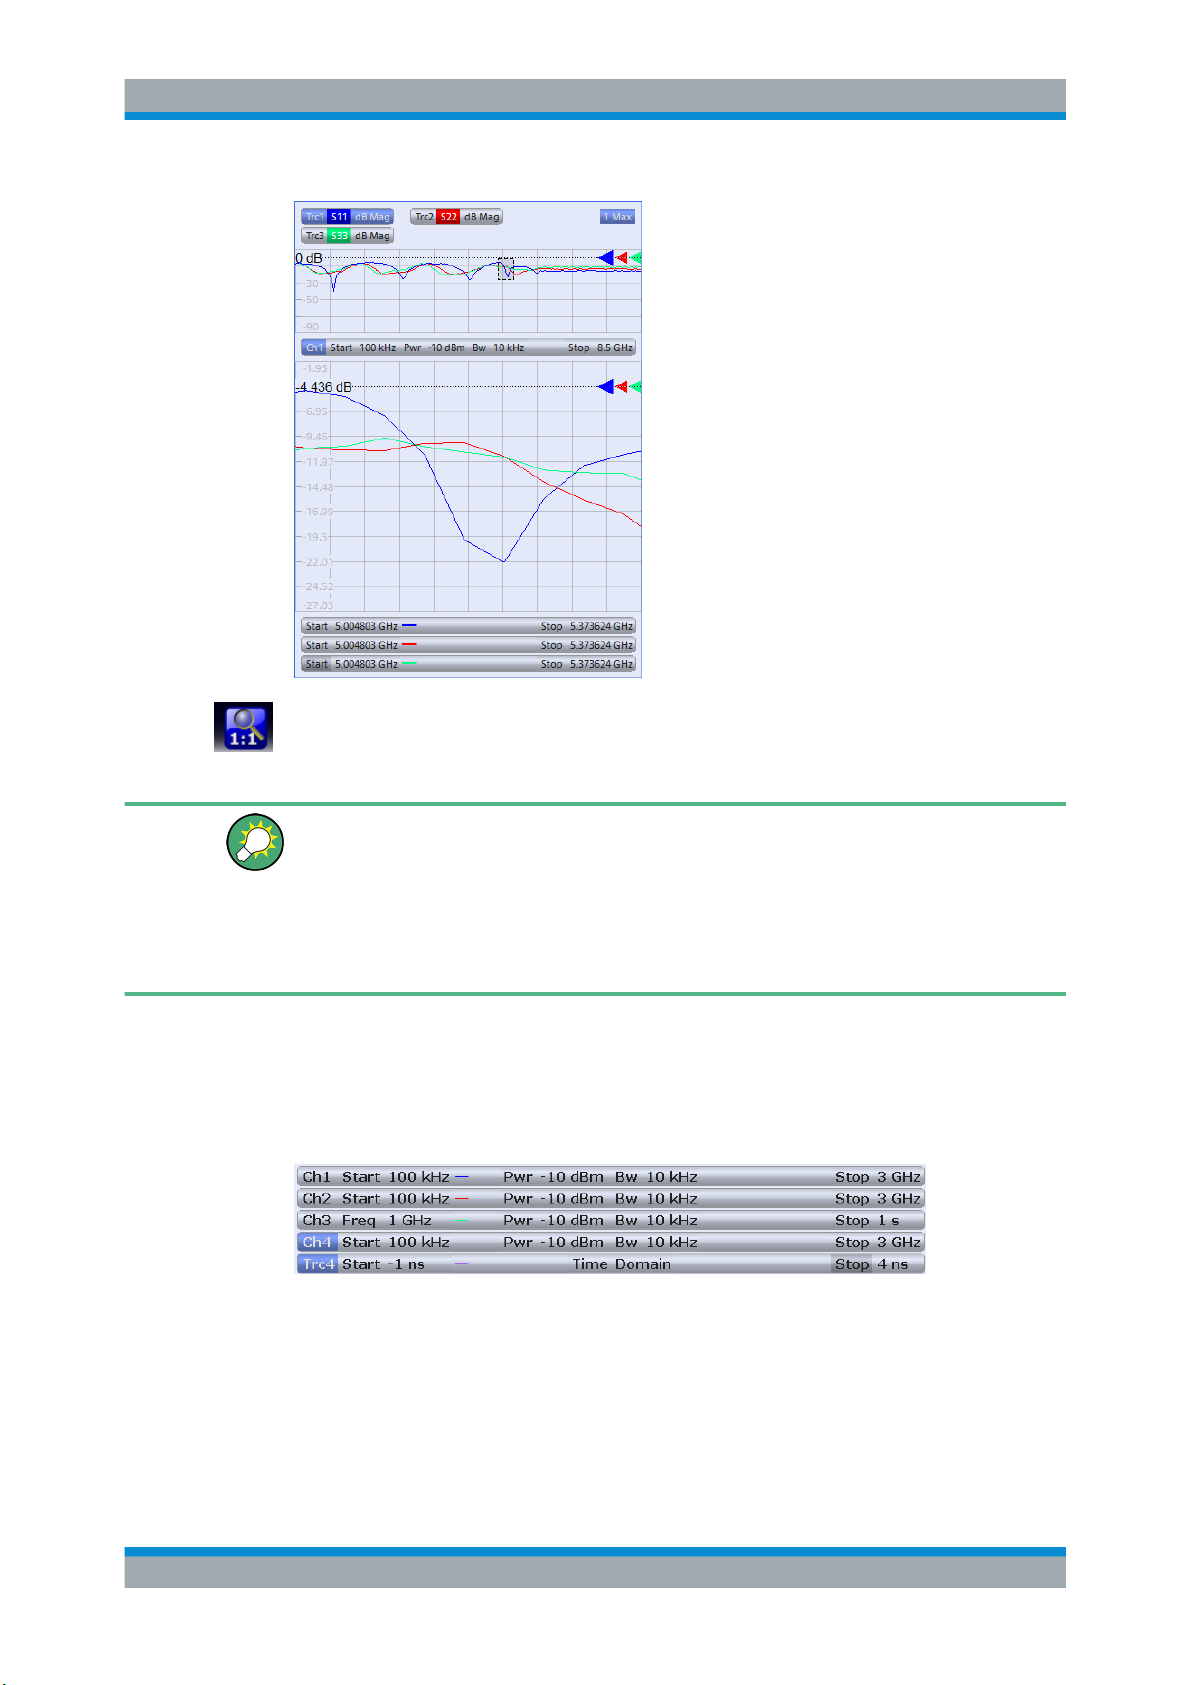
R&S® ZNB/ZNBT
Operating the Instrument
Scaling Diagrams
Use the "Zoom Reset" icon to restore the original diagram. Alternatively, you can drag
and drop the "Zoom" label from the additional channel info line onto the "Delete" toolbar button.
Alternative settings
●
The TRACE – [SCALE] > "Zoom" softtool tab allows you to define the displayed
zoom range numerically.
●
To zoom the stimulus range (keeping the number of sweep points constant), use
the "Zoom Stimulus" function in the "Stimulus" tab of the "Stimulus" softtool. The
latter can be opened using the keys in the STIMULUS section.
4.6.2 Setting the Sweep Range
The sweep range for all related channels is displayed in the channel info area at the
bottom of each diagram:
To change the sweep range of the active channel, use one of the following methods:
●
Use the [START], [STOP], [CENTER], and [SPAN] function keys from the STIMULUS section.
●
Double-tap (with a mouse: double-click) the "Start" or "Stop" label in the channel
list.
59Getting Started 1316.0062.02 ─ 26
Page 62
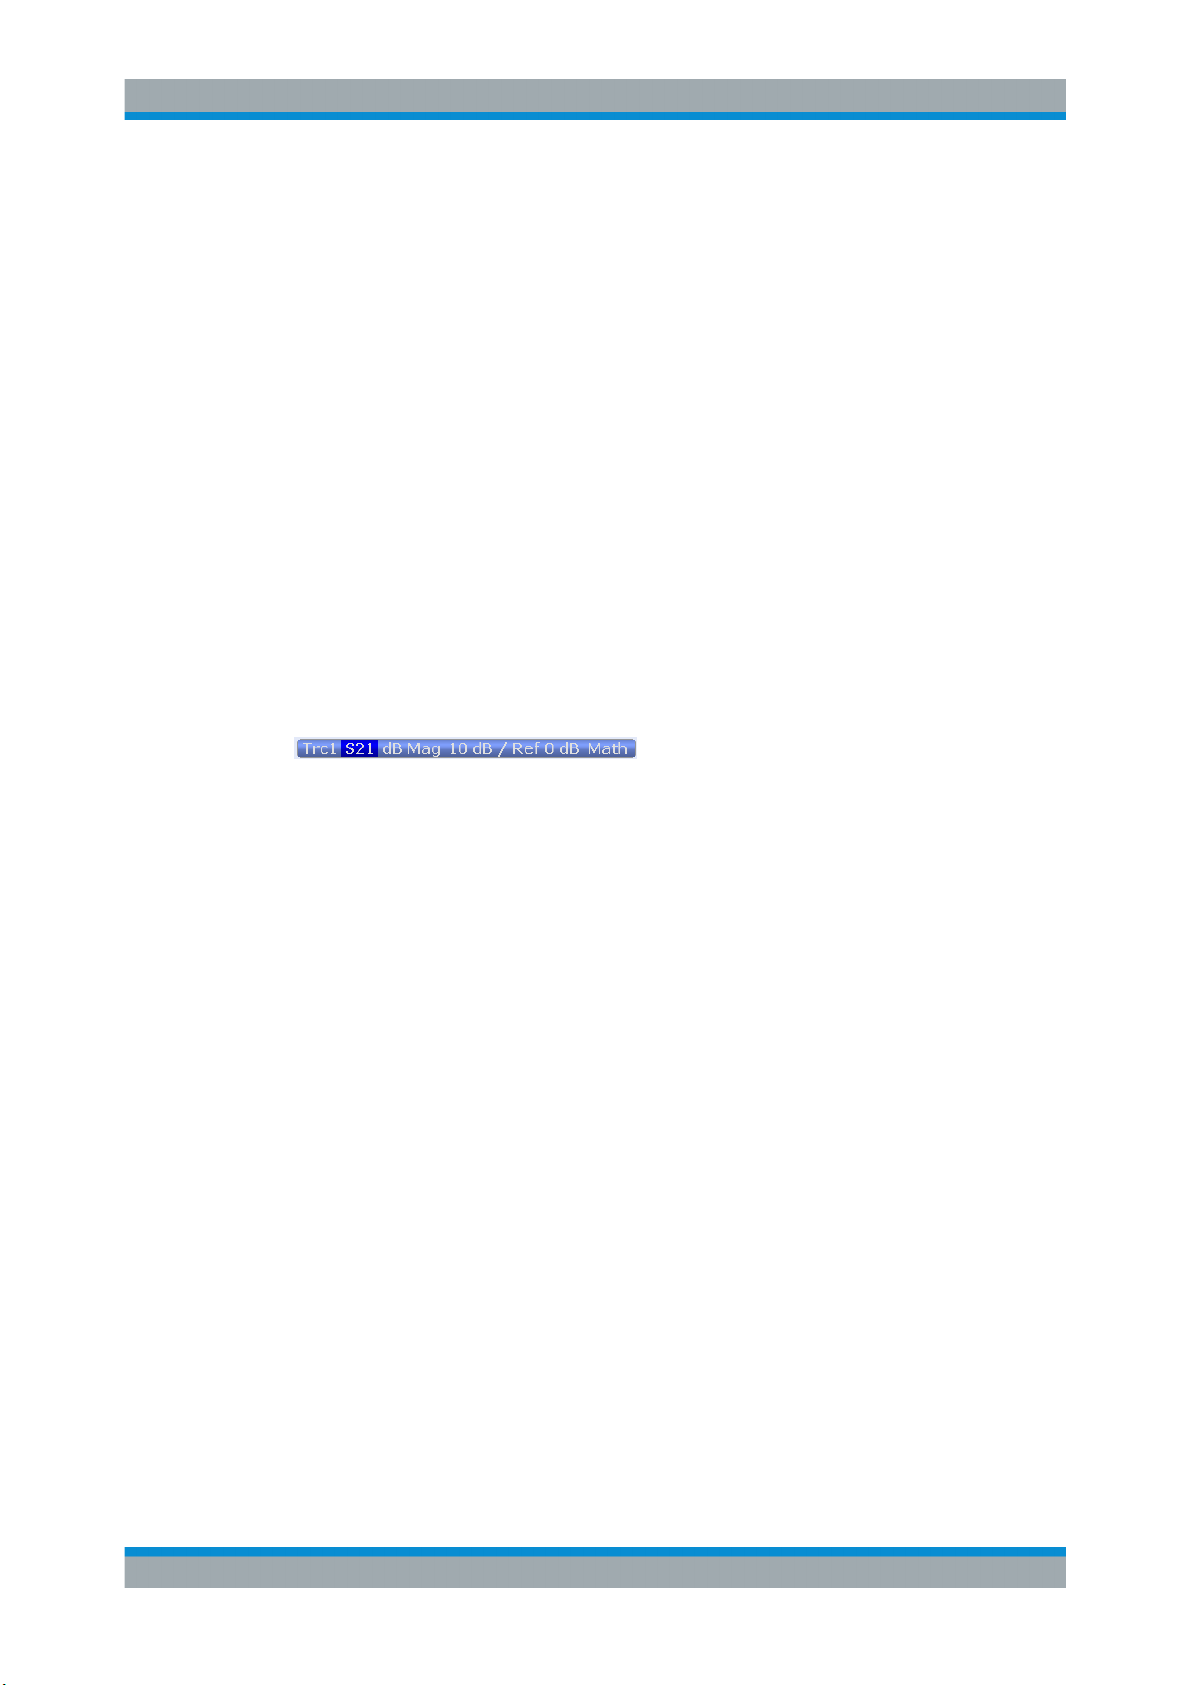
R&S® ZNB/ZNBT
4.6.3 Reference Value and Position
Operating the Instrument
Scaling Diagrams
●
Tap and hold (with a mouse: right-click) the "Start" or "Stop" label in the channel list
and select "Start Frequency", "Stop Frequency", "Center Frequency", or "Frequency Span" from the context menu.
●
Select "Start Frequency", "Stop Frequency", "Center Frequency", "Span Frequency" from the "Channel" > "Stimulus" menu.
●
Use the "Set by Marker" functions (TRACE – [MARKER] > "Set by Marker"; see
Chapter 4.6.6, "Set by Marker", on page 61).
The analyzer provides three parameters for changing the scale of the vertical
(response) axis:
●
Changing the "Ref Value" or "Ref Pos" shifts the trace in vertical direction and
adjusts the labels of the vertical axis. "Ref Value" also works for radial diagrams.
●
Changing the "Scale/Div" modifies the value of the vertical or radial diagram divisions and thus the entire range of response values displayed.
The "Scale/Div" and the "Ref Value" are indicated in the scale section of the trace info.
In the example below, a "Scale/Div" of 10 dB and a "Ref Value" of 0 dB is used.
To change such a scale parameter, use one of the following methods:
●
Open the TRACE – [SCALE] > "Scale Values" softtool tab and proceed from there.
●
Tap and hold (with a mouse: right-click) the scale section in the trace info and
select a setting from the context menu.
●
Select a setting from the "Trace" > "Scale" menu.
●
Use "Set by Marker" functions (TRACE – [MARKER] > "Set by Marker"; see Chap-
ter 4.6.6, "Set by Marker", on page 61).
4.6.4 Auto Scale
The "Auto Scale" function adjusts the scale divisions and the reference value so that
the entire trace fits into the diagram. To access "Auto Scale", use one of the following
methods:
●
Open the TRACE – [SCALE] > "Scale Values" softtool tab and select "Auto Scale
Trace" or "Auto Scale Diagram".
●
Tap and hold (with a mouse: right-click) the scale section in the trace info and
select "Auto Scale Trace" from the context menu.
●
Select "Auto Scale Trace" or "Auto Scale Diagram" from the "Trace" > "Scale"
menu.
60Getting Started 1316.0062.02 ─ 26
Page 63
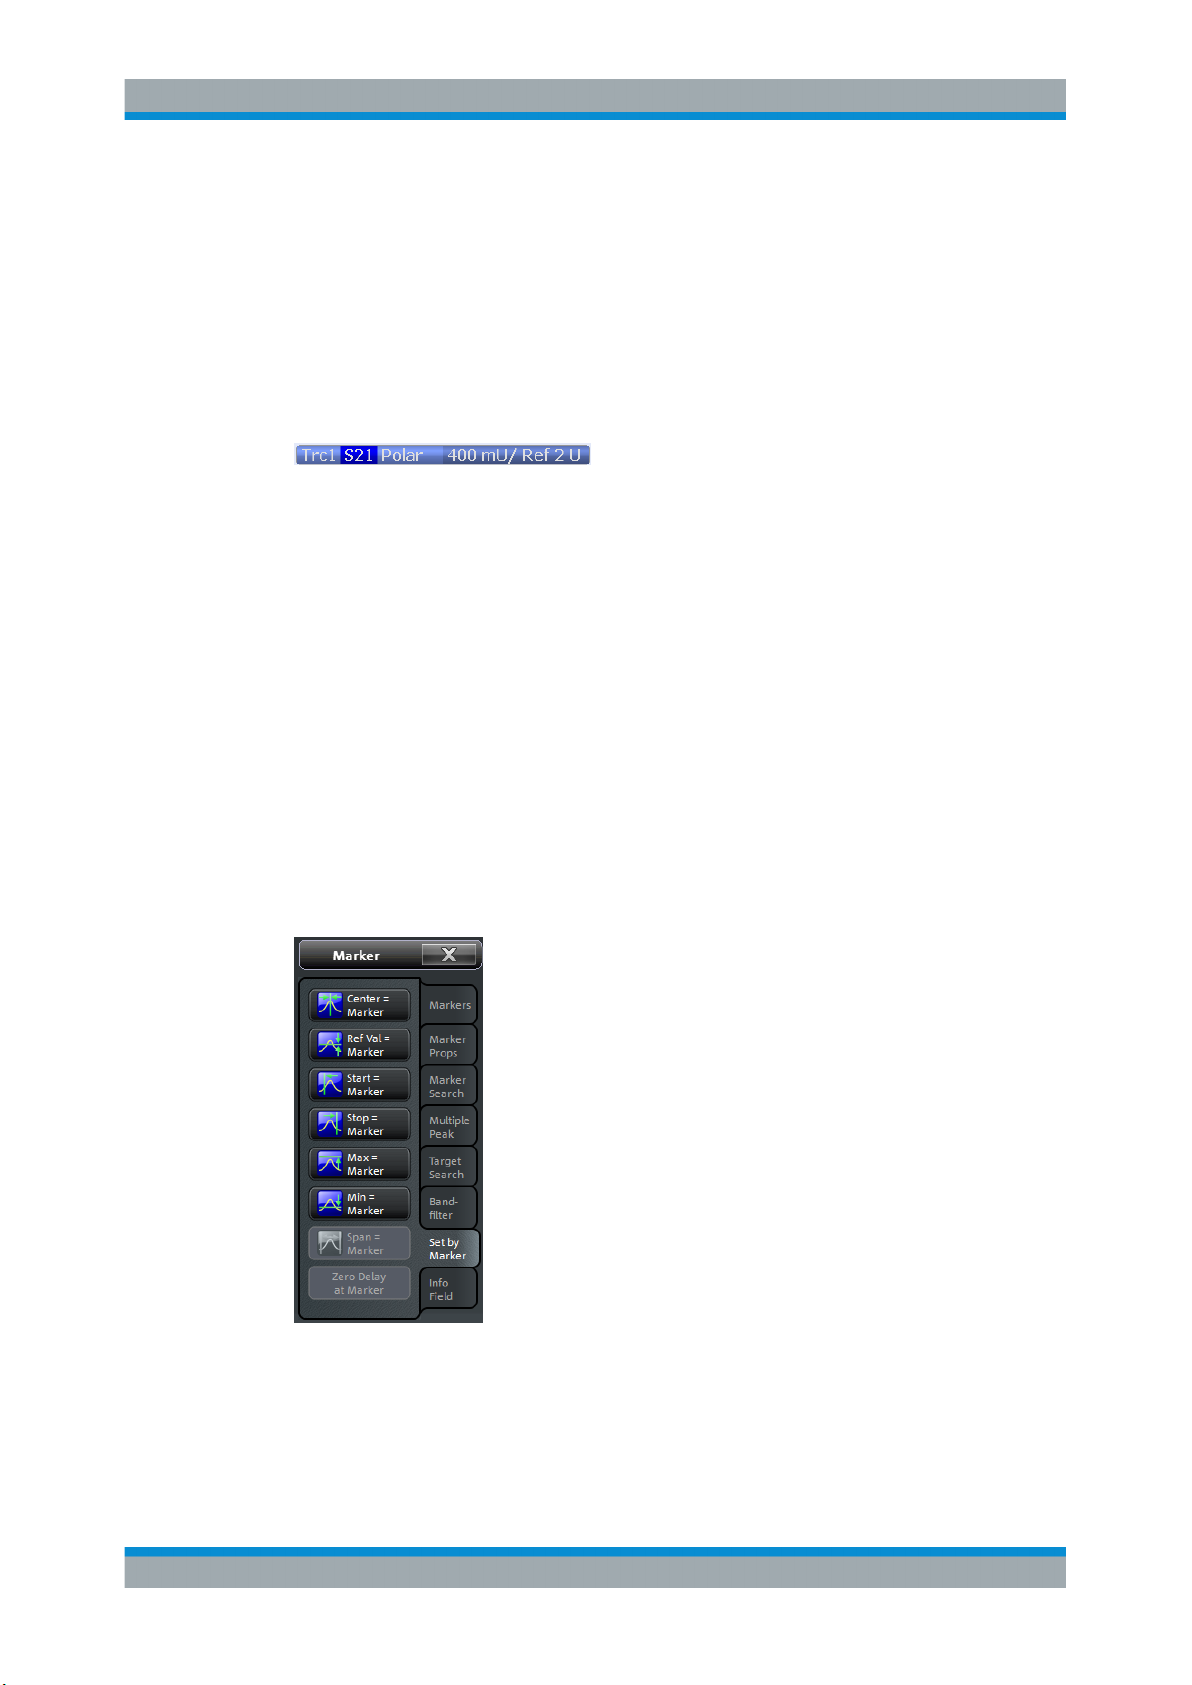
R&S® ZNB/ZNBT
4.6.5 Circular Diagrams
Operating the Instrument
Scaling Diagrams
The radial scale of a circular diagram ("Polar", "Smith" or "Inverted Smith") can be
changed with a single linear parameter, the "Ref Value". The reference value defines
the radius of the outer circumference.
●
Increasing the "Ref Value" scales down the polar diagram.
●
Decreasing the "Ref Value" magnifies the polar diagram.
The "Ref Value" is indicated in the scale section of the trace info.
To change the "Ref Value" setting, use one of the following methods:
●
Locate it on the TRACE – [SCALE] > "Scale Values" softtool tab.
●
Tap and hold (with a mouse: right-click) the scale section in the trace info and
select the parameter from the context menu.
●
Select the parameter from the "Trace" > "Scale" menu.
●
Use the "Set by Marker" functions; see Chapter 4.6.6, "Set by Marker",
on page 61.
4.6.6 Set by Marker
The "Set by Marker" functions are a convenient tool for scaling (in particular: magnifying) diagrams without entering explicit numeric values. You simply place a marker to a
trace point and use the marker values to change the sweep range or move the trace
relative to the vertical axis. The touchscreen or a mouse makes it easier to activate
(touch/click) or move (drag and drop) markers.
To set the sweep range using markers, use one of the following methods.
61Getting Started 1316.0062.02 ─ 26
Page 64
R&S® ZNB/ZNBT
Operating the Instrument
Scaling Diagrams
Set "Start" and "Stop" values in the diagram:
1. Create two normal markers, e.g. the markers "Mkr 1" (default label "M1") and "Mkr
2" (default label "M2").
See Chapter 4.4.2, "Adding New Markers", on page 52.
2. Place "M1" to the start value of the desired sweep range and tap TRACE –
[MARKER] > "Set by Marker" > "Start = Marker".
3. Place "M2" to the stop value of the desired sweep range and tap TRACE –
[MARKER] > "Set by Marker" > "Stop = Marker".
Use a definite "Span:"
1. Create a marker.
2. Enable "Delta Mode" for this marker.
The analyzer automatically creates an additional reference marker.
3. Place the reference marker to the start value of the desired sweep range.
4. Set the value of the delta marker to the desired sweep range and tap TRACE –
[MARKER] > "Set by Marker" > "Span = Marker".
To move the trace in vertical direction, proceed as follows:
1. Create a normal marker, e.g. the marker "Mkr 1" (default label "M1").
2. Place "M1" to a particular trace point, e.g. use the "Marker Search" functions to
locate a maximum or minimum on the trace.
3. Select TRACE – [MARKER] > "Set by Marker" > "Max = Marker" to move the trace
towards the upper diagram edge, leaving the values of the vertical divisions
("Scale/Div") and the overall vertical scale unchanged. Analogously, select "Min =
Marker" to move the trace towards the lower diagram edge, or select "Ref Val =
Marker" to move the trace towards the "Ref Value".
You can also use marker values in the "Numeric Editor"; see Chapter 4.5.2, "Using the
Numeric Editor", on page 56.
4.6.7 Enlarging a Diagram
The analyzer provides different tools for customizing the contents and size of the diagrams:
●
Double-tap/click a diagram to maximize it. Or equivalently, select SYSTEM – [DISPLAY] > "Diagram" > "Maximize".
If enabled the active diagram is always maximized.
●
The "Menu Bar", the "Status Bar", the "Hard Key Panel", and the "Title Bar" can be
hidden to gain space for the diagrams (SYSTEM – [DISPLAY] > "View Bar").
62Getting Started 1316.0062.02 ─ 26
Page 65

R&S® ZNB/ZNBT
Operating the Instrument
Scaling Diagrams
●
The SYSTEM – [DISPLAY] > "Config" softtool tab defines optional display elements
for the interior of the diagrams.
Use the context menu of the diagram, the SYSTEM – [DISPLAY] key or the "Display"
menu to access the display settings.
63Getting Started 1316.0062.02 ─ 26
Page 66
R&S® ZNB/ZNBT
5 Performing Measurements
Performing Measurements
Transmission S-Parameter Measurement
This chapter takes you through a sample session with a R&S ZNB/ZNBT network analyzer and describes basic operation tasks.
Safety considerations
Before starting any measurement on your network analyzer, please note the instructions given in Chapter 2, "Putting the Analyzer into Operation", on page 11.
Use the "S-Parameter Wizard" accessible via TRACE – [MEAS] > "S-Params" > "SParam Wizard..." to measure S-parameters in a straightforward way. The wizard provides a series of dialogs where you can select the test setup, screen configuration and
measurement parameters, configure the essential channel settings and perform a guided calibration.
Measurement stages in the wizard
The individual dialogs of the "S-Parameter Wizard" correspond to the typical stages of
any measurement:
1. Select the test setup.
2. Define port impedances.
3. Select the measurement parameters and the diagrams.
4. Define the sweep range.
5. Adjust the receiver and source settings (measurement bandwidth, source power).
6. Perform a calibration.
5.1 Transmission S-Parameter Measurement
In a transmission measurement, the analyzer transmits a stimulus signal to the input
port of the device under test (DUT) and measures the transmitted wave at the DUT's
output port. The trace settings allow you to select the measured quantities and display
formats, depending on what you want to learn from the data. A minimum of two analyzer test ports are required for transmission measurements.
In the following example, the analyzer is set up for a two-port transmission measurement. A frequency sweep range is selected, the instrument is calibrated and the measurement result is analyzed using various display formats.
64Getting Started 1316.0062.02 ─ 26
Page 67
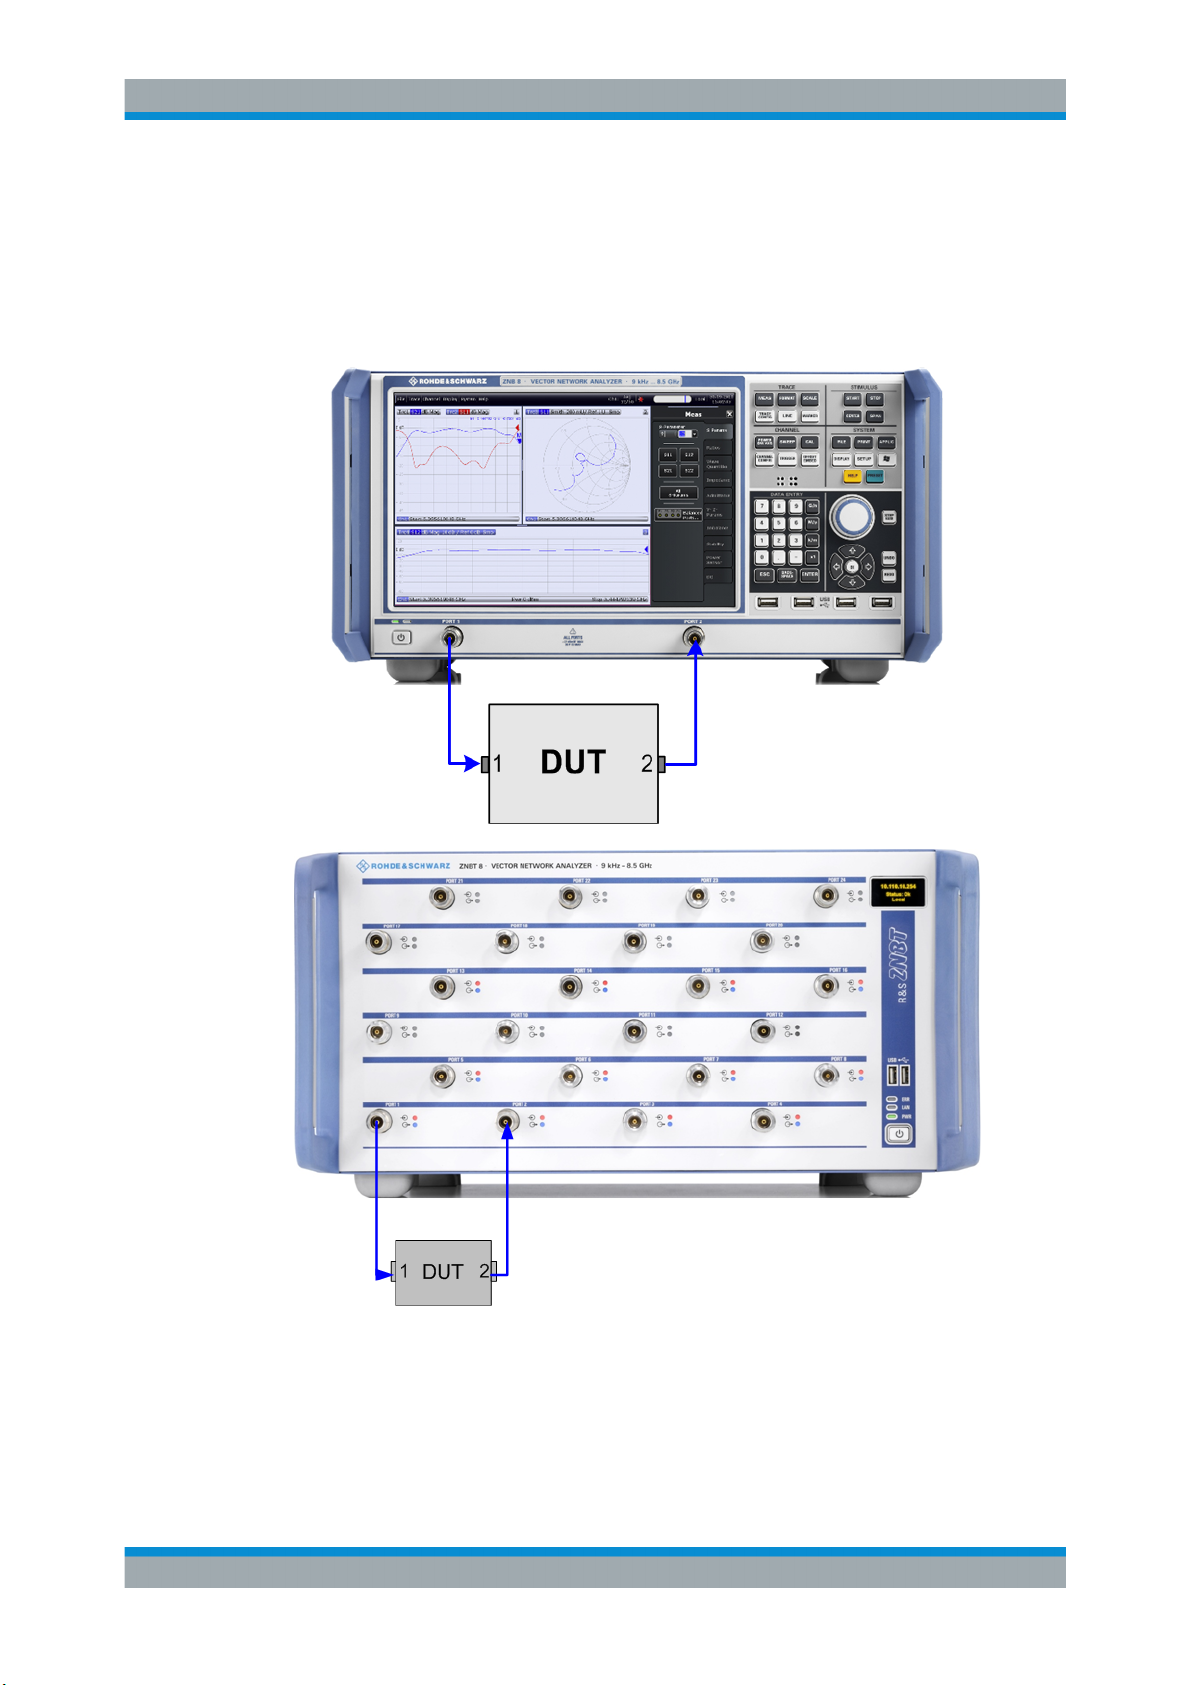
R&S® ZNB/ZNBT
5.1.1 Connecting the Instrument for Transmission Measurements
Performing Measurements
Transmission S-Parameter Measurement
To prepare a transmission measurement, you have to connect your DUT (which for
simplicity we assume to have appropriate connectors) in-between a pair of analyzer
test ports. It is recommended that you preset the R&S ZNB/ZNBT to start from a welldefined instrument state.
1. Connect the DUT between test ports 1 and 2 of the network analyzer as shown
above.
2. Switch on the instrument and start the VNA application.
65Getting Started 1316.0062.02 ─ 26
Page 68
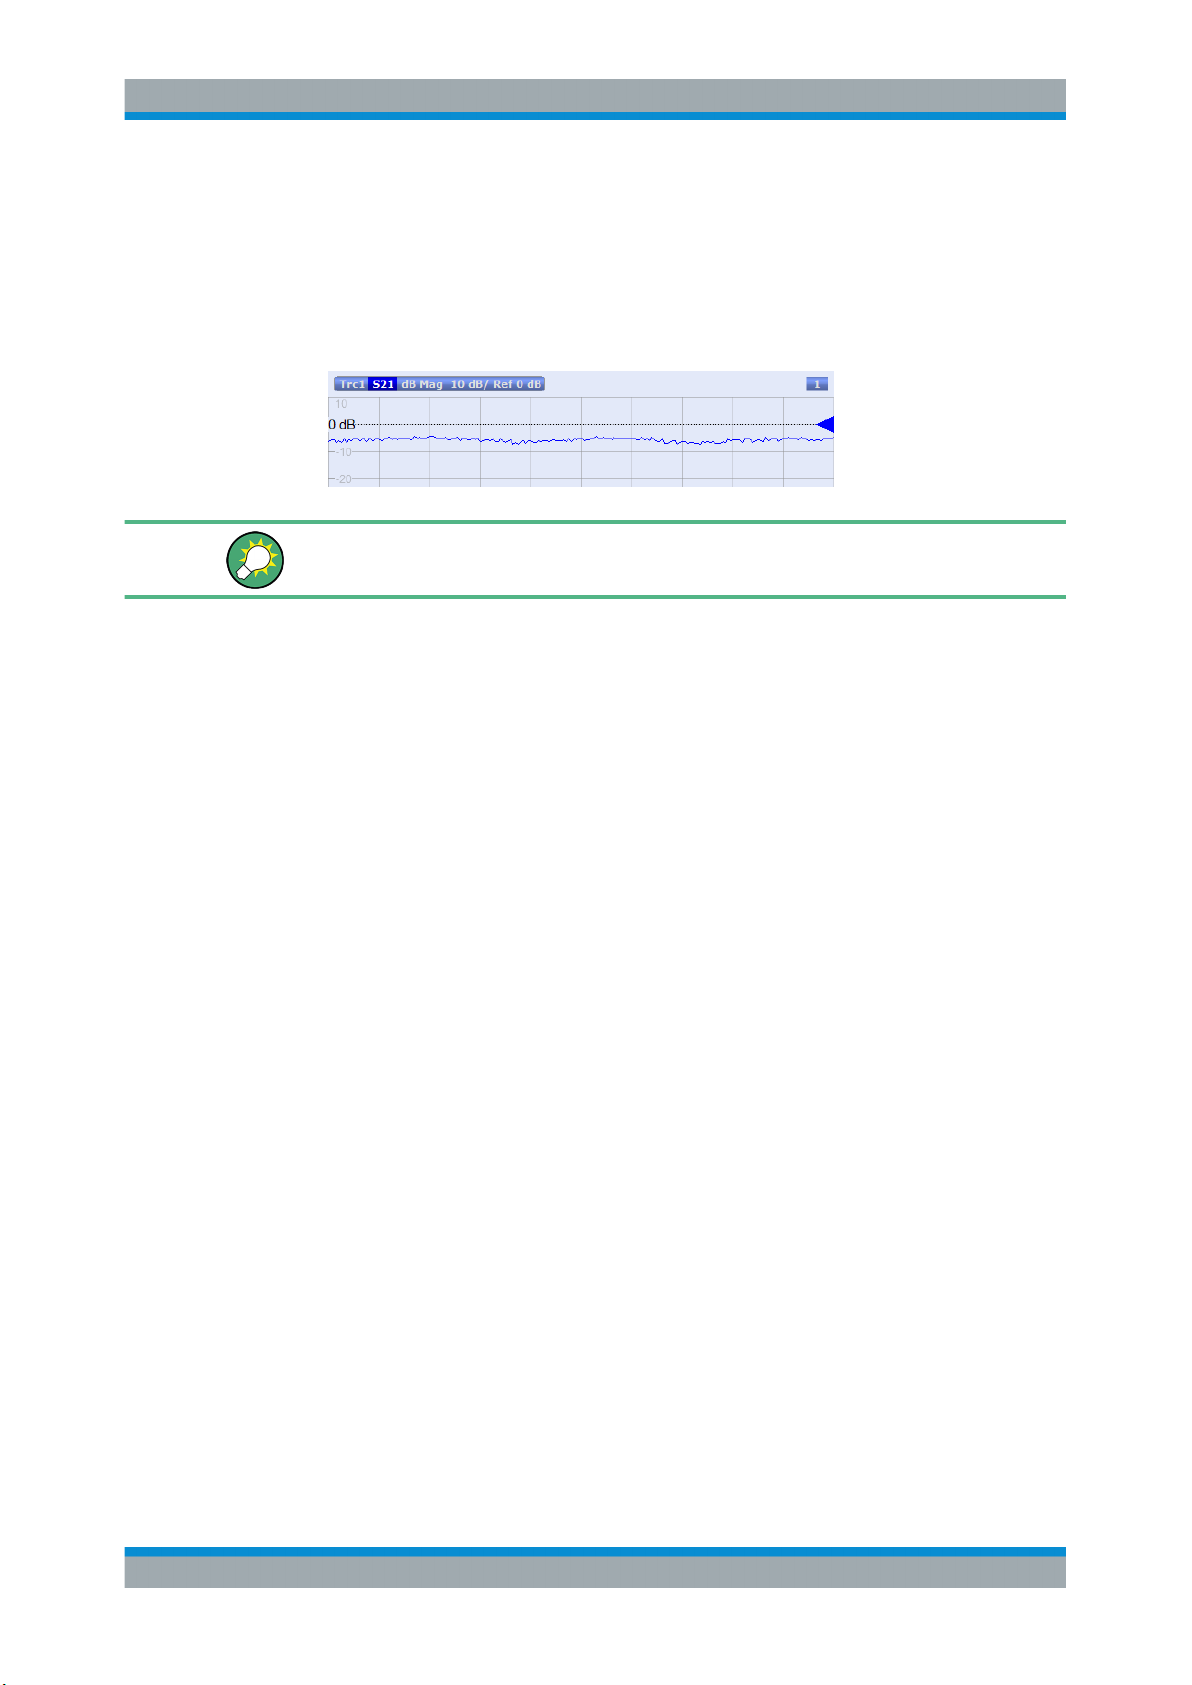
R&S® ZNB/ZNBT
5.1.2 Selecting the Sweep Range and Other Parameters
Performing Measurements
Transmission S-Parameter Measurement
Proceed as described in Chapter 2.7, "Starting the Analyzer and Shutting Down",
on page 14.
3. Use the [PRESET] key to restore a well-defined instrument state.
The analyzer is now set to its default state. The default measured quantity is the
transmission S-parameter S21.
Select TRACE – [TRACE CONFIG] and use the control elements in the "Traces" softtool tab if you wish to create additional traces and diagrams.
After a system preset the display shows a diagram with a dB magnitude scale, and the
S-parameter S21 is selected as a measured quantity. This S-parameter is the forward
transmission coefficient of the DUT. It is defined as the ratio of the transmitted wave at
the DUT's output port (port no. 2) to the incident wave at the DUT's input port (port no.
1).
The R&S ZNB/ZNBT automatically adjusts its internal source and receiver to the
selected measured quantities: For an S21 measurement, a stimulus signal (termed a1)
is transmitted at the analyzer port no. 1; the transmitted wave (termed b2) is measured
at port 2. The stimulus signal from the analyzer port no. 2 is not needed except for
some calibration types.
By default the sweep range is set to the frequency range of the analyzer, which can be
unsuitable for your DUT. The following procedure shows you how to configure a
smaller sweep range.
1. Select STIMULUS – [START] and set the "Start Frequency" to the lowest frequency you want to measure (e.g. 1.77 GHz). For convenient numeric entry, open
the "Numeric Editor" (see Chapter 4.5.2, "Using the Numeric Editor", on page 56).
Tip: If you use the DATA ENTRY keys at the front panel for data entry (R&S ZNB
only), type [1][.][7][7] and terminate the entry with the [G/n] key.
Refer to Chapter 4.5, "Entering Data", on page 54 to learn more about entering
numeric values and characters.
2. In the "Stop Frequency" input field, enter the highest frequency you want to measure (e.g. 2.5 GHz).
3. Select TRACE – [SCALE] > "Scale Values" and activate the "Auto Scale Trace"
function. The analyzer adjusts the scale of the diagram to fit in the entire S21 trace,
leaving an appropriate display margin.
66Getting Started 1316.0062.02 ─ 26
Page 69
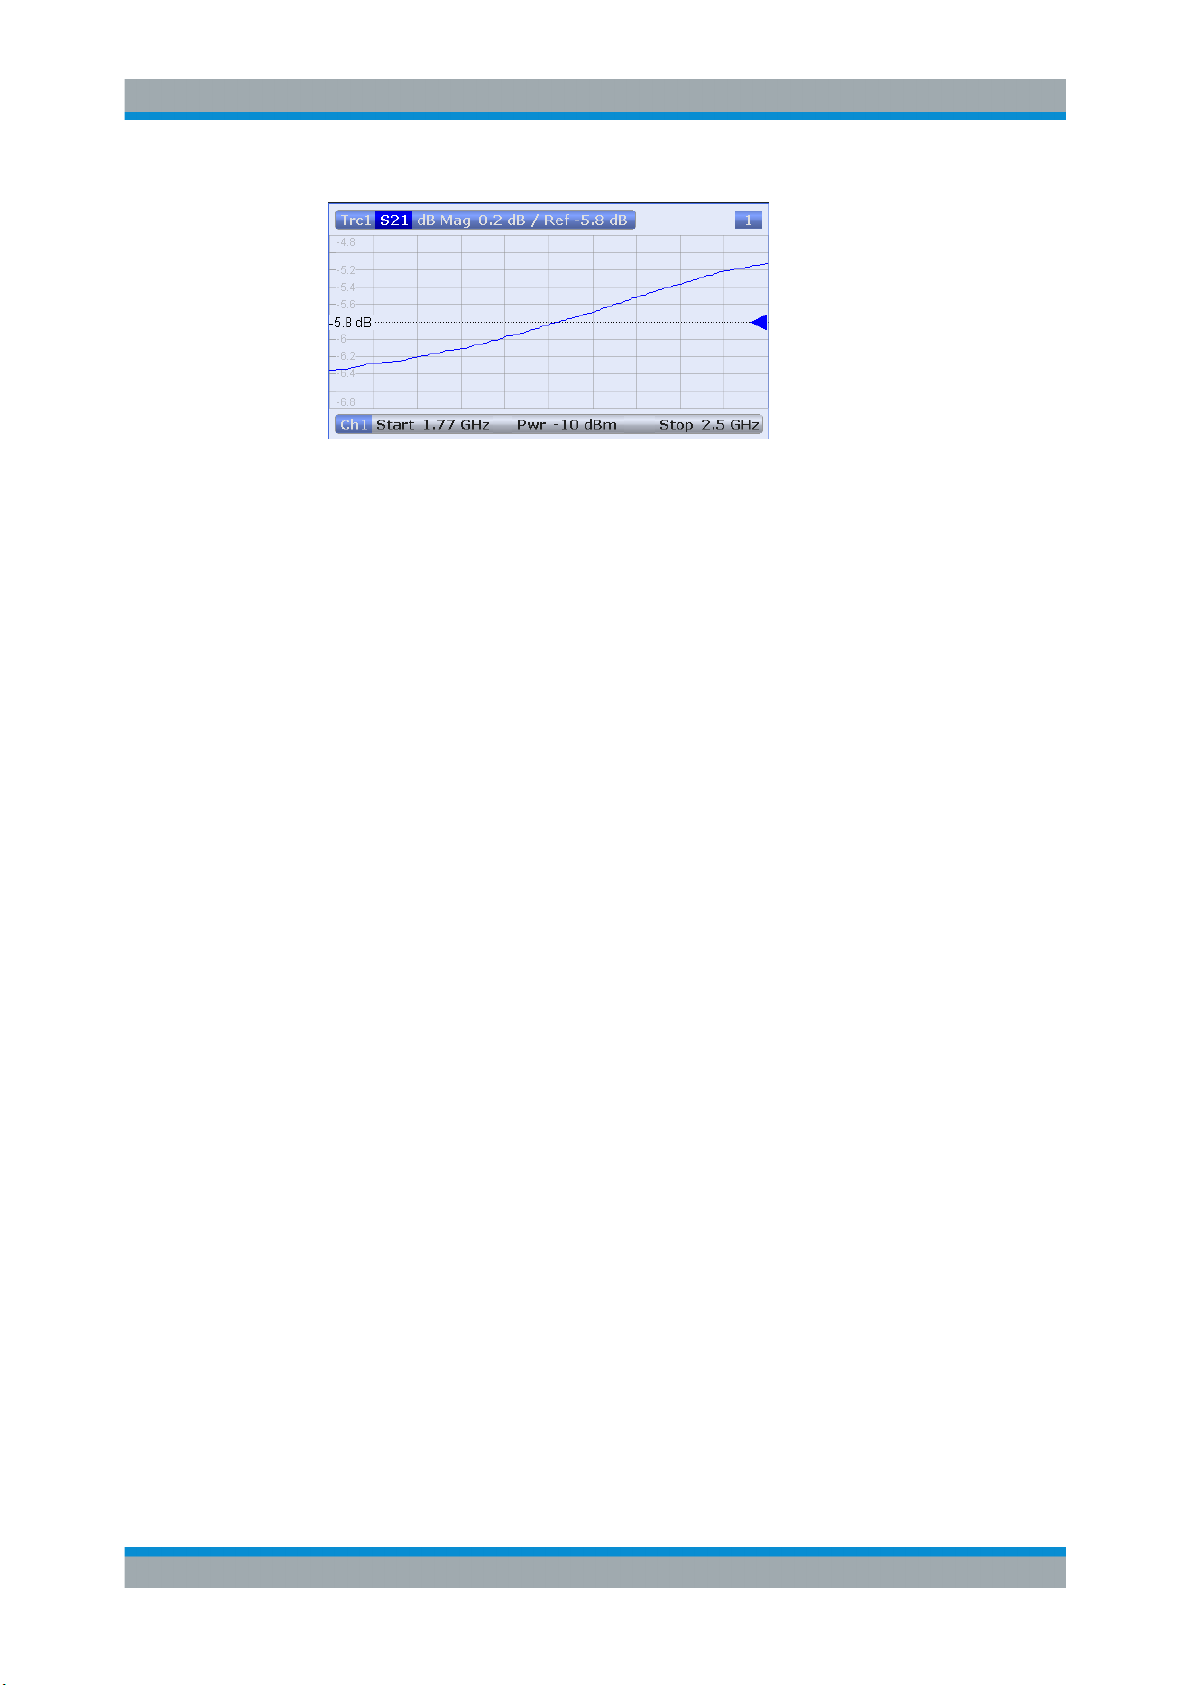
R&S® ZNB/ZNBT
5.1.3 Calibrating the Instrument
Performing Measurements
Transmission S-Parameter Measurement
Tip: Refer to Chapter 4.6, "Scaling Diagrams", on page 58 to learn more about the
different methods and tools for diagram scaling.
Calibration (system error correction) is the process of eliminating systematic, reproducible errors from the measurement results. E.g., in the current test setup, the connecting cables between the analyzer ports and the DUT introduce an attenuation and a
phase shift of the waves. Both effects impair the accuracy of the S-parameter measurement.
The analyzer provides a wide range of sophisticated calibration methods for all types of
measurements. The calibration method to select depends on the expected system
errors, the accuracy requirements of the measurement, on the test setup and on the
types of calibration standards available.
The following example requires a calibration kit with a male Through standard with
known transmission characteristics for the related test port connector type and gender.
With a single Through, it is possible to perform a transmission normalization, compensating for a frequency-dependent attenuation and phase shift in the signal paths.
Due to the R&S ZNB/ZNBT's calibration wizard, calibration is a straightforward, guided
process.
1. Replace the DUT by the Through standard of your calibration kit.
2. Select CHANNEL – [CAL] > "Start... (Manual)" to open the "Calibration Setting"
wizard.
3. Select the port combination Port 1 (P1) and Port 2 (P2) and the calibration type
"Trans Norm". Make sure to define port 1 as the source port.
67Getting Started 1316.0062.02 ─ 26
Page 70
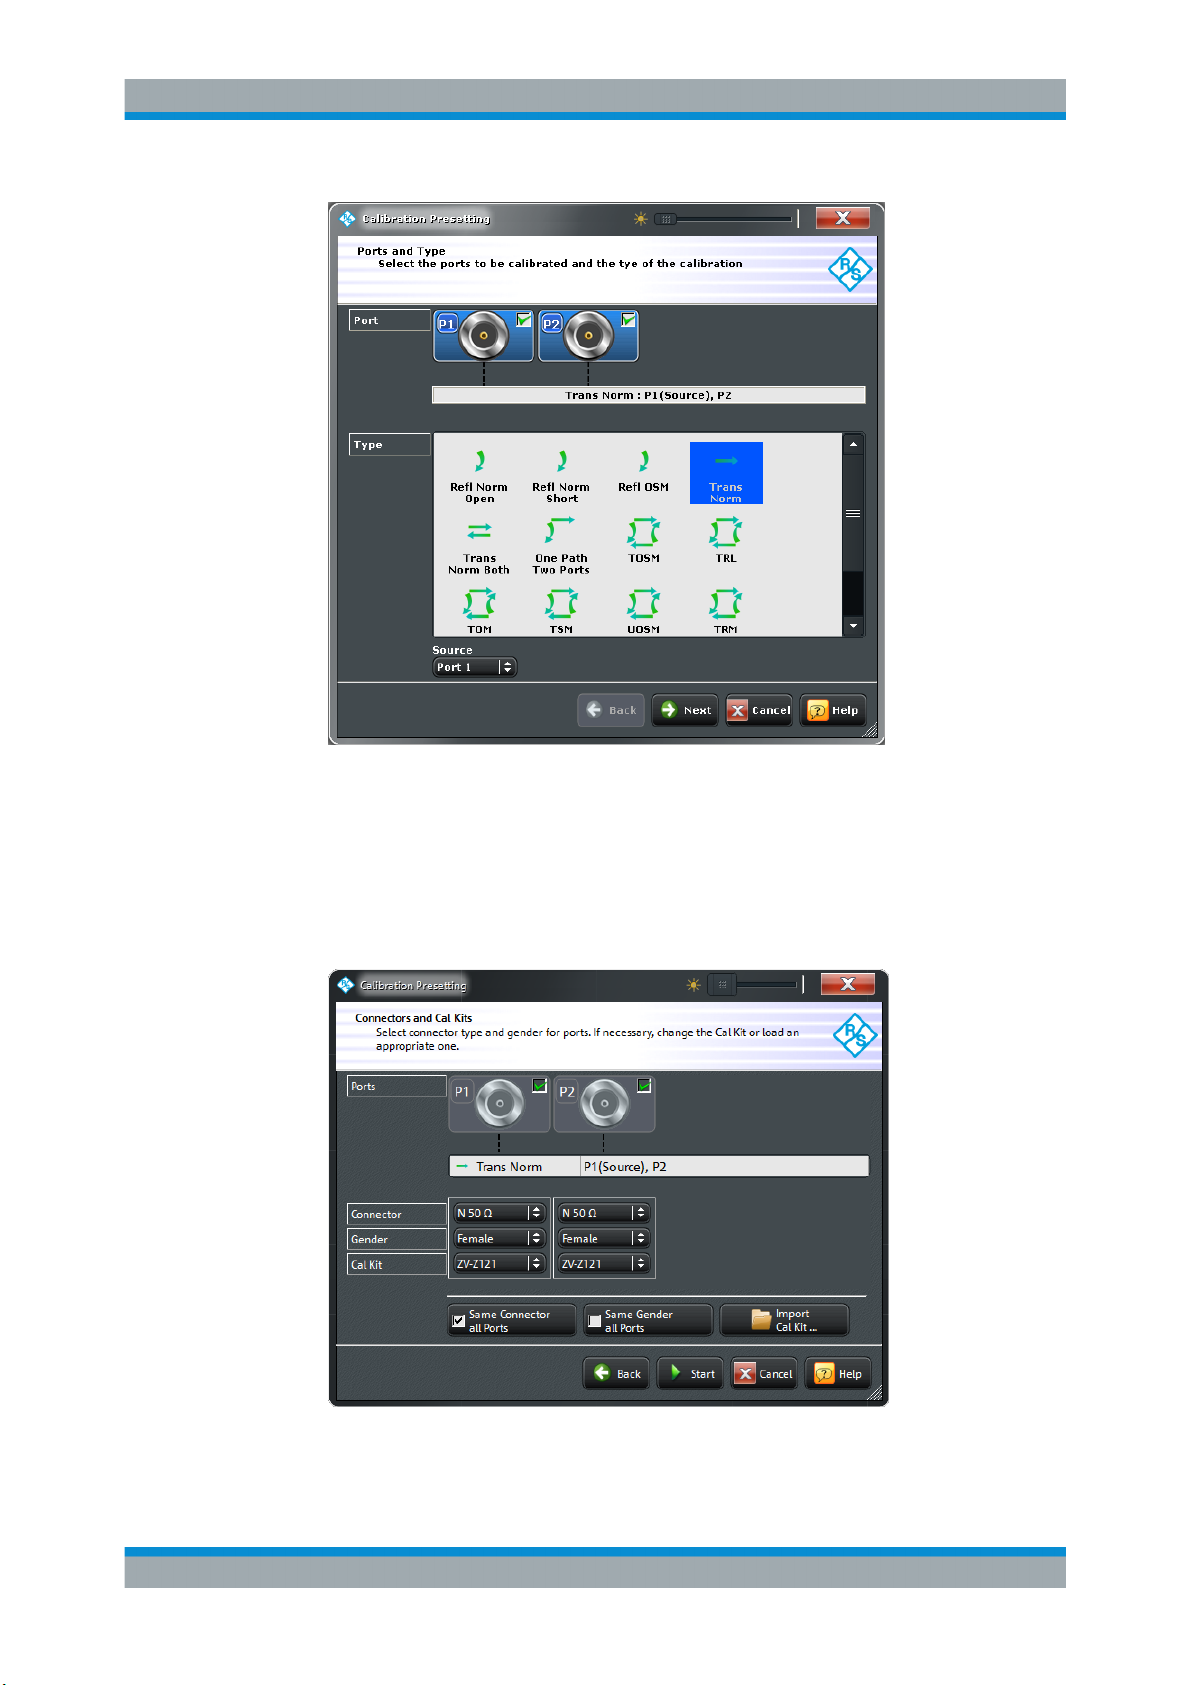
R&S® ZNB/ZNBT
Performing Measurements
Transmission S-Parameter Measurement
Tip: For a R&S ZNBT with more than 4 ports, the graphical port representation is
replaced by a generic port list. The selection logic is unchanged.
4. Select "Next" to proceed to the next page of the "Calibration Setting" wizard.
5. Select the test port connector type and gender (here: N 50 Ω, female, corresponding to a male Through standard) and the calibration kit (here: R&S ZV-Z121), then
click "Start".
6. The "Calibration" dock widget indicates the standard measurements that make up
a "Trans Norm" calibration.
68Getting Started 1316.0062.02 ─ 26
Page 71
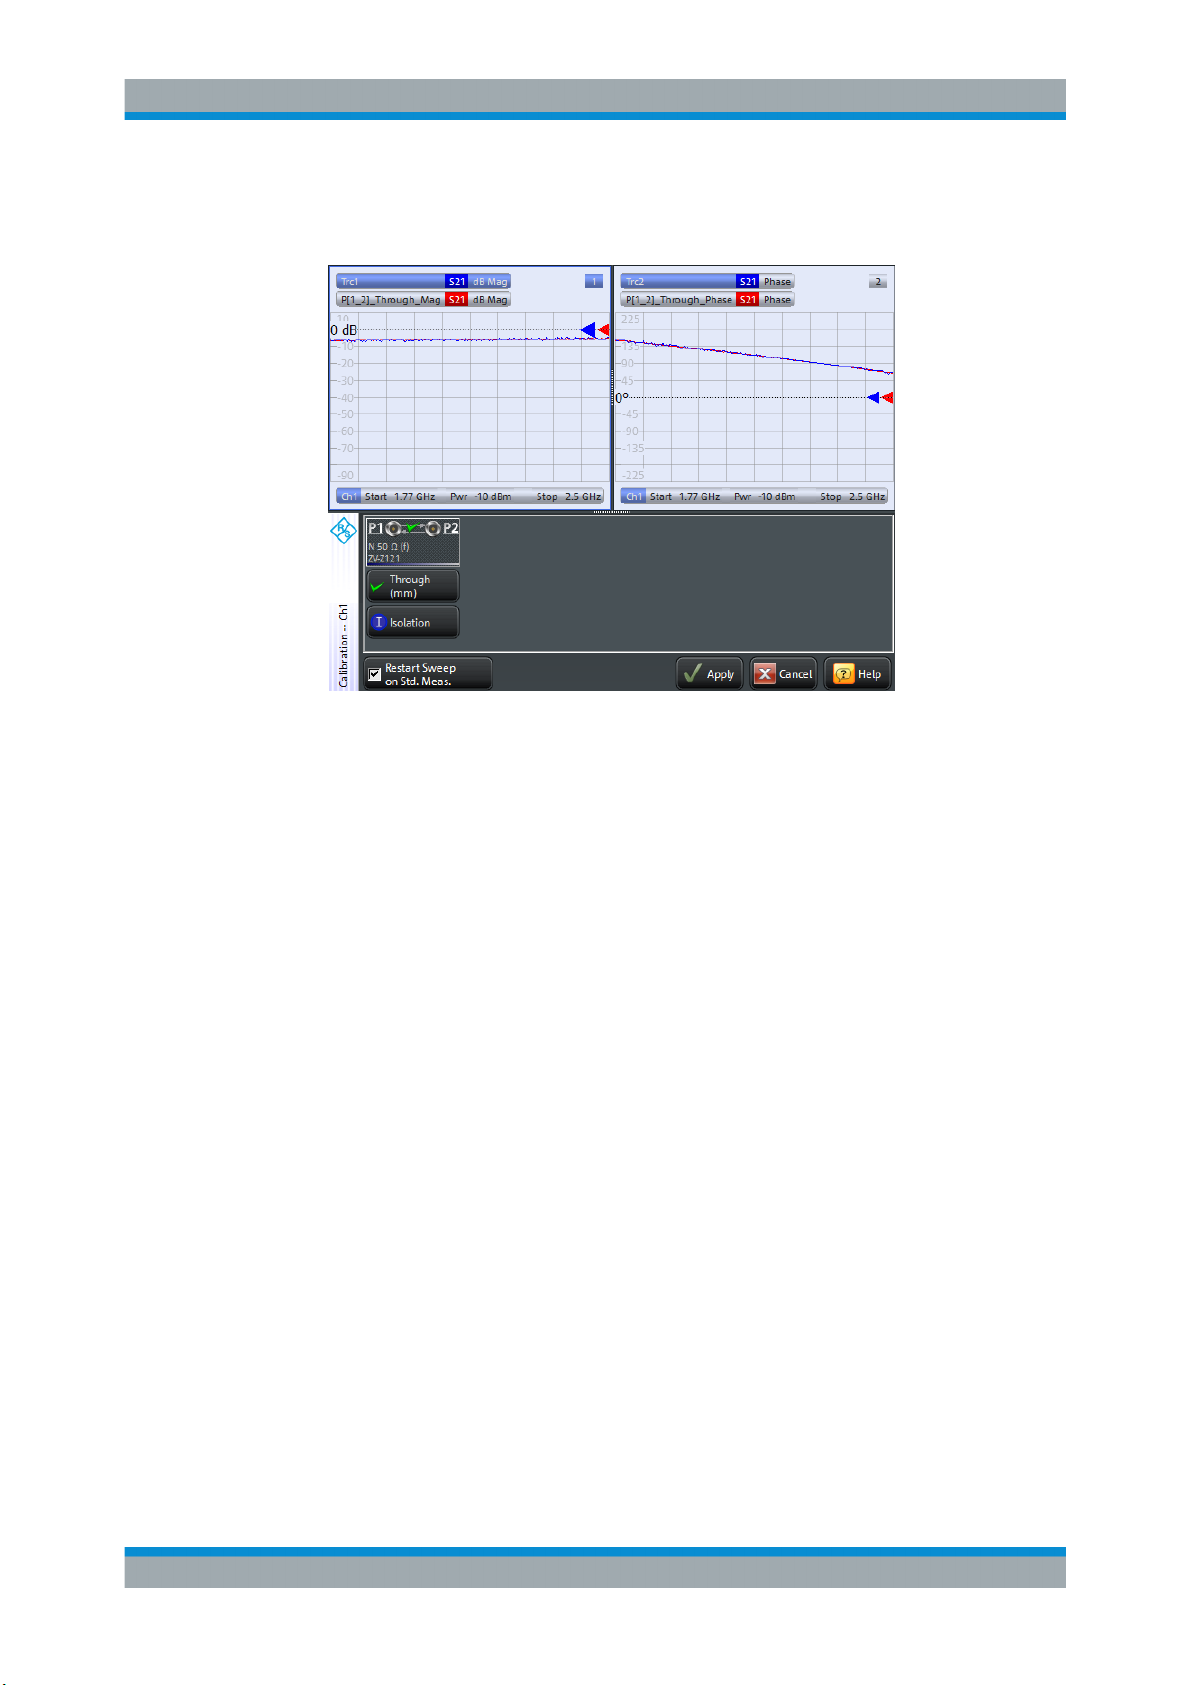
R&S® ZNB/ZNBT
Performing Measurements
Transmission S-Parameter Measurement
Select "Through (mm)" to initiate the measurement of the connected Through standard. Measuring the isolation between ports 1 and 2 is optional. Skip it for now.
The analyzer performs a calibration sweep for the measured quantity S21. The
magnitude and phase of the result is displayed in two diagrams, together with the
expected typical result for a Through standard. The similarity of real and expected
traces indicates that the Through standard has been properly connected. After the
R&S ZNB/ZNBT has completed the calibration sweep and calculated the correction
data, the "Apply" button is enabled.
7. Select "Apply" to close the wizard and apply the system error correction to the current channel.
A "Cal" label appears in the trace list.
To proceed with the measurement, remove the Through standard and connect the DUT
again.
5.1.4 Evaluating Data
The analyzer provides various tools to optimize the display and analyze the measurement data. For instance, you can use markers to determine maxima and minima on the
trace, and change the display format to obtain information about the group delay of the
transmitted wave.
1. Select TRACE – [MARKER] > "Markers" > "Mkr 1".
This places marker "M1" to its default position (center of the sweep range). A
marker symbol (triangle) appears on the trace, a marker info field in the upper right
corner of the diagram. The marker info field displays the stimulus value (frequency)
and response value (magnitude of the transmission coefficient converted to a dB
value) at the marker position.
69Getting Started 1316.0062.02 ─ 26
Page 72
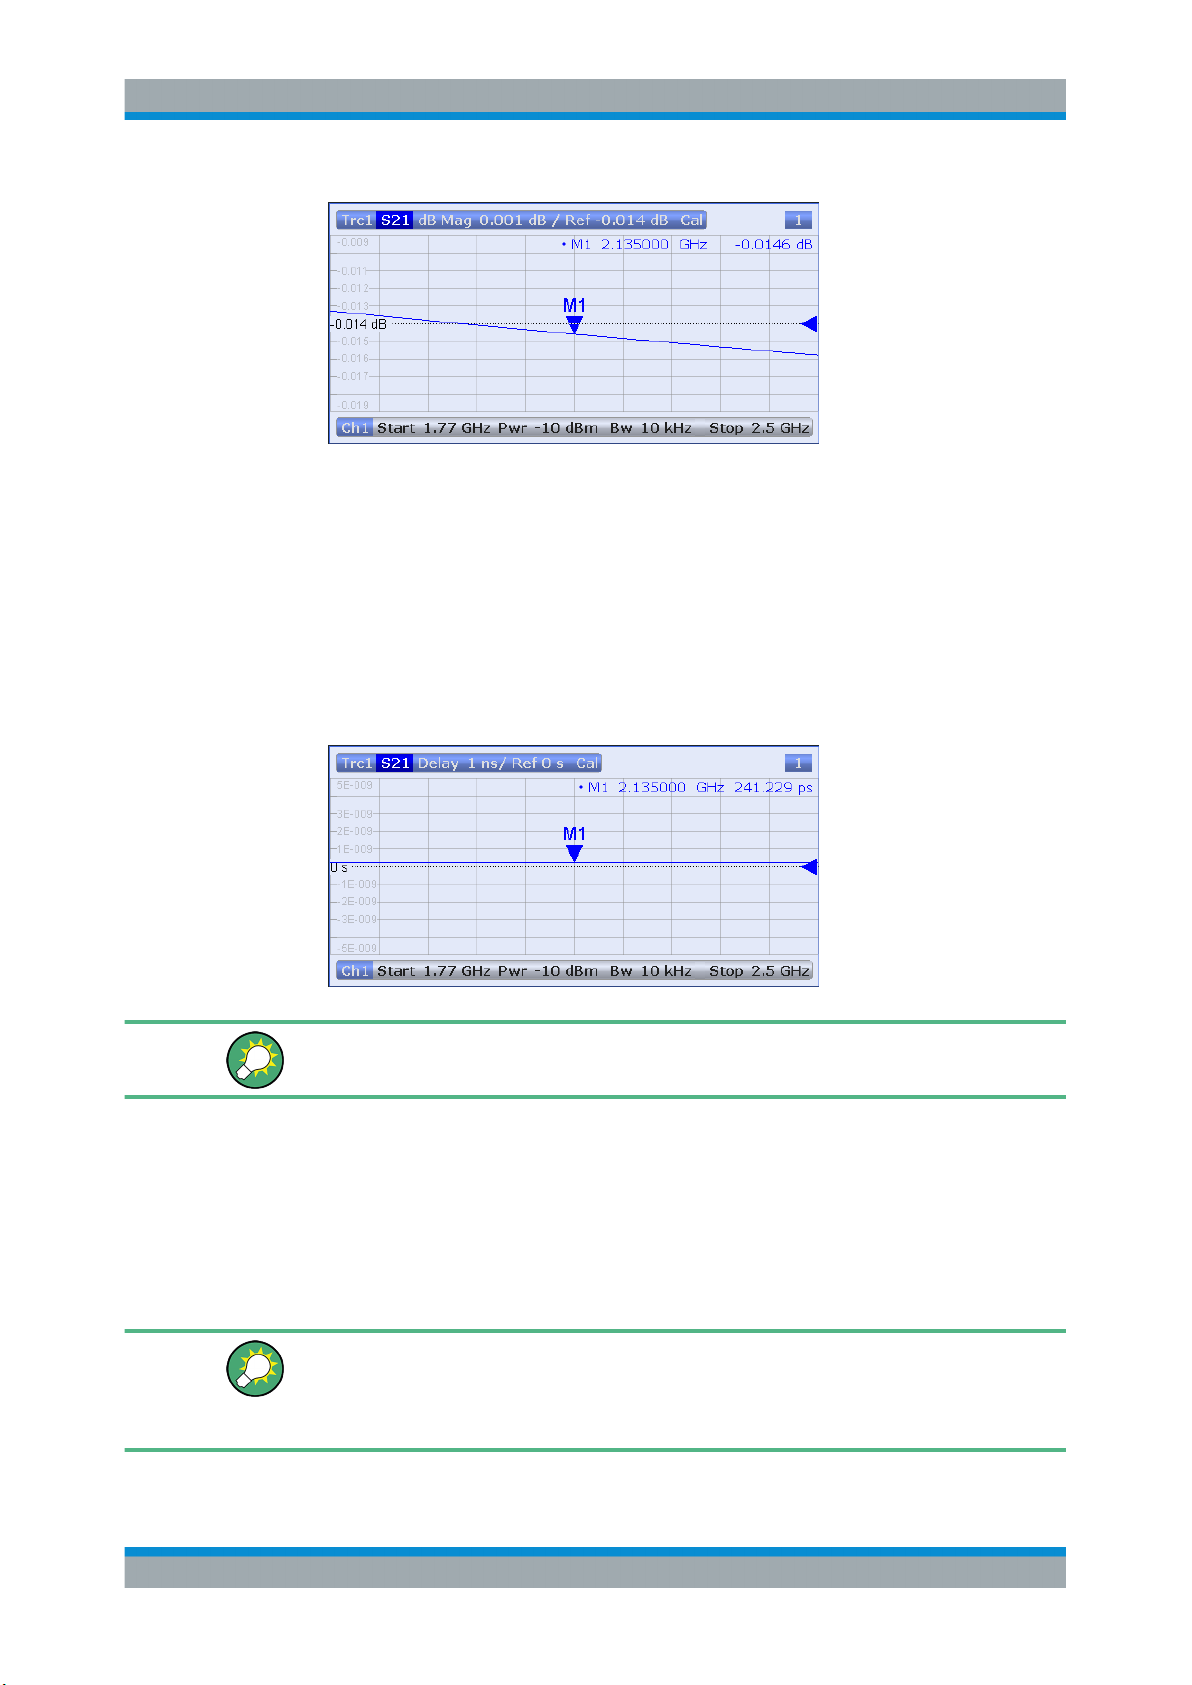
R&S® ZNB/ZNBT
Performing Measurements
Transmission S-Parameter Measurement
2. Select TRACE – [MARKER], activate the "Marker Search" softtool tab and activate
"Min" search.
The marker jumps to the absolute minimum of the curve in the entire sweep range.
The marker info field shows the coordinates of the new marker position.
3. Select TRACE – [FORMAT] and choose the "Delay" of the transmission coefficient
as displayed quantity.
The group delay represents the propagation time of the wave through the DUT; it is
displayed in a Cartesian diagram. The marker info field shows the frequency and
group delay at the marker position.
Refer to section "Trace Formats" in the help system or in the user manual to learn
more about the diagram properties.
5.1.5 Saving and Printing Data
The analyzer provides standard functions for saving measurement settings and for
saving or printing the results. You can use these functions as if you were working on a
standard PC. Moreover you can export your trace data to an ASCII file and reuse it in a
later session or in an external application.
Data transfer is made easier if external accessories are connected to the analyzer or if
the instrument is integrated into a LAN. Refer to Chapter 2.9, "Connecting External
Accessories", on page 16, and Chapter 2.12, "Remote Operation in a LAN",
on page 20 to obtain information about the necessary steps.
70Getting Started 1316.0062.02 ─ 26
Page 73

R&S® ZNB/ZNBT
Performing Measurements
Reflection S-Parameter Measurement
1. Activate the SYSTEM – [FILE] > "Trace Data" softtool tab.
2. In the "Trace Data" softtool tab, select "Export" – "ASCII..." to open the "Export
Data - ASCII Files" dialog.
3. In the "Export Data - ASCII Files" dialog:
a) Select a file location ("Look in:").
b) Enter a file name ("File name:").
c) Select "Save".
The analyzer writes the data of the active trace to an ASCII file and closes the dialog.
4. Activate the "Print" softtool tab (SYSTEM – [FILE] > "Print") .
5. In the "Print" softtool tab, select "Print" to print the diagram area or "To Clipboard"
to copy it to the Windows clipboard.
6. Select SYSTEM – [FILE] > "Recall Sets" > "Save..." to open the "Save" dialog for
recall sets.
7. In the "Save" dialog:
a) Select a file location ("Look in:").
b) Enter a name for the recall set file ("File name:").
c) Select "Save".
The analyzer saves the active recall set, containing channel, stimulus and trace
settings, to a *.znx file. This recall set can be restored in a later session.
5.2 Reflection S-Parameter Measurement
In a reflection measurement, the analyzer transmits a stimulus signal to the input port
of the device under test (DUT) and measures the reflected wave. Different trace formats allow you to express and display the results, depending on what you want to
learn from the data. Only one analyzer test port is required for reflection measurements.
In principle, a reflection measurement involves the same steps as a transmission measurement. Note the following differences:
●
The basic test setup for reflection measurements involves a single DUT and analyzer port. For instance, you can connect the input of your DUT to port 1 of the analyzer as shown below.
71Getting Started 1316.0062.02 ─ 26
Page 74
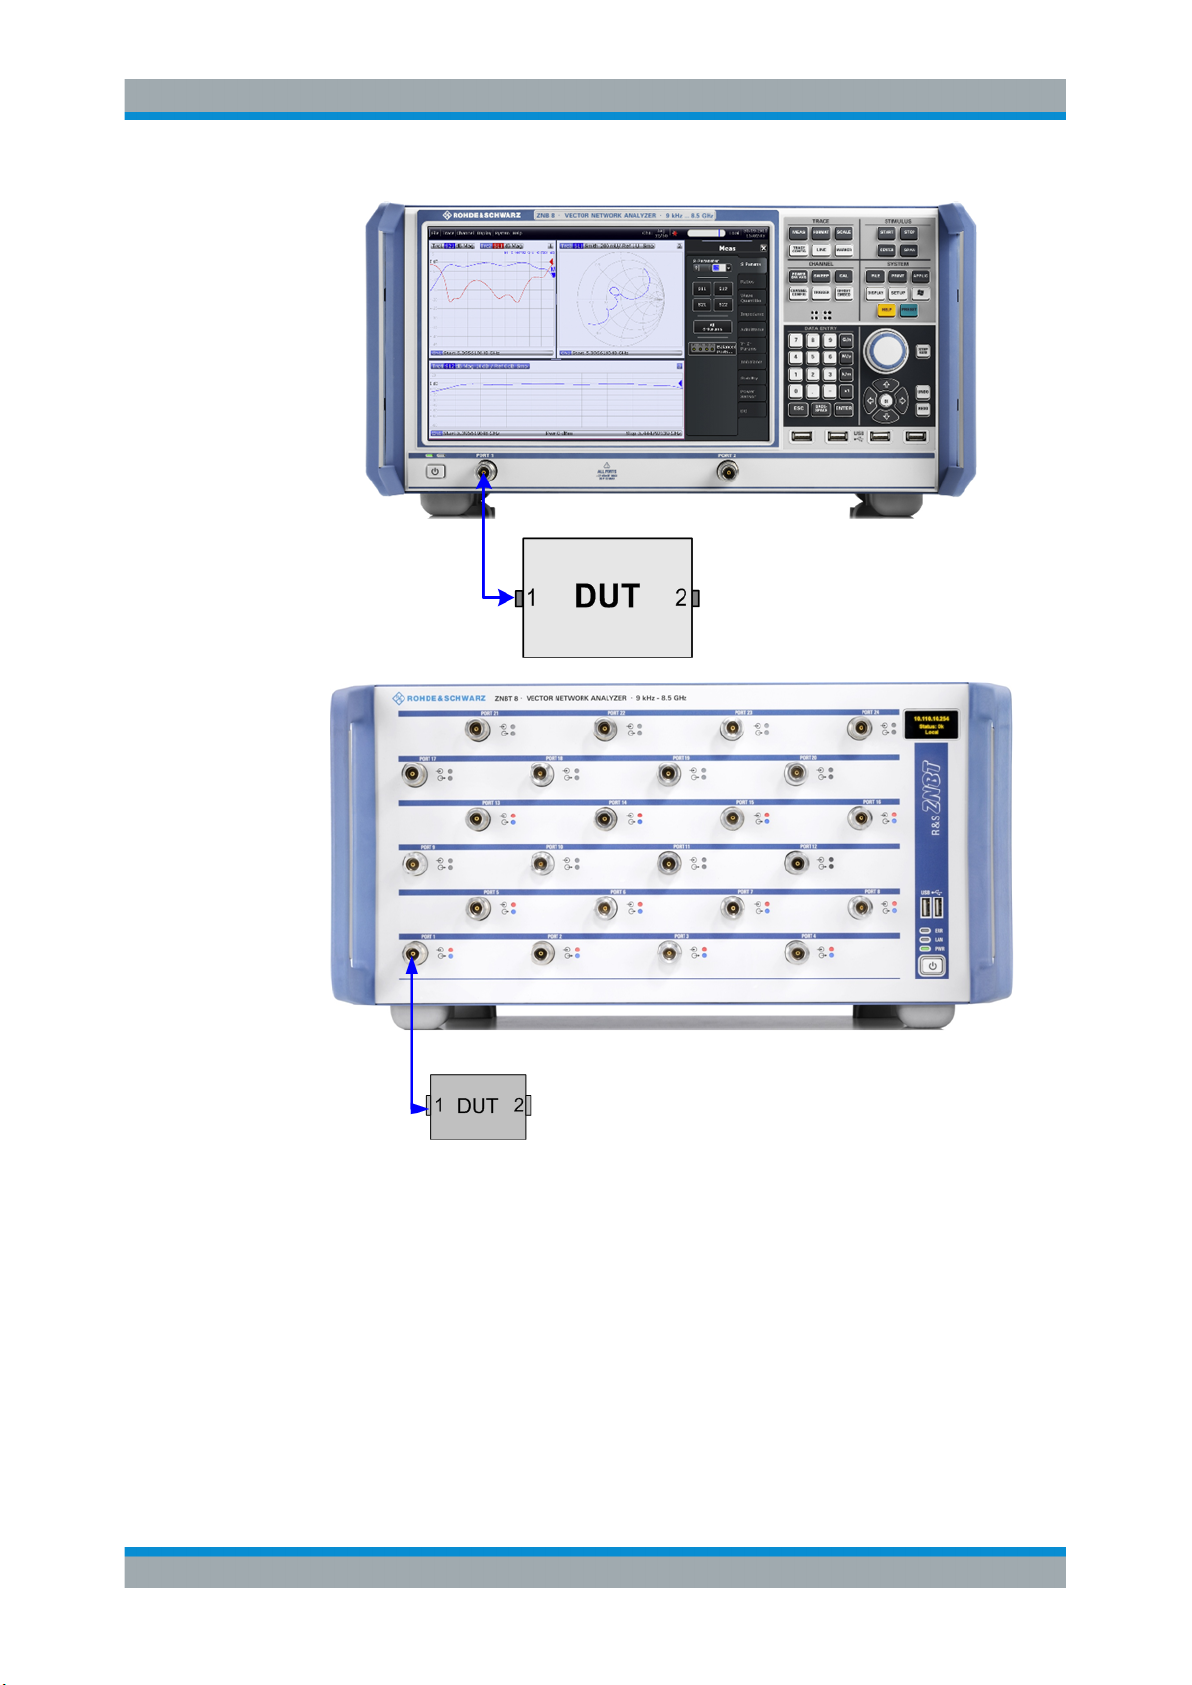
R&S® ZNB/ZNBT
Performing Measurements
Reflection S-Parameter Measurement
You can also use the basic transmission test setup, e.g. if you want to measure
reflection and transmission parameters in parallel.
●
The analyzer provides special calibration types for reflection measurements. Use
the calibration wizard and select an appropriate type.
A full n-port calibration (TOSM, UOSM, TNA ...) corrects the system errors for all
transmission and reflection S-parameters.
●
Some of the trace formats are particularly suited for reflection measurements. For
instance, you can display the measured reflection coefficient S11 in a Smith chart to
obtain the complex input impedance at port 1.
72Getting Started 1316.0062.02 ─ 26
Page 75
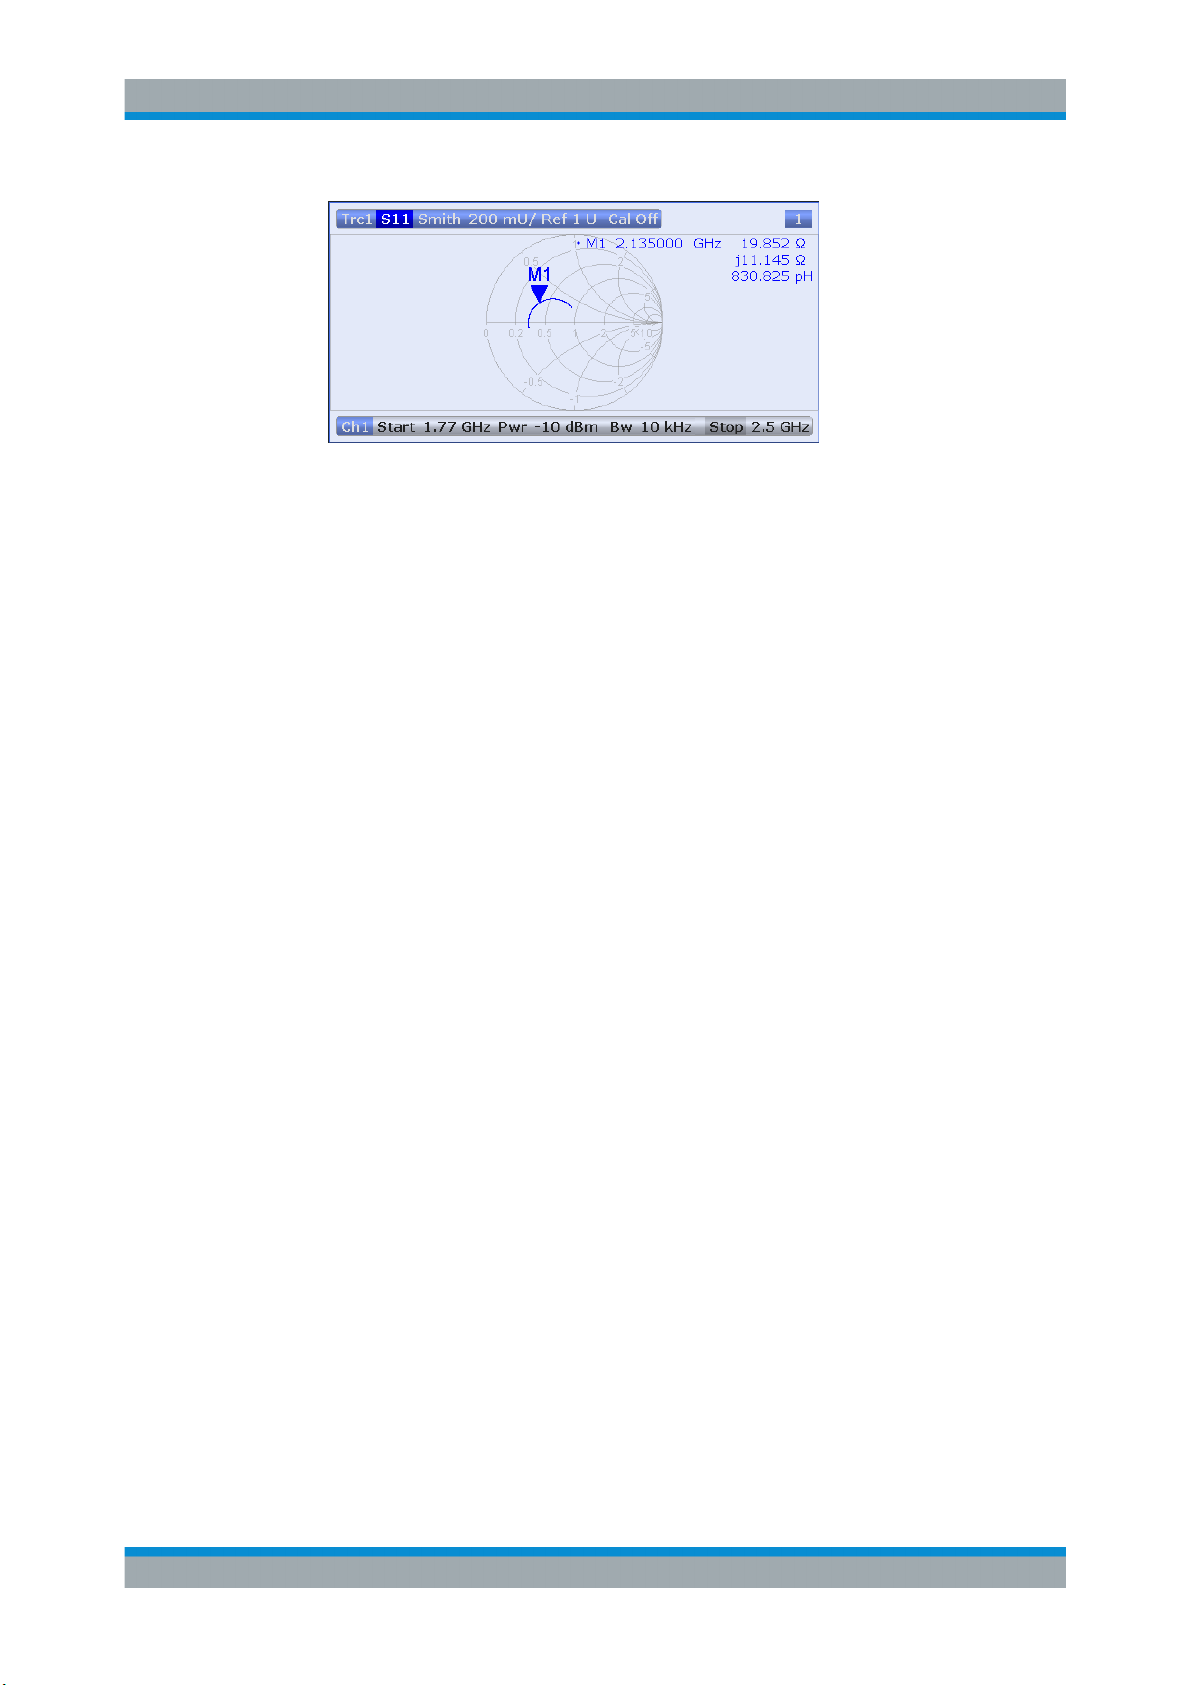
R&S® ZNB/ZNBT
Performing Measurements
Reflection S-Parameter Measurement
Proceed as described in Chapter 2.7, "Starting the Analyzer and Shutting Down",
on page 14 to shut down your analyzer.
73Getting Started 1316.0062.02 ─ 26
Page 76
R&S® ZNB/ZNBT
6 Administrative Tasks
6.1 Windows Operating System
Administrative Tasks
Windows Operating System
This chapter describes some topics that are only needed occasionally, or if a special
instrument configuration is required.
The analyzer is equipped with a Windows® operating system which has been configured according to the instrument's features and needs. Changes in the system configuration can be necessary to:
●
Establish a LAN connection
●
Customize the properties of the external accessories connected to the analyzer
●
Call up additional software tools
Modifications of the operating system
The operating system is adapted to the network analyzer. To avoid impairment of
instrument functions, only change the settings described in this manual. Existing software must be modified only with update software released by Rohde & Schwarz. Likewise, only programs authorized by Rohde & Schwarz for use on the instrument must
be executed.
The "Start" menu of the operating system is accessed by pressing the Windows key in
the SYSTEM keypad or on an external keyboard. All necessary settings can be
accessed from the "Start" menu, in particular from the Windows "Control Panel".
User accounts and password protection
The analyzer uses a user name and password as credentials for remote access. Two
user accounts with different levels of access are available on the instrument:
●
"instrument" is the default account with standard rights to change system settings.
Use this account for normal operation of the analyzer.
●
"Administrator" is the account for administering the operating system. This account
is required, for instance, if you wish to install programs on the analyzer.
In the factory configuration, "894129" is preset as a password for both users. To protect
the analyzer from unauthorized access, it is recommended to change the preset passwords.
To switch from one user account to another, log off from Windows and then log on
again. The "switch user" functionality is disabled on the R&S ZNB/ZNBT.
74Getting Started 1316.0062.02 ─ 26
Page 77
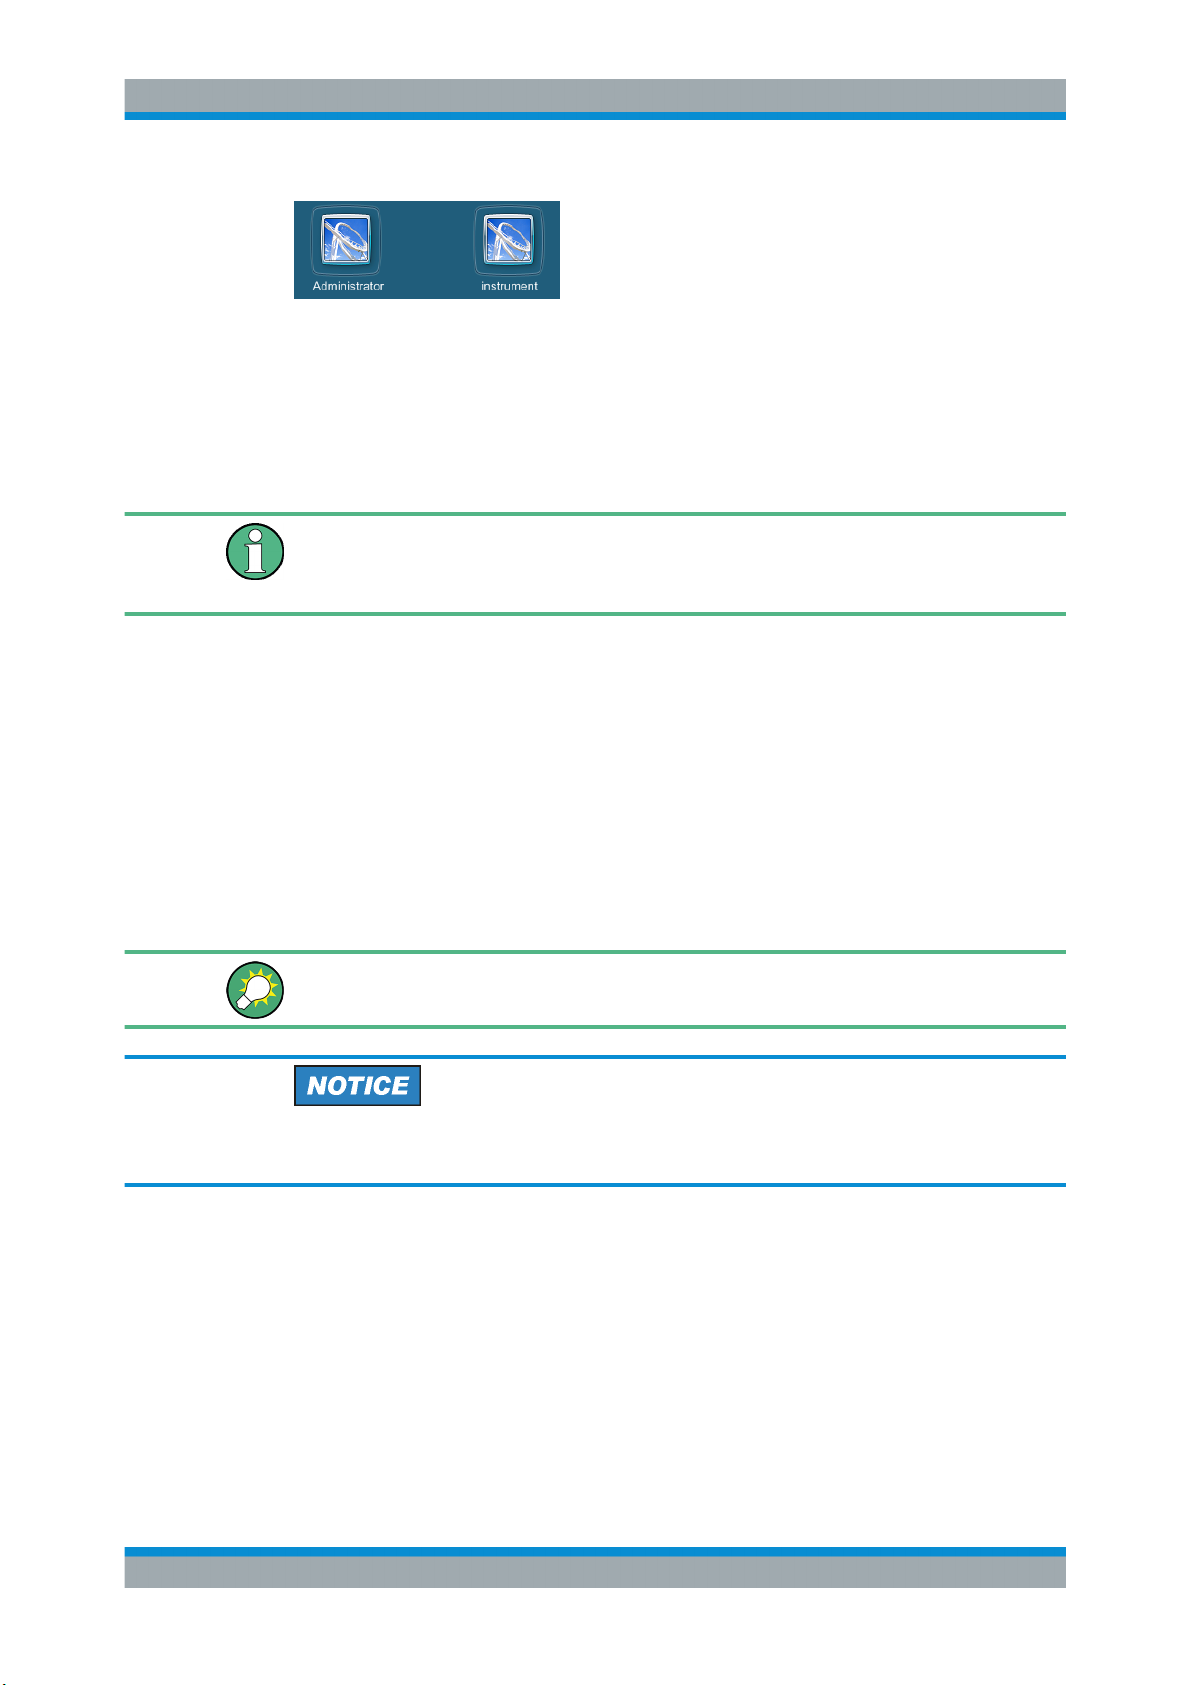
R&S® ZNB/ZNBT
6.2 Firmware Update
Administrative Tasks
Firmware Update
Upgrade versions of the analyzer firmware are supplied as single Windows® installer
files (*.msi).
Administrator account
You need administrator rights to install a new firmware version. See note on "User
accounts and password protection" on page 74 for details.
To perform a firmware update:
1. Copy the setup file to any storage medium accessible from the analyzer. This can
be either the internal mass storage drive, an external storage medium (USB memory stick, external CD-ROM drive) or a network connection (LAN).
2.
Run the setup file from the Windows® Explorer. Follow the instructions of the setup
wizard.
Setup files can be reinstalled. The default name of the internal drive is C:. External
storage devices are automatically mapped to the next free drive, i.e. D:, E: etc.
Factory calibration
A firmware update does not affect the factory calibration.
External accessories
Calibration units must be disconnected during a firmware update.
75Getting Started 1316.0062.02 ─ 26
Page 78
R&S® ZNB/ZNBT
7 Maintenance
7.1 Cleaning
Maintenance
Cleaning
The R&S ZNB/ZNBT vector network analyzer does not require any special maintenance.
For our support center address and a list of useful R&S contact addresses, refer to the
"Contact" page at the beginning of the Help system.
Risk of electric shock
If moisture enters the casing, for example if you clean the instrument using a moist
cloth, contact with the instrument can lead to electric shock. Before cleaning the instrument other than with a dry cloth, make sure that the instrument is switched off and disconnected from all power supplies.
Instrument damage caused by cleaning agents
Cleaning agents contain substances such as solvents (thinners, acetone, etc.), acids,
bases, or other substances. Solvents can damage the front panel labeling, plastic
parts, or screens, for example.
Never use cleaning agents to clean the outside of the instrument. Use a soft, dry, lintfree dust cloth instead.
Risk of instrument damage due to obstructed fans
If the instrument is operated in dusty areas, the fans become obstructed by dust or
other particles over time. Check and clean the fans regularly to ensure that they always
operate properly. If the instrument is run with obstructed fans for a longer period, the
instrument overheats, which can disturb the operation and even cause damage.
1. Clean the outside of the instrument using a soft, dry, lint-free dust cloth.
2. Check and clean the fans regularly to ensure that they always operate properly.
3. Clean the touchscreen as follows:
a) Apply a small amount of standard screen cleaner to a soft cloth.
b) Wipe the screen gently with the moist, but not wet, cloth.
76Getting Started 1316.0062.02 ─ 26
Page 79
R&S® ZNB/ZNBT
7.2 Storing and Packing the Instrument
7.3 Replacing Fuses
Maintenance
Replacing Fuses
c) If necessary, remove any excess moisture with a dry, soft cloth.
The vector network analyzer can be stored at the temperature range quoted in the data
sheet. When it is stored for a longer period of time, the unit must be protected against
dust.
If possible, use the original packing when the instrument is to be transported or dispatched; please also observe the notes in Chapter 2.1, "Unpacking and Checking the
Instrument", on page 11.
The R&S ZNBT is protected by a time lag fuse (T15L250V, stock no. 3589.7478.00).
The fuse is screwed in below the AC power switch on the rear panel.
For the R&S ZNB, each of the optional "Bias Tee" inputs at the rear panel (labeled
PORT BIAS <no>) is protected by a fuse (0.250 A, F IEC60127-2/2, stock no.
0020.7246.00).
Risk of electric shock
The fuse is part of the main power supply. Therefore, handling the fuse while power is
on can lead to electric shock. Before opening the fuse holder, make sure that the
instrument is switched off and disconnected from all power supplies.
Always use fuses supplied by Rohde & Schwarz as spare parts, or fuses of the same
type and rating.
To replace the mains fuse (R&S ZNBT only)
1. Unscrew the fuse holder from the rear panel and pull the fuse holder out of the slot.
2. Pull the fuse out of the fuse holder and replace it by a new one.
3. Stick the fuse holder back into the slot in the rear panel and screw it tight.
To replace the DC input fuses
► Open the fuse holder by slightly turning the lid counterclockwise.
77Getting Started 1316.0062.02 ─ 26
Page 80

R&S® ZNB/ZNBT
8 Obtaining Technical Support
Obtaining Technical Support
The instrument generates error messages which are usually sufficient for you to detect
the cause of an error and find a remedy. Error message types are described in the
R&S ZNB/ZNBT User Manual; refer to section "Error Messages and Troubleshooting".
In addition, the system "Info" dialog offers valuable troubleshooting information. This
dialog can be opened via the "Info..." button in the SYSTEM – [SETUP] > "Setup" softtool tab.
Finally, our customer support centers are there to assist you in solving any problems
with your network analyzer.
The required troubleshooting information can also be generated in the system "Info"
dialog. "Save Report" collects the following information:
●
Setup, option, and hardware information, error log, and selftest results.
This information can also be retrieved using the "Save..." function of the "Info" dialog.
●
Current eeprom data.
●
A screenshot of the VNA display.
●
The latest 5 exception dumps.
The resulting *.zip file is written to the report directory
C:\Users\Public\Documents\Rohde-Schwarz\Vna\Report. Its file name contains the current date and time, e.g. report_20180228_1658.zip.
78Getting Started 1316.0062.02 ─ 26
Page 81

R&S® ZNB/ZNBT
Index
Index
A
AC Supply ......................................................................... 14
Accessories (connect) ....................................................... 16
Administrative tasks .......................................................... 74
Application cards ................................................................. 9
Application notes ................................................................. 9
Auto scale ......................................................................... 60
B
Basic Measurement Examples
see User Manual ........................................................... 7
Basic tasks ........................................................................ 38
Bench Top Operation ........................................................ 12
Bias Tees ........................................................................... 35
Brochures ............................................................................ 8
C
CHANNEL ......................................................................... 27
Circular diagrams .............................................................. 61
Cleaning ............................................................................ 76
Connectors
Optional ...................................................................... 37
Control elements ............................................................... 43
D
Data entry .......................................................................... 54
DATA ENTRY .................................................................... 27
Data sheets ......................................................................... 8
DC input
Connectors ................................................................. 37
DC Inputs .......................................................................... 35
Diagram ............................................................................. 51
Dialogs .............................................................................. 49
Direct Control Interface ............................................... 35, 37
Display .............................................................................. 26
Drag and drop ................................................................... 54
E
Electrostatic discharge ...................................................... 12
Electrostatic discharge (ESD) ..................................... 34, 36
EMI suppression ............................................................... 13
ESD ................................................................................... 12
Evaluation of data ............................................................. 69
EXT TRIG OUT / IN .................................................... 34, 36
F
Factory calibration ............................................................. 75
Firewall .............................................................................. 23
Firmware
Setup file ..................................................................... 75
Firmware update
Update ........................................................................ 75
Front panel
LED controls ............................................................... 33
Mini display ................................................................. 32
R&S ZNB .................................................................... 25
R&S ZNBT .................................................................. 30
USB ............................................................................ 32
Front panel keys ................................................................ 38
Fuse .................................................................................. 36
Fuse replacement ............................................................. 77
G
Getting started ..................................................................... 7
GPIB Interface ............................................................. 35, 37
GPIO Interface
external ....................................................................... 35
Graphic zoom .................................................................... 58
Ground connector ....................................................... 34, 36
H
Handler I/O ........................................................................ 36
Handler I/O (Universal Interface) ...................................... 35
Hardkey panel ................................................................... 47
I
Instrument calibration ........................................................ 67
Instrument security procedures ........................................... 8
Instrument setup ............................................................... 12
IP address setting ............................................................. 20
K
Keyboard ........................................................................... 17
L
LAN ............................................................................. 34, 36
connection .................................................................. 18
remote operation ......................................................... 20
LED controls ...................................................................... 33
M
Maintenance ...................................................................... 76
Marker ............................................................................... 51
set by .......................................................................... 61
Measurement examples .................................................... 64
Menu bar ........................................................................... 46
Menus ............................................................................... 46
Mini display ....................................................................... 32
Minimize application .......................................................... 18
Monitor .............................................................................. 16
Monitor (DisplayPort) .................................................. 34, 36
Monitor (DVI-D) ........................................................... 34, 36
Mounting into a 19" rack .................................................... 13
Mouse ............................................................................... 17
N
Navigation keys ................................................................. 28
Navigation tools ................................................................. 43
Numeric Editor (dialog) ..................................................... 56
O
OCXO Frequency Reference ............................................ 15
79Getting Started 1316.0062.02 ─ 26
Page 82

R&S® ZNB/ZNBT
Index
On-screen keyboard
analyzer ...................................................................... 56
Windows ..................................................................... 57
Operating system .............................................................. 74
Option
R&S ZN-B12 ............................................................... 35
R&S ZN-B14 ............................................................... 35
R&S ZN-Z15 ............................................................... 35
R&S ZNB-B1 ............................................................... 35
R&S ZNB-B4 ............................................................... 15
R&S ZNB-B10 ............................................................. 35
R&S ZNB-B81 ............................................................. 35
R&S ZNBT-B4 ............................................................. 15
Option R&S ZNB-B19 ....................................................... 34
Option R&S ZNBT-B10 ..................................................... 37
Option R&S ZNBT-B12 ..................................................... 37
Option R&S ZNBT-B19 ..................................................... 36
Option R&S ZNBT-B81 ..................................................... 37
Option R&S ZNBT-Z14 ...................................................... 36
P
Packing ............................................................................. 77
Password .......................................................................... 20
PCIe Interface ............................................................. 35, 37
Power on and off ............................................................... 14
Preparing for use ............................................................... 25
Printer ................................................................................ 17
Printing data ...................................................................... 70
Putting into operation ......................................................... 11
R
R&S ZN-B12 ..................................................................... 35
R&S ZN-B14 ..................................................................... 35
R&S ZN-Z15 ...................................................................... 35
R&S ZNB-B1 ..................................................................... 35
R&S ZNB-B4 ..................................................................... 15
R&S ZNB-B10 ................................................................... 35
R&S ZNB-B19 ................................................................... 34
R&S ZNB-B81 ................................................................... 35
R&S ZNBT-B4 ................................................................... 15
R&S ZNBT-B10 ................................................................. 37
R&S ZNBT-B12 ................................................................. 37
R&S ZNBT-B19 ................................................................. 36
R&S ZNBT-B81 ................................................................. 37
R&S ZNBT-Z14 ................................................................. 36
Rear panel ......................................................................... 35
R&S ZNB .................................................................... 33
R&S ZNBT .................................................................. 35
REF OUT / IN .............................................................. 34, 36
Reference position ............................................................ 60
Reference value ................................................................ 60
Reflection measurement (example) .................................. 71
Release notes ..................................................................... 9
Remote desktop ................................................................ 23
Removable HD ............................................................ 34, 36
Replacing fuses ................................................................. 77
RFFE Interface
external ....................................................................... 35
Rotary knob ....................................................................... 28
Scaling diagrams ............................................................... 58
Screen saver ..................................................................... 26
Security procedures ............................................................ 8
Service manual ................................................................... 8
Setup keys ........................................................................ 26
Softtools ............................................................................ 45
Standby and ready state ................................................... 15
Standby key ................................................................ 29, 33
Startup and shutdown ....................................................... 14
Status bar .......................................................................... 48
Step Size (dialog) .............................................................. 56
STIMULUS ........................................................................ 27
Storing ............................................................................... 77
Support .............................................................................. 78
Sweep range selection ...................................................... 66
Sweep range setting ......................................................... 59
SYSTEM ........................................................................... 27
T
Test port ...................................................................... 29, 31
Title Bar ............................................................................. 44
Toolbar .............................................................................. 44
Touchscreen ...................................................................... 26
Trace ................................................................................. 51
TRACE .............................................................................. 26
Transmission measurement (example) ............................. 64
U
USB
front panel ................................................................... 30
Front panel .................................................................. 32
USB Device
rear panel .............................................................. 34, 36
USB Host
rear panel .............................................................. 34, 36
USER PORT ............................................................... 34, 36
V
Virus protection ................................................................. 20
W
White papers ....................................................................... 9
Windows ............................................................................ 74
Wizard ............................................................................... 64
Z
Zoom ................................................................................. 58
S
S-Parameter Wizard .......................................................... 64
Safety instructions ............................................................... 8
Saving data ....................................................................... 70
80Getting Started 1316.0062.02 ─ 26
 Loading...