


R&S®VSE-K70
Vector Signal Analysis Application
User Manual
(;ÚçÁ2)
1176895102
Version 13

This manual applies to the following software, version 2.20 and later:
●
R&S®VSE Enterprise Edition base software (1345.1105.06)
●
R&S®VSE Basic Edition base software (1345.1011.06)
The following software options are described:
●
R&S VSE-K70 (1320.7522.xx)
●
R&S VSE-K70P (1345.1228.xx)
●
R&S VSE-K70M (1345.1211.xx)
●
R&S®CMA-K305 (1320.7939.xx)
●
R&S®CMW-KM152 (1211.5307.xx)
●
R&S VSE-KT70 (1345.1870.02)
●
R&S VSE-KT70P (1345.1711.02)
●
R&S VSE-KT70M (1345.1863.02)
© 2022 Rohde & Schwarz GmbH & Co. KG
Muehldorfstr. 15, 81671 Muenchen, Germany
Phone: +49 89 41 29 - 0
Email: info@rohde-schwarz.com
Internet: www.rohde-schwarz.com
Subject to change – data without tolerance limits is not binding.
R&S® is a registered trademark of Rohde & Schwarz GmbH & Co. KG.
The Bluetooth® word mark and logos are registered trademarks owned by Bluetooth SIG, Inc. and any use of such marks by Rohde
& Schwarz is under license.
CDMA2000® is a registered trademark of the Telecommunications Industry Association (TIA-USA).
DOCSIS® is a registered trademark of the Cable Television Laboratories, Inc..
All other trademarks are the properties of their respective owners.
1176.8951.02 | Version 13 | R&S®VSE-K70
Throughout this manual, products from Rohde & Schwarz are indicated without the ® symbol, e.g. R&S®VSE is indicated as
R&S VSE.

R&S®VSE-K70
1.1 Introduction to vector signal analysis...................................................................... 14
1.2 Starting the VSA application......................................................................................14
1.3 Understanding the display information.................................................................... 15
2.1 Evaluation data sources in VSA................................................................................ 18
2.2 Result types in VSA.................................................................................................... 23
2.2.1 Bit error rate (BER)....................................................................................................... 25
2.2.2 Channel frequency response group delay.................................................................... 27
2.2.3 Channel frequency response magnitude...................................................................... 27
Contents
Contents
1 Welcome to the vector signal analysis application.......................... 13
2 Measurements and result displays.................................................... 18
2.2.4 Constellation frequency.................................................................................................28
2.2.5 Constellation I/Q............................................................................................................29
2.2.6 Constellation I/Q (rotated)............................................................................................. 31
2.2.7 Error vector magnitude (EVM)...................................................................................... 32
2.2.8 Eye diagram frequency................................................................................................. 33
2.2.9 Eye diagram imag (Q)................................................................................................... 34
2.2.10 Eye diagram real (I).......................................................................................................36
2.2.11 Frequency absolute.......................................................................................................36
2.2.12 Frequency relative.........................................................................................................38
2.2.13 Frequency error absolute.............................................................................................. 39
2.2.14 Frequency error relative................................................................................................ 41
2.2.15 Frequency response group delay..................................................................................42
2.2.16 Frequency response magnitude....................................................................................43
2.2.17 Frequency response phase...........................................................................................43
2.2.18 Impulse response magnitude........................................................................................ 44
2.2.19 Impulse response phase............................................................................................... 45
2.2.20 Impulse response real/imag.......................................................................................... 46
2.2.21 Magnitude absolute.......................................................................................................46
2.2.22 Magnitude overview (capture buffer).............................................................................48
2.2.23 Magnitude relative.........................................................................................................49
2.2.24 Magnitude error.............................................................................................................50
3User Manual 1176.8951.02 ─ 13

R&S®VSE-K70
2.2.25 Phase error................................................................................................................... 51
2.2.26 Phase wrap................................................................................................................... 52
2.2.27 Phase unwrap............................................................................................................... 53
2.2.28 Real/imag (I/Q)..............................................................................................................54
2.2.29 Result summary............................................................................................................ 55
2.2.30 Spectrum (capture buffer + error)..................................................................................59
2.2.31 Spectrum (measurement + error)..................................................................................60
2.2.32 Symbol table................................................................................................................. 61
2.2.33 Vector frequency........................................................................................................... 63
2.2.34 Vector I/Q...................................................................................................................... 63
2.3 Predefined display configuration.............................................................................. 65
2.4 Common parameters in VSA......................................................................................66
Contents
3 Measurement basics............................................................................68
3.1 Filters and bandwidths during signal processing................................................... 68
3.1.1 I/Q bandwidth................................................................................................................ 69
3.1.2 Demodulation bandwidth (measurement bandwidth)....................................................70
3.1.3 Modulation and demodulation filters............................................................................. 70
3.1.4 Measurement filters.......................................................................................................71
3.1.5 Customized filters..........................................................................................................73
3.2 Sample rate, symbol rate and I/Q bandwidth........................................................... 75
3.2.1 Sample rate, record length and analysis bandwidth..................................................... 77
3.3 Symbol mapping......................................................................................................... 77
3.3.1 Phase shift keying (PSK).............................................................................................. 78
3.3.2 Rotating PSK.................................................................................................................82
3.3.3 Differential PSK.............................................................................................................85
3.3.4 Rotating differential PSK modulation.............................................................................86
3.3.5 Offset QPSK..................................................................................................................88
3.3.6 Shaped offset QPSK..................................................................................................... 89
3.3.7 Frequency shift keying (FSK)........................................................................................90
3.3.8 Minimum shift keying (MSK)......................................................................................... 95
3.3.9 Quadrature amplitude modulation (QAM)..................................................................... 96
3.3.10 ASK............................................................................................................................. 108
3.3.11 APSK...........................................................................................................................109
4User Manual 1176.8951.02 ─ 13

R&S®VSE-K70
3.3.12 User-defined modulation............................................................................................. 110
3.4 Overview of the demodulation process.................................................................. 111
3.4.1 Burst search................................................................................................................ 114
3.4.2 I/Q pattern search........................................................................................................115
3.4.3 Demodulation and symbol decisions...........................................................................116
3.4.4 Pattern symbol check.................................................................................................. 119
3.4.5 Synchronization and the reference signal................................................................... 120
3.4.6 The equalizer.............................................................................................................. 122
3.5 Signal model, estimation and modulation errors...................................................124
3.5.1 PSK, QAM and MSK modulation................................................................................ 125
3.5.1.1 Error model................................................................................................................. 125
3.5.1.2 Estimation................................................................................................................... 126
3.5.1.3 Modulation errors........................................................................................................ 127
Contents
3.5.2 FSK modulation...........................................................................................................137
3.5.2.1 Error model................................................................................................................. 138
3.5.2.2 Estimation................................................................................................................... 139
3.5.2.3 Modulation errors........................................................................................................ 141
3.6 Measurement ranges................................................................................................ 142
3.6.1 Result range................................................................................................................143
3.6.2 Evaluation range......................................................................................................... 146
3.7 Display points vs estimation points per symbol....................................................147
3.8 Capture buffer display.............................................................................................. 149
3.9 Known data files - dependencies and restrictions................................................ 149
3.10 Known data from PRBS generators........................................................................ 150
3.11 Multi-modulation analysis (R&S VSE-K70M)..........................................................152
4 Configuration......................................................................................158
4.1 Configuration overview............................................................................................ 158
4.2 Configuration according to digital standards........................................................ 161
4.3 Signal description..................................................................................................... 163
4.3.1 Modulation...................................................................................................................164
4.3.2 Signal structure........................................................................................................... 167
4.3.3 Frame structure...........................................................................................................169
4.3.3.1 General frame structure settings.................................................................................170
5User Manual 1176.8951.02 ─ 13

R&S®VSE-K70
4.3.3.2 Frame configuration.................................................................................................... 173
4.3.4 Known data................................................................................................................. 177
4.4 Input, output and frontend settings.........................................................................180
4.4.1 Radio frequency input................................................................................................. 181
4.4.2 oscilloscope baseband input....................................................................................... 188
4.4.3 I/Q file input................................................................................................................. 191
4.4.4 Frequency settings......................................................................................................193
4.4.5 Amplitude and vertical axis configuration....................................................................195
4.4.5.1 Amplitude settings.......................................................................................................195
4.4.5.2 Scaling........................................................................................................................ 199
4.4.5.3 Units............................................................................................................................ 203
4.5 Signal capture........................................................................................................... 203
4.5.1 Data acquisition...........................................................................................................204
Contents
4.5.2 Trigger settings............................................................................................................207
4.6 Burst and pattern configuration.............................................................................. 211
4.6.1 Burst search................................................................................................................ 211
4.6.2 Pattern search.............................................................................................................213
4.6.3 Pattern configuration................................................................................................... 214
4.6.4 Pattern definition......................................................................................................... 217
4.7 Result range configuration...................................................................................... 220
4.8 Demodulation settings............................................................................................. 223
4.8.1 Demodulation - compensation and equalizer..............................................................223
4.8.2 Advanced demodulation (synchronization)................................................................. 226
4.9 Measurement filter settings..................................................................................... 230
4.10 Evaluation range configuration............................................................................... 232
4.11 Adjusting settings automatically.............................................................................233
5 Analysis.............................................................................................. 236
5.1 Trace settings............................................................................................................236
5.2 Trace export settings................................................................................................240
5.3 Markers...................................................................................................................... 241
5.3.1 Individual marker settings........................................................................................... 242
5.3.2 Marker search settings................................................................................................244
5.3.3 Marker positioning functions....................................................................................... 245
6User Manual 1176.8951.02 ─ 13

R&S®VSE-K70
5.4 Limit and display lines..............................................................................................247
5.4.1 Display lines for eye diagrams.................................................................................... 247
5.4.2 Modulation accuracy limit lines................................................................................... 248
5.5 Display and window configuration..........................................................................251
5.5.1 Result window configuration....................................................................................... 251
6.1 How to perform VSA according to digital standards.............................................255
6.2 How to perform customized VSA measurements.................................................. 257
6.2.1 How to select user-defined filters................................................................................ 258
6.2.2 How to perform pattern searches................................................................................259
6.2.2.1 How to assign patterns to a standard..........................................................................259
6.2.2.2 How to define a new pattern....................................................................................... 260
Contents
6 How to perform vector signal analysis............................................ 255
6.2.2.3 How to manage patterns............................................................................................. 262
6.2.3 How to manage known data files................................................................................ 263
6.2.3.1 How to load known data files...................................................................................... 263
6.2.3.2 How to create known data files................................................................................... 264
6.2.4 How to define the result range.................................................................................... 266
6.3 How to analyze the measured data......................................................................... 267
6.3.1 How to change the display scaling..............................................................................268
6.3.1.1 How to scale time and spectrum diagrams................................................................. 268
6.3.1.2 How to scale statistics diagrams................................................................................. 269
6.3.2 How to measure the size of an eye.............................................................................272
6.3.3 How to check limits for modulation accuracy.............................................................. 273
6.3.4 How to export the trace data to a file.......................................................................... 274
7 Measurement examples.....................................................................275
7.1 Connecting the transmitter and analyzer............................................................... 275
7.2 Measurement example 1: continuous QPSK signal.............................................. 275
7.2.1 Transmitter settings.....................................................................................................276
7.2.2 Analyzer settings.........................................................................................................277
7.2.3 Changing the display configuration............................................................................. 279
7.2.4 Navigating through the capture buffer.........................................................................279
7.2.5 Averaging several evaluations.................................................................................... 281
7.3 Measurement example 2: burst GSM EDGE signals..............................................282
7User Manual 1176.8951.02 ─ 13

R&S®VSE-K70
7.3.1 Transmitter settings.....................................................................................................282
7.3.2 Analyzer settings.........................................................................................................284
7.3.3 Navigating through the capture buffer.........................................................................287
7.3.4 Evaluating the rising and falling edges........................................................................288
7.3.5 Setting the evaluation range....................................................................................... 290
7.3.6 Comparing the measurement signal to the reference signal.......................................291
8.1 Flow chart for troubleshooting................................................................................ 292
8.2 Explanation of error messages................................................................................294
8.3 Frequently asked questions.....................................................................................303
9.1 Introduction............................................................................................................... 311
Contents
8 Troubleshooting the measurement.................................................. 292
9 Remote commands for VSA..............................................................311
9.1.1 Conventions used in descriptions............................................................................... 312
9.1.2 Long and short form.................................................................................................... 313
9.1.3 Numeric suffixes..........................................................................................................313
9.1.4 Optional keywords.......................................................................................................313
9.1.5 Alternative keywords................................................................................................... 314
9.1.6 SCPI parameters.........................................................................................................314
9.1.6.1 Numeric values........................................................................................................... 314
9.1.6.2 Boolean....................................................................................................................... 315
9.1.6.3 Character data............................................................................................................ 315
9.1.6.4 Character strings.........................................................................................................316
9.1.6.5 Block data................................................................................................................... 316
9.2 Common suffixes...................................................................................................... 316
9.3 Activating VSA measurements................................................................................ 316
9.4 Configuring VSA....................................................................................................... 317
9.4.1 Restoring the default configuration (preset)................................................................ 317
9.4.2 Digital standards......................................................................................................... 317
9.4.3 Signal description........................................................................................................320
9.4.3.1 Modulation...................................................................................................................320
9.4.3.2 Signal structure........................................................................................................... 329
9.4.3.3 Frame structure...........................................................................................................332
9.4.3.4 Known data................................................................................................................. 343
8User Manual 1176.8951.02 ─ 13

R&S®VSE-K70
9.4.4 Configuring data input................................................................................................. 346
9.4.4.1 RF input.......................................................................................................................347
9.4.4.2 Configuring oscilloscope baseband input....................................................................359
9.4.4.3 Using external mixers..................................................................................................362
9.4.4.4 Remote commands for external frontend control........................................................ 371
9.4.4.5 Working with power sensors....................................................................................... 380
Contents
Basic settings.............................................................................................................. 363
Mixer settings.............................................................................................................. 364
Programming example: working with an external mixer..............................................369
Commands for initial configuration..............................................................................371
Commands for alignment............................................................................................ 377
Configuring power sensors......................................................................................... 380
Configuring power sensor measurements.................................................................. 382
9.4.5 Frontend settings........................................................................................................ 388
9.4.5.1 Frequency................................................................................................................... 389
9.4.5.2 Amplitude settings.......................................................................................................390
9.4.5.3 Attenuation.................................................................................................................. 392
9.4.5.4 Configuring a preamplifier........................................................................................... 395
9.4.5.5 Scaling and units.........................................................................................................396
9.4.6 Signal capture............................................................................................................. 402
9.4.7 Triggering measurements........................................................................................... 406
9.4.8 Configuring bursts and patterns.................................................................................. 412
9.4.8.1 Burst search................................................................................................................ 412
9.4.8.2 Pattern searches......................................................................................................... 414
9.4.8.3 Configuring patterns....................................................................................................416
9.4.9 Defining the result range............................................................................................. 419
9.4.10 Demodulation settings.................................................................................................423
9.4.11 Measurement filter settings......................................................................................... 432
9.4.12 Defining the evaluation range..................................................................................... 433
9.4.13 Adjusting settings automatically.................................................................................. 435
9.5 Analysis..................................................................................................................... 437
9.5.1 Configuring traces....................................................................................................... 438
9.5.2 Working with markers..................................................................................................442
9User Manual 1176.8951.02 ─ 13

R&S®VSE-K70
9.5.2.1 Individual marker settings........................................................................................... 442
9.5.2.2 Marker search and positioning settings.......................................................................446
9.5.3 Configuring display lines for eye diagrams................................................................. 453
9.5.4 Configuring modulation accuracy limit lines................................................................ 457
9.5.4.1 General commands.....................................................................................................458
9.5.4.2 Defining limits..............................................................................................................458
9.6 Configuring the result display................................................................................. 463
9.6.1 Global layout commands.............................................................................................463
9.6.2 Working with windows in the display...........................................................................467
9.6.3 VSA window configuration.......................................................................................... 473
9.7 Retrieving results......................................................................................................480
9.7.1 Retrieving trace data and marker values.................................................................... 481
9.7.2 Measurement results for TRACe<n>[:DATA]? TRACE<n>.........................................486
Contents
9.7.2.1 Capture buffer results..................................................................................................486
9.7.2.2 Cartesian diagrams..................................................................................................... 487
9.7.2.3 Polar diagrams............................................................................................................ 487
9.7.2.4 Symbols...................................................................................................................... 487
9.7.2.5 Result summary.......................................................................................................... 488
9.7.2.6 Equalizer..................................................................................................................... 488
9.7.2.7 Multi source.................................................................................................................489
9.7.3 Retrieving general burst and pattern information........................................................ 489
9.7.4 Retrieving parameter values....................................................................................... 493
9.7.5 Retrieving limit check results.......................................................................................509
9.8 Status reporting system........................................................................................... 511
9.8.1 STATus:QUEStionable:SYNC<n> register..................................................................513
9.8.2 STATus:QUEStionable:MODulation<n> register.........................................................513
9.8.3 STATus:QUESTionable:MODulation<n>:EVM register............................................... 514
9.8.4 STATus:QUESTionable:MODulation<n>:PHASe register........................................... 514
9.8.5 STATus:QUESTionable:MODulation<n>:MAGnitude register.....................................514
9.8.6 STATus:QUESTionable:MODulation<n>:CFRequency register..................................515
9.8.7 STATus:QUESTionable:MODulation<n>:IQRHO register........................................... 515
9.8.8 STATus:QUESTionable:MODulation<n>:FSK register................................................516
9.8.9 Querying the status registers...................................................................................... 516
10User Manual 1176.8951.02 ─ 13

R&S®VSE-K70
9.9 Programming examples........................................................................................... 521
9.9.1 Measurement example 1: user-defined measurement of continuous QPSK signal....521
9.9.2 Measurement example 2: GSM EDGE burst measurement based on a digital standard
9.9.3 Measurement example 3: user-defined pattern search and limit check......................526
A Menu reference...................................................................................531
A.1 Common R&S VSE menus....................................................................................... 531
A.1.1 File menu.................................................................................................................... 531
A.1.2 Window menu............................................................................................................. 532
A.1.3 Help menu...................................................................................................................533
A.2 Vector signal analysis menus..................................................................................533
Contents
.................................................................................................................................... 523
Annex.................................................................................................. 529
A.2.1 Edit menu.................................................................................................................... 534
A.2.2 Input & output menu....................................................................................................534
A.2.3 Meas setup menu........................................................................................................534
A.2.4 Trace menu................................................................................................................. 535
A.2.5 Marker menu............................................................................................................... 535
A.2.6 Limits menu.................................................................................................................536
B Reference of toolbar functions......................................................... 537
C Abbreviations..................................................................................... 541
D Predefined standards and settings.................................................. 542
E Predefined measurement and tx filters............................................551
E.1 Transmit filters.......................................................................................................... 551
E.2 Measurement filters.................................................................................................. 552
E.3 Typical combinations of tx and measurement filters.............................................553
F ASCII file export format for VSA data...............................................554
G Known data file syntax description..................................................556
H Formulae.............................................................................................558
H.1 Trace-based evaluations.......................................................................................... 558
H.2 Result summary evaluations................................................................................... 560
H.2.1 PSK, QAM and MSK modulation................................................................................ 560
11User Manual 1176.8951.02 ─ 13

R&S®VSE-K70
H.2.2 FSK modulation...........................................................................................................562
H.3 Statistical evaluations for the result summary...................................................... 563
H.4 Trace averaging.........................................................................................................563
H.5 Analytically calculated filters...................................................................................564
H.6 Standard-specific filters........................................................................................... 565
H.6.1 Transmit filter...............................................................................................................565
H.6.2 Measurement filter...................................................................................................... 565
H.6.2.1 EDGE measurement filters......................................................................................... 565
H.6.2.2 Low-isi filters............................................................................................................... 568
Contents
List of Remote Commands (VSA).....................................................572
Index....................................................................................................584
12User Manual 1176.8951.02 ─ 13

R&S®VSE-K70
1 Welcome to the vector signal analysis appli-
Welcome to the vector signal analysis application
cation
The R&S VSE VSA application performs vector and scalar measurements on digitally
modulated single-carrier signals. To perform the measurements it converts RF signals
into the complex baseband.
TheR&S VSE VSA application features:
●
Flexible modulation analysis from MSK to 1024QAM
●
Numerous standard-specific default settings
●
Various graphical, numerical and statistical evaluations and result displays
●
Spectrum analysis of the measured signal and the reference signal
●
Flexible burst search for the analysis of complex signal combinations, short bursts
or signal mix
This user manual contains a description of the functionality that the application provides, including remote control operation.
General R&S VSE functions
The application-independent functions for general tasks on the R&S VSE are also
available for VSA measurements and are described in the R&S VSE Base Software
User Manual. In particular, this comprises the following functionality:
●
Controlling instruments and capturing I/Q data
●
Data management
●
Test report functionality
●
General software preferences and information
●
Fast access panel
The latest version is available for download at the product homepage http://
www.rohde-schwarz.com/product/VSE.html.
Additional information
Several application notes discussing vector signal analysis using the R&S VSE VSA
application are available from the Rohde & Schwarz website:
1EF93: Modulation Accuracy Measurements of DVB-S2 and DVB-S2X Signals
1EF55: EVM Measurements for ZigBee signals in the 2.4 GHz band
1MA171: How to use Rohde & Schwarz Instruments in MATLAB
● Introduction to vector signal analysis...................................................................... 14
● Starting the VSA application................................................................................... 14
● Understanding the display information....................................................................15
13User Manual 1176.8951.02 ─ 13
R&S®VSE-K70
1.1 Introduction to vector signal analysis
Welcome to the vector signal analysis application
Starting the VSA application
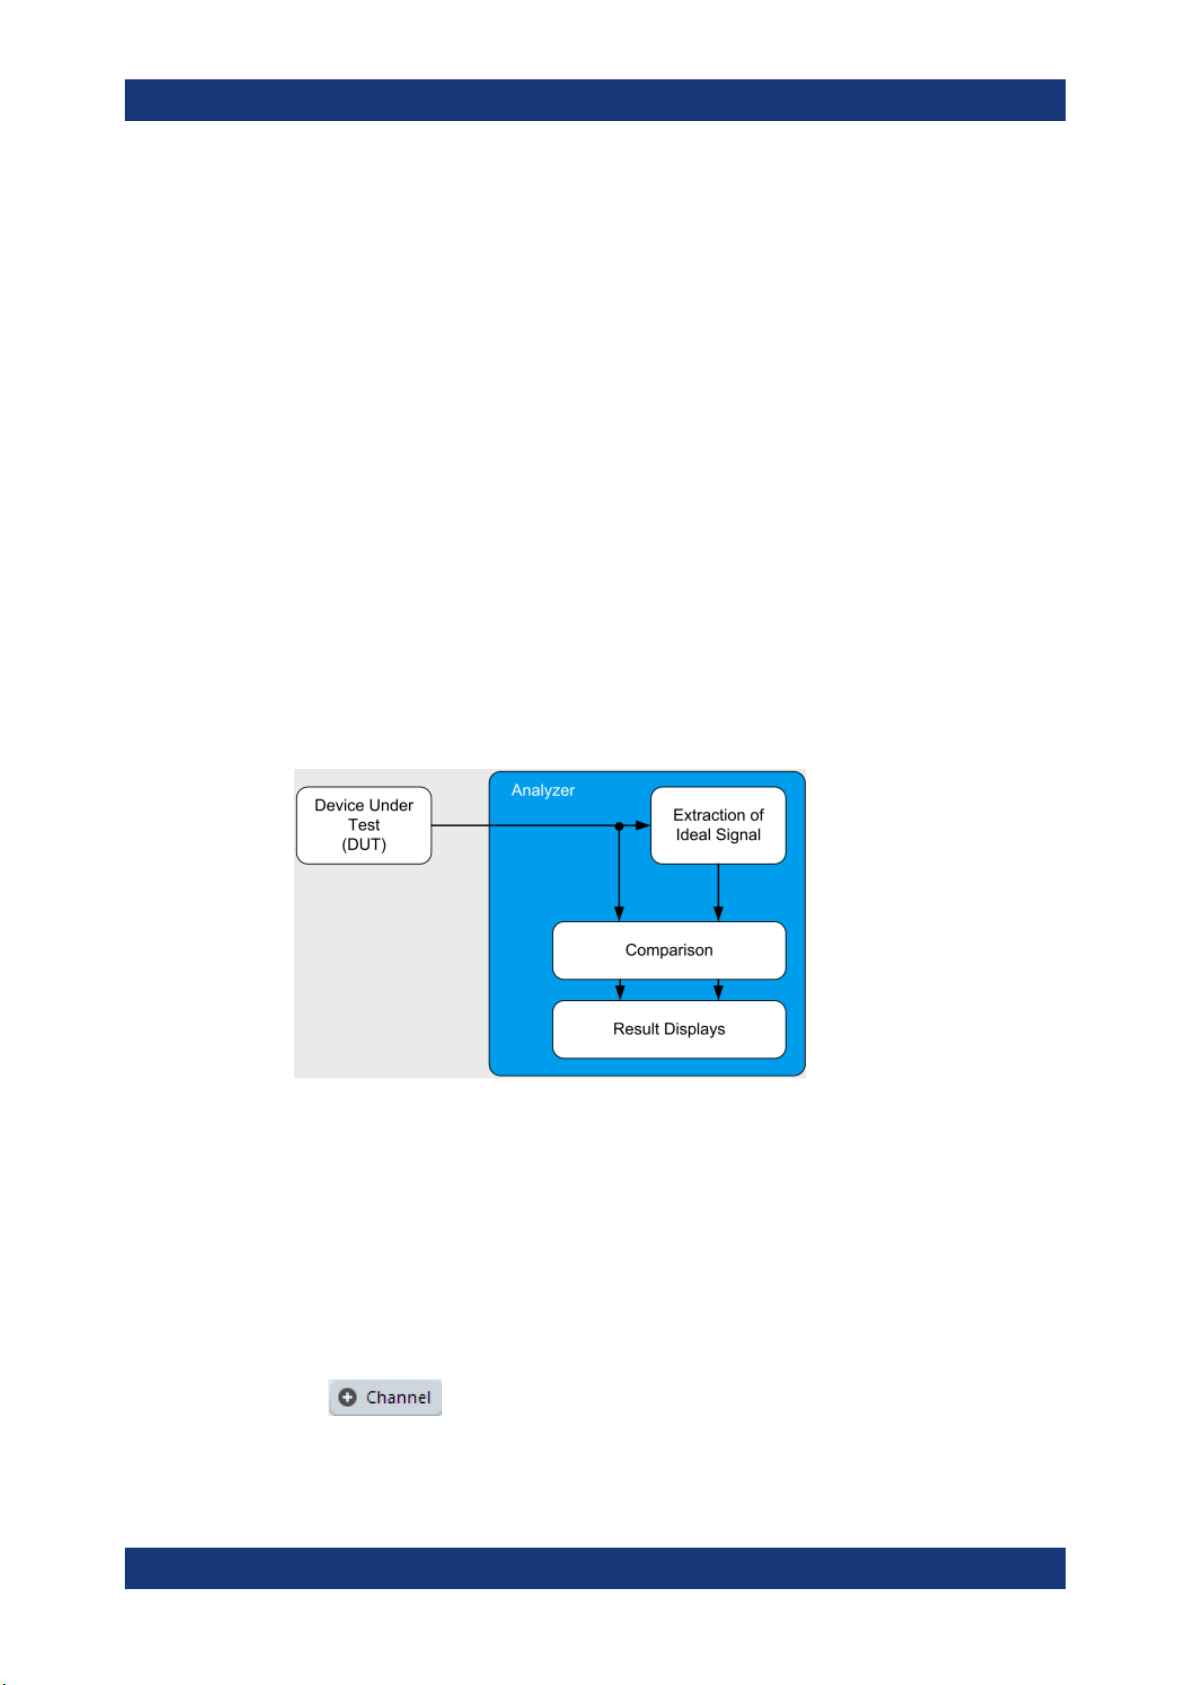
The goal of vector signal analysis is to determine the quality of the signal that is transmitted by the device under test (DUT) by comparing it against an ideal signal. The DUT
is usually connected with the analyzer via a cable. The key task of the analyzer is to
determine the ideal signal. Hence, the analyzer aims to reconstruct the ideal signal
from the measured signal that is transmitted by the DUT. This ideal signal is commonly
referred to as the reference signal, while the signal from the DUT is called the mea-
surement signal.
After extracting the reference signal, the R&S VSE VSA application compares the
measurement signal and the reference signal, and the results of this comparison are
displayed.
Example:
The most common vector signal analysis measurement is the EVM ("Error Vector Magnitude") measurement. Here, the complex baseband reference signal is subtracted
from the complex baseband measurement signal. The magnitude of this error vector
represents the EVM value. The EVM has the advantage that it "summarizes" all potential errors and distortions in one single value. If the EVM value is low, the signal quality
of the DUT is high.
Figure 1-1: Simplified schema of vector signal analysis
1.2 Starting the VSA application
Vector Signal Analysis is a separate application on the R&S VSE. It is activated by creating a new measurement channel in VSA mode.
To activate the VSA application
1.
Select the "Add Channel" function in the Sequence tool window.
14User Manual 1176.8951.02 ─ 13

R&S®VSE-K70
Welcome to the vector signal analysis application
Understanding the display information
A dialog box opens that contains all operating modes and applications currently
available in your R&S VSE.
2. Select the "VSA" item.
The R&S VSE opens a new measurement channel for the R&S VSE VSA application.
1.3 Understanding the display information
The following figure shows a measurement diagram during analyzer operation. All different information areas are labeled. They are explained in more detail in the following
sections.
15User Manual 1176.8951.02 ─ 13

R&S®VSE-K70
Welcome to the vector signal analysis application
Understanding the display information
1 = Color coding for windows of same channel
2 = Channel bar with measurement settings
3 = Window title bar with diagram-specific (trace) information
4 = Diagram area
5 = Diagram footer with diagram-specific information, depending on result display
Channel bar information
In the R&S VSE VSA application, the R&S VSE shows the following settings:
Table 1-1: Information displayed in the channel bar in VSA application
Ref Level Reference level
Freq Center frequency for the RF signal
Offset Reference level offset
Att Mechanical and electronic RF attenuation
STD/Mod Digital standard or modulation type, if no standard is active (or default
standard is changed)
Res Len/ Cap Len Result length or capture length (for capture buffer display), see "Capture
Length Settings" on page 205
SR Symbol Rate
Burst Burst search active (see "Enabling Burst Searches" on page 212)
Pattern Pattern search active (see "Enabling Pattern Searches" on page 213)
Stat Count Statistics count for averaging and other statistical operations, see "Statis-
tic Count" on page 206; cannot be edited directly
Capt Count Capture count; the current number of captures performed if several cap-
tures are necessary to obtain the number of results defined by "Statistics
Count"; cannot be edited directly
Result Range # Selected result range (see "Select Result Rng" on page 221)
16User Manual 1176.8951.02 ─ 13

R&S®VSE-K70
Welcome to the vector signal analysis application
Understanding the display information
In addition, the channel bar also displays information on instrument settings that affect
the measurement results even though this is not immediately apparent from the display
of the measured values (e.g. transducer or trigger settings). This information is displayed only when applicable for the current measurement. For details see the
R&S VSE Base Software User Manual.
Window title bar information
For each diagram, the header provides the following information:
Figure 1-2: Window title bar information in VSA application
0 = Color coding for windows of same channel
1 = Edit result display function
2 = Channel name
3 = Window number
4 = Window type
5 = Data source type
6 = Trace color, trace number, displayed signal for Meas&Ref data source: M (Meas) or R (Ref), trace mode
7 = Dock/undock window function
8 = Close window function
Diagram area
The diagram area displays the results according to the selected result displays (see
Chapter 2, "Measurements and result displays", on page 18).
Diagram footer information
The diagram footer (beneath the diagram) contains the start and stop symbols or time
of the evaluation range.
Status bar information
The software status, errors and warnings and any irregularities in the software are indicated in the status bar at the bottom of the R&S VSE window.
17User Manual 1176.8951.02 ─ 13

R&S®VSE-K70
2 Measurements and result displays
Measurements and result displays
Evaluation data sources in VSA
Various different result displays for VSA measurements are available. Which result
types are available depends on the selected data source. You can define which part of
the measured signal is to be evaluated and displayed.
The determined result and evaluation ranges are included in the result displays (where
useful) to visualize the basis of the displayed values and traces.
For background information on the result and evaluation ranges, see Chapter 3.6,
"Measurement ranges", on page 142.)
Result display windows
For each measurement, a separate measurement channel is activated. Each measurement channel can provide multiple result displays, which are displayed in individual
windows. The measurement windows can be rearranged and configured in the
R&S VSE to meet your requirements. All windows that belong to the same measurement (including the channel bar) are indicated by a colored line at the top of the window title bar.
In the R&S VSE VSA application, a maximum of 24 windows are available.
►
To add further result displays for the VSA channel, select the
from the toolbar, or select the "Window > New Window" menu item.
For details on working with channels and windows, see the "Operating Basics"
chapter in the R&S VSE base software user manual.
● Evaluation data sources in VSA..............................................................................18
● Result types in VSA................................................................................................ 23
● Predefined display configuration.............................................................................65
● Common parameters in VSA.................................................................................. 66
2.1 Evaluation data sources in VSA
All data sources for evaluation available for VSA are displayed in the evaluation bar in
SmartGrid mode.
The data source determines which result types are available (see Table 2-1). For
details on selecting the data source for evaluation, see Chapter 5.5, "Display and win-
dow configuration", on page 251.
"Add Window" icon
18User Manual 1176.8951.02 ─ 13

R&S®VSE-K70
Measurements and result displays
Evaluation data sources in VSA
In diagrams in the frequency domain (Spectrum transformation, see "Result Type
Transformation" on page 252) the usable I/Q bandwidth is indicated by vertical blue
lines.
Capture Buffer...............................................................................................................19
Measurement & Reference Signal................................................................................ 20
Symbols........................................................................................................................ 20
Error Vector...................................................................................................................20
Modulation Errors..........................................................................................................21
Modulation Accuracy.....................................................................................................21
Equalizer....................................................................................................................... 22
Multi Source.................................................................................................................. 22
Capture Buffer
Displays the captured I/Q data.
In "Capture Buffer" result diagrams, the result ranges are indicated by green bars along
the time axis. The currently displayed result range is indicated by a blue bar.
Figure 2-1: Result ranges for a burst signal
Note: You can use the "Capture Buffer" display to navigate through the available result
ranges (using Select Result Rng function), and analyze the individual result ranges in
separate windows.
19User Manual 1176.8951.02 ─ 13

R&S®VSE-K70
Measurements and result displays
Evaluation data sources in VSA
Once the sweep has stopped, you can change the position of the result range quickly
and easily. Drag the blue bar representing the result range to a different position in the
"Capture Buffer".
If the optional 2 GHz bandwidth extension (B2000) is active, the capture buffer is
restricted to 256 000 samples; thus, all data is included in one single range.
The default result type is "Magnitude Absolute".
The following result types are available:
●
Chapter 2.2.21, "Magnitude absolute", on page 46
●
Chapter 2.2.22, "Magnitude overview (capture buffer)", on page 48
●
Chapter 2.2.28, "Real/imag (I/Q)", on page 54
●
Chapter 2.2.11, "Frequency absolute", on page 36
●
Chapter 2.2.34, "Vector I/Q", on page 63
Remote command:
LAY:ADD? '1',BEL,TCAP(see LAYout:ADD[:WINDow]? on page 467)
Measurement & Reference Signal
The measurement signal or the ideal reference signal (or both)
The default result type is "Magnitude Relative".
The following result types are available:
●
Chapter 2.2.21, "Magnitude absolute", on page 46
●
Chapter 2.2.23, "Magnitude relative", on page 49
●
Chapter 2.2.26, "Phase wrap", on page 52
●
Chapter 2.2.27, "Phase unwrap", on page 53
●
Chapter 2.2.11, "Frequency absolute", on page 36
●
Chapter 2.2.12, "Frequency relative", on page 38
●
Chapter 2.2.28, "Real/imag (I/Q)", on page 54
●
Chapter 2.2.10, "Eye diagram real (I)", on page 36
●
Chapter 2.2.9, "Eye diagram imag (Q)", on page 34
●
Chapter 2.2.8, "Eye diagram frequency", on page 33
●
Chapter 2.2.5, "Constellation I/Q", on page 29
●
Chapter 2.2.34, "Vector I/Q", on page 63
●
Chapter 2.2.4, "Constellation frequency", on page 28
●
Chapter 2.2.33, "Vector frequency", on page 63
Remote command:
LAY:ADD? '1',BEL,REF(see LAYout:ADD[:WINDow]? on page 467)
Symbols
The detected symbols (i.e. the detected bits) displayed in a table.
The default result type is a hexadecimal symbol table.
Other formats for the symbol table are available, but no other result types (see Chap-
ter 2.2.32, "Symbol table", on page 61).
Remote command:
LAY:ADD? '1',BEL, SYMB(see LAYout:ADD[:WINDow]? on page 467)
Error Vector
The modulated difference between the complex measurement signal and the complex
reference signal:
20User Manual 1176.8951.02 ─ 13

R&S®VSE-K70
Measurements and result displays
Evaluation data sources in VSA
Modulation (measurement signal - reference signal)
For example: EVM = Mag(meas - ref)
The default result type is "EVM".
The following result types are available:
●
Chapter 2.2.7, "Error vector magnitude (EVM)", on page 32
●
Chapter 2.2.28, "Real/imag (I/Q)", on page 54
●
Chapter 2.2.34, "Vector I/Q", on page 63
Remote command:
LAY:ADD? '1',BEL,EVEC(see LAYout:ADD[:WINDow]? on page 467)
Modulation Errors
The difference between the modulated complex samples in the measurement and the
modulated reference signal:
Modulation (measurement signal) - Modulation (reference signal)
For example: Magnitude Error = Mag(meas) - Mag(ref)
The default result type is "Magnitude Error".
The following result types are available:
●
Chapter 2.2.21, "Magnitude absolute", on page 46
●
Chapter 2.2.25, "Phase error", on page 51
●
Chapter 2.2.13, "Frequency error absolute", on page 39
●
Chapter 2.2.14, "Frequency error relative", on page 41
Remote command:
LAY:ADD? '1',BEL,MERR(see LAYout:ADD[:WINDow]? on page 467)
Modulation Accuracy
Parameters that characterize the accuracy of modulation.
The default result type is "Result Summary".
The following result types are available:
●
Chapter 2.2.29, "Result summary", on page 55
●
Chapter 2.2.1, "Bit error rate (BER)", on page 25
The results of a "modulation accuracy" measurement can be checked for violation of
defined limits automatically. If limit check is activated and the measured values exceed
the limits, those values are indicated in red in the "Result Summary" table. If limit check
is activated and no values exceed the limits, the checked values are indicated in green.
21User Manual 1176.8951.02 ─ 13

R&S®VSE-K70
Measurements and result displays
Evaluation data sources in VSA
Remote command:
LAY:ADD? '1',BEL,MACC(see LAYout:ADD[:WINDow]? on page 467)
Equalizer
Filter characteristics of the "equalizer" used to compensate for channel distortion and
parameters of the distortion itself.
The following result types are available:
●
Chapter 2.2.18, "Impulse response magnitude", on page 44
●
Chapter 2.2.19, "Impulse response phase", on page 45
●
Chapter 2.2.20, "Impulse response real/imag", on page 46
●
Chapter 2.2.16, "Frequency response magnitude", on page 43
●
Chapter 2.2.17, "Frequency response phase", on page 43
●
Chapter 2.2.15, "Frequency response group delay", on page 42
●
Chapter 2.2.3, "Channel frequency response magnitude", on page 27
●
Chapter 2.2.2, "Channel frequency response group delay", on page 27
The default result type is "Frequency Response Magnitude".
Remote command:
LAY:ADD? '1',BEL,EQU(see LAYout:ADD[:WINDow]? on page 467)
Multi Source
Combines two data sources in one diagram, with (initially) one trace for each data
source. This display allows you to compare the errors to the captured or measured
data directly in the diagram.
Furthermore, for carrier-in-carrier measurements, this data source makes both carriers
visible.
The default result type is "Spec (Meas+Error)".
The following result types are available:
●
Chapter 2.2.30, "Spectrum (capture buffer + error)", on page 59
●
Chapter 2.2.31, "Spectrum (measurement + error)", on page 60
Remote command:
LAY:ADD? '1',RIGH,MCOM, see LAYout:ADD[:WINDow]? on page 467
22User Manual 1176.8951.02 ─ 13

R&S®VSE-K70
2.2 Result types in VSA
Measurements and result displays
Result types in VSA
The available result types for a window depend on the selected evaluation data source.
The SCPI parameters in the following table refer to the CALC:FORM command, see
CALCulate<n>:FORMat on page 475.
Table 2-1: Available result types depending on data source
Evaluation data
source
"Capture Buffer" "Magnitude Absolute"
"Capture Buffer" "Magnitude Overview Absolute"
"Meas & Ref Signal" "Magnitude Absolute"
Result type SCPI parameter
(selected capture buffer section)
"Real/Imag (I/Q)"
"Frequency Absolute"
"Vector I/Q"
(entire capture buffer)
"Magnitude Relative"
"Phase Wrap"
"Phase Unwrap"
"Frequency Absolute"
"Frequency Relative"
"Real/Imag (I/Q)"
"Eye Diagram Real (I)"
MAGNitude
RIMag
FREQuency
COMP
MOVerview
MAGNitude
MAGNitude
PHASe
UPHase
FREQuency
FREQuency
RIMag
IEYE
"Eye Diagram Imag (Q)"
"Eye Diagram Frequency"
"Constellation I/Q"
"Constellation I/Q (Rotated)"
"Vector I/Q"
"Constellation Frequency"
"Vector Frequency"
"Symbols" "Binary" -
"Octal" -
"Decimal" -
"Hexadecimal" -
"Error Vector" "EVM"
QEYE
FEYE
CONS
RCON
COMP
CONF
COVF
MAGNitude
23User Manual 1176.8951.02 ─ 13

R&S®VSE-K70
Measurements and result displays
Result types in VSA
Evaluation data
source
"Modulation Errors" "Magnitude Error"
"Modulation Accuracy"
"Equalizer" "Impulse Response Magnitude"
Result type SCPI parameter
"Real/Imag (I/Q)"
"Vector I/Q"
"Phase Error"
"Frequency Error Absolute"
"Frequency Error Relative"
"Bit Error Rate"
"Result Summary"
"Impulse Response Phase"
"Impulse Response Real/Imag"
"Frequency Response Magnitude"
"Frequency Response Phase"
"Frequency Response Group Delay"
"Channel Frequency Response Magnitude"
RIMag
COMP
MAGNitude
PHASe
FREQuency
FREQuency
BERate
RSUM
MAGNitude
UPHase
RIMag
MAGNitude
UPHase
GDELay
MAGNitude
"Channel Frequency Response
Group Delay"
"Multi Source" "Spectrum (Real/Imag) (Capture buf-
fer + Error)"
"Spectrum (Real/Imag) (Measurement
+ Error)"
GDELay
RIMag (query only)
RIMag (query only)
For details on selecting the data source and result types for evaluation, see Chap-
ter 5.5, "Display and window configuration", on page 251.
Remote command:
CALCulate<n>:FORMat on page 475
● Bit error rate (BER)................................................................................................. 25
● Channel frequency response group delay.............................................................. 27
● Channel frequency response magnitude................................................................ 27
● Constellation frequency...........................................................................................28
● Constellation I/Q......................................................................................................29
● Constellation I/Q (rotated).......................................................................................31
● Error vector magnitude (EVM)................................................................................ 32
● Eye diagram frequency........................................................................................... 33
● Eye diagram imag (Q).............................................................................................34
● Eye diagram real (I).................................................................................................36
● Frequency absolute.................................................................................................36
24User Manual 1176.8951.02 ─ 13

R&S®VSE-K70
Measurements and result displays
Result types in VSA
● Frequency relative...................................................................................................38
● Frequency error absolute........................................................................................39
● Frequency error relative..........................................................................................41
● Frequency response group delay............................................................................42
● Frequency response magnitude..............................................................................43
● Frequency response phase.....................................................................................43
● Impulse response magnitude..................................................................................44
● Impulse response phase.........................................................................................45
● Impulse response real/imag....................................................................................46
● Magnitude absolute.................................................................................................46
● Magnitude overview (capture buffer).......................................................................48
● Magnitude relative...................................................................................................49
● Magnitude error.......................................................................................................50
● Phase error............................................................................................................. 51
● Phase wrap............................................................................................................. 52
● Phase unwrap......................................................................................................... 53
● Real/imag (I/Q)........................................................................................................54
● Result summary...................................................................................................... 55
● Spectrum (capture buffer + error)........................................................................... 59
● Spectrum (measurement + error)............................................................................60
● Symbol table........................................................................................................... 61
● Vector frequency.....................................................................................................63
● Vector I/Q................................................................................................................63
2.2.1 Bit error rate (BER)
A bit error rate (BER) measurement compares the transmitted bits with the determined
symbol decision bits:
BER = error bits / number of analyzed bits
As a prerequisite for this measurement, the VSA application must know which bit
sequences are correct, i.e. which bit sequences can occur. This knowledge must be
provided as a list of possible data sequences in xml format, which is loaded in the VSA
application (see Chapter 3.9, "Known data files - dependencies and restrictions",
on page 149).
Auxiliary tool to create known data files
An auxiliary tool to create known data files from data that is already available in the
R&S VSE VSA application is provided with the software free of charge.
See Chapter 6.2.3.2, "How to create known data files", on page 264.
Alternatively, for data generated by a pseudo-random bit sequence (PRBS) generator,
you can specify the algorithm used to generate the data, so the R&S VSE VSA application knows which sequences can occur. This function requires the R&S VSE-K70P
option. See Chapter 3.10, "Known data from PRBS generators", on page 150.
If known data is specified in the application, the BER result display is available for the
following source types:
25User Manual 1176.8951.02 ─ 13

R&S®VSE-K70
Measurements and result displays
Result types in VSA
●
"Modulation Accuracy"
Note that this measurement can take some time, as each symbol decision must be
compared to the possible data sequences one by one.
The BER measurement is an indicator for the quality of the demodulated signal. High
BER values indicate problems such as:
●
Inadequate demodulation settings
●
Poor quality in the source data
●
False or missing sequences in the known data file
●
Result range alignment leads to a mismatch of the input data with the defined
sequences
A BER value of 0.5 means that for at least one measurement no matching sequence
was found.
See also Chapter 3.4.3, "Demodulation and symbol decisions", on page 116 and the
application sheet R&S®FSW-K70 Measuring the BER and the EVM for Signals with
Low SNR on the Rohde & Schwarz Internet site.
The following information is provided in the "Bit Error Rate" result display:
●
"Bit Error Rate": error bits / number of analyzed bits
●
"Total # of Errors": number of detected bit errors (known data compared to symbol
decisions)
●
"Total # of Bits": number of analyzed bits
For each of these results, the following values are provided:
BER result Description
Current Value for current result range
Minimum Minimum "Current" value during the current measurement
Maximum Maximum "Current" value during the current measurement
Accumulative Total value over several measurements;
For BER: "Total # of Errors" / "Total # of Bits" (similar to average function)
Remote commands:
LAY:ADD? '1',BEL,MACC
To define the required source type (see LAYout:ADD[:WINDow]? on page 467).
CALC:FORM BER
To define the result type (see CALCulate<n>:FORMat on page 475).
26User Manual 1176.8951.02 ─ 13

R&S®VSE-K70
2.2.2 Channel frequency response group delay
Measurements and result displays
Result types in VSA
CALC:BER?
To query the results (see CALCulate<n>:BERate? on page 494).
The frequency response group delay of the channel is the derivation of phase over frequency for the original input signal. It is a measure of phase distortion.
Remote commands:
LAY:ADD? '1',BEL,EQU
To define the required source type (see LAYout:ADD[:WINDow]? on page 467).
CALC:FEED 'XFR:DDEM:IRAT'
To define the channel frequency response result type (see CALCulate<n>:FEED
on page 474).
CALC:FORM GDEL
To define the group delay result type (see CALCulate<n>:FORMat on page 475).
TRAC:DATA? TRACE1
To query the trace results (see TRACe<n>[:DATA]? TRACE<n> and Chapter 9.7.2.6,
"Equalizer", on page 488).
2.2.3 Channel frequency response magnitude
The frequency response magnitude of the channel indicates which distortions occurred
during transmission of the input signal. It is only determined if the equalizer is activated.
27User Manual 1176.8951.02 ─ 13

R&S®VSE-K70
Measurements and result displays
Result types in VSA
The bandwidth for which the channel transfer function can be estimated is not only limited by the usable I/Q bandwidth, but also by the bandwidth of the analyzed input signal. Areas with low reception power, e.g. at the filter edges, can suffer from less accurate estimation results.
Remote commands:
LAY:ADD? '1',BEL,EQU
To define the required source type (see LAYout:ADD[:WINDow]? on page 467).
CALC:FEED 'XFR:DDEM:IRAT'
To define the channel frequency response result type (see CALCulate<n>:FEED
on page 474).
CALC:FORM MAGN
To define the magnitude result type (see CALCulate<n>:FORMat on page 475).
TRAC:DATA? TRACE1
To query the trace results (see TRACe<n>[:DATA]? TRACE<n> and Chapter 9.7.2.6,
"Equalizer", on page 488).
2.2.4 Constellation frequency
Depending on the modulation type,, the source signal (without inter-symbol interference) as an X/Y plot; only the symbol decision instants are drawn and not connected.
Available for source types:
●
"Meas & Ref Signal"
28User Manual 1176.8951.02 ─ 13

R&S®VSE-K70
Measurements and result displays
Result types in VSA
Figure 2-2: Constellation Frequency result display
A special density trace mode is available for this diagram. The occurrence of each
value within the current result range or evaluation range is indicated by color.
Remote commands:
LAY:ADD? '1',BEL,MEAS
To define the required source type (see LAYout:ADD[:WINDow]? on page 467)
CALC:FORM CONF
To define the result type (see CALCulate<n>:FORMat on page 475)
TRAC:DATA? TRACE1
To query the trace results (see TRACe<n>[:DATA]? TRACE<n> and Chapter 9.7.2.3,
"Polar diagrams", on page 487)
2.2.5 Constellation I/Q
The complex source signal (without inter-symbol interference) as an X/Y plot; only the
(de-rotated) symbol decision instants are drawn and not connected
Available for source types:
●
"Meas & Ref Signal"
29User Manual 1176.8951.02 ─ 13

R&S®VSE-K70
Measurements and result displays
Result types in VSA
Figure 2-3: Constellation I/Q diagram for QPSK modulated signal
Markers in the Constellation diagram
Using markers you can detect individual constellation points for a specific symbol.
When you activate a marker in the Constellation diagram, its position is defined by the
symbol the point belongs to. However, the marker result indicates the I and Q values of
the point.
Constellation for subframe or symbol types in multi-modulation signals
For signals with a user-defined frame structure (see Chapter 3.11, "Multi-modulation
analysis (R&S VSE-K70M)", on page 152), the constellation diagram displays all sym-
bols in the entire frame by default. However, if you restrict the evaluation range to the
symbols of a particular subframe, only those constellation points are displayed (see
Chapter 4.10, "Evaluation range configuration", on page 232).
Density trace
A special density trace mode is available for this diagram. The occurrence of each
value within the current result range or evaluation range is indicated by color.
30User Manual 1176.8951.02 ─ 13
 Loading...