

Page 1
R&S®VSE-K7
Analog Demodulation Application
User Manual
(;ÚçW2)
1176893902
User Manual
Version 07
Page 2

This manual applies to the following software, version 1.50 and later:
●
R&S®VSE Enterprise Edition base software (1320.7500.xx / 1320.7951.xx)
●
R&S®VSE Basic Edition base software (1345.1011.06)
The following software options are described:
●
R&S VSE-K7 (1320.7539.xx)
●
R&S®CMA-K310 (1320.7945.xx)
© 2018 Rohde & Schwarz GmbH & Co. KG
Mühldorfstr. 15, 81671 München, Germany
Phone: +49 89 41 29 - 0
Fax: +49 89 41 29 12 164
Email: info@rohde-schwarz.com
Internet: www.rohde-schwarz.com
Subject to change – Data without tolerance limits is not binding.
R&S® is a registered trademark of Rohde & Schwarz GmbH & Co. KG.
Trade names are trademarks of the owners.
1176.8939.02 | Version 07 | R&S®VSE-K7
The following abbreviations are used throughout this manual: R&S®VSE is abbreviated as R&S VSE.
Page 3

R&S®VSE-K7
1.1 About this Manual......................................................................................................... 5
1.2 Typographical Conventions......................................................................................... 6
2.1 Starting the R&S VSE Analog Demodulation application......................................... 7
2.2 Understanding the Display Information......................................................................8
4.1 Demodulation Process............................................................................................... 20
4.2 Demodulation Bandwidth...........................................................................................22
Contents
Contents
1 Preface.................................................................................................... 5
2 Welcome to the R&S VSE Analog Demodulation application............7
3 Measurements and Result Displays...................................................11
4 Measurement Basics........................................................................... 20
4.3 Sample Rate and Demodulation Bandwidth.............................................................22
4.4 AF Filters......................................................................................................................23
4.5 Time Domain Zoom.....................................................................................................23
4.6 Working with Spectrograms.......................................................................................25
5 Configuration........................................................................................31
5.1 Configuration According to Digital Standards.........................................................31
5.2 Configuration Overview..............................................................................................33
5.3 Input and Frontend Settings...................................................................................... 35
5.4 Trigger Source Settings..............................................................................................50
5.5 Data Acquisition..........................................................................................................54
5.6 Demodulation.............................................................................................................. 58
5.7 Adjusting Settings Automatically..............................................................................75
6 Analysis................................................................................................ 78
6.1 Trace Settings..............................................................................................................78
6.2 Trace / Data Export Configuration.............................................................................81
6.3 Spectrogram Settings.................................................................................................84
6.4 Working with Markers in the R&S VSE Analog Demodulation application........... 87
6.5 Working with Limit Lines in the R&S VSE Analog Demodulation application.... 107
6.6 Zoom Functions........................................................................................................ 120
3User Manual 1176.8939.02 ─ 07
Page 4

R&S®VSE-K7
9.1 Introduction............................................................................................................... 126
9.2 Common Suffixes......................................................................................................130
9.3 Activating Analog Demodulation Measurements.................................................. 131
9.4 Configuring the Measurement................................................................................. 131
9.5 Configuring the Result Display................................................................................201
9.6 Retrieving Results.....................................................................................................212
9.7 Analyzing Results..................................................................................................... 223
9.8 Programming Example............................................................................................. 276
Contents
7 How to Perform Measurements in the Analog Demodulation Appli-
cation...................................................................................................122
8 Optimizing and Troubleshooting the Measurement....................... 124
9 Remote Commands for Analog Demodulation Measurements..... 125
Annex.................................................................................................. 280
A Reference............................................................................................280
A.1 Menu Reference........................................................................................................ 280
A.2 Reference of Toolbar Functions.............................................................................. 285
A.3 Predefined Standards and Settings........................................................................ 288
A.4 Formats for Returned Values: ASCII Format and Binary Format......................... 290
A.5 Reference: ASCII File Export Format...................................................................... 291
List of Remote Commands (AnalogDemod)....................................294
Index....................................................................................................302
4User Manual 1176.8939.02 ─ 07
Page 5

R&S®VSE-K7
1.1 About this Manual
About this Manual
1 Preface
This R&S VSE Analog Demodulation User Manual provides all the information specific
to the application. All general software functions and settings common to all applica-
tions and operating modes are described in the R&S VSE Base Software User Manual.
The main focus in this manual is on the measurement results and the tasks required to
obtain them. The following topics are included:
●
Welcome to the R&S VSE Analog Demodulation application Application
Introduction to and getting familiar with the application
●
Measurements and Result Displays
Details on supported measurements and their result types
●
Measurement Basics
Background information on basic terms and principles in the context of the measurement
●
Configuration + Analysis
A concise description of all functions and settings available to configure measurements and analyze results with their corresponding remote control command
●
How to Perform Measurements in the R&S VSE Analog Demodulation application Application
The basic procedure to perform each measurement and step-by-step instructions
for more complex tasks or alternative methods
●
Measurement Examples
Detailed measurement examples to guide you through typical measurement scenarios and allow you to try out the application immediately
●
Optimizing and Troubleshooting the Measurement
Hints and tips on how to handle errors and optimize the measurement configuration
●
Remote Commands for R&S VSE Analog Demodulation application Measurements
Remote commands required to configure and perform R&S VSE Analog Demodulation application measurements in a remote environment, sorted by tasks
(Commands required to set up the environment or to perform common tasks in the
software are provided in the R&S VSE Base Software User Manual)
Programming examples demonstrate the use of many commands and can usually
be executed directly for test purposes
●
List of remote commands
Alphabetical list of all remote commands described in the manual
●
Index
Preface
5User Manual 1176.8939.02 ─ 07
Page 6
R&S®VSE-K7
1.2 Typographical Conventions
Preface
Typographical Conventions
The following text markers are used throughout this documentation:
Convention Description
"Graphical user interface elements"
[Keys] Key and knob names are enclosed by square brackets.
File names, commands,
program code
Input Input to be entered by the user is displayed in italics.
Links Links that you can click are displayed in blue font.
"References" References to other parts of the documentation are enclosed by quota-
All names of graphical user interface elements on the screen, such as
dialog boxes, menus, options, buttons, and softkeys are enclosed by
quotation marks.
File names, commands, coding samples and screen output are distinguished by their font.
tion marks.
6User Manual 1176.8939.02 ─ 07
Page 7

R&S®VSE-K7
Welcome to the R&S VSE Analog Demodulation application
Starting the R&S VSE Analog Demodulation application
2 Welcome to the R&S VSE Analog Demodu-
lation application
The (optional) R&S VSE Analog Demodulation application converts the R&S VSE into
an analog demodulation analyzer for amplitude-, frequency- or phase-modulated signals. It measures not only characteristics of the useful modulation, but also factors
such as residual FM or synchronous modulation.
The digital signal processing in the R&S VSE is also ideally suited for demodulating
AM, FM, or PM signals. The R&S VSE Analog Demodulation application provides the
necessary measurement functions. This application is optional and requires an additional license.
The R&S VSE Analog Demodulation application features:
●
AM, FM, and PM demodulation, with various result displays:
– Modulation signal versus time
– Spectrum of the modulation signal (FFT)
– RF signal power versus time
– Spectrum of the RF signal
●
Determining maximum, minimum and average or current values in parallel over a
selected number of measurements
●
Error-free AM to FM conversion and vice versa, without deviation errors, frequency
response or frequency drift at DC coupling
●
Relative demodulation, in relation to a user-defined or measured reference value
This user manual contains a description of the functionality that the application provides, including remote control operation.
All functions not discussed in this manual are the same as in the base unit and are
described in the R&S VSE User Manual.
2.1 Starting the R&S VSE Analog Demodulation application
The R&S VSE Analog Demodulation application is a separate application on the
R&S VSE. It is activated by creating a new measurement channel in "Analog Demod"
mode.
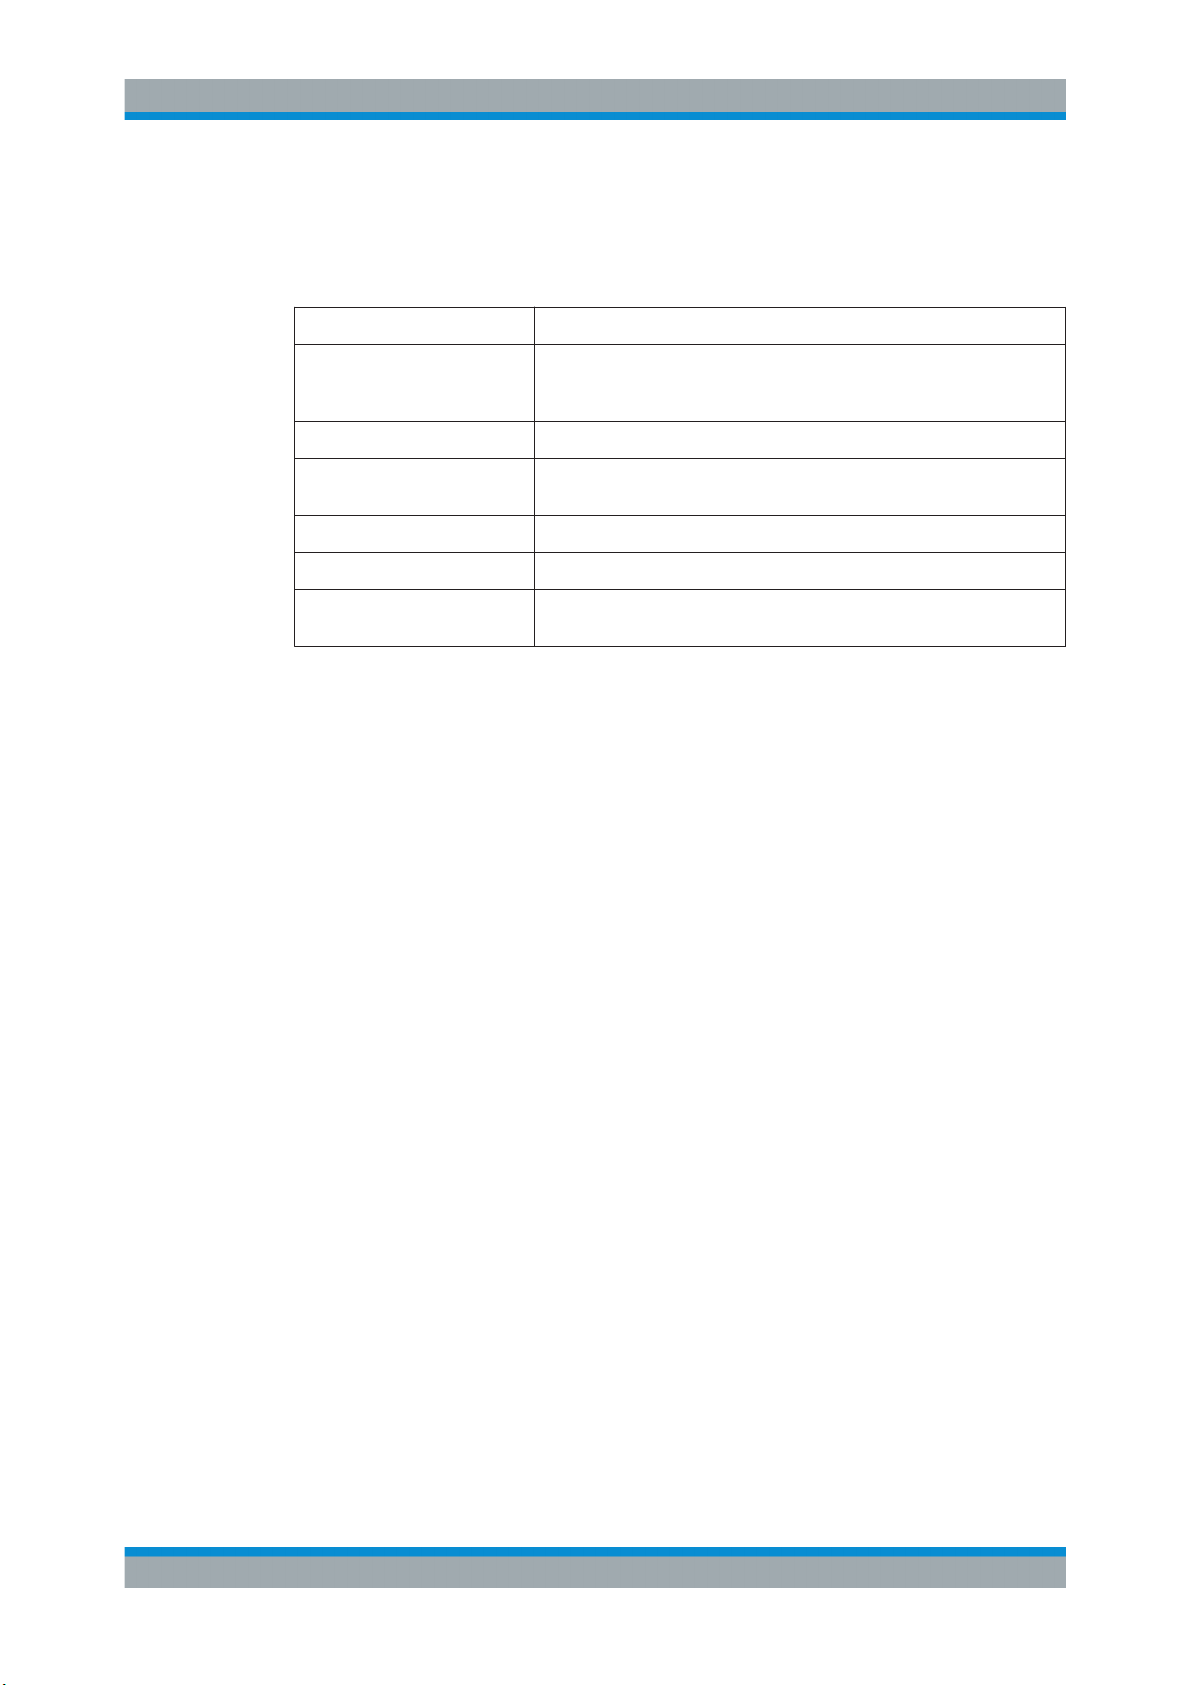
To activate the R&S VSE Analog Demodulation application
1.
Select the "Add Channel" function in the Sequence tool window.
A dialog box opens that contains all operating modes and applications currently
available in your R&S VSE.
7User Manual 1176.8939.02 ─ 07
Page 8
R&S®VSE-K7
Welcome to the R&S VSE Analog Demodulation application
Understanding the Display Information
2. Select the "Analog Demodulation" item.
The R&S VSE opens a new measurement channel for the R&S VSE Analog
Demodulation application.
2.2 Understanding the Display Information
The following figure shows a measurement diagram during an Analog Demodulation
measurement. All different information areas are labeled. They are explained in more
detail in the following sections.
8User Manual 1176.8939.02 ─ 07
Page 9

R&S®VSE-K7
Welcome to the R&S VSE Analog Demodulation application
Understanding the Display Information
1 = Color coding for windows of same channel
2 = Channel bar with measurement settings
3 = Window title bar with diagram-specific (trace) information
4 = Diagram area
5 = Diagram footer with diagram-specific information, depending on result display
Channel bar information
In the R&S VSE Analog Demodulation application, the R&S VSE shows the following
settings:
Table 2-1: Information displayed in the channel bar in the Analog Demodulation application
Ref Level Reference level
m.+el.Att Mechanical and electronic RF attenuation
Offset Reference level offset
AQT Measurement time for data acquisition.
RBW Resolution bandwidth
DBW Demodulation bandwidth
Freq Center frequency for the RF signal
Window title bar information
For each diagram, the header provides the following information:
9User Manual 1176.8939.02 ─ 07
Page 10
R&S®VSE-K7
Welcome to the R&S VSE Analog Demodulation application
Understanding the Display Information
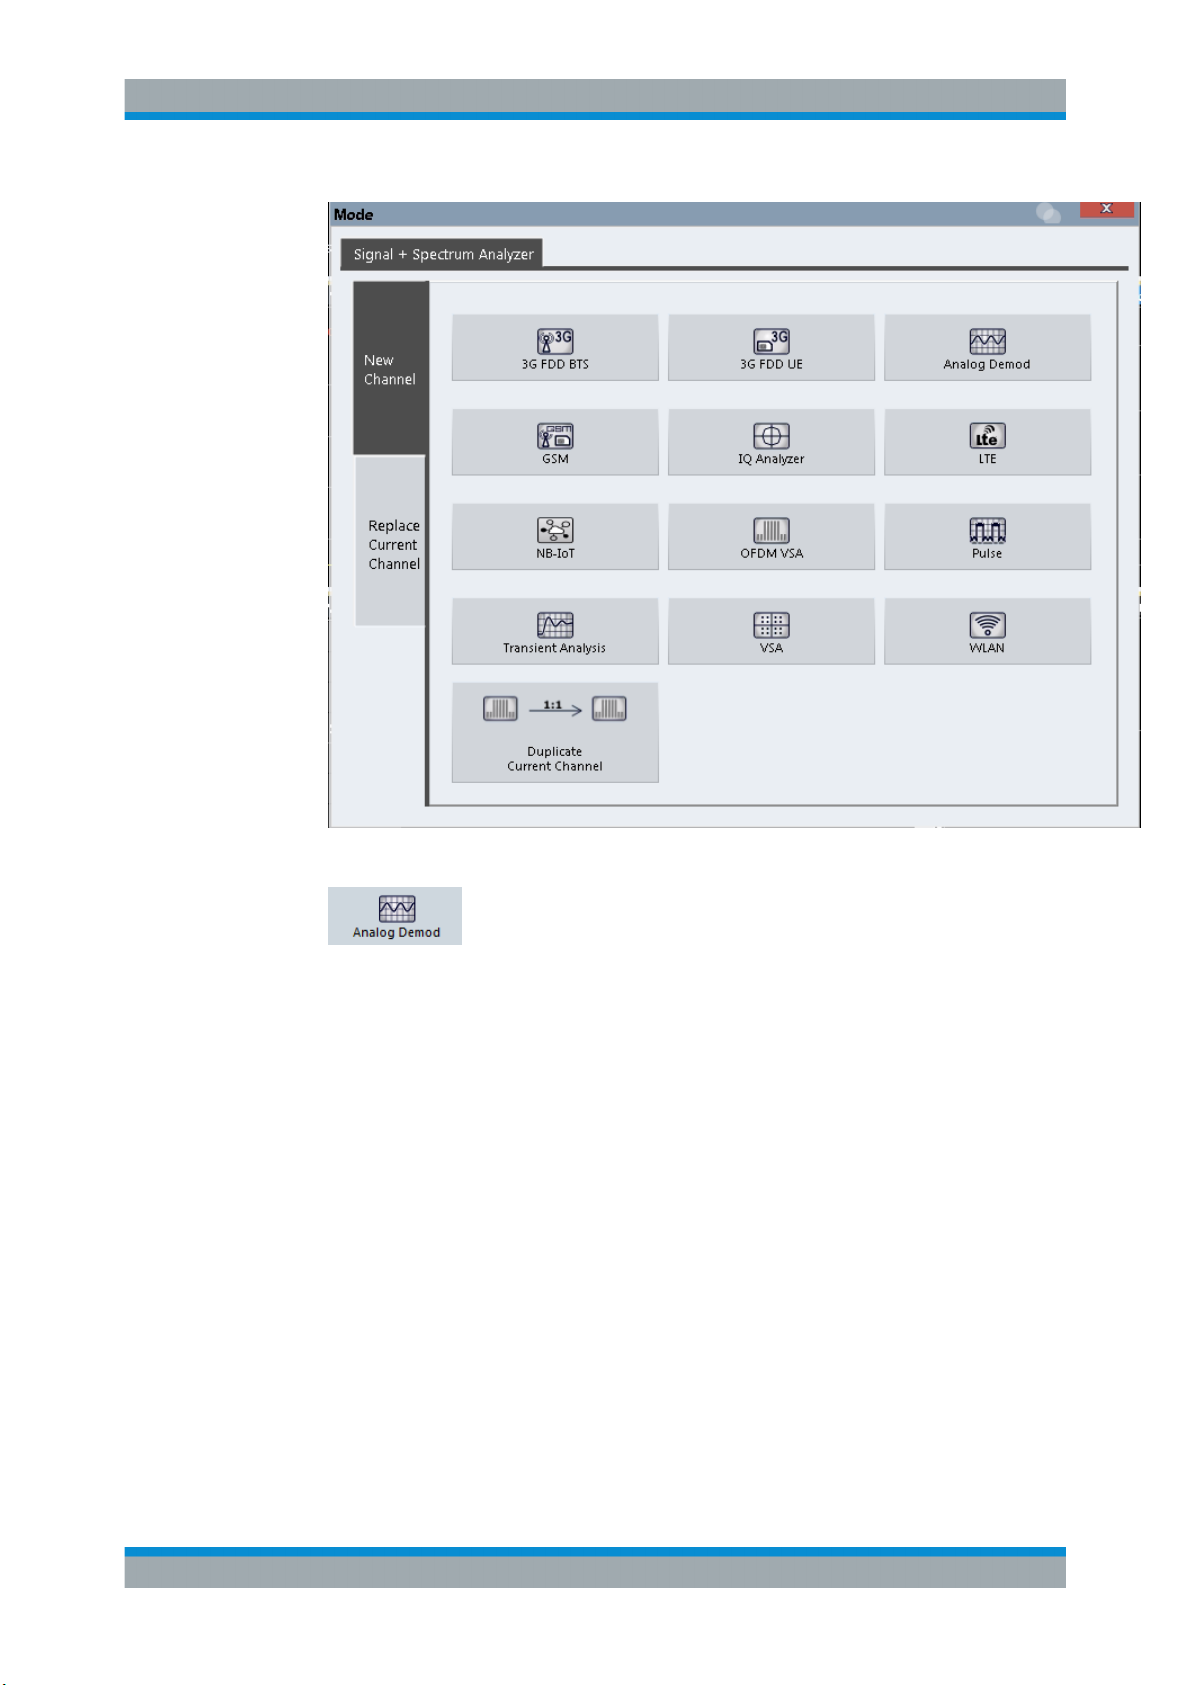
Figure 2-1: Window title bar information in the Analog Demodulation application
0 = Color coding for windows of same channel
1 = Edit result display function
2 = Channel name
3 = Window number
4 = Window type
5 = Trace color, trace number, detector type, trade mode
6 = AF coupling (AC/DC), only in AF time domains, if applicable
7 = Reference value (at the defined reference position)
8 = Dock/undock window function
9 = Close window function
Diagram footer information
The diagram footer (beneath the diagram) contains the following information, depending on the evaluation:
RF Spectrum
CF: Center frequency
of input signal
RF Time domain
CF: Center frequency
of input signal
AF Spectrum
AF CF: center frequency of demodulated signal
AF Time domain
CF: Center frequency
of input signal
Sweep points Span: measured span
Sweep points Time per division
Sweep points AF Span: evaluated span
Sweep points Time per division
For most modes, the number of sweep points shown in the display are indicated in the
diagram footer. In zoom mode, the (rounded) number of currently displayed points are
indicated.
10User Manual 1176.8939.02 ─ 07
Page 11
R&S®VSE-K7
Measurements and Result Displays
3 Measurements and Result Displays
Access: "Overview" > "Display Config"
Or: [MEAS] > "Display Config"
The data that was measured by the R&S VSE can be evaluated using various different
methods. In the Analog Demodulation application, up to six evaluation methods can be
displayed simultaneously in separate windows. The results can be displayed as absolute deviations or relative to a reference value or level.
The abbreviation "AF" (for Audio Frequency) refers to the demodulated AM, FM or PM
signal.
Result display windows
For each measurement, a separate channel is activated. Each channel can provide
multiple result displays, which are displayed in individual windows. The measurement
windows can be rearranged and configured in the R&S VSE to meet your requirements. All windows that belong to the same measurement (including the channel bar)
are indicated by a colored line at the top of the window title bar.
►
To add further result displays for the Analog Demodulation channel, select the
"Add Window" icon from the toolbar, or select the "Window" > "New Window" menu
item.
For details on working with channels and windows see the "Operating Basics"
chapter in the R&S VSE Base Software User Manual.
Basis for evaluation
All evaluations are based on the I/Q data set acquired during the measurement. The
spectrum of the modulated signal to be evaluated is determined by the demodulation
bandwidth. However, it can be restricted to a limited span ( "AF Span" ) if only part of
the signal is of interest. Furthermore, the time base for evaluations in the time domain
can be restricted to analyze a smaller extract in more detail, see Chapter 4.5, "Time
Domain Zoom", on page 23.
Spectrograms
Spectrograms are not configured as separate result displays, but as a subwindow of
any existing graphical result display window. They are activated and deactivated in the
"Spectrogram" tab of the "Traces" settings (see Chapter 6.3, "Spectrogram Settings",
on page 84).
AM Time Domain ..........................................................................................................12
FM Time Domain ..........................................................................................................12
PM Time Domain ..........................................................................................................13
AM Spectrum ............................................................................................................... 13
FM Spectrum ................................................................................................................14
11User Manual 1176.8939.02 ─ 07
Page 12
R&S®VSE-K7
Measurements and Result Displays
PM Spectrum ............................................................................................................... 15
RF Time Domain ..........................................................................................................15
RF Spectrum ................................................................................................................16
Result Summary ...........................................................................................................17
Marker Table ................................................................................................................ 18
Marker Peak List .......................................................................................................... 19
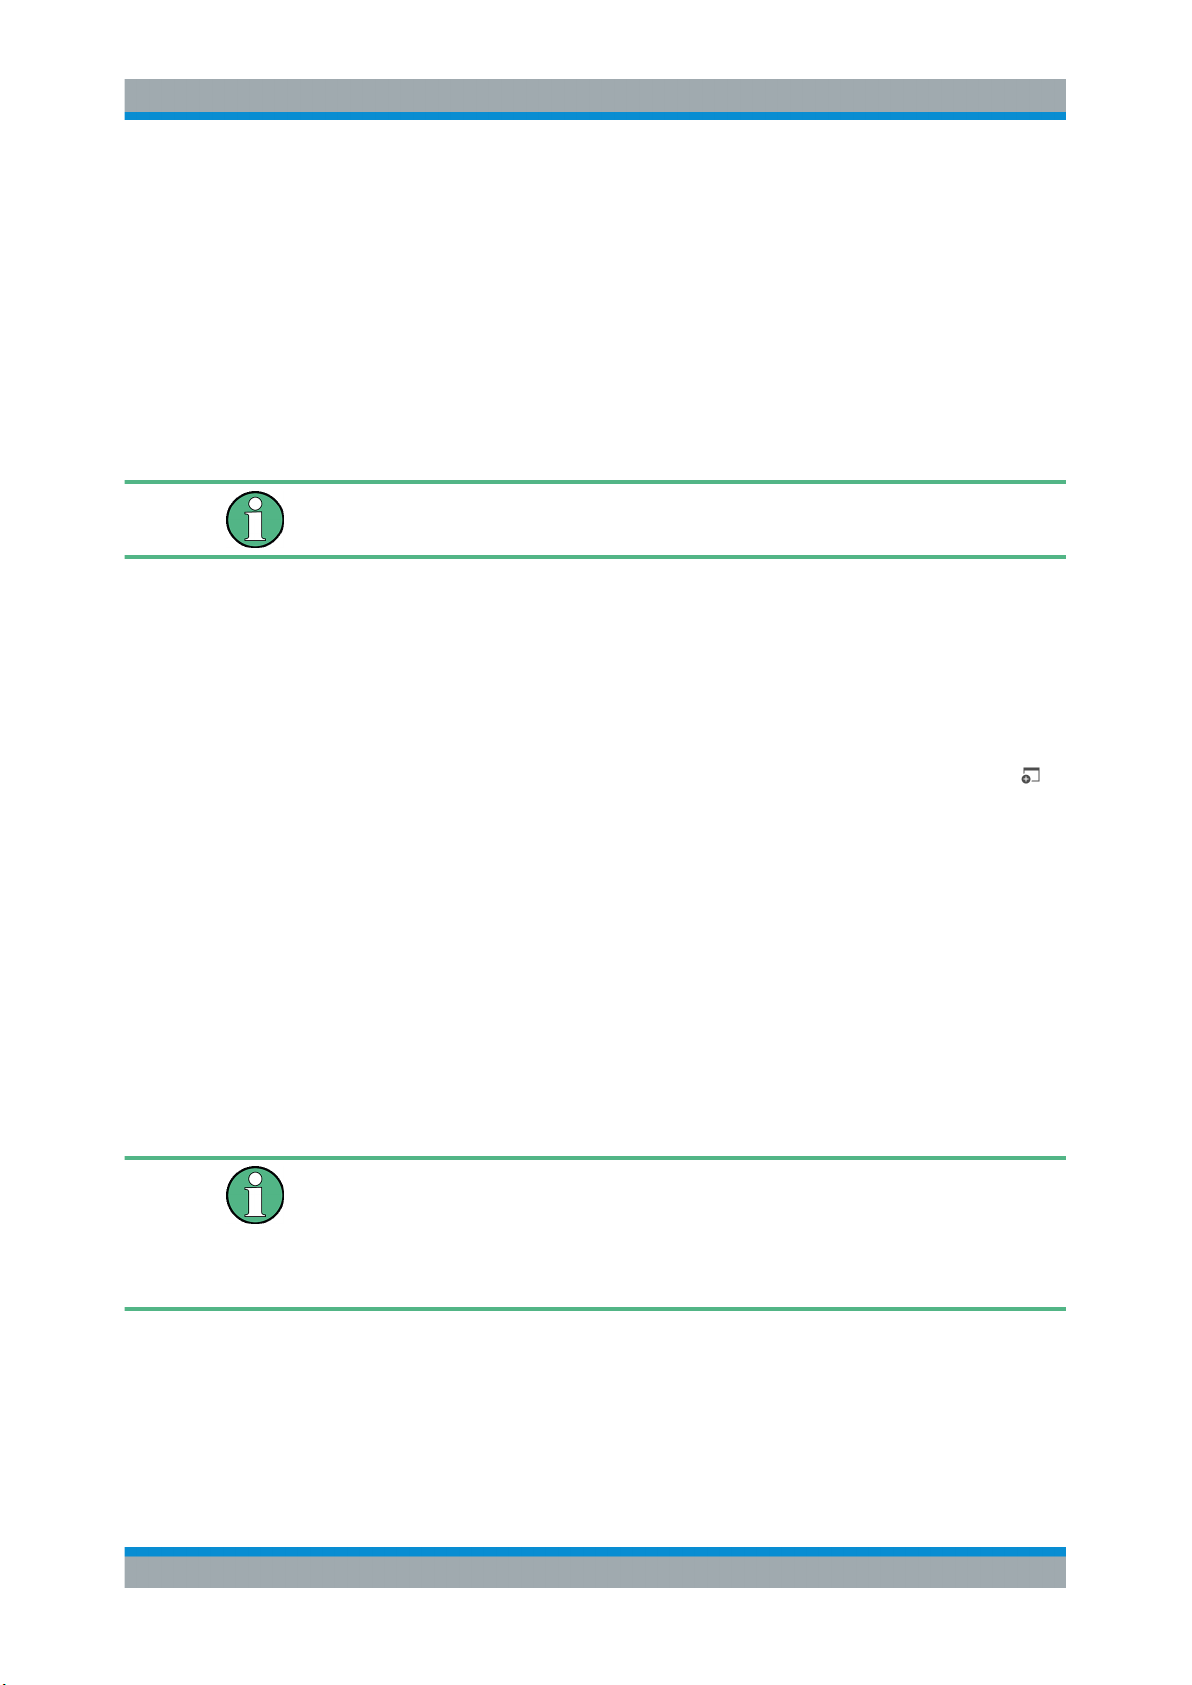
AM Time Domain
Displays the modulation depth of the demodulated AM signal (in %) versus time.
Remote command:
LAY:ADD? '1',RIGH,'XTIM:AM:REL'
(See LAYout:ADD[:WINDow]? on page 206)
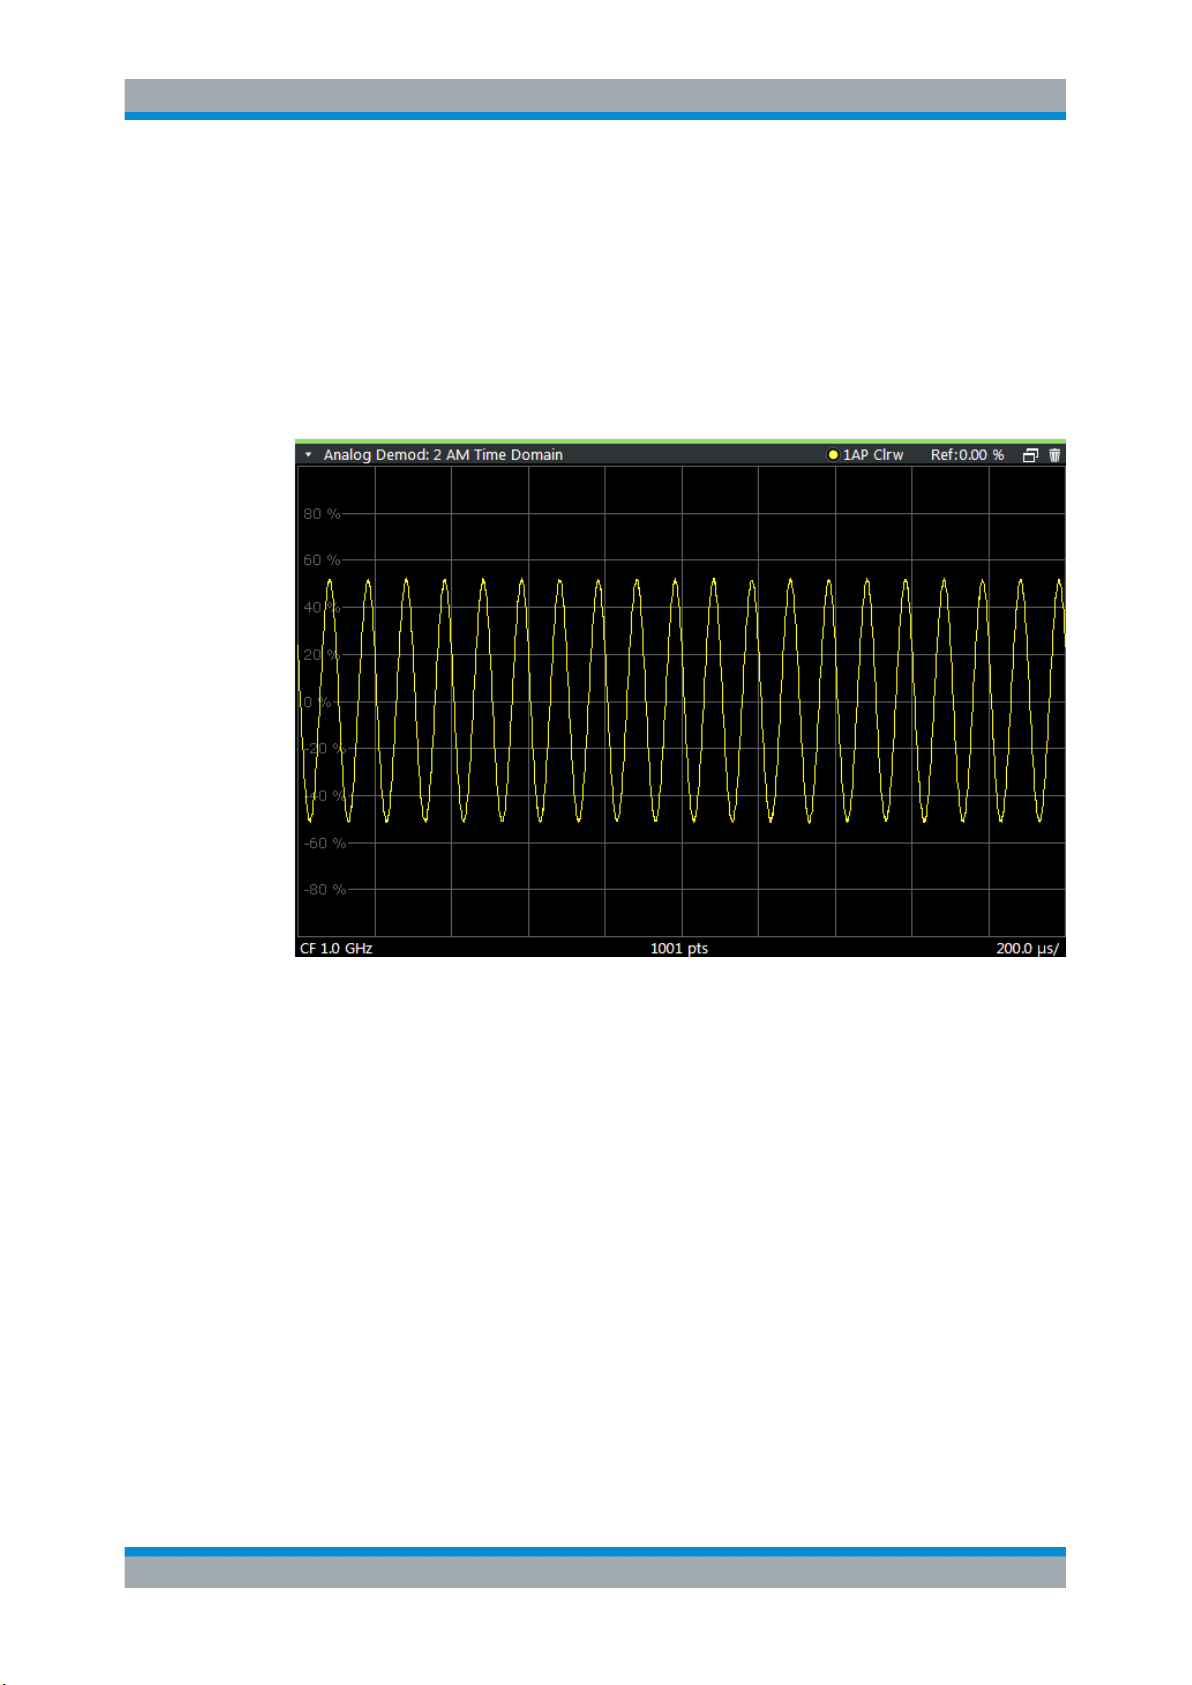
FM Time Domain
Displays the frequency spectrum of the demodulated FM signal versus time.
12User Manual 1176.8939.02 ─ 07
Page 13
R&S®VSE-K7
Measurements and Result Displays
Remote command:
LAY:ADD? '1',RIGH,'XTIM:FM'
(See LAYout:ADD[:WINDow]? on page 206)
PM Time Domain
Displays the phase deviations of the demodulated PM signal (in rad or °) versus time.
Remote command:
LAY:ADD? '1',RIGH,'XTIM:PM'
(See LAYout:ADD[:WINDow]? on page 206)
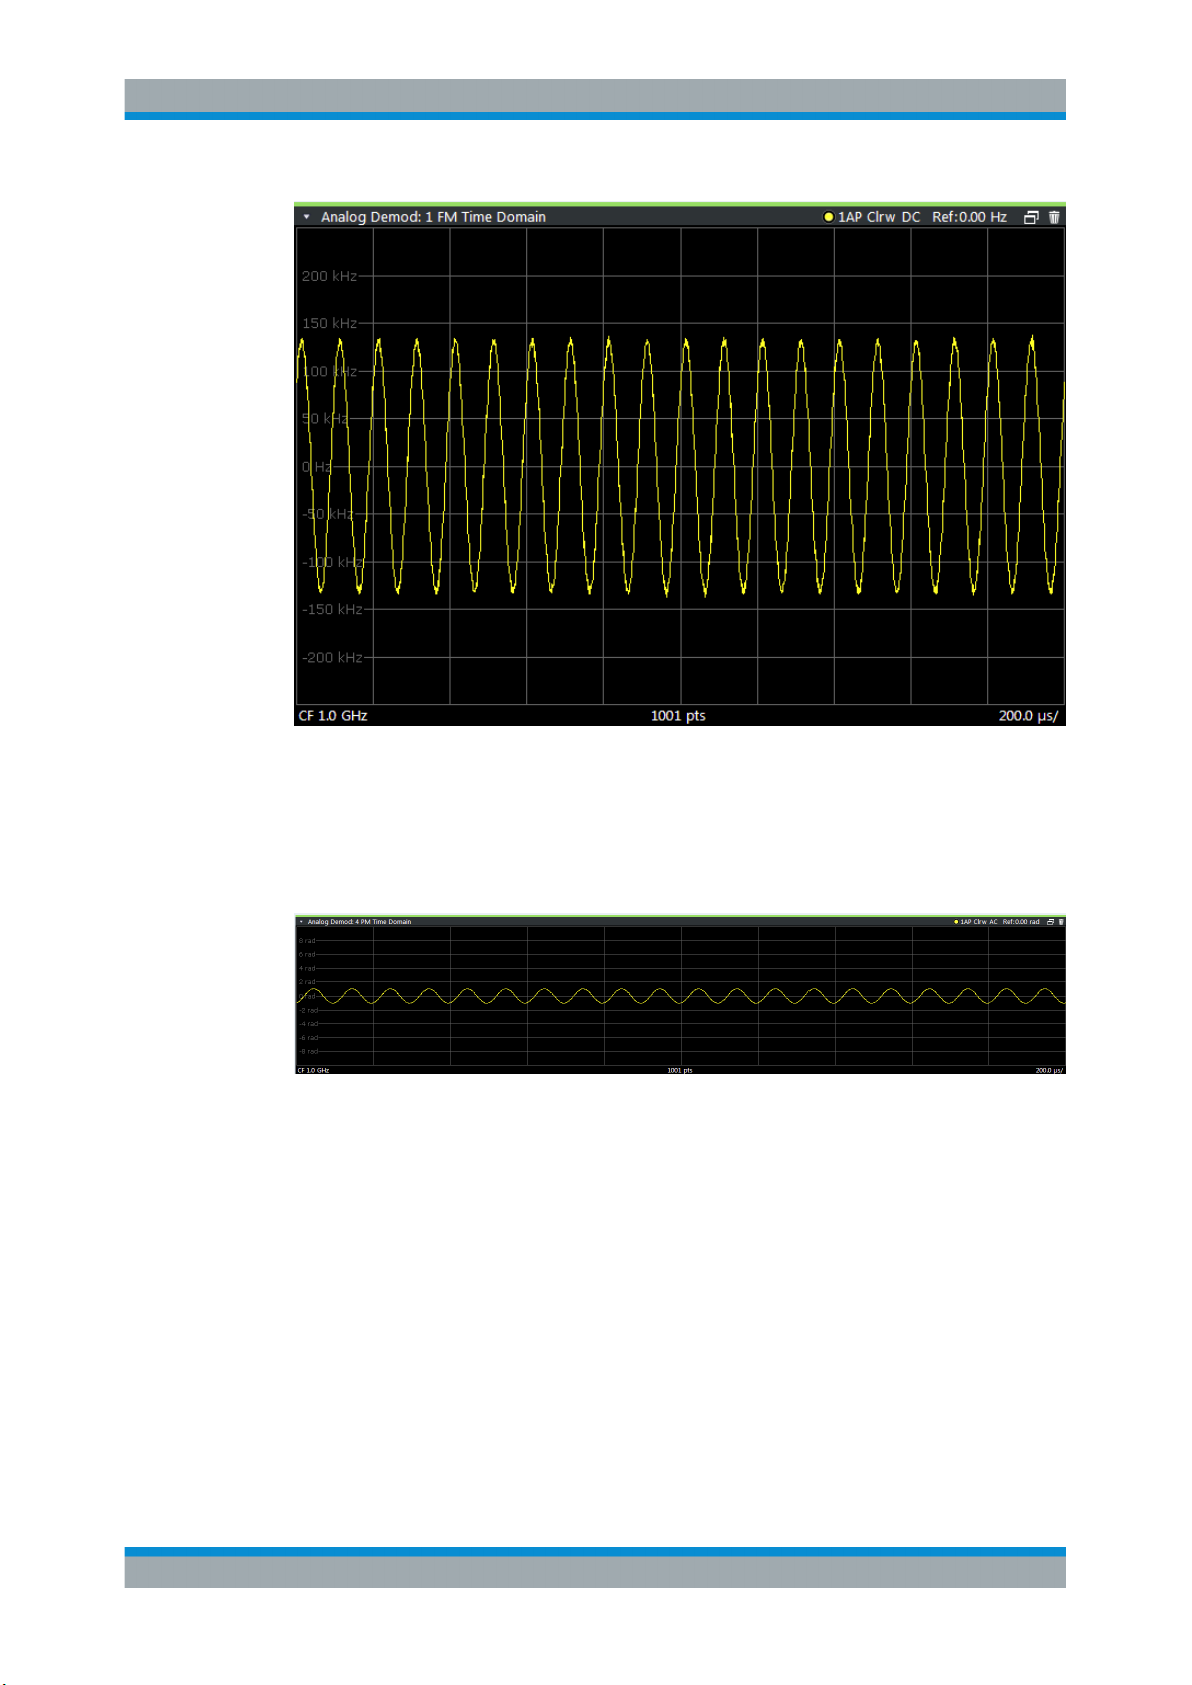
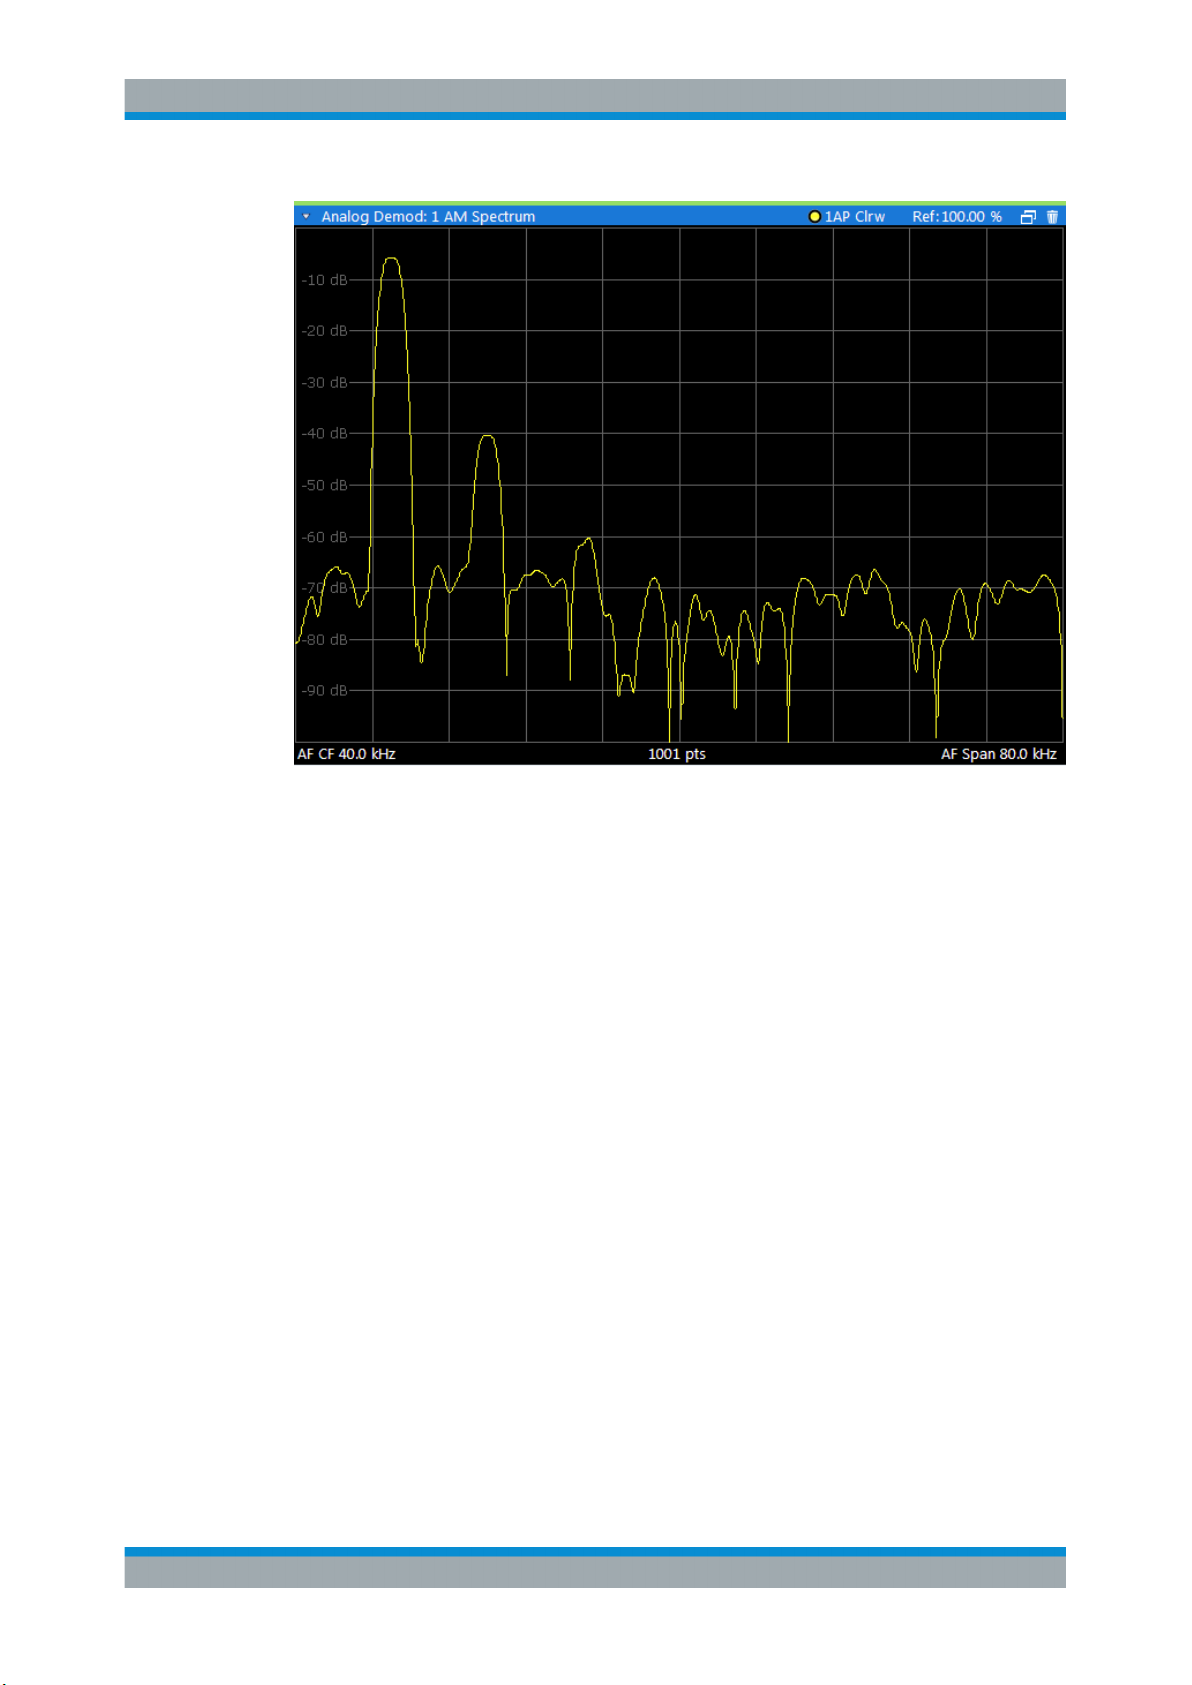
AM Spectrum
Displays the modulation depth of the demodulated AM signal (in % or dB) versus AF
span. The spectrum is calculated from the demodulated AM signal in the time domain
via FFT.
13User Manual 1176.8939.02 ─ 07
Page 14
R&S®VSE-K7
Measurements and Result Displays
Remote command:
LAY:ADD? '1',RIGH,'XTIMe:AM:REL:AFSPectrum1'
(see LAYout:ADD[:WINDow]? on page 206)
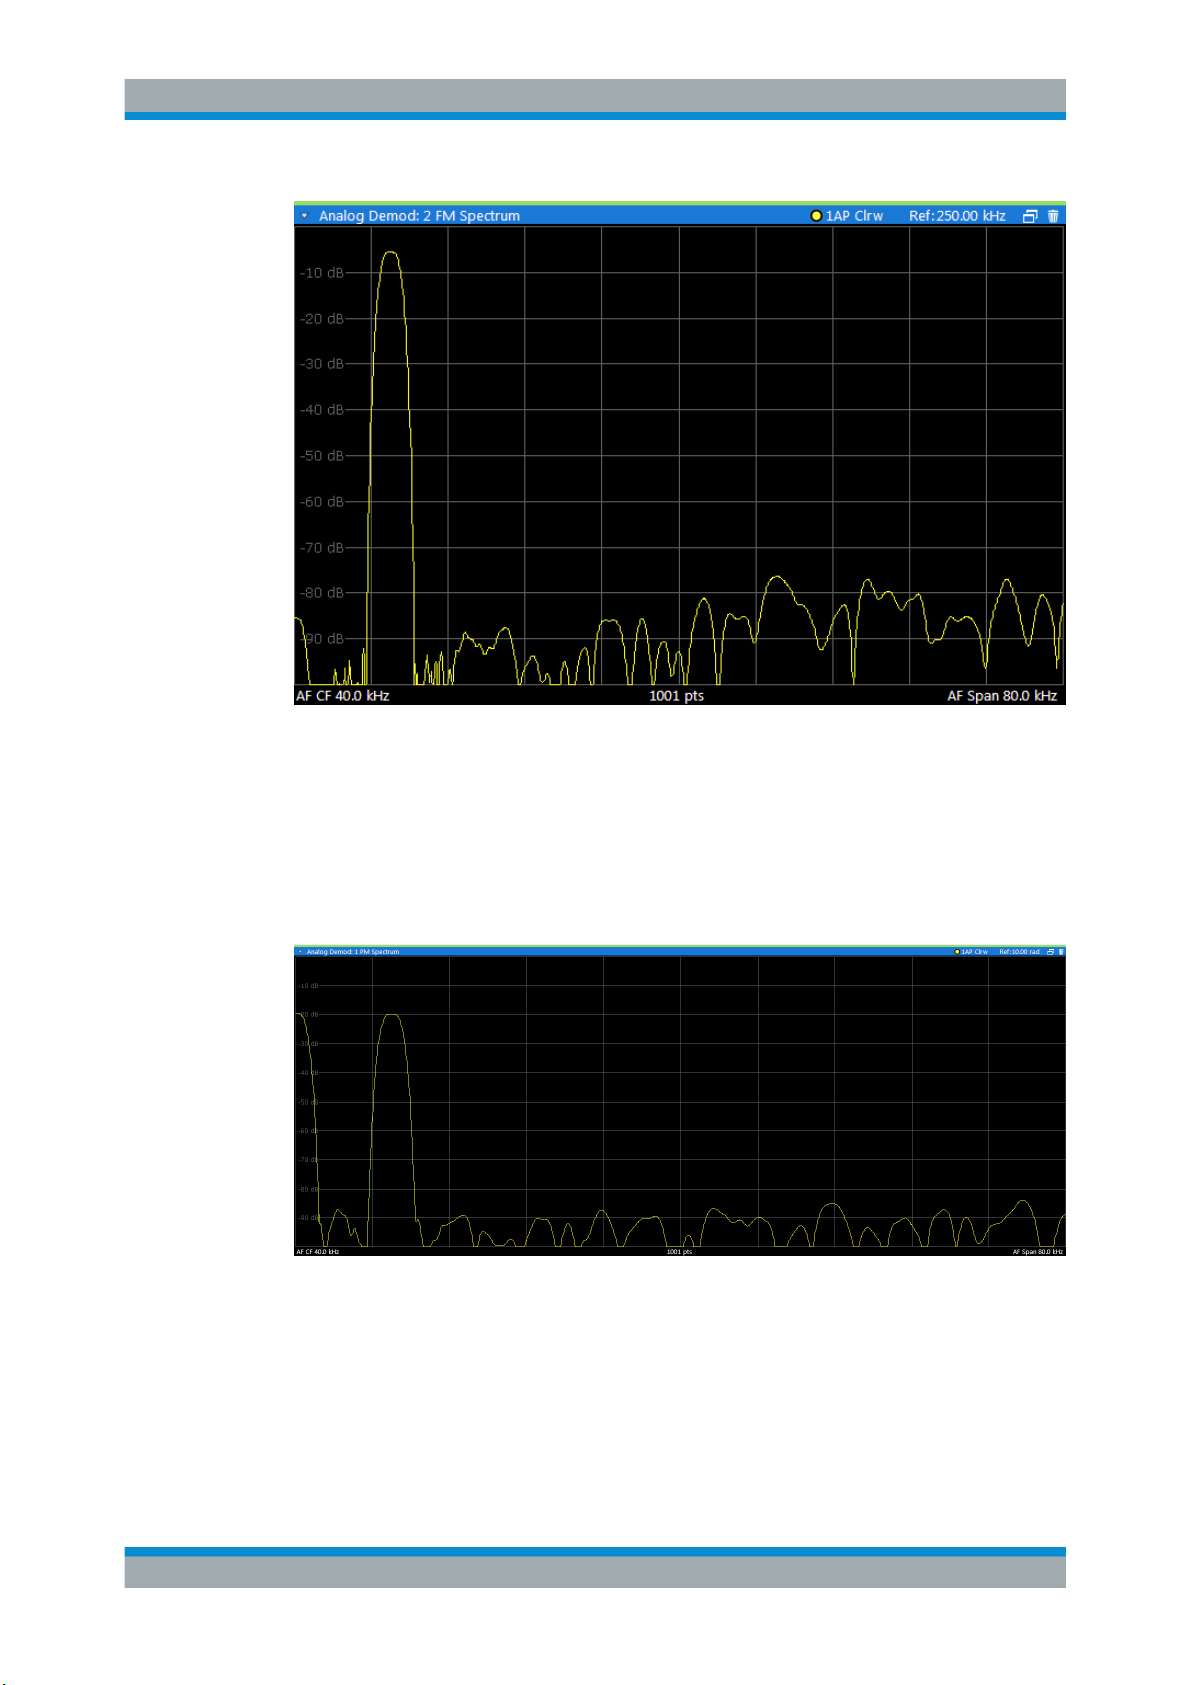
FM Spectrum
Displays the frequency deviations of the demodulated FM signal (in Hz or dB) versus
AF span. The spectrum is calculated from the demodulated AM signal in the time
domain via FFT.
14User Manual 1176.8939.02 ─ 07
Page 15
R&S®VSE-K7
Measurements and Result Displays
Remote command:
LAY:ADD? '1',RIGH,'XTIMe:FM:AFSPectrum1'
(see LAYout:ADD[:WINDow]? on page 206)
PM Spectrum
Displays the phase deviations of the demodulated PM signal (in rad, ° or dB) versus
AF span. The spectrum is calculated from the demodulated AM signal in the time
domain via FFT.
Remote command:
LAY:ADD? '1',RIGH,'XTIMe:PM:AFSPectrum1'
(see LAYout:ADD[:WINDow]? on page 206)
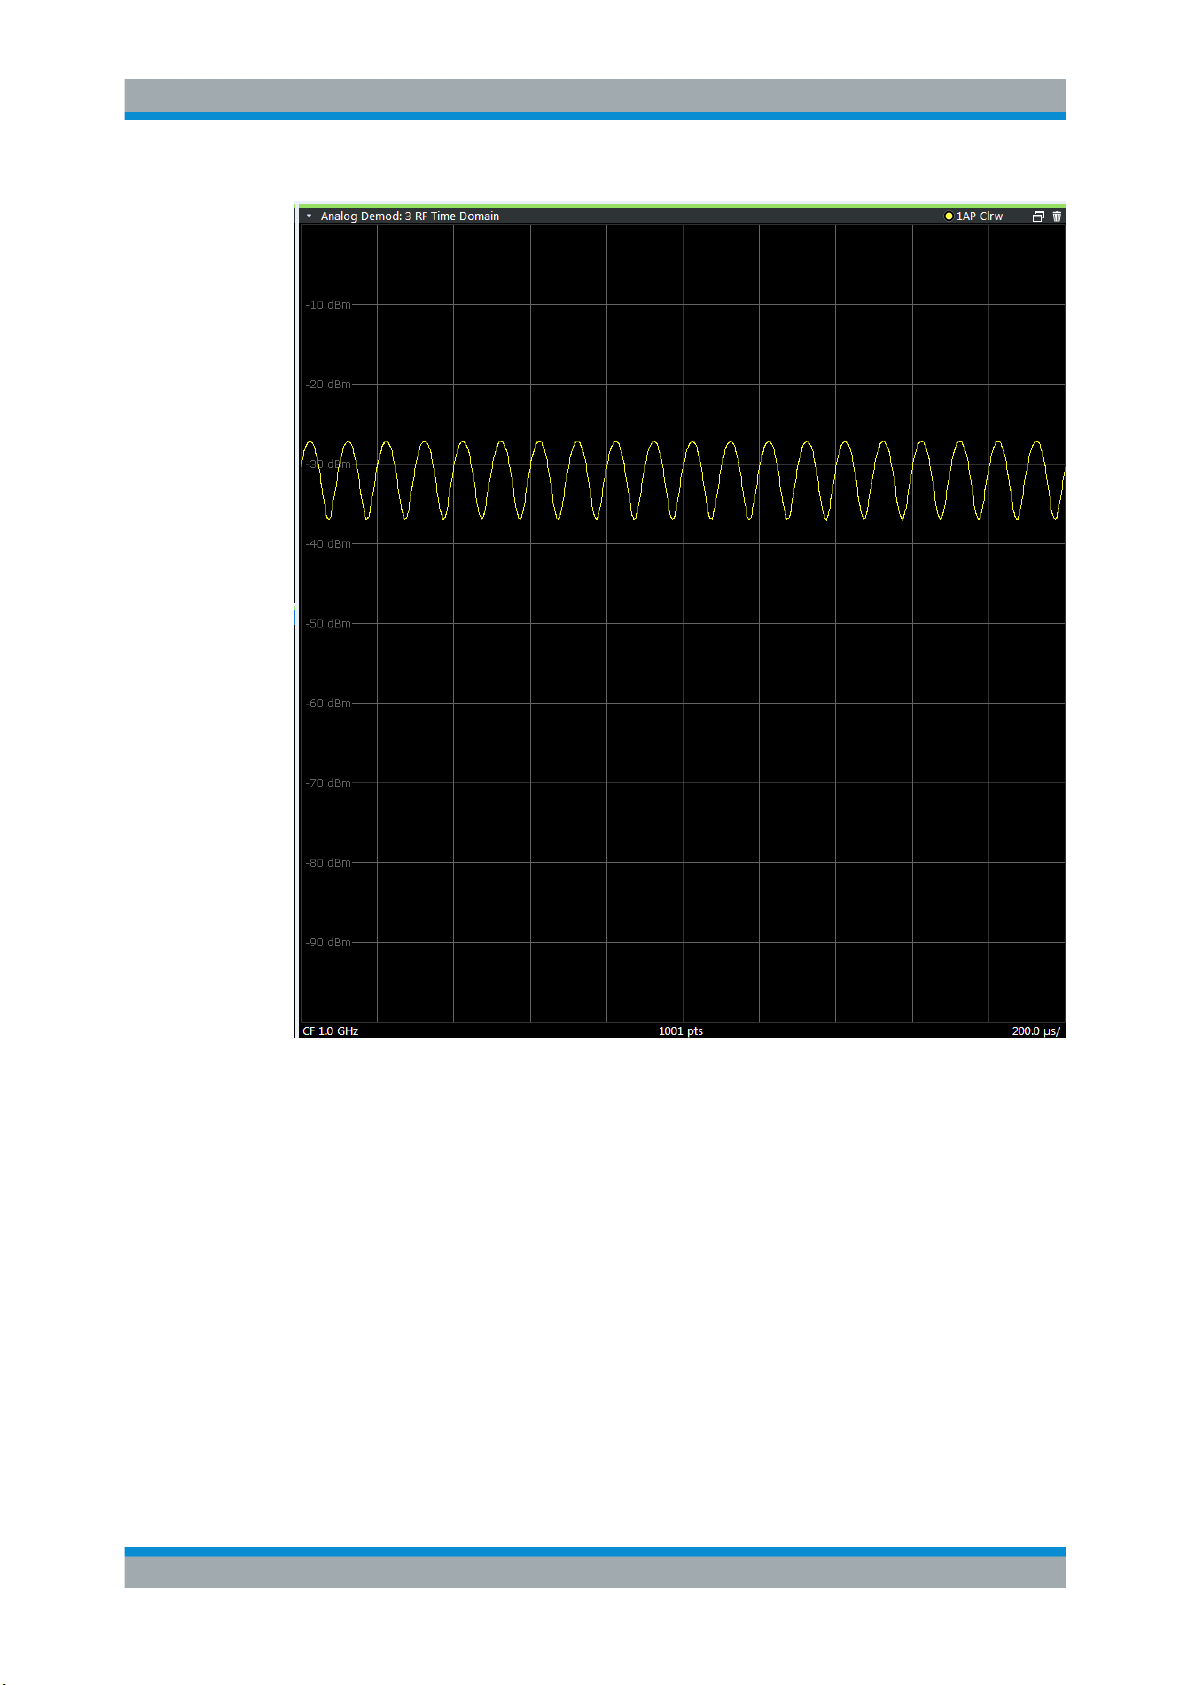
RF Time Domain
Displays the RF power of the input signal versus time. The level values represent the
magnitude of the I/Q data set.
15User Manual 1176.8939.02 ─ 07
Page 16
R&S®VSE-K7
Measurements and Result Displays
Remote command:
LAY:ADD? '1',RIGH,'XTIM:AM'
(see LAYout:ADD[:WINDow]? on page 206)
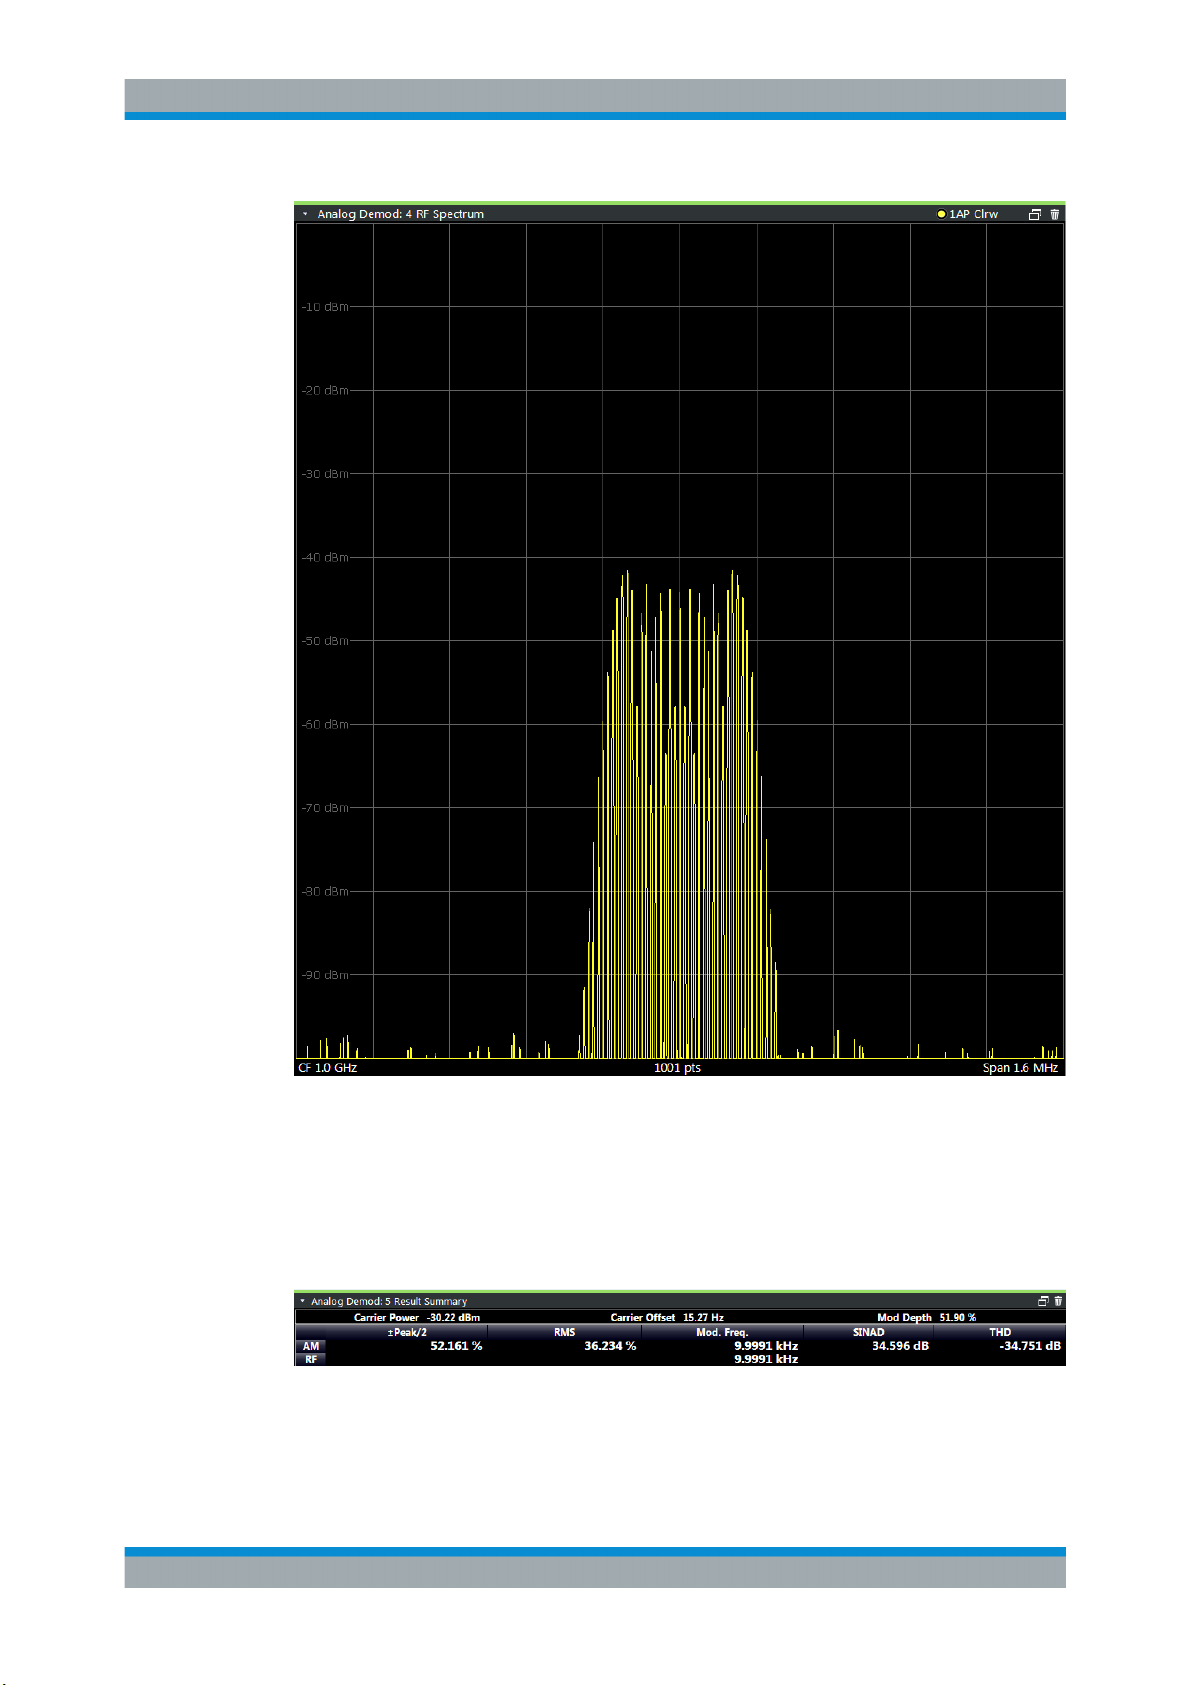
RF Spectrum
Displays the spectrum of the input signal. In contrast to the Spectrum application, the
frequency values are determined using FFT from the recorded I/Q data set.
16User Manual 1176.8939.02 ─ 07
Page 17
R&S®VSE-K7
Measurements and Result Displays
Remote command:
LAY:ADD? '1',RIGH,'XTIM:SPECTRUM'
(see LAYout:ADD[:WINDow]? on page 206)
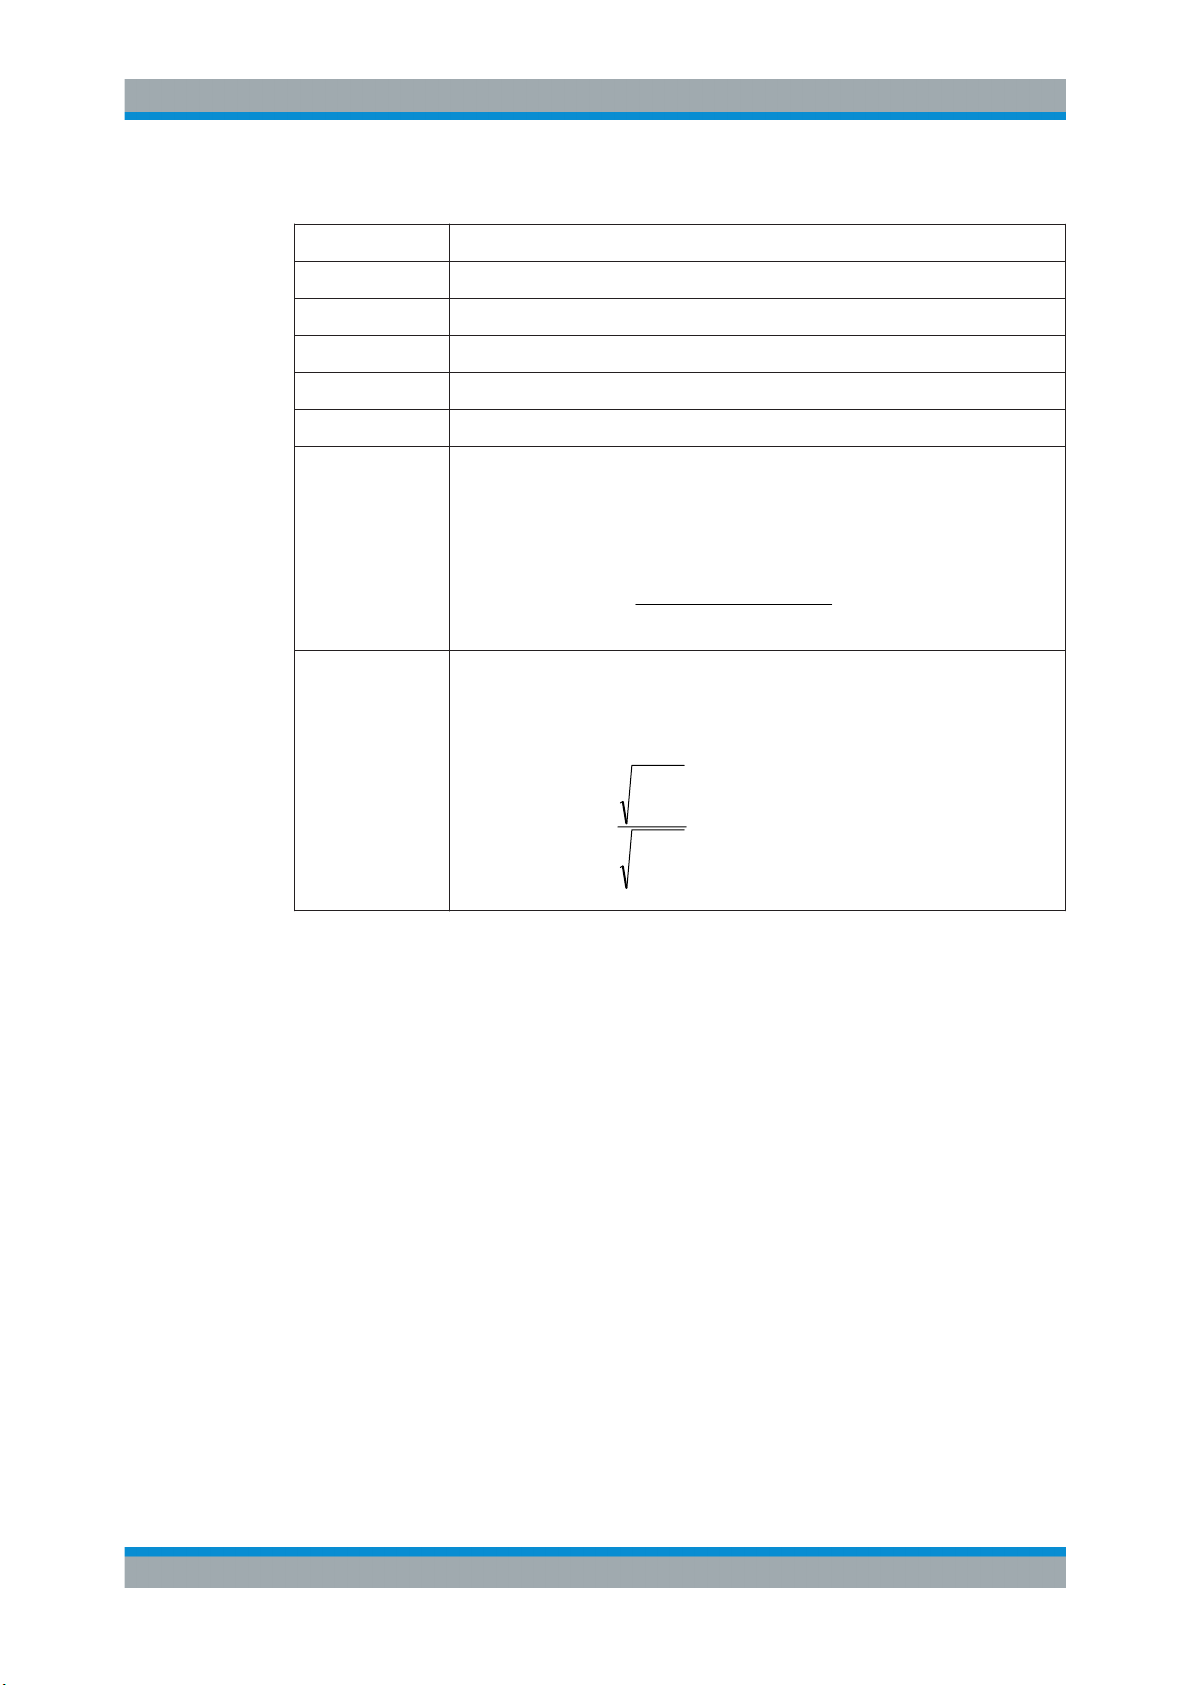
Result Summary
The result summary displays the results of the demodulation functions for all windows
in a table.
For each demodulation, the following information is provided:
17User Manual 1176.8939.02 ─ 07
Page 18
R&S®VSE-K7
power distortion noise
power total
log20dBSINAD
1
2
2
2
log20
i
i
i
i
U
U
dBTHD
Measurements and Result Displays
Table 3-1: Result summary description
Label Description
+Peak Positive peak (maximum)
-Peak Negative peak (minimum)
+/-Peak/2 Average of positive and negative peaks
RMS Root Mean Square value
Mod Freq Modulation frequency
SINAD Signal-to-noise-and-distortion
(Calculated only if AF Spectrum is displayed)
Measures the ratio of the total power to the power of noise and harmonic distortions.
The noise and harmonic power is calculated inside the AF spectrum span. The DC
offset is removed before the calculation.
THD Total harmonic distortion
The ratio of the harmonics to the fundamental and harmonics. All harmonics inside
the AF spectrum span are considered up to the tenth harmonic.
(Calculated only if AF Spectrum is displayed)
Note: Relative demodulation results. Optionally, the demodulation results in relation to
user-defined or measured reference values are determined. See Chapter 5.6.6, "Result
Table Settings", on page 72.
In addition, the following general information for the input signal is provided:
●
Carrier Power: the power of the carrier without modulation
●
Carrier Offset: the deviation of the calculated carrier frequency to the ideal carrier
frequency
●
Modulation Depth (AM or RF Time Domain only): the difference in amplitude the
carrier signal is modulated with
Remote command:
LAY:ADD? '1',RIGH,RSUM, see LAYout:ADD[:WINDow]? on page 206
Results:
CALCulate<n>:MARKer<m>:FUNCtion:ADEMod:PM[:RESult<t>]? on page 219
CALCulate<n>:MARKer<m>:FUNCtion:ADEMod:PM[:RESult<t>]:RELative?
on page 220
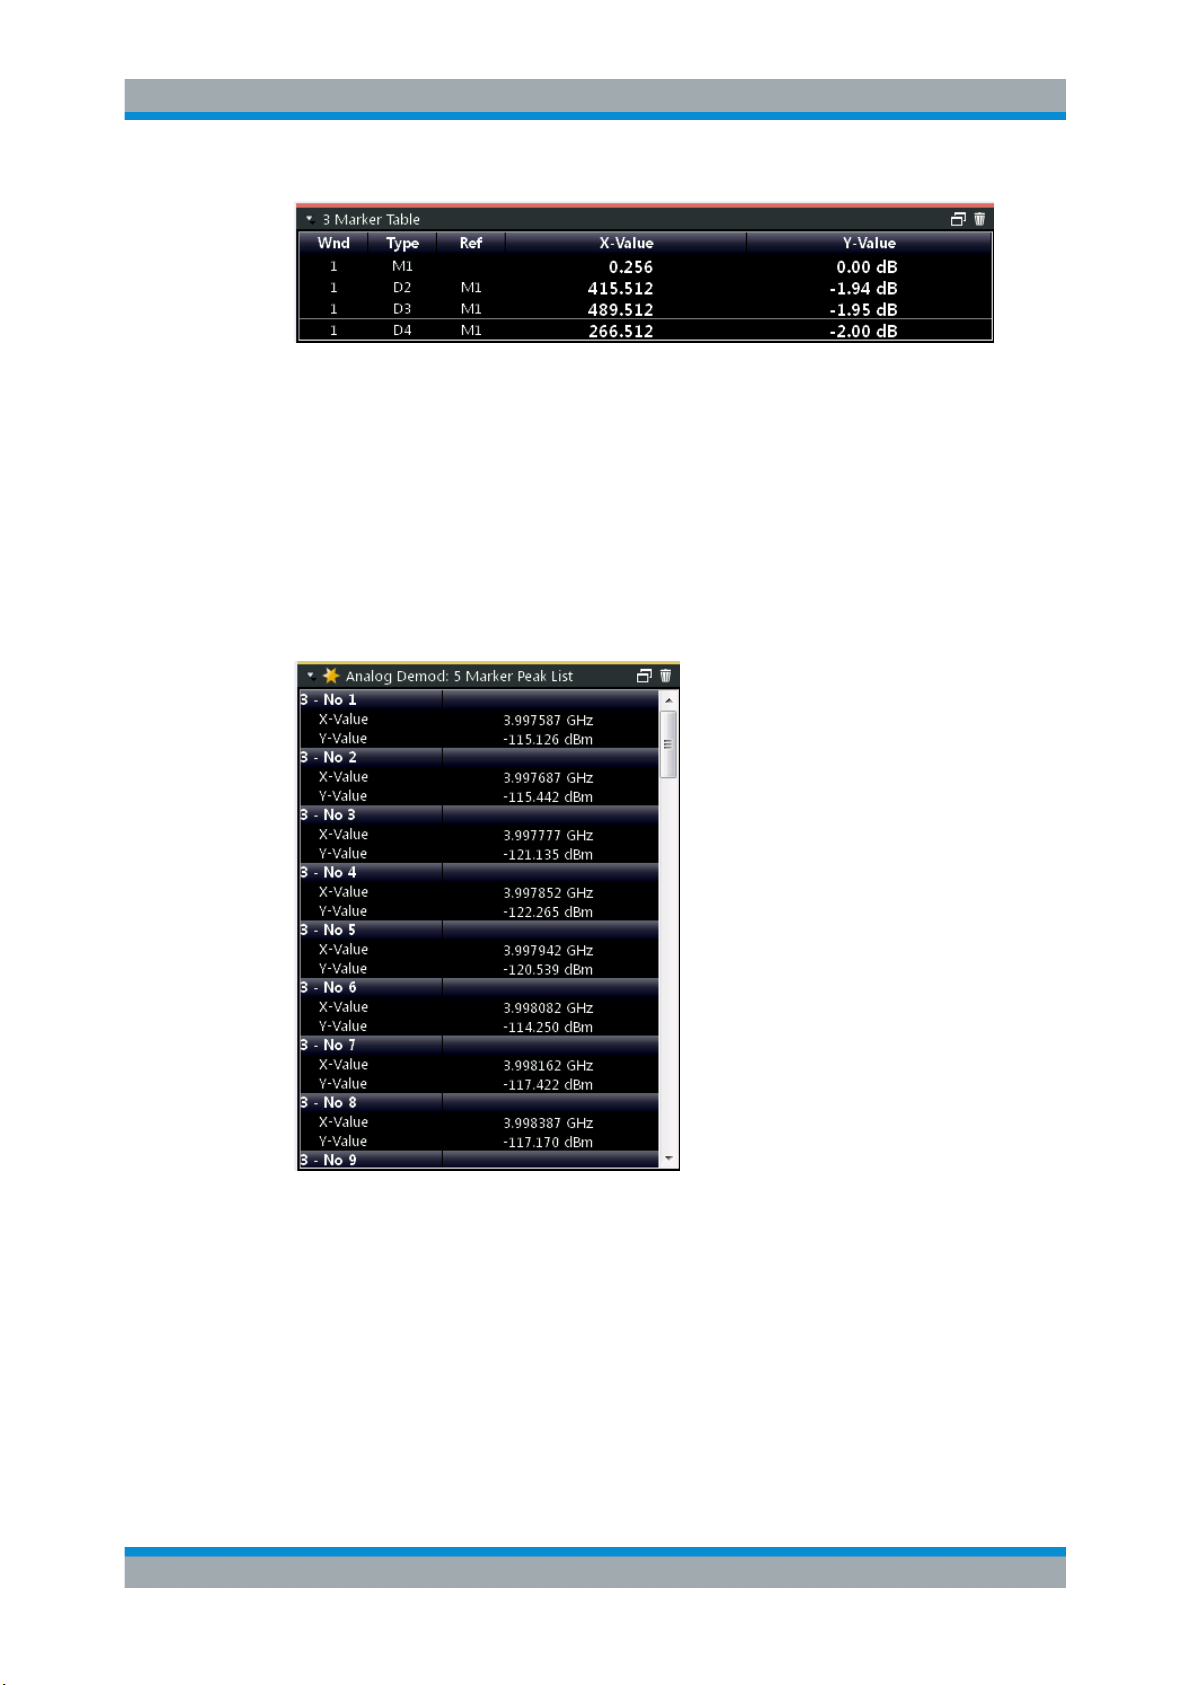
Marker Table
Displays a table with the current marker values for the active markers.
This table is displayed automatically if configured accordingly (see " Marker Table Dis-
play " on page 92).
18User Manual 1176.8939.02 ─ 07
Page 19
R&S®VSE-K7
Measurements and Result Displays
Remote command:
LAY:ADD? '1',RIGH, MTAB, see LAYout:ADD[:WINDow]? on page 206
Results:
CALCulate<n>:MARKer<m>:X on page 225
CALCulate<n>:MARKer<m>:Y? on page 225
Marker Peak List
The marker peak list determines the frequencies and levels of peaks in the spectrum or
time domain. How many peaks are displayed can be defined, as well as the sort order.
In addition, the detected peaks can be indicated in the diagram. The peak list can also
be exported to a file for analysis in an external application.
Remote command:
LAY:ADD? '1',RIGH, PEAK, see LAYout:ADD[:WINDow]? on page 206
Results:
CALCulate<n>:MARKer<m>:X on page 225
CALCulate<n>:MARKer<m>:Y? on page 225
19User Manual 1176.8939.02 ─ 07
Page 20

R&S®VSE-K7
4.1 Demodulation Process
Measurement Basics
Demodulation Process
4 Measurement Basics
Some background knowledge on basic terms and principles used in Analog Demodulation measurements is provided here for a better understanding of the required configuration settings.
● Demodulation Process............................................................................................20
● Demodulation Bandwidth........................................................................................ 22
● Sample Rate and Demodulation Bandwidth........................................................... 22
● AF Filters.................................................................................................................23
● Time Domain Zoom.................................................................................................23
● Working with Spectrograms.................................................................................... 25
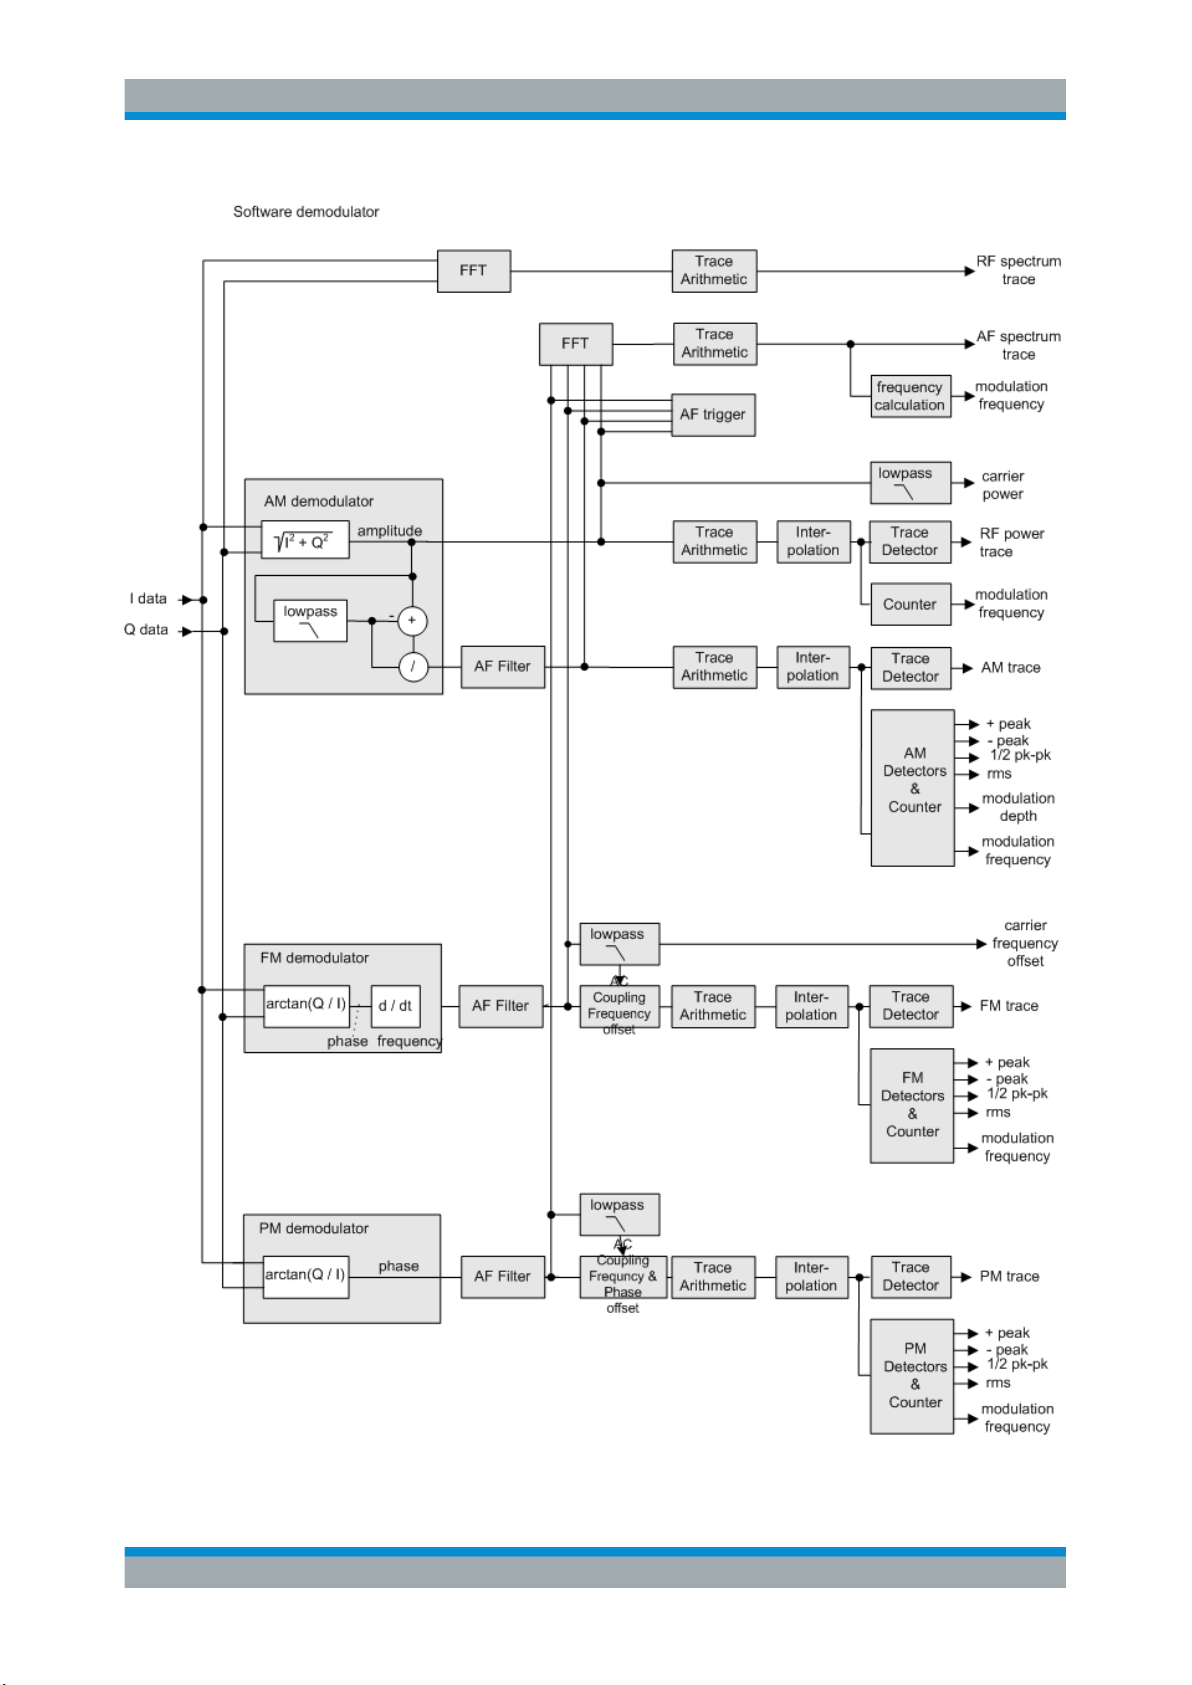
The demodulation process is shown in Figure 4-1. All calculations are performed simultaneously with the same I/Q data set. Magnitude (= amplitude) and phase of the complex I/Q pairs are determined. The frequency result is obtained from the differential
phase.
For details on general I/Q data processing in the R&S VSE, refer to the reference part
of the I/Q Analysis remote control description in the R&S VSE User Manual.
20User Manual 1176.8939.02 ─ 07
Page 21
R&S®VSE-K7
Measurement Basics
Demodulation Process
Figure 4-1: Block diagram of software demodulator
21User Manual 1176.8939.02 ─ 07
Page 22
R&S®VSE-K7
Measurement Basics
Sample Rate and Demodulation Bandwidth
The AM DC, FM DC and PM DC raw data of the demodulators is fed into the "Trace
Arithmetic" block that combines consecutive data sets. Possible trace modes are:
Clear Write, Max Hold, Min Hold and Average. The output data of the "Trace Arithmetic" block can be read via remote control ([SENS:]ADEM:<evaluation>:RES?,
see [SENSe:]ADEMod<n>:AM[:ABSolute][:TDOMain]:RESult? on page 213.
The collected measured values are evaluated by the selected detector. The result is
displayed on the screen and can be read out via remote control.
In addition, important parameters are calculated:
●
A counter determines the modulation frequency for AM, FM, and PM.
●
average power = carrier power (RF power)
●
average frequency = carrier frequency offset (FM)
●
The modulation depth or the frequency or phase deviation; the deviations are
determined from the trace data
AC coupling is possible with FM and PM display.
4.2 Demodulation Bandwidth
The demodulation bandwidth determines the span of the signal that is demodulated. It
is not the 3 dB bandwidth of the filter but the useful bandwidth which is distortion-free
with regard to phase and amplitude.
Therefore the following formulas apply:
●
AM: demodulation bandwidth ≥ 2 x modulation frequency
●
FM: demodulation bandwidth ≥ 2 x (frequency deviation + modulation frequency)
●
PM: demodulation bandwidth ≥ 2 x modulation frequency x (1 + phase deviation)
If the center frequency of the analyzer is not set exactly to the signal frequency, the
demodulation bandwidth must be increased by the carrier offset, in addition to the
requirement described above. This also applies if FM or PM AC coupling has been
selected.
In general, the demodulation bandwidth should be as narrow as possible to improve
the S/N ratio. The residual FM caused by noise floor and phase noise increases dramatically with the bandwidth, especially with FM.
For help on determining the adequate demodulation bandwidth see "Determining the
demodulation bandwidth" on page 124.
4.3 Sample Rate and Demodulation Bandwidth
The maximum demodulation bandwidths that can be obtained during the measurement, depending on the sample rate, are listed in the tables below for different demod-
22User Manual 1176.8939.02 ─ 07
Page 23
R&S®VSE-K7
Measurement Basics
Time Domain Zoom
ulation filter types. The allowed value range of the measurement time and trigger offset
depends on the selected demodulation bandwidth and demodulation filter. If the AF filter or the AF trigger are not active, the measurement time increases by 20 %.
A maximum of 24 million samples can be captured, assuming sufficient memory is
available; thus the maximum measurement time can be determined according to the
following formula:
Meas.time
The minimum trigger offset is (-Meas.time
Large numbers of samples
Principally, the R&S VSE can handle up to 24 million samples. However, when 480001
samples are exceeded, all traces that are not currently being displayed in a window are
deactivated to improve performance. The traces can only be activated again when the
samples are reduced.
= Sample count
max
/ sample rate
max
max
)
Effects of measurement time on the stability of measurement results
Despite amplitude and frequency modulation, the display of carrier power and carrier
frequency offset is stable.
This is achieved by a digital filter which sufficiently suppresses the modulation, provided, however, that the measurement time is ≥ 3 x 1 / modulation frequency, i.e. that at
least three periods of the AF signal are recorded.
The mean carrier power for calculating the AM is also calculated with a digital filter that
returns stable results after a measurement time of ≥ 3 x 1 / modulation frequency, i.e.
at least three cycles of the AF signal must be recorded before a stable AM can be
shown.
4.4 AF Filters
Additional filters applied after demodulation help filter out unwanted signals, or correct
pre-emphasized input signals. A CCITT filter allows you to evaluate the signal by simulating the characteristics of human hearing.
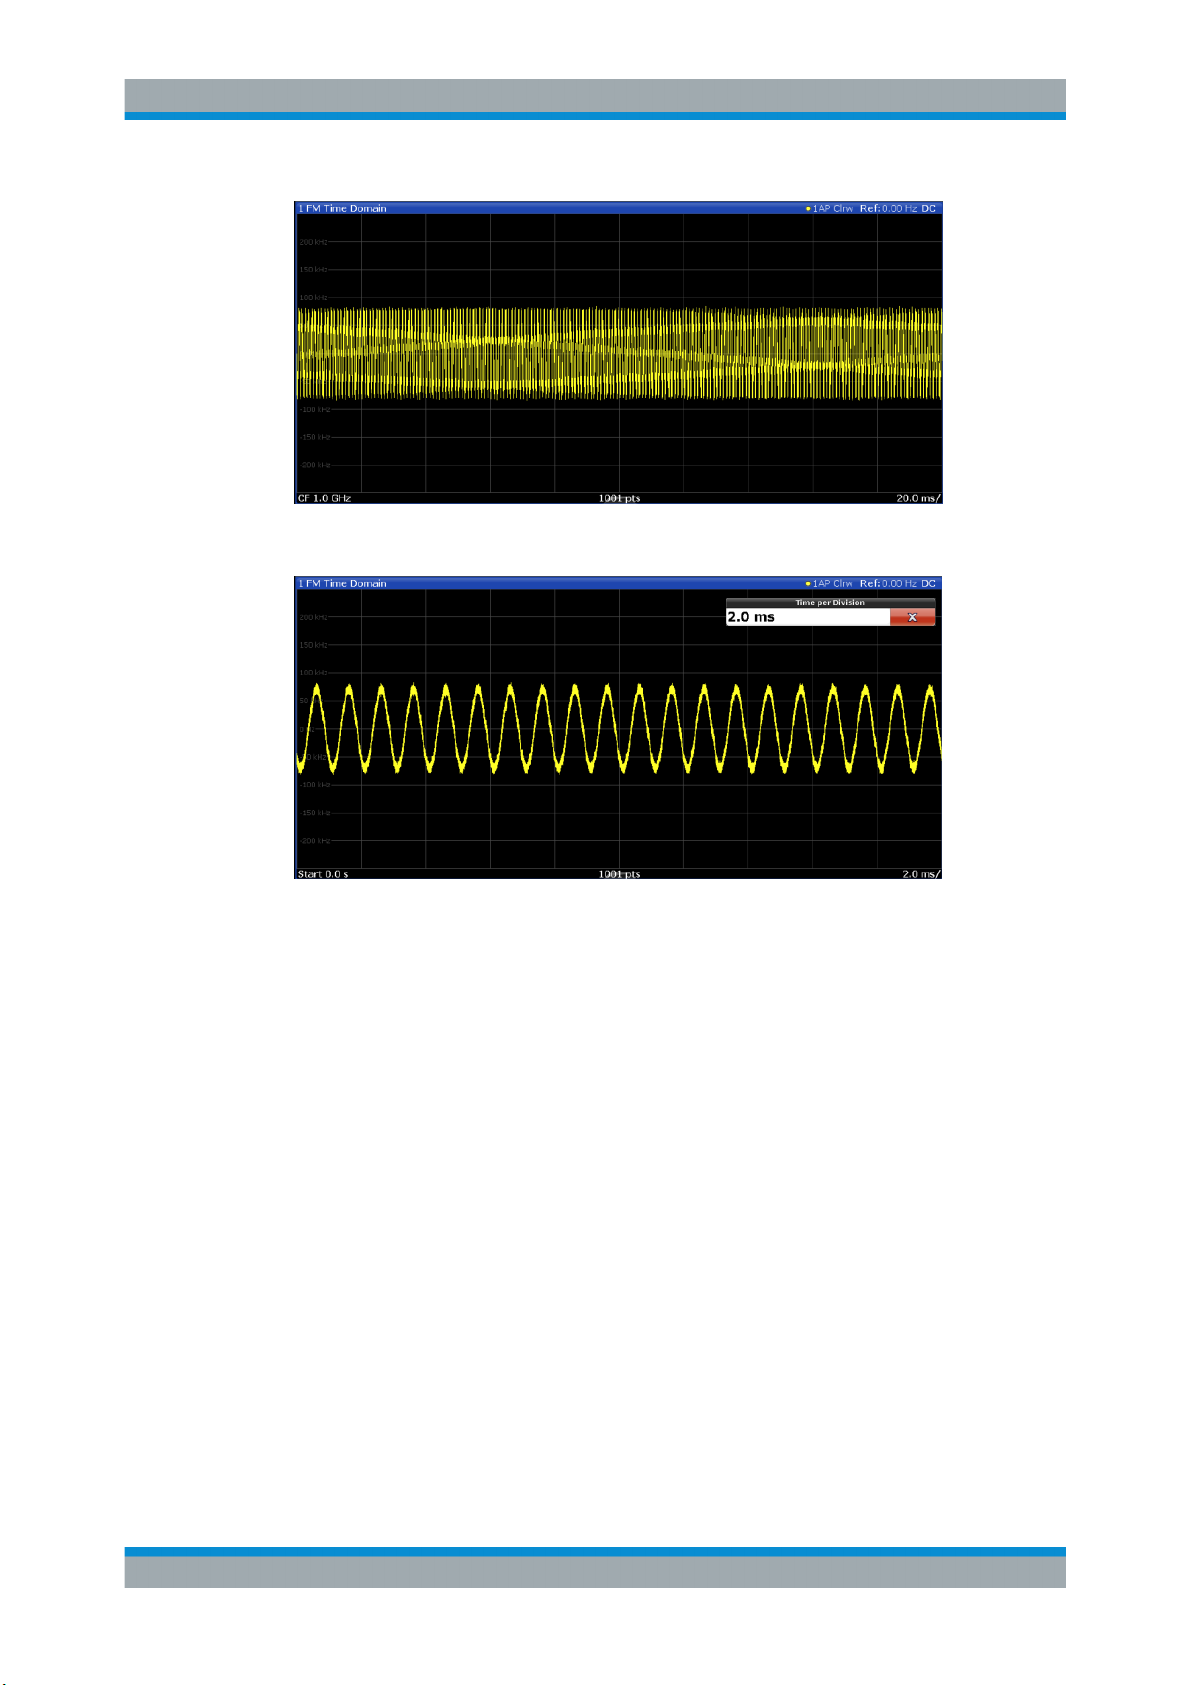
4.5 Time Domain Zoom
For evaluations in the time domain, the demodulated data for a particular time span
can be extracted and displayed in more detail using the "Time Domain Zoom" function.
This is useful if the measurement time is very large and thus each sweep point represents a large time span. The time domain zoom function distributes the available
sweep points only among the time span defined by the zoom area length. The time
span displayed per division of the diagram is decreased. Thus, the display of the
extracted time span becomes more precise.
23User Manual 1176.8939.02 ─ 07
Page 24
R&S®VSE-K7
Measurement Basics
Time Domain Zoom
Figure 4-2: FM time domain measurement with a very long measurement time (200 ms)
Figure 4-3: FM time domain measurement with time domain zoom (2.0 ms per division)
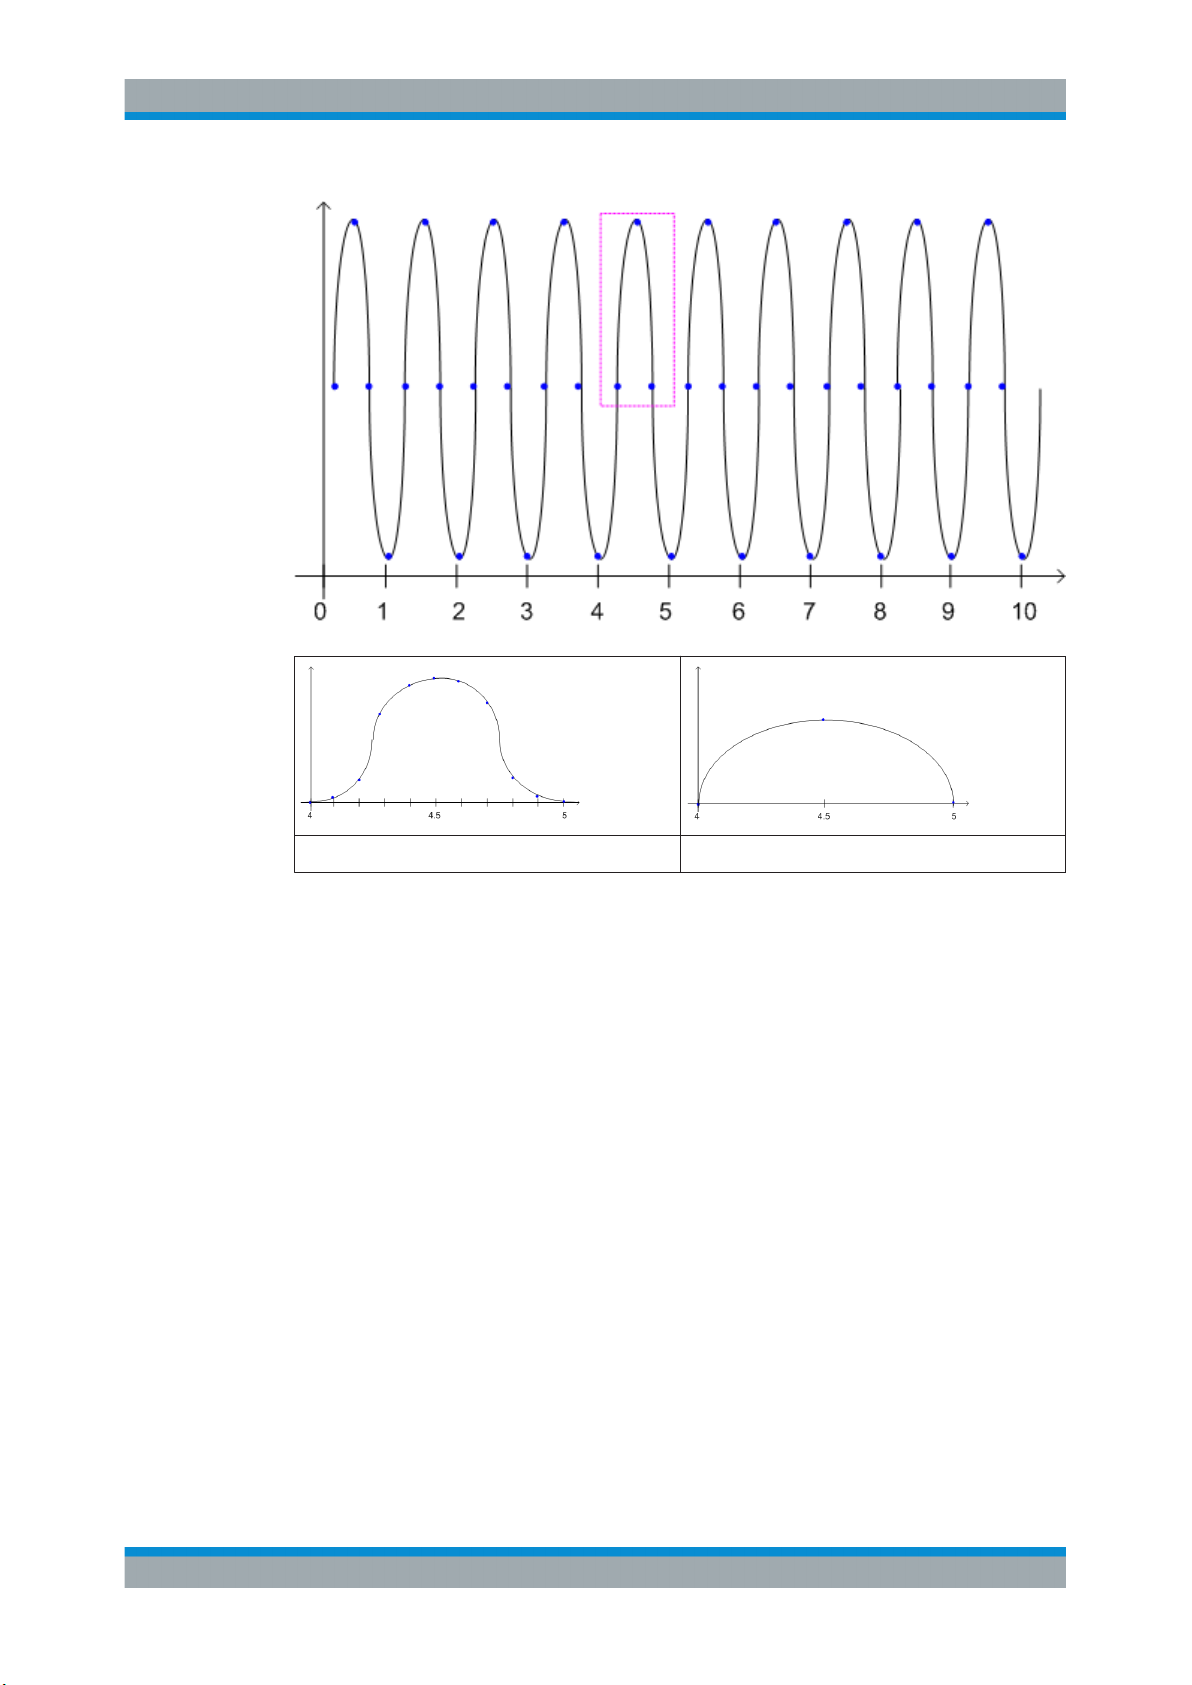
The time domain zoom area affects not only the diagram display, but the entire evaluation for the current window.
In contrast to the time domain zoom, the graphical zoom is available for all diagram
evaluations. However, the graphical zoom is useful only if more measured values than
trace points are available. The (time) span represented by each measurement point
remains the same.
24User Manual 1176.8939.02 ─ 07
Page 25
R&S®VSE-K7
Measurement Basics
Working with Spectrograms
Time domain zoom Graphical zoom
4.6 Working with Spectrograms
In addition to the standard "level versus frequency" or "level versus time" traces, the
R&S VSE Analog Demodulation application also provides a spectrogram display of the
measured data. A special feature of the R&S VSE software is that it provides spectrograms for applications based on I/Q data, such as the I/Q Analyzer and the Analog
Demodulation application.
A spectrogram shows how the spectral density of a signal varies over time. The x-axis
shows the frequency, the y-axis shows the time. A third dimension, the power level, is
indicated by different colors. Thus you can see how the strength of the signal varies
over time for different frequencies.
25User Manual 1176.8939.02 ─ 07
Page 26
R&S®VSE-K7
Measurement Basics
Working with Spectrograms
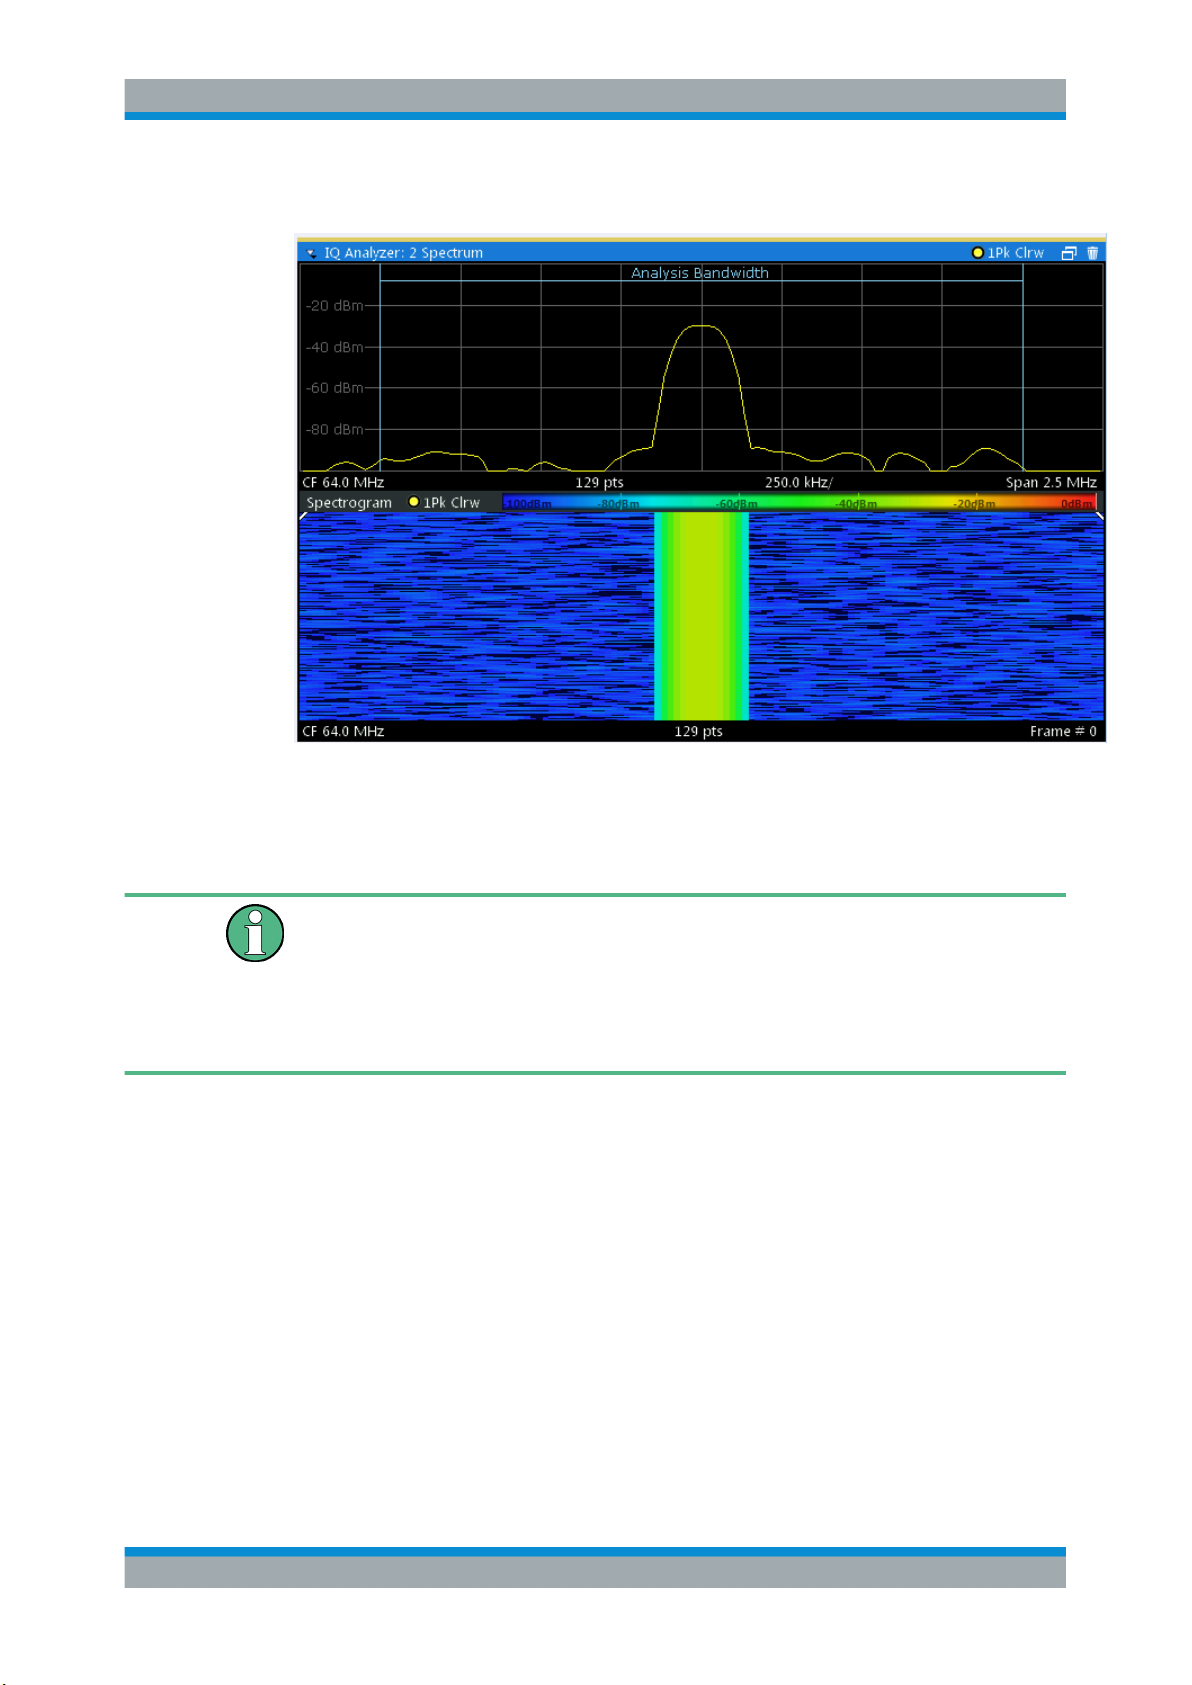
Example:
In this example you see the spectrogram for the calibration signal of an R&S FSW,
compared to the standard spectrum display. Since the signal does not change over
time, the color of the frequency levels does not change over time, i.e. vertically. The
legend above the spectrogram display describes the power levels the colors represent.
Spectrogram based on specific trace
The R&S VSE software allows you to define which trace of a particular result display
the Spectrogram is calculated from, if multiple traces are available. For example, if a
Spectrum is displayed with a Maxhold, a Minhold and an Average trace, you can activate a Spectrogram that displays the maximum, minimum, or average power levels
over time and frequency.
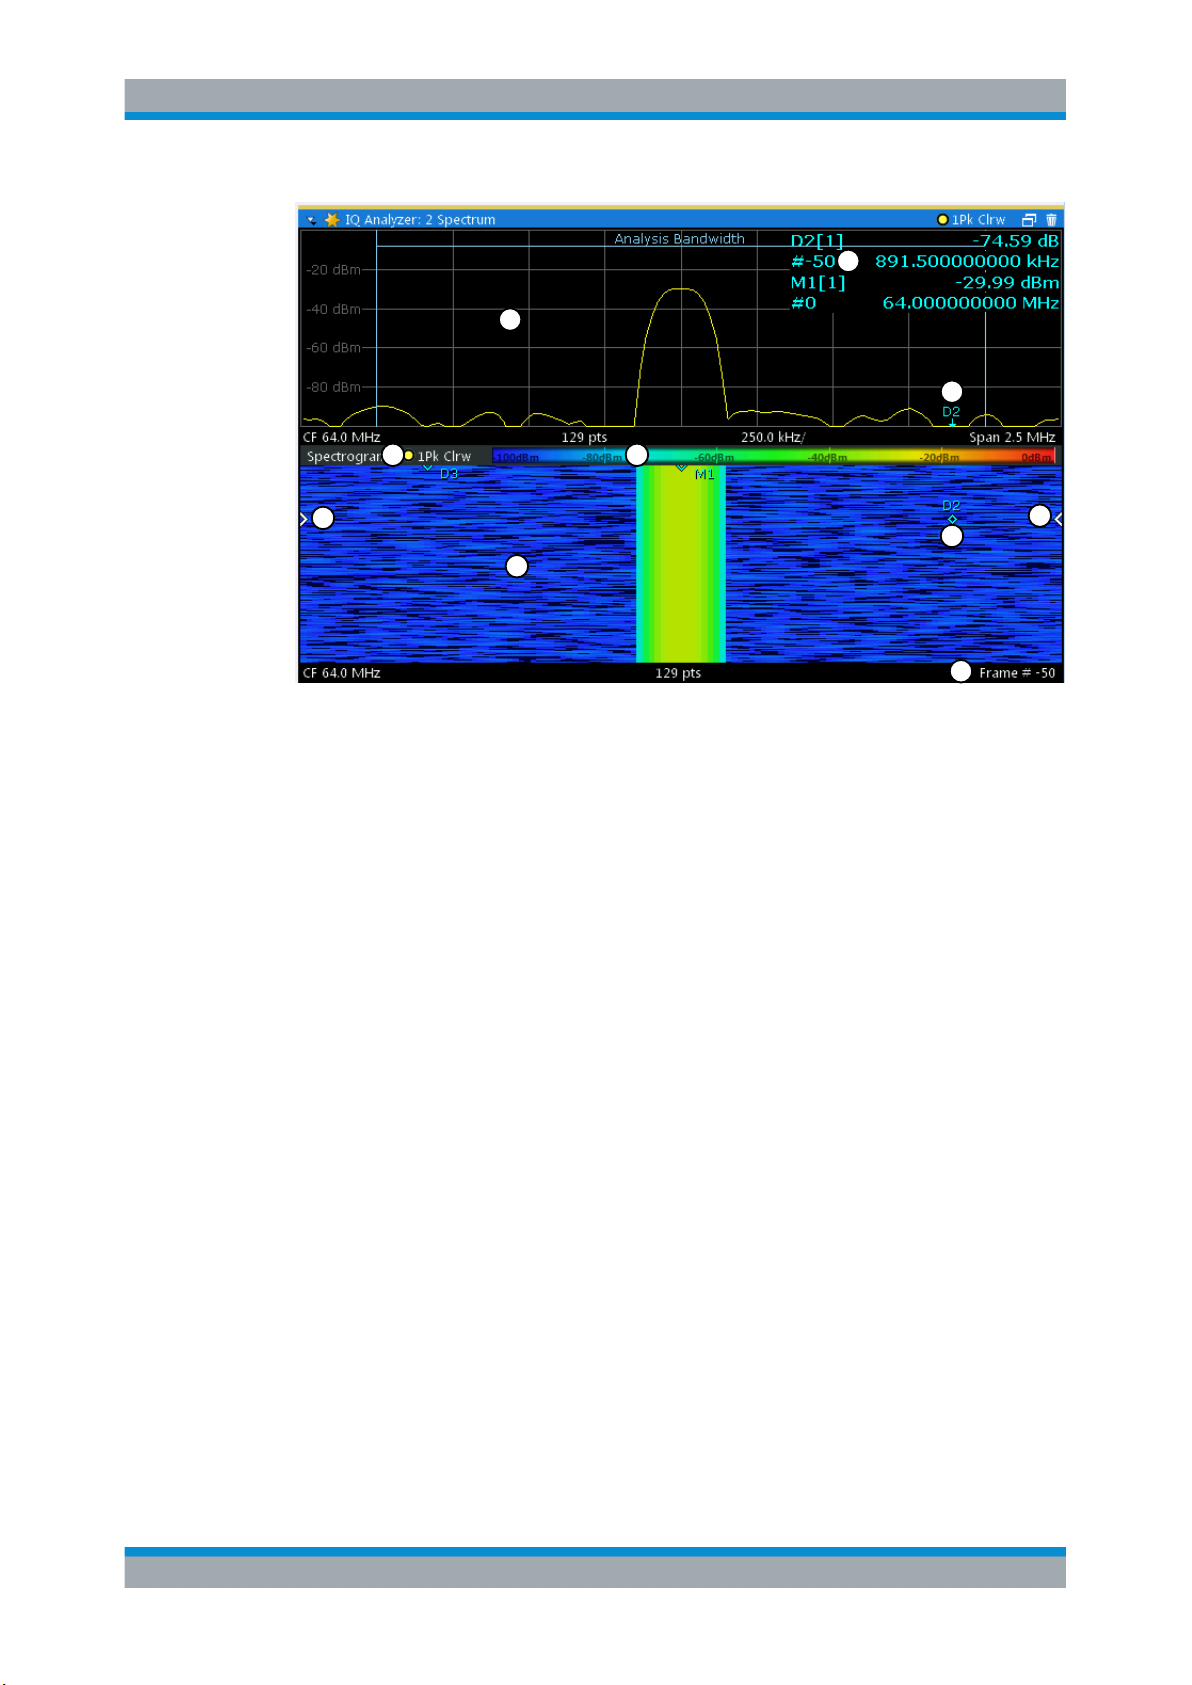
Result display
The spectrogram result can consist of the following elements:
26User Manual 1176.8939.02 ─ 07
Page 27
R&S®VSE-K7
Measurement Basics
Working with Spectrograms
2
1
7
3
6
5
Figure 4-4: Display elements for a result display with a spectrogram subwindow
1 = Main result display (in this case: Spectrum)
2 = Marker info with frame number
3 = Spectrogram subwindow title with trace information
4 = Color map
5 = Spectrogram subwindow
6 = Current frame indicators
7 = Deltamarker in Spectrogram and Spectrum displays
8 = Current frame number
4
6
7
8
For more information about spectrogram configuration see Chapter 6.3, "Spectrogram
Settings", on page 84.
Remote commands:
Activating and configuring spectrograms:
Chapter 9.4.11, "Configuring Spectrograms", on page 195
Storing results:
MMEMory:STORe<n>:SPECtrogram on page 216
● Time Frames...........................................................................................................27
● Color Maps..............................................................................................................28
4.6.1 Time Frames
The time information in the spectrogram is displayed vertically, along the y-axis. Each
line (or trace) of the y-axis represents one or more captured sweep and is called a
time frame or simply "frame". As with standard spectrum traces, several measured
values are combined in one sweep point using the selected detector.
27User Manual 1176.8939.02 ─ 07
Page 28
R&S®VSE-K7
Measurement Basics
Working with Spectrograms
Frames are sorted in chronological order, beginning with the most recently recorded
frame at the top of the diagram (frame number 0). With the next sweep, the previous
frame is moved further down in the diagram, until the maximum number of captured
frames is reached. The display is updated continuously during the measurement, and
the measured trace data is stored. Spectrogram displays are continued even after single measurements unless they are cleared manually.
The maximum number of frames that you can capture depends on the number of
sweep points that are analyzed during the measurement.
The scaling of the time axis (y-axis) is not configurable. However, you can enlarge the
spectrogram display to the full window size using the State: "Full" .
Displaying individual frames
The spectrogram diagram contains all stored frames since it was last cleared. Arrows
on the left and right border of the spectrogram indicate the currently selected frame.
The spectrum diagram always displays the spectrum for the currently selected frame.
The current frame number is indicated in the diagram footer. The current frame, displayed at the top of the diagram, is frame number 0. Older frames further down in the
diagram are indicated by a negative index, e.g. "-10" . You can display the spectrum
diagram of a previous frame by changing the current frame number.
4.6.2 Color Maps
The color display is highly configurable to adapt the spectrograms to your needs. You
can define:
●
Which colors to use (Color scheme)
●
Which value range to apply the color scheme to
●
How the colors are distributed within the value range, i.e where the focus of the visualization lies (shape of the color curve)
The individual colors are assigned to the power levels automatically by the R&S VSE.
The Color Scheme
●
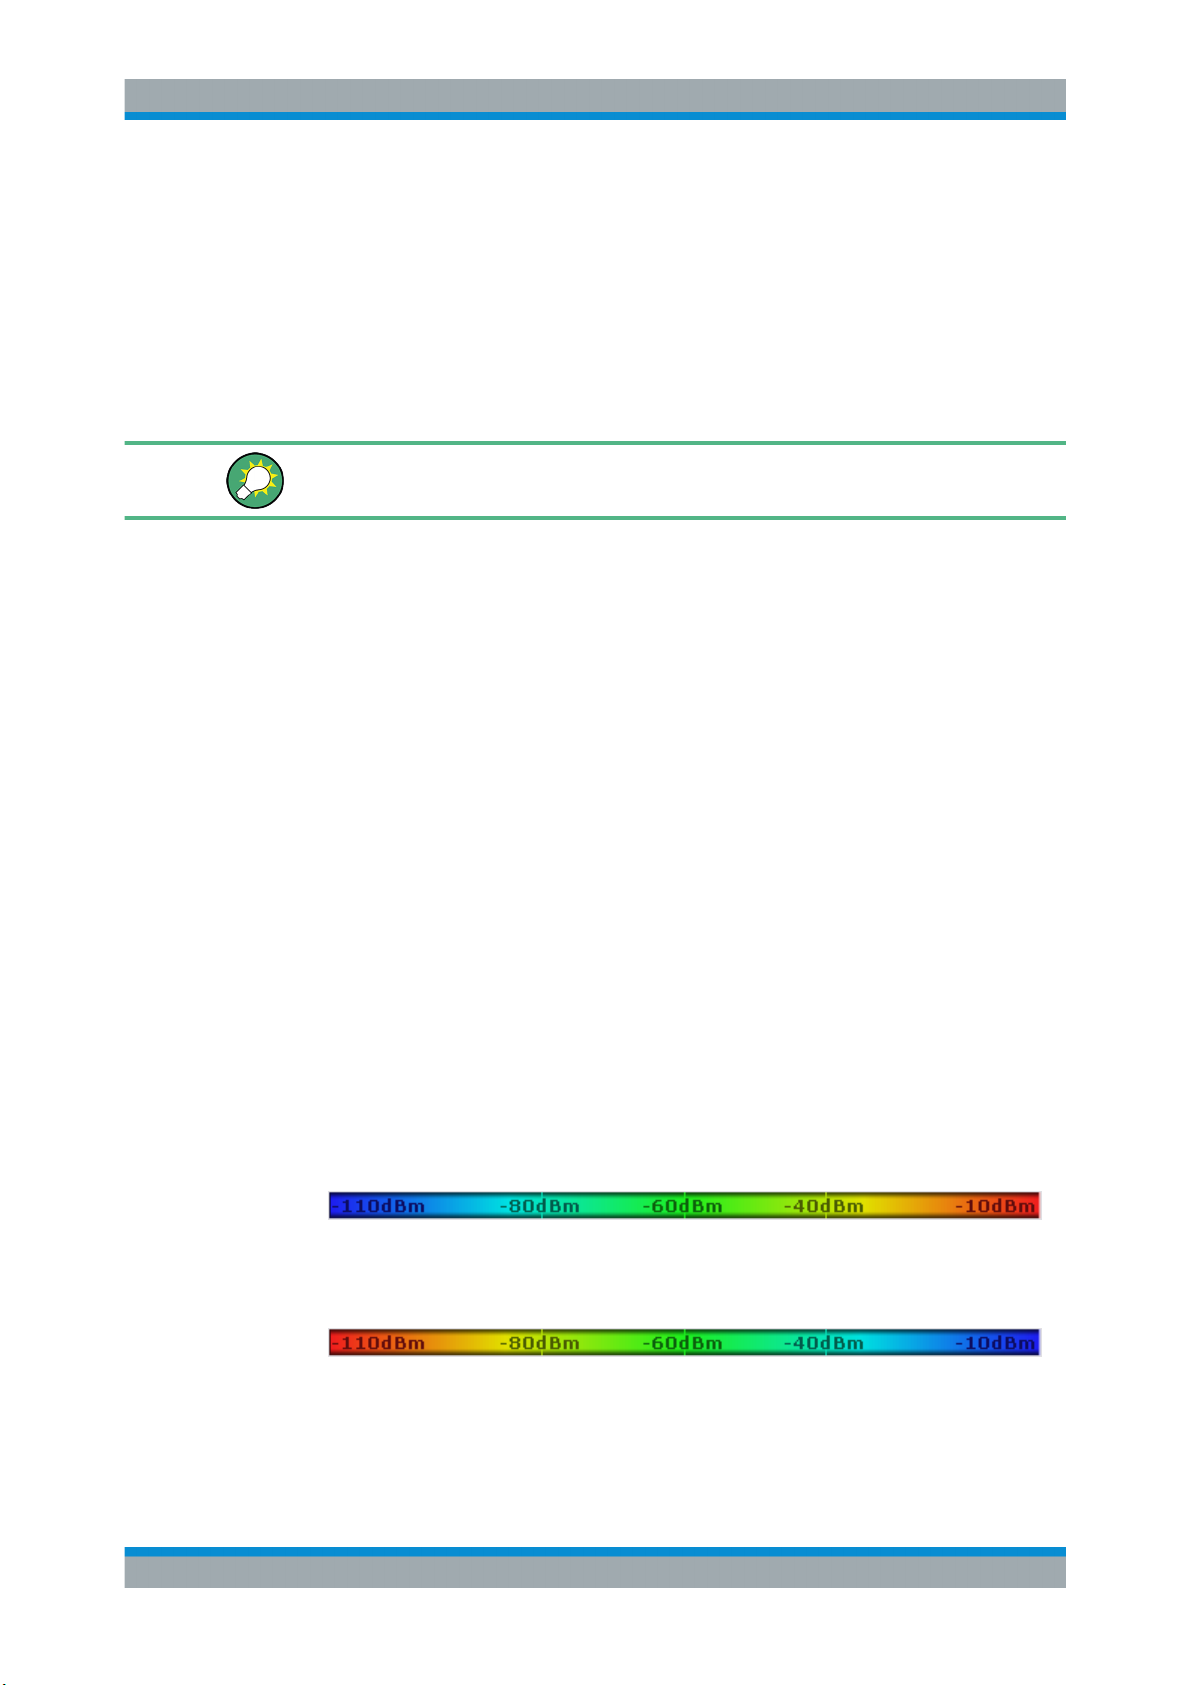
Hot
Uses a color range from blue to red. Blue colors indicate low levels, red colors indicate high ones.
●
Cold
Uses a color range from red to blue. Red colors indicate low levels, blue colors
indicate high ones.
The "Cold" color scheme is the inverse "Hot" color scheme.
28User Manual 1176.8939.02 ─ 07
Page 29
R&S®VSE-K7
Measurement Basics
Working with Spectrograms
●
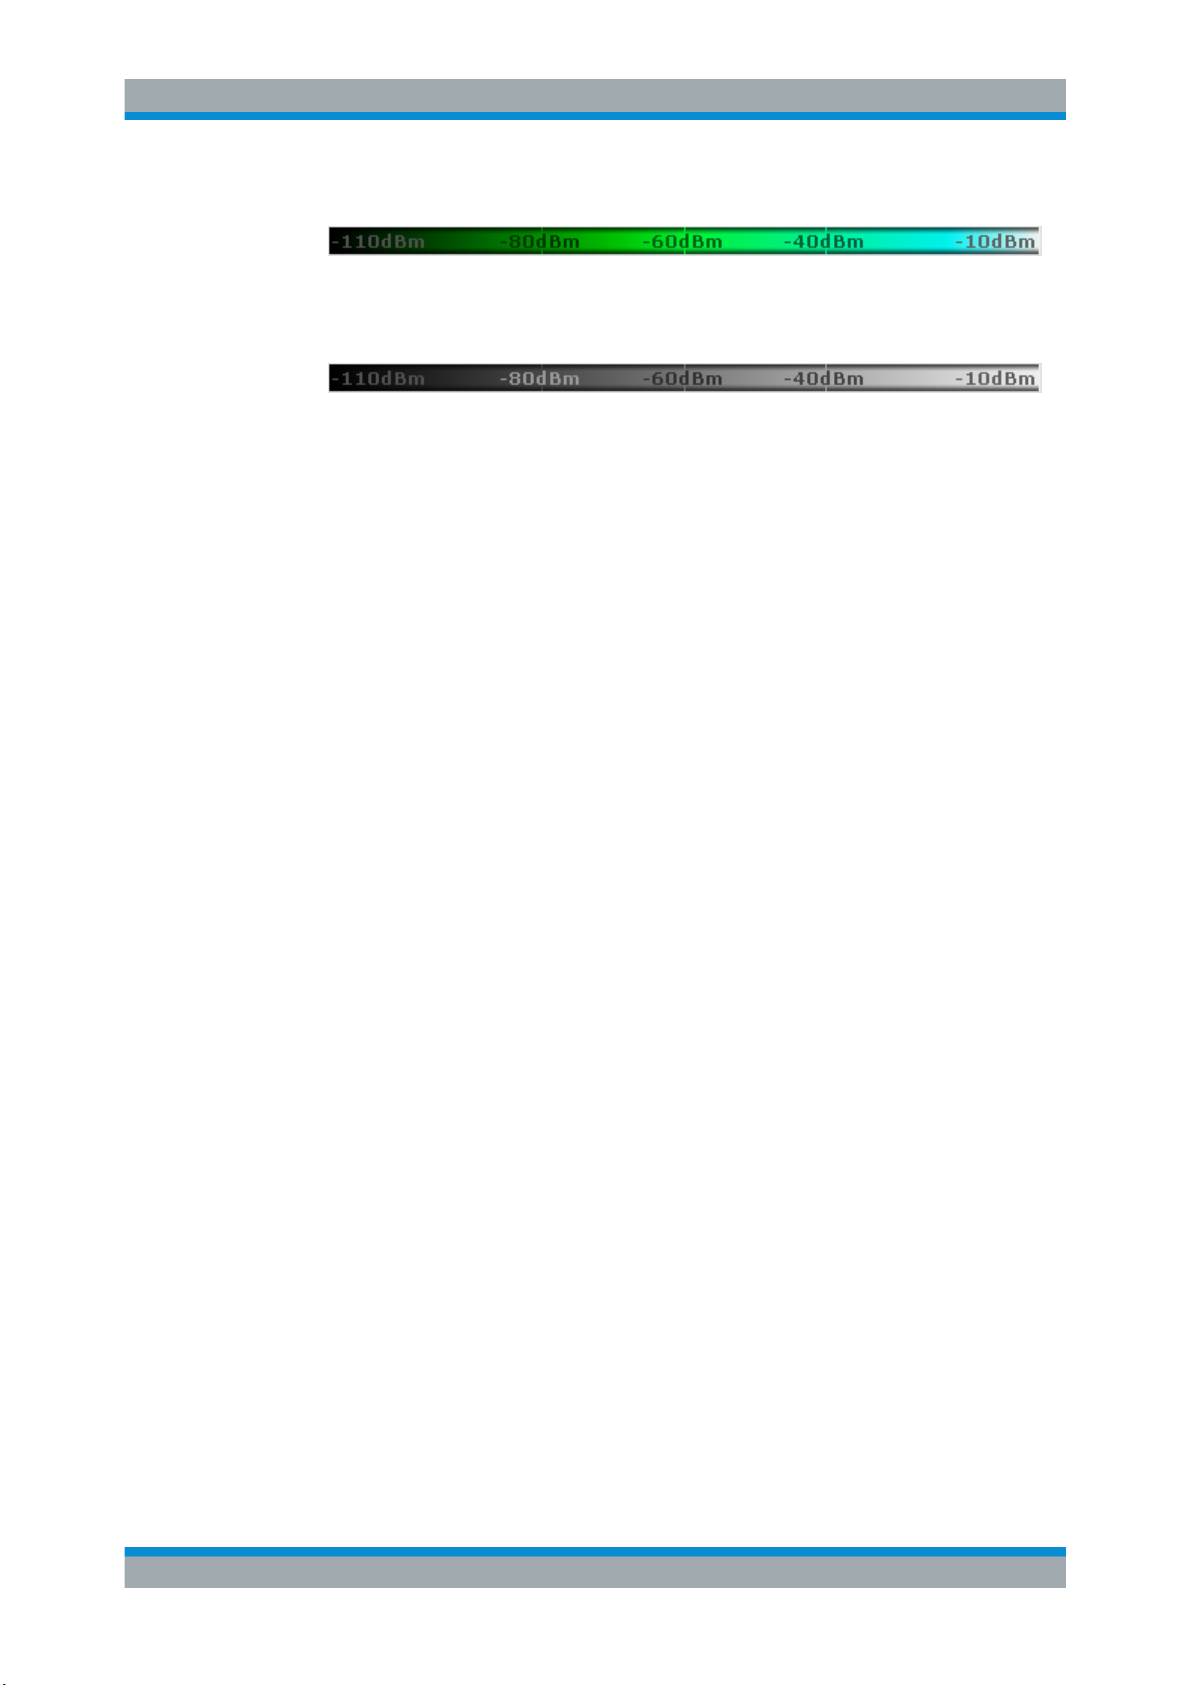
Radar
Uses a color range from black over green to light turquoise with shades of green in
between. Dark colors indicate low levels, light colors indicate high ones.
●
Grayscale
Shows the results in shades of gray. Dark gray indicates low levels, light gray indicates high ones.
The Value Range of the Color Map
If the measured values only cover a small area in the spectrogram, you can optimize
the displayed value range so it becomes easier to distinguish between values that are
close together. Display only parts of interest.
The Shape and Focus of the Color Curve
The color mapping function assigns a specified color to a specified power level in the
spectrogram display. By default, colors on the color map are distributed evenly. However, to visualize a certain area of the value range in greater detail than the rest, you
can set the focus of the color mapping to that area. Changing the focus is performed
by changing the shape of the color curve.
The color curve is a tool to shift the focus of the color distribution on the color map. By
default, the color curve is linear. If you shift the curve to the left or right, the distribution
becomes non-linear. The slope of the color curve increases or decreases. One end of
the color palette then covers a large range of results, while the other end distributes
several colors over a relatively small result range.
You can use this feature to put the focus on a particular region in the diagram and to be
able to detect small variations of the signal.
29User Manual 1176.8939.02 ─ 07
Page 30
R&S®VSE-K7
Measurement Basics
Working with Spectrograms
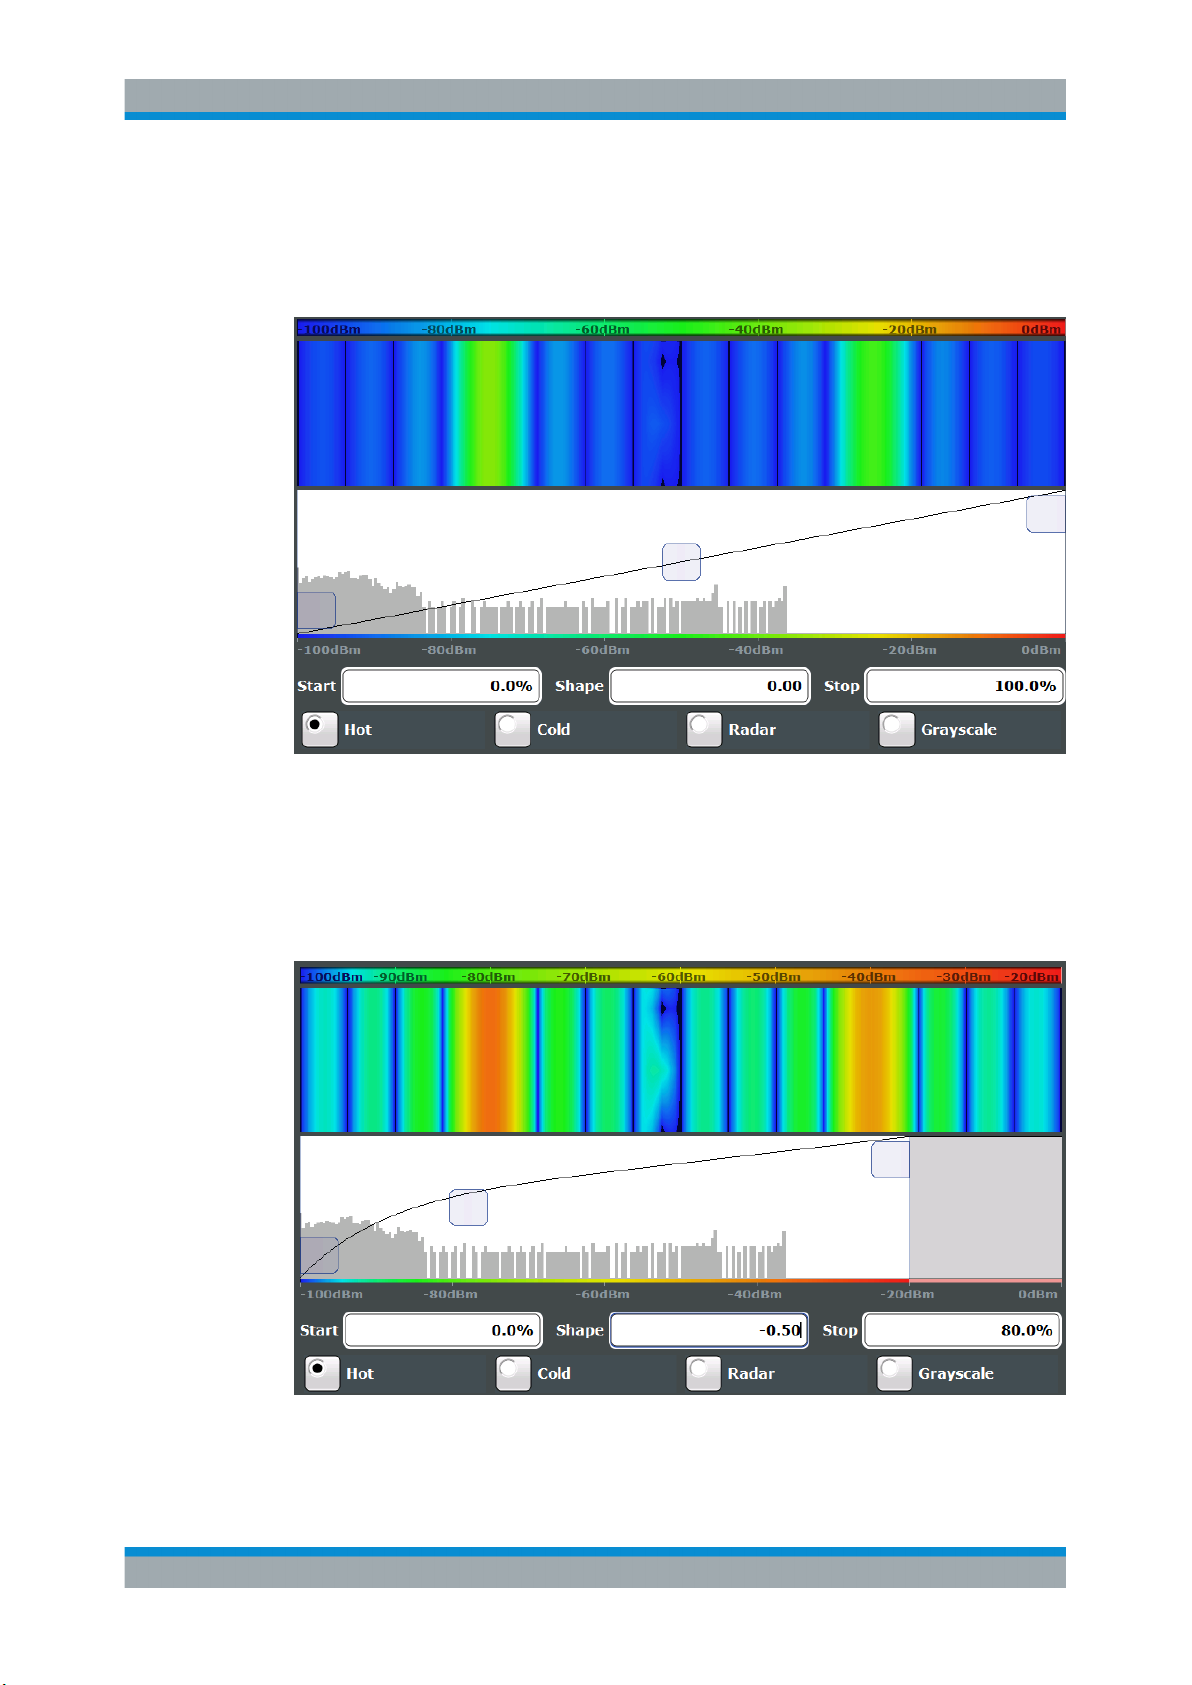
Example:
In the color map based on the linear color curve, the range from -100 dBm to -60 dBm
is covered by blue and a few shades of green only. The range from -60 dBm to
-20 dBm is covered by red, yellow and a few shades of green.
Figure 4-5: Spectrogram with (default) linear color curve shape = 0
The sample spectrogram is dominated by blue and green colors. After shifting the color
curve to the left (negative value), more colors cover the range from -100 dBm to
-60 dBm (blue, green and yellow). This range occurs more often in the example. The
range from -60 dBm to -20 dBm, on the other hand, is dominated by various shades of
red only.
Figure 4-6: Spectrogram with non-linear color curve (shape = -0.5)
30User Manual 1176.8939.02 ─ 07
Page 31

R&S®VSE-K7
Configuration
Configuration According to Digital Standards
5 Configuration
Access: "Meas Setup" > "Overview"
Analog demodulation measurements require a special application on the R&S VSE.
General R&S VSE functions
The application-independent functions for general tasks on the R&S VSE are also
available for Analog Demodulation measurements and are described in the R&S VSE
Base Software User Manual. In particular, this comprises the following functionality:
●
Controlling Instruments and Capturing I/Q Data
●
Output settings
●
Data Management
●
General Software Preferences and Information
Multiple access paths to functionality
The easiest way to configure a measurement channel is via the "Overview" dialog box.
Alternatively, you can access the individual dialog boxes from the corresponding menu
items, or via tools in the toolbars, if available.
In this documentation, only the most convenient method of accessing the dialog boxes
is indicated - usually via the "Overview". For an overview of all available menu items
and toolbar icons see Chapter A, "Reference", on page 280.
Predefined settings
For commonly performed measurements, standard setup files are provided for quick
and easy configuration. Simply load an existing standard settings file and, if necessary,
adapt the measurement settings to your specific requirements.
For an overview of predefined standards and settings see Chapter A.3, "Predefined
Standards and Settings", on page 288.
● Configuration According to Digital Standards......................................................... 31
● Configuration Overview...........................................................................................33
● Input and Frontend Settings....................................................................................35
● Trigger Source Settings.......................................................................................... 50
● Data Acquisition...................................................................................................... 54
● Demodulation..........................................................................................................58
● Adjusting Settings Automatically.............................................................................75
5.1 Configuration According to Digital Standards
Access: "Meas Setup" > "Overview" > "Setup Standard"
31User Manual 1176.8939.02 ─ 07
Page 32

R&S®VSE-K7
Configuration
Configuration According to Digital Standards
Various predefined settings files for common digital standards are provided for use with
the Analog Demodulation application. In addition, you can create your own settings
files for user-specific measurements.
For details on which settings are defined and an overview of predefined standards see
Chapter A.3, "Predefined Standards and Settings", on page 288.
Setup Standard ............................................................................................................ 32
└ Selecting Storage Location - Drive/ Path/ Files.............................................. 32
└ File Name .......................................................................................................32
└ Load Standard ............................................................................................... 33
└ Save Standard ............................................................................................... 33
└ Delete Standard .............................................................................................33
└ Restore Standard Files .................................................................................. 33
Setup Standard
Opens a file selection dialog box to select a predefined setup file. The predefined settings are configured in the R&S VSE Analog Demodulation application. This allows for
quick and easy configuration for commonly performed measurements.
Selecting Storage Location - Drive/ Path/ Files ← Setup Standard
Select the storage location of the file on the software or an external drive.
The default storage location for the settings files is:
C:\ProgramData\Rohde-Schwarz\VSE\<version_no>\user\predefined\
AdemodPredefined.
The default storage location for the SEM settings files is:
C:\ProgramData\Rohde-Schwarz\VSE\<version>\sem_std.
File Name ← Setup Standard
Contains the name of the data file without the path or extension.
File names must be compatible with the Windows conventions for file names. In partic-
ular, they must not contain special characters such as ":", "*", "?".
32User Manual 1176.8939.02 ─ 07
Page 33

R&S®VSE-K7
Configuration
Configuration Overview
For details on the filename and location, see the R&S VSE Base Software User Manual.
For details on the filename and location, see the "Data Management" topic in the
R&S VSE User Manual.
Load Standard ← Setup Standard
Loads the selected measurement settings file.
Remote command:
[SENSe:]ADEMod<n>:PRESet[:STANdard] on page 132
Save Standard ← Setup Standard
Saves the current measurement settings for a specific standard as a file with the
defined name.
Remote command:
[SENSe:]ADEMod<n>:PRESet:STORe on page 133
Delete Standard ← Setup Standard
Deletes the selected standard. Standards predefined by Rohde & Schwarz can also be
deleted. A confirmation query is displayed to avoid unintentional deletion of the standard.
Note: Restoring predefined standard files. The standards predefined by Rohde &
Schwarz available at the time of delivery can be restored using the "Restore Standard
Files" function (see " Restore Standard Files " on page 33).
Restore Standard Files ← Setup Standard
Restores the standards predefined by Rohde & Schwarz available at the time of delivery.
Note that this function will overwrite customized standards that have the same name
as predefined standards.
Remote command:
[SENSe:]ADEMod<n>:PRESet:RESTore on page 132
5.2 Configuration Overview
Access: "Meas Setup" > "Overview"
Throughout the measurement configuration, an overview of the most important currently defined settings is provided in the "Overview".
33User Manual 1176.8939.02 ─ 07
Page 34

R&S®VSE-K7
Configuration
Configuration Overview
In addition to the main measurement settings, the "Overview" provides quick access to
the main settings dialog boxes. Thus, you can easily configure an entire Analog
Demodulation measurement channel from input over processing to output and analysis
by stepping through the dialog boxes as indicated in the "Overview".
In particular, the "Overview" provides quick access to the following configuration dialog
boxes (listed in the recommended order of processing):
1. Input/Frontend
See Chapter 5.3, "Input and Frontend Settings", on page 35
2. Trigger
See Chapter 5.4, "Trigger Source Settings", on page 50
3. Data Acquisition
See Chapter 5.5, "Data Acquisition", on page 54
4. Demodulation Settings
See Chapter 5.6, "Demodulation", on page 58
5. Analysis
See Chapter 6, "Analysis", on page 78
To configure settings
► Select any button in the "Overview" or select a setting in the channel's global info
bar to open the corresponding dialog box.
34User Manual 1176.8939.02 ─ 07
Page 35

R&S®VSE-K7
Configuration
Input and Frontend Settings
Preset Channel
Select the "Preset Channel" button in the lower left-hand corner of the "Overview" to
restore all measurement settings in the current channel to their default values.
Remote command:
SYSTem:PRESet:CHANnel[:EXEC] on page 131
Setup Standard
Opens a file selection dialog box to select a predefined setup file. See " Setup Stan-
dard " on page 32.
Specifics for
The channel may contain several windows for different results. Thus, the settings indicated in the "Overview" and configured in the dialog boxes vary depending on the
selected window.
Select an active window from the "Specifics for" selection list that is displayed in the
"Overview" and in all window-specific configuration dialog boxes.
The "Overview" and dialog boxes are updated to indicate the settings for the selected
window.
5.3 Input and Frontend Settings
Access: "Overview" > "Input/Frontend"
or: "Input & Output"
The source and characteristics of the input signal to be demodulated are configured in
the "Input" dialog box.
● Input Source Settings..............................................................................................35
● Amplitude................................................................................................................ 45
● Frequency............................................................................................................... 49
5.3.1 Input Source Settings
Access: "Overview" > "Input/Frontend" > "Input Source"
Or: "Input & Output" > "Input Source"
The R&S VSE can control the input sources of the connected instruments.
● Radio Frequency Input............................................................................................35
● Oscilloscope Baseband Input..................................................................................41
● I/Q File Input............................................................................................................43
5.3.1.1 Radio Frequency Input
Access: "Overview" > "Input/Frontend" > "Input Source" > "Radio Frequency"
Or: "Input & Output" > "Input Source" > "Radio Frequency"
35User Manual 1176.8939.02 ─ 07
Page 36

R&S®VSE-K7
Configuration
Input and Frontend Settings
The default input source for the connected instrument is "Radio Frequency". Depending on the connected instrument, different input parameters are available.
Figure 5-1: RF input source settings for an R&S FSW with B2000 option
If the Frequency Response Correction option (R&S VSE-K544) is installed, the R&S
VSE Analog Demodulation application also supports frequency response correction
using Touchstone (.snp) files or .fres files.
For details on user-defined frequency response correction, see the R&S VSE Base
Software User Manual.
Input Type (Instrument / File)........................................................................................37
Instrument..................................................................................................................... 37
Input Coupling ..............................................................................................................37
Impedance ................................................................................................................... 37
Direct Path ................................................................................................................... 37
High Pass Filter 1 to 3 GHz ..........................................................................................38
YIG-Preselector ............................................................................................................38
Capture Mode............................................................................................................... 38
B2000 State.................................................................................................................. 39
RTO Sample Rate.........................................................................................................39
36User Manual 1176.8939.02 ─ 07
Page 37

R&S®VSE-K7
Configuration
Input and Frontend Settings
RTO Splitter Mode.........................................................................................................40
RTO IP Address............................................................................................................40
Preselector State...........................................................................................................40
Preselector Mode..........................................................................................................40
10 dB Minimum Attenuation..........................................................................................41
Input Selection.............................................................................................................. 41
Input Type (Instrument / File)
Selects an instrument or a file as the type of input provided to the channel.
Remote command:
INSTrument:BLOCk:CHANnel[:SETTings]:SOURce<si> on page 139
INPut<ip>:SELect on page 138
Instrument
Specifies a configured instrument to be used for input.
Input Coupling
The RF input of the connected instrument can be coupled by alternating current (AC)
or direct current (DC).
AC coupling blocks any DC voltage from the input signal. This is the default setting to
prevent damage to the instrument. Very low frequencies in the input signal may be distorted.
However, some specifications require DC coupling. In this case, you must protect the
instrument from damaging DC input voltages manually. For details, refer to the data
sheet.
Remote command:
INPut<ip>:COUPling on page 134
Impedance
For some measurements, the reference impedance for the measured levels of the connected instrument can be set to 50 Ω or 75 Ω.
Select 75 Ω if the 50 Ω input impedance is transformed to a higher impedance using a
75 Ω adapter of the RAZ type. (That corresponds to 25Ω in series to the input impedance of the instrument.) The correction value in this case is 1.76 dB = 10 log (75Ω/
50Ω).
Remote command:
INPut<ip>:IMPedance on page 136
Direct Path
Enables or disables the use of the direct path for small frequencies.
In spectrum analyzers, passive analog mixers are used for the first conversion of the
input signal. In such mixers, the LO signal is coupled into the IF path due to its limited
isolation. The coupled LO signal becomes visible at the RF frequency 0 Hz. This effect
is referred to as LO feedthrough.
37User Manual 1176.8939.02 ─ 07
Page 38

R&S®VSE-K7
Configuration
Input and Frontend Settings
To avoid the LO feedthrough the spectrum analyzer provides an alternative signal path
to the A/D converter, referred to as the direct path. By default, the direct path is
selected automatically for RF frequencies close to zero. However, this behavior can be
deactivated. If "Direct Path" is set to "Off" , the spectrum analyzer always uses the analog mixer path.
"Auto"
"Off"
Remote command:
INPut<ip>:DPATh on page 134
High Pass Filter 1 to 3 GHz
Activates an additional internal high-pass filter for RF input signals from 1 GHz to
3 GHz. This filter is used to remove the harmonics of the analyzer to measure the harmonics for a DUT, for example.
This function may require an additional hardware option on the connected instrument.
Remote command:
INPut<ip>:FILTer:HPASs[:STATe] on page 135
(Default) The direct path is used automatically for frequencies close
to zero.
The analog mixer path is always used.
YIG-Preselector
Activates or deactivates the YIG-preselector, if available on the connected instrument.
An internal YIG-preselector at the input of the connected instrument ensures that
image frequencies are rejected. However, this is only possible for a restricted bandwidth. To use the maximum bandwidth for signal analysis you can deactivate the YIGpreselector at the input of the connected instrument, which can lead to image-frequency display.
Remote command:
INPut<ip>:FILTer:YIG[:STATe] on page 136
Capture Mode
Determines how data from an oscilloscope is input to the R&S VSE software.
This function is only available for a connected R&S RTO with a firmware version
3.0.1.1 or higher (for other versions and instruments the input is always I/Q data).
"I/Q"
The measured waveform is converted to I/Q data directly on the R&S
RTO (requires option R&S RTO-K11), and input to the R&S VSE software as I/Q data.
For data imports with small bandwidths, importing data in this format
is quicker. However, the maximum record length is restricted by the
R&S RTO. (Memory options on the R&S RTO are not available for I/Q
data.)
This mode is not available for Oscilloscope Baseband Input.
38User Manual 1176.8939.02 ─ 07
Page 39

R&S®VSE-K7
Configuration
Input and Frontend Settings
"Waveform"
"Auto"
Remote command:
INPut<ip>:RF:CAPMode on page 137
B2000 State
Activates the optional 2 GHz bandwidth extension (R&S FSW-B2000).
Note: The R&S VSE software supports input from a connected R&S FSW with a
B2000 option installed. However, the R&S FSW interface to the oscilloscope must be
set up and aligned directly on the instrument before the R&S VSE software can start
analyzing the input.
The analysis bandwidth is defined in the data acquisition settings of the application as
usual. Note that the maximum bandwidth cannot be restricted manually as for other
bandwidth extension options.
Manual operation on the connected oscilloscope, or remote operation other than by the
R&S VSE, is not possible while the B2000 option is active.
The data is input in its original waveform format and converted to I/Q
data in the R&S VSE software. No additional options are required on
the R&S RTO.
For Oscilloscope Baseband Input, the capture mode is automatically
set to "Waveform". I and Q data is sampled in separate channels in
its original waveform format. The separately captured I and Q waveform samples are converted to complex I/Q data in the R&S VSE.
For data imports with large bandwidths, this format is more convenient as it allows for longer record lengths if appropriate memory
options are available on the R&S RTO.
Uses "I/Q" mode when possible, and "Waveform" only when required
by the application (e.g. Pulse measurement, Oscilloscope Baseband
Input).
Remote command:
SYSTem:COMMunicate:RDEVice:OSCilloscope[:STATe] on page 140
RTO Sample Rate
Determines whether the 10 GHz mode (default) or 20 GHz mode of the connected
oscilloscope is used. The 20 GHz mode achieves a higher decimation gain, but
reduces the record length by half.
This setting is only available if an R&S RTO is used to obtain the input data, either
directly or via the R&S FSW.
When using an oscilloscope as the input source, the following restrictions apply for this
setting:
●
Only available for R&S RTO models that support a sample rate of 20 GHz (see
data sheet)
●
For R&S RTO-2064 with an analysis bandwidth of 4 GHz or larger, a sample rate of
20 GHZ is always used
Remote command:
Input source R&S FSW via R&S RTO:
SYSTem:COMMunicate:RDEVice:OSCilloscope:SRATe on page 141
Input source R&S RTO:
INPut<ip>:RF:CAPMode:WAVeform:SRATe on page 138
39User Manual 1176.8939.02 ─ 07
Page 40

R&S®VSE-K7
Configuration
Input and Frontend Settings
RTO Splitter Mode
Activates the use of the power splitter inserted between the [IF 2 GHZ OUT] connector
of the R&S FSW and the [CH1] and [CH3] input connectors of the oscilloscope. Note
that this mode requires an additional alignment with the power splitter.
For details see the R&S FSW I/Q Analyzer and I/Q Input User Manual.
Remote command:
SYSTem:COMMunicate:RDEVice:OSCilloscope:PSMode[:STATe] on page 141
RTO IP Address
When using the optional 2 GHz bandwidth extension (R&S FSW-B2000) with an R&S
FSW as the connected instrument, the entire measurement, as well as both instruments, are controlled by the R&S VSE software. Thus, the instruments must be connected via LAN, and the TCPIP address of the oscilloscope must be defined in the
R&S VSE software.
For tips on how to determine the computer name or TCPIP address, see the oscilloscope's user documentation.
Remote command:
SYSTem:COMMunicate:RDEVice:OSCilloscope:TCPip on page 140
Preselector State
Turns the preselector on and off.
When you turn on the preselector, you can configure the characteristics of the prese-
lector and add the preamplifier into the signal path.
When you turn off the preselector, the signal bypasses the preselector and the pream-
plifier, and is fed into the input mixer directly.
Remote command:
INPut<ip>:PRESelection[:STATe] on page 137
Preselector Mode
Selects the preselection filters to be applied to the measurement.
"Auto"
"Auto Wide"
"Auto Narrow"
"Manual"
Automatically applies all available bandpass filters in a measurement.
Available with the optional preamplifier.
Automatically applies the wideband filters consecutively:
●
Lowpass 40 MHz
●
Bandpass 30 MHz to 2250 MHz
●
Bandpass 2 GHz to 8 GHz
●
Bandpass 8 GHz to 26.5 GHz
Available with the optional preselector.
Automatically applies the most suitable narrowband preselection fil-
ters in a measurement, depending on the bandwidth you have
selected.
For measurement frequencies up to 30 MHz, the connected instrument uses combinations of lowpass and highpass filters. For higher
frequencies, the connected instrument uses bandpass filters.
Available with the optional preselector.
Applies the filter settings you have defined manually.
40User Manual 1176.8939.02 ─ 07
Page 41

R&S®VSE-K7
Configuration
Input and Frontend Settings
Remote command:
INPut<ip>:PRESelection:SET on page 136
10 dB Minimum Attenuation
Turns the availability of attenuation levels of less than 10 dB on and off.
When you turn on this feature, the attenuation is always at least 10 dB. This minimum
attenuation protects the input mixer and avoids accidental setting of 0 dB, especially if
you measure DUTs with high RFI voltage.
When you turn it off, you can also select attenuation levels of less than 10 dB.
The setting applies to a manual selection of the attenuation as well as the automatic
selection of the attenuation.
Remote command:
INPut<ip>:ATTenuation:PROTection[:STATe] on page 134
Input Selection
Selects the RF input connector you would like to use for a measurement.
Note that you cannot use both RF inputs simultaneously.
Remote command:
Global: INPut<ip>:TYPE on page 138
5.3.1.2 Oscilloscope Baseband Input
Access: "Overview" > "Input" > "Input Source" > "Oscilloscope Baseband"
If the Frequency Response Correction option (R&S VSE-K544) is installed, the R&S
VSE Analog Demodulation application also supports frequency response correction
using Touchstone (.snp) files or .fres files.
For details on user-defined frequency response correction, see the R&S VSE Base
Software User Manual.
Input Type (Instrument / File)........................................................................................42
Instrument..................................................................................................................... 42
Input Source..................................................................................................................42
I/Q Mode ...................................................................................................................... 42
41User Manual 1176.8939.02 ─ 07
Page 42

R&S®VSE-K7
Configuration
Input and Frontend Settings
I/Q Skew........................................................................................................................43
Impedance ................................................................................................................... 43
Center Frequency ........................................................................................................ 43
Signal Path....................................................................................................................43
Input Type (Instrument / File)
Selects an instrument or a file as the type of input provided to the channel.
Remote command:
INSTrument:BLOCk:CHANnel[:SETTings]:SOURce<si> on page 139
INPut<ip>:SELect on page 138
Instrument
Specifies a configured instrument to be used for input.
Input Source
Configures the source of input (and channel) on the selected instrument to be used.
"RF"
"Channel 1 | Channel 2 | Channel 3 | Channel 4 "
"Channel 1,2 (I+Q)"
"Channel 1,3 (I+Q) | Channel 2,4 (I+Q)"
"Channels 1-4 (diff. I+Q)"
Radio Frequency ("RF INPUT" connector)
Oscilloscope input channel 1, 2, 3, or 4
I/Q data provided by oscilloscope input channels 1 and 2 (for oscilloscopes with 2 channels only)
I/Q data provided by oscilloscope input channels 1 and 3, or 2 and 4
(for oscilloscopes with 4 channels only)
Differential I/Q data provided by oscilloscope input channels (for oscilloscopes with 4 channels only):
Channel 1: I (pos.)
Channel 2: Ī (neg.)
Channel 3: Q (pos.)
Channel 4: Ǭ (neg.)
Remote command:
INSTrument:BLOCk:CHANnel[:SETTings]:SOURce<si>:TYPE on page 139
I/Q Mode
Defines the format of the input signal.
For more information on I/Q data processing modes, see the R&S VSE I/Q Analyzer
and I/Q Input User Manual.
"I/Q"
"I Only / Low IF I"
Both components of the complex input signal (in-phase component,
quadrature component) are filtered and resampled to the sample rate
of the application.
The input signal at the channel providing I data is filtered and resampled to the sample rate of the application.
The input signal is down-converted with the center frequency (Low IF
I).
42User Manual 1176.8939.02 ─ 07
Page 43

R&S®VSE-K7
Configuration
Input and Frontend Settings
Remote command:
INPut<ip>:IQ:OSC:TYPE on page 144
I/Q Skew
Compensates for skewed I/Q values, e.g. due to different input cables
Define the delay values individually for the I and Q channels. For differential input,
changing the positive skew automatically also changes the negative skew (but not vice
versa).
Depending on the connected oscilloscope, values between ±100 ns are allowed.
Remote command:
INPut<ip>:IQ:OSC:SKEW:I on page 143
INPut<ip>:IQ:OSC:SKEW:I:INVerted on page 144
INPut<ip>:IQ:OSC:SKEW:Q on page 144
INPut<ip>:IQ:OSC:SKEW:Q:INVerted on page 144
Impedance
For some measurements, the reference impedance for the measured levels of the connected instrument can be set to 50 Ω or 75 Ω.
Select 75 Ω if the 50 Ω input impedance is transformed to a higher impedance using a
75 Ω adapter of the RAZ type. (That corresponds to 25Ω in series to the input impedance of the instrument.) The correction value in this case is 1.76 dB = 10 log (75Ω/
50Ω).
Remote command:
INPut<ip>:IMPedance on page 136
Center Frequency
Defines the center frequency for Oscilloscope Baseband Input.
Note: If the analysis bandwidth to either side of the defined center frequency exceeds
the allowed range, an error is displayed. In this case, adjust the center frequency or the
analysis bandwidth.
Remote command:
[SENSe:]FREQuency:CENTer on page 146
Signal Path
Illustrates the signal path used for the currrent baseband input settings.
5.3.1.3 I/Q File Input
Access: "Overview" > "Input/Frontend" > "Input Source" > "I/Q File"
43User Manual 1176.8939.02 ─ 07
Page 44

R&S®VSE-K7
Configuration
Input and Frontend Settings
Or: "Input & Output" > "Input Source" > "I/Q File"
Alternatively to "live" data input from a connected instrument, measurement data to be
analyzed by the R&S VSE software can also be provided "offline" by a stored data file.
This allows you to perform a measurement on any instrument, store the results to a
file, and analyze the stored data partially or as a whole at any time using the R&S VSE
software.
Loading a file via drag&drop
As of R&S VSE software version 1.30, you can load a file simply by selecting it in a file
explorer and dragging it to the R&S VSE software. Drop it into the "Measurement
Group Setup" window or the channel bar for any channel. The channel is automatically
configured for file input, if necessary. If the file contains all essential information, the file
input is immediately displayed in the channel. Otherwise, the "Recall I/Q Recording"
dialog box is opened for the selected file so you can enter the missing information.
If the file contains data from multiple channels (e.g. from LTE measurements), it can be
loaded to individual input sources, if the application supports them.
For details see the R&S VSE Base Software User Manual.
The "Input Source" settings defined in the "Input" dialog box are identical to those configured for a specific channel in the "Measurement Group Setup" window.
(See "Controlling Instruments and Capturing Data" in the R&S VSE User Manual).
44User Manual 1176.8939.02 ─ 07
Page 45

R&S®VSE-K7
Configuration
Input and Frontend Settings
If the Frequency Response Correction option (R&S VSE-K544) is installed, the R&S
VSE Analog Demodulation application also supports frequency response correction
using Touchstone (.snp) files or .fres files.
For details on user-defined frequency response correction, see the R&S VSE Base
Software User Manual.
Input Type (Instrument / File)........................................................................................45
Input File....................................................................................................................... 45
Zero Padding.................................................................................................................45
Input Type (Instrument / File)
Selects an instrument or a file as the type of input provided to the channel.
Remote command:
INSTrument:BLOCk:CHANnel[:SETTings]:SOURce<si> on page 139
INPut<ip>:SELect on page 138
Input File
Specifies the I/Q data file to be used for input.
Select "Select File" to open the "Load I/Q File" dialog box.
(See "Data Management - Loading the I/Q Data File" in the R&S VSE User Manual).
Zero Padding
Enables or disables zero padding for input from an I/Q data file that requires resampling. For resampling, a number of samples are required due to filter settling. These
samples can either be taken from the provided I/Q data, or the R&S VSE software can
add the required number of samples (zeros) at the beginning and end of the file.
If enabled, the required number of samples are inserted as zeros at the beginning and
end of the file. The entire input data is analyzed. However, the additional zeros can
effect the determined spectrum of the I/Q data. If zero padding is enabled, a status
message is displayed.
If disabled (default), no zeros are added. The required samples for filter settling are
taken from the provided I/Q data in the file. The start time in the R&S VSE Player is
adapted to the actual start (after filter settling).
Note: You can activate zero padding directly when you load the file, or afterwards in
the "Input Source" settings.
Remote command:
INPut<ip>:FILE:ZPADing on page 135
5.3.2 Amplitude
Access: "Overview" > "Input" > "Amplitude"
or: "Input & Output" > "Amplitude"
Amplitude settings are identical to the base unit.
For background information on amplitude settings see the R&S VSE User Manual.
45User Manual 1176.8939.02 ─ 07
Page 46

R&S®VSE-K7
Configuration
Input and Frontend Settings
Reference Level ...........................................................................................................46
└ Shifting the Display ( Offset ).......................................................................... 46
└ Unit .................................................................................................................47
└
Setting the Reference Level Automatically ( Auto Level )...........................47
Mechanical Attenuation.................................................................................................47
└ Attenuation Mode / Value ...............................................................................47
Using Electronic Attenuation ........................................................................................48
Input Settings................................................................................................................ 48
└ Input Coupling ................................................................................................48
└ Impedance ..................................................................................................... 49
Reference Level
Defines the expected maximum reference level. Signal levels above this value may not
be measured correctly. This is indicated by an "IF Overload" status display.
The reference level can also be used to scale power diagrams; the reference level is
then used as the maximum on the y-axis.
Since the hardware of the connected instrument is adapted according to this value, it is
recommended that you set the reference level close above the expected maximum signal level. Thus you ensure an optimum measurement (no compression, good signal-tonoise ratio).
Remote command:
DISPlay[:WINDow<n>]:TRACe<t>:Y[:SCALe]:RLEVel on page 148
Shifting the Display ( Offset ) ← Reference Level
Defines an arithmetic level offset. This offset is added to the measured level. In some
result displays, the scaling of the y-axis is changed accordingly.
Define an offset if the signal is attenuated or amplified before it is fed into the R&S VSE
so the application shows correct power results. All displayed power level results are
shifted by this value.
The setting range is ±200 dB in 0.01 dB steps.
46User Manual 1176.8939.02 ─ 07
Page 47

R&S®VSE-K7
Configuration
Input and Frontend Settings
Note, however, that the internal reference level (used to adjust the hardware settings to
the expected signal) ignores any "Reference Level Offset" . Thus, it is important to
keep in mind the actual power level the R&S VSE must handle. Do not rely on the displayed reference level (internal reference level = displayed reference level - offset).
Remote command:
DISPlay[:WINDow<n>]:TRACe<t>:Y[:SCALe]:RLEVel:OFFSet on page 149
Unit ← Reference Level
The connected instrument measures the signal voltage at the RF input.
In the default state, the level is displayed at a power level of 1 mW (= dBm). Via the
known input impedance (50 Ω or 75 Ω, see " Impedance " on page 37), conversion to
other units is possible.
The following units are available and directly convertible:
●
dBm
●
dBmV
●
dBμV
●
dBμA
●
dBpW
●
Volt
●
Ampere
●
Watt
Remote command:
INPut<ip>:IMPedance on page 136
CALCulate<n>:UNIT:POWer on page 148
Setting the Reference Level Automatically ( Auto Level ) ← Reference Level
The connected instrument automatically determines the optimal reference level for the
current input data. At the same time, the internal attenuators and the preamplifier are
adjusted so the signal-to-noise ratio is optimized, while signal compression, clipping
and overload conditions are minimized. This function is not available on all supported
instruments.
You can change the measurement time for the level measurement if necessary (see
"Automatic Measurement Time Mode and Value" on page 76).
Remote command:
[SENSe:]ADJust:LEVel on page 149
Mechanical Attenuation
Defines the mechanical attenuation for RF input.
Attenuation Mode / Value ← Mechanical Attenuation
The RF attenuation can be set automatically as a function of the selected reference
level (Auto mode). This ensures that no overload occurs at the "RF Input" connector for
the current reference level. It is the default setting.
In "Manual" mode, you can set the RF attenuation in 1 dB steps (down to 0 dB). Other
entries are rounded to the next integer value. The range is specified in the data sheet.
If the defined reference level cannot be set for the defined RF attenuation, the reference level is adjusted accordingly and the warning "limit reached" is displayed.
47User Manual 1176.8939.02 ─ 07
Page 48

R&S®VSE-K7
Configuration
Input and Frontend Settings
NOTICE! Risk of hardware damage due to high power levels. When decreasing the
attenuation manually, ensure that the power level does not exceed the maximum level
allowed at the RF input, as an overload may lead to hardware damage.
Remote command:
INPut<ip>:ATTenuation on page 150
INPut<ip>:ATTenuation:AUTO on page 150
Using Electronic Attenuation
If the (optional) Electronic Attenuation hardware is installed on the connected instrument, you can also activate an electronic attenuator.
In "Auto" mode, the settings are defined automatically; in "Manual" mode, you can
define the mechanical and electronic attenuation separately.
Note: Note that restrictions may apply concerning which frequencies electronic attenuation is available for, depending on which instrument is connected to the R&S VSE
software. Check your instrument documentation for details.
In "Auto" mode, RF attenuation is provided by the electronic attenuator as much as
possible to reduce the amount of mechanical switching required. Mechanical attenuation may provide a better signal-to-noise ratio, however.
When you switch off electronic attenuation, the RF attenuation is automatically set to
the same mode (auto/manual) as the electronic attenuation was set to. Thus, the RF
attenuation can be set to automatic mode, and the full attenuation is provided by the
mechanical attenuator, if possible.
If the defined reference level cannot be set for the given attenuation, the reference
level is adjusted accordingly and the warning "limit reached" is displayed in the status
bar.
Remote command:
INPut<ip>:EATT:STATe on page 152
INPut<ip>:EATT:AUTO on page 151
INPut<ip>:EATT on page 151
Input Settings
Some input settings affect the measured amplitude of the signal, as well.
For details see Chapter 5.3.1, "Input Source Settings", on page 35.
Input Coupling ← Input Settings
The RF input of the connected instrument can be coupled by alternating current (AC)
or direct current (DC).
AC coupling blocks any DC voltage from the input signal. This is the default setting to
prevent damage to the instrument. Very low frequencies in the input signal may be distorted.
However, some specifications require DC coupling. In this case, you must protect the
instrument from damaging DC input voltages manually. For details, refer to the data
sheet.
Remote command:
INPut<ip>:COUPling on page 134
48User Manual 1176.8939.02 ─ 07
Page 49

R&S®VSE-K7
5.3.3 Frequency
Configuration
Input and Frontend Settings
Impedance ← Input Settings
For some measurements, the reference impedance for the measured levels of the connected instrument can be set to 50 Ω or 75 Ω.
Select 75 Ω if the 50 Ω input impedance is transformed to a higher impedance using a
75 Ω adapter of the RAZ type. (That corresponds to 25Ω in series to the input impedance of the instrument.) The correction value in this case is 1.76 dB = 10 log (75Ω/
50Ω).
Remote command:
INPut<ip>:IMPedance on page 136
Access: "Overview" > "Input" > "Frequency"
or: "Input & Output" > "Frequency"
Configure the center frequency of the input signal.
Center Frequency ........................................................................................................ 49
Center Frequency Stepsize ..........................................................................................50
Center Frequency
Defines the center frequency of the signal in Hertz.
0 Hz ≤ f
f
and span
max
center
≤ f
max
depend on the instrument and are specified in the data sheet.
min
Note: For file input, you can shift the center frequency of the current measurement
compared to the stored measurement data. The maximum shift depends on the sample rate of the file data.
If the file does not provide the center frequency, it is assumed to be 0 Hz.
In order to ensure that the input data remains within the valid analysis bandwidth,
define the center frequency and the analysis bandwidth for the measurement such that
the following applies:
49User Manual 1176.8939.02 ─ 07
Page 50

R&S®VSE-K7
Configuration
Trigger Source Settings
Remote command:
[SENSe:]FREQuency:CENTer on page 146
Center Frequency Stepsize
Defines the step size of the center frequency. The step size can be coupled to the
demodulation bandwidth, or it can be manually set to a fixed value.
"0.1 * Demod
BW"
"0.5 * Demod
BW"
"X * Demod
BW"
"= Center"
"Manual"
Remote command:
[SENSe:]FREQuency:CENTer:STEP:LINK on page 146
[SENSe:]FREQuency:CENTer:STEP:LINK:FACTor on page 147
[SENSe:]FREQuency:CENTer:STEP on page 146
Sets the step size for the center frequency to 10 % of the demodulation bandwidth.
This is the default setting.
Sets the step size for the center frequency to 50 % of the demodulation bandwidth.
Sets the step size for the center frequency to a manually defined factor of the demodulation bandwidth. The "X-Factor" defines the percentage of the demodulation bandwidth.
Values between 1 and 100 % in steps of 1 % are allowed. The default
setting is 10 %.
Sets the step size to the value of the center frequency and removes
the coupling of the step size to the demodulation bandwidth. The
used value is indicated in the "Value" field.
Defines a fixed step size for the center frequency. Enter the step size
in the "Value" field.
5.4 Trigger Source Settings
Access: "Overview" > "Trigger" > "Trigger Source"
or: "Input & Output" > "Trigger"
Triggering means to capture the interesting part of the signal. Choosing the right trigger
type and configuring all trigger settings correctly allows you to detect various incidents
in your demodulated signals.
Optionally, the trigger signal used by the R&S VSE can be output to a connected
device, and an external trigger signal from a connected device can be used by the
R&S VSE.
The trigger input and output settings are described in the R&S VSE Base Software
User Manual.
Trigger settings are identical to the base unit, except for the available trigger sources.
50User Manual 1176.8939.02 ─ 07
Page 51

R&S®VSE-K7
Configuration
Trigger Source Settings
For background information on trigger settings, trigger output and working with external
triggers, see the R&S VSE User Manual.
Trigger Source...............................................................................................................51
└ Free Run ........................................................................................................51
└ External Trigger / Trigger Channel X.............................................................. 51
└ I/Q Power .......................................................................................................52
└ IF Power .........................................................................................................52
└ Magnitude (Offline) ........................................................................................ 52
└ Time ...............................................................................................................52
└ RF Power .......................................................................................................53
Trigger Level ................................................................................................................ 53
Trigger Offset ............................................................................................................... 53
Hysteresis .................................................................................................................... 54
Drop-Out Time ..............................................................................................................54
Slope ............................................................................................................................54
Trigger Holdoff ..............................................................................................................54
Trigger Source
In the Analog Demodulation application, the next measurement can be triggered if the
selected input signal exceeds the threshold specified using the "Trigger Level" setting
(see " Trigger Level " on page 53). Thus, a periodic signal modulated onto the carrier
frequency can be displayed. It is recommended that the measurement time covers at
least five periods of the audio signal.
Note that which trigger sources are available depends on the connected instrument.
Remote command:
TRIGger[:SEQuence]:SOURce on page 166
Free Run ← Trigger Source
No trigger source is considered. Data acquisition is started manually or automatically
and continues until stopped explicitly.
Remote command:
TRIG:SOUR IMM, see TRIGger[:SEQuence]:SOURce on page 166
External Trigger / Trigger Channel X ← Trigger Source
Data acquisition starts when the signal fed into the specified input connector or input
channel of the connected instrument meets or exceeds the specified trigger level.
51User Manual 1176.8939.02 ─ 07
Page 52

R&S®VSE-K7
Configuration
Trigger Source Settings
Note: Which input and output connectors are available depends on the connected
instrument. For details, see the instrument's documentation.
For a connected R&S RTO, the following signals are used as trigger input:
●
"External Trigger": "EXT TRIGGER INPUT" connector on rear panel of instrument
●
"Trigger Channel 2"/"Trigger Channel 3"/"Trigger Channel 4": Input at channel connectors "CH 2/3/4" on front panel of instrument - if not used as an input source
Remote command:
TRIG:SOUR EXT, TRIG:SOUR EXT2, TRIG:SOUR EXT3, TRIG:SOUR EXT4
See TRIGger[:SEQuence]:SOURce on page 166
I/Q Power ← Trigger Source
Triggers the measurement when the magnitude of the sampled I/Q data exceeds the
trigger threshold.
The trigger bandwidth corresponds to the resolution bandwidth setting for data acquisition (see " Resolution Bandwidth " on page 55).
Remote command:
TRIG:SOUR IQP, see TRIGger[:SEQuence]:SOURce on page 166
IF Power ← Trigger Source
The R&S VSE starts capturing data as soon as the trigger level is exceeded around
the third intermediate frequency.
(The third IF represents the center frequency.)
This trigger source is only available for RF input.
The available trigger levels depend on the RF attenuation and preamplification. A refer-
ence level offset, if defined, is also considered.
When using the optional 2 GHz bandwidth extension (R&S FSW-B2000) with an IF
power trigger, the IF power trigger corresponds to a "width" trigger on the oscilloscope,
with a negative polarity and the range "longer". Thus, data acquisition starts when both
of the following conditions apply to the signal fed into the CH1 input connector on the
oscilloscope:
●
The power level has remained below the specified trigger level for a duration longer than the drop-out time.
●
The power level then rises above the specified trigger level.
For details on available trigger levels and trigger bandwidths, see the data sheet.
Remote command:
TRIG:SOUR IFP, see TRIGger[:SEQuence]:SOURce on page 166
Magnitude (Offline) ← Trigger Source
For (offline) input from a file, rather than an instrument. Triggers on a specified signal
level.
Remote command:
TRIG:SOUR MAGN, see TRIGger[:SEQuence]:SOURce on page 166
Time ← Trigger Source
Triggers in a specified repetition interval.
52User Manual 1176.8939.02 ─ 07
Page 53

R&S®VSE-K7
Configuration
Trigger Source Settings
For file input, data is taken from the file in the specified time interval. Overlap settings
for the R&S VSE Player are ignored.
Remote command:
TRIG:SOUR TIME, see TRIGger[:SEQuence]:SOURce on page 166
RF Power ← Trigger Source
Defines triggering of the measurement via signals which are outside the displayed
measurement range.
For this purpose, the software uses a level detector at the first intermediate frequency.
The resulting trigger level at the RF input depends on the RF attenuation and preampli-
fication. For details on available trigger levels, see the instrument's data sheet.
Note: If the input signal contains frequencies outside of this range (e.g. for fullspan
measurements), the sweep may be aborted. A message indicating the allowed input
frequencies is displayed in the status bar.
A "Trigger Offset" , "Trigger Polarity" and "Trigger Holdoff" (to improve the trigger stability) can be defined for the RF trigger, but no "Hysteresis" .
Remote command:
TRIG:SOUR RFP, see TRIGger[:SEQuence]:SOURce on page 166
Trigger Level
Defines the trigger level for the specified trigger source.
For details on supported trigger levels, see the data sheet.
Remote command:
TRIGger[:SEQuence]:LEVel:IFPower on page 163
TRIGger[:SEQuence]:LEVel:IQPower on page 163
TRIGger[:SEQuence]:LEVel[:EXTernal<port>] on page 162
TRIGger[:SEQuence]:LEVel:RFPower on page 164
TRIGger[:SEQuence]:LEVel:AM:RELative on page 164
TRIGger[:SEQuence]:LEVel:AM[:ABSolute] on page 164
TRIGger[:SEQuence]:LEVel:FM on page 165
TRIGger[:SEQuence]:LEVel:PM on page 165
TRIGger[:SEQuence]:LEVel:MAPower on page 163
Trigger Offset
Defines the time offset between the trigger event and the start of the sweep.
Offset > 0: Start of the sweep is delayed
Offset < 0: Sweep starts earlier (pretrigger)
(If supported by the connected instrument.)
Remote command:
TRIGger[:SEQuence]:HOLDoff[:TIME] on page 161
53User Manual 1176.8939.02 ─ 07
Page 54

R&S®VSE-K7
Configuration
Data Acquisition
Hysteresis
Defines the distance in dB to the trigger level that the trigger source must exceed
before a trigger event occurs. Setting a hysteresis avoids unwanted trigger events
caused by noise oscillation around the trigger level.
When using the optional 2 GHz bandwidth extension (R&S FSW-B2000) with an IF
power trigger, the hysteresis refers to the robust width trigger.
This setting is only available for "IF Power" or "Magnitude (Offline)" trigger sources.
The range of the value depends on the connected instrument.
Remote command:
TRIGger[:SEQuence]:IFPower:HYSTeresis on page 162
TRIGger[:SEQuence]:MAPower:HYSTeresis on page 166
Drop-Out Time
Defines the time the input signal must stay below the trigger level before triggering
again.
When using the optional 2 GHz bandwidth extension (R&S FSW-B2000) with an IF
power trigger, the drop-out time defines the width of the robust width trigger. By default
it is set to 1 μs. For external triggers, no drop-out time is available when using the
B2000 option.
Remote command:
TRIGger[:SEQuence]:DTIMe on page 161
Slope
For all trigger sources except time, you can define whether triggering occurs when the
signal rises to the trigger level or falls down to it.
When using the optional 2 GHz bandwidth extension (R&S FSW-B2000) with an IF
power trigger, only rising slopes can be detected.
Remote command:
TRIGger[:SEQuence]:SLOPe on page 166
Trigger Holdoff
Defines the minimum time (in seconds) that must pass between two trigger events.
Trigger events that occur during the holdoff time are ignored.
Remote command:
TRIGger[:SEQuence]:IFPower:HOLDoff on page 161
TRIGger[:SEQuence]:MAPower:HOLDoff on page 165
5.5 Data Acquisition
Configure how data is to be acquired and then demodulated in the "Data Acquisition"
dialog box.
● Bandwidth Settings................................................................................................. 55
● Capture Settings..................................................................................................... 56
54User Manual 1176.8939.02 ─ 07
Page 55

R&S®VSE-K7
5.5.1 Bandwidth Settings
Configuration
Data Acquisition
Access: "Overview" > "Data Acquisition" > "Bandwidth"
or: "Meas Setup" > "Capture" > "Bandwidth"
Demodulation Bandwidth ............................................................................................. 55
Demodulation Filter ......................................................................................................55
Measurement Time (AQT).............................................................................................55
Resolution Bandwidth .................................................................................................. 55
Demodulation Bandwidth
Defines the demodulation bandwidth of the measurement. The demodulation bandwidth determines the sample rate with which the input signal is captured and analyzed.
For recommendations on finding the correct demodulation bandwidth see Chapter 4.2,
"Demodulation Bandwidth", on page 22.
Remote command:
[SENSe:]BWIDth:DEMod on page 159
Demodulation Filter
Defines the filter to be used for demodulation.
For details on sample rates, measurement times and trigger offsets for various demod-
ulation bandwidths when using a Gaussian filter, see Chapter 4.3, "Sample Rate and
Demodulation Bandwidth", on page 22.
"Flat"
"Gauss"
Remote command:
[SENSe:]BWIDth:DEMod:TYPE on page 159
Measurement Time (AQT)
Defines how long data is acquired for demodulation.
Remote command:
[SENSe:]ADEMod<n>:MTIMe on page 156
Default
Optimizes the settling behavior of the filter
Resolution Bandwidth
Defines the resolution bandwidth for data acquisition. The available range is specified
in the data sheet.
Remote command:
[SENSe:]BANDwidth[:RESolution] on page 159
55User Manual 1176.8939.02 ─ 07
Page 56

R&S®VSE-K7
5.5.2 Capture Settings
Configuration
Data Acquisition
Access: "Overview" > "Data Acquisition" > "Capture"
or: "Meas Setup" > "Capture"
The capture settings define how much data from the input signal is acquired and then
demodulated.
Figure 5-2: Capture settings with active spectrogram
Measurement Time (AQT)
Points............................................................................................................................ 56
Capture Count...............................................................................................................57
Select Frame.................................................................................................................57
Continue Frame ........................................................................................................... 57
Frame Count ................................................................................................................ 57
Clear Spectrogram .......................................................................................................58
Measurement Time (AQT)
Defines how long data is acquired for demodulation.
Remote command:
[SENSe:]ADEMod<n>:MTIMe on page 156
Points
This value defines the number of trace points that are evaluated and displayed in the
result diagrams.
Note: The capture settings are window-specific. For some result displays, the points
may not be editable as they are determined automatically, or restrictions may apply.
Remote command:
[SENSe:]SWEep:POINts on page 160
.............................................................................................56
56User Manual 1176.8939.02 ─ 07
Page 57

R&S®VSE-K7
Configuration
Data Acquisition
Capture Count
Defines the number of times data is captured in single sweep mode. Values from 0 to
200000 are allowed. If the values 0 or 1 are set, one sweep is performed.
The capture count is applied to all the traces in all diagrams.
If the trace modes "Average", "Max Hold" or "Min Hold" are set, this value also deter-
mines the number of averaging or maximum search procedures.
In continuous sweep mode, if capture count = 0 (default), averaging is performed over
10 sweep. For capture count =1, no averaging, maxhold or minhold operations are performed.
For spectrogram displays, the capture count determines how many captures are combined in one frame in the spectrogram, i.e. how many captures the R&S VSE performs
to plot one trace in the spectrogram result display. For more details see Chapter 4.6.1,
"Time Frames", on page 27.
Remote command:
[SENSe:]AVERage<n>:COUNt on page 193
Select Frame
Selects a specific frame, loads the corresponding trace from the memory, and displays
it in the Spectrum window.
Note that activating a marker or changing the position of the active marker automatically selects the frame that belongs to that marker.
This function is only available in single sweep mode or if the sweep is stopped, and
only if a spectrogram is selected.
The most recent frame is number 0, all previous frames have a negative number.
For more details see the R&S VSE base software user manual.
Remote command:
CALCulate<n>:SPECtrogram:FRAMe:SELect on page 197
CALCulate<n>:SPECtrogram:FRAMe:SELect on page 197
Continue Frame
Determines whether the results of the previous sweeps are included in the analysis of
the next sweeps for trace modes "Max Hold" , "Min Hold" , and "Average" .
This function is available in single sweep mode only.
●
On
When the average or peak values are determined for the new sweep, the results of
the previous sweeps in the spectrogram are also taken into account.
●
Off
The average or peak values are determined from the results of the newly swept
frames only.
Remote command:
CALCulate<n>:SPECtrogram:CONTinuous on page 196
Frame Count
Determines how many frames are plotted during a single capture (as opposed to a
continuous capture). The maximum number of possible frames depends on the history
depth (see " History Depth " on page 85).
57User Manual 1176.8939.02 ─ 07
Page 58

R&S®VSE-K7
5.6 Demodulation
Configuration
Demodulation
For more details see Chapter 4.6.1, "Time Frames", on page 27.
Remote command:
CALCulate<n>:SPECtrogram:FRAMe:COUNt on page 197
Clear Spectrogram
Resets the spectrogram result display and clears the history buffer.
This function is only available if a spectrogram is selected.
Remote command:
CALCulate<n>:SPECtrogram:CLEar[:IMMediate] on page 196
Access: "Overview" > "Demod Settings"
Or: "Meas Setup" > "Demod"
● Basic Demodulation Measurement Parameters (Demod).......................................58
● Demodulation Spectrum..........................................................................................61
● AF Filter...................................................................................................................64
● Scaling.................................................................................................................... 67
● Units........................................................................................................................71
● Result Table Settings.............................................................................................. 72
5.6.1 Basic Demodulation Measurement Parameters (Demod)
Access: "Overview" > "Demod Settings" > "Demod"
Or: "Meas Setup" > "Demod" > "Demod" tab
The basic demodulation measurement parameters define how the measurement is
performed.
58User Manual 1176.8939.02 ─ 07
Page 59

R&S®VSE-K7
Configuration
Demodulation
Squelch State ...............................................................................................................59
Squelch Level ...............................................................................................................59
AF Coupling ................................................................................................................. 59
Selected Trace .............................................................................................................60
Time Domain Zoom ......................................................................................................60
└ State ...............................................................................................................60
└ Start ............................................................................................................... 60
└ Length ............................................................................................................61
Zero Phase Reference Position (PM Time Domain only)..............................................61
Phase Wrap On/Off (PM Time Domain only)................................................................ 61
Squelch State
Activates the squelch function, that is: if the signal falls below a defined threshold, the
demodulated data is automatically set to 0. This is useful, for example, to avoid
demodulation noise during transmission breaks.
This function is only available for FM demodulation.
Remote command:
[SENSe:]ADEMod<n>:SQUelch[:STATe] on page 171
Squelch Level
Defines the level threshold below which the demodulated data is set to 0 if squelching
is enabled. The squelch level is an absolute value.
Remote command:
[SENSe:]ADEMod<n>:SQUelch:LEVel on page 171
AF Coupling
Controls the automatic correction of the frequency offset and phase offset of the input
signal:
This function is only available for FM or PM time domain evaluations.
●
FM time evaluation
59User Manual 1176.8939.02 ─ 07
Page 60

R&S®VSE-K7
Configuration
Demodulation
If DC is selected, the absolute frequency is displayed, i.e. an input signal with an
offset relative to the center frequency is not displayed symmetrically with respect to
the zero line.
If AC is selected, the frequency offset is automatically corrected, i.e. the trace is
always symmetric with respect to the zero line.
●
PM time evaluation
If DC is selected, the phase runs according to the existing frequency offset. In addition, the DC signal contains a phase offset of ± π.
If AC is selected, the frequency offset and phase offset are automatically corrected,
i.e. the trace is always symmetric with respect to the zero line.
Remote command:
[SENSe:]ADEMod<n>:AF:COUPling on page 170
Selected Trace
Defines the trace used to determine the results in the Result Summary.
Time Domain Zoom
Using the time domain zoom, the demodulated data for a particular time span is extracted and displayed in more detail. This is useful if the measurement time is very large
and thus each sweep point represents a large time span. The time domain zoom function distributes the available sweep points only among the time span defined by the
zoom area length. The time span displayed per division of the diagram is decreased.
Thus, the display of the extracted time span becomes more precise. Note that the time
domain zoom area affects not only the diagram display, but the entire evaluation for the
current window.
This function is only available for evaluations in the time domain.
Tip: In addition to the Time Domain Zoom, a graphical zoom is available for all diagram
evaluations. However, the graphical zoom is useful only if more measured values than
trace points are available. The (time) span represented by each measurement point
remains the same.
For details see the R&S VSE User Manual.
State ← Time Domain Zoom
Activates or deactivates the time domain zoom mode.
"On"
"Off"
Remote command:
[SENSe:]ADEMod<n>:ZOOM[:STATe] on page 173
Start ← Time Domain Zoom
Defines the start time for the time domain zoom area. For spectrum evaluations the
start time is always 0.
Remote command:
[SENSe:]ADEMod<n>:ZOOM:STARt on page 173
Activates the time domain zoom.
Deactivates the time domain zoom and restores the original display. If
more measured values than measurement points are available, several measured values are combined in one measurement point
according to the method of the selected trace detector.
60User Manual 1176.8939.02 ─ 07
Page 61

R&S®VSE-K7
Configuration
Demodulation
Length ← Time Domain Zoom
Defines the length of the time domain zoom area. Enter the length as a time value
manually, or use the "Auto" setting to set the length to the current number of sweep
points automatically.
Remote command:
[SENSe:]ADEMod<n>:ZOOM:LENGth on page 172
[SENSe:]ADEMod<n>:ZOOM:LENGth:MODE on page 172
Zero Phase Reference Position (PM Time Domain only)
Defines the position at which the phase of the PM-demodulated signal is set to 0 rad.
The entry is made with respect to time. In the default setting, the first measured value
is set to 0 rad.
This setting is only available for PM time domain displays with DC coupling.
Remote command:
[SENSe:]ADEMod<n>:PM:RPOint[:X] on page 171
Phase Wrap On/Off (PM Time Domain only)
Activates/deactivates the phase wrap.
On The phase is displayed in the range ±180° (± Π). For example, if the phase exceeds +180°,
360° is subtracted from the phase value, with the display thus showing >-180°.
Off The phase is not wrapped.
This setting is only available for PM time domain displays with DC coupling.
5.6.2 Demodulation Spectrum
Access: "Overview" > "Demod Settings" > "Spectrum"
Or: "Meas Setup" > "Demod" > "Spectrum" tab
The demodulation spectrum defines which span of the demodulated data is evaluated.
Depending on the evaluation (AF or RF display), the settings vary.
● AF Evaluation..........................................................................................................61
● RF Evaluation..........................................................................................................63
5.6.2.1 AF Evaluation
Access: "Overview" > "Demod Settings" > "Spectrum"
Or: "Meas Setup" > "Demod" > "Spectrum" tab
These settings are only available for AF Spectrum evaluations, not in the time domain.
61User Manual 1176.8939.02 ─ 07
Page 62

R&S®VSE-K7
Configuration
Demodulation
AF Center .....................................................................................................................62
AF Start ........................................................................................................................62
AF Stop ........................................................................................................................ 62
AF Span ....................................................................................................................... 62
AF Full Span ................................................................................................................ 63
AF Center
Defines the center frequency of the demodulated data to evaluate.
Remote command:
[SENSe:]ADEMod<n>:AF:CENTer on page 174
AF Start
Defines the start frequency of the demodulated data to evaluate.
Remote command:
[SENSe:]ADEMod<n>:AF:STARt on page 175
AF Stop
Defines the stop frequency of the demodulated data to evaluate.
The maximum AF stop frequency corresponds to half the demodulation bandwidth.
Remote command:
[SENSe:]ADEMod<n>:AF:STOP on page 175
AF Span
Defines the span (around the center frequency) of the demodulated data to evaluate.
The maximum span is DBW/2.
Remote command:
[SENSe:]ADEMod<n>:AF:SPAN on page 174
62User Manual 1176.8939.02 ─ 07
Page 63

R&S®VSE-K7
5.6.2.2 RF Evaluation
Configuration
Demodulation
AF Full Span
Sets the span (around the center frequency) of the demodulated data to the maximum
of DBW/2.
Remote command:
[SENSe:]ADEMod<n>:AF:SPAN:FULL on page 175
Access: "Overview" > "Demod Settings" > "Spectrum"
Or: "Meas Setup" > "Demod" > "Spectrum" tab
These settings are only available for RF evaluation, both in time and frequency
domain. Note that for RF data the center frequency and demodulation bandwidth correspond to the settings defined in the "Input" and "Data Acquisition" configuration.
Center Frequency ........................................................................................................ 63
Span .............................................................................................................................64
Demodulation Bandwidth ............................................................................................. 64
RF Full Span................................................................................................................. 64
Center Frequency
Defines the center frequency of the signal in Hertz.
0 Hz ≤ f
f
and span
max
center
≤ f
max
depend on the instrument and are specified in the data sheet.
min
Note: For file input, you can shift the center frequency of the current measurement
compared to the stored measurement data. The maximum shift depends on the sample rate of the file data.
If the file does not provide the center frequency, it is assumed to be 0 Hz.
63User Manual 1176.8939.02 ─ 07
Page 64

R&S®VSE-K7
Configuration
Demodulation
In order to ensure that the input data remains within the valid analysis bandwidth,
define the center frequency and the analysis bandwidth for the measurement such that
the following applies:
Remote command:
[SENSe:]FREQuency:CENTer on page 146
Span
Defines the frequency span. The center frequency is kept constant. The following
range is allowed:
span = 0: 0 Hz
span >0:
span
and f
f
min
max
and span
max
≤ f
span
=DBW/2
min
≤ f
max
are specified in the data sheet.
Remote command:
[SENSe:]ADEMod<n>:SPECtrum:SPAN[:MAXimum] on page 176
[SENSe:]ADEMod<n>:SPECtrum:SPAN:ZOOM on page 176
Demodulation Bandwidth
Defines the demodulation bandwidth of the measurement. The demodulation bandwidth determines the sample rate with which the input signal is captured and analyzed.
For recommendations on finding the correct demodulation bandwidth see Chapter 4.2,
"Demodulation Bandwidth", on page 22.
Remote command:
[SENSe:]BWIDth:DEMod on page 159
RF Full Span
Sets the span (around the center frequency) of the RF data to be evaluated to the
demodulation bandwidth.
Remote command:
[SENSe:]ADEMod<n>:SPECtrum:SPAN[:MAXimum] on page 176
5.6.3 AF Filter
Access: "Overview" > "Demod Settings" > "AF Filter"
Or: "Meas Setup" > "Demod" > "AF Filter" tab
The AF filter reduces the evaluated bandwidth of the demodulated signal and can
define a weighting function.
64User Manual 1176.8939.02 ─ 07
Page 65

R&S®VSE-K7
Configuration
Demodulation
AF filters are only available for AF evaluations, not for RF evaluation.
High Pass .....................................................................................................................65
Low Pass ......................................................................................................................65
Weighting ..................................................................................................................... 66
Deemphasis ................................................................................................................. 67
Deactivating all AF Filters............................................................................................. 67
High Pass
Defines a high pass filter with the given limit to separate the DC component. The filters
are indicated by the 3 dB cutoff frequency. The 50 Hz and 300 Hz filters are designed
as 2nd-order Butterworth filter (12 dB/octave). The 20 Hz filter is designed as 3rd-order
Butterworth filter (18 dB/octave).
The high pass filters are active in the following demodulation bandwidth range:
None No AF Filter used (default)
20 Hz 100 Hz ≤ demodulation bandwidth ≤ 1.6 MHz
50 Hz: 200 Hz ≤ demodulation bandwidth ≤ 3 MHz
300 Hz: 800 Hz ≤ demodulation bandwidth ≤ 8 MHz
Manual: A high pass filter with the manually defined frequency is used.
Remote command:
[SENSe:]FILTer<n>:HPASs[:STATe] on page 180
[SENSe:]FILTer<n>:HPASs:FREQuency[:ABSolute] on page 179
[SENSe:]FILTer<n>:HPASs:FREQuency:MANual on page 179
Low Pass
Defines a low pass filter type. Relative and absolute low pass filter are available.
65User Manual 1176.8939.02 ─ 07
Page 66

R&S®VSE-K7
Configuration
Demodulation
●
Absolute low pass filters:
Absolute filters are indicated by the 3 dB cutoff frequency. The 3 kHz, 15 kHz and
23 kHz filters are designed as 5th-order Butterworth filters (30 dB/octave). The 150
kHz filter is designed as 8th-order Butterworth filter (48 dB/octave).
The absolute low pass filters are active in the following demodulation bandwidth
range:
Filter type Demodulation bandwidth
3 kHz: 6.4 kHz ≤ demodulation bandwidth ≤ 3 MHz
15 kHz: 50 kHz ≤ demodulation bandwidth ≤ 8 MHz
23 kHz 50 kHz ≤ demodulation bandwidth ≤ 18 MHz
150 kHz: 400 kHz ≤ demodulation bandwidth ≤ 8 MHz
Manual: A low pass filter with the manually defined frequency is used.
●
Relative low pass filters:
Relative filters (3 dB) can be selected in % of the demodulation bandwidth. The filters are designed as 5th-order Butterworth filter (30 dB/octave) and active for all
demodulation bandwidths.
●
"NONE" deactivates the AF low pass filter (default).
Remote command:
[SENSe:]FILTer<n>:LPASs[:STATe] on page 181
[SENSe:]FILTer<n>:LPASs:FREQuency[:ABSolute] on page 180
[SENSe:]FILTer<n>:LPASs:FREQuency:RELative on page 181
[SENSe:]FILTer<n>:LPASs:FREQuency:MANual on page 180
Weighting
Selects a weighting AF filter. By default, no weighting filter is active.
"A weighted"
Switches on the A weighted filter. The weighting filter is active in the
following demodulation bandwidth range:
100 kHz ≤ demodulation bandwidth ≤ 800 kHz
"CCITT"
Switches on a CCITT P.53 weighting filter. The weighting filter is
active in the following demodulation bandwidth range:
20 kHz ≤ demodulation bandwidth ≤ 3 MHz
"CCIR weighted"
Switches on the CCIR weighted filter. The weighting filter is active in
the following demodulation bandwidth range:
100 kHz ≤ demodulation bandwidth ≤ 3.0 MHz
"CCIR
unweighted"
Switches on the CCIR unweighted filter, which is the combination of
the 20 Hz highpass and 23 kHz low pass filter. The weighting filter is
active in the following demodulation bandwidth range:
50 kHz ≤ demodulation bandwidth ≤ 1.6 MHz
Remote command:
[SENSe:]FILTer<n>:CCITt on page 178
[SENSe:]FILTer<n>:CCIR[:UNWeighted][:STATe] on page 178
[SENSe:]FILTer<n>:CCIR:WEIGhted[:STATe] on page 177
[SENSe:]FILTer<n>:AWEighted[:STATe] on page 177
66User Manual 1176.8939.02 ─ 07
Page 67

R&S®VSE-K7
Configuration
Demodulation
Deemphasis
Activates a deemphasis filter with the given time constant.
Sometimes a modulated signal is extorted by a pre-emphasis filter before transmission,
for example to eliminate frequencies that are more prone to interferences. In this case,
the emphasis function must be reversed after demodulation. This is done by the deemphasis filter.
The deemphasis filter is active in the following demodulation bandwidth range:
25 µs: 25 kHz ≤ demodulation bandwidth ≤ 40 MHz
50 µs: 6.4 kHz ≤ demodulation bandwidth ≤ 18 MHz
75 µs: 6.4 kHz ≤ demodulation bandwidth ≤ 18 MHz
750 µs: 800 Hz ≤ demodulation bandwidth ≤ 3 MHz
Depending on the deemphasis filter, a minimum demodulation bandwidth is required
for an error less than 0.5 dB, up to a maximum AF frequency. The following table
shows the dependencies.
Deemphasis [us] 25 µs 50 µs 75 µs 750 µs
Max. AF frequency 25 kHz 12 kHz 8 kHz 800 Hz
Required demodulation bandwidth ≥ 200 kHz ≥ 100 kHz ≥ 50 kHz ≥ 6.4 kHz
For higher AF frequencies the demodulation bandwidth must be increased.
Remote command:
[SENSe:]FILTer<n>:DEMPhasis[:STATe] on page 179
[SENSe:]FILTer<n>:DEMPhasis:TCONstant on page 178
Deactivating all AF Filters
The "All Filter Off" button deactivates all AF filters for the selected evaluation.
Remote command:
[SENSe:]FILTer<n>:AOFF on page 177
5.6.4 Scaling
Access: "Overview" > "Demod Settings" > "Scaling"
Or: "Meas Setup" > "Demod" > "Scaling" tab
The scaling parameters define the range of the demodulated data to be displayed.
● AF Evaluation..........................................................................................................67
● RF Evaluation..........................................................................................................70
5.6.4.1 AF Evaluation
Access: "Overview" > "Demod Settings" > "Scaling"
Or: "Meas Setup" > "Demod" > "Scaling" tab
67User Manual 1176.8939.02 ─ 07
Page 68

R&S®VSE-K7
Configuration
Demodulation
These settings are only available for AF evaluations.
Dev per Division / dB per Division ................................................................................68
Reference Value Position..............................................................................................68
Reference Value ...........................................................................................................69
AF Coupling ................................................................................................................. 69
Deviation ...................................................................................................................... 70
AF Auto Scale .............................................................................................................. 70
Dev per Division / dB per Division
Defines the modulation depth or the phase deviation or frequency deviation per division (logarithmic: 0.1 to 20 dB):
AM display: 0.0001 % to 1000 %
FM display: 1 Hz/div to 100 MHz/div
PM display: 0.0001 rad/div to 1000 rad/div
Note: The value defined per division refers to the default display of 10 divisions on the
y-axis. If fewer divisions are displayed (e.g. because the window is reduced in height),
the range per division is increased in order to display the same result range in the
smaller window. In this case, the per division value does not correspond to the actual
display.
Remote command:
DISPlay[:WINDow<n>]:TRACe<t>:Y[:SCALe]:PDIVision on page 154
Reference Value Position
Determines the position of the reference value for the modulation depth or the phase
deviation or frequency deviation on the y-axis of the diagram.
68User Manual 1176.8939.02 ─ 07
Page 69

R&S®VSE-K7
Configuration
Demodulation
The position is entered as a percentage of the diagram height with 100 % corresponding to the upper diagram border. The default setting is 50 % (diagram center) for the
AF time evaluations and 100 % (upper diagram border) for the AF spectrum evaluations.
Remote command:
DISPlay[:WINDow<n>]:TRACe<t>:Y[:SCALe]:RPOSition on page 155
Reference Value
Determines the modulation depth or the phase deviation or the frequency deviation at
the reference line of the y-axis. The reference value can be set specifically for each
evaluation.
●
AF time display
The trace display takes individual frequency/phase offsets into account (in contrast,
the AF Coupling setting permits automatic correction by the average frequency/
phase offset of the signal, and therefore cannot be activated simultaneously).
●
AF spectrum display
In the default setting, the reference value defines the modulation depth or the
FM/PM deviation at the upper diagram border.
Possible values:
●
AM: 0 and ± 10000 %
●
FM: 0 and ± 10 MHz
●
PM: 0 and ± 10000 rad
Note: The reference value for the AF range in the window title bar is displayed with
respect to the defined reference position. The position may vary for different windows.
For time domain and frequency domain windows, for example, a different reference
value may be displayed, although the same reference is actually used (but the positions vary).
Remote command:
DISPlay[:WINDow<n>]:TRACe<t>:Y[:SCALe]:RVALue on page 182
AF Coupling
Controls the automatic correction of the frequency offset and phase offset of the input
signal:
This function is only available for FM or PM time domain evaluations.
●
FM time evaluation
If DC is selected, the absolute frequency is displayed, i.e. an input signal with an
offset relative to the center frequency is not displayed symmetrically with respect to
the zero line.
If AC is selected, the frequency offset is automatically corrected, i.e. the trace is
always symmetric with respect to the zero line.
●
PM time evaluation
If DC is selected, the phase runs according to the existing frequency offset. In addition, the DC signal contains a phase offset of ± π.
If AC is selected, the frequency offset and phase offset are automatically corrected,
i.e. the trace is always symmetric with respect to the zero line.
Remote command:
[SENSe:]ADEMod<n>:AF:COUPling on page 170
69User Manual 1176.8939.02 ─ 07
Page 70

R&S®VSE-K7
5.6.4.2 RF Evaluation
Configuration
Demodulation
Deviation
Switches between logarithmic and linear display of the modulation depth or the phase
deviation or the frequency deviation.
Remote command:
DISPlay[:WINDow<n>]:TRACe<t>:Y:SPACing on page 155
AF Auto Scale
Activates automatic scaling of the y-axis for AF measurements. RF power and RF
spectrum measurements are not affected by the auto-scaling.
Remote command:
[SENSe:]ADJust:SCALe[:Y]:AUTO[:CONTinuous] on page 189
Access: "Overview" > "Demod Settings" > "Scaling"
Or: "Meas Setup" > "Demod" > "Scaling" tab
These settings are only available for RF evaluations and the result summary.
Range ...........................................................................................................................70
Ref Level Position ........................................................................................................ 71
Auto Scale Once .......................................................................................................... 71
Scaling ......................................................................................................................... 71
Range
Defines the displayed y-axis range in dB.
The default value is 100 dB.
For Analog Demodulation measurements, time domain scaling is defined in Hz
(default: 500 kHz).
Remote command:
DISPlay[:WINDow<n>]:TRACe<t>:Y[:SCALe] on page 153
70User Manual 1176.8939.02 ─ 07
Page 71

R&S®VSE-K7
Configuration
Demodulation
Ref Level Position
Defines the reference level position, i.e. the position of the maximum AD converter
value on the level axis in %, where 0 % corresponds to the lower and 100 % to the
upper limit of the diagram.
Only available for RF measurements.
Remote command:
DISPlay[:WINDow<n>]:TRACe<t>:Y[:SCALe]:RPOSition on page 155
Auto Scale Once
Automatically determines the optimal range and reference level position to be displayed for the current measurement settings.
The display is only set once; it is not adapted further if the measurement settings are
changed again.
This function is only available for RF measurements.
Remote command:
DISPlay[:WINDow<n>]:TRACe<t>:Y[:SCALe]:AUTO ONCE on page 154
Scaling
Defines the scaling method for the y-axis.
"Logarithmic"
"Linear with
Unit"
"Linear Percent"
"Absolute"
"Relative"
Remote command:
DISPlay[:WINDow<n>]:TRACe<t>:Y:SPACing on page 155
DISPlay[:WINDow<n>]:TRACe<t>:Y[:SCALe]:MODE on page 154
5.6.5 Units
Access: "Overview" > "Demod Settings" > "Unit"
Logarithmic scaling (only available for logarithmic units - dB..., and A,
V, Watt)
Linear scaling in the unit of the measured signal
Linear scaling in percentages from 0 to 100
The labeling of the level lines refers to the absolute value of the reference level (not available for "Linear Percent" )
The scaling is in dB, relative to the reference level (only available for
logarithmic units - dB...). The upper line of the grid (reference level) is
always at 0 dB.
Or: "Meas Setup" > "Demod" > "Unit" tab
The units define how the demodulated data is displayed.
71User Manual 1176.8939.02 ─ 07
Page 72

R&S®VSE-K7
Configuration
Demodulation
Phase Unit (Rad/Deg)...................................................................................................72
THD Unit (%/ DB)..........................................................................................................72
Relative Unit .................................................................................................................72
Phase Unit (Rad/Deg)
Sets the phase unit to rad or deg for displaying PM signals.
Remote command:
UNIT<n>:ANGLe on page 182
THD Unit (%/ DB)
Sets the unit to percent or DB for the calculation of the THD (in the Result Summary).
Remote command:
UNIT<n>:THD on page 183
Relative Unit
Defines the unit for relative demodulation results (see Chapter 5.6.6, "Result Table Set-
tings", on page 72).
Remote command:
CONFigure:ADEMod:RESults:UNIT on page 185
5.6.6 Result Table Settings
Access: "Overview" > "Demod Settings" > "Result Table"
Or: "Meas Setup" > "Demod" > "Result Table" tab
72User Manual 1176.8939.02 ─ 07
Page 73

R&S®VSE-K7
Configuration
Demodulation
The demodulation results are displayed in the Result Summary table (see also " Result
Summary " on page 17). The detectors used to determine the results can be config-
ured.
In addition to common absolute demodulation, the R&S VSE Analog Demodulation
application also provides demodulation results relative to user-defined or measured
reference values in the Result Summary.
The settings for the Result Summary can be defined individually for the different modulation types (FM, AM, PM). For each modulation, a separate tab is provided in the dialog box.
Detector ........................................................................................................................73
Mode ............................................................................................................................ 73
State .............................................................................................................................74
Reference Value ...........................................................................................................74
Meas -> Reference .......................................................................................................74
Detector
Detector type for demodulation results
"+ Peak"
"- Peak"
"+/- Peak"
"RMS"
Remote command:
The detector is specified by the DETector<det> suffix in
CONFigure:RELative:AM|FM|PM:DETector<det>... commands.
Positive peak
Negative peak
Autopeak
Root mean square
Mode
Defines the mode with which the demodulation result is determined.
The modes are similar to those for the entire trace (see " Trace Mode " on page 79).
73User Manual 1176.8939.02 ─ 07
Page 74

R&S®VSE-K7
Configuration
Demodulation
"Clear Write"
"Max Hold"
"Average"
Remote command:
CONFigure:ADEMod:RESults:AM:DETector<det>:MODE on page 185
CONFigure:ADEMod:RESults:FM:DETector<det>:MODE on page 185
CONFigure:ADEMod:RESults:PM:DETector<det>:MODE on page 185
State
Activates relative demodulation for the selected detector. If activated, the demodulated
result is set in relation to the Reference Value .
Remote command:
CONFigure:ADEMod:RESults:AM:DETector<det>:STATe on page 184
CONFigure:ADEMod:RESults:FM:DETector<det>:STATe on page 184
CONFigure:ADEMod:RESults:PM:DETector<det>:STATe on page 184
Reference Value
Defines the reference value to be used for relative demodulation results and recalculates the results. If necessary, the detector is activated.
Note: A reference value 0 would provide infinite results and is thus automatically cor-
rected to 0.1.
Remote command:
CONFigure:ADEMod:RESults:AM:DETector<det>:REFerence on page 183
CONFigure:ADEMod:RESults:FM:DETector<det>:REFerence on page 183
CONFigure:ADEMod:RESults:PM:DETector<det>:REFerence on page 183
Overwrite mode: the detector value is overwritten by each sweep.
This is the default setting.
The maximum value is determined over several sweeps and displayed. The R&S VSE saves each result only if the new value is
greater than the previous one.
The average result is determined over all sweeps.
Meas -> Reference
Sets the Reference Value to be used for relative demodulation results to the currently
measured value for all relative detectors.
Note: A reference value 0 would provide infinite results and is thus automatically cor-
rected to 0.1.
If necessary, the detectors are activated.
Remote command:
CONFigure:ADEMod:RESults:AM:DETector<det>:REFerence:MEAStoref
on page 185
CONFigure:ADEMod:RESults:FM:DETector<det>:REFerence:MEAStoref
on page 185
CONFigure:ADEMod:RESults:PM:DETector<det>:REFerence:MEAStoref
on page 185
74User Manual 1176.8939.02 ─ 07
Page 75

R&S®VSE-K7
5.7 Adjusting Settings Automatically
Configuration
Adjusting Settings Automatically
Access: "Auto Set" toolbar
Depending on the connected instrument, some settings can be adjusted by the instrument automatically according to the current measurement settings. In order to do so, a
measurement is performed. The duration of this measurement can be defined automatically or manually.
To activate the automatic adjustment of a setting from the R&S VSE, select the corresponding function in the "Auto Set" toolbar or in the configuration dialog box for the setting, where available.
Adjusting settings automatically during triggered measurements
When you select an auto adjust function a measurement is performed to determine the
optimal settings. If you select an auto adjust function for a triggered measurement, you
are asked how the connected instrument should behave:
●
(default:) The measurement for adjustment waits for the next trigger
●
The measurement for adjustment is performed without waiting for a trigger.
The trigger source is temporarily set to "Free Run". After the measurement is completed, the original trigger source is restored. The trigger level is adjusted as follows for IF Power and RF Power triggers:
Trigger Level = Reference Level - 15 dB
Remote command:
[SENSe:]ADJust:CONFigure:TRIGger on page 188
Adjusting all Determinable Settings Automatically ( Auto All )...................................... 75
Adjusting the Center Frequency Automatically ( Auto Frequency ).............................. 75
Setting the Reference Level Automatically ( Auto Level ).........................................76
Auto Settings Configuration.......................................................................................... 76
└ Automatic Measurement Time Mode and Value.............................................76
└ Upper Level Hysteresis ..................................................................................76
└ Lower Level Hysteresis ..................................................................................77
Adjusting all Determinable Settings Automatically ( Auto All )
Activates all automatic adjustment functions for the current measurement settings.
This includes:
●
Auto Frequency
●
" Setting the Reference Level Automatically ( Auto Level )" on page 47
●
" AF Auto Scale " on page 70
Remote command:
[SENSe:]ADJust:ALL on page 186
Adjusting the Center Frequency Automatically ( Auto Frequency )
The connected instrument adjusts the center frequency automatically.
75User Manual 1176.8939.02 ─ 07
Page 76

R&S®VSE-K7
Configuration
Adjusting Settings Automatically
The optimum center frequency is the frequency with the highest S/N ratio in the frequency span. As this function uses the signal counter, it is intended for use with sinusoidal signals.
Remote command:
[SENSe:]ADJust:FREQuency on page 188
Setting the Reference Level Automatically ( Auto Level )
The connected instrument automatically determines the optimal reference level for the
current input data. At the same time, the internal attenuators and the preamplifier are
adjusted so the signal-to-noise ratio is optimized, while signal compression, clipping
and overload conditions are minimized. This function is not available on all supported
instruments.
You can change the measurement time for the level measurement if necessary (see
"Automatic Measurement Time Mode and Value" on page 76).
Remote command:
[SENSe:]ADJust:LEVel on page 149
Auto Settings Configuration
For some automatic settings, additional parameters can be configured. The "Auto Set
Config" dialog box is available when you select the icon from the "Auto Set" toolbar.
Automatic Measurement Time Mode and Value ← Auto Settings Configuration
To determine the optimal reference level automatically, a level measurement is performed on the connected instrument. You can define whether the duration of this measurement is determined automatically or manually.
To define the duration manually, enter a value in seconds.
Remote command:
[SENSe:]ADJust:CONFigure[:LEVel]:DURation:MODE on page 187
[SENSe:]ADJust:CONFigure[:LEVel]:DURation on page 187
Upper Level Hysteresis ← Auto Settings Configuration
When the reference level is adjusted automatically using the Auto Level function, the
internal attenuators and the preamplifier (if available) of the connected instrument are
also adjusted. To avoid frequent adaptation due to small changes in the input signal,
you can define a hysteresis. This setting defines an upper threshold the signal must
exceed (compared to the last measurement) before the reference level is adapted
automatically.
76User Manual 1176.8939.02 ─ 07
Page 77

R&S®VSE-K7
Configuration
Adjusting Settings Automatically
Remote command:
[SENSe:]ADJust:CONFigure:HYSTeresis:UPPer on page 188
Lower Level Hysteresis ← Auto Settings Configuration
When the reference level is adjusted automatically using the Auto Level function, the
internal attenuators and the preamplifier (if available) of the connected instrument are
also adjusted. To avoid frequent adaptation due to small changes in the input signal,
you can define a hysteresis. This setting defines a lower threshold the signal must fall
below (compared to the last measurement) before the reference level is adapted automatically.
Remote command:
[SENSe:]ADJust:CONFigure:HYSTeresis:LOWer on page 187
77User Manual 1176.8939.02 ─ 07
Page 78

R&S®VSE-K7
Analysis
Trace Settings
6 Analysis
Access: "Overview" > "Analysis"
General result analysis settings concerning the trace, markers, lines etc. can be configured. They are identical to the analysis functions in the base unit except for the special
marker functions.
The remote commands required to perform these tasks are described in Chapter 9,
"Remote Commands for Analog Demodulation Measurements", on page 125.
● Trace Settings.........................................................................................................78
● Trace / Data Export Configuration...........................................................................81
● Spectrogram Settings..............................................................................................84
● Working with Markers in the R&S VSE Analog Demodulation application..............87
● Working with Limit Lines in the R&S VSE Analog Demodulation application....... 107
● Zoom Functions.................................................................................................... 120
6.1 Trace Settings
Access: "Overview" > "Analysis" > "Traces"
Or: "Trace" > "Trace"
You can configure the settings for up to 6 individual traces.
In the Analog Demodulation application when you configure the traces for a window
with a specific evaluation (e.g. AM time domain), the traces in all windows with the
same evaluation are configured identically.
Trace data can also be exported to an ASCII file for further analysis. For details see
Chapter 6.2, "Trace / Data Export Configuration", on page 81.
78User Manual 1176.8939.02 ─ 07
Page 79

R&S®VSE-K7
Analysis
Trace Settings
Trace 1 / Trace 2 / Trace 3 / Trace 4 / Trace 5 / Trace 6 ..............................................79
Trace Mode ..................................................................................................................79
Detector ........................................................................................................................80
Hold ..............................................................................................................................80
Average Mode ..............................................................................................................80
Average Count ............................................................................................................. 81
Predefined Trace Settings - Quick Config ....................................................................81
Trace 1 / Trace 2 / Trace 3 / Trace 4 / Trace 5 / Trace 6
Selects the corresponding trace for configuration. The currently selected trace is highlighted.
Remote command:
Selected via numeric suffix of:TRACe<1...6> commands
DISPlay[:WINDow<n>]:TRACe<t>[:STATe] on page 191
Trace Mode
Defines the update mode for subsequent traces.
"Clear/ Write"
"Max Hold"
"Min Hold"
"Average"
"View"
Overwrite mode (default): the trace is overwritten by each sweep.
The maximum value is determined over several sweeps and dis-
played. The R&S VSE saves each trace point in the trace memory
only if the new value is greater than the previous one.
The minimum value is determined from several measurements and
displayed. The R&S VSE saves each trace point in the trace memory
only if the new value is lower than the previous one.
The average is formed over several sweeps.
The Capture Count determines the number of averaging procedures.
The current contents of the trace memory are frozen and displayed.
79User Manual 1176.8939.02 ─ 07
Page 80

R&S®VSE-K7
Analysis
Trace Settings
"Blank"
Remote command:
DISPlay[:WINDow<n>]:TRACe<t>:MODE on page 189
Detector
Defines the trace detector to be used for trace analysis.
"Auto"
"Type"
Remote command:
[SENSe:][WINDow<n>:]DETector<t>[:FUNCtion] on page 194
[SENSe:][WINDow<n>:]DETector<t>[:FUNCtion]:AUTO on page 195
Hold
If activated, traces in "Min Hold" , "Max Hold" and "Average" mode are not reset after
specific parameter changes have been made.
Normally, the measurement is started again after parameter changes, before the measurement results are analyzed (e.g. using a marker). In all cases that require a new
measurement after parameter changes, the trace is reset automatically to avoid false
results (e.g. with span changes). For applications that require no reset after parameter
changes, the automatic reset can be switched off.
The default setting is off.
Remote command:
DISPlay[:WINDow<n>]:TRACe<t>:MODE:HCONtinuous on page 190
Removes the selected trace from the display.
Selects the optimum detector for the selected trace and filter mode.
This is the default setting.
Defines the selected detector type.
Average Mode
Defines the mode with which the trace is averaged over several sweeps.
This setting is generally applicable if trace mode "Average" is selected. For FFT
sweeps, the setting also affects the VBW (regardless of whether or not the trace is
averaged).
(See the chapter on ACLR power measurements in the R&S VSE User Manual.)
The Capture Count determines the number of averaging procedures.
"Linear"
"Logarithmic"
"Power"
The power level values are converted into linear units prior to averaging. After the averaging, the data is converted back into its original
unit.
For logarithmic scaling, the values are averaged in dBm. For linear
scaling, the behavior is the same as with linear averaging.
Activates linear power averaging.
The power level values are converted into unit Watt prior to averaging. After the averaging, the data is converted back into its original
unit.
Use this mode to average power values in Volts or Amperes correctly.
In particular, for small VBW values (smaller than the RBW), use
power averaging mode for correct power measurements in FFT
sweep mode.
80User Manual 1176.8939.02 ─ 07
Page 81

R&S®VSE-K7
Analysis
Trace / Data Export Configuration
Remote command:
[SENSe:]AVERage<n>:TYPE on page 194
Average Count
Determines the number of averaging or maximum search procedures If the trace
modes "Average" , "Max Hold" or "Min Hold" are set.
In continuous sweep mode, if capture count = 0 (default), averaging is performed over
10 sweeps. For capture count =1, no averaging, Max Hold or Min Hold operations are
performed.
Remote command:
[SENSe:]AVERage<n>:COUNt on page 193
Predefined Trace Settings - Quick Config
Commonly required trace settings have been predefined and can be applied very
quickly by selecting the appropriate button.
Function Trace Settings
Preset All Traces Trace 1: Clear Write
Traces 2-6: Blank
Set Trace Mode
Max | Avg | Min
Set Trace Mode
Max | ClrWrite | Min
Trace 1: Max Hold
Trace 2: Average
Trace 3: Min Hold
Traces 4-6: Blank
Trace 1: Max Hold
Trace 2: Clear Write
Trace 3: Min Hold
Traces 4-6: Blank
6.2 Trace / Data Export Configuration
Access: "Overview" > "Analysis" > "Traces" > "Trace / Data Export"
The standard data management functions (e.g. saving or loading instrument settings,
or exporting the I/Q data in other formats) that are available for all R&S VSE applications are not described here.
See the R&S VSE User Manual for a description of the standard functions.
81User Manual 1176.8939.02 ─ 07
Page 82

R&S®VSE-K7
Analysis
Trace / Data Export Configuration
Export all Traces and all Table Results ........................................................................ 82
Include Instrument & Measurement Settings ............................................................... 82
Trace to Export .............................................................................................................82
Decimal Separator ....................................................................................................... 82
Export Trace to ASCII File ............................................................................................83
└ File Type ........................................................................................................ 83
└ Decimal Separator ......................................................................................... 83
Export all Traces and all Table Results
Selects all displayed traces and result tables (e.g. Result Summary, marker table etc.)
in the current application for export to an ASCII file.
Alternatively, you can select one specific trace only for export (see Trace to Export ).
The results are output in the same order as they are displayed on the screen: window
by window, trace by trace, and table row by table row.
Remote command:
FORMat:DEXPort:TRACes on page 218
Include Instrument & Measurement Settings
Includes additional instrument and measurement settings in the header of the export
file for result data.
See the R&S VSE User Manual for details.
Remote command:
FORMat:DEXPort:HEADer on page 217
Trace to Export
Defines an individual trace that will be exported to a file.
This setting is not available if Export all Traces and all Table Results is selected.
Decimal Separator
Defines the decimal separator for floating-point numerals for the data export/import
files. Evaluation programs require different separators in different languages.
82User Manual 1176.8939.02 ─ 07
Page 83

R&S®VSE-K7
Analysis
Trace / Data Export Configuration
Remote command:
FORMat:DEXPort:DSEParator on page 217
Export Trace to ASCII File
Saves the selected trace or all traces in the currently active result display to the specified file and directory in the selected ASCII format.
Note: Secure user mode.
In secure user mode, settings that are stored on the instrument are stored to volatile
memory, which is restricted to 256 MB. Thus, a "memory limit reached" error can occur
although the hard disk indicates that storage space is still available.
To store data permanently, select an external storage location such as a USB memory
device.
For details, see "Protecting Data Using the Secure User Mode" in the "Data Management" section of the R&S VSE User Manual.
Remote command:
MMEMory:STORe<n>:TRACe on page 217
File Type ← Export Trace to ASCII File
Determines the format of the ASCII file to be imported or exported.
Depending on the external program in which the data file was created or will be evalu-
ated, a comma-separated list (CSV) or a plain data format (DAT) file may be required.
Remote command:
FORMat:DEXPort:FORMat on page 215
Decimal Separator ← Export Trace to ASCII File
Defines the decimal separator for floating-point numerals for the data export/import
files. Evaluation programs require different separators in different languages.
83User Manual 1176.8939.02 ─ 07
Page 84

R&S®VSE-K7
6.3 Spectrogram Settings
Analysis
Spectrogram Settings
Remote command:
FORMat:DEXPort:DSEParator on page 217
Access: "Overview" > "Analysis" > "Traces" > "Spectrogram"
or: "Trace" > Spectrogram
The individual settings available for spectrogram display are described here. For settings on color mapping, see Chapter 6.3.2, "Color Map Settings", on page 86.
Settings concerning the frames and how they are handled during a sweep are provided
as additional capture settings for spectrogram display, see Chapter 5.5.2, "Capture
Settings", on page 56.
For background information see also Chapter 4.6, "Working with Spectrograms",
on page 25.
● General Spectrogram Settings................................................................................84
● Color Map Settings..................................................................................................86
6.3.1 General Spectrogram Settings
Access: "Overview" > "Analysis" > "Traces" > "Spectrogram"
or: "Trace" > "Spectrogram"
This section describes general settings for spectrogram display.
84User Manual 1176.8939.02 ─ 07
Page 85

R&S®VSE-K7
Analysis
Spectrogram Settings
State..............................................................................................................................85
Select Frame.................................................................................................................85
History Depth ............................................................................................................... 85
Color Mapping ..............................................................................................................85
Clear Spectrogram .......................................................................................................85
State
Activates and deactivates a Spectrogram subwindow.
"Split"
"Full"
"Off"
Remote command:
CALCulate<n>:SPECtrogram:LAYout on page 198
Select Frame
Selects a specific frame, loads the corresponding trace from the memory, and displays
it in the Spectrum window.
Note that activating a marker or changing the position of the active marker automatically selects the frame that belongs to that marker.
This function is only available in single sweep mode or if the sweep is stopped, and
only if a spectrogram is selected.
The most recent frame is number 0, all previous frames have a negative number.
For more details see the R&S VSE base software user manual.
Displays the Spectrogram as a subwindow in the original result display.
Displays the Spectrogram in a subwindow in the full size of the original result display.
Closes the Spectrogram subwindow.
Remote command:
CALCulate<n>:SPECtrogram:FRAMe:SELect on page 197
CALCulate<n>:SPECtrogram:FRAMe:SELect on page 197
History Depth
Sets the number of frames that the R&S VSE stores in its memory.
The maximum number of frames depends on the Points.
For an overview of the maximum number of frames depending on the number of
sweep points, see the R&S VSE User Manual.
If the memory is full, the R&S VSE deletes the oldest frames stored in the memory and
replaces them with the new data.
Remote command:
CALCulate<n>:SPECtrogram:HDEPth on page 198
Color Mapping
Opens the "Color Mapping" dialog.
Clear Spectrogram
Resets the spectrogram result display and clears the history buffer.
This function is only available if a spectrogram is selected.
85User Manual 1176.8939.02 ─ 07
Page 86

R&S®VSE-K7
6.3.2 Color Map Settings
Analysis
Spectrogram Settings
Remote command:
CALCulate<n>:SPECtrogram:CLEar[:IMMediate] on page 196
Access: "Overview" > "Analysis" > "Traces" > "Color Mapping"
or: "Trace" > "Spectrogram" > "Color Mapping"
In addition to the available color settings, the dialog box displays the current color map
and provides a preview of the display with the current settings.
1
2
3
6
4
8
Figure 6-1: Color Mapping dialog box
1 = Color map: shows the current color distribution
2 = Preview pane: shows a preview of the spectrogram with any changes that you make to the color
scheme
3 = Color curve pane: graphical representation of all settings available to customize the color scheme
4/5 = Color range start and stop sliders: define the range of the color map or amplitudes for the spectrogram
6 = Color curve slider: adjusts the focus of the color curve
7 = Histogram: shows the distribution of measured values
8 = Scale of the horizontal axis (value range)
7
5
Start / Stop ................................................................................................................... 87
Shape ...........................................................................................................................87
Hot / Cold / Radar / Grayscale ..................................................................................... 87
86User Manual 1176.8939.02 ─ 07
Page 87

R&S®VSE-K7
Analysis
Working with Markers in the R&S VSE Analog Demodulation application
Auto ..............................................................................................................................87
Set to Default ............................................................................................................... 87
Close.............................................................................................................................87
Start / Stop
Defines the lower and upper boundaries of the value range of the spectrogram.
Remote command:
DISPlay[:WINDow<n>]:SPECtrogram:COLor:LOWer on page 200
DISPlay[:WINDow<n>]:SPECtrogram:COLor:UPPer on page 201
Shape
Defines the shape and focus of the color curve for the spectrogram result display.
"-1 to <0"
"0"
">0 to 1"
Remote command:
DISPlay[:WINDow<n>]:SPECtrogram:COLor:SHAPe on page 200
More colors are distributed among the lower values
Colors are distributed linearly among the values
More colors are distributed among the higher values
Hot / Cold / Radar / Grayscale
Sets the color scheme for the spectrogram.
Remote command:
DISPlay[:WINDow<n>]:SPECtrogram:COLor[:STYLe] on page 201
Auto
Defines the color range automatically according to the existing measured values for
optimized display.
Set to Default
Sets the color mapping to the default settings.
Remote command:
DISPlay[:WINDow<n>]:SPECtrogram:COLor:DEFault on page 200
Close
Saves the changes and closes the dialog box.
6.4 Working with Markers in the R&S VSE Analog Demodulation application
Access: "Overview" > "Analysis" > "Markers"
or: "Marker"
Basically, markers in the R&S VSE Analog Demodulation application are very similar to
those in the I/Q Analyzer. However, some additional functions are available.
87User Manual 1176.8939.02 ─ 07
Page 88

R&S®VSE-K7
6.4.1 Marker Settings
Analysis
Working with Markers in the R&S VSE Analog Demodulation application
Markers in Spectrogram Displays
In Spectrograms, you can activate up to 16 markers or delta markers at the same time.
Each marker can be assigned to a different frame. Therefore, in addition to the x-value
you also define the frame number when activating a new marker. If no frame number is
specified, the marker is positioned on the currently selected frame. All markers are visible that are positioned on a visible frame.
● Marker Settings.......................................................................................................88
● Marker Search Settings and Positioning Functions................................................ 94
● Special Marker Functions........................................................................................97
Access: "Overview" > "Analysis" > "Marker" > "Markers"
Or: "Marker" > "Markers"
● Individual Marker Setup.......................................................................................... 88
● General Marker Settings......................................................................................... 92
6.4.1.1 Individual Marker Setup
Access: "Overview" > "Analysis" > "Marker" > "Markers"
Or: "Marker" > "Markers" tab
In the Analog Demodulation application, up to 17 markers or delta markers can be activated for each window simultaneously.
88User Manual 1176.8939.02 ─ 07
Page 89

R&S®VSE-K7
Analysis
Working with Markers in the R&S VSE Analog Demodulation application
The markers are distributed among 3 tabs for a better overview. By default, the first
marker is defined as a normal marker, whereas all others are defined as delta markers
with reference to the first marker. All markers are assigned to trace 1, but only the first
marker is active.
Place New Marker ....................................................................................................89
Marker 1 / Delta Marker 1 / Delta Marker 2 / Delta Marker 16 .............................. 89
Selected Marker ...........................................................................................................90
Marker State .................................................................................................................90
Marker Position X-value ...............................................................................................90
Marker Type .................................................................................................................90
Reference Marker ........................................................................................................ 91
Linking to Another Marker ............................................................................................91
Assigning the Marker to a Trace .................................................................................. 91
All Marker Off ............................................................................................................... 91
Place New Marker
Activates the next currently unused marker and sets it to the peak value of the current
trace in the current window.
If a spectrogram is active, an edit field is displayed for the frame number (≤ 0) in which
the marker is to be placed.
Marker 1 / Delta Marker 1 / Delta Marker 2 / Delta Marker 16
To activate a marker, select the arrow on the marker selection list in the toolbar, or
select a marker from the "Marker" > "Select Marker" menu. Enter the marker position
( "X-value" ) in the edit dialog box.
If a spectrogram is active, the frame number (≤ 0) in which the marker is to be placed
can also be defined.
89User Manual 1176.8939.02 ─ 07
Page 90

R&S®VSE-K7
Analysis
Working with Markers in the R&S VSE Analog Demodulation application
To deactivate a marker, select the marker name in the marker selection list in the toolbar (not the arrow) to display the "Select Marker" dialog box. Change the "State" to
"Off" .
Marker 1 is always the default reference marker for relative measurements. If activated, markers 2 to 16 are delta markers that refer to marker 1. These markers can be
converted into markers with absolute value display using the "Marker Type" function.
Several markers can be configured very easily using the "Marker" dialog box, see
Chapter 6.4.1.1, "Individual Marker Setup", on page 88.
Remote command:
CALCulate<n>:MARKer<m>[:STATe] on page 224
CALCulate<n>:MARKer<m>:X on page 225
CALCulate<n>:MARKer<m>:Y? on page 225
CALCulate<n>:DELTamarker<m>[:STATe] on page 228
CALCulate<n>:DELTamarker<m>:X on page 229
CALCulate<n>:DELTamarker<m>:X:RELative? on page 229
CALCulate<n>:DELTamarker<m>:Y? on page 230
For spectrogram display:
CALCulate<n>:DELTamarker<m>:SPECtrogram:FRAMe on page 238
CALCulate<n>:MARKer<m>:SPECtrogram:FRAMe on page 234
Selected Marker
Marker name. The marker which is currently selected for editing is highlighted orange.
Remote command:
Marker selected via suffix <m> in remote commands.
Marker State
Activates or deactivates the marker in the diagram.
Remote command:
CALCulate<n>:MARKer<m>[:STATe] on page 224
CALCulate<n>:DELTamarker<m>[:STATe] on page 228
Marker Position X-value
Defines the position (x-value) of the marker in the diagram. For normal markers, the
absolute position is indicated. For delta markers, the position relative to the reference
marker is provided.
Remote command:
CALCulate<n>:MARKer<m>:X on page 225
CALCulate<n>:DELTamarker<m>:X on page 229
Marker Type
Toggles the marker type.
The type for marker 1 is always "Normal" , the type for delta marker 1 is always
"Delta" . These types cannot be changed.
90User Manual 1176.8939.02 ─ 07
Page 91

R&S®VSE-K7
Analysis
Working with Markers in the R&S VSE Analog Demodulation application
Note: If normal marker 1 is the active marker, switching the "Mkr Type" activates an
additional delta marker 1. For any other marker, switching the marker type does not
activate an additional marker, it only switches the type of the selected marker.
"Normal"
"Delta"
Remote command:
CALCulate<n>:MARKer<m>[:STATe] on page 224
CALCulate<n>:DELTamarker<m>[:STATe] on page 228
Reference Marker
Defines a marker as the reference marker which is used to determine relative analysis
results (delta marker values).
If the reference marker is deactivated, the delta marker referring to it is also deactivated.
Remote command:
CALCulate<n>:DELTamarker<m>:MREF on page 228
A normal marker indicates the absolute value at the defined position
in the diagram.
A delta marker defines the value of the marker relative to the specified reference marker (marker 1 by default).
Linking to Another Marker
Links the current marker to the marker selected from the list of active markers. If the xaxis value of the initial marker is changed, the linked marker follows to the same position on the x-axis. Linking is off by default.
Using this function you can set two markers on different traces to measure the difference (e.g. between a max hold trace and a min hold trace or between a measurement
and a reference trace).
Remote command:
CALCulate<n>:MARKer<m>:LINK:TO:MARKer<m> on page 224
CALCulate<n>:DELTamarker<m>:LINK:TO:MARKer<m> on page 227
CALCulate<n>:DELTamarker<m>:LINK on page 227
Assigning the Marker to a Trace
The "Trace" setting assigns the selected marker to an active trace. The trace determines which value the marker shows at the marker position. If the marker was previously assigned to a different trace, the marker remains on the previous frequency or
time, but indicates the value of the new trace.
The marker can also be assigned to the currently active trace using the "Marker" >
"Marker To Trace" menu item.
If a trace is turned off, the assigned markers and marker functions are also deactivated.
Remote command:
CALCulate<n>:MARKer<m>:TRACe on page 225
All Marker Off
Deactivates all markers in one step.
91User Manual 1176.8939.02 ─ 07
Page 92

R&S®VSE-K7
6.4.1.2 General Marker Settings
Analysis
Working with Markers in the R&S VSE Analog Demodulation application
Remote command:
CALCulate<n>:MARKer<m>:AOFF on page 223
Access: "Overview" > "Analysis" > "Marker" > "Marker Settings"
Or: "Marker" > "Marker Settings" tab
Some general marker settings allow you to influence the marker behavior for all markers.
Marker Table Display ....................................................................................................92
Marker Info ...................................................................................................................93
Marker Stepsize ........................................................................................................... 93
Defining a Fixed Reference...........................................................................................93
Link Time Marker...........................................................................................................94
Link AF Spectrum Marker............................................................................................. 94
Marker Table Display
Defines how the marker information is displayed.
"On"
"Off"
"Auto"
Displays the marker information in a table in a separate area beneath
the diagram.
No separate marker table is displayed.
If Marker Info is active, the marker information is displayed within the
diagram area.
(Default) If more than two markers are active, the marker table is displayed automatically.
If Marker Info is active, the marker information for up to two markers
is displayed in the diagram area.
92User Manual 1176.8939.02 ─ 07
Page 93

R&S®VSE-K7
Analysis
Working with Markers in the R&S VSE Analog Demodulation application
Remote command:
DISPlay[:WINDow<n>]:MTABle on page 232
Marker Info
Turns the marker information displayed in the diagram on and off.
Remote command:
DISPlay:MINFo[:STATe] on page 232
Marker Stepsize
Defines the size of the steps that the marker position is moved using the mouse wheel.
"Standard"
"Points"
Remote command:
CALCulate<n>:MARKer<m>:X:SSIZe on page 231
The marker position is moved in steps of (Span/1000), which corresponds approximately to the number of pixels for the default display
of 1001 sweep points. This setting is most suitable to move the
marker over a larger distance.
The marker position is moved from one sweep point to the next. This
setting is required for a very precise positioning if more sweep points
are collected than the number of pixels that can be displayed on the
screen. It is the default mode.
Defining a Fixed Reference
Instead of using a reference marker that may vary its position depending on the measurement results, a fixed reference marker can be defined for trace analysis.
Note that this function may not be available in all result displays.
For "State" = "On" , a vertical and a horizontal red display line are displayed, marked
as "FXD" . The normal marker 1 is activated and set to the peak value of the trace
assigned to marker 1, and a delta marker to the next peak. The fixed reference marker
is set to the position of marker 1 at the peak value. The delta marker refers to the fixed
reference marker.
The "Level" and "Frequency" or "Time" settings define the position and value of the reference marker. To move the fixed reference, move the red display lines marked "FXD"
in the diagram, or change the position settings in the "Marker Settings" tab of the
"Marker" dialog box.
Peak Search sets the fixed reference marker to the current maximum value of the
trace assigned to marker 1.
If activated, the fixed reference marker ( "FXD" ) can also be selected as a Reference
Marker instead of another marker.
Remote command:
CALCulate<n>:DELTamarker<m>:FUNCtion:FIXed[:STATe] on page 250
CALCulate<n>:DELTamarker<m>:FUNCtion:FIXed:RPOint:Y on page 250
93User Manual 1176.8939.02 ─ 07
Page 94

R&S®VSE-K7
6.4.2 Marker Search Settings and Positioning Functions
Analysis
Working with Markers in the R&S VSE Analog Demodulation application
CALCulate<n>:DELTamarker<m>:FUNCtion:FIXed:RPOint:X on page 249
CALCulate<n>:DELTamarker<m>:FUNCtion:FIXed:RPOint:MAXimum[:PEAK]
on page 249
Link Time Marker
Links the markers in all time domain diagrams.
Remote command:
CALCulate<n>:MARKer<m>:LINK on page 231
Link AF Spectrum Marker
Links the markers in all AF spectrum displays.
Remote command:
CALCulate<n>:MARKer<m>:LINK on page 231
Access: "Overview" > "Analysis" > "Marker" > "Search"
or: "Marker" > "Search"
Several functions are available to set the marker to a specific position very quickly and
easily, or to use the current marker position to define another characteristic value. In
order to determine the required marker position, searches may be performed. The
search results can be influenced by special settings.
The remote commands required to define these settings are described in Chap-
ter 9.7.1, "Working with Markers Remotely", on page 223.
● Marker Search Settings...........................................................................................94
● Positioning Functions..............................................................................................95
6.4.2.1 Marker Search Settings
Access: "Overview" > "Analysis" > "Marker" > "Search"
or: "Marker" > "Search"
Markers are commonly used to determine peak values, i.e. maximum or minimum values, in the measured signal. Configuration settings allow you to influence the peak
search results.
Marker Search Type .....................................................................................................94
Marker Search Area .....................................................................................................95
Peak Excursion ............................................................................................................ 95
Marker Search Type
Defines the type of search to be performed in the spectrogram.
"X-Search"
"Y-Search"
"XY-Search"
Searches only within the currently selected frame.
Searches within all frames but only at the current frequency position.
Searches in all frames at all positions.
94User Manual 1176.8939.02 ─ 07
Page 95

R&S®VSE-K7
Analysis
Working with Markers in the R&S VSE Analog Demodulation application
Remote command:
Defined by the search function, see Chapter 9.7.1.3, "Marker Search (Spectrograms)",
on page 233
Marker Search Area
Defines which frames the search is performed in.
"Visible"
"Memory"
Remote command:
CALCulate<n>:MARKer<m>:SPECtrogram:SARea on page 234
CALCulate<n>:DELTamarker<m>:SPECtrogram:SARea on page 239
Peak Excursion
Defines the minimum level value by which a signal must rise or fall so that it is identified as a maximum or a minimum by the search functions.
Entries from 0 dB to 80 dB are allowed; the resolution is 0.1 dB. The default setting for
the peak excursion is 6 dB.
Only the visible frames are searched.
All frames stored in the memory are searched.
For analog demodulation, the unit and value range depends on the selected result display type.
Remote command:
CALCulate<n>:MARKer<m>:PEXCursion on page 242
6.4.2.2 Positioning Functions
Access: "Marker" toolbar
The following functions set the currently selected marker to the result of a peak search
or set other characteristic values to the current marker value.
Select Marker ...............................................................................................................95
Peak Search .................................................................................................................96
Search Next Peak ........................................................................................................ 96
Search Minimum .......................................................................................................... 97
Search Next Minimum ..................................................................................................97
Select Marker
The "Select Marker" function opens a dialog box to select and activate or deactivate
one or more markers quickly.
95User Manual 1176.8939.02 ─ 07
Page 96

R&S®VSE-K7
Analysis
Working with Markers in the R&S VSE Analog Demodulation application
Remote command:
CALCulate<n>:MARKer<m>[:STATe] on page 224
CALCulate<n>:DELTamarker<m>[:STATe] on page 228
Peak Search
Sets the selected marker/delta marker to the maximum of the trace. If no marker is
active, marker 1 is activated.
Remote command:
CALCulate<n>:MARKer<m>:MAXimum[:PEAK] on page 244
CALCulate<n>:DELTamarker<m>:MAXimum[:PEAK] on page 247
Search Next Peak
Sets the selected marker/delta marker to the next (lower) maximum of the assigned
trace. If no marker is active, marker 1 is activated.
,
For spectrogram displays, define which frame the next peak is to be searched in.
For the Next Peak Up/Down functions, the search is automatically performed in all
frames above or below the currently selected frame, respectively.
Remote command:
CALCulate<n>:MARKer<m>:MAXimum:NEXT on page 244
CALCulate<n>:MARKer<m>:MAXimum:RIGHt on page 244
CALCulate<n>:MARKer<m>:MAXimum:LEFT on page 243
CALCulate<n>:DELTamarker<m>:MAXimum:NEXT on page 246
CALCulate<n>:DELTamarker<m>:MAXimum:RIGHt on page 247
CALCulate<n>:DELTamarker<m>:MAXimum:LEFT on page 246
96User Manual 1176.8939.02 ─ 07
Page 97

R&S®VSE-K7
Analysis
Working with Markers in the R&S VSE Analog Demodulation application
Search Minimum
Sets the selected marker/delta marker to the minimum of the trace. If no marker is
active, marker 1 is activated.
Remote command:
CALCulate<n>:MARKer<m>:MINimum[:PEAK] on page 245
CALCulate<n>:DELTamarker<m>:MINimum[:PEAK] on page 248
Search Next Minimum
Sets the selected marker/delta marker to the next (higher) minimum of the selected
trace. If no marker is active, marker 1 is activated.
,
For spectrogram displays, define which frame the next minimum is to be searched in.
For the Next Min Up/Down functions, the search is automatically performed in all
frames above or below the currently selected frame, respectively.
Remote command:
CALCulate<n>:MARKer<m>:MINimum:NEXT on page 245
CALCulate<n>:MARKer<m>:MINimum:LEFT on page 244
CALCulate<n>:MARKer<m>:MINimum:RIGHt on page 245
CALCulate<n>:DELTamarker<m>:MINimum:NEXT on page 248
CALCulate<n>:DELTamarker<m>:MINimum:LEFT on page 247
CALCulate<n>:DELTamarker<m>:MINimum:RIGHt on page 248
6.4.3 Special Marker Functions
Access: "Overview" > "Analysis" > "Marker" > "Marker Functions"
or: "Marker" > "Marker Function"
In addition to basic markers, sophisticated marker functions are provided for special
results
● Defining a Fixed Reference Marker........................................................................ 97
● Measuring Characteristic Bandwidths (n dB Down Marker)....................................98
● Measuring Phase Noise..........................................................................................99
● Marker Function Configuration................................................................................99
6.4.3.1 Defining a Fixed Reference Marker
Access: "Overview" > "Analysis" > "Marker Functions" > "Reference Fixed"
Or: "Marker" > "Marker Function" > "Reference Fixed"
Instead of using a reference marker that can vary its position depending on the measurement results, a fixed reference marker can be defined for trace analysis. Once
positioned, the reference marker does not move during subsequent sweeps unless you
explicitly move it manually.
97User Manual 1176.8939.02 ─ 07
Page 98

R&S®VSE-K7
6.4.3.2 Measuring Characteristic Bandwidths (n dB Down Marker)
Analysis
Working with Markers in the R&S VSE Analog Demodulation application
Remote commands:
CALCulate<n>:DELTamarker<m>:FUNCtion:FIXed[:STATe] on page 250
CALCulate<n>:DELTamarker<m>:FUNCtion:FIXed:RPOint:X on page 249
CALCulate<n>:DELTamarker<m>:FUNCtion:FIXed:RPOint:Y on page 250
Access: "Overview" > "Analysis" > "Marker Functions" > "n dB Down"
Or: "Marker" > "Marker Function" > "n dB Down"
When characterizing the shape of a signal, the bandwidth at a specified offset from its
peak level is often of interest. The offset is specified as a relative decrease in amplitude of n dB. To measure this bandwidth, you could use several markers and delta
markers and determine the bandwidth manually. However, using the n dB down marker
function makes the task very simple and quick.
The n dB down marker function uses the current value of marker 1 as the reference
point. It activates two temporary markers T1 and T2 located on the signal, whose level
is n dB below the level of the reference point. Marker T1 is placed to the left and
marker T2 to the right of the reference marker. The default setting for n is 3 dB, but it
can be changed.
If a positive offset is entered, the markers T1 and T2 are placed below the active reference point. If a negative value is entered (for example for notch filter measurements),
the markers T1 and T2 are placed above the active reference point.
Figure 6-2: n dB down marker function
The following marker function results are displayed:
98User Manual 1176.8939.02 ─ 07
Page 99

R&S®VSE-K7
Analysis
Working with Markers in the R&S VSE Analog Demodulation application
Table 6-1: n dB down marker function results
Label Description
M1 Current position and level of marker 1
ndB Offset value (n dB down)
ndB down Bw /
PWid
Q-factor Quality factor of the determined bandwidth (characteristic of damping or resonance)
T1, T2 Current position and level of the temporary markers
Determined bandwidth or pulse width (zero span) at the offset
If the required position for the temporary markers cannot be determined uniquely, for
example due to noise, dashes are displayed as a result.
Remote commands:
CALCulate<n>:MARKer<m>:FUNCtion:NDBDown:STATe on page 257
CALCulate<n>:MARKer<m>:FUNCtion:NDBDown:RESult? on page 256
6.4.3.3 Measuring Phase Noise
Access: "Overview" > "Analysis" > "Marker Functions" > "Phase Noise"
or: "Marker" > "Marker Function" > "Phase Noise"
Phase noise is unintentional modulation of a carrier; it creates frequencies next to the
carrier frequency. A phase noise measurement consists of noise density measurements at defined offsets from the carrier; the results are given in relation to the carrier
level (dBc).
In the Analog Demodulation application, phase noise measurement markers are available for the AF Spectrum result displays. For the FM Spectrum and PM Spectrum
result displays, the phase deviation in rad equals the phase noise at the marker position. For AM Spectrum displays the marker result equals the amplitude noise at the
marker position.
The noise power density is measured at each marker for which the phase noise function is activated, and set in relation to the measured carrier power. A reference marker
is not required. In the marker table display, the phase noise is indicated as the marker
function result.
6.4.3.4 Marker Function Configuration
Access: "Overview" > "Analysis" > "Marker Functions" > "Phase Noise"
Or: "Marker" > "Marker Function"
Special marker functions can be selected via the "Marker Function" dialog box.
99User Manual 1176.8939.02 ─ 07
Page 100

R&S®VSE-K7
Analysis
Working with Markers in the R&S VSE Analog Demodulation application
The fixed reference marker is described under "Defining a Fixed Reference"
on page 93.
Not all marker functions are available for all evaluations. The following table indicates
which functions are available for which evaluations.
Evaluation n dB
down
AM/FM/PM time - - X X
AF/FM/PM spectrum X X X X
RF time X - X X
RF spectrum X X X X
Phase
Noise
Reference
Fixed
Marker
Peak
List
For details on special marker functions see Chapter 6.4.3, "Special Marker Functions",
on page 97.
The remote commands required to define these settings are described in Chap-
ter 9.7.1.6, "Configuring Special Marker Functions", on page 248.
The Fixed Reference Marker settings are described in "Defining a Fixed Reference"
on page 93.
● Measuring Characteristic Bandwidths (n dB Down Marker)..................................100
● Phase Noise Measurement Marker.......................................................................102
● Marker Peak List................................................................................................... 104
● Deactivating All Marker Functions.........................................................................107
Measuring Characteristic Bandwidths (n dB Down Marker)
Access: "Overview" > "Analysis" > "Marker Functions" > "n dB down" > "n dB Down
Config"
Or: "Marker" > "Marker Function" > "n dB down"
100User Manual 1176.8939.02 ─ 07
 Loading...