

Page 1
PAD-T-M: 3574.3259.02/01.00/CI/1/EN
R&S®UPV-K7
Software for Hearing Aids Tests
Operating Manual
Version 2.0.0.20
Operating Manual
1401.9353.12 – 04
Page 2

© 2019 Rohde & Schwarz GmbH & Co. KG
Muehldorfstr. 15, 81671 Munich, Germany
Phone: +49 89 41 29 - 0
Fax: +49 89 41 29 12 164
E-mail: info@rohde-schwarz.com
Internet: http://www.rohde-schwarz.com
Subject to change – Data without tolerance limits is not binding.
R&S® is a registered trademark of Rohde & Schwarz GmbH & Co. KG.
Trade names are trademarks of the owners.
1401.9353.12 | Version 04 | R&S®UPV-K7
Throughout this manual, products from Rohde & Schwarz are indicated without the ® symbol , e.g. R&S®UPV-K7 is indicated as
R&S UPV-K7, or R&S®UPV is indicated as R&S UPV, etc.
Page 3

R&S UPV-K7 Contents
Operating Manual 1401.9353.12 - 04 3
Contents
1 Overview .............................................................................................. 6
2 Preparation and Start of the Application Software .......................... 7
2.1 Required Measuring Instruments and Accessories ................................................. 7
2.2 Installing the Software ................................................................................................ 9
2.3 Test Setup ..................................................................................................................... 9
2.4 Starting the Application Software ............................................................................10
3 Operating Concept............................................................................ 14
3.1 Options (General settings) ........................................................................................14
4 Calibration ......................................................................................... 19
4.1 Calibration Devices....................................................................................................19
4.2 Microphone Calibration .............................................................................................21
4.3 Calibration of Ear Simulator IEC 711 .......................................................................22
4.4 Entering correction values for Pistonphones .........................................................23
4.5 Calibration of Sound Source ....................................................................................23
4.6 Calibration of the International Speech Test Signal (ISTS) ...................................24
4.7 Calibration Value for Induction Coil.........................................................................25
5 Data Entry for Reporting .................................................................. 26
5.1 Operator ......................................................................................................................26
5.2 Test Object .................................................................................................................26
6 Measurements ................................................................................... 27
6.1 Functionality and Control of the Measurement Macros ........................................27
6.1.1 Zooming .......................................................................................................................28
6.1.2 Changing the Scale of the Graph ................................................................................28
6.1.3 Cursor ..........................................................................................................................28
6.1.4 Data Point Size ............................................................................................................29
6.1.5 Performing Additional Measurements..........................................................................29
6.1.6 Storing and Loading Curves ........................................................................................29
6.1.7 Storing Curves as Limit Curves ...................................................................................29
6.1.8 Entering a Comment ....................................................................................................29
6.1.9 Creating a Report.........................................................................................................30
6.1.10 Generating a Landscape Report ..................................................................................30
6.1.11 Closing the Measurement Window ..............................................................................30
Page 4

R&S UPV-K7 Contents
Operating Manual 1401.9353.12 - 04 4
6.2 Customizing Measurements .....................................................................................31
6.3 Notes on Individual Measurements .........................................................................33
6.3.1 Frequency Response Measurement............................................................................33
6.3.2 Multi-Curve Measurement ...........................................................................................37
6.3.3 Saturation Sound Pressure Level Measurement .........................................................40
6.3.4 Harmonic Distortion Measurement ..............................................................................41
6.3.5 Intermodulation Distortion Measurement .....................................................................44
6.3.6 Measurement of Dynamic Behaviour (AGC Settling) ..................................................47
6.3.7 Measurement of Input-Output Characteristics .............................................................49
6.3.8 Measurement of Equivalent Input Noise ......................................................................51
6.3.9 Battery Current Measurement .....................................................................................54
6.3.10 Speech Test according to IEC 60118-15 .....................................................................56
6.3.11 Routine for Reference Test Gain Setting .....................................................................62
6.3.12 Routine for Alignment of the Hearing Aid in the Magnetic Field ..................................64
6.3.13 Electric Input Sensitivity Measurement ........................................................................65
6.3.14 Create Report ..............................................................................................................67
6.3.15 Set Switcher .................................................................................................................68
6.3.16 Start Executable ...........................................................................................................69
7 Automatic Test Sequences .............................................................. 71
7.1 Creating and Editing a Sequence .............................................................................71
7.2 Opening an Existing Sequence ................................................................................72
7.3 Using a Sample Sequence ........................................................................................72
7.4 Running a Sequence .................................................................................................72
7.5 Running a Single Measurement within a Sequence...............................................73
7.6 Reporting on Sequence Results ..............................................................................73
8 Reporting, Storing, Loading and Deleting Results ........................ 74
8.1 Result Files .................................................................................................................74
8.2 Report Settings ..........................................................................................................74
8.3 Generating a Single Report ......................................................................................75
8.4 Generating a Sequence Report ................................................................................75
8.5 Configuring the Landscape Report..........................................................................76
8.6 Generating a Landscape Report ..............................................................................77
8.7 Selection Report ........................................................................................................77
8.8 Configuring the One-Page Report ............................................................................78
8.9 Generating a One-Page Report ................................................................................79
8.10 Preview Window.........................................................................................................81
8.11 Storing and Loading Curves .....................................................................................82
Page 5

R&S UPV-K7 Contents
Operating Manual 1401.9353.12 - 04 5
8.12 Deleting Results .........................................................................................................83
8.13 Automatic Backup and Restoration of the Results File.........................................83
9 Remote Control ................................................................................. 85
9.1 Preparations ...............................................................................................................85
9.2 String Buffers and Data Buffers ...............................................................................85
9.3 Sending a Remote Control Command .....................................................................87
9.4 Remote Controlled Settings .....................................................................................88
9.4.1 Selecting a device under test .......................................................................................88
9.4.2 Setting the supply voltage ............................................................................................89
9.4.3 Setting the environmental values for the reports .........................................................89
9.4.4 Measuring the supply current ......................................................................................89
9.4.5 Generating a report and storing it to a file ...................................................................90
9.5 Starting a Measurement ............................................................................................90
9.6 Continue and Done ....................................................................................................90
9.7 Reading the Results ..................................................................................................90
9.8 Status of the remotely started measurement function ..........................................91
10 Terminating the Application ............................................................ 92
11 Index .................................................................................................. 93
Page 6

R&S UPV-K7 Overview
Operating Manual 1401.9353.12 - 04 6
1 Overview
Tests of basic properties of hearing aids are specified in standards IEC 60118 and
ANSI S3.22. They comprise measurement of output sound pressure level, frequency
responses, output SPL over input SPL, harmonic distortion, battery current drain and
AGC settling.
Audio Analyzer R&S UPV with option R&S UPV-K7 provides a test system which,
together with the necessary acoustic accessories, allows measurements according to
IEC60118-0:1983, IEC60118-0:2015, IEC60118-1:1995, IEC60118-2:1983, IEC601186:1999, IEC60118-7:2005, IEC60118-9:1985 and ANSI S3.22-2003.
In addition to standard measurements it is possible to create own tests by customizing
the available parameters.
With additional option R&S UPV-K71, tests according to IEC60118-15 using speech
signal can be performed.
Automatic test sequences can be compiled from the available tests, and results are
compiled for subsequent creation of test reports.
1.1
Page 7

R&S UPV-K7 Preparation and Start of the Application Software
Required Measuring Instruments and Accessories
Operating Manual 1401.9353.12 - 04 7
Device
Description
Type (examples)
Hearing aid test box
Anechoic box with built-in sound source
and induction loop, feed-throughs for
the most important connection lines
R&S UPL-B7 or Interacoustics
TBS25 or B&K 4232
Measurement microphone
¼” measurement microphone for
measurement of artificial mouth output
during calibration, to be inserted into
IEC 126 2cc coupler, and for
comparison measurement
B&K 4938 with B&K 2670 or
G.R.A.S. 40BP with G.R.A.S.
26AC
Low-noise measurement
microphone
½” measurement microphone with high
sensitivity and low self-noise for speech
tests according to IEC 60118-15.
G.R.A.S. 40AP with G.R.A.S.
26AC and right-angled adapter
RA0001
IEC 126 coupler
Acoustic coupler according to IEC 126
Part of R&S UPL-B7 (with internal
microphone or with ¼”
microphone with preamplifier)
IEC 126 coupler for ½“
microphone
Acoustic coupler according to IEC 126,
for use with ½” microphone
G.R.A.S. RA0038
IEC 711 ear simulator
(optional)
IEC 711 type occluded ear simulator
with adapters for calibration and
connection to the output of the DUT,
with 1/2” - preamplifier
B&K 4157 & 2669 or G.R.A.S.
RA0045
Acoustic calibrator
Sound level calibrator or pistonphone
for calibrating the measuring
microphones
B&K 4231 or G.R.A.S. 42AB
Microphone power supply
Power supply and preamplifier for the
measuring microphone
B&K 2829, 5935L or 2690A0S2
or G.R.A.S. 12AD or 12AA
2 Preparation and Start of the Application
Software
2.1 Required Measuring Instruments and Accessories
The Audio Analyzer R&S UPV with option R&S UPV-K7 is required for the
measurements.
Acoustic devices such as measurement couplers, a calibrator and other accessories
are required for the measurements. The following equipment from Brüel & Kjær or
G.R.A.S. may be used:
Table 2-1: Acoustic accessories for hearing aid tests
Page 8
R&S UPV-K7 Preparation and Start of the Application Software
Required Measuring Instruments and Accessories
Operating Manual 1401.9353.12 - 04 8
With the amplifier set to 0 dB, the microphone power supply B&K 2690A0S2 produces
too much noise for measuring idle noise and distortion. It is therefore advisable to set
a gain of 20 dB.
Theoretically the reference microphone for sound source calibration and comparison
measurement should be a free field type and the IEC 126 coupler should be used with
a pressure field type. However with a ¼” microphone the frequency response
difference is negligible up to at least 10 kHz.
When using a ½” pressure microphone as reference microphone, a good
approximation of a flat free field response is achieved if the microphone is place such
that the sound incidence is from 90 degrees relative to the microphone axis.
An external USB keyboard and a mouse must be connected to the R&S UPV.
R&S UPV-K7 does not support the use of headphones.
Do not connect headphones to the R&S UPV during hearing aid tests. High level
signals may be present at the headphone connector.
The audio analyzer must meet the following firmware requirements:
● R&S UPV firmware version 4.0.4 or higher
● License key R&S UPV-K7 installed
● For tests with speech-like signals according to IEC 60118-15, license key
R&S UPV-K71 must be installed in addition.
Page 9
R&S UPV-K7 Preparation and Start of the Application Software
Operating Manual 1401.9353.12 - 04 9
2.2 Installing the Software
Acoustical Test Box
START SINGLE CONT H COPY OUTPUT
STOP OFF
1 2 1 2
UNBAL OPTICAL
BAL
UNBAL OPTICAL
BAL
UPV AUDIO ANAL YZER DC ... 250 kHz
.
110 V RMS /160 V PK CAT I
CONTROL
DATA VARIATION
ANALOG
DIGITAL AUDIO OUTPUT
POWER
DIGITAL AUDIO INPUT
ON
REM
LOCALDOWN
SHUT-
WINDOW SETUP
SCREEN
WINDOW
SCAN
PAGE
WINBAR MODIFY HIDE CLOSE SAVE LOAD PRESETHELP
0
1 2 3
4 5 6
7 8
9
. -
+/
ESC
MENU
UNDO
.
ANALYZEROVLD OVLD
F 5 F 6
F 7 F 8 F 9 F 10 F 11 F 12
GENERATOR
USB
ghi jkl m no
# A a
pqrs tuv wxyz
abc d ef
*
...
Microphone
Power Supply
in
out
Loudspeaker Cable
Battery Adaptor Cable
Coupler Cable
Telecoil Cable
ANLG AUX OUT
Audio Analyzer
R&S UPV
The application program requires key K7 to be installed. The application program and
the key are installed in the factory in case a new R&S UPV is ordered together with this
option. If the option is ordered separately, the key as well as the installation manual is
part of the delivery.
For instructions on installation of the software and update of previous versions please
see the release notes.
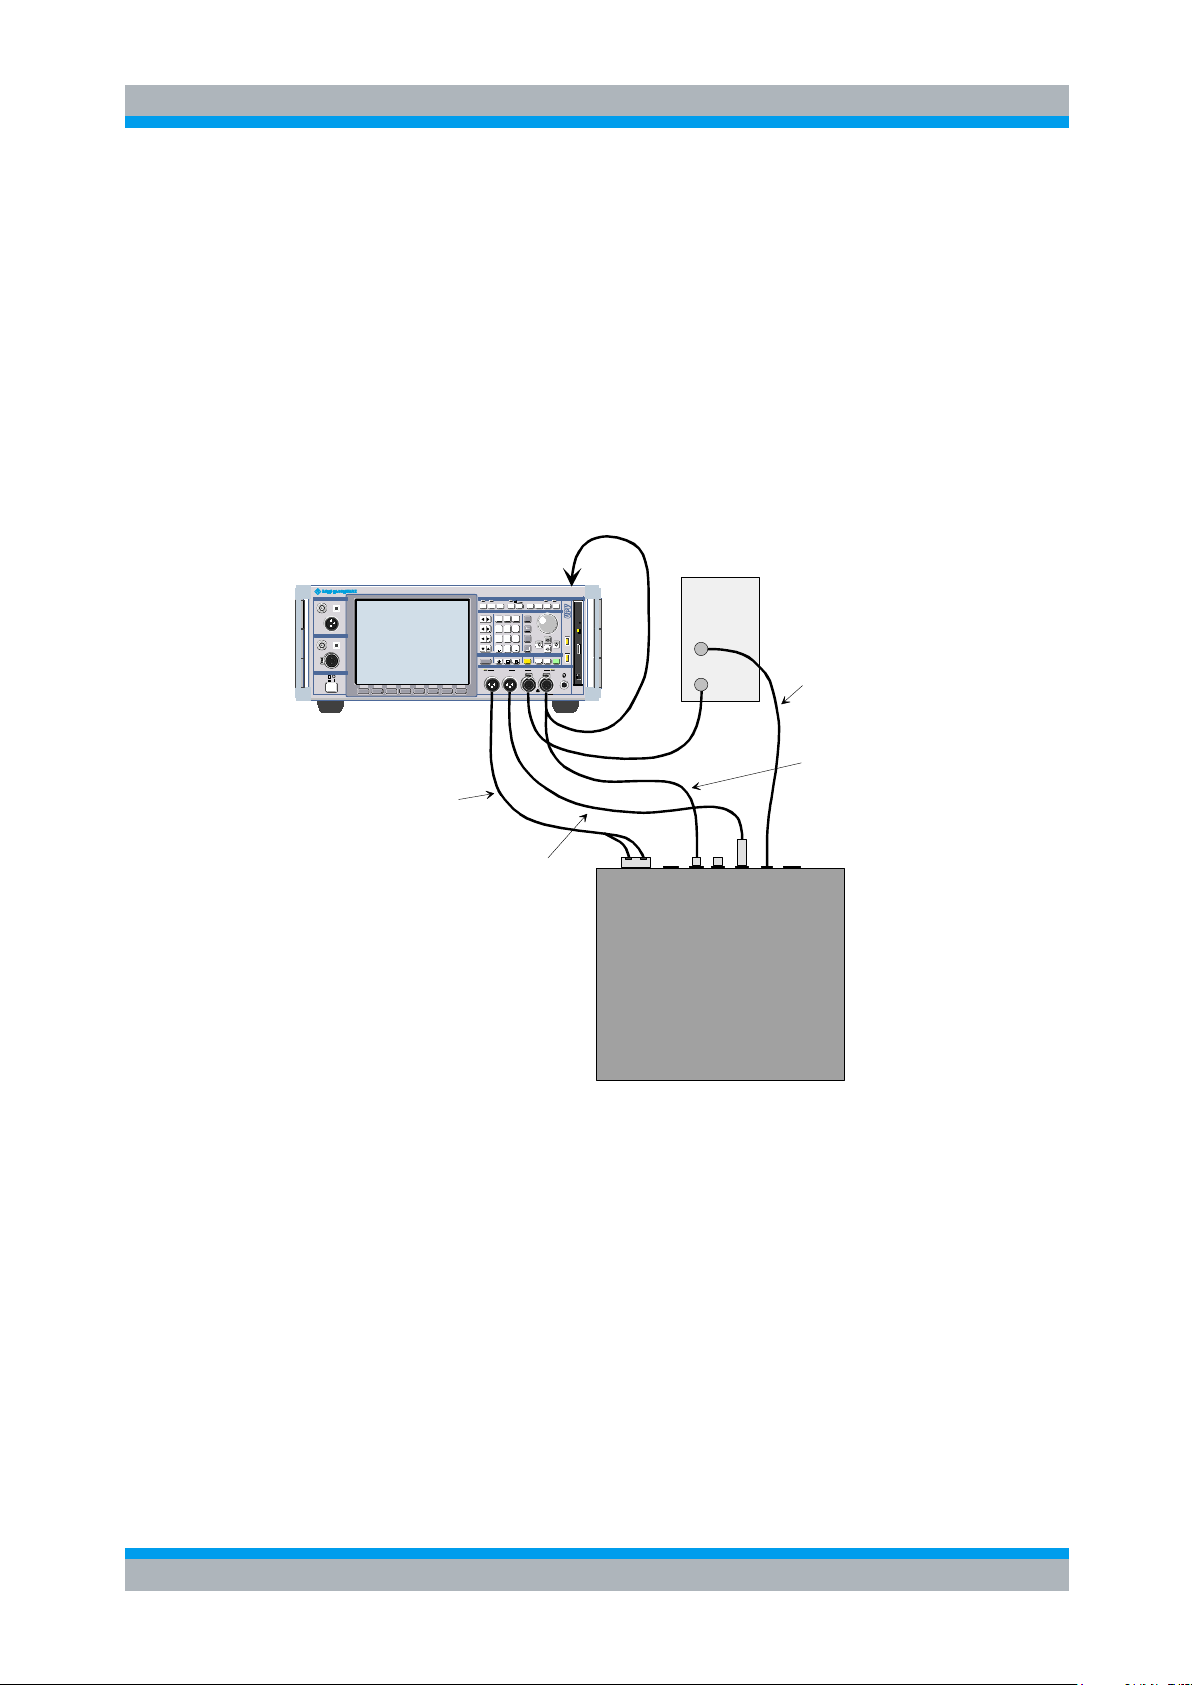
2.3 Test Setup
Installing the Software
Figure 2-1 Test setup and connection of external components
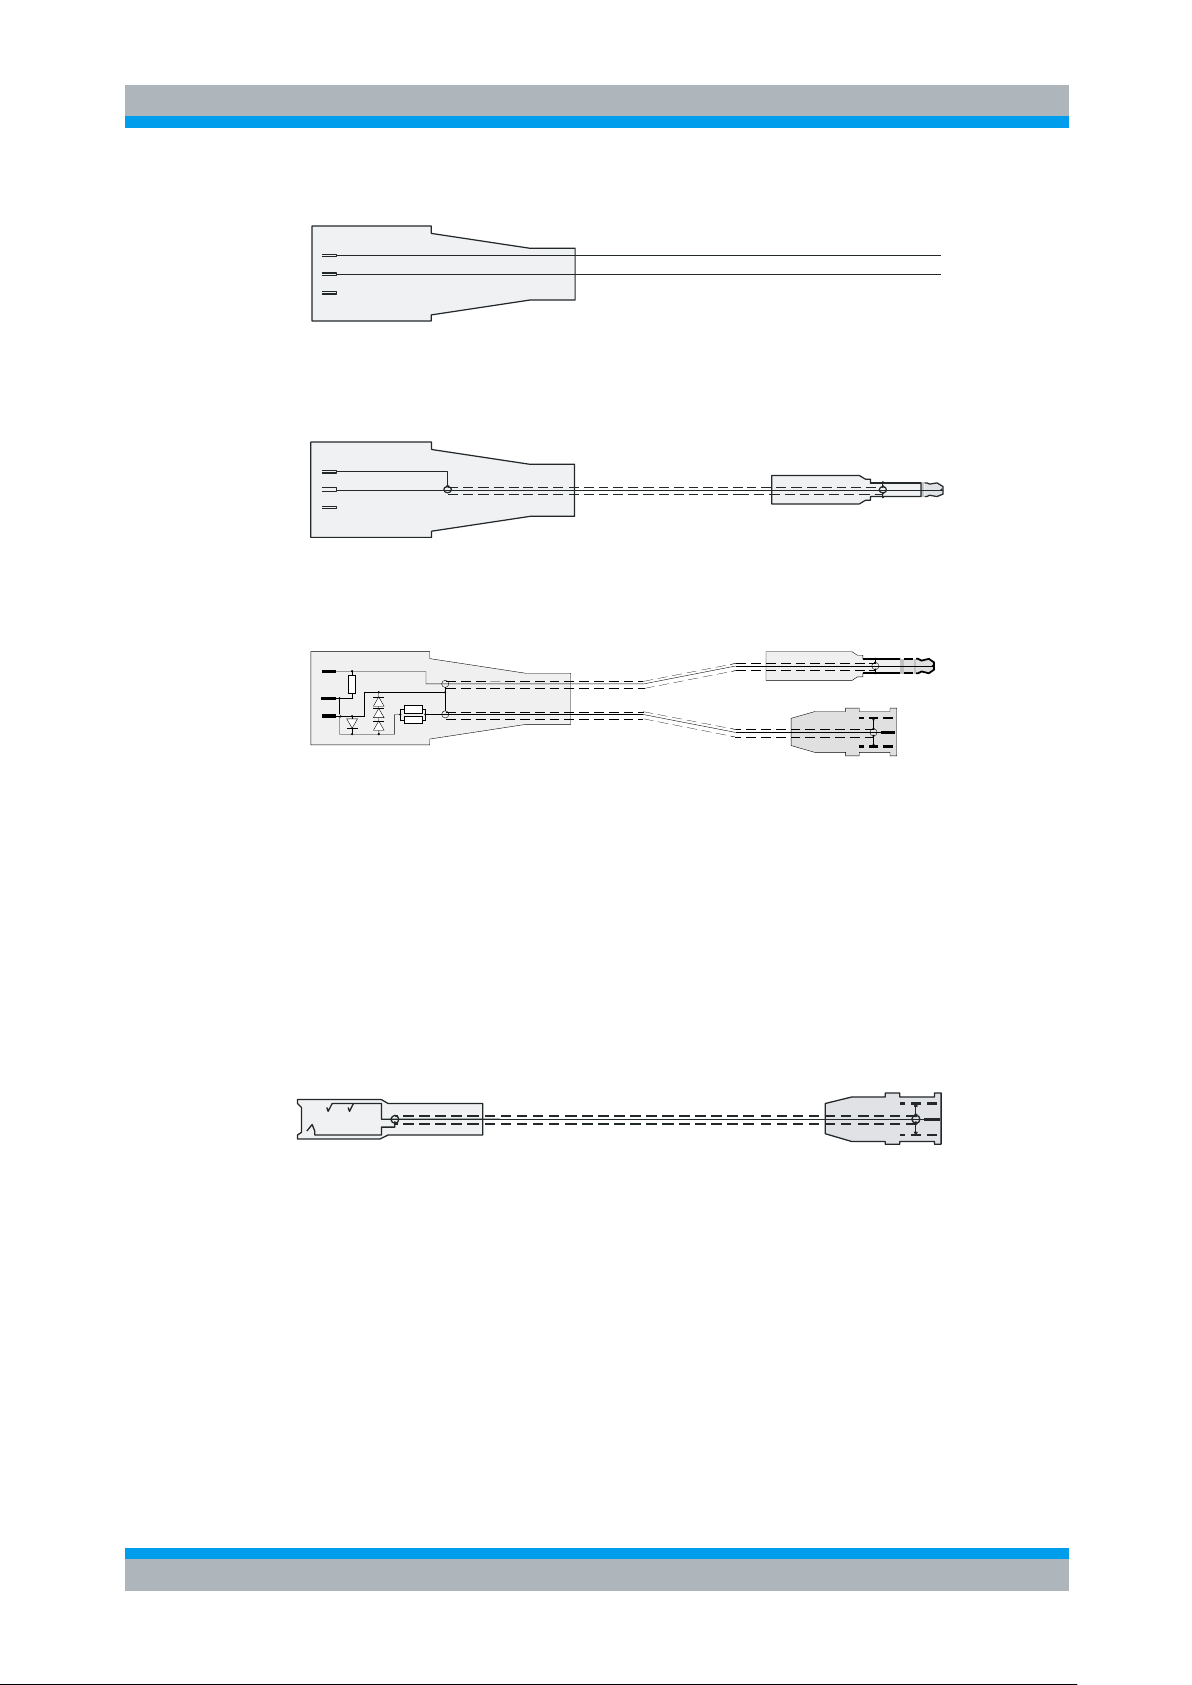
The following cables are required to connect speaker, induction loop and battery
voltage supply of the test box delivered with R&S UPL-B7 to the R&S UPV. The
microphone signal from the microphone power supply may be connected to the
analyzer input with a BNC cable and an R&S UP-Z1MF adapter. If a custom made
BNC to XLR cable is used, it should be made following the schematics of the R&S UPZ1MF adapter (see R&S UPV Manual, chapter “Configuring the Analog Analyzer”).
Page 10
R&S UPV-K7 Preparation and Start of the Application Software
Starting the Application Software
Operating Manual 1401.9353.12 - 04 10
XLR female
3
2
1
open ends
Loudspeaker Cable
XLR female
3
2
1
6.3 mm mono jack male
Telecoil Cable
3
2
1
XLR male
D: 4 diodes: 1N4007 or similar (1A forward current)
R1: resistor 2 Ohm, 1%
R2: 2 resistors 1 Ohm, 1%
3.5 mm stereo jack male
BNC male
R1
R2
D
Battery Cable
6.3 mm stereo jack female BNC male
Figure 2-2 Connection cables for R&S UPL-B7 (Interacoustics TBS 25) test box
The cables shown in Figure 2-2 can be ordered as Accessory R&S UPV-Z7.
The cables of R&S UPL-B7 can be re-used for R&S UPV-K7. As the supply voltage is
now provided by the “ANLG AUX OUT” on the rear panel of the R&S UPV, the
following adapter is required in addition.
Figure 2-3 Adapter cable to connect the R&S UPL-B7 battery supply cable
to the “ANLG AUX OUT” of the R&S UPV
2.4 Starting the Application Software
After installation, the program can be started by double-clicking the Icon “UPV-K7
Hearing Aid Tests” or by clicking “R&S UPV Applications UPV-K7 Hearing Aid
Tests” in the “Programs” menu.
At the fist start of the program, selection windows appear for the standard according to
which the measurements should be made, and for the measurement coupler used.
Page 11
R&S UPV-K7 Preparation and Start of the Application Software
Starting the Application Software
Operating Manual 1401.9353.12 - 04 11
The entered selections are stored with the settings and automatically loaded at the
next start of the program.
At each start of the program, the ambient conditions temperature, relative humidity and
atmospheric pressure are queried for protocol purpose. The entered values are not
stored in the settings, because the ambient conditions are supposed to change with
time. The query can be deselected and values can be changed any time in the
“Options” menu.
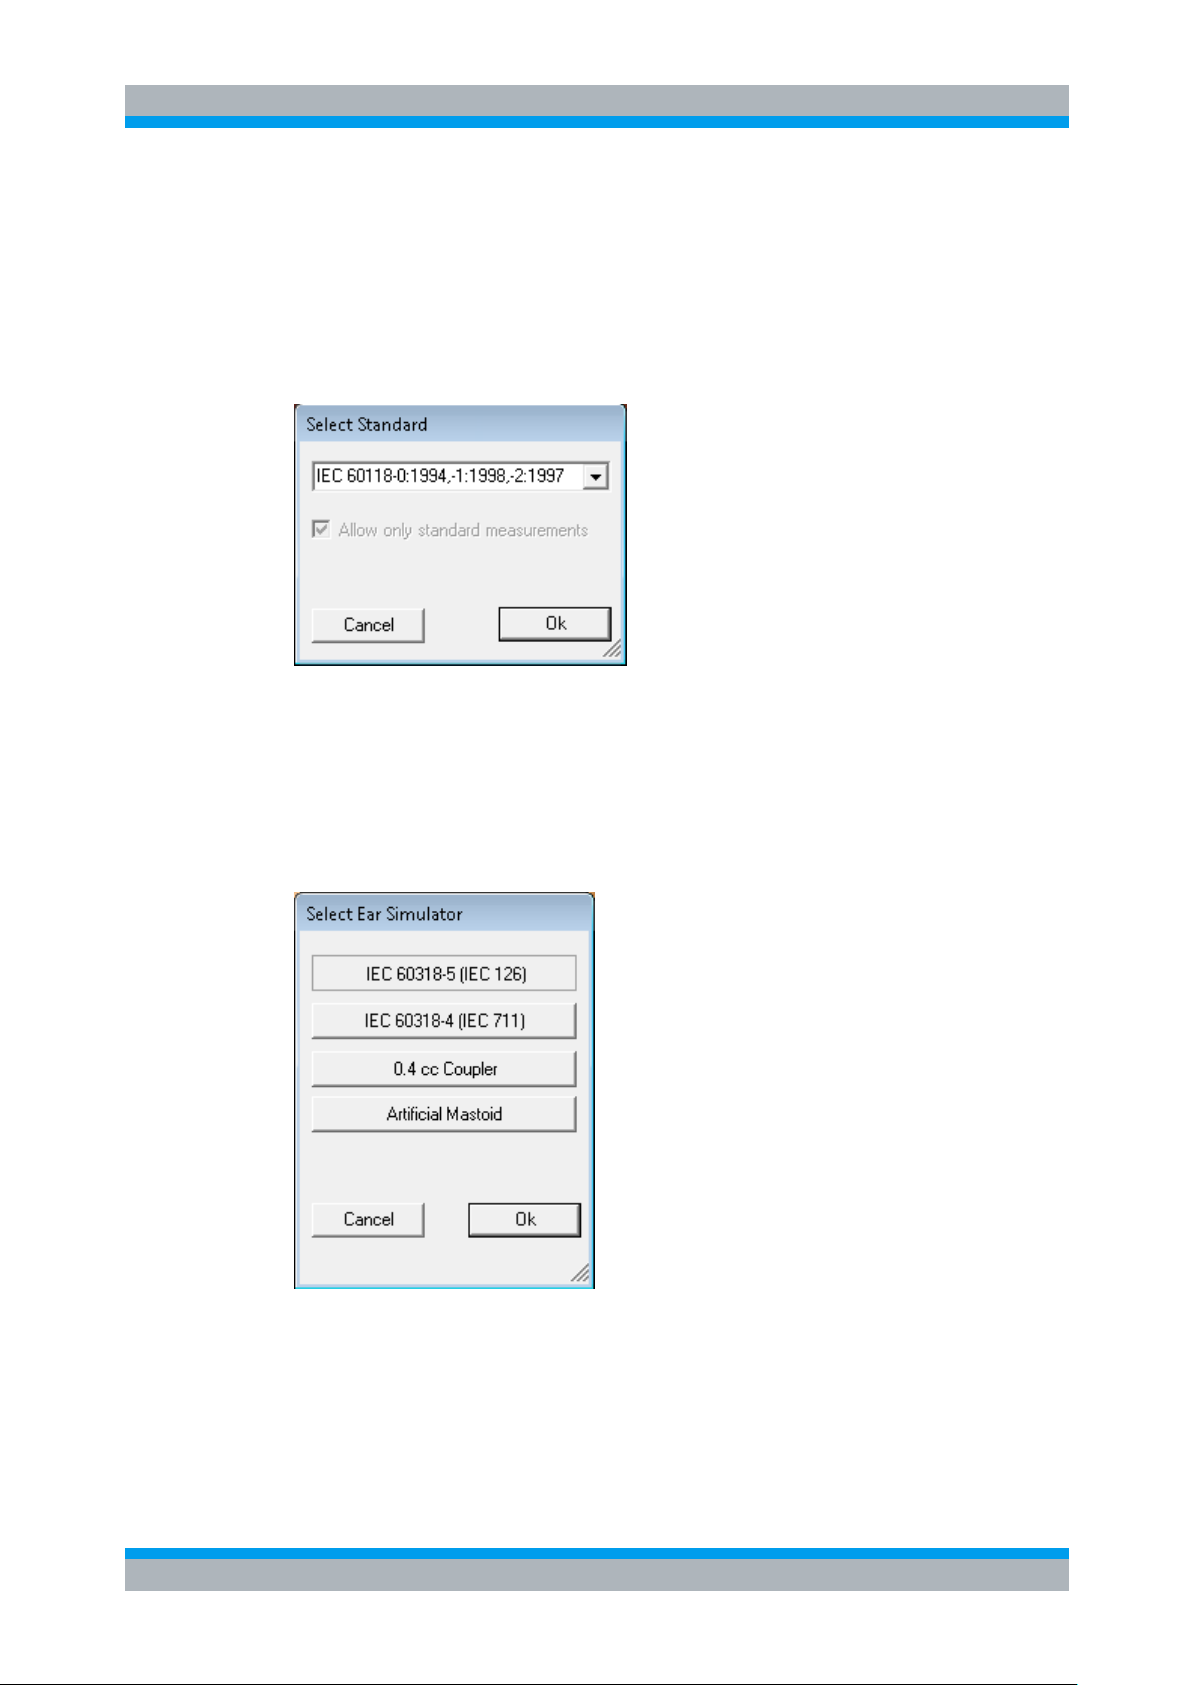
Figure 2-4 Query window for selection of applied standard
If “none” is selected in the standard selection window, all measurements appear in the
“Measurement” menu. If a standard is selected, all measurements appear in the
“Measurement” menu, but compliant measurements are checked in the menu. If “Allow
only standard measurements” is checked, non-compliant measurements are
suppressed in the Measurement menu.
Figure 2-5 Query window for selection of ear simulator
When the checkbox “Do not show this dialog again” is checked, the corresponding
selection window will not appear at the program start in future. However, the selection
is still available in the “Options” menu (see below).
Page 12
R&S UPV-K7 Preparation and Start of the Application Software
Starting the Application Software
Operating Manual 1401.9353.12 - 04 12
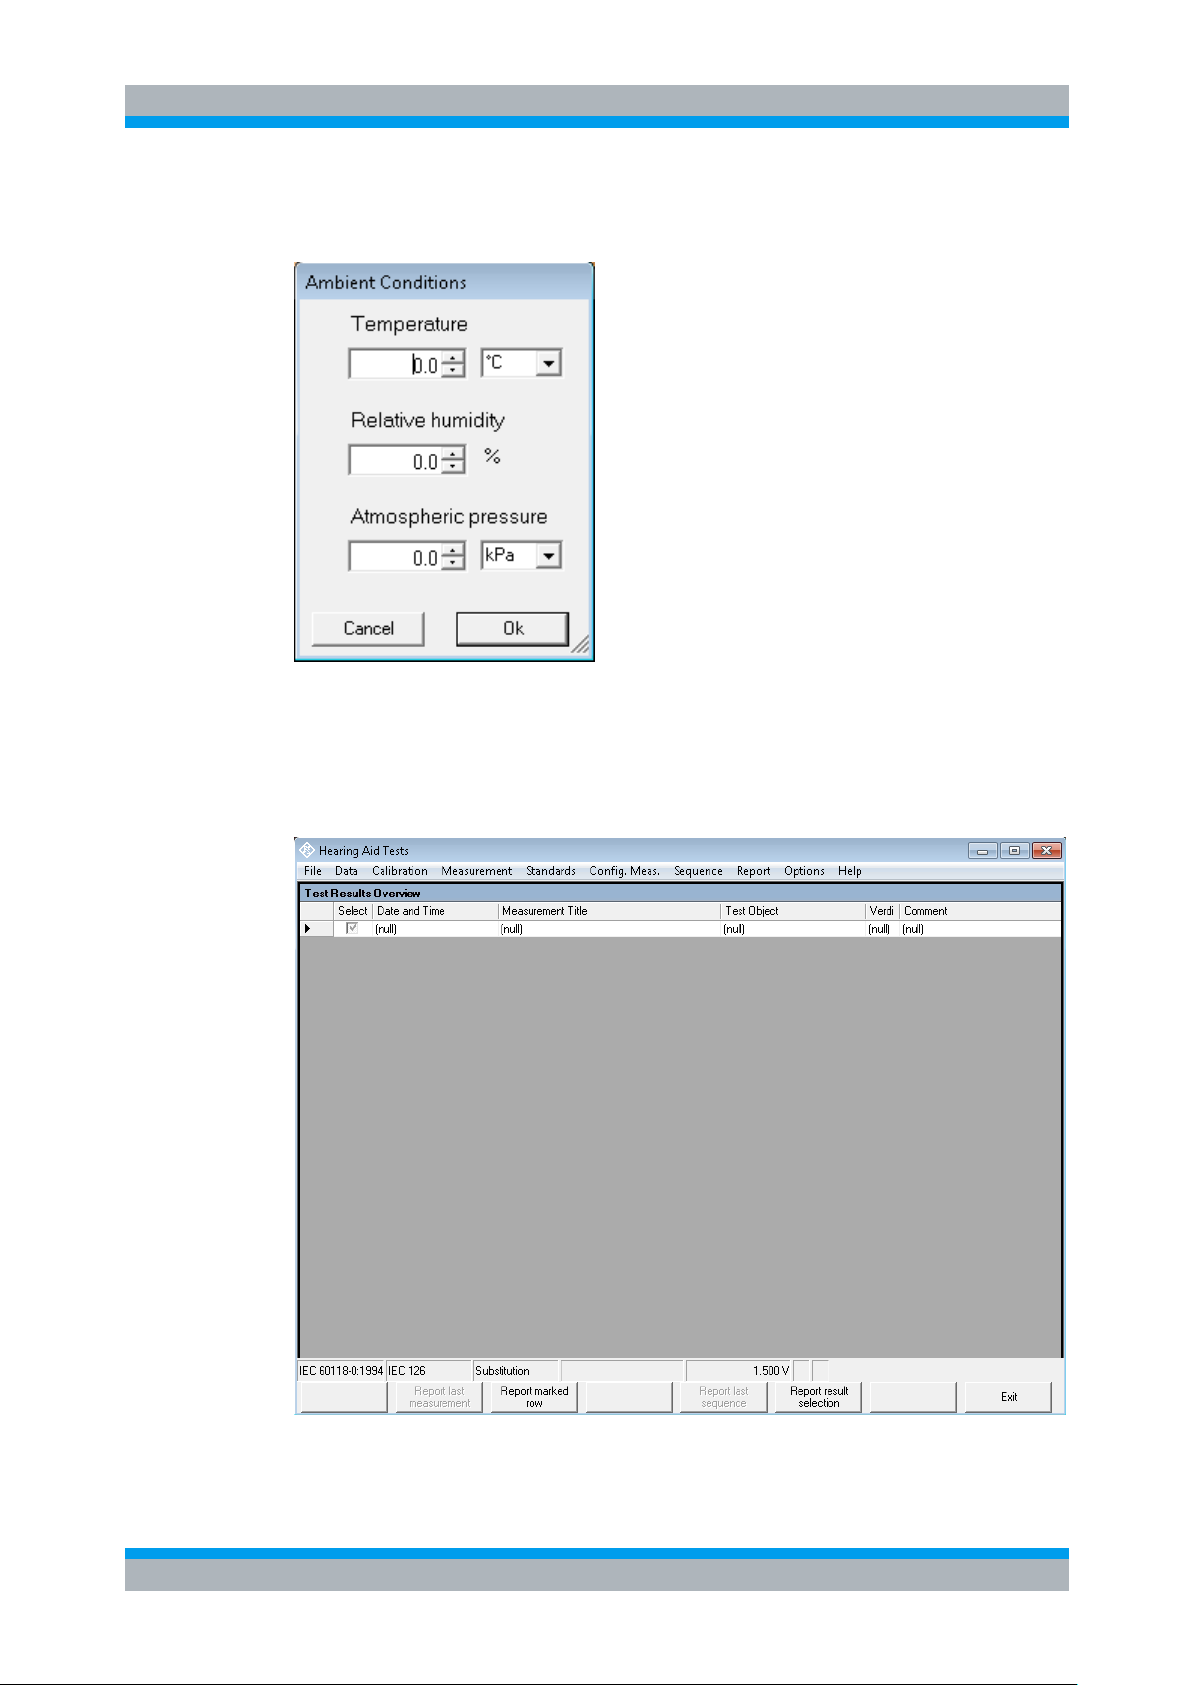
The next window to open is the input window for the ambient conditions temperature,
relative humidity and atmospheric pressure.
Figure 2-6 Query window for input of ambient conditions
The units can be switched between °C and °F and between kPa and mmHg,
respectively. After the last of the three selection windows has been closed, the main
window of the R&S UPV-K7 opens.
Figure 2-7 Main window after first start of the program
Page 13
R&S UPV-K7 Preparation and Start of the Application Software
Starting the Application Software
Operating Manual 1401.9353.12 - 04 13
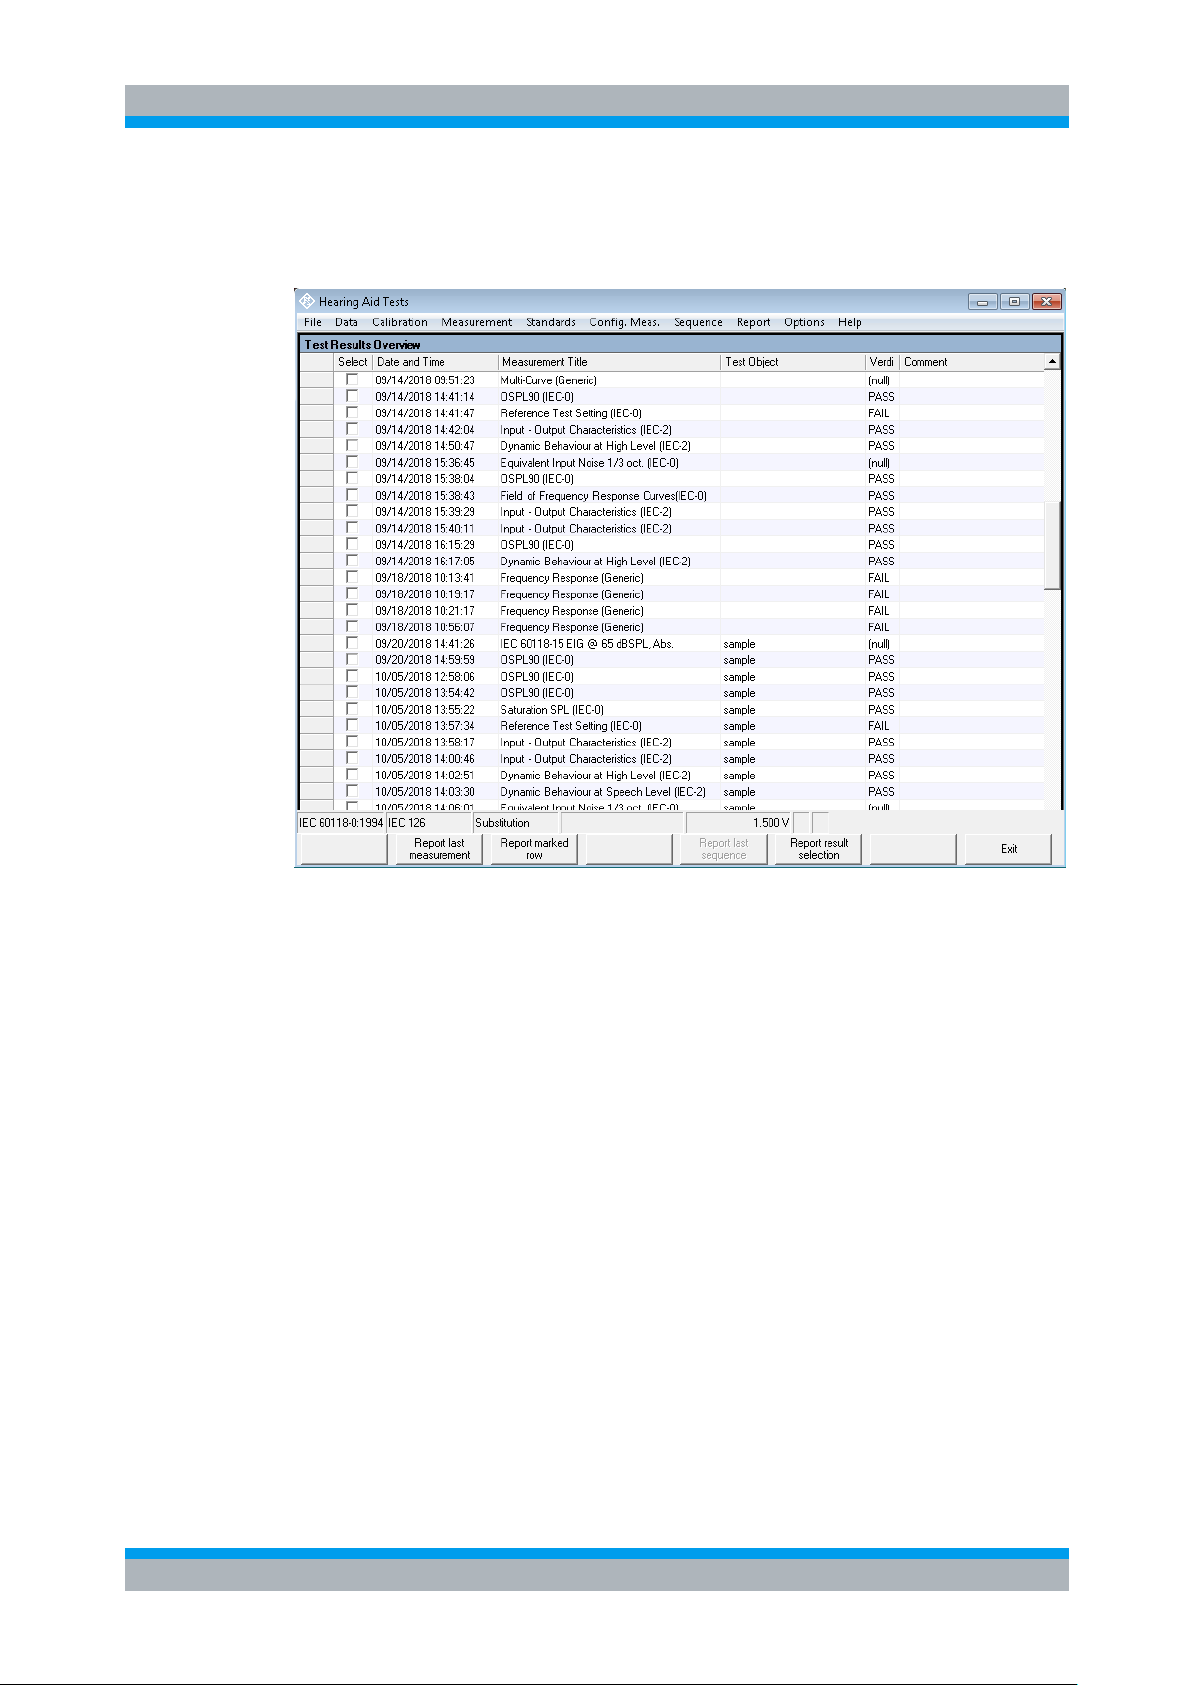
Initially, the data grid in the center of the screen which shows the result overview is
empty. The screenshot below shows an example after a number of measurements
have been made.
Figure 2-8 Main window with results
Page 14
R&S UPV-K7 Operating Concept
Operating Manual 1401.9353.12 - 04 14
3 Operating Concept
3.1 Options (General settings)
Options (General settings)
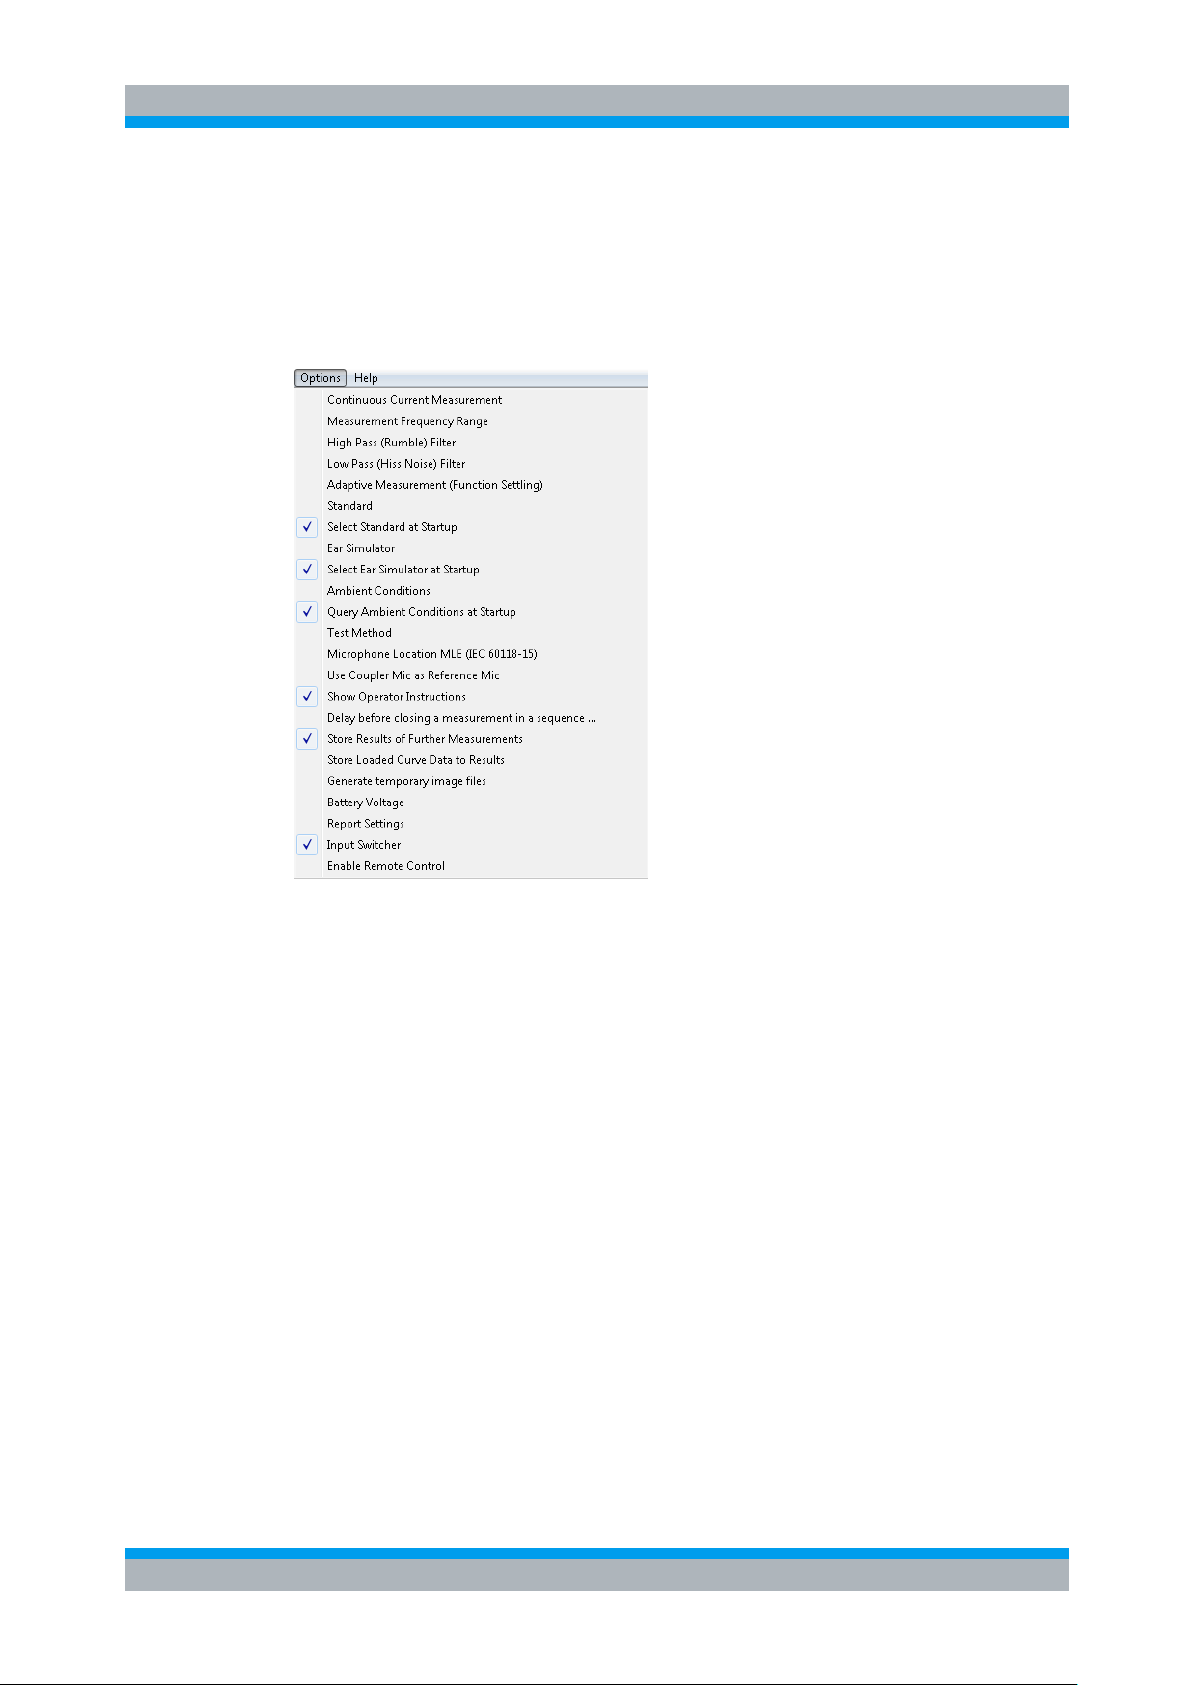
Figure 3-1 Options menu
The “Options” menu in the main window allows to change a set of general settings like
ear simulator, test method and battery voltage, which are valid for all or at least a
plurality of the tests.
“Continuous current measurement” allows to measure the supply current at
analyzer input 2. This option can only be selected with the substitution method. The
value of the shunt resistor for the current measurement can be entered in the
calibration menu. By default it is set to 2 Ω.
“Measurement frequency range” allows to enter the frequency range in which the
sound source is calibrated. In general this will be 100 Hz to 10 kHz which is the default.
“Number of points” specifies the number of (logarithmically spaced) frequencies
measured for the sound source equalization.
“High pass (rumble) filter” allows to set a high pass filter which is active in most
measurements except distortion measurements, battery current measurements and
noise measurements. The edge frequency of the high pass filter can be set, and the
filter can be activated and deactivated. The high pass filter is not applied to battery
current measurements.
Page 15
R&S UPV-K7 Operating Concept
Options (General settings)
Operating Manual 1401.9353.12 - 04 15
Filters slow down the measurement. Therefore they should only be used if necessary.
In particular a combination of selective measurement with high pass and / or low pass
filter is not recommended.
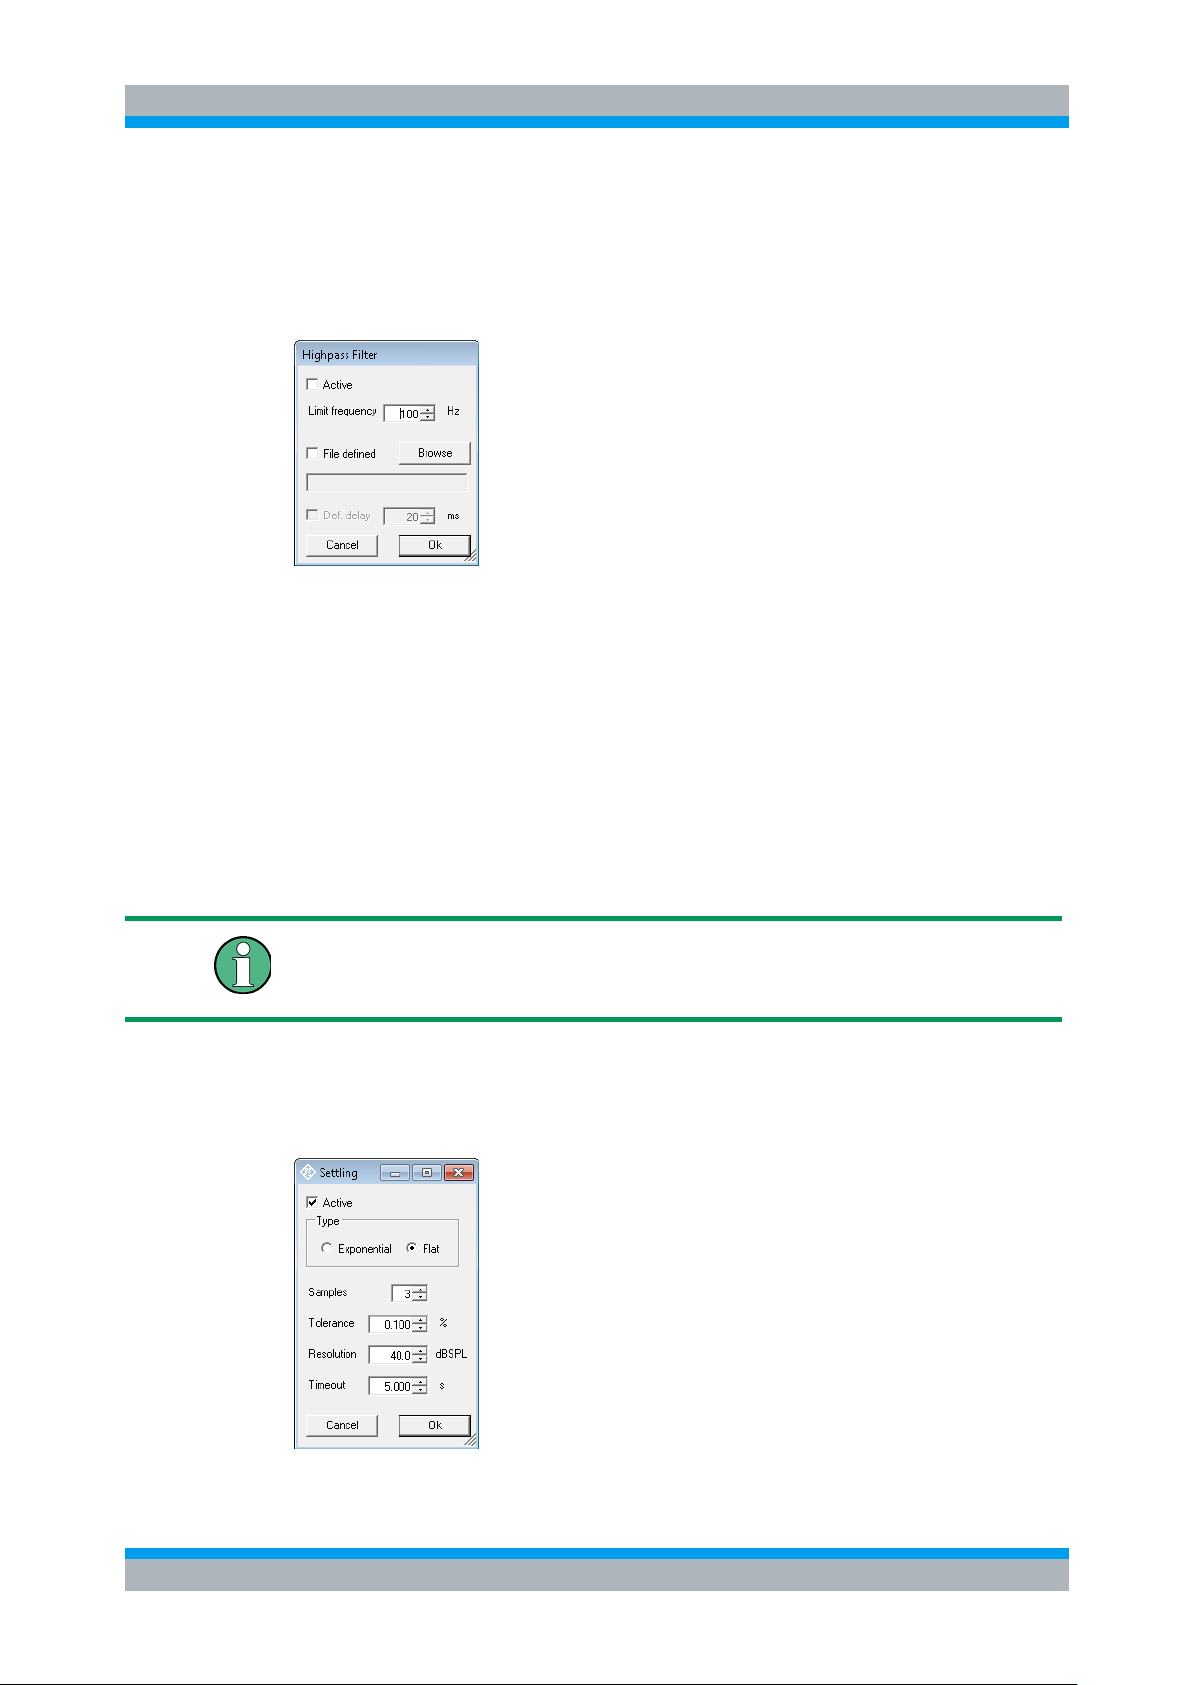
If “File defined” is deactivated, the edge frequency can be set in the “Limit frequency”
field. The R&S UPV firmware then calculates the filter coefficients and the delay to
account for the filter settling. If “File defined” is activated, a file with filter coefficients
can be loaded using the “Browse” button. A measurement delay for the filter settling
time can be set manually if the “Def. delay” checkbox is activated.
Figure 3-2 Input window for filter settings
“Low pass (hiss noise) filter” allows to set a low pass filter which is active in most
measurements except battery current measurements and noise measurements. The
edge frequency of the high pass filter can be set, and the filter can be activated and
deactivated. The low pass filter is not applied to battery current and distortion
measurements.
The settings in the “Lowpass Filter” window are according to those for the highpass
filter.
With noise measurements, the filters from the “Options” menu are only applied to the
gain measurement. The noise measurement has own parameters for the band limits of
the noise level measurement.
“Adaptive measurement (function settling)” causes gain and level measurements
to be repeated until the result has settled within a specified tolerance. This is helpful to
assure that an AGC which is present in the signal path has adapted to the applied
input signal of the hearing aid.
Figure 3-3 Input window for adaptive measurement
Page 16

R&S UPV-K7 Operating Concept
Options (General settings)
Operating Manual 1401.9353.12 - 04 16
The resolution value must be set high enough to take idle channel noise into account.
If it is set too low, especially measurements with high gain at low input levels may be
aborted due to invalid result values.
If the use of filters leads to slow measurements, the timeout value may have to be
increased.
With the “Flat” type, measurements are repeated until the last “Samples” number of
results are within the given “Tolerance” or the difference between two subsequent
measurement results is below the “Resolution” value. The “Resolution” can be used to
take into account the idle channel noise of hearing aid and measurement equipment.
With the “exponential” type of settling, differences between the earlier results may be
higher than specified, but the results must converge exponentially into the specified
values.
If the settling time of the hearing aid is known, measurement may be faster with settling
turned off. In this case the known settling time has to be entered as pre-delay in the
measurement parameters of each measurement.
Function settling is generally not applied to battery current measurements. For
harmonic distortion measurements the resolution is set fix to 0.01 % THD.
“Standard” allows to select one of the available standards. Measurements belonging
to this standard will be checked in the measurement menu. If “Allow only standard
measurements” is checked, it is not possible to start single measurements which do
not belong to the standard.
If “Select standard at startup” is checked, the selection window for the standard is
opened at each start of the program.
“Ear simulator” allows to select the type of ear simulator used. For details on the
handling of calibration data see section 4 Calibration below.
If “Select ear simulator at startup” is checked, the selection window for the ear
simulator is opened at each start of the program.
“Ambient conditions” allows to change the temperature, relative humidity and
atmospheric pressure values for the protocol.
“Query ambient conditions at startup” causes the input window for the ambient
condition to be opened at each start of the program.
Page 17
R&S UPV-K7 Operating Concept
Options (General settings)
Operating Manual 1401.9353.12 - 04 17
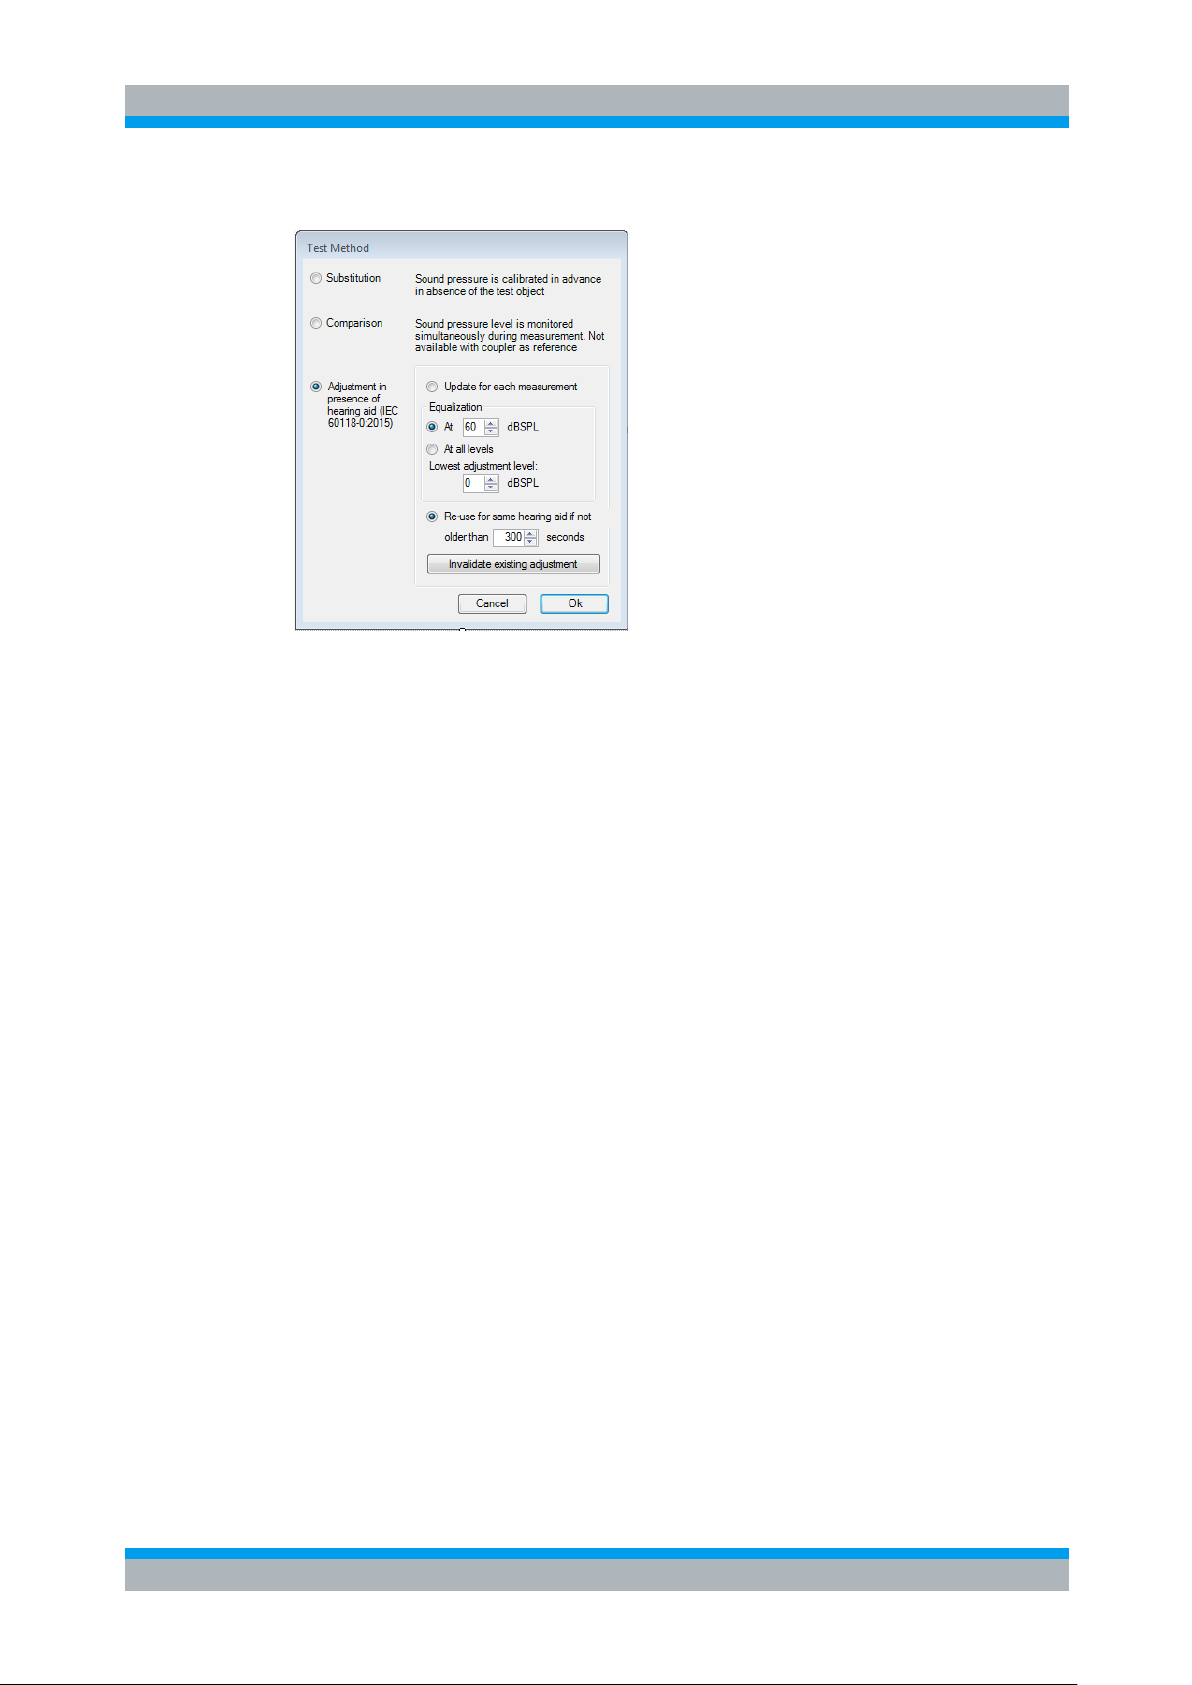
“Test method” allows to select the method for setting the input sound pressure.
Figure 3-4: Window for selection of the test method
With “Substitution”, the nominally set SPL at the input of the hearing aid is assumed to
be correct, due to the calibration of the sound source. With “Comparison”, the input
SPL is measured simultaneously with the output SPL by the reference microphone in a
two channel measurement, and results transfer measurements are corrected for the
deviation of the input SPL from the nominal value. “Comparison” cannot be selected
when the coupler microphone is used as reference microphone (see below). When the
continuous current measurement is active, an input switcher is required for the
“Comparison” method.
From IEC 60118-0:2015 it is required to adjust the input sound pressure level with the
hearing aid under test present. For sweep measurements the input sound pressure
level is measured with an extra sweep using the equalization and calibration value
obtained with the last source calibration. The deviation is subtracted as correction from
the existing values. There are options to do this for each input sound pressure level
value required in the measurement (“Subst. each”) or to do it once with a specified
default sound pressure level (“Subst. once”). As the measurement results from low
input levels can be noisy, especially when a ¼” measurement microphone is used, it is
possible to specify a minimum SPL. For all lower input levels, the sound pressure will
be adjusted with the minimum level instead. The values obtained can be re-used as
long as the same hearing aid is tested (i.e. the device under test is not changed in the
“Data” menu), or updated for each measurement. Single values are fine-adjusted in
this test mode with each measurement.
“Microphone Location MLE (IEC 60118-15)” allows to specify the location of the
hearing aid. The respective frequency correction (“location effect”) according
IEC 60118-8 is taken into account for speech tests according to IEC 60118-15.
● None: No location effect is taken into account
● BTE: Location effect for hearing aids worn behind the ear
● ITE: Location effect for hearing aids worn inside the concha
● ITC: Location effect for hearing aids inserted into the ear canal
● CIC: Location effect for hearing aids which are worn completely inside the ear
canal.
Page 18

R&S UPV-K7 Operating Concept
Options (General settings)
Operating Manual 1401.9353.12 - 04 18
“Use coupler mic as reference mic” allows to use the microphone of the IEC 126
coupler for sound source calibration. In this case the program applies the calibration
value of the coupler microphone for the sound source calibration, and the reference
microphone has to be connected to analyzer input 1 instead of analyzer input 2.
If “Show operator instructions” is checked, instructions to the operator are displayed
in a message box before the measurement starts. The operator may be prompted to
position the hearing aid in a defined way or to set the volume to a certain setting.
In Menu item “Delay before closing a measurement in a sequence” a time period
can be defined for which the result of a completed measurement is shown during
execution of a sequence, before the measurement window is closed and the next
measurement in the sequence is started.
“Store results of further measurements” allows to include results obtained with the
“Add measurement” softkey to the result database. All curves obtained this way will be
reported in the same graph. This allows e.g. to measure responses depending on
settings of the hearing aid, and to report them in a field of curves.
“Store Loaded Curve Data to results” includes curve data which is loaded with the
button “Load Curve” to the result database such that the loaded curves will appear in
the diagram of the respective report.
If “Generate temporary image files” is activated, each measurement stores a
screenshot of the result graph in an image file called “”. The file can be queried by a
remote control host after a remotely started testcase has finished. It is overwritten
when the next measurement finishes successfully.
“Battery voltage” allows to specify the supply voltage for the hearing aid. If a supply
voltage is specified in the parameters of a measurement, the general setting is
overridden. This allows to measure response curves for different supply voltages within
one sequence.
“Report settings” allows to define the type of information which should appear in the
reports. For details on reporting, see section 7 Automatic Test Sequences below.
“Input Switcher” enables the use of a UPZ12 switcher, e.g. to switch the second
analyzer input automatically between the output of a reference microphone measuring
the input sound pressure of a hearing aid, and a shunt resistor for continuous current
measurement.
If “Enable Remote Control” is active, remote controlled start of testcases and
configuration via SCPI commands is possible. For details see section 9.
Page 19
R&S UPV-K7 Calibration
Operating Manual 1401.9353.12 - 04 19
4 Calibration
4.1 Calibration Devices
R&S UPV-K7 allows to simultaneously store calibration values for multiple individuals
of the same type. This allows to switch devices without the requirement for recalibration. However, regular re-calibration is recommended in order to assure the
correct function of the used devices.
Calibration Devices
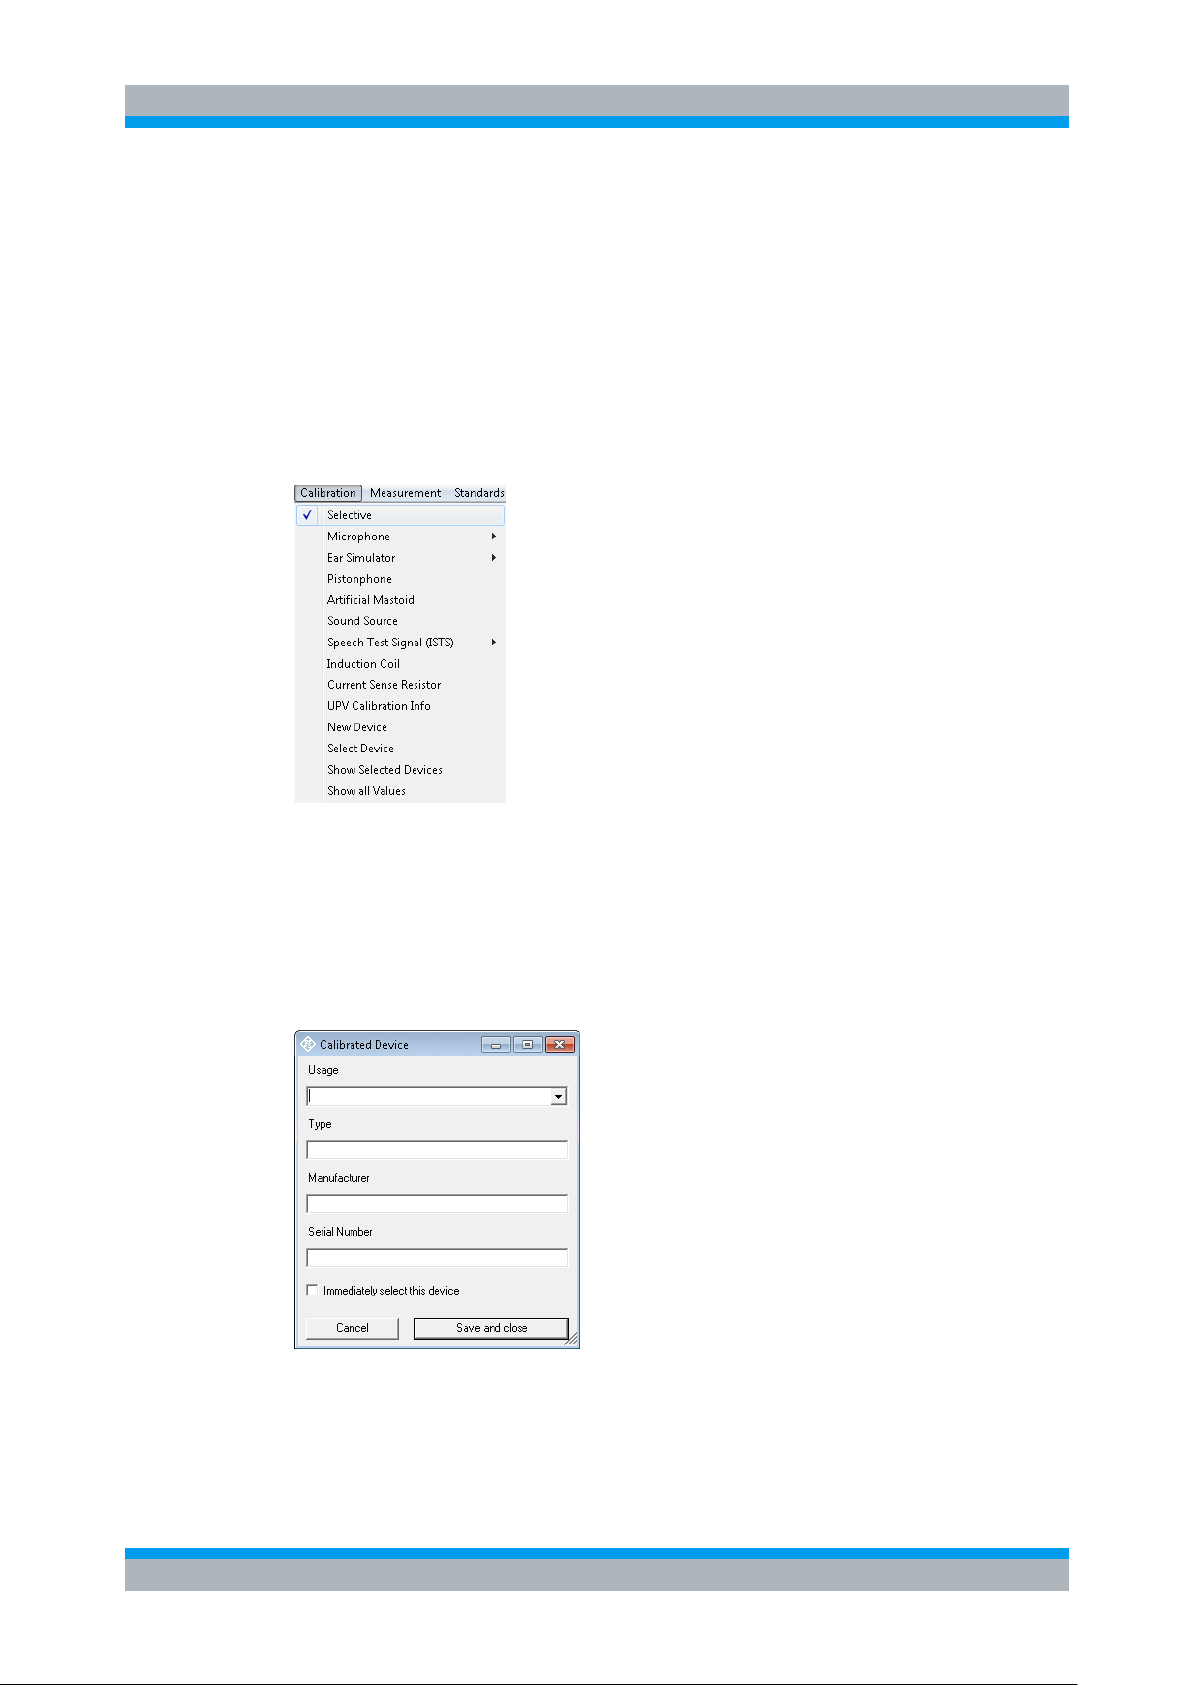
Figure 4-1 Calibration menu
For every device to be calibrated, an entry must be created using “Calibration New
device” in the main menu. This menu item opens an entry window to specify the
calibrated device. A category of device must be chosen from the combo box on top.
Type, manufacturer and serial number are entered into the text boxes below. The
entries are confirmed by clicking on the “Save and close” button.
Figure 4-2 Input window for information about calibrated device
Page 20
R&S UPV-K7 Calibration
Calibration Devices
Operating Manual 1401.9353.12 - 04 20
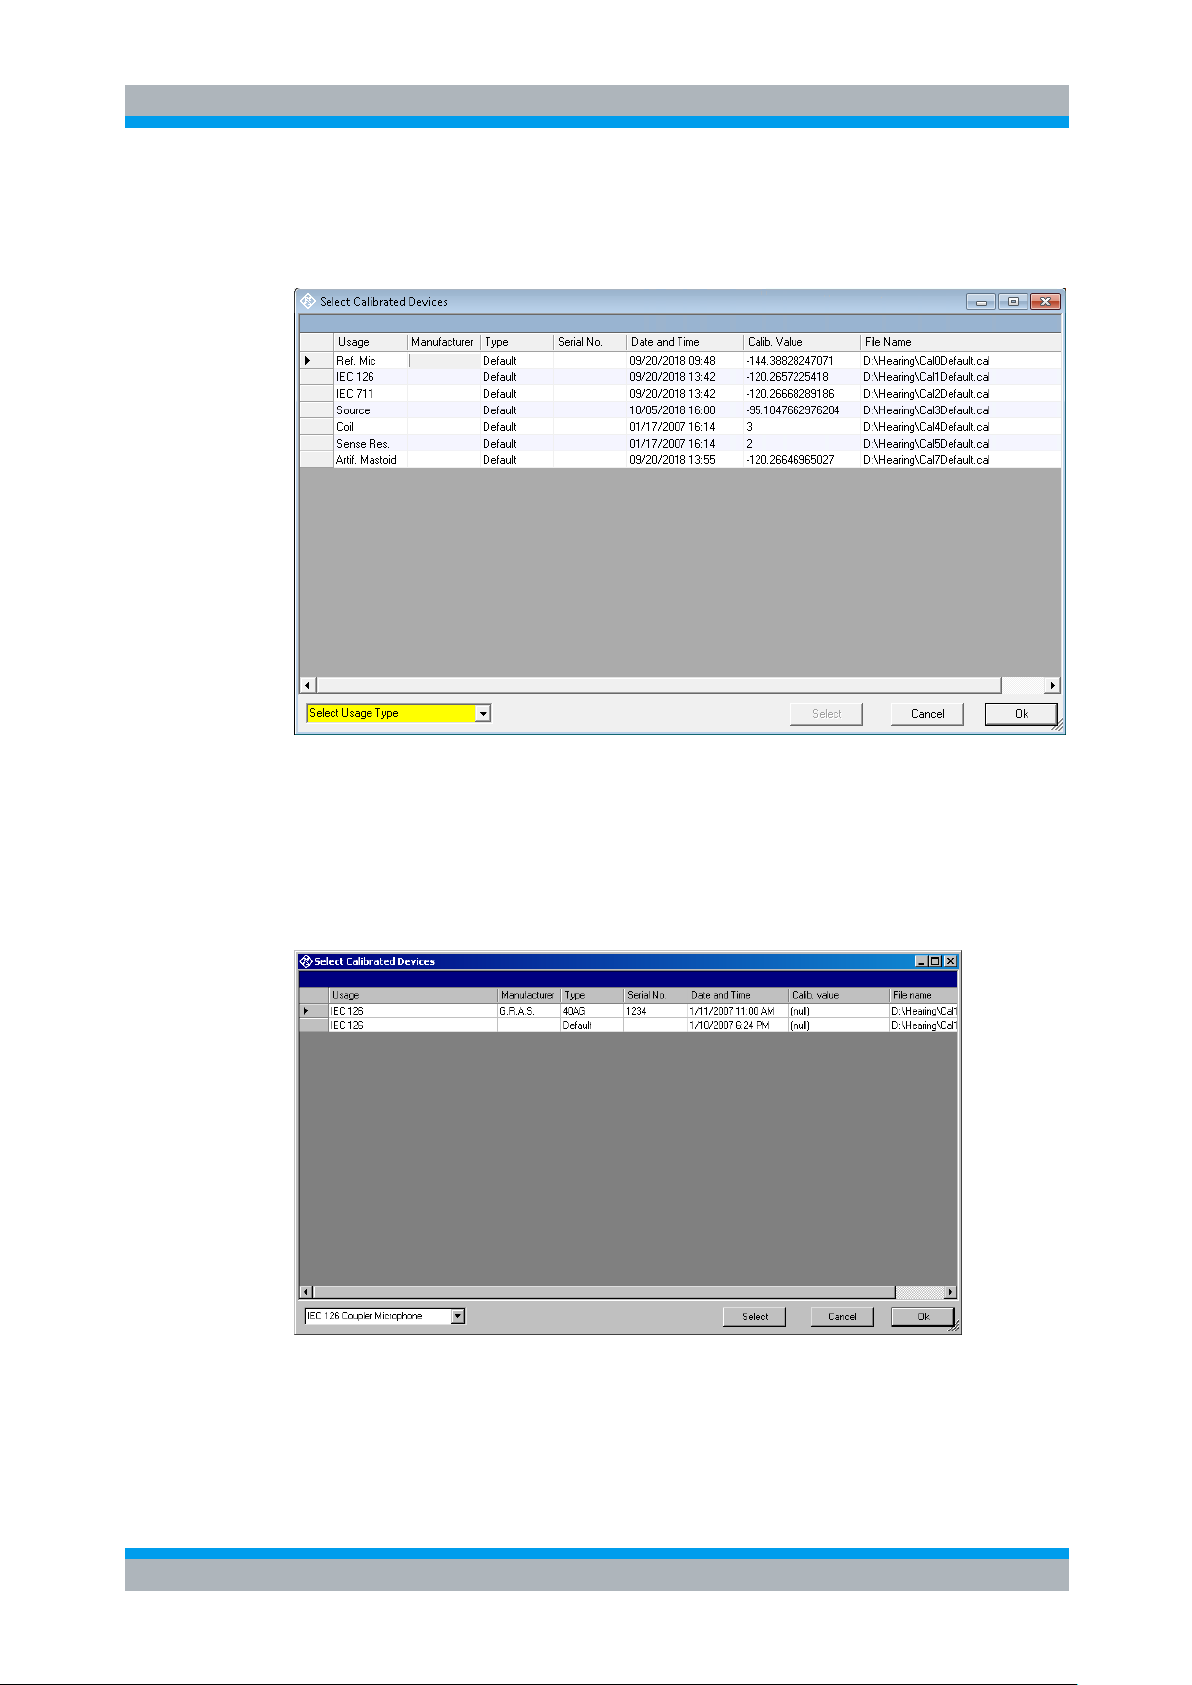
Before a device can be calibrated or used, it must be selected with “Calibration
Select device” in the main menu. Clicking on this item opens a window with a table of
all entered devices.
Figure 4-3 Window for selection of calibrated devices
In the combo box lower left, a category of devices must be selected. Subsequently the
table is reduced to available devices in this category. At first startup, there is only a
“Default” device for each category, but when more devices have been created with the
“New device” function, a choice will be available in this view. In this state a row in the
table can be marked with a mouse click on its left end. A mouse click on the button
“Select” selects this device for the associated usage.
Figure 4-4 Selection window for particular device type (here IEC 126 coupler)
Subsequently this procedure may be repeated for other categories. Finally all
selections are confirmed by clicking the “Ok” button.
Page 21
R&S UPV-K7 Calibration
Operating Manual 1401.9353.12 - 04 21
All calibration data are stored on the R&S UPV hard disk and are therefore
After inserting the microphone, wait about 10 s to allow for static pressure
equalization.
automatically available again after every restart. The calibration values for the
R&S UPV-K7 option are stored independently of other options.
All calibration routines below require as pre-requisite that a device for the respective
usage has been generated and selected.
To simplify the procedure for the case that it is not intended to use multiple devices of
the same category nor to include information about the used devices into a report,
there is a “Default” device selected for each device type or category after the first start
of the program.
4.2 Microphone Calibration
► Insert the measuring microphone fully into the adapter of the sound level
calibrator and switch on the calibrator.
Microphone Calibration
► Call the test routine with “Calibration Microphone 2 cc Coupler”,
“Calibration Microphone Reference” or “Calibration Microphone
0.4 cc Coupler” from the main menu, depending on the microphone.
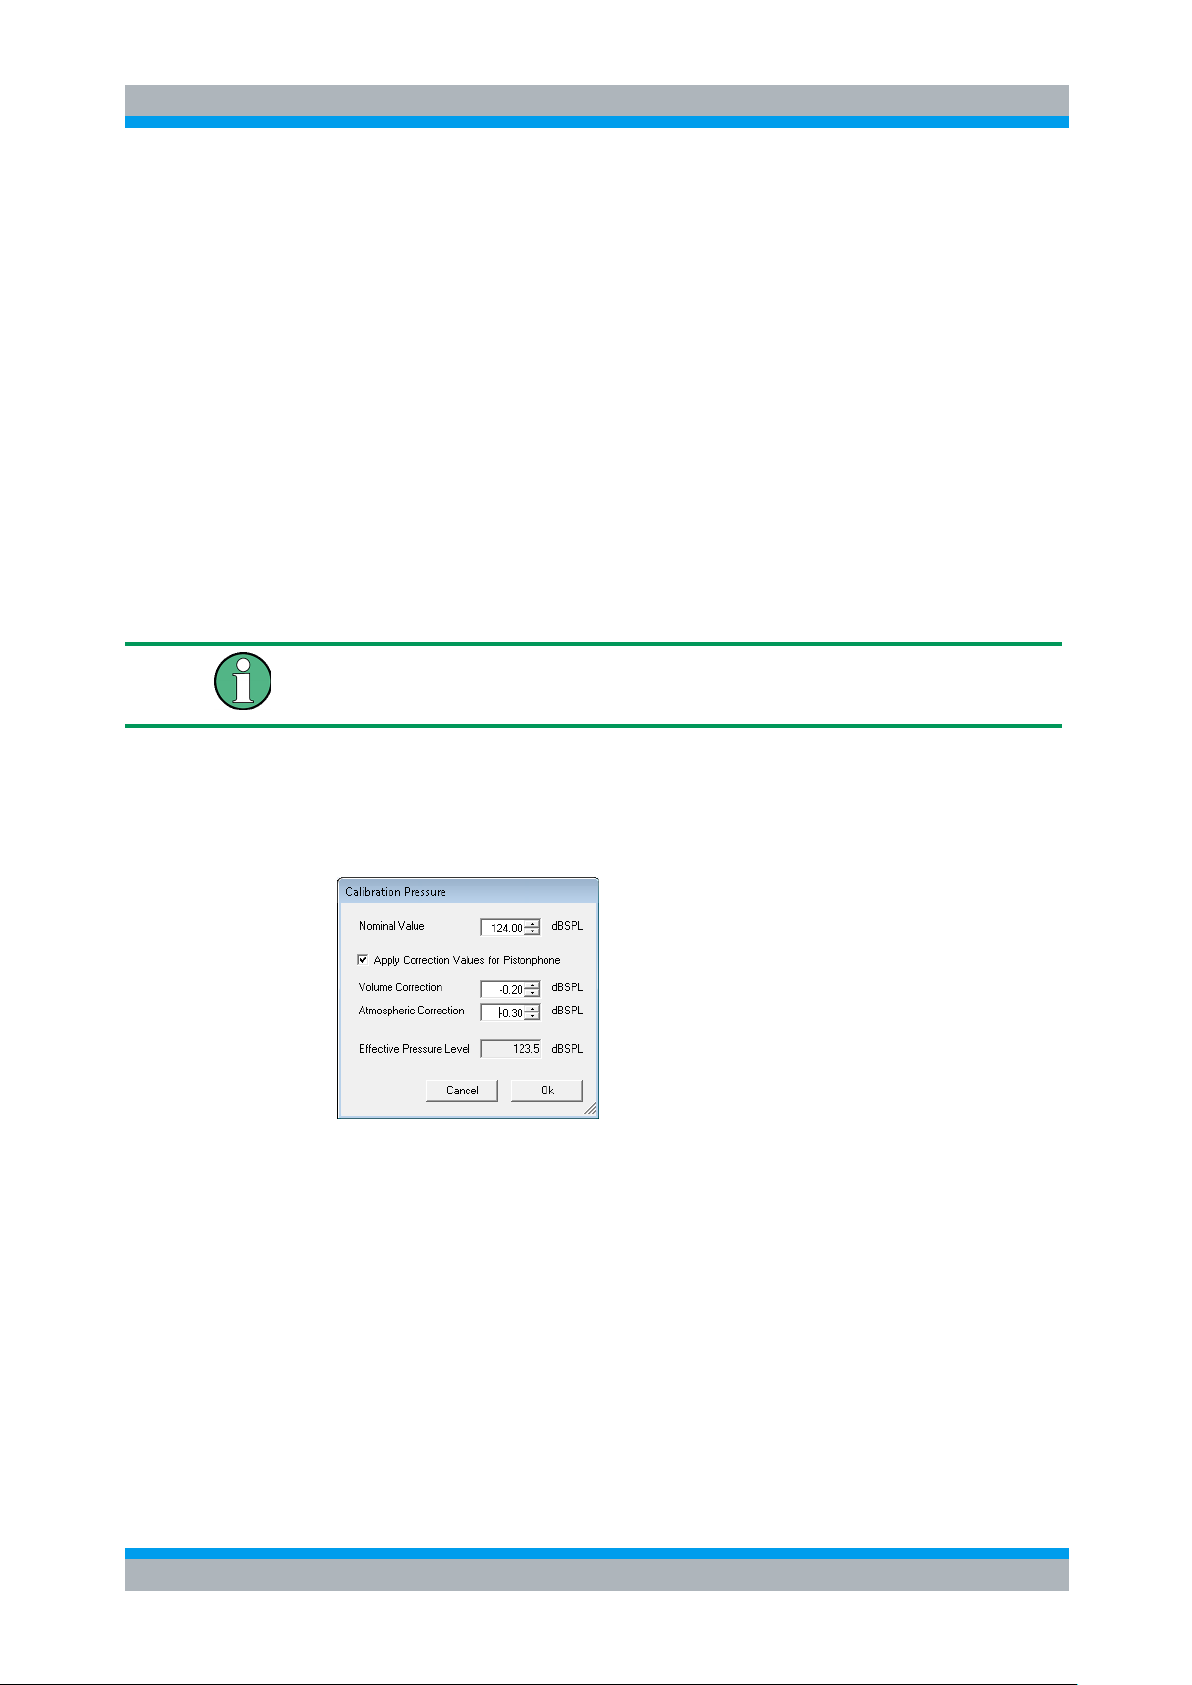
First the nominal SPL of the calibrator has to be entered:
Figure 4-5 Input window for calibration SPL
Checkbox “Apply Correction Values for Pistonphone” allows to specify volume
correction and atmospheric correction values which are added to the nominal
calibration value to calculate the effective pressure level at the microphone during
calibration. If this checkbox is checked, the default for the nominal calibration
value is 124 dBPL. If the calibration values are deactivated, the default is 93.98
dBSPL.
Page 22
R&S UPV-K7 Calibration
Calibration of Ear Simulator IEC 711
Operating Manual 1401.9353.12 - 04 22
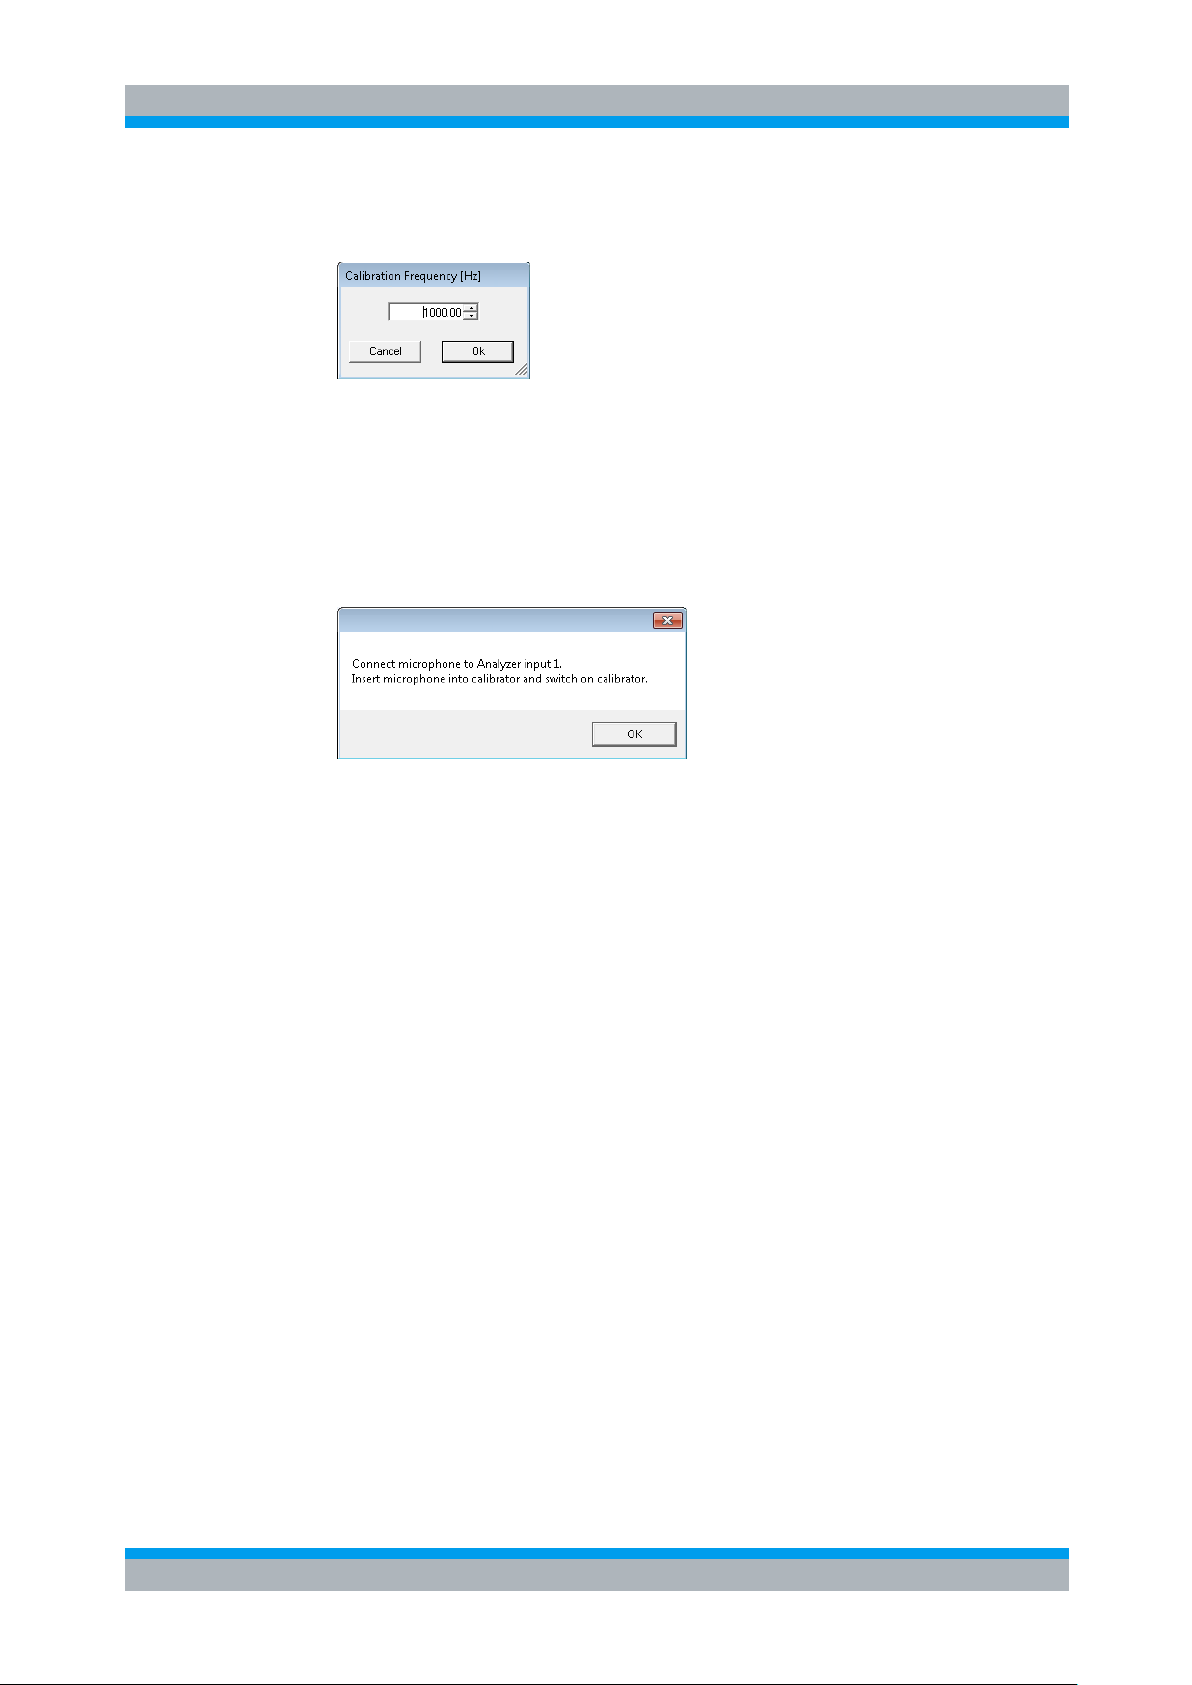
If selective calibration is activated in the calibration menu, the frequency of the
calibration signal has to be entered:
Figure 4-6 Input window for calibration frequency
If correction values for pistonphone are used, the default for the calibration
frequency is 250 Hz. Otherwise the default calibration frequency is 1000 Hz.
After these settings have been confirmed, instructions for connecting the
microphone are displayed, unless an input switcher is used. The reference
microphone must be connected to analyzer input 2, coupler microphones must be
connected to analyzer input 1.
Figure 4-7 Connection instructions of microphone calibration
Subsequently, the output voltage of the microphone is measured and the
sensitivity displayed with reference to 1 Pa. If a mere power supply without gain is
used, the displayed sensitivity must approximately match the value in the
calibration certificate of the microphone capsule (typical value for microphone
capsule 4134 of artificial ear 4185 is approx. 12 mV/Pa, display = 120 mV/Pa). If a
conditioning amplifier with 20 dB gain (recommended value) is used, the displayed
sensitivity must be about 10 times higher. If the voltage measured is below 3 mV
or instable, an error message is displayed. Possible error sources are, for
example, a switched-off microphone power supply or a disabled calibrator. In this
case, the program requests that the calibration is repeated. After switching on the
microphone power supply, wait approx. 20 s before starting the calibration again.
4.3 Calibration of Ear Simulator IEC 711
For calibration of the IEC 711 ear simulator, an adapter part must be screwed onto the
simulator which allows it to be inserted into the calibrator like a ½” microphone. The
calibration routine is started with “Calibration Ear Simulator IEC 711” and follows
the course described above.
Page 23

R&S UPV-K7 Calibration
Entering correction values for Pistonphones
Operating Manual 1401.9353.12 - 04 23
4.4 Entering correction values for Pistonphones
With the menu Item “Pistonphone” in the “Calibration” menu, volume and atmospheric
correction values can be viewed and edited. In addition the default nominal level and
calibration frequency for pistonphone use can be modified.
Volume correction values are specific to the different microphone or coupler types and
can therefore be entered separately. The atmospheric correction value is common to
all microphones and ear simulators.
Figure 4-8 Input window pistonphone correction values
4.5 Calibration of Sound Source
Before a hearing aid can be tested, the absolute sensitivity and frequency response of
the sound source have to be measured and corrected with the aid of a previously
calibrated reference microphone. If “Use coupler mic as reference mic” is activated in
the “Options” menu, the microphone of the IEC 126 coupler can be used for this
purpose. The frequency response of the microphone can be ignored in the test
frequency range (100 Hz to 10 kHz) (see also calibration certificate of microphone
capsule). If a separate reference microphone is used, this has to be calibrated
beforehand with “Calibration Microphone Reference”.
After starting the sound source calibration with “Calibration Sound Source”, the
calibration level can be defined. This allows to adapt the calibration to specific
measurement levels. It is also possible to store calibrations for different levels using
multiple calibration devices (see above).
The sound pressure generated at the point of the reference microphone is set to
exactly the specified level in an automatic measurement routine at 1 kHz. The
generator voltage required is stored in a file on the hard disk and used as a reference
for all subsequent settings with the same sound source. If the sound pressure cannot
be adjusted to the specified value, an error message is displayed with a request to
check the connection to the sound source and to repeat the measurement.
Page 24
R&S UPV-K7 Calibration
Calibration of the International Speech Test Signal (ISTS)
Operating Manual 1401.9353.12 - 04 24
The uncorrected frequency response of the sound source is measured and displayed.
Next, the frequency response is measured with the inverse frequency response
correction automatically selected in the generator (equalization). Residual errors
caused by nonlinearities of the speaker are measured and taken into account in the
final equalization file as fine correction.
To verify the results, the absolute sound pressure versus frequency is measured at the
specified sound pressure level. Correct calibration without interfering sound yields an
almost straight line.
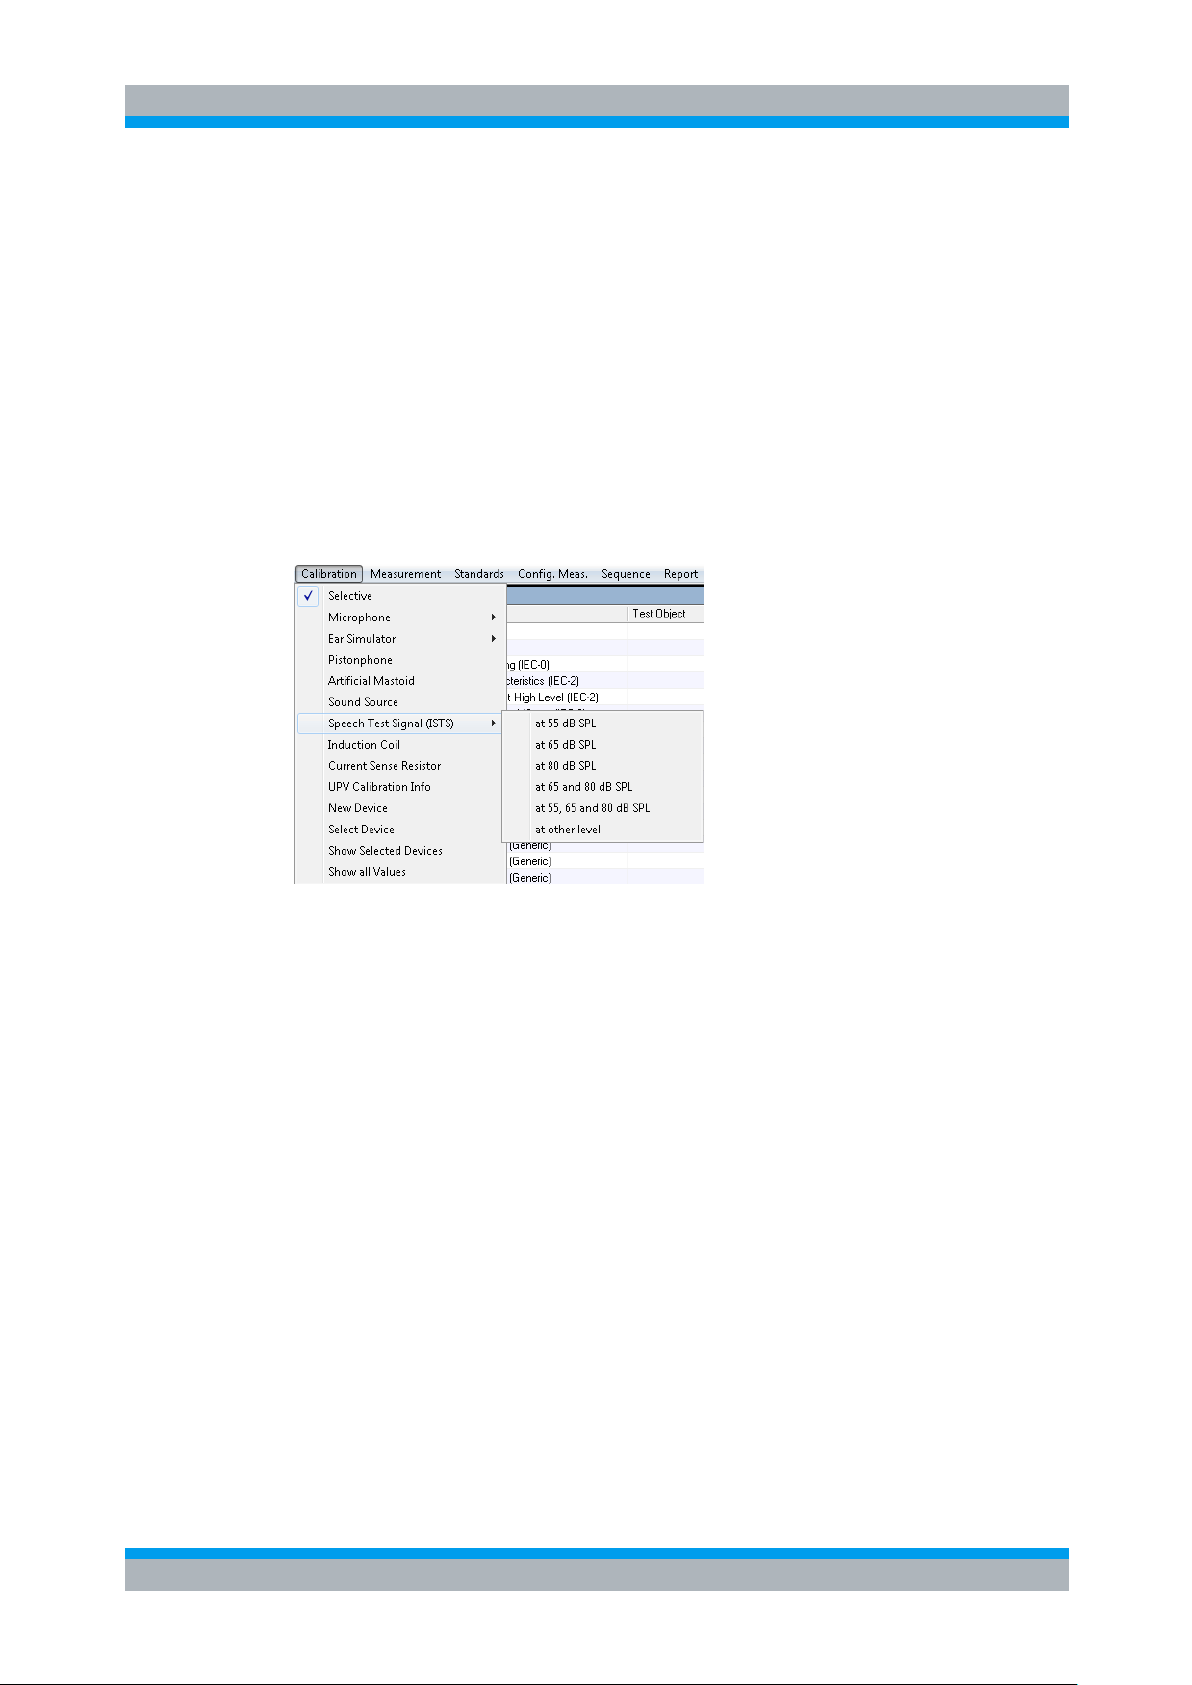
4.6 Calibration of the International Speech Test Signal (ISTS)
This item is only available with option R&S UPV-K71 installed.
Figure 4-9 Submenu for ISTS calibration
The calibration function performs the following actions on the ISTS:
● Pre-filtering the speech signal with the inverse frequency response of the sound
source (valid sound source calibration is prerequisite)
● Level alignment of the filtered signal
● Analysis of the long-term average spectrum and percentile spectra at the
reference point and limit check in comparison to the requirements in IEC 60118-
15.
● Analysis of the speech signal at the reference point as input signal to the hearing
aid (according to IEC 60118-15). Raw results like 3rd octave spectra over time
and selected intervals in each 3rd octave for given percentiles are stored in files
for later use in the measurement function.
● Pre-filtering of the equalized signal according to the different microphone location
effects.
Standard speech levels are 65 dBSPL, 80 dBSPL and optionally 55 dBSPL.
Additionally calibration can also be performed at other levels if required. Especially for
low levels like 55 dBSPL, a low-noise microphone is required to get correct values for
the 30% percentile.
Page 25
R&S UPV-K7 Calibration
Calibration Value for Induction Coil
Operating Manual 1401.9353.12 - 04 25
Before starting the ISTS calibration routine, either a coupler microphone or a reference
microphone must be calibrated. If the coupler microphone is to be used for this
calibration function, select “Options Use coupler mic as reference mic”. The coupler
microphone must be connected to analyzer input 1. If a separate reference microphone
is to be used, “Options Use coupler mic as reference mic” must be unchecked. The
reference microphone must be connected to analyzer input 2.
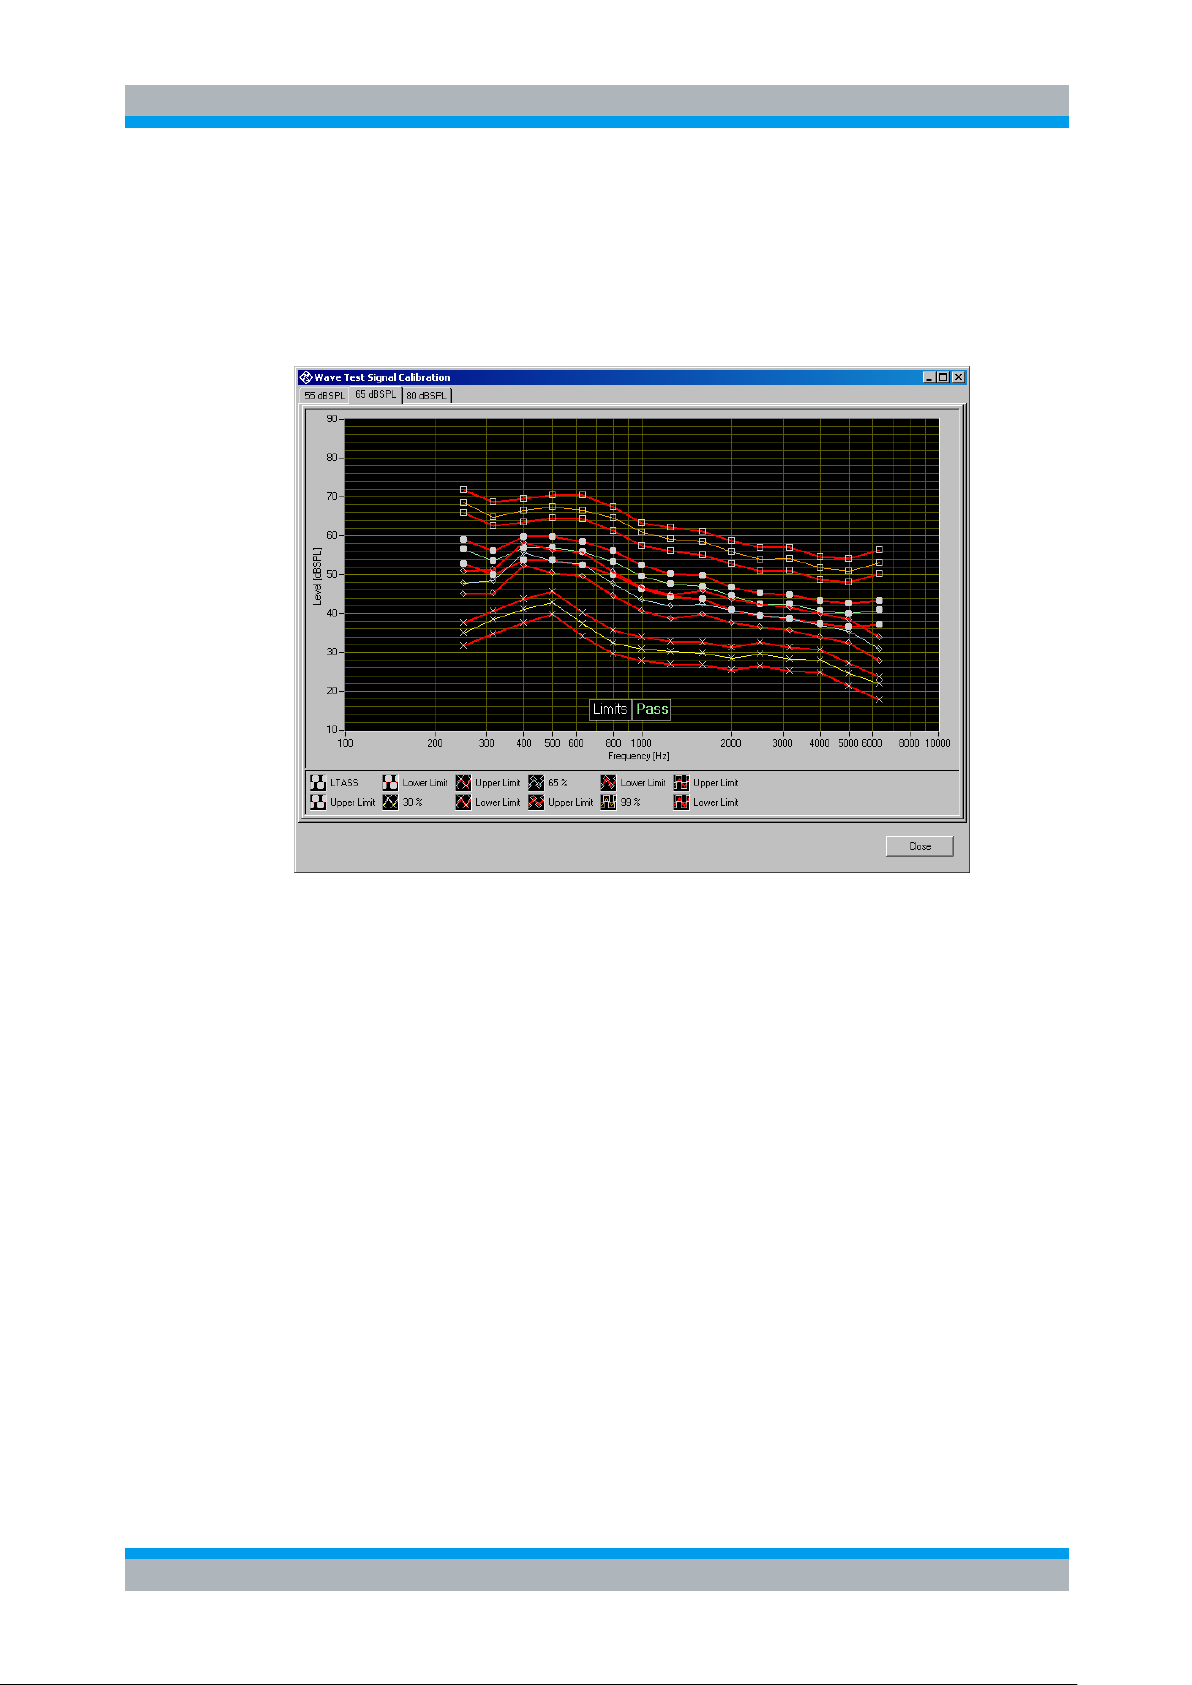
Figure 4-10 ISTS calibration result
For each calibrated speech level, the window contains a tab with a result graph. Each
result graph shows long-term average speech spectrum (LTASS) and percentile levels
for this speech level, together with limits calculated from the nominal levels given in
IEC 60118-15 for the ISTS at 65 dBSPL speech level ±3 dB.
The calibration is valid even if not all limits are passed. Particularly ad 55 dBSPL it
might be difficult to pass the limits for the 30% percentile.
4.7 Calibration Value for Induction Coil
The sensitivity H/I for the induction coil used for hearing aid tests with inductive input
can be entered under menu Item “Induction Coil” in the “Calibration” menu.
Refer to the data sheet of the test box for induction coil sensitivity and resistance.
Page 26
R&S UPV-K7 Data Entry for Reporting
Operating Manual 1401.9353.12 - 04 26
5 Data Entry for Reporting
5.1 Operator
Under “DataOperator” an operator’s name can be entered which is stored in
association with all calibration and measurement results. If “Operator” is activated in
the report settings, the name will appear in all reports about these measurements.
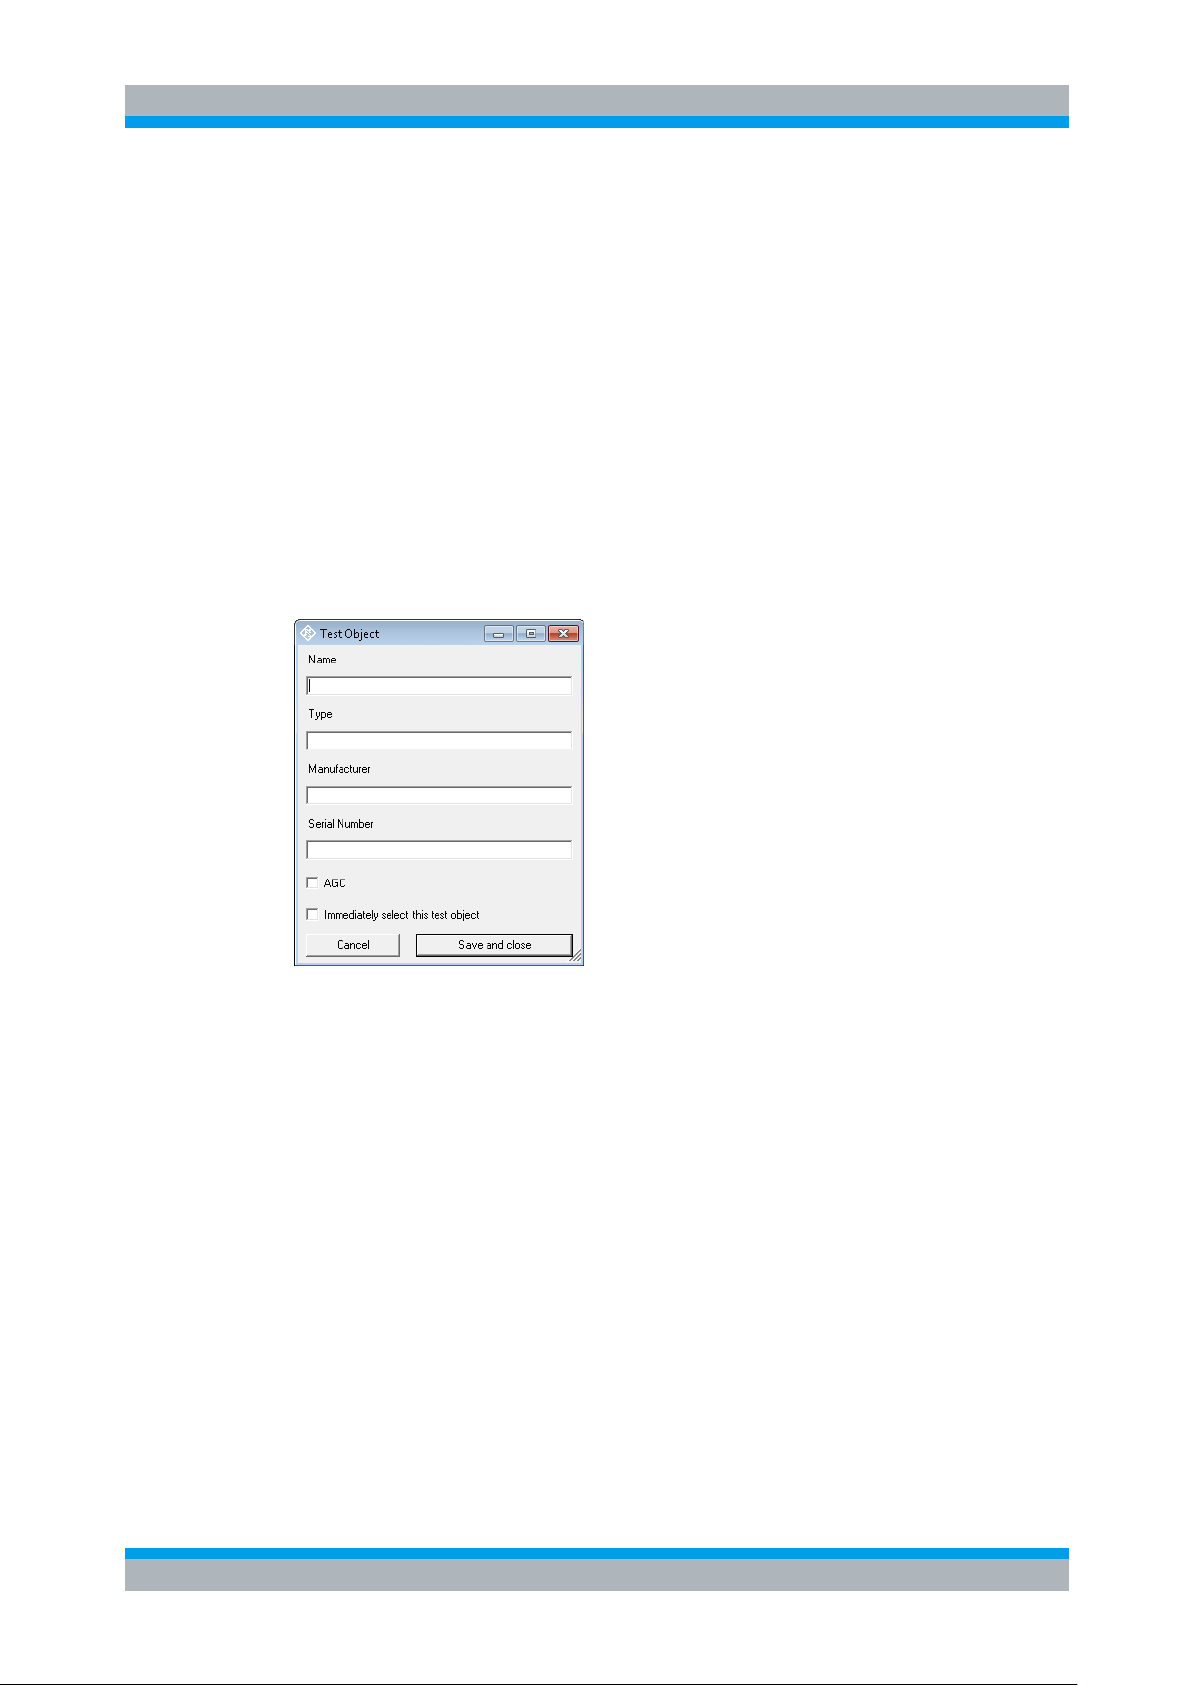
5.2 Test Object
Under “Data Test object New” a description of the device under test can be
entered.
Operator
Figure 5-1 Window for input of information about a test object
With “Data Test object Select” one of the entered test objects can be selected.
The data of this selected test object will be stored in association with all measurements
and appear on the associated reports if “DUT information” is activated in the report
settings.
Page 27
R&S UPV-K7 Measurements
Functionality and Control of the Measurement Macros
Operating Manual 1401.9353.12 - 04 27
6 Measurements
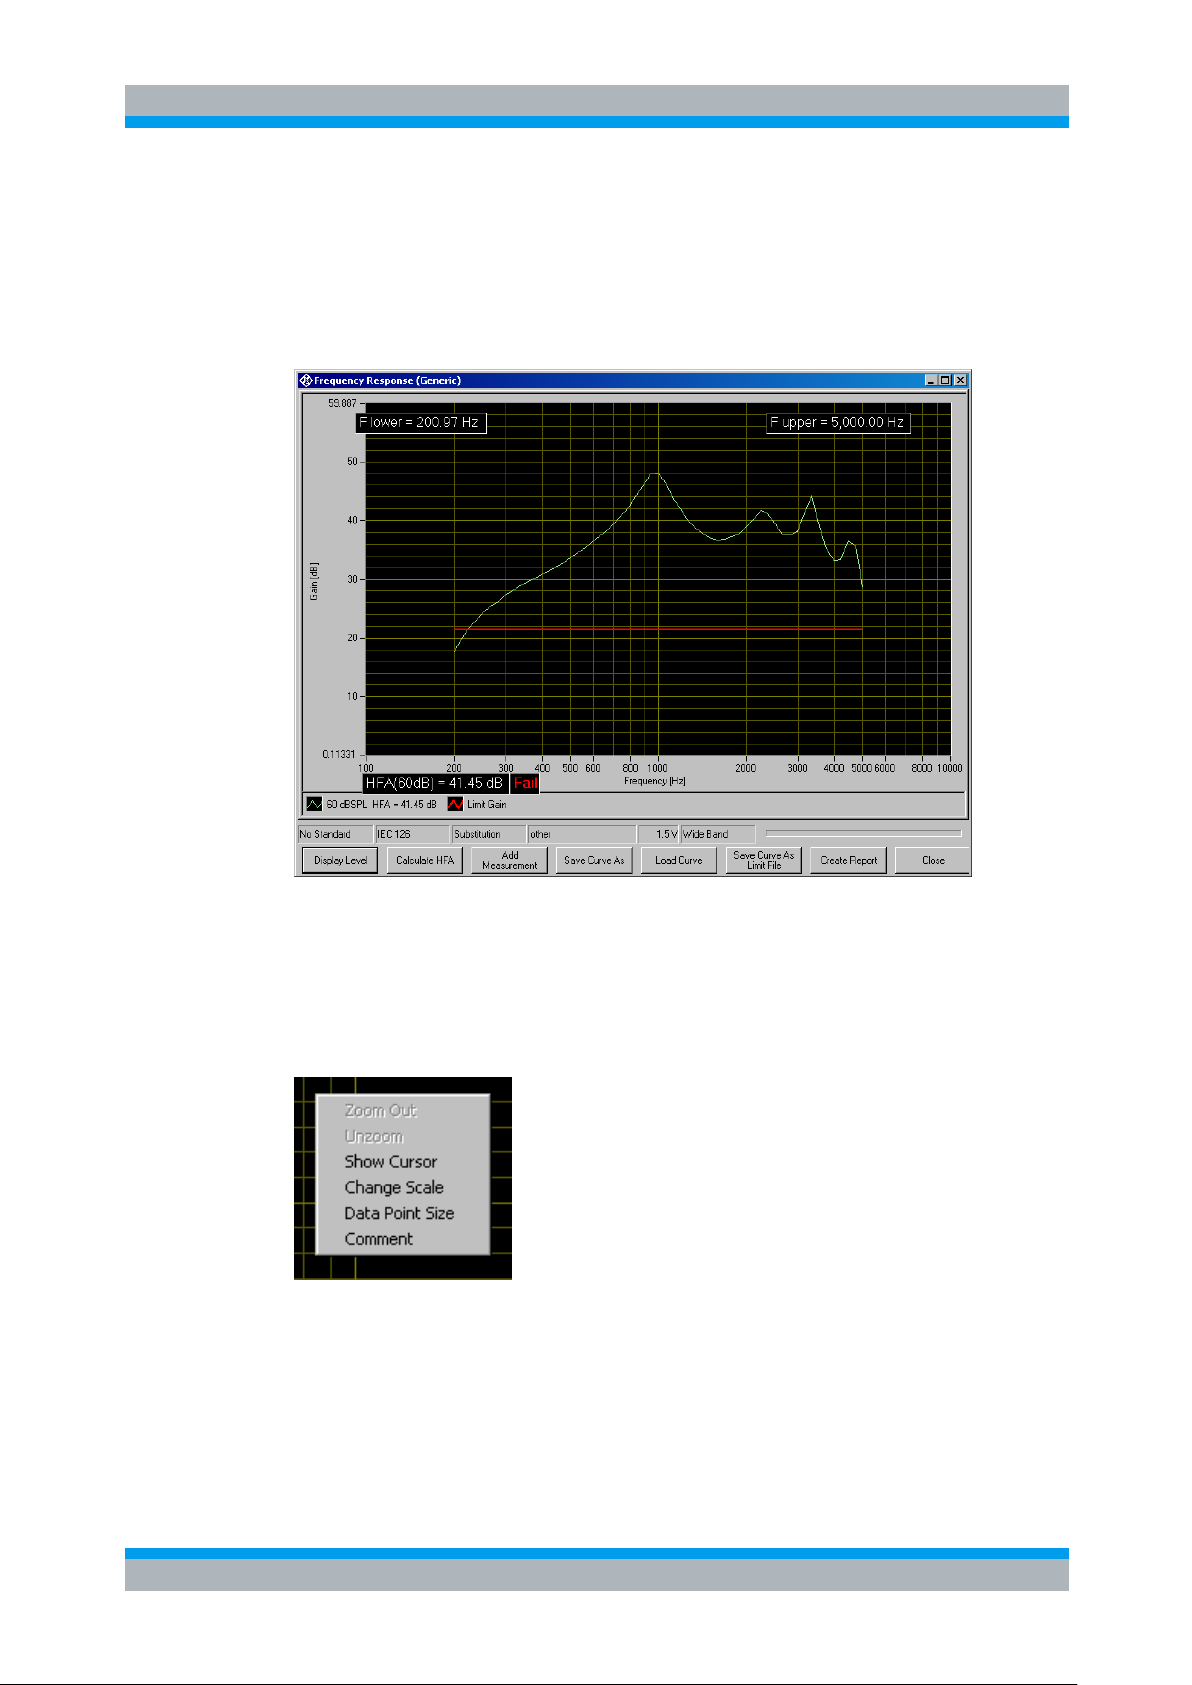
6.1 Functionality and Control of the Measurement Macros
Figure 6-1 Example of a measurement window
When a measurement macro is started, e.g. from the “Measurement” menu, the
standardized measurement is immediately executed. With a single measurement, the
window of the measurement macro stays open after the measurement is terminated. At
that time, the following functionality is available:
Figure 6-2 Context menu of the graph window
Page 28
R&S UPV-K7 Measurements
Functionality and Control of the Measurement Macros
Operating Manual 1401.9353.12 - 04 28
6.1.1 Zooming
When the “Shift” key on the keyboard is pressed, the mouse cursor changes to the
zoom cursor. When the left mouse button is pressed, a rectangle can be marked in the
graph. As soon as the left mouse button is released, the graph is zoomed into the area
of the marked rectangle
“Zoom Out” in the graph context menu reverses the last zooming step. “Unzoom”
zooms completely out to the original scaling.
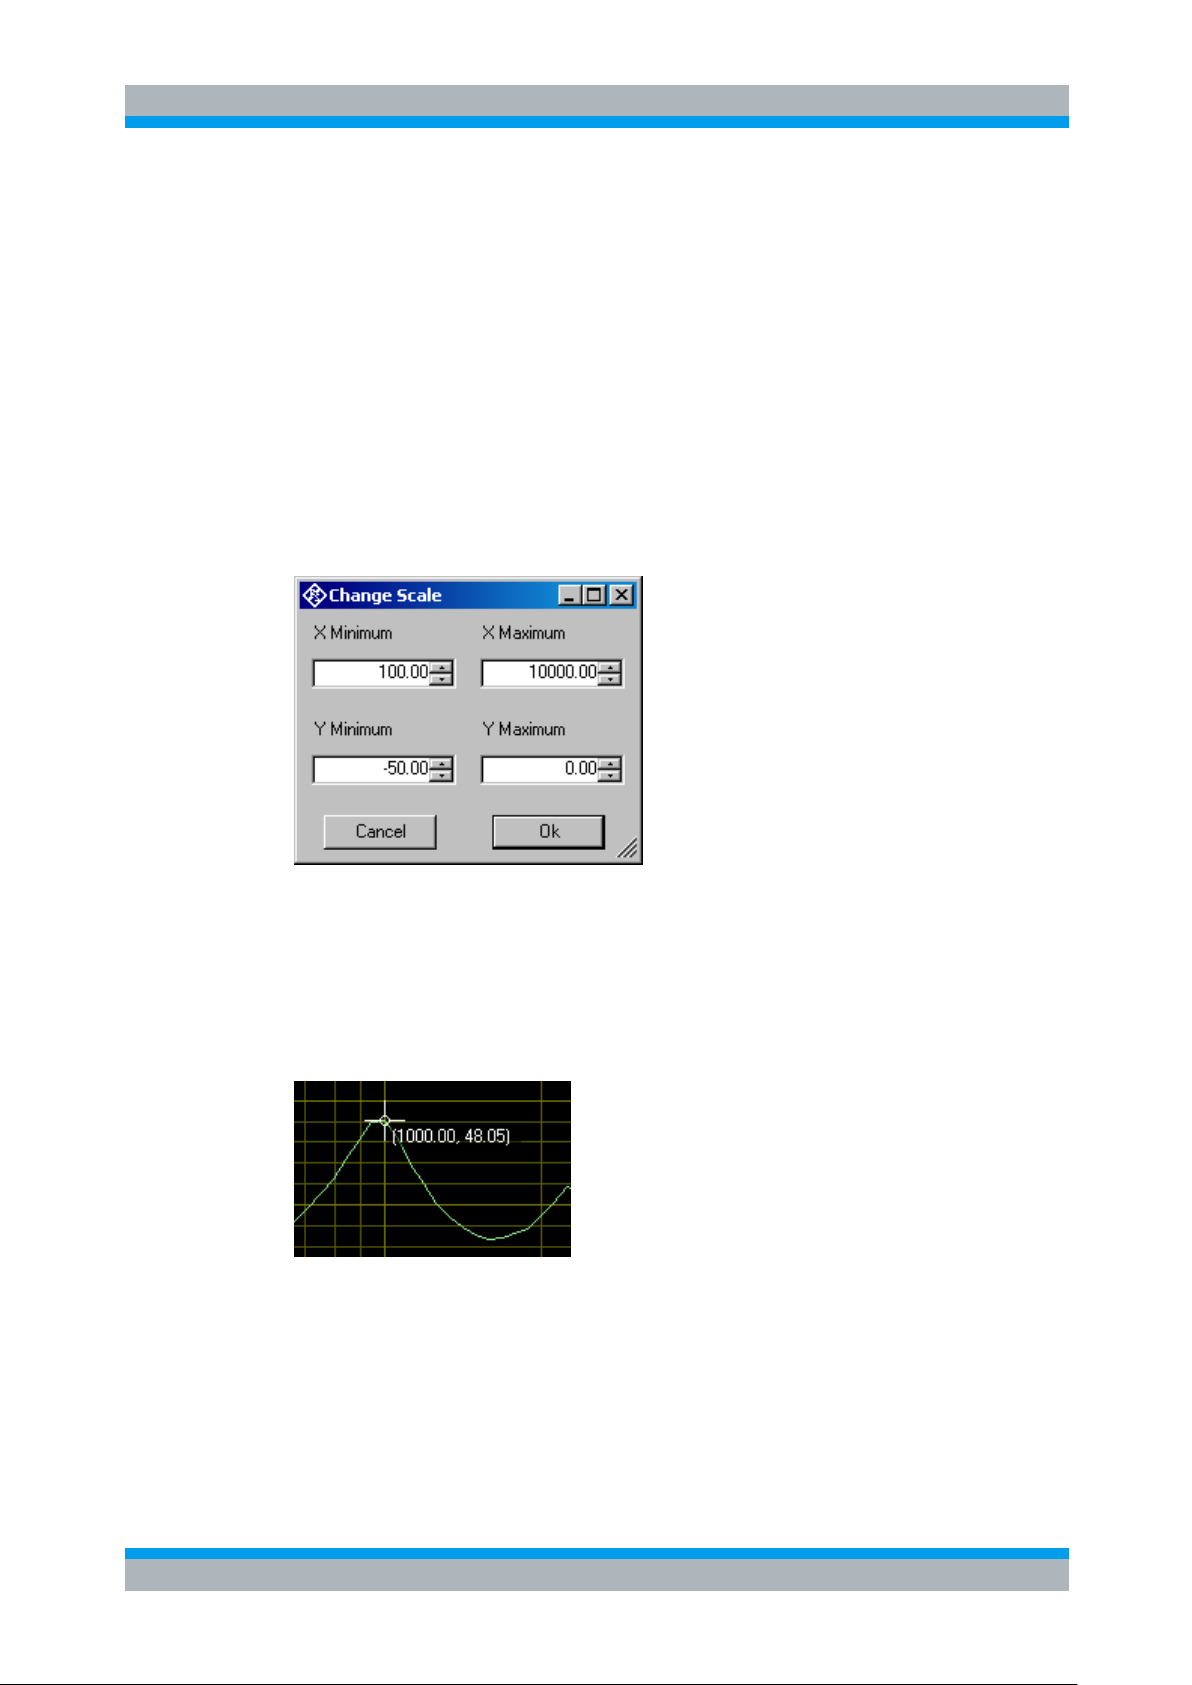
6.1.2 Changing the Scale of the Graph
“Change Scale” in the context menu opens a window in which the upper and lower
bounds of both axes can be entered by numbers.
Figure 6-3 Window for changing the scale of the graph
6.1.3 Cursor
When the item “Show Cursor” is marked in the graph context menu, a cursor is
displayed which can be dragged along the graph with the mouse. X and Y values of
the data points below the cursor are displayed.
Figure 6-4 Cursor with data display
Page 29
R&S UPV-K7 Measurements
Functionality and Control of the Measurement Macros
Operating Manual 1401.9353.12 - 04 29
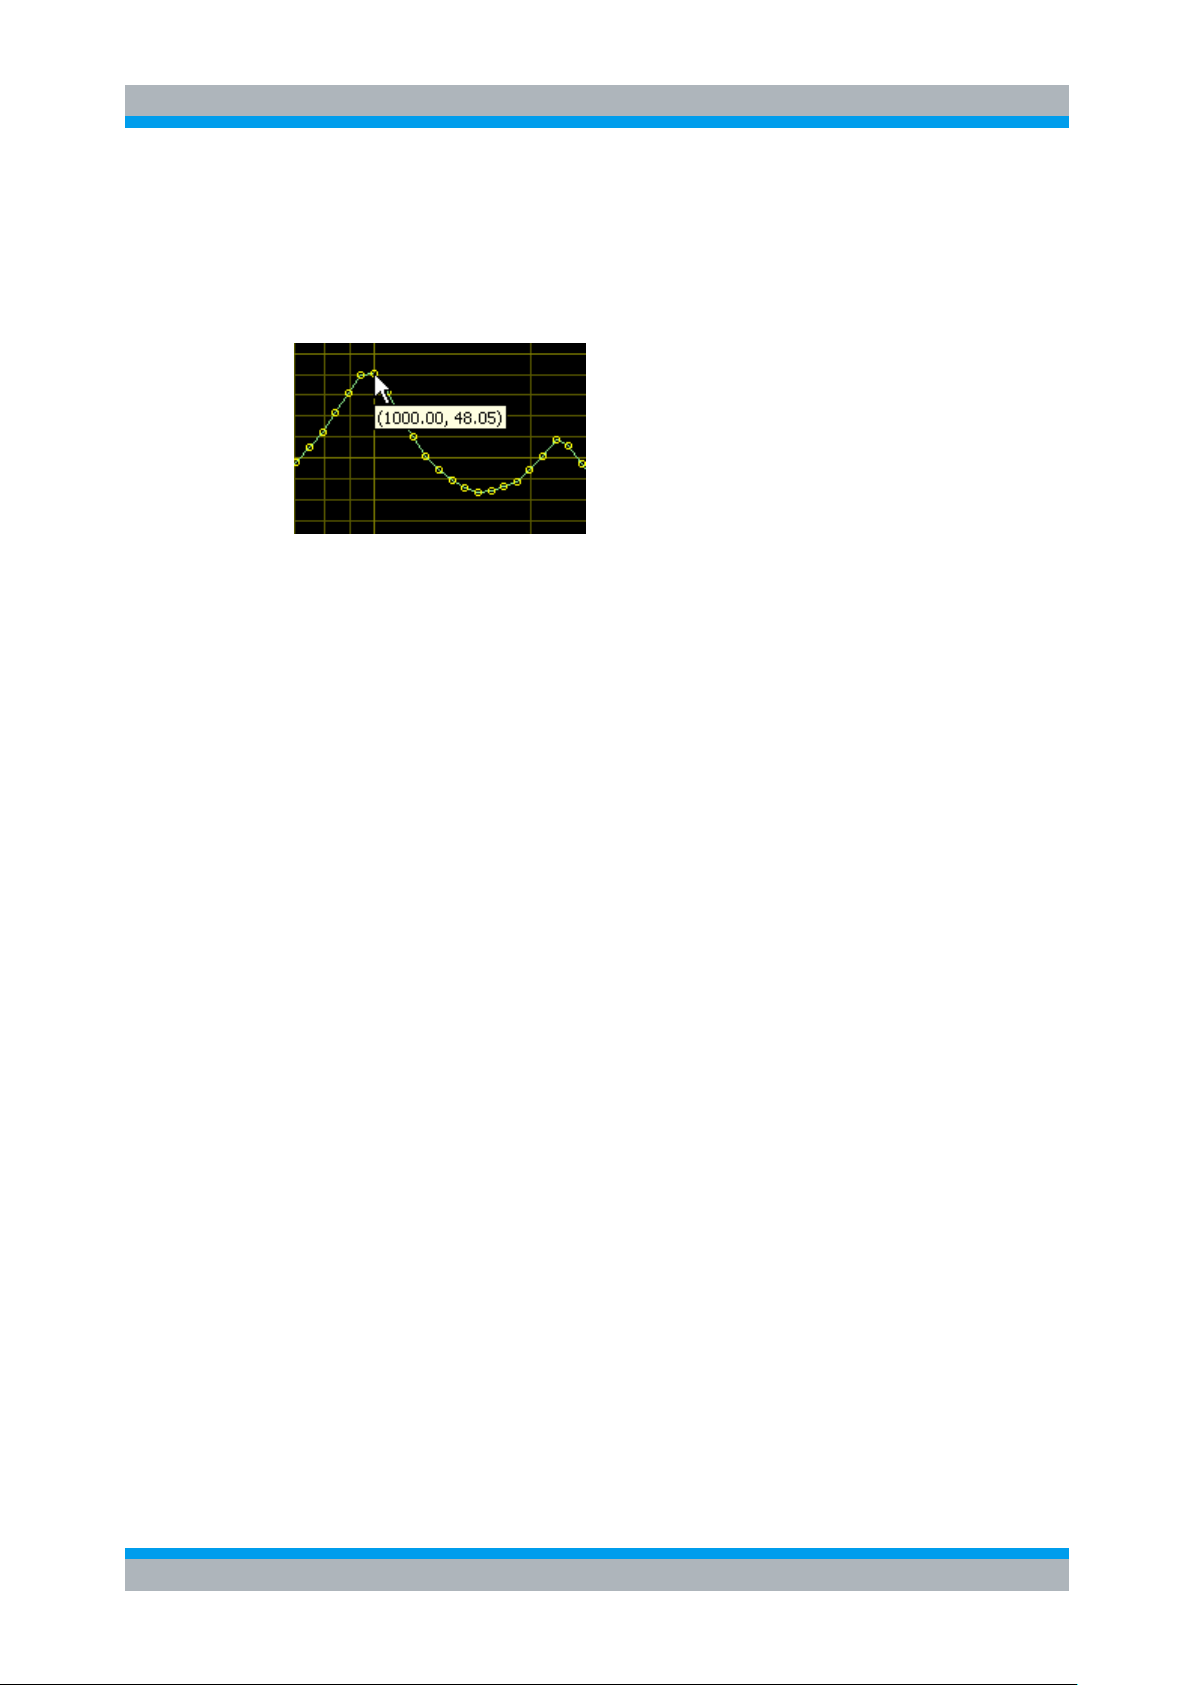
6.1.4 Data Point Size
“Data Point Size” in the graph context menu opens a window in which the size of
marks at the measured data points can be specified. Moving the mouse cursor over
one of the marks causes the associated X and Y values to be displayed.
Figure 6-5 Data points with data display
6.1.5 Performing Additional Measurements
The softkey “Add Measurement” triggers another measurement according to the
specification of the test. Loudness ratings and noise values are calculated and
displayed in the legend. However, limits are not checked. This function can e.g. be
used to compare different settings in a device under test.
If the item “Store results of further measurements” is activated in the “Options” menu,
graphs and result values obtained with this functionality are added to the results
database and will appear later in reports on this measurement. All curves obtained
within the same measurement will appear in the report in the same graph.
6.1.6 Storing and Loading Curves
All measured curves in the graph can be stored to an ASCII file, and stored curves can
be loaded back into the graph. The softkey “Store Curve” opens a window in which a
combo box offers choice between the legends of all measured curves in the graph. The
curve associated in which the selected entry is stored to the file at the specified
location.
6.1.7 Storing Curves as Limit Curves
With “Store As Limit Curve” a curve can be selected and stored into a R&S UPV format
limit file with a specified shift in Y axis direction. This functionality can be used to
generate limit curves from “golden” devices for evaluation purpose. Regarding the use
of such limit curves see section 6.2 Customizing Measurements below.
6.1.8 Entering a Comment
With the softkey “Enter Comment” or the item “Comment” in the graph context menu, a
comment can be entered and edited which will appear in the report about the
respective measurement.
Page 30

R&S UPV-K7 Measurements
Functionality and Control of the Measurement Macros
Operating Manual 1401.9353.12 - 04 30
6.1.9 Creating a Report
The softkey “Create Report” causes a report to be prepared. The report preview
window (see below) opens and shows the preview of the report. Buttons in the preview
window allow to print the report or to export it to PDF, WORD, EXCEL or Rich Text
format. For details see section 8.10 Preview Window below.
6.1.10 Generating a Landscape Report
Landscape reports are only available for frequency response graphs. They show the
result graph together with the measurement title and information about the tested
hearing aid and about the operator. The layout and scale is fixed and cannot be
configured.
A landscape report can be generated from the measurement window by right-clicking
into the result graph of a frequency response measurement and selecting “Create
Landscape Report” from the context menu.
6.1.11 Closing the Measurement Window
The softkey “Close” closes the measurement window. The control is returned to the
R&S UPV-K7 main window. All relevant data associated with the measurement is
imported to the results database. A new entry appears for the measurement as new
row on the bottom of the overview data grid in the main window.
Page 31

R&S UPV-K7 Measurements
Operating Manual 1401.9353.12 - 04 31
6.2 Customizing Measurements
The first item in the “Measurement” menu which is called “Settings” opens a sub-menu
with all available measurements in it. Clicking on a measurement in this sub-menu
opens a window which allows to change parameters of the selected measurement.
Customizing Measurements
Figure 6-6 Measurement setup window
The “Title” appears in the measurement menu and forms the heading of the report.
The “Description” can be chosen to be included into the report.
“Date” shows the date of the last change to this measurement definition.
“Operator instruction” is the text displayed before the start of each measurement,
provided that the item “Show operator instructions” is activated in the “Options” menu.
The entry in the field “Program File” designates the measurement type and must not be
changed.
The field “Setup Files” specifies the R&S UPV setups used by the measurement. The
specified file can be replaced by a user defined file but the number of setups is defined
by the measurement type. The customized setup file must be stored in folder
D:\Hearing. It is recommended to generate customized setups by copying existing
ones. Note that changes in the setup like changing the analysis function or generator
signal may cause malfunction of the measurement. Some parameters of the setup
might be overwritten by the macro during the measurement run.
The field “Template files” specifies limit template curves for the response curve. The
buttons “Add” or “Edit” produce the following input window:
Page 32

R&S UPV-K7 Measurements
Customizing Measurements
Operating Manual 1401.9353.12 - 04 32
Figure 6-7 Input window for limit template curve
The radio buttons allow to determine whether the given curve should be used as upper
limit, lower limit or for information only (no limit check). The field “File name” must
contain the path name of the file. To generate a new limit curve file, use the softkey
“Save as limit curve” of the respective measurement window or copy and edit an
existing limit file using a text editor.
All other available parameters of a measurement definition are shown in the
“Parameters” data grid. The rightmost column with the headline “Fixed” displays
whether the respective parameter can be changed by the operator or not. In “generic”
measurements all parameters may be changed. In measurements which follow
standards, only parameters which are not determined by the standard may be changed
by the operator. The “Edit” button opens an input window for the parameter in the line
specified in “Number”:
Figure 6-8 Input window for parameter value
Alternatively this input window can be opened by double-clicking on the row header of
the parameter to be edited.
“Name” appears in the report and explains the meaning of the parameter. “Type” is
determined by the measurement routine and cannot be changed. In the field “Value” a
value must be entered which conforms with the syntax rules of the selected data type.
The syntax is checked automatically when the text box is left. However there is no
check for the allowable range of the value. Entering inadequate values (e.g. too high
levels, negative frequencies) may cause malfunction of the measurement.
Page 33

R&S UPV-K7 Measurements
Operating Manual 1401.9353.12 - 04 33
Tables in section 6.3 list the available parameters for each measurement routine.
Some of the parameters are optional. They are marked with “Optional_i:” in the
explanation column, wherein i stands for a consecutive numbering. The following rules
apply for optional parameters:
● For each value of i, all or none of the parameters marked with “Optional_i” must
be present
● If optional parameters marked with “Optional_j” are present, all optional
parameters marked with “Optional_i” for values i < j must also be present.
6.3 Notes on Individual Measurements
6.3.1 Frequency Response Measurement
Notes on Individual Measurements
Figure 6-9 Display window of frequency response measurement
The softkey “Display Level” or “Display Gain”, respectively, allows to toggle between
gain and level in the Y axis of the graph. The button “Calculate HFA” allows to
calculate a high frequency average or special frequency average from one of the
displayed curves:
Page 34

R&S UPV-K7 Measurements
Notes on Individual Measurements
Operating Manual 1401.9353.12 - 04 34
Name
Type
Value
Explanation
battery voltage (V)
Double
0
Supply voltage provided at ANLG AUX OUT.
Overrides the general setting. “0 V “ means
“use voltage from general setting”.
lower frequency limit (Hz)
Double
200
Start frequency of sweep
upper frequency limit (Hz)
Double
5000
Stop frequency of sweep
number of frequencies
Integer
57
Number of sweep points
display result as gain
Boolean
True
„True“: Gain on Y axis, „False“: SPL on Y
axis
selective measurement
Boolean
false
„True“: Selective measurement with fast 3rd
octave filter
number of sweeps
Parameter count
1
Number of sweeps with level as parameter
sweep 1 level (dB)
Double
60
Sweep level for each sweep (dBSPL or dB re
1 mA/m)
Figure 6-10 Input window for HFA calculation
In the text box on the left side the HFA frequencies are entered in separate lines. In the
combo box top right, one of the existing curves is chosen. When the button “Calculate”
is clicked, the text box below shows the associated HFA value.
The following table lists all available parameters in the generic frequency response
measurement:
Table 6-1 Available parameters for frequency response measurements
Page 35

R&S UPV-K7 Measurements
Notes on Individual Measurements
Operating Manual 1401.9353.12 - 04 35
Name
Type
Value
Explanation
measurement delay (s)
Double
0.02
Pre-delay between sweep Step and
measurement trigger, allows for settling of the
DUT (e.g. AGC)
inductive
Boolean
false
“False”: Acoustic input, “True”: Inductive input
number of HFA frequencies
Parameter count
3
Number of frequencies averaged in the high
frequency average
HFA frequency 1 (Hz)
Double
1000
HFA frequency (Hz)
Double
1600
HFA frequency (Hz)
Double
2500
HFA upper limit (dB)
Double
30
Upper limit for limit check
HFA lower limit (dB)
Double
10
Lower limit for limit check
check limit for sweep no.
Byte 1 “0“ means: “don’t check”
calc. freq. range for swp. no
Byte 1 “0“ means: “don’t calculate”
level difference (dB)
Double
20
Level difference between HFA level and
frequency response limit points
check frequency range limits
Boolean
True
Determines whether the frequency range is
checked against the limits given below
max. lower frequency (Hz)
Double
500
min. upper frequency (Hz)
Double
3500
display curve maximum
Boolean
True
Stipulates whether the absolute curve
maximum should be determined
lower limit of max. (dB)
Double
0 upper limit of max. (dB)
Double
40 check max limits for swp. no
Byte 1 “0“ means: “don’t check”
calculate MASL for sweep
no.
Byte 0 Optional_1. Determines for which sweep the
MASL should be calculated. 0 means “no
calculation”.
check MASL limits
Boolean
False
Optional_1. Determines whether a limit check
should be performed on the MASL.
MASL lower limit (dB)
Double
0
Optional_1.
MASL upper limit (dB)
Double
100
Optional_1.
Page 36

R&S UPV-K7 Measurements
Notes on Individual Measurements
Operating Manual 1401.9353.12 - 04 36
Name
Type
Value
Explanation
electric input
Boolean
False
Optional_2. Set to “True”: The test signal is
fed on the electric input of the hearing aid.
The sweep levels are specified relative
to -54 dBV.
maximum voltage (V)
Double
1
Optional_2. Voltage limit for protection of the
electric input of the hearing aid.
If for example only an upper limit should be checked but not the corresponding lower
one, select the lower limit low enough to be always passed.
The following standard conformal tests are based on the frequency response
measurement routine:
Frequency Response @ 60 dBSPL (IEC-0)
Frequency Response (IEC-0:2015)
Field of Frequency Response Curves (IEC-0)
Frequency Response (ANSI)
Frequency Response (IEC-7)
Frequency Response Induction (ANSI)
Frequency Response Induction (IEC-1)
Frequency Response Induction (IEC-0:2015)
Full-On Frequency Response Induction (IEC-0:2015)
Full-On Gain 50 dB (IEC-0)
Full-On Gain 60 dB (IEC-0)
Full-On Gain (IEC-0:2015)
Full-On Gain (IEC-7)
Response Curve at Maximum Gain (IEC-1)
Full-On Gain (ANSI)
Output SPL at Maximum Gain, Induction (IEC-1)
OSPL90 (ANSI)
OSPL90 (IEC-7)
OSPL 90 (IEC-0)
OSPL 90 (IEC-0:2015)
Page 37

R&S UPV-K7 Measurements
Operating Manual 1401.9353.12 - 04 37
6.3.2 Multi-Curve Measurement
Name
Type
Value
Explanation
battery voltage (V)
Double
0
Supply voltage provided at ANLG AUX OUT.
Overrides the general setting. “0 V “ means
“use voltage from general setting”.
lower frequency limit (Hz)
Double
200
Start frequency of sweep
upper frequency limit (Hz)
Double
5000
Stop frequency of sweep
number of frequencies
Integer
57
Number of sweep points
Notes on Individual Measurements
Figure 6-11 Display window of multi-curve measurement
The multi-curve measurement is found in “Standards Utilities”. It is similar to
frequency response measurements and allows measurement and display of acoustic
and inductive frequency responses in one window. Unlike other measurements, the
multi-curve measurement does not automatically start a sweep when it opens. All
sweeps are started by the user using the “Add Measurement” button, even within
sequences. Therefore this window does not close automatically within a sequence but
has to be closed using the “Done” button.
The following table lists all available parameters available for configuration of the multicurve measurement:
Table 6-2 Available parameters for multi-curve measurement
Page 38

R&S UPV-K7 Measurements
Notes on Individual Measurements
Operating Manual 1401.9353.12 - 04 38
Name
Type
Value
Explanation
display result as gain
Boolean
False
„True“: Gain on Y axis, „False“: SPL on Y
axis
selective measurement
Boolean
True
„True“: Selective measurement with fast 3rd
octave filter
measurement predelay (s)
Double
0.02
Pre-delay between sweep Step and
measurement trigger, allows for settling of the
DUT (e.g. AGC)
number of HFA frequencies
Parameter count
3
Number of frequencies averaged in the high
frequency average
HFA frequency 1 (Hz)
Double
1000
HFA frequency (Hz)
Double
1600
HFA frequency (Hz)
Double
2500
HFA upper limit (dB)
Double
30
Upper limit for limit check
HFA lower limit (dB)
Double
10
Lower limit for limit check
determine maximum gain
Boolean
True
Stipulates whether the absolute curve
maximum should be determined
show operator instruction
Boolean
True
Determines whether the operator should be
prompted to switch the hearing aid between
microphone and telecoil mode
selective acoustic
measurement
Boolean
True
Optional_1: Activates selective measurement
for acoustic input only
selective induction
measurement
Boolean
True
Optional_1: Activates selective measurement
for induction input only
preset parameters
Boolean
False
Optional_2: Determines whether to use the
following two parameters or not
preset induction
Boolean
False
Optional_2: If “True”, each additional
measurement (Button “Add Measurement”
clicked) offers inductive measurement first
preset level (dB)
Double
60
Optional_2: Each additional measurement
(Button “Add Measurement” clicked) offers
the level value specified here first
lock parameters
Boolean
False
Optional_2: The settings of the previous two
parameters are forced. The user cannot
change them in the user interface.
curve text
String
Optional_2: Default for the curve name
offered when button “Add Measurement” is
clicked. This text is complemented with
numbering of the measured curves.
Page 39

R&S UPV-K7 Measurements
Notes on Individual Measurements
Operating Manual 1401.9353.12 - 04 39
When the “Add Measurement” button is clicked, an entry window for the level of the
next sweep opens.
The input to the hearing aid can be switched between acoustic and inductive signal.
For acoustic input the level is set in dBSPL. For inductive input the level can be
entered in mA/m or dB(mA/m). If there are already sweeps present in the graph, the
input window always opens with the settings done for the last sweep. In addition
buttons are provided for increasing or decreasing the level from the previous sweep by
1, 5 or 10 dB.
Figure 6-12 Entry window for sweep level in Multi-curve measurements
Page 40

R&S UPV-K7 Measurements
Notes on Individual Measurements
Operating Manual 1401.9353.12 - 04 40
Name
Type
Value
Explanation
battery voltage (V)
Double
1.5
Supply voltage provided at ANLG AUX OUT.
Overrides the general setting. “0 V “ means
“use voltage from general setting”.
lower frequency limit (Hz)
Double
200
Start frequency of sweep
upper frequency limit (Hz)
Double
8000
Stop frequency of sweep
number of frequencies
Integer
65
Number of sweep points
lowest input level (dB)
Double
60
Start level of sweep (dBSPL or dB re 1
mA/m)
highest input level (dB)
Double
90
Stop level of sweep (dBSPL or dB re 1
mA/m)
number of levels
Integer
31
Number of level steps in sweep
selective measurement
Boolean
false
„True“: Selective measurement with fast 3rd
octave filter
6.3.3 Saturation Sound Pressure Level Measurement
Figure 6-13 Display window of saturation sound pressure level measurement
The saturation sound pressure level measurement performs the specified number of
level sweeps and records the maximum level obtained in each sweep.
The following table lists all available parameters in the generic saturation sound
pressure level measurement:
Table 6-3 Available parameters for saturation SPL measurements
Page 41

R&S UPV-K7 Measurements
Notes on Individual Measurements
Operating Manual 1401.9353.12 - 04 41
Name
Type
Value
Explanation
measurement delay (s)
Double
0.02
Pre-delay between sweep Step and
measurement trigger, allows for settling of the
DUT (e.g. AGC)
inductive
Boolean
false
“False”: Acoustic input, “True”: Inductive input
display curve maximum
Boolean
True
Optional_1: Stipulates whether the absolute
curve maximum should be determined
lower limit of max. (dB)
Double
130
Optional_1
upper limit of max. (dB)
Double
150
Optional_1
check max limits
Boolean
true
Optional_1: Stipulates whether pass / fail
check takes place
The only standard conformal test based on the saturation SPL measurement routine is
Saturation SPL (IEC-0).
6.3.4 Harmonic Distortion Measurement
Figure 6-14 Curve display of harmonic distortion measurement
The softkey “Display dB” or “Display %”, respectively, allows to toggle between both Y
axis units. The softkey “Show Discrete Values” or “Show Curves”, respectively, allows
to toggle between curve display and result data table provided that discrete values or
curves, respectively, have been measured.
Page 42

R&S UPV-K7 Measurements
Notes on Individual Measurements
Operating Manual 1401.9353.12 - 04 42
Name
Type
Value
Explanation
battery voltage (V)
Double
0
Supply voltage provided at ANLG AUX OUT.
Overrides the general setting. “0 V “ means
“use voltage from general setting”.
lower frequency limit (Hz)
Double
200
Start frequency of sweep
upper frequency limit (Hz)
Double
5000
Stop frequency of sweep
number of frequencies
Integer
57
Number of sweep points
display result in dB
Boolean
false
“False”: Y axis and values in %, “True”: Y
axis and values in dB
number of sweeps
Parameter count
3
Number of sweeps with level as parameter
sweep 1 level (dB)
Double
60
(dBSPL or dB re 1 mA/m)
sweep 2 level (dB)
Double
80
(dBSPL or dB re 1 mA/m)
sweep 3 level (dB)
Double
100
(dBSPL or dB re 1 mA/m)
measurement delay (s)
Double
0.01
Pre-delay between sweep Step and
measurement trigger, allows for settling of the
DUT (e.g. AGC)
Figure 6-15 Data table display of harmonic distortion measurement
The following table lists all available parameters in the harmonic distortion
measurement:
Table 6-4 Available parameters for harmonic distortion measurements
Page 43

R&S UPV-K7 Measurements
Notes on Individual Measurements
Operating Manual 1401.9353.12 - 04 43
Name
Type
Value
Explanation
induction
Boolean
false
“False”: Acoustic input, “True”: Inductive input
show thd
Boolean
true
Stipulates whether the thd curve is displayed
show 2nd
Boolean
true
Stipulates whether curve of 2nd harmonic is
displayed
show 3rd
Boolean
true
Stipulates whether curve of 3rd harmonic is
displayed
show 4th
Boolean
false
Etc.
show 5th
Boolean
false show 6th
Boolean
false show 7th
Boolean
false show 8th
Boolean
false show 9th
Boolean
false
check limit for sweep no.
Byte 0 Stipulates whether limit curve is checked. “0”
means no limit check
number of discrete points
Parameter count
3
Number of discrete measured values
point 1 (Hz), (dB), limit %
String
500,
70, 1
Value triples specifying measurements and
upper limits for THD
point 2 (Hz), (dB), limit %
String
800,
70, 0.5
point 3 (Hz), (dB), limit %
String
1600,
65, 0.5
check limits
Boolean
true
Stipulates whether limits are checked in
discrete measurements
number of limits
Parameter count
3
Optional_1: Must be equal to the number of
discrete measured values. Allows to specify
the limits separately from frequency and
level.
THD upper limit 1 (%)
Double
1
Optional_1: upper THD limit for the first
discrete measurement point in %
THD upper limit 2 (%)
Double
0.5
Optional_1: upper THD limit for the second
discrete measurement point in %
THD upper limit 3 (%)
Double
0.5
Optional_1: upper THD limit for the third
discrete measurement point in %
Page 44

R&S UPV-K7 Measurements
Operating Manual 1401.9353.12 - 04 44
The following standard conformal tests are based on the harmonic distortion
measurement routine:
Harmonic Distortion (IEC-0)
Harmonic Distortion (IEC-0:2015)
Harmonic Distortion Induction (IEC-0:2015)
Harmonic Distortion (IEC-7)
Harmonic Distortion (ANSI)
6.3.5 Intermodulation Distortion Measurement
Notes on Individual Measurements
Figure 6-16 Curve display of intermodulation distortion measurement
The softkey “Display dB” or “Display %”, respectively, allows to toggle between both Y
axis units. The softkey “Show Discrete Values” or “Show Curves”, respectively, allows
to toggle between curve display and result data table provided that discrete values or
curves, respectively, have been measured.
Page 45

R&S UPV-K7 Measurements
Notes on Individual Measurements
Operating Manual 1401.9353.12 - 04 45
Name
Type
Value
Explanation
battery voltage (V)
Double
0
Supply voltage provided at ANLG AUX OUT.
Overrides the general setting. “0 V “ means
“use voltage from general setting”.
lower f2 frequency limit (Hz)
Double
350
Start frequency of sweep
upper f2 frequency limit (Hz)
Double
8000
Stop frequency of sweep
difference frequency (Hz)
Double
125
Frequency separation of test tone pair
number of frequencies
Integer
15
Number of sweep points
check with f2 off
Boolean
True
Plausibility check with upper test tone muted
shows noise level in the measurement
off difference (dB)
Double
10
Minimum difference between distortion result
an noise result measured with upper test tone
muted
display result in dB
Boolean
false
“False”: Y axis and values in %, “True”: Y axis
and values in dB
Figure 6-17 Data table display of intermodulation distortion measurement
The following table lists all available parameters in the intermodulation distortion
measurement:
Table 6-5 Available parameters for intermodulation distortion measurements
Page 46

R&S UPV-K7 Measurements
Notes on Individual Measurements
Operating Manual 1401.9353.12 - 04 46
Name
Type
Value
Explanation
number of sweeps
Parameter
count
1
Number of sweeps with level as parameter
sweep 1 f1, f2 level (dB)
Double
61
(dBSPL or dB re 1 mA/m) for each test tone
measurement delay (s)
Double
0.01
Pre-delay between sweep Step and
measurement trigger, allows for settling of the
DUT (e.g. AGC)
induction
Boolean
false
“False”: Acoustic input, “True”: Inductive input
check d2 limit for sweep no.
Byte 0 Stipulates against which of the sweeps the limit
curve is checked. “0” means no limit check
check d3 limit for sweep no.
Byte 0 Stipulates against which of the sweeps the limit
curve is checked. “0” means no limit check
number of discrete points
Parameter
count
3
Number of discrete measured values
point 1 f2 (Hz), Δf (Hz), (dB),
d2 limit (%), d3 limit (%)
String
500, 125,
61, 1, 1
Value quintuples specifying upper frequency,
frequency spacing, level of each tone, upper
limits for 2nd order and 3rd order distortion
products.
point 2 f2 (Hz), Δf (Hz), (dB),
d2 limit (%), d3 limit (%)
String
800, 125,
61, 0.5, 0.5
point 3 f2 (Hz), Δf (Hz), (dB),
d2 limit (%), d3 limit (%)
String
1600, 125,
61, 0.5, 0.5
check limits
Boolean
False
Stipulates whether limits are checked in
discrete measurements
number of limits
Parameter
count
3
Optional_1: Must be equal to the number of
discrete measured values. Allows to specify the
limits separately from frequency and level. If
limits are specified separately, only the first
three values out of each quintuple are
evaluated for each discrete measurement
point.
d2 limit 1 (%), d3 limit 1 (%)
Optional_1: upper distortion limits for the first
discrete measurement point in %
d2 limit 2 (%), d3 limit 2 (%)
Optional_1: upper distortion limits for the
second discrete measurement point in %
d2 limit 3 (%), d3 limit 3 (%)
Optional_1: upper distortion limits for the third
discrete measurement point in %
The following standard conformal tests are based on the intermodulation distortion
measurement routine:
Intermodulation Distortion (IEC-0)
Intermodulation Distortion (IEC-0:2015)
Page 47

R&S UPV-K7 Measurements
Notes on Individual Measurements
Operating Manual 1401.9353.12 - 04 47
6.3.6 Measurement of Dynamic Behaviour (AGC Settling)
Figure 6-18 Measurement window for dynamic behaviour
The dynamic behaviour measurement inputs a step-up and step-down burst of a
sinewave signal to the hearing aid. The output sound pressure level of the hearing aid
is plotted over time. The settling time is the time elapsing from the level step until the
level settles within a defined tolerance band around the final output level. The
tolerance bands and the settling periods are indicated in the graph with dotted lines.
The following standard conformal tests are based on the dynamic behaviour
measurement routine:
Dynamic Behaviour (IEC-0:2015)
Dynamic Behaviour at High Level (IEC-2)
Dynamic Behaviour at Speech Level (IEC-2)
Dynamic Behaviour (IEC-7)
Dynamic Behaviour (ANSI)
Page 48

R&S UPV-K7 Measurements
Notes on Individual Measurements
Operating Manual 1401.9353.12 - 04 48
Name
Type
Value
Explanation
battery voltage (V)
Double
0
Supply voltage provided at ANLG AUX OUT.
Overrides the general setting. “0 V “ means
“use voltage from general setting”.
test frequency (Hz)
Double
2000
Frequency of sine burst tone
high level (dB)
Double
80
High level of sine burst (dBSPL or dB re 1
mA/m)
low level (dB)
Double
55
Low level of sine burst (dBSPL or dB re 1
mA/m)
on time (s)
Double
0.25
Duration of high level
interval (s)
Double
1
Period duration of sine burst
selective measurement
Boolean
False
“True”: Signal filtered with one octave width
around test tone frequency
induction
Boolean
false
“False”: Acoustic input, “True”: Inductive input
store diagram
Boolean
true
“False”: Only values are stored in the
database (saves disk space), “True”
compressed curve is stored in the database
display dB
Boolean
true
“False”: Sound pressure on Y axis, “True”:
SPL on Y axis
attack tolerance (dB)
Double
2
Settling time is determined as the time after
which the curve approaches the steady value
closer than this difference
attack time lower limit (ms)
Double
20
Lower limit of high settling time for limit check
attack time upper limit (ms)
Double
150
Upper limit of high settling time for limit check
release tolerance (dB)
Double
2
Settling time is determined as the time after
which the curve approaches the steady value
closer than this difference
release time lower limit (ms)
Double
50
Lower limit of low settling time for limit check
release time upper limit (ms)
Double
300
Upper limit of low settling time for limit check
check limits
Boolean
true
Stipulates whether limits of settling times are
checked
burst-on delay (ms)
Double
5
Optional_1: Time delay between the start of
the acquisition and the start of the high level
burst
The following table lists all available parameters in the generic dynamic behaviour
measurement:
Table 6-6 Available parameters for dynamic behaviour measurements
Page 49

R&S UPV-K7 Measurements
Notes on Individual Measurements
Operating Manual 1401.9353.12 - 04 49
6.3.7 Measurement of Input-Output Characteristics
Figure 6-19 Measurement window for input-output characteristics
The softkey “Display Gain” or “Display Level”, respectively, toggles the Y axis data
between gain and sound pressure level. With the softkey “Calculate Comp. Ratio” a
compression ratio may be calculated for any of the measured curves.
Figure 6-20 Window for calculation of compression ratio
With “Lower Level” and “Upper Level” the input levels for the compression ratio
calculation are determined. The combo box top right selects one of the measured
curves. When the button “Calculate” is clicked, the compression ratio is calculated and
displayed in the text box below.
Page 50

R&S UPV-K7 Measurements
Notes on Individual Measurements
Operating Manual 1401.9353.12 - 04 50
Name
Type
Value
Explanation
battery voltage (V)
Double
0
Supply voltage provided at ANLG AUX OUT.
Overrides the general setting. “0 V “ means
“use voltage from general setting”.
lowest input level (dB)
Double
40
Start level of sweep (dBSPL or dB re 1
mA/m)
highest input level (dB)
Double
90
Stop level of sweep (dBSPL or dB re 1
mA/m)
number of level steps
Integer
50
Number of level steps in sweep
display result as gain
Boolean
false
“False”: Level on the Y axis, “True”: Gain on
the Y axis
selective measurement
Boolean
False
“True”: selective measurement with fast 3rd
octave filter
number of sweeps
Parameter count
3
Number of sweeps with frequency as
parameter
sweep 1 frequency (Hz)
Double
500 sweep 2 frequency (Hz)
Double
1000
sweep 3 frequency (Hz)
Double
2000
measurement delay (s)
Double
0.05
Pre-delay between sweep Step and
measurement trigger, allows for settling of the
DUT (e.g. AGC)
induction
Boolean
false
“False”: Acoustic input, “True”: Inductive input
calculate values
Boolean
true
“True”: AGC threshold and compression ratio
are determined for each curve
AGC threshold upper limit
(dB)
Double
80
Upper limit for limit check of AGC threshold
AGC threshold lower limit
(dB)
Double
60
Lower limit for limit check of AGC threshold
compression input level 1
(dB)
Double
80
Lower input level for compression ratio
calculation (dBSPL or dB re 1 mA/m)
compression input level 2
(dB)
Double
85
Higher input level for compression ratio
calculation (dBSPL or dB re 1 mA/m)
compression ratio upper limit
Double
8
Upper limit for limit check of compression
ratio
The following table lists all available parameters in the generic input-output
measurement:
Table 6-7 Available parameters for input-output measurements
Page 51

R&S UPV-K7 Measurements
Operating Manual 1401.9353.12 - 04 51
Name
Type
Value
Explanation
compression ratio lower limit
Double
4
Lower limit for limit check of compression
ratio
check limit for curve no.
Byte 2 “0” means “don’t check”
The following standard conformal tests are based on the measurement routine for
input-output characteristics:
Input-Output characteristics (IEC-0:2015)
Input-Output characteristics (IEC-2)
Input-Output characteristics (IEC-7)
Input-Output characteristics (ANSI)
6.3.8 Measurement of Equivalent Input Noise
Notes on Individual Measurements
Figure 6-21 Measurement window for equivalent input noise
The test routine for equivalent input noise determines the gain at an average of predefined frequencies. The output noise is measured, and the equivalent input noise is
determined by subtracting the gain from the output noise level. In addition to the
wideband input noise, it is optionally possible to measure the 3rd octave spectrum of
the equivalent input noise.
Page 52

R&S UPV-K7 Measurements
Notes on Individual Measurements
Operating Manual 1401.9353.12 - 04 52
Name
Type
Value
Explanation
battery voltage (V)
Double
0
Supply voltage provided at ANLG AUX OUT.
Overrides the general setting. “0 V “ means
“use voltage from general setting”.
lower cutoff freq. (Hz)
Double
175
Lower band limit for wideband noise
measurement
upper cutoff frequency (Hz)
Double
5650
Upper band limit for wideband noise
measurement
gain test input level (dB)
Double
60
Level for measurement of gain (dBSPL or dB
re 1 mA/m)
integration time (s)
Double
1
Integration time for noise measurement
predelay (s)
Double
0
Pre-delay between sweep Step and
measurement trigger, allows for settling of the
DUT (e.g. AGC)
induction
Boolean
False
“False”: Acoustic input, “True”: Inductive input
number of HFA frequencies
Parameter count
1
Number of frequencies averaged for gain
measurement
HFA frequency 1 (Hz)
Double
1600
check closed input
Boolean
True
“True”: Repeat noise measurement with
sealed input and check level difference
max level difference (dB)
Double
1
Maximum acceptable noise level difference
between input open and input sealed
check off
Boolean
True
“True”: Repeat noise measurement with
hearing aid switched off
min. level difference (dB)
Double
10
Minimum acceptable noise difference
between hearing aid switched of and hearing
aid switched on with input open
maximum noise level
(dBSPL)
Double
40
Maximum noise level for pass/fail check
Additional measurements can be performed with sealed input and with hearing aid
switched off. The equivalent input noise with sealed input should not differ significantly
from that measured with open input because otherwise the noise must be assumed to
be picked up from the acoustic environment. The noise measured with hearing aid
switched off should be significantly lower than the measured equivalent input noise,
because otherwise the noise must be assumed to be at least partly generated by the
coupler microphone.
The following table lists all available parameters in the generic measurement of
equivalent input noise:
Table 6-8 Available parameters for equivalent input noise measurements
Page 53

R&S UPV-K7 Measurements
Notes on Individual Measurements
Operating Manual 1401.9353.12 - 04 53
Name
Type
Value
Explanation
check limits
Boolean
True
Stipulates whether limit should be checked
display spectrum
Boolean
True
Optional_1: “True”: Noise spectrum is
measured with a sweep of a fast 3rd octave
filter
lower frequency (Hz)
Double
200
Optional_1: Lowest 3rd octave center
frequency
upper frequency (Hz)
Double
5000
Optional_1: Highest 3rd octave center
frequency
number of frequencies
Double
15
Optional_1: Number of 3rd octaves
measured, must match the number of 3rd
octaves including the lowest and highest one
show curve as spectrum
display
Boolean
True
Optional_2: The graph is displayed as
spectrum curve
use 1/n-octave measurement
Boolean
True
Optional_3: It “True”, the 1/n octave
measurement is used instead of a sweep of
the RMS selective measurement. Requires
option UPV-K6.
aperture (s)
Double
5
Optional_3: Acquisition time in seconds for
1/n octave measurement
check noise at input
Boolean
True
Optional_4: Checks the background noise at
the microphone input, using the reference
microphone. Beware of the inherent noise of
the reference microphone!
min. difference to input noise
(dB)
Double
10
Optional_4: Minimum difference between
equivalent input noise and background noise
at the reference microphone
The following standard conformal tests are based on the measurement routine for
equivalent input noise:
Equivalent Input Noise 1/3 oct. (IEC-0)
Equivalent Input Noise (IEC-0:2015)
Equivalent Input Noise 1/3 oct. (IEC-0:2015)
Equivalent Input Noise (IEC-7)
Equivalent Input Noise (ANSI)
Page 54

R&S UPV-K7 Measurements
Operating Manual 1401.9353.12 - 04 54
6.3.9 Battery Current Measurement
Notes on Individual Measurements
Figure 6-22 Graphic display of battery current measurement
Figure 6-23 Value table display of battery current measurement
The softkey “Show Discrete Values” or “Show Graph”, respectively, toggles between
the graph view and the data table view of the measurement window.
Page 55

R&S UPV-K7 Measurements
Notes on Individual Measurements
Operating Manual 1401.9353.12 - 04 55
Name
Type
Value
Explanation
battery voltage (V)
Double
0
Supply voltage provided at ANLG AUX
OUT. Overrides the general setting. “0 V “
means “use voltage from general setting”.
lowest input level (dB)
Double
40
Start level of sweep (dBSPL or dB re 1
mA/m)
highest input level (dB)
Double
90
Stop level of sweep (dBSPL or dB re 1
mA/m)
number of level steps
Integer
50
Number of level steps in sweep
number of sweeps
Parameter count
3
Number of sweeps with frequency as
parameter
sweep 1 frequency (Hz)
Double
500 sweep 2 frequency (Hz)
Double
1000
sweep 3 frequency (Hz)
Double
2000
measurement delay (s)
Double
0.05
Pre-delay between generator setting and
measurement trigger, allows for settling of
the DUT (e.g. AGC)
induction
Boolean
false
“False”: Acoustic input, “True”: Inductive
input
check limits for curve no
Byte 2 “0” means “don’t check”
number of discrete points
Parameter count
3
Number of discrete measured values
point 1 (Hz), (dB), lower
limit, upper limit
String
1000, 0,
0.05, 2.5
Value quadruples specifying measurement
frequency and level, lower and upper limits
in mA
point 2 (Hz), (dB), lower
limit, upper limit
String
1000, 60,
0.05, 5
point 3 (Hz), (dB), lower
limit, upper limit
String
1000, 90,
0.05, 8
check limits
Boolean
true
Stipulates whether limits are checked in
discrete measurements
average count
Byte 5 Number of averaged DC measurements
The following table lists all available parameters in the generic battery current
measurement:
Table 6-9 Available parameters for battery current measurements
Page 56

R&S UPV-K7 Measurements
Notes on Individual Measurements
Operating Manual 1401.9353.12 - 04 56
Name
Type
Value
Explanation
number of limit pairs
Parameter count
3
Optional_1: Number of pairs of lower and
upper limit for the battery current. Must be
equal to the number of discrete points.
Allows to specify the limits separately from
the measurement points.
low. limit 1 (mA), upp. limit
1 (mA)
String
0.05, 5
Lower and upper limit for the measurement
results of the measurement points specified
above. If limits are specified here, third and
fourth value of the quadruples for the
discrete points are not evaluated.
low. limit 2 (mA), upp. limit
2 (mA)
String
0.05, 5
low. limit 3 (mA), upp. limit
3 (mA)
String
0.05, 8
The following standard conformal tests are based on the battery current measurement
routine:
Battery Current (IEC-0)
Battery Current (IEC-0:2015)
Battery Current (IEC-7)
Battery Current (ANSI)
6.3.10 Speech Test according to IEC 60118-15
This test requires option key UPV-K71. Prerequisite is valid ISTS calibration data.
Purpose of the test is the characterization of fitted hearing aids using a speech-like
signal.
The International Speech Test Signal (ISTS) has been composed from segments
shorter than 500 ms, taken from recordings with 21 female speakers in six different
languages (American English, Arabic, Chinese, French, German and Spanish).
Segments are mounted in sections of 10 or 15 seconds with pauses in between. The
total length of the test signal used in this software is 60 seconds.
The ISTS is equalized and pre-filtered as described in the section 4 Calibration.
Recordings of the signal at the input and output of the hearing aid are analyzed using
the following steps:
● Input and output signal are time-aligned by a cross-correlation delay
measurement
● Both signals are filtered in third-octave bands with centre frequencies from 250 Hz
to 6300 Hz
● The RMS value within each 3rd-octave band is determined in sections of 125 ms
length, overlapping by a factor of 2 such that a level value is obtained every 62.5
ms
Page 57

R&S UPV-K7 Measurements
Notes on Individual Measurements
Operating Manual 1401.9353.12 - 04 57
● A percentile analysis of the input signal is performed on the levels pertaining to
each third octave band (done during calibration).
● Within each third octave band, time sections are identified having a level within ±3
dB of certain percentile values (done during calibration). As a standard, the 30th,
65th and 99th percentile are used. The 99th percentile is defined as the level to
which 99% of the samples are lower and 1 % of the samples are higher in level.
● For each combination of percentile and third-octave band, the percentile gain is
determined by subtracting the input level from the output level of each selected
section, and averaging the level difference in all selected sections of this
percentile/third-octave band combination.
● For “Estimated Insertion Gain”, the open-ear gain given in IEC 60118-8:2005 is
subtracted from the gain result and correction values for the difference between
open-ear sensitivity and 2cc coupler results are added to the output level values.
Usually multiple graphs result from one test run:
● Gain calculated from the long-term average speech spectra (“LTASS gain”) at
different speech levels
● Gain calculated from selected sections for certain percentiles (“Speech gain”), one
graph for each speech level
● If the delay is determined for each third-octave band separately, the delay can
also be plotted over frequency.
All graphs are contained within a tab control, where the tabs on top allow to switch
between the graphs. The softkeys / buttons on bottom of the window are context
sensitive, as far as applicable.
Figure 6-24 Display of speech test
Page 58

R&S UPV-K7 Measurements
Notes on Individual Measurements
Operating Manual 1401.9353.12 - 04 58
When using a headset, beware of excessive sound pressure. Take off and / or
disconnect the headset after listening and before starting a new test.
Name
Type
Value
Explanation
battery voltage (V)
Double
0
Supply voltage provided at ANLG AUX
OUT. Overrides the general setting. “0
V “ means “use voltage from general
setting”.
Induction
Boolean
False
Must always be “False”
lowest band
Byte 4 Lowest analyzed 3rd-octave band.
Band 0 corresponds to 100 Hz.
highest band
Byte
18
Highest analyzed 3rd-octave band.
Band 20 corresponds to 10 kHz
test signal (without file
extension)
String
ISTSV1.0_60s_16bit_48kHz
Currently
only this signal
file is
supported.
analysis start time (s)
Double
15
Length of settling time.
analysis length (s)
Double
45
Length of analyzed time interval which
starts after completion of settling time.
microphone location
String
SELECTED
Microphone location effect to be taken
into account:
The “Play Output Signal” button allows to listen to the output signal of the hearing aid.
The speech level can be selected, whereas the speech level which is currently on
display is pre-selected.
Level and output volume can be set in the following window:
Figure 6-25 Volume control for replay of output signal
The following table lists all available parameters in the generic speech test:
Table 6-10 Available parameters for speech tests
Page 59

R&S UPV-K7 Measurements
Notes on Individual Measurements
Operating Manual 1401.9353.12 - 04 59
Name
Type
Value
Explanation
“SELECTED” means MLE selected in
Options. Other values: “NONE”, “BTE”,
“ITE”, “ITC”, “CIC”
number of signal levels
Parameter
count
3
Number of signal levels to be tested
signal level 1 (dBSPL)
Double
55
Average signal level
signal level 2 (dBSPL)
Double
65
Average signal level
signal level 3 (dBSPL)
Double
80
Average signal level
frequency-dependent
delay
Boolean
False
Specifies whether the delay should be
determined frequency-selective
show freq.-dep. delay
Boolean
False
Specifies whether frequency
dependent delay should be plotted in
an extra graph
add OES2CCD for 2cc
coupler
Boolean
False
Specifies whether correction values
should be applied for 2cc coupler
subtract OEG
Boolean
False
Specifies whether open-ear gain
values from IEC 60118-8:2005 Annex B
should be subtracted from the gain
results
show LTASS gain
Boolean
True
Specifies whether the LTASS gains
should be shown in an own diagram
normalize to level
(dBSPL) ...
Double
0
Specifies the LTASS gain curve to
which all curves should be normalized.
“0” means no normalization.
show speech gain
Boolean
True
Specifies whether the percentile gain
curves should be shown in a separate
diagram for each tested speech level.
number of percentiles
Parameter
count
3
Specifies number of percentiles for
which a speech gain is determined
percentage 1 (%)
Single
30
Selected percent value of first
percentile.
percentage 2 (%)
Single
65
Selected percent value of second
percentile.
percentage 3 (%)
Single
99
Selected percent value of third
percentile.
Page 60

R&S UPV-K7 Measurements
Notes on Individual Measurements
Operating Manual 1401.9353.12 - 04 60
Name
Type
Value
Explanation
include LTASS gain
Boolean
True
Specifies whether the LTASS gains
should be shown in the speech gain
diagrams
normalize to LTASS
gain
Boolean
False
Specifies whether the percentile gains
at each level should be normalized to
the LTASS gain at the respective level
The following standard conformal tests are based on the speech test routine (EIG =
Estimated Insertion Gain, CG = Couple Gain):
IEC 60118-15 EIG @ 55, 65, 80 dBSPL, Abs.
IEC 60118-15 EIG @ 55, 65, 80 dBSPL, Rel.
IEC 60118-15 EIG @ 65, 80 dBSPL, Abs.
IEC 60118-15 EIG @ 65, 80 dBSPL, Rel.
IEC 60118-15 EIG @ 55 dBSPL, Abs.
IEC 60118-15 EIG @ 55 dBSPL, Rel.
IEC 60118-15 EIG @ 65 dBSPL, Abs.
IEC 60118-15 EIG @ 65 dBSPL, Rel.
IEC 60118-15 EIG @ 80 dBSPL, Abs.
IEC 60118-15 EIG @ 80 dBSPL, Rel.
IEC 60118-15 CG @ 55, 65, 80 dBSPL, Abs.
IEC 60118-15 CG @ 55, 65, 80 dBSPL, Rel.
IEC 60118-15 CG @ 65, 80 dBSPL, Abs.
IEC 60118-15 CG @ 65, 80 dBSPL, Rel.
IEC 60118-15 CG @ 55 dBSPL, Abs.
IEC 60118-15 CG @ 55 dBSPL, Rel.
IEC 60118-15 CG @ 65 dBSPL, Abs.
IEC 60118-15 CG @ 65 dBSPL, Rel.
IEC 60118-15 CG @ 80 dBSPL, Abs.
IEC 60118-15 CG @ 80 dBSPL, Rel.
Page 61

R&S UPV-K7 Measurements
Notes on Individual Measurements
Operating Manual 1401.9353.12 - 04 61
Furthermore the test software provides non-standard short tests with a settling time of
5 seconds and an analysis time of 15 seconds:
Short EIG @ 55, 65, 80 dBSPL, Abs.
Short EIG @ 55, 65, 80 dBSPL, Rel.
Short EIG @ 65, 80 dBSPL, Abs.
Short EIG @ 65, 80 dBSPL, Rel.
Short EIG @ 55 dBSPL, Abs.
Short EIG @ 55 dBSPL, Rel.
Short EIG @ 65 dBSPL, Abs.
Short EIG @ 65 dBSPL, Rel.
Short EIG @ 80 dBSPL, Abs.
Short EIG @ 80 dBSPL, Rel.
Short CG @ 55, 65, 80 dBSPL, Abs.
Short CG @ 55, 65, 80 dBSPL, Rel.
Short CG @ 65, 80 dBSPL, Abs.
Short CG @ 65, 80 dBSPL, Rel.
Short CG @ 55 dBSPL, Abs.
Short CG @ 55 dBSPL, Rel.
Short CG @ 65 dBSPL, Abs.
Short CG @ 65 dBSPL, Rel.
Short CG @ 80 dBSPL, Abs.
Short CG @ 80 dBSPL, Rel.
The short tests are meant to speed up alignment procedures and quick tests, whereas
precise testing according to the standard requires the full analysis time of 45 seconds
after a settling time of 15 seconds.
Page 62

R&S UPV-K7 Measurements
Operating Manual 1401.9353.12 - 04 62
6.3.11 Routine for Reference Test Gain Setting
Figure 6-26 Initial display of the routine for reference test gain setting
Notes on Individual Measurements
At start of the macro, the full-on gain or output SPL is measured and averaged at the
specified HFA frequencies. From this value a target level is calculated.
The gain of the hearing aid at the specified frequencies is repeatedly measured until
the “STOP” button is clicked. The thermometer shows the deviation from the target
value. If the deviation becomes smaller than 3 dB, the scale is enlarged. The colour of
the thermometer is red as long as the deviation is higher than the allowed tolerance
and turns green as soon as the deviation is within tolerance.
Figure 6-27 Display of the routine for reference test gain setting, adjusted
Page 63

R&S UPV-K7 Measurements
Notes on Individual Measurements
Operating Manual 1401.9353.12 - 04 63
Name
Type
Value
Explanation
battery voltage (V)
Double
0
Supply voltage provided at ANLG AUX OUT.
Overrides the general setting. “0 V “ means
“use voltage from general setting”.
selective measurement
Boolean
false
“True”: selective measurement with fast 3rd
octave filter
OSPL as gain
Boolean
false
Stipulates whether the full-on value is
measured as gain or as level
OSPL (dB)
Double
90
Input level for the full-on measurement
RTS as gain
Boolean
true
Stipulates whether the value during
adjustment is measured as gain or as level
RTS level (dB)
Double
60
Input level during adjustment (dBSPL or dB
re 1 mA/m)
measurement delay (s)
Double
0
Pre-delay between generator setting and
measurement trigger, allows for settling of the
DUT (e.g. AGC)
induction
Boolean
false
“False”: Acoustic RTS input, “True”: Inductive
RTS input,
OSPL measurement is always acoustic
number of HFA frequencies
Parameter count
3
Number of frequencies averaged for gain
measurement
HFA frequency 1 (Hz)
Double
1000
HFA frequency 2 (Hz)
Double
1600
HFA frequency 3 (Hz)
Double
2500
level difference (dB)
Double
-77
Difference between target value and full-on
value
upper tolerance (dB)
Double
1.5
Maximum allowed difference between value
during adjustment and target value
In remote control this routine writes the deviation of the current adjustment value from
the target together with tolerances and verdict continuously to string buffer 21 and
waits for an input. Write “continue” to string buffer 20 in order to start one more
measurement after modifying the gain of the hearing aid under test. Write “done” to
string buffer 19 when the adjustment is finished. The RTS value after adjustment can
then be found in string buffer 21.
A comment to be printed with the report (e.g. setting of the gain control) may be
entered in the “Comment” field.
The following table lists all available parameters for reference test gain setting:
Table 6-11 Available parameters for the reference test gain setting
Page 64

R&S UPV-K7 Measurements
Notes on Individual Measurements
Operating Manual 1401.9353.12 - 04 64
Name
Type
Value
Explanation
lower tolerance (dB)
Double
-1.5
Minimum allowed between value during
adjustment and target value
store RTS OSPL during
sequence
Boolean
False
If “True”, the measured RTS OSPL is stored
for later use during a running sequence, e.g.
for reference test setting induction
use stored RTS OSPL
Boolean
False
If “True” and a stored RTS OSPL exists, this
stored value is used instead of performing a
new OSPL measurement.
The following standard conformal tests are based on the reference test gain setting
routine:
Reference Test Setting (IEC-0)
Reference Test Setting (IEC-0:2015)
Gain Adjustment Induction (IEC-0:2015)
Gain Adjustment Induction (IEC-1)
Reference Test Setting (IEC-7)
Reference Test Setting (ANSI)
6.3.12 Routine for Alignment of the Hearing Aid in the Magnetic Field
Figure 6-28 Display of the routine for magnetic field alignment
Page 65

R&S UPV-K7 Measurements
Notes on Individual Measurements
Operating Manual 1401.9353.12 - 04 65
Name
Type
Value
Explanation
Selective
Boolean
True
“True”: selective measurement with fast 3rd
octave filter
induction
Boolean
True
“False”: Acoustic input,
“True”: Inductive input,
number of HFA frequencies
Parameter count
1
Number of frequencies averaged for gain
measurement
HFA frequency 1 (Hz)
Double
1600
Input level (dB re 1 mA/m)
Double
20
Magnetic field strength for inductive input
SPL for acoustic input
level scale maximum
(dBSPL)
Double
80
Initial upper end of the graphic display
level scale minimum
(dBSPL)
Double
30
Initial lower end of the graphic display
Name
Type
Value
Explanation
battery voltage (V)
Double
0
Supply voltage provided at ANLG AUX OUT.
Overrides the general setting. “0 V “ means
“use voltage from general setting”.
measurement delay (s)
Double
0.02
Pre-delay between sweep Step and
measurement trigger, allows for settling of the
DUT (e.g. AGC)
selective measurement
Boolean
True
„True“: Selective measurement with fast 3rd
octave filter
This routine shows the output SPL of the hearing aid with a defined magnetic field
strength in real time on a graphic thermometer display and on a numeric display. In
addition a “maximum hold” display is provided. The maximum reading can be reset by
clicking the “Max. Reset” button. The range of the graphic displays can be adapted
using the “Change Scale” button.
The “Stop” button stops the continuous measurement and leaved the window open.
The “Done” button stops the continuous measurement and closes the window.
The following table lists all available parameters for magnetic field alignment:
Table 6-12 Available parameters for magnetic field alignment
6.3.13 Electric Input Sensitivity Measurement
This measurement determines the electric input sensitivity by comparison with the
acoustic gain.
Table 6-13 Available parameters for electric input sensitivity measurement
Page 66

R&S UPV-K7 Measurements
Notes on Individual Measurements
Operating Manual 1401.9353.12 - 04 66
Name
Type
Value
Explanation
acoustic reference level
(dBSPL)
Double
70
Input level used to determine the output SPL
with acoustic input
electric target level (dBV)
Double
-54
Initial voltage to the electric input of the
hearing aid for starting the adjustment loop
adjustment tolerance (dB)
Double
0.05
Criterion for ending the adjustment loop. The
adjustment is finished when the deviation is
lower than the specified tolerance.
maximum input voltage (V)
Double
1
Voltage limit for protection of the electric input
of the hearing aid.
number of HFA frequencies
Parameter count
1
Number of frequencies averaged for output
SPL measurement
HFA frequency 1 (Hz)
Double
1600
upper input sensitivity limit
(dBV)
Double
-48
Upper limit for the sensitivity result of the
electric input
lower input sensitivity limit
(dBV)
Double
-60
Lower limit for the sensitivity result of the
electric input
check limits
Boolean
False
Stipulates whether limits are checked in
discrete measurements
lower frequency limit (Hz)
Double
200
Optional_1: Start frequency of optional sweep
upper frequency limit (Hz)
Double
5000
Optional_1: Stop frequency of optional sweep
number of frequencies
Integer
57
Optional_1: Number of sweep points for
optional sweep
number of sweeps
Parameter count
1
Optional_1: Number of sweeps with level as
parameter
sweep 1 level (dB)
Double
0
Optional_1: Sweep level for each sweep (dB
re measured electric input sensitivty)
Display curve maximum
Boolean
False
Optional_2: Stipulates whether the absolute
curve maximum should be determined
The following standard conformal tests are based on the electric input sensitivity
measurement routine:
Electric Input Sensitivity (IEC-0:2015)
Electric Input Sensitivity @ 1600 Hz (IEC-6)
Electric Input Sensitivity @ 2500 Hz (IEC-6)
Page 67

R&S UPV-K7 Measurements
Operating Manual 1401.9353.12 - 04 67
6.3.14 Create Report
Name
Type
Value
Explanation
report type
String
Single Report | Sequence Report |
Landscape Report | One-Page Report
subtype
String
Standard for one-page report:
IEC60118-0 | IEC60118-7 | ANSI S3.22 |
IEC60118-0:2015
prompt for execution
Boolean
True
„True“: the report is created after a user
prompt
preview
Boolean
True
Optional_1: If „True“, a preview of the report
preview opens after the report has been
created. If the “Optional_1” parameters are
missing, the preview always opens and the
report is never stored automatically.
store
Boolean
false
Optional_1: If „True“, the report is stored in
the specified file format with a file name
which is automatically created
file format
string
Optional_1: See Table 6-15
File extension
File format
pdf
Portable document format
no
No format
cr
Crystal Report
rtf
Rich text
ertf
Editable rich text
csv
Character-separated values
docx
Word for Window document
txt
ASCII text
xlsx
Excel workbook
xls
Excel workbook
This item is not a measurement. It is found in the tree view of the sequence window
and can be inserted into sequences for automatic generation of a report. It can also be
called remotely.
Table 6-14 Available parameters for report creation
Notes on Individual Measurements
Table 6-15 Available report file formats
Page 68

R&S UPV-K7 Measurements
Operating Manual 1401.9353.12 - 04 68
File extension
File format
xlsr
Excel record
tab
Tab-separated text
html32
HTML 3.2 document
html40
HTML 4.0 document
xml
XML document
rptr
Read-only Crystal Report
6.3.15 Set Switcher
Name
Type
Value
Explanation
Operation
String
Switcher
Do not change!
Input channel for output A
Byte The channel to be connected to output A.
“0” means "do not change".
Input channel for output B
Byte The channel to be connected to the output B.
“0” means "do not change".
Calibration type code 1
Byte Type code for the first calibration assignment
to be changed. See Table 6-17
Calibration file name 1
string
Relative file name of calibration file
Calibration type code 2
Byte Type code for the first calibration assignment
to be changed. See Table 6-17
Calibration file name 2
string
Relative file name of calibration file
This item is not a measurement. It is found in the tree view of the sequence window
and can be inserted into sequences for changing the switcher settings and selecting
calibration values for connected acoustic equipment.
Typically the switcher should be deactivated in the “Options” menu when this function
is utilized. Otherwise the switcher settings will be overridden by the switcher control of
the measurement functions.
Notes on Individual Measurements
Table 6-16 Available parameters for switcher control
Page 69

R&S UPV-K7 Measurements
Operating Manual 1401.9353.12 - 04 69
Table 6-17 Calibration type codes
Code
Meaning
0
Reference microphone
1
2 cm3 coupler microphone
2
Ear simulator
3
Sound source
4
Induction coil
5
Current sense resistor
6
n. a.
7
Artificial mastoid
8
0.4 cm3 coupler microphone
Name
Type
Value
Explanation
Operation
String
Run
Executable
Do not change!
absolute path name
Boolean
False
“False”: The file is located in “D:\Hearing”.
Only the file name itself is specified.
“True”: The file name contains the complete
path information.
program file name
String
The file name or path name of the
executable
6.3.16 Start Executable
Notes on Individual Measurements
This item is not a measurement. It is found in the tree view of the sequence window
and can be inserted into sequences for starting a measurement, e.g. in order to
change settings of a hearing aid under test.
The executable is called with the specified command line parameters. The sequence
waits for the executable to terminate. If a result file is specified, the contents of the
result file are adopted for the UPV-K7 result database.
Table 6-18 Available parameters for report creation
Page 70

R&S UPV-K7 Measurements
Notes on Individual Measurements
Operating Manual 1401.9353.12 - 04 70
Name
Type
Value
Explanation
Results file name
String
Name of the file containing the results of the
call of the executable, to be integrated with
the UPV-K7 results. The file name is relative
and the file must be found in folder
“D:\Hearing”.
If the file name ends with “.txt”, the contents
of the file are appended as comment in the
result of the call of the executable. If the file
name ends with “.xml”, the contents
consolidated with the UPV-K7 database.
The data set structure must comply with the
structure of the UPV-K7 database.
number of command line
parameters
Parameter
count
1
Number of command line parameters
specified for the call of the executable.
Command line parameter 1
String
Parameter to be added to the command line
calling the executable.
Page 71

R&S UPV-K7 Automatic Test Sequences
Operating Manual 1401.9353.12 - 04 71
7 Automatic Test Sequences
Figure 7-1 Sequence menu
7.1 Creating and Editing a Sequence
The menu item “Sequence New” first produces a window where a name for the new
sequence has to be entered. Subsequently the sequence window opens.
Creating and Editing a Sequence
Figure 7-2 Sequence window
Initially the right checked list box is empty. The list box on the left side displays all
available measurement definitions, sorted by standards like in the “Standards” menu. A
measurement is appended to the sequence by highlighting it in the tree view box on
the left side and clicking the “Append” button. Subsequently a measurement, which is
highlighted in the checked list box on the right side, can be moved within the sequence
using the buttons “Move up” and “Move down” and deleted from the sequence with the
“Delete X” button. It is possible to edit parameters which are not defined by the
standard before appending the measurement to the sequence. This is done by clicking
the button “Edit and append”. It is for example possible to assemble a test sequence
which repeats a certain test with different battery voltages.
Page 72

R&S UPV-K7 Automatic Test Sequences
Operating Manual 1401.9353.12 - 04 72
7.2 Opening an Existing Sequence
The menu item “Sequence Open …” opens a file selector for specifying the
sequence to be loaded. The sequence window opens with the specified sequence
loaded. The sequence can then be edited and/or run.
7.3 Using a Sample Sequence
Sample sequences are provided in the folder “C:\Program Files\Rohde&Schwarz\UPVK7 Hearing Aid Tests”. Before being edited or run, the files should be copied to the
current “D:Hearing” directory. This can be done with menu item “Sequence Insert
sample sequence.
Sample sequences are provided for measurements according to IEC 60118-0,-1,-2,
according to IEC 60118-0:2015, according to IEC 60118-7 and according to ANSI
S3.22. They can be used for collecting the data for the one-page reports.
7.4 Running a Sequence
Opening an Existing Sequence
When the softkey “Start sequence” is pressed, all checked measurements in the right
list box are executed in sequence. The state of the checkboxes may be altered by
marking a measurement and then clicking on the checkbox. Each measurement
window may be kept open for a time period defined in “Options Delay before closing
a measurement in a sequence …”. This value can also modified on the bottom right
corner of the sequence window. In addition, a screenshot of each terminated
measurement is copied to a new tab in the sequence results overview:
Figure 7-3 Sequence results window
Page 73

R&S UPV-K7 Automatic Test Sequences
Running a Single Measurement within a Sequence
Operating Manual 1401.9353.12 - 04 73
The view can be toggled between results and sequence by using the “Hide Results” /
“Show Results” button, respectively. Each tab indicates the verdict (“Pass” or “Fail”) of
the respective result. If the mouse is hovered into the visible screenshot, the tooltip
displays the measurement title. Alternatively the tabs can also be configured in the
context menu to show the titles of the measurements.
7.5 Running a Single Measurement within a Sequence
When the softkey “Run highlighted” is pressed, the measurement currently selected in
the right checked list box is executed regardless of its checked state. Results are
added to the result database, however the measurement started this way will not
appear in the sequence report. This allows to use sequences as customized sets of
measurements which can be stored and opened later again.
7.6 Reporting on Sequence Results
A report on all executed measurements of the last run sequence is prepared and
displayed after the “Report Sequence” softkey has been pressed. After the sequence
window has been closed, a report on the last sequence can be obtained by pressing
the “Report last sequence” softkey in the main window.
Page 74

R&S UPV-K7 Reporting, Storing, Loading and Deleting Results
Result Files
Operating Manual 1401.9353.12 - 04 74
8 Reporting, Storing, Loading and Deleting
Results
8.1 Result Files
Measurement results are stored together with all associated data in XML files.
Separate files can be used for different projects or operators. They can be archived
together with other project data and re-opened later for generating reports.
It is recommended to keep result files small and to generate backups at frequent
intervals.
Figure 8-1 File menu
A new (empty) result file can be created with “File New Result File” from the main
menu.
An existing result file can be opened with “File Open Result File” from the main
menu.
A currently opened result file can be stored under a new name with “File Save
results as” from the main menu.
8.2 Report Settings
With “Report Settings” or “Options Report settings”, a selection can be made of
data which should appear in the reports. Thus, information which is the same for a
larger number of measurements does not have to be printed with every report again.
Page 75

R&S UPV-K7 Reporting, Storing, Loading and Deleting Results
Operating Manual 1401.9353.12 - 04 75
8.3 Generating a Single Report
A report on a single measurement result can be generated from the window of a
measurement macro by clicking or pressing the softkey “Generate report”.
From the result overview of the main window, a report on a single measurement can
be generated by marking the row with the selected result by clicking on the row header
to the left, right-clicking into the data grid and selecting “Generate report” from the
context menu.
Figure 8-2 Results context menu
Subsequently data associated with the selected measurement is assembled, a graph
for existing curve data is generated, and the preview window is opened. Depending on
the amount of measurement data, this may take a few seconds.
Generating a Single Report
8.4 Generating a Sequence Report
A report on a sequence of measurements can be generated from the sequence
window by clicking or pressing the softkey “Report sequence”.
Once the sequence window has been closed, a report on the last executed sequence
can be generated by selecting “Report Last sequence” from the main menu.
Reports about previous sequences can be generated as single reports on the
measurements of this sequence, as all results appear in the overview data grid in the
main window.
Page 76

R&S UPV-K7 Reporting, Storing, Loading and Deleting Results
Operating Manual 1401.9353.12 - 04 76
8.5 Configuring the Landscape Report
Menu item “Report One-Page Report Settings” opens the following input window:
Configuring the Landscape Report
Figure 8-3 Data entry window for settings of the landscape report
“Style” allows to choose between black-and-white and Color output.
“Curve Identification” specifies how to include the parameter Values for the curves:
in a legend below the graph, in a label inside the graph area or not at all.
“Axis Scaling” can be configured for each combination of x axis unit and y axis unit
separately. “Standard” means automatic scaling to achieve the y axis to x axis ratio
defined in IEC 60118-0. “Define” enables the input fields below.
In the “X Axis” and “Y Axis” fields, the scaling of each axis can be defined for the
specified combination of axis units. “Auto” uses the scaling from the result dataset.
“Define” enables the controls for the maximum and minimum values.
The checkbox “Print Information on Test and Object” enables inclusion of the
measurement title and information about the tested hearing aid and about the operator.
“Add Lines at 1600 Hz and 2500 Hz” enables inclusion of auxiliary vertical lines at
these frequencies, provided that the x axis unit is frequency.
Furthermore, the chart size can be scaled between 0.5 and 1.2. Information text is
included only with scale factors up to 1.0. A scale factor of 1.2 causes the graph to fill
the whole A4 landscape page.
Page 77

R&S UPV-K7 Reporting, Storing, Loading and Deleting Results
Operating Manual 1401.9353.12 - 04 77
8.6 Generating a Landscape Report
A landscape report shows the result graph on an A4 landscape page. A landscape
report can be generated from the measurement window by right-clicking into the result
graph of a frequency response measurement and selecting “Create Landscape Report”
from the context menu. Furthermore a Landscape report can be created from the
results overview data grid in the main window by marking a row in the results overview
by clicking into the row header, right-clicking into the results data grid and selecting
“Create Landscape Report for Marked Row”.
Generating a Landscape Report
Figure 8-4 Sample landscape report
8.7 Selection Report
A report on a selection of measurements can be generated from the results overview
data grid in the main window by marking the rows with the desired results in the
“Select” column and choosing item “Report Selection Report Selected Results” (see
Figure 7-1). Rows marked with “XXXXX” in the “Select” column will be added to the
report. The selection can be toggled by clicking into the respective “Select” cells. Note
that another cell must be clicked before the same cell can be toggled again.
Page 78

R&S UPV-K7 Reporting, Storing, Loading and Deleting Results
Operating Manual 1401.9353.12 - 04 78
8.8 Configuring the One-Page Report
Menu item “Report One-Page Report Settings” opens the following input window:
Configuring the One-Page Report
Figure 8-5 Data entry window for settings of the one-page report
“Style” allows to choose between black-and-white and “Color” output.
“HFA Gain vale at 60 dB, Telecoil” selects whether the output sound pressure level
measured at HFA/ref. frequency with 10 mA/m is displayed in column” Setting Telecoil”
and row “Gain @ 60 dB @ REF, OSPL(1mA/m, ref.)”, or whether a virtual value at 1
mA/m is displayed, calculated from a measured value of 10 mA/m or 31.6 mA/m by
subtracting 20 dB or 30 dB, respectively.
In “Frequency Response at Ref. Gain” it can be chosen whether the second
diagram shows output sound pressure level values or gain values.
In “Curve Identification” it is possible to choose between legends below the
respective graph (advantageous with color plots) and labels inside the graphs
(compatible with printouts from the UPL-B7 application program “HEARPRO”.
The scaling of each graph can be configured in the “Axis Scaling” field. The diagram
is chosen with the numeric entry control, and the textbox besides shows the title of the
chosen graph. Autoscaling optimizes the size of the curves while preserving the aspect
ratio between the axes (10 dB on Y axis equals 10 dB on X axis for input-output curves
and 50 dB on Y axis equals 1 logarithmic frequency decade on the x axis for frequency
response graphs) like specified in IEC 60118-0 section 8 and in IEC 60263.
Checkboxes “Edit Comment”, “Edit Serial”, “Edit Equipment” cause the respective
information to be displayed for editing during generation of the report. If “Memorize
Serial” is checked, the serial number is not taken from the information about the
selected test object but can be entered during generation of the report. To ease entry
of consecutive serial numbers, the last entered number is always memorized and
displayed as suggestion for the next instance of the report.
Page 79

R&S UPV-K7 Reporting, Storing, Loading and Deleting Results
Operating Manual 1401.9353.12 - 04 79
8.9 Generating a One-Page Report
IEC 60118-0,-1,-2
IEC 60118-0:2015
IEC 60118-7
ANSI S3.22
1
OSPL90 (IEC-0)
OSPL90 (IEC-0:2015)
OSPL90 (IEC-7)
OSPL90 (ANSI)
2
Field of Frequency
Response Curves
(IEC-0)
Frequency Response
(IEC-0:2015)
Frequency Response
(IEC-7)
Frequency Response
(ANSI)
3
Frequency Response
Induction (IEC-1) or
Freq. Resp. Induction
@ 10 mA/m (IEC-1) or
Freq. Resp. Induction
@ 31.6 mA/m (IEC-1)
Frequency Response
Induction (IEC-0:2015)
Frequency Response
Induction (IEC-7)
Frequency Response
Induction (ANSI)
4
Response Curve @
Max. Gain Induction
(IEC-1)
Full-On Frequency
Response Induction
(IEC-0:2015)
Output SPL at
Maximum Gain,
Induction (IEC-7)
Output SPL at
Maximum Gain,
Induction (ANSI)
5
Multi-Curve
Multi-Curve
Multi-Curve
Multi-Curve
6
Equivalent Input Noise
(IEC-0)
Equivalent Input Noise
(IEC-0:2015)
Equivalent Input Noise
(IEC-7)
Equivalent Input Noise
(ANSI)
7
Harmonic Distortion
(IEC-0)
Harmonic Distortion
(IEC-0:2015)
Harmonic Distortion
(IEC-7)
Harmonic Distortion
(ANSI)
8
Harmonic Distortion
Induction
Harmonic Distortion
Induction (IEC-0:2015)
Harmonic Distortion
Induction
Harmonic Distortion
Induction
9
Battery Current
(IEC-0)
Battery Current
(IEC-0:2015)
Battery Current
(IEC-7)
Battery Current (ANSI)
10
Dynamic Behaviour at
Speech Level (IEC-2)
Dynamic Behaviour
(IEC-0:2015)
Dynamic Behaviour
(IEC-7)
Dynamic Behaviour
(ANSI)
11
Input-Output
Characteristics (IEC-2)
Input - Output
Characteristics
(IEC-0:2015)
Input-Output
Characteristics (IEC-7)
Input-Output
Characteristics (ANSI)
One-page reports are available for standards IEC 60118-0,-1,-2, IEC 60118-7 and
ANSI S3.22. They can be generated for the test object selected in “Data Test object
Select” or for the test object selected in “Report Select by Object”.
Furthermore a one-page report can be generated from a sequence by inserting a
respective control item at the end of the sequence.
To assemble a one-page report, the report generator looks for the latest results for the
selected test object, with certain test names as listed below. If the one-page report is
generated from a sequence, however, it uses only results obtained during the latest
run of this sequence.
Table 8-1 Measurement titles of the data sources for the one-page report
Generating a One-Page Report
Page 80

R&S UPV-K7 Reporting, Storing, Loading and Deleting Results
Generating a One-Page Report
Operating Manual 1401.9353.12 - 04 80
The following figure illustrates which of the above measurements serves as data
source for the respective areas of the one-page report:
Figure 8-6 Data sources for one-page report (refer to Table 6-12)
Page 81

R&S UPV-K7 Reporting, Storing, Loading and Deleting Results
Operating Manual 1401.9353.12 - 04 81
8.10 Preview Window
Preview Window
Figure 8-7 Report preview window
The main area of the preview window shows a preview of the report as it will be printed
or appear in an exported PDF file. If the report comprises more than one page, the
pages can be browsed using the buttons
To open the print dialog for installed windows printers click
To open a file selector for export of the report to PDF, WORD, EXCEL or Rich Text
format, click
Page 82

R&S UPV-K7 Reporting, Storing, Loading and Deleting Results
Storing and Loading Curves
Operating Manual 1401.9353.12 - 04 82
The scale of the document in the preview can be adjusted with
Figure 8-8 Scale menu of the preview window
8.11 Storing and Loading Curves
Measured curves can be stored from and loaded into the graph of a measurement
macro (see above). This allows easy import into spreadsheets as well as direct
comparison of curves measured at different times or places. Measured curves can also
be stored in a R&S UPV limit file for use as a limit curve either in a R&S UPV sweep
graph or in the graph of a R&S UPV-K7 window. This allows e.g. to derive tolerance
schemes from “golden devices”. The measured curve can be arbitrarily shifted before
being stored.
Figure 8-9 Input window for defining a shift of a measured curve for storage as limit curve
Measured curves can be stored out of the results overview to an ASCII file by rightclicking into the results overview and selecting “Save Curve of Marked Row as …”. If
the result contains more than one result, the user can select which curve is to be
stored, or alternatively choose to store all measured curves into a common file. The file
format can be tab separated (“*.txt”) or comma separated (“*.csv”). *.csv files can be
directly opened in spreadsheet applications like MS Excel by double-clicking the file.
Tab separated text files can also be imported into spreadsheets.
Page 83

R&S UPV-K7 Reporting, Storing, Loading and Deleting Results
Deleting Results
Operating Manual 1401.9353.12 - 04 83
8.12 Deleting Results
It may be desirable to delete results of selected measurements from the result file, e.g.
because the measurement was repeated due to the hearing aid being switched off, a
wrong setting etc. To delete the result of a particular measurement, mark the row for
the selected measurement in the data grid of the main window by clicking on the row
header to the left, right-click into the data grid and select “Delete result” from the
context menu. After confirmation by the operator, the selected row of the result
overview will be deleted from the result file together with all associated data (except
data also associated with other measurement results).
A set of results may be selected in the “Select” column of the results data grid and
commonly deleted using the context menu item “Report Selection Delete Selected
Results”.
8.13 Automatic Backup and Restoration of the Results File
To speed up the execution of sequences, the result file is only saved when the
program is closed. However, backups of the result file called “*.xml~1” and “*.xml~2”
are stored alternately after termination of each single measurement and after
termination of each sequence (“*” stands for the name of the results file without
extension). If the program is ended without closing it properly, or if the result file is not
existing anymore, the R&S UPV-K7 will by the time of its next start offer to restore the
result file from the latest backup file:
Figure 8-10 Restoration of data from backup file
Page 84

R&S UPV-K7 Reporting, Storing, Loading and Deleting Results
Automatic Backup and Restoration of the Results File
Operating Manual 1401.9353.12 - 04 84
If it is chosen to restore the result file from the backup, the supposedly damaged result
file is copied do “*.xml~3” before the backup file is copied to the original name of the
results file.
Page 85

R&S UPV-K7 Remote Control
Operating Manual 1401.9353.12 - 04 85
9 Remote Control
Buffer No.
Content
1
Measurement Title
2
Measurement Date and Time
3
Total Verdict
9.1 Preparations
1. Start the K7 test program on the R&S UPV.
2. In the “Options” menu, deactivate item “Show operator instructions”.
3. In the “Options” menu, deactivate item “Continuous Current Measurement”.
4. Activate “Enable remote control” in the Options menu. Remote control is always
disabled after start of the UPV-K7 program.
5. If it is desired to download screenshots from the R&S UPV to the host, activate
also “Generate temporary image files” in the Options menu.
6. Do all necessary settings and calibrations as would be done for manual control.
9.2 String Buffers and Data Buffers
Preparations
For handing data between macros or application programs and a remote control host,
the UPV firmware provides up to 1024 string buffers and up to 1024 data buffers.
String buffers can be written with SCPI command
SYSTem:MEMory:STRing<n3> <string>
and read out with SCPI command
SYSTem:MEMory:STRing<n3>?
Data buffers can be written with SCPI command
SYSTem:MEMory:DATA<n3> <data>
and read out with SCPI command
SYSTem:MEMory:DATA<n3>?
<n3> = 1 to 1024 for all operations above.
The UPV-K7 program uses string buffers 1 to 6 for communicating status information
to the remote control host and string buffers 11 to 20 for communicating control
information from the host to the UPV-K7 program. String buffers from 21 onwards are
used for communicating result values.
Table 9-1: Contents of string buffers
Page 86

R&S UPV-K7 Remote Control
String Buffers and Data Buffers
Operating Manual 1401.9353.12 - 04 86
Buffer No.
Content
4
Status
5
Error Message
6
Control Message
7
Not used
8
Not used
9
Not used
10
Not used
11
Control: Parameter 1
12
Control: Parameter 2
13
Control: Parameter 3
14
Control: Parameter 4
15
Control: Parameter 5
16
Control: Parameter 6
17
Control: Parameter 7
18
Control: Command
19
Control: Done
20
Control: Continue
A comprehensive description of string and trace buffer contents, depending on the type
of test, is available in file “UPV-K7_Buffers.xlsx”.
Page 87

R&S UPV-K7 Remote Control
Sending a Remote Control Command
Operating Manual 1401.9353.12 - 04 87
Command
Explanation
DUT
Changes the DUT information for report and results
database.
VBatt
Sets the global battery voltage. This value can be
overridden by battery voltage values specified in
test definitions.
SupplyCurrent
Starts a supply current measurement.
Environmental
Enters static air pressure, room temperature and
relative humidity values for the reports.
FR1
Starts a frequency response measurement
according to the measurement definition file
specified in string buffer 11.
RTS1
Starts the test gain setting tool according to the
measurement definition file specified in string buffer
11.
LS1
Starts a level sweep (input-output curve)
measurement according to the measurement
definition file specified in string buffer 11.
NOISE1
Starts a measurement of equivalent input noise
according to the measurement definition file
specified in string buffer 11.
DF1
Starts a measurement of harmonic distortion
according to the measurement definition file
specified in string buffer 11.
DDIST1
Starts an intermodulation distortion measurement
according to the measurement definition file
specified in string buffer 11.
BCL1
Starts a battery current measurement according to
the measurement definition file specified in string
buffer 11.
DYN1
Starts a measurement of dynamic behavior
according to the measurement definition file
specified in string buffer 11.
SSPL1
Starts a measurement of saturation SPL according
to the measurement definition file specified in string
buffer 11.
9.3 Sending a Remote Control Command
A remote control command is always written into string buffer 18. Related parameters
are written to string buffers 11 to 17. Note that the parameters have to be written first
and the command in string buffer 18 last because the command starts the remote
controlled action.
Table 9-2: Remote control commands
Page 88

R&S UPV-K7 Remote Control
Remote Controlled Settings
Operating Manual 1401.9353.12 - 04 88
Command
Explanation
FRI1
Starts a frequency response measurement with
inductive coupling and calculation of ETLS
according to the measurement definition file
specified in string buffer 11.
SPEECH
Starts a speech test according to the measurement
definition file specified in string buffer 11.
MC1
Starts a frequency response measurement
according to the measurement definition file
specified in string buffer 11.
REP1
Generates a report according to the definition file
specified in buffer 11.
AT1
Starts the alignment tool according to the
measurement definition file specified in buffer 11.
ESENS
Starts a measurement of electric input sensitivity
according to the measurement definition file
specified in string buffer 11.
SCONT
Can be used to run an external executable
according to the definition file specified in buffer 11.
Buffer No.
Content
12
Device name (String)
13
Device type (String)
14
Device manufacturer (String)
15
Device serial number (String)
16
AGC (“true” or “false”)
9.4 Remote Controlled Settings
9.4.1 Selecting a device under test
To be able to assign results later to tested devices, and to generate reports containing
information about the tested device, it is possible to select a device and also to enter
new information about the current device under test remotely.
The remote command to be stored in string buffer 18 for changing the information
about the test object is “DUT”.
If buffer 11 contains the string “new”, a new data set is generated using the data from
buffers 12 to 16. The data must be stored to the string buffers as follows:
Table 9-3: Contents of string buffers for generating a new test object data set.
Page 89

R&S UPV-K7 Remote Control
Remote Controlled Settings
Operating Manual 1401.9353.12 - 04 89
Buffer No.
Meaning
Example
12
Temperature
21 °C
67 °F
13
Relative humidity
53 %
14
Static air pressure
101 kPa
758 mmHg
Buffer No.
Meaning
Format
12
Lower limit (mA)
Floating point number
13
Upper limit (mA)
Floating point number
14
Check limits
Boolean (“true” or “false”)
If the data set has been generated successfully, a date and time string serving as a
key to the data set is returned in string buffer 2. This date and time string is required
later to re-select the test object.
If buffer 11 contains the string “select”, the test object data set pertaining to the date
and time string provided in buffer 12 is selected to be reported as test object with the
subsequent tests.
9.4.2 Setting the supply voltage
Remote command “VBatt” in string buffer 18 causes the supply voltage at the analog
aux output to be set to the value specified in string buffer 11. The voltage range is
limited between 0 V and +3 V.
9.4.3 Setting the environmental values for the reports
Remote command “Environmental” in string buffer 18 sets the air pressure, humidity
and temperature values assigned to the subsequent measurement results. It is
recommended to use the formatting shown in the examples of the following table.
Table 9-4: Parameters for environmental values
9.4.4 Measuring the supply current
With remote command “SupplyCurrent” in string buffer 18, a simple supply current
measurement, similar to the continuous current measurement available without remote
control, can be started. An optional limit check is available with the following
parameters:
Table 9-5: Parameters for supply current measurement
Page 90

R&S UPV-K7 Remote Control
Operating Manual 1401.9353.12 - 04 90
9.4.5 Generating a report and storing it to a file
To generate a report, a definition file configuring the report has to be present. The
report generation is started with the path name of the definition file in string buffer 11
and command “REP1” in string buffer 18.
9.5 Starting a Measurement
To start a measurement, store the path name of the measurement definition to string
buffer 11 and then the shortcut for the appropriate measurement dll as listed in table
Table 9-2 to string buffer 18. The shortcut can be seen in the parameters window (see
section 6.2).
9.6 Continue and Done
Adjustments like Reference Test Setting require a confirmation from the operator that
the requested operation, like e.g. setting the gain control, has been completed. If an
action is requested from the operator, the prompt text is stored in string buffer 6. As
soon as this text appears in string buffer 6, the execution of the measurement is halted
and the status text in string buffer 4 changes to “Waiting for input”. After the operator
has completed the requested action, the controlling program has to store the string
“continue” in string buffer 20.
Starting a Measurement
“Continue” is also used to start a new sweep in the Multi-curve measurement.
To close a measurement like Multi-curve which does not close automatically in remote
mode, string “Done” has to be stored to string buffer 19.
9.7 Reading the Results
After a measurement has terminated, status information is available in string buffers 1
to 6. Global result values are available in string buffers 21 to 30. Per-sweep result
values are stored from buffer 31 onwards. Each result value is stored as commadelimited string in the order < Name, Unit, Value, Lower Limit, Upper Limit, Limit
checked (True / False), Verdict (Pass / Fail / not checked) >.
Measured curves are stored as comma-delimited strings in trace buffers starting from
trace buffer 11 (X values) and 12 (Y values). Trace buffers with odd number contain X
values, trace buffers with even numbers contain Y values.
If limit curves exist, they are available in trace buffers 1 to 4.
For details on result data in string buffers and trace buffers, depending on the
measurement function, see file “UPV-K7_Buffers.xlsx”.
Contents of string buffers are queried with SCPI command
SYSTem:MEMory:STRing<n3>?
Contents of trace buffers can be queried with SCPI command
Page 91

R&S UPV-K7 Remote Control
Status of the remotely started measurement function
Operating Manual 1401.9353.12 - 04 91
Status String
Explanation
Idle
The measurement program is currently inactive. A new measurement can be
started.
Measurement running
A measurement has been started and has not yet finished.
Error occured
The running measurement caused an error. See the error string provided in
string buffer 5.
Waiting for input
The measurement execution has been halted, e.g. for some input or for
control of the DUT. To continue the measurement execution, write “continue”
to string buffer 20. If the program is waiting to be closed, e.g. because no
additional sweep is required, write “done” to string buffer 19.
SYSTem:MEMory:DATA<n3>?
<n3> = 1 to 1024 is the buffer number as specified in the tables above and in file “UPVK7_Buffers.xlsx”.
9.8 Status of the remotely started measurement function
The remote control host can monitor the state of the measurement program by reading
the content of string buffer 4. The meaning of the strings returned is explained in Table
9-6.
Table 9-6: Status strings
Page 92

R&S UPV-K7 Terminating the Application
Status of the remotely started measurement function
Operating Manual 1401.9353.12 - 04 92
10 Terminating the Application
The measurement can be terminated from the main window with the “Exit” softkey.
This causes the result file to be written to the hard disk.
Page 93

R&S UPV-K7 Index
Operating Manual 1401.9353.12 - 04 93
11 Index
Adaptive measurement (function settling) ........ 15
Additional measurements ................................ 29
AGC settling .................................................... 47
Alignment of hearing aid in the magnetic field
routine ............................................................. 65
Ambient conditions .......................................... 16
Automatic backup ............................................ 83
Automatic test sequences ................................ 71
Battery current measurements ......................... 54
Battery voltage............................................... 18
Calibration ....................................................... 19
Devices ........................................................ 19
Ear simulator ................................................ 22
Induction coil ................................................ 25
Internal speech test signal ............................ 24
ISTS ............................................................. 24
microphone .................................................. 21
Pistonphones correction values .................... 23
Sound source ............................................... 23
Change scale of the graph ............................... 28
Closing measurement windows ....................... 30
Complete a measurement remotely ................. 90
Configuring a landscape report ........................ 76
Configuring an on-page report ......................... 78
Continue a measurement remotely .................. 90
Continuous current measurement .................... 14
Correction values for pistonphones .................. 23
Coupler mic reference ..................................... 18
Create a test sequence .................................... 71
Creating a landscape report ............................. 30
Creating a report ........................................ 30, 67
Cursor ............................................................. 28
Customizing measurements ............................ 31
Data buffers ..................................................... 85
Data entry reporting ......................................... 26
Data point size ................................................. 29
Delay before closing a measurement in a
sequence ........................................................ 18
Deleting results ................................................ 83
Dynamic behaviour measurements .................. 47
Ear simulator ................................................... 16
Ear simulator calibration .................................. 22
Edit a test sequence ........................................ 71
Electric input sensitivity measurements ........... 65
Enable remote control ...................................... 18
Entering comments .......................................... 29
Equivalent input noise measurements ............. 51
Frequency Response measurements .............. 33
Generate temporary image files ................... 18
Generating a landscape report ........................ 77
Generating a report remotely ........................... 90
Generating a sequence report ......................... 75
Generating a single report ............................... 75
Generating an on-page report .......................... 79
Harmonic distortion measurements.................. 41
High-pass (rumble) filter .................................. 14
IEC 60118-15 .................................................. 56
Induction coil calibration .................................. 25
Input -Output characteristics............................ 49
Input switcher .................................................. 18
Installing the application software ...................... 9
intermodulation distortion measurements ........ 44
Internal speech test signal calibration .............. 24
ISTS
Calibration.................................................... 24
Notes ........................................................... 56
Loading curves .......................................... 29, 82
Low-pass (hiss noise) filter .............................. 15
Measurement frequency range ........................ 14
Measurements ................................................ 27
Additional measurements ............................. 29
Change scale of the graph ........................... 28
Closing measurement windows .................... 30
Creating a landscape report ......................... 30
Creating a report .......................................... 30
Cursor .......................................................... 28
Customizing ................................................. 31
Data point size ............................................. 29
Entering comments ...................................... 29
Macros ......................................................... 27
Notes ........................................................... 33
Notes on alignment of hearing aid in the
magnetic field routine ................................ 65
Notes on battery current measurements ...... 54
Notes on creating a report ............................ 67
Notes on dynamic behaviour measurements 47
Notes on electric input sensitivity
measurements .......................................... 65
Notes on equivalent input noise measurements
................................................................. 51
Notes on frequency response measurements
................................................................. 33
Notes on harmonic distortion measurements 41
Notes on input-output characteristics ........... 49
Notes on intermodulation distortion
measurements .......................................... 44
Notes on multi-curve measurements ............ 37
Notes on reference test gain setting routine . 62
Notes on saturation sound pressure level
measurements .......................................... 40
Notes on setting the switcher ....................... 68
Notes on speech test measurements ........... 56
Notes on starting executable ........................ 69
Storing and loading curves ........................... 29
Storing as limit curves .................................. 29
Zooming ....................................................... 28
Measuring the supply current remotely ............ 89
Microphone calibration .................................... 21
Microphone location ........................................ 17
Multi-curve measurements .............................. 37
Notes on measurements ................................. 33
Open a test sequence ..................................... 72
Page 94

R&S UPV-K7 Index
Operating Manual 1401.9353.12 - 04 94
Operating concept ........................................... 14
Operator .......................................................... 26
Options
Adaptive measurement (function settling) ..... 15
Continuous current measurement ................. 14
General settings ........................................... 14
High-pass (rumble) filter ............................... 14
Low-pass (hiss noise) filter ........................... 15
Measurement frequency range ..................... 14
Overview ........................................................... 6
Preparation ........................................................ 7
Installing the application software ................... 9
Required accessories ..................................... 7
Required measuring instruments .................... 7
Starting the application software ................... 10
Test setup ...................................................... 9
Preparations for remote control........................ 85
Preview window ............................................... 81
Reading the results remotely ........................... 90
Reference test gain setting routine .................. 62
Remote control ................................................ 85
Continue a measurement ............................. 90
Data buffers .................................................. 85
Generate a report ......................................... 90
Measure the supply current .......................... 89
Read results ................................................. 90
Select DUT ................................................... 88
Send a command ......................................... 87
Set a measurement done ............................. 90
Set environmental values for reports ............ 89
Set supply voltage ........................................ 89
Start a measurement .................................... 90
Status of the measurement function ............. 91
Store a report ............................................... 90
String buffers ................................................ 85
Report settings ................................................ 74
Reporting
Data entry ..................................................... 26
Operator ....................................................... 26
Test object .................................................... 26
Reporting on sequence results ........................ 73
Restoration of resultes file ............................... 83
Result files ....................................................... 74
Results
Delete ........................................................... 83
Files ............................................................. 74
Landscape report (configuring) ..................... 76
Landscape report (generating) ...................... 77
Load curves .................................................. 82
On-page report (configuring)......................... 78
On-page report (generating) ......................... 79
Preview window ........................................... 81
Report settings ............................................. 74
Restore Automatic backup ........................... 83
Restore results file ....................................... 83
Select report ................................................ 77
Sequence report .......................................... 75
Single report ................................................ 75
Store curves ................................................. 82
Running a sequence ....................................... 72
Running a single measurement within a
sequence ........................................................ 73
Saturation sound pressure level measurements
....................................................................... 40
Selecting a device under test remotely ............ 88
Selecting a report ............................................ 77
Sending a remote control command ................ 87
Set switcher .................................................... 68
Setting the environmental values for reports
remotely .......................................................... 89
Setting the supply voltage remotely ................. 89
Show operator instructions .......................... 18
Sound source calibration ................................. 23
Speech test ..................................................... 56
Standard ......................................................... 16
Start executable .............................................. 69
Start of the application software ........................ 7
Starting a measurement remotely.................... 90
Starting the application software ..................... 10
Status of the remotely started measurement
function ........................................................... 91
Store loaded curve data to results ............... 18
Store results of further measurements ........ 18
Storing a report remotely ................................. 90
Storing curves ........................................... 29, 82
Limit curves .................................................. 29
String buffers................................................... 85
Terminating the application ............................. 92
Test method .................................................... 17
Test object ...................................................... 26
Test sequences
Creating a sequence .................................... 71
Editing a sequence ...................................... 71
Open a sequence ......................................... 72
Reporting results .......................................... 73
Running a sequence .................................... 72
Running a single measurement .................... 73
Using a sample sequence ............................ 72
Test setup ......................................................... 9
Using a sample sequence ............................... 72
Zooming .......................................................... 28
 Loading...