

Page 1
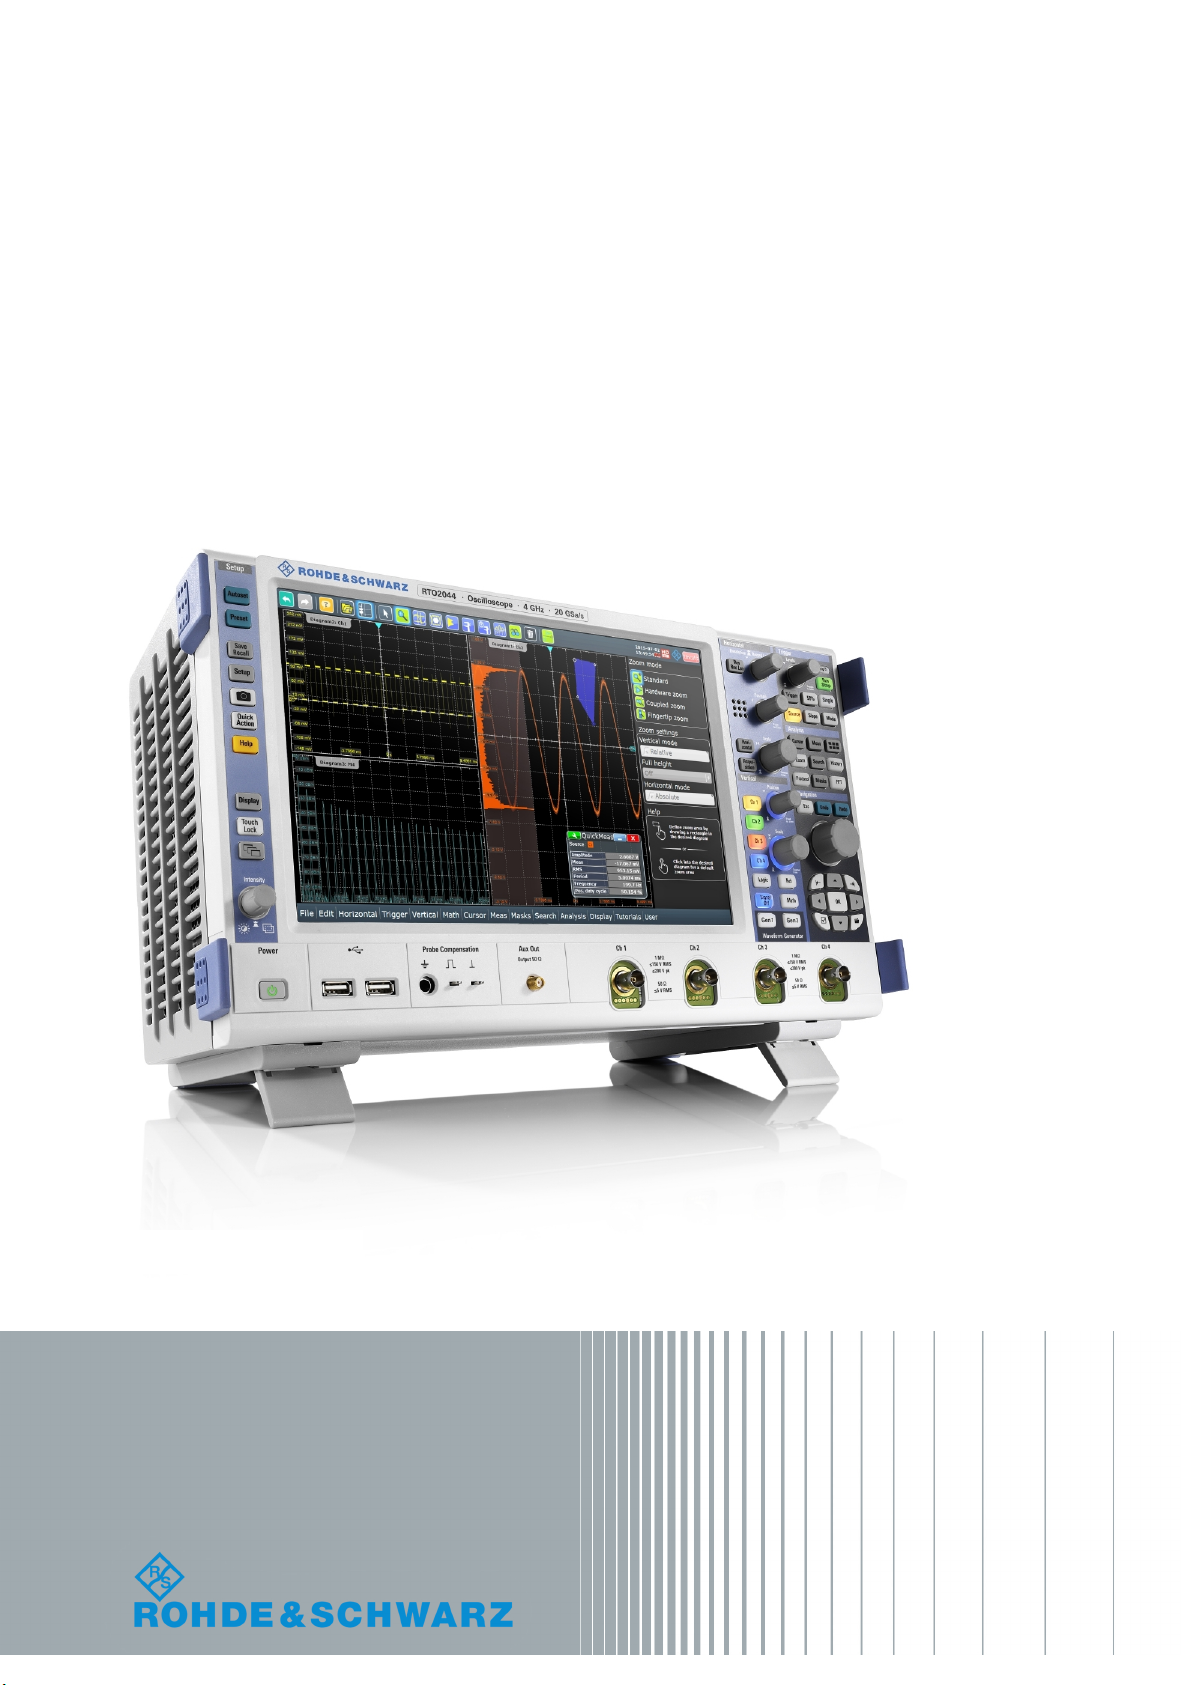
R&S®RTO2000
Oscilloscope
Getting Started
(=PïC2)
1332971902
Version 08
Getting Started
Page 2

This manual describes the following R&S®RTO models with firmware version 4.15 and higher:
●
R&S®RTO2002 (1329.7002K02)
●
R&S®RTO2004 (1329.7002K04)
●
R&S®RTO2012 (1329.7002K12)
●
R&S®RTO2014 (1329.7002K14)
●
R&S®RTO2022 (1329.7002K22)
●
R&S®RTO2024 (1329.7002K24)
●
R&S®RTO2032 (1329.7002K32)
●
R&S®RTO2034 (1329.7002K34)
●
R&S®RTO2044 (1329.7002K44)
●
R&S®RTO2064 (1329.7002K64)
© 2018 Rohde & Schwarz GmbH & Co. KG
Mühldorfstr. 15, 81671 München, Germany
Phone: +49 89 41 29 - 0
Fax: +49 89 41 29 12 164
Email: [email protected]
Internet: www.rohde-schwarz.com
Subject to change – Data without tolerance limits is not binding.
R&S® is a registered trademark of Rohde & Schwarz GmbH & Co. KG.
Trade names are trademarks of the owners.
1332.9719.02 | Version 08 | R&S®RTO2000
Throughout this manual, products from Rohde & Schwarz are indicated without the ® symbol , e.g. R&S®RTO2000 is indicated as
R&S RTO.
Page 3

R&S®RTO2000
1 Preface.................................................................................................... 7
1.1 Key Features..................................................................................................................7
1.2 Documentation Overview............................................................................................. 7
1.2.1 Manuals and Instrument Help......................................................................................... 8
1.2.2 Data Sheet and Brochure................................................................................................9
1.2.3 Release Notes, Open Source Acknowledgment............................................................. 9
1.2.4 Application notes, Application cards, Videos...................................................................9
1.3 Conventions Used in the Documentation...................................................................9
1.3.1 Typographical Conventions.............................................................................................9
1.3.2 Conventions for Procedure Descriptions.......................................................................10
1.3.3 Notes on Screenshots...................................................................................................10
Contents
Contents
2 Preparing for Use................................................................................. 11
2.1 Unpacking and Checking the Instrument................................................................. 11
2.2 Positioning the Instrument.........................................................................................12
2.2.1 Bench Top Operation.................................................................................................... 12
2.2.2 Rackmounting............................................................................................................... 13
2.3 Starting the Instrument...............................................................................................14
2.3.1 Powering On and Off.....................................................................................................14
2.3.2 Starting Up and Shutting Down.....................................................................................15
2.3.3 EMI Suppression...........................................................................................................15
2.4 Connecting External Devices.....................................................................................16
2.4.1 Connecting USB Devices..............................................................................................16
2.4.2 Connecting an External Monitor....................................................................................17
3 Instrument Tour....................................................................................19
3.1 Front Panel.................................................................................................................. 19
3.1.1 Input Connectors...........................................................................................................20
3.1.2 Other Front Panel Connectors...................................................................................... 21
3.2 Rear Panel....................................................................................................................21
3.3 Keys and Controls...................................................................................................... 24
3.3.1 Power Key.....................................................................................................................24
3.3.2 Setup Controls.............................................................................................................. 24
3Getting Started 1332.9719.02 ─ 08
Page 4

R&S®RTO2000
3.3.3 Horizontal Controls........................................................................................................26
3.3.4 Vertical Controls............................................................................................................27
3.3.5 Trigger Controls.............................................................................................................29
3.3.6 Analysis Keys................................................................................................................30
3.3.7 Navigation Controls.......................................................................................................31
4 Trying Out the Instrument................................................................... 35
4.1 Displaying a Basic Signal...........................................................................................35
4.2 Acquiring Data.............................................................................................................37
4.3 Organizing the Display............................................................................................... 38
4.4 Changing the Waveform Scaling and Position.........................................................41
4.5 Zooming into the Display........................................................................................... 45
4.5.1 Using the Standard Zoom............................................................................................. 45
Contents
4.5.2 Using the Fingertip Zoom..............................................................................................47
4.6 Displaying the Waveform History..............................................................................48
4.7 Performing Basic Measurements.............................................................................. 49
4.7.1 Performing a Cursor Measurement...............................................................................50
4.7.2 Performing an Amplitude Measurement........................................................................51
4.7.3 Performing and Configuring the Quick Measurement................................................... 53
4.7.4 Displaying a Histogram................................................................................................. 57
4.8 Performing a Basic FFT Analysis.............................................................................. 59
4.9 Performing Mathematical Calculations.....................................................................62
4.10 Performing a Search................................................................................................... 63
4.11 Performing a Mask Test..............................................................................................65
4.12 Printing and Saving Screenshots..............................................................................67
4.13 Saving Data..................................................................................................................69
5 Operating the Instrument.................................................................... 73
5.1 Means of Manual Interaction......................................................................................73
5.2 Touchscreen Display.................................................................................................. 74
5.2.1 Information on the Display............................................................................................ 74
5.2.2 Control Elements on the Touchscreen.......................................................................... 78
5.3 App Cockpit................................................................................................................. 79
5.4 Working with Waveforms........................................................................................... 80
5.5 Toolbar......................................................................................................................... 83
4Getting Started 1332.9719.02 ─ 08
Page 5

R&S®RTO2000
5.5.1 Using the Toolbar.......................................................................................................... 84
5.5.2 Configuring the Toolbar................................................................................................. 84
5.5.3 Toolbar Functions..........................................................................................................85
5.6 Displaying Results...................................................................................................... 90
5.7 Using Dialog Boxes.................................................................................................... 92
5.8 Entering Data...............................................................................................................93
5.9 Messages..................................................................................................................... 95
5.10 Getting Information and Help.....................................................................................96
5.10.1 Displaying Tutorials.......................................................................................................96
5.10.2 Displaying Help............................................................................................................. 96
5.10.3 Using the Help Window.................................................................................................97
6 Setting Up the Instrument................................................................... 99
Contents
6.1 Performing a Self-alignment...................................................................................... 99
6.2 Aligning the Touchscreen.......................................................................................... 99
6.3 Setting the Display Language..................................................................................100
6.4 Adjusting Passive Probes........................................................................................ 100
Index....................................................................................................103
5Getting Started 1332.9719.02 ─ 08
Page 6

R&S®RTO2000
Contents
6Getting Started 1332.9719.02 ─ 08
Page 7

R&S®RTO2000
1 Preface
1.1 Key Features
Preface
Documentation Overview
The R&S RTO oscilloscopebrings various benefits in your daily work. Outstanding key
features are:
Best oscilloscope performance
●
Up to 16-bit vertical resolution
●
Trigger on any detail you can see
●
Quickly find signal faults with 1 Million waveforms/s
●
Integrated spectrum analysis
Widest range of capabilities
●
Fast acquisition rate even with industry leading 2 Gsample deep memory
●
First zone trigger in time and frequency domain
●
Analyze previous acquisitions - always available in history buffer
●
Deep toolset for signal analysis
Powerful user interface
●
High-resolution 12.1’’ capacitive touchscreen with gesture support
●
Easily customizable waveform display with SmartGrid
●
Fast access to important tools
●
Documentation at the press of a button
Engineered for multi-domain challenges
●
Class leading MSO
●
Trigger and decode for serial protocols
●
Power measurements
●
Automatic compliance tests
●
EMI debugging with oscilloscopes
●
IQ and RF analysis
●
Extensive probe portfolio for voltage, current and more
For a detailed specification refer to the data sheet.
1.2 Documentation Overview
This section provides an overview of the R&S RTO user documentation.
7Getting Started 1332.9719.02 ─ 08
Page 8

R&S®RTO2000
1.2.1 Manuals and Instrument Help
Preface
Documentation Overview
You find the manuals on the product page at:
www.rohde-schwarz.com/manual/rto
Getting started manual
Introduces the R&S RTO and describes how to set up and start working with the instrument, and describes basic operations. A printed English version is included in the
delivery. Editions in other languages are available on the product website.
Instrument help
The help offers quick, context-sensitive access to the complete information for the firmware basic functionality and applications.
User manual (Instrument)
Describes all instrument functions in detail. It also provides an introduction to remote
control, a complete description of the remote control commands with programming
examples, and information on maintenance and instrument interfaces. Includes the
contents of the getting started manual.
The online version of the user manual provides the complete contents for immediate
display on the internet.
Manuals for compliance test options
For compliance test options, extra test procedure manual are available. Test fixtures
are described in printed manuals, which are delivered with the fixture.
●
The following test procedure manuals are available:
– USB 2.0 Compliance Tests for R&S RTO
– Ethernet Compliance Tests for R&S RTO
– MIPI D-PHY Compliance Tests for R&S RTO
– DDR3 Compliance Tests for R&S RTO
– eMMC Compliance Tests for R&S RTO
– ScopeSuite Automation
●
The following test fixture manuals are available:
– R&S RT-ZF1 USB 2.0 Compliance Test Fixture Set
– R&S RT-ZF2 Ethernet Compliance Test Fixture Set
– R&S RT-ZF3 Frequency Converter Board (100BASE-T1)
– R&S RT-ZF4 10BASE-Te Test Fixture
– R&S RT-ZF5 Ethernet Probing Fixture
– R&S RT-ZF6 Frequency Converter Board (1000BASE-T1)
8Getting Started 1332.9719.02 ─ 08
Page 9

R&S®RTO2000
1.2.2 Data Sheet and Brochure
Preface
Conventions Used in the Documentation
Basic safety instructions
Contains safety instructions, operating conditions and further important information.
The printed document is delivered with the instrument.
Instrument security procedures manual
Deals with security issues when working with the R&S RTO in secure areas.
Service Manual
Describes the performance test for checking the rated specifications, module replacement, firmware update, troubleshooting and fault elimination, and contains mechanical
drawings and spare part lists. The service manual is available for registered users on
the global Rohde & Schwarz information system (GLORIS, https://gloris.rohde-
schwarz.com).
The data sheet contains the technical specifications of the R&S RTO. It also lists the
options with their order numbers and optional accessories. The brochure provides an
overview of the instrument and deals with the specific characteristics.
See www.rohde-schwarz.com/brochure-datasheet/rto
1.2.3 Release Notes, Open Source Acknowledgment
The release notes list new features, improvements and known issues of the current
firmware version, and describe the firmware installation. The open source acknowledgment document provides verbatim license texts of the used open source software. It
can also be read directly on the instrument.
See www.rohde-schwarz.com/firmware/rto.
1.2.4 Application notes, Application cards, Videos
These documents deal with special applications or background information on particular topics.
See www.rohde-schwarz.com/application/rto
1.3 Conventions Used in the Documentation
1.3.1 Typographical Conventions
The following text markers are used throughout this documentation:
9Getting Started 1332.9719.02 ─ 08
Page 10
R&S®RTO2000
Preface
Conventions Used in the Documentation
Convention Description
"Graphical user interface elements"
[Keys] Key and knob names are enclosed by square brackets.
File names, commands,
program code
Input Input to be entered by the user is displayed in italics.
Links Links that you can click are displayed in blue font.
"References" References to other parts of the documentation are enclosed by quota-
All names of graphical user interface elements on the screen, such as
dialog boxes, menus, options, buttons, and softkeys are enclosed by
quotation marks.
File names, commands, coding samples and screen output are distinguished by their font.
tion marks.
1.3.2 Conventions for Procedure Descriptions
When operating the instrument, several alternative methods may be available to perform the same task. In this case, the procedure using the touchscreen is described.
Any elements that can be activated by touching can also be clicked using an additionally connected mouse. The alternative procedure using the keys on the instrument or
the on-screen keyboard is only described if it deviates from the standard operating procedures.
The term "select" may refer to any of the described methods, i.e. using a finger on the
touchscreen, a mouse pointer in the display, or a key on the instrument or on a keyboard.
1.3.3 Notes on Screenshots
When describing the functions of the product, we use sample screenshots. These
screenshots are meant to illustrate as many as possible of the provided functions and
possible interdependencies between parameters. The shown values may not represent
realistic usage scenarios.
The screenshots usually show a fully equipped product, that is: with all options installed. Thus, some functions shown in the screenshots may not be available in your particular product configuration.
10Getting Started 1332.9719.02 ─ 08
Page 11
R&S®RTO2000
2 Preparing for Use
Preparing for Use
Unpacking and Checking the Instrument
This section describes the basic steps to be taken when setting up the R&S RTO for
the first time.
Risk of instrument damage due to inappropriate operating conditions
An unsuitable operating site or test setup can damage the instrument and connected
devices. Before switching on the instrument, observe the information on appropriate
operating conditions provided in the data sheet. In particular, ensure the following:
●
All fan openings are unobstructed and the airflow perforations are unimpeded. A
minimum distance of 10 cm to other objects is recommended.
●
The instrument is dry and shows no sign of condensation.
●
The instrument is positioned as described in the following sections.
●
The ambient temperature does not exceed the range specified in the data sheet.
●
Signal levels at the input connectors are all within the specified ranges.
●
Signal outputs are connected correctly and are not overloaded.
2.1 Unpacking and Checking the Instrument
To remove the instrument from its packaging and check the equipment for completeness, proceed as follows:
1. Pull off the polyethylene protection pads from the instrument's rear feet.
2. Carefully remove the pads from the instrument handles at the front.
3. Pull off the corrugated cardboard cover that protects the rear of the instrument.
4. Carefully unthread the corrugated cardboard cover at the front that protects the
instrument handles and remove it.
5. Check the equipment for completeness using the delivery note and the accessory
lists for the various items.
6. Check the instrument for any damage. If there is damage, immediately contact the
carrier who delivered the instrument. Make sure not to discard the box and packing
material.
Packing material
Retain the original packing material. If the instrument needs to be transported or shipped later, you can use the material to protect the control elements and connectors.
11Getting Started 1332.9719.02 ─ 08
Page 12
R&S®RTO2000
2.2 Positioning the Instrument
2.2.1 Bench Top Operation
Preparing for Use
Positioning the Instrument
The instrument is designed for use under laboratory conditions. It can be used in
standalone operation on a bench top or can be installed in a rack.
For standalone operation, place the instrument on a horizontal bench with even, flat
surface. The instrument can be used in horizontal position, standing on its feet, or with
the support feet on the bottom extended.
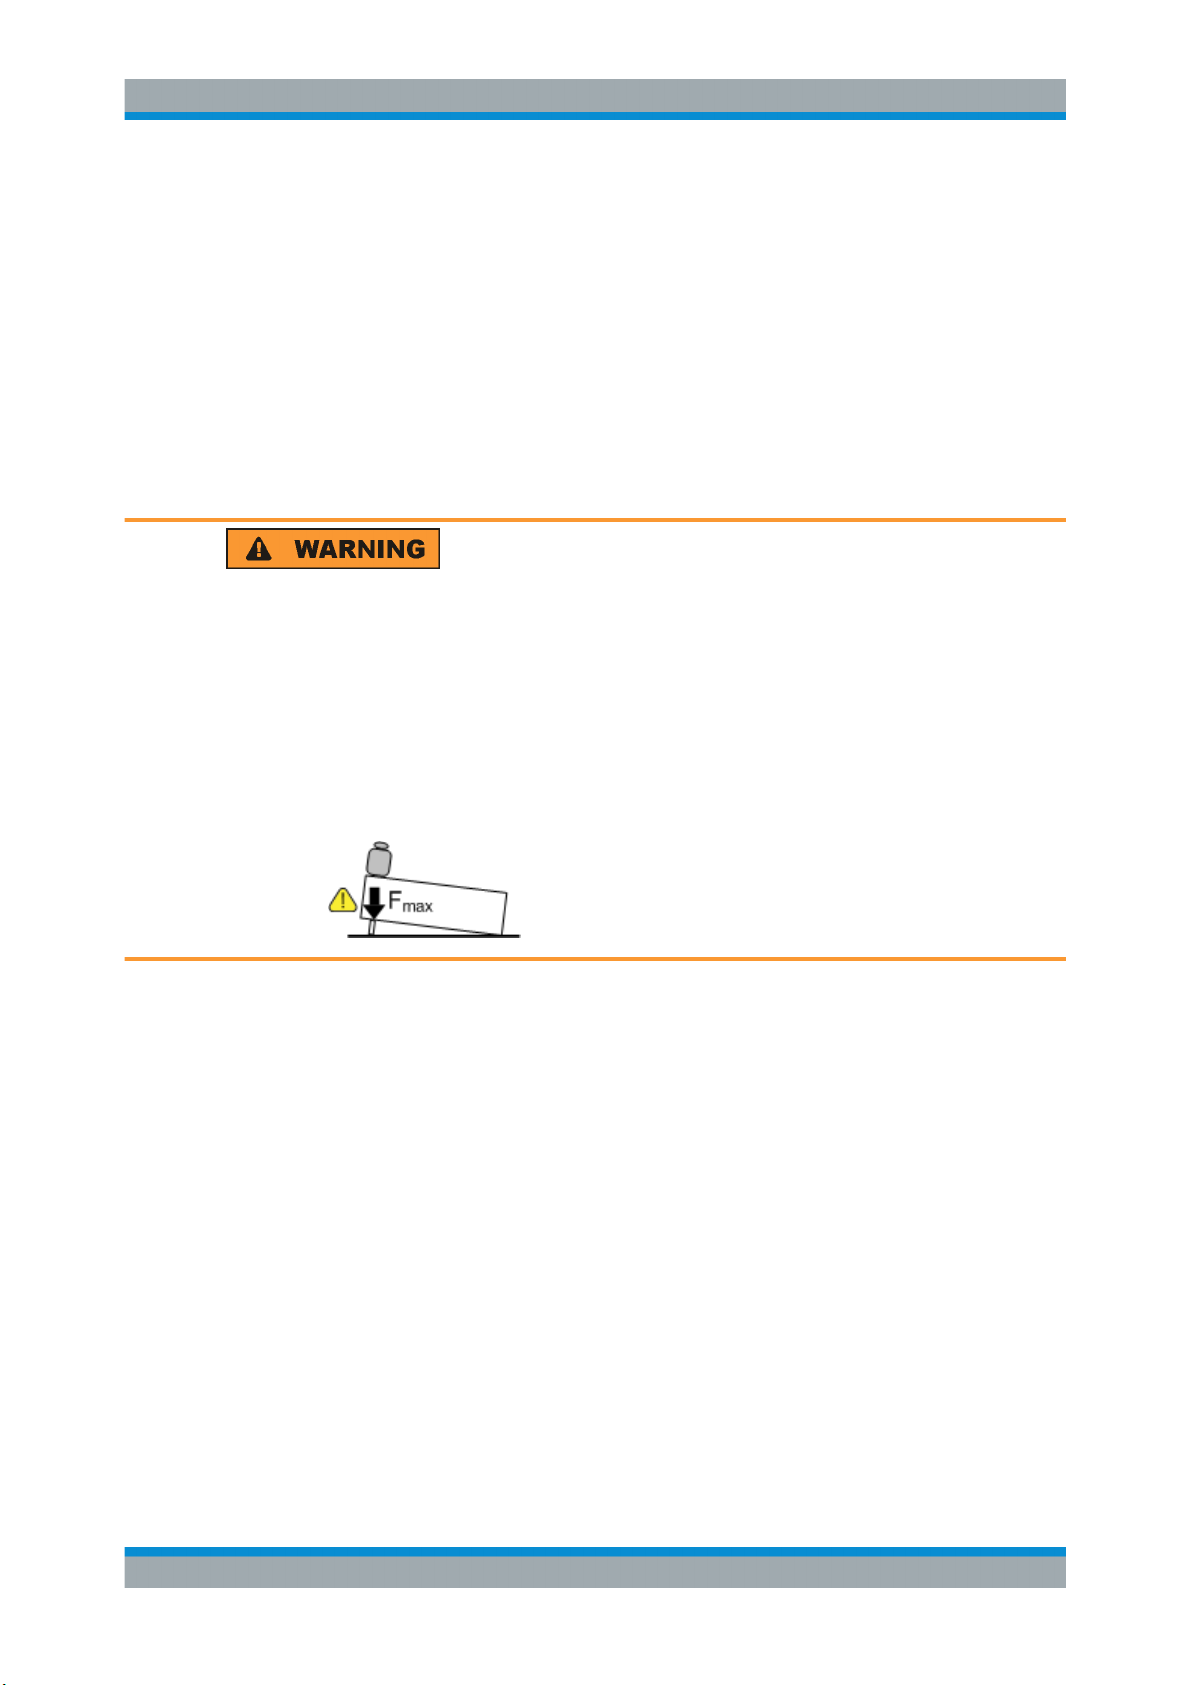
Risk of injury if feet are folded out
The feet can fold in if they are not folded out completely or if the instrument is shifted.
Collapsing feet can cause injury or damage the instrument.
●
Fold the feet completely in or out to ensure stability of the instrument. Never shift
the instrument when the feet are folded out.
●
When the feet are folded out, do not work under the instrument or place anything
underneath.
●
The feet can break if they are overloaded. The overall load on the folded-out feet
must not exceed 200 N.
12Getting Started 1332.9719.02 ─ 08
Page 13
R&S®RTO2000
Preparing for Use
Positioning the Instrument
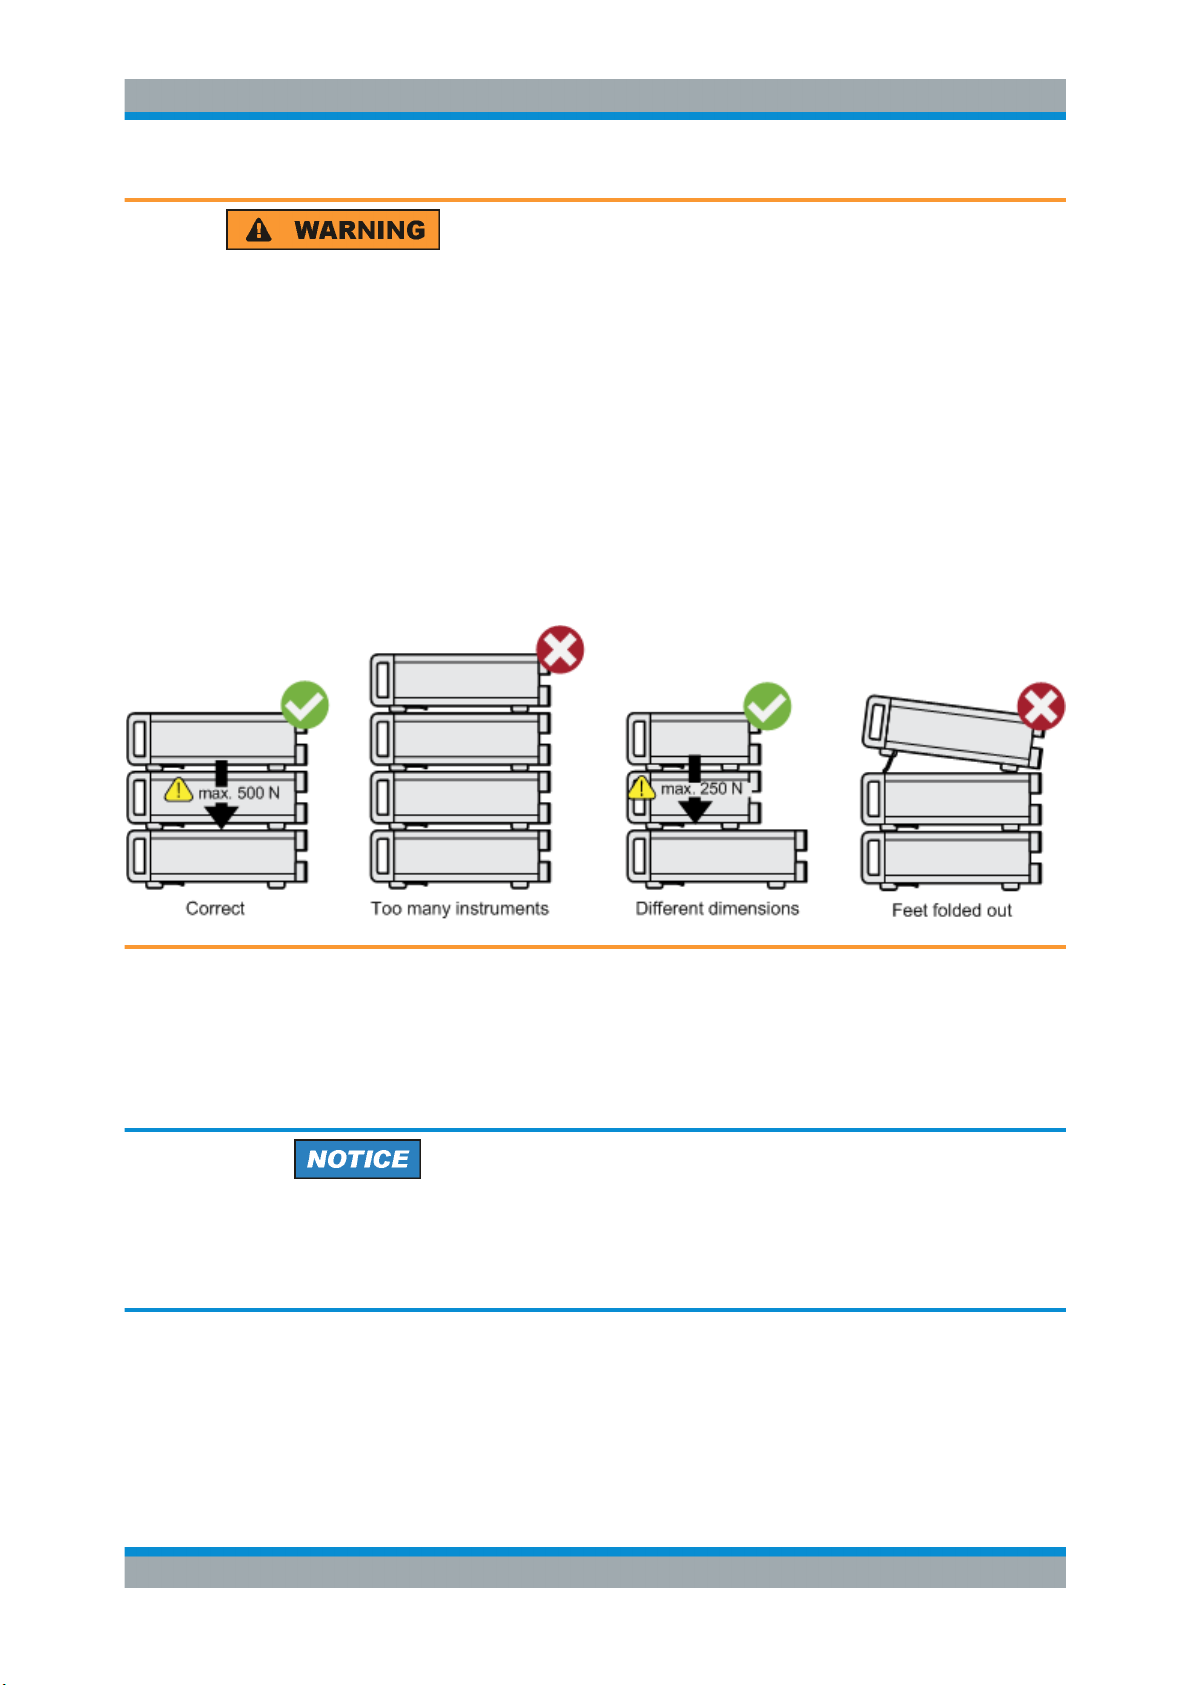
Risk of injury when stacking instruments
A stack of instruments can tilt over and cause injury if not stacked correctly. Furthermore, the instruments at the bottom of the stack can be damaged due to the load
imposed by the instruments on top.
Observe the following instructions when stacking instruments:
●
Never stack more than three instruments. If you need to stack more than three
instruments, install them in a rack.
●
The overall load imposed on the lowest instrument must not exceed 500 N.
●
It is best if all instruments have the same dimensions (width and length).
If you need to stack smaller instruments on the top, the overall load imposed on the
lowest instrument must not exceed 250 N.
●
If the instruments have foldable feet, fold them in completely.
2.2.2 Rackmounting
The instrument can be installed in a rack using a rack adapter kit. The order number is
given in the data sheet. The installation instructions are part of the adapter kit.
Risk of instrument damage due to insufficient airflow in a rack
If you mount several instruments in a rack, you need an efficient ventilation concept to
ensure that the instruments do not overheat. Insufficient airflow for a longer period can
disturb the operation and even cause damage.
13Getting Started 1332.9719.02 ─ 08
Page 14
R&S®RTO2000
2.3 Starting the Instrument
2.3.1 Powering On and Off
Preparing for Use
Starting the Instrument
Risk of injury
Connect the oscilloscope to an outlet that has a ground contact.
If grounding is not ensured by the mains system, ground the oscilloscope using the
protective earth conductor on the front panel and an appropriate cable.
Do not use an isolating transformer to connect the oscilloscope to the AC power supply.
The R&S RTO can be used with different AC power voltages and adapts itself automatically to it.
The nominal ranges are:
●
100 V to 240 V AC at 50 Hz to 60 Hz and 400 Hz
●
max. 5.5 A to 2.3 A
●
max. 450 W
To power on
1. Connect the power cable to the AC power connector on the rear panel of the
R&S RTO.
2. Connect the power cable to the socket outlet.
3. Switch the main power switch at the rear of the instrument to position I.
The power key on the front panel lights up.
Before you start measurements, be sure to comply with the warm-up phase specified
in the data sheet.
If you leave the main power switch on, the instrument is in standby mode. To disconnect from power supply, power off the instrument. Powering off is only required if the
instrument must be disconnected from all power supplies.
To power off
1. If the instrument is running and the [Power] key is green, press the [Power] key on
the front panel to shut down the instrument.
2. Switch the main power switch at the rear of the instrument to position 0.
3. Disconnect the AC power cable from the AC power supply.
14Getting Started 1332.9719.02 ─ 08
Page 15
R&S®RTO2000
2.3.2 Starting Up and Shutting Down
Preparing for Use
Starting the Instrument
Risk of losing data
If you switch off the running instrument using the rear panel switch or by disconnecting
the power cord, the instrument loses its current settings. Furthermore, program data
can be lost.
Press the POWER key first to shut down the application properly.
Powering off also interrupts the power supply of the OCXO (option OCXO Reference
Frequency, R&S RTO-B4).
The [Power] key is located in the bottom left corner of the front panel.
To start up the instrument
1. Make sure that the R&S RTO is connected to the AC power supply and the main
power switch on the rear panel is in position I.
2. Press the [Power] key on the front panel.
The instrument performs a system check, boots the Windows operating system,
and then starts the R&S RTO firmware.
The [Power] key turns green and the illuminated keys on the front panel light up. If
the previous session was terminated regularly, the oscilloscope uses the last settings.
To shut down the instrument
► Press the [Power] key on the front panel.
All current settings are saved, and the software shuts down. The standby power
only supplies the power switch circuits and the optional oven quartz (OCXO, option
R&S RTO-B4).
Now it is safe to power off the instrument.
The "Exit" function in the "File" menu shuts down only the firmware application. To shut
down the instrument completely, also shut down the operating system in the "Start"
menu, or use the [Power] key.
2.3.3 EMI Suppression
Electromagnetic Interference (EMI) may affect the measurement results.
To suppress generated Electromagnetic Interference:
●
Use suitable shielded cables of high quality. For example use double-shielded RF
and LAN cables.
15Getting Started 1332.9719.02 ─ 08
Page 16

R&S®RTO2000
2.4 Connecting External Devices
2.4.1 Connecting USB Devices
Preparing for Use
Connecting External Devices
●
Always terminate open cable ends.
●
Note the EMC classification in the data sheet.
The following interfaces for external devices are provided:
●
USB connectors at the front and rear panel of the instrument
●
Monitor connectors DVI-D and DisplayPort at the rear panel of the instrument
● Connecting USB Devices........................................................................................16
● Connecting an External Monitor..............................................................................17
The USB interfaces on the front and rear panels allow you to connect USB devices
directly to the instrument. The number of USB connectors can be increased by using
USB hubs. Due to the large number of available USB devices, there is almost no limit
to the expansions that are possible with the R&S RTO.
The following USB devices can be useful, for example:
●
USB flash drives to save screenshots and measurement results, and for easy
installation of firmware applications
●
Keyboard and/or mouse to simplify the operation and the entry of data, comments,
filenames, etc.
●
Printer to print measurement results and screenshots
You can connect or disconnect all USB devices during operation of the instrument.
Installing USB devices on R&S RTO is easy under the Windows operating system,
because all USB devices are plug&play. After a device is connected to the USB interface, Windows automatically searches for a suitable device driver.
If the operating system does not find a suitable driver, it prompts you to specify a directory that contains the driver software. If the driver software is on a storage media, connect the appropriate drive to the instrument before proceeding. If the instrument is integrated in a network, you can also install driver data stored in a network directory.
When a USB device is disconnected from the R&S RTO, Windows immediately detects
the change in hardware configuration and deactivates the corresponding driver.
The properties of external USB devices are configured in the operating system, not in
the R&S RTO software. It is recommended that you use mouse and keyboard to
access and modify the settings of the Windows operating system. To access Windows,
press the Windows key on the external keyboard, or select "File" > "Minimize Application" on the R&S RTO menu.
16Getting Started 1332.9719.02 ─ 08
Page 17

R&S®RTO2000
Preparing for Use
Connecting External Devices
Connecting a USB flash drive
If the installation of a USB flash drive is successful, Windows informs you that the
device is ready to use. The device is made available as a new drive ("D:") and is displayed in Windows Explorer. The name of the drive depends on the manufacturer.
Connecting a keyboard
The keyboard is detected automatically when it is connected. The default input language is English – US.
To configure the keyboard properties:
1. Tap the "Find" icon (magnifier) on the Windows taskbar.
2. Type keybord.
3. Select "Edit language and keyboard options".
Connecting a mouse
The mouse is detected automatically when it is connected. To configure the mouse
properties:
1. Tap the "Find" icon (magnifier) on the Windows taskbar.
2. Type mouse.
3. Select "Mouse settings".
Connecting a printer
When printing a file, the instrument checks whether a printer is connected and turned
on, and whether the appropriate printer driver is installed. If necessary, printer driver
installation is initiated by the Windows system. To install a printer driver:
1. Tap the "Find" icon (magnifier) on the Windows taskbar.
2. Type printer.
3. Select "Printers & scanners".
4. Select "Add a printer or scanner".
2.4.2 Connecting an External Monitor
You can connect an external monitor or projector to the R&S RTO. The following connectors are available:
●
"DVI-D" on page 23
●
"DisplayPort" on page 23
Before connecting an external monitor, ensure that the monitor and the R&S RTO are
connected to a ground contact. Otherwise the instrument can be damaged.
17Getting Started 1332.9719.02 ─ 08
Page 18

R&S®RTO2000
Preparing for Use
Connecting External Devices
After connecting an additional monitor or projector to the instrument, configure it for
usage. The relevant settings are Windows settings but you can configure the displays
directly in the instrument setup.
1. Check the input type of the monitor or projector. Make sure to select the correct
cable. To use a VGA monitor, you need an active DVI-D to VGA adapter.
2. Press the [Setup] key.
3. Select the "System" tab.
4. Tap "Display / Monitors".
5. To show the instrument's display content only on the external monitor, select "Projector only".
To show the instrument's display content on both the oscilloscope and the external
monitor, select "Duplicate".
The touchscreen of the R&S RTO has a screen resolution of 1280 x 800 pixel. Most
external monitors have a higher screen resolution. If the screen resolution of the monitor is set higher than the instrument's resolution, the application window uses a 1280 x
800 area of the monitor display. For full screen display, adjust the monitor's screen resolution using "Additional display settings".
18Getting Started 1332.9719.02 ─ 08
Page 19
R&S®RTO2000
3 Instrument Tour
3.1 Front Panel
Instrument Tour
Front Panel
This chapter describes the front and rear panels of the instrument including all function
keys and connectors, and also the touchscreen with its control elements.
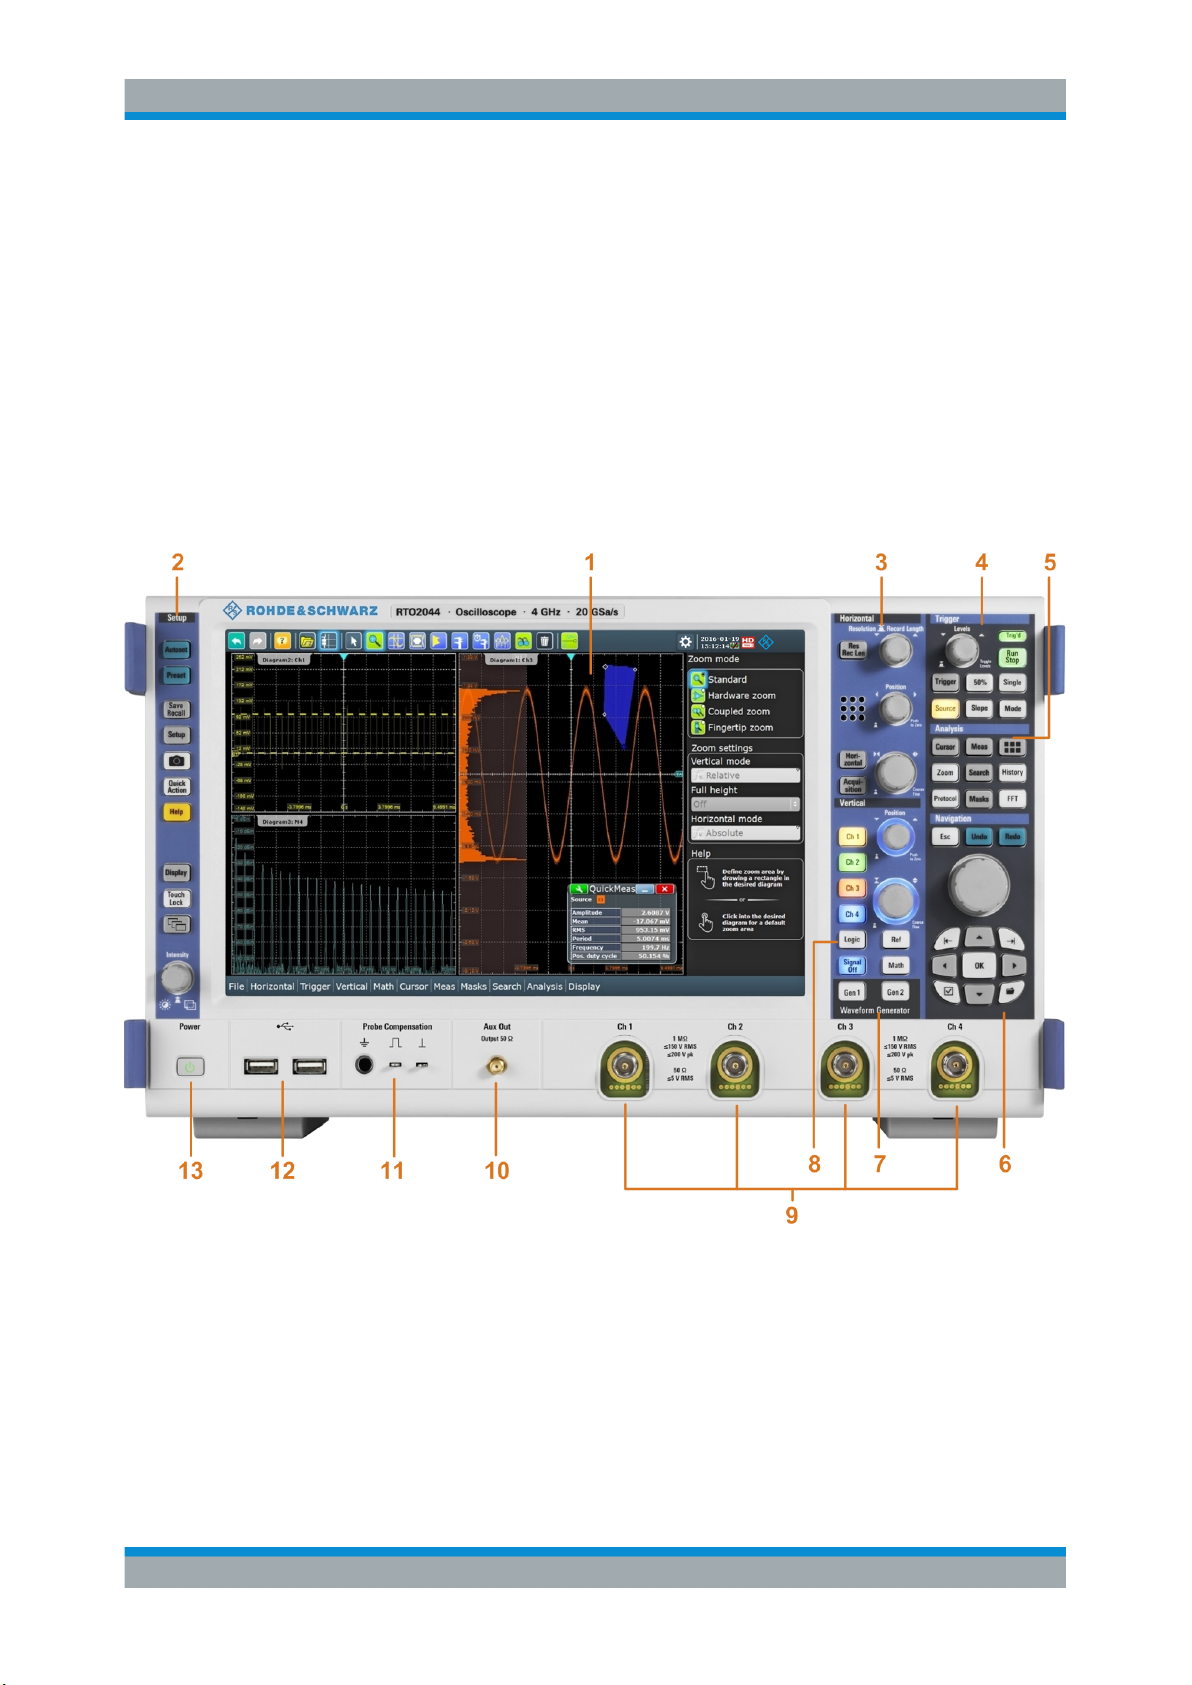
The front panel of the R&S RTO is shown in Figure 3-1. The function keys are grouped
in functional blocks to the left and the right of the touchscreen. Below the screen, various connectors are located.
Figure 3-1: Front panel of R&S RTO2044 with 4 input channels
1 = Touchscreen
2 = [Setup] controls
3 = [Horizontal] controls
4 = [Trigger] controls
5 = [Analysis] keys
6 = [Navigation] controls
7 = [Waveform Generator] keys
8 = [Vertical] controls
19Getting Started 1332.9719.02 ─ 08
Page 20
R&S®RTO2000
3.1.1 Input Connectors
Instrument Tour
Front Panel
9 = Input channels
10 = [Aux Out] connector
11 = Connectors for probe compensation and grounding
12 = USB connectors
13 = [Power] key
Instrument damage caused by cleaning agents
Cleaning agents contain substances such as solvents (thinners, acetone, etc.), acids,
bases, or other substances. Solvents can damage the front panel labeling, plastic
parts, or screens, for example.
Never use cleaning agents to clean the outside of the instrument. Use a soft, dry, lintfree dust cloth instead.
The R&S RTO has two or four channel inputs to connect the input signals using active
and passive probes.
The input connectors are provided with a special Rohde & Schwarz active probe interface, and they are BNC compatible. Thus, the instrument can automatically detect passive probes with standard BNC connector and active Rohde & Schwarz probes having
the Rohde & Schwarz probe interface.
The input impedance is selectable, the values are 50 Ω and 1 MΩ.
Risk of electrical shock or fire
Voltages higher than 30 V RMS or 42 V peak or 60 V DC are regarded as hazardous
contact voltages. When working with hazardous contact voltages, use appropriate protective measures to preclude direct contact with the measurement setup:
●
Use only insulated voltage probes, test leads and adapters.
●
Do not touch voltages higher than 30 V RMS or 42 V peak or 60 V DC.
20Getting Started 1332.9719.02 ─ 08
Page 21
R&S®RTO2000
Instrument Tour
Rear Panel
Risk of injury and instrument damage
The instrument is not rated for any measurement category.
Make sure that the input voltage on channel inputs does not exceed 200 V peak,
150 V RMS at 1 MΩ input impedance and 5 V RMS at 50 Ω input impedance.
Transient overvoltages must not exceed 200 V peak.
When performing measurements in circuits with transient overvoltages of category II,
III or IV circuits, make sure that no such overvoltages reach the R&S RTO input.
Therefore, use only probes that comply with DIN EN 61010-031. When performing
measurements in category II, III or IV circuits, it is mandatory to insert a probe that
appropriately reduces the voltage so that no transient overvoltages higher than
200 V peak are applied to the instrument. For detailed information, refer to the documentation and safety information of the probe manufacturer.
Explanation: According to section AA.2.4 of EN 61010-2-030, measuring circuits without any measurement category are intended for measurements on circuits which are
not connected to the mains system.
3.1.2 Other Front Panel Connectors
Besides the input connectors, the instrument has USB connectors and probe compensation connectors at the front panel.
[USB]
Two USB type A connectors that comply with standard USB 2.0. They are used to connect devices like keyboard, mouse, printer and USB flash drive.
Note: Electromagnetic interference (EMI) can affect the measurement results. To avoid
any impact, do not use USB connecting cables exceeding 1 m.
Probe Compensation
Probe compensation terminal to support adjustment of passive probes to the oscilloscope channel.
Protective earth conductor for grounding the instrument.
Square wave signal for probe compensation with 1 kHz and 1 Vpp.
Ground connector for probes.
[Aux Out]
Output of the internal calibration signal, if the signal is configured to external destination.
3.2 Rear Panel
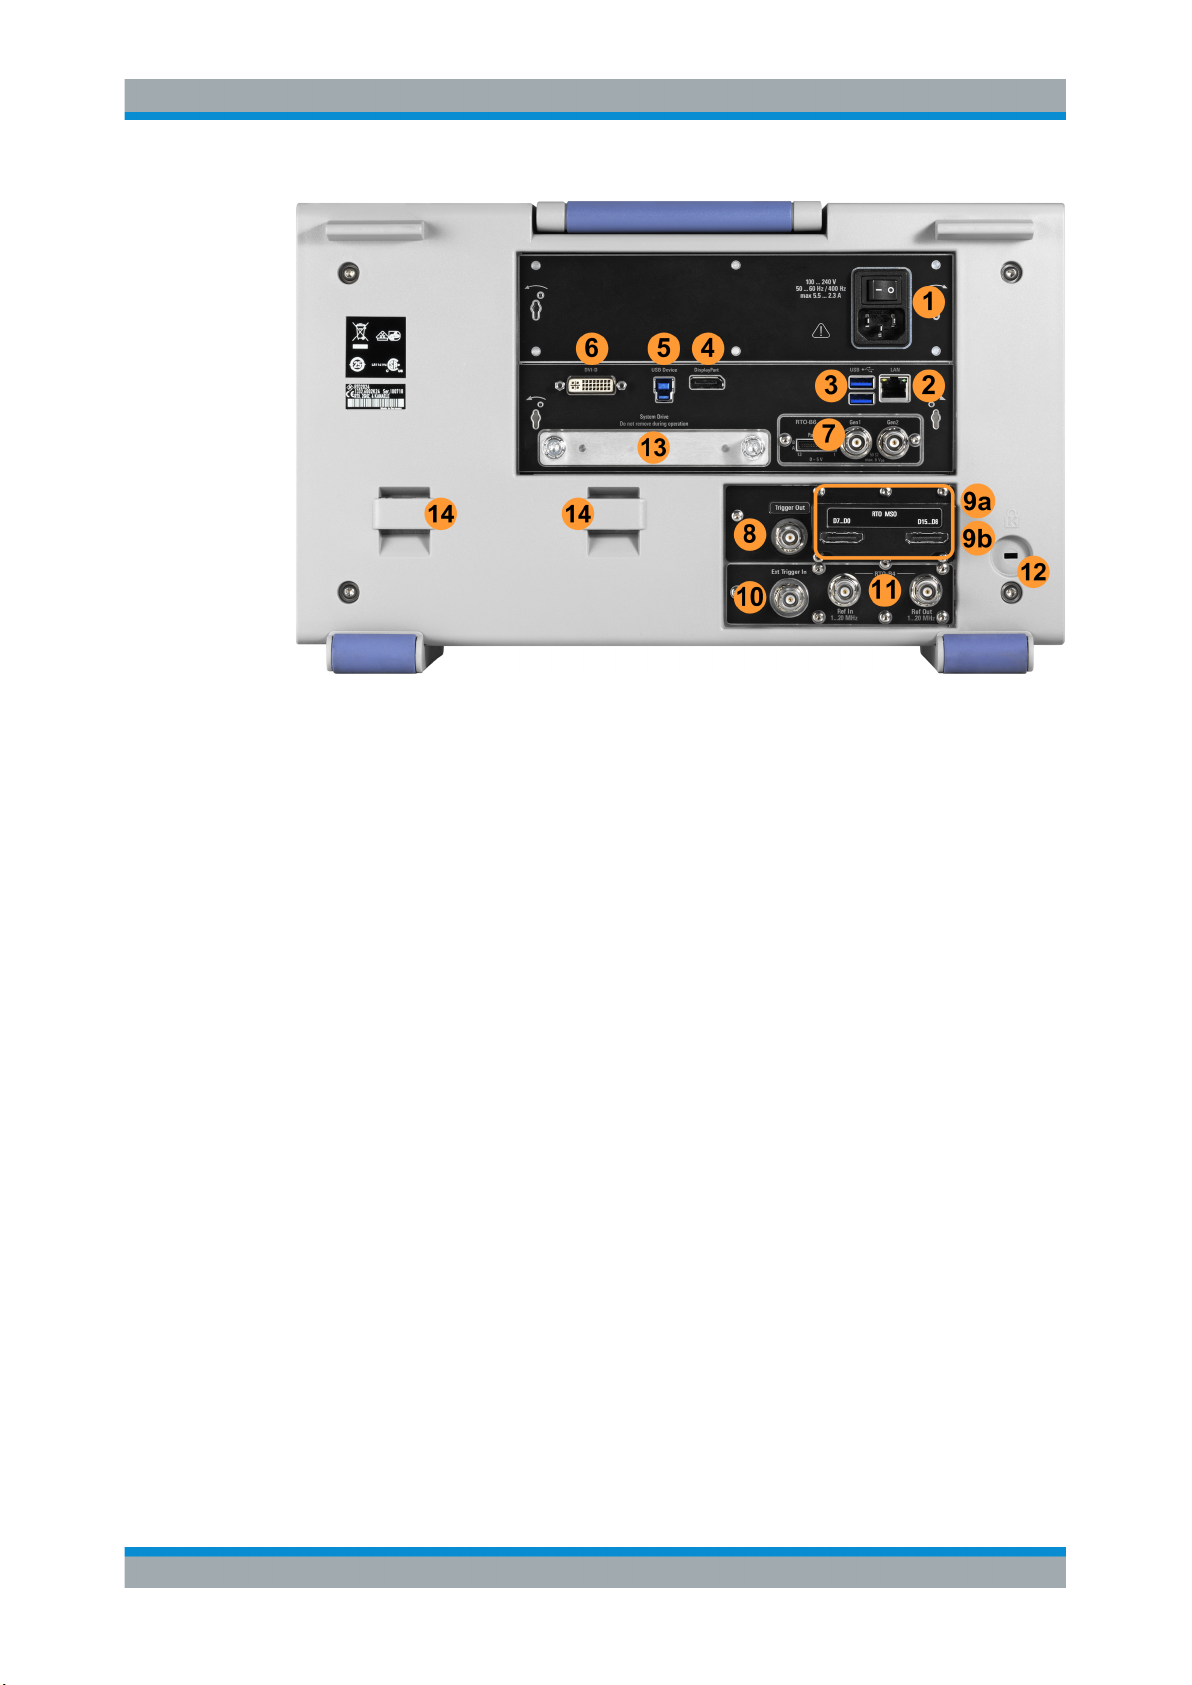
Figure 3-2 shows the rear panel of the R&S RTO.
21Getting Started 1332.9719.02 ─ 08
Page 22
R&S®RTO2000
Instrument Tour
Rear Panel
Figure 3-2: Rear panel of R&S RTO
1 = AC power supply connector and main power switch
2 = LAN connector
3 = USB connectors, type A
4 = DisplayPort connector
5 = USB Device connector, type B
6 = DVI-D connector for external monitor
7 = Optional connectors for waveform and pattern generator (option R&S RTO-B6)
8 = External trigger output
9a = Optional connectors for digital probe (Mixed Signal Option R&S RTO-B1, shown in figure)
9b = Optional GPIB connector (option R&S RTO-B10, not shown in figure)
10 = External trigger input
11 = Optional OCXO with input and output of the reference signal (option R&S RTO-B4)
12 = Kensington lock slot to secure the instrument against theft
13 = Optional exchangeable hard disk: solid state disk (option R&S RTO-B18) or standard hard disk drive
(option R&S RTO-B19)
14 = Lugs to attach the accessory bag
AC power supply connector and main power switch
Connection to the AC power line. The R&S RTO can be used with different AC power
voltages and adapts itself automatically to it. The nominal voltage and frequency
ranges are displayed on the rear panel and quoted in the data sheet.
If grounding is not ensured by the mains system, ground the oscilloscope using the
protective earth conductor on the front panel and an appropriate cable.
The AC main power switch also interrupts the power supply of the OCXO (option
OCXO Reference Frequency, R&S RTO-B4).
When you power up the instrument, be sure to comply with the warm-up phase specified in the data sheet before you start measurements.
22Getting Started 1332.9719.02 ─ 08
Page 23

R&S®RTO2000
Instrument Tour
Rear Panel
USB
Two USB type A connectors that comply with standard USB 3.0. They are used to connect devices like keyboard, mouse, printer, and flash drive to store and reload instrument settings and measurement data.
Note: Electromagnetic interference (EMI) can affect the measurement results. To avoid
any impact, do not use USB connecting cables exceeding 1 m.
LAN
8-pin RJ-45 connector used to connect the instrument to a Local Area Network (LAN).
It supports up to 1000 Mbit/s (10/100/1000BASE-T Ethernet).
USB Device
USB 3.0 interface of type B (device USB), to be used for remote control of the instrument.
DisplayPort
DisplayPort connector for an external monitor or projector. It supports DisplayPort version 1.1a.
DVI-D
Digital connector for an external monitor or projector. The monitor shows the complete
content of the instrument's screen.
[Ext Trigger In]
The BNC connector for external trigger input is used to control the measurement by an
external signal. The input impedance can be selected in the trigger configuration, the
values are 50 Ω and 1 MΩ. The trigger level can be set from -5 V to 5 V. The maximum
input voltage is 30 V RMS at 1 MΩ input impedance and 7 V RMS at 50 Ω input impedance.
Trigger Out
The BNC connector for external trigger output is used to provide the internal trigger
signal of the oscilloscope to trigger other instruments for synchronized measurements.
When a trigger occurs, the R&S RTO creates a pulse of 5 V with a source impedance
of 50 Ω and delivers it to the external trigger output. The instrument can also send the
pulse on mask test violation or violation of measurement limits and margins.
If the connector is terminated with 50 Ω, the signal level is 2.5 V (50 mA). With 1 MΩ
termination, the level is 5 V. A short-circuit of the connector to ground creates current
of 100 mA.
To enable the trigger out signal, select "Trigger" menu > "Ctrl/Action". Here you also
adjust polarity, delay, and length of the pulse. The default is a positive pulse of 100 ns.
The minimum delay is 800 ns.
[RTO MSO]
Mixed Signal Option, input for digital signals (parallel buses). The hardware module
and logic probe come with option R&S RTO-B1. The module provides connectors for
two logical probes with 8 digital channels each (D0 to D7 and D8 to D15).
23Getting Started 1332.9719.02 ─ 08
Page 24

R&S®RTO2000
Instrument Tour
Keys and Controls
The maximum input voltage is 40 V peak at 100 kΩ input impedance. The maximum
input frequency for a signal with the minimum input voltage swing of 500 mV (Vpp) is
400 MHz. For detailed specifications, refer to the data sheet.
[RTO-B4]
Optional [Ref In] (left) and [Ref Out] (right) connectors coming with option R&S RTOB4 OCXO 10 MHz.
The input frequency ranges from 1 MHz to 20 MHz in 1 MHz steps. The input impedance is 50 Ω.
The output frequency of the OCXO is 10 MHz, the impedance is 50 Ω. For detailed
specifications, refer to the data sheet.
[RTO-B6]
Optional connectors for the waveform generator (option R&S RTO-B6). For detailed
specifications, refer to the data sheet.
[Gen1, Gen2]
[PattGen]
BNC connectors
Connector for the pattern generator
RTO-B10
Optional GBIP connector coming with option R&S RTO-B10 GBIP interface. For
detailed specifications, refer to the data sheet.
3.3 Keys and Controls
3.3.1 Power Key
The [Power] key is located on the lower left corner of the front panel. It starts up and
shuts down the instrument's software.
The light of the key shows the instrument state:
●
Orange: standby, the main power switch is on, the software is shut down.
●
Green: The instrument is ready for operation.
3.3.2 Setup Controls
Setup keys set the instrument to a defined state, change basic settings, and provide
print and help functions. The intensity rotary knob adjusts the display contrast for several display elements.
[Autoset]
The instrument analyzes the enabled channel signals, and adjusts appropriate horizontal, vertical, and trigger settings to display stable waveforms.
24Getting Started 1332.9719.02 ─ 08
Page 25
R&S®RTO2000
Instrument Tour
Keys and Controls
[Preset]
Resets the instrument to a default state. All measurements, mask tests, zoom, and
most individual settings are deleted, and all channels except for channel 1 are disabled. You can define preset configurations and save them to a file. The [Preset] key
can be configured to set either factory defaults or a user-defined preset configuration.
[Save Recall]
Opens and closes the "File" dialog box, where you can:
●
Save instrument settings (user settings)
●
Load instrument settings which were saved before
●
Save waveform data and measurement results
●
Define a naming pattern for autonaming of files
[Setup]
Opens and closes the "Setup" dialog box, where you can:
●
Access Windows configuration and install firmware updates
●
Configure the touchscreen
●
Check and install option keys for software options
●
Check availability of hardware options
●
Configure remote settings, LAN settings, and GPIB
Camera
Performs the action that is assigned to the key in "File" menu > "Frontpanel Setup" >
"Hardkeys". By default, the key saves a screenshot of the waveform display.
[Help]
Opens the appropriate help topic for the active tab. If no dialog box is open, the contents page of the help appears.
[Touch Lock]
Locks the touchscreen to prevent unintended use. When the touchscreen is off, the
key is illuminated. Press again to unlock the touchscreen.
[Display]
Opens and closes the "Display" dialog box to configure the appearance of the waveforms, the diagram layout, color tables, and the XY-diagram. You can also assign name
labels to the waveforms.
[Intensity]
Adjusts the intensity of the waveforms on the screen, or the background transparency
of dialog boxes, or the transparency of result boxes. If a dialog box is open, turning the
knob changes the transparency of dialog boxes. If a result box is open, the transparency of result boxes is changed. Otherwise the waveform intensity is adjusted. Press
the knob to toggle between the three settings. The controlled parameter and its value
are shown in the input box in the lower right corner of the screen.
25Getting Started 1332.9719.02 ─ 08
Page 26
R&S®RTO2000
3.3.3 Horizontal Controls
Instrument Tour
Keys and Controls
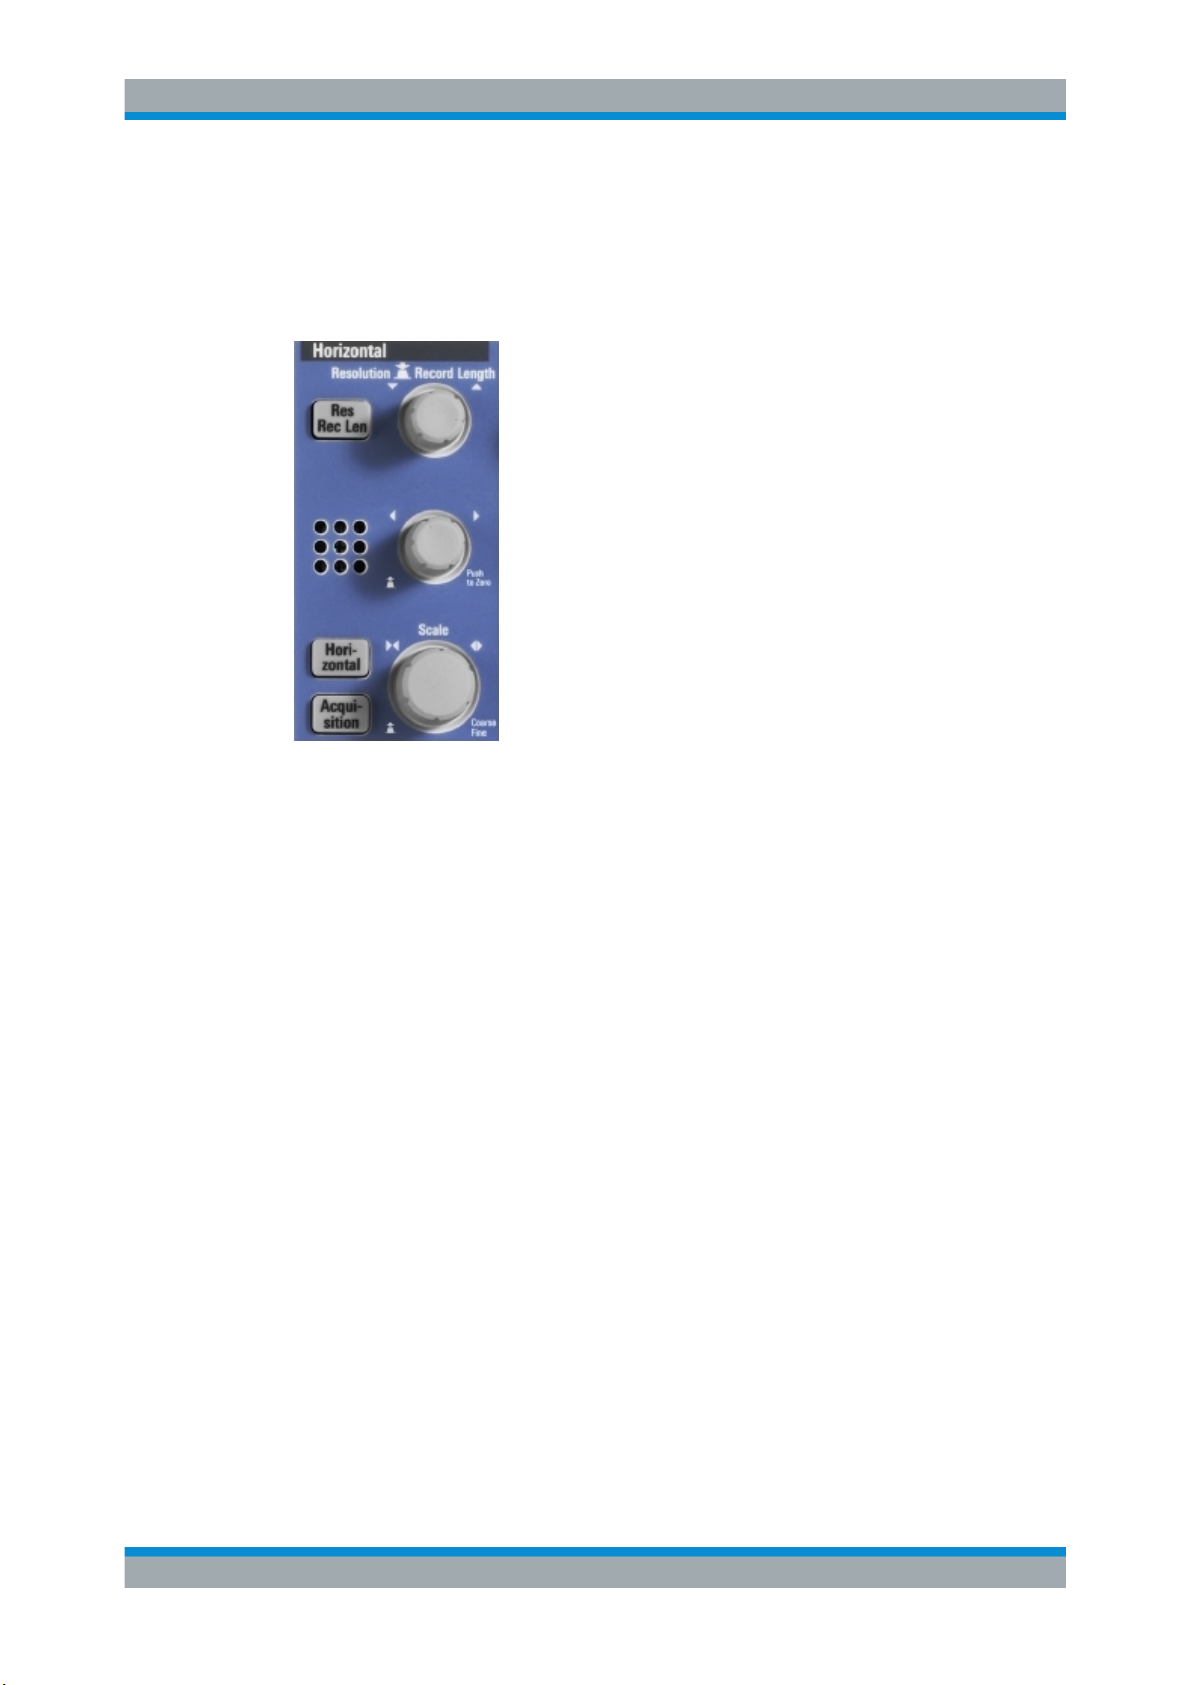
The keys and rotary knobs in the Horizontal functional block adjust the acquisition settings and horizontal parameters. These settings are effective for all channel waveforms.
[Res Rec Len], [Horizontal]
Open and close the "Setup" tab in the "Horizontal" dialog box, where you can:
●
Adjust the time scale, and acquisition time
●
Adjust the horizontal position, and reference point
●
Adjust the resolution and the record length
●
Enable the roll mode
[Acquisition]
Opens and closes the "Acquisition" tab in the "Horizontal" dialog box, where you can
define the acquisition processing (acquisition mode and waveform arithmetic).
[Resolution / Record Length]
The rotary knob changes the resolution or the record length. Press the knob to toggle
the setting. The controlled parameter and its value are shown in the input box in the
lower right corner of the screen.
For resolution, turn clockwise to increase the resolution: the time between two acquisition points gets shorter. Record length and sample rate increase while the acquisition
time remains constant.
For record length, turn clockwise to increase the record length, and the resolution
increases too - the time between to acquisition points gets shorter.
[Position]
The rotary knob changes the horizontal position of the waveform or the position of the
reference point on the screen.
26Getting Started 1332.9719.02 ─ 08
Page 27
R&S®RTO2000
Instrument Tour
Keys and Controls
You can select if the knob changes the position or the reference point in "File" menu >
"Frontpanel Setup" > "Knobs". To set the value to zero, press the knob. The current
value is shown in the input box in the lower right corner of the screen.
"Horizontal position" defines the time distance of the reference point from the zero
point of the diagram. Turn clockwise to move the waveform to the right.
"Reference point" defines the position of the reference point on the screen. Turn clockwise to move it to the right. The reference point marks the rescaling center of the time
scale. It is indicated by a gray triangle outline at the top of the diagram. If you modify
the time scale, the reference point remains fixed on the screen, and the scale is
stretched or compressed to both sides of the reference point.
[Scale]
The rotary knob adjusts the time scale for all signals. The time scale is also known as
timebase.
Turn clockwise to stretch the waveforms. Doing so, the scale value time/div decreases.
Press the knob to toggle between coarse and fine scale adjustment.
3.3.4 Vertical Controls
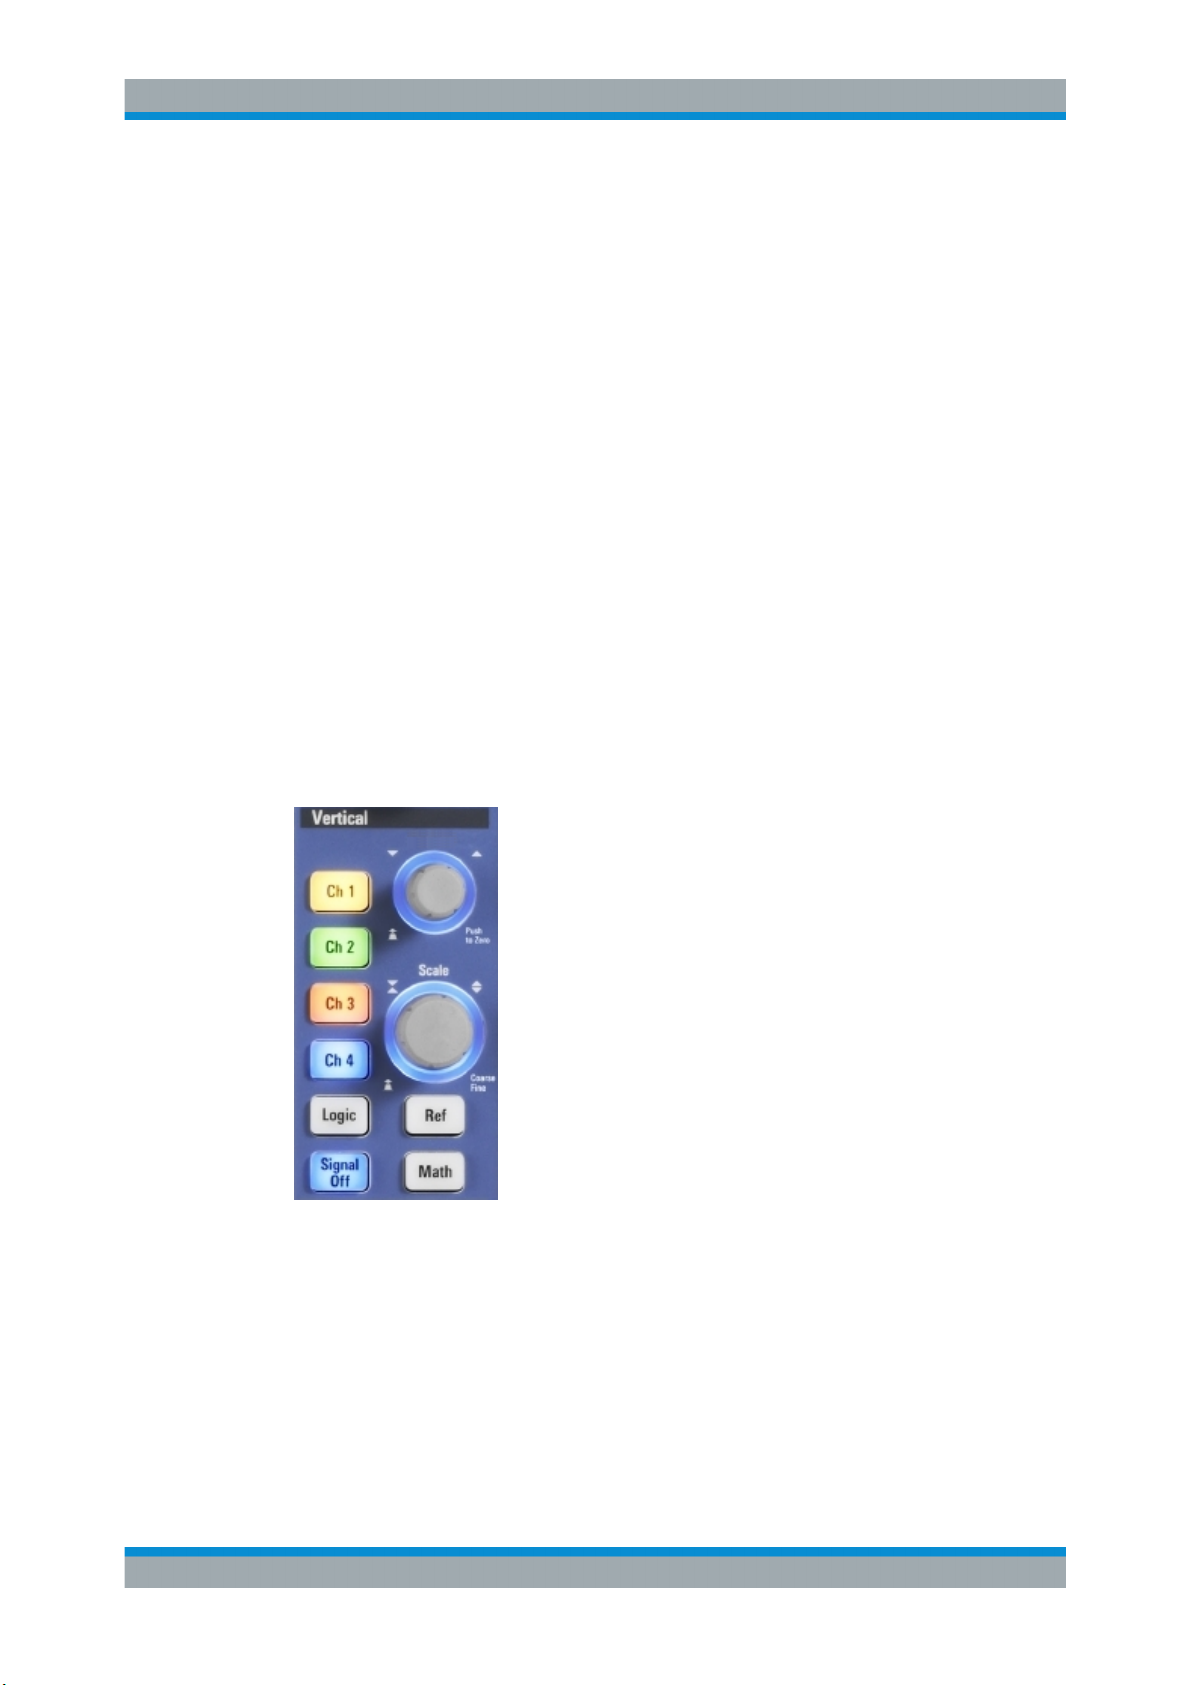
The keys and knobs in the Vertical functional block select a signal and adjust the vertical scale and position of the selected signal.
[Ch <n>]
Turns on, selects, and configures a channel. If the channel is active, the key lights up
in the corresponding channel color .
The effect of the keypress depends on state of the channel:
●
If channel is off: Pressing the key turns on the channel and selects it.
●
If the channel is on, but not selected: Pressing the key selects the channel waveform.
●
If the waveform is selected: Pressing the key opens the "Vertical" dialog box for the
appropriate channel.
27Getting Started 1332.9719.02 ─ 08
Page 28

R&S®RTO2000
Instrument Tour
Keys and Controls
The vertical rotary knobs are focused on the selected waveform. They are illuminated
in the color of the selected waveform.
[Logic]
Opens the dialog box for configuration of parallel buses and digital channels. The key
lights up if you enable at least one parallel bus. You can switch off the selected bus
using the [Signal Off] key.
[Ref]
Opens the "Reference" dialog box, where you can configure and display reference
waveforms. Press the key repeatedly to switch the reference waveform.
If a reference waveform is selected, the vertical rotary knobs are illuminated in white or
light gray (default colors), depending on the selected waveform.
[Math]
Opens the "Math" dialog box, where you can configure the calculation of mathematical
waveforms using various mathematic operations on other waveforms. Press the key
repeatedly to switch the math waveform.
If a math waveform is selected, the vertical rotary knobs are illuminated in brown
(default color), the brightness of the color depends on the selected waveform.
[Position] (upper knob)
The upper rotary knob changes the vertical position or the offset of the selected waveform. The horizontal axis and the selected waveform are moved vertically. The knob
lights up in the color of the selected waveform.
You can select if the knob changes the position or the offset in "File" menu > "Frontpanel Setup" > "Knobs". To set the value to zero, press the knob. Turn clockwise to move
up the waveform. The current value is shown in the input box in the lower right corner
of the screen.
●
Position indicates the vertical location in divisions.
●
Offset moves the vertical center of the selected channel to the offset value.
[Scale]
This rotary knob adjusts the vertical scale for the selected waveform. The knob lights
up in the color of the selected waveform.
Turn clockwise to stretch the waveform. Doing so, the scale value V/div decreases.
Press the knob to toggle between coarse and fine scale adjustment.
[Signal Off]
Turns off the selected signal and selects the next channel, math, or reference waveform.
The key is illuminated in the color of the selected signal and changes the color according to the new selection.
28Getting Started 1332.9719.02 ─ 08
Page 29
R&S®RTO2000
3.3.5 Trigger Controls
Instrument Tour
Keys and Controls
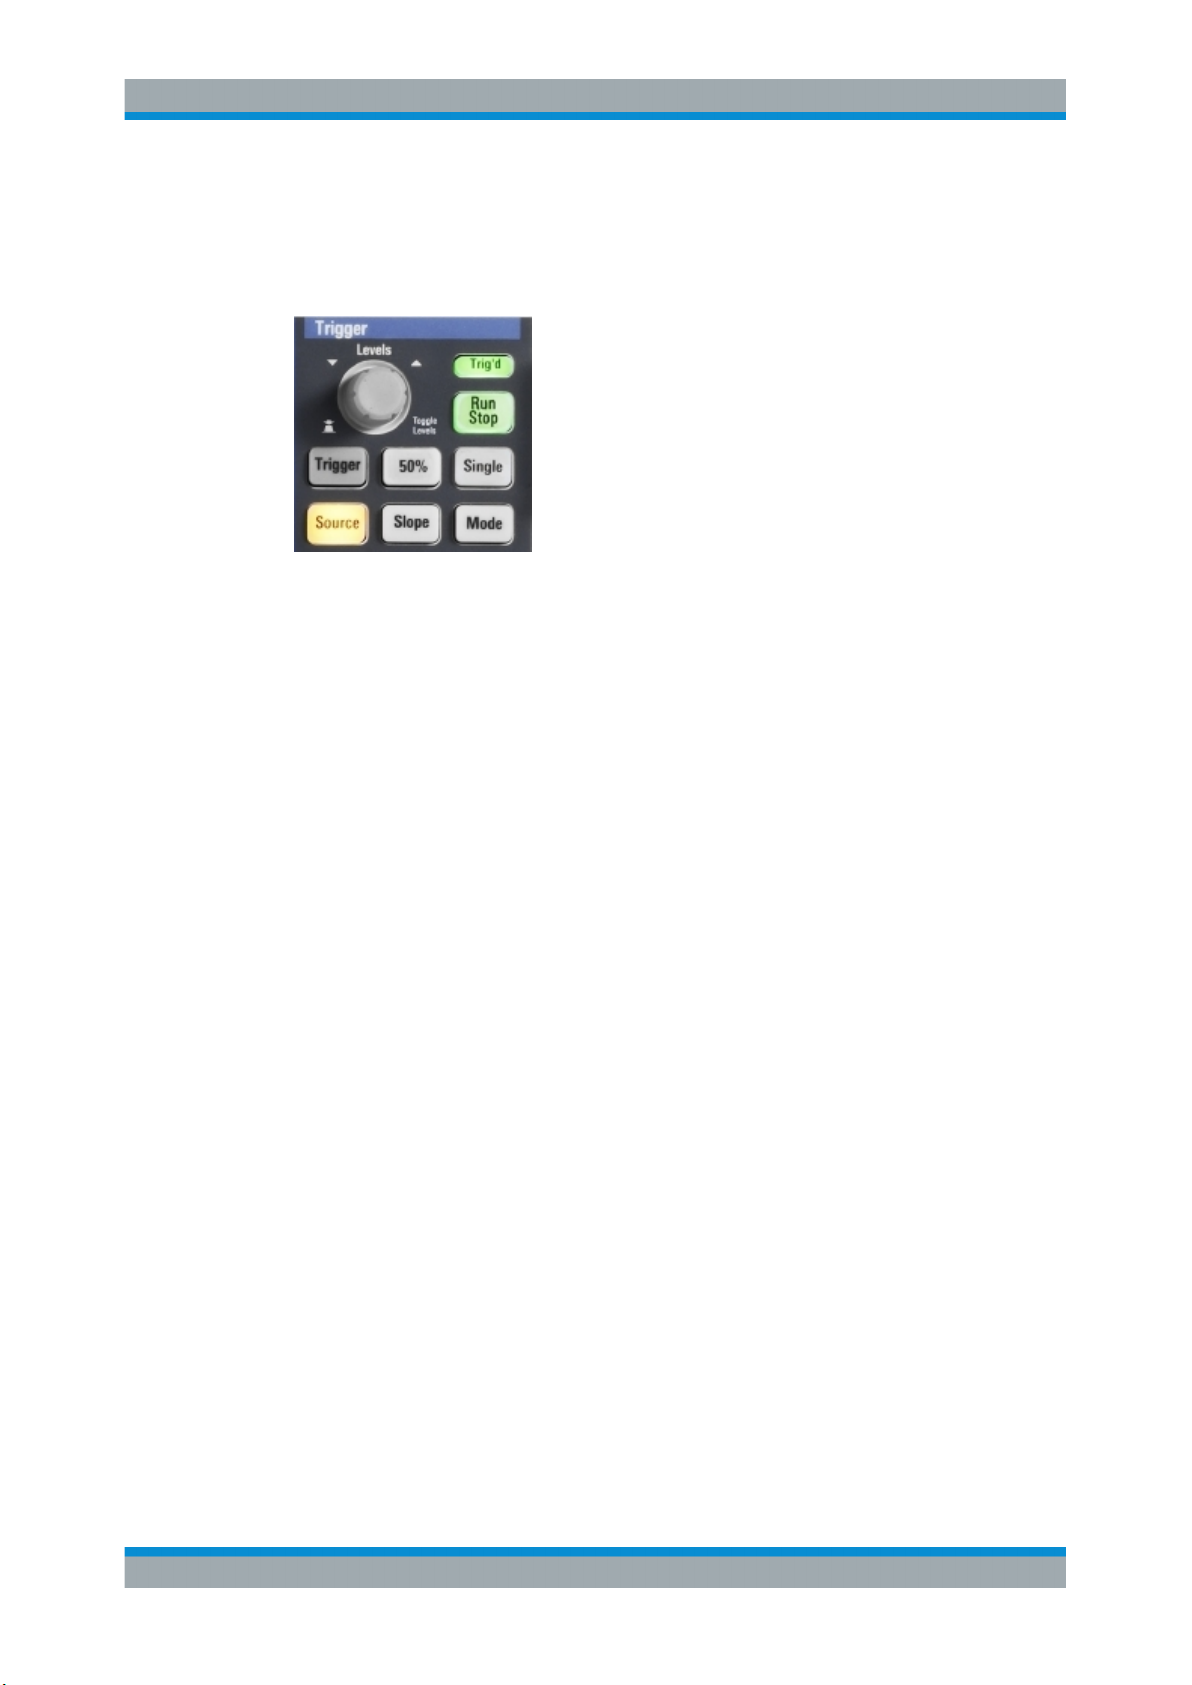
The keys and knob in the Trigger functional block adjust the trigger and start or stop
acquisition.
[Trigger]
Opens and closes the "Trigger" dialog box, where you can:
●
Select a trigger type and configure it.
●
Set general trigger parameters and control the acquisition run.
●
Qualify the trigger event with logic patterns.
●
Configure a sequence of subsequent trigger events.
●
Set up the zone trigger if option R&S RTO-K19 is installed.
[Levels]
The rotary knob sets the trigger level for all trigger types. Turn clockwise to move up
the trigger level. If the selected trigger type requires two trigger levels - upper and
lower level - press the knob to toggle between the two levels.
[Source]
Opens a dialog box where you can select the trigger source. Press the key again to
switch the source. The key lights up in the color of the selected trigger source.
[Slope]
Toggles the trigger slope or trigger polarity, dependent on the trigger type. The current
setting is shown on the trigger label, which is in the upper part of the sidebar.
[Mode]
Toggles the trigger mode between Auto and Normal. The current setting is shown on
the trigger label.
[Run Stop]
Starts and stops the continuous acquisition. A green light indicates a running acquisition. A red light shows that acquisition is stopped.
[Single]
Starts a defined number of acquisitions. A green light indicates a running acquisition. A
red light shows that acquisition is stopped. Press the key again to stop running acquisitions.
29Getting Started 1332.9719.02 ─ 08
Page 30
R&S®RTO2000
3.3.6 Analysis Keys
Instrument Tour
Keys and Controls
To set the number of acquisitions, press the [Trigger] key, select the "Ctrl/Action" tab,
and set "Average count (N-single count)".
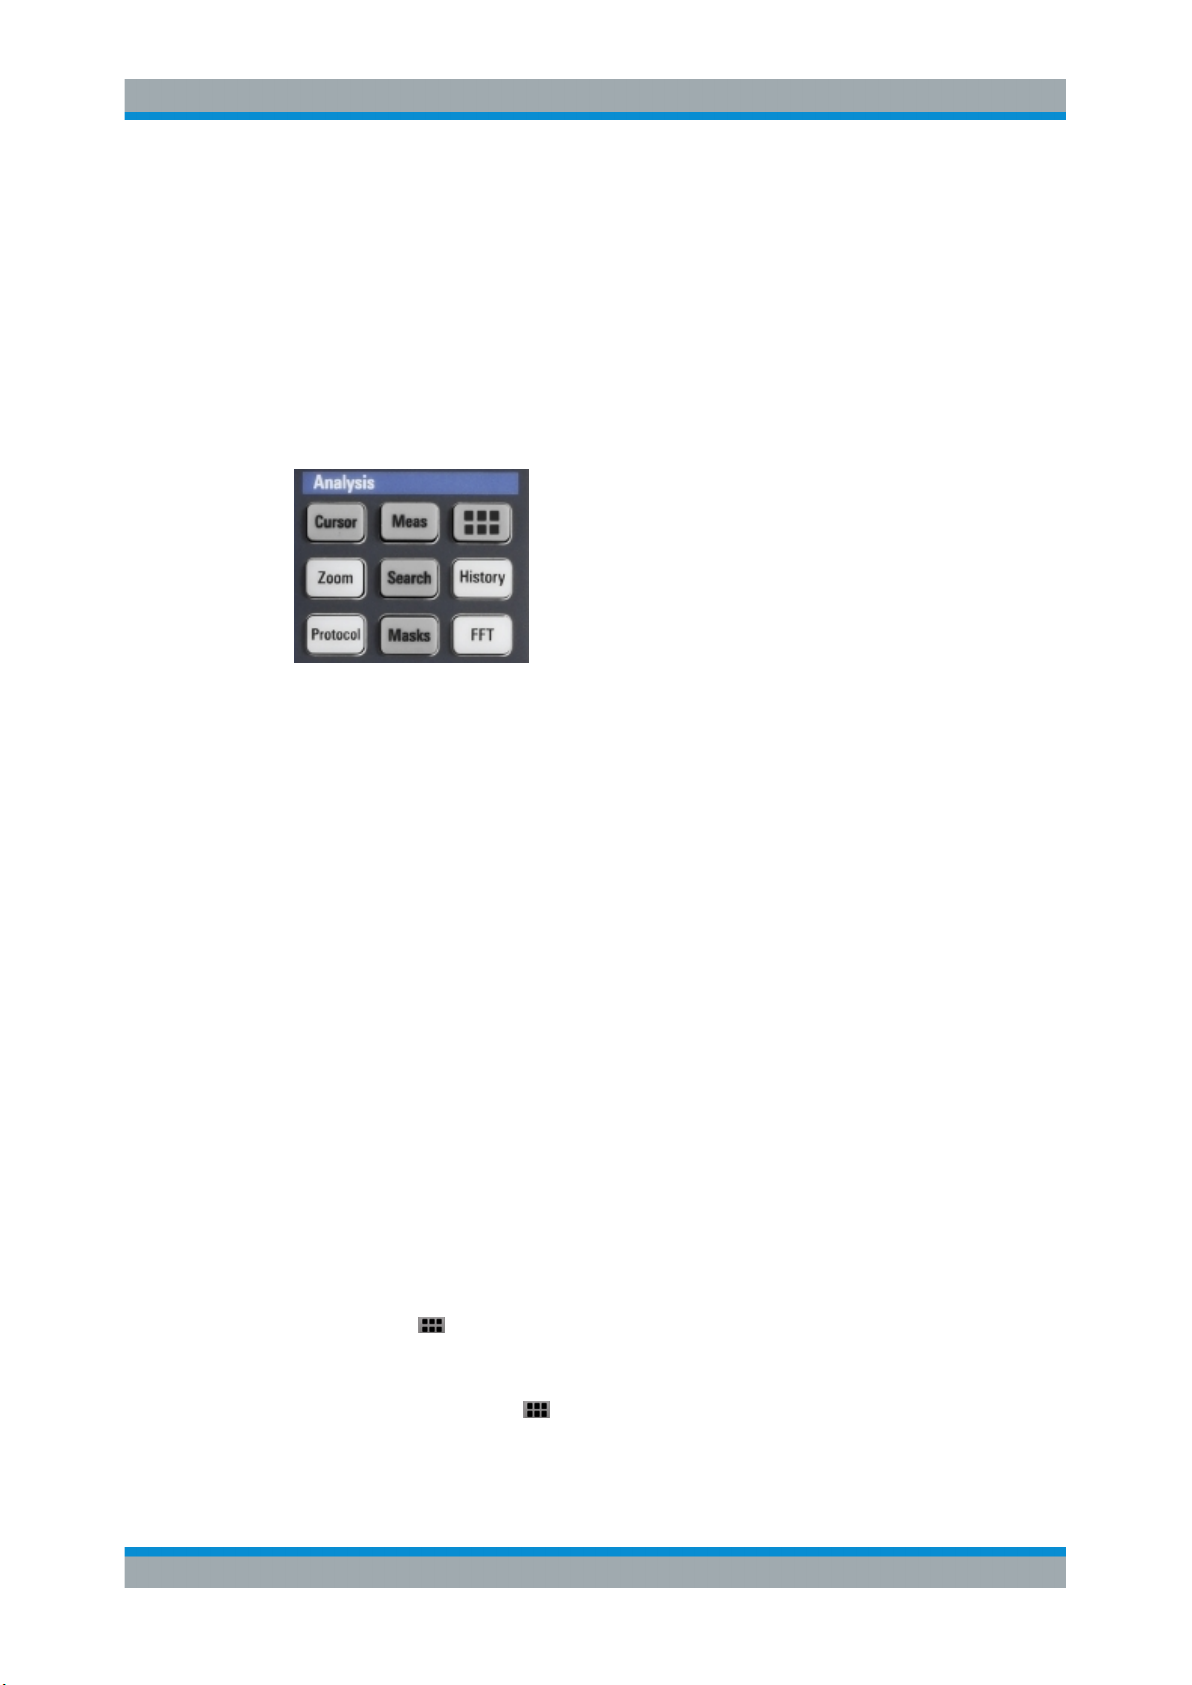
The keys in the Analysis functional block provide direct access to measurement and
analyzing functions. If you press [Cursor], [Zoom] or [Meas], the action starts on first
keypress, and a second keypress opens the corresponding dialog box. If you press
another function key, the dialog box opens.
[Cursor]
Displays vertical and horizontal cursors in the active diagram and opens the "Cursor
Results" box.
Cursors are markers which are placed at points of interest on a waveform. The instrument measures the cursor positions and delta values between parallel cursors.
If you press the key while a cursor measurement is enabled, the "Cursors" dialog box
opens.
In the "Cursors" dialog box, you can:
●
Configure up to 4 cursor sets
●
Define style and labels of the cursors
●
Connect the cursor to the waveform and couple the cursors
[Meas]
Starts the default automatic measurement for the active waveform and opens the
"Measurement" result box.
If you press the [Meas] key while a measurement is enabled, the "Measurements" dialog box is displayed, where you can:
●
Configure amplitude and time measurements, eye, spectrum, and histogram measurements
●
Configure gated measurement
●
Configure long term and statistic measurements
●
Configure actions to be executed if specified limits are exceeded
App Cockpit
Opens the "App Cockpit" dialog box, where you can start an application or analysis
function directly, without knowing its position in the menu or toolbar.
The "App Cockpit" button
on the left end of the menu has the same effect.
30Getting Started 1332.9719.02 ─ 08
Page 31

R&S®RTO2000
Instrument Tour
Keys and Controls
[Zoom]
Displays a zoom diagram for the active diagram. The key is illuminated if at least one
zoom is active. If you press the key while the zoom function is on, the "Zoom" dialog
box opens, where you can configure several zoom areas for detailed signal observation.
[Protocol]
Opens the "Protocol" dialog box which contains the configuration of serial buses and
the settings for decoding the signals.
The key lights up if the decoding of a serial bus is active. You can switch off the decoded bus using the [Signal Off] key.
[Search]
Opens and closes the "Search" dialog box, where you can:
●
Configure trigger events to be searched for
●
Limit the search by gating
●
Configure the presentation of search results
[Masks]
Opens and closes the "Masks" dialog box. Masks are used for error detection and
compliance tests of digital signals.
You can:
●
Configure masks and masks segments
●
Define mask test parameters
●
Configure actions triggered by mask violation
●
Configure the mask display
[History]
The sample memory contains several stored acquisitions before the current one, which
is shown in the display. Press the key to open the quick access "History" dialog box,
where you can view the stored acquisitions and use them for further analysis. Press
the key again to open the main "History" dialog box with more settings and information.
The key is illuminated as long as a history acquisition or replay is displayed.
FFT
Opens and closes the FFT setup.
The key lights up if an FFT is active. You can switch off the FFT math waveform using
the [Signal Off] key.
3.3.7 Navigation Controls
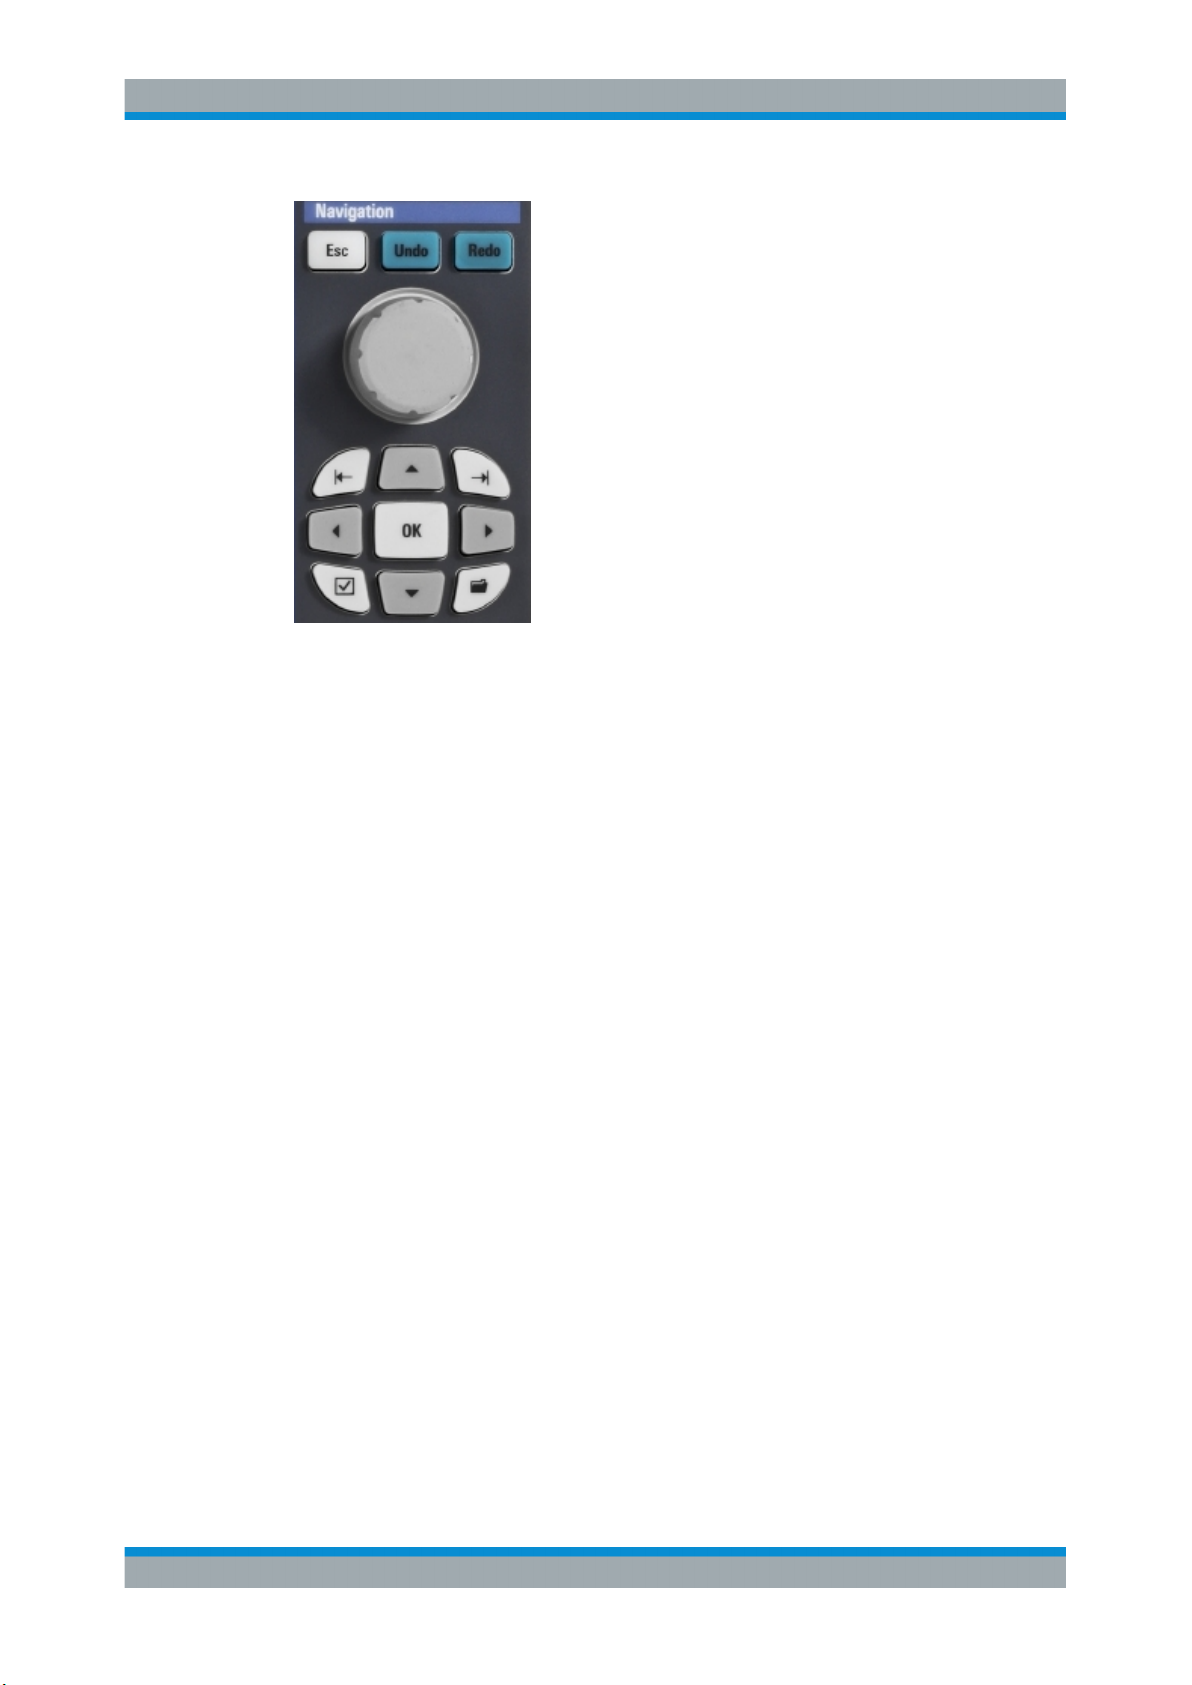
The rotary knob and the navigation keys provide an alternative way to navigate in dialog boxes and to enter numeric data.
See also: Chapter 5.7, "Using Dialog Boxes", on page 92
31Getting Started 1332.9719.02 ─ 08
Page 32
R&S®RTO2000
Instrument Tour
Keys and Controls
Navigation rotary knob
The navigation knob has various functions:
●
In numeric entry fields: turn to increase or decrease the value.
●
In tables: press to activate the edit mode, turn clockwise to increase the value or
turn counterclockwise to decrease it, and press to enter the value and move to the
next cell.
●
To set cursor positions, histogram areas, and mask points in input boxes: press to
toggle the parameter, turn clockwise to increase the value or turn counterclockwise
to decrease it.
●
To move zoom area, cursor line, or gate in diagrams: Turn to move the element
that has the focus, and press to toggle the focus.
[Esc]
Closes a dialog box or input box.
[Undo]
Reverses the last setting actions step by step. Undo is not possible after load and
recall actions, and after creating a reference waveform.
[Redo]
Recovers the undo steps in reverse order.
[OK]
The [OK] key has various functions:
●
In dialog boxes and opened selection lists: the key applies the selected value.
●
In tables: the key activates the edit mode. If the table cell is in edit mode, the key
confirms the value, quits the edit mode and moves to the next cell.
Field left, Field right
In dialog boxes and tables, the keys move the focus.
In diagrams, they switch the focus between zoom areas, cursor lines, and gates.
32Getting Started 1332.9719.02 ─ 08
Page 33

R&S®RTO2000
Instrument Tour
Keys and Controls
Checkmark [☑]
The checkmark key [☑] has different functions depending on the focus:
●
In usual dialog box: if the focus is on a selection list, the key opens the list and
applies the selected value.
●
In tables: activates the edit mode.
Tab
The tab key has various functions:
●
In dialog boxes with only horizontal tabs, the key switches the horizontal tabs.
●
In dialog boxes with horizontal and vertical tabs, the key switches the tabthat has
the focus.
●
In a table or diagram, the key moves the focus in the same way as the [▶] key.
Up arrow [▲], Down arrow [▼]
The up and down arrow keys have the following effects:
●
In numeric edit fields: increase or decrease the parameter value.
●
In tables: scroll vertically through the rows.
●
In dialog boxes, for option buttons in a column: select an option. In an open selection list, the keys scroll the list.
Left arrow [◀], Right arrow [▶]
The left and right arrow keys have the following effects:
●
In edit fields: move the cursor.
●
In tables: scroll horizontally through the columns.
●
In dialog boxes, for option buttons in a row: select an option.
33Getting Started 1332.9719.02 ─ 08
Page 34

R&S®RTO2000
Instrument Tour
Keys and Controls
34Getting Started 1332.9719.02 ─ 08
Page 35
R&S®RTO2000
4 Trying Out the Instrument
Trying Out the Instrument
Displaying a Basic Signal
This chapter introduces the most important functions and settings of the R&S RTO step
by step. The complete description of the functionality and its usage is given in the
"User Manual". Basic instrument usage is described in Chapter 5, "Operating the
Instrument", on page 73.
Prerequisites
●
The instrument is set up, connected to the mains system, and started up as described in Chapter 2, "Preparing for Use", on page 11.
●
A probe is available.
For these first measurements, you use the internal calibration signal, so you do not
need any additional signal source or instruments. Try out the following:
● Displaying a Basic Signal........................................................................................35
● Acquiring Data.........................................................................................................37
● Organizing the Display............................................................................................38
● Changing the Waveform Scaling and Position........................................................41
● Zooming into the Display.........................................................................................45
● Displaying the Waveform History............................................................................48
● Performing Basic Measurements............................................................................49
● Performing a Basic FFT Analysis............................................................................59
● Performing Mathematical Calculations....................................................................62
● Performing a Search............................................................................................... 63
● Performing a Mask Test.......................................................................................... 65
● Printing and Saving Screenshots............................................................................67
● Saving Data.............................................................................................................69
4.1 Displaying a Basic Signal
Displaying the input from a signal channel is simple and straightforward. Furthermore,
you get to know some basic trigger functions. The R&S RTO provides wide-ranging
trigger functions to find various signal anomalies, which are described in the instrument
help and in the "User Manual".
1. Press the [Preset] key on the front panel (in the [Setup] area on the left).
2. Connect the probe to the input connector [CH 1].
Connect the probe's ground connector to the right compensation pin
to the left pin .
The instrument recognizes the probe, and a signal is displayed in the diagram.
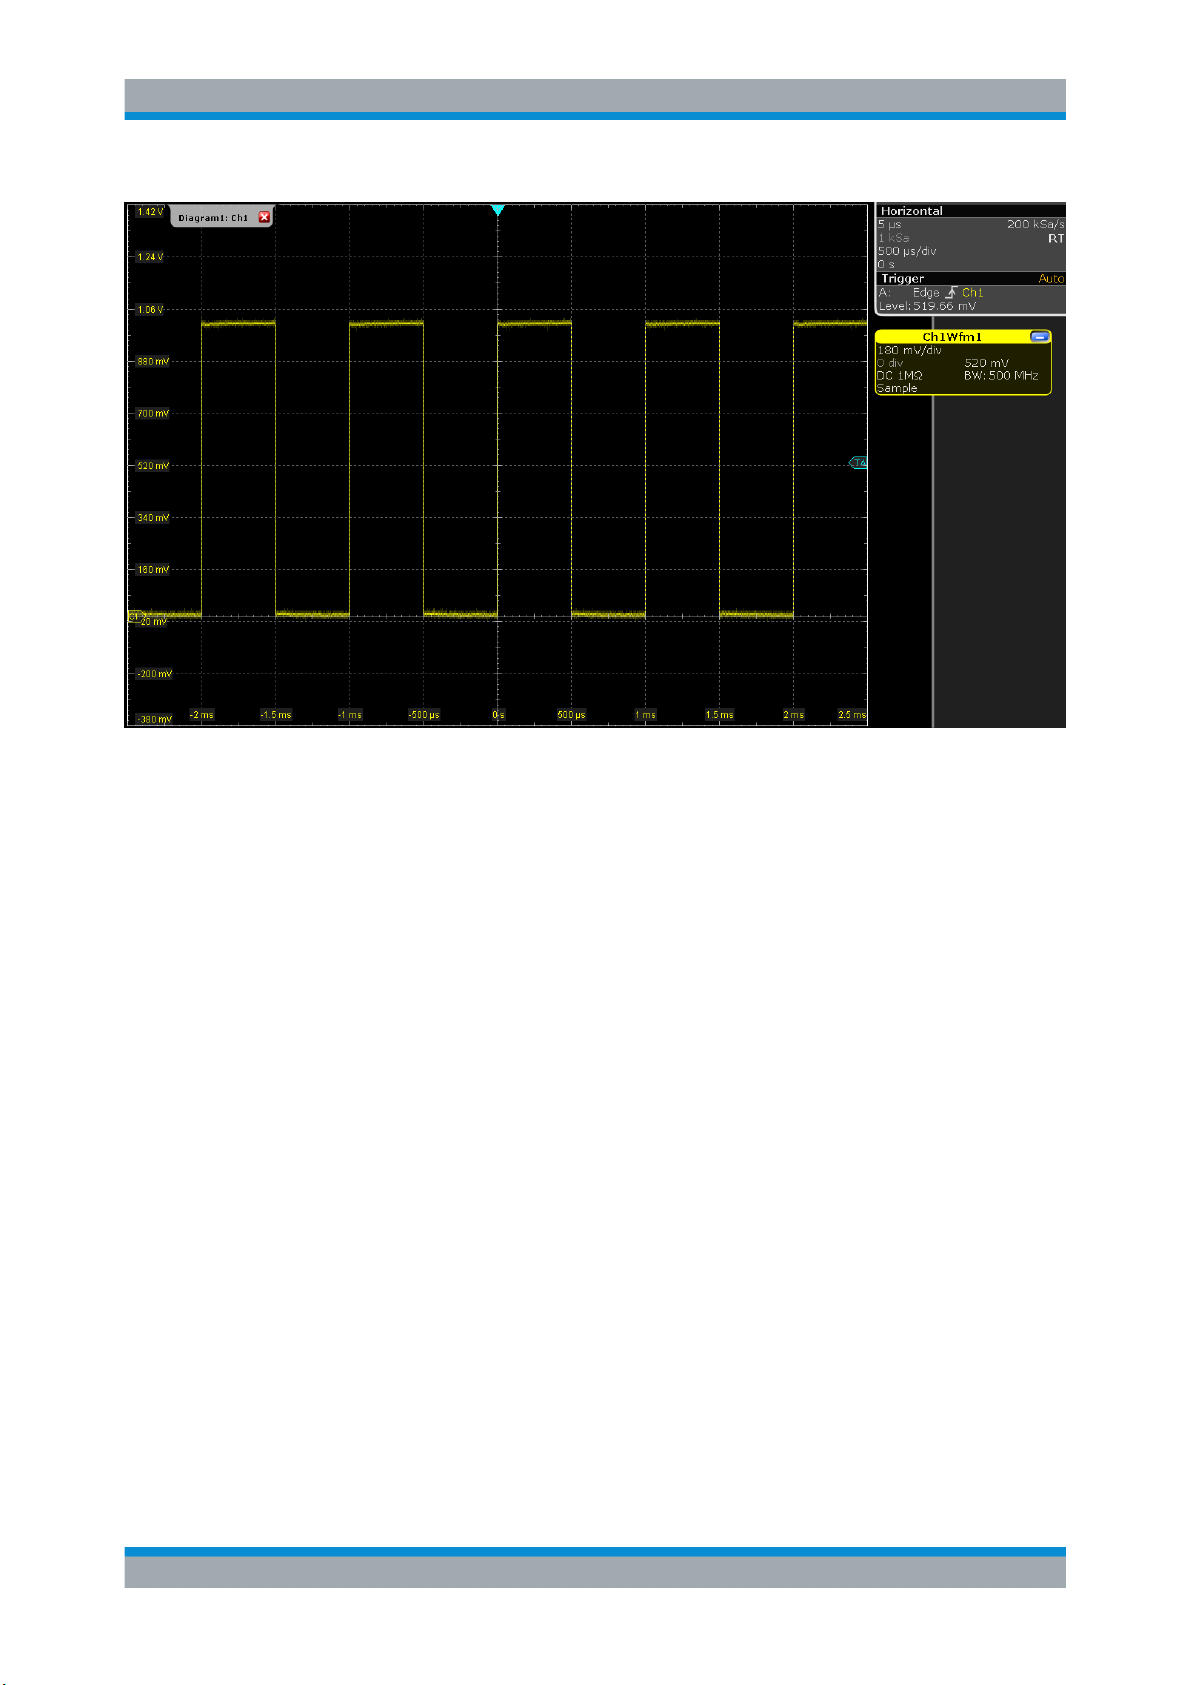
3. Press the [Autoset] key on the front panel (in the [Setup] area on the left).
Autoset finds appropriate horizontal and vertical scales and trigger conditions to
present a stable square waveform. The trigger is set to edge trigger on rising edge
with auto trigger mode.
, and the tip
35Getting Started 1332.9719.02 ─ 08
Page 36
R&S®RTO2000
Trying Out the Instrument
Displaying a Basic Signal
4. If necessary, compensate the passive probe as described in Chapter 6.4, "Adjust-
ing Passive Probes", on page 100.
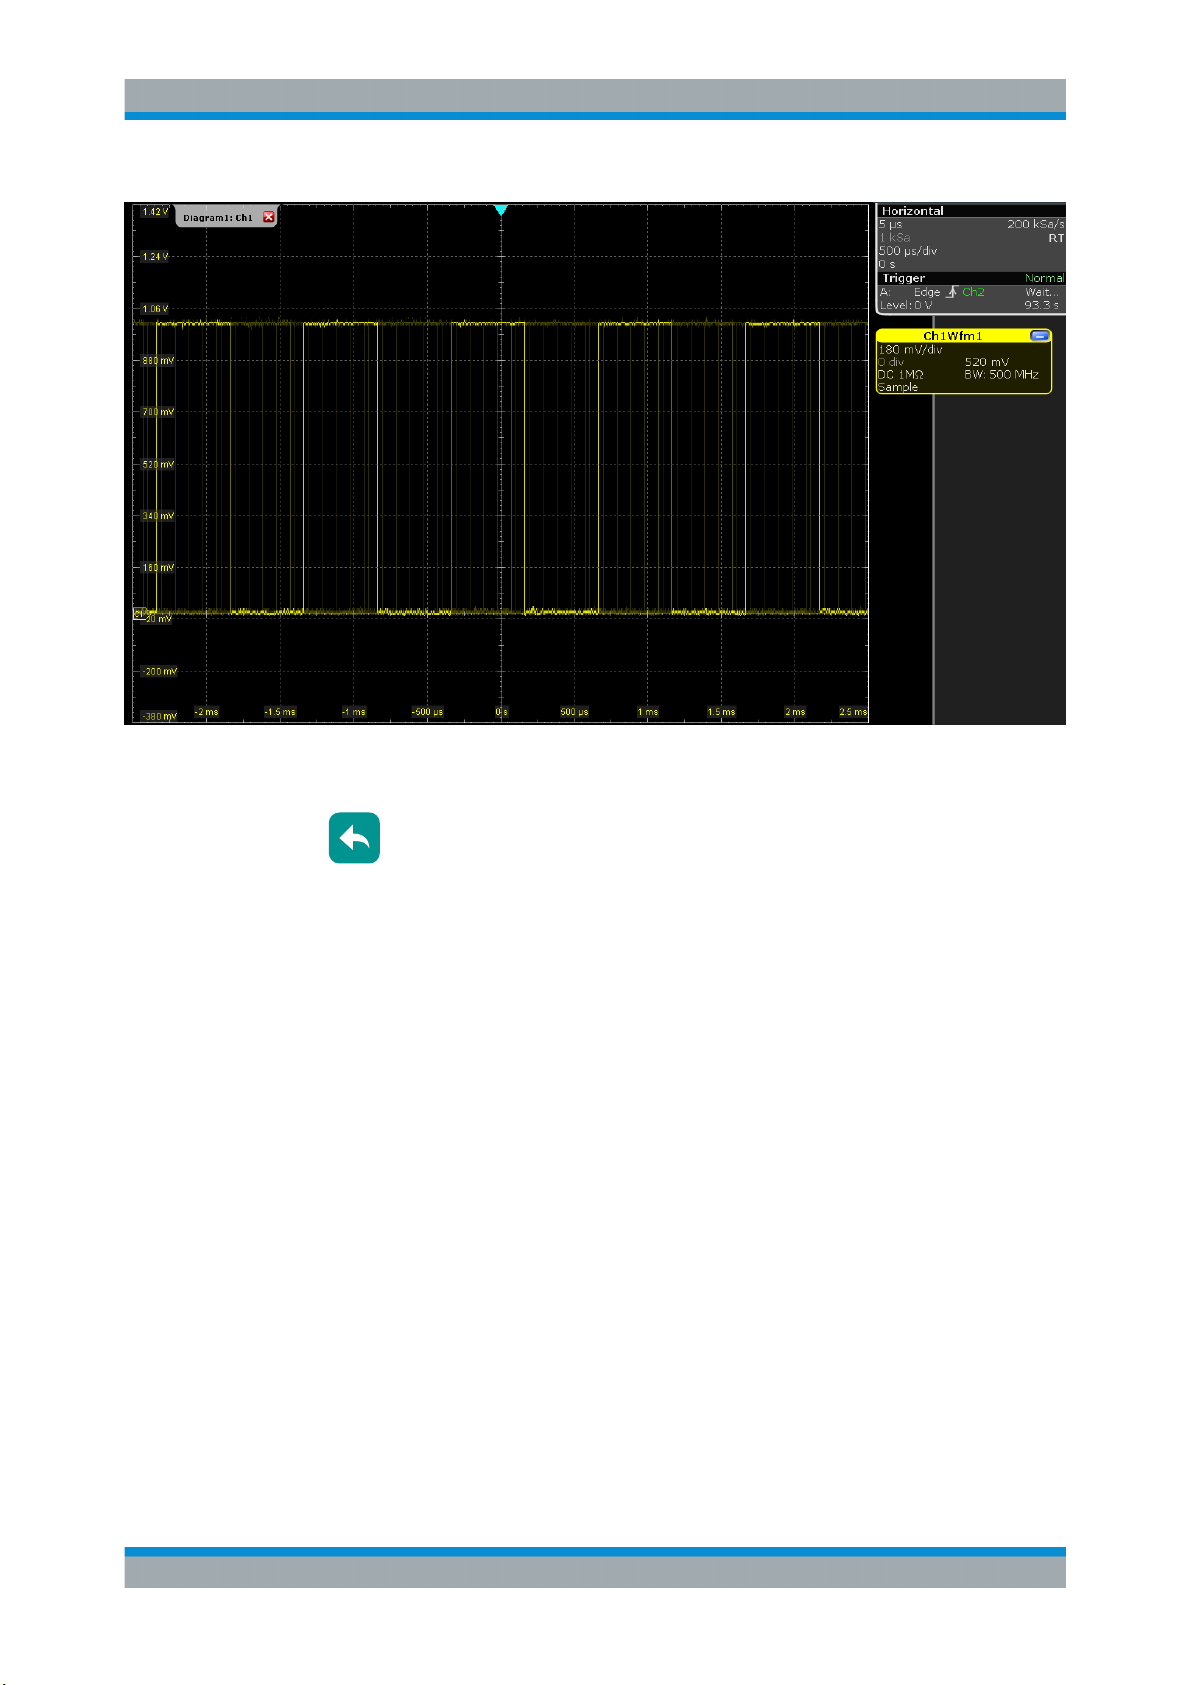
5. In the [Trigger] area of the front panel, press the [Source] key. Press the key again
to switch the trigger source to "C2".
An unstable waveform is displayed. In auto mode, the instrument triggers repeatedly after a time interval if no real trigger occurs.
6. In the [Trigger] area, press the [Mode] key.
7. Check the "Trigger" settings in the upper right corner of the screen.
The trigger mode has changed to "Normal". The waveform is no longer refreshed,
and "Wait" is displayed in the trigger settings. The instrument cannot find a real
trigger event because there is no signal on channel 2.
36Getting Started 1332.9719.02 ─ 08
Page 37
R&S®RTO2000
Trying Out the Instrument
Acquiring Data
8. Tap the "Undo" icon on the toolbar repeatedly until the trigger mode is "Auto" and
the trigger source is "CH1".
9. Press the [Slope] key to toggle the trigger slope.
Watch the waveform and the "Trigger" settings.
4.2 Acquiring Data
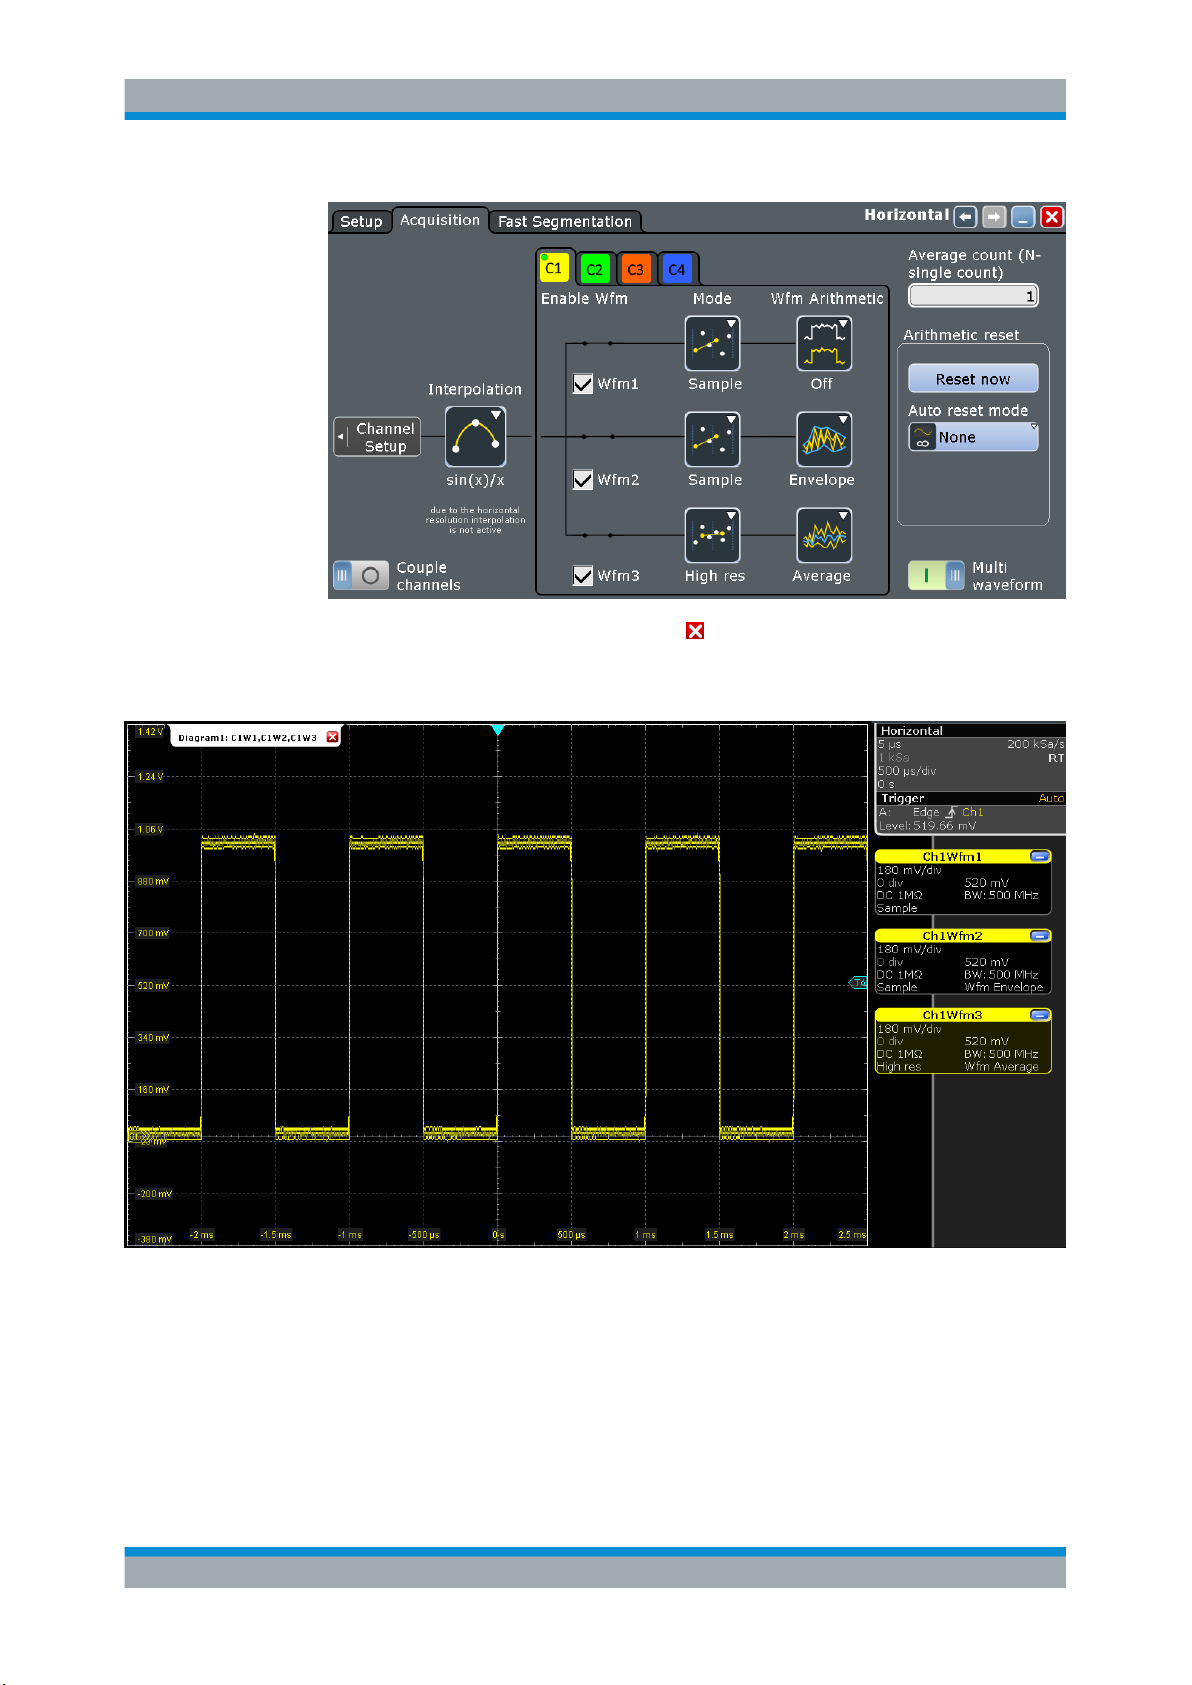
Although you are using only one input channel, you can acquire the calibration data
using three different arithmetic methods and display the results in separate waveforms.
1. In the [Horizontal] area, press the [Acquisition] key.
2. In the "Acquisition" tab of the "Horizontal" dialog box, enable all three waveforms
("Wfm1", "Wfm2", "Wfm3").
If you cannot see these settings, enable "Multi waveform" in the lower right corner
of the dialog box.
3. For Wfm1, select the "Mode" = Sample and "Wfm Arithmetic" = "Off".
4. For Wfm2, select the "Wfm Arithmetic" Envelope. The "Decimation" type is automatically set to Peak detect to display the correct envelope waveform.
5. For Wfm3, select the "mode" = High Res and the "Wfm Arithmetic" to Average.
37Getting Started 1332.9719.02 ─ 08
Page 38
R&S®RTO2000
Trying Out the Instrument
Organizing the Display
6.
To close the "Horizontal" dialog box, tap .
The three waveforms are displayed in one diagram. The corresponding signal
icons are displayed on the sidebar.
4.3 Organizing the Display
Now, the display has become confusing with so many waveforms in one diagram. You
can display each waveform in a separate diagram and then define a useful label for
each diagram. You can also hide diagrams you do not currently need, and display them
later again.
38Getting Started 1332.9719.02 ─ 08
Page 39
R&S®RTO2000
Trying Out the Instrument
Organizing the Display
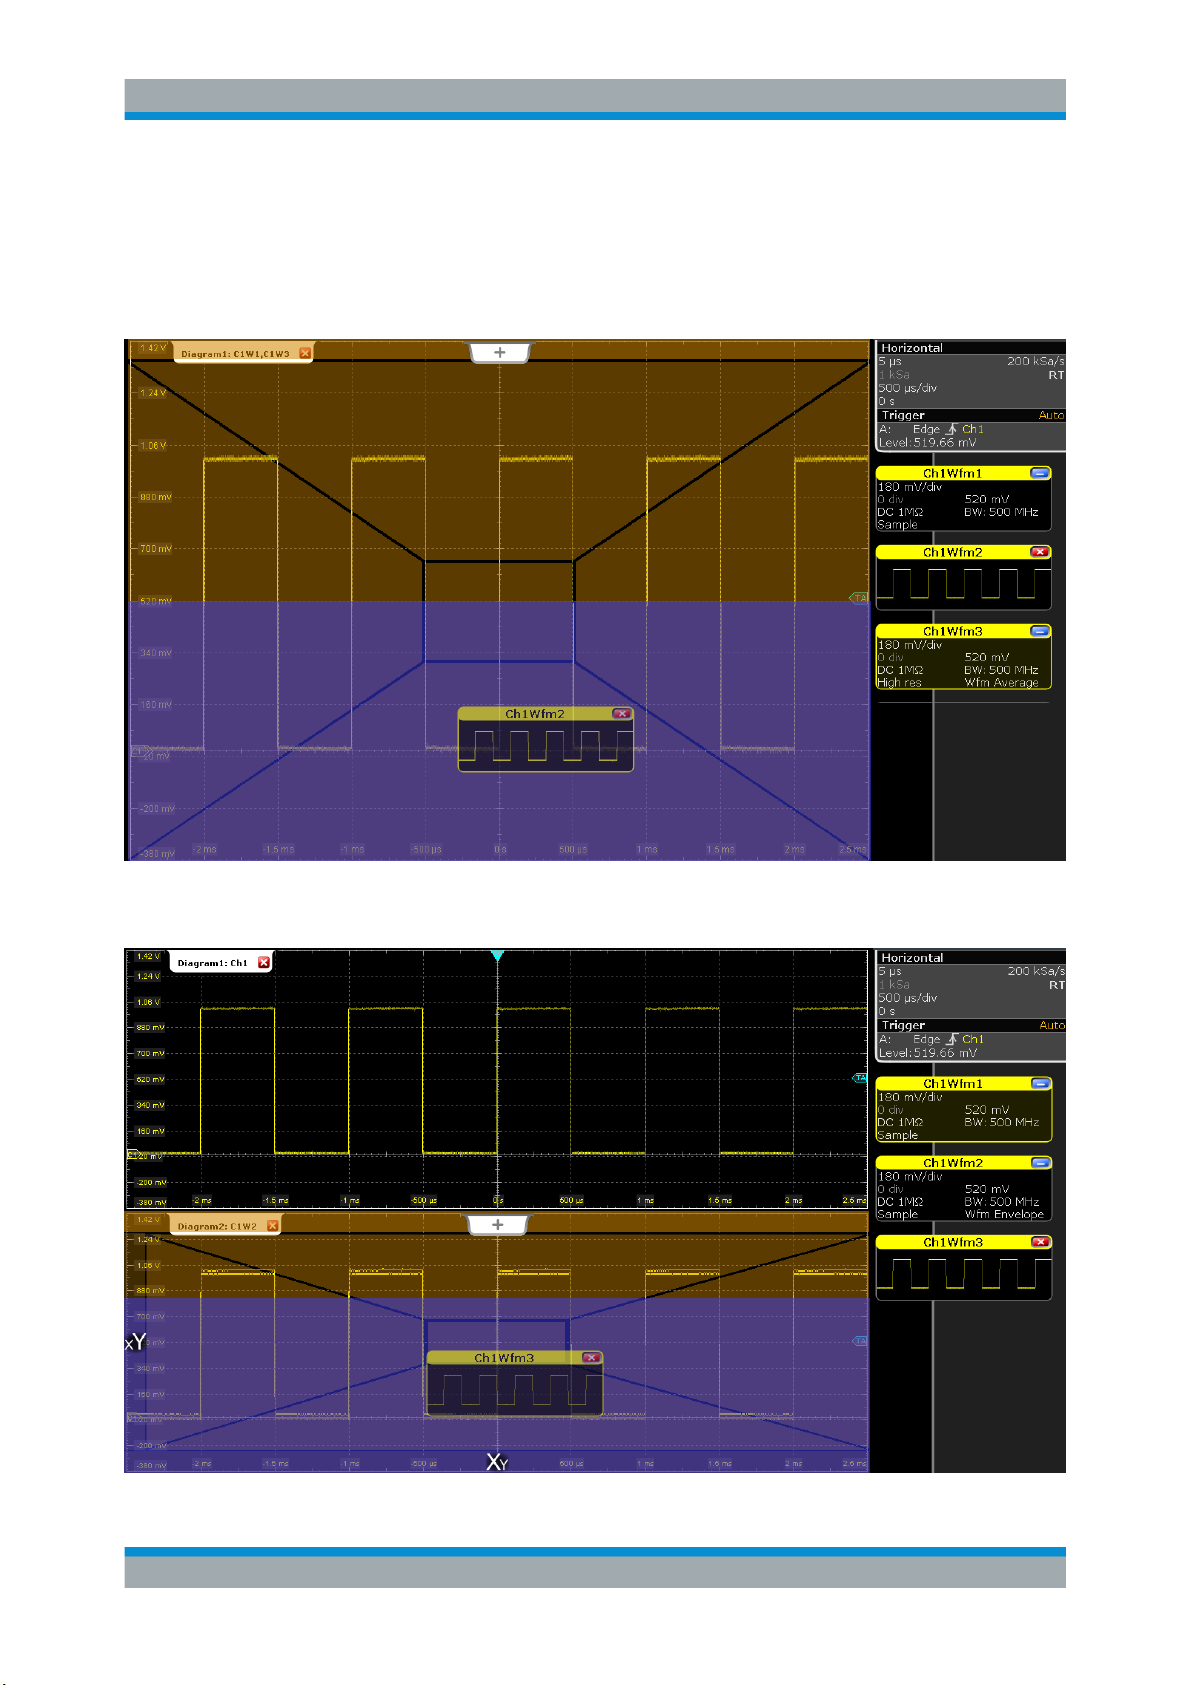
To manage several diagrams
1. Drag the signal icon for "Ch1Wfm2" from the sidebar to the bottom half of the diagram area.
The SmartGrid appears and a blue area shows where the waveform will be placed.
2. Drag the signal icon for "Ch1Wfm3" to the bottom half of the diagram so that it covers an area beneath "Ch1Wfm2" and drop it there.
39Getting Started 1332.9719.02 ─ 08
Page 40
R&S®RTO2000
Trying Out the Instrument
Organizing the Display
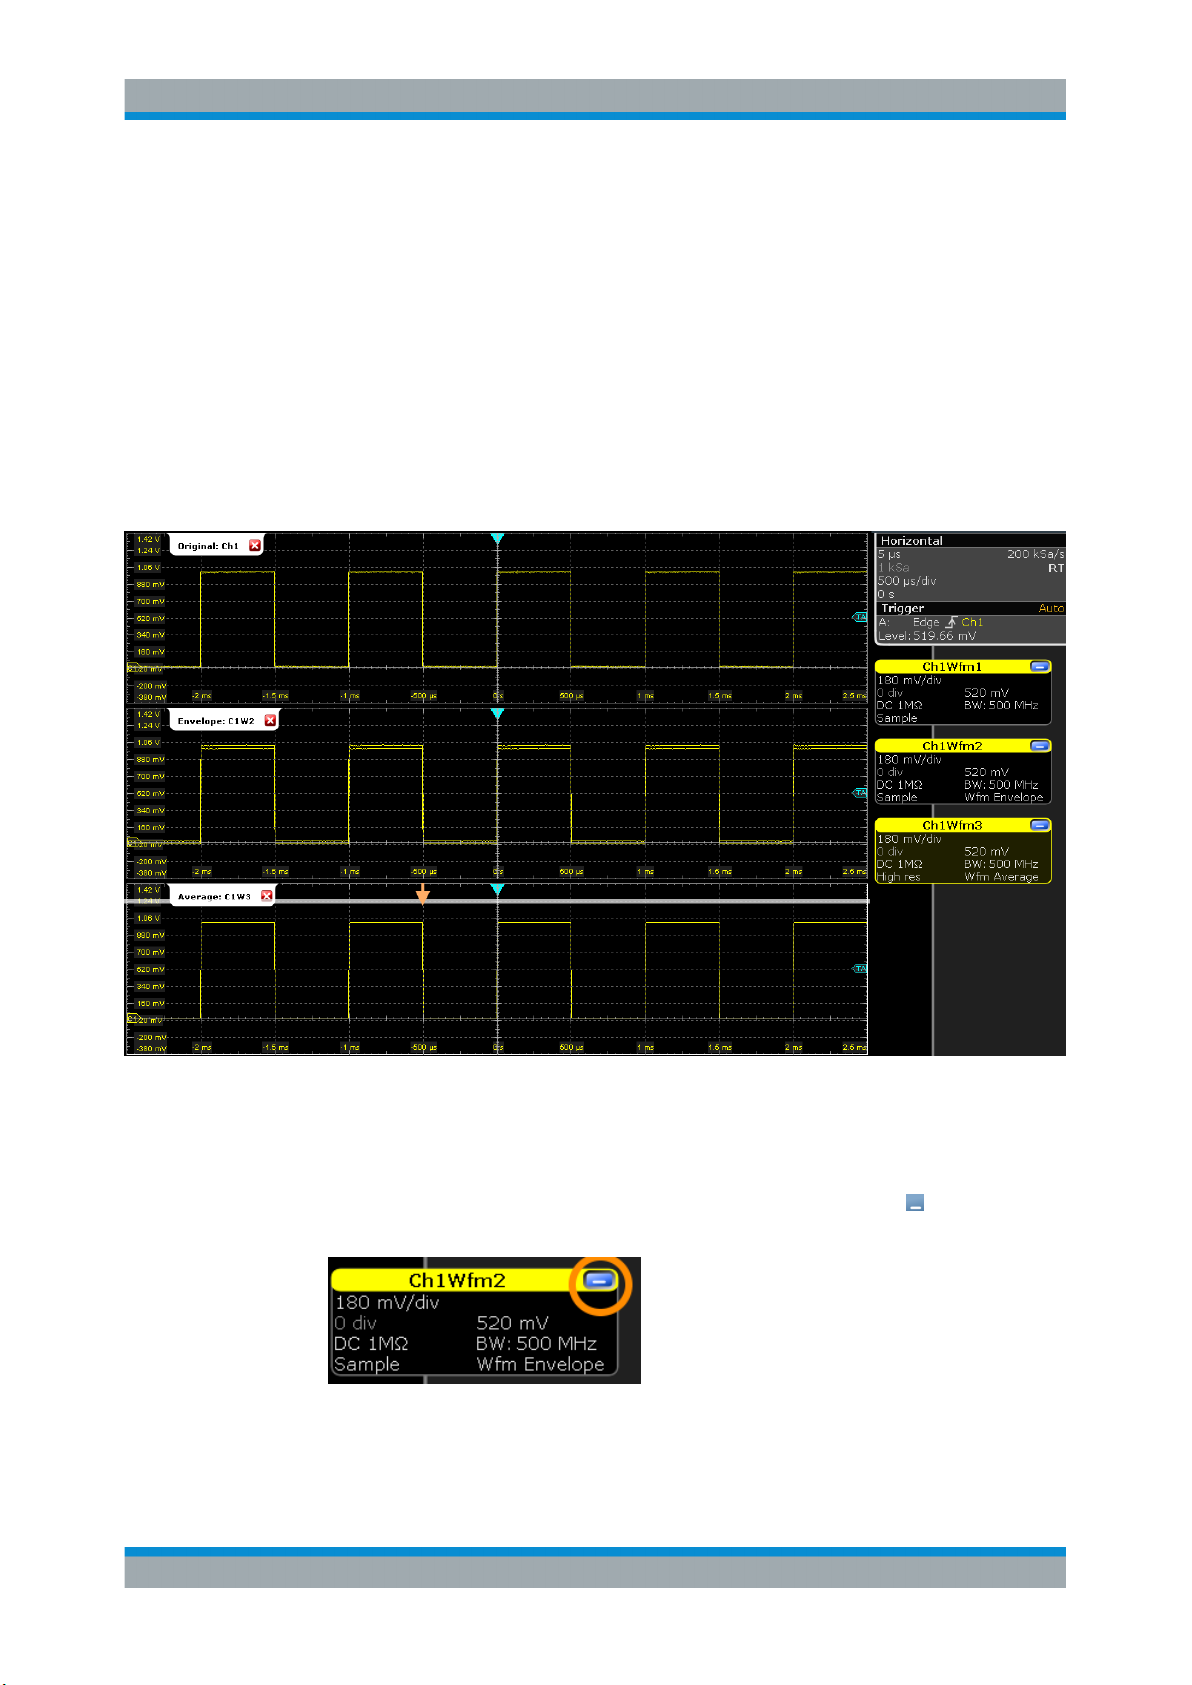
The three waveforms are now displayed in separate diagrams.
3. Rename the diagrams so that the label indicates the diagram content:
a) Double-tap the label for "Diagram 1: Ch1".
b) On the on-screen keyboard, enter Original.
c) Tap [OK].
d) Repeat these steps to rename "Diagram 2: Ch1Wfm2" to Envelope.
e) Rename "Diagram 3: Ch1Wfm3" to Average.
The diagram titles are shown together with the waveform number that is displayed
in the diagram.
4. To change the size of a diagram, drag its horizontal edge to the required position.
To delete waveform diagrams
For the procedures in the following sections, we need only the original waveform diagram. So we close the other two diagrams.
1.
To minimize the waveform in diagram "Envelope: Ch1Wfm2", tap "Minimize" in
the "Ch1Wfm2" signal icon.
The diagram is removed and the signal icon on the sidebar displays a live view of
the signal.
40Getting Started 1332.9719.02 ─ 08
Page 41
R&S®RTO2000
4.4 Changing the Waveform Scaling and Position
Trying Out the Instrument
Changing the Waveform Scaling and Position
2.
Tap "Close" in the signal icon for "Ch1Wfm2".
The signal icon is removed from the sidebar, the waveform is switched off.
3. Switch off the "Average:Ch1Wfm3" waveform using the toolbar function:
a) Tap the "Delete" icon on the toolbar.
b) Tap the waveform in the "Average: Ch1Wfm3" diagram.
The waveform is switched off, its signal icon and the empty diagram are removed.
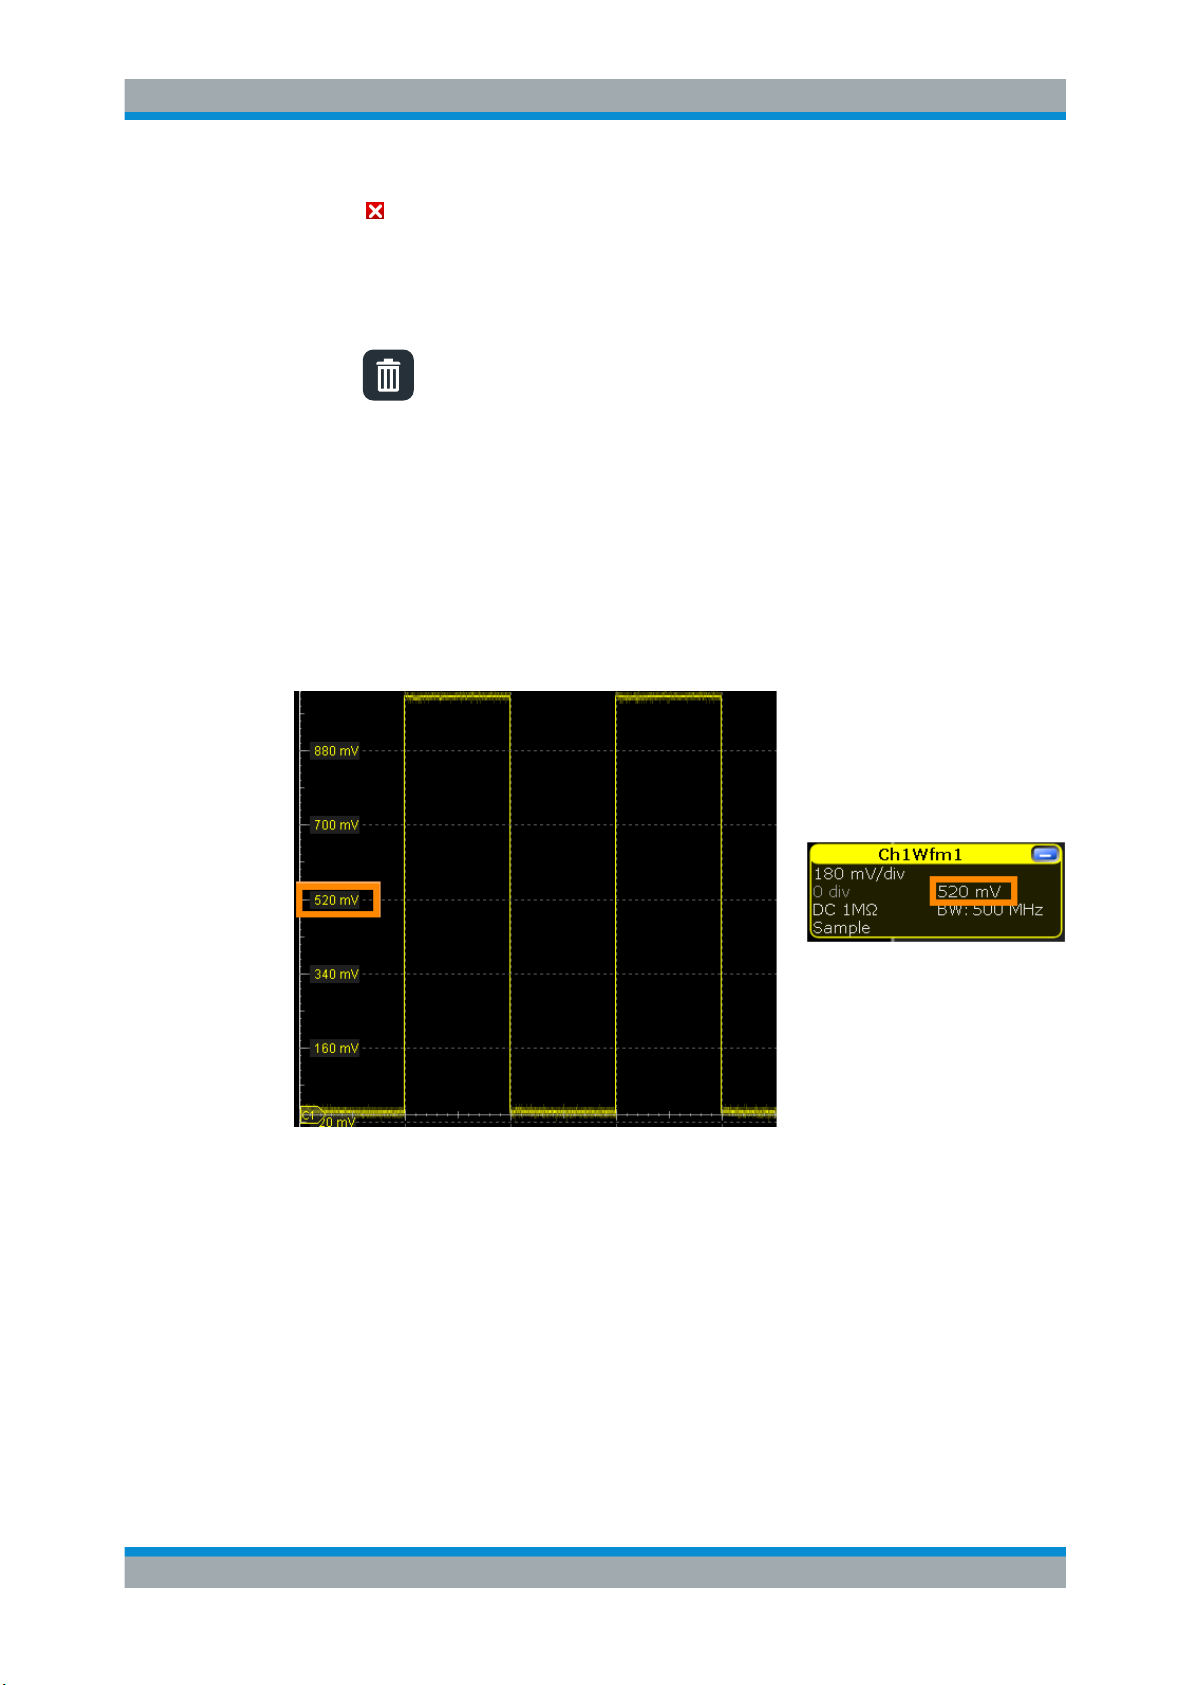
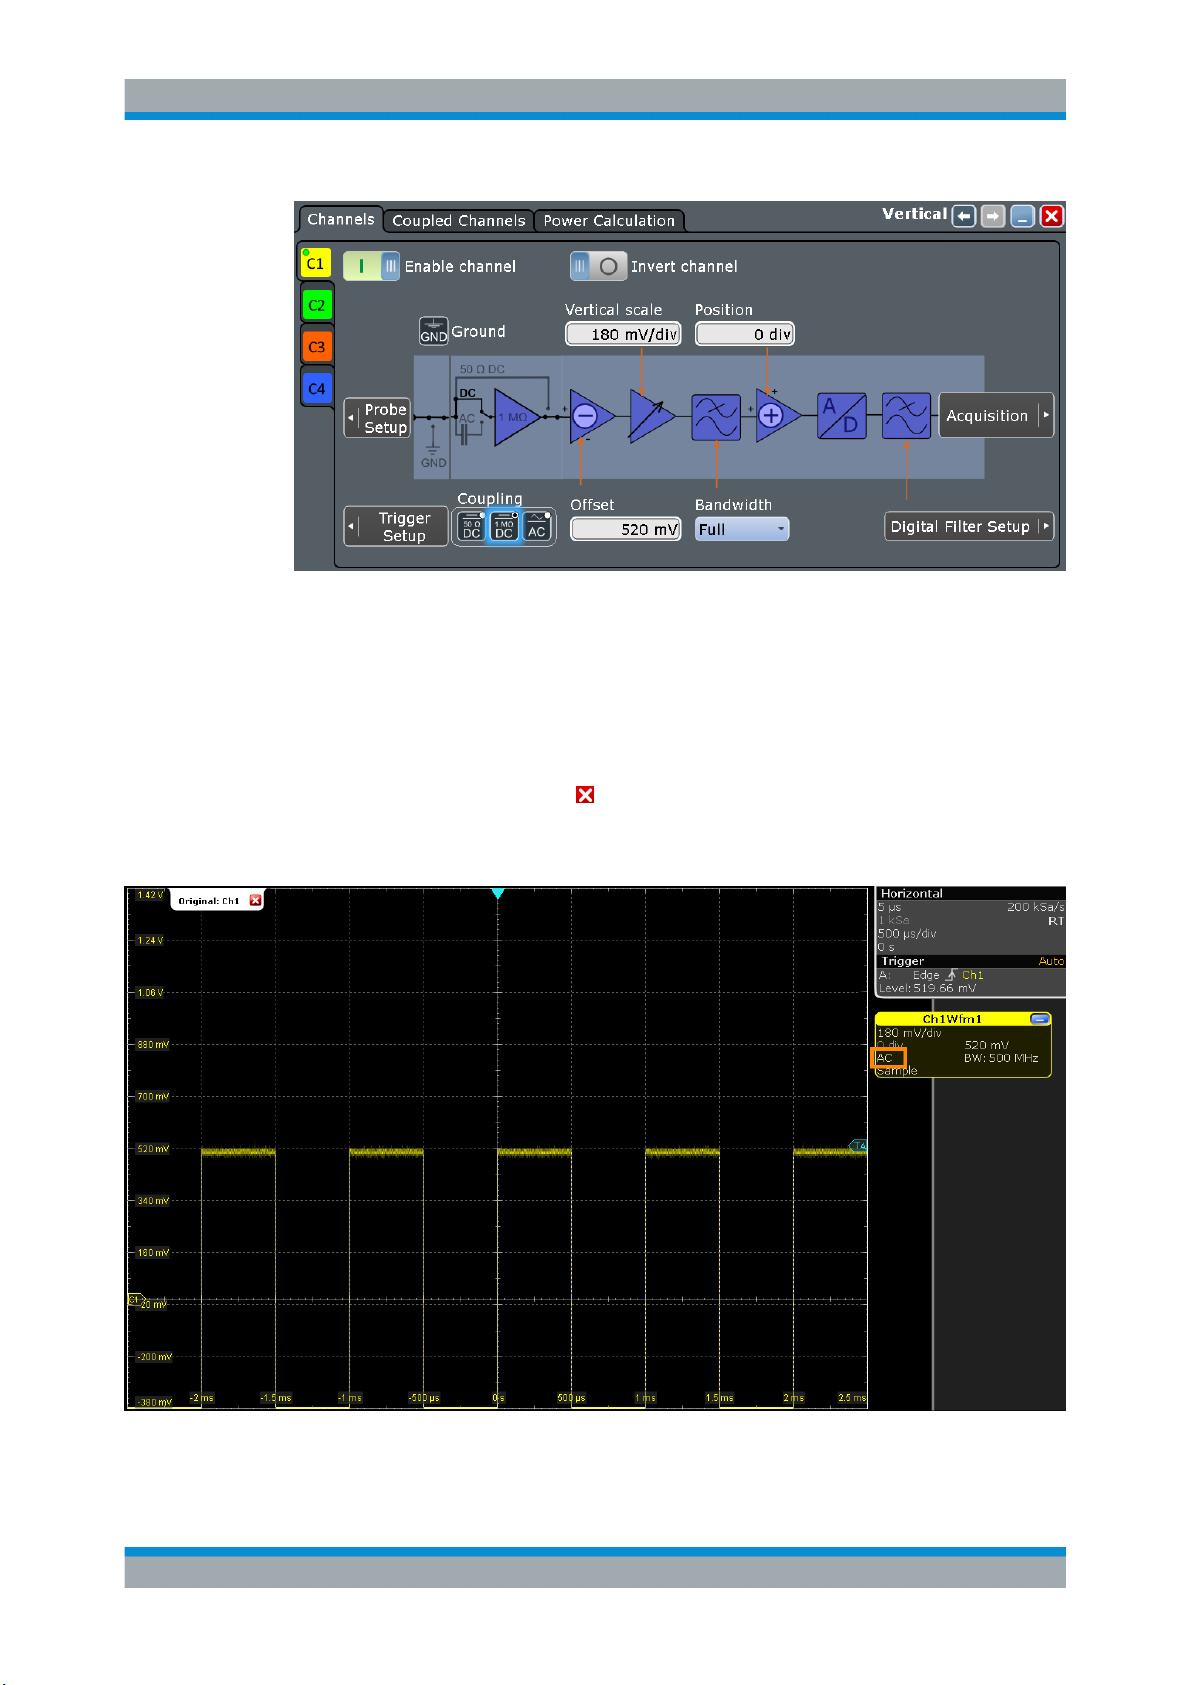
As you can see on the y-axis of the display, the calibration signal has a vertical offset of
about 520 mV. The value can differ. This value is also indicated in the signal icon for
channel1 (2nd row).
If you press the [Ch1] key, the "Vertical" settings dialog box also displays the "Offset"
value. The offset is the DC component of the signal.
41Getting Started 1332.9719.02 ─ 08
Page 42
R&S®RTO2000
Trying Out the Instrument
Changing the Waveform Scaling and Position
If you use a passive probe, you can filter the DC component by using the AC coupling
function. Then you quickly set the new trigger level, and try out the scaling functions.
1. In the [Vertical] area, press the [Ch1] key.
The "Vertical" dialog box is shown.
2. Change the "Coupling" to "AC".
3.
To close the dialog box, tap
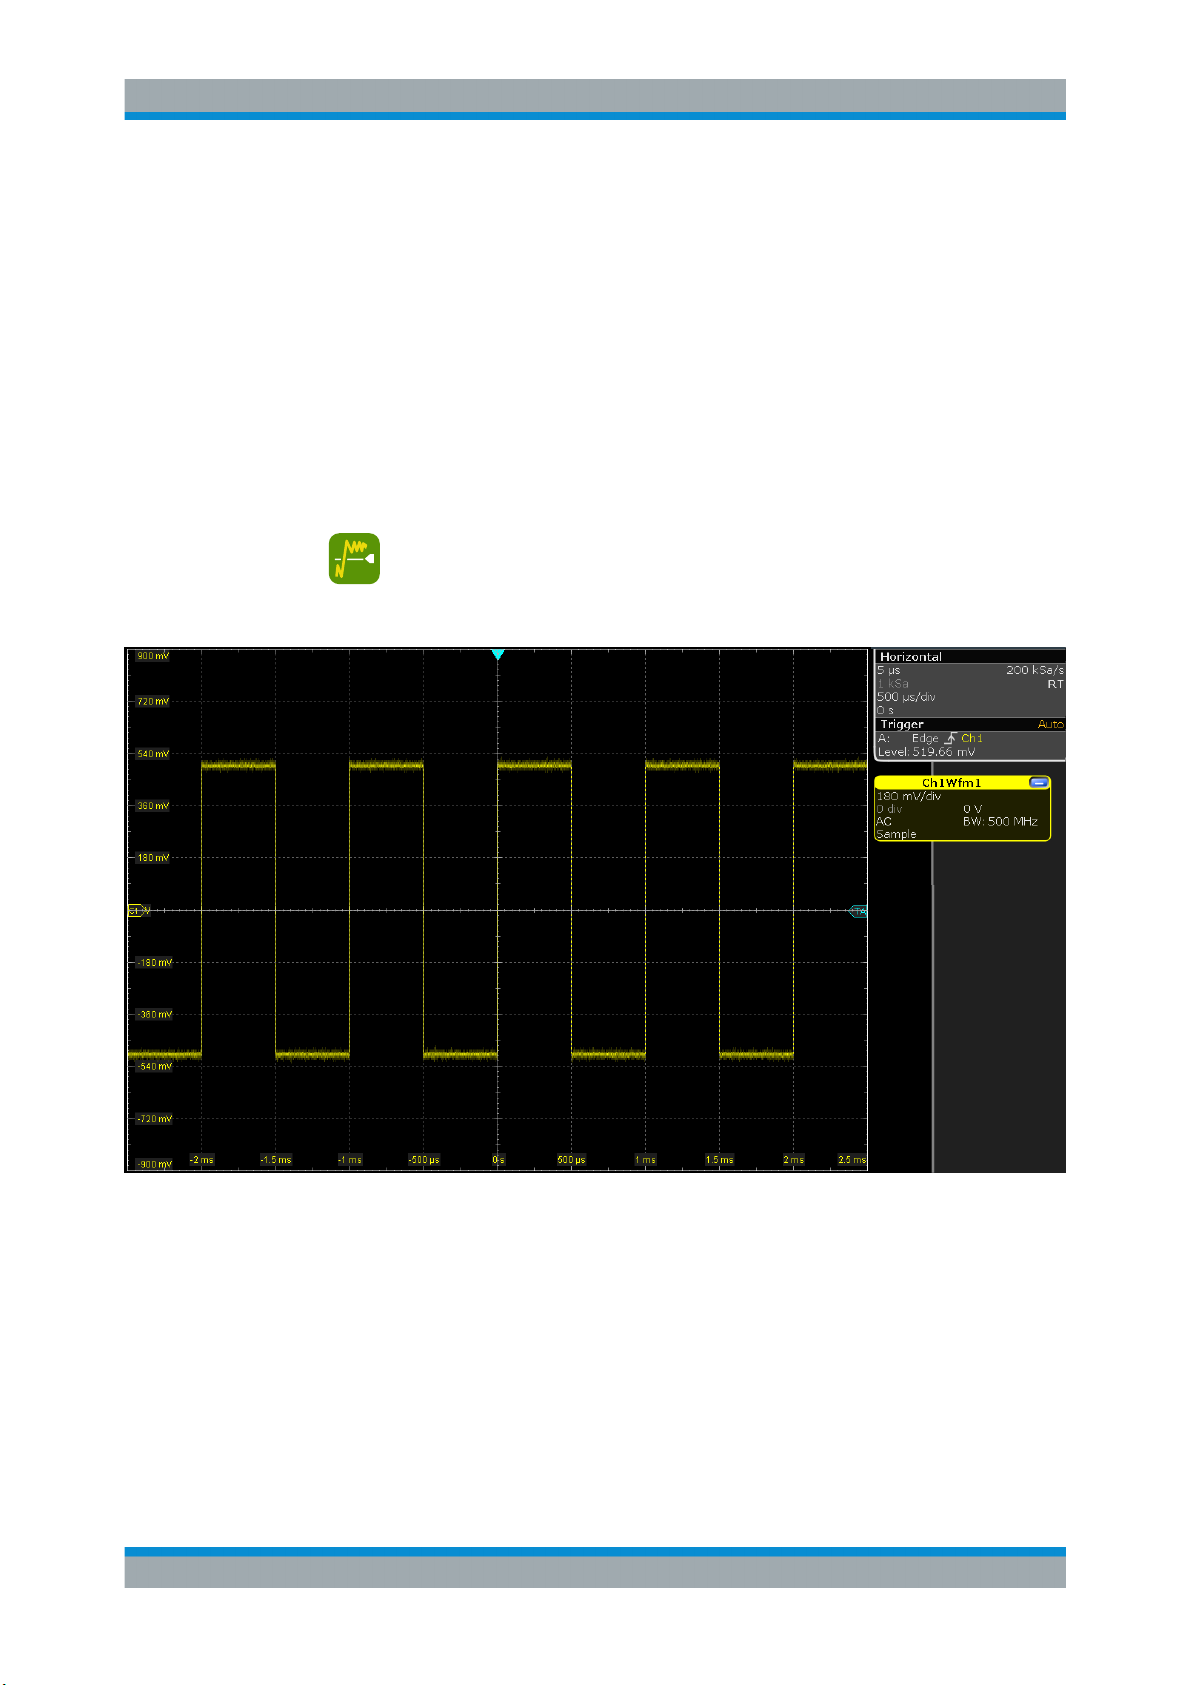
The DC component of the signal is eliminated; the waveform position moves down
vertically and is now centered on 0 V.
.
42Getting Started 1332.9719.02 ─ 08
Page 43
R&S®RTO2000
Trying Out the Instrument
Changing the Waveform Scaling and Position
4. To move the waveform back to the center of the screen, eliminate the offset in the
vertical settings: Press the upper rotary knob in the [Vertical] area (Offset/Position
knob).
The waveform is now displayed in the center of the display, with the x-axis crossing
at 0 V. The waveform might be unstable if the trigger level is above the waveform.
Note: If this step does not work as described, check the function assignment of the
rotary knob. The second row of the signal label shows the vertical position on the
left and the offset on the right. The white value is assigned to the rotary knob, while
the gray value is not. To change the assignment, use "File" menu > "Hardkey
Setup".
5. Tap the "Find level" icon on the toolbar.
The instrument adjusts the trigger level, and a stable waveform is displayed.
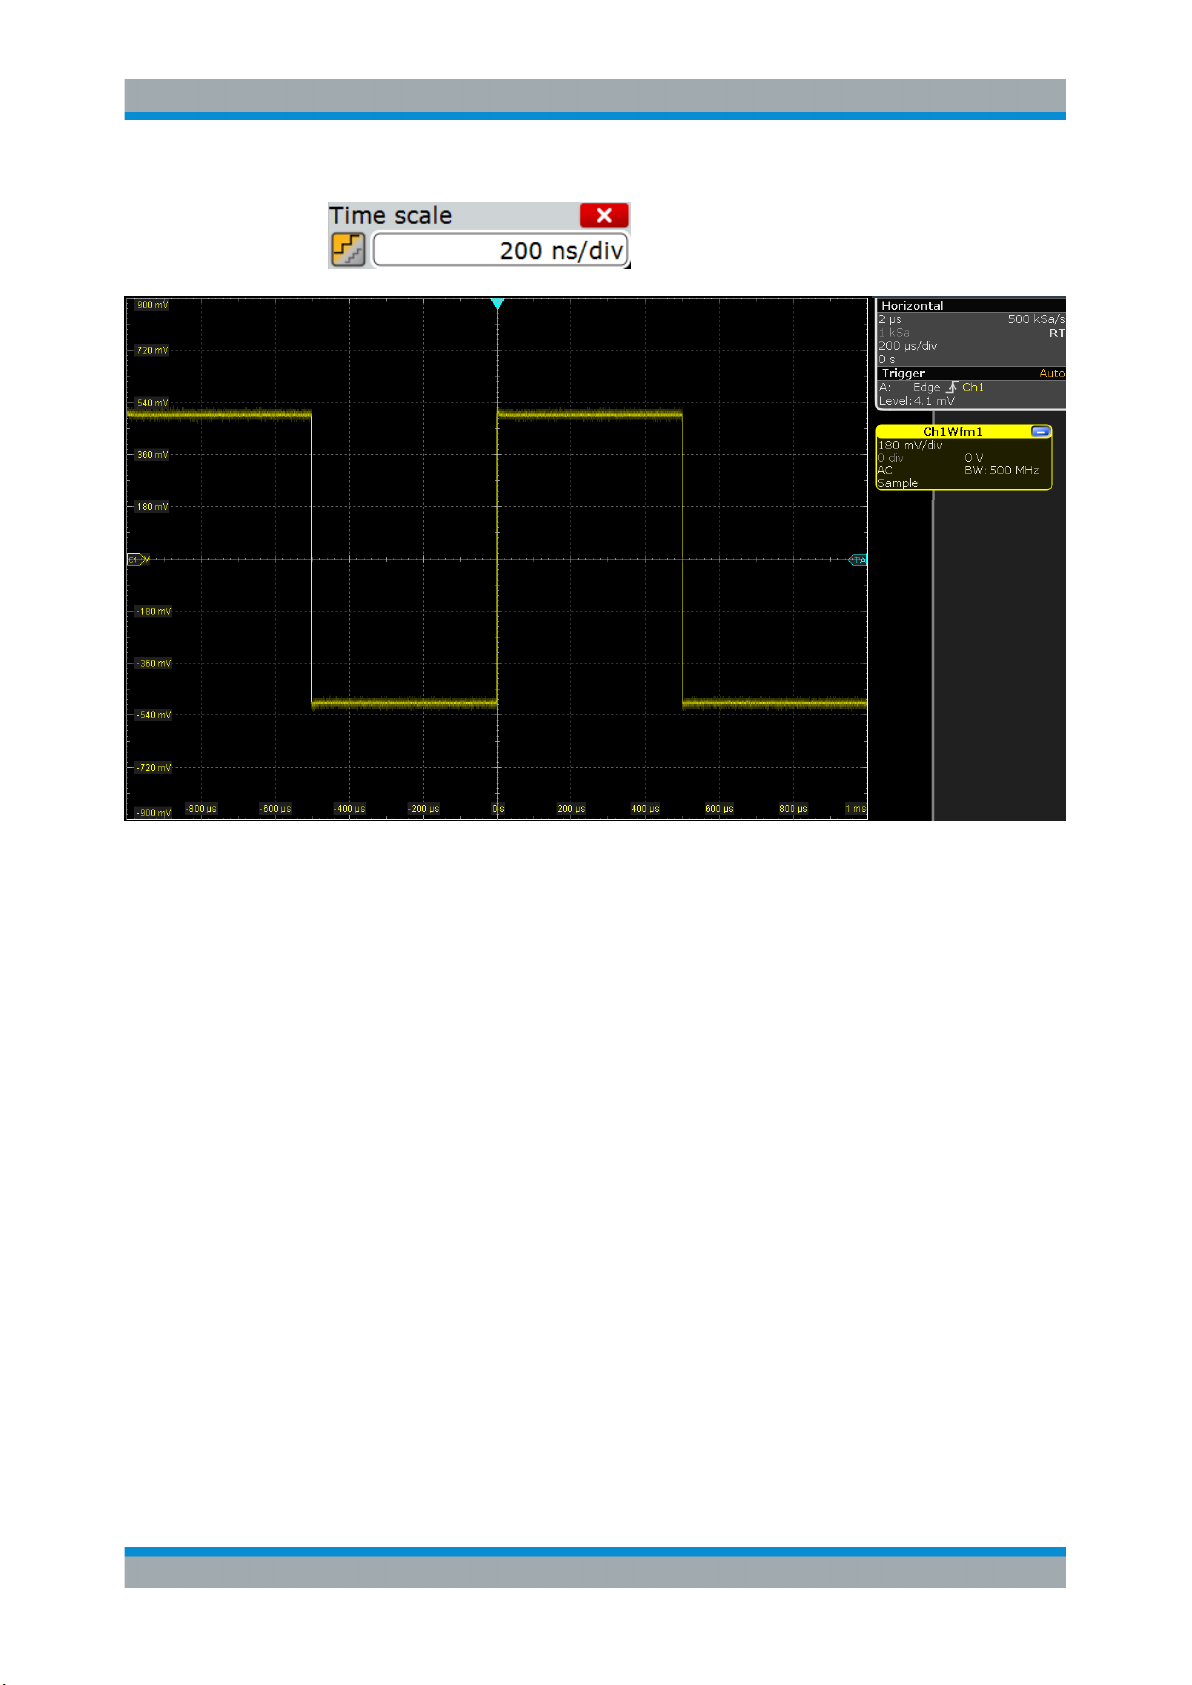
6. To examine one pulse in more detail, change the horizontal scale. Try these methods:
● Touch the screen with two fingers and spread the fingers horizontally.
● Turn the horizontal [Scale] knob.
When you turn the knob, the current scale factor per division is displayed in the
lower right corner of the display. You can switch between a small and large step
size of the scaling factor by tapping the step icon, or by pressing the horizontal
[Scale] knob.
43Getting Started 1332.9719.02 ─ 08
Page 44
R&S®RTO2000
Trying Out the Instrument
Changing the Waveform Scaling and Position
7. To return to the original scaling, try the [Undo] key in the [Navigation] area. Press
the [Undo] key repeatedly until the original scaling is displayed. Press the [Redo]
key to retrace the undone steps. Thus, you can toggle between the two displays
using the undo and redo keys until you perform a different action.
Alternatively, you can:
● Touch the screen with two spread fingers and pinch them together in horizontal
direction.
● Tap the "Undo" icon on the toolbar.
If you use an active single-ended probe, you can measure the DC component of the
signal directly at the probe tip with the integrated R&S ProbeMeter:
1. On the "Vertical" menu, tap "Probe Setup".
2. Make sure that the correct channel is selected on the left tab.
3. In the "Additional" section, tap "ProbeMeter".
A result box shows the DC voltage measured by the R&S ProbeMeter.
44Getting Started 1332.9719.02 ─ 08
Page 45
R&S®RTO2000
4.5 Zooming into the Display
4.5.1 Using the Standard Zoom
Trying Out the Instrument
Zooming into the Display
Using the [Scale] rotary knobs, you can change the scaling of the timebase and signal
amplitudes to enlarge the waveform. To see more details, use one of the zoom functions. The instrument has 4 zoom types, 2 of them you try out in this section.
The usage of zooms is also shown in a short video that is available on the instrument:
"File" menu > "Tutorials" > "Zoom".
1. Restore the default signal channel settings by pressing the [Preset] and [Autoset]
keys.
2. On the toolbar, tap the "Zoom" icon.
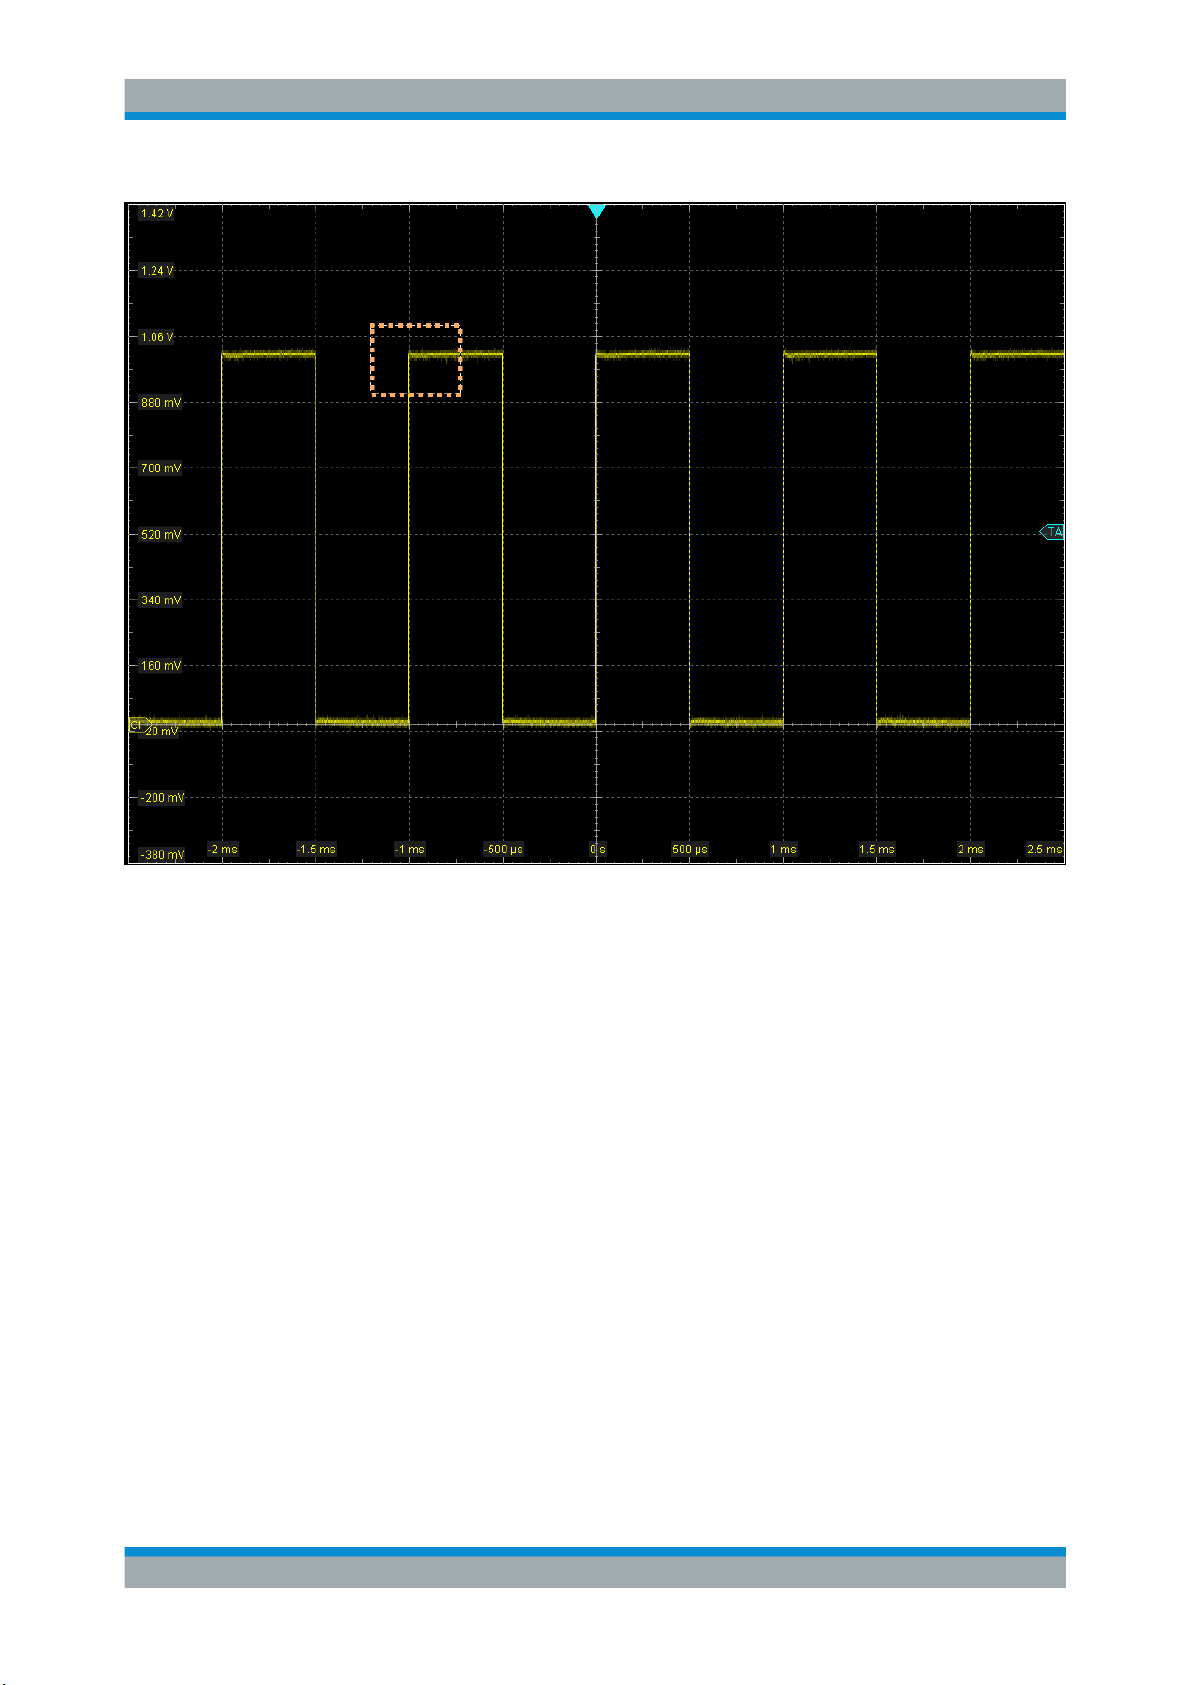
3. Tap the position in the diagram that you want to define as one corner of the zoom
area. Then drag your finger to the opposite corner of the zoom area.
While you drag your finger on the touchscreen, a dotted rectangle indicates the
current zoom area. When the rectangle covers the required zoom area, remove
your finger.
45Getting Started 1332.9719.02 ─ 08
Page 46
R&S®RTO2000
Trying Out the Instrument
Zooming into the Display
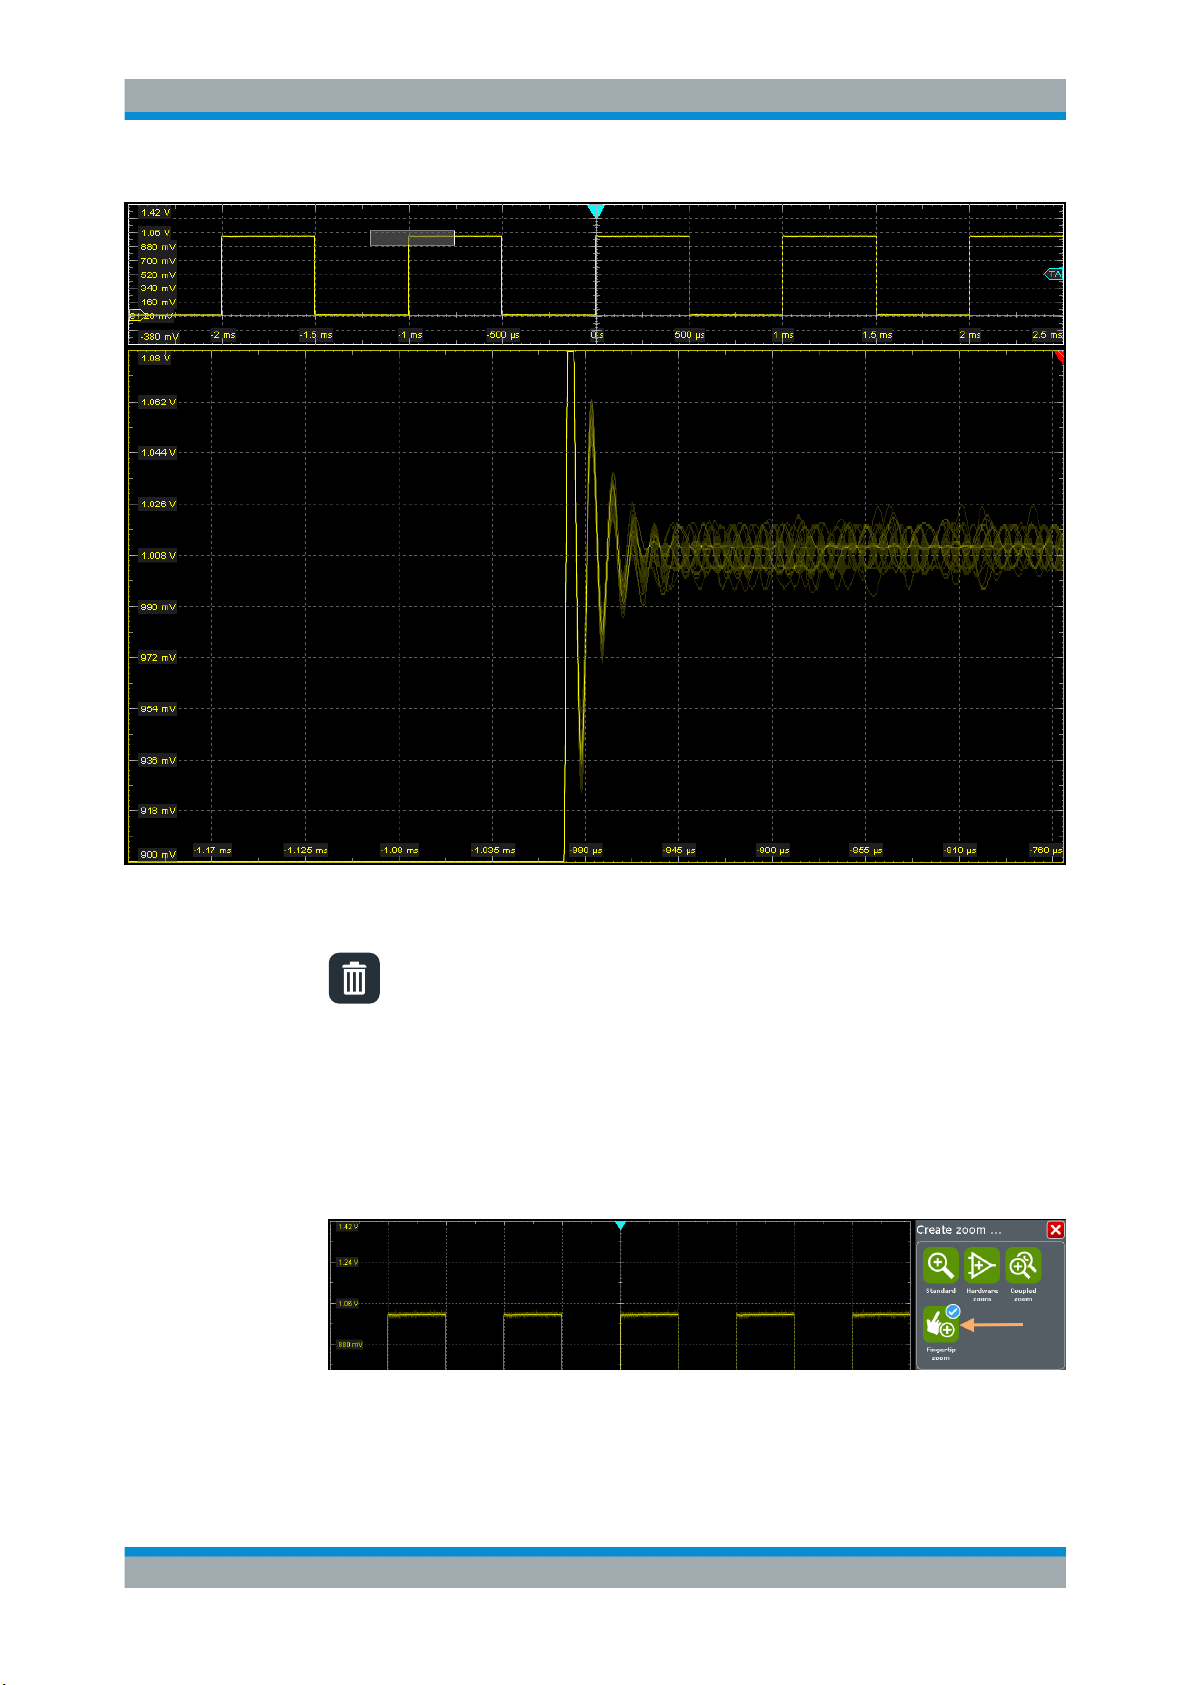
The indicated area is magnified in a new zoom diagram. The original diagram indicates the zoom area as a rectangle.
46Getting Started 1332.9719.02 ─ 08
Page 47
R&S®RTO2000
Trying Out the Instrument
Zooming into the Display
4. To remove the zoom window and make room on the display for other results, tap
"Delete" on the toolbar and then the zoom window.
4.5.2 Using the Fingertip Zoom
1. Tap the "Zoom" icon on the toolbar.
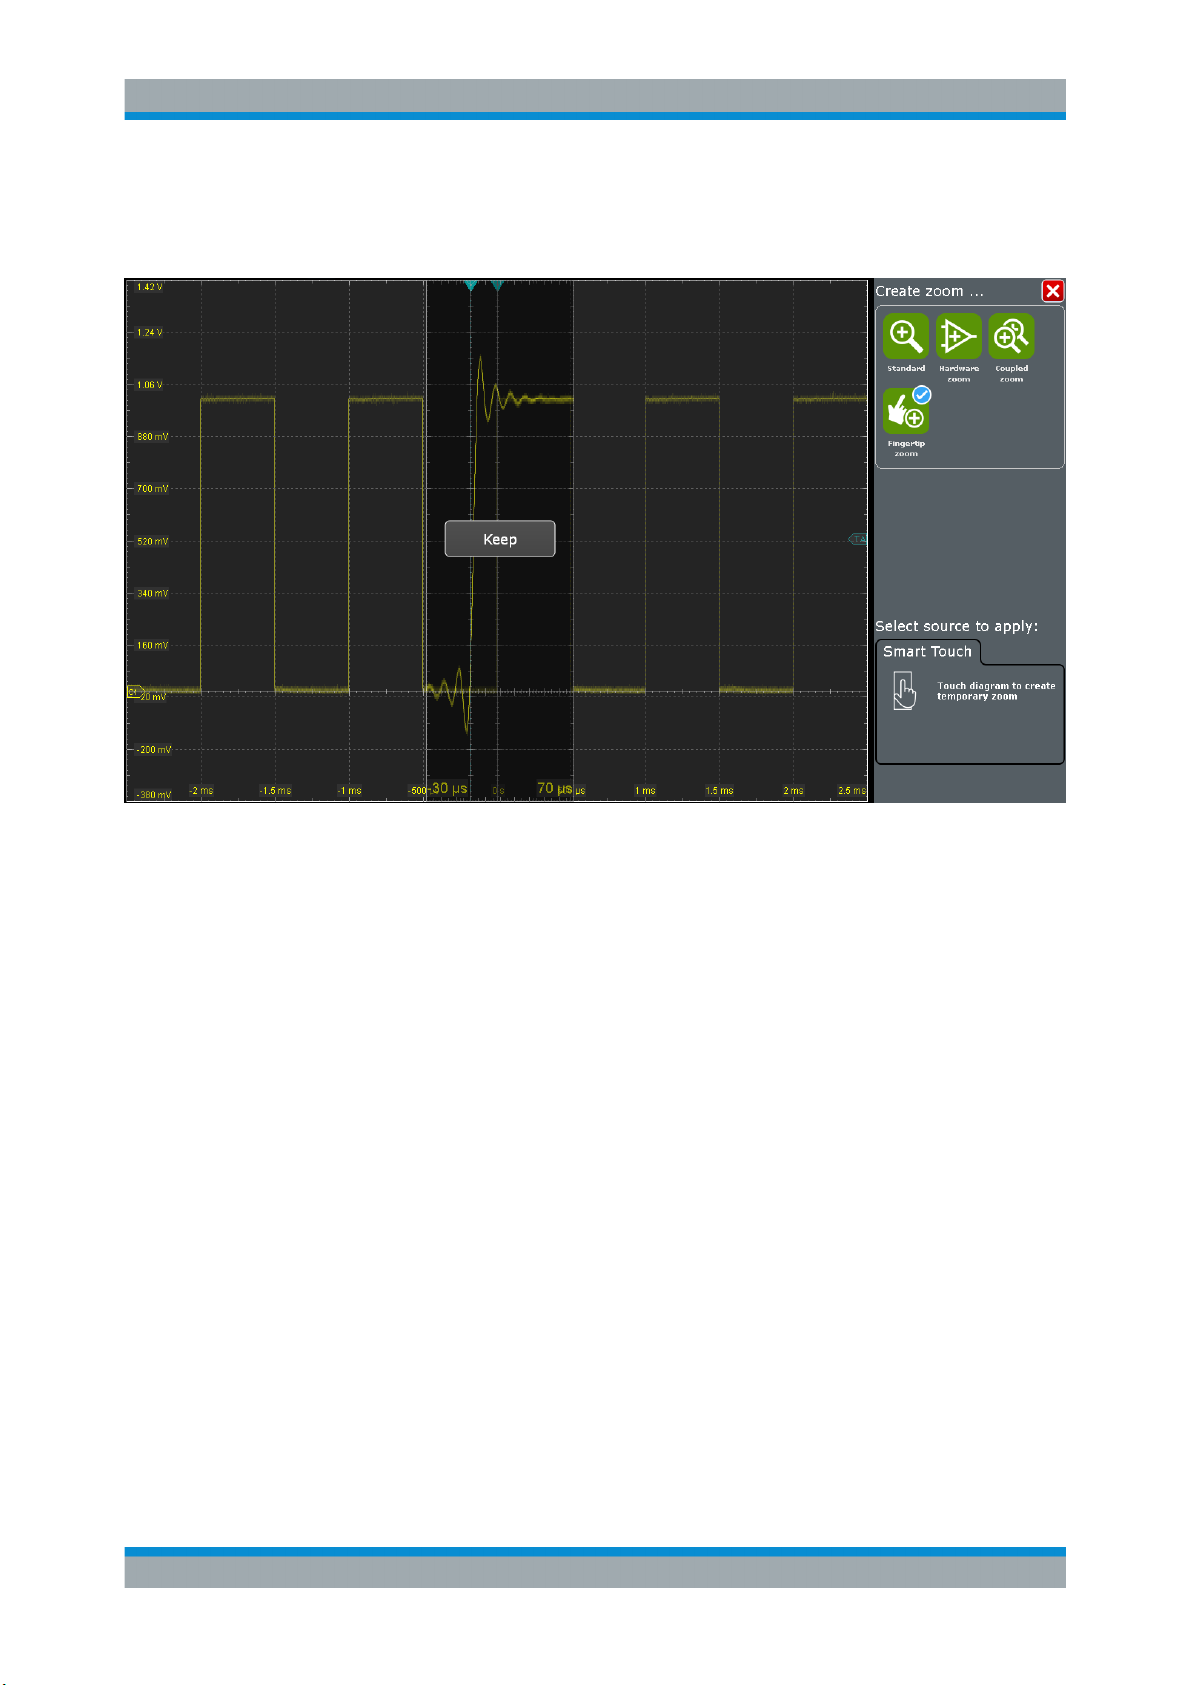
2. In the sidebar, tap "Fingertip zoom".
3. Touch the waveform and move your finger very slowly in horizontal direction.
Tip: You can turn the [Navigation] knob to change the zoom factor while holding
the waveform.
47Getting Started 1332.9719.02 ─ 08
Page 48
R&S®RTO2000
Trying Out the Instrument
Displaying the Waveform History
4. Release the finger when the waveform segment of interest is visible in the zoom.
5. Tap "Keep" to convert the fingertip zoom into a standard zoom diagram.
4.6 Displaying the Waveform History
During a continuous acquisition, the instrument stores the acquired data in the memory
and shows the current acquisition on the display. The history accesses and displays
the samples that were saved before the current acquisition. When the acquisition was
stopped and a new acquisition is started with [Run Stop] or [Single], the memory is
cleared and written anew.
In the following example, you acquire 10 waveforms, and display the 3 most recent
waveforms.
1. In the [Horizontal] area, press the [Acquisition] key.
The "Horizontal" settings dialog box opens.
2. Set the "Average count" to 10 to perform 10 waveform acquisitions.
3. Close the "Horizontal" dialog box.
4. In the [Trigger] area, press the [Single] key.
10 waveform acquisitions are performed. The most recent acquisition is displayed
in the diagram.
5. In the [Analysis] area, press the [History] key.
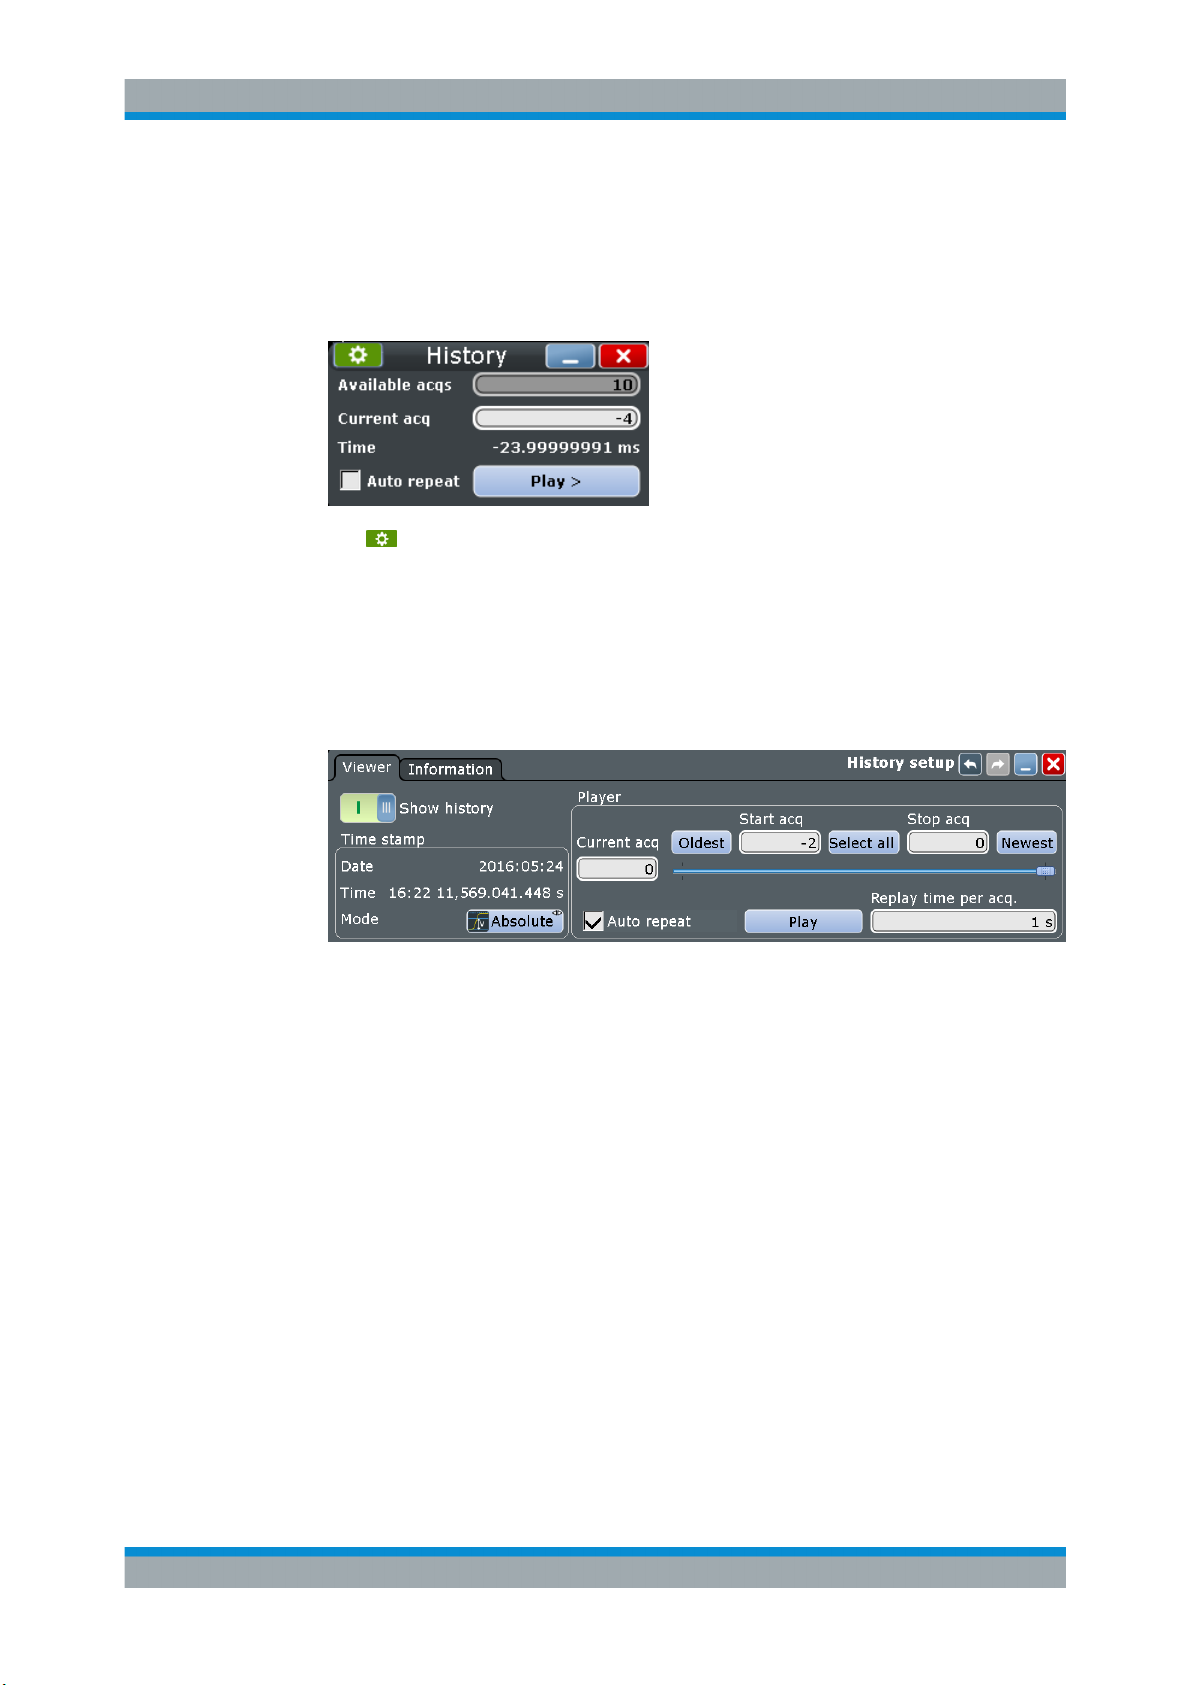
The quick access "History" dialog box appears, and the history mode is on.
48Getting Started 1332.9719.02 ─ 08
Page 49
R&S®RTO2000
Trying Out the Instrument
Performing Basic Measurements
6. Tap "Play".
The 10 stored waveforms are displayed one after the other, but very fast.
7. In the "Current acq." field, enter -4 to display the sixth waveform, counted from
acquisition start. The latest acquisition has the number 0, the oldest has -9.
8.
Tap to open the "History" setup dialog box.
9. Enter -2 in the "Start acq" field. Tap "Newest" to enter 0 in the "Stop acq" field.
Thus the three latest acquisitions are displayed.
10. In the "Replay time per acq." field, enter 1 s to display each waveform for one second.
11. Enable the "Auto repeat" option to see the three waveforms repeatedly.
12. Tap "Play".
The currently displayed waveform is indicated in the "Current acq." field.
13. Close the "History" dialog box so you can see the waveform better.
14. Tap "Running" to stop the display.
During running display, the "Play" is labeled "Running".
15. Close the quick access "History" dialog box.
The history mode is disabled. The [History] key is no longer illuminated.
4.7 Performing Basic Measurements
Using the R&S RTO, you can perform and display different measurements simultaneously. The color of the results in the result table corresponds with the source waveform
color.
49Getting Started 1332.9719.02 ─ 08
Page 50
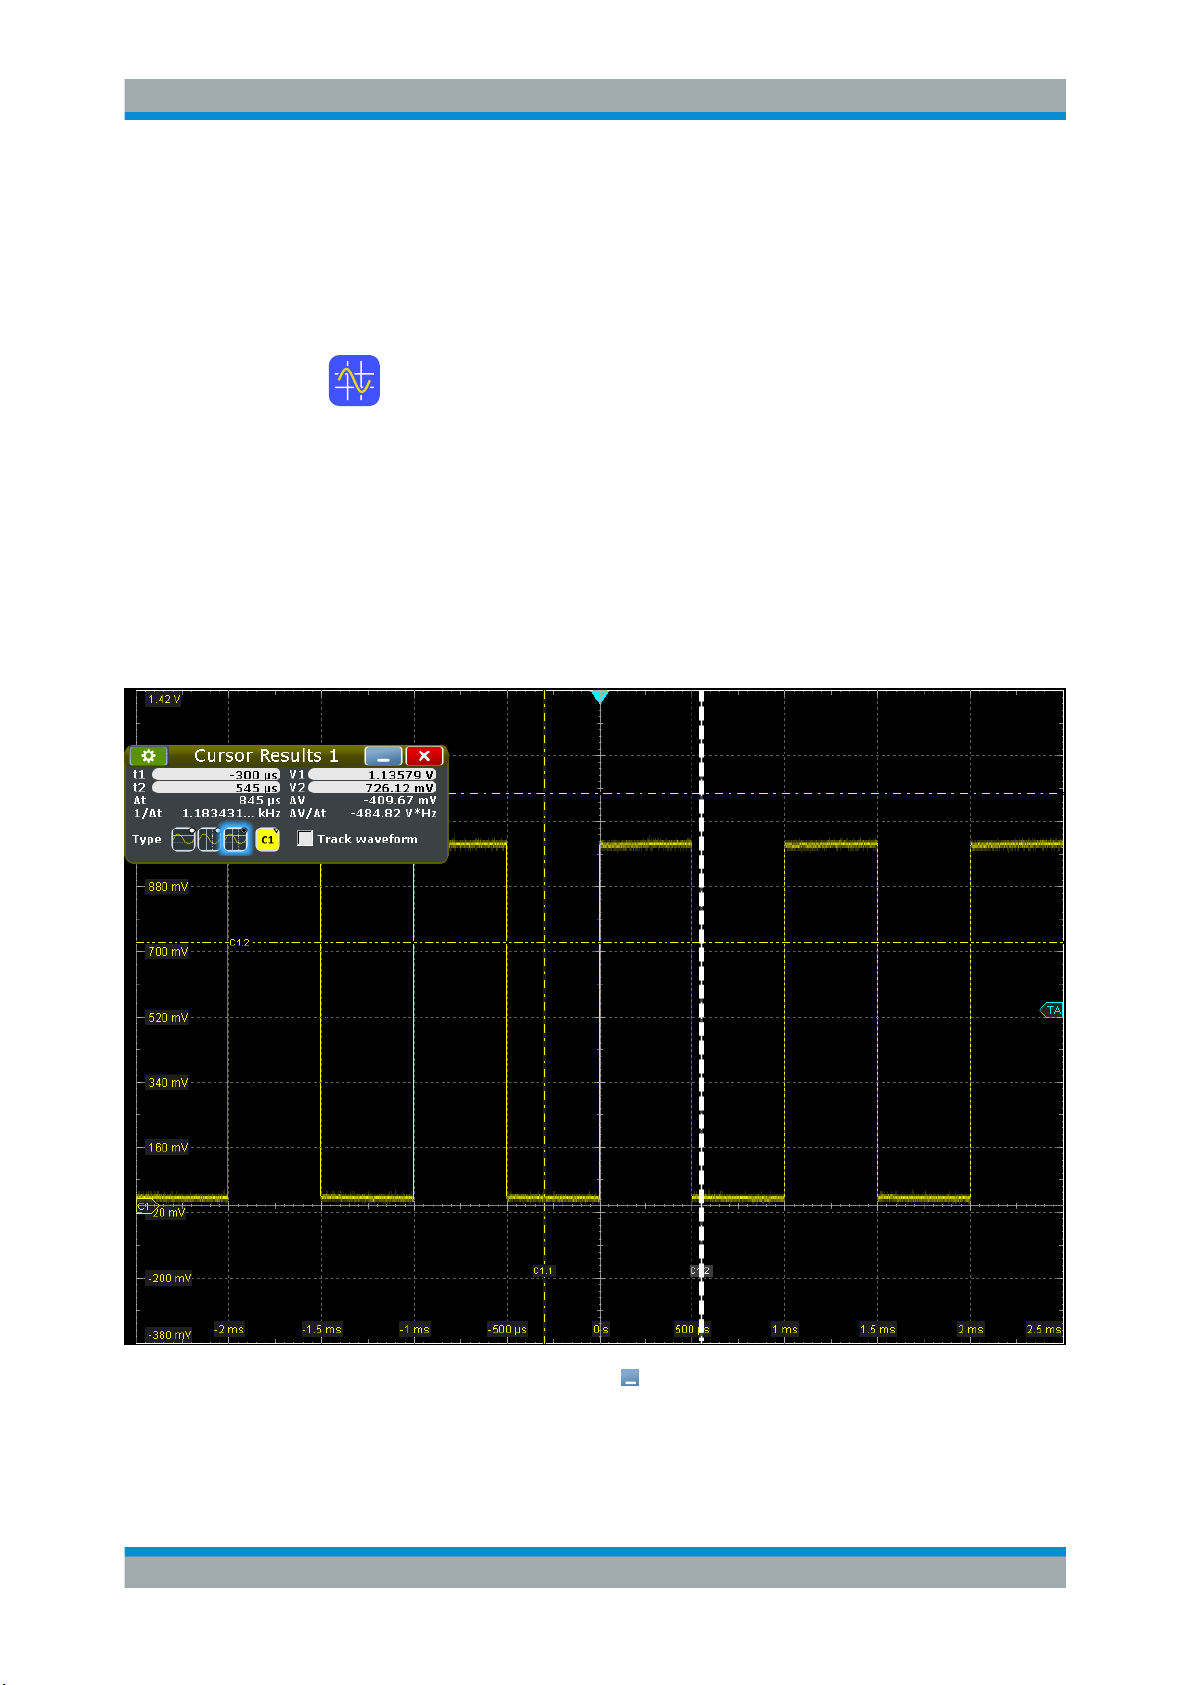
R&S®RTO2000
4.7.1 Performing a Cursor Measurement
Trying Out the Instrument
Performing Basic Measurements
1. Restore the default signal channel settings: Press the [Preset] and [Autoset] keys.
2. Tap the "Cursor" icon on the toolbar.
3. Draw a rectangle on the screen where you want to place the cursor lines.
The cursor lines appear in the diagram and the "Cursor Results" box opens. The
measured waveform values at the cursor positions are displayed.
4. You can move the cursor lines in different ways:
● Touch a cursor line and drag it on the screen.
● Tap a cursor line to activate it. Then turn the [Navigation] knob to adjust the
position.
● Enter the position values in the result box.
5.
To save space in the display, tap "Minimize" in the result box.
The most important results are shown in the result icon.
50Getting Started 1332.9719.02 ─ 08
Page 51
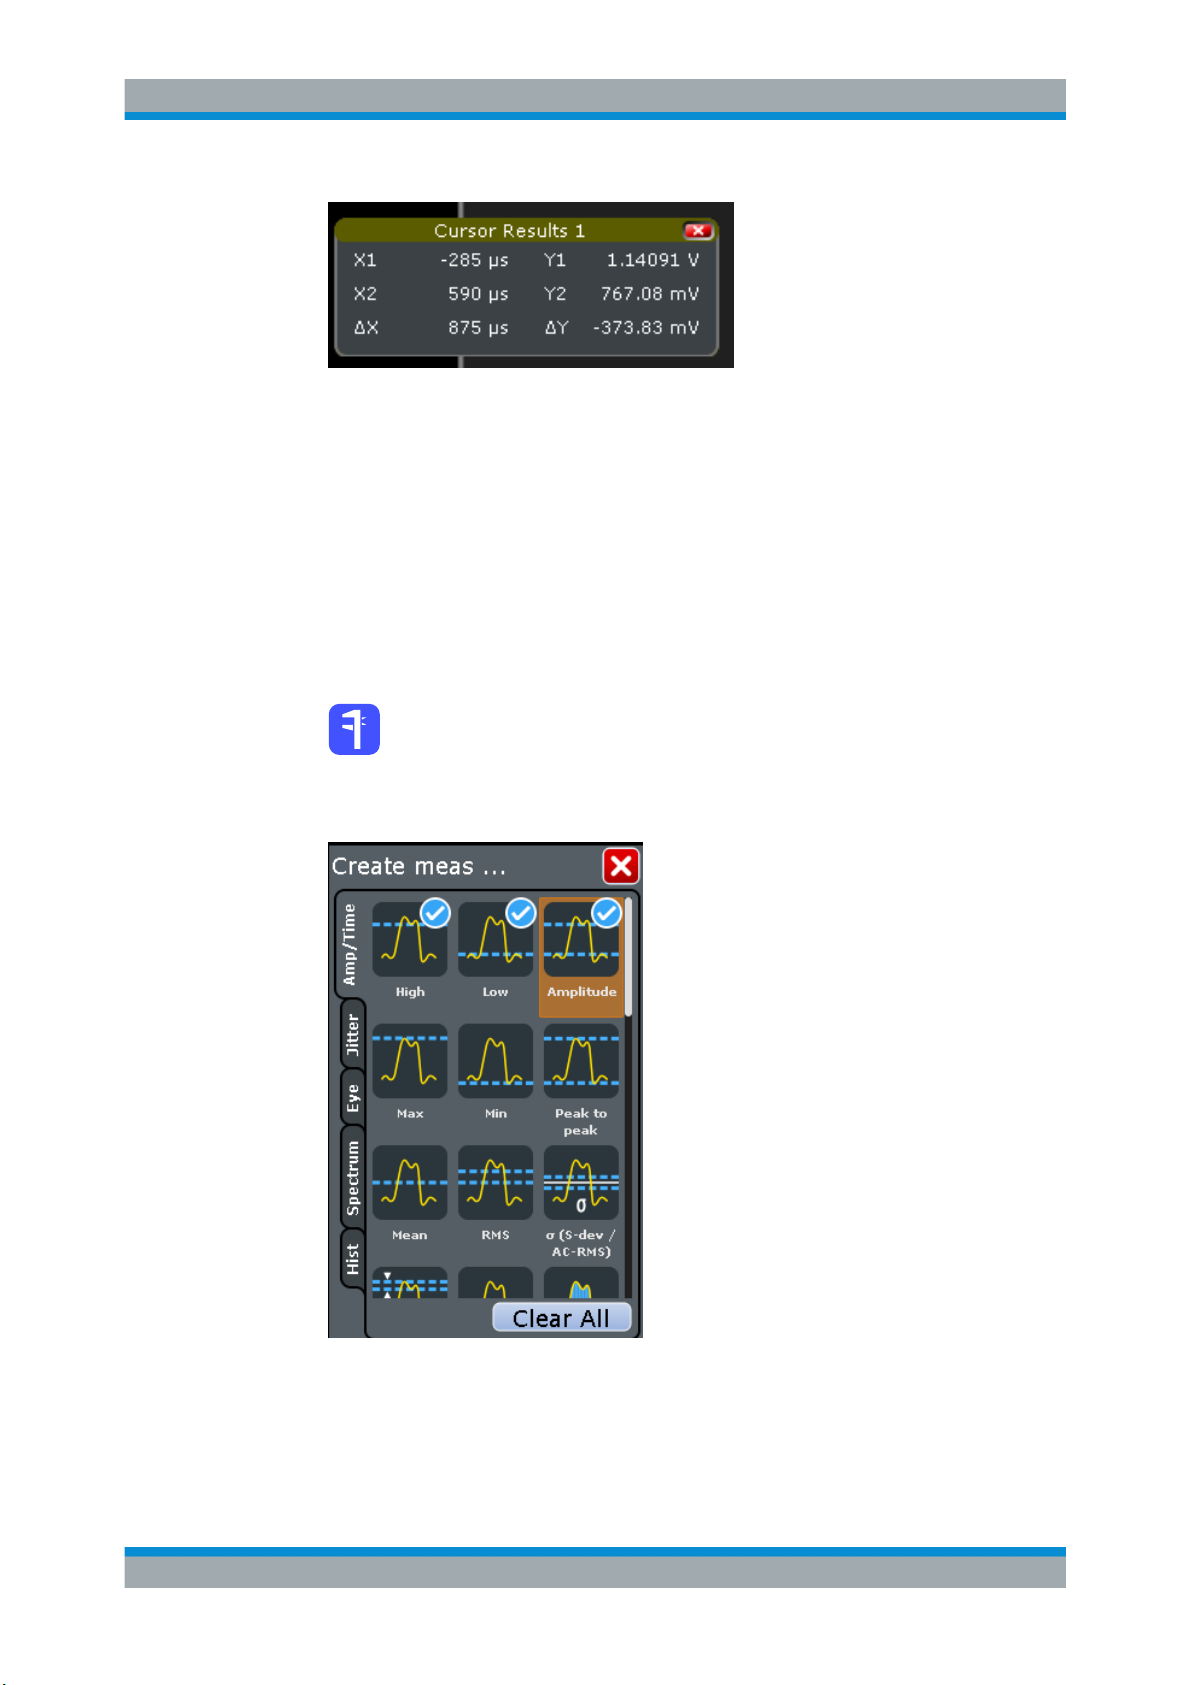
R&S®RTO2000
4.7.2 Performing an Amplitude Measurement
Trying Out the Instrument
Performing Basic Measurements
6. To remove the result icon and make room on the display for other results, tap the
red cross on the icon label.
To measure the voltages of a pulse quickly, measure the amplitude in the time domain.
1. To restore the default signal channel settings, press the [Preset] and [Autoset]
keys.
2. Tap the "Measurement" icon on the toolbar.
3. In the sidebar, select the measurement types, for example, "High", "Low", and
"Amplitude".
4. Tap the diagram in which you want to measure.
The selected measurement types are enabled, using the selected (focused) waveform as the source. The "Measurements" result box shows the measured values.
51Getting Started 1332.9719.02 ─ 08
Page 52
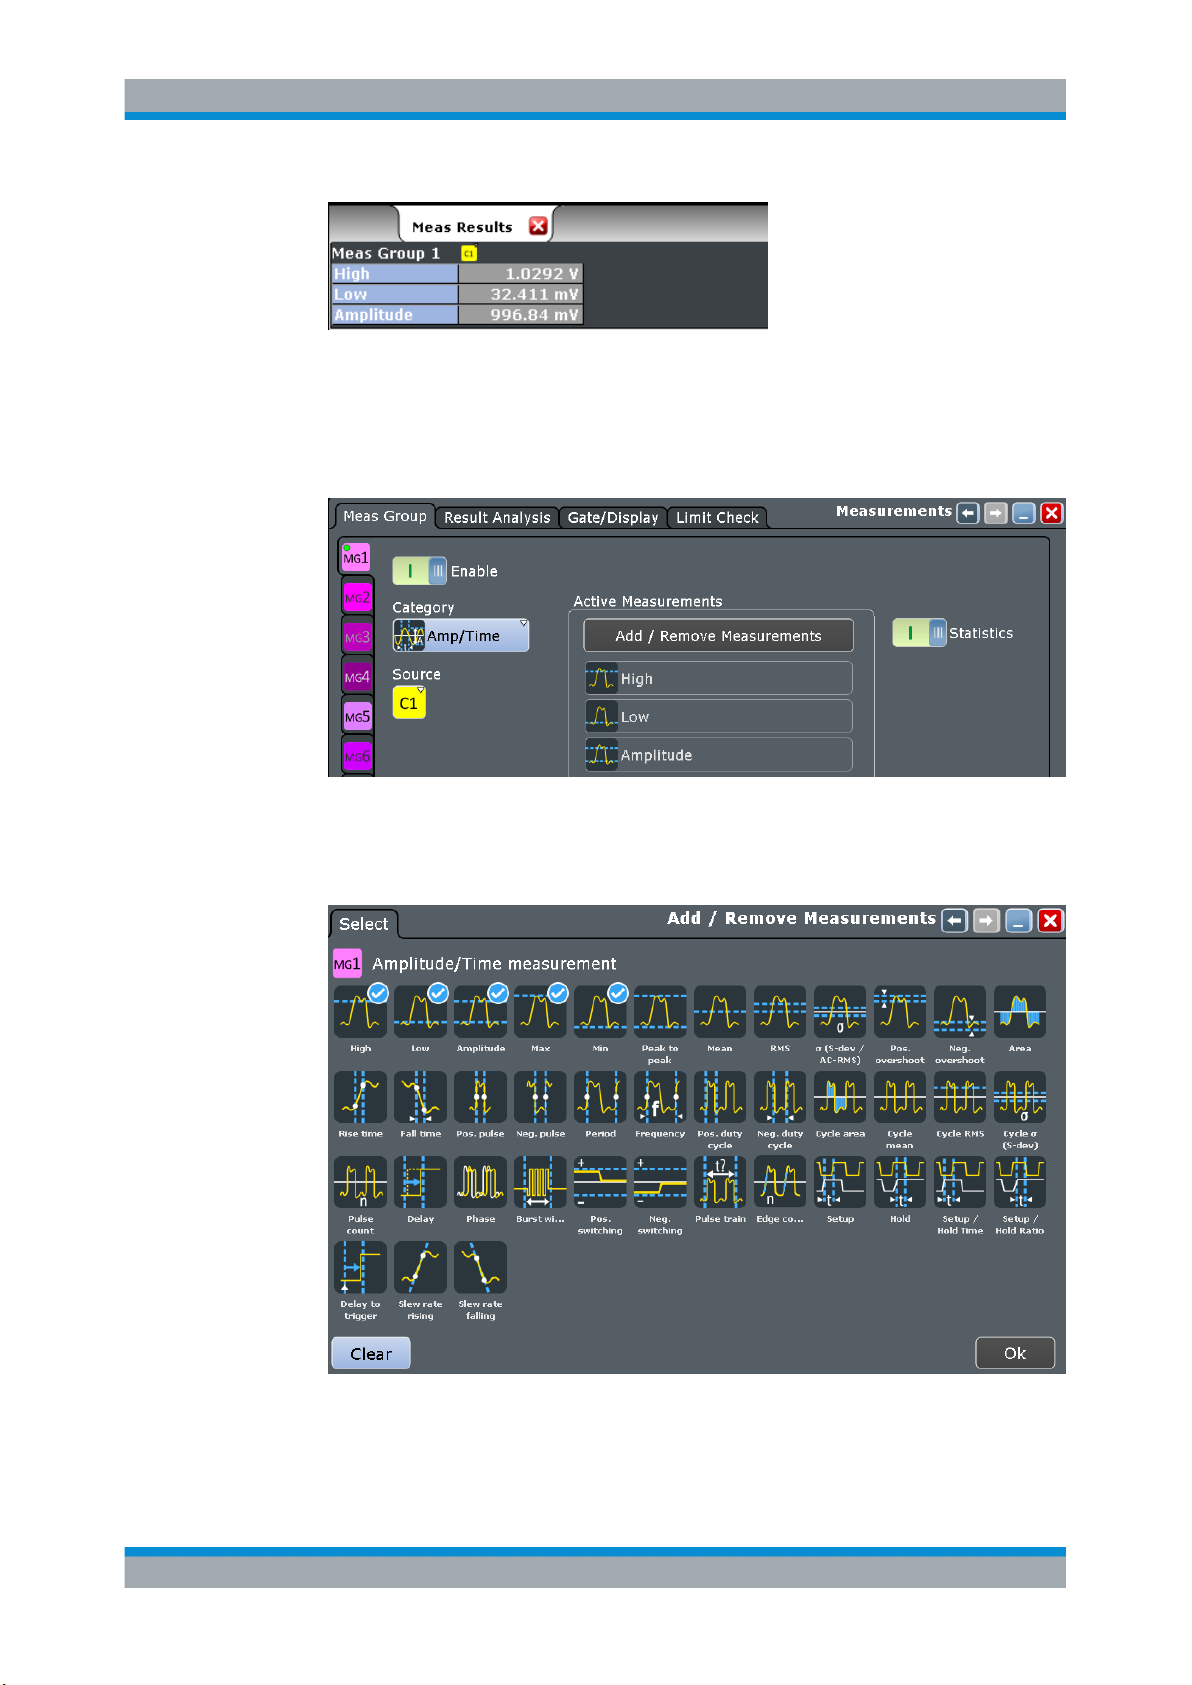
R&S®RTO2000
Trying Out the Instrument
Performing Basic Measurements
5. To display statistical results for the measurement, double-tap the results.
Alternatively, press the [Meas] key in the [Analysis] area of the front panel.
6. Enable the "Statistics" option.
7. Tap "Advanced Setup".
8. Tap "Add/Remove Measurements".
9. Select the required measurement types. For example, select "Min" and "Max" to
display the minimum and maximum values.
10. Tap "OK". Close the dialog box.
The result box displays all measurement results.
52Getting Started 1332.9719.02 ─ 08
Page 53
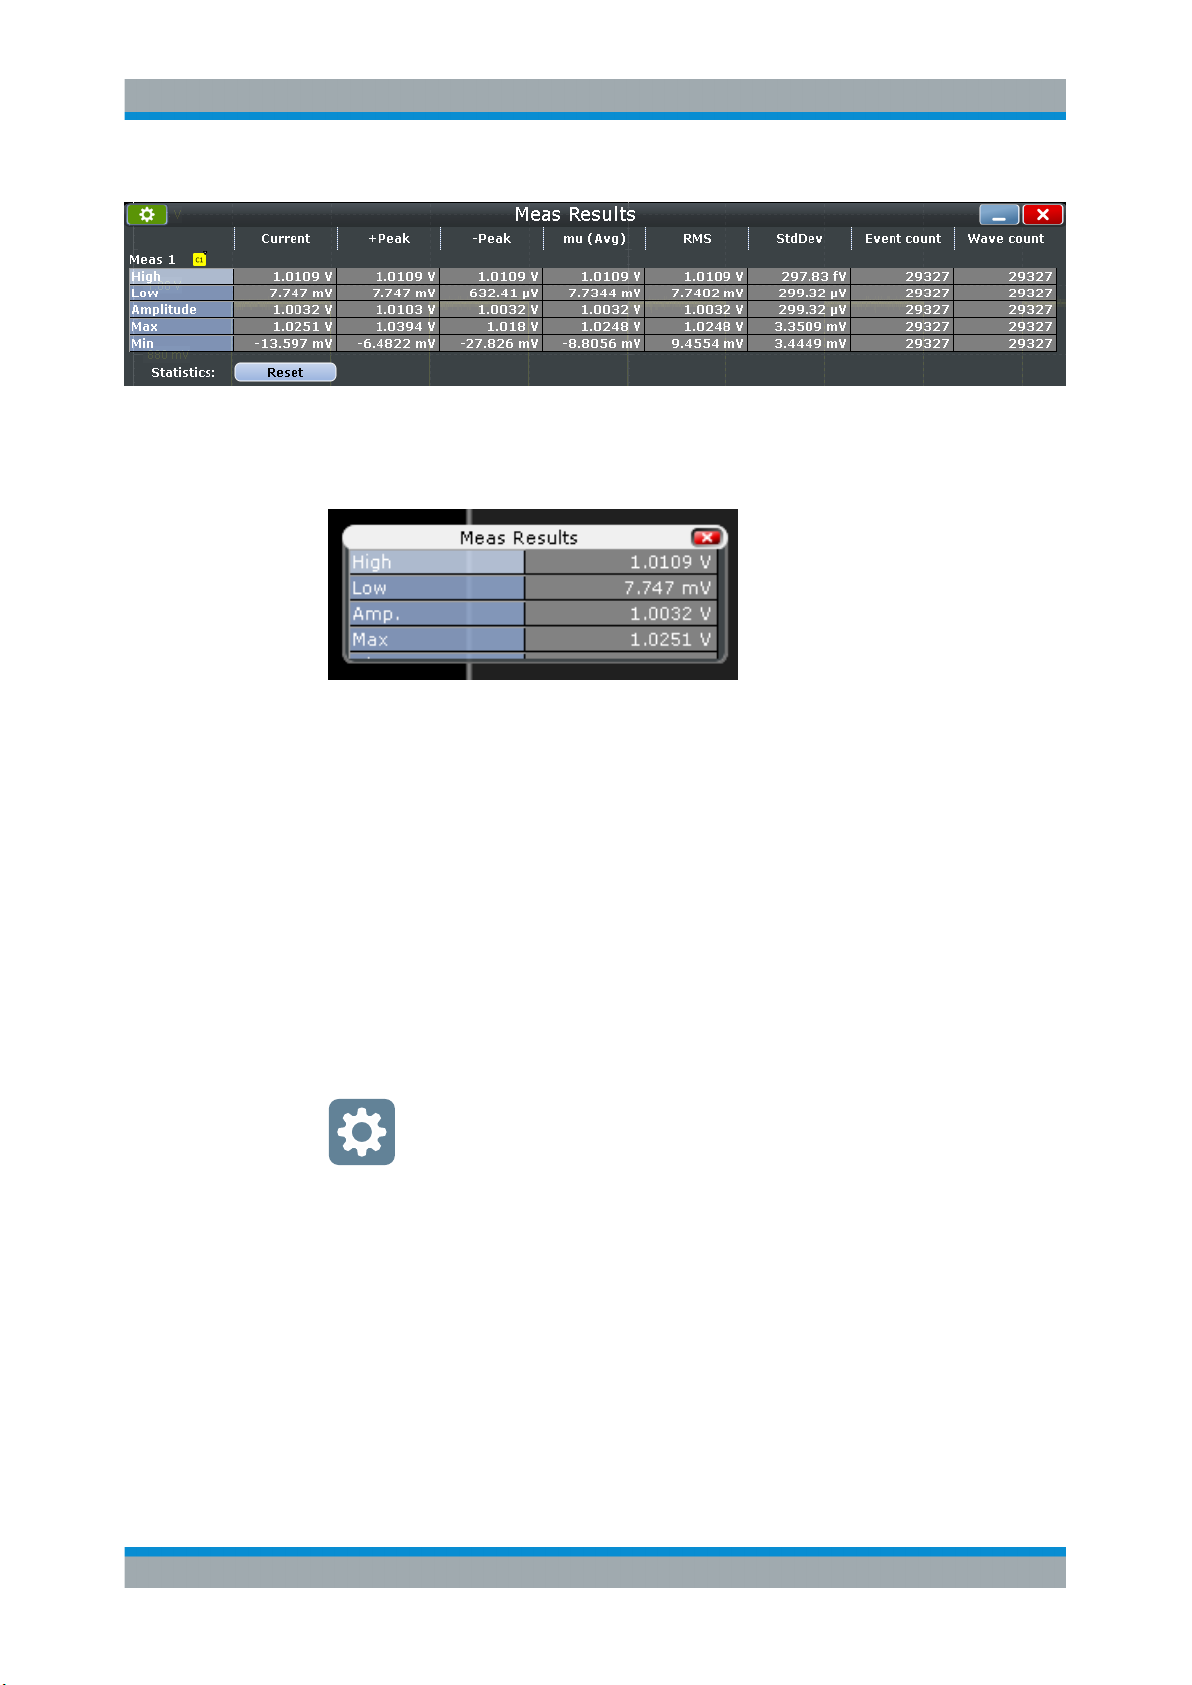
R&S®RTO2000
Trying Out the Instrument
Performing Basic Measurements
11. To save space in the display, touch the title of the results diagram, and drag it to
the sidebar.
Now you see the results in the result icon.
12. Close the result icon.
4.7.3 Performing and Configuring the Quick Measurement
A set of maximum 8 different measurements on one source can be performed at once,
simply by tapping the "Quick measurement" toolbar icon. You can configure the measurement types to be included in quick measurement. This way, you can repeat measurements quickly.
By default, the "Quick measurement" icon is not visible in the toolbar. Therefore, you
first configure the toolbar content.
To add a function to the toolbar
1. On the right of the toolbar, tap the "Toolbar configuration" icon.
2. Enable "Quick meas".
53Getting Started 1332.9719.02 ─ 08
Page 54
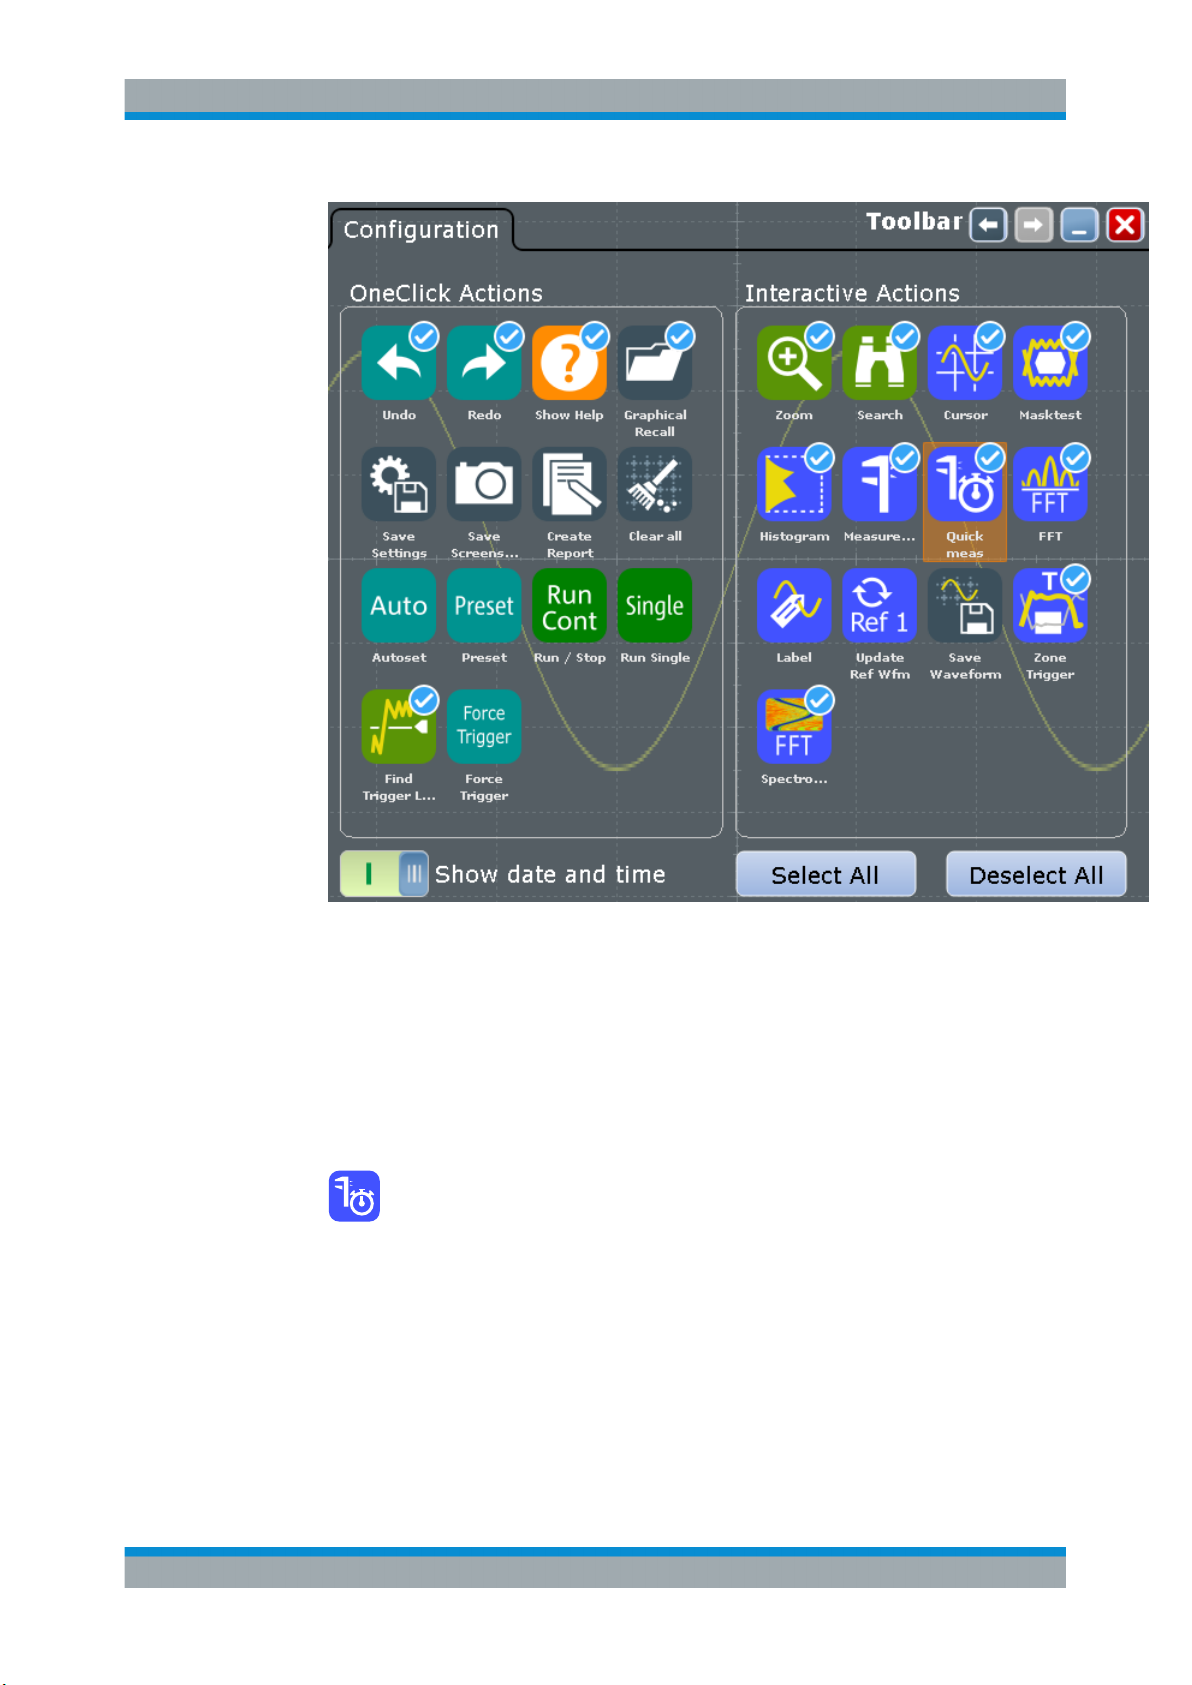
R&S®RTO2000
Trying Out the Instrument
Performing Basic Measurements
3. Close the dialog box.
In the following examples, you start a quick measurement and change the measurement configuration.
To start the quick measurement
1. Press [Autoset].
2. Tap the "Quick measurement" icon on the toolbar.
3. Tap the diagram.
The result box shows the results of the default quick measurement.
54Getting Started 1332.9719.02 ─ 08
Page 55
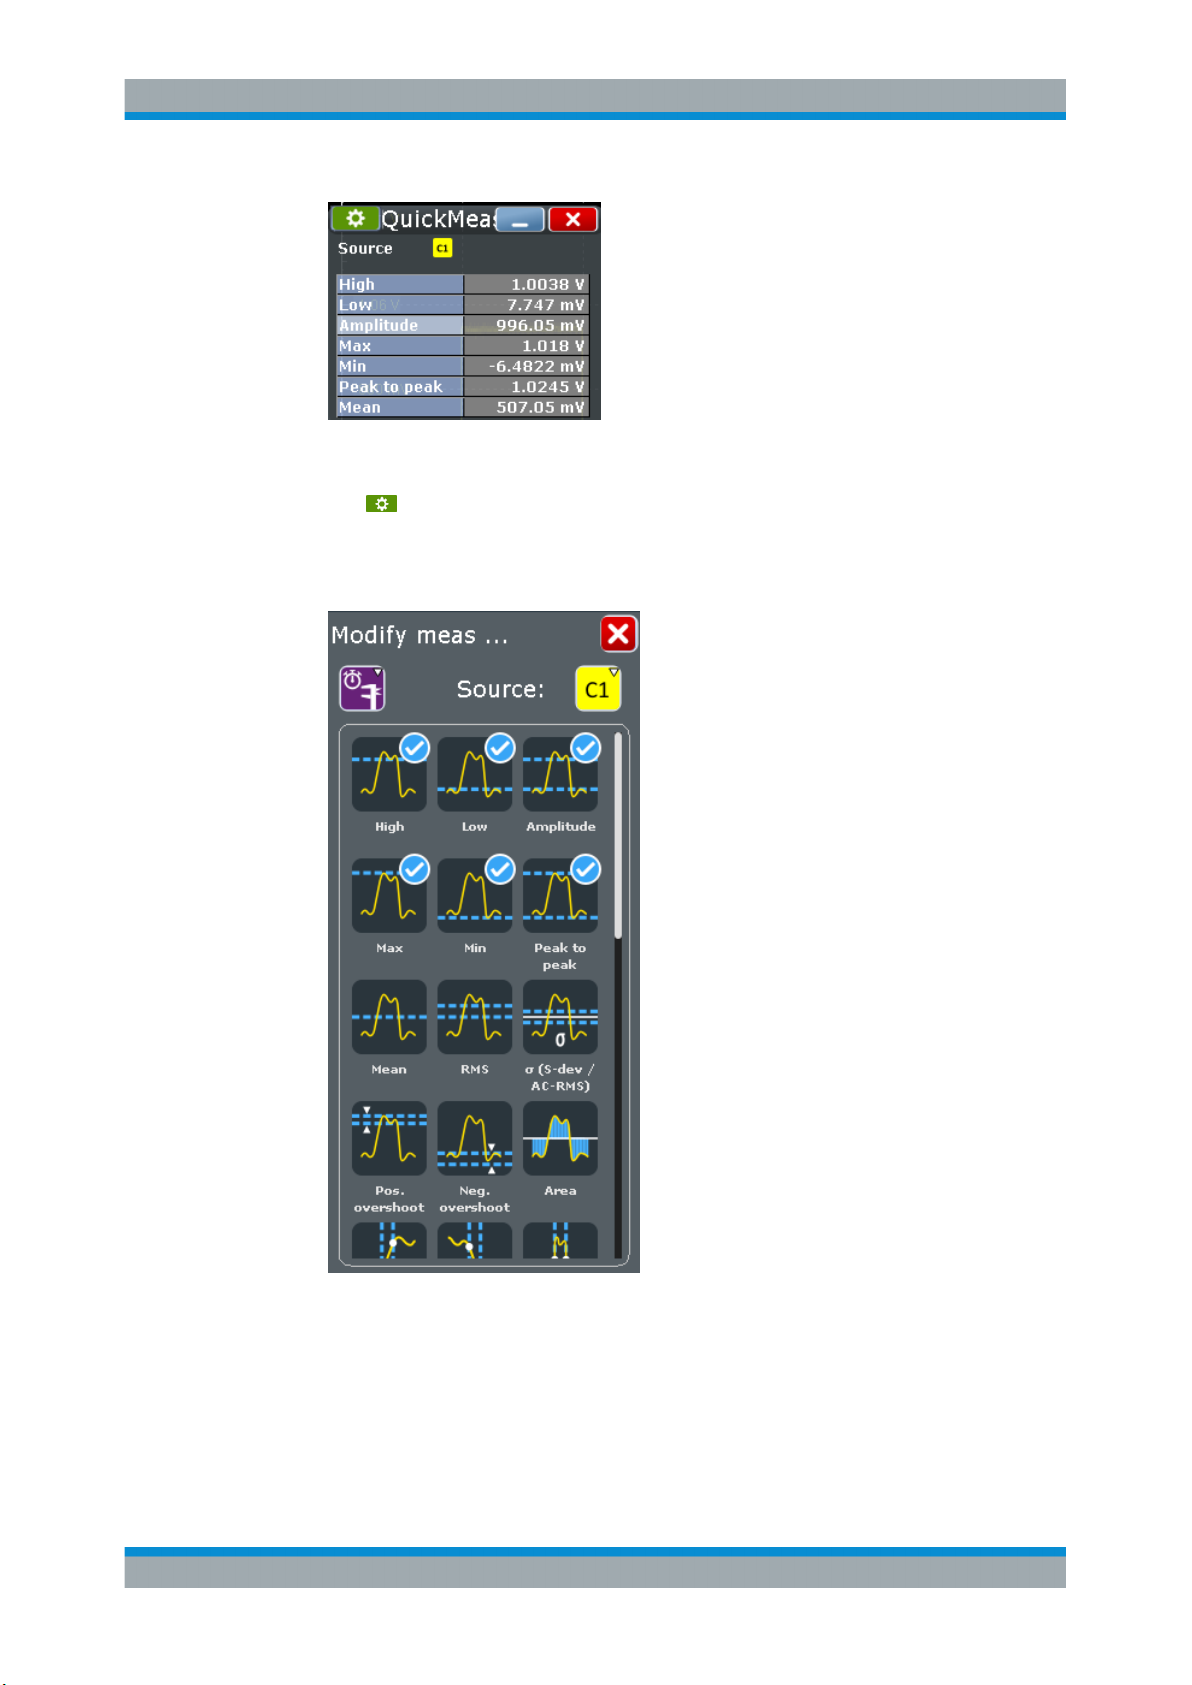
R&S®RTO2000
Trying Out the Instrument
Performing Basic Measurements
To configure the quick measurement
1.
Tap .
2. In the sidebar on the top, select the quick measurement if necessary.
3. In the sidebar, disable the Mean and RMS measurements.
4. Scroll down and select "Period".
Now the result box also shows the result of the period measurement.
5. Select "Frequency".
55Getting Started 1332.9719.02 ─ 08
Page 56
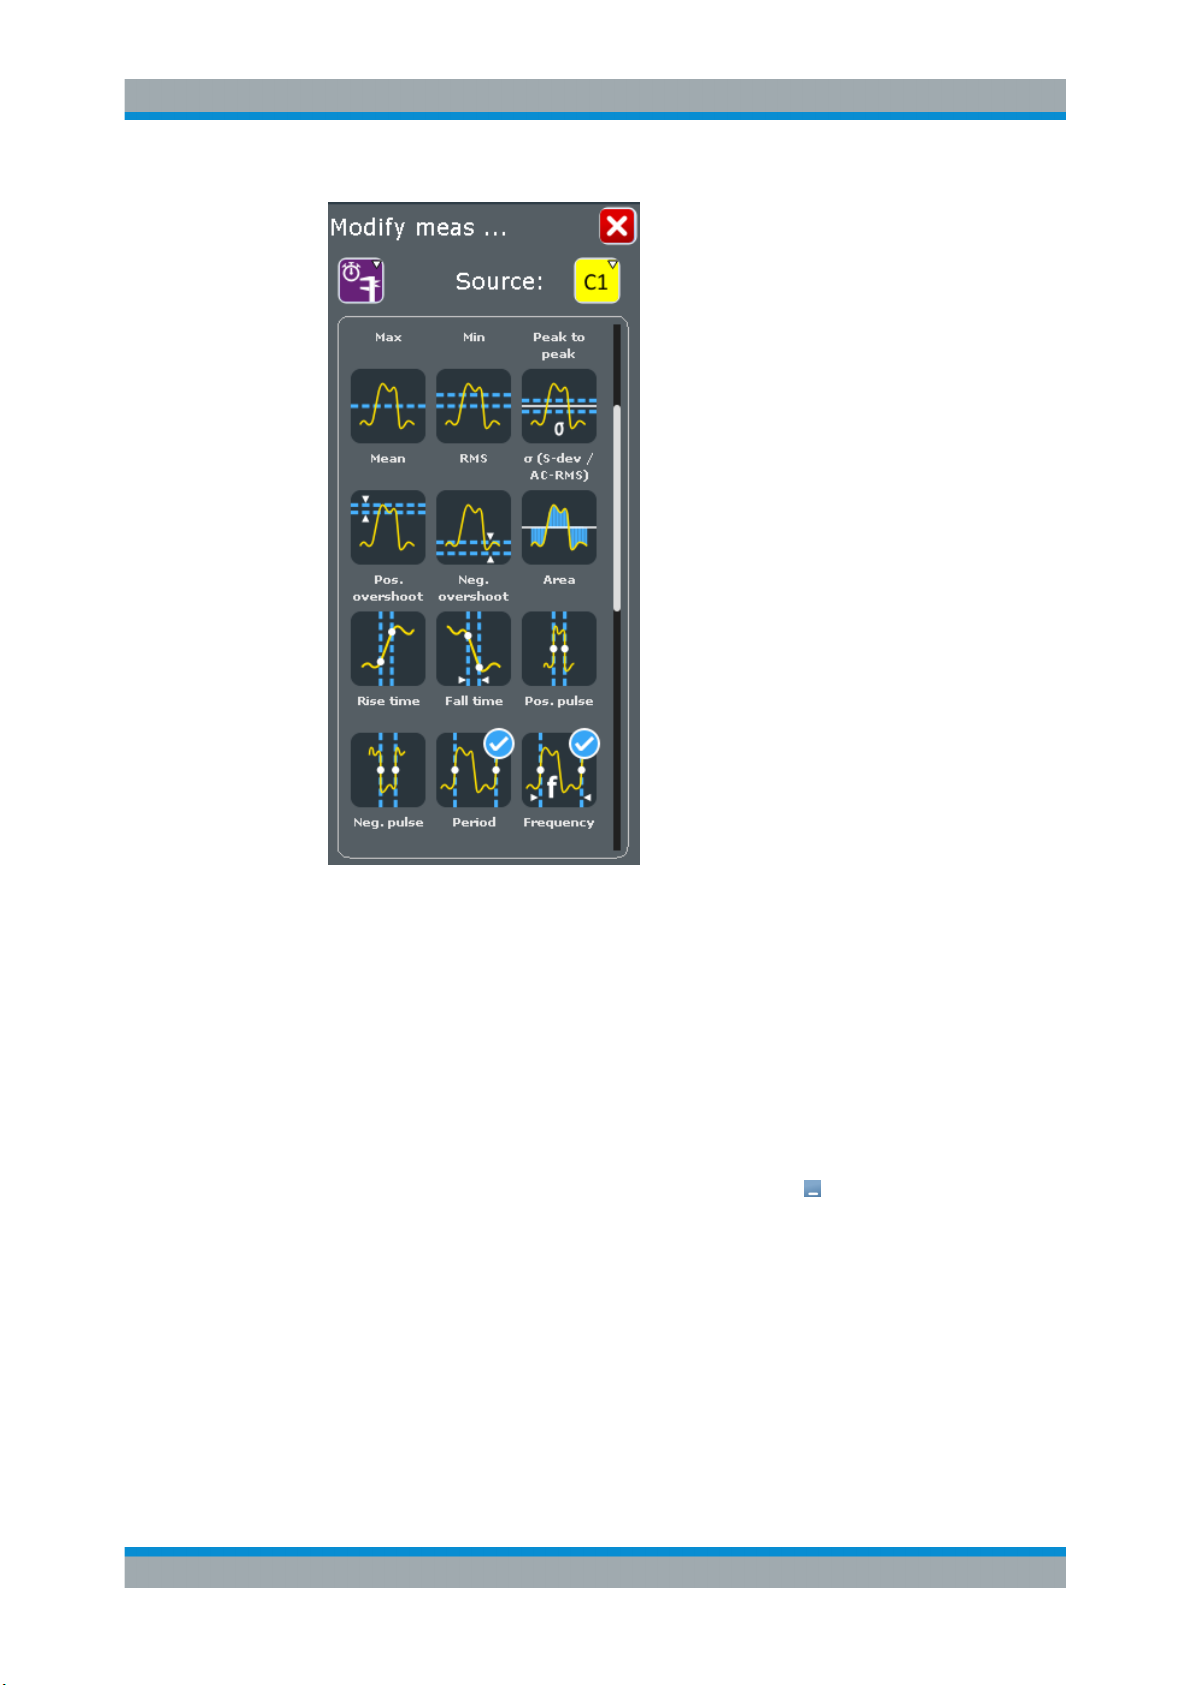
R&S®RTO2000
Trying Out the Instrument
Performing Basic Measurements
Now the result box also shows the result of the frequency measurements.
6. Tap "Advanced Setup".
In the list of selected measurements, you see a "Settings" icon at the period and
frequency measurements. Tap the icon to adjust measurement-specific settings.
7. Tap "Set as QuickMeas".
The current configuration is set as default quick measurement and can be repeated
until you save another configuration.
8. Close the dialog box.
9.
To save space in the display, minimize the result box:
Do not close the result icon, as you need the results for the search example (see
Chapter 4.10, "Performing a Search", on page 63).
56Getting Started 1332.9719.02 ─ 08
Page 57
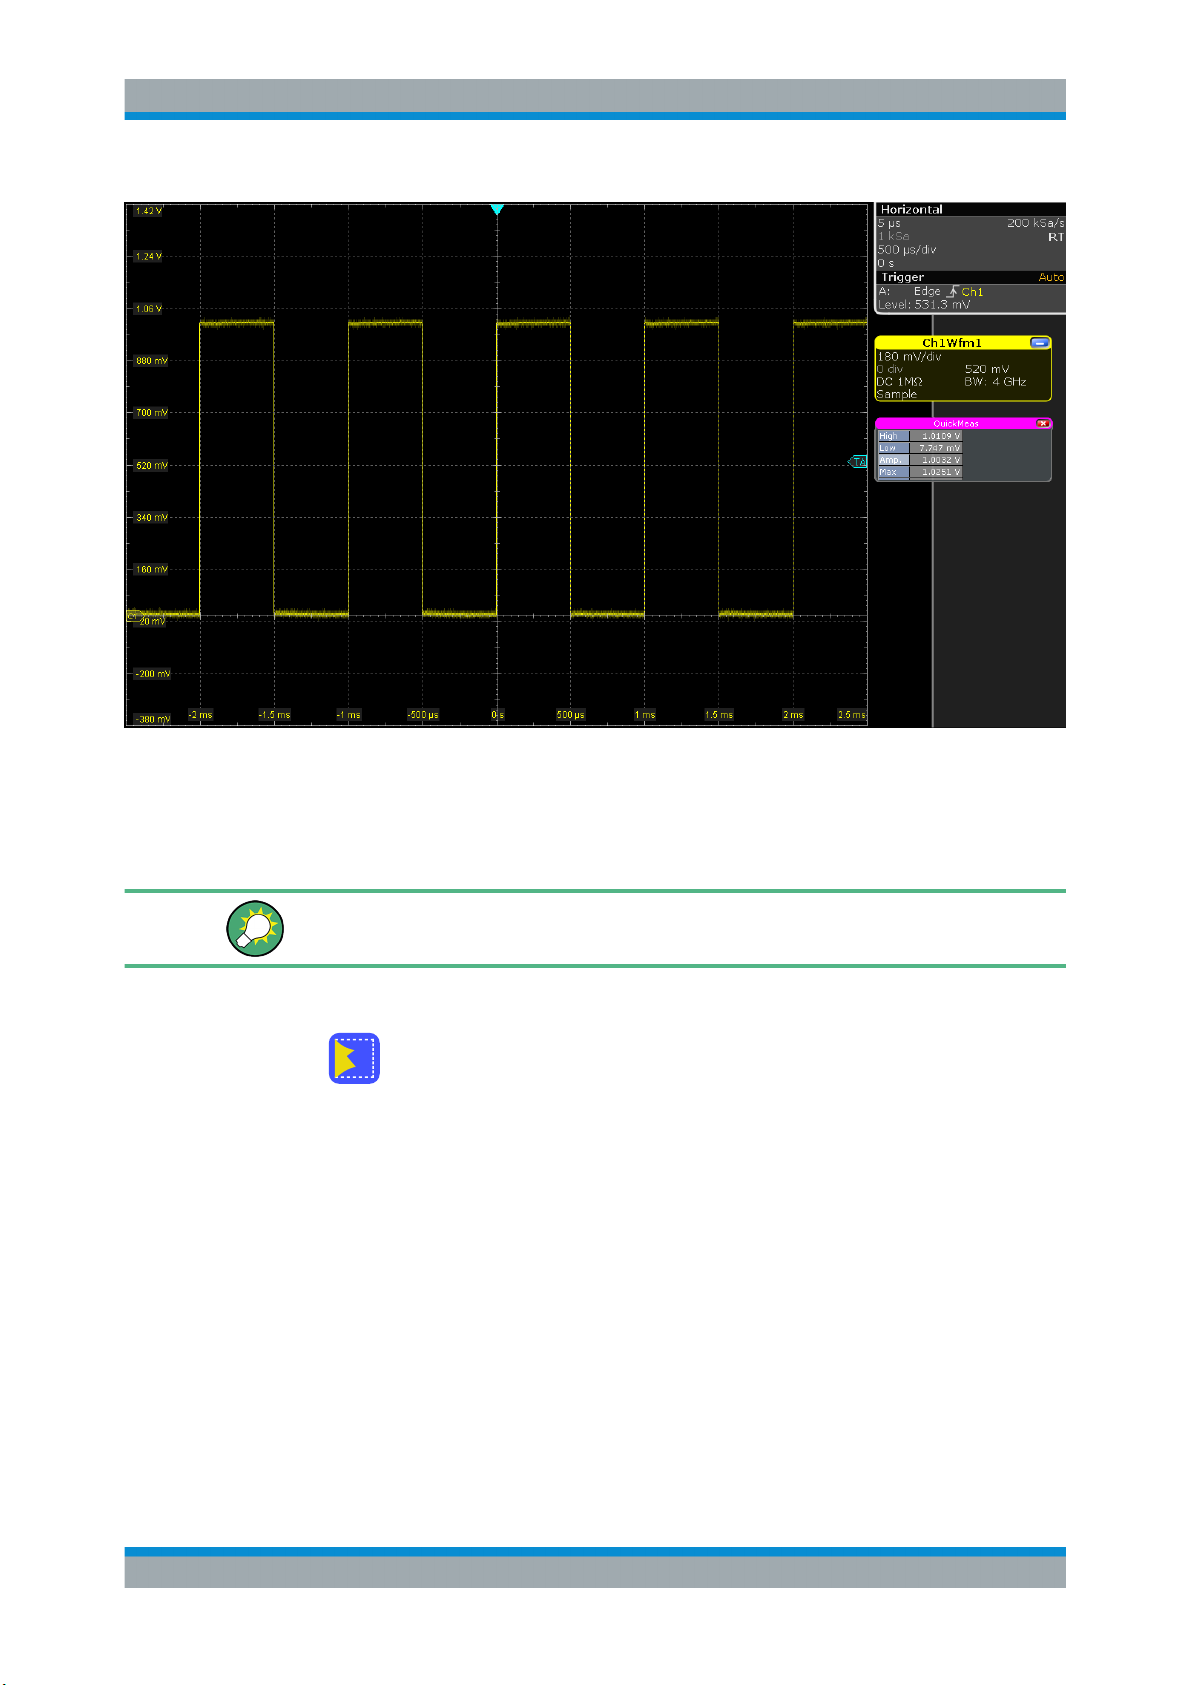
R&S®RTO2000
Trying Out the Instrument
Performing Basic Measurements
4.7.4 Displaying a Histogram
Histograms are useful to analyze the occurrence of measurement values statistically.
The usage of histograms is also shown in a short video that is available on the instrument: "File" menu > "Tutorials" > "Histogram".
1. Tap the "Histogram" icon on the toolbar.
2. Tap the diagram in which you want to generate the histogram.
A vertical histogram is defined and displayed.
57Getting Started 1332.9719.02 ─ 08
Page 58
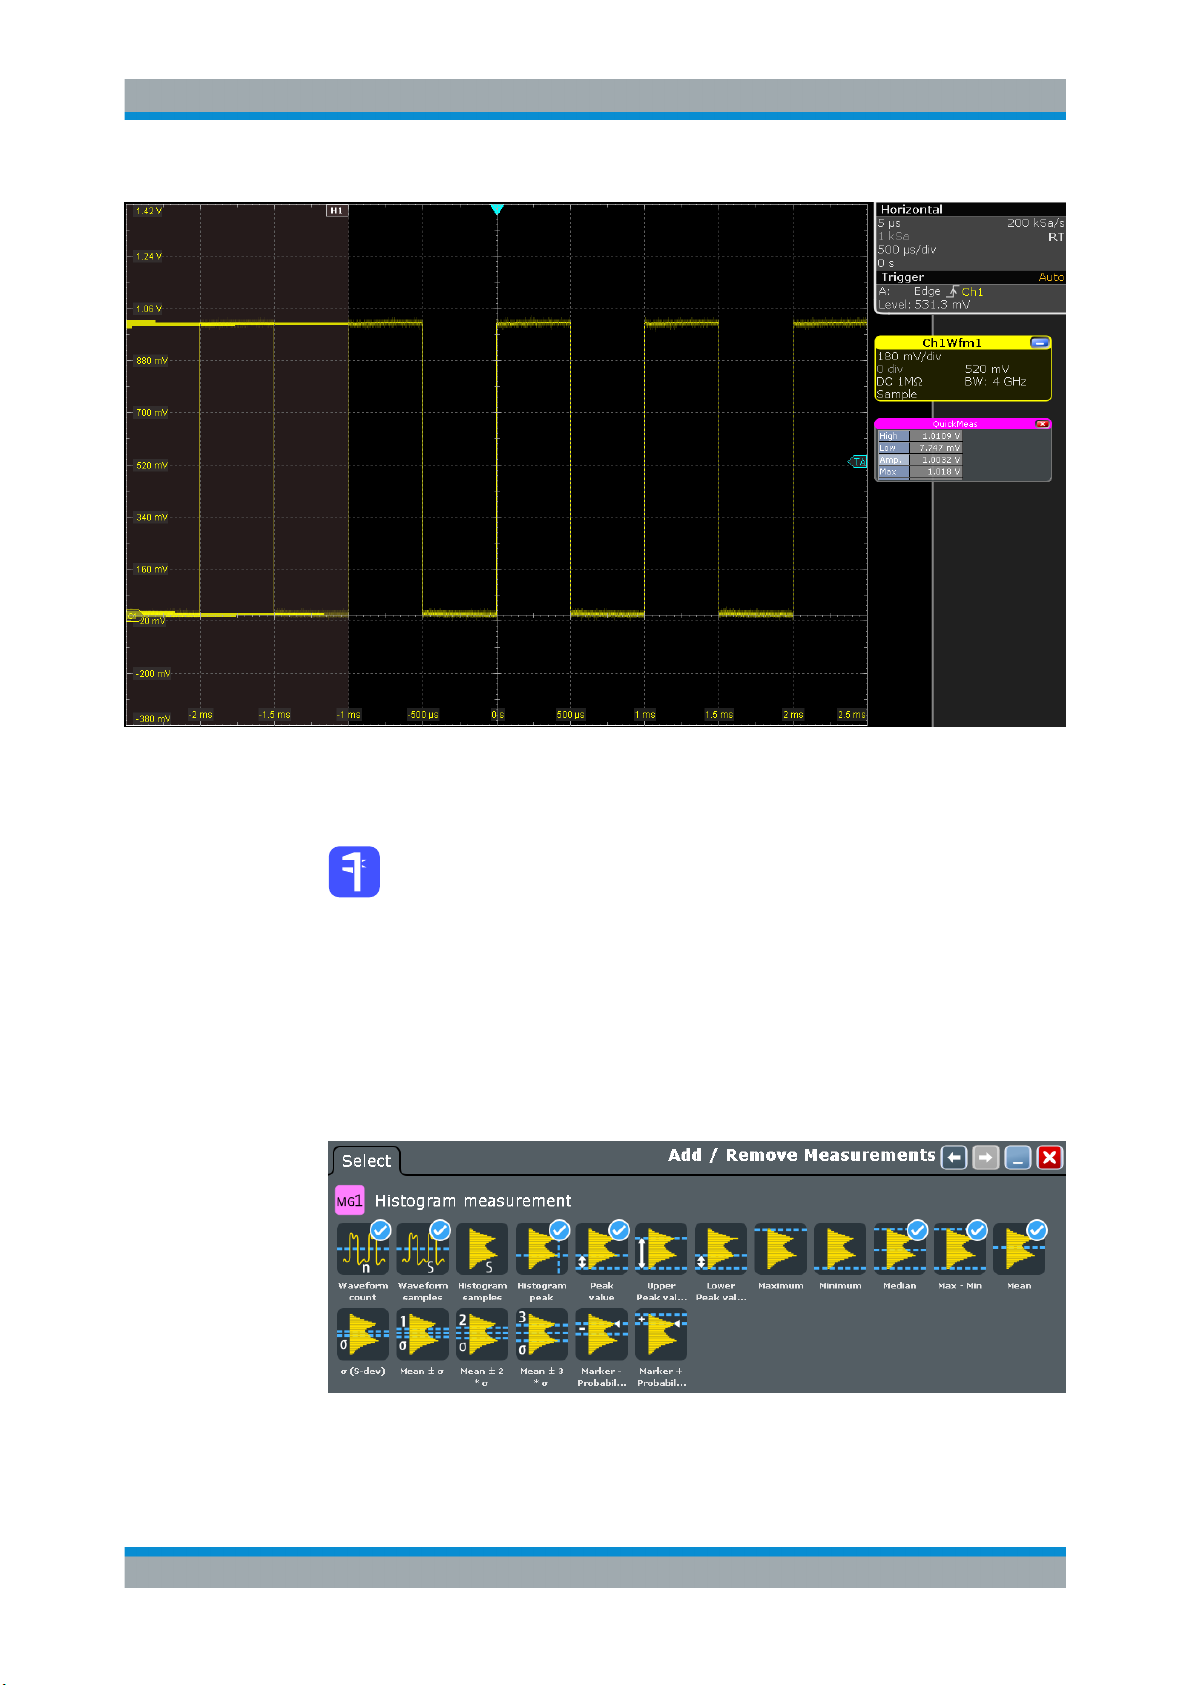
R&S®RTO2000
Trying Out the Instrument
Performing Basic Measurements
Tip: You can also draw a rectangle on the screen to define the area on which the
histogram is to be based. The histogram range is indicated in the diagram.
3. To measure on the histogram, tap the "Measurement" icon on the toolbar.
4. Tap the histogram.
The waveform count for the histogram is displayed.
5. To display more measurement results for the histogram, press the [Meas] key on
the front panel.
6. In the "Measurements" dialog box, tap "Add/Remove Measurements".
7. Select the required histogram measurement types.
8. Tap "OK". Close the dialog box.
The histogram measurement results are displayed in the result box.
58Getting Started 1332.9719.02 ─ 08
Page 59
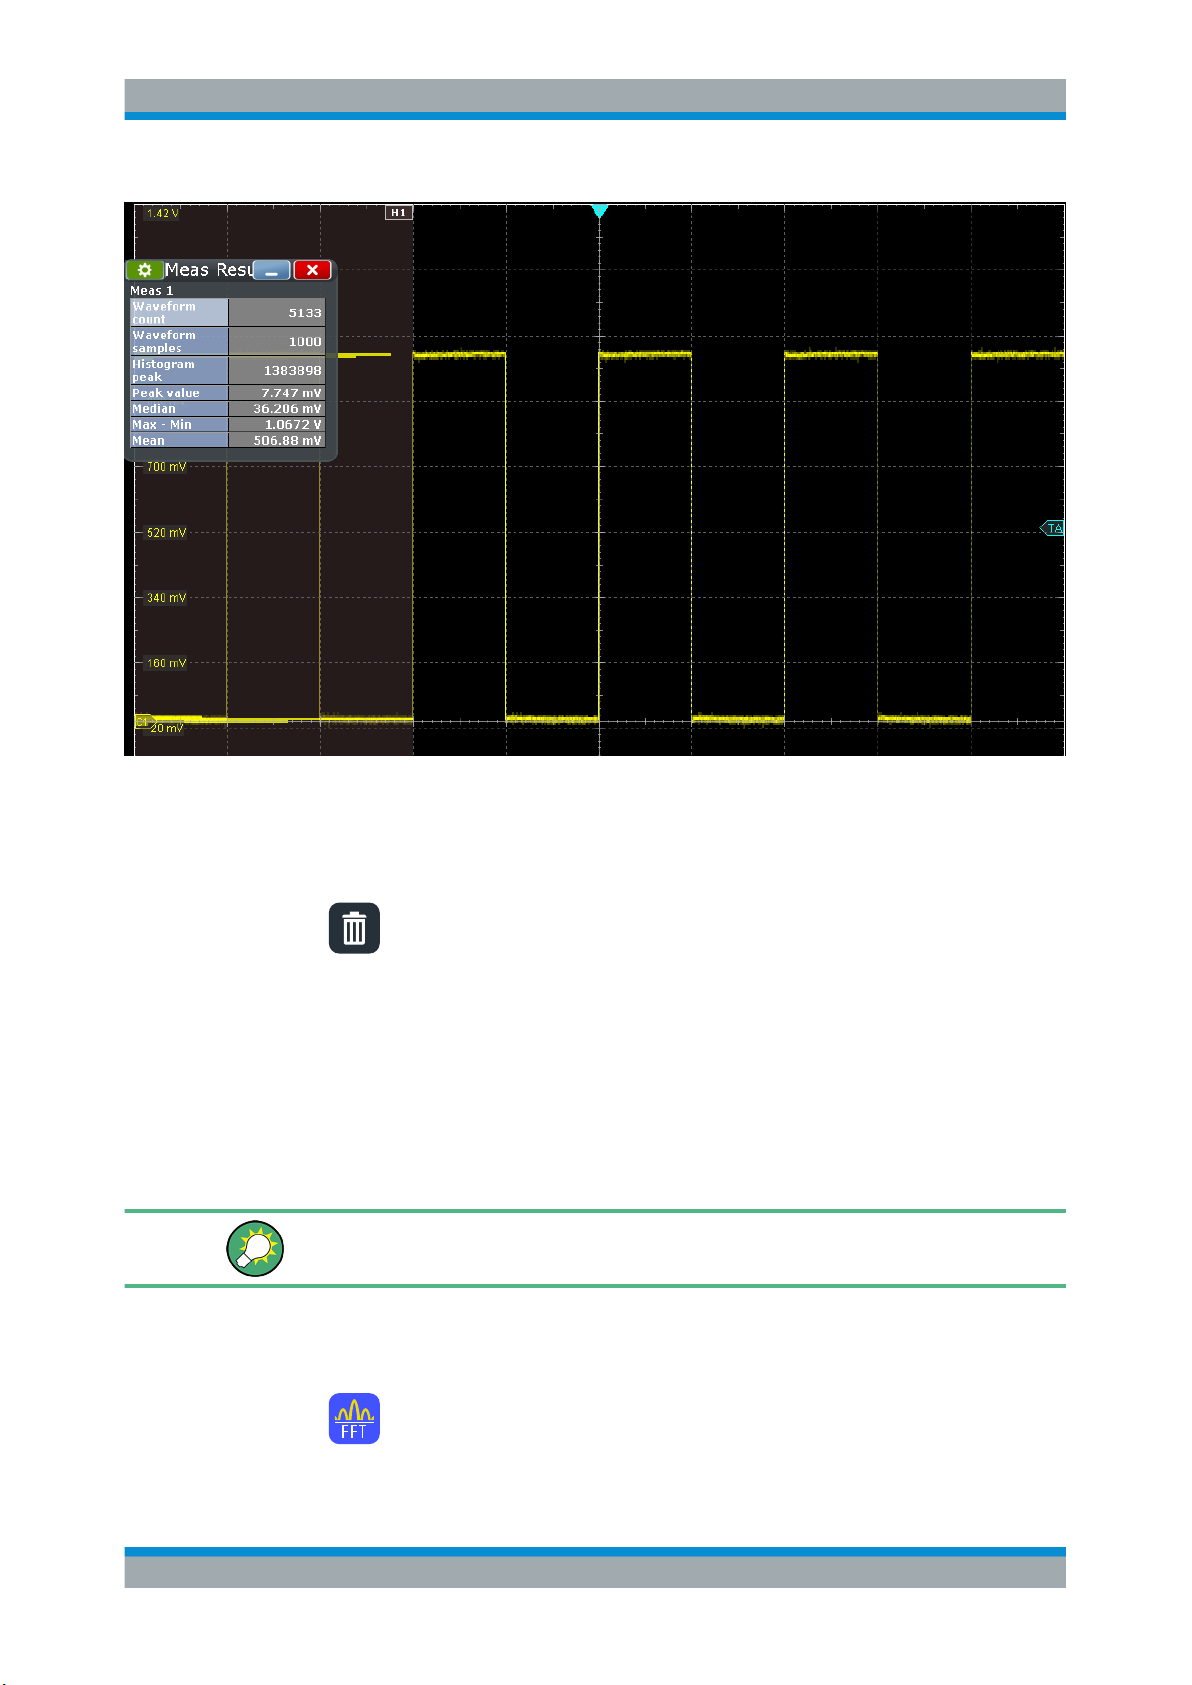
R&S®RTO2000
Trying Out the Instrument
Performing a Basic FFT Analysis
Tip: Alternatively to steps 5 to 8, you can double-tap the measurement results, and
select the appropriate measurement group and the measurements in the sidebar.
9. To remove the histogram, tap the "Delete" icon on the toolbar, and then tap the histogram.
The histogram and any measurements based on that histogram are deactivated.
4.8 Performing a Basic FFT Analysis
During FFT analysis, a signal in the time domain is converted to a spectrum of frequencies. A basic spectrum waveform can be displayed quickly.
The usage of FFT is also shown in a short video that is available on the instrument:
"File" menu > "Tutorials" > "FFT".
1. Restore the default signal channel settings by pressing the [Autoset] key.
2. Tap the "FFT" icon on the toolbar. Then tap the diagram.
59Getting Started 1332.9719.02 ─ 08
Page 60
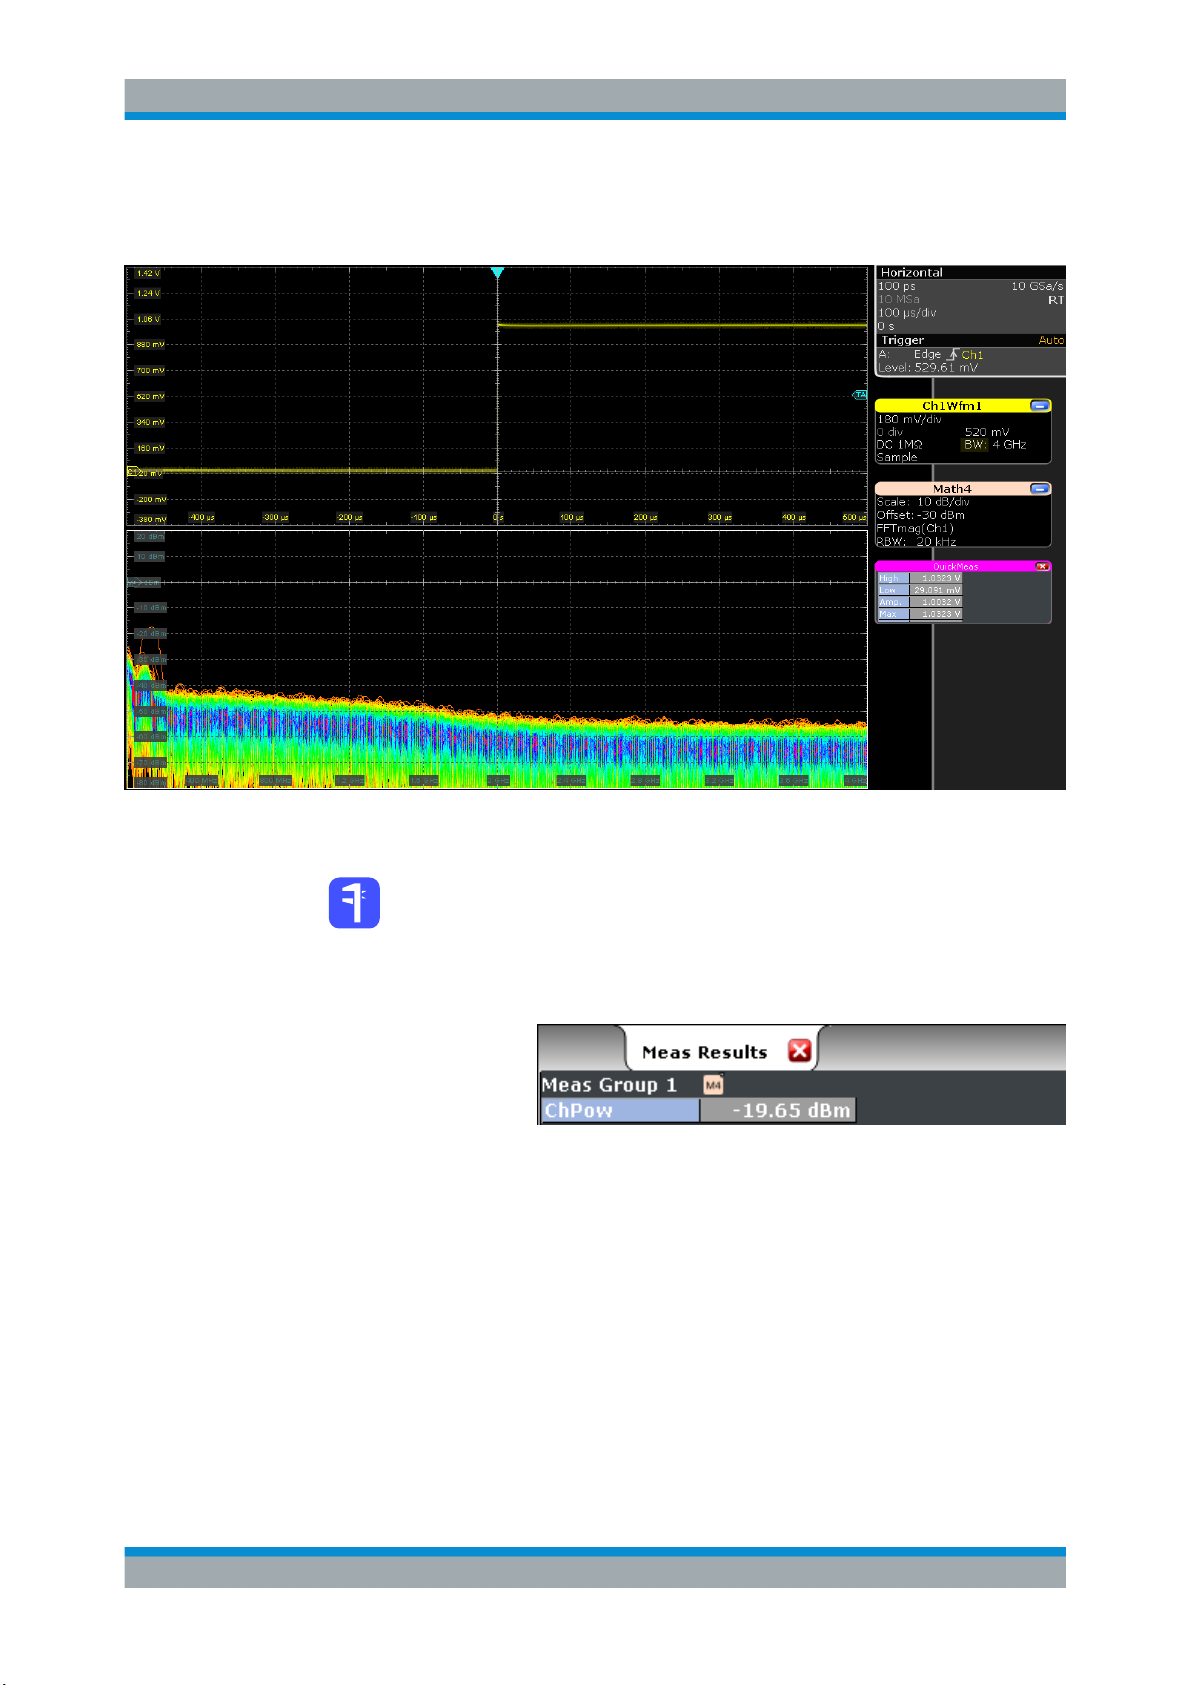
R&S®RTO2000
Trying Out the Instrument
Performing a Basic FFT Analysis
A math waveform is configured that uses the "Mag(FFT(x))" operator with Ch1 as
source. The spectrum waveform is displayed in a new diagram.
3. To measure the spectrum on the math channel, tap the "Measurement" icon on the
toolbar.
4. Tap the spectrum waveform.
The channel power is displayed below the FFT diagram.
5. Double-tap the spectrum waveform.
The sidebar opens, showing main FFT settings.
6. Set the "Center frequency" to 1 MHz.
The instrument adjusts the frequency span automatically.
Close the sidebar.
60Getting Started 1332.9719.02 ─ 08
Page 61
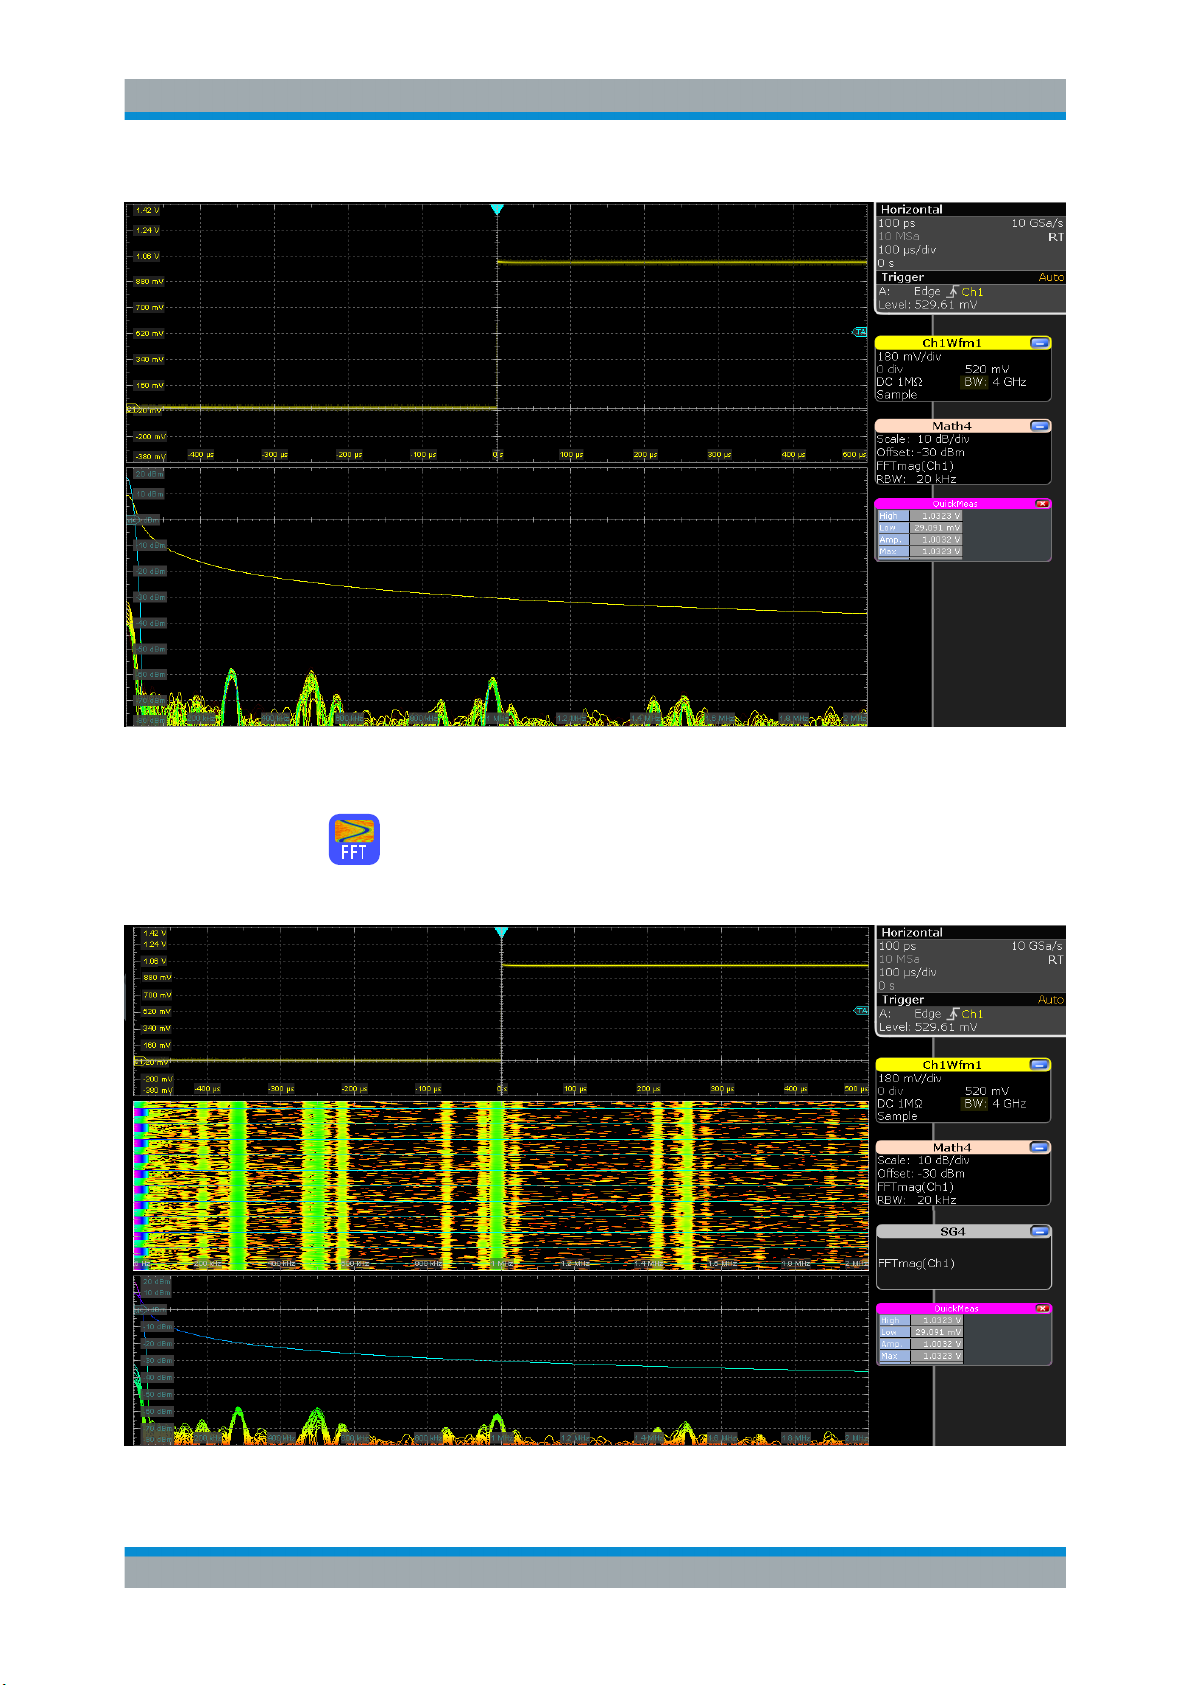
R&S®RTO2000
Trying Out the Instrument
Performing a Basic FFT Analysis
7. If the spectrum analysis option is installed on your instrument, the spectrum icon
on the toolbar.
8. Tap the FFT waveform.
61Getting Started 1332.9719.02 ─ 08
Page 62
R&S®RTO2000
4.9 Performing Mathematical Calculations
Trying Out the Instrument
Performing Mathematical Calculations
9. To remove the FFT results, tap the "Delete" icon and then the spectrum waveform.
10. Close the "Measurement" results.
In addition to the measured waveforms, you can display calculated data to compare
the current measurement result with.
For example, you can display the absolute value of the waveform values as a math
waveform.
1. Press [Autoset].
2. Press the [Math] key.
3. In the "Setup" tab, select the "M1" vertical tab.
4. Select the "Basic" subtab.
5. Tap the "Source1" icon and select "Ch1Wfm1".
6. Tap the "Operator" icon and select "|x|".
7. Tap "Enable math waveform" to display the math waveform.
8. Close the "Math" dialog box.
The original and the math waveforms are displayed.
62Getting Started 1332.9719.02 ─ 08
Page 63
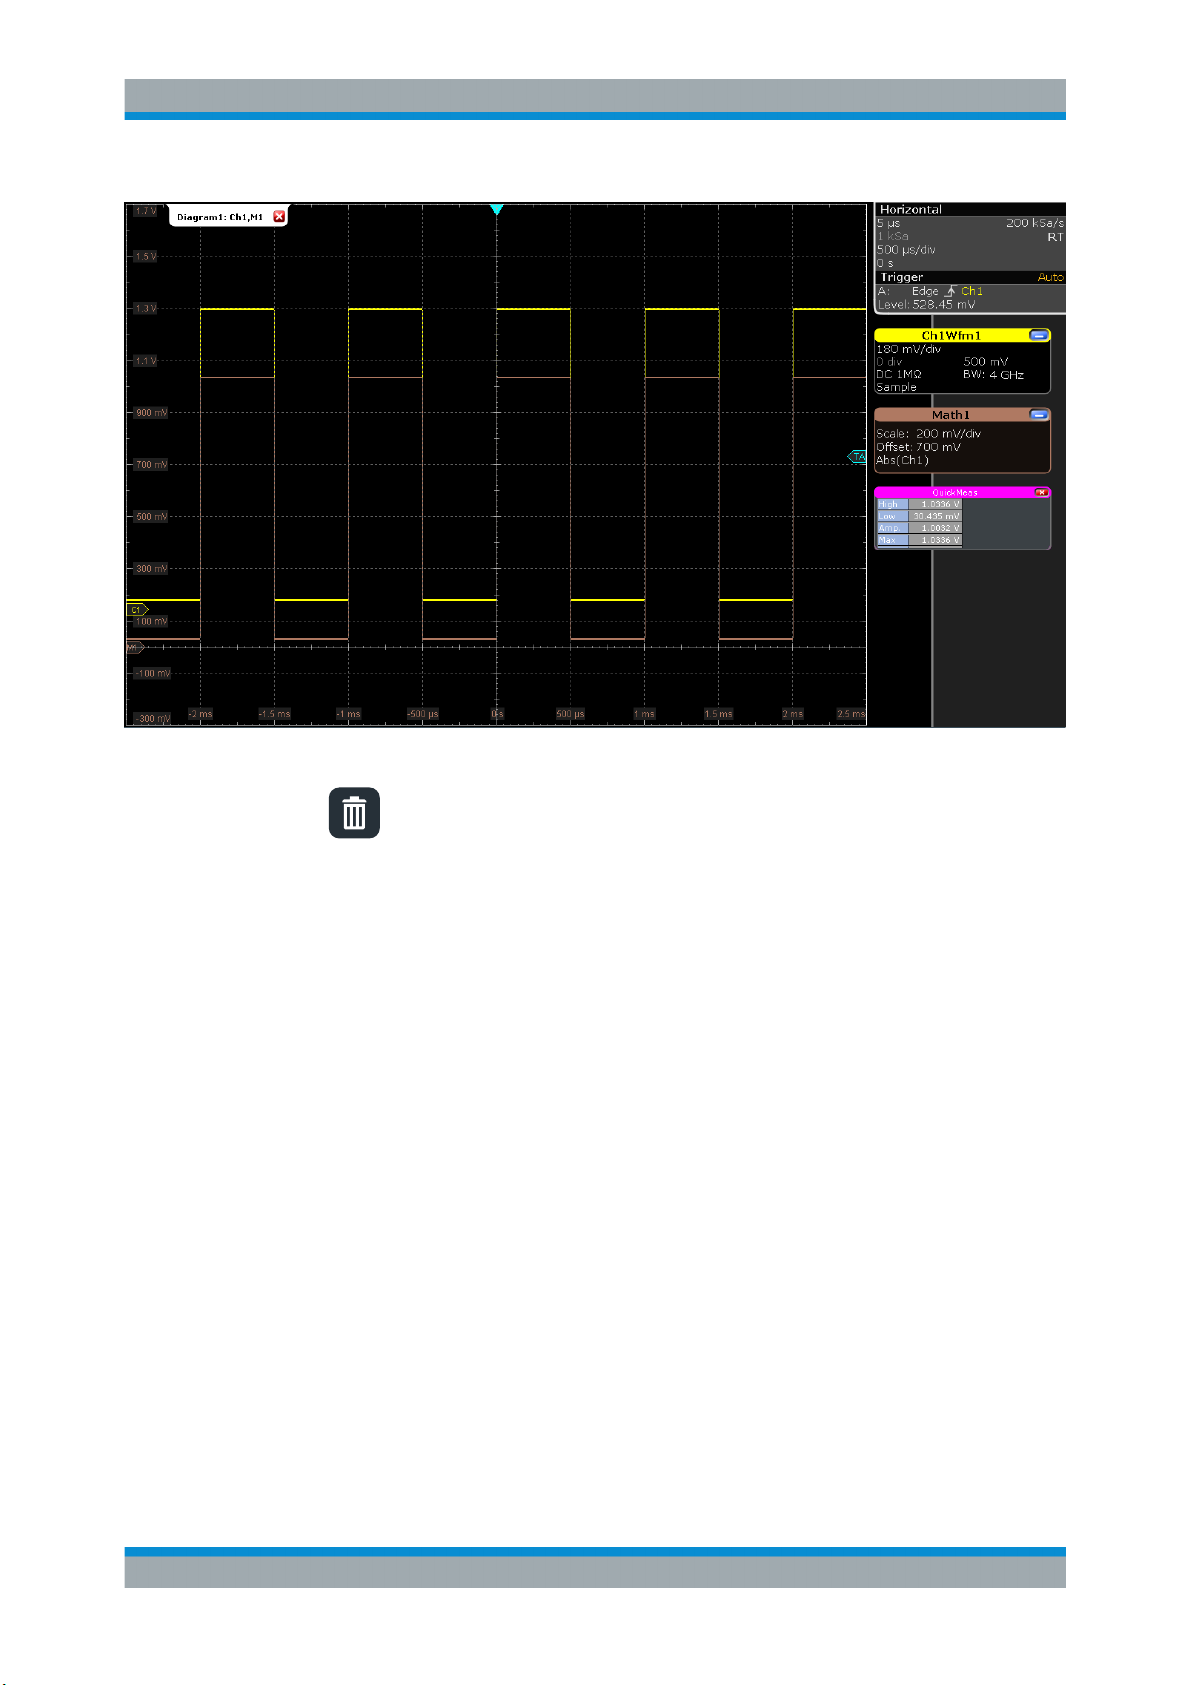
R&S®RTO2000
Trying Out the Instrument
Performing a Search
9. To remove the math waveform, tap the "Delete" icon and then the math waveform.
Alternatively, you can tap the signal icon of the math waveform to minimize the
waveform. Then close the signal icon.
4.10 Performing a Search
In the following search, you detect positive and negative overshoots, i.e. values that
exceed the high or low levels. To find these events, you can use the windows search.
To determine the search conditions, we use the results of the measurement example
described in Chapter 4.7.3, "Performing and Configuring the Quick Measurement",
on page 53.
1. Press the [Search] key on the front panel (Analysis area).
2. Select "C1" as "Source".
3. Select the search criteria: Enable "Window".
4. In the "Window" tab below, define the search conditions:
a) In the "Upper level" field, enter the result of the "High" level measurement.
b) In the "Lower level" field, enter the result of the "Low" level measurement.
c) As "Vertical condition", select "Exit" to find values that are outside the range
defined by the high and low levels.
63Getting Started 1332.9719.02 ─ 08
Page 64
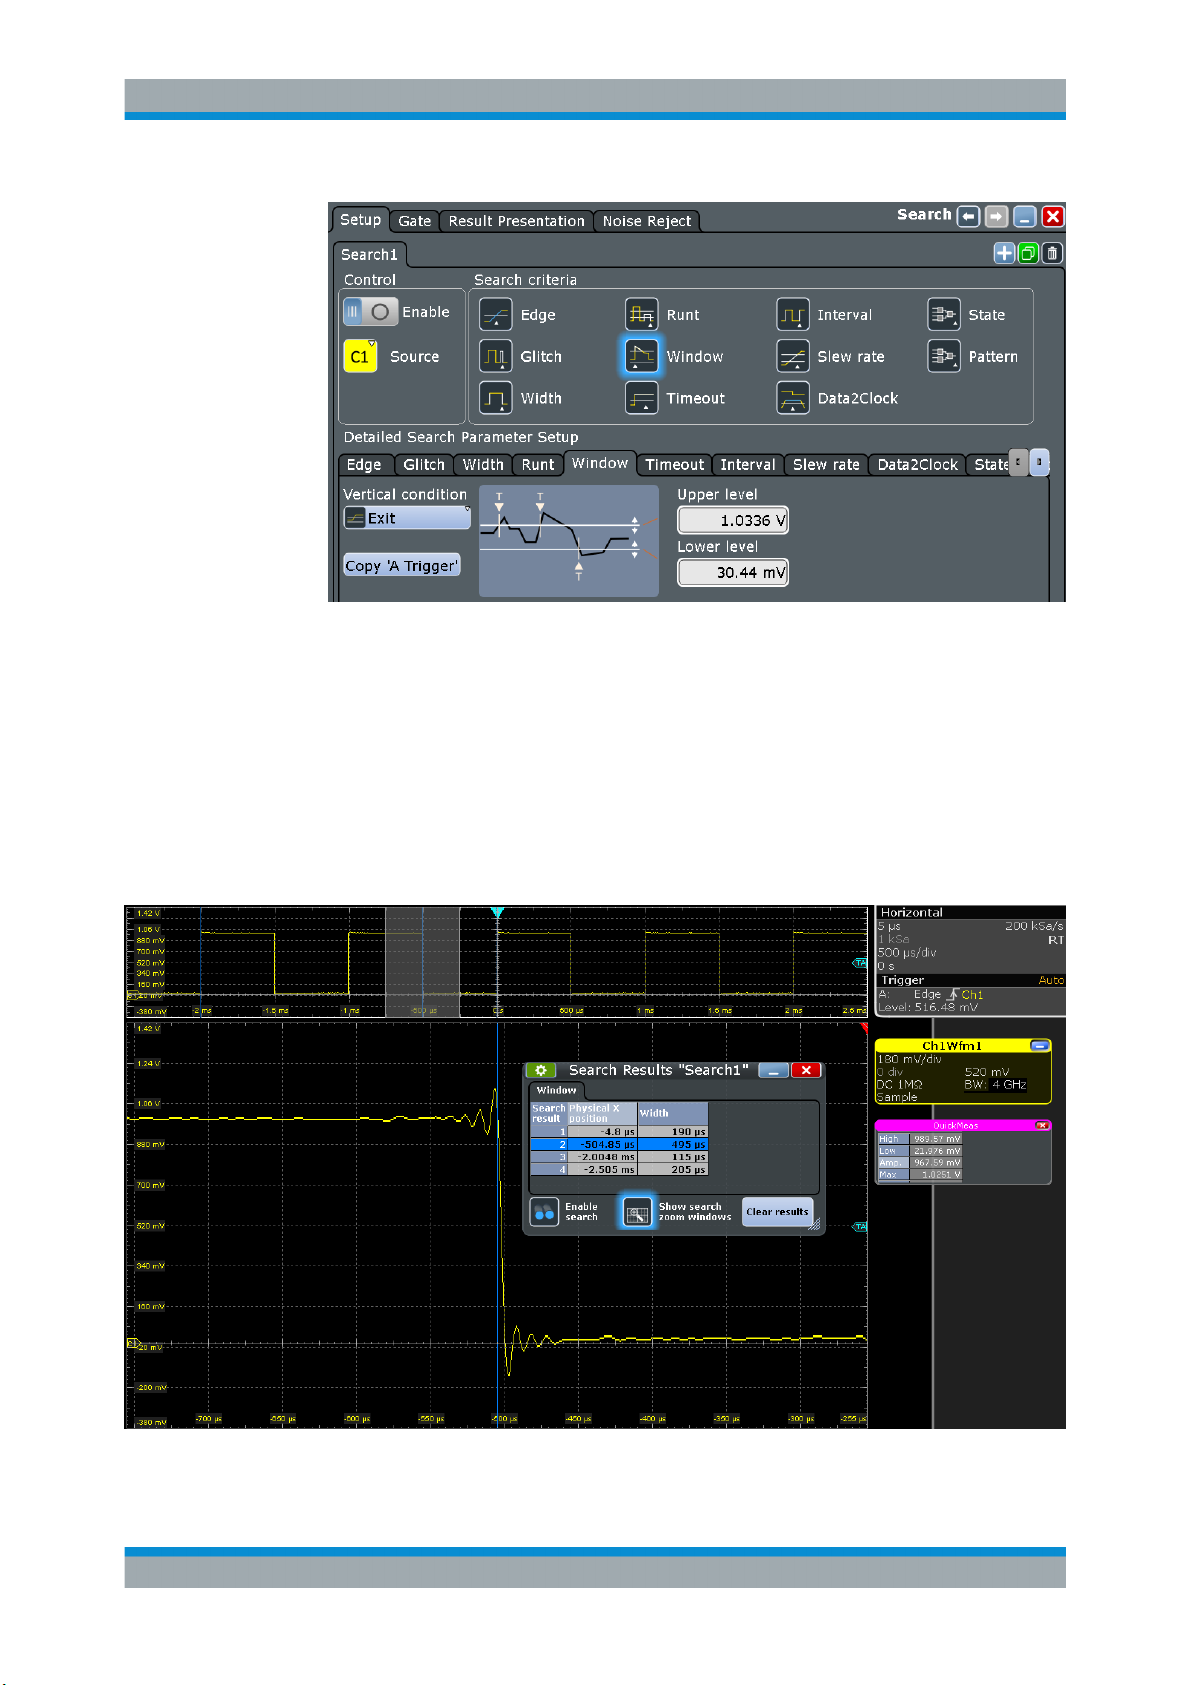
R&S®RTO2000
Trying Out the Instrument
Performing a Search
5. Select "Enable" to start the continuous search on the acquired data.
6. Close the "Search" dialog box.
7. In the "Search Results" box, select "Show search zoom windows".
The acquisition stops, and the detected overshoots of the last acquisition are listed
in the search result table. The search zoom window shows the last result that was
found. Vertical lines indicate the time values for which a result was found.
8. In the results table, tap the row of the search result that you want to display in the
search zoom diagram.
64Getting Started 1332.9719.02 ─ 08
Page 65
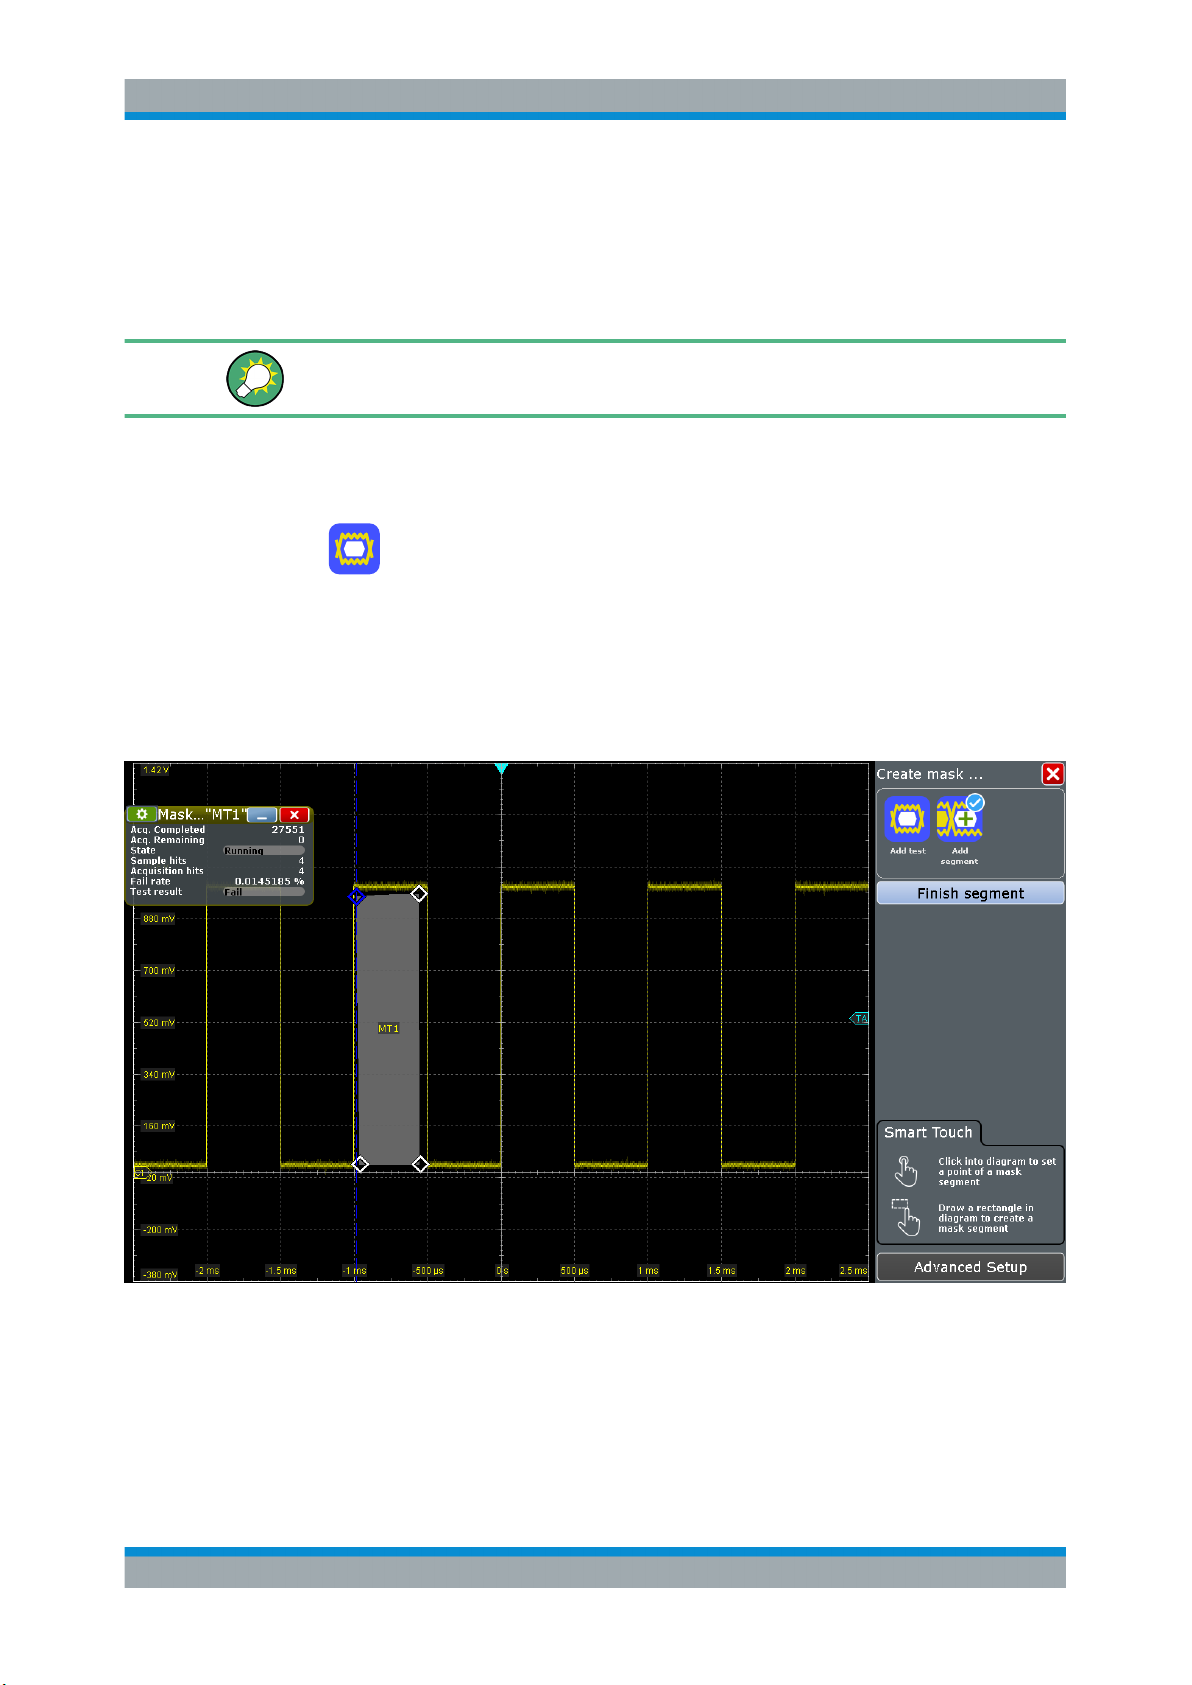
R&S®RTO2000
4.11 Performing a Mask Test
Trying Out the Instrument
Performing a Mask Test
In the following example, you perform a mask test to determine whether the signal
exceeds a rectangular area.
The usage of masks tests is also shown in a short video that is available on the instrument: "File" menu > "Tutorials" > "Mask Test".
1. To restore the default signal channel settings, press [Preset] and [Autoset].
2. Tap the "Masks" icon on the toolbar.
3. Tap the corner points of the first mask segment on the touchscreen. Select the corner points of one complete pulse, with a minor offset to the inside.
Tip: To create an exact rectangle, draw the diagonal of the rectangle on the
screen.
4. Tap "Finish segment" in the sidebar.
5. Add another mask segment above the positive pulse:
a) Tap "Add segment" in the sidebar.
b) Tap two points slightly above the pulse.
65Getting Started 1332.9719.02 ─ 08
Page 66
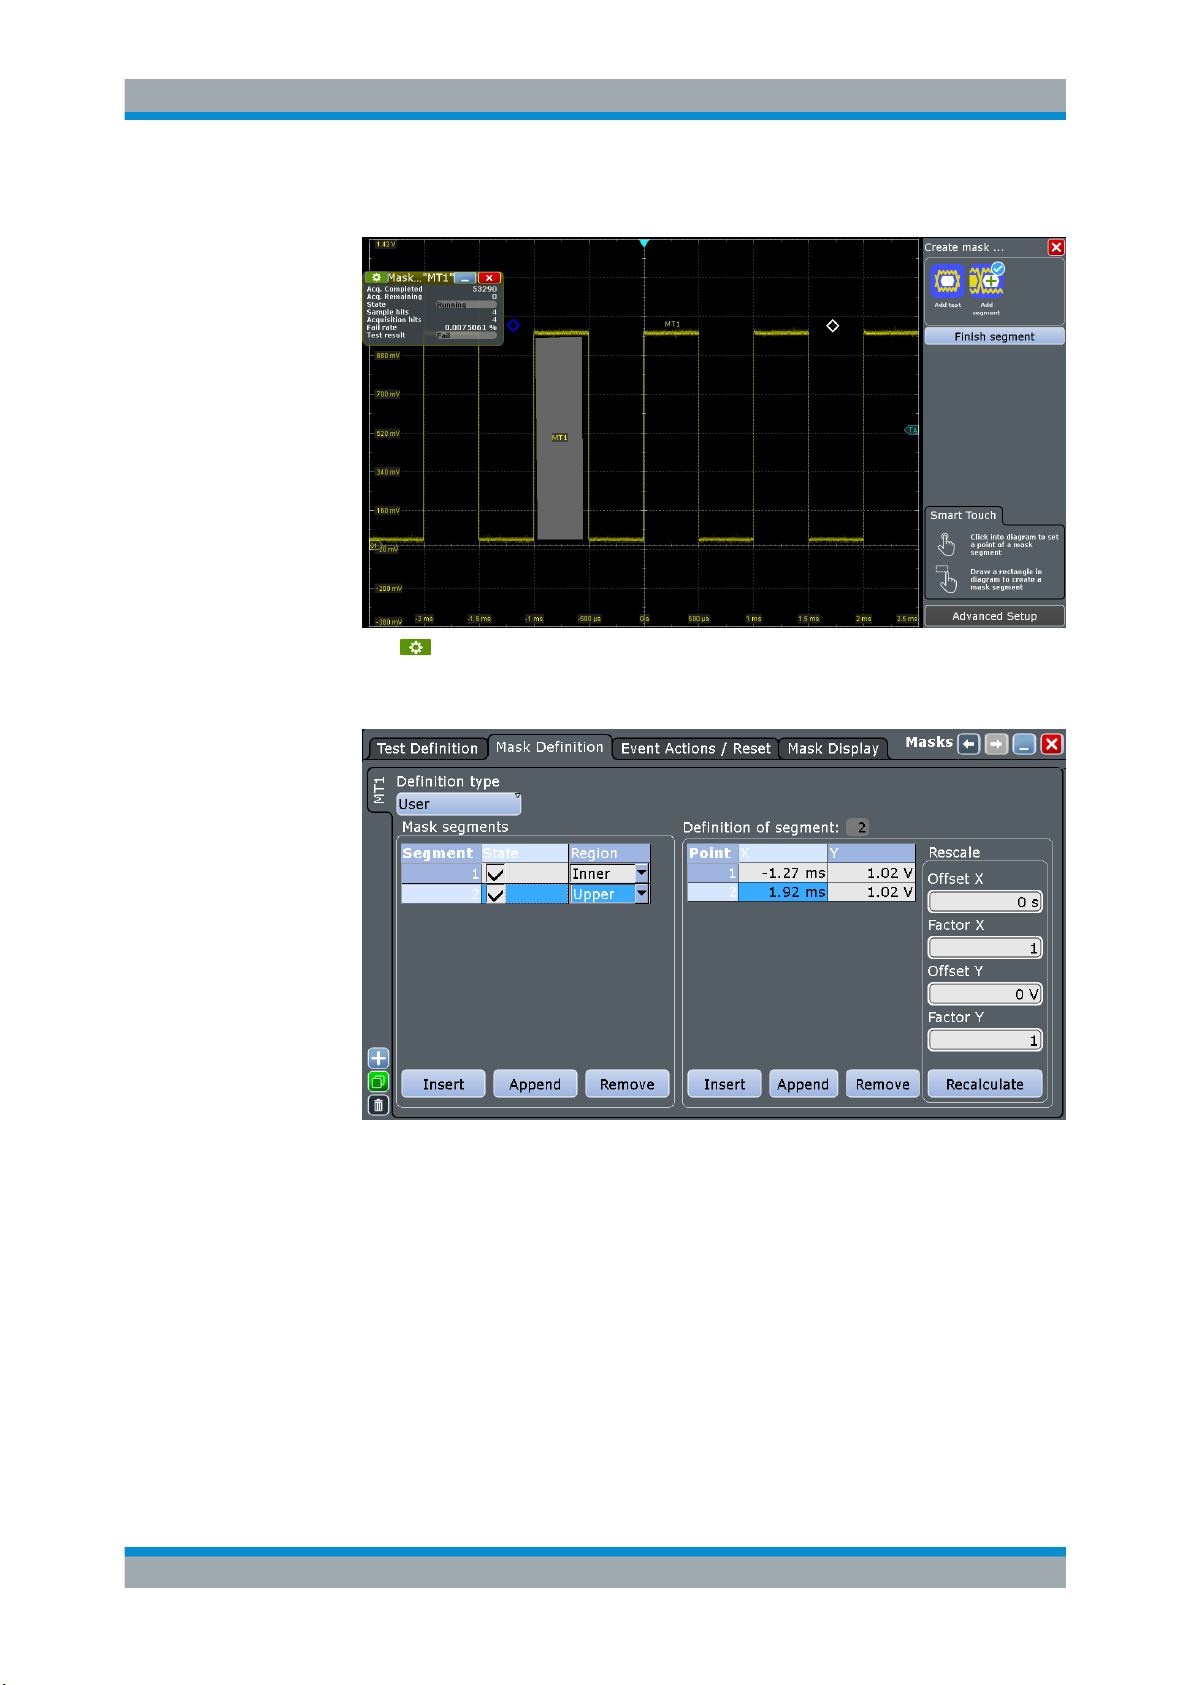
R&S®RTO2000
Trying Out the Instrument
Performing a Mask Test
c) Tap "Finish segment" in the sidebar.
d)
Tap in the result box.
e) Select the "Mask Definition" tab.
f) In the "Region" column of the second mask segment, select "Upper".
6. Select the "Test Definition" tab.
7. Select channel 1 as the "Source".
8. Define the number of tolerable sample hits in the "Violation tolerance" field.
A test has failed if the number of sample hits exceeds the limit of "Violation tolerance".
9. Select the "Event Action / Reset" tab.
10. For the "Stop acquisition" action, select "On violation".
When the violation tolerance is exceeded, the acquisition stops. The results of the
mask test are shown in the "MaskTest" results box. Mask hits are also indicated as
red points in the mask segment in the diagram.
66Getting Started 1332.9719.02 ─ 08
Page 67
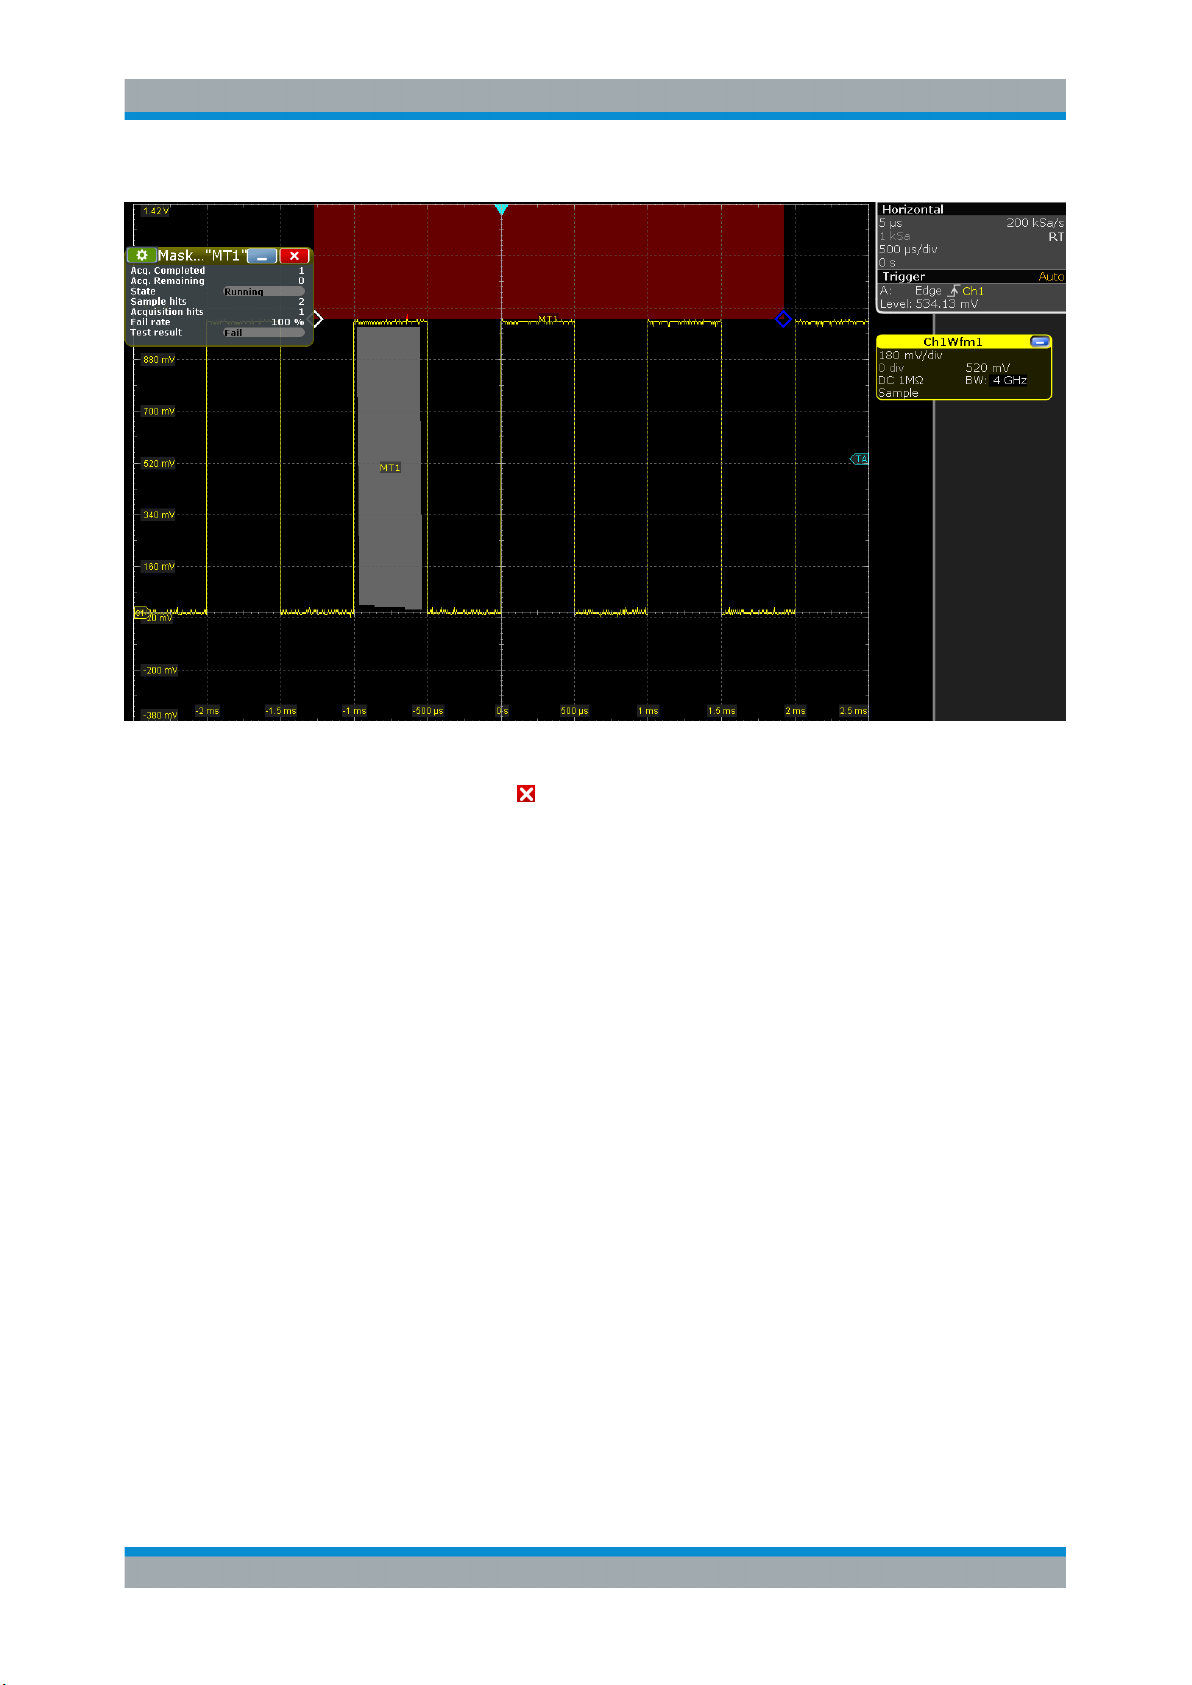
R&S®RTO2000
Trying Out the Instrument
Printing and Saving Screenshots
11. Press [Run Stop] to start the next acquisition and watch the screen.
12.
To close the test, tap
in the "MaskTest" results box.
4.12 Printing and Saving Screenshots
You can print and save screenshots of the current display to document your results. In
the following examples, you print the current display as a black and white graphic with
inverted colors, i.e. a black waveform is printed on a white background. Then you save
some screenshots using the Camera key.
To print a screenshot
You need a printer that is connected to the instrument. If the instrument is connected to
the network, you can also use a network printer.
1. Open the "File" menu and tap "Print Setup".
2. Tap "Color" and select "Black and white".
3. Enable "Inverse color".
4. Disable "Include signal bar".
67Getting Started 1332.9719.02 ─ 08
Page 68
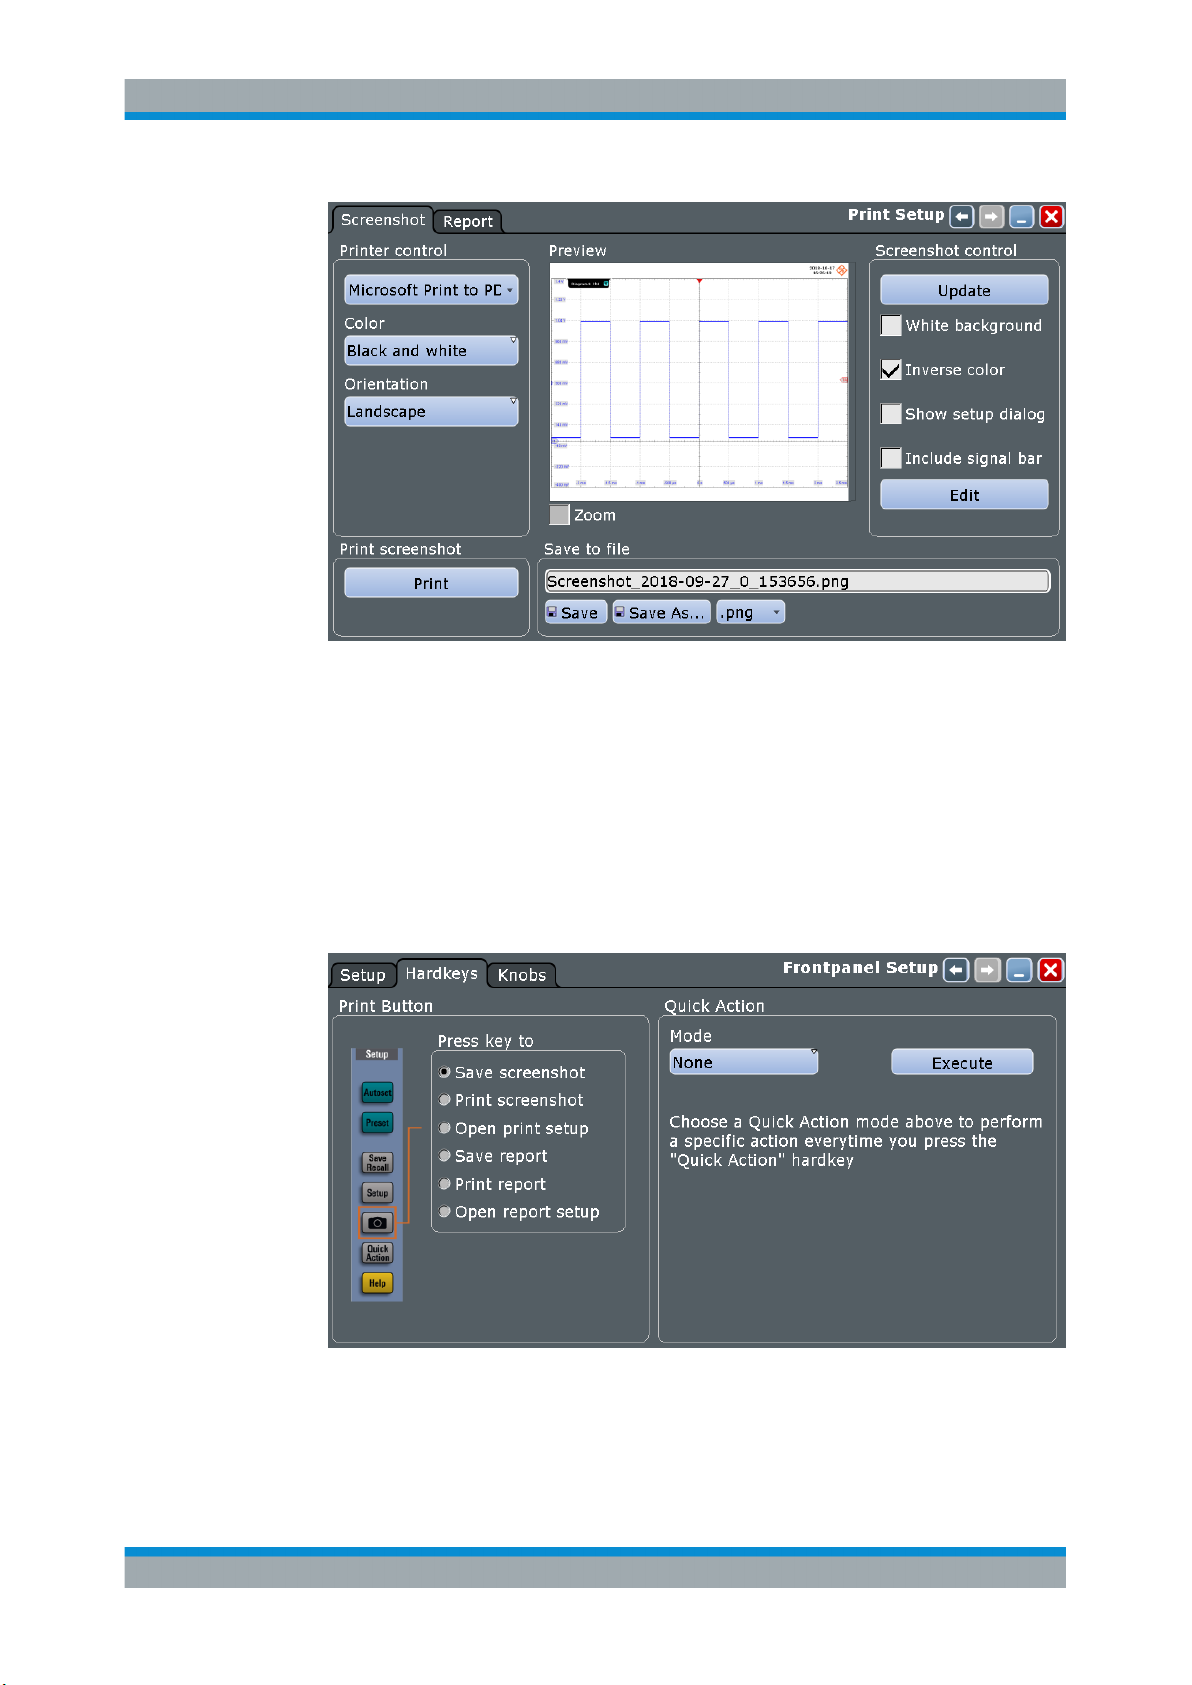
R&S®RTO2000
Trying Out the Instrument
Printing and Saving Screenshots
5. Tap the upper left button and select the printer.
6. Tap "Print". The result is a monochrome image.
7. Close the dialog box.
To configure the Camera key
1. Open the "File" menu and tap "Frontpanel Setup".
2. Select the "Hardkeys" tab.
3. Select "Save screenshot".
4. Close the dialog box.
68Getting Started 1332.9719.02 ─ 08
Page 69
R&S®RTO2000
4.13 Saving Data
Trying Out the Instrument
Saving Data
To save screenshots
1.
Press the key.
2. Change the horizontal scale.
3.
Press the key.
The files are saved to the following directory:
C:\Users\Public\Public Documents\Rohde-Schwarz\RTx\
ScreenShots
The default file name is Screenshot_<date>_<index>_<time>.png.
4. To access the saved files, open the "File" menu and tap "Minimize Application".
5. Double-tap the "User" folder icon on the desktop.
6. Open the ScreenShots folder.
After a measurement with the R&S RTO, you can save the resulting waveform data for
further evaluation or comparison. You can also save measurement results, and device
settings to repeat or restore previous measurements.
●
"Saving waveform data" on page 69
●
"Saving data of an acquisition series" on page 70
●
"Saving measurement results" on page 70
●
"Saving and restoring device settings" on page 71
Saving waveform data
1. Press the [Save Recall] key on the front panel (in the Setup area on the left).
2. Select "Waveform".
3. Check the "Source".
4. Set "Scope" to "Full Waveform".
Tip: If a cursor, zoom or measurement gate is defined, you can use these settings
to export only a part of the waveform.
5. Under "Save to file", tap "Save As".
6. The file selection dialog box shows the default storage directory:
C:\Users\Public\Public Documents\Rohde-Schwarz\RTx\
RefWaveforms
7. Tap the keyboard icon on the right of the "File Name" field.
69Getting Started 1332.9719.02 ─ 08
Page 70
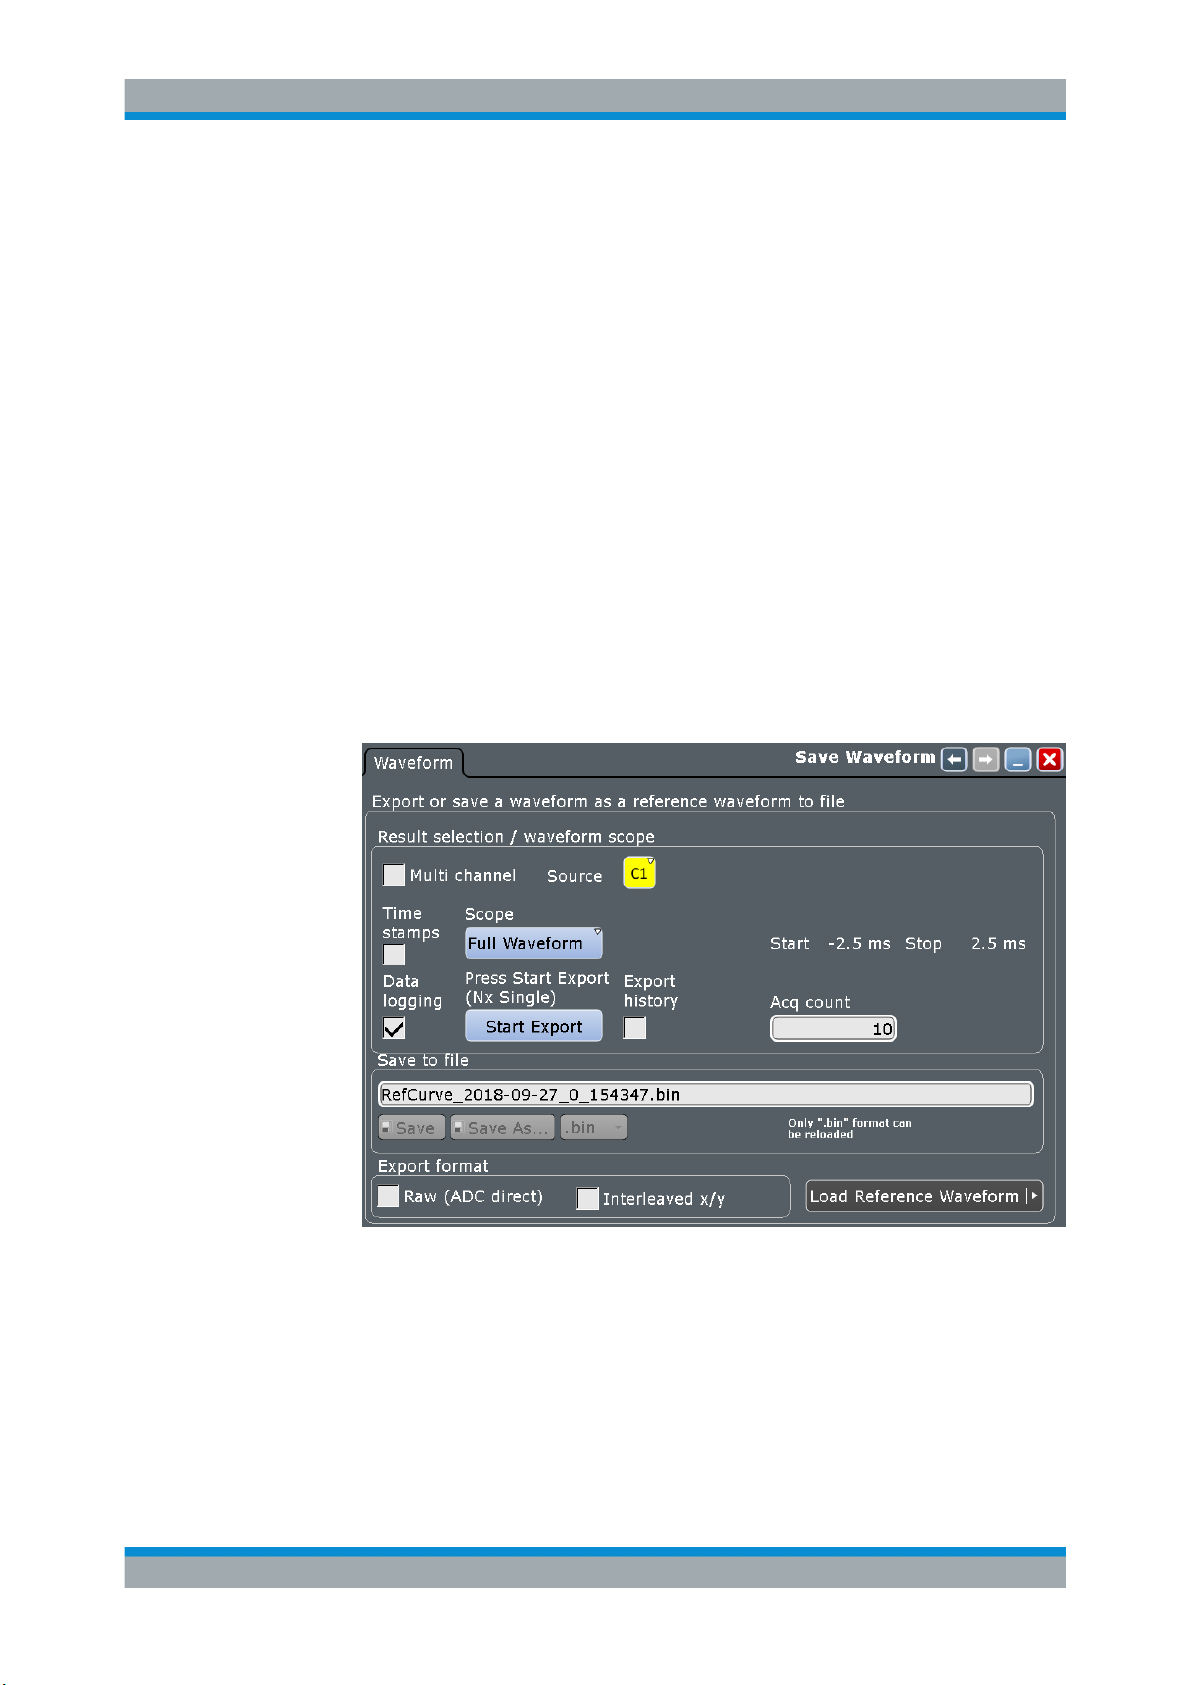
R&S®RTO2000
Trying Out the Instrument
Saving Data
8. Enter Waveform1 on the online keyboard.
9. Tap "ENTER" to close the online keyboard.
10. Select the file type: "*.bin".
11. Tap "Save".
The waveform data is saved to the files Waveform1.Wfm.bin and
Waveform1.bin in the selected directory.
Saving data of an acquisition series
1. Press the [Save Recall] key on the front panel.
2. Select "Waveform".
3. Set the export scope of the waveform:
a) Check the "Source".
b) Set "Scope" to "Full Waveform".
c) Tap "Data logging" to enable export all waveforms of a running acquisition.
d) Enter "Acq count" = 10, the number of subsequent waveforms that the instru-
ment acquires and saves.
4. Tap "Start Export" to save the waveforms to file. You can change the filename in
"Save to file".
Saving measurement results
1. Perform a measurement as described in Chapter 4.7.2, "Performing an Amplitude
Measurement", on page 51.
2. Press the [Save Recall] key on the front panel.
70Getting Started 1332.9719.02 ─ 08
Page 71
R&S®RTO2000
Trying Out the Instrument
Saving Data
3. Select "Numeric results".
4. Select the results that you want to save.
5. For further usage of the results, select the "CSV-Delimiter" that is used to convert
the values in columns. For MS Excel, select the semicolon.
6. Tap "Save".
The results are saved to the following folder:
C:\Users\Public\Public Documents\Rohde-Schwarz\RTx\
ResultBoxExport
The filename is created according to the autonaming settings.
Saving and restoring device settings
1. Press the [Save Recall] key on the front panel.
2. Select "Savesets".
3. Tap "Save As". Enter the path and filename.
C:\Users\Public\Public Documents\Rohde-Schwarz\RTx\SaveSets\
Settings_Meas1.dfl
4. Tap "Save".
5. To restore the default instrument settings, press the [Preset] key.
6. To repeat the initial measurement, tap the "Load saveset" icon on the toolbar.
7. Select the "Type" = "Savesets".
8. Use the buttons on the left and the right to scroll the stored savesets. The filename
and a screenshot help identify the correct saveset.
9. Tap "Load".
The device and measurement settings are restored and you can repeat the measurement.
71Getting Started 1332.9719.02 ─ 08
Page 72

R&S®RTO2000
Trying Out the Instrument
Saving Data
72Getting Started 1332.9719.02 ─ 08
Page 73

R&S®RTO2000
5 Operating the Instrument
Operating the Instrument
Means of Manual Interaction
There are three ways to operate the R&S RTO.
Manual operation
Use the touchscreen, keys and rotary knobs, or an optional mouse and/or keyboard.
The principles of manual operation are explained in this section.
Remote control
Create programs to automatize repeating settings, tests, and measurements. The
instrument is connected to a computer that runs the program.
This way of operation is described in the user manual, chapter "Remote Control Commands".
Remote operation
The remote desktop connection of Windows can be used for instrument control and file
transfer. Even on computers with non-Windows operating systems, a remote desktop
connection is possible using RDP applications.
For details, refer to the User Manual, chapter "Remote Desktop Connection".
Remote monitoring and control of the instrument from a connected computer is also
possible with a standard web browser and a LAN connection.
For details, refer to the User Manual, chapter "Web Control".
Alternatively, you can use Virtual Network Computing (VNC), which requires installation
of the VNC server on the R&S RTO. Installation and configuration are described in the
Application Note "Remote Monitoring and Control of the R&S RTO with a Web
Browser", available on the Rohde & Schwarz Internet.
5.1 Means of Manual Interaction
The R&S RTO provides the following means of manual interaction, which you can use
alternatively or complementary:
●
Touchscreen:
Using the touchscreen is the direct interaction way. Use your finger to place waveforms on the screen, mark areas for zoom and histograms, set parameters in dialog boxes, enter data, and much more. The control elements and actions on the
screen are based on common concepts, and you will easily become familiar with
the user interface.
Tapping the screen works like clicking mouse buttons:
– Tap = click: Selects a parameter or provokes an action.
– Double-tap = double-click has the same effect as touch and hold = right-click:
Opens the on-screen keyboard or keypad, or a specific editor if available
73Getting Started 1332.9719.02 ─ 08
Page 74

R&S®RTO2000
Operating the Instrument
Touchscreen Display
Use gestures to scale the waveform:
– Spread or pinch two fingers horizontally to change the horizontal scale (time-
base).
– Spread or pinch two fingers vertically to change the vertical scale of the active
waveform.
●
Function keys and rotary knobs:
The front panel provides nearly all functions and controls to operate the instrument
in the classic ways, without touchscreen. As an exception, the sidebar cannot be
used with front panel controls.
●
Optional mouse and/or keyboard:
These devices work conform to Windows standards. The navigation keys on the
front panel correspond to the keys on the keyboard.
The usage of the touchscreen and navigation keys is described in detail in the following sections.
5.2 Touchscreen Display
5.2.1 Information on the Display
The touchscreen of the instrument shows the waveforms and measurement results,
and also information and everything that you need to control the instrument. All waveform-related display elements are shown in Figure 5-1. An overview of control elements - like dialog box, toolbar - is given in Figure 5-4 .
74Getting Started 1332.9719.02 ─ 08
Page 75
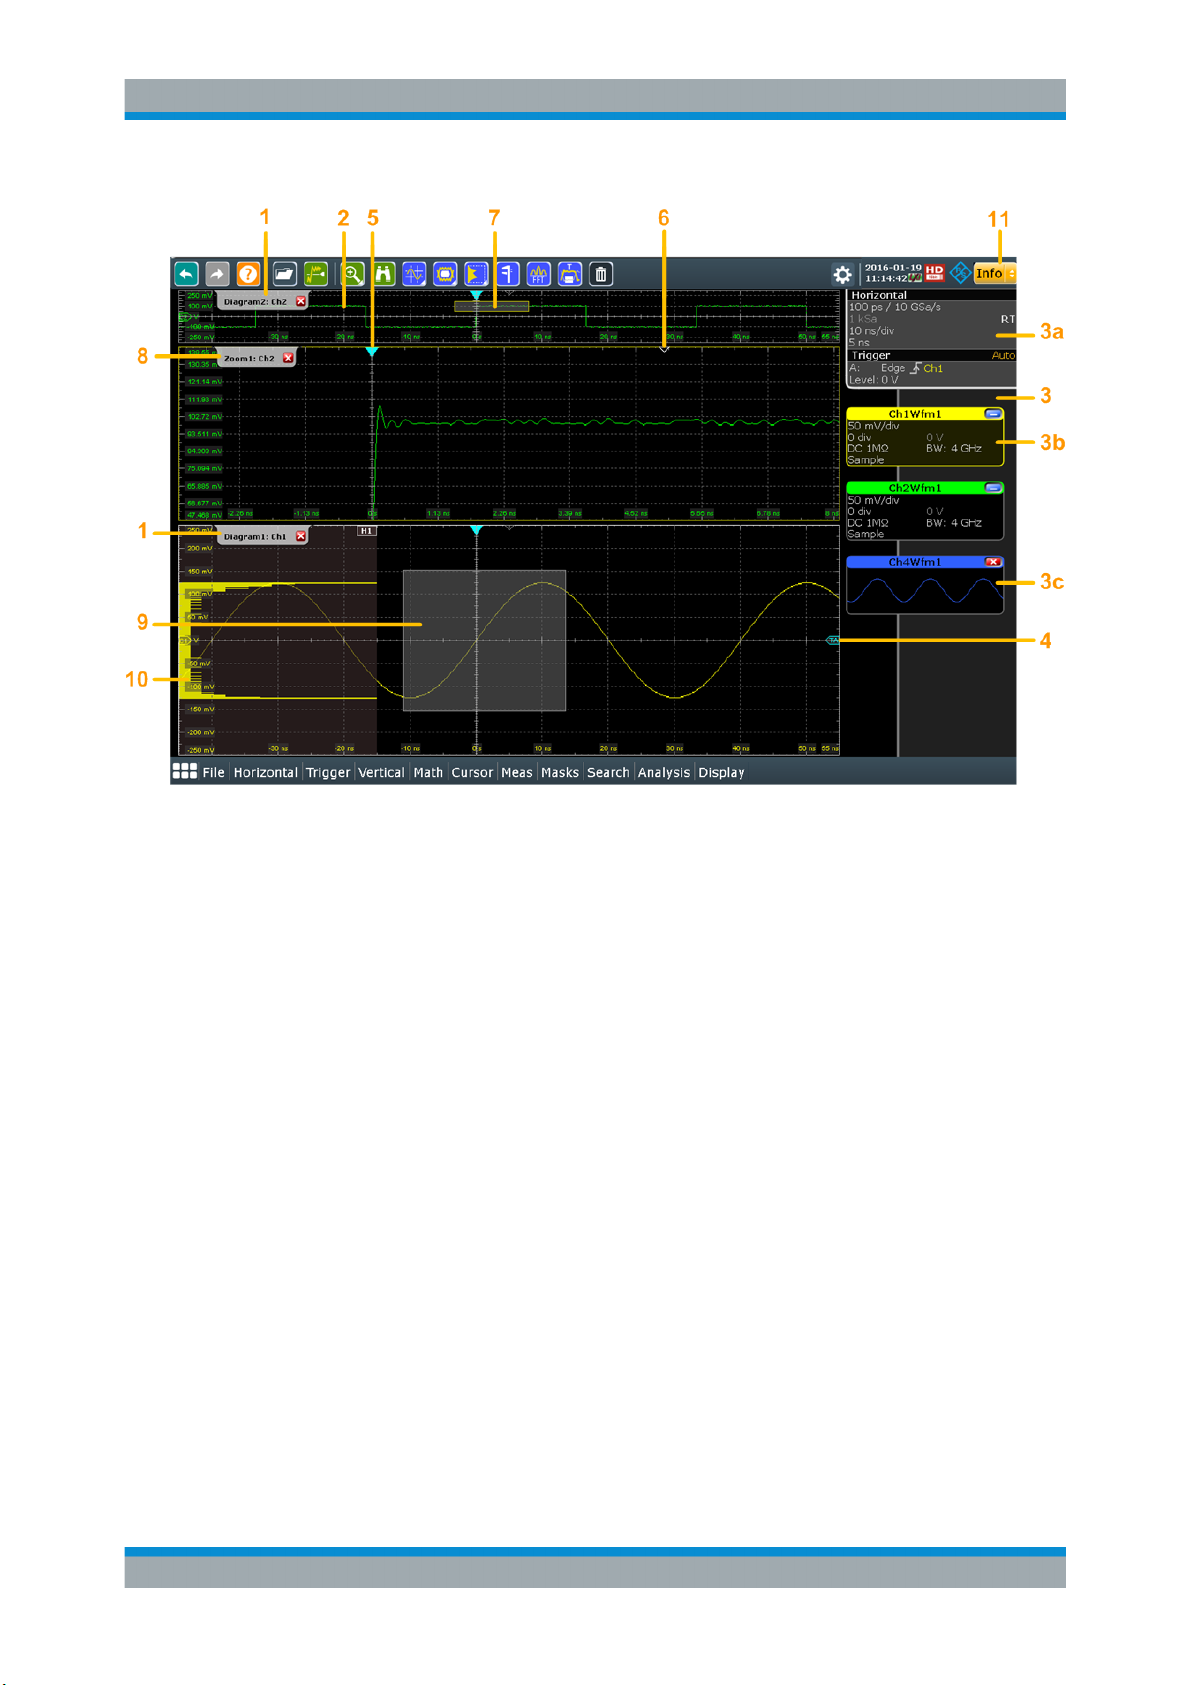
R&S®RTO2000
Operating the Instrument
Touchscreen Display
Figure 5-1: Display information
1 = Diagram
2 = Grid
3 = Sidebar with horizontal and trigger label (3a), signal icon with waveform settings (3b) and signal icon
with minimized live waveform (3c)
4 = Trigger level
5 = Trigger position
6 = Reference point (distance from trigger position to reference point = horizontal position)
7 = Zoom area
8 = Zoom diagram
9 = Histogram area
10 = Histogram
11 = Messages
Diagram (1)
A diagram shows one or more waveforms: channel, reference, and math waveforms
together with histograms, masks etc. Zoom details, XY-waveforms, spectra and other
special waveforms are shown in separate diagrams.
By default, the diagram name contains the diagram number and the short names of the
waveforms shown inside. To change the diagram name, touch and hold the tab name.
The on-screen keyboard opens to enter the new name. Names must be unique.
To arrange the diagrams on the screen, the Rohde & Schwarz SmartGrid function
helps you to find the target place simply and quickly. For details, see "To arrange a
waveform using the SmartGrid" on page 82. You can also adjust the diagram size by
dragging the diagram border.
75Getting Started 1332.9719.02 ─ 08
Page 76
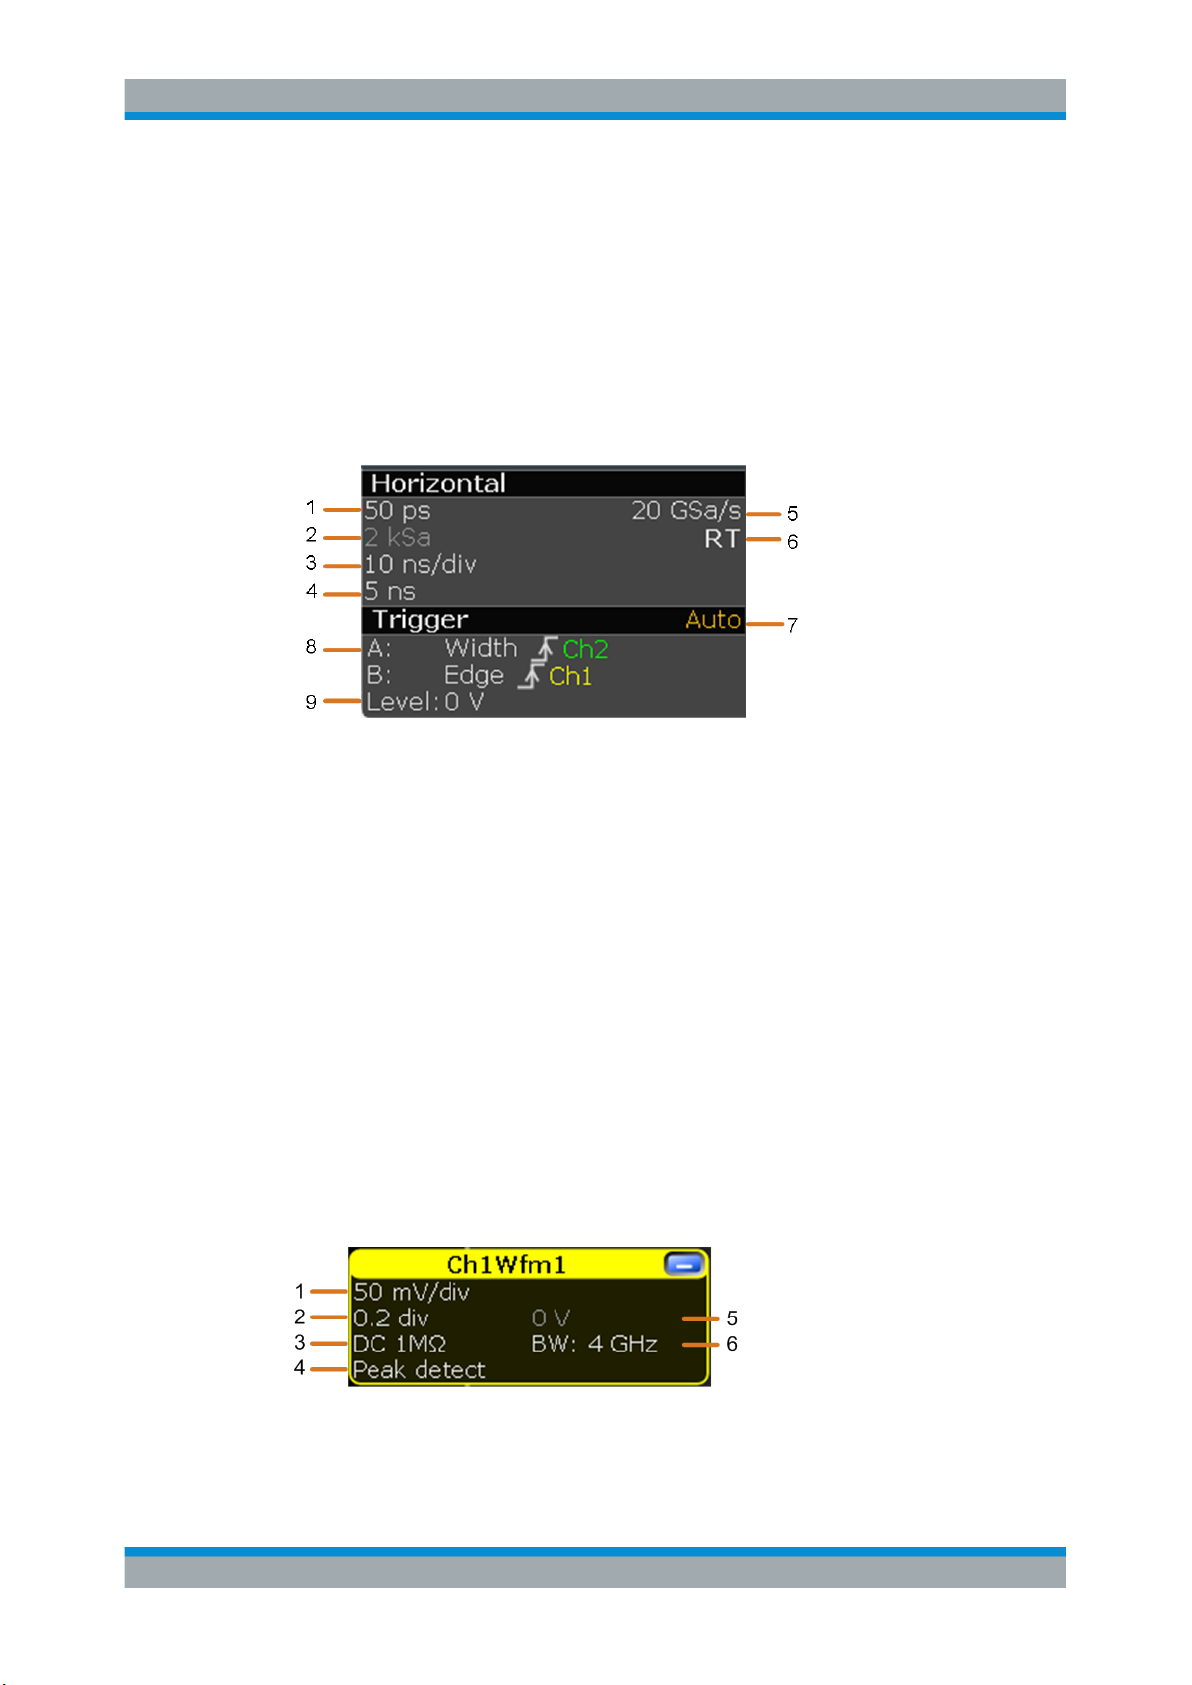
R&S®RTO2000
Operating the Instrument
Touchscreen Display
Grid (2)
The grid shows the vertical and horizontal divisions. The division lines are labeled with
the correspondent values. The grid labels have the color of the waveform to which they
belong. If several waveforms are shown in one diagram, the grid has the color of the
selected waveform.
Sidebar (3)
The sidebar is the control center for all enabled waveforms. On the top, the horizontal
and trigger labels show the main timebase and trigger settings. If you tap a label, the
relevant dialog box opens with the tab used at last.
Figure 5-2: Horizontal and trigger label on top of the sidebar
1 = Resolution
2 = Record length
3 = Timebase (horizontal scale)
4 = Horizontal position
5 = Sample rate
6 = RT - real time, IT - interpolated time
7 = Trigger mode
8 = Trigger type, slope or polarity, source for A-event and B-event
9 = Trigger level
Below, each waveform is represented by a signal icon. If the waveform is shown in a
diagram, the signal icon displays its main vertical and acquisition settings. If you tap
the "Minimize" icon on the signal icon, the waveform switches from the diagram area to
the signal icon: the icon shows the real-time preview of the waveform. If you tap a signal icon, the dialog box with vertical settings for this waveform opens. See Chapter 5.4,
"Working with Waveforms", on page 80 for a detailed description.
In Figure 5-1, the signal icons Ch1Wfm1 and Ch2Wfm1 show the main settings, and
the waveforms are displayed in diagrams. All other waveforms are minimized and
shown in the signal icon.
Figure 5-3: Signal label on the sidebar
76Getting Started 1332.9719.02 ─ 08
Page 77

R&S®RTO2000
Operating the Instrument
Touchscreen Display
1 = Vertical scale
2 = Vertical position
3 = Coupling and Termination
4 = Acquisition mode
5 = Offset
6 = Actual bandwidth, can be less than the instrument bandwidth depending on the number of active chan-
nels and other settings
If the sidebar contains many icons and not all icons are visible, touch one of the icons
and move it up or down until the required icon appears.
You can also switch off the sidebar: "Display" menu > "Diagram Layout" > "Show signal
bar" .
Trigger position and trigger level (4, 5)
The blue markers show the horizontal position of the trigger and the vertical trigger
level. You can touch and move the trigger markers in the diagram to set the positions.
The trigger point is the zero point of the diagram.
The trigger position can be moved outside the diagram. A red trigger position marker
indicates that the trigger position is not visible.
Reference point (6)
The reference point marks the rescaling center. If you modify the time scale, the reference point remains fixed on the screen, and the scale is stretched or compressed to
both sides of the reference point.
You can define the position of the reference point (Horizontal), and its time distance
from the trigger point of the diagram (Position).
Zoom diagram and zoom area (7, 8)
Zoomed waveforms are shown in separate zoom diagrams, in addition to the waveform
diagrams. On the original waveform diagram, a rectangle indicates the zoomed section
of the waveform - this is the zoom area. You can modify the zoom area by dragging the
rectangle as a whole, and by dragging its edges. To toggle between these modes, tap
the zoom area. You can also set exact positions.
The frames of the zoom area and of the associated zoom diagram have the same
color, different zooms are marked with different colors. So it is easy to assign zoom
area and zoom diagram.
As for waveform diagrams, you can change the name of the zoom diagram. A zoom in
a zoom and coupled zooms are also possible.
All zooming possibilities are described in detail in the User Manual, chapter "Zoom".
Histogram and histogram area (9, 10)
A histogram shows the frequency of occurrence of voltage or time values in a bar chart
directly in the diagram. The rectangular histogram area indicates the part of the waveform that is considered in the histogram. The vertical histogram counts the voltage values, and the horizontal histogram counts time values. You can switch between vertical
and horizontal mode, and modify the histogram area by dragging the rectangle as a
whole, by dragging its edges, or by setting exact positions.
77Getting Started 1332.9719.02 ─ 08
Page 78
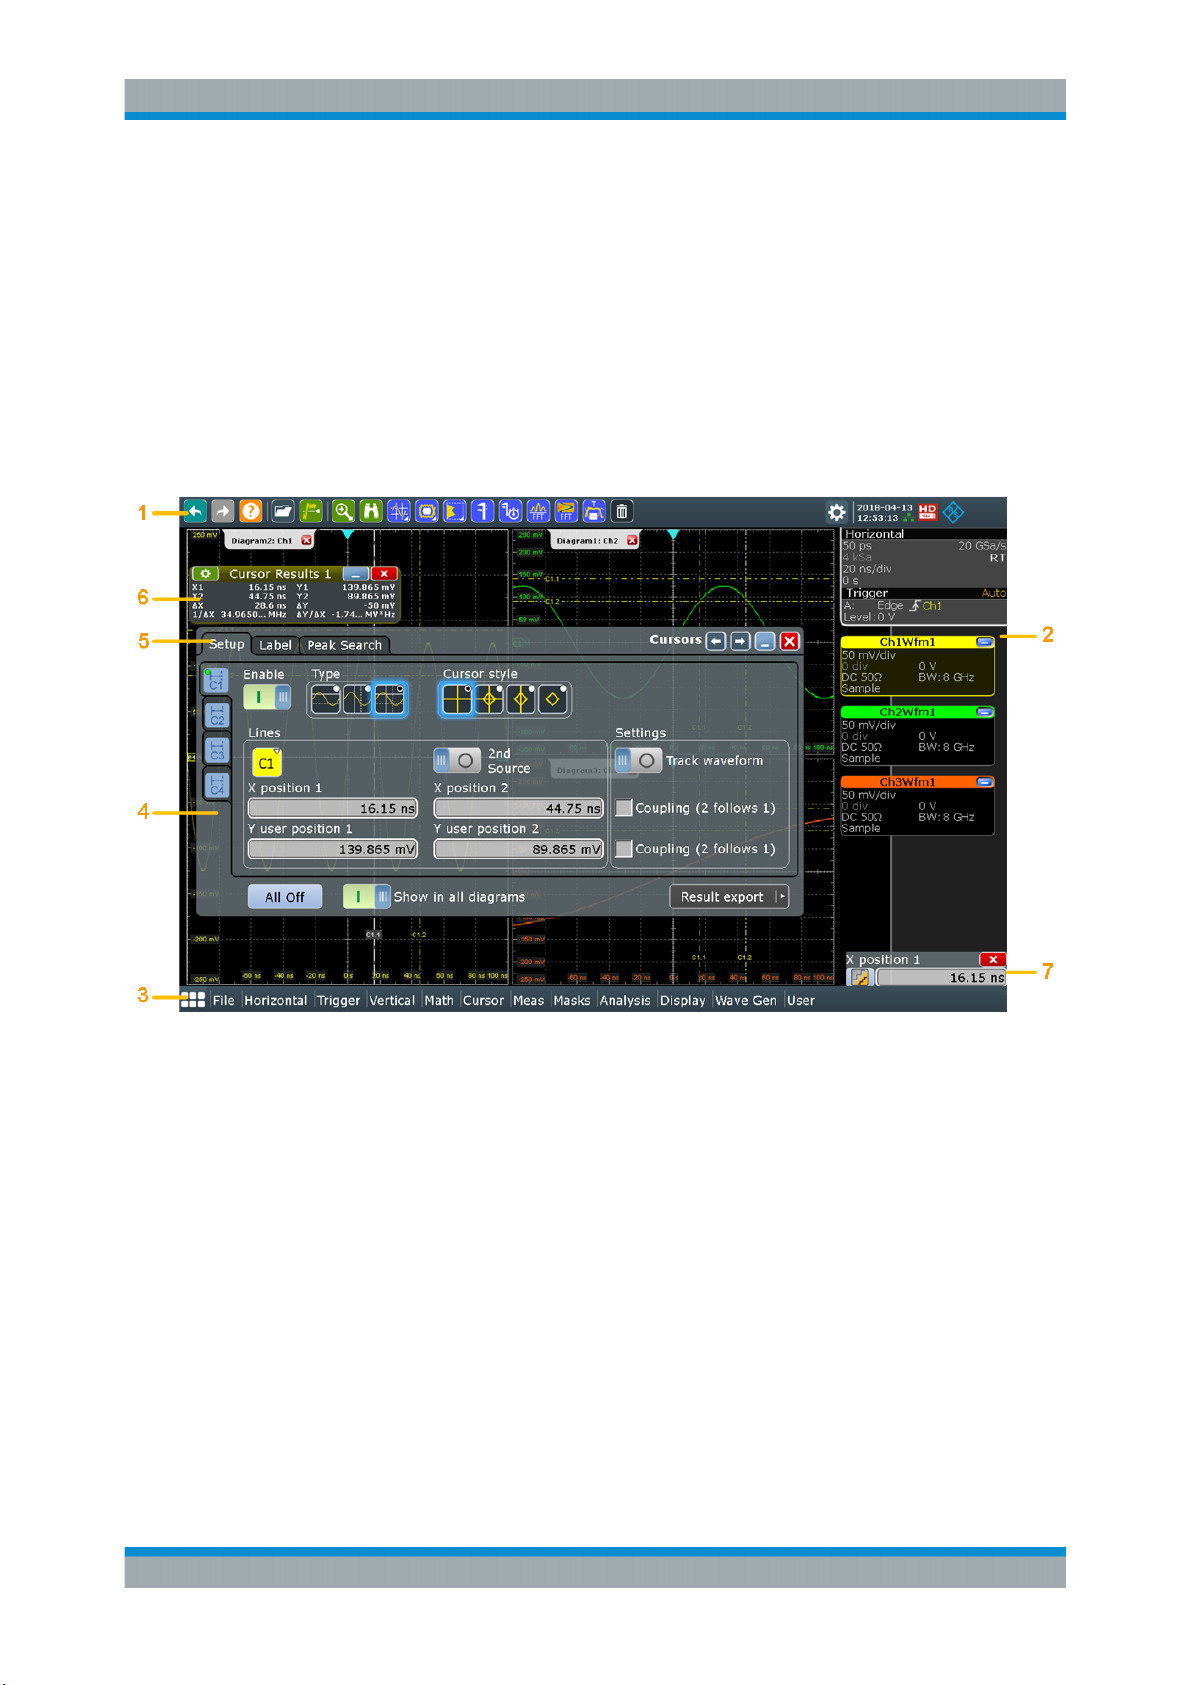
R&S®RTO2000
5.2.2 Control Elements on the Touchscreen
Operating the Instrument
Touchscreen Display
Messages (11)
A yellow or red button on the toolbar points to the status messages of the instrument.
To open the message box, tap the button. See also: Chapter 5.9, "Messages",
on page 95.
The touchscreen provides everything you need to control the instrument, to analyze
waveforms, and to get measurement results. Figure 5-4 shows the control elements on
a glance.
Figure 5-4: Control elements on the touchscreen
1 = Toolbar
2 = Sidebar, see "Sidebar (3)" on page 76
3 = Menu bar
4 = Dialog box
5 = Tab in a dialog box
6 = Result box
7 = Input box
Toolbar (1)
The icons on the toolbar provide quick and easy access to the most important functionality. For a detailed description, refer to Chapter 5.5, "Toolbar", on page 83.
Menu bar (3)
The menus provide access to the complete functionality of R&S RTO.
78Getting Started 1332.9719.02 ─ 08
Page 79
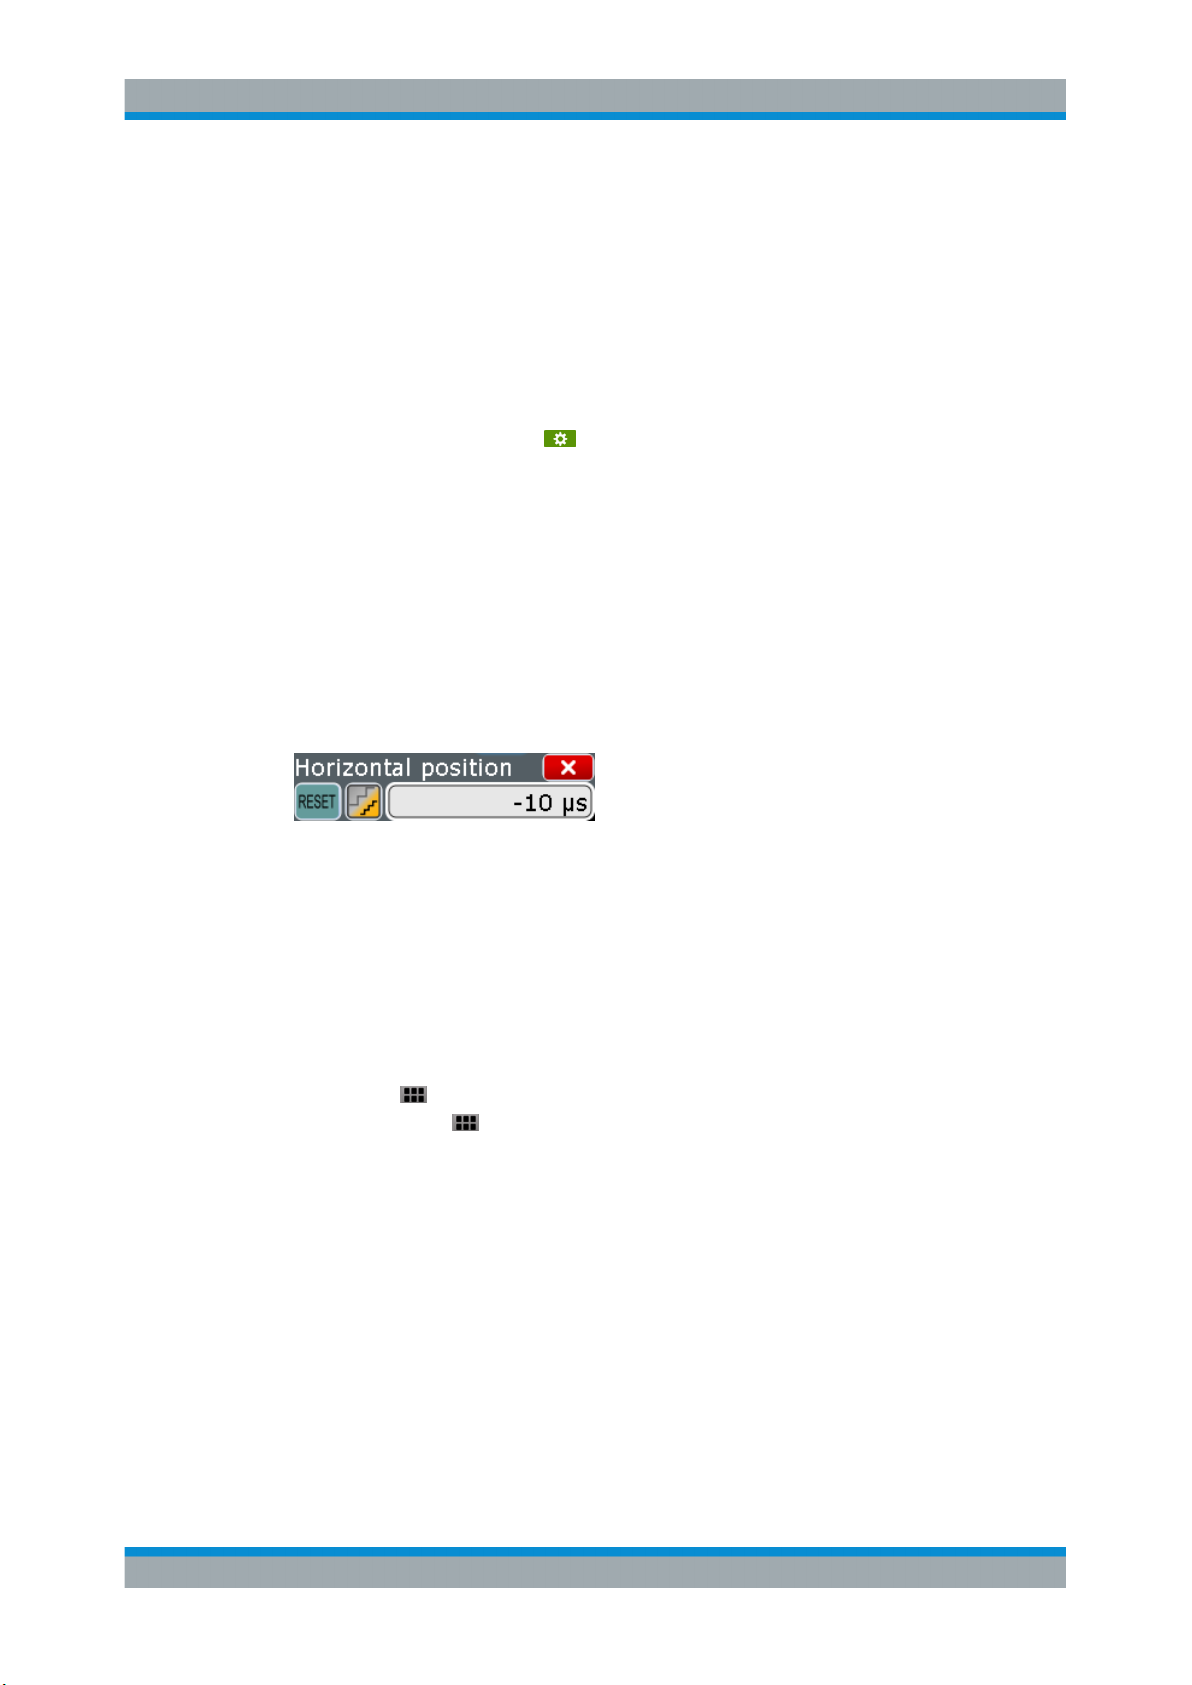
R&S®RTO2000
Operating the Instrument
App Cockpit
Dialog box (4, 5)
The tabs of the dialog boxes contain all task-oriented settings and operations, and
black buttons for calling related tabs. The usage of dialog boxes is described in Chap-
ter 5.7, "Using Dialog Boxes", on page 92.
Result box (6)
If you perform manual or automatic measurements, mask testing, or a search, the
result box shows the results of the action. Similar to waveform diagrams, you can minimize the result box to a result icon on the sidebar, and display results in a separate
diagram on the screen. The
settings.
For details, see Chapter 5.6, "Displaying Results", on page 90.
Input box (7)
The input box appears if you adjust a value using one of the rotary knobs, or if you
drag an element on the screen, for example, a cursor line. The input box shows the
current value of the modified parameter. You can enter the exact numerical value,
change the step size, and - if available - autoset the value directly in the input box. The
box title shows the name of the currently adjusted parameter. The input box is helpful
when using the multi-function rotary knobs, for example, [Intensity], and [Resolution /
Record Length].
icon opens the corresponding dialog box to adjust the
See also: Chapter 5.8, "Entering Data", on page 93.
5.3 App Cockpit
The app cockpit provides fast access to all available applications.
► To open the app cockpit:
●
Tap in the menu.
●
Press the key in the [Analysis] section of the frontpanel.
79Getting Started 1332.9719.02 ─ 08
Page 80
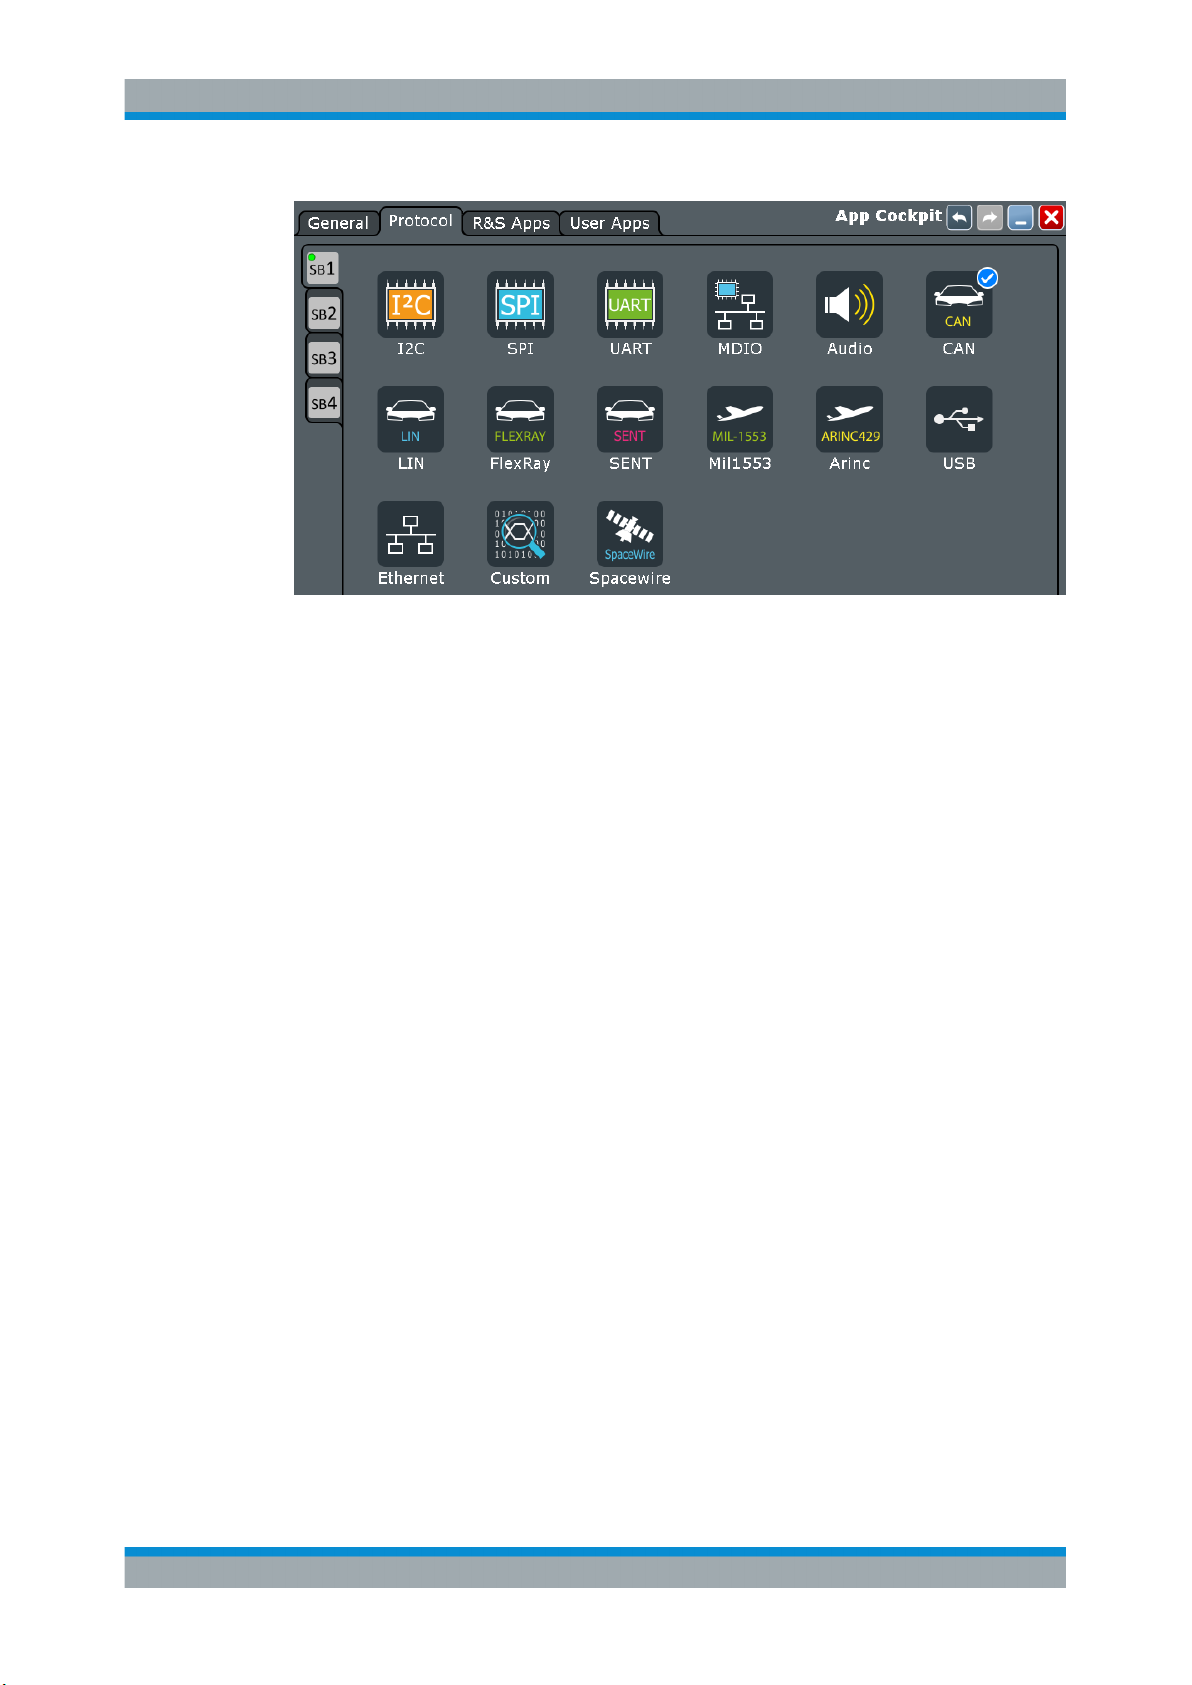
R&S®RTO2000
Operating the Instrument
Working with Waveforms
5.4 Working with Waveforms
The R&S RTO can create and display several types of waveforms:
●
Channel waveforms:
Up to three waveforms per input channel can be shown. For a four-channel instrument, 12 channel waveforms are available.
●
Reference waveforms:
Four waveforms can be used as reference for comparison and analysis.
●
Math waveforms:
Four mathematic waveforms can be created with mathematic operations performed
on channel, reference, and other math waveforms.
●
Zoom waveforms:
Show the details of waveforms.
●
XY-waveforms:
Four XY-waveforms can be created. Each XY-waveform is built from the voltage
values of two source waveforms.
●
Digital waveforms:
The Mixed Signal Option R&S RTO-B1 provides 16 digital channels grouped in two
logic probes (pods) with 8 channels each.
Waveform handling
The R&S RTO can show and analyze many waveforms. To handle this multitude while
keeping track of it, the R&S RTO provides intelligent support:
●
The color system helps to distinguish the waveforms. The color of the vertical
rotary knobs indicates the signal that is focused (selected). The color of each
waveform can be changed, the color of its signal icon and of the illuminated keys is
adjusted to the new color. Alternatively, a color table can be assigned to a waveform. Settings: [Display] > "Signal Colors / Persistence" tab.
80Getting Started 1332.9719.02 ─ 08
Page 81
R&S®RTO2000
Operating the Instrument
Working with Waveforms
●
Waveforms can be minimized to signal icons showing a small real-time signal view.
Thus, more space in the diagram area is available without switching off waveforms.
●
Diagrams are displayed on tabs – you can arrange them side by side or one above
the other. To change the diagram name, double-tap the tab name.
●
The Rohde & Schwarz SmartGrid function helps to arrange the diagrams.
Waveform states
Depending on its place on the screen and the effect of settings, a waveform has one of
the following states:
●
Off
●
Active:
The waveform is shown in a diagram
●
Selected:
One of the active waveforms that has the focus. In each diagram, one of the
assigned waveforms is selected – it appears "on top" in the diagram, and the grid
labels have the color of the selected waveform. Some of the toolbar functions, like
cursor and histogram measurements are performed on the selected waveform. All
waveform-specific settings are applied to the selected waveform of the selected
diagram. The vertical [Position] and [Scale] knobs, and the [Signal Off] key are illuminated with the color of the selected waveform.
In Figure 5-1, "Ch1Wfm1" is the selected waveform: The frame of the diagram and
the signal icon are highlighted.
●
Minimized:
The waveform is shown as real-time signal view in its signal icon.
To switch a waveform on
A channel waveform is activated as soon as you connect the probe. You can switch it
on and off according to your needs.
► Choose one of the following ways:
● Press the channel key.
● In the "Vertical" dialog box, select the channel and tap the "Show channel" button.
The waveform is now active, selected, and is shown in the diagram.
To select a waveform
► Choose one of the following ways:
● Tap the waveform in the waveform diagram.
● To select a channel, reference, or math waveform, press the corresponding
key.
● Tap the signal icon.
Note: Zoom waveforms in zoom diagrams cannot be selected.
81Getting Started 1332.9719.02 ─ 08
Page 82
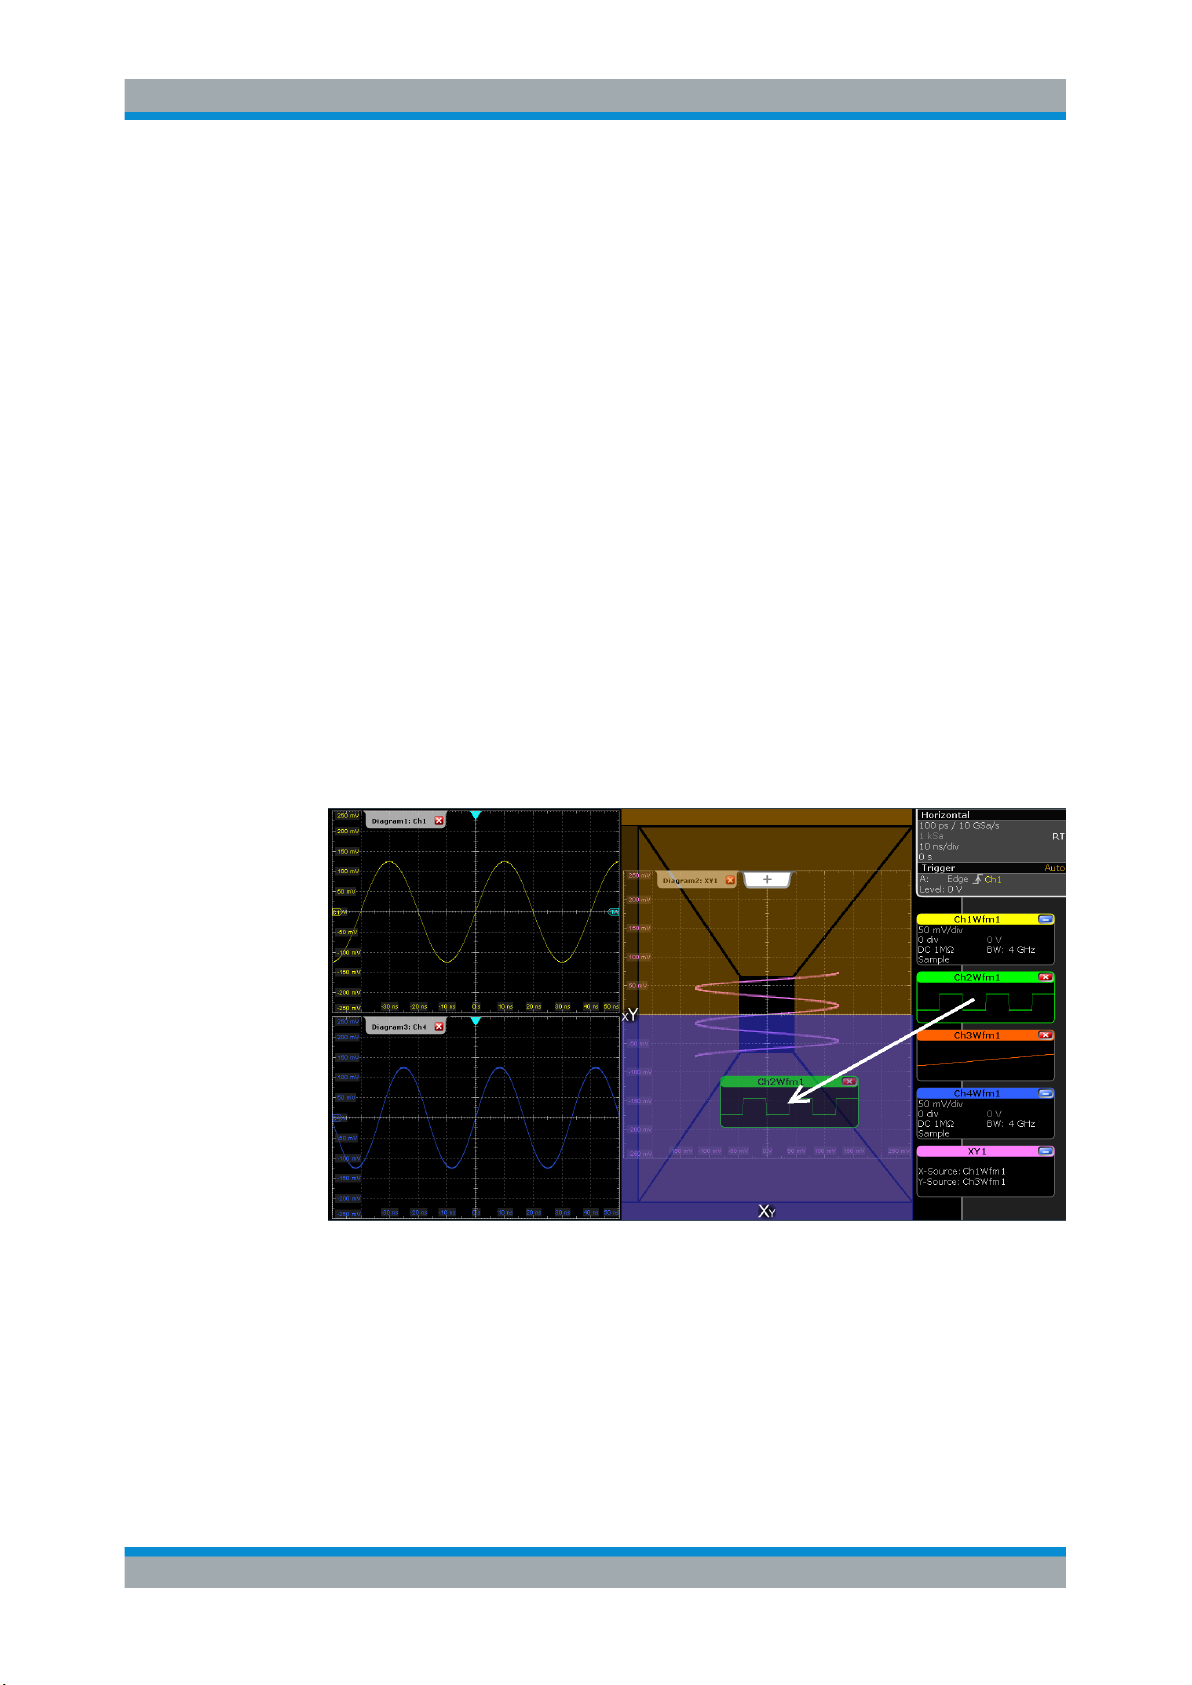
R&S®RTO2000
Operating the Instrument
Working with Waveforms
To minimize a waveform
► Choose on of the following ways:
● Tap the "Minimize" icon in the upper right corner of the waveform's signal label
in the sidebar.
● Drag the waveform from the diagram to the sidebar.
The waveform disappears from the diagram and the minimized signal view is
shown in the signal icon.
Tip: To set the waveform back to its previous diagram immediately, use "Undo".
To arrange a waveform using the SmartGrid
You can arrange waveforms in one of the existing diagrams, or in a new diagram.
The usage of the SmartGrid is also shown in a short video that is available on the
instrument: "Tutorials > Getting Started > SmartGrid".
1. Drag the signal icon to the diagram area, and move it around.
The Rohde & Schwarz SmartGrid appears and a blue area shows where the waveform will be placed.
2. Drop the waveform in the target area.
The waveform appears in an existing or in a new diagram, and it is selected for further actions.
3. To change the size of the new diagram, drag its edge to the required position.
82Getting Started 1332.9719.02 ─ 08
Page 83
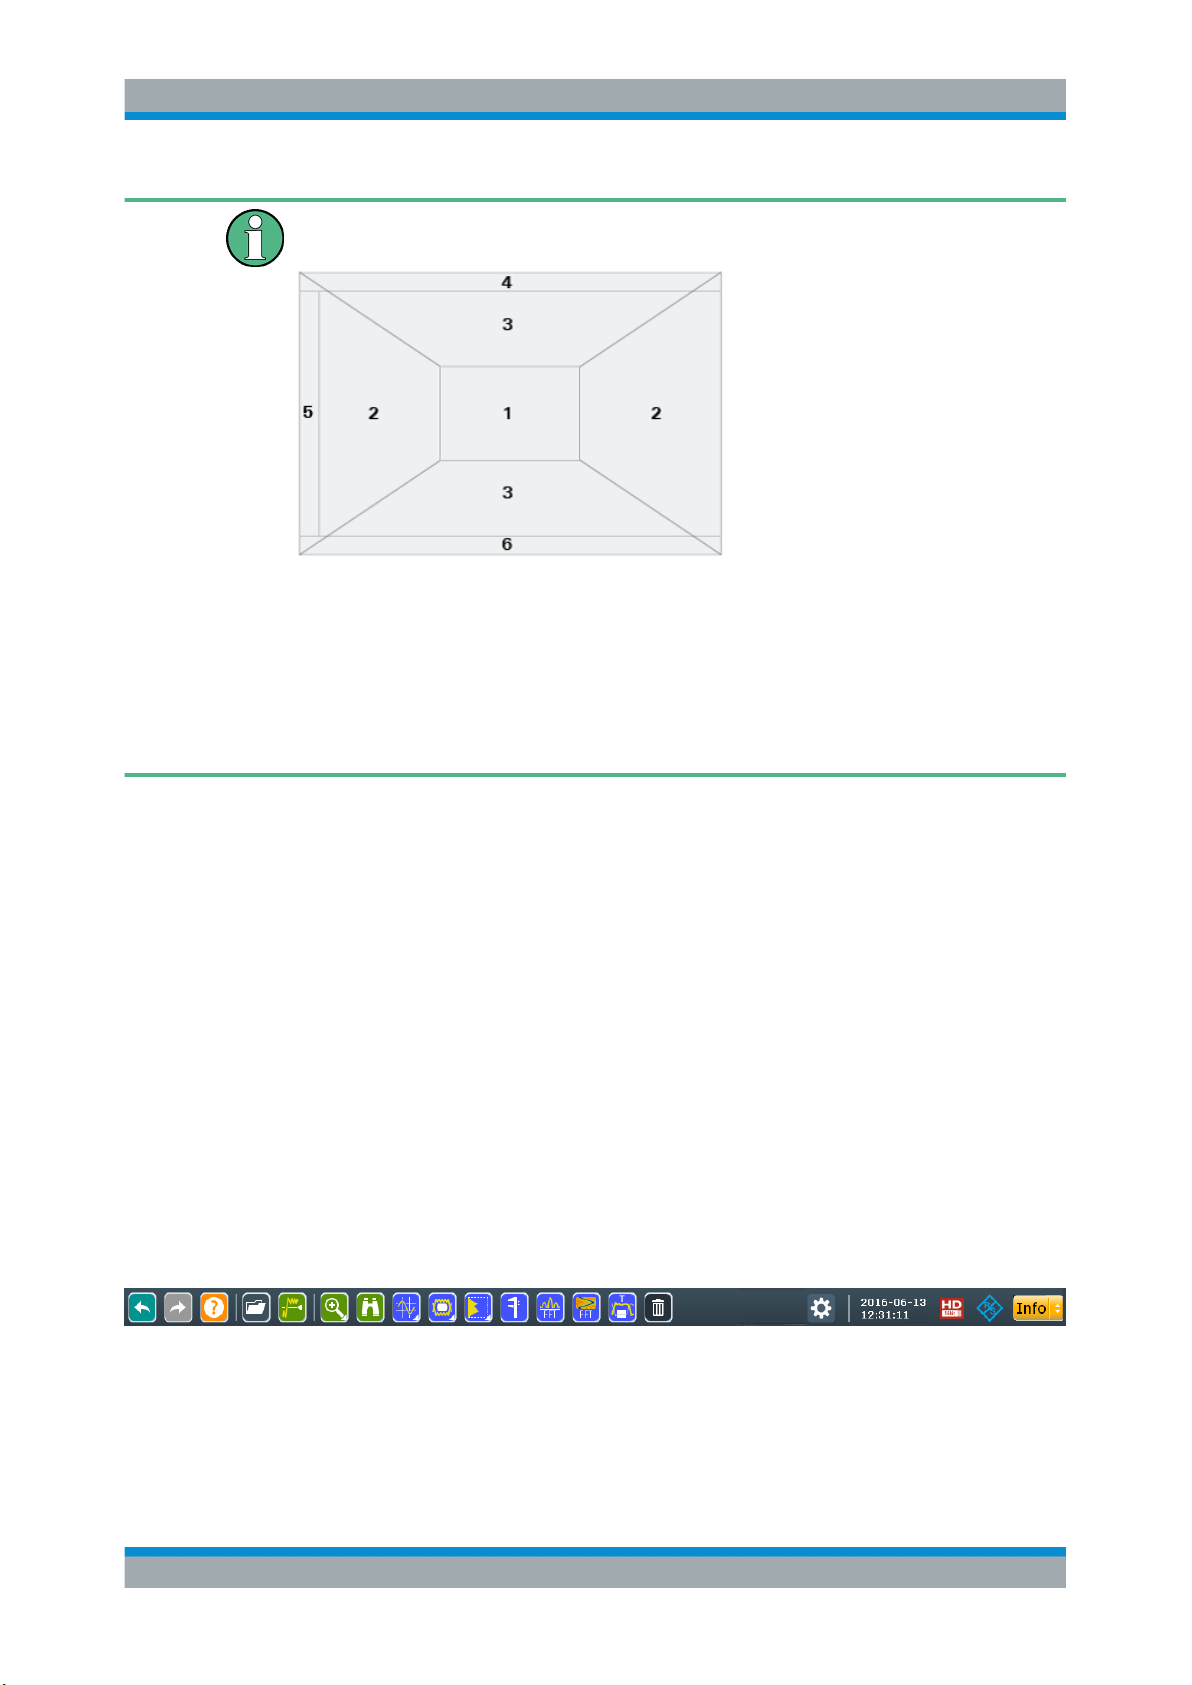
R&S®RTO2000
Operating the Instrument
Toolbar
The diagram layout depends on the position where you drop the signal view, in relation
to an existing diagram.
Figure 5-5: SmartGrid positions
1 = In the existing diagram, overlay of signal
2 = New diagram on the left or right
3 = New diagram above or below
4 = New diagram on top of the existing diagram
5 = XY-diagram
6 = YX-diagram
To switch off a waveform
► Do one of the following:
● Select the waveform, and then press the [Signal Off] key.
● To switch off a minimized waveform, tap the "Close" icon in the upper right cor-
ner of the minimized signal view.
● Disable "Show channel" in the "Vertical" > "Channels" tab.
● Tap the "Delete" icon (Recycle bin) in the toolbar, and then the waveform.
If several waveforms overlap or lie close together, the upper (selected) waveform is switched off.
5.5 Toolbar
The toolbar provides direct access to important control and measurement functions. It
shows current date and time, and a message button. The selected function is highlighted.
By default, the toolbar shows the most frequently used functions. You can configure the
content of the toolbar and hide the date/time display, see Chapter 5.5.2, "Configuring
the Toolbar", on page 84.
83Getting Started 1332.9719.02 ─ 08
Page 84
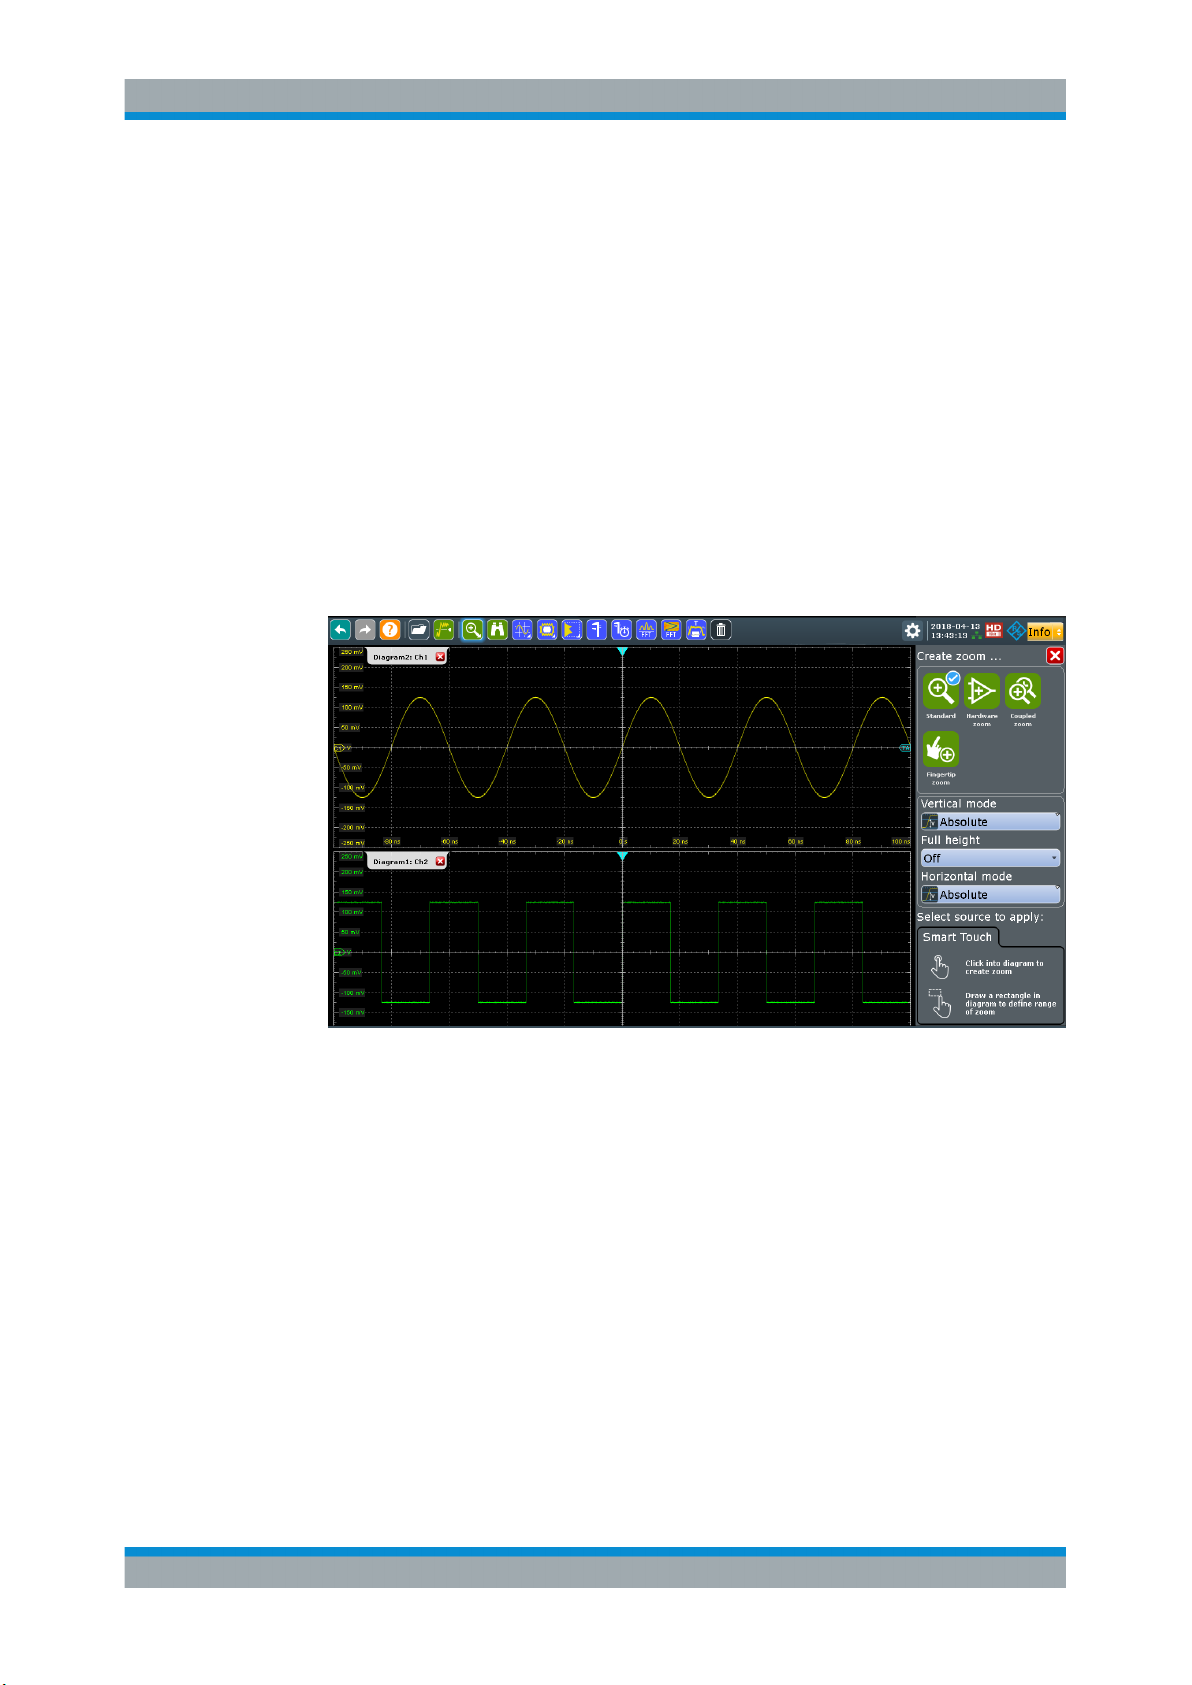
R&S®RTO2000
5.5.1 Using the Toolbar
Operating the Instrument
Toolbar
Using the toolbar is easy and straightforward.
Some of the toolbar functions are one-click actions. These actions are performed
immediately when you tap the icon.
Other toolbar functions are analyzing functions. These actions are interactive actions.
To use analyzing functions (interactive actions)
1. If several waveforms are shown in the diagram, select the waveform that you want
to analyze.
See: "To select a waveform" on page 81
2. Tap the icon of the function in the toolbar.
3. Check and adjust the settings in the sidebar on the right.
4. To define the analyzed area, do one of the following:
● Tap the required diagram.
● Drag a rectangle on the diagram.
The toolbar handling is also shown in a short video that is available on the instrument:
"Tutorials > Getting Started > Toolbar".
5.5.2 Configuring the Toolbar
You can configure the contents of the toolbar so that only the required functions are
displayed. Furthermore, date and time can be hidden. The toolbar configuration is part
of the user preferences. It is retained when you switch off and on the instrument, and
you can save it in the user preferences and user-defined preset.
84Getting Started 1332.9719.02 ─ 08
Page 85
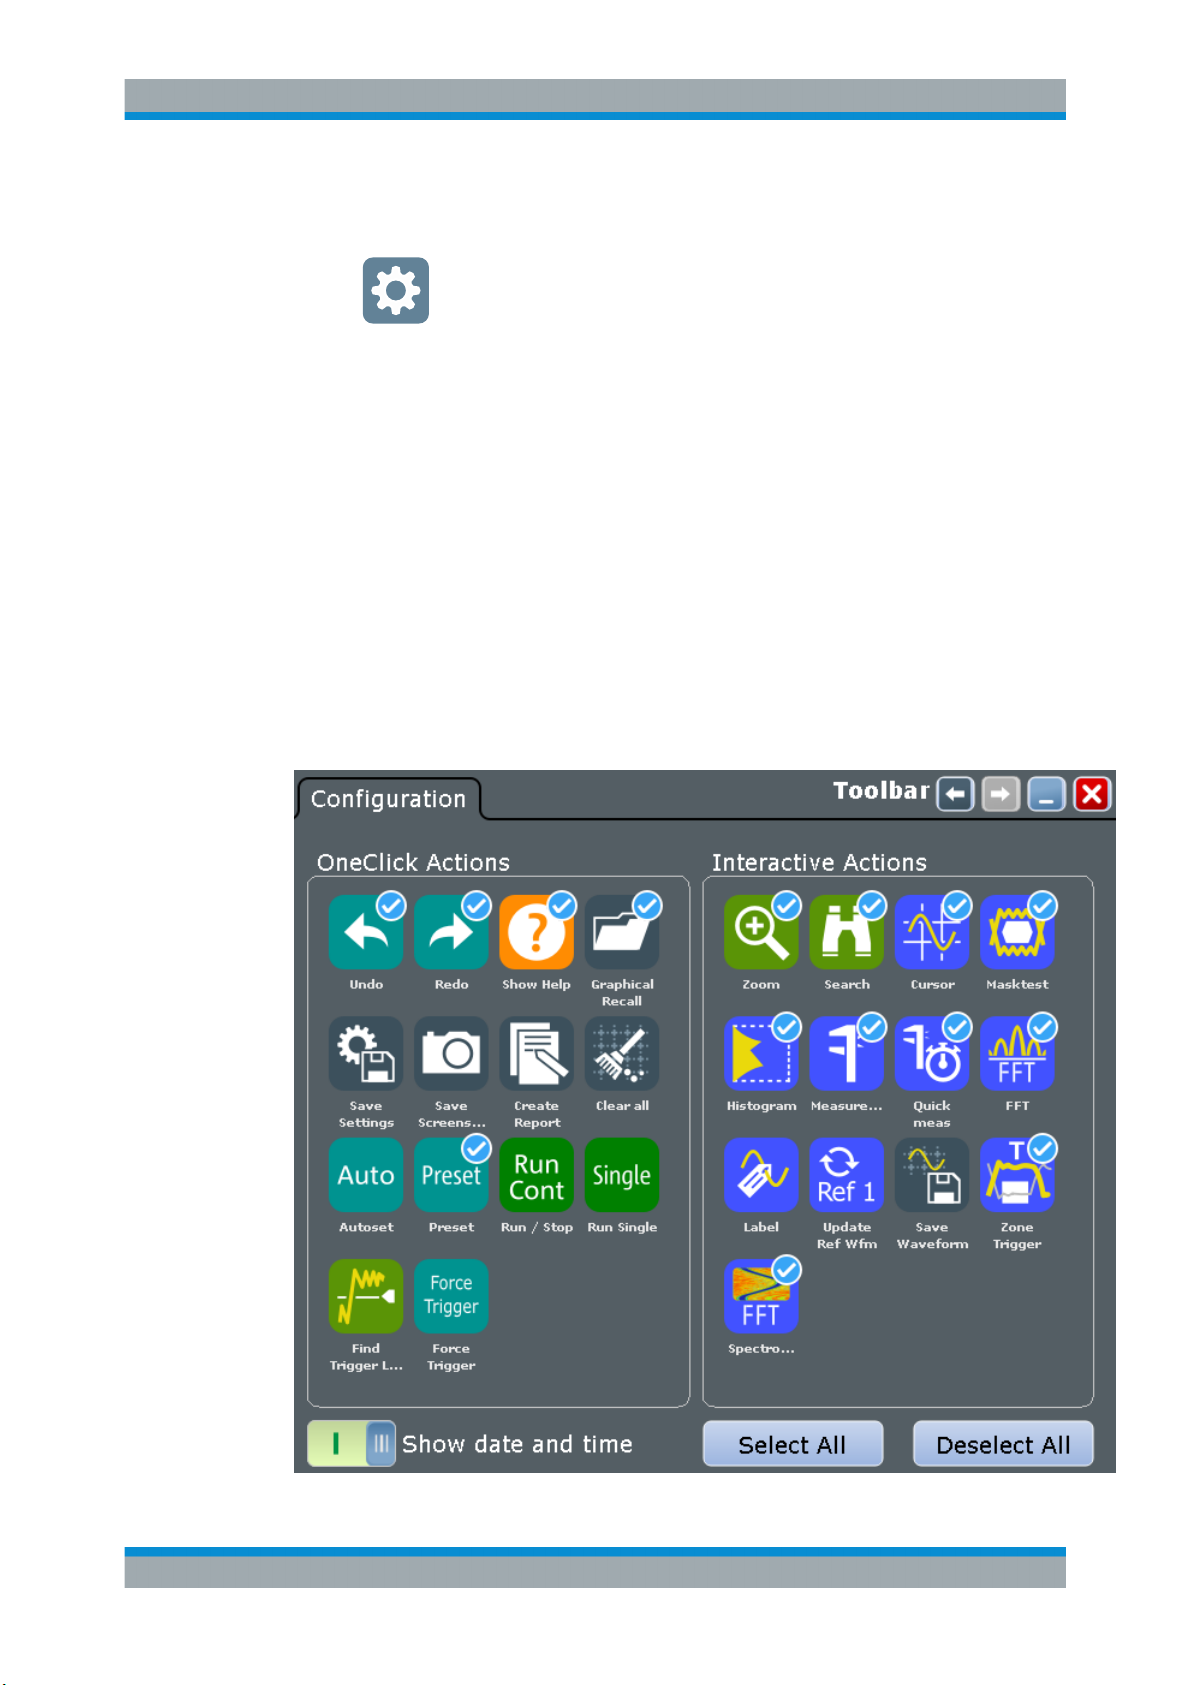
R&S®RTO2000
Operating the Instrument
Toolbar
1. To open the toolbar configuration, choose one of the following ways:
● Tap the icon in the toolbar:
● On the "Display" menu, select "Toolbar".
2. Select the required toolbar functions:
● Disable the functions that you do not need.
Enable the functions that you want to add to the toolbar.
● To display all available toolbar icons, tap "Show All".
● To hide all toolbar icons, tap "Hide All".
3. To hide the current date and time on the toolbar, disable "Show date and time".
A detailed description of the toolbar functions is given in Chapter 5.5.3, "Toolbar Func-
tions", on page 85.
5.5.3 Toolbar Functions
This chapter describes all toolbar functions in detail.
85Getting Started 1332.9719.02 ─ 08
Page 86
R&S®RTO2000
Operating the Instrument
Toolbar
One-click actions Interactive actions
Undo Zoom
Redo Search
Show Help Cursor
Graphical Recall (load saveset ) Masktest
Save Settings Histogram
Save Screenshot Measurement
Create Report Quick meas
Clear all FFT
Autoset and Preset Delete
Run / Stop and Run Single Label
Find Trigger Level Update Ref Waveform
Force Trigger Save Waveform
Spectrogram (option R&S RTO-K18)
Zone trigger (option R&S RTO-K19)
You can configure the content of the toolbar and hide the date/time display, see Chap-
ter 5.5.2, "Configuring the Toolbar", on page 84.
The following list describes at first the default toolbar functions and then the additional
functions.
Undo
Undoes the last setting actions step by step. Some actions cannot be revoked: locking
the touchscreen with [Touch Lock], and saving data. The undo stack is deleted during
the following actions: Reloading settings from file, and reference waveform actions
(save, load and preset with active reference waveform).
Redo
Recovers the undo steps in reverse order.
Show Help
Enables the tooltip display. A short description appears when you tap a parameter in a
dialog or result box. To open the corresponding help topic, tap the "Show Help" button
in the lower right corner of the tooltip. See also: Chapter 5.10, "Getting Information and
Help", on page 96.
Graphical Recall (load saveset )
Opens a window to select and load instrument settings that were previously stored in a
saveset. A graphical preview helps you to find the required settings.
86Getting Started 1332.9719.02 ─ 08
Page 87
R&S®RTO2000
Operating the Instrument
Toolbar
Zoom
The zoom icon on the toolbar shows the last selected zoom type. A short tap on the
icon activates the selected zoom.
To use another zoom type, select it in the sidebar.
Standard zoom ← Zoom
Displays a magnified section of the diagram in an additional zoom diagram. It is a display zoom, instrument settings are not changed.
Tap the icon and drag a rectangle on the diagram to mark the zoom area. An additional
zoom diagram appears. You can use the tool also repeatedly on the zoom diagram to
get a more detailed view.
Touch and hold the zoom area to open the "Zoom" dialog box.
Hardware zoom ← Zoom
Changes the instrument settings - horizontal and vertical scales as well as trigger level
and offset - to display a part of the diagram in greater detail.
Tap the icon and drag a rectangle on the diagram to mark the area to be zoomed. The
diagram changes and shows the magnified area. To return to the previous display, use
the "Undo" function.
Coupled zoom ← Zoom
Creates a coupled zoom area and its related zoom diagram. If you change the size of
one zoom area, the size of all coupled zoom areas is changed as well.
First, create a zoom using the "Standard" zoom. Then tap "Coupled zoom" and tap the
existing zoom area. The zoom area is duplicated. Drag the duplicate to the required
position.
Fingertip zoom ← Zoom
Magnifies the waveforms around your fingertip.
Tap the icon and put your finger on the waveform. The touched part of the waveform is
displayed in a magnifier. Drag your finger on the screen to move the magnifier. You can
change the zoom factor using the Navigation knob.
Search
Performs a search. Tap the icon and adjust the settings in the sidebar. Tap the diagram
with the waveform to be searched, or drag a rectangle to define a search gate. The
search is performed on the selected waveform.
Cursor
The cursor icon shows the last selected cursor type. A short tap on the icon activates
the selected cursor.
To use another cursor type, select it in the sidebar, and adjust the settings.
87Getting Started 1332.9719.02 ─ 08
Page 88
R&S®RTO2000
Operating the Instrument
Toolbar
Tap the diagram where you want to set the cursors, or draw a rectangle in the diagram
to position the cursor lines. The resulting cursor lines measure the selected waveform.
The results appear in the "Cursor Results" box. You can adjust the cursor source, type
and position in the result box. Move the cursor lines by dragging them in the diagram,
or by turning the navigation knob. Pressing the knob switches the parameter to be
changed.
Masktest
Starts the on-screen mask definition and the testing against the defined mask.
Tap the icon and then tap the points that build the mask. Double-tap the last point to
finish mask definition. To create a rectangular mask, draw a rectangle on the screen.
You can move the mask on the screen.
To configure the mask test settings, tap the
Histogram
The histogram icon on the toolbar shows the last selected histogram type. A short tap
on the icon activates the selected histogram.
To use another histogram type, select it in the sidebar, and adjust the settings.
Tap the icon and then drag a rectangle on the diagram to mark the histogram area. The
histogram for the selected waveform appears.
Touch and hold the histogram area to open the "Histogram" dialog box.
icon in the "Mask" result box.
Measurement
Starts an automatic measurement.
You can run up to 8 automatic measurement groups in parallel. The "Automatic measurment" icon starts the measurement groups one after the other.
A measurement group consists of minimum one measurement, and can consist of
many measurements of the same category. Tap the icon and select the measurements
in the sidebar. Tap the diagram with the waveform to be measured. To define a measurement gate, draw a rectangle on the screen.
To modify the measurement, tap the
Quick meas
Performs a set of measurements on the selected waveform. You can configure up to 8
measurement to be included in quick measurement.
Tap the icon and then tap the diagram with the waveform to be measured.
FFT
Transforms a waveform to the frequency spectrum by fast Fourier transform (FFT). The
FFT trace is shown in a new diagram.
Tap the icon and adjust the settings in the sidebar. Tap diagram with the waveform to
be transformed. The FFT diagram is created from the selected waveform.
To adjust FFT settings, double-tap the FFT diagram.
icon in the "Measurement" result box.
88Getting Started 1332.9719.02 ─ 08
Page 89
R&S®RTO2000
Operating the Instrument
Toolbar
Delete
Removes zoom and histogram areas and their diagrams; measurement areas and their
associated results; and mask segments. The icon also switches off a waveform.
Tap the icon and then tap the area or diagram to be deleted, or the waveform to be
switched off.
Save Settings
Saves the current instrument settings in a saveset. The filename is created according
to the autonaming pattern. You can reload the saveset using the "Load saveset
(Graphical recall)" toolbar icon, or using [Save Recall] > "Save/Recall" > "Settings".
Save Screenshot
Saves a screenshot of the current display using the settings defined in "File" menu >
"Print Setup".
Create Report
Creates a report of the current measurement settings and results using the settings
defined in "File" menu > "Report Setup".
Clear all
Deletes all measurement results including long term measurement and statistics, all
waveforms, and the history.
Autoset and Preset
Performs an autoset, or a preset to a default state. The icons have the same functionality as the corresponding keys on the front panel. They are useful when you control
the instrument remotely.
Run / Stop and Run Single
Starts and stops the continuous acquisition, or starts a defined number of acquisition
cycles. The icons have the same functionality as the corresponding keys on the front
panel. They are useful when you control the instrument remotely.
Find Trigger Level
Analyses the signal and sets the trigger level to the middle of the signal peaks.
Force Trigger
Starts an immediate single acquisition. If the acquisition is running in normal mode and
no valid trigger occurs, use "Force Trigger" to confirm that a signal is available. Then
you can use the displayed waveform to determine how to trigger on it.
Label
Defines a waveform label that names or explains the waveform. Tap the icon and then
tap the waveform to be labeled. If you tap the display background, the label is assigned
to the selected waveform. Enter the label text using the onscreen keyboard. The text is
shown in the same color as the waveform. You can drag the label to another position.
89Getting Started 1332.9719.02 ─ 08
Page 90
R&S®RTO2000
Re f 1
Operating the Instrument
Displaying Results
Update Ref Waveform
Copies the selected source waveform with all its settings to the reference waveform. If
the acquisition is running, the reference waveform is a snapshot. You can configure up
to four reference waveforms.
Select the required reference waveform (R1 to R4) in the sidebar.
Save Waveform
Exports the waveform data to file using the settings defined in [Save Recall] > "Waveforms / Results" > "Waveforms". The filename is created according to the autonaming
pattern.
Tap the icon and then tap the waveform to be exported. If you tap the display background, the selected waveform is exported, or a multichannel export is performed if
configured.
Spectrogram (option R&S RTO-K18)
Starts an FFT and the spectrogram. The FFT trace and the spectrogram are shown in
separate diagrams.
Tap the icon. Select the source in the sidebar, or tap diagram with the waveform to be
transformed. The diagrams are created from the selected waveform.
Zone trigger (option R&S RTO-K19)
Defines a zone trigger, which combines the trigger condition with the intersection or
non-intersection of one or more zones or masks.
Tap the icon and then tap the corner points of the zone on the screen.
5.6 Displaying Results
The results of automatic and cursor measurements, mask tests, and searches are displayed immediately in a result box.
There are several places to display the results:
●
In a floating result box in front of the diagrams, which you can move on the display
●
In a minimized view (result icon) on the sidebar
●
In a separate tab
●
For results of automatic measurements: in a docked tab below the diagram
The default position and the font size can be adjusted.
To arrange a result box on the display
► Touch the title of the result box and drag the box on the screen. The SmartGrid
indicates where the result box will be placed.
● If you drop the box on one of the buttons, the results are shown in a separate
tab besides, above, or below the diagram.
● If you drop the box on the sidebar, a result icon is created.
● If you drop the box somewhere else, a floating result box is created.
90Getting Started 1332.9719.02 ─ 08
Page 91
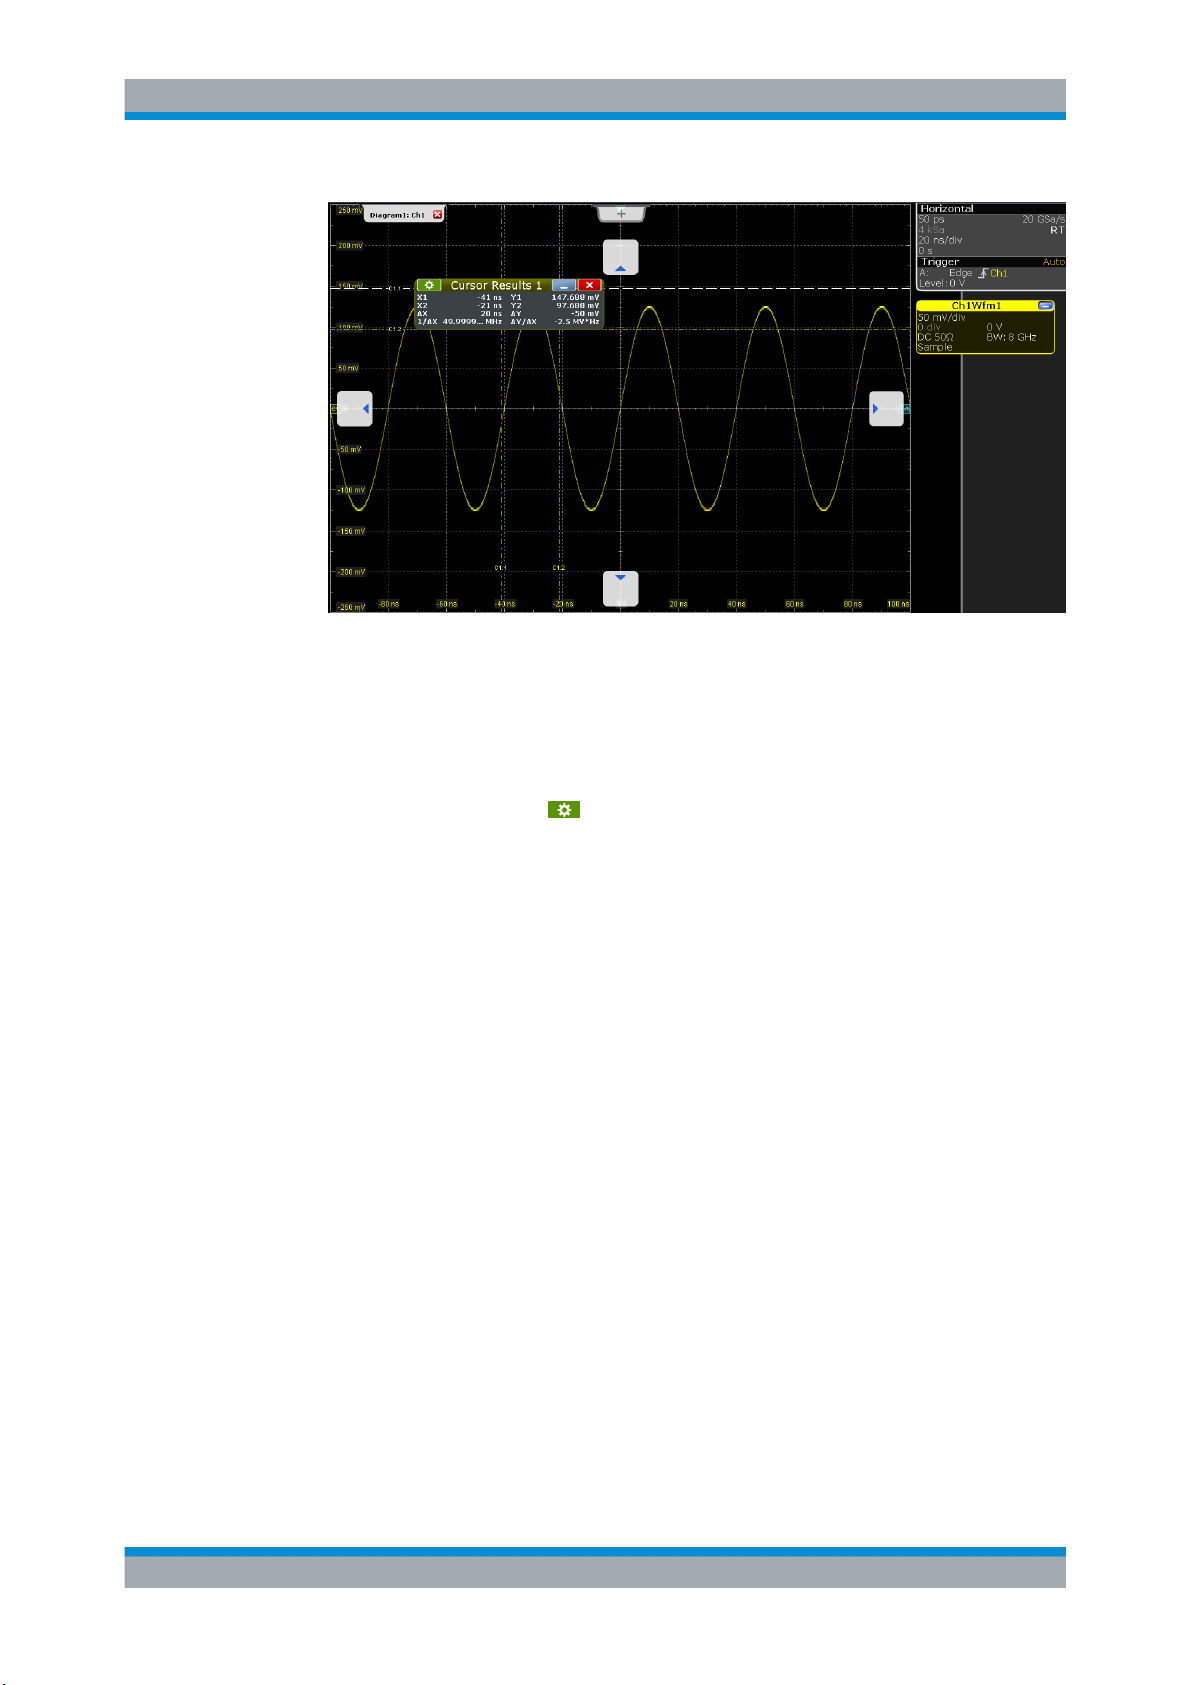
R&S®RTO2000
Operating the Instrument
Displaying Results
1 = Floating result box
2 = Table in a tab on the left or right
3 = Table in a tab above or below
4 = New tab
To open the corresponding setup dialog box
1.
In the result box, tap the icon. Alternatively, double-tap the results.
2. If the sidebar opens, tap "Advanced Settings" in the sidebar.
The dialog box with corresponding settings opens.
To define the default position of results
1. Press the [Display] key on the front panel.
2. In the "Display" dialog box, select the "Diagram Layout" tab.
3. Under "Result box", select the "Default position":
● "Preview": result icon on the sidebar
● "Floating": floating result box in front of the diagrams
4. For result boxes of automatic measurements, the docked position is the default. In
docked position, the result table is placed below the diagram. To change the
default position of measurement results, select "Meas" menu > "Gate/Display" >
"Default" position.
To adjust the font size in result boxes
1. Press the [Setup] key.
2. Select the "Screen" tab.
3. Set the "Result dialog font size".
91Getting Started 1332.9719.02 ─ 08
Page 92
R&S®RTO2000
5.7 Using Dialog Boxes
Operating the Instrument
Using Dialog Boxes
All functionality is provided in dialog boxes as known from computer programs. You
can control the instrument intuitively with the touchscreen. This section provides an
overview of the accessing methods and describes how to use the dialog boxes.
Each dialog box has four icons in the upper right corner:
Go back: opens the previously opened dialog box.
Go forward: opens the next dialog box.
Minimizes the dialog box to a small box that only contains the last selected function.
Closes the dialog box.
For direct access to important control and measurement functions use the toolbar, see
Chapter 5.5, "Toolbar", on page 83.
To open a dialog box
► Perform one of the following actions:
● Tap the required menu, and then the menu entry.
● Press the function key on the front panel.
●
If a results box is open, tap the icon to open the corresponding dialog box.
● To open the "Vertical" dialog box of a waveform, tap its signal icon. For XY-
waveforms, the "XY Diagram" tab opens.
● Tap the horizontal or trigger label to open the "Horizontal" or "Trigger" dialog
box, respectively.
To minimize a dialog box
If you want to change only one setting during analysis, and you need to change it
often, you can display a small box that only contains the required setting.
1. Tap the function that you need to modify.
2.
Tap the
"Minimize" icon in the upper right corner of the dialog box.
The dialog box turns into a small box that contains only the "Wfm Arithmetic" setting.
92Getting Started 1332.9719.02 ─ 08
Page 93
R&S®RTO2000
Operating the Instrument
Entering Data
3.
To restore the complete dialog box, tap the "Maximize" icon in the small box.
To close a dialog box
► Tap the "Close" icon in the upper right corner.
Or:
Press the [Esc] key on the front panel.
To select an option in a dialog box
► Tap the required option.
Or:
Press the [⇤] and [⇥] keys to navigate to the required option. Then press the [☑]
key.
To select an option in a list
If many options are available - for example, for the trigger type - the options are provided in a list. The current selection is shown on the list button.
► Tap the list button. Then tap the required option.
Or:
Use the front panel keys:
a) Press the [⇤] and [⇥] keys to navigate to the list button.
b) Press the [☑] key to open the list.
c) Press the [▲] and [▼] keys to navigate to the required option in the list.
d) Press the [☑] key to select the marked option.
5.8 Entering Data
Most important parameters have their own rotary knobs on the front panel. When you
turn a knob, the input box appears the lower right corner of the screen, showing the
parameter name and current value.
Using rotary knobs
1. Turn the knob to change the value.
2. To toggle the increment, tap the "Steps" icon in the input box.
3. To set the parameter to the autoset value (if available), tap the "RESET" icon.
93Getting Started 1332.9719.02 ─ 08
Page 94
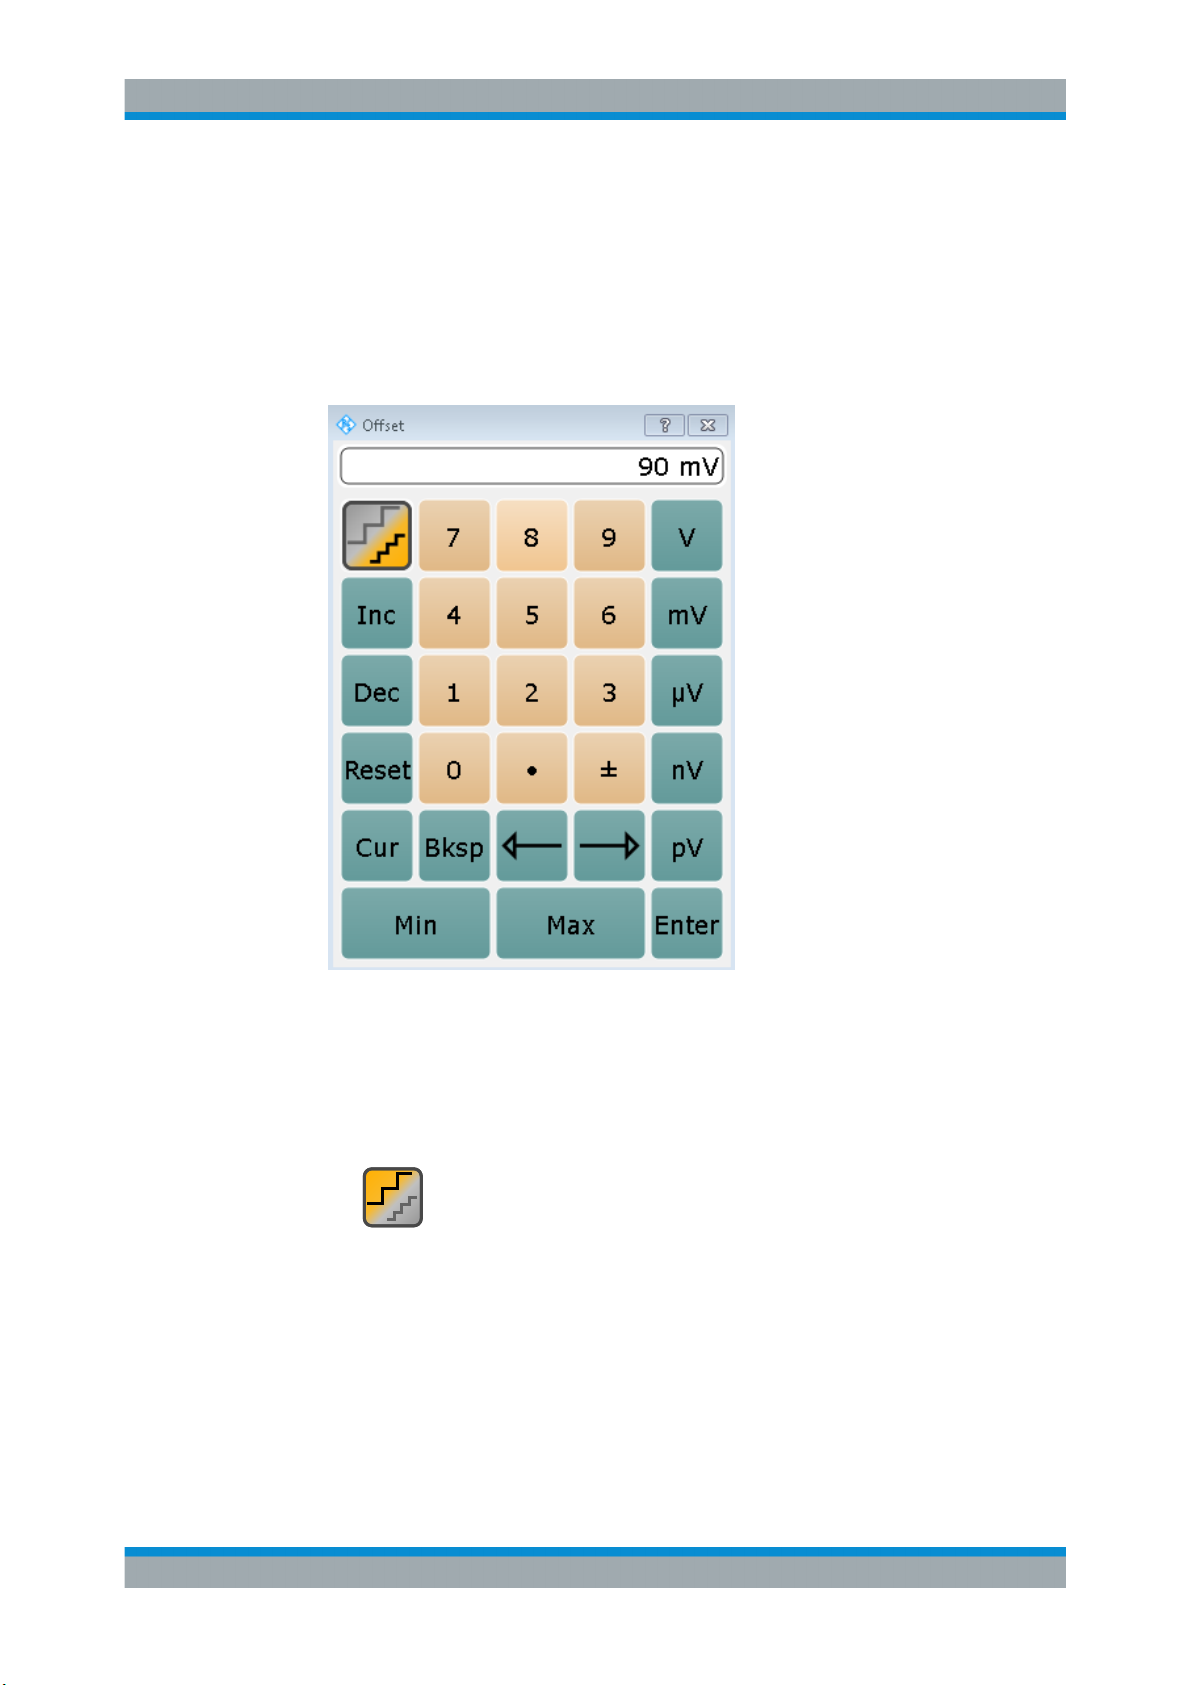
R&S®RTO2000
Operating the Instrument
Entering Data
For data input in dialog boxes, the touchscreen provides an on-screen keypad to enter
numeric values and units. For text input, the on-screen keyboard with English key layout is used.
To enter values with the on-screen keypad
1. Double-tap the entry field.
The on-screen keypad opens.
2. Enter the numeric value using the following methods:
● To use the default value, tap "Reset" (if available).
● To use the minimum or maximum value, tap "Min" or "Max", respectively.
● To increase the displayed value in fixed steps, tap "Inc".
To decrease the value in fixed steps, tap "Dec".
To toggle between small steps and large steps, tap the "Steps" icon.
● To get the value that was used before the keypad was displayed, tap "Cur".
● To enter a user-defined value, tap the numbers and complete the entry by tap-
ping the unit button.
– The arrow buttons move the cursor left or right.
– "Bksp" deletes the last character before the cursor.
– "±" changes the sign of the value.
94Getting Started 1332.9719.02 ─ 08
Page 95
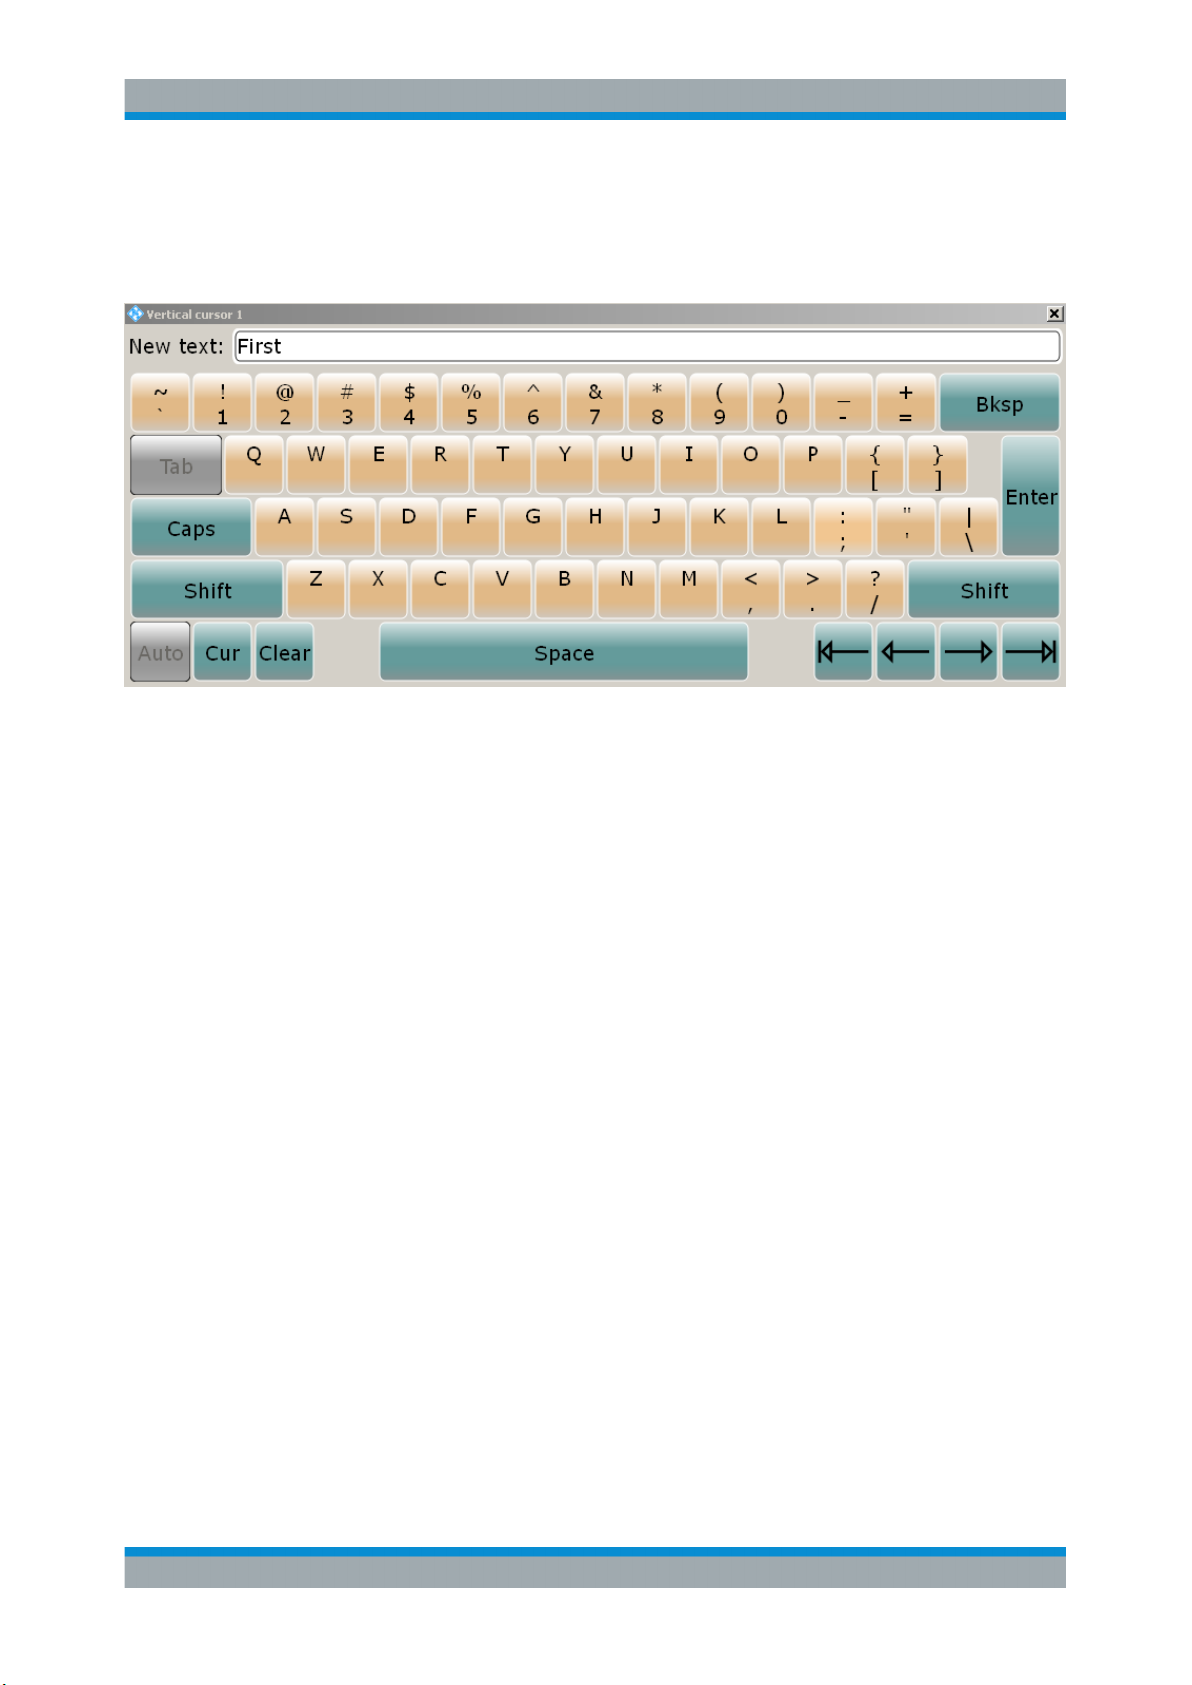
R&S®RTO2000
Operating the Instrument
Messages
To enter data with the on-screen keyboard
1. Double-tap the entry field to open the on-screen keyboard.
If available, you can also tap the keyboard icon on the right of the entry field.
2. Enter the text as you would on a normal keyboard.
● To enter a series of capital characters, tap "Caps".
To enter one capital character, tap "Shift".
● To use the currently defined value, tap "Cur". This is the value that was used
before the keyboard was displayed.
● The arrow buttons move the cursor left or right.
● "Bksp" deletes the last character before the cursor.
3. Tap "Enter" to complete the entry.
To enter numeric data in a dialog box with navigation controls
1. To navigate to the entry field, press the [⇤] and [⇥] keys.
2. To change the value with a small step size, turn the rotary knob.
Alternatively, press the [▲] and [▼] keys for a larger step size.
If you edit numeric data in tables, the entry field must be in edit mode. To activate the
edit mode, press ENTER, or the [☑] key, or the navigation rotary knob.
5.9 Messages
Status messages of the instrument are displayed for a few seconds. Then they are
saved in a message box in the upper right corner of the screen. By default, the message box is closed. You can open it to read the messages and to delete them.
► To open and close the message box, tap the "Info" button.
95Getting Started 1332.9719.02 ─ 08
Page 96
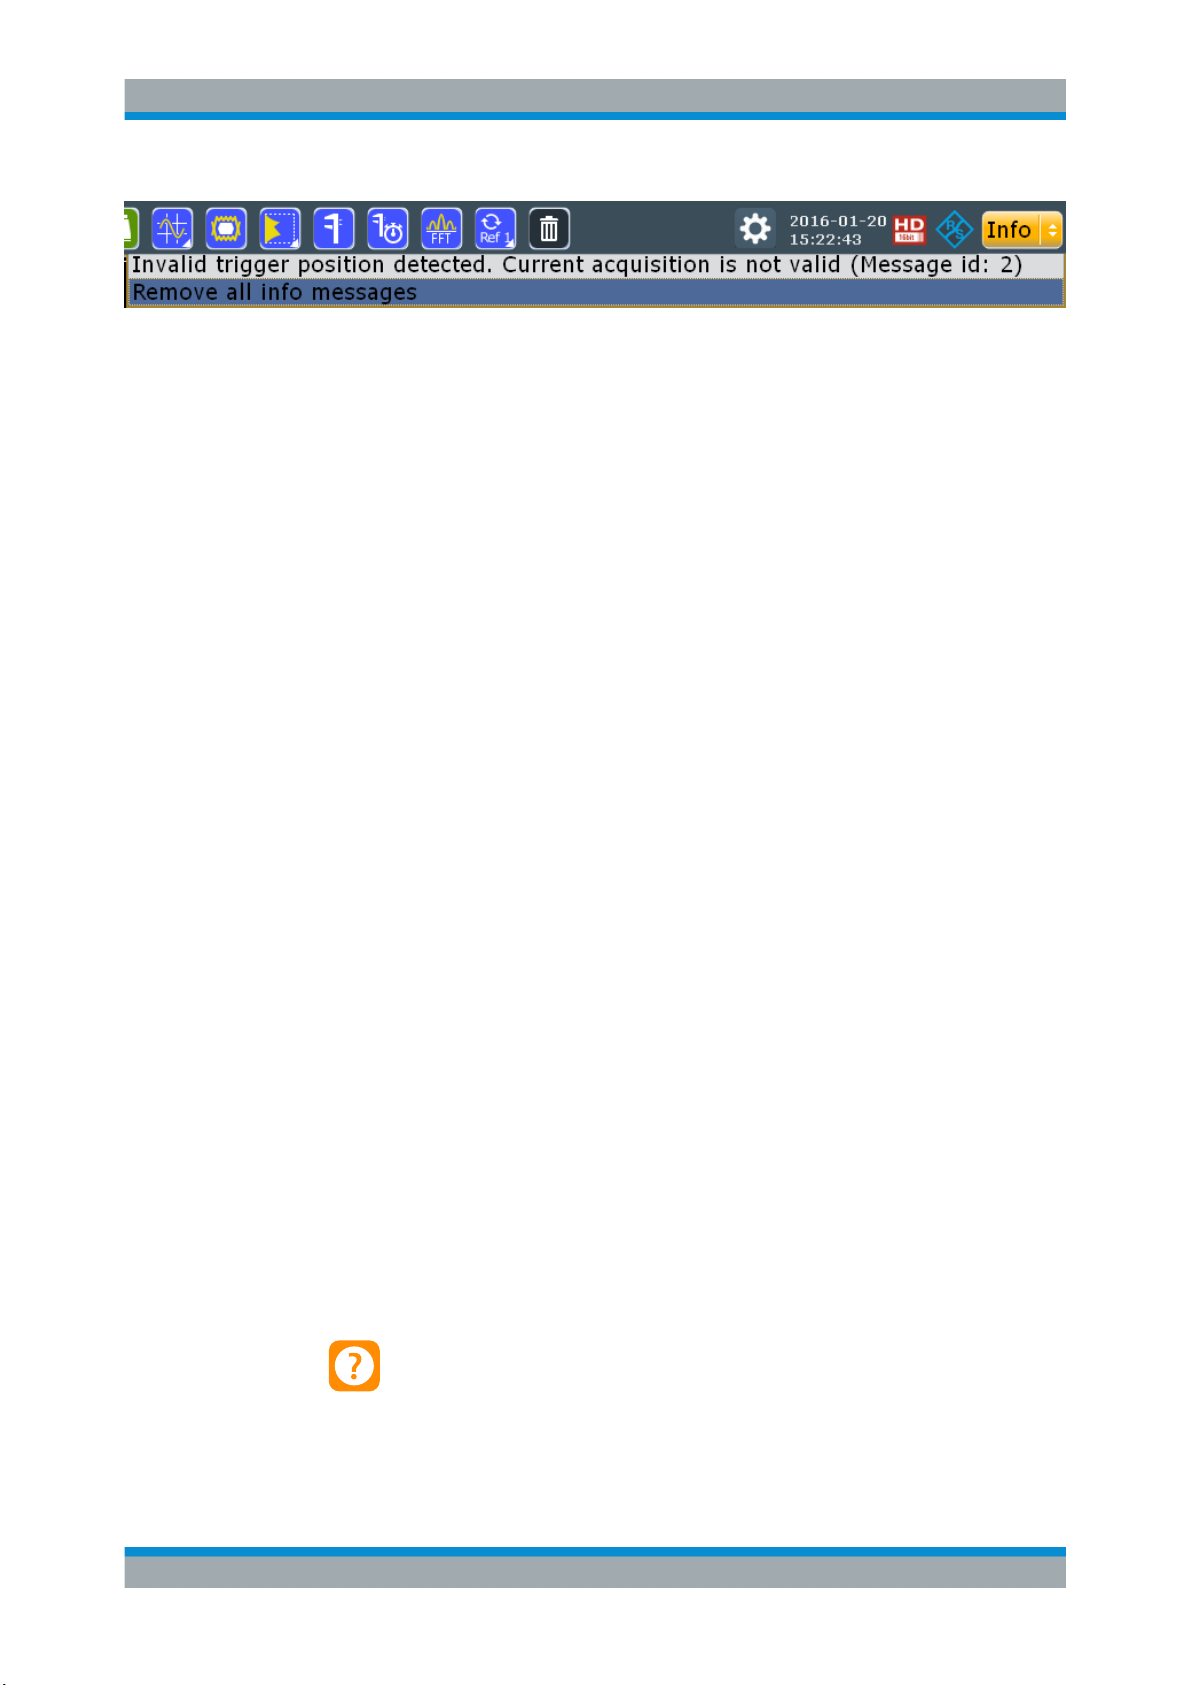
R&S®RTO2000
5.10 Getting Information and Help
Operating the Instrument
Getting Information and Help
If no messages are available, the "Info" button is hidden.
Important messages are indicated by a red "Info" button. These messages cannot be
deleted, they remain until the problem is solved.
In many dialog boxes, graphics are included to explain the way a setting works. For
further information, you can use the following sources:
●
Tutorials demonstrate the general usage of the R&S RTO, for example, how to use
the SmartGrid.
●
Tooltips give a short description of the parameter.
●
The context help provides functional description on a setting, and the corresponding remote command.
●
The general help explains a dialog box, provides instructions, and general information.
5.10.1 Displaying Tutorials
Tutorials are silent movies, which are available directly on the instrument, and on the
Internet. They show basic usage aspects.
To see a tutorial on the instrument
1. On the menu, tap "File".
2. Tap "Tutorials".
3. Tap the tutorial that you want to see.
5.10.2 Displaying Help
To display tooltips and context help
1. Enable the "Tooltip" icon on the toolbar.
2. Tap the parameter for which you need information.
The tooltip opens.
96Getting Started 1332.9719.02 ─ 08
Page 97
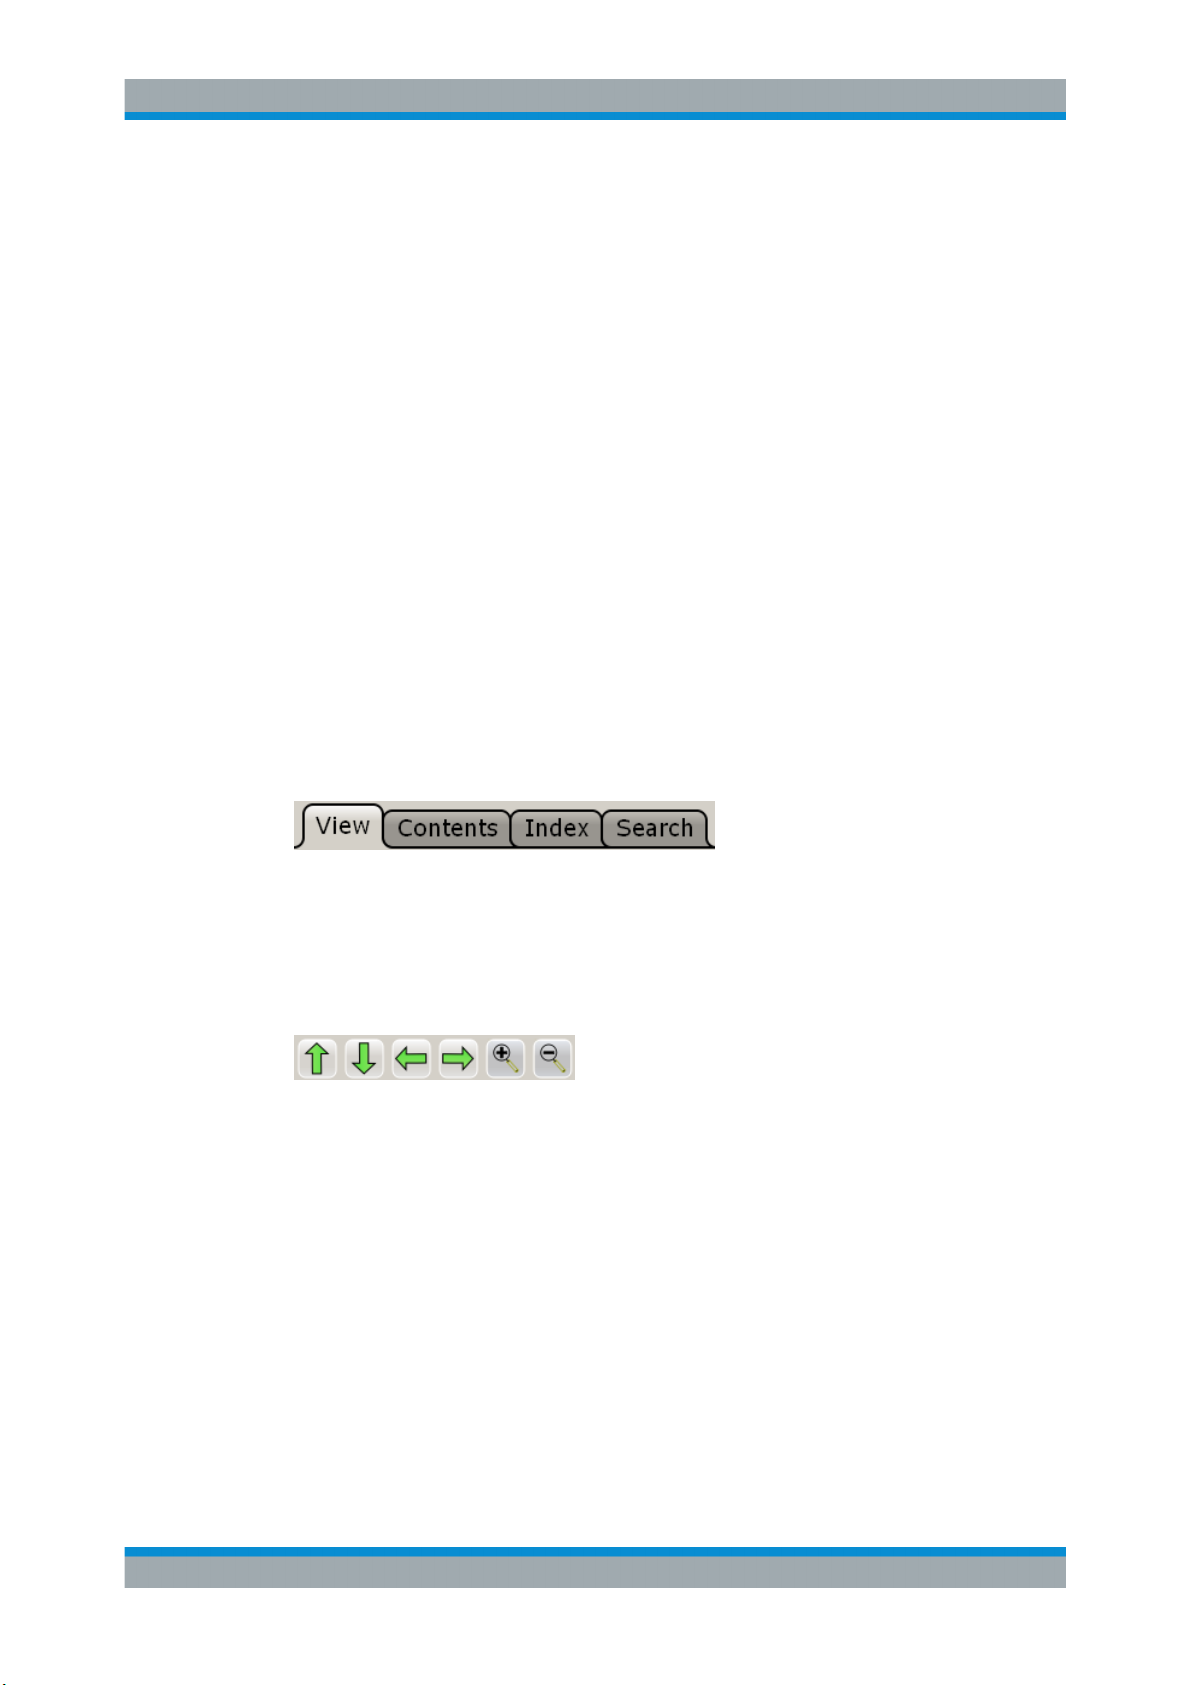
R&S®RTO2000
5.10.3 Using the Help Window
Operating the Instrument
Getting Information and Help
3. To open the corresponding help topic, tap the "Show Help" button in the lower right
corner of the tooltip.
The "Help" window opens and displays the comprehensive description and the corresponding remote command. You can browse the help for further information.
Note: The tooltip icon disables automatically when you tap a parameter. To show
another tooltip, tap the tooltip icon again.
To open general help
► Press the yellow [Help] button on the left side of the screen.
If a dialog box is open, the help topic for the current tab is shown. Otherwise the
"Contents" page appears.
The Help window contains several tabs:
●
"View" - shows the selected help topic
●
"Contents" - contains a table of help contents
●
"Index" - contains index entries to search for help topics
●
"Search" - provides text search
The Help toolbar provides some buttons:
●
To browse the topics in the order of the table of contents: Up arrow = previous
topic, Down arrow = next topic
●
To browse the topics visited before: Left arrow = back, Right arrow = forward
●
To increase or decrease the font
To navigate the Help, use the touchscreen. Alternatively, you can also use the navigation keys on the front panel.
To search for a topic in the index
The index is sorted alphabetically. You can browse the list, or search for entries in the
list.
1. Switch to the "Index" tab.
2. Select the "Keyboard" icon besides the entry field.
3. Enter the first characters of the keyword you are interested in.
The entries containing these characters are displayed.
4. Double-tap the suitable index entry.
97Getting Started 1332.9719.02 ─ 08
Page 98

R&S®RTO2000
Operating the Instrument
Getting Information and Help
The "View" tab with the corresponding help topic is displayed.
To search topics for a text string
1. Switch to the "Search" tab.
2. Select the "Keyboard" icon besides the entry field.
3. Enter the string you want to find.
If you enter several strings with blanks between, topics containing all words are
found (same as AND operator).
For advanced search, consider the following:
● To find a defined string of several words, enclose it in quotation marks. For
example, a search for "trigger qualification" finds all topics with exactly "trigger
qualification". A search for trigger qualification finds all topics that contain the
words trigger and qualification.
● Use "Match whole word" and "Match case" to refine the search.
● Use operators AND, OR, and NOT.
To close the Help window
► Select the "Close" icon in the upper right corner of the help window.
Or: Press the [Esc] key.
98Getting Started 1332.9719.02 ─ 08
Page 99
R&S®RTO2000
6 Setting Up the Instrument
6.1 Performing a Self-alignment
Setting Up the Instrument
Aligning the Touchscreen
Basic setup procedures for the instrument are the following:
● Performing a Self-alignment....................................................................................99
● Aligning the Touchscreen........................................................................................99
● Setting the Display Language............................................................................... 100
● Adjusting Passive Probes..................................................................................... 100
The self-alignment aligns the data from several input channels vertically and horizontally to synchronize the timebases, amplitudes and positions. The self-alignment process includes a basic hardware check.
Recommendation on performing the self-alignment:
●
When putting the instrument into operation for the first time
●
After a firmware update
●
Once a week
●
When major temperature changes occur (> 5°)
Warm-up and prepare the instrument
Make sure that the instrument has been running and warming up before you start the
self-alignment. The minimum warm-up time is indicated in the data sheet.
Remove the probes from the input connectors.
1. On the "File" menu, select "Selfalignment".
2. On the "Control" tab, tap "Start Alignment".
The alignment is performed, the process might take several minutes. A message
box informs you about the running process, wait until this message box closes.
The overall pass/fail result is shown in the "Overall alignment state" field. The
results of the individual alignment steps for each input channel are indicated in the
"Results" tab. This information is required if problems arise.
6.2 Aligning the Touchscreen
When the device is delivered, the touchscreen is initially calibrated. However, to ensure
that the touchscreen responds to the finger contact correctly, a touchscreen alignment
is required. Only users with administrator rights can fulfill this task.
99Getting Started 1332.9719.02 ─ 08
Page 100

R&S®RTO2000
Setting Up the Instrument
Adjusting Passive Probes
Alignment of the touchscreen is useful:
●
At first use
●
If the position of the instrument has been changed, and you cannot look straight on
the screen
●
If another person operates the instrument
●
If you notice, that touching a specific point on the screen does not achieve the correct response
1. Press the [Setup] key.
2. Select the "Screen" tab.
3. Tap "Touchscreen Calibration".
A blinking cross appears in the lower left corner of the screen.
4. Touch and hold the cross until "OK" is shown.
5. Repeat this action for the crosses in the other corners.
6. Tap the R&S logo button in the task bar to display the instrument's user interface.
6.3 Setting the Display Language
You can change the language in which the dialog boxes, result boxes and other screen
information is displayed. A reboot of the instrument is not necessary.
1. Press the [Setup] key.
2. Select the "System" tab.
3. Tap the "Language" button. The button shows the current language.
4. Select the required language.
The instrument changes the language after a few seconds.
6.4 Adjusting Passive Probes
R&S RT-ZP10 passive probes are already pre-compensated to the R&S RTO front-end
characteristics, and a compensation procedure is not required.
If you use other passive probes, the R&S RTO allows you to compensate it when it is
connected to the instrument the first time. Compensation matches the probe cable
capacitance to the oscilloscope input capacitance to assure good amplitude accuracy
from DC to upper bandwidth limit frequencies. A poorly compensated probe reduces
the performance of the probe-oscilloscope system and introduces measurement errors
resulting in distorted waveforms and inaccurate results.
100Getting Started 1332.9719.02 ─ 08
 Loading...