


R&S®FSWP-B1
Signal and Spectrum Analyzer
User Manual
(;ÛÆÆ2)
1177565602
Version 09

This manual describes the following R&S®FSWP models with firmware version 1.92 or higher:
●
R&S®FSWP8 (1322.8003K08)
●
R&S®FSWP26 (1322.8003K26)
●
R&S®FSWP50 (1322.8003K50)
The following options are described:
●
R&S FSWP-B1 (1322.9997.08)
●
R&S FSWP-B1 (1322.9997.26)
●
R&S FSWP-B1 (1322.9997.50)
© 2021 Rohde & Schwarz GmbH & Co. KG
Mühldorfstr. 15, 81671 München, Germany
Phone: +49 89 41 29 - 0
Email: info@rohde-schwarz.com
Internet: www.rohde-schwarz.com
Subject to change – data without tolerance limits is not binding.
R&S® is a registered trademark of Rohde & Schwarz GmbH & Co. KG.
Trade names are trademarks of the owners.
1177.5656.02 | Version 09 | R&S®FSWP-B1
Throughout this manual, products from Rohde & Schwarz are indicated without the ® symbol , e.g. R&S®FSWP is indicated as
R&S FSWP.

R&S®FSWP-B1
1 Preface.................................................................................................. 11
1.1 About this Manual....................................................................................................... 11
1.2 Documentation Overview........................................................................................... 11
1.2.1 Getting Started Manual................................................................................................. 12
1.2.2 User Manuals and Help.................................................................................................12
1.2.3 Service Manual............................................................................................................. 12
1.2.4 Instrument Security Procedures....................................................................................12
1.2.5 Basic Safety Instructions...............................................................................................13
1.2.6 Data Sheets and Brochures.......................................................................................... 13
1.2.7 Release Notes and Open Source Acknowledgment (OSA).......................................... 13
1.2.8 Application Notes, Application Cards, White Papers, etc..............................................13
Contents
Contents
1.3 Conventions Used in the Documentation.................................................................13
1.3.1 Typographical Conventions...........................................................................................13
1.3.2 Conventions for Procedure Descriptions.......................................................................14
1.3.3 Notes on Screenshots...................................................................................................14
2 Welcome to the R&S FSWP-B1...........................................................15
2.1 Starting the Application..............................................................................................15
2.2 Understanding the Display Information....................................................................15
2.3 R&S MultiView............................................................................................................. 17
3 Measurements and Results.................................................................19
3.1 Basic Measurements.................................................................................................. 20
3.1.1 Basic Measurement Types............................................................................................20
3.1.2 How to Perform a Basic Sweep Measurement............................................................. 21
3.1.3 Measurement Examples - Measuring a Sinusoidal Signal............................................22
3.1.4 Measurement Example – Measuring Levels at Low S/N Ratios................................... 25
3.1.5 Measurement Examples - Measuring Signal Spectra with Multiple Signals................. 28
3.1.6 Measurement Examples in Zero Span..........................................................................35
3.2 Channel Power and Adjacent-Channel Power (ACLR) Measurement....................41
3.2.1 About Channel Power Measurements.......................................................................... 42
3.2.2 Channel Power Results.................................................................................................42
3.2.3 Channel Power Basics.................................................................................................. 44
3User Manual 1177.5656.02 ─ 09

R&S®FSWP-B1
3.2.4 Channel Power Configuration....................................................................................... 57
3.2.5 MSR ACLR Configuration............................................................................................. 66
3.2.6 How to Perform Channel Power Measurements...........................................................82
3.2.7 Measurement Examples............................................................................................... 87
3.2.8 Optimizing and Troubleshooting the Measurement.......................................................90
3.2.9 Reference: Predefined CP/ACLR Standards................................................................ 91
3.2.10 Reference: Predefined ACLR User Standard XML Files.............................................. 92
3.3 Carrier-to-Noise Measurements.................................................................................94
3.3.1 About the Measurement................................................................................................94
3.3.2 Carrier-to-Noise Results................................................................................................95
3.3.3 Carrier-to-Noise Configuration...................................................................................... 95
3.3.4 How to Determine the Carrier-to-Noise Ratio............................................................... 97
3.4 Occupied Bandwidth Measurement (OBW).............................................................. 97
Contents
3.4.1 About the Measurement................................................................................................98
3.4.2 OBW Results...............................................................................................................100
3.4.3 OBW Configuration..................................................................................................... 101
3.4.4 How to Determine the Occupied Bandwidth............................................................... 103
3.4.5 Measurement Example............................................................................................... 104
3.5 Noise Power Ratio (NPR) Measurement................................................................. 105
3.5.1 About Noise Power Ratio (NPR) Measurements........................................................ 105
3.5.2 NPR Basics................................................................................................................. 105
3.5.3 NPR Results................................................................................................................107
3.5.4 NPR Configuration...................................................................................................... 109
3.5.5 Generator Setup..........................................................................................................113
3.5.6 Generator Frequency Coupling................................................................................... 117
3.5.7 How to Perform NPR Measurements.......................................................................... 119
3.5.8 Measurement Example............................................................................................... 120
3.6 Spectrum Emission Mask (SEM) Measurement..................................................... 121
3.6.1 About the Measurement..............................................................................................122
3.6.2 Typical Applications.....................................................................................................122
3.6.3 SEM Results............................................................................................................... 122
3.6.4 SEM Basics.................................................................................................................125
3.6.5 SEM Configuration...................................................................................................... 136
4User Manual 1177.5656.02 ─ 09

R&S®FSWP-B1
3.6.6 How to Perform a Spectrum Emission Mask Measurement........................................153
3.6.7 Measurement Example: Multi-SEM Measurement......................................................157
3.6.8 Reference: SEM File Descriptions.............................................................................. 159
3.7 Spurious Emissions Measurement......................................................................... 166
3.7.1 About the Measurement..............................................................................................166
3.7.2 Spurious Emissions Measurement Results.................................................................167
3.7.3 Spurious Emissions Basics......................................................................................... 168
3.7.4 Spurious Emissions Measurement Configuration....................................................... 170
3.7.5 How to Perform a Spurious Emissions Measurement.................................................176
3.7.6 Reference: ASCII Export File Format (Spurious)........................................................ 177
3.8 Statistical Measurements (APD, CCDF).................................................................. 179
3.8.1 About the Measurements............................................................................................ 179
3.8.2 Typical Applications.....................................................................................................180
Contents
3.8.3 APD and CCDF Results..............................................................................................180
3.8.4 APD and CCDF Basics - Gated Triggering................................................................. 183
3.8.5 APD and CCDF Configuration.................................................................................... 184
3.8.6 How to Perform an APD or CCDF Measurement........................................................190
3.8.7 Examples.................................................................................................................... 191
3.8.8 Optimizing and Troubleshooting the Measurement.....................................................194
3.9 Time Domain Power Measurement..........................................................................194
3.9.1 About the Measurement..............................................................................................194
3.9.2 Time Domain Power Results.......................................................................................194
3.9.3 Time Domain Power Basics - Range Definition Using Limit Lines..............................195
3.9.4 Time Domain Power Configuration............................................................................. 196
3.9.5 How to Measure Powers in the Time Domain.............................................................197
3.9.6 Measurement Example............................................................................................... 198
3.10 Harmonic Distortion Measurement......................................................................... 199
3.10.1 About the Measurement..............................................................................................199
3.10.2 Harmonic Distortion Basics......................................................................................... 200
3.10.3 Harmonic Distortion Results........................................................................................202
3.10.4 Harmonic Distortion Configuration.............................................................................. 203
3.10.5 How to Determine the Harmonic Distortion.................................................................205
3.11 Third Order Intercept (TOI) Measurement...............................................................205
5User Manual 1177.5656.02 ─ 09

R&S®FSWP-B1
3.11.1 About the TOI Measurement.......................................................................................206
3.11.2 TOI Basics...................................................................................................................206
3.11.3 TOI Results................................................................................................................. 210
3.11.4 TOI Configuration........................................................................................................ 211
3.11.5 How to Determine the Third Order Intercept............................................................... 212
3.11.6 Measurement Example – Measuring the R&S FSWP's Intrinsic Intermodulation....... 213
3.12 AM Modulation Depth Measurement....................................................................... 215
3.12.1 About the Measurement..............................................................................................215
3.12.2 AM Modulation Depth Results.....................................................................................215
3.12.3 AM Modulation Depth Configuration........................................................................... 216
3.12.4 Optimizing and Troubleshooting the Measurement.....................................................217
3.12.5 How to Determine the AM Modulation Depth..............................................................218
Contents
4 Common Measurement Settings...................................................... 219
4.1 Configuration Overview............................................................................................219
4.2 Data Input and Output.............................................................................................. 221
4.2.1 Receiving Data Input and Providing Data Output....................................................... 221
4.2.2 Input Source Settings..................................................................................................223
4.2.3 Power Sensors............................................................................................................225
4.2.4 Probes Input................................................................................................................234
4.2.5 Optional External Generator Control...........................................................................239
4.2.6 Optional External Mixers............................................................................................. 266
4.2.7 Output Settings........................................................................................................... 291
4.3 Frequency and Span Configuration........................................................................ 295
4.3.1 Impact of the Frequency and Span Settings............................................................... 296
4.3.2 Frequency and Span Settings.....................................................................................298
4.3.3 Keeping the Center Frequency Stable - Signal Tracking............................................ 301
4.3.4 How To Define the Frequency Range......................................................................... 302
4.3.5 How to Move the Center Frequency through the Frequency Range...........................302
4.4 Amplitude and Vertical Axis Configuration............................................................ 302
4.4.1 Impact of the Vertical Axis Settings.............................................................................303
4.4.2 Amplitude Settings...................................................................................................... 305
4.4.3 Scaling the Y-Axis....................................................................................................... 309
4.4.4 How to Optimize the Amplitude Display...................................................................... 310
6User Manual 1177.5656.02 ─ 09

R&S®FSWP-B1
4.5 Bandwidth, Filter and Sweep Configuration...........................................................311
4.5.1 Impact of the Bandwidth, Filter and Sweep Settings...................................................311
4.5.2 Bandwidth, Filter and Sweep Settings........................................................................ 317
4.5.3 Reference: List of Available RRC and Channel Filters................................................325
4.6 Trigger and Gate Configuration...............................................................................327
4.6.1 Triggering.................................................................................................................... 327
4.6.2 Gating..........................................................................................................................338
4.7 Adjusting Settings Automatically............................................................................343
4.8 Transducer.................................................................................................................345
4.8.1 Basics on Transducer Factors.....................................................................................345
4.8.2 Transducer Settings.................................................................................................... 347
4.8.3 How to Configure the Transducer............................................................................... 353
4.8.4 Reference: Transducer Factor File Format................................................................. 356
Contents
5 Common Analysis and Display Functions...................................... 358
5.1 Result Display Configuration...................................................................................358
5.1.1 Basic Evaluation Methods...........................................................................................358
5.1.2 Laying out the Result Display with the SmartGrid.......................................................361
5.2 Zoomed Displays...................................................................................................... 365
5.2.1 Single Zoom Versus Multiple Zoom............................................................................ 365
5.2.2 Zoom Functions.......................................................................................................... 367
5.2.3 How to Zoom Into a Diagram...................................................................................... 368
5.3 Configuring Traces................................................................................................... 370
5.3.1 Basics on Trace Configuration.................................................................................... 370
5.3.2 Configuring Standard Traces...................................................................................... 387
5.3.3 Exporting and Importing Traces.................................................................................. 391
5.3.4 Copying Traces........................................................................................................... 395
5.3.5 Trace Math.................................................................................................................. 396
5.3.6 Configuring Spectrograms.......................................................................................... 397
5.3.7 How to Configure Traces.............................................................................................402
5.3.8 References..................................................................................................................408
5.4 Marker Usage.............................................................................................................413
5.4.1 Basics on Markers.......................................................................................................413
5.4.2 Marker Settings........................................................................................................... 416
7User Manual 1177.5656.02 ─ 09

R&S®FSWP-B1
5.4.3 Marker Search Settings and Positioning Functions.................................................... 421
5.4.4 Marker (Measurement) Functions............................................................................... 427
5.4.5 How to Work With Markers..........................................................................................443
5.4.6 Measurement Example: Measuring Harmonics Using Marker Functions................... 445
5.5 Display and Limit Lines............................................................................................ 446
5.5.1 Display Lines...............................................................................................................447
5.5.2 Limit Lines................................................................................................................... 449
6 Remote Control Commands for the Spectrum Application........... 465
6.1 Introduction............................................................................................................... 465
6.1.1 Conventions used in Descriptions...............................................................................465
6.1.2 Long and Short Form.................................................................................................. 466
6.1.3 Numeric Suffixes......................................................................................................... 466
Contents
6.1.4 Optional Keywords...................................................................................................... 467
6.1.5 Alternative Keywords.................................................................................................. 467
6.1.6 SCPI Parameters........................................................................................................ 467
6.2 Common Suffixes......................................................................................................470
6.3 Configuring and Performing Measurements.......................................................... 470
6.3.1 Performing Measurements..........................................................................................470
6.3.2 Performing a Sequence of Measurements..................................................................475
6.3.3 Configuring Power Measurements..............................................................................477
6.3.4 Measuring the Channel Power and ACLR.................................................................. 481
6.3.5 Measuring the Carrier-to-Noise Ratio......................................................................... 523
6.3.6 Measuring the Occupied Bandwidth........................................................................... 524
6.3.7 Remote Commands for Noise Power Ratio (NPR) Measurements............................ 526
6.3.8 Measuring with Spectrum Emission Masks.................................................................542
6.3.9 Measuring Spurious Emissions...................................................................................578
6.3.10 Analyzing Statistics..................................................................................................... 592
6.3.11 Measuring the Time Domain Power............................................................................602
6.3.12 Measuring the Harmonic Distortion............................................................................. 611
6.3.13 Measuring the Third Order Intercept Point..................................................................614
6.3.14 Measuring the AM Modulation Depth..........................................................................618
6.3.15 List Evaluations........................................................................................................... 620
6.3.16 Measuring the Pulse Power........................................................................................ 624
8User Manual 1177.5656.02 ─ 09

R&S®FSWP-B1
6.3.17 Programming Example: Performing a Basic Frequency Sweep................................. 629
6.4 Remote Commands to Select the Spectrum Application......................................632
6.5 General Window Commands....................................................................................635
6.6 Working with Windows in the Display.....................................................................636
6.7 Preset......................................................................................................................... 643
6.8 Common Measurement Settings............................................................................. 644
6.8.1 Configuring Inputs and Ouputs................................................................................... 644
6.8.2 Defining the Frequency............................................................................................... 694
6.8.3 Amplitude Settings...................................................................................................... 701
6.8.4 Scaling the Y-Axis....................................................................................................... 705
6.8.5 Remote Commands to Define Filter Characteristics................................................... 708
6.8.6 Remote Commands to Control a Measurement..........................................................711
6.8.7 Trigger Configuration...................................................................................................716
Contents
6.8.8 Automatic Configuration..............................................................................................724
6.8.9 Transducer.................................................................................................................. 727
6.9 Common Analysis and Display Functions............................................................. 731
6.9.1 Zoom........................................................................................................................... 732
6.9.2 Remote Commands to Configure Traces....................................................................735
6.9.3 Marker Usage..............................................................................................................759
6.9.4 Lines............................................................................................................................811
7 Maintenance....................................................................................... 829
7.1 Cleaning..................................................................................................................... 829
List of commands.............................................................................. 831
Index....................................................................................................847
9User Manual 1177.5656.02 ─ 09

R&S®FSWP-B1
Contents
10User Manual 1177.5656.02 ─ 09

R&S®FSWP-B1
1 Preface
1.1 About this Manual
Preface
Documentation Overview
This User Manual provides all the information specific to RF measurements in the
Spectrum application. All other operating modes and applications are described in
the specific application manuals.
The main focus in this manual is on the measurement results and the tasks required to
obtain them. The following topics are included:
●
Welcome to the R&S FSWP
Introduction to and getting familiar with the instrument
●
Measurements
Descriptions of the individual measurements in the Spectrum application, including
result types and configuration settings.
●
Common Measurement Settings
Description of the measurement settings common to all measurement types with
their corresponding remote control commands
●
Common Measurement Analysis and Display Functions
Description of the settings and functions provided to analyze results independently
of the measurement type with their corresponding remote control commands
●
Remote Commands
Remote commands required to configure and perform measurements in a remote
environment, sorted by tasks
Remote commands required to set up the environment and to perform common
tasks on the instrument, sorted by tasks
Programming examples demonstrate the use of many commands and can usually
be executed directly for test purposes
●
List of Commands
Alphabetical list of all remote commands described in the manual
●
Index
1.2 Documentation Overview
This section provides an overview of the R&S FSWP user documentation. Unless
specified otherwise, you find most of the documents on the R&S FSWP product page
at:
www.rohde-schwarz.com/manual/fswp
11User Manual 1177.5656.02 ─ 09

R&S®FSWP-B1
1.2.1 Getting Started Manual
1.2.2 User Manuals and Help
Preface
Documentation Overview
Introduces the R&S FSWP and describes how to set up and start working with the
product. Includes basic operations, typical measurement examples, and general information, e.g. safety instructions, etc.
A printed version is delivered with the instrument. A PDF version is available for download on the Internet.
Separate user manuals are provided for the base unit and the firmware applications:
●
Base unit manual
Contains the description of all instrument modes and functions. It also provides an
introduction to remote control, a complete description of the remote control commands with programming examples, and information on maintenance, instrument
interfaces and error messages. Includes the contents of the getting started manual.
●
Manuals for (optional) firmware applications
Contains the description of the specific functions of a firmware application, including remote control commands. Basic information on operating the R&S FSWP is
not included.
The contents of the user manuals are available as help in the R&S FSWP. The help
offers quick, context-sensitive access to the complete information for the base unit and
the firmware applications.
All user manuals are also available for download or for immediate display on the Internet.
1.2.3 Service Manual
Describes the performance test for checking the rated specifications, module replacement and repair, firmware update, troubleshooting and fault elimination, and contains
mechanical drawings and spare part lists.
The service manual is available for download for registered users on the global
Rohde & Schwarz information system (GLORIS):
https://gloris.rohde-schwarz.com
1.2.4 Instrument Security Procedures
Deals with security issues when working with the R&S FSWP in secure areas. It is
available for download on the Internet.
12User Manual 1177.5656.02 ─ 09

R&S®FSWP-B1
1.2.5 Basic Safety Instructions
1.2.6 Data Sheets and Brochures
1.2.7 Release Notes and Open Source Acknowledgment (OSA)
Preface
Conventions Used in the Documentation
Contains safety instructions, operating conditions and further important information.
The printed document is delivered with the instrument.
The data sheet contains the technical specifications of the R&S FSWP. It also lists the
options and their order numbers, and optional accessories.
The brochure provides an overview of the instrument and deals with the specific characteristics.
See www.rohde-schwarz.com/brochure-datasheet/fswp
The release notes list new features, improvements and known issues of the current
firmware version, and describe the firmware installation.
The open source acknowledgment document provides verbatim license texts of the
used open source software.
See www.rohde-schwarz.com/firmware/fswp
1.2.8 Application Notes, Application Cards, White Papers, etc.
These documents deal with special applications or background information on particular topics.
See www.rohde-schwarz.com/application/fswp
1.3 Conventions Used in the Documentation
1.3.1 Typographical Conventions
The following text markers are used throughout this documentation:
Convention Description
"Graphical user interface elements"
[Keys] Key and knob names are enclosed by square brackets.
All names of graphical user interface elements on the screen, such as
dialog boxes, menus, options, buttons, and softkeys are enclosed by
quotation marks.
13User Manual 1177.5656.02 ─ 09

R&S®FSWP-B1
Preface
Conventions Used in the Documentation
Convention Description
Filenames, commands,
program code
Input Input to be entered by the user is displayed in italics.
Links Links that you can click are displayed in blue font.
"References" References to other parts of the documentation are enclosed by quota-
Filenames, commands, coding samples and screen output are distinguished by their font.
tion marks.
1.3.2 Conventions for Procedure Descriptions
When operating the instrument, several alternative methods may be available to perform the same task. In this case, the procedure using the touchscreen is described.
Any elements that can be activated by touching can also be clicked using an additionally connected mouse. The alternative procedure using the keys on the instrument or
the on-screen keyboard is only described if it deviates from the standard operating procedures.
The term "select" may refer to any of the described methods, i.e. using a finger on the
touchscreen, a mouse pointer in the display, or a key on the instrument or on a keyboard.
1.3.3 Notes on Screenshots
When describing the functions of the product, we use sample screenshots. These
screenshots are meant to illustrate as many as possible of the provided functions and
possible interdependencies between parameters. The shown values may not represent
realistic usage scenarios.
The screenshots usually show a fully equipped product, that is: with all options installed. Thus, some functions shown in the screenshots may not be available in your particular product configuration.
14User Manual 1177.5656.02 ─ 09

R&S®FSWP-B1
2 Welcome to the R&S FSWP-B1
Welcome to the R&S FSWP-B1
Understanding the Display Information
The R&S FSWP-B1 Signal and Spectrum Analyzer is a hardware option that adds the
functionality of a conventional signal and spectrum analyzer to your R&S FSWP.
Depending on the R&S FSWP model you have (8 GHz or 26 GHz), you have to equip
the R&S FSWP with the corresponding spectrum analyzer option: 1322.9997.08 for
8 GHz models or 1322.9997.26 for 26 GHz models.
This user manual contains a description of the functionality of the Spectrum application, including remote control operation. The latest version is available for download at
the product homepage (http://www2.rohde-schwarz.com/product/FSWP.html).
● Starting the Application........................................................................................... 15
● Understanding the Display Information...................................................................15
● R&S MultiView........................................................................................................ 17
2.1 Starting the Application
Access: [MODE] > "Spectrum"
Multiple Measurement Channels and Sequencer Function
When you enter an application, a new measurement channel is created which determines the measurement settings for that application. The same application can be activated with different measurement settings by creating several channels for the same
application.
The number of channels that can be configured at the same time depends on the available memory on the instrument.
Only one measurement can be performed at any time, namely the one in the currently
active channel. However, in order to perform the configured measurements consecutively, a Sequencer function is provided.
If activated, the measurements configured in the currently active channels are performed one after the other in the order of the tabs. The currently active measurement is
indicated by a
are updated in the tabs (as well as the "MultiView") as the measurements are performed. Sequential operation itself is independent of the currently displayed tab.
For details on the Sequencer function see the R&S FSWP User Manual.
symbol in the tab label. The result displays of the individual channels
2.2 Understanding the Display Information
The following figure shows the display as it looks for noise figure measurements. All
different information areas are labeled. They are explained in more detail in the following sections.
15User Manual 1177.5656.02 ─ 09

R&S®FSWP-B1
Welcome to the R&S FSWP-B1
Understanding the Display Information
1 42 3 5 6
Figure 2-1: Screen layout of the noise figure measurement application
1 = Toolbar
2 = Channel bar
3 = Diagram header
4 = Result display
5 = Status bar
6 = Softkey bar
Channel bar information
The channel bar contains information about the current measurement setup, progress
and results.
Figure 2-2: Channel bar of the Spectrum application
Ref Level Reference level of the R&S FSWP.
Att Attenuation of the R&S FSWP.
Input Input and input coupling
SWT Sweep time
PS Preselector state
RBW Resolution bandwidth
VBW Video bandwidth
16User Manual 1177.5656.02 ─ 09

R&S®FSWP-B1
Welcome to the R&S FSWP-B1
R&S MultiView
Mode Currently selected measurement mode, including the sweep count.
Frequency Center frequency
Window title bar information
For each diagram, the header provides the following information:
1 2 3 4
Figure 2-3: Window title bar information for the Noise Figure application
1 = Window number
2 = Window type
3 = Trace color and number
4 = Trace mode and detector
Status bar information
Global instrument settings, the instrument status and any irregularities are indicated in
the status bar beneath the diagram. Furthermore, the progress of the current operation
is displayed in the status bar.
2.3 R&S MultiView
Each application is displayed in a separate tab. An additional tab ("MultiView") provides
an overview of all currently active channels at a glance. In the "MultiView" tab, each
individual window contains its own channel bar with an additional button. Select this
button to switch to the corresponding channel display quickly.
17User Manual 1177.5656.02 ─ 09

R&S®FSWP-B1
Welcome to the R&S FSWP-B1
R&S MultiView
Remote command:
DISPlay:FORMat on page 635
18User Manual 1177.5656.02 ─ 09

R&S®FSWP-B1
3 Measurements and Results
Measurements and Results
Access: "Overview" > "Select Measurement"
Or: [MEAS]
In the Spectrum application, the R&S FSWP provides a variety of different measurement functions.
●
Basic measurements - measure the spectrum of your signal or watch your signal
in time domain
●
Power measurements - calculate the powers involved in modulated carrier signals
●
Emission measurements - detect unwanted signal emission
●
Statistic measurements - evaluate the spectral distribution of the signal
●
Special measurements - provide characteristic values of the signal
The individual functions are described in detail in the following chapters.
The measurement function determines which settings, functions and evaluation methods are available in the R&S FSWP. The various measurement functions are described
in detail here.
When you select a measurement function, the measurement is started with its default
settings immediately and the corresponding measurement configuration menu is displayed. The measurement configuration menu can be displayed at any time by pressing the [MEAS CONFIG] key.
The easiest way to configure measurements is using the configuration "Overview" ,
see Chapter 4.1, "Configuration Overview", on page 219.
In addition to the measurement-specific parameters, the general parameters can be
configured as usual, see Chapter 4, "Common Measurement Settings", on page 219.
Many measurement functions provide special result displays or evaluation methods;
however, in most cases the general evaluation methods are also available, see Chap-
ter 5, "Common Analysis and Display Functions", on page 358.
The remote commands required to retrieve measurement results are described in
Chapter 6.9.2.1, "Getting Trace Data", on page 735.
Measurements on I/Q-based data
The I/Q Analyzer application (not Master) in MSRA mode can also perform measurements on the captured I/Q data in the time and frequency domain.
The measurements are configured using the same settings as described here for the
Spectrum application.
The results, however, may differ slightly as hardware settings are not adapted automatically as for the Spectrum application. Additionally, the analysis interval used for the
measurement is indicated as in all MSRA applications.
For more information see the R&S FSWP MSRA User Manual.
19User Manual 1177.5656.02 ─ 09

R&S®FSWP-B1
3.1 Basic Measurements
Measurements and Results
Basic Measurements
● Basic Measurements...............................................................................................20
● Channel Power and Adjacent-Channel Power (ACLR) Measurement....................41
● Carrier-to-Noise Measurements..............................................................................94
● Occupied Bandwidth Measurement (OBW)............................................................ 97
● Noise Power Ratio (NPR) Measurement.............................................................. 105
● Spectrum Emission Mask (SEM) Measurement................................................... 121
● Spurious Emissions Measurement........................................................................166
● Statistical Measurements (APD, CCDF)............................................................... 179
● Time Domain Power Measurement.......................................................................194
● Harmonic Distortion Measurement........................................................................199
● Third Order Intercept (TOI) Measurement............................................................ 205
● AM Modulation Depth Measurement.....................................................................215
Basic measurements are common sweeps in the time or frequency domain which provide an overview of the basic input signal characteristics.
If no other measurement function is selected, or if all measurement functions are
switched off, the R&S FSWP performs a basic frequency or time sweep.
Use the general measurement settings to configure the measurement, e.g. via the
"Overview" (see Chapter 4, "Common Measurement Settings", on page 219).
3.1.1 Basic Measurement Types
Frequency Sweep ........................................................................................................ 20
Zero Span .................................................................................................................... 21
All Functions Off ...........................................................................................................21
Frequency Sweep
A common frequency sweep of the input signal over a specified span. Can be used for
general purposes to obtain basic measurement results such as peak levels and spectrum traces. The "Frequency" menu is displayed. This is the default measurement if no
other function is selected.
Use the general measurement settings to configure the measurement, e.g. via the
"Overview" (see Chapter 4, "Common Measurement Settings", on page 219).
Remote command:
[SENSe:]FREQuency:STARt on page 697, [SENSe:]FREQuency:STOP
on page 698
INITiate<n>[:IMMediate] on page 473
INITiate<n>:CONTinuous on page 472
20User Manual 1177.5656.02 ─ 09

R&S®FSWP-B1
Measurements and Results
Basic Measurements
Zero Span
A sweep in the time domain at the specified (center) frequency, i.e. the frequency span
is set to zero. The display shows the time on the x-axis and the signal level on the yaxis, as on an oscilloscope. On the time axis, the grid lines correspond to 1/10 of the
current sweep time.
Use the general measurement settings to configure the measurement, e.g. via the
"Overview" (see Chapter 4, "Common Measurement Settings", on page 219).
Most result evaluations can also be used for zero span measurements, although some
functions (e.g. markers) may work slightly differently and some may not be available. If
so, this will be indicated in the function descriptions (see Chapter 5, "Common Analysis
and Display Functions", on page 358).
Remote command:
[SENSe:]FREQuency:SPAN on page 697
INITiate<n>[:IMMediate] on page 473
INITiate<n>:CONTinuous on page 472
All Functions Off
Switches off all measurement functions and returns to a basic frequency sweep.
Selecting "Frequency Sweep" has the same effect.
3.1.2 How to Perform a Basic Sweep Measurement
The following step-by-step instructions demonstrate how to perform basic sweep measurements.
For remote operation, see Chapter 6.3.17, "Programming Example: Performing a Basic
Frequency Sweep", on page 629.
To perform one or more single sweeps
1. Configure the frequency and span to be measured ( "Frequency" dialog box, see
Chapter 4.3, "Frequency and Span Configuration", on page 295).
2. Configure the number of sweeps to be performed in a single measurement
( "Sweep Config" dialog box, see " Sweep/Average Count " on page 321).
3. If necessary, configure how the signal is processed internally ( "Bandwidth" dialog
box, see " Sweep Type " on page 322).
4. If necessary, configure a trigger for the measurement ( "Trigger/ Gate Config" dialog box, see Chapter 4.6, "Trigger and Gate Configuration", on page 327).
5. Define how the results are evaluated for display ( "Trace" dialog box, see Chap-
ter 5.3.2, "Configuring Standard Traces", on page 387).
6. If necessary, configure the vertical axis of the display ( "Amplitude" dialog box, see
Chapter 4.4.3, "Scaling the Y-Axis", on page 309).
7. To start the measurement, select one of the following:
21User Manual 1177.5656.02 ─ 09

R&S®FSWP-B1
Measurements and Results
Basic Measurements
● [RUN SINGLE] key
● "Single Sweep" softkey in the "Sweep" menu
The defined number of sweeps are performed, then the measurement is stopped.
While the measurement is running, the [RUN SINGLE] key is highlighted. To abort
the measurement, press the [RUN SINGLE] key again. The key is no longer highlighted. The results are not deleted until a new measurement is started.
8. To repeat the same number of sweeps without deleting the last trace, select the
"Continue Single Sweep" softkey in the "Sweep" menu.
To start continuous sweeping
1. If you want to average the trace or search for a maximum over more (or less) than
10 sweeps, configure the "Sweep/Average Count" ( "Sweep Config" dialog box,
see " Sweep/Average Count " on page 321).
2. To start the measurement, select one of the following:
● [RUN CONT] key
● "Continuous Sweep" softkey in the "Sweep" menu
After each sweep is completed, a new one is started automatically. While the mea-
surement is running, the [RUN CONT] key is highlighted. To stop the measurement, press the [RUN CONT] key again. The key is no longer highlighted. The
results are not deleted until a new measurement is started.
3.1.3 Measurement Examples - Measuring a Sinusoidal Signal
One of the most common measurement tasks that can be handled using a signal analyzer is determining the level and frequency of a signal. When measuring an unknown
signal, you can usually start with the presettings.
High input values
If levels higher than +30 dBm (=1 W) are expected or are possible, a power attenuator
must be inserted before the RF input of the analyzer. Otherwise, signal levels exceeding 30 dBm can damage the RF attenuator or the input mixer. The total power of all
occurring signals must be taken into account.
Test setup
●
Connect the RF output of the signal generator to the RF input of the R&S FSWP.
22User Manual 1177.5656.02 ─ 09

R&S®FSWP-B1
3.1.3.1 Measuring the Level and Frequency Using Markers
Measurements and Results
Basic Measurements
Table 3-1: Signal generator settings (e.g. R&S SMW)
Frequency 128 MHz
Level -30 dBm
● Measuring the Level and Frequency Using Markers...............................................23
● Measuring the Signal Frequency Using the Signal Counter................................... 24
The level and frequency of a sinusoidal signal can be measured easily using the
marker function. The R&S FSWP always displays its amplitude and frequency at the
marker position. The frequency measurement uncertainty is determined by the reference frequency of the R&S FSWP, the resolution of the marker frequency display and
the number of sweep points.
1. Select [PRESET] to reset the instrument.
2. Enter the Spectrum application via the [MODE] key.
3. Connect the signal to be measured to the "RF INPUT" connector on the
R&S FSWP.
4. Set the center frequency to 128
MHz.
5. Reduce the frequency span to 1 MHz.
Note: Coupled settings. When the frequency span is defined, the resolution band-
width, the video bandwidth and the sweep time are automatically adjusted,
because these functions are defined as coupled functions in the presettings.
6. Select [MKR] to activate marker 1 and automatically set it to the maximum of the
trace.
The level and frequency values measured by the marker are displayed in the
marker information at the top of the display.
Note: Performing a peak search. When a marker is initially activated, it automatically performs the peak search function (as shown in the example).
If a marker was already active, select the [Peak Search] key or the "Peak" softkey
in the [MKR >] menu in order to set the currently active marker to the maximum of
the displayed signal.
Increasing the Frequency Resolution
The frequency resolution of the marker is determined by the resolution of the trace. A
trace consists of 1001 trace points, i.e. if the frequency span is 1 MHz, each trace point
represents a span of approximately 1 kHz. This corresponds to a maximum uncertainty
of +/- 0.5 kHz.
You can increase the resolution of the trace by reducing the frequency span.
23User Manual 1177.5656.02 ─ 09

R&S®FSWP-B1
Measurements and Results
Basic Measurements
Reducing the frequency span to 10 kHz
► Reduce the frequency span to 10 kHz.
The resolution of the trace is now approximately 10 Hz (10 kHz span / 1001 trace
points), thus, the precision of the marker frequency display increases to approximately ±5 Hz.
Setting the Reference Level
The reference level is the level at the upper limit of the diagram. To achieve the widest
dynamic range possible for a spectrum measurement, use the entire level span of the
R&S FSWP. In other words, the highest level that occurs in the signal should be located at the top edge of the diagram ( = reference level) or immediately below it.
Low Reference Levels
If the selected reference level is lower than the highest signal that occurs in the spectrum, the signal path in the R&S FSWP is overloaded.
In this case, the message "IFOVL" is displayed in the error message field.
In the presettings, the value of the reference level is 0 dBm. If the input signal is
-30 dBm, the reference level can be reduced by 30 dB without causing the signal path
to be overloaded.
Reducing the reference level by 30 dB
► Set the reference level to -30
The maximum of the trace is near the maximum of the measurement diagram. The
increase in the displayed noise is not substantial. Thus, the distance between the
signal maximum and the noise display (=dynamic range) has increased.
Setting the reference level with the help of a marker
You can also use a marker to shift the maximum value of the trace directly to the top
edge of the diagram. If the marker is located at the maximum level of the trace (as in
this example), the reference level can be moved to the marker level as follows:
1. Press the [MKR ->] key.
2. Select "Ref Lvl = Mkr Lvl" .
The reference level is set to the current marker level.
3.1.3.2 Measuring the Signal Frequency Using the Signal Counter
dBm.
The built-in signal counter allows you to measure the frequency more accurately than
measuring it with the marker. The frequency sweep is stopped at the marker, and the
R&S FSWP measures the frequency of the signal at the marker position (see also
Chapter 5.4.4.1, "Precise Frequency (Signal Count) Marker", on page 427).
In the following example, the frequency of the generator at 128 MHz is shown using
the marker.
24User Manual 1177.5656.02 ─ 09

R&S®FSWP-B1
Measurements and Results
Basic Measurements
Prerequisite
Precise frequency measurements require a precise reference frequency. Therefore, an
external reference frequency from the signal generator is used. Connect the signal
generator's "Ref OUT" connector to the analyzer's "Ref IN" connector.
1. Select [PRESET] to reset the instrument.
2. Enter the Spectrum application via the [MODE] key.
3. Set the center frequency to 128 MHz.
4. Set the frequency span to 1 MHz.
5. Select "Setup" > "Reference" > "External Reference 10 MHz" to activate the external reference frequency.
6. Select [MKR] to activate marker 1 and automatically set it to the maximum of the
trace.
The level and the frequency of the marker are displayed in the marker results in the
diagram or the marker table.
7. Select [MKR FUNC] > "Signal Count" to activate the signal counter.
The result of the signal counter is displayed in the marker results.
8. If necessary, increase the resolution of the signal counter by selecting "Signal
Count Resolution" (in the "Signal Count" menu).
Prerequisites for using the internal signal counter
In order to obtain a correct result when measuring the frequency with the internal signal counter, an RF sinusoidal signal or a spectral line must be available. The marker
must be located more than 25 dB above the noise level to ensure that the specified
measurement accuracy is adhered to.
3.1.4 Measurement Example – Measuring Levels at Low S/N Ratios
The minimum signal level a signal analyzer can measure is limited by its intrinsic noise.
Small signals can be swamped by noise and therefore cannot be measured. For signals that are just above the intrinsic noise, the accuracy of the level measurement is
influenced by the intrinsic noise of the R&S FSWP.
The displayed noise level of a signal analyzer depends on its noise figure, the selected
RF attenuation, the selected reference level, the selected resolution and video bandwidth and the detector.
For details see:
●
Chapter 4.4.1.2, "RF Attenuation", on page 304
●
Chapter 4.4.1.1, "Reference Level", on page 303
●
Chapter 4.5.1.1, "Separating Signals by Selecting an Appropriate Resolution Bandwidth", on page 312
25User Manual 1177.5656.02 ─ 09

R&S®FSWP-B1
Measurements and Results
Basic Measurements
●
Chapter 4.5.1.2, "Smoothing the Trace Using the Video Bandwidth", on page 312
●
Chapter 5.3.1.1, "Mapping Samples to measurement Points with the Trace Detector", on page 370
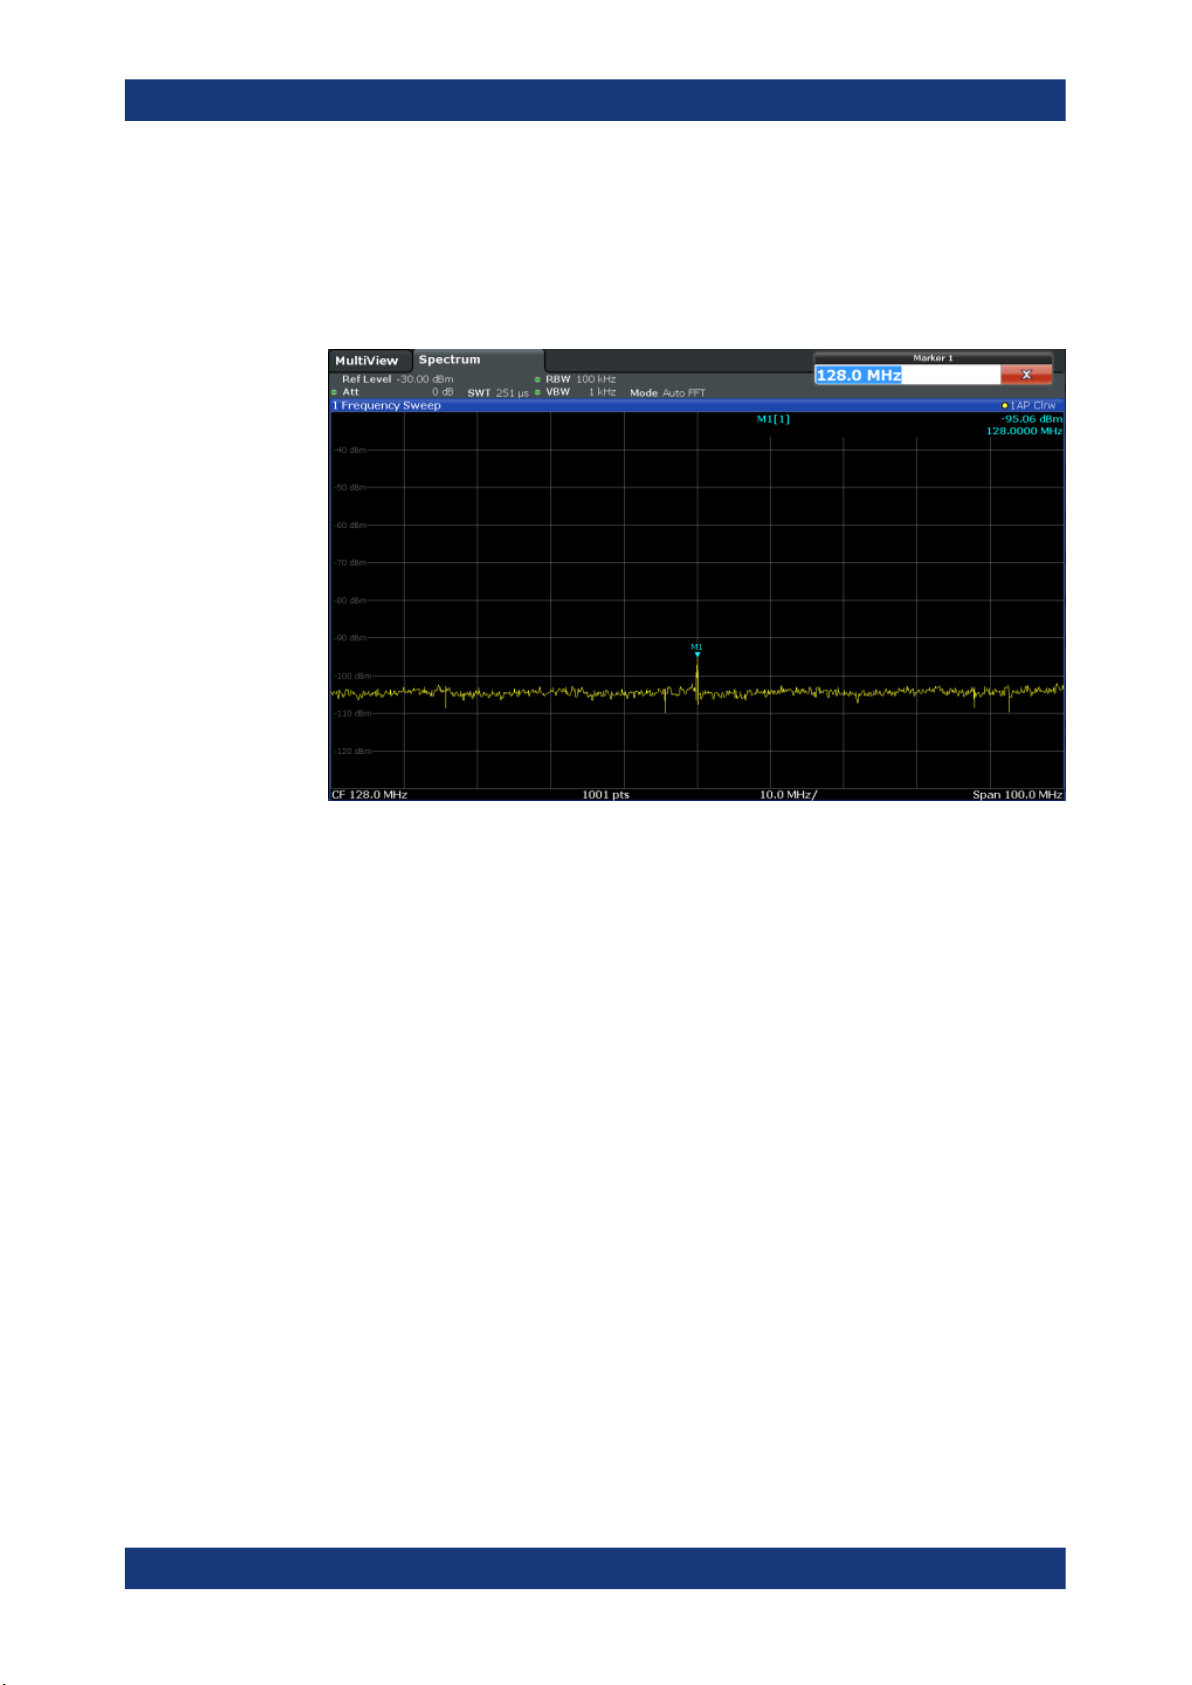
This measurement example shows the different factors influencing the S/N ratio.
Table 3-2: Signal generator settings (e.g. R&S SMW)
Frequency 128 MHz
Level -95 dBm
1. Preset the R&S FSWP.
2. Enter the Spectrum application via the [MODE] key.
3. Set the center frequency to 128 MHz.
4. Set the span to 100 MHz.
5. Set the reference level to-30 dBm.
The signal is measured with the auto peak detector and is completely hidden in the
intrinsic noise of the R&S FSWP.
Figure 3-1: Sine wave signal with low S/N ratio
6. To suppress noise spikes, average the trace. In the "Traces" configuration dialog,
set the "Trace Mode" to "Average" (see " Trace Mode " on page 388).
The traces of consecutive sweeps are averaged. To perform averaging, the
R&S FSWP automatically switches on the sample detector. The RF signal, therefore, can be more clearly distinguished from noise.
26User Manual 1177.5656.02 ─ 09

R&S®FSWP-B1
Measurements and Results
Basic Measurements
Figure 3-2: RF sine wave signal with low S/N ratio with an averaged trace
7. Instead of trace averaging, you can select a video filter that is narrower than the
resolution bandwidth. Set the trace mode back to "Clear/ Write" , then set the VBW
to 10 kHz manually in the "Bandwidth" configuration dialog.
The RF signal can be distinguished from noise more clearly.
Figure 3-3: RF sine wave signal with low S/N ratio with a smaller video bandwidth
8. By reducing the resolution bandwidth by a factor of 10, the noise is reduced by
10 dB. Set the RBW to 100 kHz.
27User Manual 1177.5656.02 ─ 09
R&S®FSWP-B1
Measurements and Results
Basic Measurements
The displayed noise is reduced by approximately 10 dB. The signal, therefore,
emerges from noise by about 10 dB. Compared to the previous setting, the video
bandwidth has remained the same, i.e. it has increased relative to the smaller resolution bandwidth. The averaging effect of the video bandwidth is therefore reduced.
The trace will be noisier.
Figure 3-4: Reference signal at a smaller resolution bandwidth
3.1.5 Measurement Examples - Measuring Signal Spectra with Multiple Signals
● Separating Signals by Selecting the Resolution Bandwidth................................... 28
● Measuring the Modulation Depth of an AM-Modulated Carrier in the Frequency
Domain....................................................................................................................32
● Measuring AM-Modulated Signals.......................................................................... 33
3.1.5.1 Separating Signals by Selecting the Resolution Bandwidth
A basic feature of a Signal and Spectrum Analyzer is the ability to separate the spectral components of a mixture of signals. The resolution at which the individual components can be separated is determined by the resolution bandwidth. Selecting a resolution bandwidth that is too large may make it impossible to distinguish between spectral
components, i.e. they are displayed as a single component (see also Chapter 4.5.1.1,
"Separating Signals by Selecting an Appropriate Resolution Bandwidth",
on page 312).
Two signals with the same amplitude can be resolved if the resolution bandwidth is
smaller than or equal to the frequency spacing of the signal. If the resolution bandwidth
is equal to the frequency spacing, the spectrum display shows a level drop of 3 dB pre-
28User Manual 1177.5656.02 ─ 09

R&S®FSWP-B1
Measurements and Results
Basic Measurements
cisely in the center of the two signals. Decreasing the resolution bandwidth makes the
level drop larger, which thus makes the individual signals clearer.
In this measurement example we will analyze two signals with a level of -30 dBm each
and a frequency spacing of 30 kHz.
Signal
Generator 1
Coupler
[-6 dB]
R&S
FSWP
Signal
Generator 2
Figure 3-5: Test setup
Table 3-3: Signal generator settings (e.g. R&S SMW)
Signal generator 1 -30 dBm 128,00 MHz
Signal generator 2 -30 dBm 128,03 MHz
Level Frequency
1. Select [PRESET] to reset the instrument.
2. Enter the Spectrum application via the [MODE] key.
3. Set the center frequency to 128.015 MHz.
4. Set the frequency span to 300 kHz.
5. Set the resolution bandwidth to 30 kHz and the video bandwidth to 1 kHz.
Note: Larger video bandwidths. The video bandwidth is set to 1 kHz in order to
make the level drop in the center of the two signals clearly visible. At larger video
bandwidths, the video voltage that results from envelope detection is not sufficiently suppressed. This produces additional voltages, which are visible in the
trace, in the transition area between the two signals.
29User Manual 1177.5656.02 ─ 09

R&S®FSWP-B1
Measurements and Results
Basic Measurements
Figure 3-6: Measurement of two equally-leveled RF sinusoidal signals with the resolution band-
width which corresponds to the frequency spacing of the signals
Matching generator and R&S FSWP frequencies
The level drop is located exactly in the center of the display only if the generator
frequencies match the frequency display of the R&S FSWP exactly. To achieve
exact matching, the frequencies of the generators and the R&S FSWP must be
synchronized.
6. Set the resolution bandwidth to 100
kHz.
It is no longer possible to clearly distinguish the two generator signals.
30User Manual 1177.5656.02 ─ 09
 Loading...