

R&S®FSW-K60
Transient Analysis
User Manual
(;ÙÎÜ2)
1175647802
Version 22

This manual applies to the following R&S®FSW models with firmware version 5.00 and later:
●
R&S®FSW8 (1331.5003K08 / 1312.8000K08)
●
R&S®FSW13 (1331.5003K13 / 1312.8000K13)
●
R&S®FSW26 (1331.5003K26 / 1312.8000K26)
●
R&S®FSW43 (1331.5003K43 / 1312.8000K43)
●
R&S®FSW50 (1331.5003K50 / 1312.8000K50)
●
R&S®FSW67 (1331.5003K67 / 1312.8000K67)
●
R&S®FSW85 (1331.5003K85 / 1312.8000K85)
This manual applies to the following R&S®FSW models with firmware version 3.20 and higher:
●
R&S®FSW8 (1312.8000K08)
●
R&S®FSW13 (1312.8000K13)
●
R&S®FSW26 (1312.8000K26)
●
R&S®FSW43 (1312.8000K43)
●
R&S®FSW50 (1312.8000K50)
●
R&S®FSW67 (1312.8000K67)
●
R&S®FSW85 (1312.8000K85)
The following firmware options are described:
●
R&S FSW-K60 Transient Analysis (1313.7495.02)
●
R&S FSW-K60H Transient Hop Measurements (1322.9916.02)
●
R&S FSW-K60C Transient Chirp Measurements (1322.9745.02)
© 2021 Rohde & Schwarz GmbH & Co. KG
Mühldorfstr. 15, 81671 München, Germany
Phone: +49 89 41 29 - 0
Email: info@rohde-schwarz.com
Internet: www.rohde-schwarz.com
Subject to change – data without tolerance limits is not binding.
R&S® is a registered trademark of Rohde & Schwarz GmbH & Co. KG.
Trade names are trademarks of the owners.
1175.6478.02 | Version 22 | R&S®FSW-K60
Throughout this manual, products from Rohde & Schwarz are indicated without the ® symbol, e.g. R&S®FSW is indicated as
R&S FSW.

R&S®FSW-K60
1 Preface.................................................................................................. 11
1.1 Documentation overview............................................................................................11
1.1.1 Getting started manual.................................................................................................. 11
1.1.2 User manuals and help..................................................................................................11
1.1.3 Service manual............................................................................................................. 12
1.1.4 Instrument security procedures.....................................................................................12
1.1.5 Printed safety instructions............................................................................................. 12
1.1.6 Data sheets and brochures........................................................................................... 12
1.1.7 Release notes and open-source acknowledgment (OSA)............................................ 12
1.1.8 Application notes, application cards, white papers, etc.................................................12
1.2 About this manual.......................................................................................................13
Contents
Contents
1.3 Conventions used in the documentation..................................................................14
1.3.1 Typographical conventions............................................................................................14
1.3.2 Conventions for procedure descriptions........................................................................14
1.3.3 Notes on screenshots................................................................................................... 14
2 Welcome to the transient analysis application................................. 15
2.1 Starting the transient analysis application...............................................................15
2.2 Understanding the display information.................................................................... 16
3 About transient analysis..................................................................... 19
4 Measurement basics............................................................................20
4.1 Data acquisition.......................................................................................................... 20
4.2 Basics on input from I/Q data files............................................................................ 20
4.3 Signal processing....................................................................................................... 22
4.4 Signal models..............................................................................................................24
4.4.1 Frequency hopping....................................................................................................... 24
4.4.2 Frequency chirping........................................................................................................26
4.4.3 Automatic vs. manual hop/chirp state detection............................................................27
4.5 Basis of evaluation..................................................................................................... 27
4.6 Analysis region........................................................................................................... 28
4.7 Zooming and shifting results.....................................................................................31
3User Manual 1175.6478.02 ─ 22

R&S®FSW-K60
4.8 Measurement range.................................................................................................... 32
4.9 Trace evaluation..........................................................................................................34
4.9.1 Mapping samples to measurement points with the trace detector................................ 34
4.9.2 Analyzing several traces - trace mode.......................................................................... 36
4.9.3 Trace statistics.............................................................................................................. 37
4.10 Working with spectrograms.......................................................................................38
4.10.1 Time frames.................................................................................................................. 40
4.10.2 Markers in the spectrogram.......................................................................................... 41
4.10.3 Color maps....................................................................................................................41
4.11 Transient analysis in MSRA/MSRT mode................................................................. 45
5 Measurement results........................................................................... 48
5.1 Hop parameters...........................................................................................................49
Contents
5.2 Chirp parameters........................................................................................................ 59
5.3 Evaluation methods for transient analysis...............................................................70
6 Configuration........................................................................................82
6.1 Configuration overview.............................................................................................. 82
6.2 Signal description....................................................................................................... 84
6.2.1 Signal model................................................................................................................. 84
6.2.2 Signal states..................................................................................................................85
6.2.3 Timing............................................................................................................................89
6.3 Input and frontend settings........................................................................................90
6.3.1 Input source settings..................................................................................................... 90
6.3.1.1 Radio frequency input................................................................................................... 90
6.3.1.2 Settings for input from I/Q data files..............................................................................93
6.3.2 Output settings.............................................................................................................. 94
6.3.3 Digital I/Q 40G output settings...................................................................................... 98
6.3.4 Frequency settings......................................................................................................100
6.3.5 Amplitude settings.......................................................................................................101
6.4 Trigger settings......................................................................................................... 105
6.5 Data acquisition and analysis region...................................................................... 110
6.6 Bandwidth settings................................................................................................... 114
6.7 Hop / chirp measurement settings.......................................................................... 116
6.7.1 General hop/chirp measurement settings....................................................................116
4User Manual 1175.6478.02 ─ 22

R&S®FSW-K60
6.7.2 Specific measurement settings....................................................................................118
6.8 FM video bandwidth..................................................................................................120
6.9 Sweep settings.......................................................................................................... 121
6.10 Adjusting settings automatically.............................................................................123
7 Analysis.............................................................................................. 125
7.1 Display configuration............................................................................................... 125
7.2 Result configuration................................................................................................. 125
7.2.1 Result range................................................................................................................126
7.2.2 Table configuration......................................................................................................127
7.2.3 Parameter configuration for result displays.................................................................128
7.2.3.1 Parameter distribution configuration........................................................................... 128
7.2.3.2 Parameter trend configuration.....................................................................................130
Contents
7.2.4 Y-Axis scaling..............................................................................................................131
7.2.5 Units............................................................................................................................ 133
7.3 Evaluation basis........................................................................................................134
7.4 Trace settings............................................................................................................134
7.5 Trace / data export configuration............................................................................ 138
7.6 Spectrogram settings............................................................................................... 139
7.6.1 General spectrogram settings..................................................................................... 140
7.6.2 Color map settings...................................................................................................... 144
7.7 Export functions........................................................................................................146
7.8 Marker settings..........................................................................................................149
7.8.1 Individual marker setup............................................................................................... 149
7.8.2 General marker settings..............................................................................................152
7.8.3 Marker search settings and positioning functions....................................................... 154
7.8.3.1 Marker search settings................................................................................................154
7.8.3.2 Positioning functions................................................................................................... 157
7.9 Zoom functions......................................................................................................... 157
7.10 Analysis in MSRA/MSRT mode................................................................................160
8 How to perform transient analysis................................................... 162
8.1 How to configure the color mapping.......................................................................166
8.2 How to export table data.......................................................................................... 169
5User Manual 1175.6478.02 ─ 22

R&S®FSW-K60
9 Measurement examples.....................................................................171
9.1 Example: hopped FM signal.....................................................................................171
9.2 Example: chirped FM signal.....................................................................................175
10 Optimizing and troubleshooting.......................................................182
11 Remote commands to perform transient analysis..........................183
11.1 Introduction............................................................................................................... 184
11.1.1 Conventions used in descriptions............................................................................... 184
11.1.2 Long and short form.................................................................................................... 185
11.1.3 Numeric suffixes..........................................................................................................185
11.1.4 Optional keywords.......................................................................................................185
11.1.5 Alternative keywords................................................................................................... 186
11.1.6 SCPI parameters.........................................................................................................186
Contents
11.1.6.1 Numeric values........................................................................................................... 186
11.1.6.2 Boolean....................................................................................................................... 187
11.1.6.3 Character data............................................................................................................ 188
11.1.6.4 Character strings.........................................................................................................188
11.1.6.5 Block data................................................................................................................... 188
11.2 Common suffixes......................................................................................................188
11.3 Activating transient analysis................................................................................... 189
11.4 Configuring transient analysis................................................................................ 193
11.4.1 Input/output settings....................................................................................................193
11.4.1.1 RF input.......................................................................................................................193
11.4.1.2 Using external mixers..................................................................................................198
Basic settings.............................................................................................................. 198
Mixer settings.............................................................................................................. 199
Conversion loss table settings.................................................................................... 205
Programming example: working with an external mixer..............................................209
11.4.1.3 Input from I/Q data files............................................................................................... 211
11.4.1.4 Configuring the 2 GHz/ 5 GHz bandwidth extension (R&S FSW-B2000/B5000)........214
11.4.1.5 Configuring the outputs............................................................................................... 219
11.4.1.6 Digital I/Q 40G streaming output commands.............................................................. 221
11.4.2 Frequency................................................................................................................... 222
11.4.3 Amplitude settings.......................................................................................................223
6User Manual 1175.6478.02 ─ 22

R&S®FSW-K60
11.4.4 Triggering.................................................................................................................... 228
11.4.4.1 Configuring the triggering conditions...........................................................................228
11.4.4.2 Configuring the trigger output......................................................................................233
11.4.5 Data acquisition...........................................................................................................235
11.4.6 Bandwidth settings...................................................................................................... 238
11.4.7 Selecting the signal model.......................................................................................... 238
11.4.8 Configuring signal detection........................................................................................239
11.4.8.1 Chirp states................................................................................................................. 239
11.4.8.2 Hop states................................................................................................................... 242
11.4.9 Configuring the measurement range...........................................................................247
11.4.10 Configuring demodulation........................................................................................... 263
11.4.11 Selecting the analysis region...................................................................................... 264
11.4.12 Adjusting settings automatically.................................................................................. 267
Contents
11.5 Capturing data and performing sweeps................................................................. 267
11.6 Analyzing transient effects...................................................................................... 273
11.6.1 Configuring the result display......................................................................................273
11.6.1.1 General window commands........................................................................................273
11.6.1.2 Working with windows in the display...........................................................................275
11.6.2 Defining the evaluation basis...................................................................................... 282
11.6.3 Configuring the result range........................................................................................282
11.6.4 Selecting the hop/chirp................................................................................................285
11.6.5 Table configuration...................................................................................................... 286
11.6.5.1 Chirp results................................................................................................................ 286
11.6.5.2 Hop results.................................................................................................................. 296
11.6.6 Configuring parameter distribution displays................................................................ 306
11.6.7 Configuring parameter trends..................................................................................... 317
11.6.7.1 General commands.....................................................................................................317
11.6.7.2 Chirp parameter trends............................................................................................... 318
11.6.7.3 Hop parameter trends................................................................................................. 337
11.6.8 Configuring the Y-Axis scaling and units.....................................................................355
11.6.9 Configuring traces....................................................................................................... 358
11.6.10 Configuring spectrograms........................................................................................... 363
11.6.11 Configuring color maps............................................................................................... 367
7User Manual 1175.6478.02 ─ 22

R&S®FSW-K60
11.6.12 Working with markers remotely...................................................................................369
11.6.12.1 Setting up individual markers...................................................................................... 370
11.6.12.2 General marker settings..............................................................................................376
11.6.12.3 Configuring and performing a marker search..............................................................377
11.6.12.4 Positioning the marker................................................................................................ 378
Positioning normal markers.........................................................................................378
Positioning delta markers............................................................................................380
11.6.12.5 Marker search (spectrograms).................................................................................... 382
Using markers............................................................................................................. 382
Using delta markers.................................................................................................... 387
11.6.13 Zooming into the display............................................................................................. 391
11.6.13.1 Using the single zoom.................................................................................................391
11.6.13.2 Using the multiple zoom..............................................................................................393
Contents
11.7 Configuring an analysis interval and line (MSRA mode only)..............................395
11.8 Configuring an analysis interval and line (MSRT mode only).............................. 397
11.9 Retrieving results......................................................................................................399
11.9.1 Retrieving information on detected hops.....................................................................399
11.9.2 Retrieving information on detected chirps...................................................................427
11.9.3 Retrieving trace data................................................................................................... 457
11.9.4 Exporting trace and table results.................................................................................460
11.9.5 Retrieving captured I/Q data....................................................................................... 464
11.9.6 Exporting I/Q results to an iq-tar file............................................................................466
11.10 Status reporting system...........................................................................................467
11.11 Programming examples........................................................................................... 467
11.11.1 Programming example: performing a basic transient analysis measurement.............468
11.11.2 Programming example: performing a chirp detection measurement.......................... 469
11.11.3 Programming example: performing a hop detection measurement............................ 471
11.11.4 Programming example: analyzing parameter distribution...........................................473
11.11.5 Programming example: analyzing parameter trends.................................................. 474
Annex.................................................................................................. 475
A Reference............................................................................................475
8User Manual 1175.6478.02 ─ 22

R&S®FSW-K60
A.1 Reference: ASCII file export format.........................................................................475
Contents
List of Commands (Transient Analysis)...........................................477
Index....................................................................................................493
9User Manual 1175.6478.02 ─ 22

R&S®FSW-K60
Contents
10User Manual 1175.6478.02 ─ 22

R&S®FSW-K60
1 Preface
1.1 Documentation overview
1.1.1 Getting started manual
Preface
Documentation overview
This chapter provides safety-related information, an overview of the user documentation and the conventions used in the documentation.
This section provides an overview of the R&S FSW user documentation. Unless specified otherwise, you find the documents on the R&S FSW product page at:
www.rohde-schwarz.com/manual/FSW
Introduces the R&S FSW and describes how to set up and start working with the product. Includes basic operations, typical measurement examples, and general information, e.g. safety instructions, etc.
A printed version is delivered with the instrument. A PDF version is available for download on the Internet.
1.1.2 User manuals and help
Separate user manuals are provided for the base unit and the firmware applications:
●
Base unit manual
Contains the description of all instrument modes and functions. It also provides an
introduction to remote control, a complete description of the remote control commands with programming examples, and information on maintenance, instrument
interfaces and error messages. Includes the contents of the getting started manual.
●
Firmware application manual
Contains the description of the specific functions of a firmware application, including remote control commands. Basic information on operating the R&S FSW is not
included.
The contents of the user manuals are available as help in the R&S FSW. The help
offers quick, context-sensitive access to the complete information for the base unit and
the firmware applications.
All user manuals are also available for download or for immediate display on the Internet.
11User Manual 1175.6478.02 ─ 22

R&S®FSW-K60
1.1.3 Service manual
1.1.4 Instrument security procedures
1.1.5 Printed safety instructions
Preface
Documentation overview
Describes the performance test for checking the rated specifications, module replacement and repair, firmware update, troubleshooting and fault elimination, and contains
mechanical drawings and spare part lists.
The service manual is available for registered users on the global Rohde & Schwarz
information system (GLORIS):
https://gloris.rohde-schwarz.com
Deals with security issues when working with the R&S FSW in secure areas. It is available for download on the Internet.
Provides safety information in many languages. The printed document is delivered with
the product.
1.1.6 Data sheets and brochures
The data sheet contains the technical specifications of the R&S FSW. It also lists the
firmware applications and their order numbers, and optional accessories.
The brochure provides an overview of the instrument and deals with the specific characteristics.
See www.rohde-schwarz.com/brochure-datasheet/FSW
1.1.7 Release notes and open-source acknowledgment (OSA)
The release notes list new features, improvements and known issues of the current
firmware version, and describe the firmware installation.
The open-source acknowledgment document provides verbatim license texts of the
used open source software.
See www.rohde-schwarz.com/firmware/FSW
1.1.8 Application notes, application cards, white papers, etc.
These documents deal with special applications or background information on particular topics.
See www.rohde-schwarz.com/application/FSW
12User Manual 1175.6478.02 ─ 22

R&S®FSW-K60
1.2 About this manual
Preface
About this manual
This Transient Analysis User Manual provides all the information specific to the appli-
cation. All general instrument functions and settings common to all applications and
operating modes are described in the main R&S FSW User Manual.
The main focus in this manual is on the measurement results and the tasks required to
obtain them. The following topics are included:
●
Welcome to the Transient Analysis Application
Introduction to and getting familiar with the application
●
Measurements and Result Displays
Details on supported measurements and their result types
●
Measurement Basics
Background information on basic terms and principles in the context of the measurement
●
Configuration + Analysis
A concise description of all functions and settings available to configure measurements and analyze results with their corresponding remote control command
●
How to Perform Measurements in the Transient Analysis Application
The basic procedure to perform each measurement and step-by-step instructions
for more complex tasks or alternative methods
●
Measurement Examples
Detailed measurement examples to guide you through typical measurement scenarios and allow you to try out the application immediately
●
Optimizing and Troubleshooting the Measurement
Hints and tips on how to handle errors and optimize the test setup
●
Remote Commands for Transient Analysis
Remote commands required to configure and perform Transient Analysis in a
remote environment, sorted by tasks
(Commands required to set up the environment or to perform common tasks on the
instrument are provided in the main R&S FSW User Manual)
Programming examples demonstrate the use of many commands and can usually
be executed directly for test purposes
●
Reference
File format description
●
List of remote commands
Alphabetical list of all remote commands described in the manual
●
Index
13User Manual 1175.6478.02 ─ 22

R&S®FSW-K60
1.3 Conventions used in the documentation
1.3.1 Typographical conventions
Preface
Conventions used in the documentation
The following text markers are used throughout this documentation:
Convention Description
"Graphical user interface elements"
[Keys] Key and knob names are enclosed by square brackets.
Filenames, commands,
program code
Input Input to be entered by the user is displayed in italics.
Links Links that you can click are displayed in blue font.
"References" References to other parts of the documentation are enclosed by quota-
All names of graphical user interface elements on the screen, such as
dialog boxes, menus, options, buttons, and softkeys are enclosed by
quotation marks.
Filenames, commands, coding samples and screen output are distinguished by their font.
tion marks.
1.3.2 Conventions for procedure descriptions
When operating the instrument, several alternative methods may be available to perform the same task. In this case, the procedure using the touchscreen is described.
Any elements that can be activated by touching can also be clicked using an additionally connected mouse. The alternative procedure using the keys on the instrument or
the on-screen keyboard is only described if it deviates from the standard operating procedures.
The term "select" may refer to any of the described methods, i.e. using a finger on the
touchscreen, a mouse pointer in the display, or a key on the instrument or on a keyboard.
1.3.3 Notes on screenshots
When describing the functions of the product, we use sample screenshots. These
screenshots are meant to illustrate as many as possible of the provided functions and
possible interdependencies between parameters. The shown values may not represent
realistic usage scenarios.
The screenshots usually show a fully equipped product, that is: with all options installed. Thus, some functions shown in the screenshots may not be available in your particular product configuration.
14User Manual 1175.6478.02 ─ 22

R&S®FSW-K60
2 Welcome to the transient analysis applica-
Welcome to the transient analysis application
Starting the transient analysis application
tion
The R&S FSW-K60 is a firmware application that adds functionality to detect transient
signal effects to the R&S FSW.
The R&S FSW Transient Analysis application features:
●
Analysis of transient effects
●
Quick analysis even before measurement end due to online transfer of captured
and measured I/Q data
●
Easy analysis of user-defined regions within the captured data
●
Analysis of frequency hopping or chirped FM signals (with additional Transient
Analysis options)
This user manual contains a description of the functionality that the application provides, including remote control operation.
Functions that are not discussed in this manual are the same as in the Spectrum application and are described in the R&S FSW User Manual. The latest version is available
for download at the product homepage.
An application note discussing RF signal analysis and interference tests using the R&S
FSW Transient Analysis application is available from the Rohde & Schwarz website:
1MA267: Automotive Radar Sensors - RF Signal Analysis and Inference Tests
Installation
You can find detailed installation instructions in the R&S FSW Getting Started manual
or in the Release Notes.
2.1 Starting the transient analysis application
The Transient Analysis application adds a new application to the R&S FSW.
To activate the Transient Analysis application
1. Press the [MODE] key on the front panel of the R&S FSW.
A dialog box opens that contains all operating modes and applications currently
available on your R&S FSW.
2. Select the "Transient Analysis" item.
The R&S FSW opens a new measurement channel for the Transient Analysis
application.
15User Manual 1175.6478.02 ─ 22
R&S®FSW-K60
2.2 Understanding the display information
Welcome to the transient analysis application
Understanding the display information
The measurement is started immediately with the default settings. It can be configured
in the Transient "Overview" dialog box, which is displayed when you select the "Overview" softkey from any menu (see Chapter 6.1, "Configuration overview",
on page 82).
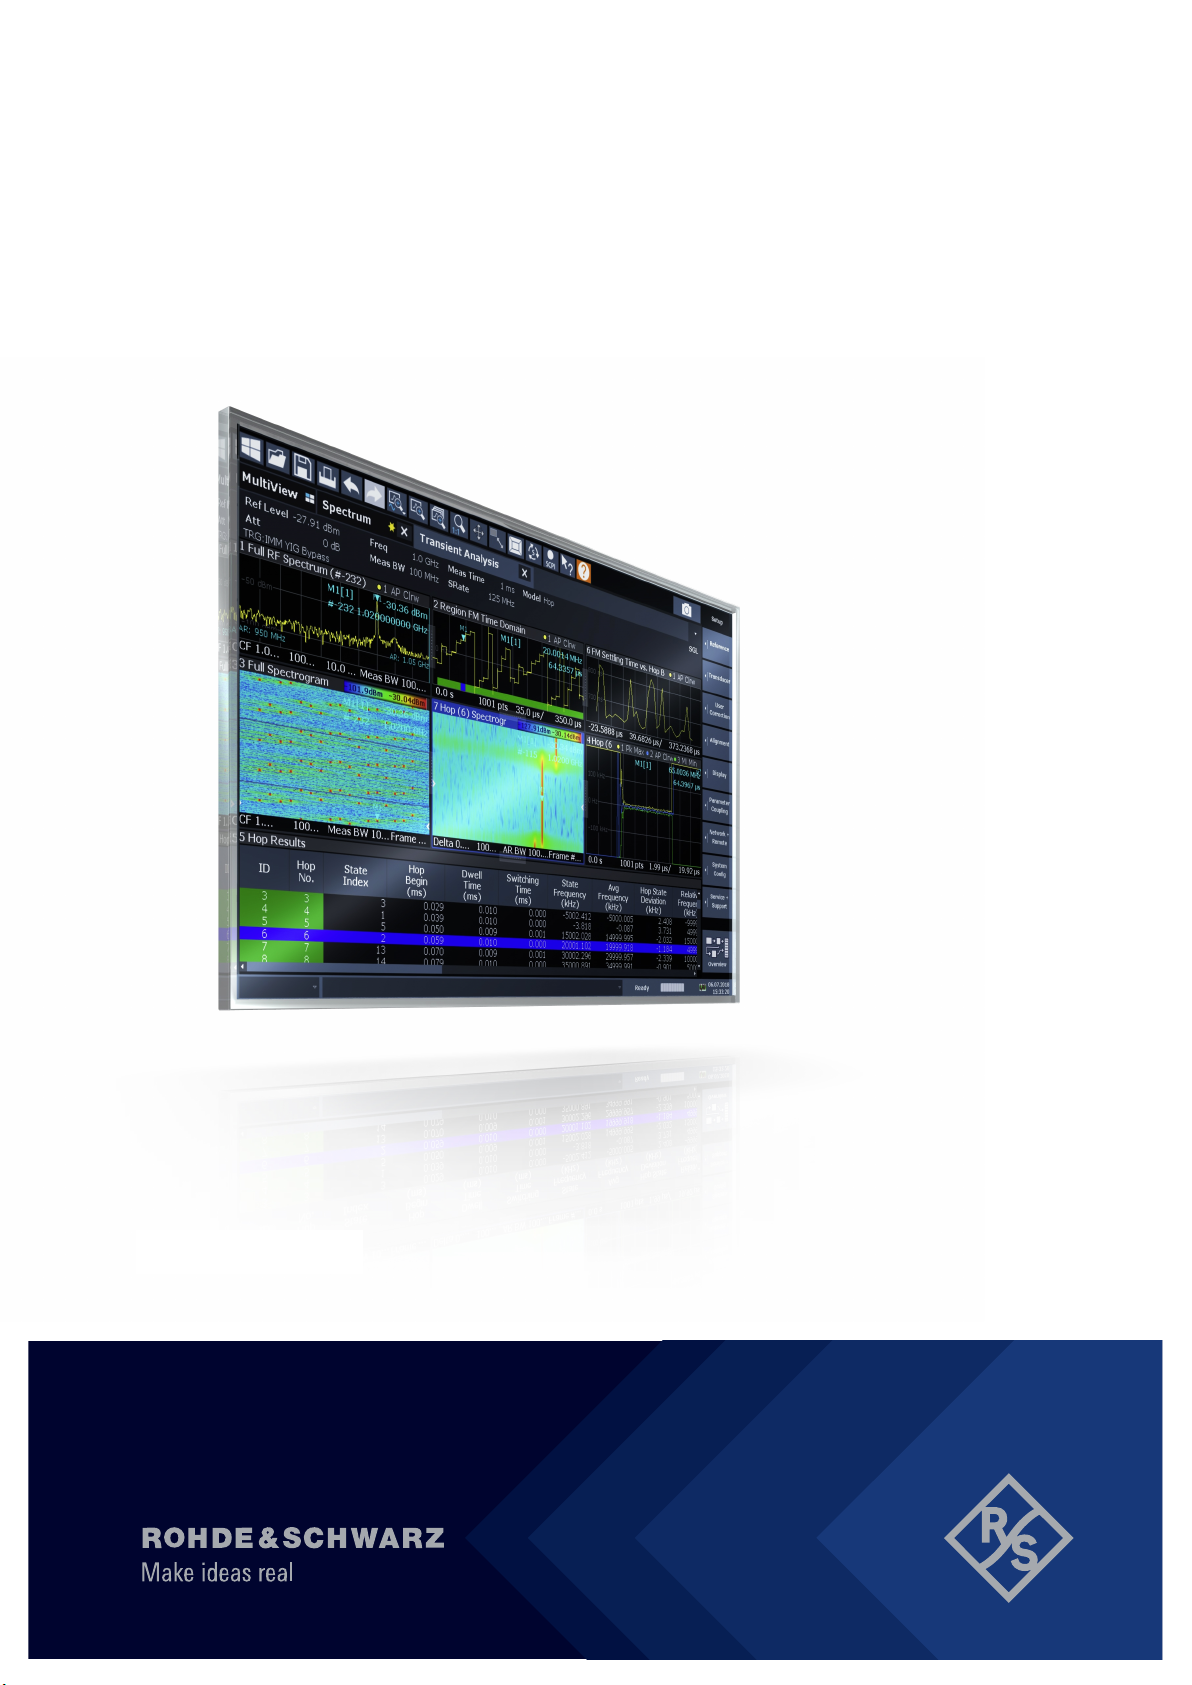
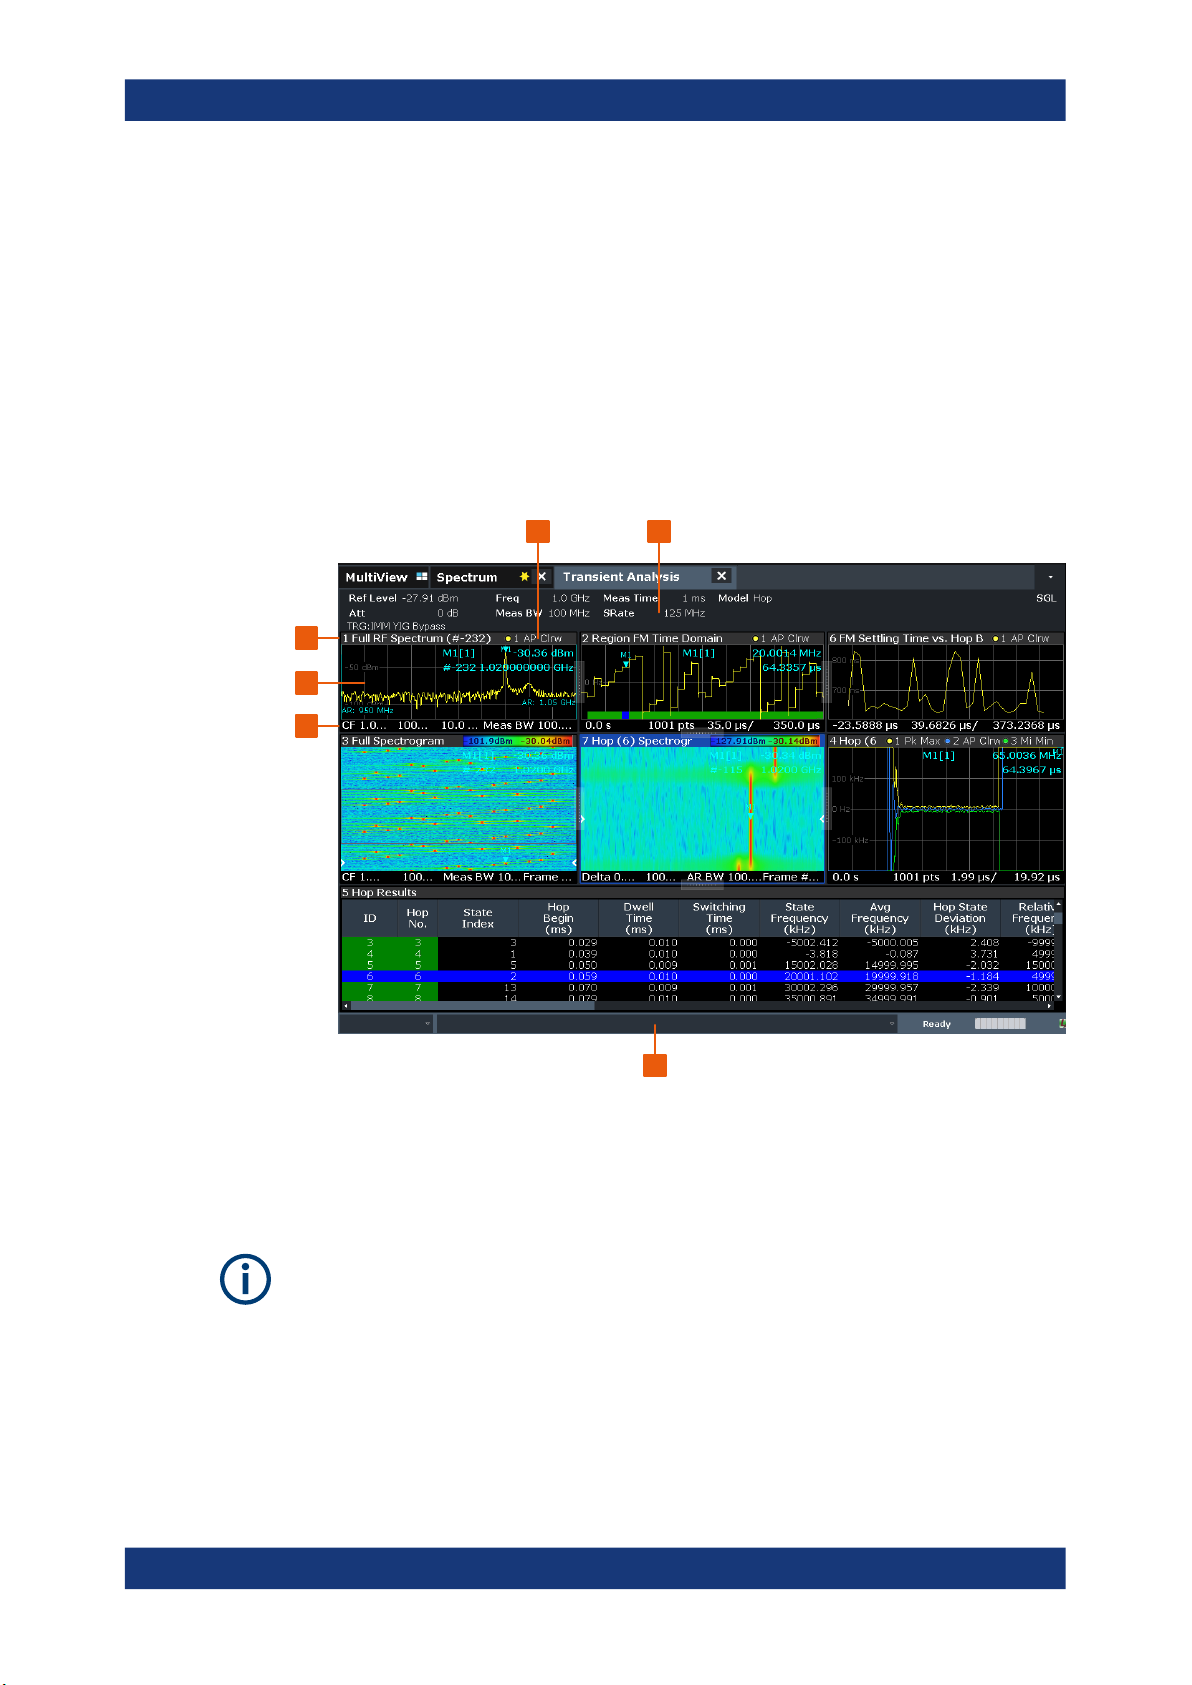
The following figure shows a measurement diagram during analyzer operation. All different information areas are labeled. They are explained in more detail in the following
sections.
1 2
6
5
4
3
1
= Channel bar for firmware and measurement settings
2+3 = Window title bar with diagram-specific (trace) information
4 = Diagram area
5 = Diagram footer with diagram-specific information
6 = Instrument status bar with error messages, progress bar and date/time display
MSRA/MSRT operating mode
In MSRA and MSRT operating mode, additional tabs and elements are available. A
colored background of the screen behind the measurement channel tabs indicates that
you are in MSRA/MSRT operating mode.
For details on the MSRA operating mode see the R&S FSW MSRA User Manual. For
details on the MSRT operating mode see the R&S FSW Realtime Spectrum Application and MSRT Operating Mode User Manual.
16User Manual 1175.6478.02 ─ 22
R&S®FSW-K60
Welcome to the transient analysis application
Understanding the display information
Channel bar information
In the Transient Analysis application, the R&S FSW shows the following settings:
Table 2-1: Information displayed in the channel bar in the Transient Analysis application
Ref Level Reference level
Att RF attenuation
Freq Center frequency for the RF signal
Meas BW Measurement bandwidth
Meas Time Measurement time (data acquisition time)
Sample Rate Sample rate
Model Signal model (hop, chirp or none)
SGL The sweep is set to single sweep mode.
In addition, the channel bar also displays information on instrument settings that affect
the measurement results even though this is not immediately apparent from the display
of the measured values (e.g. transducer or trigger settings). This information is displayed only when applicable for the current measurement. For details see the
R&S FSW Getting Started manual.
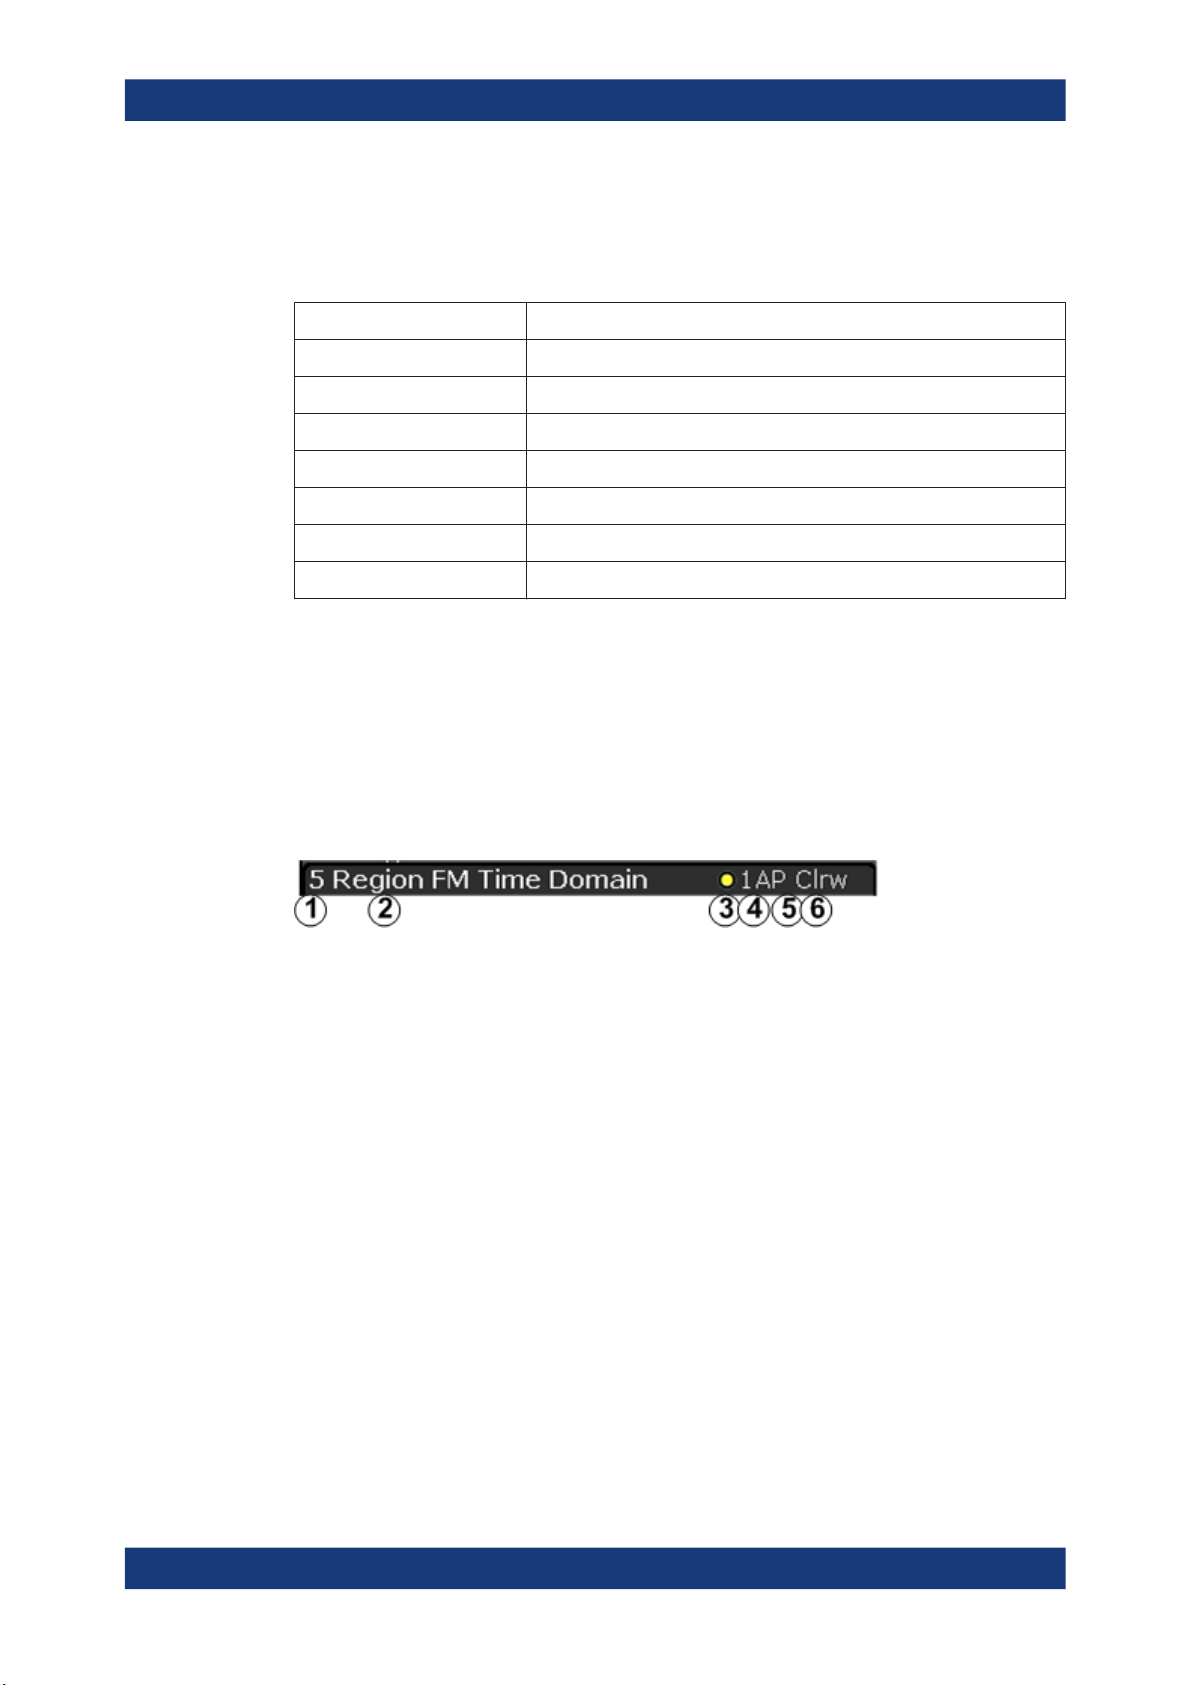
Window title bar information
For each diagram, the header provides the following information:
Figure 2-1: Window title bar information in the R&S FSW Transient Analysis application
1 = Window number
2 = Window type
3 = Trace color
4 = Trace number
5 = Detector mode
6 = Trace mode
Diagram footer information
The diagram footer (beneath the diagram) contains the following information, depending on the evaluation:
Time domain:
●
Start and stop time of data acquisition
●
Number of data points
●
Time displayed per division
Frequency domain:
●
Center frequency
●
Number of data points
17User Manual 1175.6478.02 ─ 22

R&S®FSW-K60
Welcome to the transient analysis application
Understanding the display information
●
Bandwidth displayed per division
●
Measurement bandwidth
Spectrogram:
●
Center frequency
●
Number of data points
●
Measurement bandwidth
●
Selected frame number
Status bar information
Global instrument settings, the instrument status and any irregularities are indicated in
the status bar beneath the diagram. Furthermore, the progress of the current operation
is displayed in the status bar.
18User Manual 1175.6478.02 ─ 22

R&S®FSW-K60
3 About transient analysis
About transient analysis
Transient analysis refers to signal effects which may appear briefly or change rapidly in
time or frequency. Typical examples are spurious emissions or modulated signals
using frequency-hopping techniques. Such signals often require analysis of a large
bandwidth, if possible without gaps.
Ideally, such signals are analyzed in real-time mode, which employs special hardware
in order to capture and process data simultaneously, and seamlessly. However, if a
real-time analyzer is not available, the Transient Analysis application is a good choice.
Similarly to real-time mode, but without the special hardware, this application captures
data and asynchronously - before data acquisition is completed - starts analyzing the
available input and displays first results. Especially for large bandwidths or long measurement times, analysis becomes much more efficient and the complete measurement task can be sped up significantly. Although gaps may occur between successive
measurements with large bandwidths, the results from each individual measurement
are complete without gaps.
Thus, the Transient Analysis application supports you in analyzing time- and frequency-variant signals with large bandwidths.
19User Manual 1175.6478.02 ─ 22

R&S®FSW-K60
4 Measurement basics
Measurement basics
Basics on input from I/Q data files
Some background knowledge on basic terms and principles used in analysis of transient signals is provided here for a better understanding of the required configuration
settings.
● Data acquisition.......................................................................................................20
● Basics on input from I/Q data files.......................................................................... 20
● Signal processing....................................................................................................22
● Signal models..........................................................................................................24
● Basis of evaluation..................................................................................................27
● Analysis region........................................................................................................28
● Zooming and shifting results................................................................................... 31
● Measurement range................................................................................................32
● Trace evaluation......................................................................................................34
● Working with spectrograms.....................................................................................38
● Transient analysis in MSRA/MSRT mode...............................................................45
4.1 Data acquisition
The R&S FSW Transient Analysis application measures the power of the signal input
over time. How much data is captured depends on the measurement bandwidth and
the measurement time. These two values are interdependant and allow you to define
the data to be measured using different methods:
●
By defining a bandwidth around the specified center frequency to be measured at a
specified sample rate
●
By defining a time length during which a specified number of samples are measured at the specified center frequency
4.2 Basics on input from I/Q data files
The I/Q data to be evaluated in a particular R&S FSW application can not only be captured by the application itself, it can also be loaded from a file, provided it has the correct format. The file is then used as the input source for the application.
For example, you can capture I/Q data using the I/Q Analyzer application, store it to a
file, and then analyze the signal parameters for that data later using the Pulse application (if available).
The I/Q data file must be in one of the following supported formats:
.iq.tar
●
.iqw
●
.csv
●
.mat
●
20User Manual 1175.6478.02 ─ 22

R&S®FSW-K60
Measurement basics
Basics on input from I/Q data files
.wv
●
.aid
●
An application note on converting Rohde & Schwarz I/Q data files is available from the
Rohde & Schwarz website:
1EF85: Converting R&S I/Q data files
As opposed to importing data from an I/Q data file using the import functions provided
by some R&S FSW applications, the data is not only stored temporarily in the capture
buffer, where it overwrites the current measurement data and is in turn overwritten by a
new measurement. Instead, the stored I/Q data remains available as input for any
number of subsequent measurements. Furthermore, the (temporary) data import
requires the current measurement settings in the current application to match the settings that were applied when the measurement results were stored (possibly in a different application). When the data is used as an input source, however, the data acquisition settings in the current application (attenuation, center frequency, measurement
bandwidth, sample rate) can be ignored. As a result, these settings cannot be changed
in the current application. Only the measurement time can be decreased, in order to
perform measurements on an extract of the available data (from the beginning of the
file) only.
For input files that contain multiple data streams from different channels, you can
define which data stream to be used for the currently selected channel in the input settings.
You can define whether the data stream is used only once, or repeatedly, to create a
larger amount of input data.
When using input from an I/Q data file, the [RUN SINGLE] function starts a single measurement (i.e. analysis) of the stored I/Q data, while the [RUN CONT] function repeatedly analyzes the same data from the file.
Sample iq.tar files
If you have the optional R&S FSW VSA application (R&S FSW-K70), some sample
iq.tar files are provided in the C:/R_S/Instr/user/vsa/DemoSignals directory
on the R&S FSW.
Pre-trigger and post-trigger samples
In applications that use pre-triggers or post-triggers, if no pre-trigger or post-trigger
samples are specified in the I/Q data file, or too few trigger samples are provided to
satisfy the requirements of the application, the missing pre- or post-trigger values are
filled up with zeros. Superfluous samples in the file are dropped, if necessary. For pretrigger samples, values are filled up or omitted at the beginning of the capture buffer,
for post-trigger samples, values are filled up or omitted at the end of the capture buffer.
21User Manual 1175.6478.02 ─ 22
R&S®FSW-K60
4.3 Signal processing
Measurement basics
Signal processing
The R&S FSW Transient Analysis application measures the power of the signal input
over time. In order to convert the time domain signal to a frequency spectrum, an FFT
(Fast Fourier Transformation) is performed which converts a vector of input values into
a discrete spectrum of frequencies.
The application calculates multiple FFTs per capture, by dividing one capture into several overlapping FFT frames. This is especially useful in conjunction with window functions since it enables a gap-free frequency analysis of the signal.
Using overlapping FFT frames leads to more individual results and improves detection
of transient signal effects. However, it also extends the duration of the calculation. The
size of the FFT frame depends on the number of input signal values (record length),
the overlap factor, and the time resolution (time span used for each FFT calculation).
FFT window functions
Each FFT frame is multiplied with a specific window function after sampling in the time
domain. Windowing helps minimize the discontinuities at the end of the measured signal interval and thus reduces the effect of spectral leakage, increasing the frequency
resolution.
Additional filters can be applied after demodulation to filter out unwanted signals, or
correct pre-emphasized input signals.
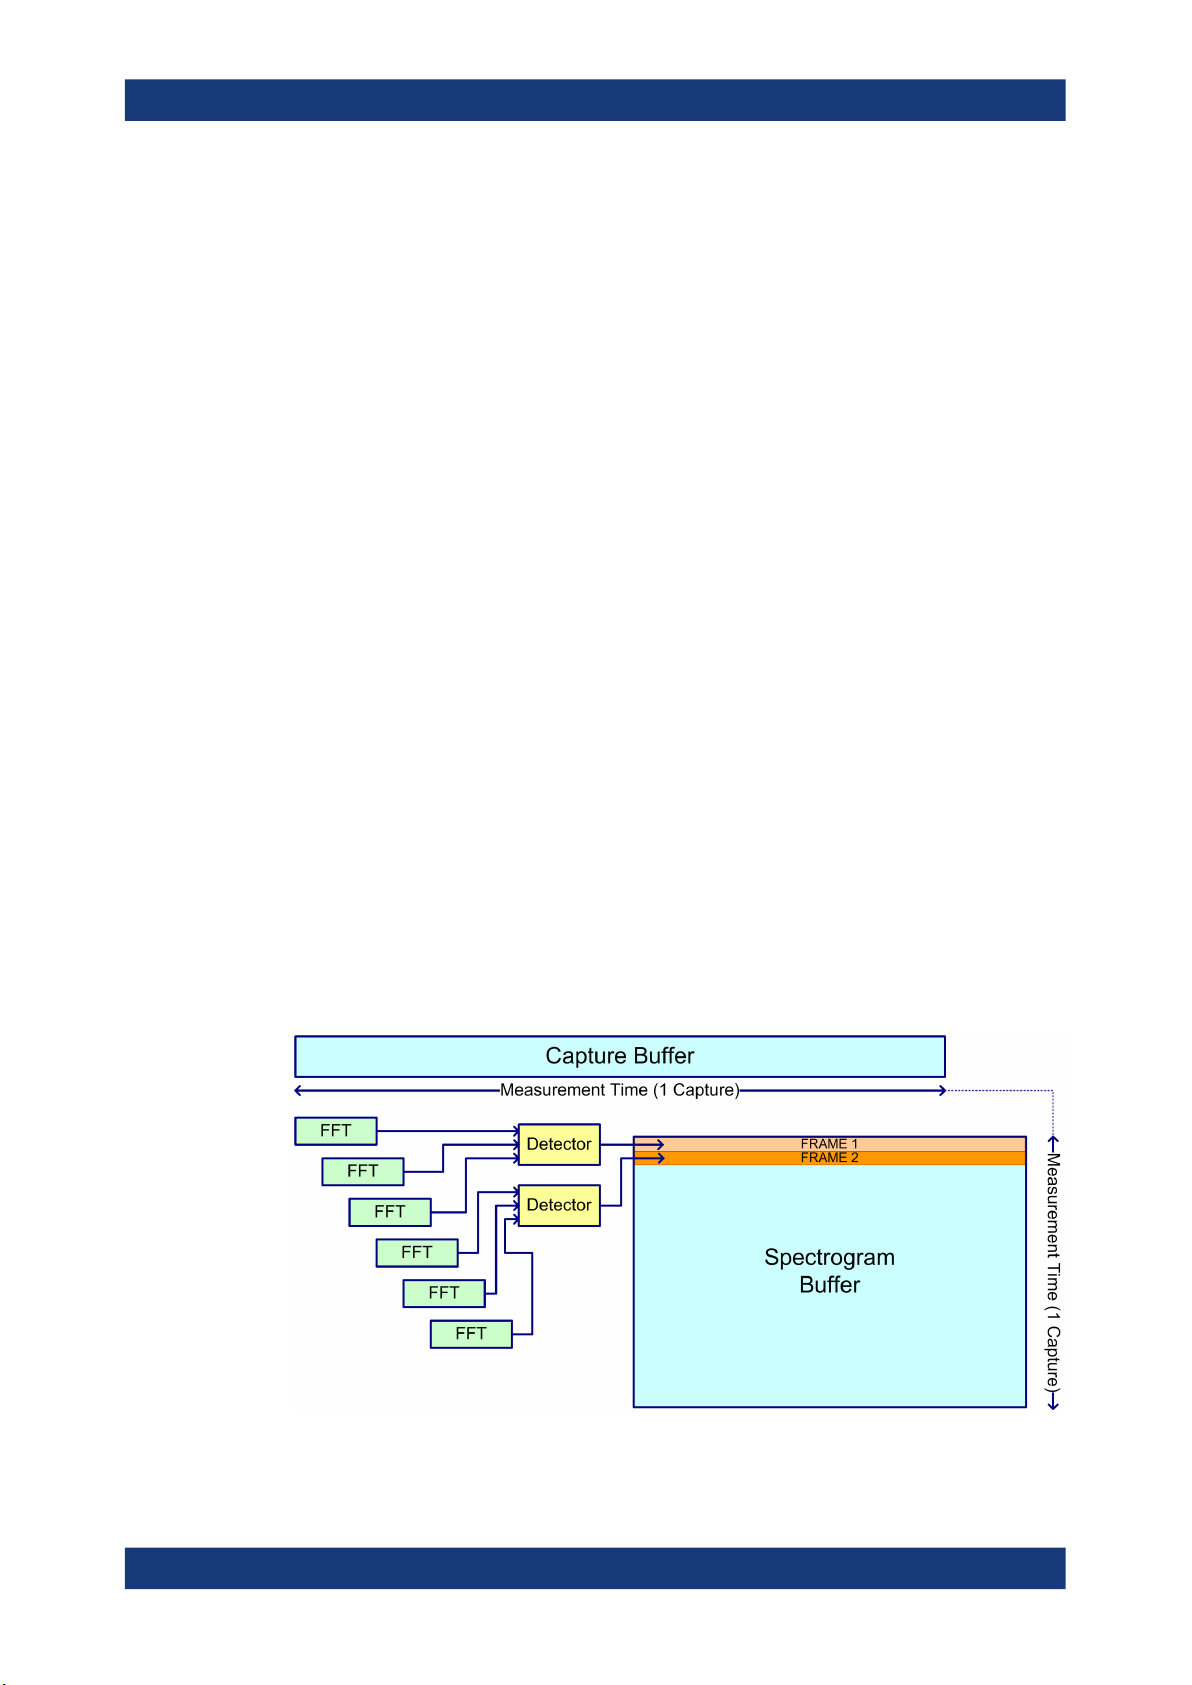
Asynchronous data processing
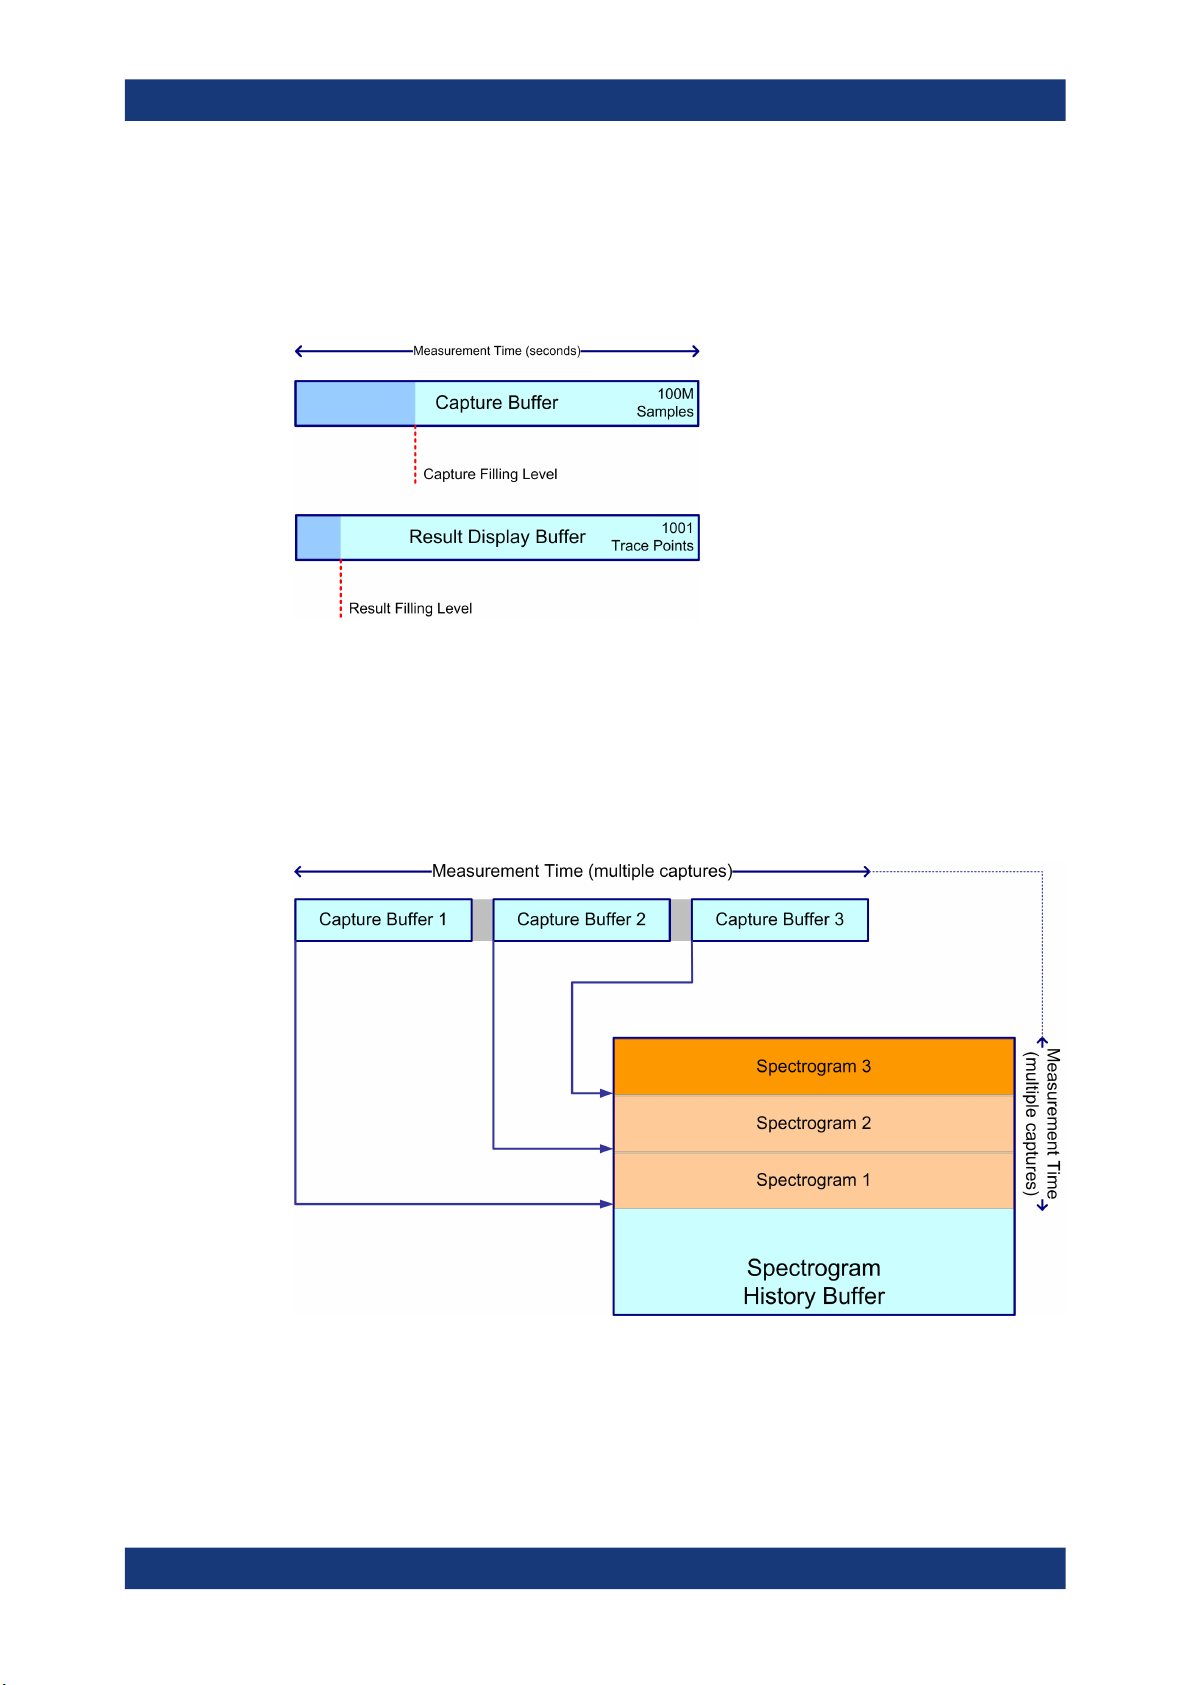
During a measurement in the R&S FSW Transient Analysis application, the data is
captured and stored in the capture buffer until the defined measurement time has
expired. As soon as a minimum amount of data is available, the first FFT calculation is
performed. As soon as the required number of (overlapping) FFT results is available,
the detector function is applied to the data and the first frame is displayed in the Spectrogram (and any other active result displays).
Figure 4-1: Signal processing: calculating one spectrogram frame
22User Manual 1175.6478.02 ─ 22
R&S®FSW-K60
Measurement basics
Signal processing
Shortly after the measurement time is over, the final results are displayed and the measurement is complete. Due to this asynchronous processing, initial analysis results are
available very quickly. At the same time, the data is captured over the full bandwidth
entirely without gaps. The following figure illustrates how the capture and result display
processes are performed asynchronously.
Figure 4-2: Asynchronous data processing
Multiple spectrograms
However, after each data acquisition, a short delay occurs before the next acquisition
can be carried out. Thus, for measurements for which several spectrograms are
required and the capturing process is repeated several times (defined by the "frame
count"), a short gap in the results between spectrograms can be detected.
Figure 4-3: Signal processing: calculating several spectrograms
23User Manual 1175.6478.02 ─ 22

R&S®FSW-K60
Measurement basics
Signal models
Resolution bandwidth
The resolution bandwidth (RBW) has an effect on how the spectrum is measured and
displayed. It determines the frequency resolution of the measured spectrum and is
directly coupled to the selected analysis bandwidth (ABW). The ABW can be the full
measurement bandwidth, the bandwidth of the analysis region, or the length of the
result range, depending on the evaluation basis of the result display (see Chapter 4.5,
"Basis of evaluation", on page 27). If the ABW is changed, the resolution bandwidth is
automatically adjusted. Which coupling ratios are available depends on the selected
FFT Window.
A small resolution bandwidth has several advantages. The smaller the resolution bandwidth, the better you can observe signals whose frequencies are close together and
the less noise is displayed. However, a small resolution bandwidth also increases the
required measurement time.
The resolution bandwidth parameters can be defined in the bandwidth configuration,
see Chapter 6.6, "Bandwidth settings", on page 114.
Time resolution
The time resolution determines the size of the bins used for each FFT calculation. The
shorter the time span used for each FFT, the shorter the resulting span, and thus the
higher the resolution in the spectrum becomes. The time resolution to be used for
R&S FSW can be defined manually or automatically according to the data acquisition
settings.
4.4 Signal models
If the additional firmware options R&S FSW-K60H or -K60C are installed, the R&S
FSW Transient Analysis application supports different signal models for which similar
parameters are characteristic.
● Frequency hopping................................................................................................. 24
● Frequency chirping..................................................................................................26
● Automatic vs. manual hop/chirp state detection......................................................27
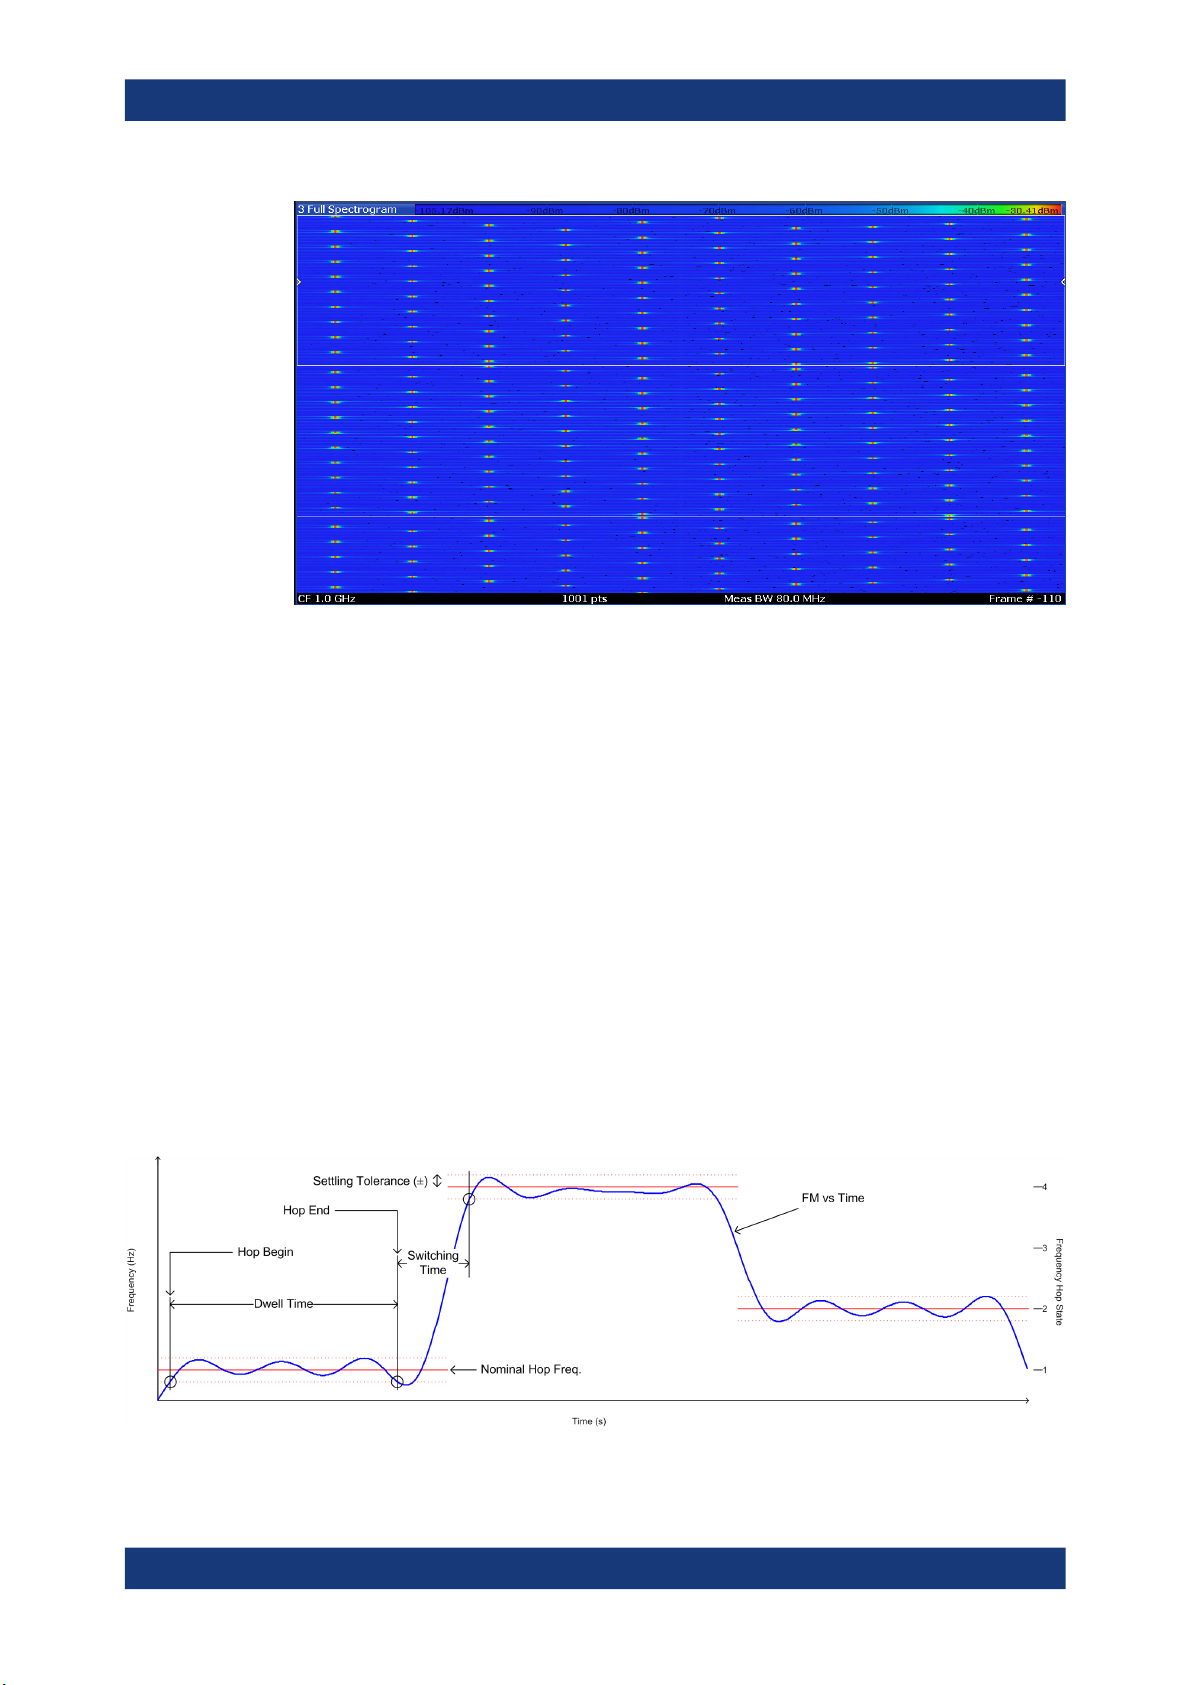
4.4.1 Frequency hopping
Some digital data transmission standards employ a frequency-hopping technique, in
which a carrier signal is rapidly switched among many frequency channels. Discrete
frequencies and continuous modulation are characteristic of this signal model.
24User Manual 1175.6478.02 ─ 22
R&S®FSW-K60
Measurement basics
Signal models
Figure 4-4: Typical spectrogram of a frequency-hopping signal
Analyzing such signals includes the following challenges:
●
Detecting the currently used carrier frequency and a possible offset
●
Determining the duration the signal stays at one frequency and the time it takes to
switch to another
●
Measuring the average power level
●
Demodulating the signal correctly
The R&S FSW Transient Analysis application (with the additional R&S FSW-K60H
option installed) can automatically detect frequency hops in a measured signal and
determine characteristic hop parameters. Both pulsed and continuous wave hopping
signals can be analyzed.
Assuming a frequency-hopping signal model, the frequency bands in which the carrier
can be expected are usually known in advance. Therefore, you can configure conditions that must apply to the measured signal in order to detect a frequency hop and
distinguish it from random spurs or frequency distortions. Such conditions can be a frequency tolerance around a defined nominal value, for instance, or a minimum or maximum dwell time in which the frequency remains steady.
Figure 4-5: Parameters required to detect hops
25User Manual 1175.6478.02 ─ 22
R&S®FSW-K60
Measurement basics
Signal models
Nominal Frequency Values (Hop States)
The (nominal) frequency values the carrier is expected to "hop" to are defined in
advance. Each such level is considered to be a hop state. The hop states are defined
as frequency offsets from the center frequency. A tolerance span can be defined to
compensate for settling effects. As long as the deviation remains within the tolerance
above or below the nominal frequency, the hop state is detected.
The nominal frequency levels are numbered consecutively in the "Hop States" table
(see Chapter 6.2.2, "Signal states", on page 85), starting at 0. The state index of the
corresponding nominal frequency level is assigned to each detected hop in the measured signal results.
Dwell Time Conditions
The dwell time is the time the signal remains in the tolerance area of a nominal hop
frequency, or in other words: the duration of a hop from beginning to end. In a default
measurement, useful dwell times for the current measurement are determined automatically. However, you can define minimum or maximum dwell times, or both, manually, in order to detect only specific hops, for example.
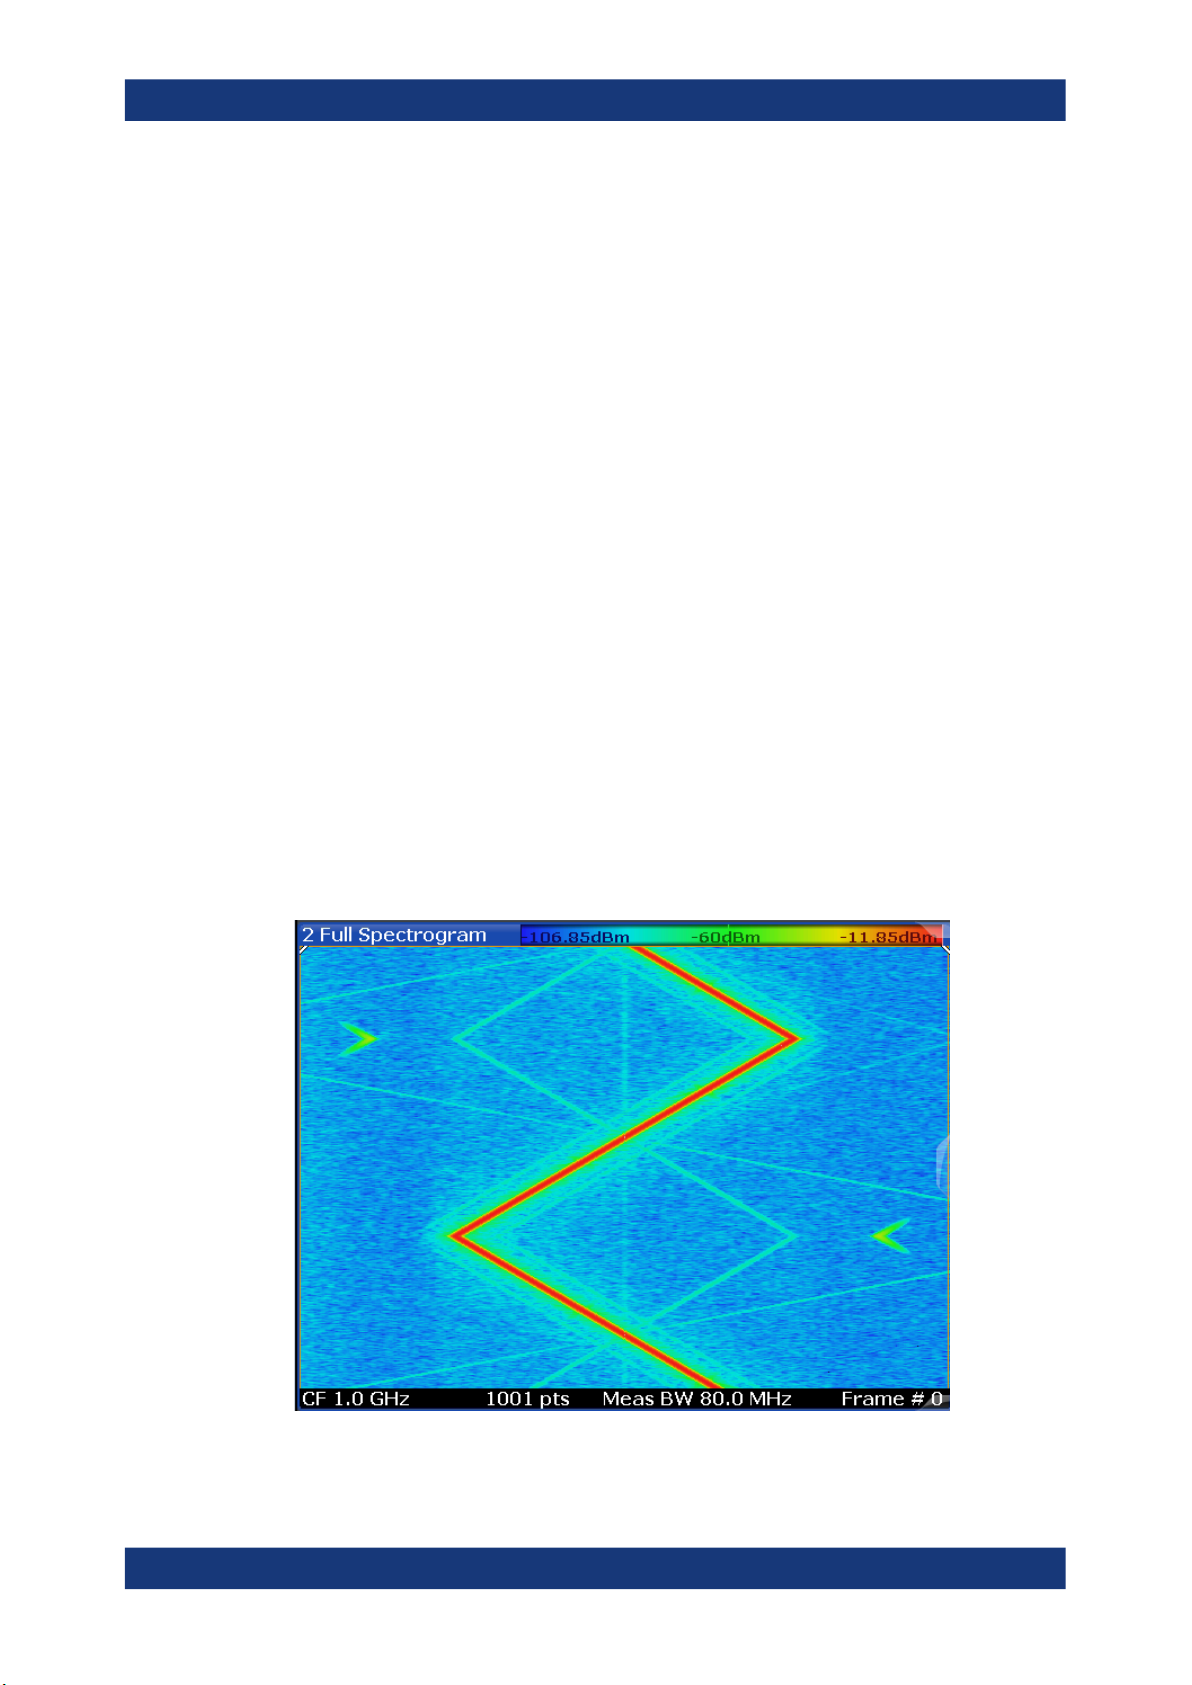
4.4.2 Frequency chirping
Frequency chirping is similar to hopping, however, instead of switching to discrete frequencies, the frequency varies with time at a particular chirp rate. Transient analysis
with the R&S FSW application (and the additional R&S FSW-K60C option) is restricted
to the commonly used linear FM chirp signals. In this case, the nominal chirp switches
to discrete values, referred to as the chirp states.
Figure 4-6: Typical spectrogram of a chirped signal
26User Manual 1175.6478.02 ─ 22
R&S®FSW-K60
Measurement basics
Basis of evaluation
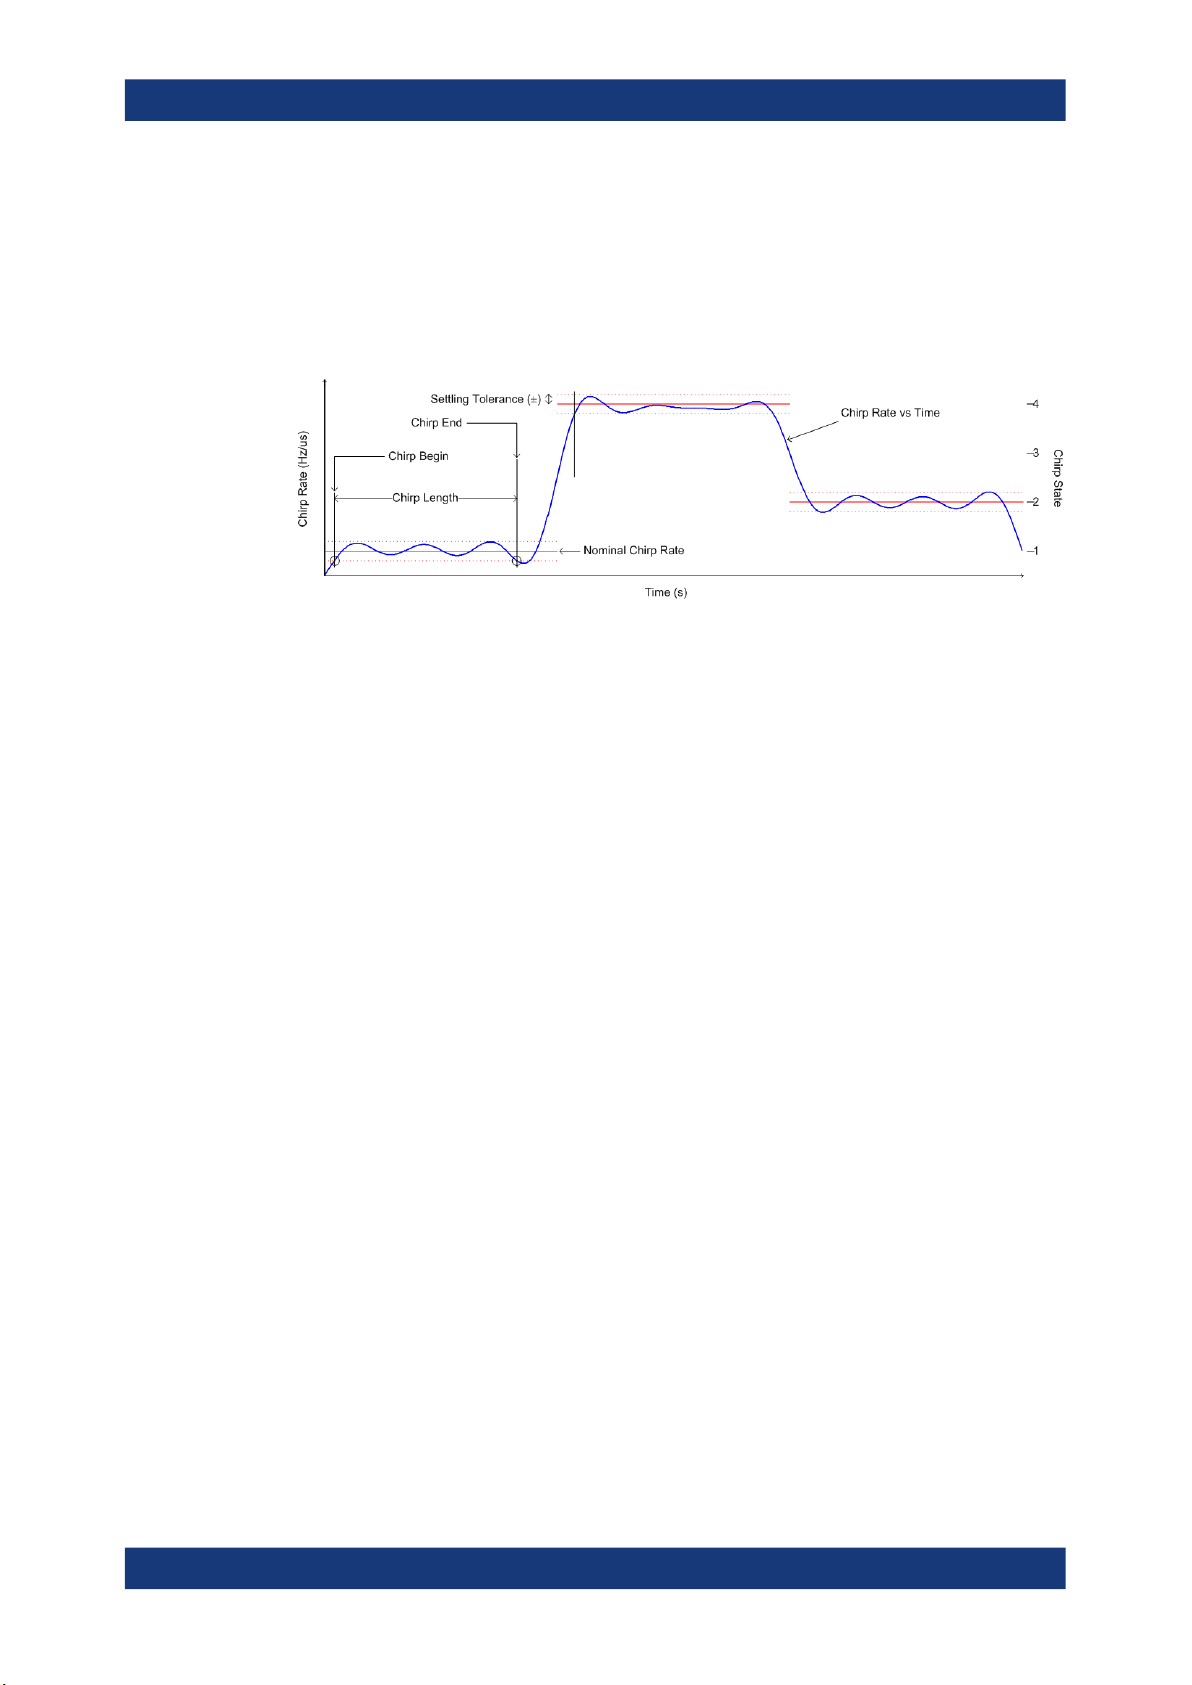
The R&S FSW Transient Analysis application can automatically detect chirps in a measured signal and determine characteristic chirp parameters. Both pulsed and continuous wave chirp signals can be analyzed.
Obviously, if you consider the chirps rather than the individual frequencies, the measured data from chirped signals is very similar to hopped signals, and thus the analysis
tasks and the characteristic parameters are very similar, as well.
Figure 4-7: Parameters required to detect chirps
In the R&S FSW Transient Analysis application, for a chirp signal, the derivation of the
captured signal data is calculated before further analysis. From there, processing is
identical for both signal models.
4.4.3 Automatic vs. manual hop/chirp state detection
By default, the R&S FSW Transient Analysis application automatically detects the
existing hop/chirp states in a pre-measurement. For an initial overview of the signal at
hand this detection is usually sufficient. For more accurate results, particularly if the
input signal is known in advance, the nominal frequency or chirp values can be defined
manually.
4.5 Basis of evaluation
Depending on the measurement task, not all of the measured data in the capture buffer
may be of interest. In some cases it may be useful to restrict analysis to a specific
user-definable region, or to a selected individual chirp or hop. This makes analysis
more efficient and the display clearer.
Automatic detection of hops or chirps, for example, is always based on a restricted
analysis region. Numeric results for characteristic parameters, as well as statistical
results, are also calculated on this restricted basis.
For graphical displays, selecting an individual hop or chirp allows you to analyze or
compare characteristic values in detail.
Which evaluation basis is available for which result display is indicated in Table 5-1.
27User Manual 1175.6478.02 ─ 22
R&S®FSW-K60
Measurement basics
Analysis region
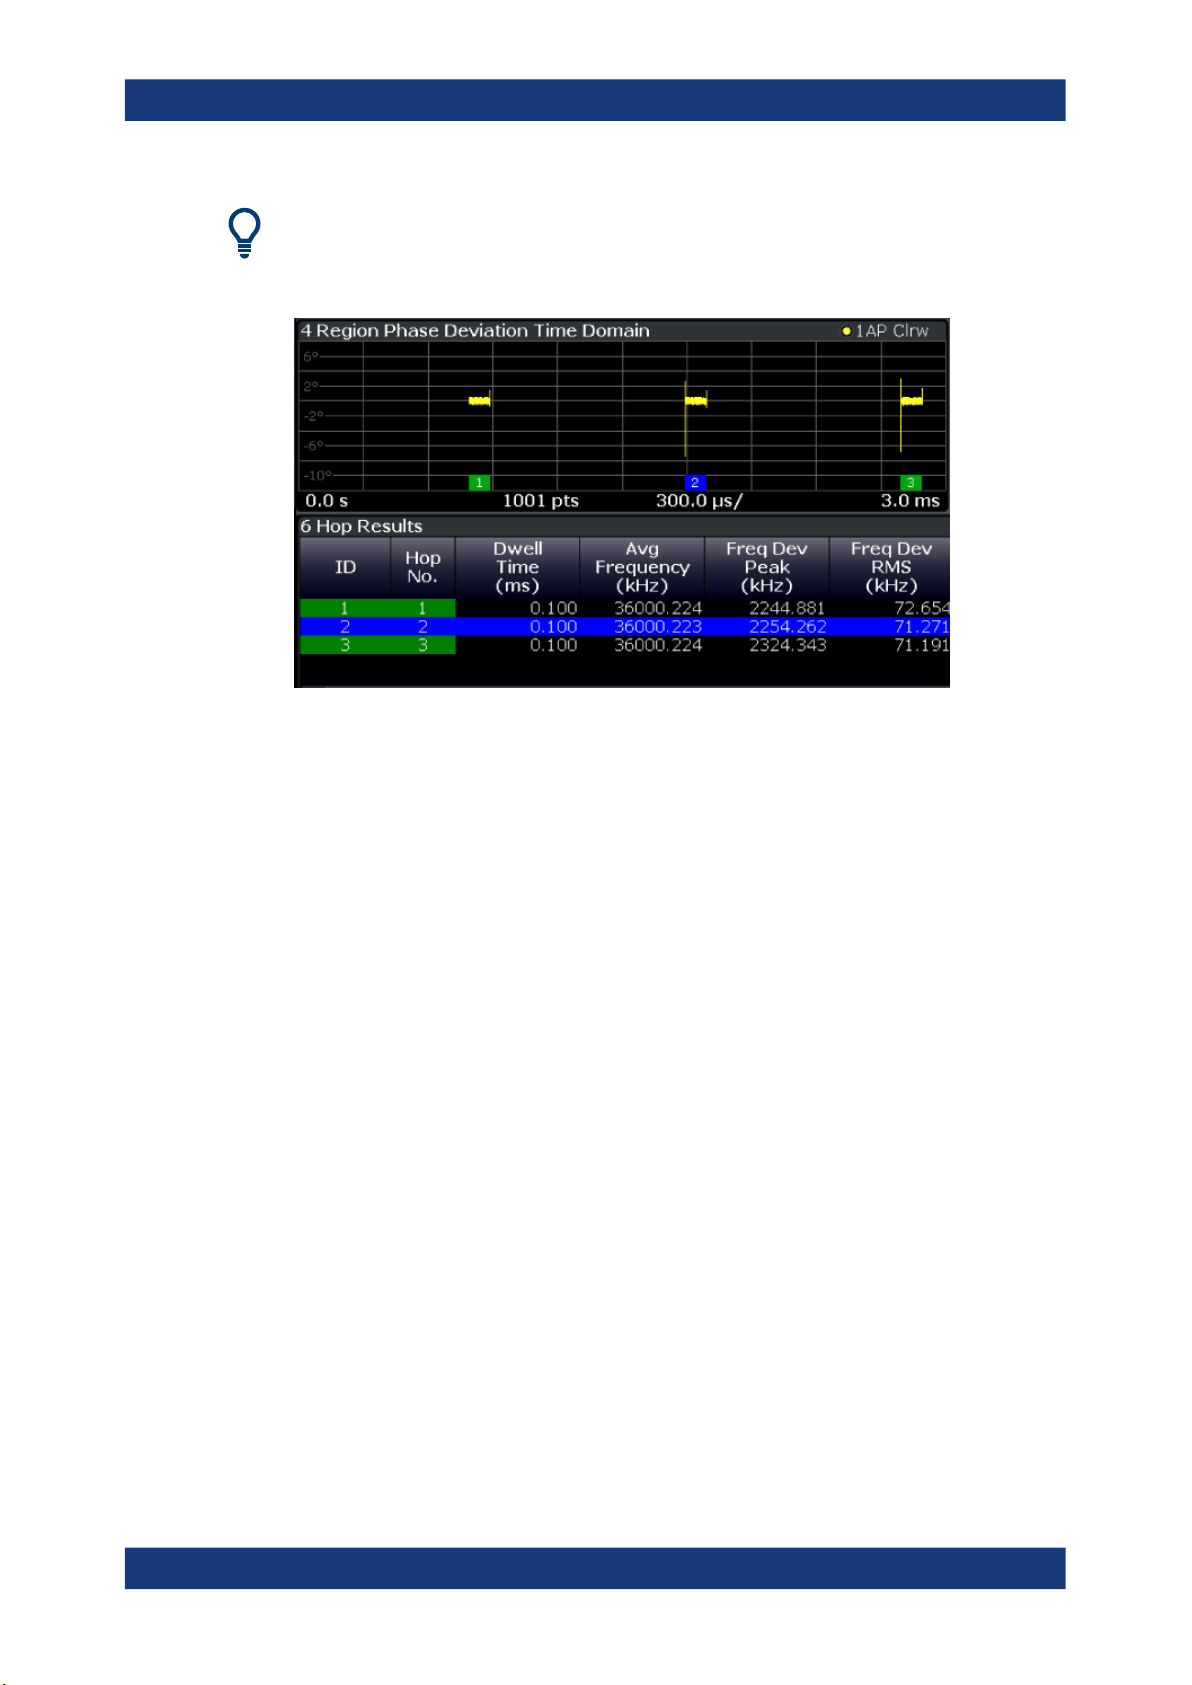
Detected hops/chirps are indicated by green bars along the x-axis in graphical result
displays. The selected hop/chirp (see "Select Hop / Select Chirp" on page 134) is indicated by a blue bar. The hop/chirp index as displayed in the result tables is indicated at
the bottom of each bar.
Figure 4-8: Example of detected hops with hop index in graphical result display and result table
4.6 Analysis region
The analysis region determines which of the captured data is analyzed and displayed
on the screen. By default, the entire capture buffer data is defined as the analysis
region. However, you can select a specific frequency and time region which is of interest for analysis. The results can then be restricted to this region (see Chapter 7.3,
"Evaluation basis", on page 134).
Note, however, that only one analysis region can be defined. All result displays that are
restricted to the analysis region thus have the same data basis.
28User Manual 1175.6478.02 ─ 22

R&S®FSW-K60
Measurement basics
Analysis region
Numeric results (displayed in the result or statistics tables) are always calculated
based on the analysis region.
For graphical result displays based on the analysis region, the x-axis range corresponds to the analysis region length (see "Time Gate Length" on page 113).
The analysis region is indicated by a colored frame in the Full Spectrogram display,
and by vertical blue lines in result displays based on the full capture buffer.
The colors used to indicate the analysis range in spectrograms are configurable, see
"Modifying Analysis Region and Sweep Separator Colors" on page 141.
Defining the analysis region
There are different methods of defining the analysis region:
●
absolute definition: by defining an absolute frequency span and an absolute time
gate
The frequency span is defined by an offset from the center frequency and an analysis bandwidth.
The time gate is defined by a starting point after measurement begin and the gate
length.
●
Relative definition: by linking the analysis region to the full capture buffer and defining a percentage of the full bandwidth and measurement time
The specified frequency offset or time gate start are also considered for relative
values.
●
Graphically: The analysis region is indicated by a dotted frame in the Spectrogram
display and by vertical lines in the full spectrum display. Its size and position can be
moved by tapping and dragging the frame on the touchscreen.
Furthermore, the data zoom and shift functions allow you to change the size and
position of the analysis region from any graphical result display (see Chapter 4.7,
"Zooming and shifting results", on page 31).
The absolute and relative methods can be combined, for example by defining an absolute frequency span and a relative time gate.
29User Manual 1175.6478.02 ─ 22

R&S®FSW-K60
Measurement basics
Analysis region
Figure 4-9: Visualization of absolute analysis region parameters
Processing data in the analysis region - data zoom
In result displays restricted to the analysis region, only the data measured for the
specified frequency range and within the defined time gate is considered. Furthermore,
the analysis region data is taken only from the latest data acquisition, that is, only data
that is still in the capture buffer is analyzed.
Restricting the results to an analysis region has the same effect as a data zoom: the
results are recalculated for a restricted data base. The data in the capture buffer is filtered by the defined time gate; the measured data within that time span then passes a
bandpass filter, so only the frequency range of interest is analyzed. Depending on the
selected result display, the data is then demodulated, if necessary, and distributed
among the trace points using a detector. The time span displayed per division of the
diagram is much smaller compared to the initial full data analysis. Thus, the results of
the analysis range become more precise.
30User Manual 1175.6478.02 ─ 22
 Loading...