

R&S®FSW-K10x (LTE Uplink)
LTE Uplink Measurement Application
User Manual
(;×ëä2)
1173938602
Version 19

This manual applies to the following R&S®FSW models with firmware version 5.00 and later:
●
R&S®FSW8 (1331.5003K08 / 1312.8000K08)
●
R&S®FSW13 (1331.5003K13 / 1312.8000K13)
●
R&S®FSW26 (1331.5003K26 / 1312.8000K26)
●
R&S®FSW43 (1331.5003K43 / 1312.8000K43)
●
R&S®FSW50 (1331.5003K50 / 1312.8000K50)
●
R&S®FSW67 (1331.5003K67 / 1312.8000K67)
●
R&S®FSW85 (1331.5003K85 / 1312.8000K85)
The following firmware options are described:
●
R&S FSW-K101 (EUTRA/LTE FDD uplink measurement application) (1313.1551.02)
●
R&S FSW-K103 (EUTRA/LTE advanced UL measurements) (1313.2487.02)
●
R&S FSW-K105 (EUTRA/LTE TDD uplink measurement application) (1313.1580.02)
© 2021 Rohde & Schwarz GmbH & Co. KG
Mühldorfstr. 15, 81671 München, Germany
Phone: +49 89 41 29 - 0
Email: info@rohde-schwarz.com
Internet: www.rohde-schwarz.com
Subject to change – data without tolerance limits is not binding.
R&S® is a registered trademark of Rohde & Schwarz GmbH & Co. KG.
Trade names are trademarks of the owners.
1173.9386.02 | Version 19 | R&S®FSW-K10x (LTE Uplink)
Throughout this manual, products from Rohde & Schwarz are indicated without the ® symbol , e.g. R&S®FSW is indicated as
R&S FSW.

R&S®FSW-K10x (LTE Uplink)
Contents
1 Preface.................................................................................................... 5
1.1 Documentation overview..............................................................................................5
1.2 Conventions used in the documentation....................................................................7
2 Welcome to the LTE measurement application...................................8
2.1 Overview of the LTE applications................................................................................ 8
2.2 Installation................................................................................................................... 10
2.3 Starting the LTE measurement application.............................................................. 10
2.4 Understanding the display information.................................................................... 11
3 Measurements and result displays.................................................... 14
3.1 Selecting measurements............................................................................................14
Contents
3.2 Selecting result displays............................................................................................ 15
3.3 Performing measurements.........................................................................................16
3.4 Selecting the operating mode....................................................................................16
3.5 I/Q measurements....................................................................................................... 17
3.6 Time alignment error measurements........................................................................ 30
3.7 Frequency sweep measurements..............................................................................32
3.8 3GPP test scenarios................................................................................................... 39
4 Measurement basics............................................................................40
4.1 Symbols and variables............................................................................................... 40
4.2 Overview...................................................................................................................... 41
4.3 The LTE uplink analysis measurement application................................................. 41
4.4 Performing time alignment measurements.............................................................. 45
4.5 SRS EVM calculation.................................................................................................. 46
5 Configuration........................................................................................48
5.1 Configuration overview.............................................................................................. 48
5.2 I/Q measurements....................................................................................................... 50
5.3 Time alignment error measurements........................................................................ 96
5.4 Frequency sweep measurements..............................................................................96
6 Analysis................................................................................................ 99
6.1 General analysis tools................................................................................................ 99
3User Manual 1173.9386.02 ─ 19

R&S®FSW-K10x (LTE Uplink)
6.2 Analysis tools for I/Q measurements......................................................................102
6.3 Analysis tools for frequency sweep measurements............................................. 108
7 Remote control...................................................................................109
7.1 Common suffixes...................................................................................................... 109
7.2 Introduction............................................................................................................... 110
7.3 LTE application selection......................................................................................... 115
7.4 Screen layout.............................................................................................................119
7.5 Measurement control................................................................................................128
7.6 Trace data readout.................................................................................................... 132
7.7 Numeric result readout.............................................................................................145
7.8 Limit check result readout....................................................................................... 160
7.9 Configuration.............................................................................................................172
Contents
7.10 Analysis..................................................................................................................... 235
List of remote commands (LTE uplink)............................................244
Index....................................................................................................250
4User Manual 1173.9386.02 ─ 19

R&S®FSW-K10x (LTE Uplink)
1 Preface
This chapter provides safety-related information, an overview of the user documentation and the conventions used in the documentation.
1.1 Documentation overview
This section provides an overview of the R&S FSW user documentation. Unless specified otherwise, you find the documents on the R&S FSW product page at:
www.rohde-schwarz.com/manual/FSW
1.1.1 Getting started manual
Introduces the R&S FSW and describes how to set up and start working with the product. Includes basic operations, typical measurement examples, and general information, e.g. safety instructions, etc.
Preface
Documentation overview
A printed version is delivered with the instrument. A PDF version is available for download on the Internet.
1.1.2 User manuals and help
Separate user manuals are provided for the base unit and the firmware applications:
●
Base unit manual
Contains the description of all instrument modes and functions. It also provides an
introduction to remote control, a complete description of the remote control commands with programming examples, and information on maintenance, instrument
interfaces and error messages. Includes the contents of the getting started manual.
●
Firmware application manual
Contains the description of the specific functions of a firmware application, including remote control commands. Basic information on operating the R&S FSW is not
included.
The contents of the user manuals are available as help in the R&S FSW. The help
offers quick, context-sensitive access to the complete information for the base unit and
the firmware applications.
All user manuals are also available for download or for immediate display on the Internet.
5User Manual 1173.9386.02 ─ 19

R&S®FSW-K10x (LTE Uplink)
1.1.3 Service manual
Describes the performance test for checking the rated specifications, module replacement and repair, firmware update, troubleshooting and fault elimination, and contains
mechanical drawings and spare part lists.
The service manual is available for registered users on the global Rohde & Schwarz
information system (GLORIS):
https://gloris.rohde-schwarz.com
1.1.4 Instrument security procedures
Deals with security issues when working with the R&S FSW in secure areas. It is available for download on the Internet.
1.1.5 Printed safety instructions
Preface
Documentation overview
Provides safety information in many languages. The printed document is delivered with
the product.
1.1.6 Data sheets and brochures
The data sheet contains the technical specifications of the R&S FSW. It also lists the
firmware applications and their order numbers, and optional accessories.
The brochure provides an overview of the instrument and deals with the specific characteristics.
See www.rohde-schwarz.com/brochure-datasheet/FSW
1.1.7 Release notes and open-source acknowledgment (OSA)
The release notes list new features, improvements and known issues of the current
firmware version, and describe the firmware installation.
The open-source acknowledgment document provides verbatim license texts of the
used open source software.
See www.rohde-schwarz.com/firmware/FSW
1.1.8 Application notes, application cards, white papers, etc.
These documents deal with special applications or background information on particular topics.
See www.rohde-schwarz.com/application/FSW
6User Manual 1173.9386.02 ─ 19

R&S®FSW-K10x (LTE Uplink)
1.2 Conventions used in the documentation
1.2.1 Typographical conventions
The following text markers are used throughout this documentation:
Convention Description
Preface
Conventions used in the documentation
"Graphical user interface elements"
[Keys] Key and knob names are enclosed by square brackets.
Filenames, commands,
program code
Input Input to be entered by the user is displayed in italics.
Links Links that you can click are displayed in blue font.
"References" References to other parts of the documentation are enclosed by quota-
All names of graphical user interface elements on the screen, such as
dialog boxes, menus, options, buttons, and softkeys are enclosed by
quotation marks.
Filenames, commands, coding samples and screen output are distinguished by their font.
tion marks.
1.2.2 Conventions for procedure descriptions
When operating the instrument, several alternative methods may be available to perform the same task. In this case, the procedure using the touchscreen is described.
Any elements that can be activated by touching can also be clicked using an additionally connected mouse. The alternative procedure using the keys on the instrument or
the on-screen keyboard is only described if it deviates from the standard operating procedures.
The term "select" may refer to any of the described methods, i.e. using a finger on the
touchscreen, a mouse pointer in the display, or a key on the instrument or on a keyboard.
1.2.3 Notes on screenshots
When describing the functions of the product, we use sample screenshots. These
screenshots are meant to illustrate as many as possible of the provided functions and
possible interdependencies between parameters. The shown values may not represent
realistic usage scenarios.
The screenshots usually show a fully equipped product, that is: with all options installed. Thus, some functions shown in the screenshots may not be available in your particular product configuration.
7User Manual 1173.9386.02 ─ 19

R&S®FSW-K10x (LTE Uplink)
2 Welcome to the LTE measurement applica-
tion
The R&S FSW-K101, -K103 and -K105 are firmware applications that add functionality
to perform measurements on LTE signals according to the 3GPP standard to the
R&S FSW.
This user manual contains a description of the functionality that the application provides, including remote control operation. Functions that are not discussed in this manual are the same as in the Spectrum application and are described in the R&S FSW
User Manual. The latest versions of the manuals are available for download at the
product homepage.
https://www.rohde-schwarz.com/manual/fsw.
● Overview of the LTE applications..............................................................................8
● Installation...............................................................................................................10
● Starting the LTE measurement application............................................................. 10
● Understanding the display information....................................................................11
Welcome to the LTE measurement application
Overview of the LTE applications
2.1 Overview of the LTE applications
You can equip the R&S FSW with one or more LTE applications. Each of the applications provides functionality for specific measurement tasks.
R&S FSW-K100
The R&S FSW-K100 is designed to measure LTE FDD signals on the downlink.
The application has the following features:
●
Basic signal characteristics (like frequency, channel bandwidth or cyclic prefix).
●
Demodulation and configuration of the PDSCH transmitted over a single antenna
and without precoding functionality.
●
Characteristics of the Synchronization and Reference signals.
●
Consideration of various control channels in the measurement (for example the
PBCH or the PPDCH).
●
Analysis of individual antennas in a MIMO setup.
●
Tools to refine and filter the measurement results.
●
Various result displays that show the measured signal characteristics in a diagram
or a numeric result table.
●
Available measurements: EVM, ACLR and SEM.
R&S FSW-K101
The R&S FSW-K101 is designed to measure LTE FDD signals on the uplink.
8User Manual 1173.9386.02 ─ 19

R&S®FSW-K10x (LTE Uplink)
The application has the following features:
●
Basic signal characteristics (like frequency, channel bandwidth or cyclic prefix).
●
Demodulation and configuration of the subframes transmitted over a single
antenna.
●
Characteristics of the demodulation and sounding reference signals.
●
Consideration of the PUSCH, PUCCH and PRACH channels.
●
Analysis of individual antennas in a MIMO setup.
●
Tools to refine and filter the measurement results.
●
Various result displays that show the measured signal characteristics in a diagram
or a numeric result table.
●
Available measurements: EVM, ACLR and SEM.
R&S FSW-K102
The R&S FSW-K102 is designed to measure LTE Advanced systems and MIMO systems on the downlink.
Note that this application only works in combination with either R&S FSW-K100 or K104.
Welcome to the LTE measurement application
Overview of the LTE applications
The application has the following features:
●
Support of 1024QAM modulation.
●
Simultaneous (or consecutive) capture and subsequent analysis of the data
streams of several antennas.
●
Control of several analyzers required for MIMO measurements.
●
Consideration of the precoding schemes defined in the 3GPP standard.
●
Support of carrier aggregation.
●
Measurements on multimedia broadcast single frequency networks (MBSFNs).
●
Additional measurements: time alignment error, multi-carrier ACLR, cumulative
ACLR and multi-SEM.
R&S FSW-K103
The R&S FSW-K103 is designed to measure LTE Advanced systems on the uplink.
Note that this application only works in combination with either R&S FSW-K101 or K105.
The application has the following features:
●
Support of 256QAM modulation.
●
Simultaneous (or consecutive) capture and subsequent analysis of the data
streams of several antennas.
●
Control of several analyzers required for MIMO measurements.
●
Consideration of the enhanced PUSCH and PUCCH characteristics.
●
Support of carrier aggregation.
●
Additional measurements: time alignment error, multi-carrier ACLR and multi SEM.
9User Manual 1173.9386.02 ─ 19
R&S®FSW-K10x (LTE Uplink)
R&S FSW-K104
The R&S FSW-K104 is designed to measure LTE TDD signals on the downlink.
The features are basically the same as in the R&S FSW-K100 with additional features
that allow you to configure TDD subframes. It also provides tools to measure the
On/Off Power.
R&S FSW-K105
The R&S FSW-K105 is designed to measure LTE TDD signals on the uplink.
The features are basically the same as in the R&S FSW-K101 with additional features
that allow you to configure TDD subframes.
2.2 Installation
Find detailed installing instructions in the Getting Started or the release notes of the
R&S FSW.
Welcome to the LTE measurement application
Starting the LTE measurement application
2.3 Starting the LTE measurement application
The LTE measurement application adds a new application to the R&S FSW.
To activate the application
1. Press the [MODE] key on the front panel of the R&S FSW.
A dialog box opens that contains all operating modes and applications currently
available on your R&S FSW.
2. Select the "LTE" item.
The R&S FSW opens a new measurement channel for the LTE measurement
application.
LTE PC software and LTE measurement application
If you are using the EUTRA/LTE PC Software in combination with an R&S FSW, the
"Mode" dialog box also contains a item for this software. It is labeled "LTE Software"
and opens the PC software on the R&S FSW.
A comprehensive description of the functionality of this software is provided in a separate manual available for download on the internet.
10User Manual 1173.9386.02 ─ 19
R&S®FSW-K10x (LTE Uplink)
The measurement is started immediately with the default settings. It can be configured
in the "Overview" dialog box, which is displayed when you select the "Overview" softkey from any menu.
For more information see Chapter 5, "Configuration", on page 48.
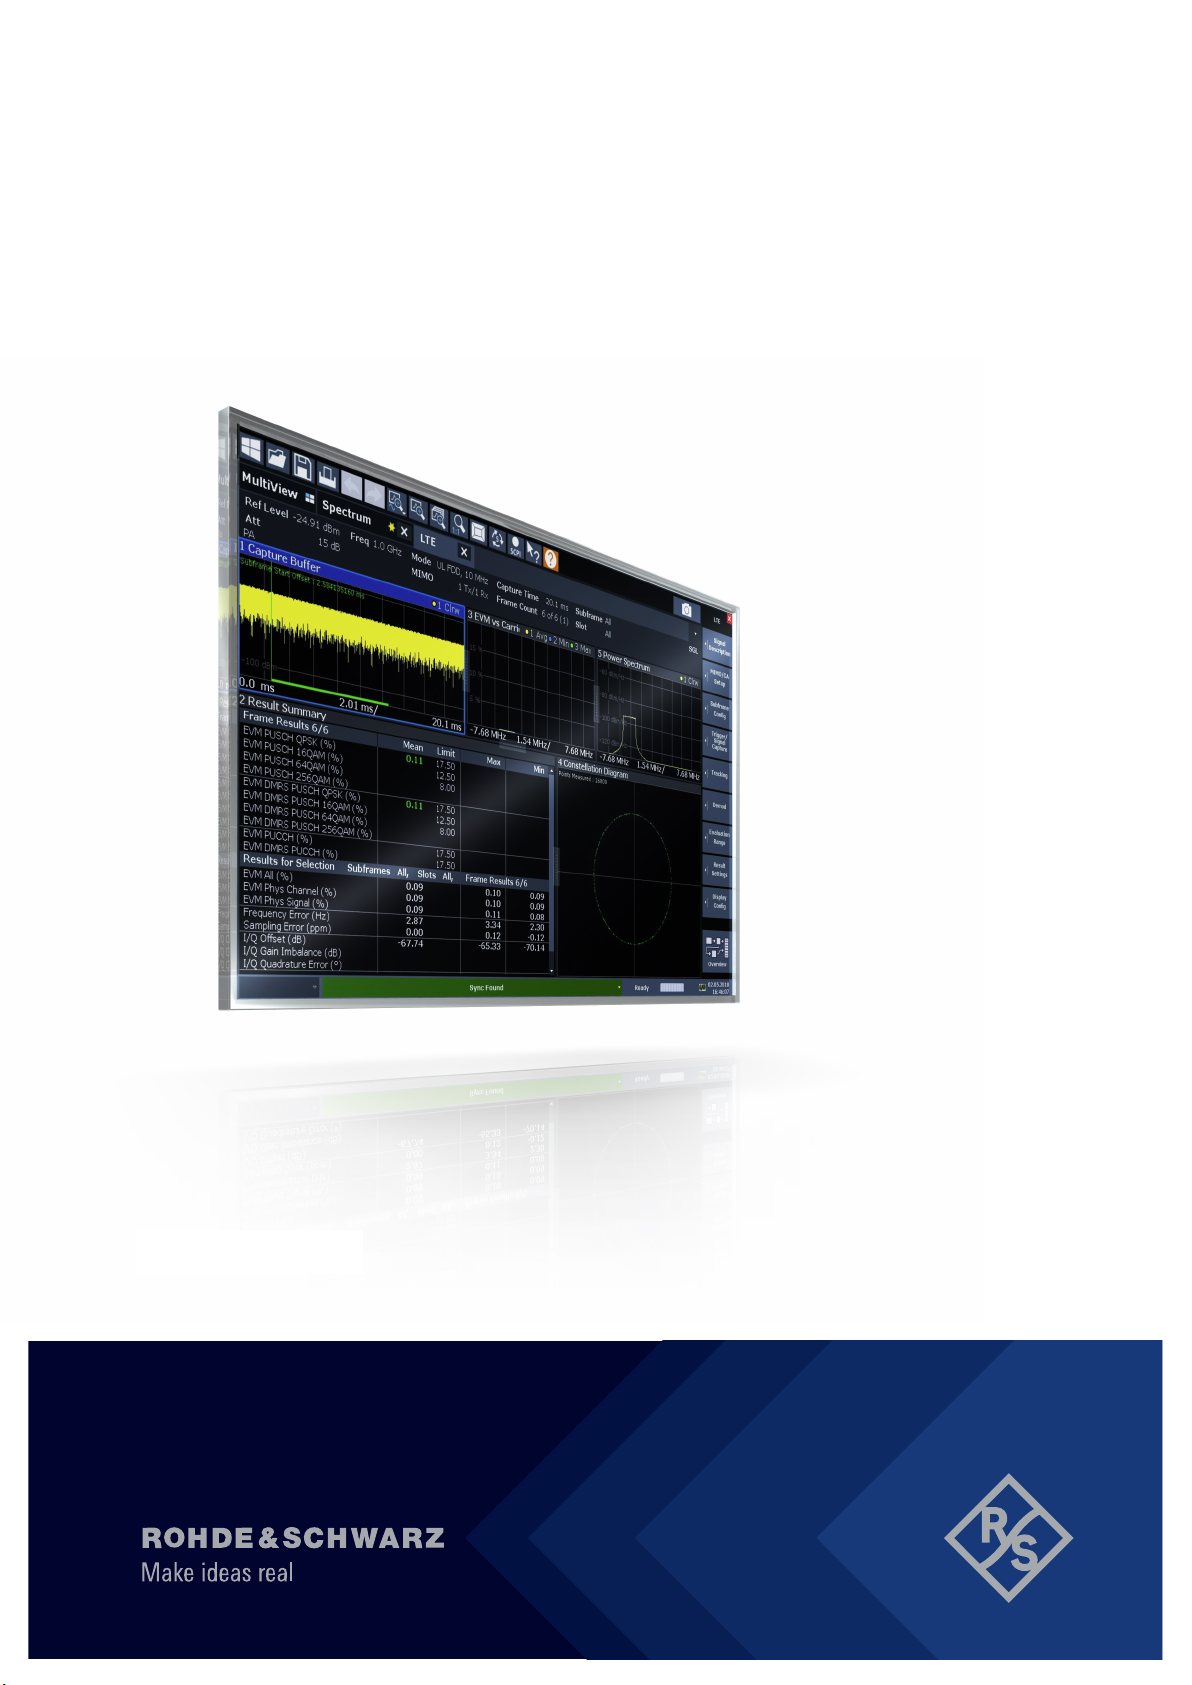
2.4 Understanding the display information
The following figure shows a measurement diagram during analyzer operation. All different information areas are labeled. They are explained in more detail in the following
sections.
1 2 3 4 5 6
Welcome to the LTE measurement application
Understanding the display information
1
= Toolbar
2 = Channel bar
3 = Diagram header
4 = Result display
5 = Tabs to select displayed information for multiple data streams
6 = Subwindows (if more than one data stream is displayed at the same time)
7 = Status bar
8 = Softkeys
7 8
11User Manual 1173.9386.02 ─ 19

R&S®FSW-K10x (LTE Uplink)
MSRA operating mode
In MSRA operating mode, additional tabs and elements are available. A colored background of the screen behind the measurement channel tabs indicates that you are in
MSRA operating mode. Frequency sweep measurements are not available in MSRA
operating mode.
For details on the MSRA operating mode see the R&S FSW MSRA User Manual.
Channel bar information
In the LTE measurement application, the R&S FSW shows the following settings:
Table 2-1: Information displayed in the channel bar in the LTE measurement application
Ref Level Reference level
Att Mechanical and electronic RF attenuation
Freq Frequency
Mode LTE standard
MIMO Number of Tx and Rx antennas in the measurement setup
Welcome to the LTE measurement application
Understanding the display information
Capture Time Signal length that has been captured
Frame Count Number of frames that have been captured
Selected Slot Slot considered in the signal analysis
Selected Subframe Subframe considered in the signal analysis
In addition, the channel bar also displays information on instrument settings that affect
the measurement results even though this is not immediately apparent from the display
of the measured values (e.g. transducer or trigger settings). This information is displayed only when applicable for the current measurement. For details see the
R&S FSW Getting Started manual.
Window title bar information
The information in the window title bar depends on the result display.
The "Constellation Diagram", for example, shows the number of points that have been
measured.
Status bar information
Global instrument settings, the instrument status and any irregularities are indicated in
the status bar beneath the diagram. Furthermore, the progress of the current operation
is displayed in the status bar.
Regarding the synchronization state, the application shows the following labels.
●
Sync OK
The synchronization was successful. The status bar is green.
●
Sync Failed
The synchronization was not successful. The status bar is red.
There can be three different synchronization errors.
12User Manual 1173.9386.02 ─ 19

R&S®FSW-K10x (LTE Uplink)
– Sync Failed (Cyclic Prefix): The cyclic prefix correlation failed.
– Sync Failed (P-SYNC): The P-SYNC correlation failed.
– Sync Failed (S-SYNC): The S-SYNC correlation failed.
Welcome to the LTE measurement application
Understanding the display information
13User Manual 1173.9386.02 ─ 19

R&S®FSW-K10x (LTE Uplink)
3 Measurements and result displays
The LTE measurement application measures and analyzes various aspects of an LTE
signal.
It features several measurements and result displays. Measurements represent different ways of processing the captured data during the digital signal processing. Result
displays are different representations of the measurement results. They may be diagrams that show the results as a graph or tables that show the results as numbers.
Remote command:
Measurement selection: CONFigure[:LTE]:MEASurement on page 173
Result display selection: LAYout:ADD[:WINDow]? on page 121
● Selecting measurements.........................................................................................14
● Selecting result displays..........................................................................................15
● Performing measurements......................................................................................16
● Selecting the operating mode................................................................................. 16
● I/Q measurements...................................................................................................17
● Time alignment error measurements...................................................................... 30
● Frequency sweep measurements...........................................................................32
● 3GPP test scenarios............................................................................................... 39
Measurements and result displays
Selecting measurements
3.1 Selecting measurements
Access: "Overview" > "Select Measurement"
The "Select Measurement" dialog box contains several buttons. Each button represents a measurement. A measurement in turn is a set of result displays that thematically belong together and that have a particular display configuration. If these predefined display configurations do not suit your requirements, you can add or remove
result displays as you like. For more information about selecting result displays, see
Chapter 3.2, "Selecting result displays", on page 15.
Depending on the measurement, the R&S FSW changes the way it captures and processes the raw signal data.
EVM
EVM measurements record, process and demodulate the signal's I/Q data. The result
displays available for EVM measurements show various aspects of the LTE signal
quality.
For EVM measurements, you can combine the result displays in any way.
For more information on the result displays, see Chapter 3.6, "Time alignment error
measurements", on page 30.
Remote command:
CONFigure[:LTE]:MEASurement on page 173
14User Manual 1173.9386.02 ─ 19

R&S®FSW-K10x (LTE Uplink)
Time alignment error
Time alignment error (TAE) measurements record, process and demodulate the signal's I/Q data. The result displays available for TAE measurements indicate how well
the antennas in a multi-antenna system are aligned.
For TAE measurements, you can combine the result displays in any way.
For more information on the result displays, see Chapter 3.6, "Time alignment error
measurements", on page 30.
Remote command:
CONFigure[:LTE]:MEASurement on page 173
Channel power ACLR
(inludes multi carrier ACLR and cumulative ACLR measurements)
ACLR measurements sweep the frequency spectrum instead of processing I/Q data.
The ACLR measurements evaluates the leakage ratio of neighboring channels and
evaluates if the signal is within the defined limits. The measurement provides several
result displays. You can combine the result displays in any way.
For more information on the result displays, see Chapter 3.7, "Frequency sweep mea-
surements", on page 32.
Remote command:
CONFigure[:LTE]:MEASurement on page 173
Measurements and result displays
Selecting result displays
SEM
(inlcudes multi carrier SEM measurements)
SEM measurements sweep the frequency spectrum instead of processing I/Q data.
The SEM measurements tests the signal against a spectrum emission mask and eval-
uates if the signal is within the defined limits. The measurement provides several result
displays. You can combine the result displays in any way.
For more information on the result displays, see Chapter 3.7, "Frequency sweep mea-
surements", on page 32.
Remote command:
CONFigure[:LTE]:MEASurement on page 173
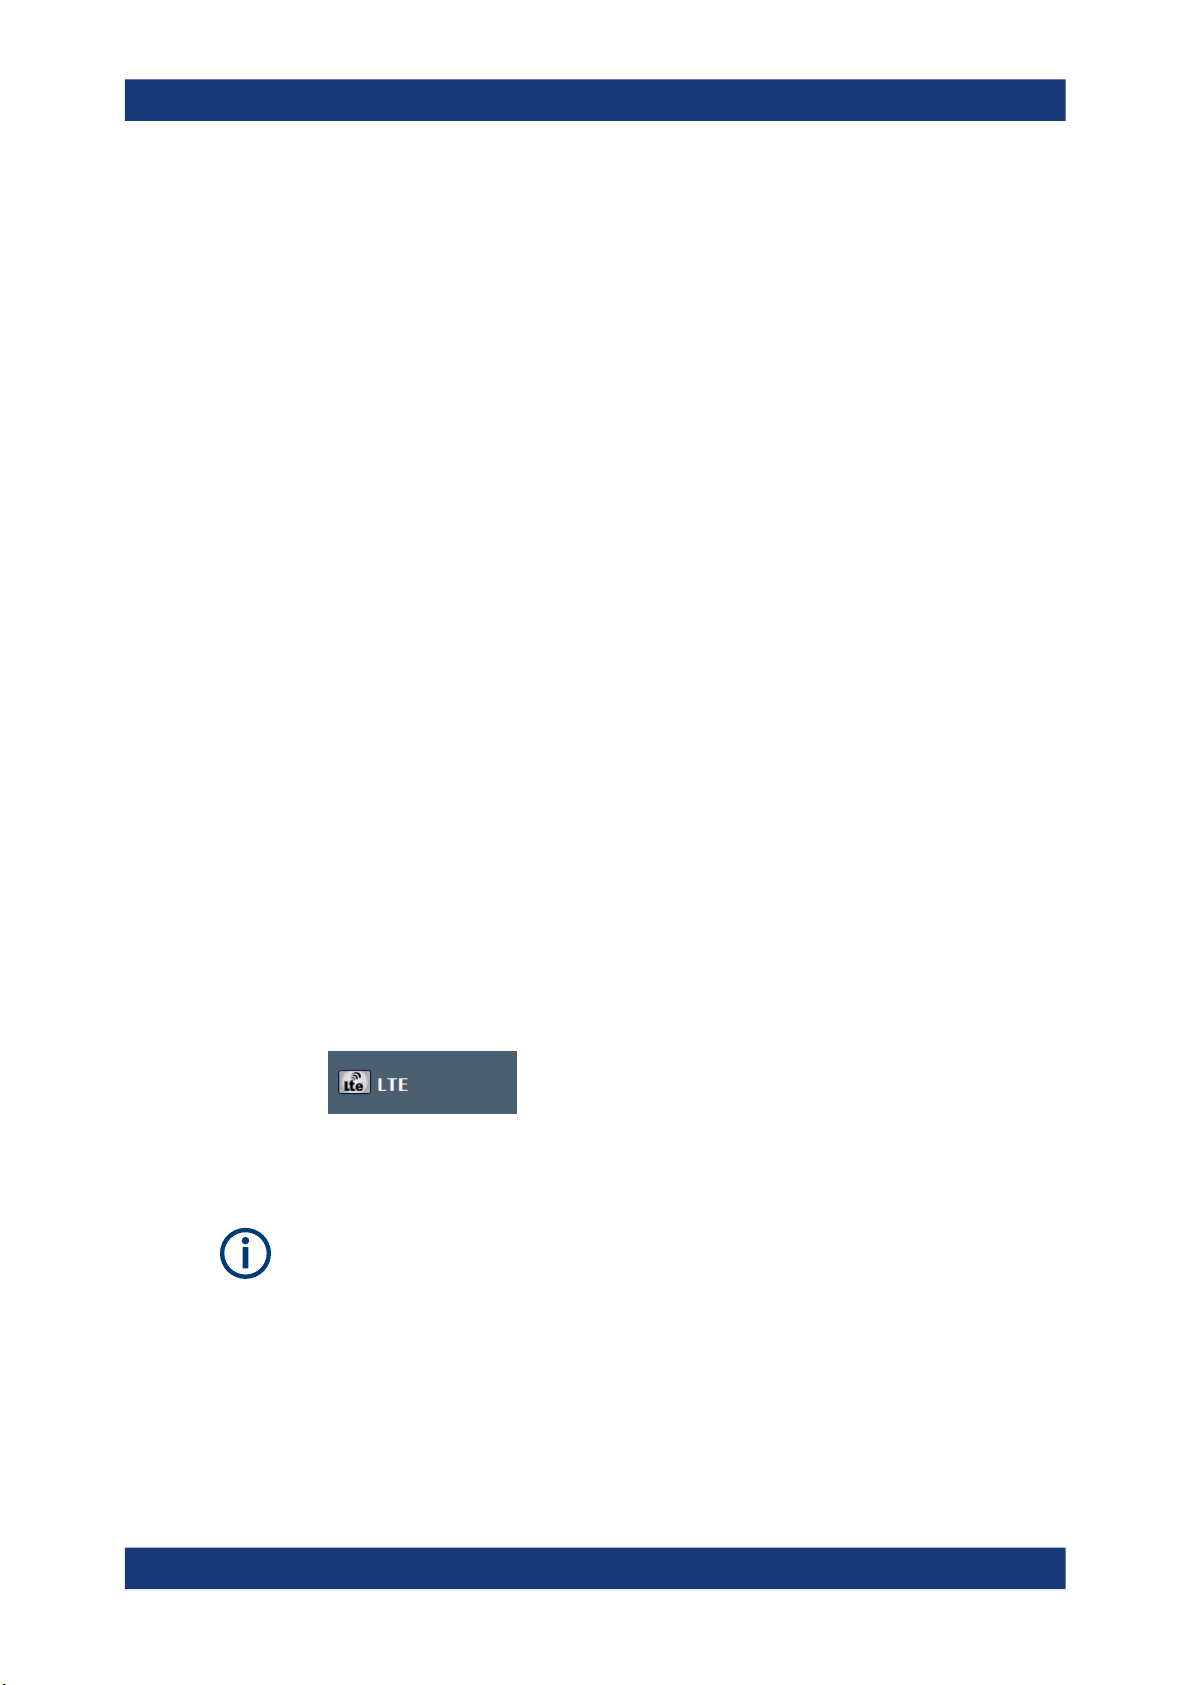
3.2 Selecting result displays
Access:
The R&S FSW opens a menu (the SmartGrid) to select result displays. For more information on the SmartGrid functionality, see the R&S FSW Getting Started.
In the default state of the application, it shows several conventional result displays.
●
Capture Buffer
●
EVM vs Carrier
●
Power Spectrum
●
Result Summary
15User Manual 1173.9386.02 ─ 19

R&S®FSW-K10x (LTE Uplink)
●
Constellation Diagram
From that predefined state, add and remove result displays as you like from the SmartGrid menu.
Remote command: LAYout:ADD[:WINDow]? on page 121
Measuring several data streams
When you capture more than one data stream (for example component carriers), each
result display is made up out of several tabs.
The first tab shows the results for all data streams. The other tabs show the results for
each individual data stream. By default, the tabs are coupled to one another - if you
select a certain data stream in one display, the application also selects this data stream
in the other result displays (see Subwindow Coupling).
The number of tabs depends on the number of data streams.
3.3 Performing measurements
Measurements and result displays
Selecting the operating mode
By default, the application measures the signal continuously. In "Continuous Sweep"
mode, the R&S FSW captures and analyzes the data again and again.
●
For I/Q measurements, the amount of captured data depends on the capture time.
●
For frequency sweep measurement, the amount of captured data depends on the
sweep time.
In "Single Sweep" mode, the R&S FSW stops measuring after it has captured the data
once. The amount of data again depends on the capture time.
Refreshing captured data
You can also repeat a measurement based on the data that has already been captured
with the "Refresh" function. Repeating a measurement with the same data can be useful, for example, if you want to apply different modulation settings to the same I/Q data.
For more information, see the documentation of the R&S FSW.
3.4 Selecting the operating mode
Access: [MODE] > "Multi-Standard Radio Analyzer Tab"
The LTE application is supported by the Multi Standard Radio Analyzer (MSRA).
The MSRA mode supports all I/Q measurements and result displays available with the
LTE application, except the frequency sweep measurements (SEM and ACLR).
In MSRA operating mode, only the MSRA primary actually captures data. The application receives an extract of the captured data for analysis, referred to as the application
data. The application data range is defined by the same settings used to define the
signal capture in "Signal and Spectrum Analyzer" mode. In addition, a capture offset
16User Manual 1173.9386.02 ─ 19

R&S®FSW-K10x (LTE Uplink)
can be defined, i.e. an offset from the start of the captured data to the start of the
analysis interval.
If a signal contains multiple data channels for multiple standards, separate applications
are used to analyze each data channel. Thus, it is of interest to know which application
is analyzing which data channel. The MSRA primary display indicates the data covered
by each application by vertical blue lines labeled with the application name. The blue
lines correspond to the channel bandwidth.
However, the individual result displays of the application need not analyze the complete data range. The data range that is actually analyzed by the individual result display is referred to as the analysis interval.
The analysis interval is automatically determined according to the Capture Time you
have defined. The analysis interval cannot be edited directly in the LTE application, but
is changed automatically when you change the evaluation range. The currently used
analysis interval (in seconds, related to capture buffer start) is indicated in the window
header for each result display.
A frequent question when analyzing multi-standard signals is how each data channel is
correlated (in time) to others. Thus, an analysis line has been introduced. The analysis
line is a common time marker for all MSRA secondary applications. It can be positioned in any MSRA secondary application or the MSRA primary and is then adjusted
in all other secondary applications. Thus, you can easily analyze the results at a specific time in the measurement in all secondary applications and determine correlations.
Measurements and result displays
I/Q measurements
If the marked point in time is contained in the analysis interval of the secondary application, the line is indicated in all time-based result displays, such as time, symbol, slot
or bit diagrams. By default, the analysis line is displayed, however, it can be hidden
from view manually. In all result displays, the "AL" label in the window title bar indicates
whether the analysis line lies within the analysis interval or not:
●
orange "AL": the line lies within the interval
●
white "AL": the line lies within the interval, but is not displayed (hidden)
●
no "AL": the line lies outside the interval
For details on the MSRA operating mode, see the R&S FSW MSRA documentation.
3.5 I/Q measurements
Access: [MEAS] > "EVM/Frequency Err/Power"
You can select the result displays from the evaluation bar and arrange them as you like
with the SmartGrid functionality.
Remote command:
Measurement selection: CONFigure[:LTE]:MEASurement on page 173
Result display selection: LAYout:ADD[:WINDow]? on page 121
17User Manual 1173.9386.02 ─ 19
R&S®FSW-K10x (LTE Uplink)
Capture Buffer...............................................................................................................18
EVM vs Carrier..............................................................................................................19
EVM vs Symbol.............................................................................................................19
EVM vs Subframe......................................................................................................... 20
Power Spectrum............................................................................................................20
Inband Emission............................................................................................................21
Spectrum Flatness........................................................................................................ 21
Spectrum Flatness SRS................................................................................................22
Group Delay..................................................................................................................22
Spectrum Flatness Difference.......................................................................................23
Constellation Diagram...................................................................................................23
CCDF............................................................................................................................ 24
Allocation Summary...................................................................................................... 24
Bitstream.......................................................................................................................25
EVM vs Symbol x Carrier..............................................................................................26
Power vs Symbol x Carrier............................................................................................26
Result Summary............................................................................................................26
Marker Table................................................................................................................. 29
Measurements and result displays
I/Q measurements
Capture Buffer
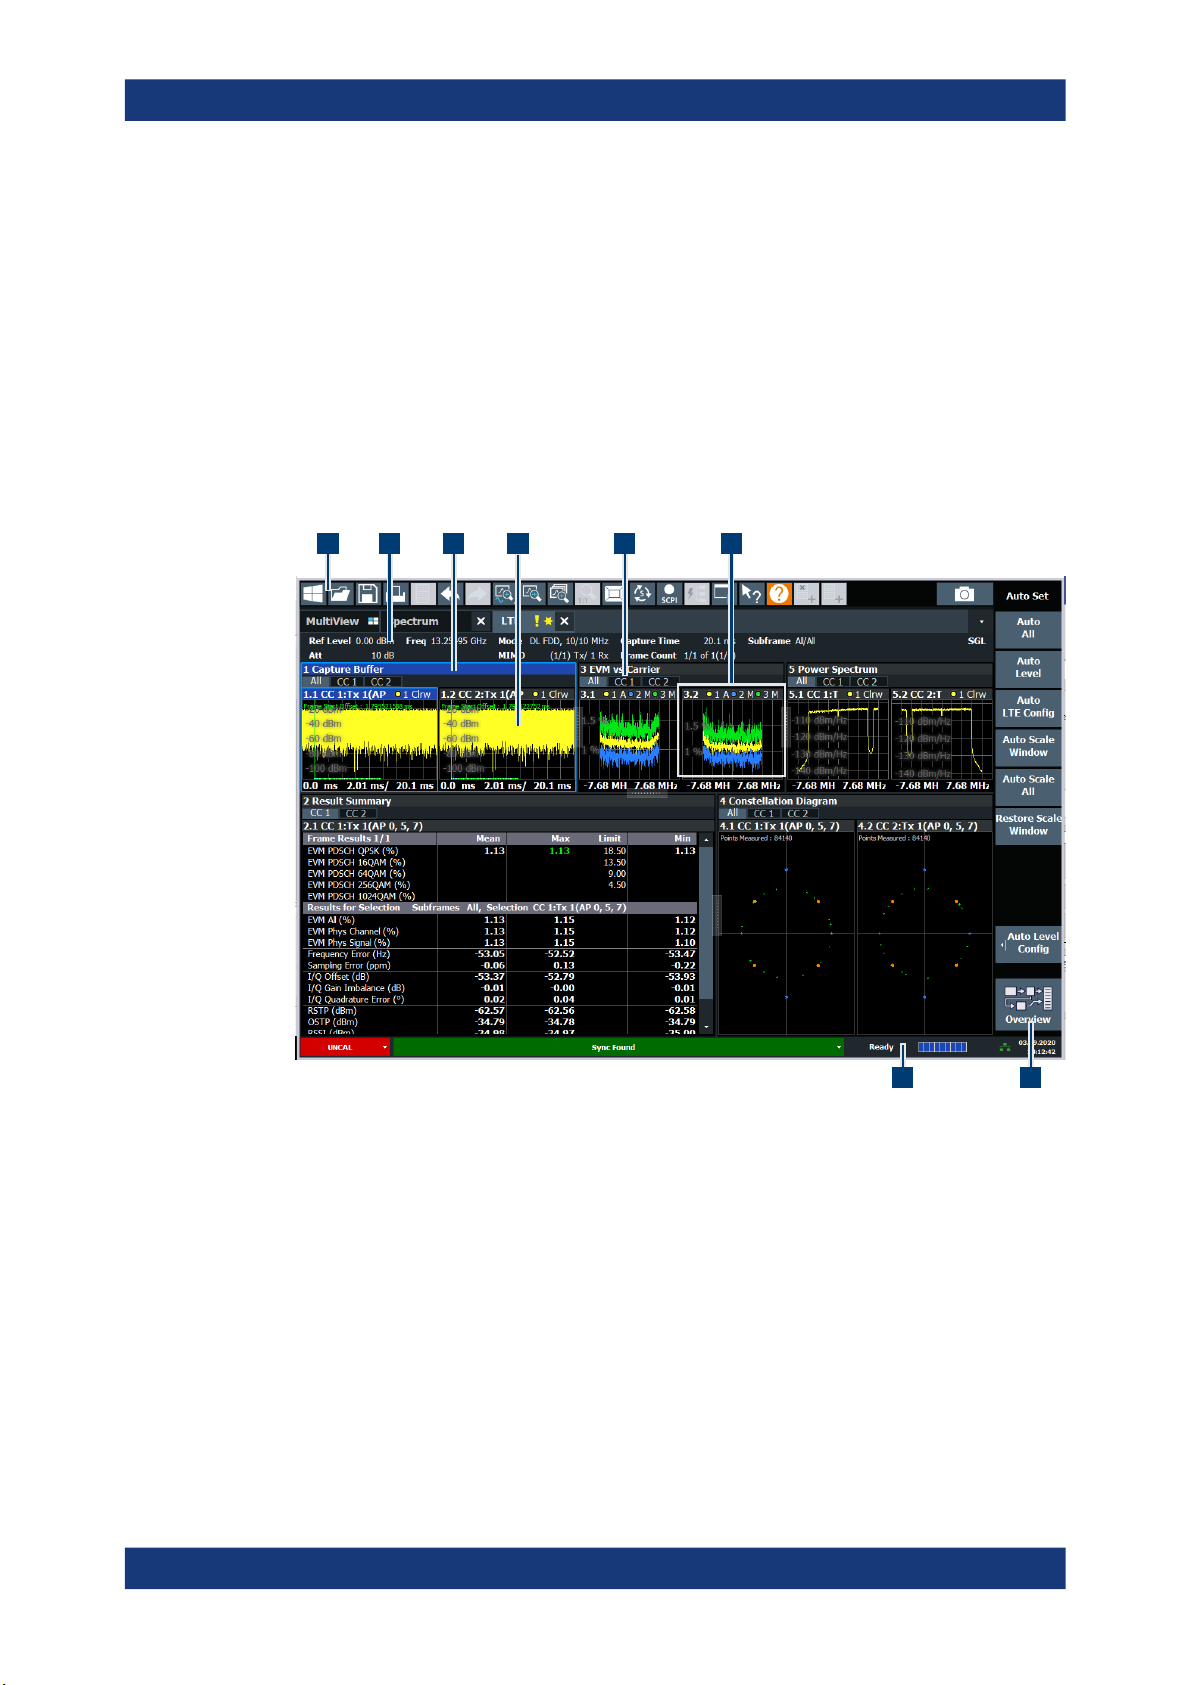
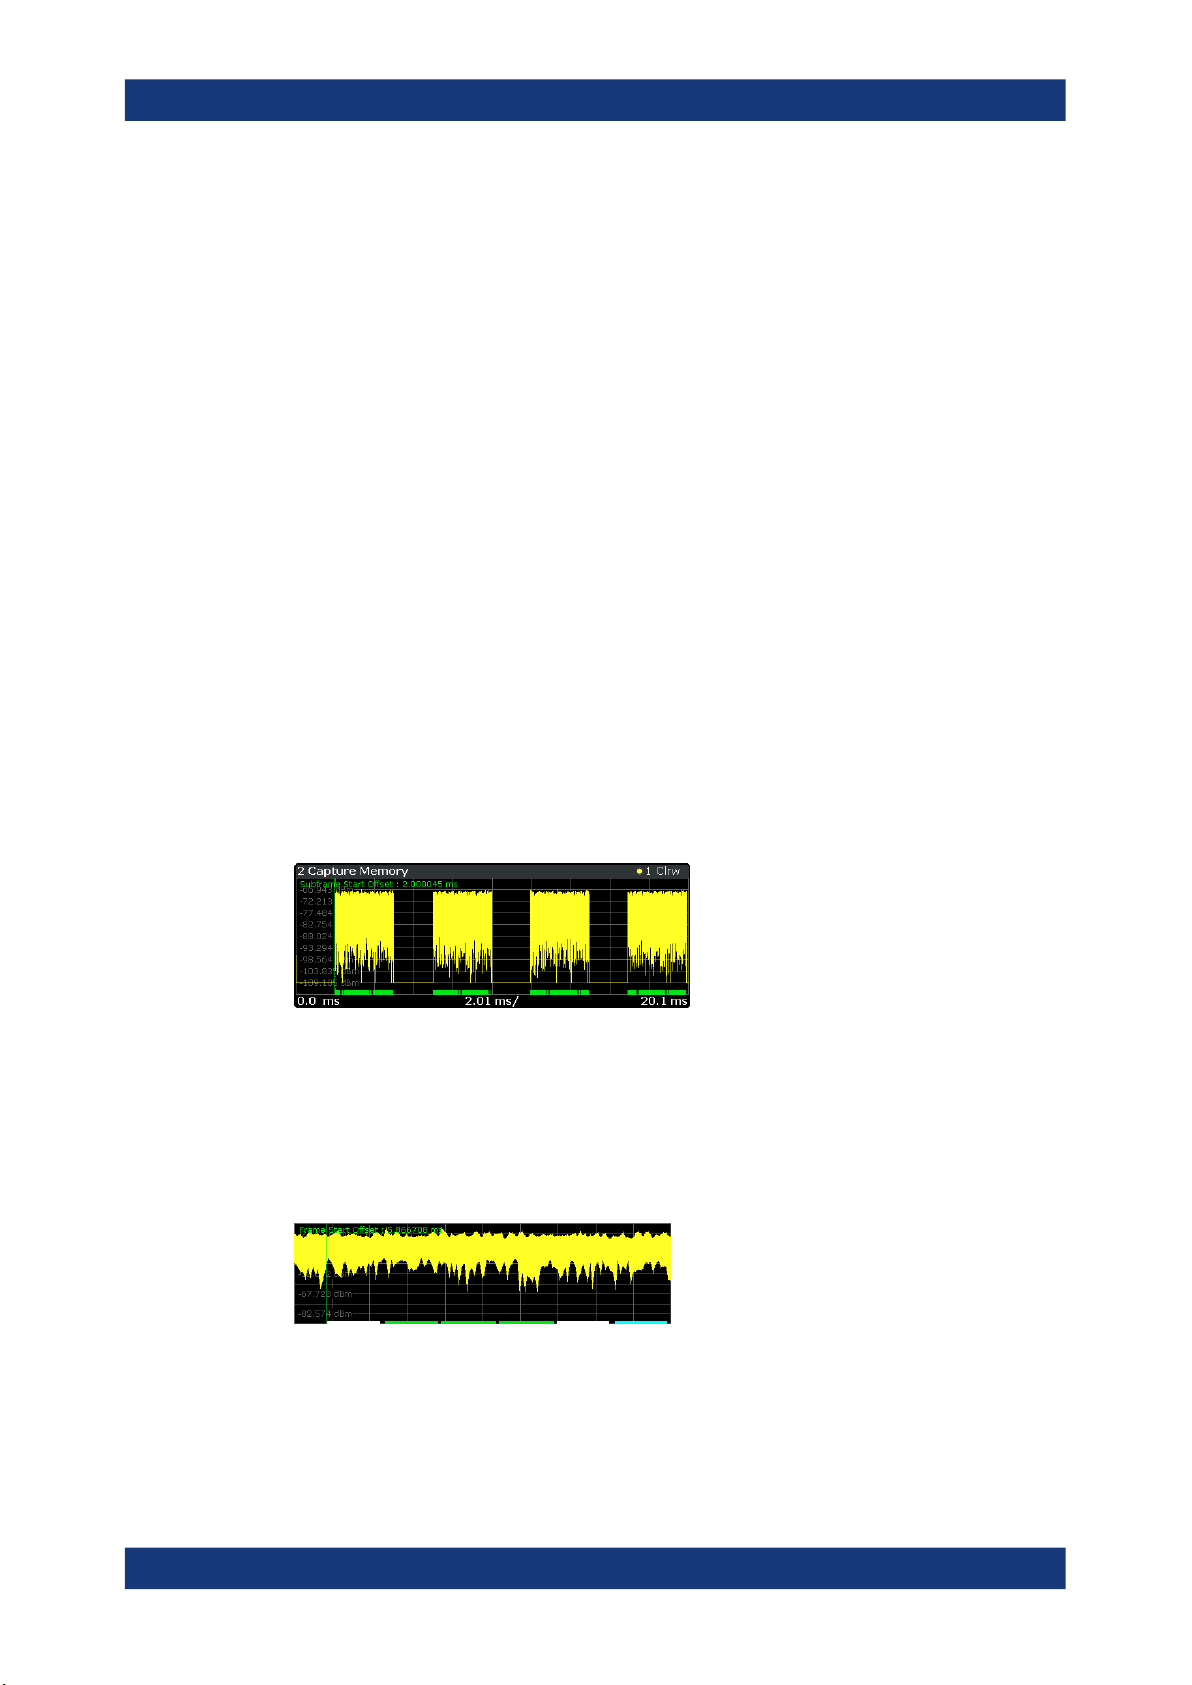
The "Capture Buffer" shows the complete range of captured data for the last data capture.
The x-axis represents time. The maximum value of the x-axis is equal to the Capture
Time.
The y-axis represents the amplitude of the captured I/Q data in dBm (for RF input).
Figure 3-1: Capture buffer without zoom
A green vertical line at the beginning of the green bar in the capture buffer represents
the subframe start. The diagram also contains the "Start Offset" value. This value is the
time difference between the subframe start and capture buffer start.
When you zoom into the diagram, you will see that the bar is interrupted at certain
positions. Each small bar indicates the useful parts of the OFDM symbol.
Figure 3-2: Capture buffer after a zoom has been applied
Remote command:
Selection: LAY:ADD ? '1',LEFT,CBUF
Query (y-axis): TRACe:DATA?
18User Manual 1173.9386.02 ─ 19

R&S®FSW-K10x (LTE Uplink)
Query (x-axis): TRACe<n>[:DATA]:X? on page 143
Subframe start offset: FETCh[:CC<cc>]:SUMMary:TFRame? on page 154
EVM vs Carrier
The "EVM vs Carrier" result display shows the error vector magnitude (EVM) of the
subcarriers. With the help of a marker, you can use it as a debugging technique to
identify any subcarriers whose EVM is too high.
The results are based on an average EVM that is calculated over the resource elements for each subcarrier. This average subcarrier EVM is determined for each analyzed slot in the capture buffer.
If you analyze all slots, the result display contains three traces.
●
Average EVM
This trace shows the subcarrier EVM, averaged over all slots.
●
Minimum EVM
This trace shows the lowest (average) subcarrier EVM that has been found over
the analyzed slots.
●
Maximum EVM
This trace shows the highest (average) subcarrier EVM that has been found over
the analyzed slots.
If you select and analyze one slot only, the result display contains one trace that shows
the subcarrier EVM for that slot only. Average, minimum and maximum values in that
case are the same. For more information, see "Slot Selection" on page 104.
The x-axis represents the center frequencies of the subcarriers. The y-axis shows the
EVM in % or in dB, depending on the EVM Unit.
Measurements and result displays
I/Q measurements
Remote command:
Selection LAY:ADD ? '1',LEFT,EVCA
Query (y-axis): TRACe:DATA?
Query (x-axis): TRACe<n>[:DATA]:X? on page 143
EVM vs Symbol
The "EVM vs Symbol" result display shows the error vector magnitude (EVM) of the
OFDM symbols. You can use it as a debugging technique to identify any symbols
whose EVM is too high.
The results are based on an average EVM that is calculated over all subcarriers that
are part of a certain OFDM symbol. This average OFDM symbol EVM is determined for
all OFDM symbols in each analyzed slot.
The x-axis represents the OFDM symbols, with each symbol represented by a dot on
the line. Any missing connections from one dot to another mean that the R&S FSW
could not determine the EVM for that symbol.
The number of displayed symbols depends on the subframe selection and the length of
the cyclic prefix.
19User Manual 1173.9386.02 ─ 19
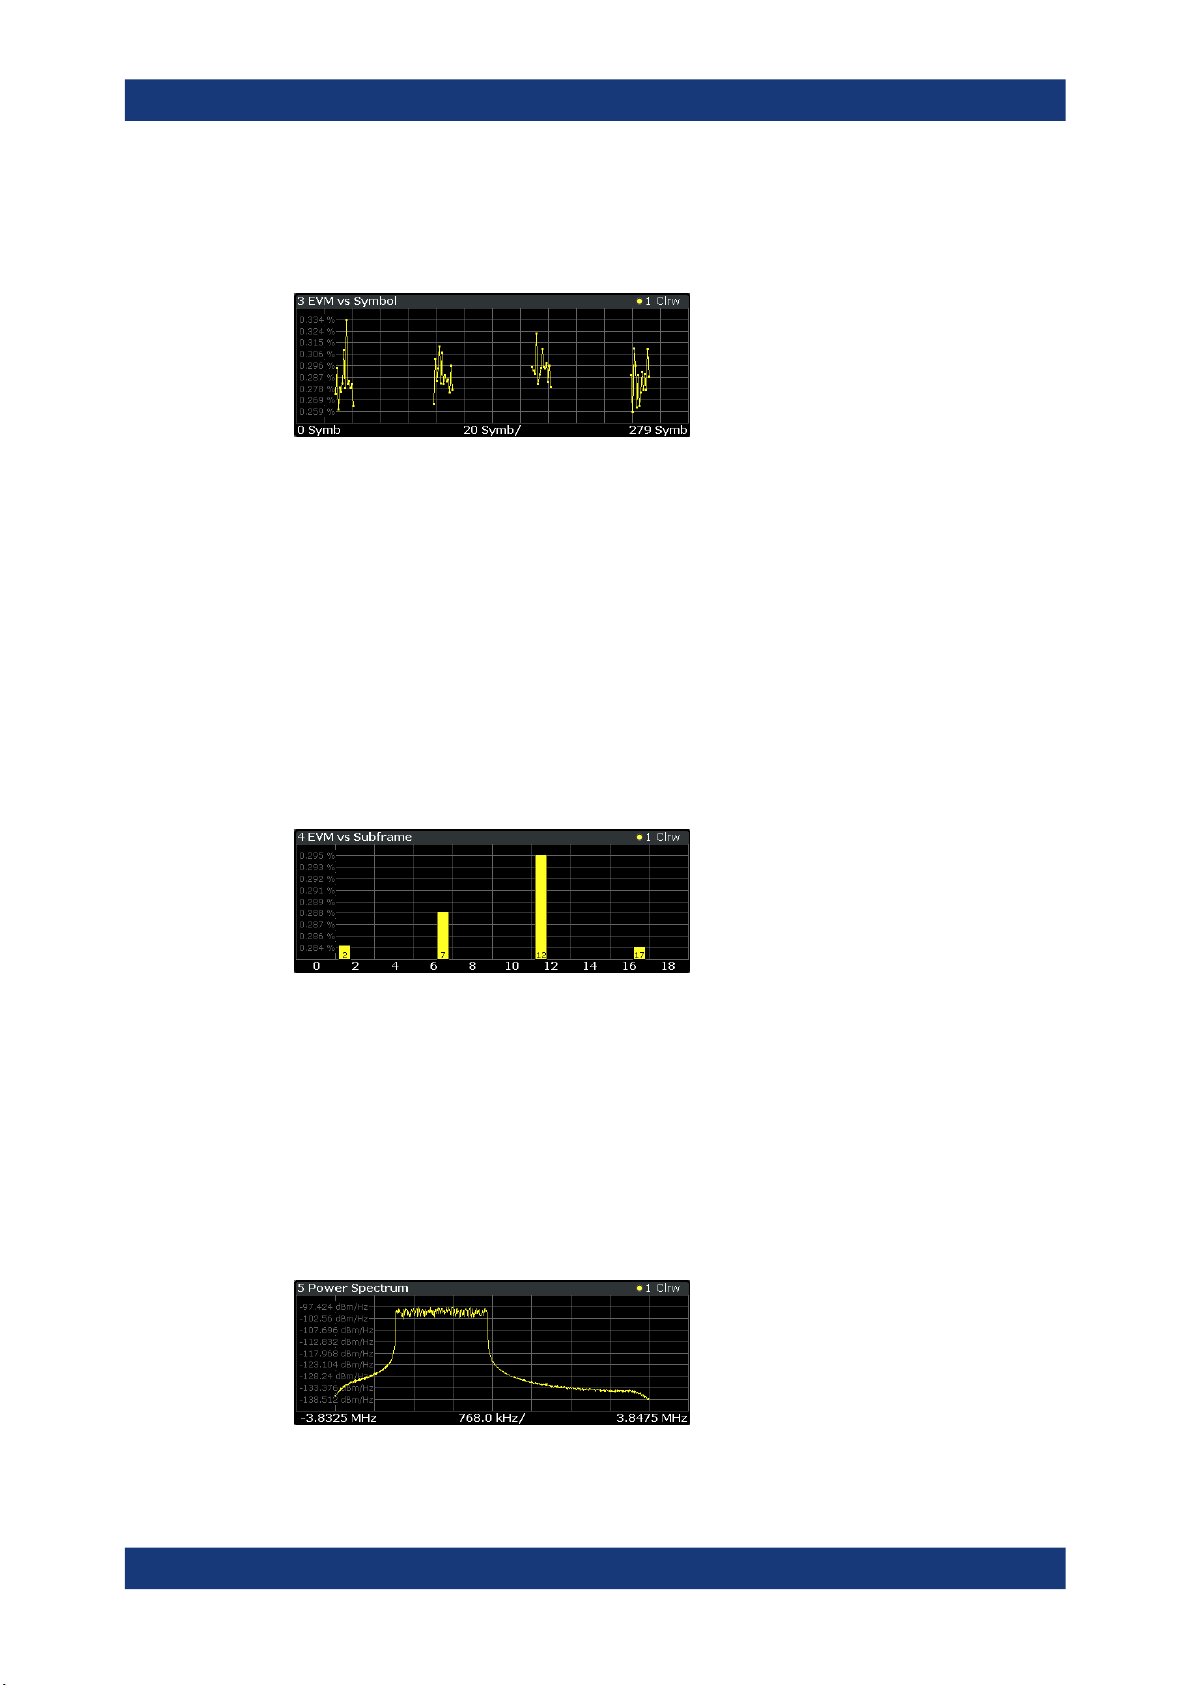
R&S®FSW-K10x (LTE Uplink)
For TDD signals, the result display does not show OFDM symbols that are not part of
the measured link direction.
On the y-axis, the EVM is plotted either in % or in dB, depending on the EVM Unit.
Remote command:
Selection: LAY:ADD ? '1',LEFT,EVSY
Query (y-axis): TRACe:DATA?
Query (x-axis): TRACe<n>[:DATA]:X? on page 143
EVM vs Subframe
The "EVM vs Subframe" result display shows the Error Vector Magnitude (EVM) for
each subframe. You can use it as a debugging technique to identify a subframe whose
EVM is too high.
The result is an average over all subcarriers and symbols of a specific subframe.
The x-axis represents the subframes, with the number of displayed subframes being
10.
On the y-axis, the EVM is plotted either in % or in dB, depending on the EVM Unit.
Measurements and result displays
I/Q measurements
Remote command:
Selection: LAY:ADD ? '1',LEFT,EVSU
Query (y-axis): TRACe:DATA?
Query (x-axis): TRACe<n>[:DATA]:X? on page 143
Power Spectrum
The "Power Spectrum" shows the power density of the complete capture buffer in
dBm/Hz.
The displayed bandwidth depends on the selected channel bandwidth.
The x-axis represents the frequency. On the y-axis, the power level is plotted.
20User Manual 1173.9386.02 ─ 19
R&S®FSW-K10x (LTE Uplink)
Remote command:
Selection: LAY:ADD ? '1',LEFT,PSPE
Query (y-axis): TRACe:DATA?
Query (x-axis): TRACe<n>[:DATA]:X? on page 143
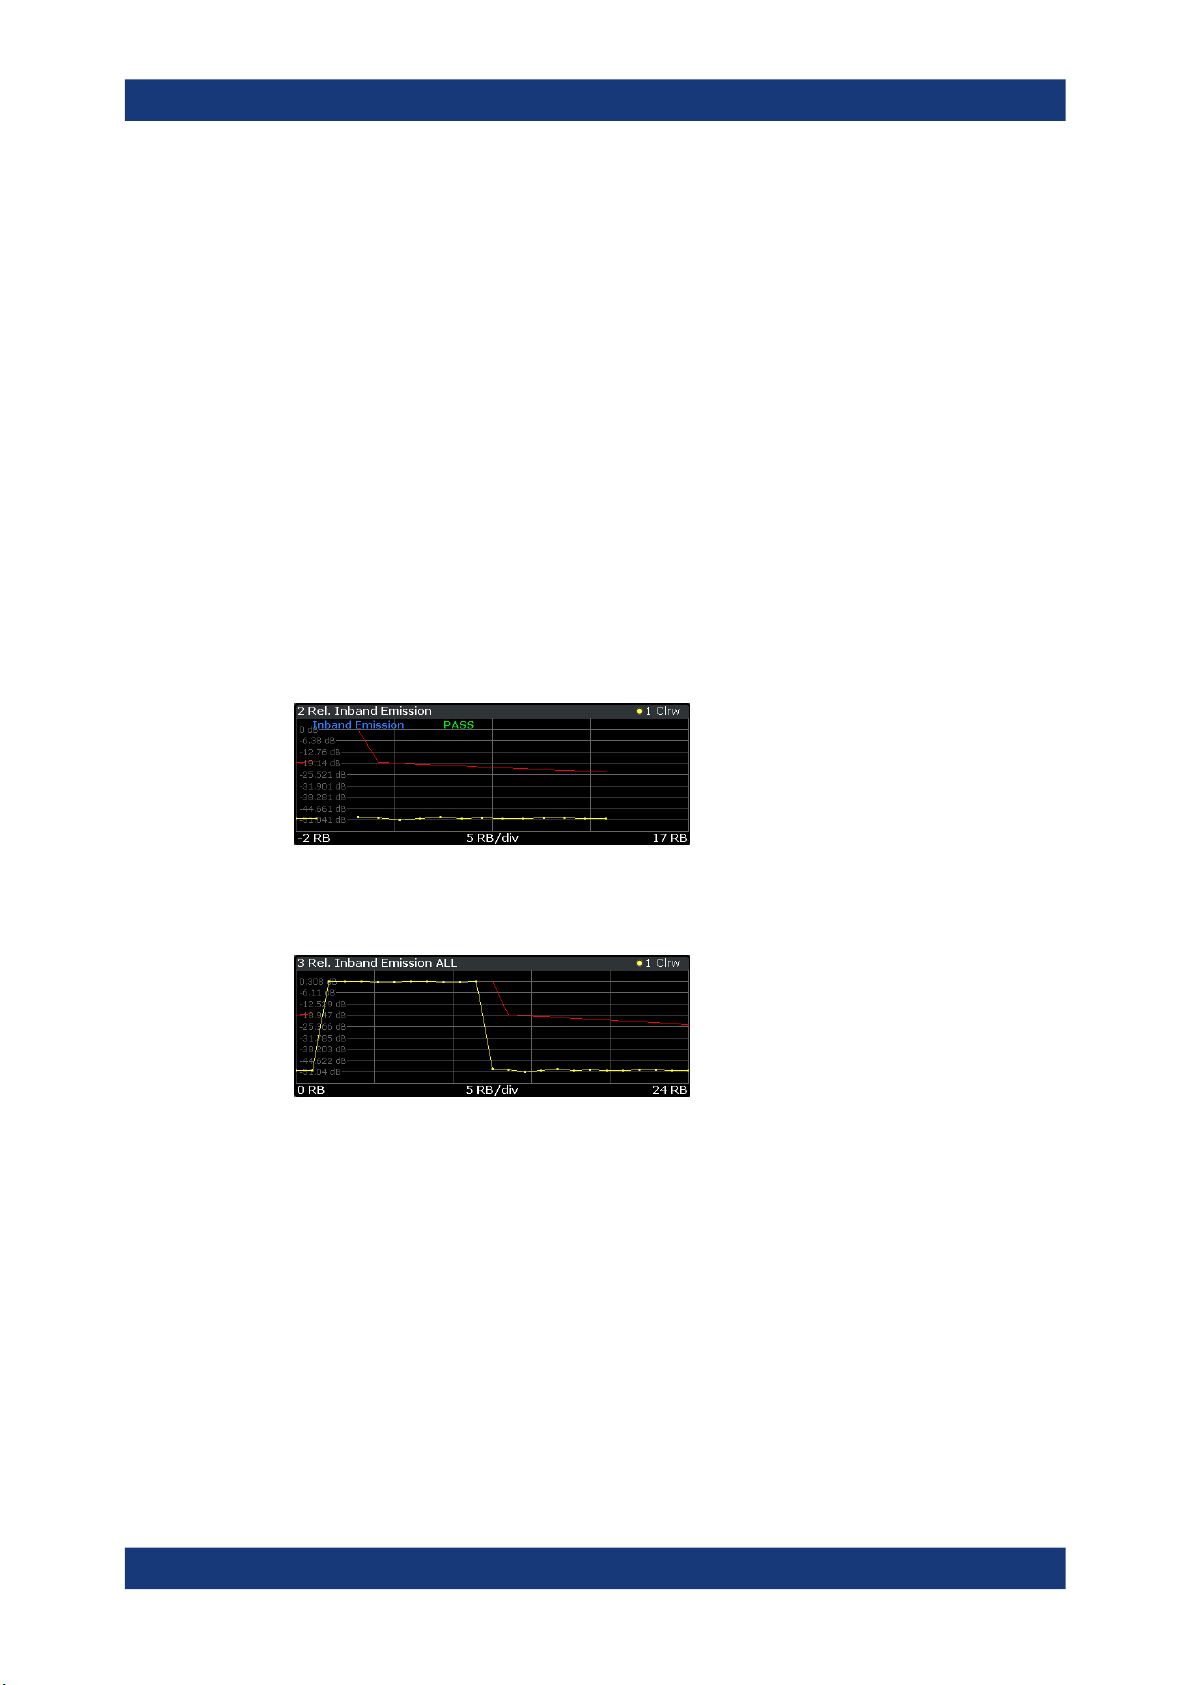
Inband Emission
The "Inband Emission" result display shows the power of the unused resource blocks
relative to the allocated resource blocks (yellow trace). The diagram also shows the
inband emission limit lines (red trace). The allocated resource blocks are not evaluated.
The x-axis represents the resource blocks. The numbering of the resource blocks is
based on 3GPP 38.521 as a function of the resource block offset from the edge of the
allocated uplink transmission bandwidth.
The y-axis shows the measured power for each resource block.
Because the measurement is evaluated over a single slot in the currently selected sub-
frame, you have to select a specific slot and subframe to get valid measurement
results.
Limits for the inband emission are specified in 3GPP 36.101.
Measurements and result displays
I/Q measurements
You can also display the inband emissions for the allocated resource block in addition
to the unused resource blocks when you select the "Inband Emissions All" result display.
Remote command:
Selection: LAY:ADD ? '1',LEFT,IE
Selection: LAY:ADD ? '1',LEFT,IEA
Query (y-axis): TRACe:DATA?
Query (x-axis): TRACe<n>[:DATA]:X? on page 143
Spectrum Flatness
The "Spectrum Flatness" result display shows the relative power offset caused by the
transmit channel.
The measurement is evaluated over the currently selected slot in the currently selected
subframe.
The currently selected subframe depends on your selection.
21User Manual 1173.9386.02 ─ 19
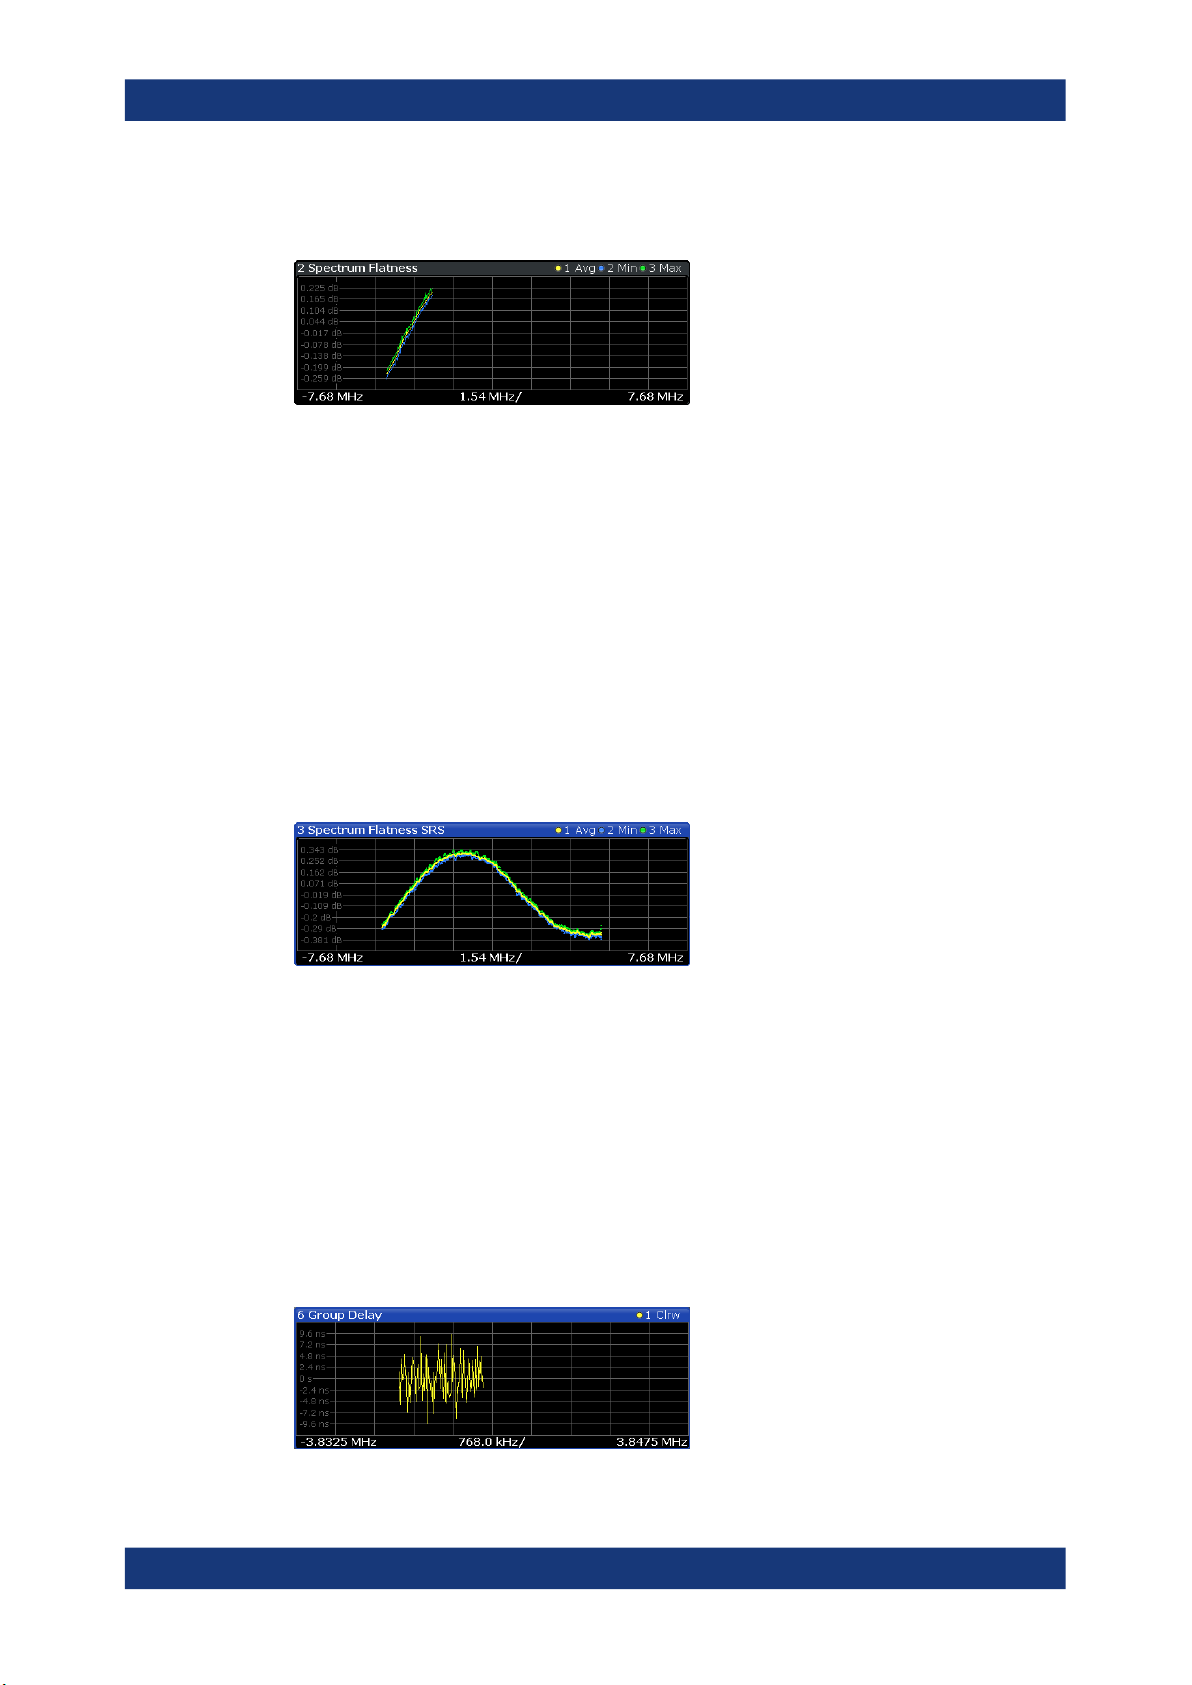
R&S®FSW-K10x (LTE Uplink)
The x-axis represents the frequency. On the y-axis, the channel flatness is plotted in
dB.
Note that the limit lines are only displayed if you match the Operating Band to the center frequency. Limits are defined for each operating band in the standard.
The shape of the limit line is different when "Extreme Conditions" on page 58 are on.
Remote command:
Selecting the result display: LAY:ADD ? '1',LEFT,SFL
Querying results:
TRACe:DATA?
TRACe<n>[:DATA]:X? on page 143
Measurements and result displays
I/Q measurements
Spectrum Flatness SRS
The "Spectrum Flatness SRS" display shows the amplitude of the channel transfer
function based on the sounding reference signal.
The measurement is evaluated over the currently selected slot in the currently selected
subframe. The slot and subframe selection may be changed in the general settings.
Remote command:
Selection: LAY:ADD ? '1',LEFT,SFSR
Query (y-axis): TRACe:DATA?
Query (x-axis): TRACe<n>[:DATA]:X? on page 143
Group Delay
This "Group Delay" shows the group delay of each subcarrier.
The measurement is evaluated over the currently selected slot in the currently selected
subframe.
The currently selected subframe depends on your selection.
The x-axis represents the frequency. On the y-axis, the group delay is plotted in ns.
22User Manual 1173.9386.02 ─ 19

R&S®FSW-K10x (LTE Uplink)
Remote command:
Selection: LAY:ADD ? '1',LEFT,GDEL
Query (y-axis): TRACe:DATA?
Query (x-axis): TRACe<n>[:DATA]:X? on page 143
Spectrum Flatness Difference
The "Spectrum Flatness Difference" result display shows the level difference in the
spectrum flatness result between two adjacent physical subcarriers.
The measurement is evaluated over the currently selected slot in the currently selected
subframe.
The currently selected subframe depends on your selection.
The x-axis represents the frequency. On the y-axis, the power is plotted in dB.
Measurements and result displays
I/Q measurements
Remote command:
Selection: LAY:ADD ? '1',LEFT,SFD
Query (y-axis): TRACe:DATA?
Query (x-axis): TRACe<n>[:DATA]:X? on page 143
Constellation Diagram
The "Constellation Diagram" shows the in-phase and quadrature phase results and is
an indicator of the quality of the modulation of the signal.
In the default state, the result display evaluates the full range of the measured input
data.
Each color represents a modulation type.
●
●
●
●
●
●
●
You can filter the results by changing the evaluation range.
: RBPSK
: MIXTURE
: QPSK
: 16QAM
: 64QAM
: 256QAM
: PSK (CAZAC)
The constellation diagram also contains information about the current evaluation
range, including the number of points that are displayed in the diagram.
23User Manual 1173.9386.02 ─ 19
R&S®FSW-K10x (LTE Uplink)
Remote command:
Selection: LAY:ADD ? '1',LEFT,CONS
Query: TRACe:DATA?
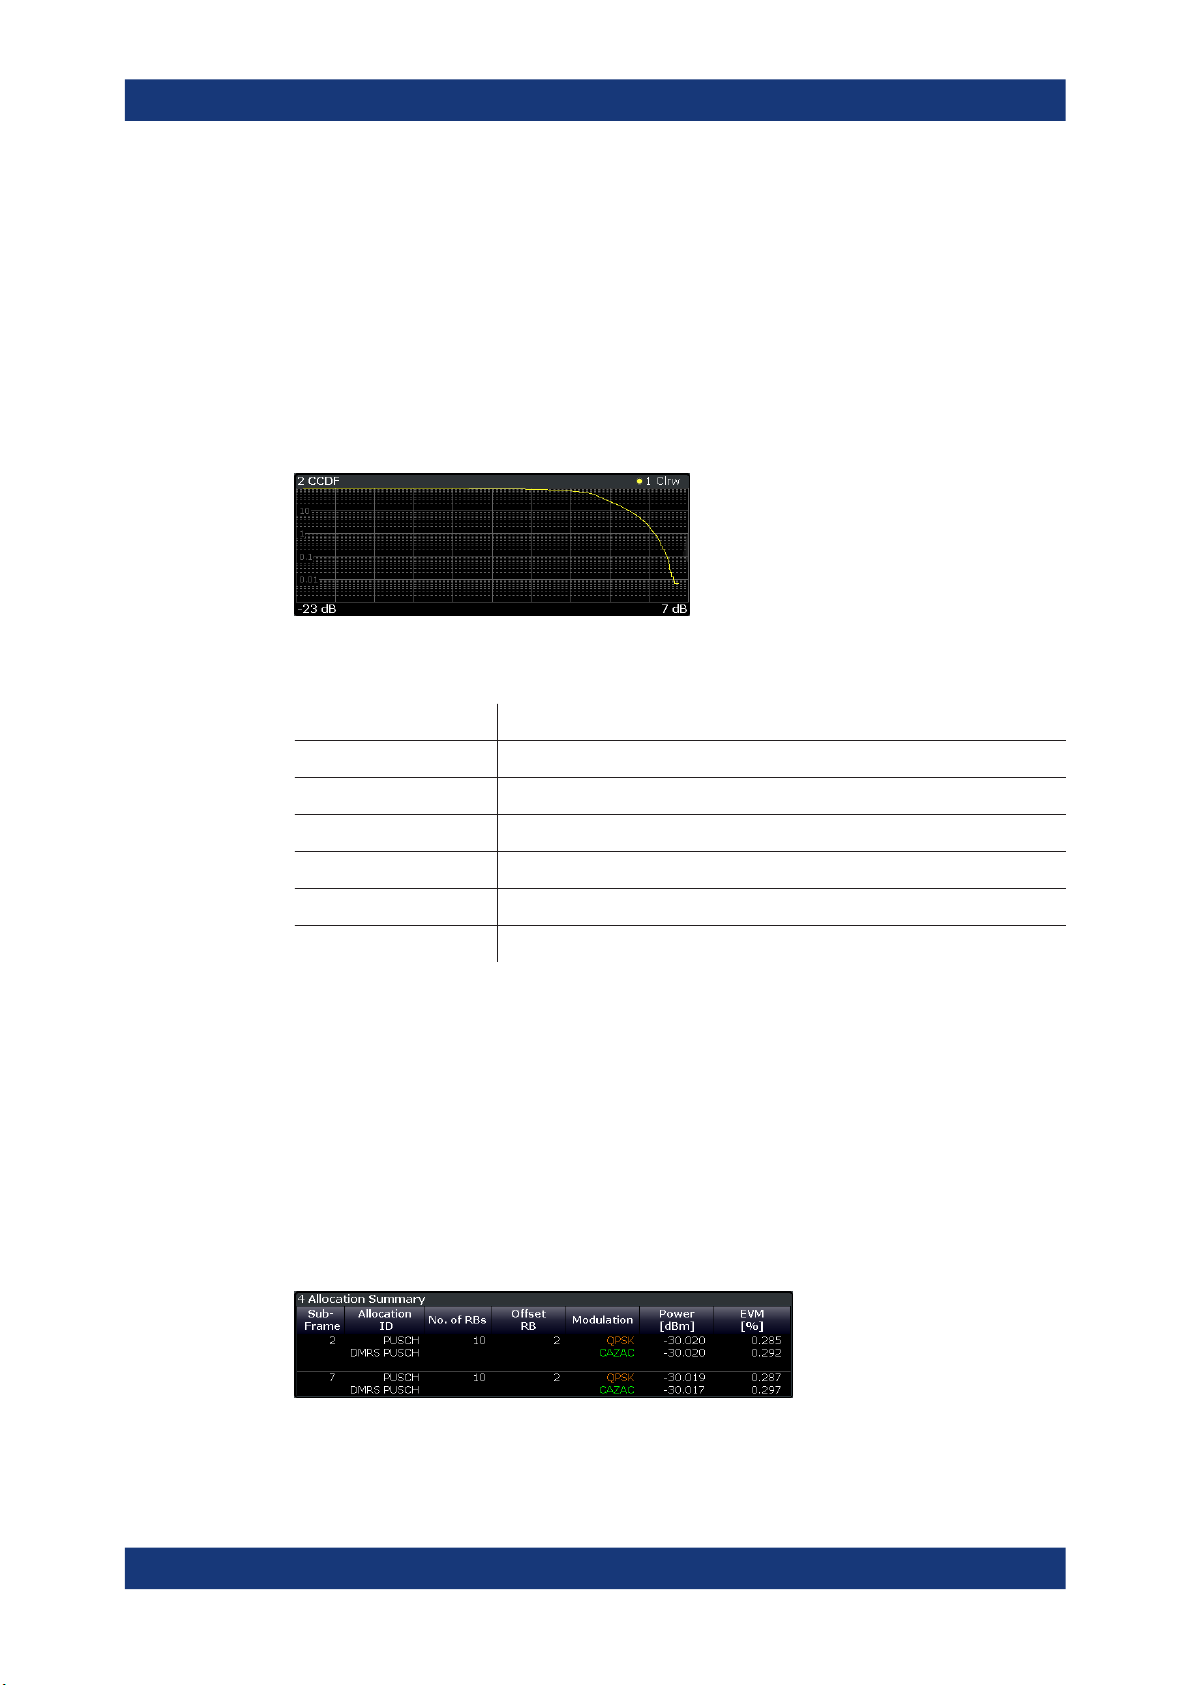
CCDF
The "Complementary Cumulative Distribution Function (CCDF)" shows the probability
of an amplitude exceeding the mean power. For the measurement, the complete capture buffer is used.
The x-axis represents the power relative to the measured mean power. On the y-axis,
the probability is plotted in %.
In addition to the diagram, the results for the CCDF measurement are summarized in
the CCDF table.
Measurements and result displays
I/Q measurements
Mean Mean power
Peak Peak power
Crest Crest factor (peak power – mean power)
10 % 10 % probability that the level exceeds mean power + [x] dB
1 % 1 % probability that the level exceeds mean power + [x] dB
0.1 % 0.1 % probability that the level exceeds mean power + [x] dB
0.01 % 0.01 % probability that the level exceeds mean power + [x] dB
Remote command:
Selection: LAY:ADD ? '1',LEFT,CCDF
Query (y-axis): TRACe:DATA?
Numerical results: CALCulate<n>:STATistics:CCDF:X<t>? on page 159
Numerical results: CALCulate<n>:STATistics:RESult<res>? on page 160
Allocation Summary
The "Allocation Summary" shows various parameters of the measured allocations in a
table.
Each row in the allocation table corresponds to an allocation. A set of several allocations make up a subframe. A horizontal line indicates the beginning of a new subframe.
The columns of the table show the following properties for each allocation.
●
The location of the allocation (subframe number).
24User Manual 1173.9386.02 ─ 19
R&S®FSW-K10x (LTE Uplink)
●
The ID of the allocation (channel type).
●
Number of resource blocks used by the allocation.
●
The resource block offset of the allocation.
●
The modulation of the allocation.
●
The power of the allocation in dBm.
●
The EVM of the allocation.
The unit depends on the EVM unit
Click once on the header row to open a dialog box that allows you to add and remove
columns.
Remote command:
Selection: LAY:ADD ? '1',LEFT,ASUM
Query: TRACe:DATA?
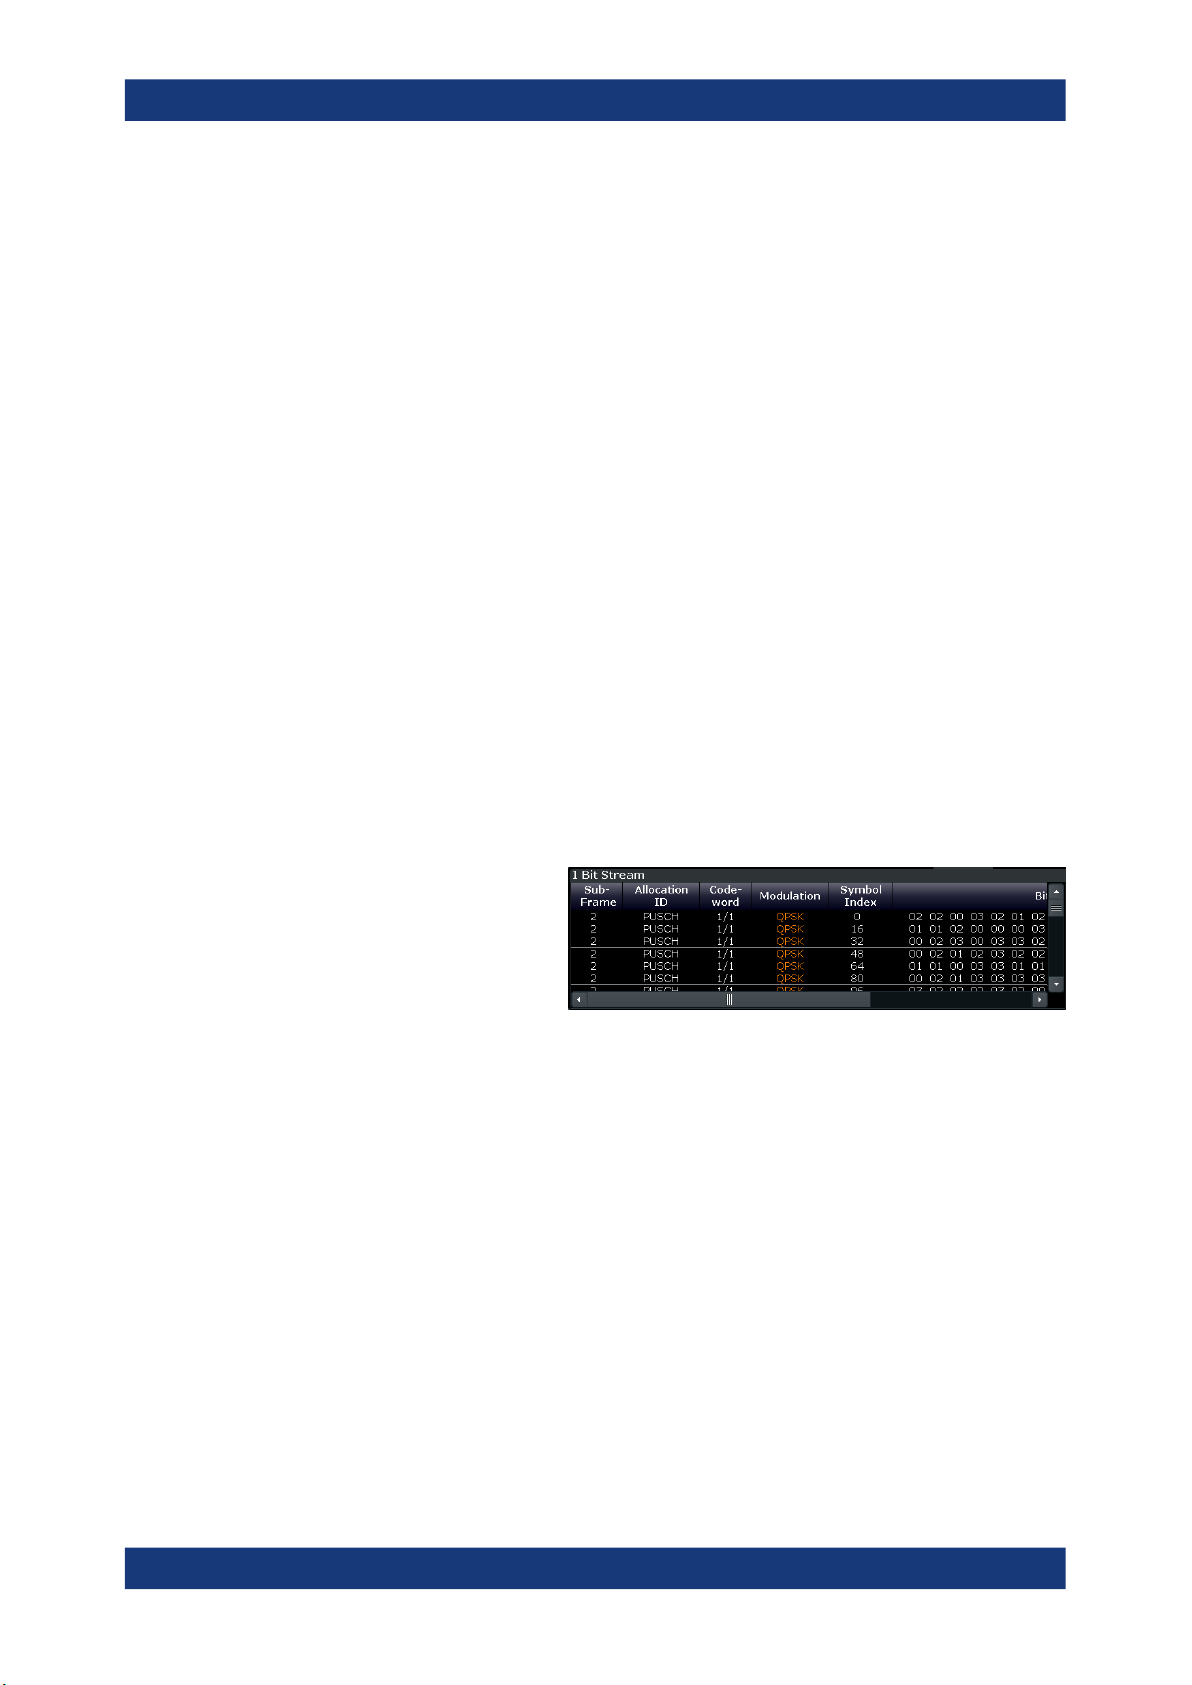
Bitstream
The "Bitstream" shows the demodulated data stream for the data allocations.
Depending on the bitstream format, the numbers represent either bits (bit order) or
symbols (symbol order).
●
For the bit format, each number represents one raw bit.
●
For the symbol format, the bits that belong to one symbol are shown as hexadecimal numbers with two digits.
Resource elements that do not contain data or are not part of the transmission are represented by a "-".
If a symbol could not be decoded because the number of layers exceeds the number
of receive antennas, the application shows a "#" sign.
Measurements and result displays
I/Q measurements
The table contains the following information:
●
Subframe
Number of the subframe the bits belong to.
●
Allocation ID
Channel the bits belong to.
●
Codeword
Code word of the allocation.
●
Modulation
Modulation type of the channels.
●
Symbol Index or Bit Index
Indicates the position of the table row's first bit or symbol within the complete
stream.
●
Bit Stream
The actual bit stream.
Remote command:
Selection: LAY:ADD ? '1',LEFT,BSTR
Query: TRACe:DATA?
25User Manual 1173.9386.02 ─ 19
R&S®FSW-K10x (LTE Uplink)
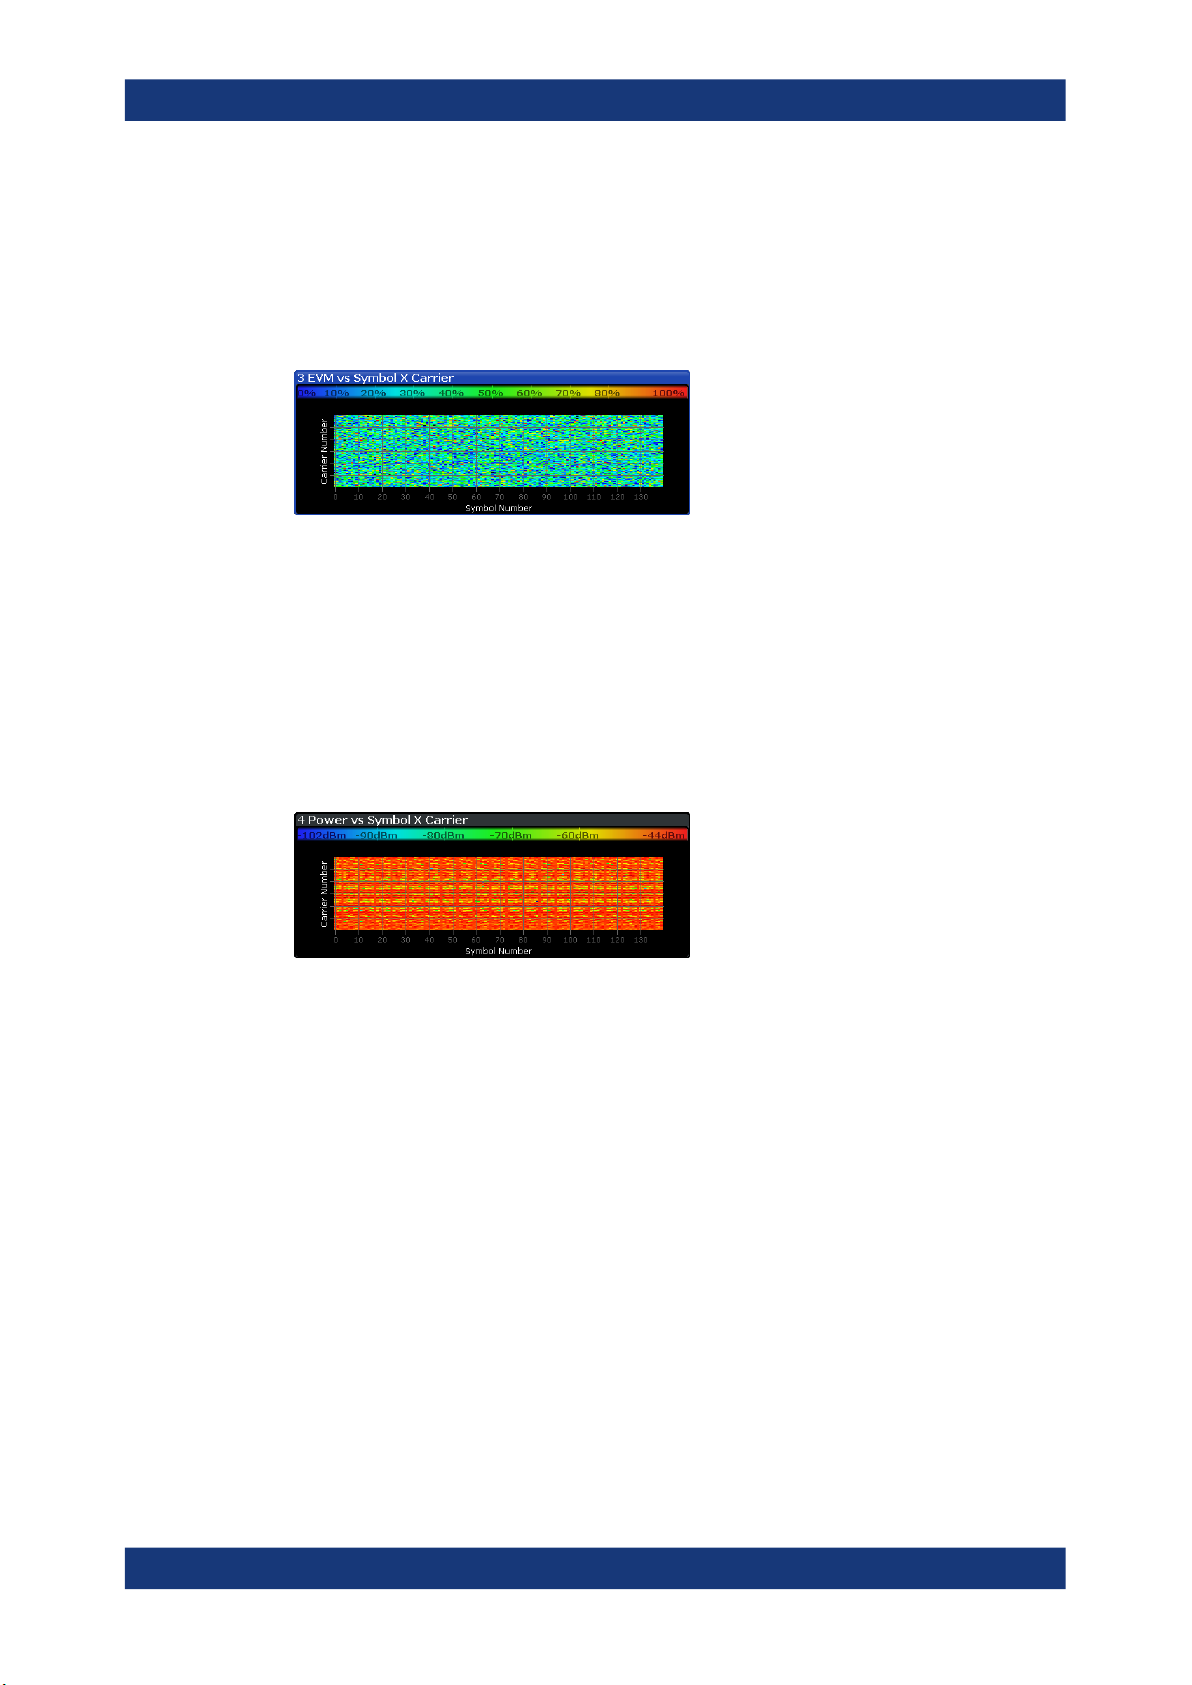
EVM vs Symbol x Carrier
The "EVM vs Symbol x Carrier" result display shows the EVM for each carrier in each
symbol.
The x-axis represents the symbols. The y-axis represents the subcarriers. Different colors in the diagram area represent the EVM. A color map in the diagram header indicates the corresponding power levels.
Remote command:
Selection: LAY:ADD ? '1',LEFT,EVSC
Query: TRACe:DATA?
Power vs Symbol x Carrier
The "Power vs Symbol x Carrier" result display shows the power for each carrier in
each symbol.
The x-axis represents the symbols. The y-axis represents the subcarriers. Different colors in the diagram area represent the power. A color map in the diagram header indicates the corresponding power levels.
Measurements and result displays
I/Q measurements
Remote command:
Selection: LAY:ADD ? '1',LEFT,PVSC
Query: TRACe:DATA?
Result Summary
The Result Summary shows all relevant measurement results in numerical form, combined in one table.
Remote command:
LAY:ADD ? '1',LEFT,RSUM
Contents of the result summary
The contents of the result summary depend on the analysis mode you have selected.
The first screenshot shows the results for "PUSCH/PUCCH" analysis mode, the second one those for "PRACH" analysis mode.
26User Manual 1173.9386.02 ─ 19

R&S®FSW-K10x (LTE Uplink)
Figure 3-3: Result summary in PUSCH/PUCCH analysis mode
Measurements and result displays
I/Q measurements
Figure 3-4: Result summary in PRACH analysis mode
The table is split in two parts. The first part shows results that refer to the complete
frame. It also indicates limit check results where available. The font of 'Pass' results is
green and that of 'Fail' results is red.
In addition to the red font, the application also puts a red star ( ) in front of
failed results.
The second part of the table shows results that refer to a specific selection of the
frame. The statistic is always evaluated over the slots. The header row of the table
contains information about the selection you have made (like the subframe).
Note: The EVM results on a frame level (first part of the table) are calculated as
defined by 3GPP at the edges of the cyclic prefix.
The other EVM results (lower part of the table) are calculated at the optimal timing
position in the middle of the cyclic prefix.
Because of inter-symbol interference, the EVM calculated at the edges of the cyclic
prefix is higher than the EVM calculated in the middle of the cyclic prefix.
By default, all EVM results are in %. To view the EVM results in dB, change the EVM
Unit.
Table 3-1: Result summary: part containing results as defined by 3GPP (PUSCH/PUCCH analysis)
EVM PUSCH QPSK Shows the EVM for all QPSK-modulated resource elements of the PUSCH
channel in the analyzed frame.
FETCh[:CC<cc>]:SUMMary:EVM:USQP[:AVERage]? on page 148
EVM PUSCH 16QAM Shows the EVM for all 16QAM-modulated resource elements of the PUSCH
channel in the analyzed frame.
FETCh[:CC<cc>]:SUMMary:EVM:USST[:AVERage]? on page 149
27User Manual 1173.9386.02 ─ 19

R&S®FSW-K10x (LTE Uplink)
EVM PUSCH 64QAM Shows the EVM for all 64QAM-modulated resource elements of the PUSCH
EVM PUSCH 256QAM Shows the EVM for all 256QAM-modulated resource elements of the PUSCH
EVM DMRS PUSCH QPSK Shows the EVM of all DMRS resource elements with QPSK modulation of the
EVM DMRS PUSCH 16QAM Shows the EVM of all DMRS resource elements with 16QAM modulation of
EVM DMRS PUSCH 64QAM Shows the EVM of all DMRS resource elements with 64QAM modulation of
Measurements and result displays
I/Q measurements
channel in the analyzed frame.
FETCh[:CC<cc>]:SUMMary:EVM:USSF[:AVERage]? on page 148
channel in the analyzed frame.
FETCh[:CC<cc>]:SUMMary:EVM:USTS[:AVERage]? on page 149
PUSCH in the analyzed frame.
FETCh[:CC<cc>]:SUMMary:EVM:SDQP[:AVERage]? on page 146
the PUSCH in the analyzed frame.
FETCh[:CC<cc>]:SUMMary:EVM:SDST[:AVERage]? on page 146
the PUSCH in the analyzed frame.
FETCh[:CC<cc>]:SUMMary:EVM:SDSF[:AVERage]? on page 146
EVM DMRS PUSCH
256QAM
EVM PUCCH Shows the EVM of all resource elements of the PUCCH channel in the ana-
EVM DMRS PUCCH Shows the EVM of all DMRS resource elements of the PUCCH channel in the
Table 3-2: Result summary: part containing results as defined by 3GPP (PRACH analysis)
EVM PRACH Shows the EVM of all resource elements of the PRACH channel in the ana-
Table 3-3: Result summary: part containing results for a specific selection
EVM All Shows the EVM for all resource elements in the analyzed frame.
EVM Phys Channel Shows the EVM for all physical channel resource elements in the analyzed
Shows the EVM of all DMRS resource elements with 256QAM modulation of
the PUSCH in the analyzed frame.
FETCh[:CC<cc>]:SUMMary:EVM:SDTS[:AVERage]? on page 147
lyzed frame.
FETCh[:CC<cc>]:SUMMary:EVM:UCCH[:AVERage]? on page 147
analyzed frame.
FETCh[:CC<cc>]:SUMMary:EVM:UCCD[:AVERage]? on page 147
lyzed frame.
FETCh[:CC<cc>]:SUMMary:EVM:UPRA[:AVERage]? on page 148
FETCh[:CC<cc>]:SUMMary:EVM[:ALL][:AVERage]? on page 150
frame.
A physical channel corresponds to a set of resource elements carrying infor-
mation from higher layers. PUSCH, PUCCH and PRACH are physical channels. For more information, see 3GPP 36.211.
FETCh[:CC<cc>]:SUMMary:EVM:PCHannel[:AVERage]? on page 151
("PUSCH/PUCCH" analysis mode only.)
EVM Phys Signal Shows the EVM for all physical signal resource elements in the analyzed
frame.
The reference signal is a physical signal. For more information, see 3GPP
36.211.
FETCh[:CC<cc>]:SUMMary:EVM:PSIGnal[:AVERage]? on page 151
("PUSCH/PUCCH" analysis mode only.)
28User Manual 1173.9386.02 ─ 19

R&S®FSW-K10x (LTE Uplink)
Frequency Error Shows the difference in the measured center frequency and the reference
Sampling Error Shows the difference in measured symbol clock and reference symbol clock
I/Q Offset Shows the power at spectral line 0 normalized to the total transmitted power.
I/Q Gain Imbalance Shows the logarithm of the gain ratio of the Q-channel to the I-channel.
I/Q Quadrature Error Shows the measure of the phase angle between Q-channel and I-channel
Power Shows the average time domain power of the allocated resource blocks of the
Measurements and result displays
I/Q measurements
center frequency.
FETCh[:CC<cc>]:SUMMary:FERRor[:AVERage]? on page 151
relative to the system sampling rate.
FETCh[:CC<cc>]:SUMMary:SERRor[:AVERage]? on page 153
FETCh[:CC<cc>]:SUMMary:IQOFfset[:AVERage]? on page 152
FETCh[:CC<cc>]:SUMMary:GIMBalance[:AVERage]? on page 152
deviating from the ideal 90 degrees.
FETCh[:CC<cc>]:SUMMary:QUADerror[:AVERage]? on page 153
analyzed signal.
FETCh[:CC<cc>]:SUMMary:POWer[:AVERage]? on page 153
Crest Factor Shows the peak-to-average power ratio of captured signal.
FETCh[:CC<cc>]:SUMMary:CRESt[:AVERage]? on page 150
Marker Table
Displays a table with the current marker values for the active markers.
This table is displayed automatically if configured accordingly.
Wnd Shows the window the marker is in.
Type Shows the marker type and number ("M" for a nor-
mal marker, "D" for a delta marker).
Trc Shows the trace that the marker is positioned on.
Ref Shows the reference marker that a delta marker
refers to.
X- / Y-Value Shows the marker coordinates (usually frequency
and level).
Z-EVM
Z-Power
Z-Alloc ID
Shows the EVM, power and allocation type at the
marker position.
Only in 3D result displays (for example "EVM vs
Symbol x Carrier").
29User Manual 1173.9386.02 ─ 19
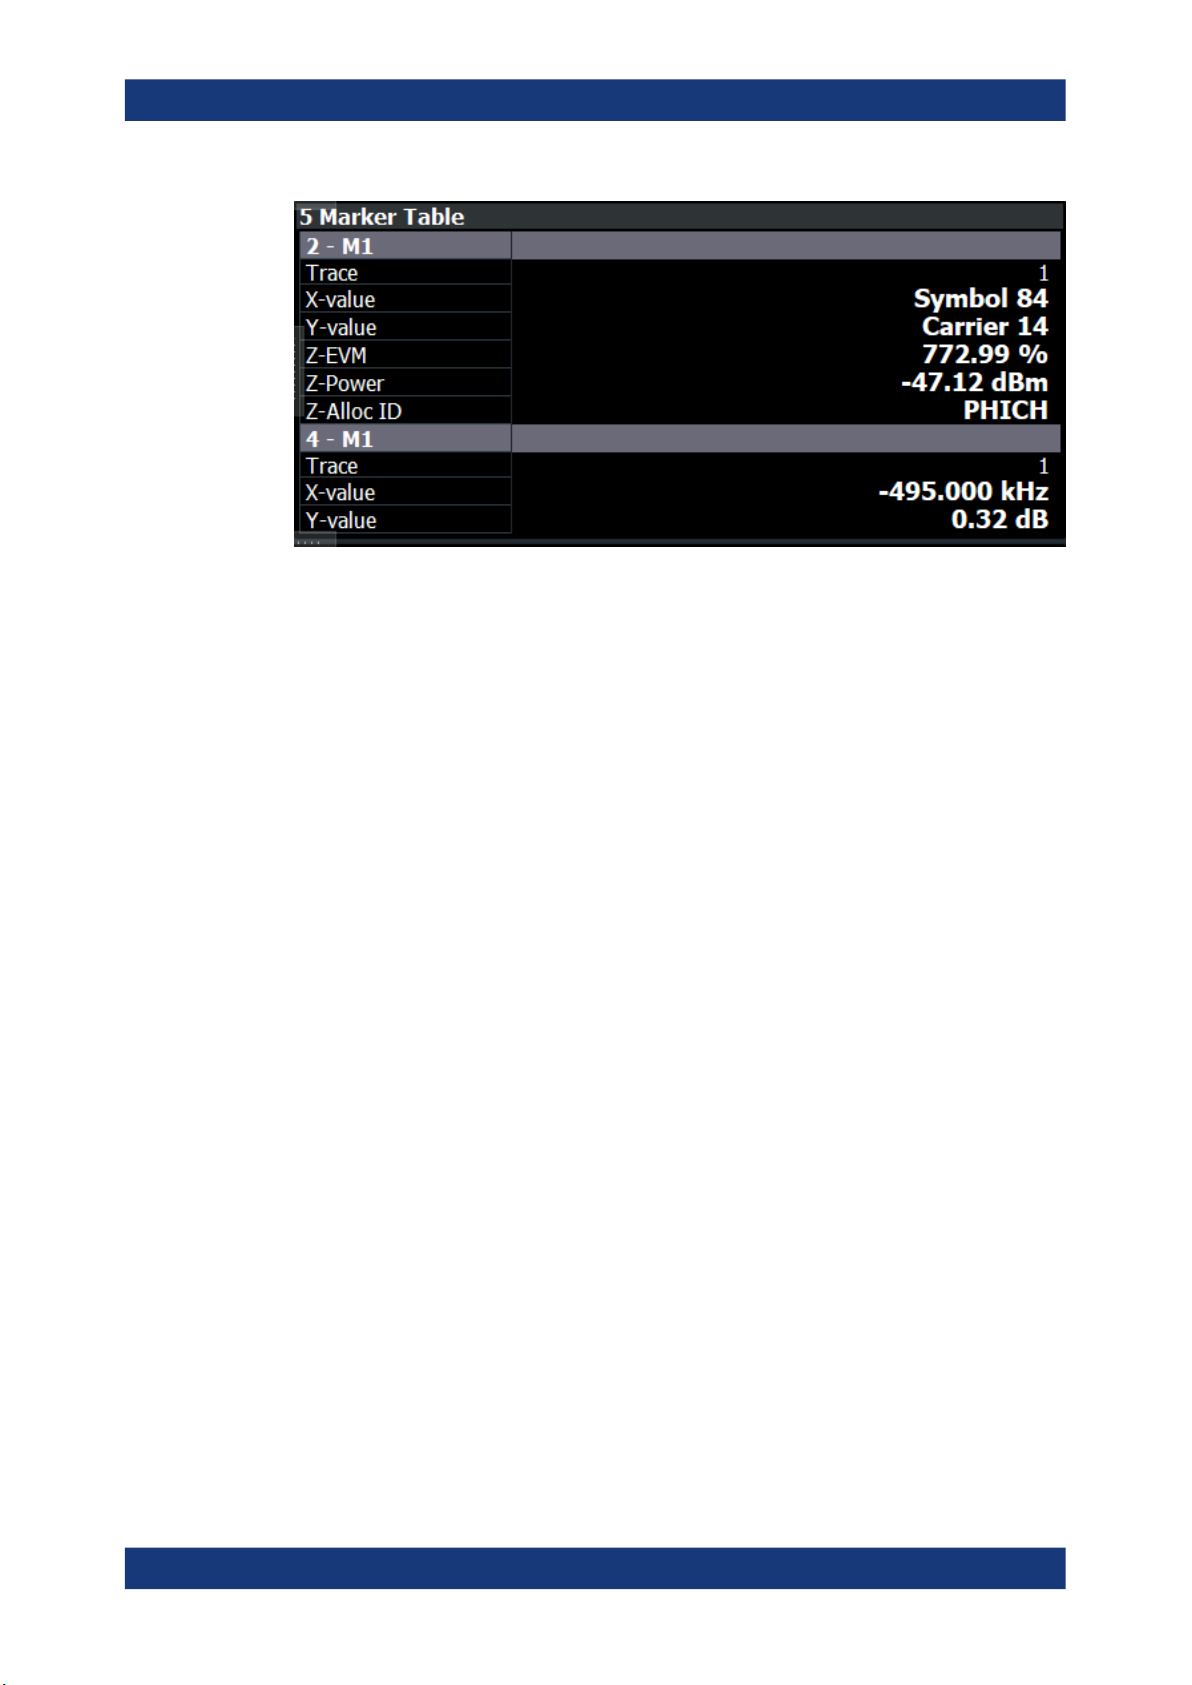
R&S®FSW-K10x (LTE Uplink)
Tip: To navigate within long marker tables, simply scroll through the entries with your
finger on the touchscreen.
Remote command:
LAY:ADD? '1',RIGH, MTAB, see LAYout:ADD[:WINDow]? on page 121
Results:
CALCulate<n>:MARKer<m>:X on page 157
CALCulate<n>:MARKer<m>:Y on page 157
CALCulate<n>:MARKer<m>:Z? on page 158
CALCulate<n>:MARKer<m>:Z:ALL? on page 158
Measurements and result displays
Time alignment error measurements
3.6 Time alignment error measurements
Access: [MEAS] > "Time Alignment Error"
The time alignment error measurement captures and analyzes new I/Q data when you
select it.
Note that the time alignment error measurement only work in a MIMO setup (2 or 4
antennas) or a system with component carriers. Therefore, you have to mix the signal
of the antennas into one cable that you can connect to the R&S FSW. For more information on configuring and performing a time alignment error measurement see Chap-
ter 4.4, "Performing time alignment measurements", on page 45.
In addition to the result displays mentioned in this section, the time alignment error
measurement also supports the following result displays described elsewhere.
●
"Capture Buffer" on page 18
●
"Power Spectrum" on page 20
●
"Marker Table" on page 29
You can select the result displays from the evaluation bar and arrange them as you like
with the SmartGrid functionality.
Remote command:
Measurement selection: CONFigure[:LTE]:MEASurement on page 173
30User Manual 1173.9386.02 ─ 19
 Loading...