


R&S® FSV-K91/91n
Firmware Option WLAN TX
Measurements
Operating Manual
(;ÚÚa2)
1176.7649.02 ─ 04.1
Operating Manual
Test & Measurement

This manual describes the following options:
●
R&S FSV-K91 (1310.8903.02)
●
R&S FSV-K91n (1310.9468.02)
The contents of this manual correspond to the following R&S®FSVR models with firmware version 2.23 or
higher:
●
R&S®FSVR7 (1311.0006K7)
●
R&S®FSVR13 (1311.0006K13)
●
R&S®FSVR30 (1311.0006K30)
●
R&S®FSVR40 (1311.0006K40)
The software contained in this product makes use of several valuable open source software packages. For information, see the
"Open Source Acknowledgement" on the user documentation CD-ROM (included in delivery).
Rohde & Schwarz would like to thank the open source community for their valuable contribution to embedded computing.
© 2015 Rohde & Schwarz GmbH & Co. KG
Mühldorfstr. 15, 81671 München, Germany
Phone: +49 89 41 29 - 0
Fax: +49 89 41 29 12 164
Email: info@rohde-schwarz.com
Internet: www.rohde-schwarz.com
Subject to change – Data without tolerance limits is not binding.
R&S® is a registered trademark of Rohde & Schwarz GmbH & Co. KG.
Trade names are trademarks of the owners.
The following abbreviations are used throughout this manual: R&S®FSV is abbreviated as R&S FSV. R&S®FSVR is abbreviated as
R&S FSVR.

R&S® FSV-K91/91n
Contents
1 Preface.................................................................................................... 5
1.1 Documentation Overview............................................................................................. 5
1.2 Conventions Used in the Documentation...................................................................7
1.3 How to Use the Help System........................................................................................8
2 Introduction.......................................................................................... 10
3 WLAN TX Measurements (R&S FSV-K91/91n)...................................11
3.1 Introduction to WLAN 802.11A, B, G, J & N TX Tests..............................................12
3.2 Basic Measurement Examples...................................................................................13
3.3 Signal Processing of the IEEE 802.11a Application................................................ 21
3.4 Signal Processing of the IEEE 802.11b Application................................................ 29
Contents
3.5 802.11b RF Carrier Suppression................................................................................35
3.6 IEEE 802.11n (MIMO) Measurements........................................................................ 36
3.7 Signal Field Measurement (IEEE 802.n (SISO+MIMO))............................................ 37
3.8 Measurement Result Types........................................................................................41
3.9 Measurement Settings and Result Displays.............................................................48
4 Instrument Functions WLAN TX Measurements (R&S FSV-K91/91n)
............................................................................................................... 60
4.1 Softkeys of the WLAN TX Menu (R&S FSV-K91/91n)...............................................61
4.2 General Settings Dialog Box (K91)............................................................................84
4.3 Demod Settings Dialog Box (K91)............................................................................. 93
4.4 Softkeys of the Sweep Menu – SWEEP key (R&S FSV-K91/91n)..........................105
4.5 Softkeys of the Trace Menu – TRAC key (R&S FSV-K91/91n).............................. 106
4.6 Softkeys of the Marker Menu – MKR key (R&S FSV-K91/91n).............................. 107
4.7 Softkeys of the Marker To Menu – MKR-> key (R&S FSV-K91/91n)..................... 107
4.8 Softkeys of the Lines Menu – LINES key (R&S FSV-K91/91n).............................. 108
4.9 Softkeys of the Input/Output Menu for WLAN Measurements..............................109
5 Remote Commands for WLAN TX Measurements (R&S FSV-
K91/91n).............................................................................................. 111
5.1 Notation......................................................................................................................112
5.2 ABORt Subsystem.................................................................................................... 115
5.3 CALCulate:BURSt Subsystem (WLAN, R&S FSV-K91/91n).................................. 115
3Operating Manual 1176.7649.02 ─ 04.1

R&S® FSV-K91/91n
5.4 CALCulate:LIMit Subsystem (WLAN, R&S FSV-K91/91n)..................................... 116
5.5 CALCulate:MARKer Subsystem (WLAN, R&S FSV-K91/91n)............................... 134
5.6 CONFigure Subsystem (WLAN, R&S FSV-K91/91n).............................................. 141
5.7 DISPlay Subsystem (WLAN, R&S FSV-K91/91n)....................................................158
5.8 FETCh Subsystem (WLAN, R&S FSV-K91/91n)......................................................163
5.9 FORMat Subsystem.................................................................................................. 171
5.10 INITiate Subsystem................................................................................................... 171
5.11 INPut Subsystem.......................................................................................................172
5.12 INSTrument Subsystem (WLAN, R&S FSV-K91/91n).............................................174
5.13 MMEMory Subsystem (WLAN, R&S FSV-K91/91n)................................................ 174
5.14 SENSe Subsystem (WLAN, R&S FSV-K91/91n)..................................................... 176
5.15 STATus Subsystem (WLAN, K91)............................................................................197
5.16 TRACe Subsystem (WLAN, K91/91n)...................................................................... 201
Contents
5.17 TRIGger Subsystem (WLAN, K91/91N)................................................................... 209
5.18 UNIT Subsystem (K91)..............................................................................................212
5.19 Status Reporting System (Option R&S FSV-K91).................................................. 214
List of Commands..............................................................................220
Index....................................................................................................226
4Operating Manual 1176.7649.02 ─ 04.1

R&S® FSV-K91/91n
1 Preface
Preface
Documentation Overview
1.1 Documentation Overview
The user documentation for the R&S FSVR is divided as follows:
●
Quick Start Guide
●
Operating Manuals for base unit and options
●
Service Manual
●
Online Help
●
Release Notes
Quick Start Guide
This manual is delivered with the instrument in printed form and in PDF format on the
CD. It provides the information needed to set up and start working with the instrument.
Basic operations and basic measurements are described. Also a brief introduction to
remote control is given. The manual includes general information (e.g. Safety Instructions) and the following chapters:
Chapter 1 Introduction, General information
Chapter 2 Front and Rear Panel
Chapter 3 Preparing for Use
Chapter 4 Firmware Update and Installation of Firmware Options
Chapter 5 Basic Operations
Chapter 6 Basic Measurement Examples
Chapter 7 Brief Introduction to Remote Control
Appendix Printer Interface
Appendix LAN Interface
Operating Manuals
The Operating Manuals are a supplement to the Quick Start Guide. Operating Manuals
are provided for the base unit and each additional (software) option.
The Operating Manual for the base unit provides basic information on operating the
R&S FSVR in general, and the "Spectrum" mode in particular. Furthermore, the software options that enhance the basic functionality for various measurement modes are
described here. The set of measurement examples in the Quick Start Guide is expanded by more advanced measurement examples. In addition to the brief introduction to
remote control in the Quick Start Guide, a description of the basic analyzer commands
and programming examples is given. Information on maintenance, instrument interfaces and error messages is also provided.
5Operating Manual 1176.7649.02 ─ 04.1

R&S® FSV-K91/91n
In the individual option manuals, the specific instrument functions of the option are
described in detail. For additional information on default settings and parameters, refer
to the data sheets. Basic information on operating the R&S FSVR is not included in the
option manuals.
The following Operating Manuals are available for the R&S FSVR:
●
●
●
●
●
●
●
●
●
●
●
●
●
●
Preface
Documentation Overview
R&S FSVR base unit; in addition:
– R&S FSV-K7S Stereo FM Measurements
– R&S FSV-K9 Power Sensor Support
– R&S FSV-K14 Spectrogram Measurement
R&S FSV-K10 GSM/EDGE Measurement
R&S FSV-K30 Noise Figure Measurement
R&S FSV-K40 Phase Noise Measurement
R&S FSV-K70 Vector Signal Analysis Operating Manual
R&S FSV-K70 Vector Signal Analysis Getting Started (First measurements)
R&S FSV-K72 3GPP FDD BTS Analysis
R&S FSV-K73 3GPP FDD UE Analysis
R&S FSV-K76/77 3GPP TD-SCDMA BTS/UE Measurement
R&S FSV-K82/83 CDMA2000 BTS/MS Analysis
R&S FSV-K84/85 1xEV-DO BTS/MS Analysis
R&S FSV-K91 WLAN IEEE 802.11
R&S FSV-K93 WiMAX IEEE 802.16 OFDM/OFDMA Analysis
R&S FSV-K100/K104 EUTRA / LTE Downlink Measurement Application
R&S FSV-K101/K105 EUTRA / LTE Uplink Measurement Application
These manuals are available in PDF format on the CD delivered with the instrument.
Service Manual
This manual is available in PDF format on the CD delivered with the instrument. It
describes how to check compliance with rated specifications, instrument function,
repair, troubleshooting and fault elimination. It contains all information required for
repairing the R&S FSVR by replacing modules. The manual includes the following
chapters:
Chapter 1 Performance Test
Chapter 2 Adjustment
Chapter 3 Repair
Chapter 4 Software Update / Installing Options
Chapter 5 Documents
Online Help
The online help contains context-specific help on operating the R&S FSVR and all
available options. It describes both manual and remote operation. The online help is
6Operating Manual 1176.7649.02 ─ 04.1

R&S® FSV-K91/91n
installed on the R&S FSVR by default, and is also available as an executable .chm file
on the CD delivered with the instrument.
Release Notes
The release notes describe the installation of the firmware, new and modified functions, eliminated problems, and last minute changes to the documentation. The corresponding firmware version is indicated on the title page of the release notes. The current release notes are provided in the Internet.
Preface
Conventions Used in the Documentation
1.2 Conventions Used in the Documentation
1.2.1 Typographical Conventions
The following text markers are used throughout this documentation:
Convention Description
"Graphical user interface elements"
KEYS Key names are written in capital letters.
File names, commands,
program code
Input Input to be entered by the user is displayed in italics.
Links Links that you can click are displayed in blue font.
"References" References to other parts of the documentation are enclosed by quota-
All names of graphical user interface elements on the screen, such as
dialog boxes, menus, options, buttons, and softkeys are enclosed by
quotation marks.
File names, commands, coding samples and screen output are distinguished by their font.
tion marks.
1.2.2 Conventions for Procedure Descriptions
When describing how to operate the instrument, several alternative methods may be
available to perform the same task. In this case, the procedure using the touchscreen
is described. Any elements that can be activated by touching can also be clicked using
an additionally connected mouse. The alternative procedure using the keys on the
instrument or the on-screen keyboard is only described if it deviates from the standard
operating procedures.
The term "select" may refer to any of the described methods, i.e. using a finger on the
touchscreen, a mouse pointer in the display, or a key on the instrument or on a keyboard.
7Operating Manual 1176.7649.02 ─ 04.1
R&S® FSV-K91/91n
Preface
How to Use the Help System
1.2.3 Notes on Screenshots
When describing the functions of the product, we use sample screenshots. These
screenshots are meant to illustrate as much as possible of the provided functions and
possible interdependencies between parameters.
The screenshots usually show a fully equipped product, that is: with all options installed. Thus, some functions shown in the screenshots may not be available in your particular product configuration.
1.3 How to Use the Help System
Calling context-sensitive and general help
► To display the general help dialog box, press the HELP key on the front panel.
The help dialog box "View" tab is displayed. A topic containing information about
the current menu or the currently opened dialog box and its function is displayed.
For standard Windows dialog boxes (e.g. File Properties, Print dialog etc.), no contextsensitive help is available.
► If the help is already displayed, press the softkey for which you want to display
help.
A topic containing information about the softkey and its function is displayed.
If a softkey opens a submenu and you press the softkey a second time, the submenu
of the softkey is displayed.
Contents of the help dialog box
The help dialog box contains four tabs:
●
"Contents" - contains a table of help contents
●
"View" - contains a specific help topic
●
"Index" - contains index entries to search for help topics
●
"Zoom" - contains zoom functions for the help display
To change between these tabs, press the tab on the touchscreen.
Navigating in the table of contents
●
To move through the displayed contents entries, use the UP ARROW and DOWN
ARROW keys. Entries that contain further entries are marked with a plus sign.
●
To display a help topic, press the ENTER key. The "View" tab with the corresponding help topic is displayed.
8Operating Manual 1176.7649.02 ─ 04.1

R&S® FSV-K91/91n
●
Navigating in the help topics
●
●
Searching for a topic
1. Change to the "Index" tab.
2. Enter the first characters of the topic you are interested in. The entries starting with
3. Change the focus by pressing the ENTER key.
4. Select the suitable keyword by using the UP ARROW or DOWN ARROW keys or
Preface
How to Use the Help System
To change to the next tab, press the tab on the touchscreen.
To scroll through a page, use the rotary knob or the UP ARROW and DOWN
ARROW keys.
To jump to the linked topic, press the link text on the touchscreen.
these characters are displayed.
the rotary knob.
5. Press the ENTER key to display the help topic.
The "View" tab with the corresponding help topic is displayed.
Changing the zoom
1. Change to the "Zoom" tab.
2. Set the zoom using the rotary knob. Four settings are available: 1-4. The smallest
size is selected by number 1, the largest size is selected by number 4.
Closing the help window
► Press the ESC key or a function key on the front panel.
9Operating Manual 1176.7649.02 ─ 04.1

R&S® FSV-K91/91n
2 Introduction
This document contains all information required for operation of an R&S FSVR equipped with Application Firmware R&S FSV-K91/91n. It covers operation via menus and
the remote control commands for analog demodulation measurements.
This part of the documentation consists of the following chapters:
●
●
●
●
Introduction
chapter 3.2, "Basic Measurement Examples", on page 13
Describes the measurement setup for WLAN TX measurements.
chapter 4, "Instrument Functions WLAN TX Measurements (R&S FSV-K91/91n)",
on page 60
Describes the overall instrument functions and provides further information
chapter 4.1, "Softkeys of the WLAN TX Menu (R&S FSV-K91/91n)", on page 61
Shows all softkeys available in the "WLAN" menu. This chapter also refers to the
remote control commands associated with each softkey function.
chapter 5, "Remote Commands for WLAN TX Measurements (R&S FSVK91/91n)", on page 111
Describes all remote control commands defined for the power meter measurement.
This part of the documentation includes only functions of the Application Firmware
R&S FSV-K91/91n. For all other descriptions, please refer to the description of the
base unit.
10Operating Manual 1176.7649.02 ─ 04.1

R&S® FSV-K91/91n
3 WLAN TX Measurements (R&S FSV-
K91/91n)
The R&S FSV-K91/91n application extends the functionality of the R&S FSVR signal
analyzer to enable wireless LAN TX measurements in accordance with IEEE standards
802.11 a b, g, j & n (R&S FSV-K91/91n).
The following topics are described in this section:
3.1 Introduction to WLAN 802.11A, B, G, J & N TX Tests..............................................12
3.2 Basic Measurement Examples...................................................................................13
3.2.1 Setting Up the Measurement........................................................................................ 13
3.2.2 Performing the Main Measurement...............................................................................14
3.2.3 Setting up a MIMO measurement................................................................................. 14
3.3 Signal Processing of the IEEE 802.11a Application................................................ 21
WLAN TX Measurements (R&S FSV-K91/91n)
3.3.1 Understanding Signal Processing of the IEEE 802.11a Application............................. 22
3.3.2 Literature to the IEEE 802.11a Application................................................................... 29
3.4 Signal Processing of the IEEE 802.11b Application................................................ 29
3.4.1 Understanding Signal Processing of the IEEE 802.11b Application............................. 30
3.4.2 Literature of the IEEE 802.11b Application................................................................... 35
3.5 802.11b RF Carrier Suppression................................................................................35
3.6 IEEE 802.11n (MIMO) Measurements........................................................................ 36
3.7 Signal Field Measurement (IEEE 802.n (SISO+MIMO))............................................ 37
3.8 Measurement Result Types........................................................................................41
3.8.1 IQ Impairments..............................................................................................................41
3.8.2 EVM Measurement....................................................................................................... 46
3.8.3 Rise/Fall Time Measurement........................................................................................ 48
3.9 Measurement Settings and Result Displays.............................................................48
3.9.1 Measurement Settings.................................................................................................. 49
3.9.2 Result Summary List.....................................................................................................52
3.9.3 Result Display Graph.................................................................................................... 57
3.9.4 Title Bar Information......................................................................................................59
3.9.5 Status Bar Information.................................................................................................. 59
11Operating Manual 1176.7649.02 ─ 04.1

R&S® FSV-K91/91n
WLAN TX Measurements (R&S FSV-K91/91n)
Introduction to WLAN 802.11A, B, G, J & N TX Tests
3.1 Introduction to WLAN 802.11A, B, G, J & N TX Tests
The use of an R&S FSVR spectrum analyzer enables the accurate and reproducible
TX measurement of a wireless LAN device under test (DUT) in accordance with the
standards specified for the device. The following test conditions are supported:
Modulation formats:
●
IEEE 802.1j (10 MHz)
– BPSK (3 & 4.5 Mbps)
– QPSK (6 & 9 Mbps)
– 16QAM (12 & 18 Mbps)
– 64QAM (24 & 27 Mbps)
●
IEEE 802.11a, j (20 MHz) & g (OFDM)
– BPSK (6 & 9 Mbps)
– QPSK (12 & 18 Mbps)
– 16QAM (24 & 36 Mbps)
– 64QAM (48 & 54 Mbps)
●
IEEE 802.11a, j (10 MHz) & g (OFDM)
– BPSK (6 & 9 Mbps)
– QPSK (12 & 18 Mbps)
– 16QAM (24 & 36 Mbps)
– 64QAM (48 & 54 Mbps)
●
IEEE 802.11b & g (single carrier mode)
– DBPSK (1 Mbps)
– DQPSK (2 Mbps)
– CCK (5.5 & 11 Mbps)
– PBCC (5.5, 11 & 22 Mbps)
●
IEEE 802.11n (OFDM)
– BPSK (6.5, 7.2, 13.5 & 15 Mbps)
– QPSK (13, 14.4, 19.5, 21.7, 27, 30, 40,5 & 45 Mbps)
– 16QAM(26, 28.9, 39, 43.3, 54, 60, 81 & 90 Mbps)
– 64QAM(52, 57.8, 58.5, 65, 72.2, 108, 121.5, 135, 120, 135 & 150 Mbps)
Modulation measurements
●
Constellation diagram
●
Constellation diagram for each OFDM carrier
●
I/Q offset and I/Q imbalance
●
Carrier and symbol frequency errors
●
Modulation error (EVM) for each OFDM carrier or symbol
●
Amplitude response and group-delay distortion (spectral flatness)
Further measurements and results
●
Amplitude statistics (CCDF) and crest factor
●
Transmit spectrum mask
12Operating Manual 1176.7649.02 ─ 04.1

R&S® FSV-K91/91n
●
●
●
WLAN TX Measurements (R&S FSV-K91/91n)
Basic Measurement Examples
FFT, also over a selected part of the signal, e.g. preamble
Payload bit information
Freq/Phase Err vs. Preamble
3.2 Basic Measurement Examples
This section provides step-by-step instruction for working through an ordinary measurement. The following steps are described:
1. chapter 3.2.1, "Setting Up the Measurement", on page 13
2. chapter 3.2.2, "Performing the Main Measurement", on page 14
In this example, a DUT using IEEE 802.11a is be used. The DUT is connected to the
R&S FSVR using the RF input of the R&S FSVR. The DUT generates a signal modulated using 16QAM.
3.2.1 Setting Up the Measurement
1. Activate the "WLAN" mode using the MODE > "WLAN" keys.
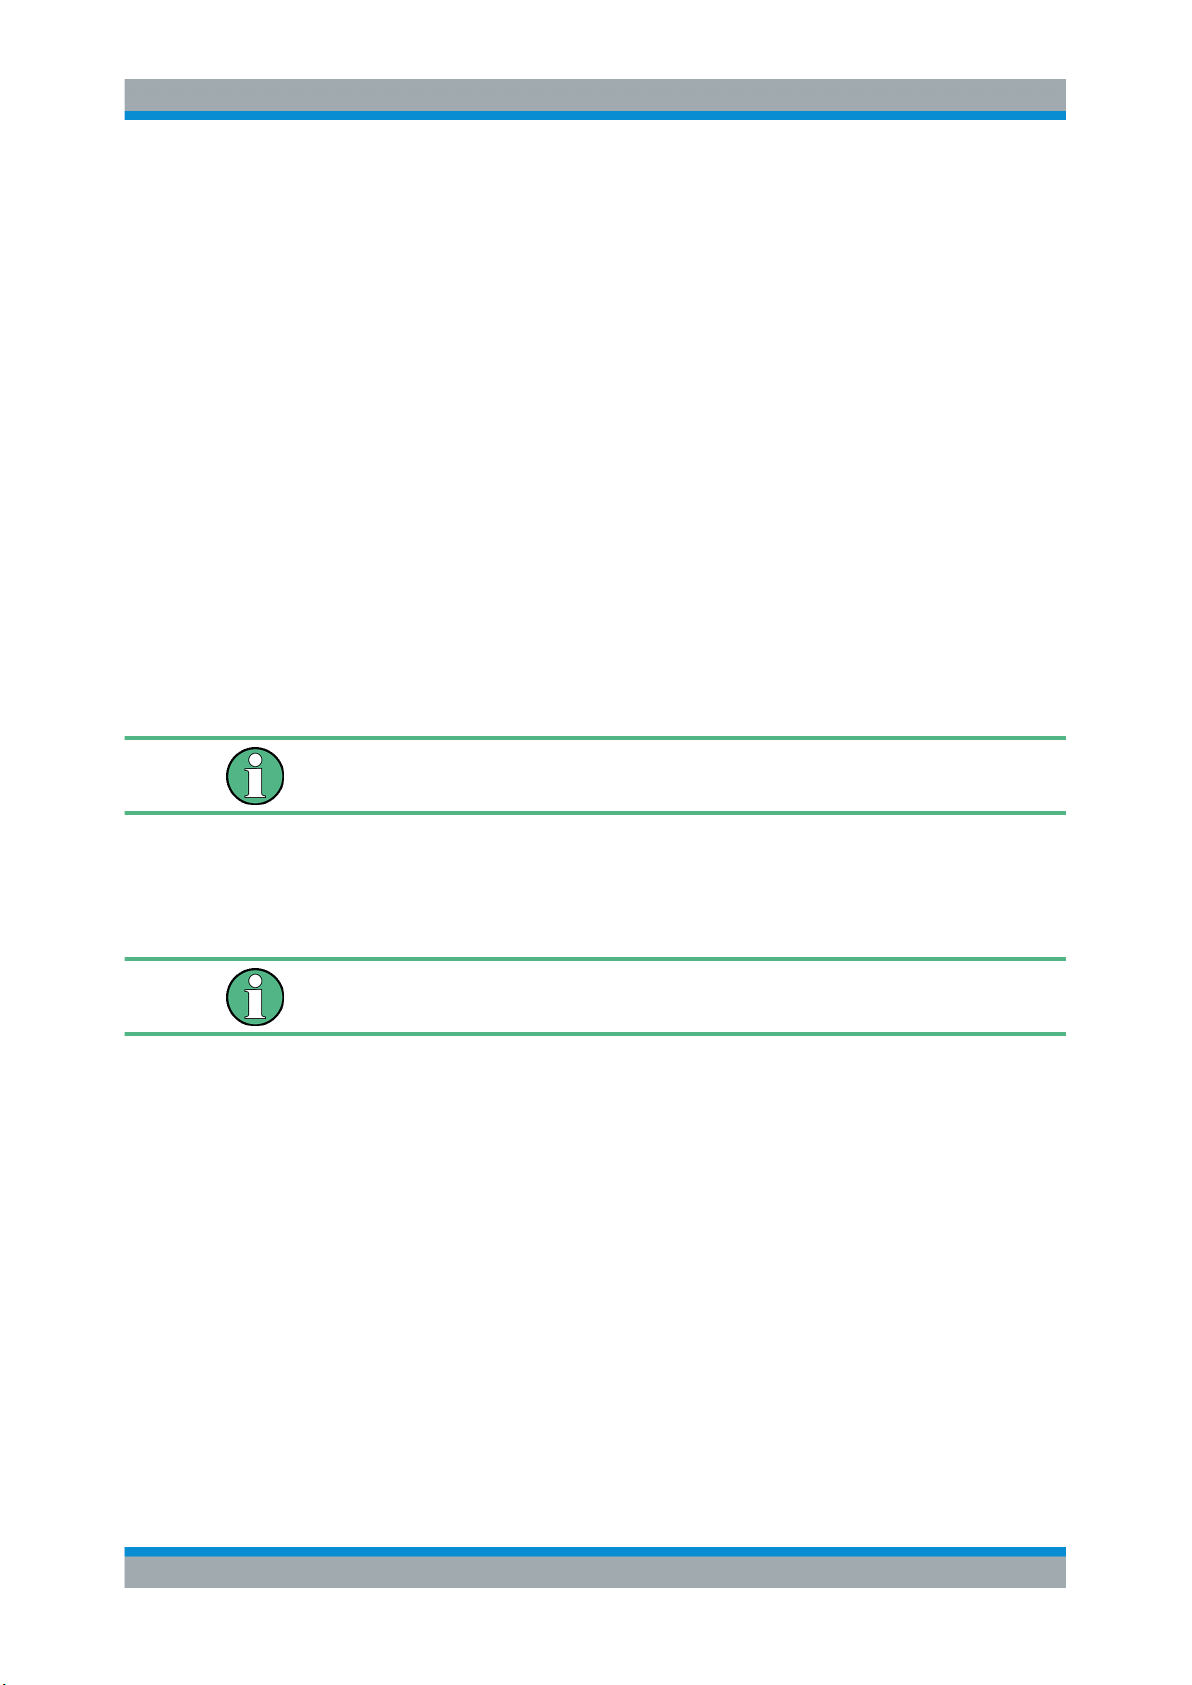
2. Press the "FREQ" key once to select and open the Demod Settings Dialog Box
(K91) and to activate the frequency input field.
13Operating Manual 1176.7649.02 ─ 04.1
R&S® FSV-K91/91n
WLAN TX Measurements (R&S FSV-K91/91n)
Basic Measurement Examples
3. Activate "Auto Demodulation" (see "Auto Demodulation (IEEE 802.11n, SISO)"
on page 96) to use the content of the signal inherent field to detect the modulation type automatically.
3.2.2 Performing the Main Measurement
●
Select single sweep measurements by pressing the RUN SINGLE hardkey.
●
Select continuous measurements by pressing the RUN CONT hardkey.
During the measurement, the status message "Running" is displayed.
Leveling is done automatically.
Measurement results are updated once the measurement has completed. The
results are displayed in graphical form. The display can be toggled to a tabular list
of measurement points by pressing the "Display" softkey (in the "WLAN" menu or
"Trace" menu).
3.2.3 Setting up a MIMO measurement
For this example a 2 Tx MIMO DUT according to IEEE 802.11n is used.
1. The MIMO DUT is connected to the analyzers according to the following setup:
14Operating Manual 1176.7649.02 ─ 04.1

R&S® FSV-K91/91n
WLAN TX Measurements (R&S FSV-K91/91n)
Basic Measurement Examples
2. Connect the external reference REF OUT of the SMU with the external reference
REF IN of the analyzers. Switch on the external reference for both analyzers in the
spectrum analyzer base system.
3. Connect the marker output of the SMU with the EXT TRIGGER input of the analyzers.
4. Either connect the "Path A RF/Baseband" connector with one analyzer and the
"Path B RF/Baseband" connector with the other analyzer, or use the air interface
with appropriate antennas.
5. Connect the master and the slave anaylzer via LAN according to the figure above.
As an alternative, it is sufficient to connect master and slave with a cross LAN
cable. The analyzer with the R&S FSVR-K91n option can be used as master. The
slave analyzer does not require a WLAN option.
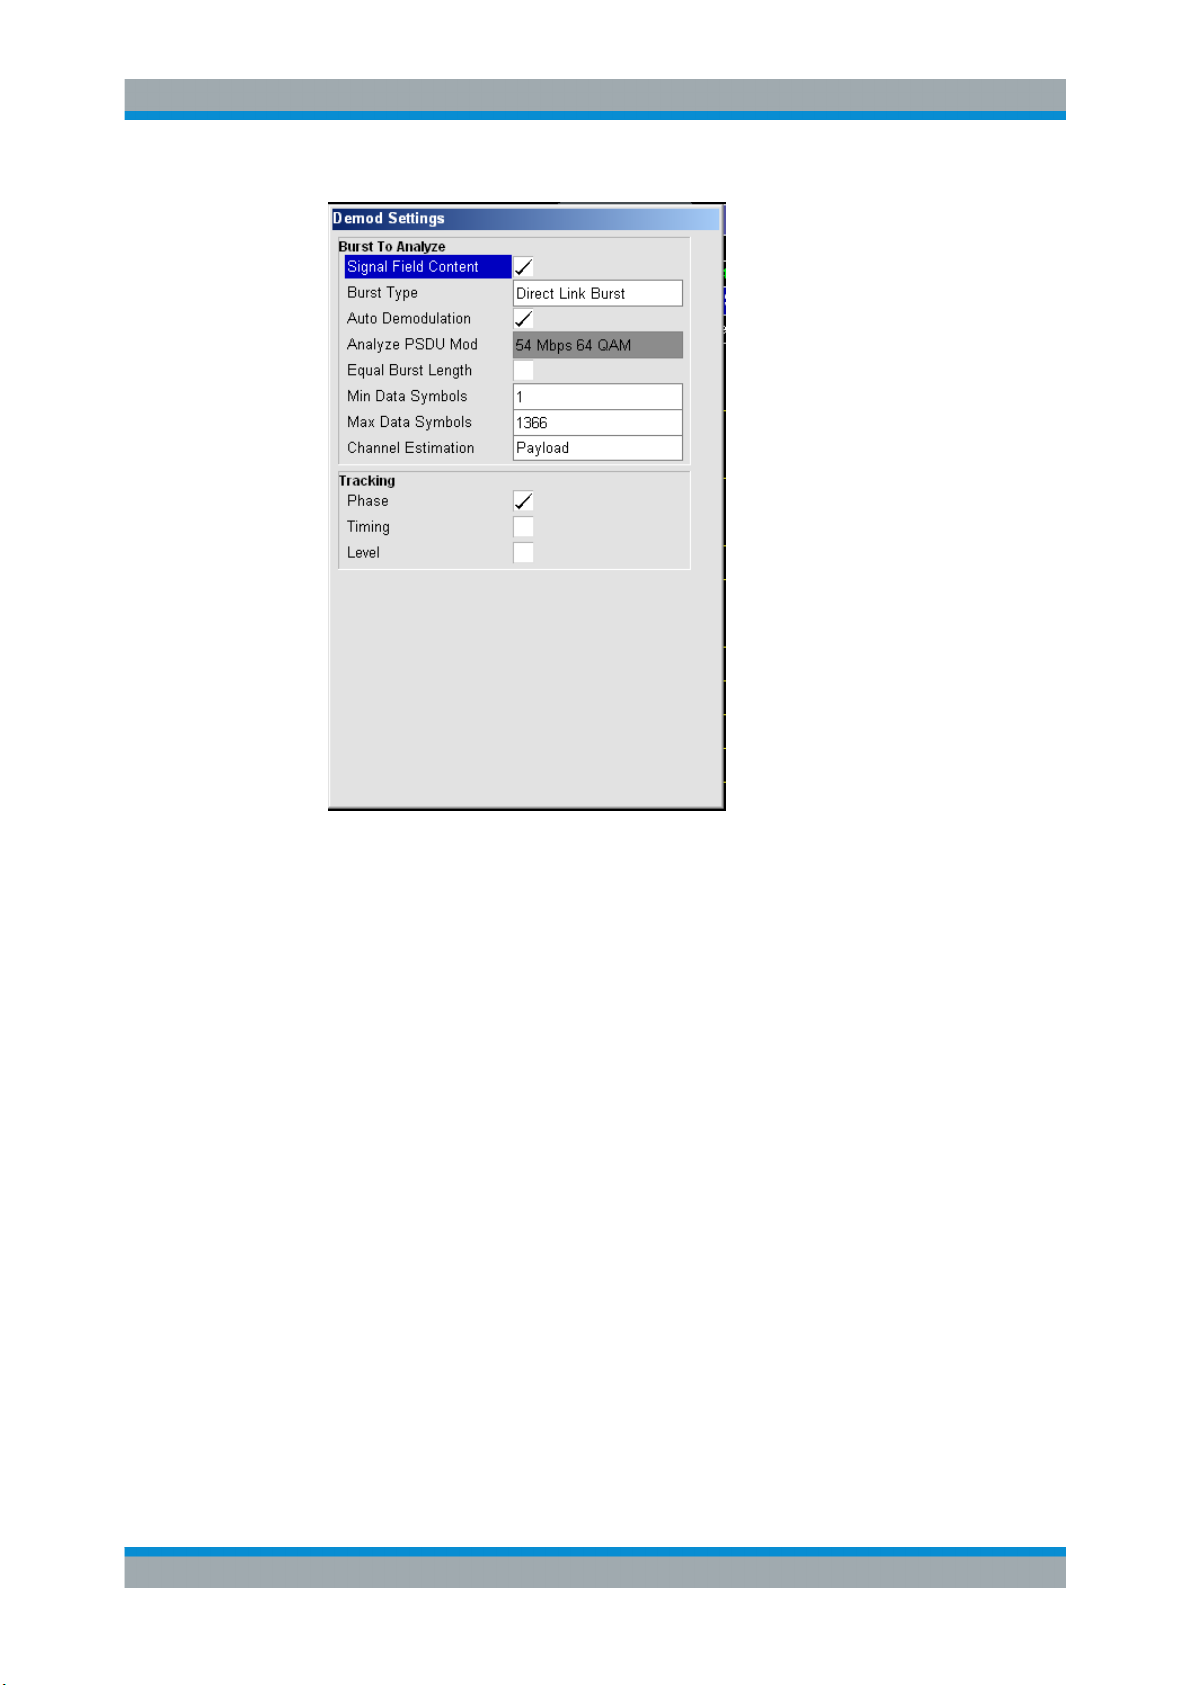
6. Setup the SMU to generate a 2 Tx IEEE 802.11n (MIMO) signal.
For the SMU "Baseband A" select the "IEEE 802.11n …" option. This opens the
"IEEE 802.11n WLAN A" dialog.
15Operating Manual 1176.7649.02 ─ 04.1
R&S® FSV-K91/91n
WLAN TX Measurements (R&S FSV-K91/91n)
Basic Measurement Examples
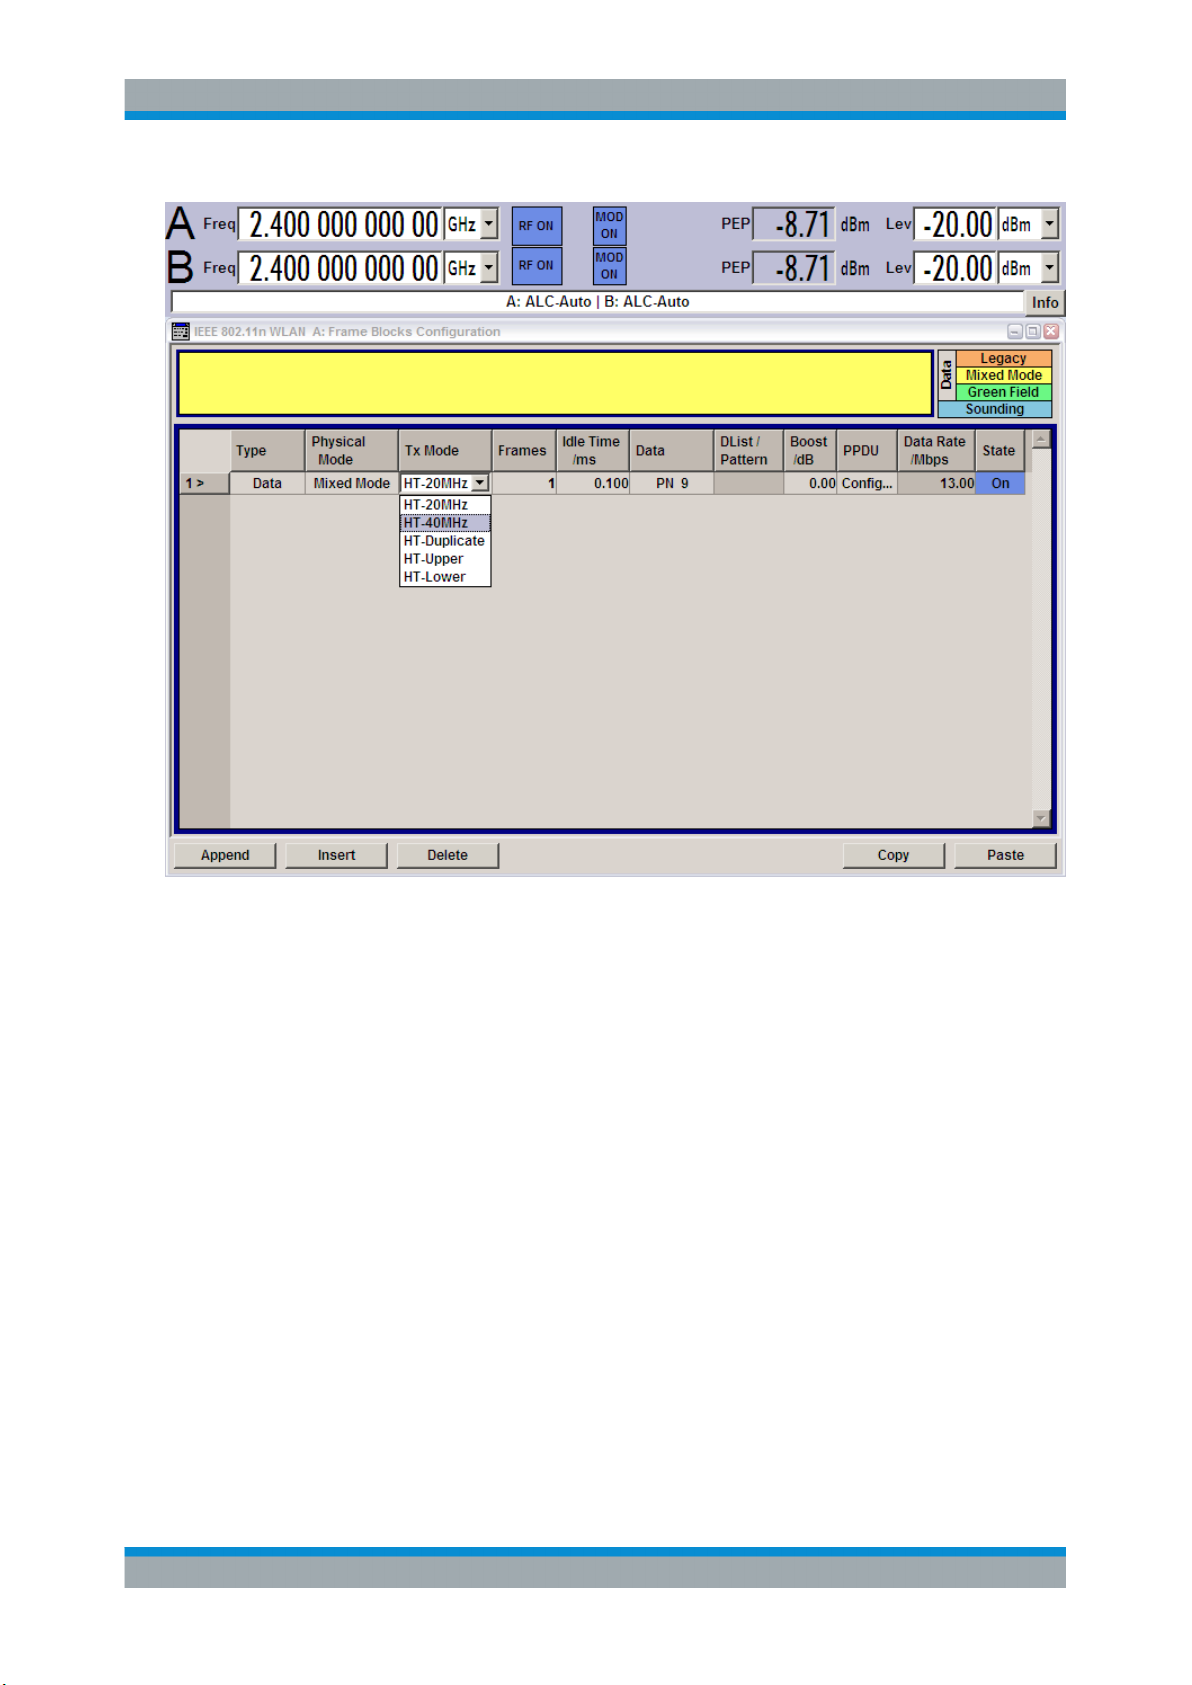
7. Select the "Transmission Bandwidth" 40MHz.
In the "IEEE 802.11n WLAN A" dialog, press the "Frame Block Configuration …"
button to open the "IEEE 802.11n WLAN A: Frame Blocks Configuration" dialog.
16Operating Manual 1176.7649.02 ─ 04.1
R&S® FSV-K91/91n
WLAN TX Measurements (R&S FSV-K91/91n)
Basic Measurement Examples
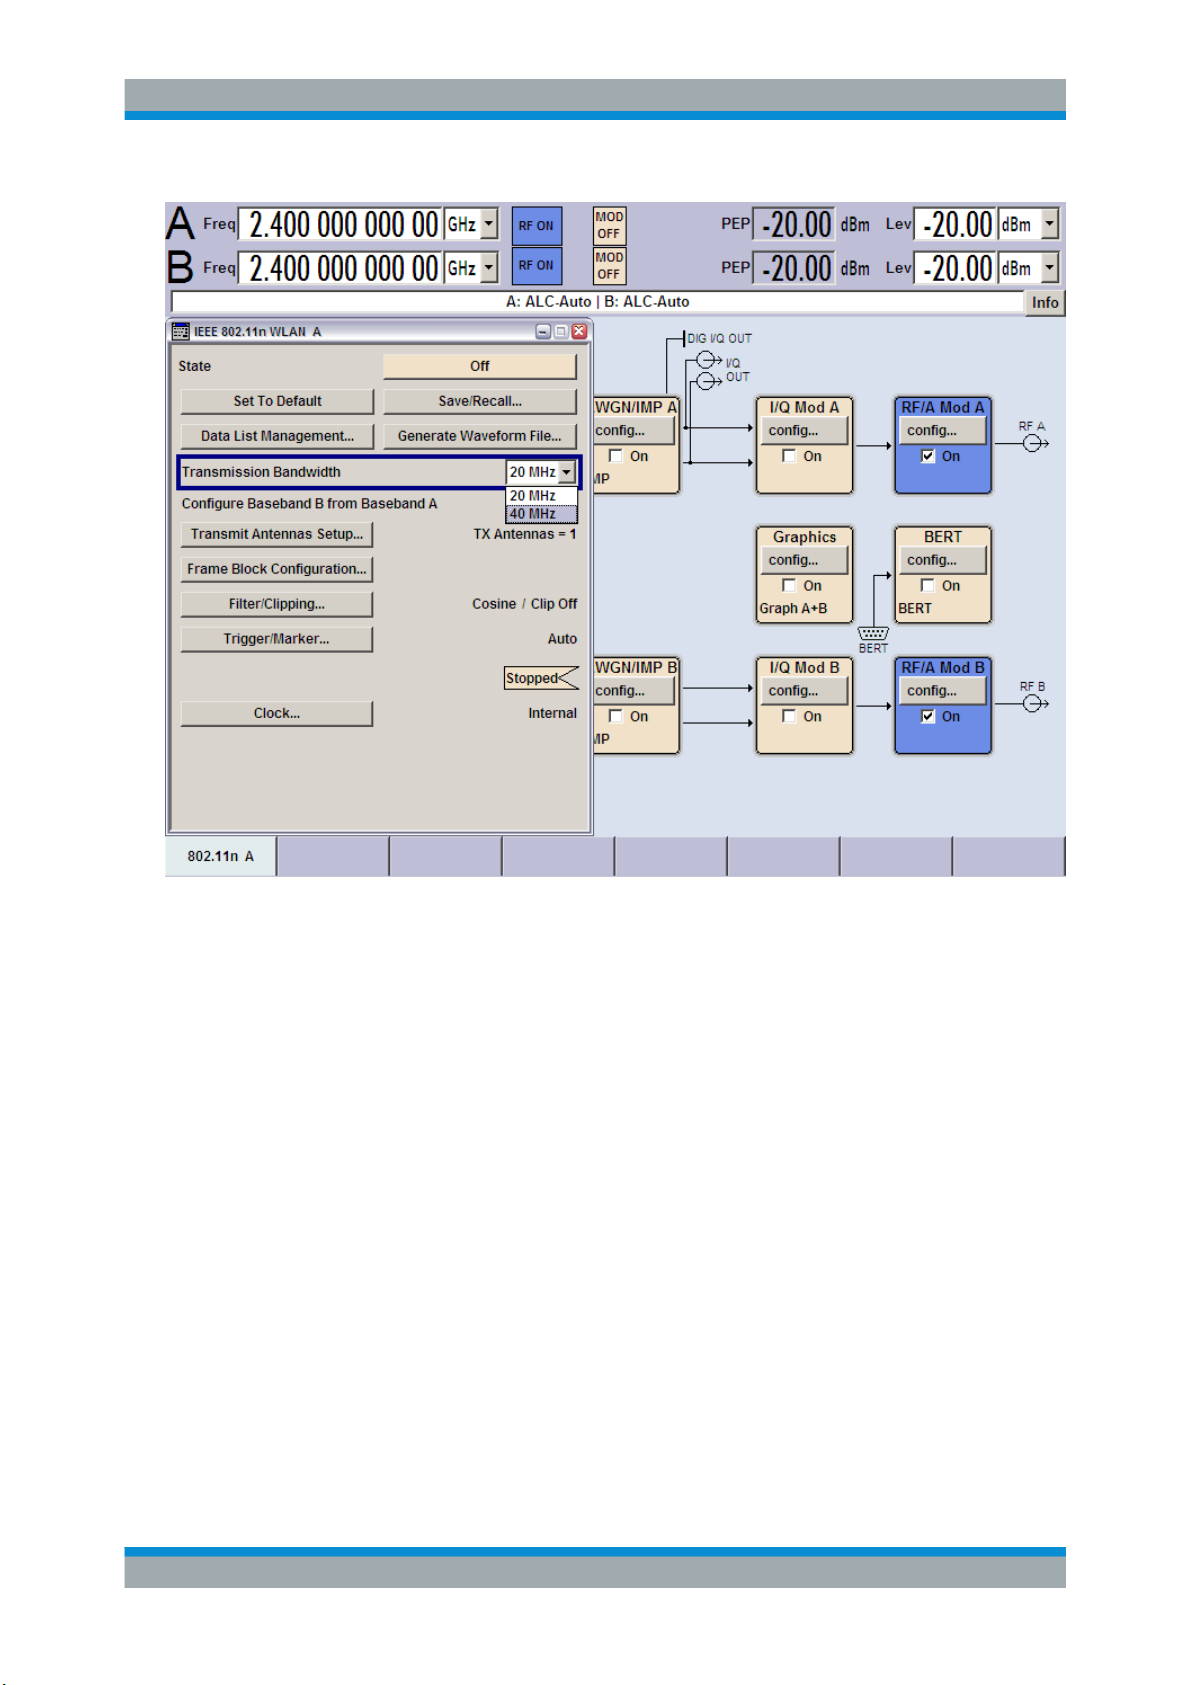
8. Select "Antennas" 2.
In the "IEEE 802.11n WLAN A" dialog, press the "Frame Block Configuration …"
button to open the "IEEE 802.11n WLAN A: Frame Blocks Configuration" dialog.
17Operating Manual 1176.7649.02 ─ 04.1
R&S® FSV-K91/91n
WLAN TX Measurements (R&S FSV-K91/91n)
Basic Measurement Examples
9. Select "Tx Mode" HT-40MHz.
Press the "PPDU Config …" button to open the "IEEE 802.11n WLAN A: PPDU
Configuration for Frame Block 1" dialog.
18Operating Manual 1176.7649.02 ─ 04.1

R&S® FSV-K91/91n
WLAN TX Measurements (R&S FSV-K91/91n)
Basic Measurement Examples
10. Select "Spatial Streams" 2 and "Space Time Streams" 2.
Return to the "IEEE 802.11n WLAN A" dialog.
19Operating Manual 1176.7649.02 ─ 04.1

R&S® FSV-K91/91n
WLAN TX Measurements (R&S FSV-K91/91n)
Basic Measurement Examples
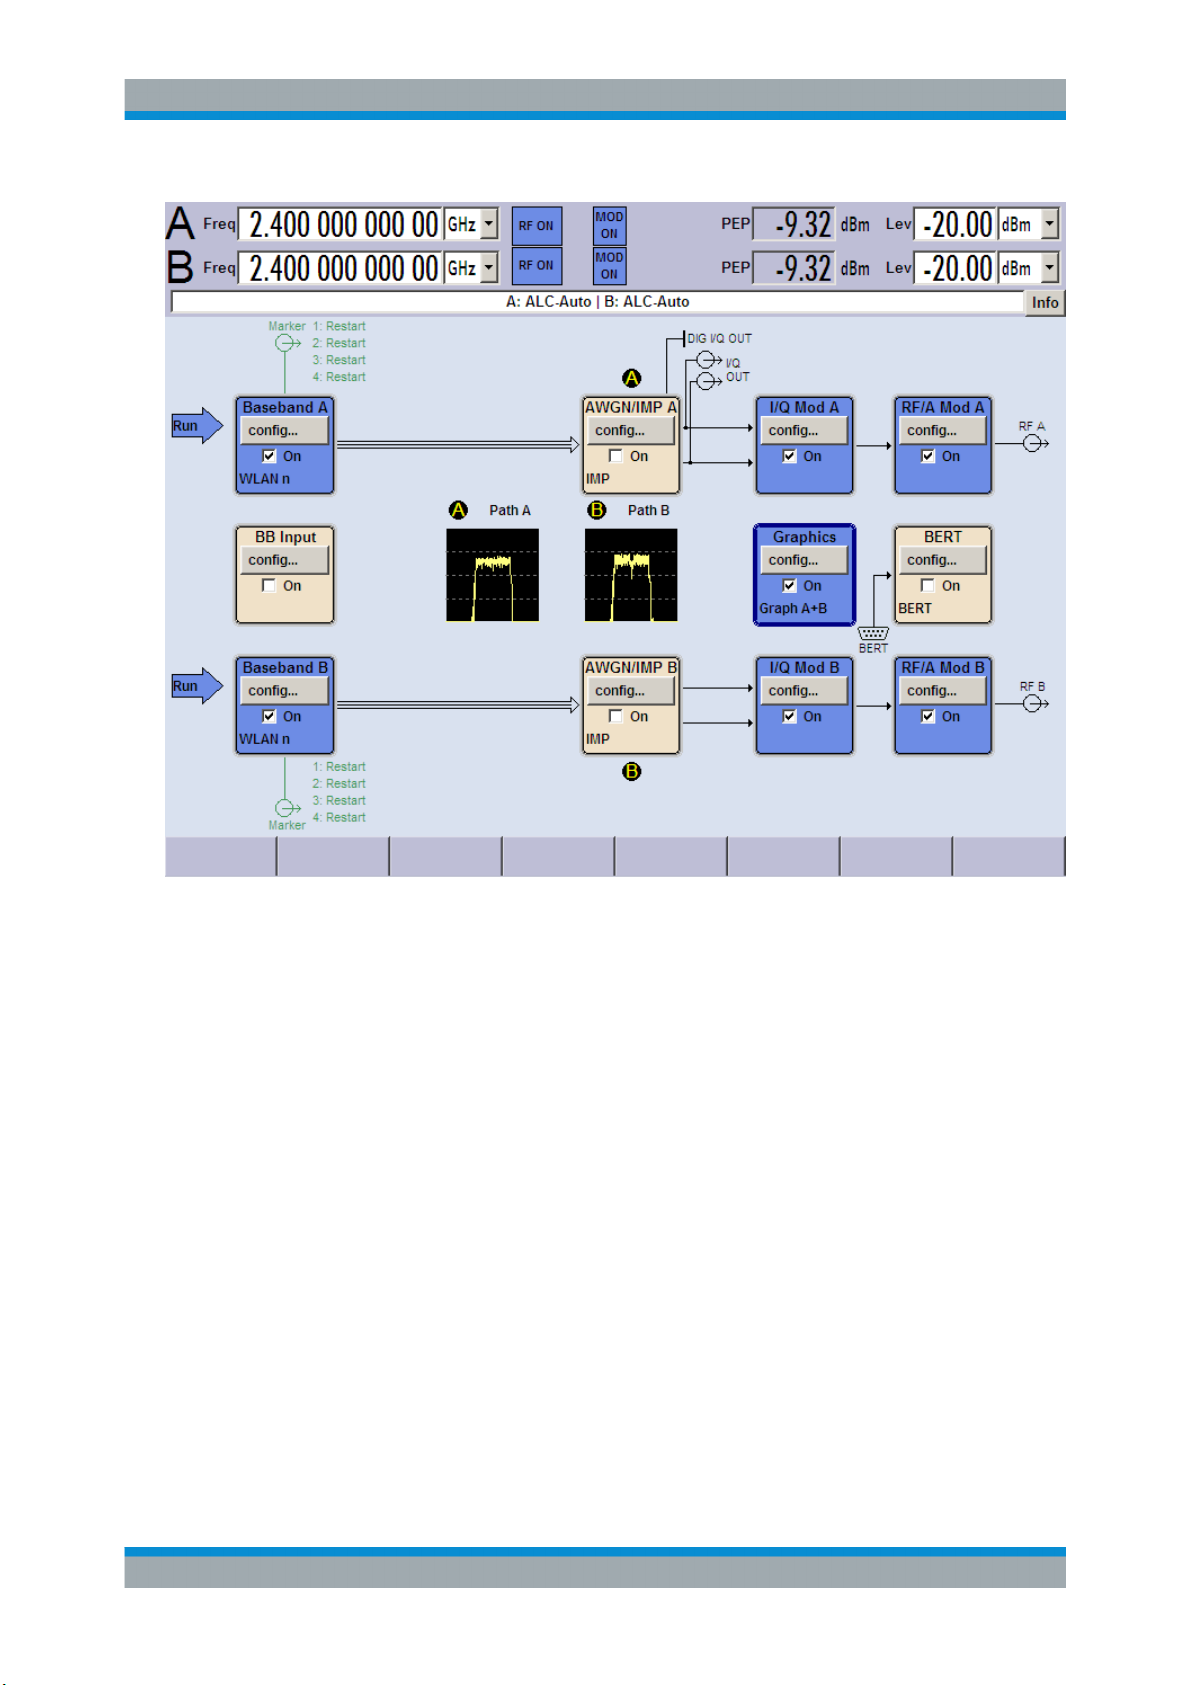
11. Check "Configure Baseband B from Baseband A". This will generate a IEEE
802.11n conform Tx 2 signal for path B of the SMU.
12. Toggle the "State" to On and make sure "RF/A Mod A" and "RF/B Mod B" are
switched on.
20Operating Manual 1176.7649.02 ─ 04.1
R&S® FSV-K91/91n
WLAN TX Measurements (R&S FSV-K91/91n)
Signal Processing of the IEEE 802.11a Application
13. Using the "Graphics | Power Spectrum" display shows the power spectrum for both
antennas.
14. Now set up the spectrum analyzer with the R&S FSVR-K91n option to perform the
WLAN MIMO measurements. Start the R&S FSVR-K91n application.
15. Select "Standard" IEEE 802.11n (MIMO).
Set the "RF Frequency" the DUT is transmitting.
16. Set "Trigger Mode" to "External".
Select the "STC/MIMO" tab in the "General Settings" dialog box.
17. Select "DUT MIMO configuration" 2 Tx Antennas.
18. Set the "IP Address" of the slave in the "MIMO Measurement Setup" table and turn
the "State" of the slave to ON.
3.3 Signal Processing of the IEEE 802.11a Application
This description gives a rough view of the IEEE 802.11a application signal processing.
Details are disregarded in order to get a concept overview.
21Operating Manual 1176.7649.02 ─ 04.1

R&S® FSV-K91/91n
●
●
Abbreviations
WLAN TX Measurements (R&S FSV-K91/91n)
Signal Processing of the IEEE 802.11a Application
chapter 3.3.1, "Understanding Signal Processing of the IEEE 802.11a Application",
on page 22
chapter 3.3.2, "Literature to the IEEE 802.11a Application", on page 29
a
l,k
EVM
k
EVM error vector magnitude of current packet
g signal gain
Δf frequency deviation between TX and RX
l symbol index l = [1, nof_Symbols]
nof_symbols number of symbols of payload
H
k
k channel index k = [–31,32]
K
mod
ξ relative clock error of reference oscillator
r
l,k
3.3.1 Understanding Signal Processing of the IEEE 802.11a Application
symbol at symbol l of subcarrier k
error vector magnitude of subcarrier k
channel transfer function of subcarrier k
modulation-dependent normalization factor
subcarrier of symbol l
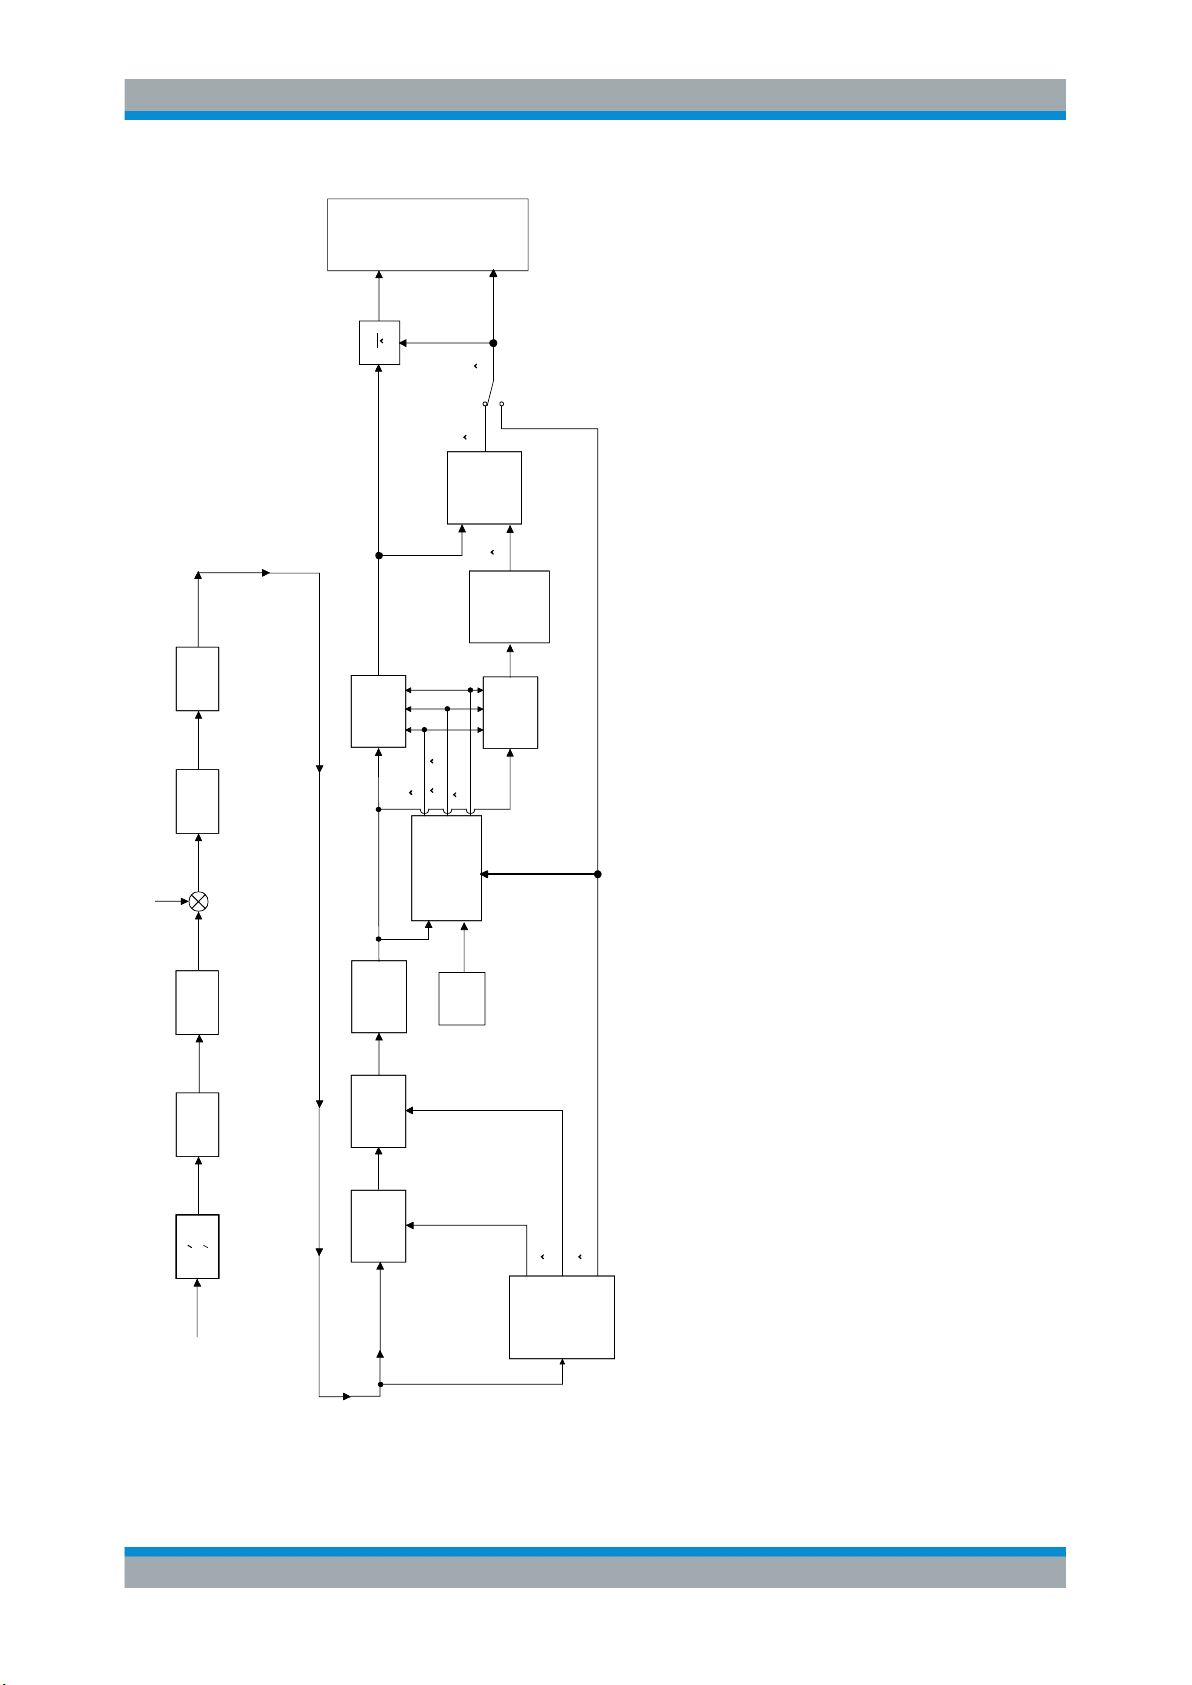
A diagram of the interesting blocks is shown in figure 3-1. First the RF signal is down
converted to the IF frequency fIF = 96 MHz. The resulting IF signal rIF(t) is shown on the
left-hand side of the figure. After bandpass filtering, the signal is sampled by an Analog
to Digital Converter (ADC) at a sampling rate of fs1 = 128 MHz. This digital sequence is
resampled. Thus the sampling rate of the down sampled sequence r(i) is the Nyquist
rate of fs3 = 20 MHz. Up to this point the digital part is implemented in an ASIC.
In the lower part of the figure the subsequent digital signal processing is shown. In the
first block the packet search is performed. This block detects the Long Symbol (LS)
and recovers the timing. The coarse timing is detected first. This search is implemented in the time domain. The algorithm is based on cyclic repetition within the LS after N
= 64 samples. Numerous treatises exist on this subject, e.g. [1] to [3].
Furthermore a coarse estimate Δ
of the Rx-Tx frequency offset Δf is derived from
coarse
the metric in [6]. (The hat generally indicates an estimate, e.g. is the estimate of x.)
This can easily be understood because the phase of r(i) Δ r* (i + N) is determined by
the frequency offset. As the frequency deviation Δf can exceed half a bin (distance
between neighboring sub-carriers) the preceding Short Symbol (SS) is also analyzed in
order to detect the ambiguity.
After the coarse timing calculation the time estimate is improved by the fine timing calculation. This is achieved by first estimating the coarse frequency response Ĥ
(LS)
, with
k
k = [–26, 26] denoting the channel index of the occupied sub-carriers.
22Operating Manual 1176.7649.02 ─ 04.1

R&S® FSV-K91/91n
First the FFT of the LS is calculated. After the FFT calculation the known symbol information of the LS sub-carriers is removed by dividing by the symbols. The result is a
coarse estimate Ĥk of the channel transfer function.
In the next step the complex channel impulse response is computed by an IFFT. Next
the energy of the windowed impulse response (the window size is equal to the guard
period) is calculated for every trial time. Afterwards the trail time of the maximum
energy is detected. This trial time is used to adjust the timing.
Now the position of the LS is known and the starting point of the useful part of the first
payload symbol can be derived. In the next block this calculated time instant is used to
position the payload window. Only the payload part is windowed. This is sufficient
because the payload is the only subject of the subsequent measurements.
In the next block the windowed sequence is compensated by the coarse frequency
estimate Δ
would occur in the frequency domain.
WLAN TX Measurements (R&S FSV-K91/91n)
Signal Processing of the IEEE 802.11a Application
. This is necessary because otherwise inter channel interference (ICI)
course
23Operating Manual 1176.7649.02 ─ 04.1
R&S® FSV-K91/91n
l,k
r''
1
measurement
k
H
of
parameters
k
H
(PL)
k
H
channel
estimation
l,k
a
WLAN TX Measurements (R&S FSV-K91/91n)
Signal Processing of the IEEE 802.11a Application
pilots + data
r(i)
= 20MHz
s3
f
l,k
r'
estimate
data symbols
data
user defined
compensation
l
, d
rest
f
l
g
full
compensation
l
FIR
S2
·kT
IF
-j
e
l,k
r
Resampler
=128MHz
ADC
f
s1
FFT
frequency
estimation
N = 64
compensation
of
gain, frequency, time
l,k
a
pilot
table
~~~
f
coarse
)
(LS
k
H
payload
window
timing
LS
(t)
IF
r
1.coarse timing
packet search:
2.fine timing
Fig. 3-1: Signal processing of the IEEE 802.11a application
24Operating Manual 1176.7649.02 ─ 04.1
R&S® FSV-K91/91n
kl
phasephasej
klkl
neHgaKr
kl
common
l
kl
,
(
,mod
)timing(
,
)(
,
The transition to the frequency domain is achieved by an FFT of length 64. The FFT is
performed symbol-wise for every of the "nof_symbols" symbols of the payload. The
calculated FFTs are described by r
●
●
In case of an additive white Gaussian noise (AWGN) channel the FFT is described by
[4], [5]
with:
●
●
●
●
●
●
●
WLAN TX Measurements (R&S FSV-K91/91n)
Signal Processing of the IEEE 802.11a Application
with:
l,k
l = [1, nof_symbols] as the symbol index
k = [–31, 32] as the channel index
Equation (10) (3 - 1)
k
: the modulation-dependant normalization factor
mod
a
: the symbol of sub-carrier k at symbol l
l,k
gl: the gain at the symbol l in relation to the reference gain g = 1 at the long symbol
(LS)
Hk: the channel frequency response at the long symbol (LS)
(common)
l
: the common phase drift phase of all sub-carriers at symbol l (see Equa-
tion (11))
l,k
(timing)
: the phase of sub-carrier k at symbol l caused by the timing drift (see
phase
Equation (11))
n
: the independent Gaussian distributed noise samples
l,k
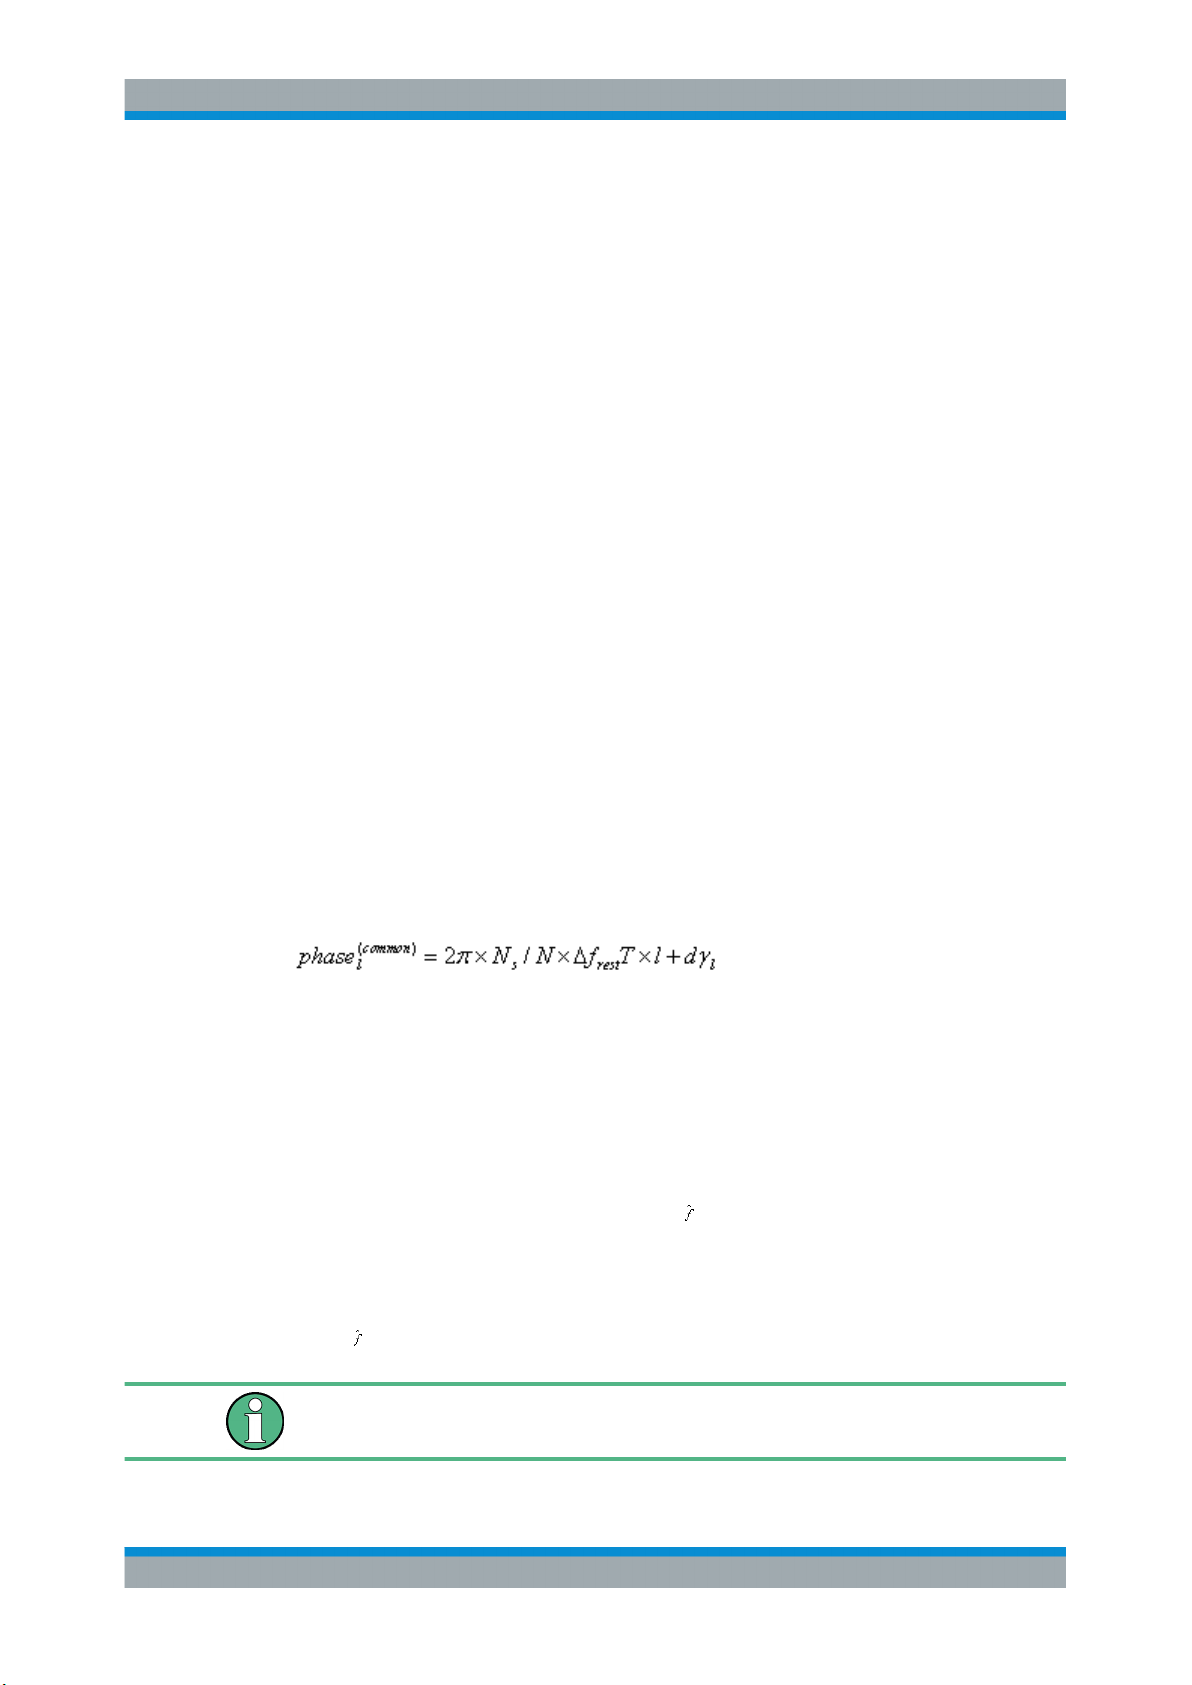
The common phase drift in Equation (10) is given by:
Equation (11) (3 - 2)
with
●
Ns = 80: the number of Nyquist samples of the symbol period
●
N = 64: the number of Nyquist samples of the useful part of the symbol
●
Δ f
: the (not yet compensated) frequency deviation
rest
●
dϒ l: the phase jitter at the symbol l
In general, the coarse frequency estimate Δ
802.11a application) is not error-free. Therefore the remaining frequency error Δf
represents the frequency deviation in r
not yet compensated. Consequently, the over-
l,k
(see) Signal processing of the IEEE
coarse
rest
all frequency deviation of the device under test (DUT) is calculated by:
Δf = Δ
coarse
+ Δf
rest
The only motivation for dividing the common phase drift in Equation (11) into two parts
is to be able to calculate the overall frequency deviation of the DUT.
25Operating Manual 1176.7649.02 ─ 04.1

R&S® FSV-K91/91n
lkNNphase
skl
/2
)timing(
,
The reason for the phase jitter dγ l in Equation (11) may be different. The nonlinear
part of the phase jitter may be caused by the phase noise of the DUT oscillator.
Another reason for nonlinear phase jitter may be the increase of the DUT amplifier
temperature at the beginning of the burst. Note that besides the nonlinear part the
phase jitter, dγ l also contains a constant part. This constant part is caused by the fre-
quency deviation Δ f
measurement of the phase starts at the first symbol l = 1 of the payload. In contrast the
channel frequency response Hk in Equation (10) represents the channel at the long
symbol of the preamble. Consequently, the frequency deviation Δ f
sated produces a phase drift between the long symbol and the first symbol of the pay-
load. Therefore, this phase drift appears as a constant value ("DC value") in dϒ l.
Referring to the IEEE 802.11a measurement standard Chapter 17.3.9.7 "Transmit
modulation accuracy test'' [6], the common phase drift phasel
ted and compensated from the pilots. Therefore this "symbol-wise phase tracking''
(Tracking Phase) is activated as the default setting of the R&S FSV-K91/91n.
Furthermore, the timing drift in Equation (10) is given by:
WLAN TX Measurements (R&S FSV-K91/91n)
Signal Processing of the IEEE 802.11a Application
not yet compensated. To understand this, keep in mind that the
rest
not yet compen-
rest
(common)
must be estima-
Equation (12) (3 - 3)
with ξ: the relative clock deviation of the reference oscillator
Normally, a symbol-wise timing jitter is negligible and thus not modeled in Equation
(12). However, there may be situations where the timing drift has to be taken into
account. This is illustrated by an example: In accordance to [6], the allowed clock deviation of the DUT is up to ξ
= 20 ppm. Furthermore, a long packet with 400 symbols
max
is assumed. The result of Equation (10) and Equation (12), is that the phase drift of the
highest sub-carrier k = 26 in the last symbol l = nof_symbols is 93 degrees. Even in
the noise-free case, this would lead to symbol errors. The example shows that it is
actually necessary to estimate and compensate the clock deviation, which is accomplished in the next block.
Referring to the IEEE 802.11a measurement standard [6], the timing drift phase
(timing)
l,k
is not part of the requirements. Therefore the "time tracking" (Tracking Time) is not
activated as the default setting of the R&S FSV-K91/91n. The time tracking option
should rather be seen as a powerful analyzing option.
In addition, the tracking of the gain gl in Equation (10) is supported for each symbol in
relation to the reference gain g = 1 at the time instant of the long symbol (LS). At this
time the coarse channel transfer function Ĥ
This makes sense since the sequence r
fer function Ĥ
(LS)
before estimating the symbols. Consequently, a potential change of
k
(LS)
is calculated.
k
'
is compensated by the coarse channel trans-
l,k
the gain at the symbol l (caused, for example, by the increase of the DUT amplifier
temperature) may lead to symbol errors especially for a large symbol alphabet M of the
MQAM transmission. In this case the estimation and the subsequent compensation of
the gain are useful.
26Operating Manual 1176.7649.02 ─ 04.1
R&S® FSV-K91/91n
Referring to the IEEE 802.11a measurement standard [6], the compensation of the
gain gl is not part of the requirements. Therefore the "gain tracking"' (Tracking Gain) is
not activated as the default setting of the R&S FSV-K91/91n.
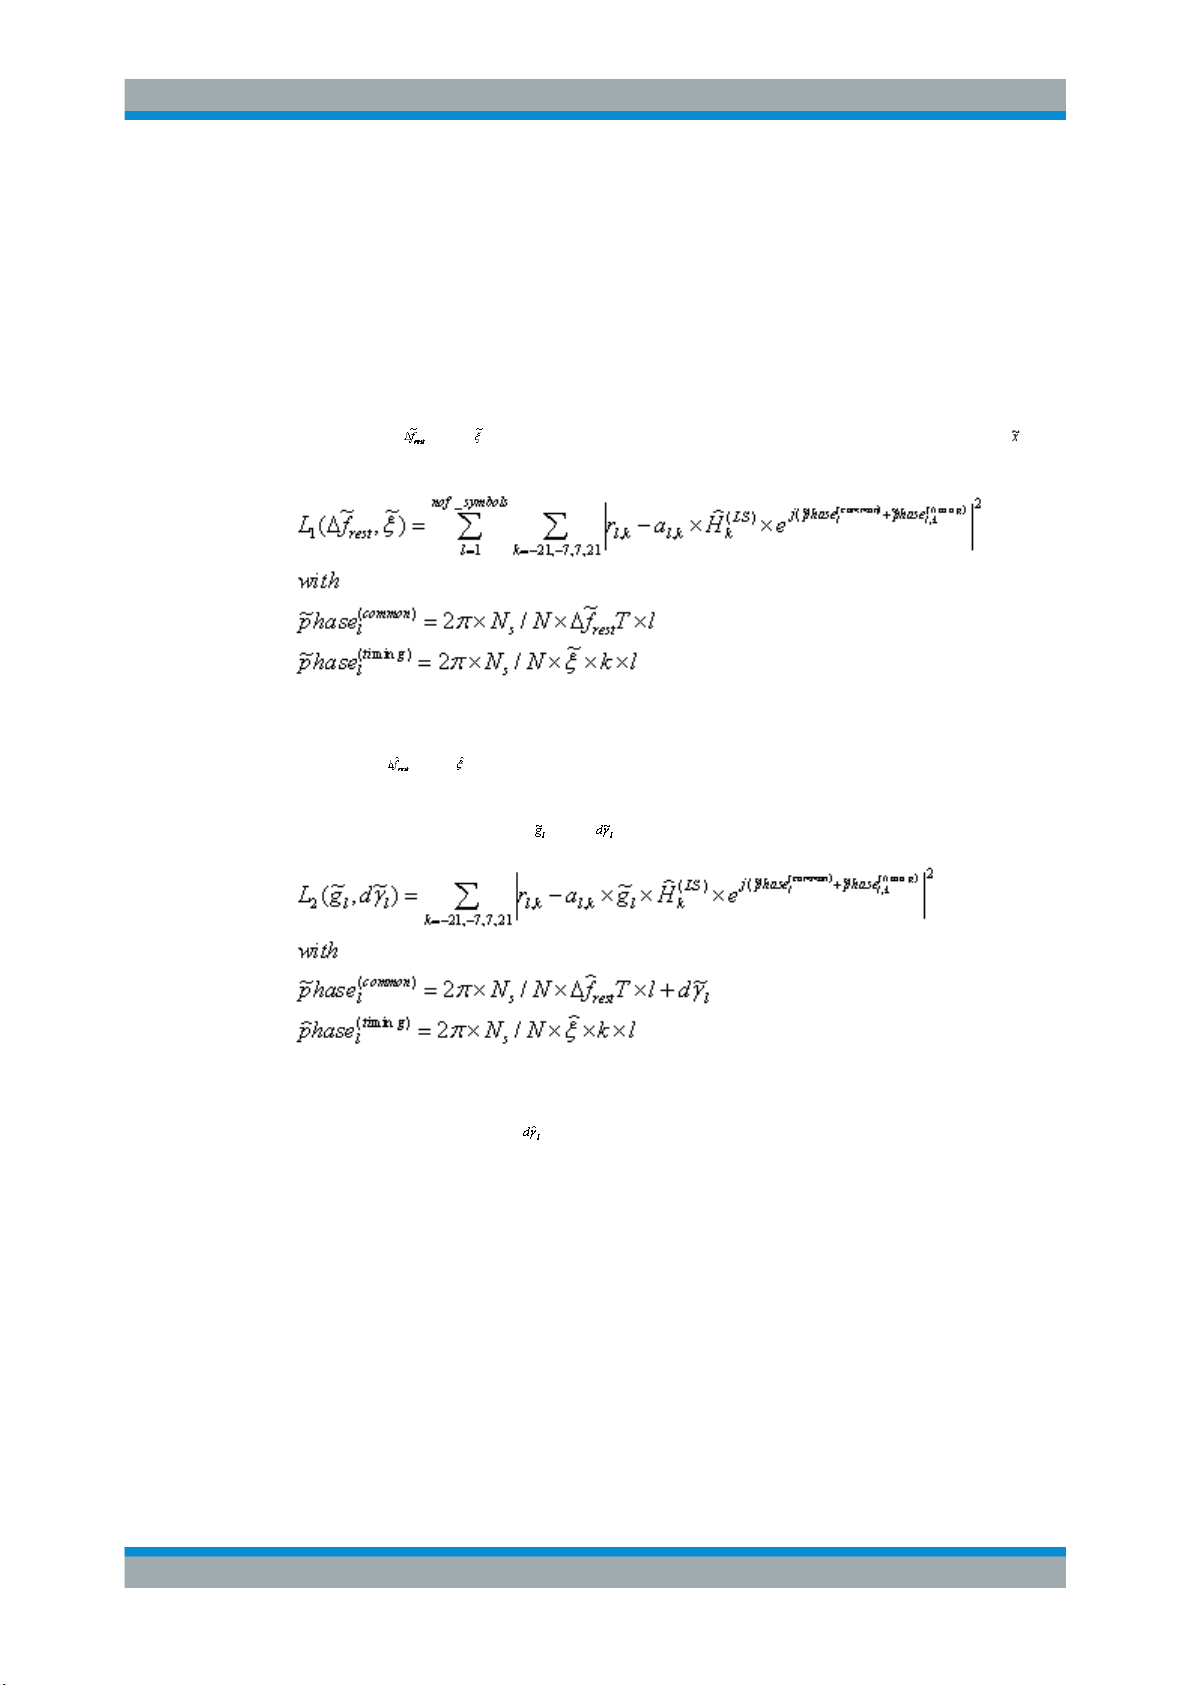
How can the parameters above be calculated? In this application the optimum maximum likelihood algorithm is used. In the first estimation step the symbol-independent
parameters Δ f
neglected in this step, i.e. the parameters are set to gl = 1 and dγ = 0. Referring to
Equation (10), the log likelihood function L must be calculated as a function of the trial
parameters
the trial parameter of x.)
WLAN TX Measurements (R&S FSV-K91/91n)
Signal Processing of the IEEE 802.11a Application
and ξ are estimated. The symbol dependent parameters can be
rest
and . (The tilde generally describes a trial parameter. Example: is
(13a) (3 - 4)
The trial parameters leading to the minimum of the log likelihood function are used as
estimates
and . In (13a) the known pilot symbols a
are read from a table.
l,k
In the second step, the log likelihood function is calculated for every symbol l as a function of the trial parameters and :
(13b) (3 - 5)
Finally, the trial parameters leading to the minimum of the log likelihood function are
used as estimates ĝl and .
This robust algorithm works well even at low signal to noise ratios with the Cramer Rao
Bound being reached.
After estimation of the parameters, the sequence r
is compensated in the compensa-
l,k
tion blocks.
In the upper analyzing branch the compensation is user-defined i.e. the user determines which of the parameters are compensated. This is useful in order to extract the
influence of these parameters. The resulting output sequence is described by: γ
'
.
δ,k
In the lower compensation branch the full compensation is always performed. This
separate compensation is necessary in order to avoid symbol errors. After the full compensation the secure estimation of the data symbols â
is performed. From Equation
l,k
27Operating Manual 1176.7649.02 ─ 04.1

R&S® FSV-K91/91n
packetsnof
counter
counterEVM
packetsnof
EVM
_
1
2
)(
_
1
26
)0(26
2
52
1
kk
k
EVMEVM
symbolsnof
l
klklk
aKr
symbolsnof
EVM
_
1
2
,mod
''
,
_
1
(10) it is clear that first the channel transfer function Hk must be removed. This is ach-
ieved by dividing the known coarse channel estimate Ĥ
Usually an error free estimation of the data symbols can be assumed.
In the next block a better channel estimate Ĥ
calculated by using all nof_symbols symbols of the payload (PL). This can be accom-
plished at this point because the phase is compensated and the data symbols are
known. The long observation interval of nof_symbols symbols (compared to the short
interval of 2 symbols for the estimation of Ĥ
estimate.
In the following equalizer block Ĥ
resulting channel-compensated sequence is described by γ
choose the coarse channel estimate Ĥ
free channel estimate Ĥ
mate Ĥ
expected.
According to the IEEE 802.11a measurement standard [6], the coarse channel estimation Ĥ
setting of the R&S FSV-K91/91n is equalization from the coarse channel estimate
derived from the long symbol.
WLAN TX Measurements (R&S FSV-K91/91n)
Signal Processing of the IEEE 802.11a Application
(LS)
calculated from the LS.
k
(PL)
of the data and pilot sub-carriers is
k
(LS)
) leads to a nearly error-free channel
k
(LS)
is compensated by the channel estimate. The
k
(LS)
(from the long symbol) or the nearly error-
(PL)
(from the payload) for equalization. If the improved esti-
(LS)
is used, a 2 dB reduction of the subsequent EVM measurement can be
k
(LS)
(from the long symbol) has to be used for equalization. Therefore the default
k
k
k
''
. The user may either
δ,k
In the last block the measurement variables are calculated. The most important variable is the error vector magnitude of the sub-carrier "k" of the current packet:
(14) (3 - 6)
Furthermore, the packet error vector magnitude is derived by averaging the squared
EVMk versus k:
(15) (3 - 7)
Finally, the average error vector magnitude is calculated by averaging the packet EVM
of all nof_symbols detected packets:
(16) (3 - 8)
This parameter is equivalent to the so-called "RMS average of all errors": Error
RMS
of
the IEEE 802.11a measurement commandment (see [6], ).
28Operating Manual 1176.7649.02 ─ 04.1

R&S® FSV-K91/91n
WLAN TX Measurements (R&S FSV-K91/91n)
Signal Processing of the IEEE 802.11b Application
3.3.2 Literature to the IEEE 802.11a Application
3.4 Signal Processing of the IEEE 802.11b Application
[1] Speth, Classen, Meyr: ''Frame synchronization of OFDM systems in frequency selective fading
channels", VTC '97, pp. 1807-1811
[2] Schmidl, Cox: ''Robust Frequency and Timing Synchronization of OFDM", IEEE Trans. on Comm.,
Dec. 1997, pp. 1613-621
[3] Minn, Zeng, Bhargava: ''On Timing Offset Estimation for OFDM", IEEE Communication Letters,
July 2000, pp. 242-244
[4] Speth, Fechtel, Fock, Meyr: ''Optimum Receiver Design for Wireless Broad-Band Systems Using
OFDM – Part I", IEEE Trans. On Comm. VOL. 47, NO 11, Nov. 1999
[5] Speth, Fechtel, Fock, Meyr: ''Optimum Receiver Design for Wireless Broad-Band Systems Using
OFDM – Part II", IEEE Trans. On Comm. VOL. 49, NO 4, April. 2001
[6] IEEE 802.11a, Part 11: Wireless LAN Medium Access Control (MAC) and Physical Layer (PHY)
specifications
This description gives a rough overview of the signal processing concept of the IEEE
802.11b application.
●
chapter 3.4.1, "Understanding Signal Processing of the IEEE 802.11b Application",
on page 30
●
chapter 3.4.2, "Literature of the IEEE 802.11b Application", on page 35
Abbreviations
ε timing offset
Δ"f" frequency offset
ΔΦ phase offset
ARG{...} calculation of the angle of a complex value
EVM error vector magnitude
ĝ
I
ĝ
Q
Δĝ
Q
ĥs(v) estimated baseband filter of the transmitter
ĥr(v) estimated baseband filter of the receiver
ô
I
ô
Q
estimate of the gain factor in the I-branch
estimate of the gain factor in the Q-branch
accurate estimate of the crosstalk factor of the Q-branch in the I-branch
estimate of the IQ-offset in the I-branch
estimate of the IQ-offset in the I-branch
r(v) measurement signal
ŝ(v) estimate of the reference signal
29Operating Manual 1176.7649.02 ─ 04.1

R&S® FSV-K91/91n
WLAN TX Measurements (R&S FSV-K91/91n)
Signal Processing of the IEEE 802.11b Application
ŝn(v) estimate of the power normalized and undisturbed reference signal
REAL{...} calculation of the real part of a complex value
IMAG{...} calculation of the imaginary part of a complex value
3.4.1 Understanding Signal Processing of the IEEE 802.11b Application
A block diagram of the measurement application is shown below in figure 3-2. The
baseband signal of an IEEE 802.11b wireless LAN system transmitter is sampled with
a sampling rate of 44 MHz.
The first task of the measurement application is to detect the position of the bursts
within the measurement signal r1(v). The detection algorithm is able to find the posi-
tions of the beginning of short and long bursts and can distinguish between them. The
algorithm also detects the initial state of the scrambler. This is required if IEEE 802.11
signals should be analyzed, because this standard does not specify the initial state of
the scrambler.
With the knowledge of the start position of the burst, the header of the burst can be
demodulated. The bits transmitted in the header provide information about the length
of the burst and the modulation type used in the PSDU.
After the start position and the burst length is fully known, better estimates of timing offset, timing drift, frequency offset and phase offset can be calculated using the entire
data of the burst.
At this point of the signal processing a demodulation can be performed without decision error. After demodulation the normalized and undisturbed reference signal s(v) is
available.
If the frequency offset is not constant and varies with time, the frequency- and phase
offset in several partitions of the burst must be estimated and corrected. Additionally,
timing offset, timing drift and gain factor can be estimated and corrected in several partitions of the burst. These corrections can be separately switched off in the "Demod
Settings" menu.
30Operating Manual 1176.7649.02 ─ 04.1
 Loading...