


R&S® FSV-K72
Firmware Option 3GPP FDD BTS
Measurement
Operating Manual
(;ÚÙâ2)
1176.7584.02 ─ 03.1
Operating Manual
Test & Measurement

This manual describes the following options:
●
R&S FSV-K72 (1310.8055.02)
The contents of this manual correspond to the following R&S®FSVR models with firmware version 2.23 or
higher:
●
R&S®FSVR7 (1311.0006K7)
●
R&S®FSVR13 (1311.0006K13)
●
R&S®FSVR30 (1311.0006K30)
●
R&S®FSVR40 (1311.0006K40)
The software contained in this product makes use of several valuable open source software packages. For information, see the
"Open Source Acknowledgement" on the user documentation CD-ROM (included in delivery).
Rohde & Schwarz would like to thank the open source community for their valuable contribution to embedded computing.
© 2015 Rohde & Schwarz GmbH & Co. KG
Mühldorfstr. 15, 81671 München, Germany
Phone: +49 89 41 29 - 0
Fax: +49 89 41 29 12 164
Email: info@rohde-schwarz.com
Internet: www.rohde-schwarz.com
Subject to change – Data without tolerance limits is not binding.
R&S® is a registered trademark of Rohde & Schwarz GmbH & Co. KG.
Trade names are trademarks of the owners.
The following abbreviations are used throughout this manual: R&S®FSV is abbreviated as R&S FSV. R&S®FSVR is abbreviated as
R&S FSVR.

R&S® FSV-K72
1 Preface.................................................................................................... 5
1.1 Documentation Overview............................................................................................. 5
1.2 Conventions Used in the Documentation...................................................................7
1.3 How to Use the Help System........................................................................................8
2 Introduction.......................................................................................... 10
3 Setup for Base Station Tests.............................................................. 11
4 3GPP FDD BTS Test Models............................................................... 13
5 Instrument Functions 3GPP Base Station Measurements...............15
5.1 Measurements and Result Diagrams........................................................................ 16
Contents
Contents
5.2 Working with the Frequency Mask Trigger...............................................................17
5.3 Further Information.....................................................................................................22
6 Configuration of 3GPP FDD BTS Measurements..............................31
6.1 Code Domain Analyzer Measurements.....................................................................32
6.2 Time Alignment Error Measurement......................................................................... 88
6.3 RF Measurements....................................................................................................... 89
7 Measurement Examples (R&S FSV-K72)......................................... 117
7.1 Basic Settings in Code Domain Measurement Mode............................................ 117
7.2 Measurement 1: Measurement of the Signal Channel Power............................... 118
7.3 Measurement 2: Measurement of the Spectrum Emission Mask......................... 119
7.4 Measurement 3: Measurement of the Relative Code Domain Power................... 120
7.5 Measurement 4: Triggered Measurement of Relative Code Domain Power........122
7.6 Measurement 5: Measurement of the Composite EVM......................................... 123
7.7 Measurement 6: Measurement of Peak Code Domain Error.................................124
7.8 Measurement 7: Measurement of the Trigger To Frame Time..............................125
8 Remote Control Commands..............................................................128
8.1 Notation......................................................................................................................129
8.2 CALCulate subsystem (R&S FSV-K72)................................................................... 131
8.3 CONFigure:WCDPower subsystem (R&S FSV-K72).............................................. 179
8.4 DISPlay subsystem (R&S FSV-K72)........................................................................ 186
3Operating Manual 1176.7584.02 ─ 03.1

R&S® FSV-K72
8.5 INSTrument subsystem............................................................................................ 191
8.6 SENSe subsystem (R&S FSV-K72)..........................................................................192
8.7 STATus:QUEStionable subsystem (R&S FSV-K72)...............................................218
8.8 TRACe subsystem (R&S FSV-K72)..........................................................................220
8.9 Other Commands Referenced in this Manual........................................................ 229
9 Error Messages.................................................................................. 246
10 Glossary..............................................................................................247
Contents
List of Commands..............................................................................248
Index....................................................................................................253
4Operating Manual 1176.7584.02 ─ 03.1

R&S® FSV-K72
1 Preface
Preface
Documentation Overview
1.1 Documentation Overview
The user documentation for the R&S FSVR is divided as follows:
●
Quick Start Guide
●
Operating Manuals for base unit and options
●
Service Manual
●
Online Help
●
Release Notes
Quick Start Guide
This manual is delivered with the instrument in printed form and in PDF format on the
CD. It provides the information needed to set up and start working with the instrument.
Basic operations and basic measurements are described. Also a brief introduction to
remote control is given. The manual includes general information (e.g. Safety Instructions) and the following chapters:
Chapter 1 Introduction, General information
Chapter 2 Front and Rear Panel
Chapter 3 Preparing for Use
Chapter 4 Firmware Update and Installation of Firmware Options
Chapter 5 Basic Operations
Chapter 6 Basic Measurement Examples
Chapter 7 Brief Introduction to Remote Control
Appendix Printer Interface
Appendix LAN Interface
Operating Manuals
The Operating Manuals are a supplement to the Quick Start Guide. Operating Manuals
are provided for the base unit and each additional (software) option.
The Operating Manual for the base unit provides basic information on operating the
R&S FSVR in general, and the "Spectrum" mode in particular. Furthermore, the software options that enhance the basic functionality for various measurement modes are
described here. The set of measurement examples in the Quick Start Guide is expanded by more advanced measurement examples. In addition to the brief introduction to
remote control in the Quick Start Guide, a description of the basic analyzer commands
and programming examples is given. Information on maintenance, instrument interfaces and error messages is also provided.
5Operating Manual 1176.7584.02 ─ 03.1

R&S® FSV-K72
Preface
Documentation Overview
In the individual option manuals, the specific instrument functions of the option are
described in detail. For additional information on default settings and parameters, refer
to the data sheets. Basic information on operating the R&S FSVR is not included in the
option manuals.
The following Operating Manuals are available for the R&S FSVR:
●
R&S FSVR base unit; in addition:
– R&S FSV-K7S Stereo FM Measurements
– R&S FSV-K9 Power Sensor Support
– R&S FSV-K14 Spectrogram Measurement
●
R&S FSV-K10 GSM/EDGE Measurement
●
R&S FSV-K30 Noise Figure Measurement
●
R&S FSV-K40 Phase Noise Measurement
●
R&S FSV-K70 Vector Signal Analysis Operating Manual
R&S FSV-K70 Vector Signal Analysis Getting Started (First measurements)
●
R&S FSV-K72 3GPP FDD BTS Analysis
●
R&S FSV-K73 3GPP FDD UE Analysis
●
R&S FSV-K76/77 3GPP TD-SCDMA BTS/UE Measurement
●
R&S FSV-K82/83 CDMA2000 BTS/MS Analysis
●
R&S FSV-K84/85 1xEV-DO BTS/MS Analysis
●
R&S FSV-K91 WLAN IEEE 802.11
●
R&S FSV-K93 WiMAX IEEE 802.16 OFDM/OFDMA Analysis
●
R&S FSV-K100/K104 EUTRA / LTE Downlink Measurement Application
●
R&S FSV-K101/K105 EUTRA / LTE Uplink Measurement Application
These manuals are available in PDF format on the CD delivered with the instrument.
Service Manual
This manual is available in PDF format on the CD delivered with the instrument. It
describes how to check compliance with rated specifications, instrument function,
repair, troubleshooting and fault elimination. It contains all information required for
repairing the R&S FSVR by replacing modules. The manual includes the following
chapters:
Chapter 1 Performance Test
Chapter 2 Adjustment
Chapter 3 Repair
Chapter 4 Software Update / Installing Options
Chapter 5 Documents
Online Help
The online help contains context-specific help on operating the R&S FSVR and all
available options. It describes both manual and remote operation. The online help is
6Operating Manual 1176.7584.02 ─ 03.1

R&S® FSV-K72
Preface
Conventions Used in the Documentation
installed on the R&S FSVR by default, and is also available as an executable .chm file
on the CD delivered with the instrument.
Release Notes
The release notes describe the installation of the firmware, new and modified functions, eliminated problems, and last minute changes to the documentation. The corresponding firmware version is indicated on the title page of the release notes. The current release notes are provided in the Internet.
1.2 Conventions Used in the Documentation
1.2.1 Typographical Conventions
The following text markers are used throughout this documentation:
Convention Description
"Graphical user interface elements"
KEYS Key names are written in capital letters.
File names, commands,
program code
Input Input to be entered by the user is displayed in italics.
Links Links that you can click are displayed in blue font.
"References" References to other parts of the documentation are enclosed by quota-
All names of graphical user interface elements on the screen, such as
dialog boxes, menus, options, buttons, and softkeys are enclosed by
quotation marks.
File names, commands, coding samples and screen output are distinguished by their font.
tion marks.
1.2.2 Conventions for Procedure Descriptions
When describing how to operate the instrument, several alternative methods may be
available to perform the same task. In this case, the procedure using the touchscreen
is described. Any elements that can be activated by touching can also be clicked using
an additionally connected mouse. The alternative procedure using the keys on the
instrument or the on-screen keyboard is only described if it deviates from the standard
operating procedures.
The term "select" may refer to any of the described methods, i.e. using a finger on the
touchscreen, a mouse pointer in the display, or a key on the instrument or on a keyboard.
7Operating Manual 1176.7584.02 ─ 03.1

R&S® FSV-K72
Preface
How to Use the Help System
1.2.3 Notes on Screenshots
When describing the functions of the product, we use sample screenshots. These
screenshots are meant to illustrate as much as possible of the provided functions and
possible interdependencies between parameters.
The screenshots usually show a fully equipped product, that is: with all options installed. Thus, some functions shown in the screenshots may not be available in your particular product configuration.
1.3 How to Use the Help System
Calling context-sensitive and general help
► To display the general help dialog box, press the HELP key on the front panel.
The help dialog box "View" tab is displayed. A topic containing information about
the current menu or the currently opened dialog box and its function is displayed.
For standard Windows dialog boxes (e.g. File Properties, Print dialog etc.), no contextsensitive help is available.
► If the help is already displayed, press the softkey for which you want to display
help.
A topic containing information about the softkey and its function is displayed.
If a softkey opens a submenu and you press the softkey a second time, the submenu
of the softkey is displayed.
Contents of the help dialog box
The help dialog box contains four tabs:
●
"Contents" - contains a table of help contents
●
"View" - contains a specific help topic
●
"Index" - contains index entries to search for help topics
●
"Zoom" - contains zoom functions for the help display
To change between these tabs, press the tab on the touchscreen.
Navigating in the table of contents
●
To move through the displayed contents entries, use the UP ARROW and DOWN
ARROW keys. Entries that contain further entries are marked with a plus sign.
●
To display a help topic, press the ENTER key. The "View" tab with the corresponding help topic is displayed.
8Operating Manual 1176.7584.02 ─ 03.1

R&S® FSV-K72
Preface
How to Use the Help System
●
To change to the next tab, press the tab on the touchscreen.
Navigating in the help topics
●
To scroll through a page, use the rotary knob or the UP ARROW and DOWN
ARROW keys.
●
To jump to the linked topic, press the link text on the touchscreen.
Searching for a topic
1. Change to the "Index" tab.
2. Enter the first characters of the topic you are interested in. The entries starting with
these characters are displayed.
3. Change the focus by pressing the ENTER key.
4. Select the suitable keyword by using the UP ARROW or DOWN ARROW keys or
the rotary knob.
5. Press the ENTER key to display the help topic.
The "View" tab with the corresponding help topic is displayed.
Changing the zoom
1. Change to the "Zoom" tab.
2. Set the zoom using the rotary knob. Four settings are available: 1-4. The smallest
size is selected by number 1, the largest size is selected by number 4.
Closing the help window
► Press the ESC key or a function key on the front panel.
9Operating Manual 1176.7584.02 ─ 03.1

R&S® FSV-K72
2 Introduction
Introduction
This section contains all information required for operation of an R&S FSVR equipped
with application firmware R&S FSV-K72. It covers operation via menus and the remote
control commands for the 3GPP FDD BTS base station test.
This part of the documentation consists of the following chapters:
●
chapter 3, "Setup for Base Station Tests", on page 11
Describes the measurement setup for base station tests.
●
chapter 4, "3GPP FDD BTS Test Models", on page 13
Gives an overview over the test models with different channel configurations.
●
chapter 5, "Instrument Functions 3GPP Base Station Measurements",
on page 15
Describes the instrument functions of 3GPP Base Station Measurements
●
chapter 6, "Configuration of 3GPP FDD BTS Measurements", on page 31
Contains a detailed description of the possible base station test measurements as
a reference for manual operation. This chapter also presents a list of remote control commands associated with each function.
●
chapter 7, "Measurement Examples (R&S FSV-K72)", on page 117
Explains some basic 3GPP°FDD base station tests.
●
chapter 8, "Remote Control Commands", on page 128
Describes all remote control commands defined for the code domain measurement. An alphabetic list of all remote control commands are provided at the end of
this document.
●
chapter 9, "Error Messages", on page 246
Contains device-specific error messages for R&S FSV-K72.
●
chapter 10, "Glossary", on page 247
Contains an explanation of terms related to measured quantities of the code
domain measurement.
This part of the documentation includes only functions of the application firmware
R&S FSV-K72. For all other descriptions, please refer to the description of the base
unit at the beginning of the documentation.
10Operating Manual 1176.7584.02 ─ 03.1

R&S® FSV-K72
3 Setup for Base Station Tests
Setup for Base Station Tests
Risk of instrument damage
Before switching on the instrument, make sure that the following conditions are met:
●
Instrument covers are in place and all fasteners are tightened.
●
All fan openings are unobstructed and the airflow perforations are unimpeded. The
minimum distance from the wall is 10 cm.
●
The instrument is dry and shows no sign of condensation.
●
The instrument is operated in the horizontal position on an even surface.
●
The ambient temperature does not exceed the range specified in the data sheet.
●
Signal levels at the input connectors are all within the specified ranges.
●
Signal outputs are correctly connected and are not overloaded.
Failure to meet these conditions may cause damage to the instrument or other devices
in the test setup.
This section describes how to set up the analyzer for 3GPP FDD BTS base station
tests. As a prerequisite for starting the test, the instrument must be correctly set up and
connected to the AC power supply as described in chapter 1 of the operating manual
for the analyzer. Furthermore, application firmware module R&S FSV-K72 must be
properly installed following the instructions provided in the operating manual for the
analyzer.
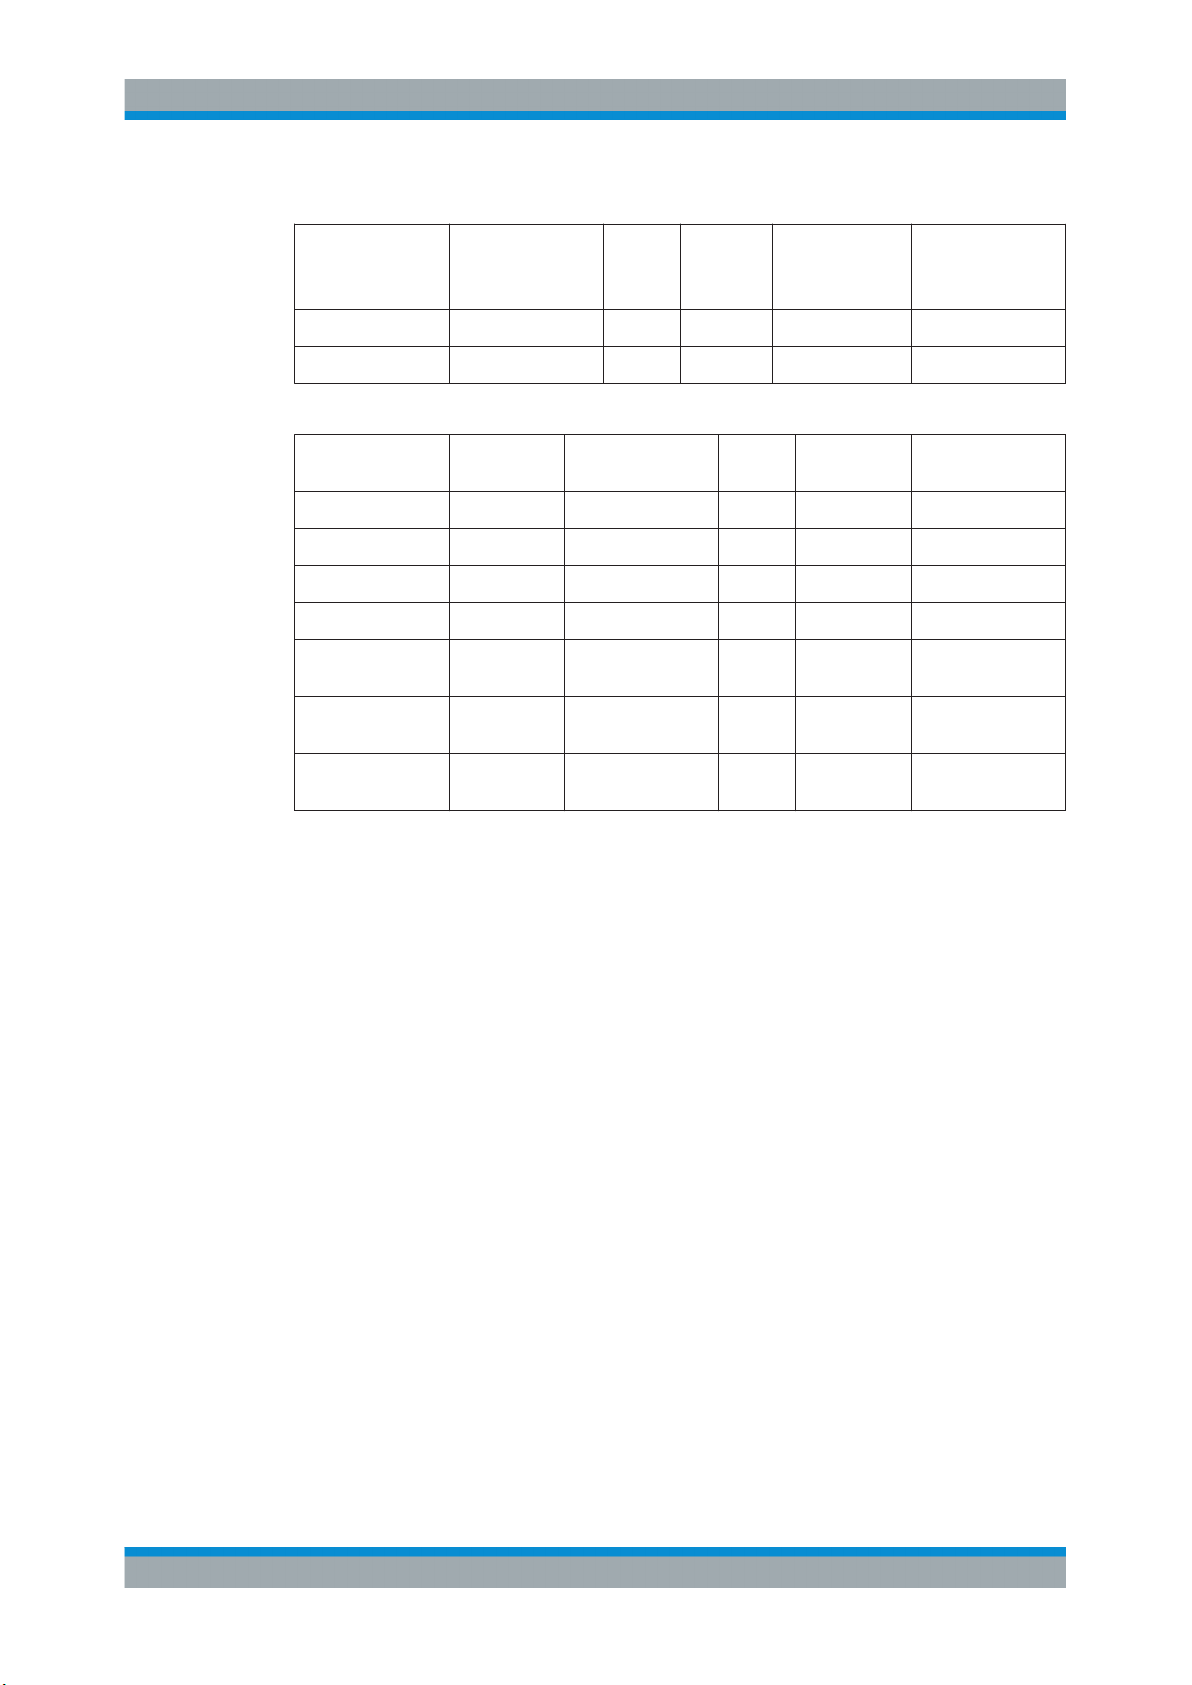
Standard Test Setup
●
Connect antenna output (or TX output) of BTS to RF input of the analyzer via a
power attenuator of suitable attenuation.
The following values are recommended for the external attenuator to ensure that
the RF input of the analyzer is protected and the sensitivity of the analyzer is not
reduced too much.
Max. power Recommended ext. attenuation
≥55 to 60 dBm 35 to 40 dB
≥50 to 55 dBm 30 to 35 dB
≥45 to 50 dBm 25 to 30 dB
≥40 to 45 dBm 20 to 25 dB
≥35 to 40 dBm 15 to 20 dB
≥30 to 35 dBm 10 to 15 dB
≥25 to 30 dBm 5 to 10 dB
11Operating Manual 1176.7584.02 ─ 03.1

R&S® FSV-K72
Setup for Base Station Tests
Max. power Recommended ext. attenuation
≥20 to 25 dBm 0 to 5 dB
<20 dBm 0 dB
●
For signal measurements at the output of two-port networks, connect the reference
frequency of the signal source to the rear reference input of the analyzer (EXT REF
IN/OUT).
●
To ensure that the error limits specified by the 3GPP standard are met, the analyzer should use an external reference frequency for frequency measurements on
base stations. For instance, a rubidium frequency standard may be used as a reference source.
●
If the base station is provided with a trigger output, connect this output to the rear
trigger input of the analyzer (EXT TRIG GATE).
Presetting
●
Enter external attenuation (REF LVL OFFSET)
●
Enter reference level
●
Enter center frequency
●
Set the trigger
●
Select standard and measurement
12Operating Manual 1176.7584.02 ─ 03.1

R&S® FSV-K72
4 3GPP FDD BTS Test Models
3GPP FDD BTS Test Models
For measurements on base-station signals in line with 3GPP, test models with different
channel configurations are specified in the document "Base station conformance testing (FDD)" (3GPP TS 25.141 V5.7.0). An overview of the test models is provided in this
chapter.
Table 4-1: Test model 1
Channel type Number of chan-
nels
PCCPCH+SCH 1 10 -10 1 0
Primary CPICH 1 10 -10 0 0
PICH 1 1.6 -18 16 120
SCCPCH (SF=256) 1 1.6 -18 3 0
DPCH (SF=128) 16/32/64 76.8
Table 4-2: Test model 2
Channel type Number of chan-
nels
PCCPCH+SCH 1 10 -10 1 0
Primary CPICH 1 10 -10 0 0
PICH 1 5 -13 16 120
SCCPCH (SF=256) 1 5 -13 3 0
DPCH (SF=128) 3 2 × 10,
Power
(%)
total
Power
(%)
1 × 50
Level (dB) Spreading
code
see TS
25.141
Level (dB) Spreading
2 × -10, 1 ×-324, 72, 120 1, 7, 2
see TS 25.141 see TS 25.141
code
Timing offset
(×256Tchip)
Timing offset
(x256Tchip)
Table 4-3: Test model 3
Channel type Number of
channels
PCCPCH+SCH 1 12.6/7.9 -9/-11 1 0
Primary CPICH 1 12.6/7.9 -9/-11 0 0
PICH 1 5/1.6 -13/-18 16 120
SCCPCH
(SF=256)
DPCH (SF=256) 16/32 63,7/80,4
1 5/1.6 -13/-18 3 0
Power (%)
16/32
total
Level (dB)
16/32
see TS
25.141
Spreading
code
see TS 25.141 see TS 25.141
Timing offset
(×256Tchip)
13Operating Manual 1176.7584.02 ─ 03.1
R&S® FSV-K72
3GPP FDD BTS Test Models
Table 4-4: Test model 4
Channel type Number of chan-
nels
PCCPCH+SCH 1 50 to 1.6 -3 to -18 1 0
Primary CPICH* 1 10 -10 0 0
Table 4-5: Test model 5
Channel type Number of
channels
PCCPCH+SCH 1 7.9 -11 1 0
Primary CPICH 1 7.9 -11 0 0
PICH 1 1.3 -19 16 120
SCCPCH (SF=256) 1 1.3 -19 3 0
DPCH (SF=256) 30/14/6 14/14.2/14.4 total see TS
HS_SCCH 2 4 total see TS
HS_PDSCH
(16QAM)
8/4/2 63.6/63.4/63.2 total see TS
Power
(%)
16/32
Power (%) Level
Level (dB)
16/32
(dB)
25.141
25.141
25.141
Spreading code Timing offset
Spreading
code
see TS
25.141
see TS
25.141
see TS
25.141
(×256Tchip)
Timing offset
(×256Tchip)
see TS 25.141
see TS 25.141
see TS 25.141
14Operating Manual 1176.7584.02 ─ 03.1

R&S® FSV-K72
5 Instrument Functions 3GPP Base Station
Instrument Functions 3GPP Base Station Measurements
Measurements
The R&S FSVR equipped with the 3GPP Base Station Measurement option R&S FSVK72 performs code domain power measurements on downlink signals according to the
3GPP standard (Third Generation Partnership Project, FDD mode). Signals that meet
the conditions for channel configuration of 3GPP standard test models 1 to 5 can be
measured, including HSDPA and HSUPA signals (test model 5). In addition to the code
domain power measurements specified by the 3GPP standard, the 3GPP Base Station
Measurements option offers measurements with predefined settings in the frequency
domain, e.g. power measurements.
To open the 3GPP BTS menu
●
If the 3G FDD BTS mode is not the active measurement mode, press the MODE
key and activate the 3G FDD BTS option.
●
If the 3G FDD BTS mode is already active, press the HOME key.
The 3GPP BTS menu is displayed.
Menu and Softkey Description
●
chapter 6.1.3, "Softkeys of the Code Domain Analyzer (R&S FSV-K72)",
on page 53
●
chapter 6.3.7, "Softkeys and Menus for RF Measurements (K72)", on page 94
●
chapter 6.1.4, "Softkeys of the Frequency Menu for CDA measurements – FREQ
key (R&S FSV-K72)", on page 70
●
chapter 6.1.5, "Softkeys of the Amplitude Menu – AMPT key (R&S FSV-K72)",
on page 71
●
chapter 6.1.11, "Softkeys of the Auto Set Menu – AUTO SET Key (R&S FSVK72)", on page 82
●
chapter 6.1.6, "Softkeys of the Sweep Menu for CDA Measurements – SWEEP key
(R&S FSV-K72)", on page 74
●
chapter 6.1.7, "Softkeys of the Trigger Menu – TRIG key (R&S FSV-K72)",
on page 76
●
chapter 6.1.8, "Softkeys of the Trace Menu for CDA Measurements – TRACE key
(R&S FSV-K72)", on page 77
●
chapter 6.1.9, "Softkeys of the Marker Menu – MKR key (R&S FSV-K72)",
on page 79
●
chapter 6.1.10, "Softkeys of the Marker To Menu – MKR-> key (R&S FSV-K72)",
on page 80
●
chapter 6.1.12, "Softkeys of the Input/Output Menu for CDA Measurements",
on page 84
The "Span", "Bandwidth", and "Marker Function" menus are disabled for measurements in the CDA mode. For all other measurements (see root menu), the settings are
15Operating Manual 1176.7584.02 ─ 03.1

R&S® FSV-K72
Instrument Functions 3GPP Base Station Measurements
Measurements and Result Diagrams
described together with the measurement. The associated menu corresponds to that of
the measurement in the base unit and is described in the manual for the base unit.
Importing and Exporting I/Q Data
As of firmware version 1.63, I/Q data can be imported from a file for processing in
R&S FSV-K72, and captured I/Q data can be stored to a file ("IQ Import"/"IQ Export"
softkeys in the "Save/Rcl" menu). For details see the base unit description.
To display help to a softkey, press the HELP key and then the softkey for which you
want to display help. To close the help window, press the ESC key. For further information refer to chapter 1.3, "How to Use the Help System", on page 8.
5.1 Measurements and Result Diagrams
The 3GPP Base Station Measurement option provides Code Domain Measurements
and RF measurements.
5.1.1 Code Domain Measurements
The Code Domain Measurement option provides various test measurement types and
result diagrams which are available via the Display Config softkey or the Display Con-
fig button in the Settings Overview dialog box.
The code domain power measurements are performed as specified by the 3GPP
standards. A signal section of approx. 20 ms is recorded for analysis and then
searched through to find the start of a 3GPP FDD BTS frame. If a frame start is found
in the signal, the code domain power analysis is performed for a complete frame starting from slot 0. The different result diagrams are calculated from the recorded IQ data
set. Therefore it is not necessary to start a new measurement in order to change the
result diagram. Common settings for these measurements are performed via the "Settings" dialog box (see "Settings Overview" on page 54).
For details on the measurement modes, see chapter 6.1.2, "Measurement Modes in
Code Domain Analyzer", on page 36
5.1.2 Time Alignment Error Measurements
Time Alignment Error Measurements are a special type of Code Domain Analysis used
to determine the time offset between the signals of both antennas of a base station.
The measurement can be activated in the MEAS menu.
The settings for time alignment measurements are the same as for CDA measurements, although some settings may not be available. For a description see chap-
ter 6.1.3, "Softkeys of the Code Domain Analyzer (R&S FSV-K72)", on page 53.
The result is displayed numerically on the screen, a graphical result is not available.
16Operating Manual 1176.7584.02 ─ 03.1

R&S® FSV-K72
Instrument Functions 3GPP Base Station Measurements
Working with the Frequency Mask Trigger
For details on Time Alignment Error Measurements see chapter 6.2, "Time Alignment
Error Measurement", on page 88.
5.1.3 RF measurements
The RF Measurement option provides the following test measurement types and result
displays:
●
Output Power (see chapter 6.3.1, "Output Power Measurements", on page 90 )
●
Spectrum Emission Mask (see chapter 6.3.2, "Spectrum Emission Mask",
on page 90 )
●
Adjacent Channel Power (see chapter 6.3.3, "Ch Power ACLR", on page 90 )
●
Occupied Bandwidth (see chapter 6.3.4, "Occupied Bandwidth", on page 91 )
●
CCDF (see chapter 6.3.5, "CCDF", on page 92 )
●
RF Combi (see chapter 6.3.6, "RF Combi", on page 93 ")
All these measurements are accessed via the MEAS key ("Measurement" menu).
Some parameters are set automatically according to the 3GPP standard. A list of these
parameters is given with each measurement type. A set of parameters is passed on
from the 3GPP Base Station Measurements option to the base unit and vice versa,
which allows you to switch between applications quickly and easily:
●
center frequency
●
reference level
●
attenuation
●
reference level offset
●
center frequency step size
●
trigger source
●
trigger offset
5.2 Working with the Frequency Mask Trigger
The Frequency Mask Trigger (FMT) is a trigger designed to trigger measurements if
the signal violates certain conditions with respect to a frequency mask that you can
define prior to the measurement.
Availability of the frequency mask trigger
Note that the frequency mask trigger is available for code domain analysis only.
To create and edit a frequency mask, you can access the corresponding dialog box via
the "Frequency Mask" softkey in the trigger menu.
Opening the dialog box also opens a softkey submenu that contains various functionality to work with frequency masks.
17Operating Manual 1176.7584.02 ─ 03.1

R&S® FSV-K72
Instrument Functions 3GPP Base Station Measurements
Working with the Frequency Mask Trigger
1 = Name and description of the frequency mask
2 = Mask point table: table containing all mask points
3 = Preview pane
4 = Frequency mask preview: the area the frequency mask currently covers is red
5 = Frequency mask data points: define the shape of the frequency mask
6 = Preview of the current measurement trace; type and shape depend on currently selected measurement
7 = Insert button: insert a new data points
8 = Shift X button: shifts the complete frequency mask horizontally
9 = Delete button: deletes an existing data points
10 = Shift Y button: shifts the complete frequency mask vertically
11 = Y-Axis Rel/Abs button: switches between relative (dB) and absolute (dBm) amplitude values
12 = Adapt Mask button: creates a frequency mask automatically
13 = Trigger Condition menu: sets the trigger condition
14 = Activate Line buttons: select the upper and lower frequency mask; check marks next to the buttons acti-
vate and deactivate a line
5.2.1 Creating a Frequency Mask
Upon opening the "Edit Frequency Mask" dialog box, the R&S FSVR already provides
a basic structure of an upper frequency mask in the live preview window.
It is also possible to create a new mask by pressing the "New Mask" softkey. The "New
Mask" softkey resets the current shape of the mask to its default state.
Labelling a frequency mask
Assign a name to the frequency mask in the "Name" field. Activate the input in the
"Name" field either by touching it or via the "Edit Name" softkey. This is also the save
name of the frequency mask.
18Operating Manual 1176.7584.02 ─ 03.1

R&S® FSV-K72
Instrument Functions 3GPP Base Station Measurements
Working with the Frequency Mask Trigger
In addition to naming the mask, you can also comment on the frequency mask you are
working on in the "Comment" field. Again, activate the input either by touching it or with
the "Edit Comment" softkey.
Remote command:
CALCulate<n>:MASK:COMMent on page 169
CALCulate<n>:MASK:NAME on page 171
Defining the frequency mask span
Define the span of the frequency mask.
The span defines the range that the frequency mask covers on the frequency axis.
Remote command:
CALCulate<n>:MASK:SPAN on page 171
Working with upper and lower lines
A frequency mask may have an upper and a lower threshold, with the signal in
between. The checkboxes next to the "Upper Line" and "Lower Line" buttons activate
or deactivate the corresponding line. Note that it is not possible to deactivate both
lines.
You can select the line you want to edit with the "Upper Line" / "Lower Line" buttons or
by touching the corresponding area in the preview to apply any changes. The buttons
turn blue if a line is selected and the R&S FSVR shows the data points in the area covered by the mask in the preview pane.
Remote command:
CALCulate<n>:MASK:LOWer[:STATe] on page 170
CALCulate<n>:MASK:UPPer[:STATe] on page 172
Setting the trigger condition
To make the trigger work, you need to set a trigger condition with the "Trigger Condition" button. The R&S FSVR supports four conditions.
"Entering"
Activates the trigger as soon as the signal enters the frequency mask.
To arm the trigger, the signal initially has to be outside the frequency
mask.
"Leaving"
Activates the trigger as soon as the signal leaves the frequency
mask.
To arm the trigger, the signal initially has to be inside the frequency
mask.
Remote command:
TRIGger<n>[:SEQuence]:MASK:CONDition on page 243
5.2.2 Editing Mask Points
You can adjust the frequency mask any way you want by adding, removing and repositioning frequency mask data points.
19Operating Manual 1176.7584.02 ─ 03.1

R&S® FSV-K72
Instrument Functions 3GPP Base Station Measurements
Working with the Frequency Mask Trigger
Data points define the shape of the frequency mask. In the preview pane, the
R&S FSVR visualizes data points as blue circles. In addition, all data point positions
are listed in the data point table. The number of data points is limited to 801.
Data points are defined by two values. The first value defines the position of the data
point on the horizontal (frequency) axis. Frequency information is relative to the center
frequency.
Note that in realtime mode, the span depends on the realtime bandwidth. That also
means that the distance of a data point to the center frequency can never exceed
20 MHz as the maximum realtime bandwidth is 40 MHz.
The second value defines the position of the data point on the vertical (level) axis. By
default, level information is relative to the reference level. You can, however, turn the
level axis to absolute scaling with the "Y-Axis Abs/Rel" button. This also changes the
unit of the vertical axis (dB for relative data points, dBm for absolute data points).
Adding data points
To add a new data point, press the "Insert" button or the "Insert Value Above" softkey.
The R&S FSVR always adds the data point to the left (or in case of the table, above) of
the currently selected data point. The currently selected data point is highlighted gray
in the table. If no data point was selected previously, the buttons add a new point next
to the very first one.
Deleting data points
The "Delete" button or the "Delete Value" softkey remove a data point from the mask.
The R&S FSVR deletes the currently selected data point. If no data point is selected, it
deletes the first one. The "Delete" button is inactive in that case.
Positioning data points
There are two ways to move a single data point.
In the preview pane, you can drag around the data points on the touchscreen or with a
mouse and position it roughly in the place you want it to be. A more exact method is to
edit the data point table itself end enter the frequencies and levels as you need.
Remote command:
CALCulate<n>:MASK:LOWer[:DATA] on page 170
CALCulate<n>:MASK:UPPer[:DATA] on page 172
Shifting mask points as a whole
With the "Shift X" and "Shift Y" buttons you are able to move all mask points of a frequency mask as one. The "Shift X" button moves the mask point set horizontally, while
the "Shift Y" button moves them vertically. This is an easy method to move mask
points if the relative position of mask points to each other is alright already without
adjusting each one by itself.
Remote command:
CALCulate<n>:MASK:LOWer:SHIFt:X on page 169
CALCulate<n>:MASK:LOWer:SHIFt:Y on page 170
CALCulate<n>:MASK:UPPer:SHIFt:X on page 172
CALCulate<n>:MASK:UPPer:SHIFt:Y on page 172
20Operating Manual 1176.7584.02 ─ 03.1

R&S® FSV-K72
Instrument Functions 3GPP Base Station Measurements
Working with the Frequency Mask Trigger
Automatic alignment of the frequency mask
Instead of defining the position of every data point by hand, the R&S FSVR is able to
shape the frequency mask according to the shape of the current signal. On pressing
the "Auto Set Mask" button, the R&S FSVR forms the frequency mask around the current spectrum.
Note the the automatic alignment of the frequency mask works only for the upper frequency mask.
Remote command:
CALCulate<n>:MASK:UPPer[:DATA] on page 172
5.2.3 Managing Frequency Masks
To be able to reuse or edit a frequency mask that you have defined later, you can save
and restore particular frequency mask configurations.
The R&S FSVR stores files that contain such configurations on its internal hard disk.
Save Mask
The "Save" softkey opens a dialog box to save the current frequency mask configuration in a file.
If you do not name the file in the dialog box, the R&S FSVR names the file like the
name of the frequency mask itself.
Load Mask
The "Load" softkey opens a dialog box to restore a frequency mask.
The dialog box contains all frequency masks already on the hard disk of the
R&S FSVR. Select the mask you need and confirm the selection with the "Load" button.
Remote command:
Path selection:
CALCulate<n>:MASK:CDIRectory on page 168
Load mask:
CALCulate<n>:MASK:NAME on page 171
Delete Mask
The Delete softkey opens a dialog box to delete a previously saved frequency mask.
The "Delete" button deletes the file. Note that you have to confirm the deletion process.
Remote command:
CALCulate<n>:MASK:DELete on page 169
21Operating Manual 1176.7584.02 ─ 03.1

R&S® FSV-K72
Instrument Functions 3GPP Base Station Measurements
Further Information
5.3 Further Information
5.3.1 Short List of Abbreviations............................................................................................ 22
5.3.2 Channels of the Code Domain Channel Table and Their Usage.................................. 22
5.3.3 Detector Overview.........................................................................................................24
5.3.4 Trace Mode Overview...................................................................................................25
5.3.5 Selecting the Appropriate Filter Type............................................................................27
5.3.6 List of Available RRC and Channel Filters.................................................................... 27
5.3.7 ASCII File Export Format.............................................................................................. 29
5.3.1 Short List of Abbreviations
Term or abbreviation Description
BTS base transmission station
CPICH common pilot channel
DPCH dedicated physical channel, data channel
FDD frequency division duplexing
PCCPCH primary common control physical channel
PICH paging indication channel
SCH synchronization channel, divided into P-SCH (primary synchro-
nization channel) and S-SCH (secondary synchronization
channel)
5.3.2 Channels of the Code Domain Channel Table and Their Usage
The channel assignment table contains the following (data) channels:
Channel Description
CPICH The common pilot channel is used to synchronize the signal in the case of
CPICH synchronization. It is expected at code class 8 and code number
0.
PSCH The primary synchronization channel is used to synchronize the signal in
the case of SCH synchronization. It is a non-orthogonal channel. Only the
power of this channel is determined.
SSCH The secondary synchronization channel is a non-orthogonal channel. Only
the power of this channel is determined.
PCCPCH The primary common control physical channel is used to synchronize the
signal in the case of SCH synchronization. It is expected at code class 8
and code number 1.
22Operating Manual 1176.7584.02 ─ 03.1

R&S® FSV-K72
Instrument Functions 3GPP Base Station Measurements
Further Information
Channel Description
SCCPCH The secondary common control physical channel is a QPSK-modulated
channel without any pilot symbols. In the 3GPP test models, this channel
can be found in code class 8 and code number 3. However, the code
class and code number need not to be fixed and can vary. For this reason, the following rules are used to indicate SCCPCH.
●
"HSDPA/HSUPA On/Off" softkey set to Off
– Only one QPSK-modulated channel without pilot symbols is
detected and displayed as the SCCPCH. Any further QPSKmodulated channels without pilot symbols are not detected as
active channels.
– If the signal contains more than one channel without pilot sym-
bols, the channel that is received in the highest code class and
with the lowest code number is displayed as the SCCPCH. It is
expected that only one channel of this type is included in the
received signal. According to this assumption, this channel is
●
probably the SCCPCH.
"HSDPA/HSUPA On/Off" softkey set to On
– All QPSK-modulated channels without pilot symbols are detec-
ted. If one of these channels is received at code class 8 and
code number 3, it is displayed as the SCCPCH. QPSK-modula-
ted channels without pilot symbols and a code class higher than
or equal to 7 are marked with the channel type CHAN. QPSK-
modulated channels without pilot symbols and a code class
lower than 7 are marked with channel type HSPDSCH.
PICH The paging indication channel is expected at code class 8 and code num-
ber 16.
DPCH The dedicated physical channel is a data channel that contains pilot sym-
bols. The displayed channel type is DPCH. The status is inactive (channel
is not active), active (channel is active and all pilot symbols are correct),
or pilotf (channel is active but it contains incorrect pilot symbols).
HS-PDSCH (HSDPA) The high speed physical downlink shared channel does not contain any
pilot symbols. It is a channel type that is expected in code classes equal
to or higher than 7: HSPDSCH(QPSK)_ (QPSK-modulated slot of an HSPDSCH channel), HSPDSCH(16QAM)_ (16QAM-modulated slot of an
HS-PDSCH channel), HSPDSCH(NONE)_ (slot without power of an HSPDSCH channel). The modulation type of these channels can be varied
depending on the selected slot. The status is inactive (channel is not
active) or active (channel is active and all pilot symbols are correct).
HS-SCCH (HSDPA) The high speed shared control channel does not contain any pilot sym-
bols. It is a channel type that is expected in code classes equal to or
higher than 7. The modulation type should always be QPSK. The channel
does not contain any pilot symbols. The status is inactive (channel is not
active) or active (channel is active and all pilot symbols are correct).
23Operating Manual 1176.7584.02 ─ 03.1

R&S® FSV-K72
Instrument Functions 3GPP Base Station Measurements
Further Information
Channel Description
CHAN Any arbitrary channel that does not carry a valid pilot symbol sequence is
displayed as an arbitrary channel. It is not possible to decide which channel type is transmitted. The only prerequisite is that the channel carries
symbols of a sufficient signal to noise ratio.
●
Chan Type: CHAN (QPSK-modulated channel without any pilot symbols)
●
Status: inactive if the channel is not active; active if the channel is
active
E-HICH Enhanced HARQ hybrid acknowledgement indicator channel
Carries hybrid ARQ ACK/NACK
E-RGCH Enhanced relative grant channel Carries relative grant allocation
for a UE
E-AGCH Enhanced absolute grant channel Carries absolute grant alloca-
tion for a UE
5.3.3 Detector Overview
The measurement detector for the individual display modes can be selected directly by
the user or set automatically by the R&S FSVR. The detector activated for the specific
trace is indicated in the corresponding trace display field by an abbreviation.
The detectors of the R&S FSVR are implemented as pure digital devices. They collect
signal power data within each measured point during a sweep. The default number of
sweep points is 691. The following detectors are available:
Table 5-1: Detector types
Detector Indicator Function
Auto Peak Ap Determines the maximum and the minimum value
Positive Peak Pk Determines the maximum value within a measure-
Negative Peak (min peak) Mi Determines the minimum value within a measure-
RMS Rm Determines the root mean square power within a
Average Av Determines the linear average power within a mea-
within a measurement point (not available for SEM)
ment point
ment point
measurement point
surement point
Sample Sa Selects the last value within a measurement point
The result obtained from the selected detector within a measurement point is displayed
as the power value at this measurement point.
All detectors work in parallel in the background, which means that the measurement
speed is independent of the detector combination used for different traces.
24Operating Manual 1176.7584.02 ─ 03.1

R&S® FSV-K72
Instrument Functions 3GPP Base Station Measurements
Further Information
Number of measured values
During a frequency sweep, the R&S FSVR increments the first local oscillator in steps
that are smaller than approximately 1/10 of the bandwidth. This ensures that the oscillator step speed is conform to the hardware settling times and does not affect the precision of the measured power.
The number of measured values taken during a sweep is independent of the number of
oscillator steps. It is always selected as a multiple or a fraction of 691 (= default number of trace points displayed on the screen). Choosing less then 691 measured values
(e.g. 125 or 251) will lead to an interpolated measurement curve, choosing more than
691 points (e.g. 1001, 2001 …) will result in several measured values being overlaid at
the same frequency position.
RMS detector and VBW
If the RMS detector is selected, the video bandwidth in the hardware is bypassed.
Thus, duplicate trace averaging with small VBWs and RMS detector no longer occurs.
However, the VBW is still considered when calculating the sweep time. This leads to a
longer sweep time for small VBW values. Thus, you can reduce the VBW value to achieve more stable trace curves even when using an RMS detector. Normally, if the RMS
detector is used the sweep time should be increased to get more stable trace curves.
5.3.4 Trace Mode Overview
The traces can be activated individually for a measurement or frozen after completion
of a measurement. Traces that are not activate are hidden. Each time the trace mode
is changed, the selected trace memory is cleared.
The R&S FSVR offers 6 different trace modes:
Clear Write
Overwrite mode: the trace is overwritten by each sweep. This is the default setting.
All available detectors can be selected.
Remote command:
DISP:TRAC:MODE WRIT, see DISPlay[:WINDow<n>]:TRACe<t>:MODE
on page 187
Max Hold
The maximum value is determined over several sweeps and displayed. The
R&S FSVR saves the sweep result in the trace memory only if the new value is greater
than the previous one.
The detector is automatically set to "Positive Peak".
This mode is especially useful with modulated or pulsed signals. The signal spectrum
is filled up upon each sweep until all signal components are detected in a kind of envelope.
25Operating Manual 1176.7584.02 ─ 03.1

R&S® FSV-K72
Instrument Functions 3GPP Base Station Measurements
Further Information
This mode is not available for statistics measurements.
Remote command:
DISP:TRAC:MODE MAXH, see DISPlay[:WINDow<n>]:TRACe<t>:MODE
on page 187
Min Hold
The minimum value is determined from several measurements and displayed. The
R&S FSVR saves the smallest of the previously stored/currently measured values in
the trace memory.
The detector is automatically set to "Negative Peak".
This mode is useful e.g. for making an unmodulated carrier in a composite signal visi-
ble. Noise, interference signals or modulated signals are suppressed whereas a CW
signal is recognized by its constant level.
This mode is not available for statistics measurements.
Remote command:
DISP:TRAC:MODE MINH, see DISPlay[:WINDow<n>]:TRACe<t>:MODE
on page 187
Average
The average is formed over several sweeps. The Sweep Count determines the number
of averaging procedures.
All available detectors can be selected. If the detector is automatically selected, the
sample detector is used (see chapter 5.3.3, "Detector Overview", on page 24).
This mode is not available for statistics measurements.
Remote command:
DISP:TRAC:MODE AVER, see DISPlay[:WINDow<n>]:TRACe<t>:MODE
on page 187
View
The current contents of the trace memory are frozen and displayed.
Note: If a trace is frozen, the instrument settings, apart from level range and reference
level (see below), can be changed without impact on the displayed trace. The fact that
the displayed trace no longer matches the current instrument setting is indicated by the
icon on the tab label.
If the level range or reference level is changed, the R&S FSVR automatically adapts
the measured data to the changed display range. This allows an amplitude zoom to be
made after the measurement in order to show details of the trace.
Remote command:
DISP:TRAC:MODE VIEW, see DISPlay[:WINDow<n>]:TRACe<t>:MODE
on page 187
Blank
Hides the selected trace.
Remote command:
DISP:TRAC OFF, see DISPlay[:WINDow<n>]:TRACe<t>[:STATe] on page 188
26Operating Manual 1176.7584.02 ─ 03.1

R&S® FSV-K72
Instrument Functions 3GPP Base Station Measurements
Further Information
5.3.5 Selecting the Appropriate Filter Type
All resolution bandwidths are realized with digital filters.
The video filters are responsible for smoothing the displayed trace. Using video bandwidths that are small compared to the resolution bandwidth, only the signal average is
displayed and noise peaks and pulsed signals are repressed. If pulsed signals are to
be measured, it is advisable to use a video bandwidth that is large compared to the
resolution bandwidth (VBW * 10 x RBW) for the amplitudes of pulses to be measured
correctly.
The following filter types are available:
●
Normal (3dB) (Gaussian) filters
The Gaussian filters are set by default. The available bandwidths are specified in
the data sheet.
●
CISPR (6 dB) filters
●
MIL Std (6 dB) filters
Note that the 6 dB bandwidths are available only with option R&S FSV-K54.
●
Channel filters
For details see chapter 5.3.6, "List of Available RRC and Channel Filters",
on page 27 .
Channel filters do not support FFT mode.
●
RRC filters
For details see chapter 5.3.6, "List of Available RRC and Channel Filters",
on page 27 .
RRC filters do not support FFT mode.
●
5-Pole filters
The available bandwidths are specified in the data sheet.
5-Pole filters do not support FFT mode.
5.3.6 List of Available RRC and Channel Filters
For power measurement a number of especially steep-edged channel filters are available (see the following table). The indicated filter bandwidth is the 3 dB bandwidth. For
RRC filters, the fixed roll-off factor (a) is also indicated.
Table 5-2: Filter types
Filter Bandwidth Filter Type Application
100 Hz CFILter
200 Hz CFILter A0
300 Hz CFILter
500 Hz CFILter
1 kHz CFILter
1.5 kHz CFILter
27Operating Manual 1176.7584.02 ─ 03.1

R&S® FSV-K72
Instrument Functions 3GPP Base Station Measurements
Further Information
Filter Bandwidth Filter Type Application
2 kHz CFILter
2.4 kHz CFILter SSB
2.7 kHz CFILter
3 kHz CFILter
3.4 kHz CFILter
4 kHz CFILter DAB, Satellite
4.5 kHz CFILter
5 kHz CFILter
6 kHz CFILter
6 kHz, a=0.2 RRC APCO
8.5 kHz CFILter ETS300 113 (12.5 kHz channels)
9 kHz CFILter AM Radio
10 kHz CFILter
12.5 kHz CFILter CDMAone
14 kHz CFILter ETS300 113 (20 kHz channels)
15 kHz CFILter
16 kHz CFILter ETS300 113 (25 kHz channels)
18 kHz, a=0.35 RRC TETRA
20 kHz CFILter
21 kHz CFILter PDC
24.3 kHz, a=0.35 RRC IS 136
25 kHz CFILter
30 kHz CFILter CDPD, CDMAone
50 kHz CFILter
100 kHz CFILter
150 kHz CFILter FM Radio
192 kHz CFILter PHS
200 kHz CFILter
300 kHz CFILter
500 kHz CFILter J.83 (8-VSB DVB, USA)
28Operating Manual 1176.7584.02 ─ 03.1

R&S® FSV-K72
Instrument Functions 3GPP Base Station Measurements
Further Information
Filter Bandwidth Filter Type Application
1 MHz CFILter CDMAone
1.228 MHz CFILter CDMAone
1.28 MHz, a=0.22 RRC
1.5 MHz CFILter DAB
2 MHz CFILter
3 MHz CFILter
3.75 MHz CFILter
3.84 MHz, a=0.22 RRC W-CDMA 3GPP
4.096 MHz, a=0.22 RRC W-CDMA NTT DOCoMo
5 MHz CFILter
20 MHz CFILter
28 MHz CFILter
40 MHz CFILter
5.3.7 ASCII File Export Format
The data of the file header consist of three columns, each separated by a semicolon:
parameter name; numeric value; basic unit. The data section starts with the keyword
"Trace <n>" (<n> = number of stored trace), followed by the measured data in one or
several columns (depending on measurement) which are also separated by a semicolon.
File contents: header and data section Description
Type;FSVR;
Version;1.45;
Date;01.Apr 2010; Date of data set storage
Screen;A; Instrument mode
Points per Symbol;4; Points per symbol
x Axis Start;-13;sym; Start value of the x axis
x Axis Stop;135;sym; Stop value of the x axis
Ref value y axis;-10.00;dBm; Y axis reference value
Ref value position;100;%; Y axis reference position
Trace;1; Trace number
Meas;Result; Result type
Meas Signal;Magnitude; Result display
Demodulator;Offset QPSK; Demodulation type
29Operating Manual 1176.7584.02 ─ 03.1

R&S® FSV-K72
Instrument Functions 3GPP Base Station Measurements
Further Information
File contents: header and data section Description
ResultMode;Trace; Result mode
x unit;sym; Unit of the x axis
y unit;dBm; Unit of the y axis
Trace Mode;Clear Write; Trace mode
Values;592; Number of results
<values> List of results
30Operating Manual 1176.7584.02 ─ 03.1
 Loading...