

Page 1
R&S®FSWP-K7
Analog Modulation Analysis
User Manual
(;ÛÆé2)
1177569102
User Manual
Version 08
Page 2

This manual describes the following R&S®FSWP models with firmware version 1.90 or higher:
●
R&S®FSWP8 (1322.8003K08)
●
R&S®FSWP26 (1322.8003K26)
●
R&S®FSWP50 (1322.8003K50)
The following firmware options are described:
●
R&S FSWP-K7 (1325.4238.02) (requires R&S FSWP-B1)
© 2019 Rohde & Schwarz GmbH & Co. KG
Mühldorfstr. 15, 81671 München, Germany
Phone: +49 89 41 29 - 0
Fax: +49 89 41 29 12 164
Email: info@rohde-schwarz.com
Internet: www.rohde-schwarz.com
Subject to change – Data without tolerance limits is not binding.
R&S® is a registered trademark of Rohde & Schwarz GmbH & Co. KG.
Trade names are trademarks of the owners.
1177.5691.02 | Version 08 | R&S®FSWP-K7
Throughout this manual, products from Rohde & Schwarz are indicated without the ® symbol , e.g. R&S®FSWP is indicated as
R&S FSWP.
Page 3

R&S®FSWP-K7
1 Preface.................................................................................................... 5
1.1 About this Manual......................................................................................................... 5
1.2 Documentation Overview............................................................................................. 6
1.3 Conventions Used in the Documentation...................................................................7
2 Welcome to the Analog Modulation Analysis Application.................9
2.1 Starting Analog Modulation Analysis......................................................................... 9
2.2 Understanding the Display Information....................................................................10
3 Measurements and Result Displays...................................................14
4 Measurement Basics........................................................................... 25
4.1 Demodulation Process............................................................................................... 25
Contents
Contents
4.2 Demodulation Bandwidth...........................................................................................27
4.3 Sample Rate and Demodulation Bandwidth.............................................................28
4.4 AF Triggers.................................................................................................................. 29
4.5 AF Filters......................................................................................................................29
4.6 Time Domain Zoom.....................................................................................................29
4.7 Analog Modulation Analysis in MSRA Operating Mode..........................................31
5 Configuration........................................................................................33
5.1 Configuration According to Digital Standards.........................................................33
5.2 Configuration Overview..............................................................................................35
5.3 Data Input and Output.................................................................................................36
5.4 Amplitude.....................................................................................................................43
5.5 Frequency.................................................................................................................... 46
5.6 Trigger Configuration................................................................................................. 47
5.7 Data Acquisition..........................................................................................................53
5.8 Demodulation.............................................................................................................. 57
5.9 Demodulation Display................................................................................................ 72
5.10 Automatic Settings..................................................................................................... 72
6 Analysis................................................................................................ 76
6.1 Trace Configuration.................................................................................................... 76
6.2 Marker Settings........................................................................................................... 77
3User Manual 1177.5691.02 ─ 08
Page 4

R&S®FSWP-K7
6.3 Display Lines and Limit Lines....................................................................................77
7 I/Q Data Import and Export..................................................................78
7.1 Import/Export Functions............................................................................................ 78
7.2 How to Export and Import I/Q Data............................................................................81
8 How to Perform Measurements in the Analog Modulation Analysis
8.1 How to Export Trace Data and Numerical Results...................................................84
9 Measurement Example: Demodulating an FM Signal.......................85
10 Optimizing and Troubleshooting the Measurement......................... 91
11 Remote Commands for Analog Modulation Analysis...................... 92
11.1 Introduction................................................................................................................. 92
Contents
Application............................................................................................83
11.2 Common Suffixes........................................................................................................97
11.3 Remote Commands to Select the Application......................................................... 97
11.4 Remote Commands to Configure Analog Modulation Analysis...........................101
11.5 Configuring the Result Display................................................................................151
11.6 Working with Measurement Results........................................................................159
11.7 Analyzing Results..................................................................................................... 170
11.8 Importing and Exporting Data..................................................................................172
11.9 Programming Example.............................................................................................173
Annex.................................................................................................. 175
A Reference............................................................................................175
A.1 Predefined Standards and Settings........................................................................ 175
A.2 Formats for Returned Values: ASCII Format and Binary Format......................... 177
A.3 Reference: ASCII File Export Format...................................................................... 177
A.4 I/Q Data File Format (iq-tar)......................................................................................178
List of Commands..............................................................................184
Index....................................................................................................188
4User Manual 1177.5691.02 ─ 08
Page 5

R&S®FSWP-K7
1 Preface
1.1 About this Manual
Preface
About this Manual
This Analog Modulation Analysis User Manual provides all the information specific to
the application. All general instrument functions and settings common to all applications and operating modes are described in the main R&S FSWP User Manual.
The main focus in this manual is on the measurement results and the tasks required to
obtain them. The following topics are included:
●
Welcome to the Analog Modulation Analysis Application
Introduction to and getting familiar with the application
●
Measurements and Result Displays
Details on supported measurements and their result types
●
Measurement Basics
Background information on basic terms and principles in the context of the measurement
●
Configuration + Analysis
A concise description of all functions and settings available to configure measurements and analyze results with their corresponding remote control command
●
I/Q Data Import and Export
Description of general functions to import and export raw I/Q (measurement) data
●
How to Perform Measurements in the Analog Modulation Analysis Application
The basic procedure to perform each measurement and step-by-step instructions
for more complex tasks or alternative methods
●
Measurement Examples
Detailed measurement examples to guide you through typical measurement scenarios and allow you to try out the application immediately
●
Optimizing and Troubleshooting the Measurement
Hints and tips on how to handle errors and optimize the measurement configuration
●
Remote Commands for Analog Modulation Analysis Measurements
Remote commands required to configure and perform Analog Modulation Analysis
measurements in a remote environment, sorted by tasks
(Commands required to set up the environment or to perform common tasks on the
instrument are provided in the main R&S FSWP User Manual)
Programming examples demonstrate the use of many commands and can usually
be executed directly for test purposes
●
List of remote commands
Alphabetical list of all remote commands described in the manual
●
Index
5User Manual 1177.5691.02 ─ 08
Page 6

R&S®FSWP-K7
1.2 Documentation Overview
1.2.1 Getting Started Manual
Preface
Documentation Overview
This section provides an overview of the R&S FSWP user documentation. Unless
specified otherwise, you find most of the documents on the R&S FSWP product page
at:
www.rohde-schwarz.com/manual/fswp
Introduces the R&S FSWP and describes how to set up and start working with the
product. Includes basic operations, typical measurement examples, and general information, e.g. safety instructions, etc.
A printed version is delivered with the instrument. A PDF version is available for download on the Internet.
1.2.2 User Manuals and Help
Separate user manuals are provided for the base unit and the firmware applications:
●
Base unit manual
Contains the description of all instrument modes and functions. It also provides an
introduction to remote control, a complete description of the remote control commands with programming examples, and information on maintenance, instrument
interfaces and error messages. Includes the contents of the getting started manual.
●
Manuals for (optional) firmware applications
Contains the description of the specific functions of a firmware application, including remote control commands. Basic information on operating the R&S FSWP is
not included.
The contents of the user manuals are available as help in the R&S FSWP. The help
offers quick, context-sensitive access to the complete information for the base unit and
the firmware applications.
All user manuals are also available for download or for immediate display on the Internet.
1.2.3 Service Manual
Describes the performance test for checking the rated specifications, module replacement and repair, firmware update, troubleshooting and fault elimination, and contains
mechanical drawings and spare part lists.
The service manual is available for download for registered users on the global
Rohde & Schwarz information system (GLORIS):
https://gloris.rohde-schwarz.com
6User Manual 1177.5691.02 ─ 08
Page 7

R&S®FSWP-K7
1.2.4 Instrument Security Procedures
1.2.5 Basic Safety Instructions
1.2.6 Data Sheets and Brochures
Preface
Conventions Used in the Documentation
Deals with security issues when working with the R&S FSWP in secure areas. It is
available for download on the Internet.
Contains safety instructions, operating conditions and further important information.
The printed document is delivered with the instrument.
The data sheet contains the technical specifications of the R&S FSWP. It also lists the
options and their order numbers, and optional accessories.
The brochure provides an overview of the instrument and deals with the specific characteristics.
See www.rohde-schwarz.com/brochure-datasheet/fswp
1.2.7 Release Notes and Open Source Acknowledgment (OSA)
The release notes list new features, improvements and known issues of the current
firmware version, and describe the firmware installation.
The open source acknowledgment document provides verbatim license texts of the
used open source software.
See www.rohde-schwarz.com/firmware/fswp
1.2.8 Application Notes, Application Cards, White Papers, etc.
These documents deal with special applications or background information on particular topics.
See www.rohde-schwarz.com/application/fswp
1.3 Conventions Used in the Documentation
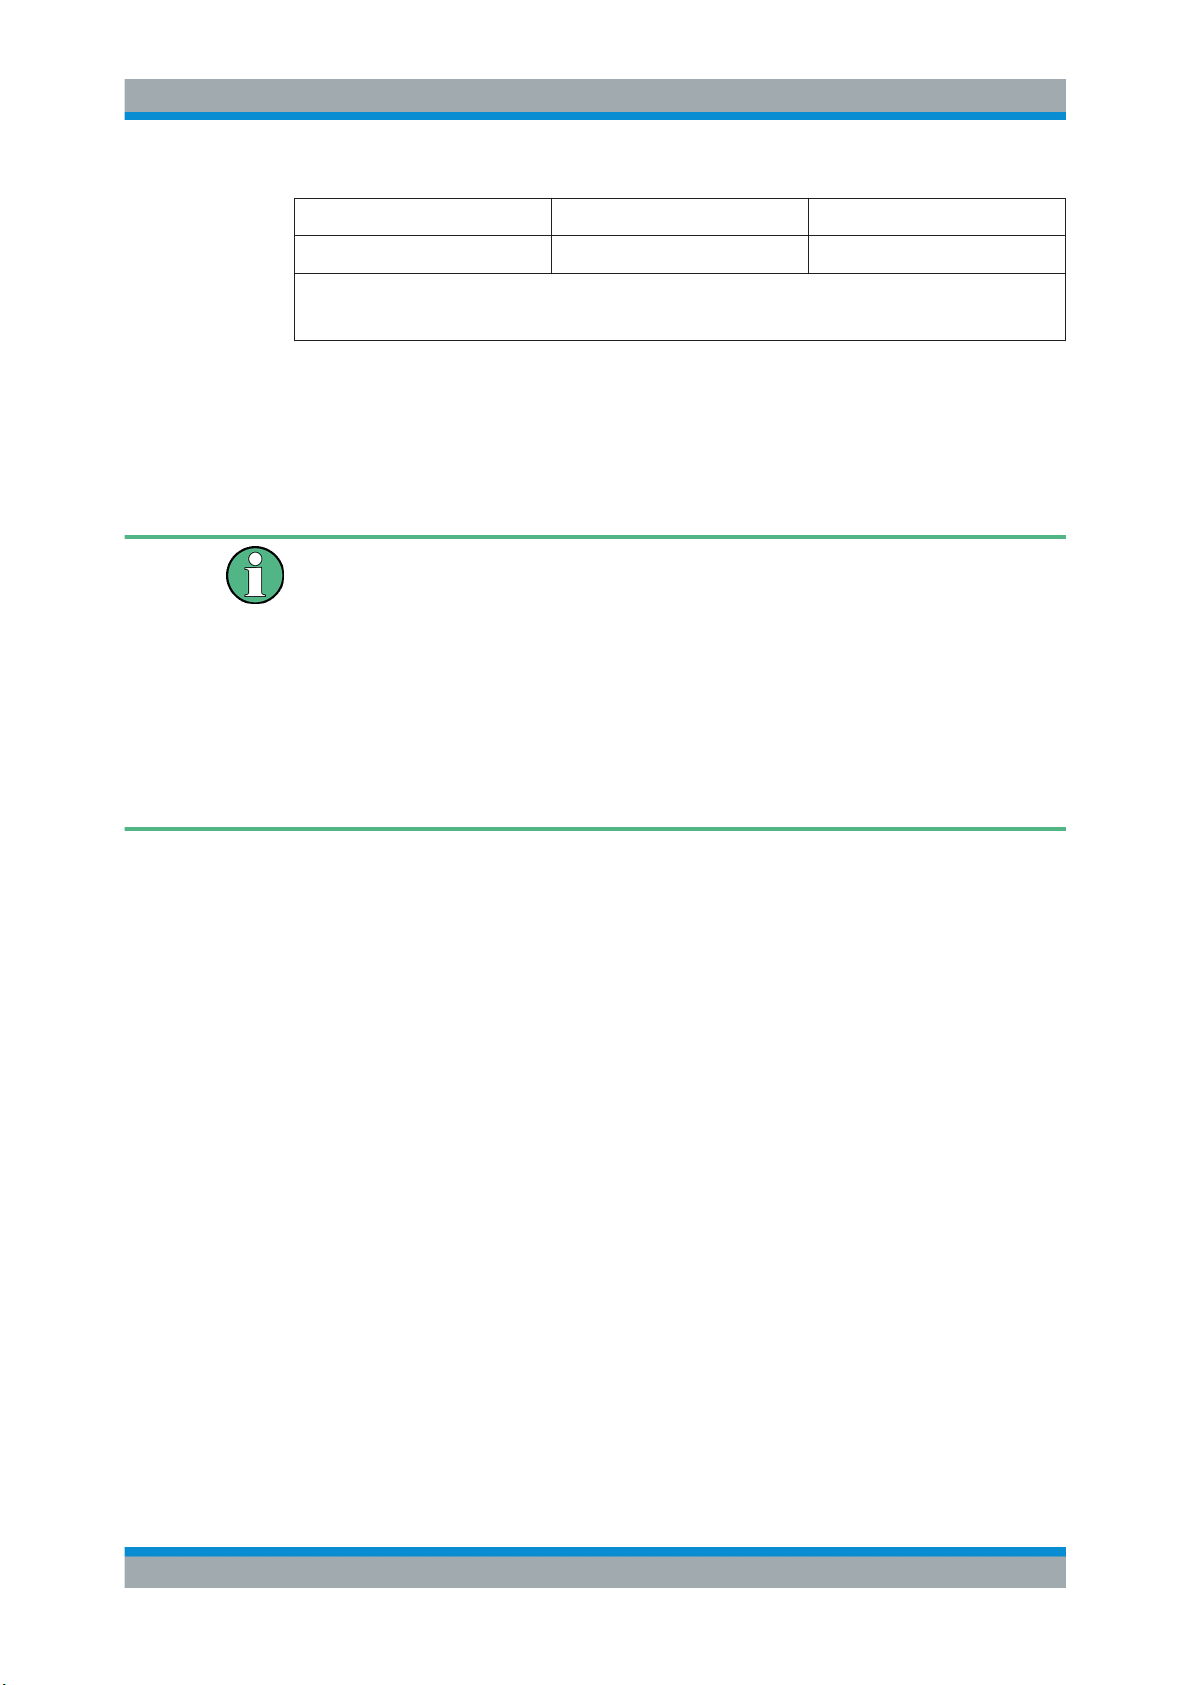
1.3.1 Typographical Conventions
The following text markers are used throughout this documentation:
7User Manual 1177.5691.02 ─ 08
Page 8
R&S®FSWP-K7
Preface
Conventions Used in the Documentation
Convention Description
"Graphical user interface elements"
[Keys] Key and knob names are enclosed by square brackets.
Filenames, commands,
program code
Input Input to be entered by the user is displayed in italics.
Links Links that you can click are displayed in blue font.
"References" References to other parts of the documentation are enclosed by quota-
All names of graphical user interface elements on the screen, such as
dialog boxes, menus, options, buttons, and softkeys are enclosed by
quotation marks.
Filenames, commands, coding samples and screen output are distinguished by their font.
tion marks.
1.3.2 Conventions for Procedure Descriptions
When operating the instrument, several alternative methods may be available to perform the same task. In this case, the procedure using the touchscreen is described.
Any elements that can be activated by touching can also be clicked using an additionally connected mouse. The alternative procedure using the keys on the instrument or
the on-screen keyboard is only described if it deviates from the standard operating procedures.
The term "select" may refer to any of the described methods, i.e. using a finger on the
touchscreen, a mouse pointer in the display, or a key on the instrument or on a keyboard.
1.3.3 Notes on Screenshots
When describing the functions of the product, we use sample screenshots. These
screenshots are meant to illustrate as many as possible of the provided functions and
possible interdependencies between parameters. The shown values may not represent
realistic usage scenarios.
The screenshots usually show a fully equipped product, that is: with all options installed. Thus, some functions shown in the screenshots may not be available in your particular product configuration.
8User Manual 1177.5691.02 ─ 08
Page 9

R&S®FSWP-K7
2 Welcome to the Analog Modulation Analysis
Welcome to the Analog Modulation Analysis Application
Starting Analog Modulation Analysis
Application
The R&S FSWP-K7 AM/FM/PM measurement demodulator option converts the
R&S FSWP into an analog modulation analyzer for amplitude-, frequency- or phasemodulated signals. It measures not only characteristics of the useful modulation, but
also factors such as residual FM or synchronous modulation.
The R&S FSWP Analog Modulation Analysis application features:
●
AM, FM, and PM demodulation, with various result displays:
– Modulation signal versus time
– Spectrum of the modulation signal (FFT)
– RF signal power versus time
– Spectrum of the RF signal
●
Determining maximum, minimum and average or current values in parallel over a
selected number of measurements
●
Maximum accuracy and temperature stability due to sampling (digitization) already
at the IF and digital down-conversion to the baseband (I/Q)
●
Error-free AM to FM conversion and vice versa, without deviation errors, frequency
response or frequency drift at DC coupling
●
Relative demodulation, in relation to a user-defined or measured reference value
Availability of the analog modulation analysis application
Analog modulation analysis requires the optional spectrum analyzer hardware
(R&S FSWP-B1).
This user manual contains a description of the functionality that the application provides, including remote control operation.
All functions not discussed in this manual are the same as in the base unit and are
described in the R&S FSWP User Manual. The latest version is available for download
at the product homepage http://www.rohde-schwarz.com/product/fswp.
Installation
You can find detailed installation instructions in the R&S FSWP Getting Started manual
or in the Release Notes.
2.1 Starting Analog Modulation Analysis
Analog modulation analysis is a separate application on the R&S FSWP.
9User Manual 1177.5691.02 ─ 08
Page 10

R&S®FSWP-K7
Welcome to the Analog Modulation Analysis Application
Understanding the Display Information
To activate analog modulation analysis
1. Select the [MODE] key.
A dialog box opens that contains all operating modes and applications currently
available on your R&S FSWP.
2. Select the "Analog Demod" item.
The R&S FSWP opens a new channel for the application for analog modulation
analysis.
The measurement is started immediately with the default settings. It can be configured
in the analog modulation analysis Configuration Overview dialog box, which is displayed when you select the "Overview" softkey from any menu.
Multiple Channels and Sequencer Function
When you activate an application, a new channel is created which determines the
measurement settings for that application ("Channel"). The same application can be
activated with different measurement settings by creating several "Channel"s for the
same application.
The number of channels that can be configured at the same time depends on the available memory on the instrument.
Only one measurement can be performed at any time, namely the one in the currently
active channel. However, in order to perform the configured measurements consecutively, a Sequencer function is provided.
If activated, the measurements configured in the currently defined "Channel"s are performed one after the other in the order of the tabs. The currently active measurement is
indicated by a
The result displays of the individual channels are updated in the tabs (as well as the
"MultiView") as the measurements are performed. Sequential operation itself is independent of the currently displayed tab.
For details on the Sequencer function see the R&S FSWP User Manual.
symbol in the tab label.
2.2 Understanding the Display Information
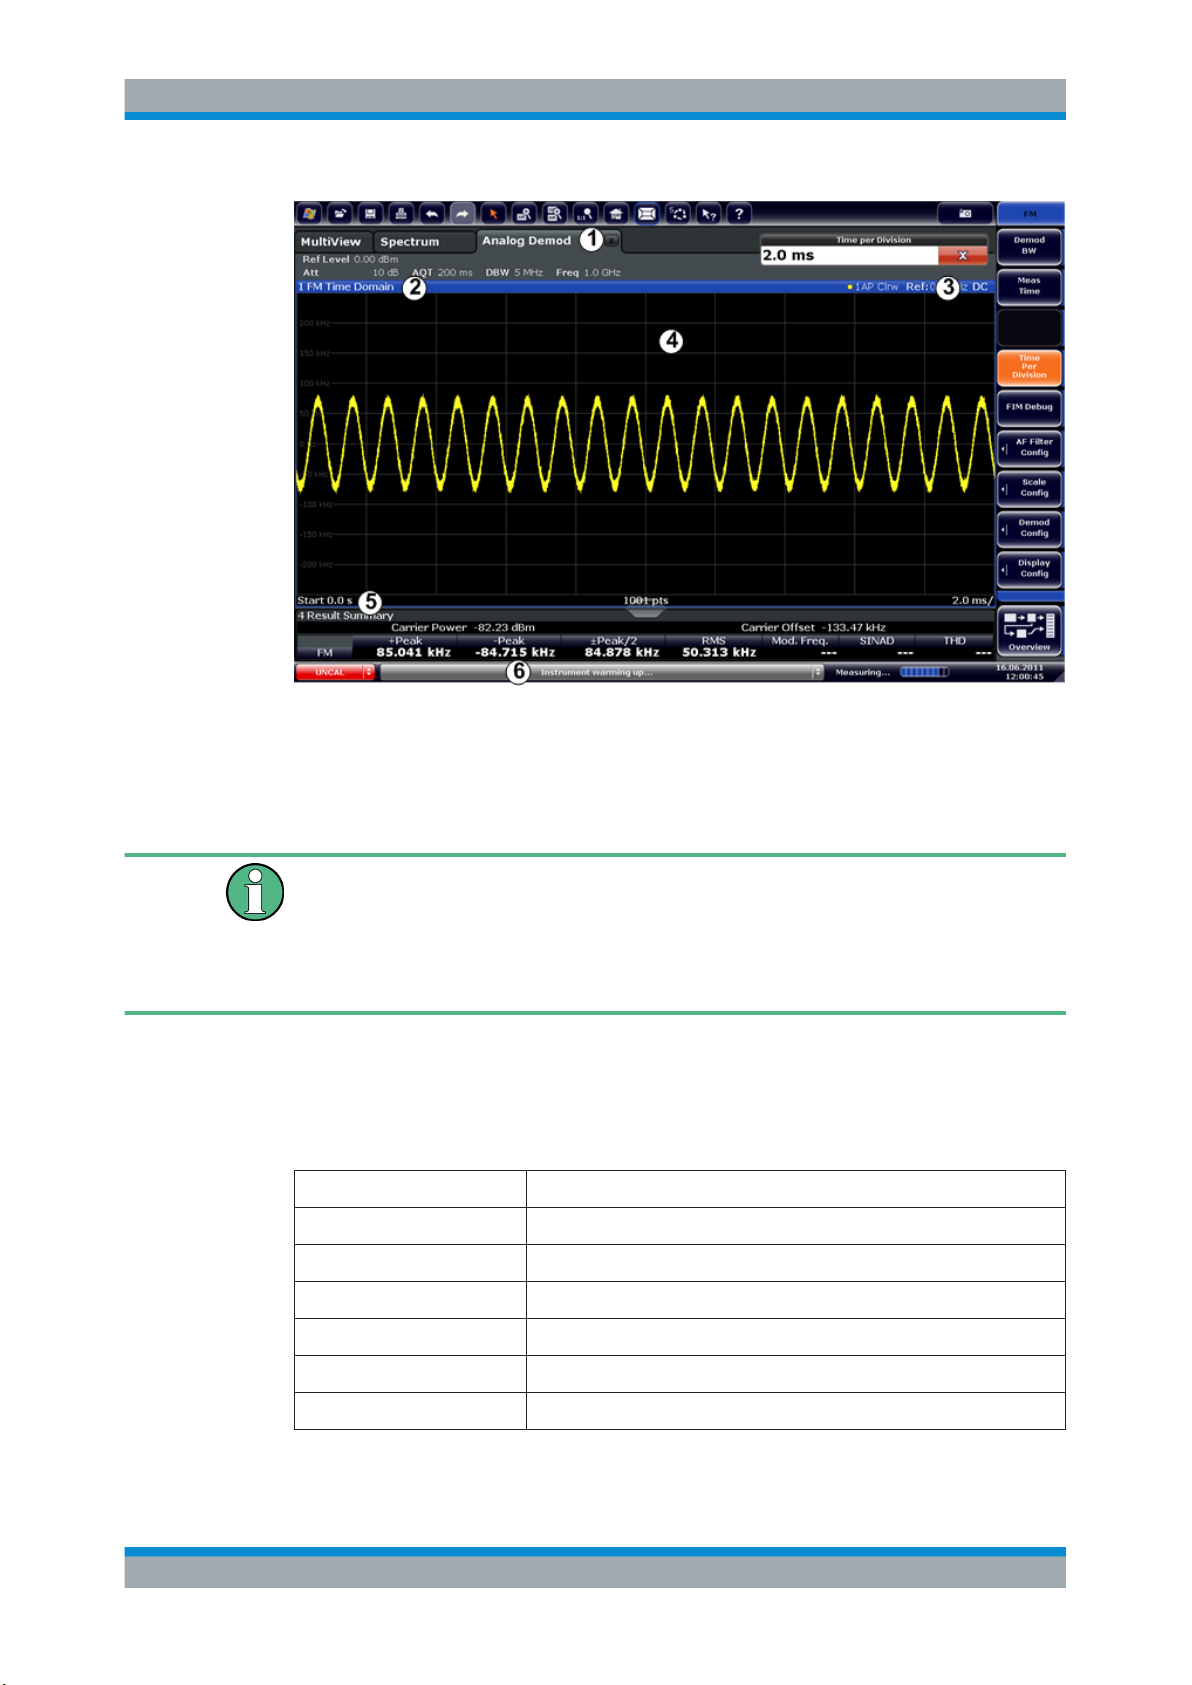
The following figure shows a measurement diagram during analog modulation analysis. All different information areas are labeled. They are explained in more detail in the
following sections.
10User Manual 1177.5691.02 ─ 08
Page 11
R&S®FSWP-K7
Welcome to the Analog Modulation Analysis Application
Understanding the Display Information
1 = Channel bar for firmware and measurement settings
2+3 = Window title bar with diagram-specific (trace) information
4 = Diagram area
5 = Diagram footer with diagram-specific information, depending on result display
6 = Instrument status bar with error messages and date/time display
MSRA operating mode
In MSRA operating mode, additional tabs and elements are available. A colored background of the screen behind the channel tabs indicates that you are in MSRA operating
mode.
For details on the MSRA operating mode see the R&S FSWP MSRA User Manual.
Channel bar information
In the Analog Modulation Analysis application, the R&S FSWP shows the following settings:
Table 2-1: Information displayed in the channel bar in the application for analog modulation analysis
Ref Level Reference level
m.+el.Att Mechanical and electronic RF attenuation
Offset Reference level offset
AQT Measurement time for data acquisition.
RBW Resolution bandwidth
DBW Demodulation bandwidth
Freq Center frequency for the RF signal
11User Manual 1177.5691.02 ─ 08
Page 12
R&S®FSWP-K7
Welcome to the Analog Modulation Analysis Application
Understanding the Display Information
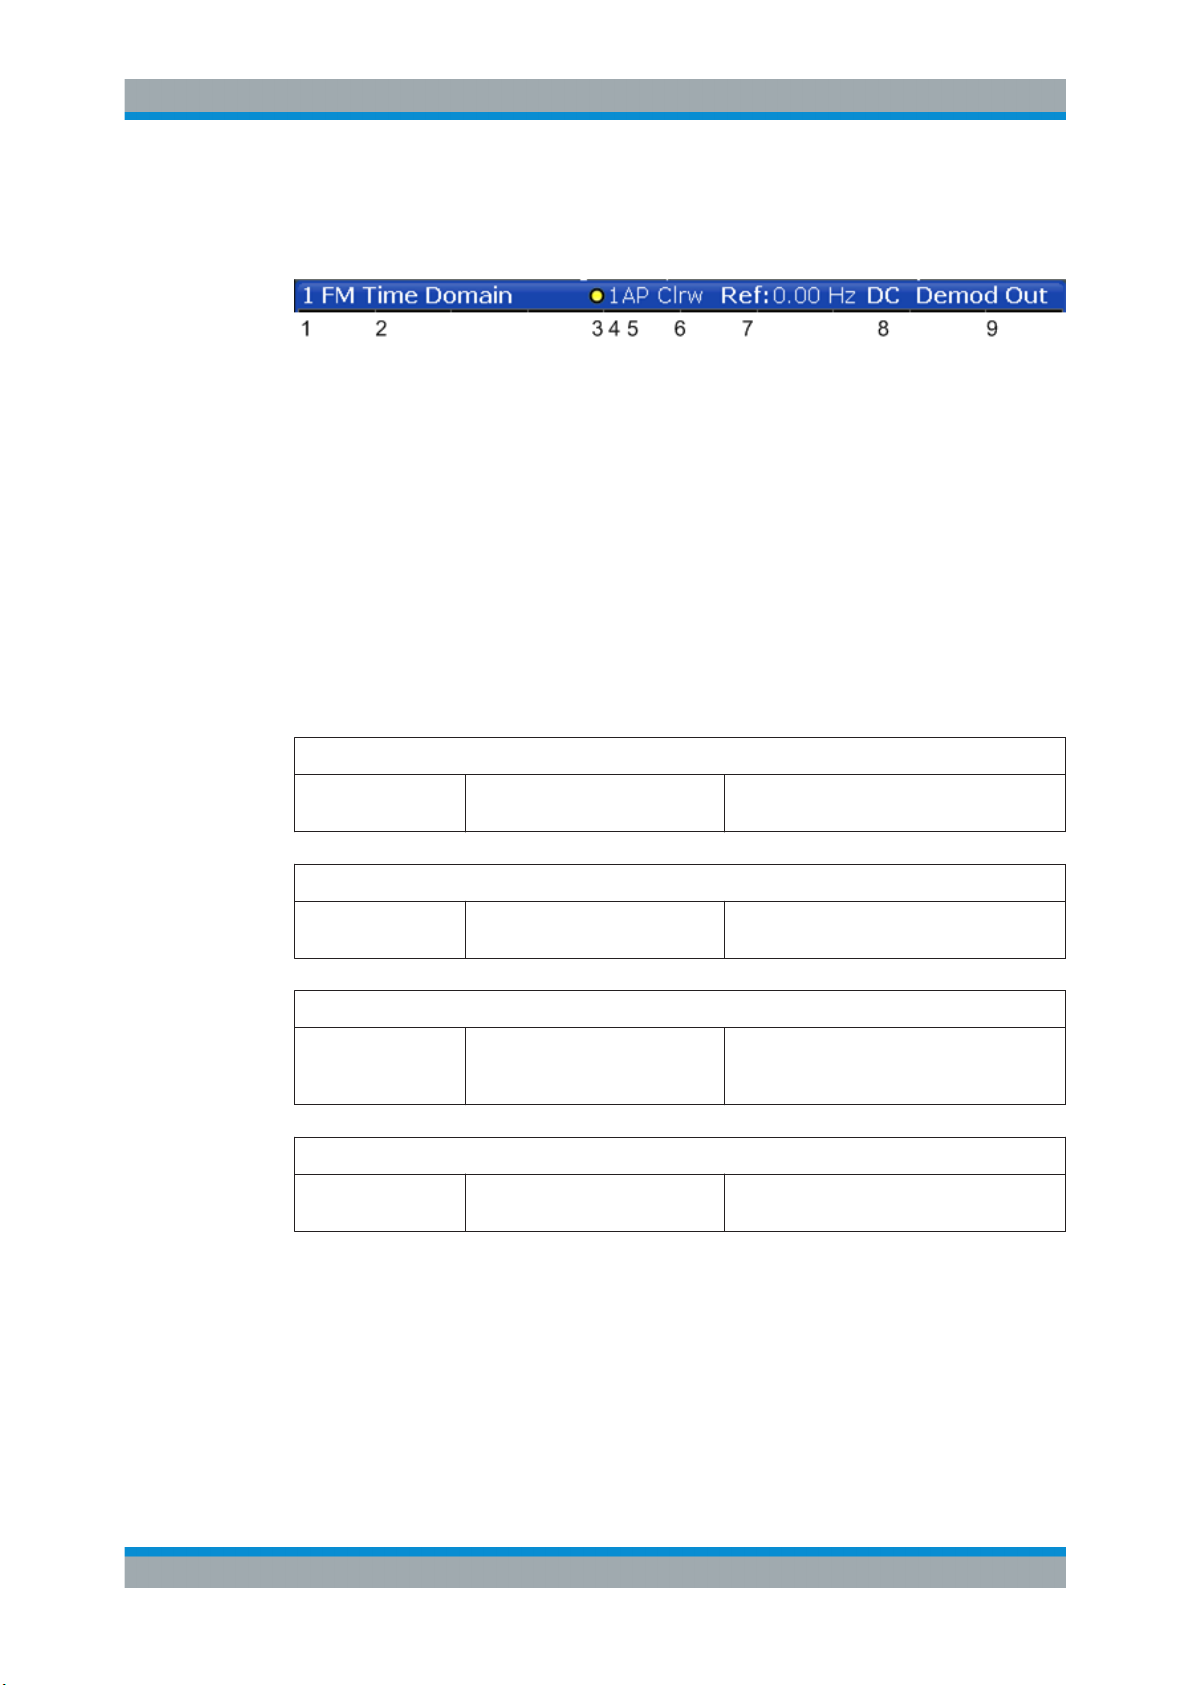
Window title bar information
For each diagram, the header provides the following information:
Figure 2-1: Window title bar information in the application for analog modulation analysis
1 = Window number
2 = Modulation type
3 = Trace color
4 = Trace number
5 = Detector
6 = Trace mode
7 = Reference value (at the defined reference position)
8 = AF coupling (AC/DC), only in AF time domains, if applicable
9 = Results are selected for demodulation output
Diagram footer information
The diagram footer (beneath the diagram) contains the following information, depending on the evaluation:
RF Spectrum
CF: Center frequency
of input signal
RF Time domain
CF: Center frequency
of input signal
AF Spectrum
AF CF: center frequency of demodulated signal
AF Time domain
CF: Center frequency
of input signal
Sweep points Span: measured span
Sweep points Time per division
Sweep points AF Span: evaluated span
Sweep points Time per division
For most modes, the number of sweep points shown in the display are indicated in the
diagram footer. In zoom mode, the (rounded) number of currently displayed points are
indicated.
Status bar information
Global instrument settings, the instrument status and any irregularities are indicated in
the status bar beneath the diagram.
12User Manual 1177.5691.02 ─ 08
Page 13

R&S®FSWP-K7
Welcome to the Analog Modulation Analysis Application
Understanding the Display Information
Furthermore, the progress of the current operation is displayed in the status bar.
13User Manual 1177.5691.02 ─ 08
Page 14

R&S®FSWP-K7
3 Measurements and Result Displays
Measurements and Result Displays
Access: "Overview" > "Display Config"
Or: [MEAS] > "Display Config"
The data that was measured by the R&S FSWP can be evaluated using various different methods. In the Analog Modulation Analysis application, up to six evaluation methods can be displayed simultaneously in separate windows. The results can be displayed as absolute deviations or relative to a reference value or level.
The abbreviation "AF" (for Audio Frequency) refers to the demodulated AM, FM or PM
signal.
Basis for evaluation
All evaluations are based on the I/Q data set acquired during the measurement. The
spectrum of the modulated signal to be evaluated is determined by the demodulation
bandwidth. However, it can be restricted to a limited span ("AF Span") if only part of the
signal is of interest. Furthermore, the time base for evaluations in the time domain can
be restricted to analyze a smaller extract in more detail, see Chapter 4.6, "Time
Domain Zoom", on page 29.
AM Time Domain...........................................................................................................14
FM Time Domain...........................................................................................................15
PM Time Domain...........................................................................................................16
AM Spectrum................................................................................................................ 17
FM Spectrum.................................................................................................................18
PM Spectrum................................................................................................................ 19
RF Time Domain...........................................................................................................20
RF Spectrum.................................................................................................................21
Result Summary............................................................................................................22
Marker Table................................................................................................................. 23
Marker Peak List........................................................................................................... 24
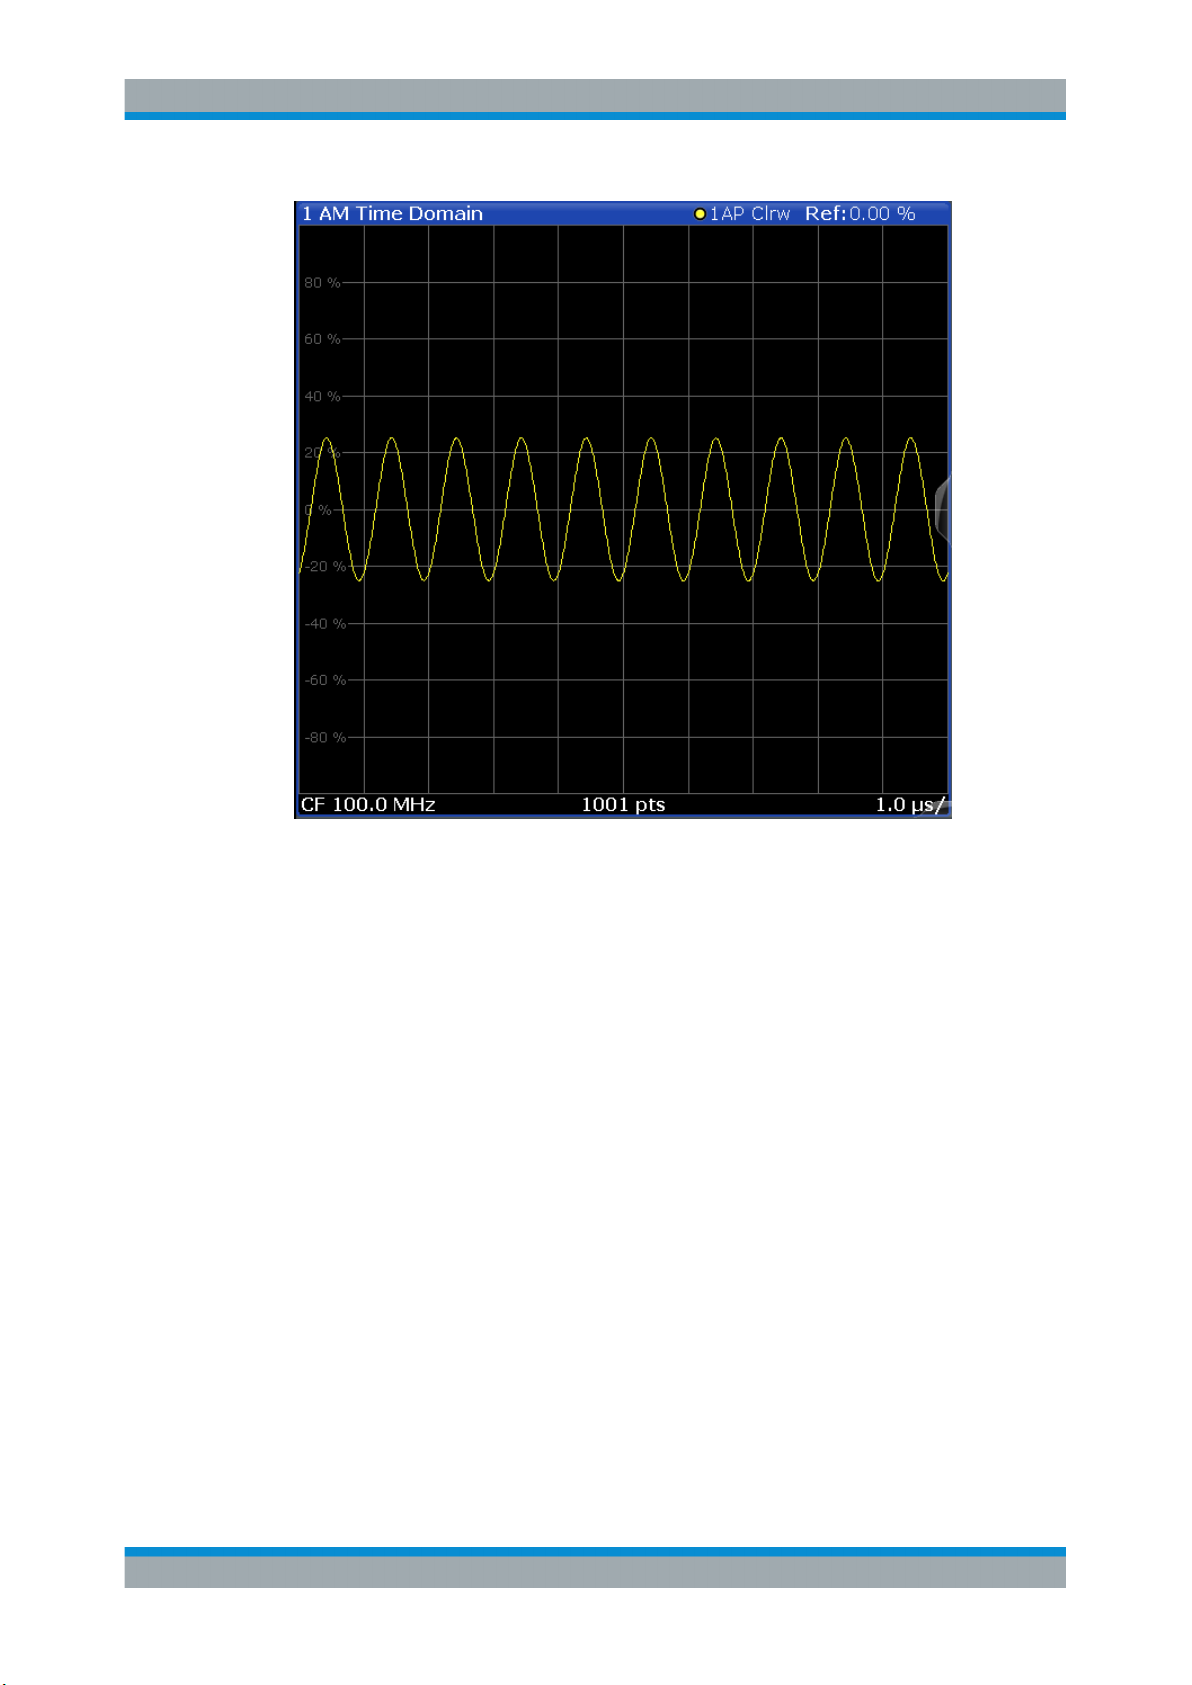
AM Time Domain
Displays the modulation depth of the demodulated AM signal (in %) versus time.
14User Manual 1177.5691.02 ─ 08
Page 15
R&S®FSWP-K7
Measurements and Result Displays
Remote command:
LAY:ADD? '1',RIGH,'XTIM:AM:REL'
(See LAYout:ADD[:WINDow]? on page 153)
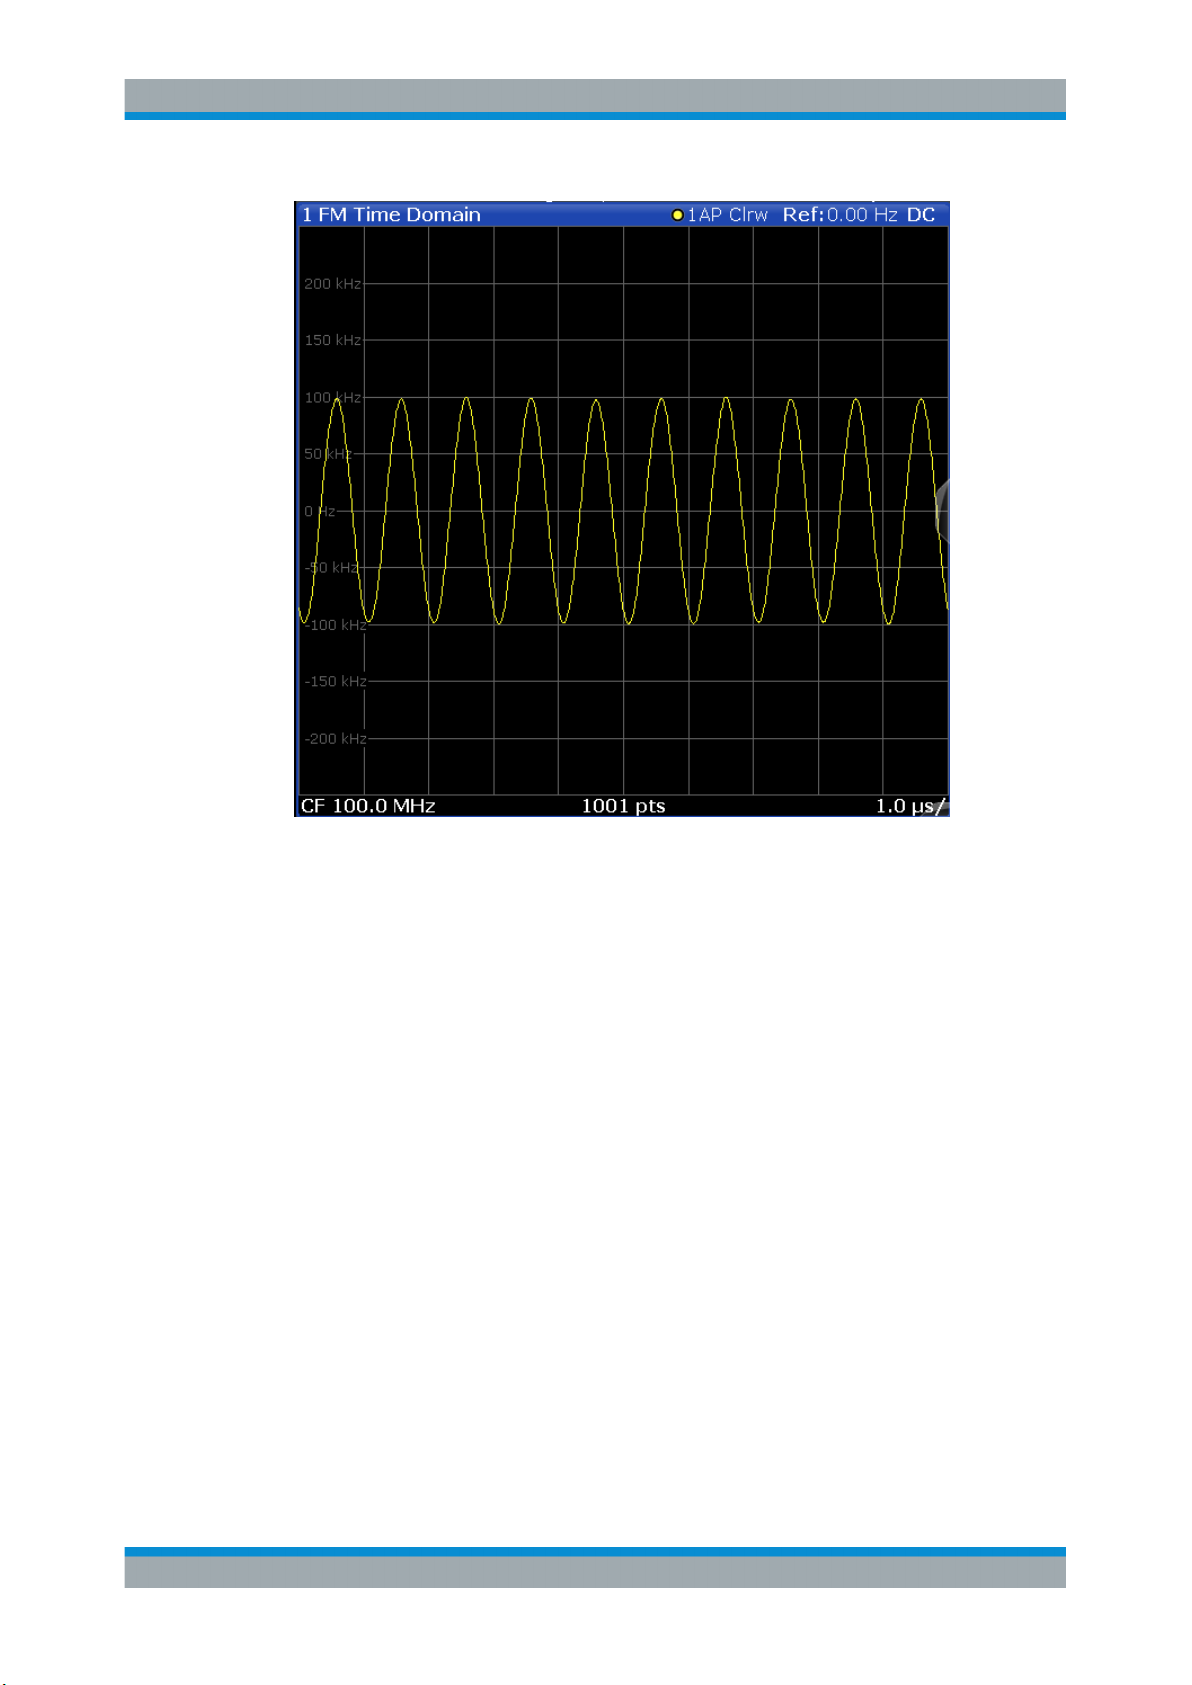
FM Time Domain
Displays the frequency spectrum of the demodulated FM signal versus time.
15User Manual 1177.5691.02 ─ 08
Page 16
R&S®FSWP-K7
Measurements and Result Displays
Remote command:
LAY:ADD? '1',RIGH,'XTIM:FM'
(See LAYout:ADD[:WINDow]? on page 153)
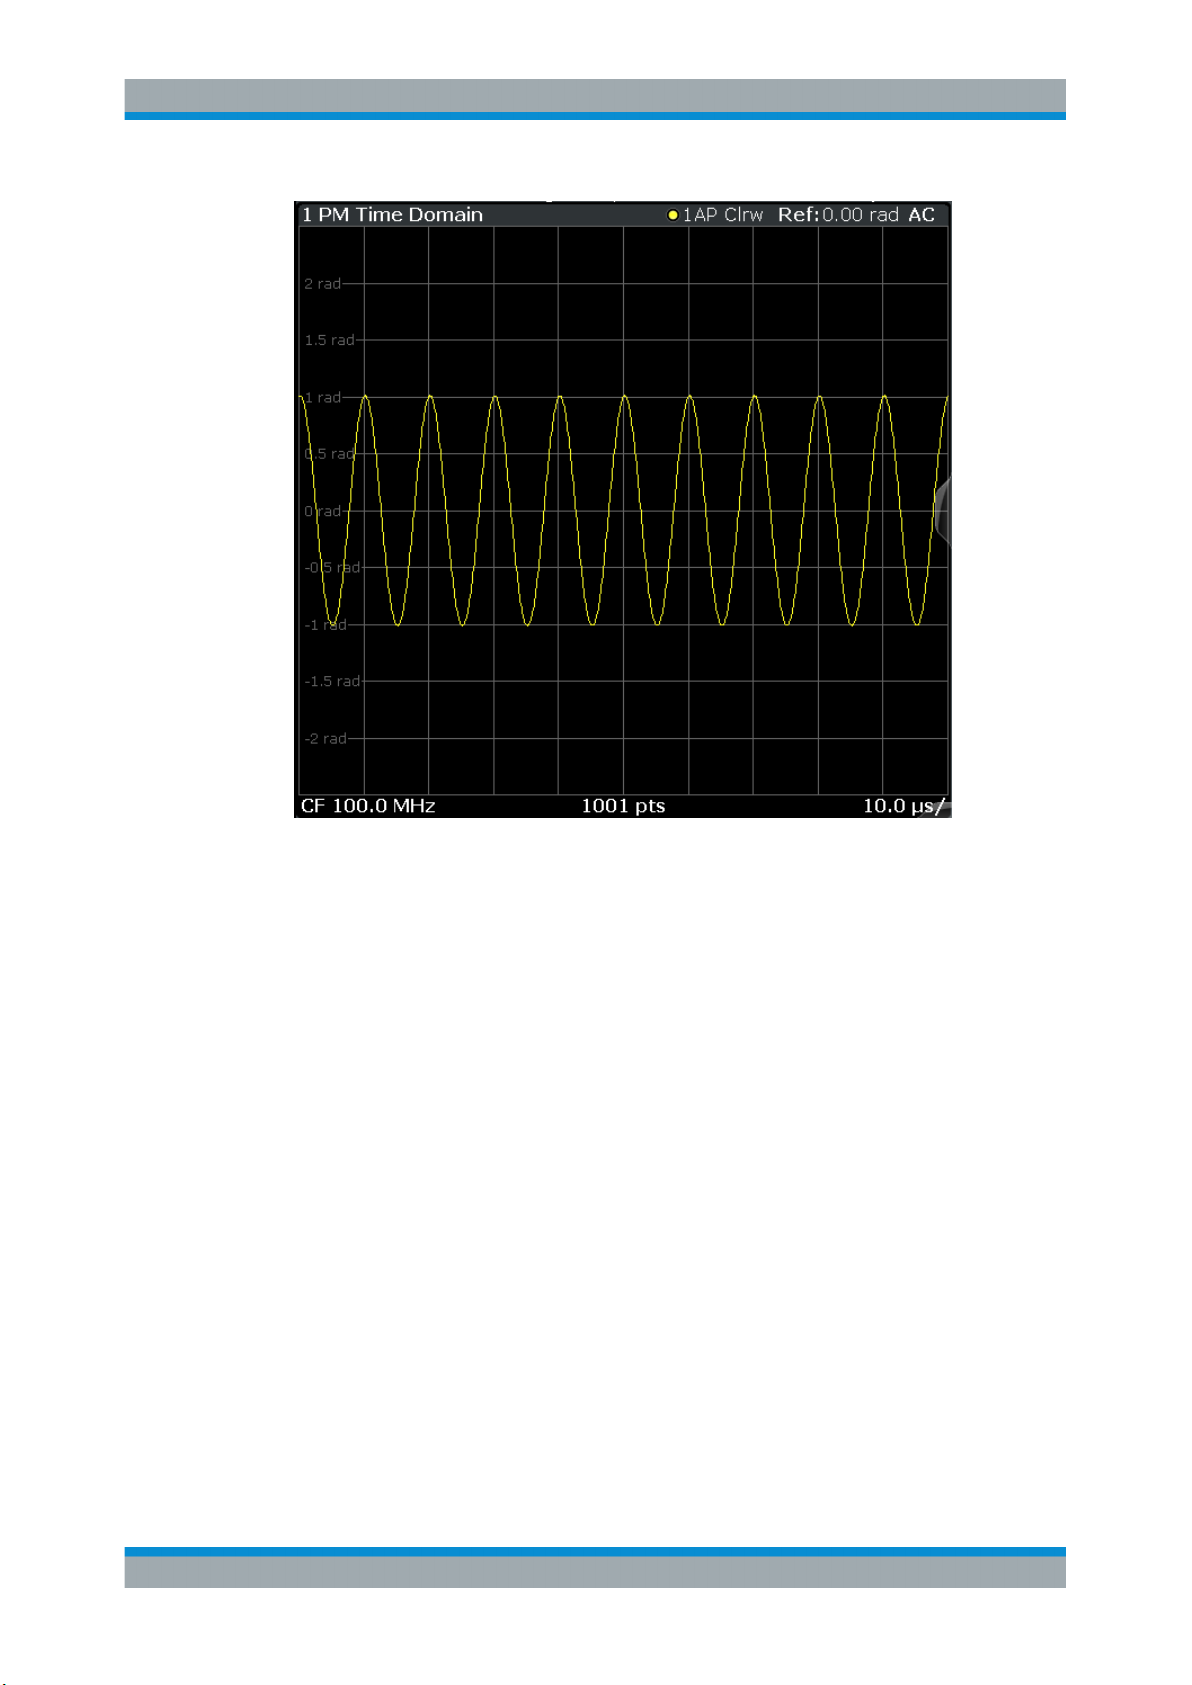
PM Time Domain
Displays the phase deviations of the demodulated PM signal (in rad or °) versus time.
16User Manual 1177.5691.02 ─ 08
Page 17
R&S®FSWP-K7
Measurements and Result Displays
Remote command:
LAY:ADD? '1',RIGH,'XTIM:PM'
(See LAYout:ADD[:WINDow]? on page 153)
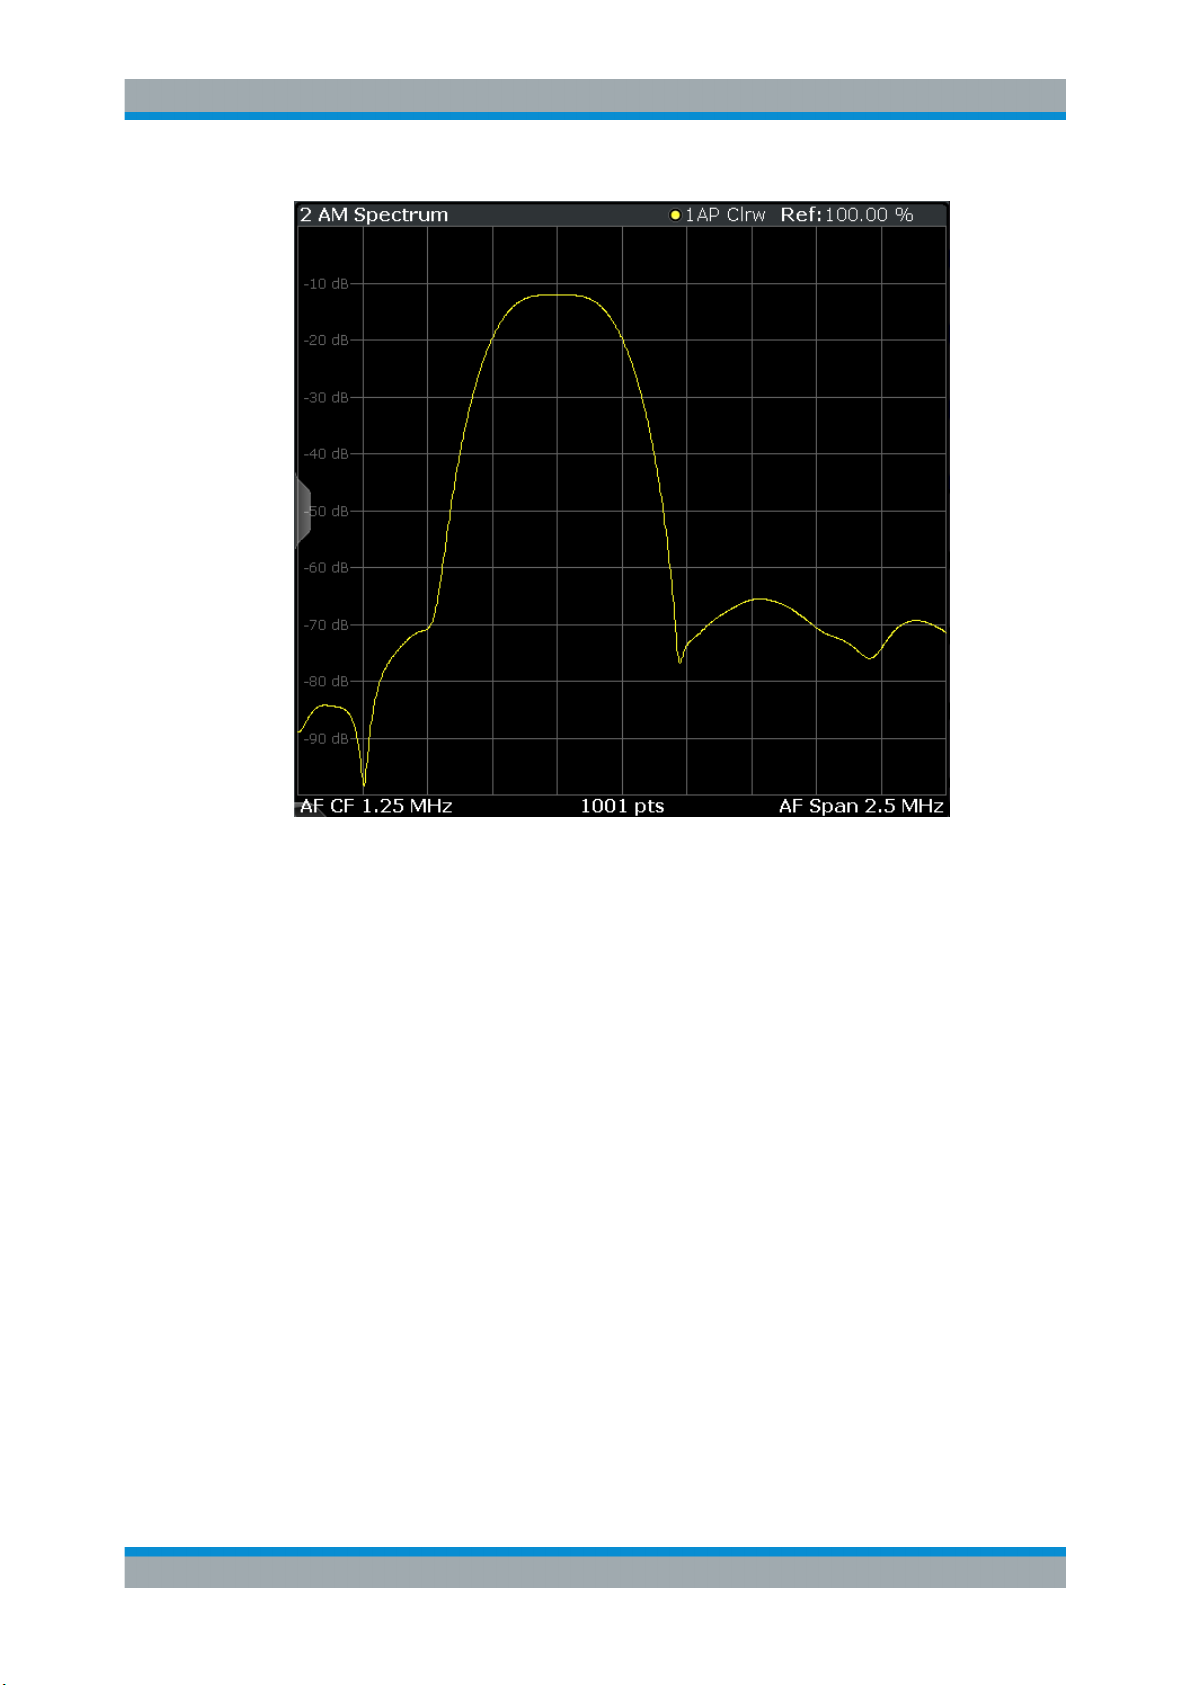
AM Spectrum
Displays the modulation depth of the demodulated AM signal (in % or dB) versus AF
span. The spectrum is calculated from the demodulated AM signal in the time domain
via FFT.
17User Manual 1177.5691.02 ─ 08
Page 18
R&S®FSWP-K7
Measurements and Result Displays
Note: If a high pass or low pass AF filter is defined, the filter is indicated by a vertical
red line in the spectrum display.
Remote command:
LAY:ADD? '1',RIGH,'XTIMe:AM:REL:AFSPectrum1'
(see LAYout:ADD[:WINDow]? on page 153)
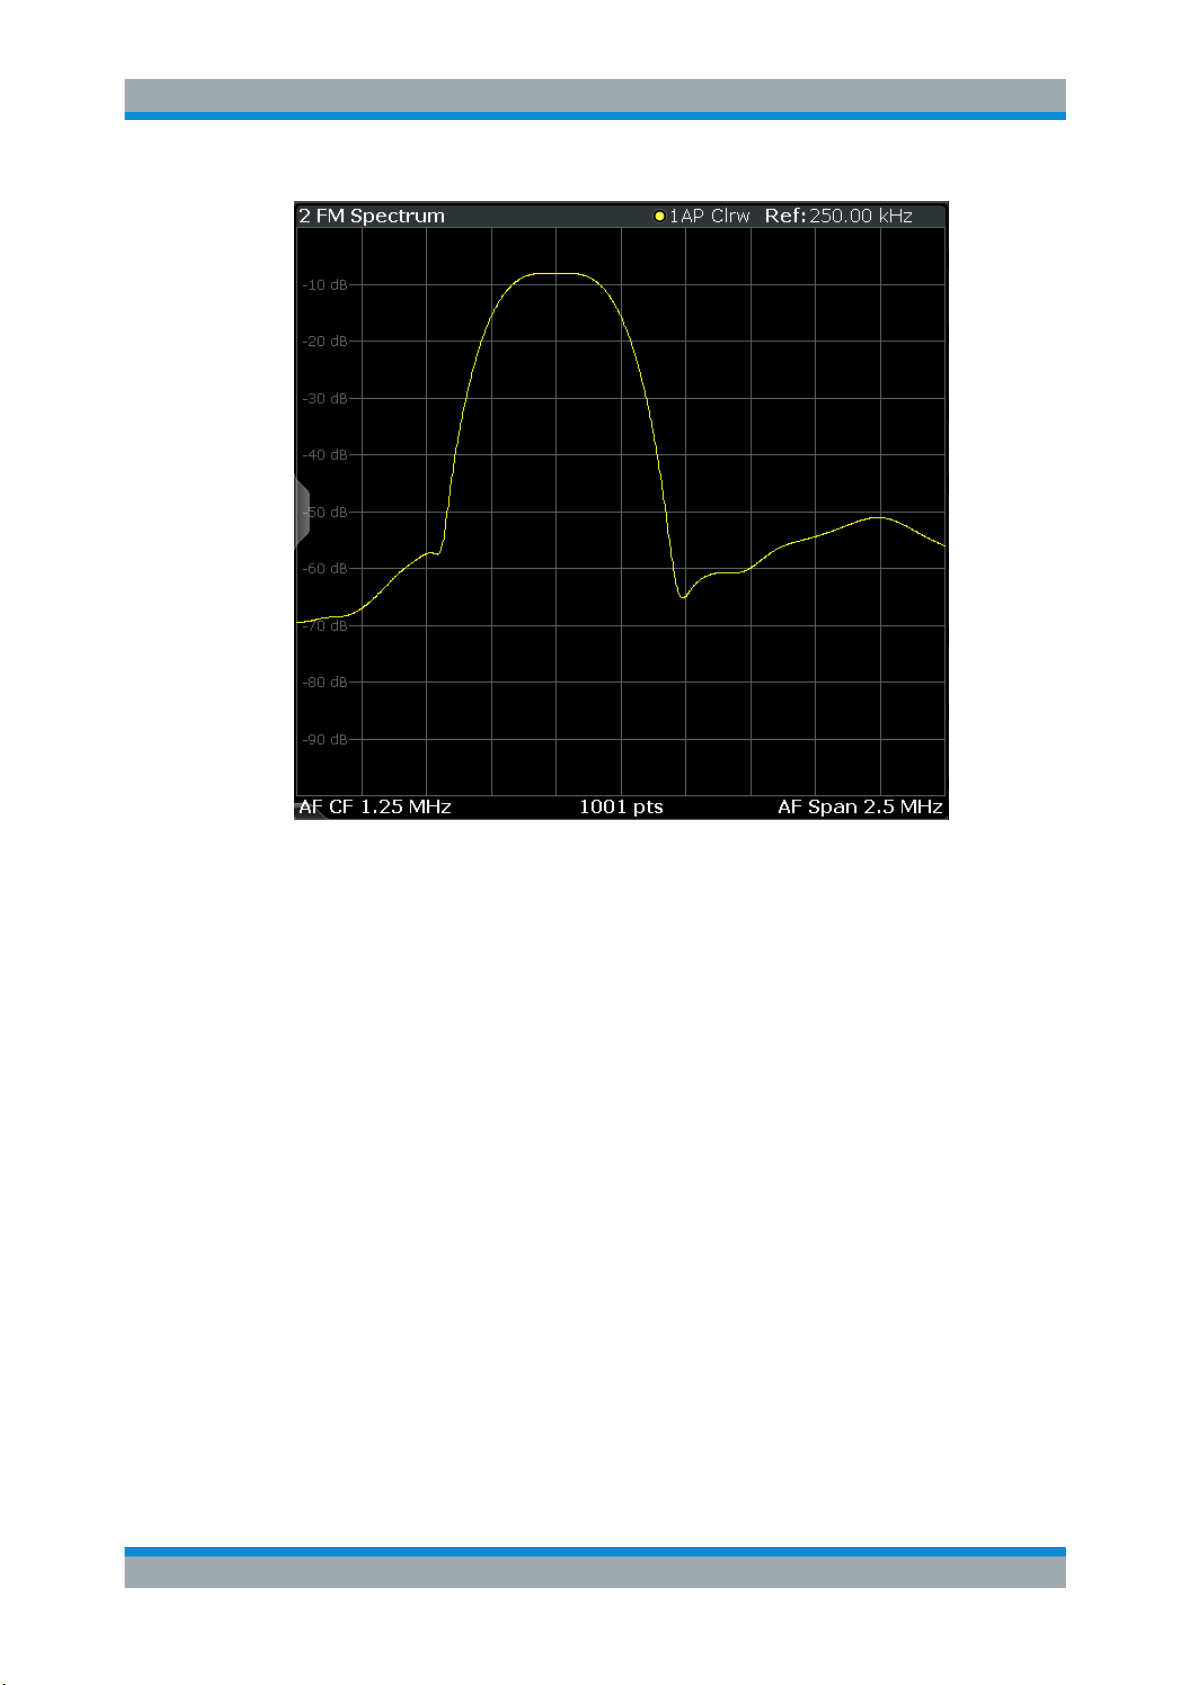
FM Spectrum
Displays the frequency deviations of the demodulated FM signal (in Hz or dB) versus
AF span. The spectrum is calculated from the demodulated AM signal in the time
domain via FFT.
18User Manual 1177.5691.02 ─ 08
Page 19
R&S®FSWP-K7
Measurements and Result Displays
Note: If a high pass or low pass AF filter is defined, the filter is indicated by a vertical
red line in the spectrum display.
Remote command:
LAY:ADD? '1',RIGH,'XTIMe:FM:AFSPectrum1'
(see LAYout:ADD[:WINDow]? on page 153)
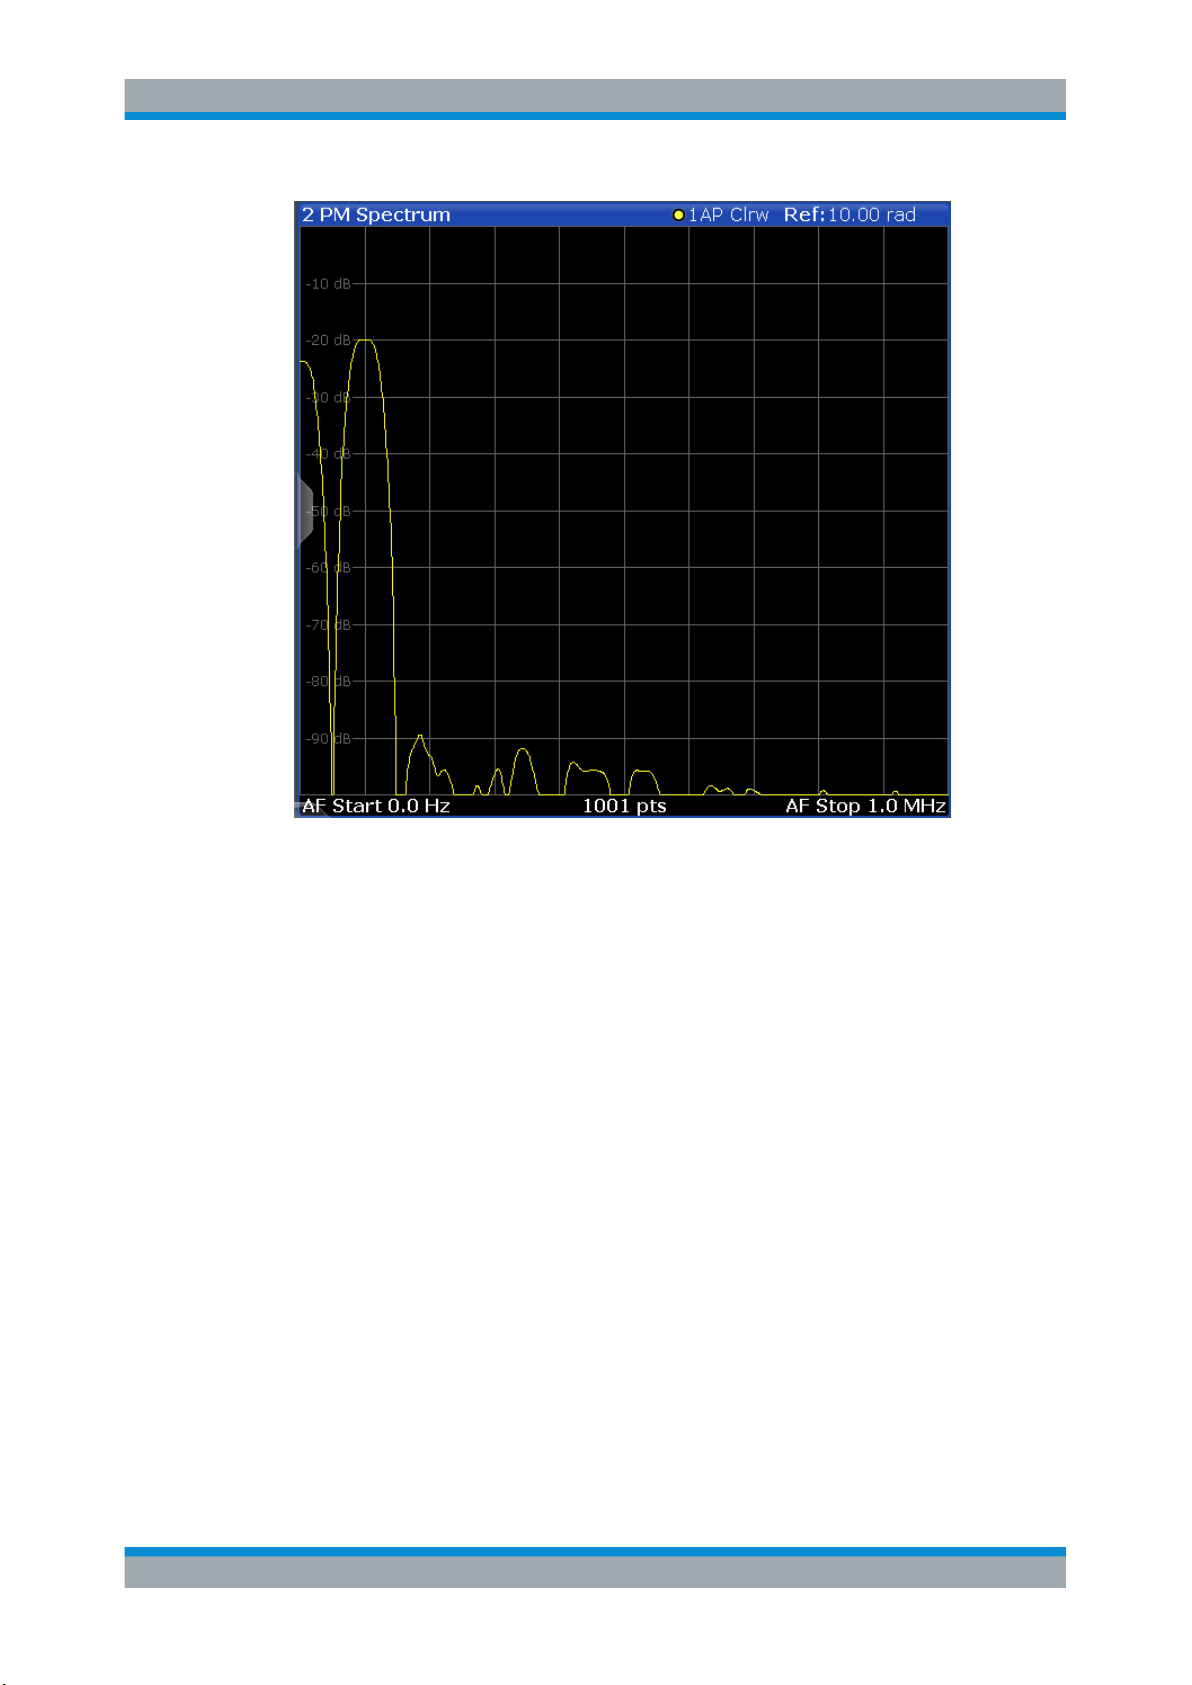
PM Spectrum
Displays the phase deviations of the demodulated PM signal (in rad, ° or dB) versus
AF span. The spectrum is calculated from the demodulated AM signal in the time
domain via FFT.
19User Manual 1177.5691.02 ─ 08
Page 20
R&S®FSWP-K7
Measurements and Result Displays
Note: If a high pass or low pass AF filter is defined, the filter is indicated by a vertical
red line in the spectrum display.
Remote command:
LAY:ADD? '1',RIGH,'XTIMe:PM:AFSPectrum1'
(see LAYout:ADD[:WINDow]? on page 153)
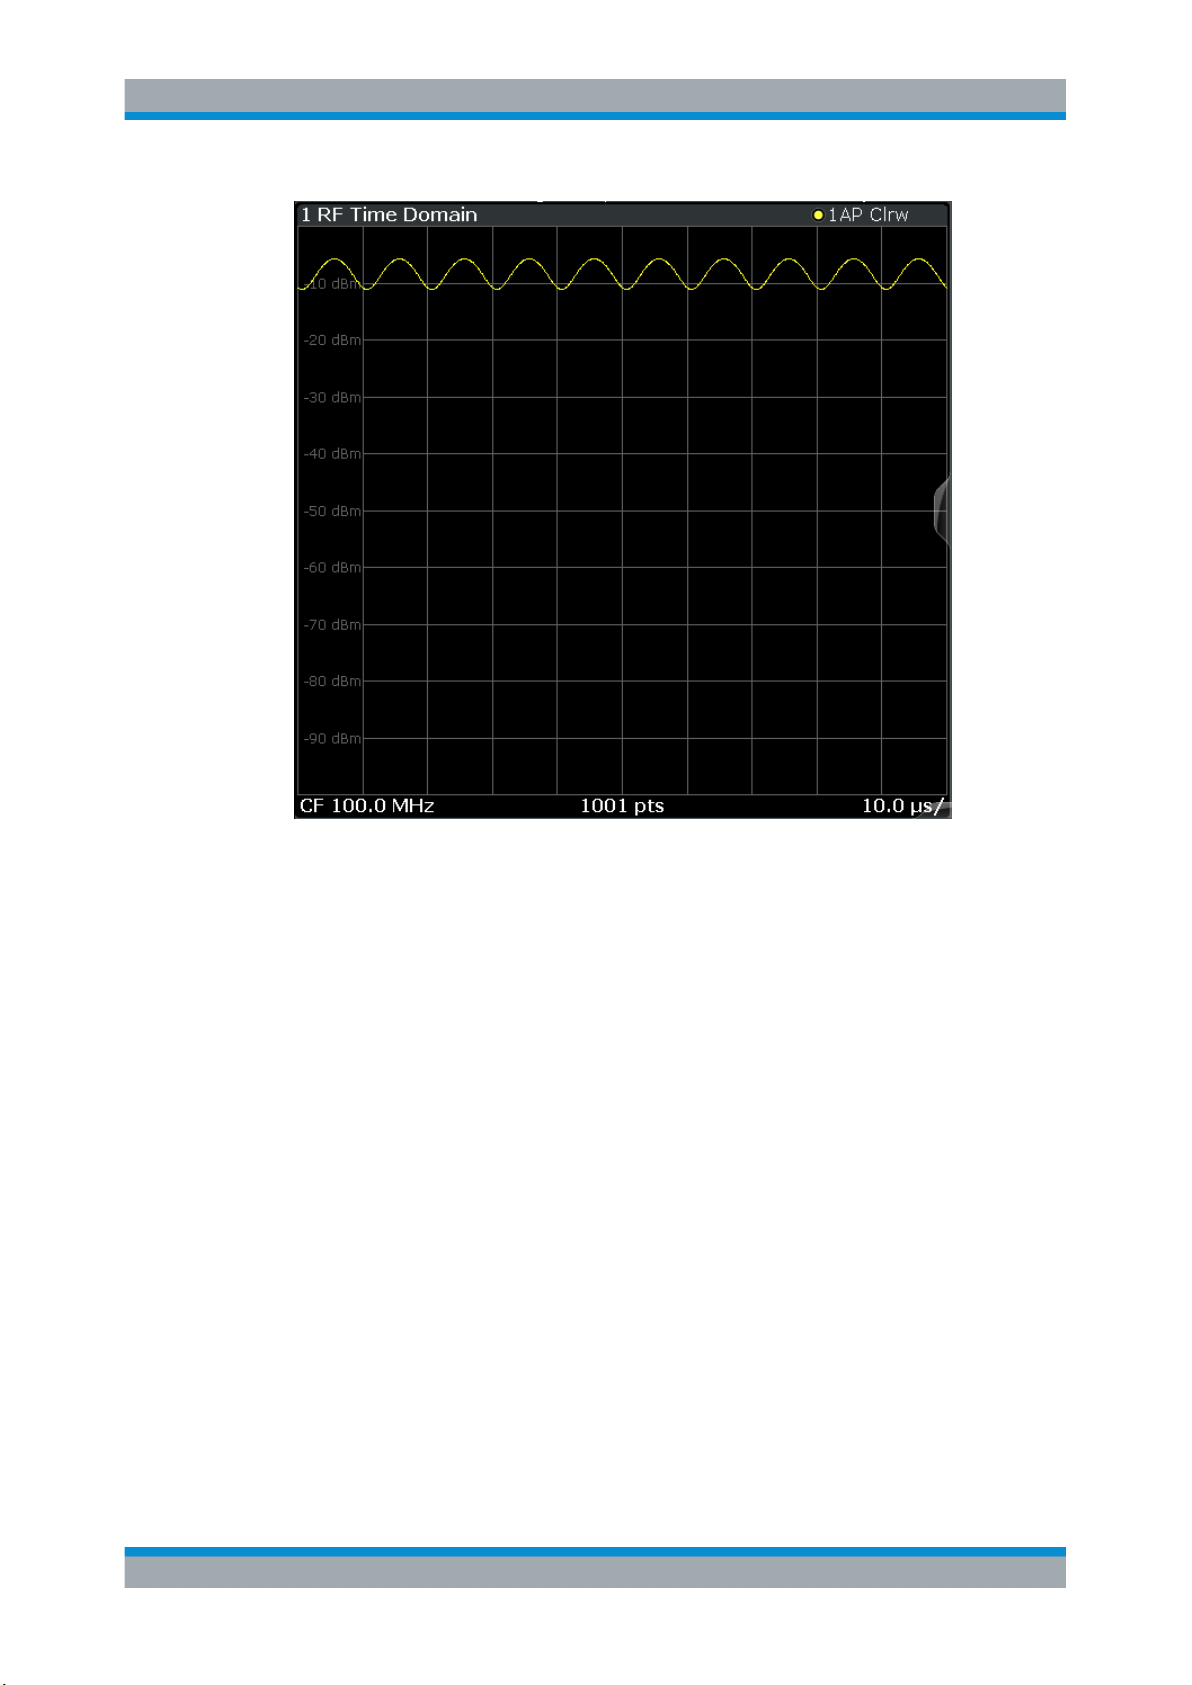
RF Time Domain
Displays the RF power of the input signal versus time. The level values represent the
magnitude of the I/Q data set.
20User Manual 1177.5691.02 ─ 08
Page 21
R&S®FSWP-K7
Measurements and Result Displays
Remote command:
LAY:ADD? '1',RIGH,'XTIM:AM'
(see LAYout:ADD[:WINDow]? on page 153)
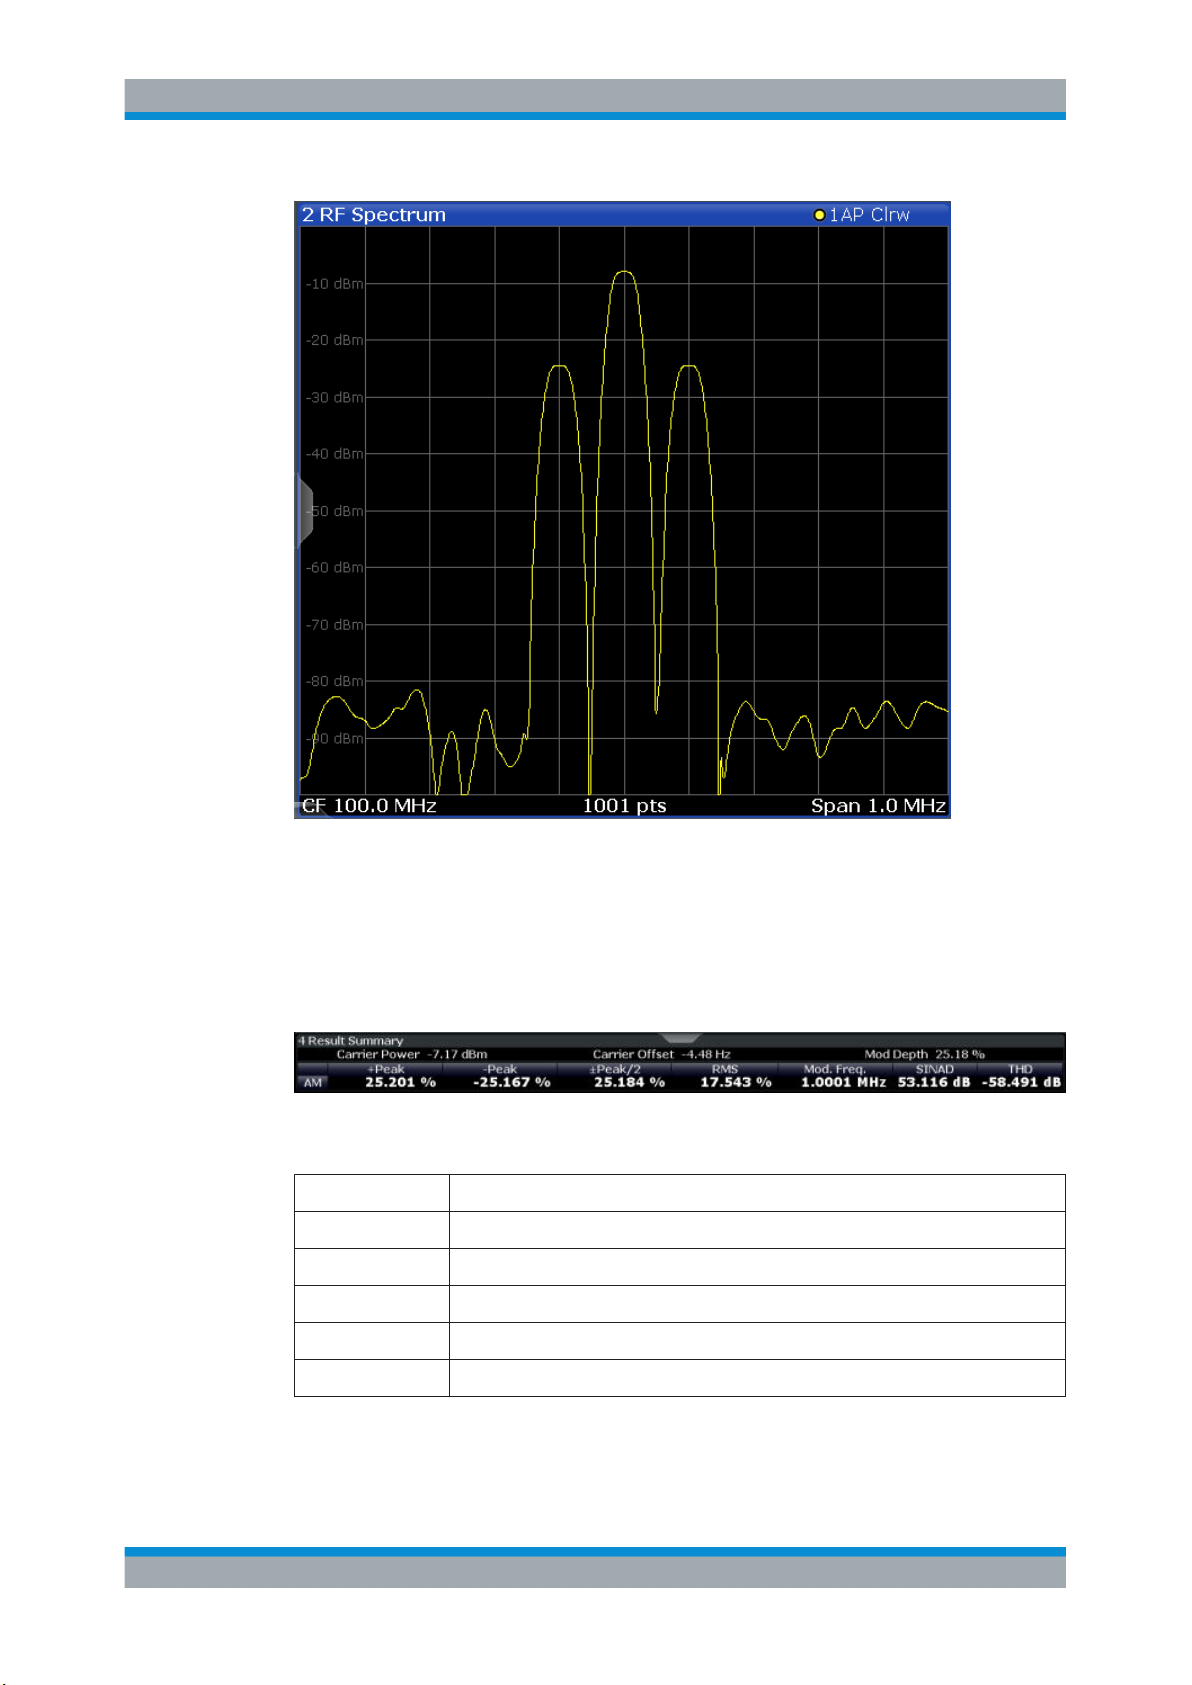
RF Spectrum
Displays the spectrum of the input signal. In contrast to the Spectrum application, the
frequency values are determined using FFT from the recorded I/Q data set.
21User Manual 1177.5691.02 ─ 08
Page 22
R&S®FSWP-K7
Measurements and Result Displays
Remote command:
LAY:ADD? '1',RIGH,'XTIM:SPECTRUM'
(see LAYout:ADD[:WINDow]? on page 153)
Result Summary
The result summary displays the results of the demodulation functions for all windows
in a table.
For each demodulation, the following information is provided:
Table 3-1: Result summary description
Label Description
+Peak Positive peak (maximum)
-Peak Negative peak (minimum)
+/-Peak/2 Average of positive and negative peaks
RMS Root Mean Square value
Mod Freq Modulation frequency
22User Manual 1177.5691.02 ─ 08
Page 23
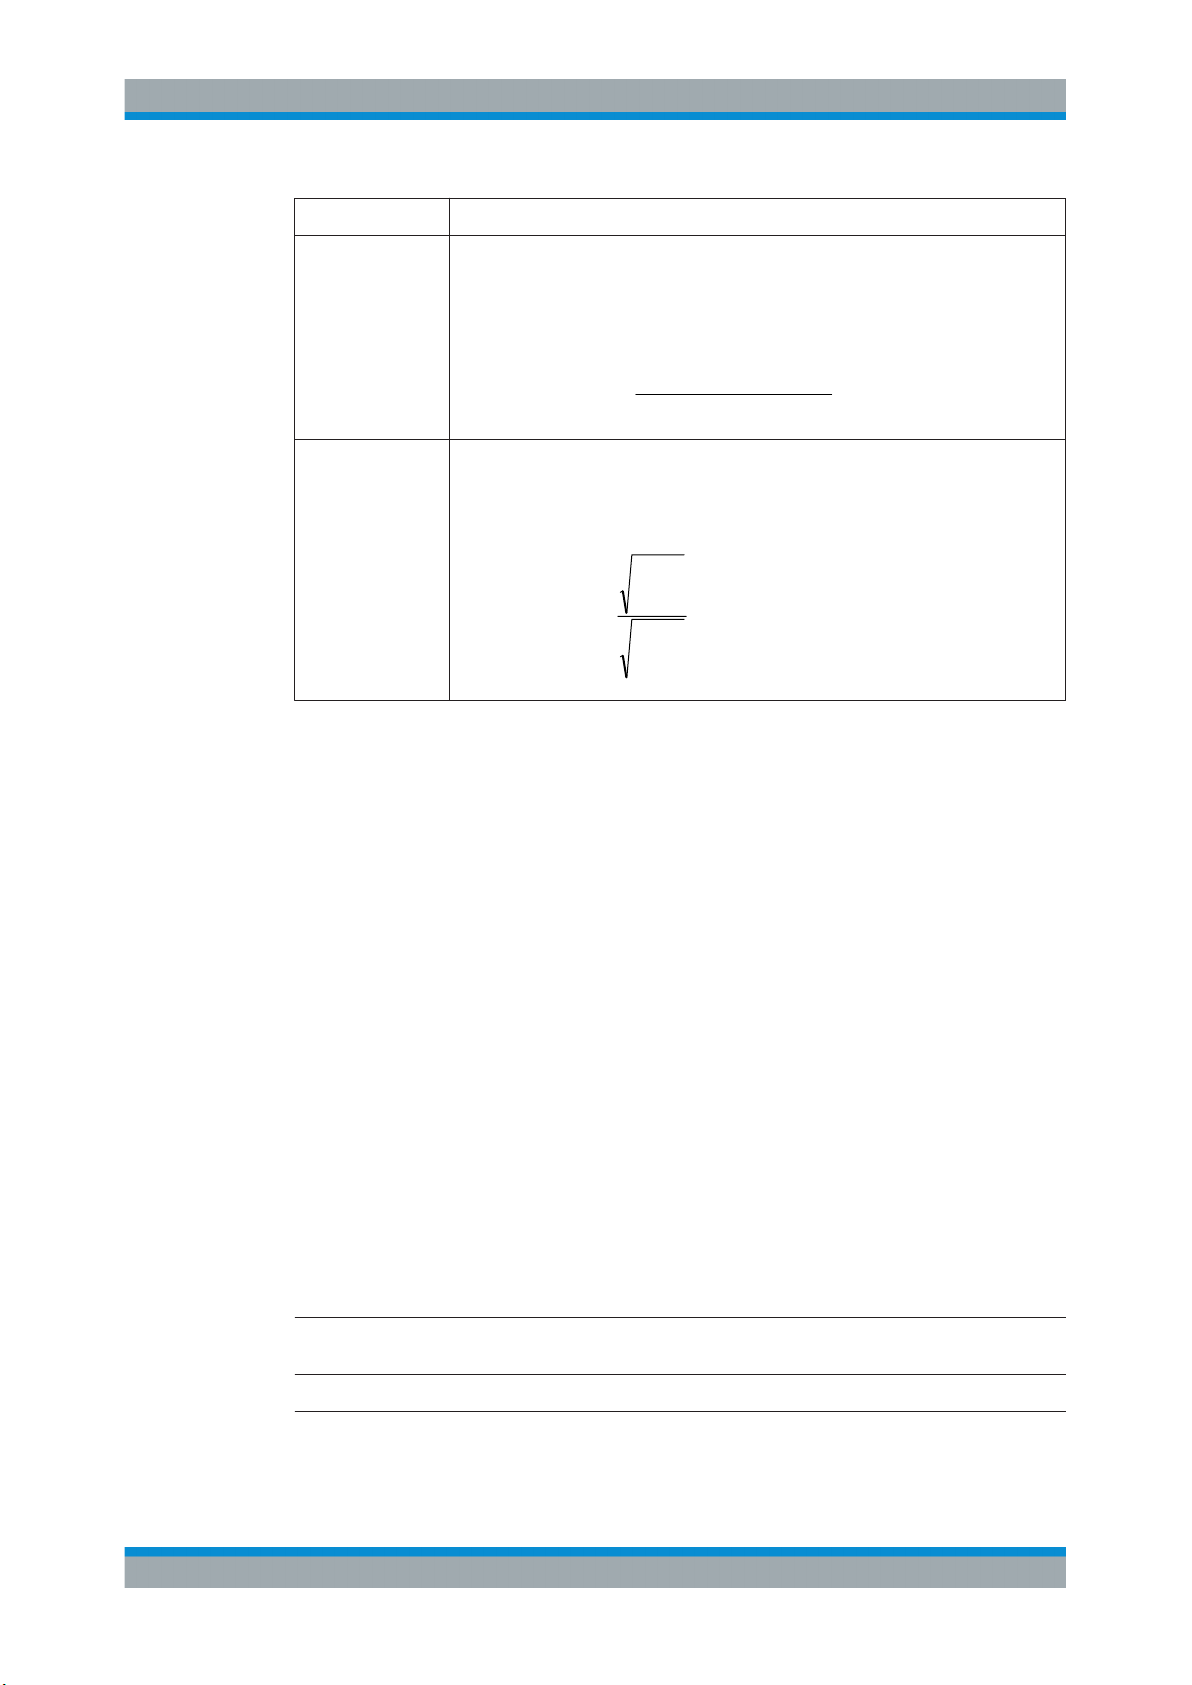
R&S®FSWP-K7
power distortion noise
power total
log20dBSINAD
1
2
2
2
log20
i
i
i
i
U
U
dBTHD
Measurements and Result Displays
Label Description
SINAD Signal-to-noise-and-distortion
(Calculated only if AF Spectrum is displayed)
Measures the ratio of the total power to the power of noise and harmonic distortions.
The noise and harmonic power is calculated inside the AF spectrum span. The DC
offset is removed before the calculation.
THD Total harmonic distortion
The ratio of the harmonics to the fundamental and harmonics. All harmonics inside
the AF spectrum span are considered up to the tenth harmonic.
(Calculated only if AF Spectrum is displayed)
Note: Relative demodulation results. Optionally, the demodulation results in relation to
user-defined or measured reference values are determined. See Chapter 5.8.6, "Result
Table Settings", on page 70.
In addition, the following general information for the input signal is provided:
●
Carrier Power: the power of the carrier without modulation
●
Carrier Offset: the deviation of the calculated carrier frequency to the ideal carrier
frequency
●
Modulation Depth (AM or RF Time Domain only): the difference in amplitude the
carrier signal is modulated with
Remote command:
LAY:ADD? '1',RIGH,RSUM, see LAYout:ADD[:WINDow]? on page 153
Results:
CALCulate<n>:MARKer<m>:FUNCtion:ADEMod:PM[:RESult<t>]? on page 164
CALCulate<n>:MARKer<m>:FUNCtion:ADEMod:PM[:RESult<t>]:RELative?
on page 164
Marker Table
Displays a table with the current marker values for the active markers.
This table is displayed automatically if configured accordingly.
Type Shows the marker type and number ("M" for a nor-
mal marker, "D" for a delta marker).
Ref Shows the reference marker that a delta marker
refers to.
Trace Shows the trace that the marker is positioned on.
X- / Y-Value Shows the marker coordinates (usually frequency
and level).
23User Manual 1177.5691.02 ─ 08
Page 24
R&S®FSWP-K7
Measurements and Result Displays
Tip: To navigate within long marker tables, simply scroll through the entries with your
finger on the touchscreen.
Remote command:
LAY:ADD? '1',RIGH, MTAB, see LAYout:ADD[:WINDow]? on page 153
Results:
CALCulate<n>:MARKer<m>:X on page 167
CALCulate<n>:MARKer<m>:Y on page 168
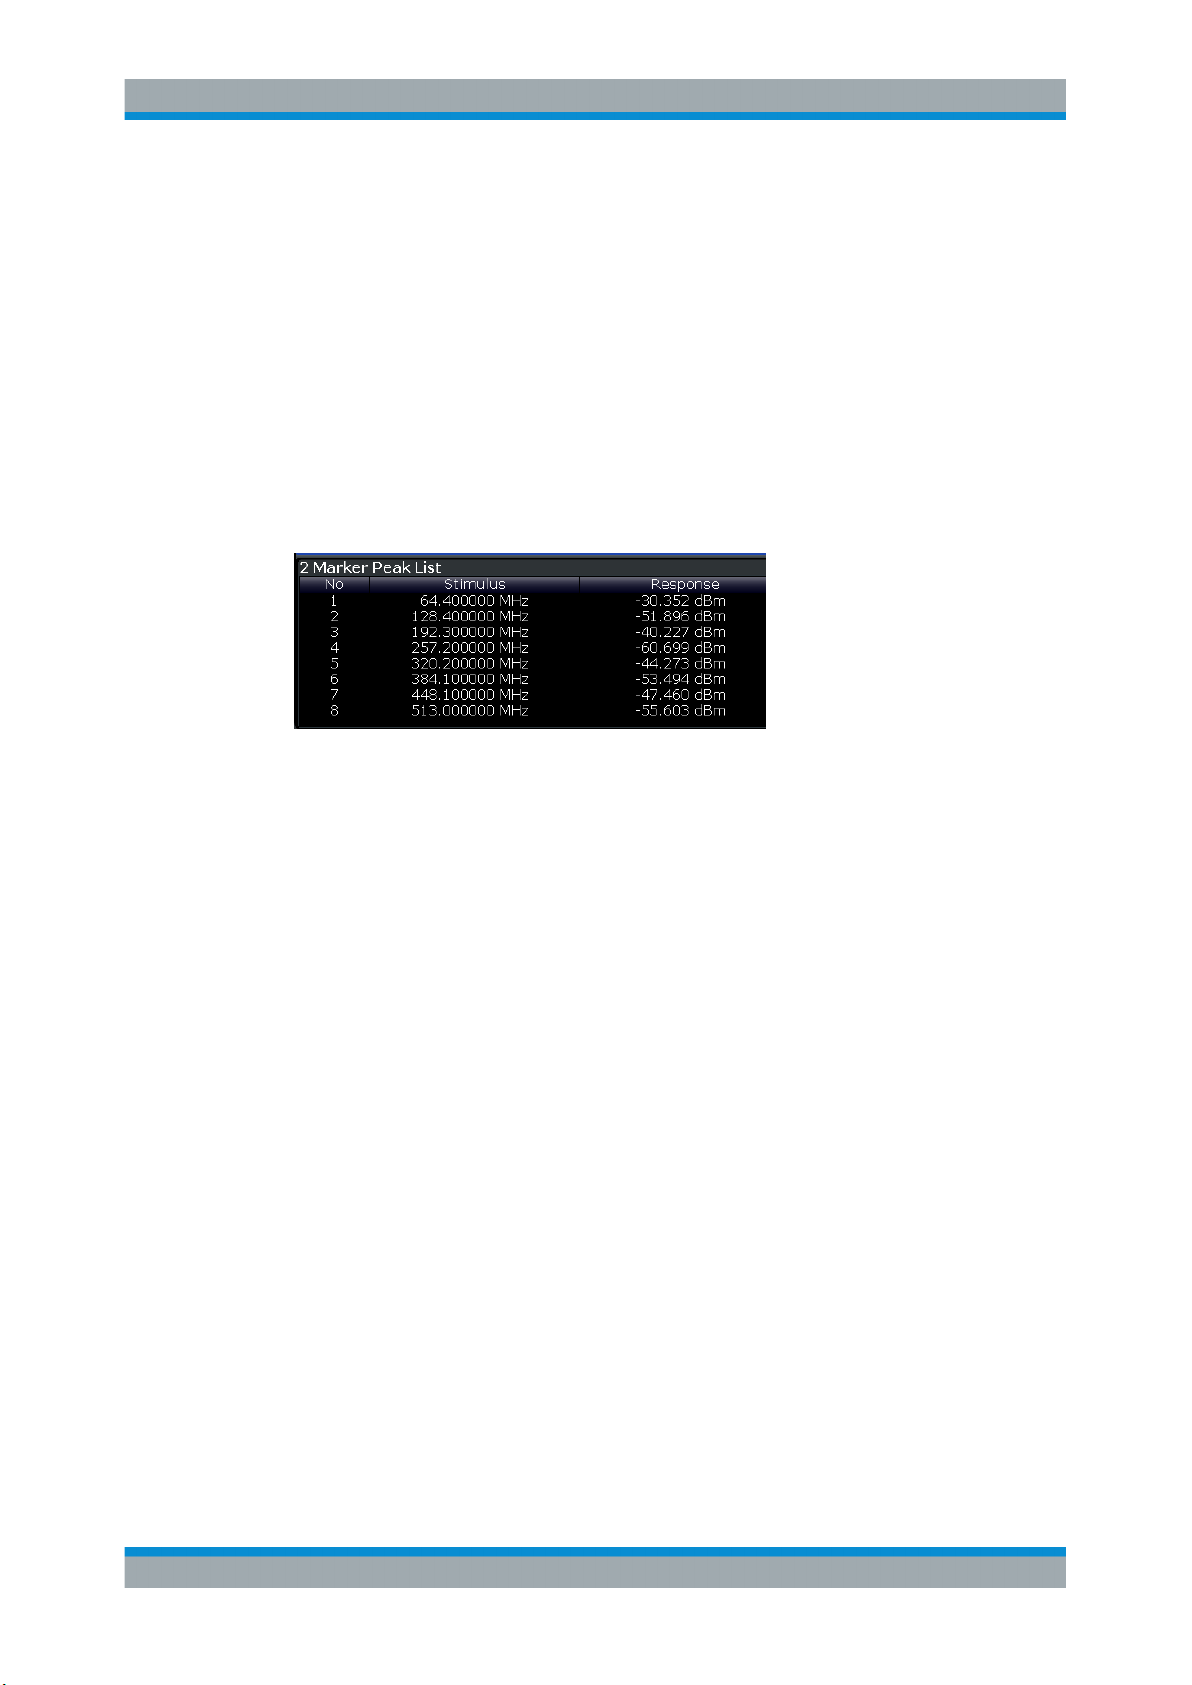
Marker Peak List
The marker peak list determines the frequencies and levels of peaks in the spectrum or
time domain. How many peaks are displayed can be defined, as well as the sort order.
In addition, the detected peaks can be indicated in the diagram. The peak list can also
be exported to a file for analysis in an external application.
Tip: To navigate within long marker peak lists, simply scroll through the entries with
your finger on the touchscreen.
Remote command:
LAY:ADD? '1',RIGH, PEAK, see LAYout:ADD[:WINDow]? on page 153
Results:
CALCulate<n>:MARKer<m>:X on page 167
CALCulate<n>:MARKer<m>:Y on page 168
24User Manual 1177.5691.02 ─ 08
Page 25

R&S®FSWP-K7
4 Measurement Basics
4.1 Demodulation Process
Measurement Basics
Demodulation Process
Some background knowledge on basic terms and principles used in Analog Modulation
Analysis measurements is provided here for a better understanding of the required
configuration settings.
● Demodulation Process............................................................................................25
● Demodulation Bandwidth........................................................................................ 27
● Sample Rate and Demodulation Bandwidth........................................................... 28
● AF Triggers............................................................................................................. 29
● AF Filters.................................................................................................................29
● Time Domain Zoom.................................................................................................29
● Analog Modulation Analysis in MSRA Operating Mode..........................................31
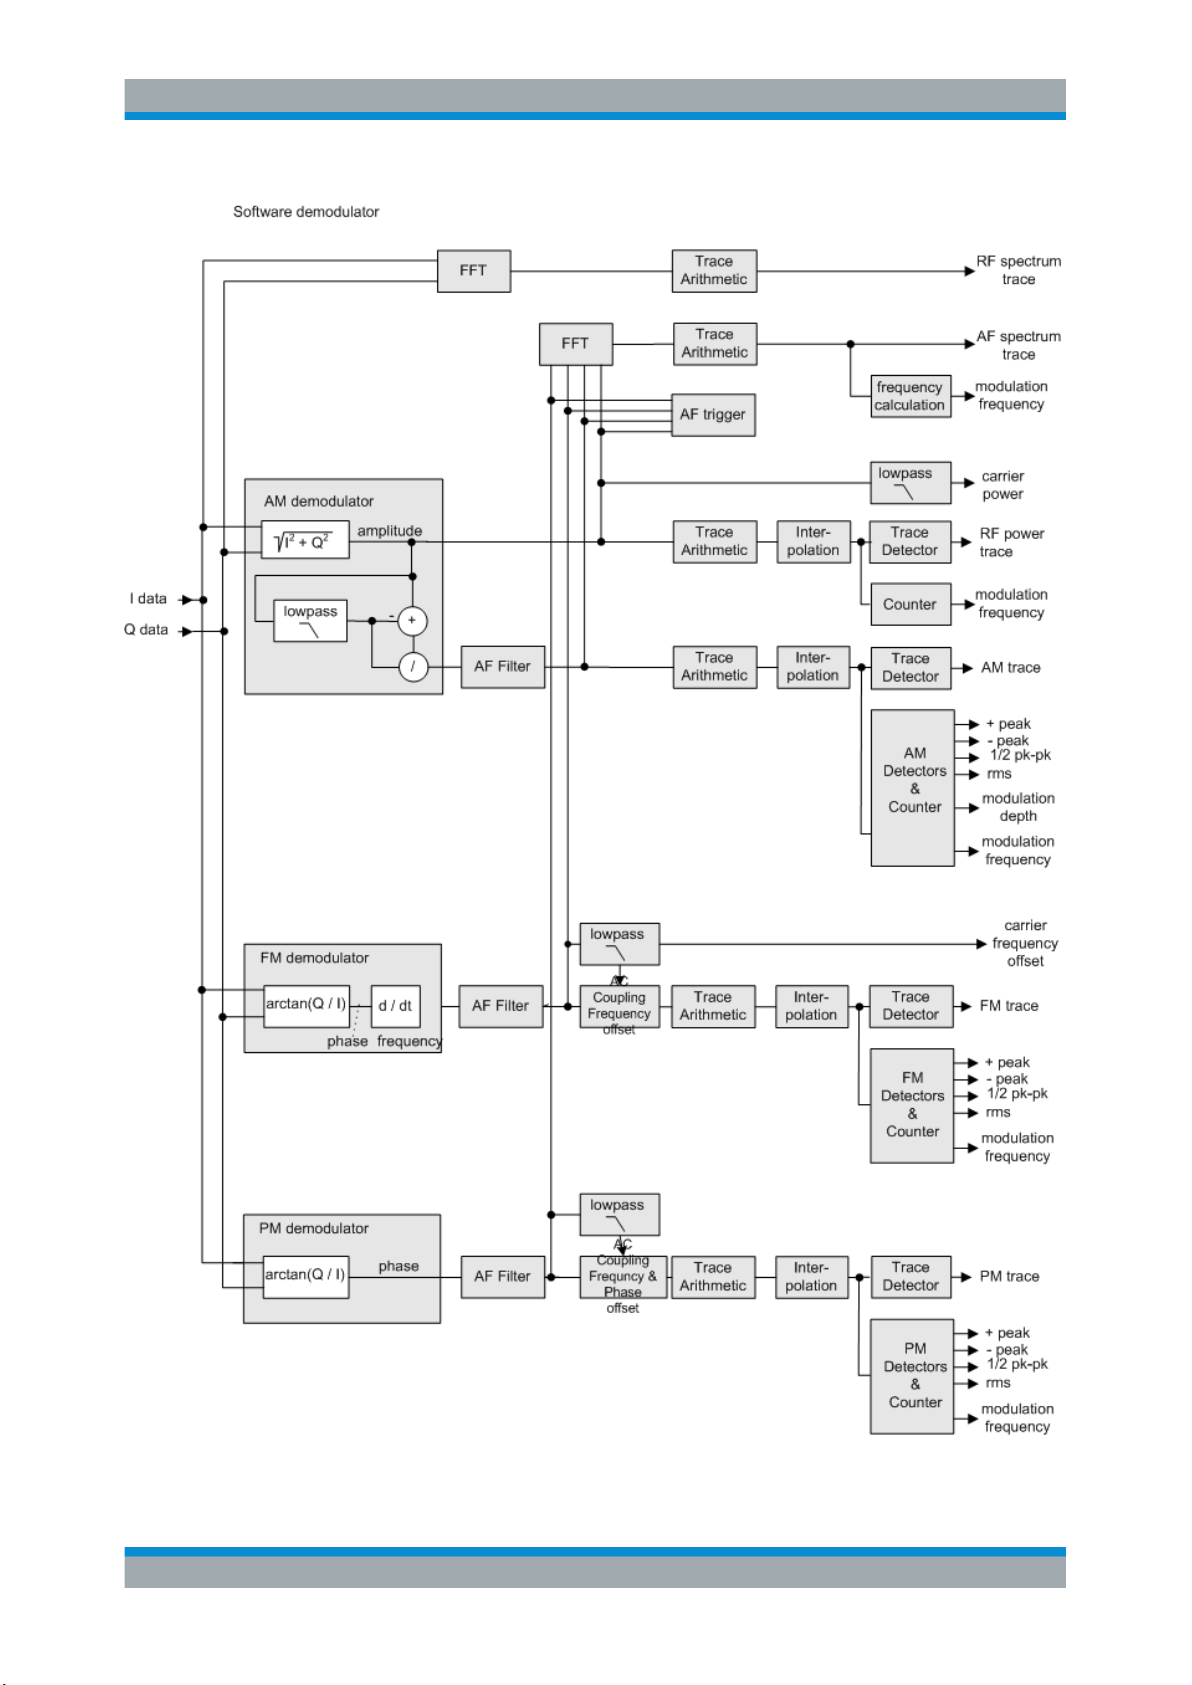
The demodulation process is shown in Figure 4-1. All calculations are performed simultaneously with the same I/Q data set. Magnitude (= amplitude) and phase of the complex I/Q pairs are determined. The frequency result is obtained from the differential
phase.
For details on general I/Q data processing in the R&S FSWP, refer to the reference
part of the I/Q Analysis remote control description in the R&S FSWP User Manual.
25User Manual 1177.5691.02 ─ 08
Page 26
R&S®FSWP-K7
Measurement Basics
Demodulation Process
Figure 4-1: Block diagram of software demodulator
26User Manual 1177.5691.02 ─ 08
Page 27

R&S®FSWP-K7
Measurement Basics
Demodulation Bandwidth
The AM DC, FM DC and PM DC raw data of the demodulators is fed into the "Trace
Arithmetic" block that combines consecutive data sets. Possible trace modes are:
Clear Write, Max Hold, Min Hold and Average. The output data of the "Trace Arithmetic" block can be read via remote control ([SENS:]ADEM:<evaluation>:RES?,
see [SENSe:]ADEMod:AM[:ABSolute][:TDOMain]:RESult? on page 161.
The collected measured values are evaluated by the selected detector. The result is
displayed on the screen and can be read out via remote control.
In addition, important parameters are calculated:
●
A counter determines the modulation frequency for AM, FM, and PM.
●
average power = carrier power (RF power)
●
average frequency = carrier frequency offset (FM)
●
The modulation depth or the frequency or phase deviation; the deviations are
determined from the trace data
AC coupling is possible with FM and PM display.
4.2 Demodulation Bandwidth
The demodulation bandwidth determines the span of the signal that is demodulated. It
is not the 3 dB bandwidth of the filter but the useful bandwidth which is distortion-free
with regard to phase and amplitude.
Therefore the following formulas apply:
●
AM: demodulation bandwidth ≥ 2 x modulation frequency
●
FM: demodulation bandwidth ≥ 2 x (frequency deviation + modulation frequency)
●
PM: demodulation bandwidth ≥ 2 x modulation frequency x (1 + phase deviation)
If the center frequency of the analyzer is not set exactly to the signal frequency, the
demodulation bandwidth must be increased by the carrier offset, in addition to the
requirement described above. This also applies if FM or PM AC coupling has been
selected.
In general, the demodulation bandwidth should be as narrow as possible to improve
the S/N ratio. The residual FM caused by noise floor and phase noise increases dramatically with the bandwidth, especially with FM.
For help on determining the adequate demodulation bandwidth see "Determining the
demodulation bandwidth" on page 91.
A practical example is described in Chapter 9, "Measurement Example: Demodulating
an FM Signal", on page 85.
27User Manual 1177.5691.02 ─ 08
Page 28

R&S®FSWP-K7
4.3 Sample Rate and Demodulation Bandwidth
Measurement Basics
Sample Rate and Demodulation Bandwidth
The maximum demodulation bandwidths that can be obtained during the measurement, depending on the sample rate, are listed in the tables below for different demodulation filter types. The allowed value range of the measurement time and trigger offset
depends on the selected demodulation bandwidth and demodulation filter. If the AF filter or the AF trigger are not active, the measurement time increases by 20 %.
A maximum of 24 million samples can be captured, assuming sufficient memory is
available; thus the maximum measurement time can be determined according to the
following formula:
Meas.time
The minimum trigger offset is (-Meas.time
Table 4-1: Available demodulation bandwidths and corresponding sample rates
Demodulation BW Sample Rate (Flat Top) Sample Rate (Gaussian Top)
= Sample count
max
/ sample rate
max
max
)
100 Hz 122.0703125 Hz 400 Hz
200 Hz 244.140625 Hz 800 Hz
400 Hz 488.28125 Hz 1.6 kHz
800 Hz 976.5625 Hz 3.2 kHz
1.6 kHz 1.953125 kHz 6.4 kHz
3.2 kHz 3.90625 kHz 12.8 kHz
6.4 kHz 7.8125 kHz 25.6 kHz
12.5 kHz 15.625 kHz 50 kHz
25 kHz 31.25 kHz 100 kHz
50 kHz 62.5 kHz 200 kHz
100 kHz 125 kHz 400 kHz
200 kHz 250 kHz 800 kHz
400 kHz 500 kHz 1.6 MHz
800 kHz 1 MHz 3.2 MHz
1.6 MHz 2 MHz 6.4 MHz
3 MHz 4 MHz 12 MHz
5 MHz 8 MHz 20 MHz
8 MHz 16 MHz 32 MHz
10 MHz 32 MHz 40 MHz
80 MHz
160 MHz
1)
2)
128 MHz 320 MHz
200 MHz 640 MHz
28User Manual 1177.5691.02 ─ 08
Page 29
R&S®FSWP-K7
Measurement Basics
Time Domain Zoom
Demodulation BW Sample Rate (Flat Top) Sample Rate (Gaussian Top)
320 MHz
1)
2)
2)
only available with option B80
only available with option B320
400 MHz 1280 MHz
Large numbers of samples
Principally, the R&S FSWP can handle up to 24 million samples. However, when
480001 samples are exceeded, all traces that are not currently being displayed in a
window are deactivated to improve performance. The traces can only be activated
again when the samples are reduced.
Effects of measurement time on the stability of measurement results
Despite amplitude and frequency modulation, the display of carrier power and carrier
frequency offset is stable.
This is achieved by a digital filter which sufficiently suppresses the modulation, provided, however, that the measurement time is ≥ 3 x 1 / modulation frequency, i.e. that at
least three periods of the AF signal are recorded.
The mean carrier power for calculating the AM is also calculated with a digital filter that
returns stable results after a measurement time of ≥ 3 x 1 / modulation frequency, i.e.
at least three cycles of the AF signal must be recorded before a stable AM can be
shown.
4.4 AF Triggers
The Analog Modulation Analysis application allows triggering to the demodulated signal. The display is stable if a minimum of five modulation periods are within the recording time.
Triggering is always DC-coupled. Therefore triggering is possible directly to the point
where a specific carrier level, phase or frequency is exceeded or not attained.
4.5 AF Filters
Additional filters applied after demodulation help filter out unwanted signals, or correct
pre-emphasized input signals. A CCITT filter allows you to evaluate the signal by simulating the characteristics of human hearing.
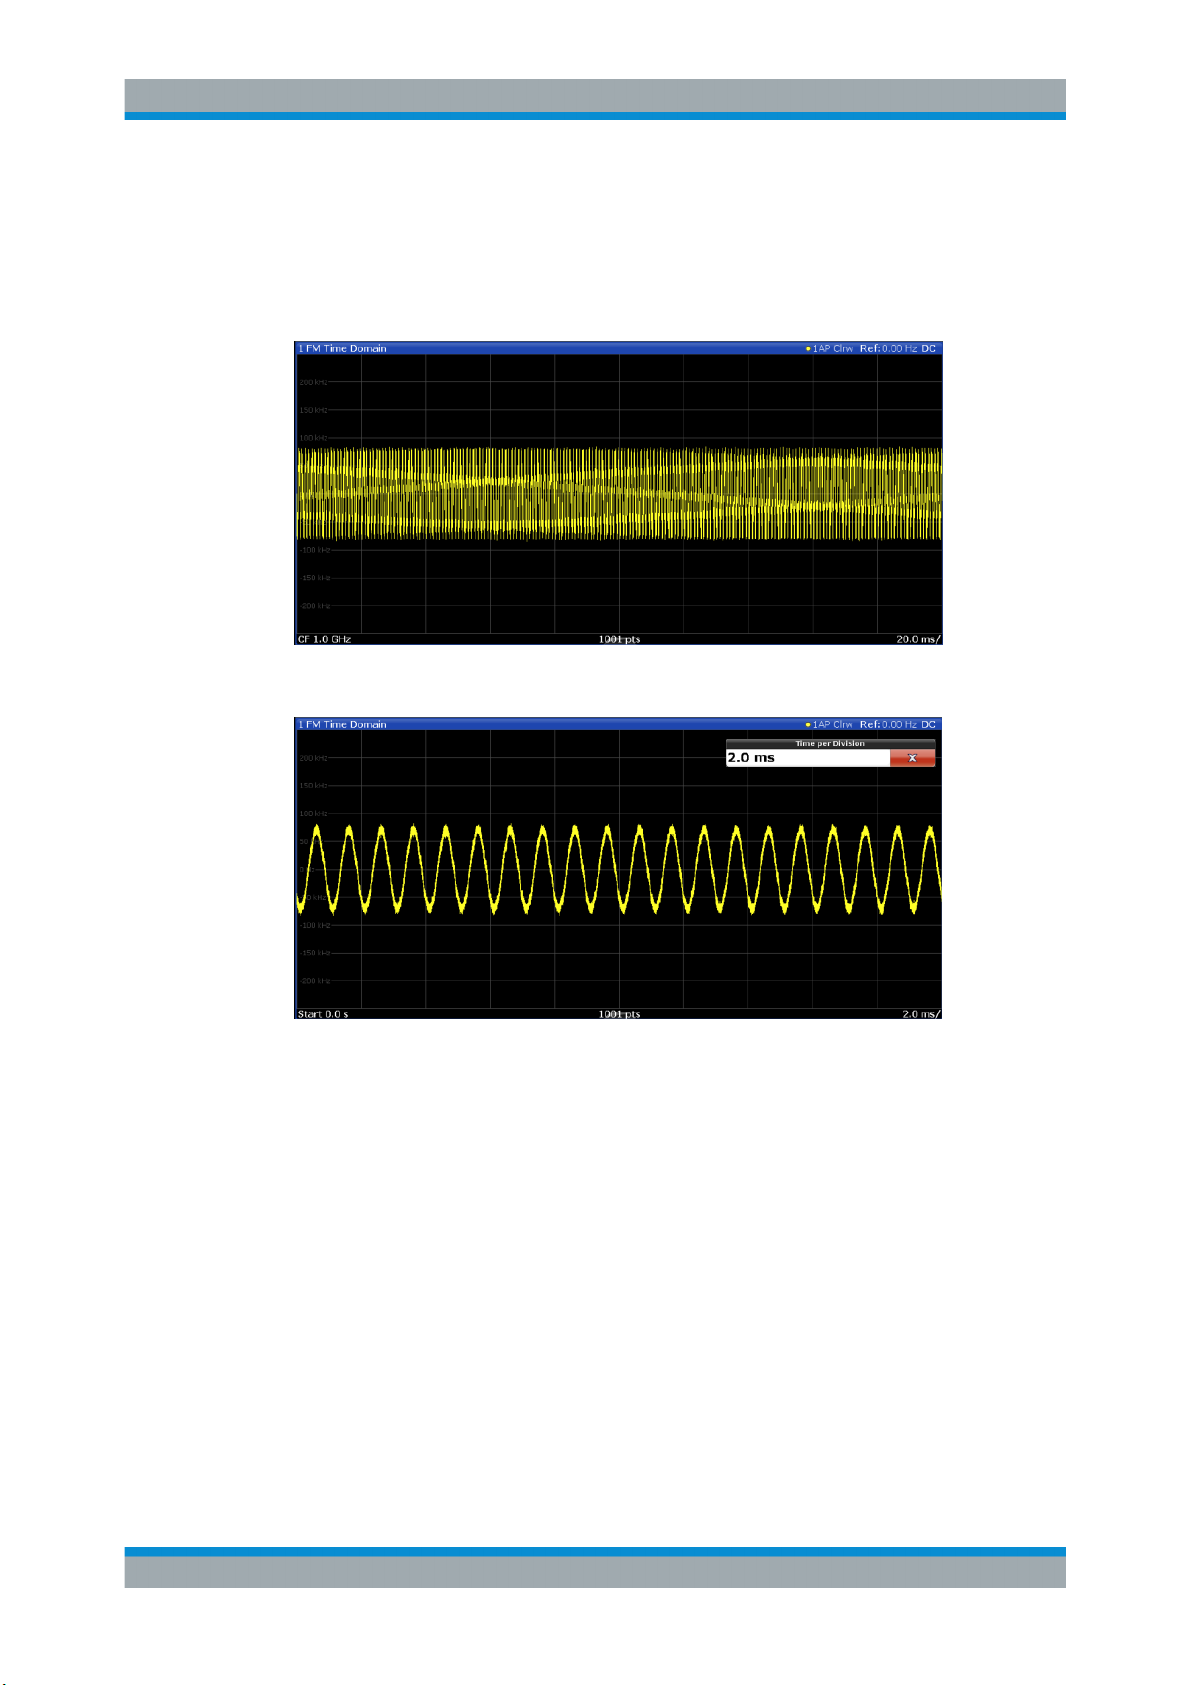
4.6 Time Domain Zoom
For evaluations in the time domain, the demodulated data for a particular time span
can be extracted and displayed in more detail using the "Time Domain Zoom" function.
29User Manual 1177.5691.02 ─ 08
Page 30
R&S®FSWP-K7
Measurement Basics
Time Domain Zoom
This is useful if the measurement time is very large and thus each sweep point represents a large time span. The time domain zoom function distributes the available
sweep points only among the time span defined by the zoom area length. The time
span displayed per division of the diagram is decreased. Thus, the display of the
extracted time span becomes more precise.
Figure 4-2: FM time domain measurement with a very long measurement time (200 ms)
Figure 4-3: FM time domain measurement with time domain zoom (2.0 ms per division)
The time domain zoom area affects not only the diagram display, but the entire evaluation for the current window.
In contrast to the time domain zoom, the graphical zoom is available for all diagram
evaluations. However, the graphical zoom is useful only if more measured values than
trace points are available. The (time) span represented by each measurement point
remains the same.
30User Manual 1177.5691.02 ─ 08
Page 31

R&S®FSWP-K7
Measurement Basics
Analog Modulation Analysis in MSRA Operating Mode
Time domain zoom Graphical zoom
4.7 Analog Modulation Analysis in MSRA Operating Mode
The Analog Modulation Analysis application can also be used to analyze data in MSRA
operating mode.
In MSRA operating mode, only the MSRA Master actually captures data; the data
acquisition settings for an Analog Modulation Analysis application channel in MSRA
mode configure the analysis interval, not an actual data capture from the input signal.
In addition, a capture offset can be defined, i.e. an offset from the start of the captured
data to the start of the analysis interval for Analog Modulation Analysis.
The currently used analysis interval (in seconds, related to measurement start) is indicated in the window header for each result display.
31User Manual 1177.5691.02 ─ 08
Page 32

R&S®FSWP-K7
Measurement Basics
Analog Modulation Analysis in MSRA Operating Mode
Analysis line
A frequent question when analyzing multi-standard signals is how each data channel is
correlated (in time) to others. Thus, an analysis line has been introduced. The analysis
line is a common time marker for all MSRA slave applications. It can be positioned in
any MSRA slave application or the MSRA Master and is then adjusted in all other slave
applications. Thus, you can easily analyze the results at a specific time in the measurement in all slave applications and determine correlations.
If the marked point in time is contained in the analysis interval of the slave application,
the line is indicated in all time-based result displays, such as time, symbol, slot or bit
diagrams. By default, the analysis line is displayed, however, it can be hidden from
view manually. In all result displays, the "AL" label in the window title bar indicates
whether the analysis line lies within the analysis interval or not:
●
orange "AL": the line lies within the interval
●
white "AL": the line lies within the interval, but is not displayed (hidden)
●
no "AL": the line lies outside the interval
For details on the MSRA operating mode see the R&S
FSWP MSRA User Manual.
32User Manual 1177.5691.02 ─ 08
Page 33

R&S®FSWP-K7
5 Configuration
Configuration
Configuration According to Digital Standards
The optional application for analog modulation analysis is an application, which you
activate using the [MODE] key on the front panel. The Analog Modulation Analysis
application requires the optional Spectrum application.
When you activate the Analog Modulation Analysis application, a Analog Modulation
Analysis measurement for the input signal is started automatically with the default configuration. It can be configured in the Analog Modulation Analysis "Overview" dialog
box, which is displayed when you select the "Overview" softkey from any menu.
The main configuration settings and dialog boxes are also available via the "Analog
Demod" menu which is displayed when you press the [MEAS CONFIG] key.
Predefined settings
For commonly performed measurements, standard setup files are provided for quick
and easy configuration. Simply load an existing standard settings file and, if necessary,
adapt the measurement settings to your specific requirements.
For an overview of predefined standards and settings see Chapter A.1, "Predefined
Standards and Settings", on page 175.
● Configuration According to Digital Standards......................................................... 33
● Configuration Overview...........................................................................................35
● Data Input and Output.............................................................................................36
● Amplitude................................................................................................................ 43
● Frequency............................................................................................................... 46
● Trigger Configuration.............................................................................................. 47
● Data Acquisition...................................................................................................... 53
● Demodulation..........................................................................................................57
● Demodulation Display............................................................................................. 72
● Automatic Settings.................................................................................................. 72
5.1 Configuration According to Digital Standards
Various predefined settings files for common digital standards are provided for use with
the Analog Modulation Analysis application. In addition, you can create your own settings files for user-specific measurements.
For details on which settings are defined and an overview of predefined standards see
Chapter A.1, "Predefined Standards and Settings", on page 175.
Digital standard settings are available via the "Digital Standards" softkey in the [MEAS]
menu or the "Overview".
Setup Standard............................................................................................................. 34
└ Selecting Storage Location - Drive/ Path/ Files.............................................. 34
└ File Name........................................................................................................34
33User Manual 1177.5691.02 ─ 08
Page 34

R&S®FSWP-K7
Configuration
Configuration According to Digital Standards
└ Load Standard................................................................................................ 34
└ Save Standard................................................................................................ 34
└ Delete Standard..............................................................................................34
└ Restore Standard Files................................................................................... 35
Setup Standard
Opens a file selection dialog box to select a predefined setup file. The predefined settings are configured in the R&S FSWP Analog Modulation Analysis application. This
allows for quick and easy configuration for commonly performed measurements.
Selecting Storage Location - Drive/ Path/ Files ← Setup Standard
Select the storage location of the file on the instrument or an external drive.
The default storage location for the settings files is:
C:\R_S\INSTR\USER\predefined\AdemodPredefined.
Note: Saving instrument settings in secure user mode.
In secure user mode, settings that are stored on the instrument are stored to volatile
memory, which is restricted to 256 MB. Thus, a "memory limit reached" error can occur
although the hard disk indicates that storage space is still available.
To store data permanently, select an external storage location such as a USB memory
device.
For details, see "Protecting Data Using the Secure User Mode" in the "Data Management" section of the R&S FSWP base unit user manual.
File Name ← Setup Standard
Contains the name of the data file without the path or extension.
File names must be compatible with the Windows conventions for file names. In partic-
ular, they must not contain special characters such as ":", "*", "?".
For details on the filename and location, see the "Data Management" topic in the
R&S FSWP User Manual.
Load Standard ← Setup Standard
Loads the selected measurement settings file.
Remote command:
[SENSe:]ADEMod:PRESet[:STANdard] on page 101
Save Standard ← Setup Standard
Saves the current measurement settings for a specific standard as a file with the
defined name.
Remote command:
[SENSe:]ADEMod:PRESet:STORe on page 102
Delete Standard ← Setup Standard
Deletes the selected standard. Standards predefined by Rohde & Schwarz can also be
deleted. A confirmation query is displayed to avoid unintentional deletion of the standard.
34User Manual 1177.5691.02 ─ 08
Page 35

R&S®FSWP-K7
5.2 Configuration Overview
Configuration
Configuration Overview
Note: Restoring predefined standard files. The standards predefined by Rohde &
Schwarz available at the time of delivery can be restored using the "Restore Standard
Files" function (see "Restore Standard Files" on page 35).
Restore Standard Files ← Setup Standard
Restores the standards predefined by Rohde & Schwarz available at the time of delivery.
Note that this function will overwrite customized standards that have the same name
as predefined standards.
Remote command:
[SENSe:]ADEMod:PRESet:RESTore on page 102
Using the R&S FSWP Analog Modulation Analysis application you can perform analog
modulation analysis using predefined standard setting files, or independently of standards using user-defined measurement settings. Such settings can be stored for recurrent use.
Thus, configuring analog modulation analysis measurements requires one of the following tasks:
●
Selecting an existing standard settings file and, if necessary, adapting the measurement settings to your specific requirements.
●
Configuring the measurement settings and, if necessary, storing the settings in a
file.
"Overview" window
Throughout the channel configuration, an overview of the most important currently
defined settings is provided in the "Overview".
In addition to the main measurement settings, the "Overview" provides quick access to
the main settings dialog boxes. Thus, you can easily configure an entire Analog Modu-
35User Manual 1177.5691.02 ─ 08
Page 36

R&S®FSWP-K7
Configuration
Data Input and Output
lation Analysis measurement channel from input over processing to output and analysis by stepping through the dialog boxes as indicated in the "Overview".
To configure settings
► Select any button in the "Overview" to open the corresponding dialog box.
Select a setting in the channel bar (at the top of the measurement channel tab) to
change a specific setting.
Preset Channel............................................................................................................. 36
Setup Standard............................................................................................................. 36
Specific Settings for...................................................................................................... 36
Preset Channel
Select the "Preset Channel" button in the lower left-hand corner of the "Overview" to
restore all measurement settings in the current channel to their default values.
Note that the [Preset] key restores the entire instrument to its default values and thus
closes all channels on the R&S FSWP (except for the default channel)!
Remote command:
SYSTem:PRESet:CHANnel[:EXEC] on page 101
Setup Standard
Opens a file selection dialog box to select a predefined setup file. See "Setup Stan-
dard" on page 34.
Specific Settings for
The channel may contain several windows for different results. Thus, the settings indicated in the "Overview" and configured in the dialog boxes vary depending on the
selected window.
Select an active window from the "Specific Settings for" selection list that is displayed
in the "Overview" and in all window-specific configuration dialog boxes.
The "Overview" and dialog boxes are updated to indicate the settings for the selected
window.
5.3 Data Input and Output
The R&S FSWP can analyze signals from different input sources and provide various
types of output (such as video or trigger signals).
● RF Input.................................................................................................................. 37
● Power Sensors........................................................................................................38
● External Generators................................................................................................39
● Probes.....................................................................................................................39
● External Mixers....................................................................................................... 39
● Configuring Additional Outputs............................................................................... 39
36User Manual 1177.5691.02 ─ 08
Page 37

R&S®FSWP-K7
5.3.1 RF Input
Configuration
Data Input and Output
● Analog Modulation Analysis Output Settings.......................................................... 41
● DC Power Output....................................................................................................43
● Signal Source Output..............................................................................................43
Access: "Overview" > "Input / Frontend" > "Input Source" > "Radio Frequency"
These settings control the characteristics of the RF input connector at the front panel of
the R&S FSWP.
Input Coupling...............................................................................................................37
Impedance.................................................................................................................... 37
Direct Path.................................................................................................................... 37
YIG-Preselector.............................................................................................................38
High Pass Filter 1 to 3 GHz...........................................................................................38
Input Coupling
The RF input of the R&S FSWP can be coupled by alternating current (AC) or direct
current (DC).
AC coupling blocks any DC voltage from the input signal. This is the default setting to
prevent damage to the instrument. Very low frequencies in the input signal may be distorted.
However, some specifications require DC coupling. In this case, you must protect the
instrument from damaging DC input voltages manually. For details, refer to the data
sheet.
Remote command:
INPut<ip>:COUPling on page 103
Impedance
For some measurements, the reference impedance for the measured levels of the
R&S FSWP can be set to 50 Ω or 75 Ω.
Select 75 Ω if the 50 Ω input impedance is transformed to a higher impedance using a
75 Ω adapter of the RAZ type. (That corresponds to 25Ω in series to the input impedance of the instrument.) The correction value in this case is 1.76 dB = 10 log (75Ω/
50Ω).
This value also affects the unit conversion.
Remote command:
INPut<ip>:IMPedance on page 104
Direct Path
Enables or disables the use of the direct path for small frequencies.
In spectrum analyzers, passive analog mixers are used for the first conversion of the
input signal. In such mixers, the LO signal is coupled into the IF path due to its limited
isolation. The coupled LO signal becomes visible at the RF frequency 0 Hz. This effect
is referred to as LO feedthrough.
37User Manual 1177.5691.02 ─ 08
Page 38

R&S®FSWP-K7
Configuration
Data Input and Output
To avoid the LO feedthrough the spectrum analyzer provides an alternative signal path
to the A/D converter, referred to as the direct path. By default, the direct path is
selected automatically for RF frequencies close to zero. However, this behavior can be
disabled. If "Direct Path" is set to "Off", the spectrum analyzer always uses the analog
mixer path.
"Auto"
"Off"
Remote command:
INPut<ip>:DPATh on page 103
YIG-Preselector
Activates or disables the YIG-preselector, if available on the R&S FSWP.
An internal YIG-preselector at the input of the R&S FSWP ensures that image frequen-
cies are rejected. However, this is only possible for a restricted bandwidth. To use the
maximum bandwidth for signal analysis you can disable the YIG-preselector at the
input of the R&S FSWP, which can lead to image-frequency display.
(Default) The direct path is used automatically for frequencies close
to zero.
The analog mixer path is always used.
Note that the YIG-preselector is active only on frequencies greater than 8 GHz. Therefore, switching the YIG-preselector on or off has no effect if the frequency is below that
value.
Remote command:
INPut<ip>:FILTer:YIG[:STATe] on page 104
High Pass Filter 1 to 3 GHz
Activates an additional internal high-pass filter for RF input signals from 1 GHz to
3 GHz. This filter is used to remove the harmonics of the analyzer to measure the harmonics for a DUT, for example.
This function requires an additional hardware option.
(Note: for RF input signals outside the specified range, the high-pass filter has no
effect. For signals with a frequency of approximately 4 GHz upwards, the harmonics
are suppressed sufficiently by the YIG-preselector, if available.)
Remote command:
INPut<ip>:FILTer:HPASs[:STATe] on page 103
5.3.2 Power Sensors
Access: "Overview" > "Input / Frontend" > "Power Sensors"
The functionality to use power sensors is the same as in the optional spectrum application.
For a comprehensive description, refer to the user manual of the optional R&S FSWP
spectrum application.
38User Manual 1177.5691.02 ─ 08
Page 39

R&S®FSWP-K7
5.3.3 External Generators
5.3.4 Probes
Configuration
Data Input and Output
Access: "Overview" > "Input / Frontend" > "External Generator"
Controlling external generators is available with the optional external generator control.
The functionality is the same as in the optional spectrum application.
For a comprehensive description, refer to the user manual of the optional R&S FSWP
spectrum application.
Access: "Overview" > "Input / Frontend" > "Probes"
The functionality to use probes (via the RF input) is the same as in the optional spectrum application.
For a comprehensive description, refer to the user manual of the optional R&S FSWP
spectrum application.
5.3.5 External Mixers
Access: "Overview" > "Input / Frontend" > "Input Source" > "External Mixer"
Input through external mixers is available with the optional external mixer control hardware.
The features are the same as in the phase noise application. For a comprehensive
description, refer to the R&S FSWP user manual.
5.3.6 Configuring Additional Outputs
Access: "Overview" > "Output Config" > "Output"
The R&S FSWP provides additional outputs that you can use for various tasks.
The remote commands required to configure the outputs are described in Chap-
ter 11.4.2.3, "Configuring Outputs", on page 105.
Noise Source Control....................................................................................................39
Trigger 1/2.....................................................................................................................40
└ Output Type.................................................................................................... 40
└ Level..................................................................................................... 41
└ Pulse Length.........................................................................................41
└ Send Trigger.........................................................................................41
Noise Source Control
The R&S FSWP provides a connector ("NOISE SOURCE CONTROL") with a 28 V
voltage supply for an external noise source. By switching the supply voltage for an
external noise source on or off in the firmware, you can enable or disable the device as
required.
39User Manual 1177.5691.02 ─ 08
Page 40

R&S®FSWP-K7
Configuration
Data Input and Output
External noise sources are useful when you are measuring power levels that fall below
the noise floor of the R&S FSWP itself, for example when measuring the noise level of
an amplifier.
In this case, you can first connect an external noise source (whose noise power level is
known in advance) to the R&S FSWP and measure the total noise power. From this
value you can determine the noise power of the R&S FSWP. Then when you measure
the power level of the actual DUT, you can deduct the known noise level from the total
power to obtain the power level of the DUT.
Remote command:
DIAGnostic:SERVice:NSOurce on page 105
Trigger 1/2
Defines the usage of the variable Trigger Input/Output connectors, where:
"Trigger 1": Trigger Input/Output connector on the front panel
"Trigger 2": Trigger Input/Output connector on the rear panel
Note: Providing trigger signals as output is described in detail in the R&S FSWP User
Manual.
"Input"
"Output"
Remote command:
OUTPut<up>:TRIGger<tp>:DIRection on page 107
Output Type ← Trigger 1/2
Type of signal to be sent to the output
"Device Trig-
gered"
The signal at the connector is used as an external trigger source by
the R&S FSWP. Trigger input parameters are available in the "Trigger" dialog box.
The R&S FSWP sends a trigger signal to the output connector to be
used by connected devices.
Further trigger parameters are available for the connector.
Note: For offline AF or RF triggers, no output signal is provided.
(Default) Sends a trigger when the R&S FSWP triggers.
40User Manual 1177.5691.02 ─ 08
Page 41

R&S®FSWP-K7
Configuration
Data Input and Output
"Trigger
Armed"
"User Defined"
Remote command:
OUTPut<up>:TRIGger<tp>:OTYPe on page 108
Level ← Output Type ← Trigger 1/2
Defines whether a high (1) or low (0) constant signal is sent to the trigger output connector.
The trigger pulse level is always opposite to the constant signal level defined here. For
example, for "Level = High", a constant high signal is output to the connector until you
select the Send Trigger function. Then, a low pulse is provided.
Sends a (high level) trigger when the R&S FSWP is in "Ready for trigger" state.
This state is indicated by a status bit in the STATus:OPERation register (bit 5), as well as by a low-level signal at the AUX port (pin 9).
Sends a trigger when you select the "Send Trigger" button.
In this case, further parameters are available for the output signal.
Remote command:
OUTPut<up>:TRIGger<tp>:LEVel on page 108
Pulse Length ← Output Type ← Trigger 1/2
Defines the duration of the pulse (pulse width) sent as a trigger to the output connector.
Remote command:
OUTPut:TRIGger<tp>:PULSe:LENGth on page 109
Send Trigger ← Output Type ← Trigger 1/2
Sends a user-defined trigger to the output connector immediately.
Note that the trigger pulse level is always opposite to the constant signal level defined
by the output Level setting. For example, for "Level" = "High", a constant high signal is
output to the connector until you select the "Send Trigger" function. Then, a low pulse
is sent.
Which pulse level will be sent is indicated by a graphic on the button.
Remote command:
OUTPut:TRIGger<tp>:PULSe:IMMediate on page 108
5.3.7 Analog Modulation Analysis Output Settings
Access: "Overview" ≥ "Output" > "Analog Demod"
The demodulated signal in time domain results can be output to the IF/VIDEO/DEMOD
output connector on the R&S FSWP.
41User Manual 1177.5691.02 ─ 08
Page 42

R&S®FSWP-K7
Configuration
Data Input and Output
The following settings and functions are available to configure the output in the Analog
Modulation Analysis application.
Note that the audio frequency (AF) filter settings used for demodulation also apply to
the online output. However, a maximum of two high pass, low pass or deemphasis filters can be active at the same time if Analog Modulation Analysis output is active.
(See Chapter 5.8.3, "AF Filter", on page 62)
Online Demodulation Output State............................................................................... 42
Output Selection............................................................................................................42
AF Coupling.................................................................................................................. 42
AC Cutoff Frequency.....................................................................................................43
Online Demodulation Output State
Enables or disables online demodulation output. If enabled, the demodulated audio frequencies are output to the IF/VIDEO/DEMOD output connector on the rear panel of the
R&S FSWP.
Remote command:
OUTPut<up>:ADEMod[:ONLine][:STATe] on page 106
Output Selection
Selects the result display whose results are output. Only time domain results can be
selected. All currently active time domain result displays are listed.
"Current Focus" dynamically switches to the currently selected window. Thus you can
easily change the output signal simply by selecting the windows in the display. If a window is selected that does not contain a time-domain result display, the selection is
ignored and the previous setting is maintained.
The result display currently used for output is indicated by a "Demod Out" label in the
window title bar.
Remote command:
OUTPut<up>:ADEMod[:ONLine]:SOURce on page 106
AF Coupling
Controls the automatic correction of the frequency offset and phase offset of the input
signal:
This function is only available for FM or PM time domain evaluations.
●
FM time evaluation
If DC is selected, the absolute frequency is displayed, i.e. an input signal with an
offset relative to the center frequency is not displayed symmetrically with respect to
the zero line.
If AC is selected, the frequency offset is automatically corrected, i.e. the trace is
always symmetric with respect to the zero line.
42User Manual 1177.5691.02 ─ 08
Page 43

R&S®FSWP-K7
Configuration
Amplitude
●
PM time evaluation
If DC is selected, the phase runs according to the existing frequency offset. In addition, the DC signal contains a phase offset of ± π.
If AC is selected, the frequency offset and phase offset are automatically corrected,
i.e. the trace is always symmetric with respect to the zero line.
Remote command:
[SENSe:]ADEMod<n>:AF:COUPling on page 133
AC Cutoff Frequency
Defines the cutoff frequency for the AC highpass filter (for AC coupling only, see AF
Coupling).
Note that the audio frequency (AF) filter settings used for demodulation also apply to
the online output.
(See Chapter 5.8.3, "AF Filter", on page 62)
Remote command:
OUTPut<up>:ADEMod[:ONLine]:AF[:CFRequency] on page 105
5.3.8 DC Power Output
Access: "Overview" > "Output Config" > "DC Config"
The configuration of the DC power supply is the same as in the phase noise application.
For a comprehensive description, refer to the R&S FSWP user manual.
5.3.9 Signal Source Output
Access: "Overview" > "Output Config" > "Signal Source"
The configuration of the optional signal source is the same as in the phase noise application.
For a comprehensive description, refer to the R&S FSWP user manual.
5.4 Amplitude
Access: "Overview" > "Input / Frontend" > "Amplitude"
The amplitude is configured in the "Amplitude" tab of the "Input" dialog box.
For background information on amplitude settings see the R&S FSWP user manual.
The remote commands required to define these settings are described in Chap-
ter 11.4.3, "Configuring Level Characteristics", on page 109.
Functions to configure level characteristics described elsewhere:
●
"Input Coupling" on page 37
43User Manual 1177.5691.02 ─ 08
Page 44

R&S®FSWP-K7
Configuration
Amplitude
●
"Impedance" on page 37
Reference Level............................................................................................................44
└ Shifting the Display (Offset)............................................................................ 44
└ Unit..................................................................................................................44
└ Setting the Reference Level Automatically (Auto Level).................................45
Attenuation Mode / Value.............................................................................................. 45
Preamplifier...................................................................................................................45
Reference Level
Defines the expected maximum reference level. Signal levels above this value may not
be measured correctly. This is indicated by an "IF Overload" status display.
The reference level can also be used to scale power diagrams; the reference level is
then used as the maximum on the y-axis.
Since the hardware of the R&S FSWP is adapted according to this value, it is recommended that you set the reference level close above the expected maximum signal
level. Thus you ensure an optimum measurement (no compression, good signal-tonoise ratio).
Note that for input from the External Mixer (R&S FSWP-B21) the maximum reference
level also depends on the conversion loss; see the R&S FSWP base unit user manual
for details.
Remote command:
DISPlay[:WINDow<n>]:TRACe<t>:Y[:SCALe]:RLEVel on page 110
Shifting the Display (Offset) ← Reference Level
Defines an arithmetic level offset. This offset is added to the measured level. In some
result displays, the scaling of the y-axis is changed accordingly.
Define an offset if the signal is attenuated or amplified before it is fed into the
R&S FSWP so the application shows correct power results. All displayed power level
results are shifted by this value.
The setting range is ±200 dB in 0.01 dB steps.
Note, however, that the internal reference level (used to adjust the hardware settings to
the expected signal) ignores any "Reference Level Offset". Thus, it is important to keep
in mind the actual power level the R&S FSWP must handle. Do not rely on the displayed reference level (internal reference level = displayed reference level - offset).
Remote command:
DISPlay[:WINDow<n>]:TRACe<t>:Y[:SCALe]:RLEVel:OFFSet on page 110
Unit ← Reference Level
The R&S FSWP measures the signal voltage at the RF input.
In the default state, the level is displayed at a power level of 1 mW (= dBm). Via the
known input impedance (50 Ω or 75 Ω, see "Impedance" on page 37), conversion to
other units is possible.
The following units are available and directly convertible:
●
dBm
●
dBmV
●
dBμV
44User Manual 1177.5691.02 ─ 08
Page 45

R&S®FSWP-K7
Configuration
Amplitude
●
dBμA
●
dBpW
●
Volt
●
Ampere
●
Watt
Remote command:
INPut<ip>:IMPedance on page 104
CALCulate<n>:UNIT:POWer on page 109
Setting the Reference Level Automatically (Auto Level) ← Reference Level
Automatically determines a reference level which ensures that no overload occurs at
the R&S FSWP for the current input data. At the same time, the internal attenuators
are adjusted so the signal-to-noise ratio is optimized, while signal compression and
clipping are minimized.
To determine the required reference level, a level measurement is performed on the
R&S FSWP.
If necessary, you can optimize the reference level further. Decrease the attenuation
level manually to the lowest possible value before an overload occurs, then decrease
the reference level in the same way.
You can change the measurement time for the level measurement if necessary (see
"Changing the Automatic Measurement Time (Meastime Manual)" on page 74).
Remote command:
[SENSe:]ADJust:LEVel on page 112
Attenuation Mode / Value
The RF attenuation can be set automatically as a function of the selected reference
level (Auto mode). This ensures that no overload occurs at the RF Input connector for
the current reference level. It is the default setting.
In "Manual" mode, you can set the RF attenuation in 1 dB steps (down to 0 dB). Other
entries are rounded to the next integer value. The range is specified in the data sheet.
If the defined reference level cannot be set for the defined RF attenuation, the reference level is adjusted accordingly and the warning "limit reached" is displayed.
NOTICE! Risk of hardware damage due to high power levels. When decreasing the
attenuation manually, ensure that the power level does not exceed the maximum level
allowed at the RF input, as an overload may lead to hardware damage.
Remote command:
INPut<ip>:ATTenuation on page 110
INPut<ip>:ATTenuation:AUTO on page 111
Preamplifier
If the (optional) internal preamplifier hardware is installed, a preamplifier can be activated for the RF input signal.
You can use a preamplifier to analyze signals from DUTs with low output power.
For R&S FSWP8 and R&S FSWP26, the following settings are available:
"Off"
"15 dB"
Deactivates the preamplifier.
The RF input signal is amplified by about 15 dB.
45User Manual 1177.5691.02 ─ 08
Page 46

R&S®FSWP-K7
Configuration
Frequency
"30 dB"
For R&S FSWP50, the input signal is amplified by 30 dB if the preamplifier is activated.
Remote command:
INPut<ip>:GAIN:STATe on page 111
INPut<ip>:GAIN[:VALue] on page 112
5.5 Frequency
Access: "Overview" > "Input / Frontend" > "Frequency"
The center frequency of the input signal is configured in the "Frequency" tab of the
"Input/Frontend" dialog box.
The remote commands required to configure the frequency are described in Chap-
ter 11.4.4, "Defining Frequency Characteristics", on page 112.
The RF input signal is amplified by about 30 dB.
Center Frequency......................................................................................................... 46
Center Frequency Stepsize...........................................................................................46
Center Frequency
Defines the center frequency of the signal in Hertz.
The allowed range of values for the center frequency depends on the frequency span.
span > 0: span
f
and span
max
/2 ≤ f
min
depend on the instrument and are specified in the data sheet.
min
center
≤ f
max
– span
min
/2
Remote command:
[SENSe:]FREQuency:CENTer on page 113
Center Frequency Stepsize
Defines the step size of the center frequency. The step size can be coupled to the
demodulation bandwidth, or it can be manually set to a fixed value.
"0.1 * Demod
BW"
Sets the step size for the center frequency to 10 % of the demodulation bandwidth.
This is the default setting.
"0.5 * Demod
BW"
"X * Demod
BW"
Sets the step size for the center frequency to 50 % of the demodulation bandwidth.
Sets the step size for the center frequency to a manually defined factor of the demodulation bandwidth. The "X-Factor" defines the percentage of the demodulation bandwidth.
Values between 1 and 100 % in steps of 1 % are allowed. The default
setting is 10 %.
46User Manual 1177.5691.02 ─ 08
Page 47

R&S®FSWP-K7
Configuration
Trigger Configuration
"= Center"
"Manual"
Remote command:
[SENSe:]FREQuency:CENTer:STEP:LINK on page 113
[SENSe:]FREQuency:CENTer:STEP:LINK:FACTor on page 114
[SENSe:]FREQuency:CENTer:STEP on page 113
Sets the step size to the value of the center frequency and removes
the coupling of the step size to the demodulation bandwidth. The
used value is indicated in the "Value" field.
Defines a fixed step size for the center frequency. Enter the step size
in the "Value" field.
5.6 Trigger Configuration
Access: "Overview" > "Trigger"
Triggering means to capture the interesting part of the signal. Choosing the right trigger
type and configuring all trigger settings correctly allows you to detect various incidents
in your demodulated signals.
Optionally, the trigger signal used by the R&S FSWP can be output to a connected
device, and an external trigger signal from a connected device can be used by the
R&S FSWP.
For a comprehensive description, refer to the user manual of the optional spectrum
application.
● Trigger Source Settings.......................................................................................... 47
● Trigger Input and Output Settings...........................................................................51
5.6.1 Trigger Source Settings
Access: "Overview" > "Trigger" > "Trigger Source"
The trigger source settings contain parameter to configure triggered measurements.
The remote commands required to configure the trigger source are described in Chap-
ter 11.4.5, "Configuring Trigger", on page 114.
Trigger Source...............................................................................................................48
└ Free Run.........................................................................................................48
└ Ext. Trigger 1/2............................................................................................... 48
└ I/Q Power........................................................................................................48
└ IF Power..........................................................................................................49
└ FM / AM / PM / RF (Offline)............................................................................ 49
└ Time................................................................................................................49
47User Manual 1177.5691.02 ─ 08
Page 48

R&S®FSWP-K7
Configuration
Trigger Configuration
└ RF Power........................................................................................................49
Trigger Level................................................................................................................. 50
Trigger Offset................................................................................................................ 50
Hysteresis..................................................................................................................... 50
Drop-Out Time...............................................................................................................50
Slope.............................................................................................................................50
Trigger Holdoff...............................................................................................................50
Trigger Source
In the Analog Modulation Analysis application, the next measurement can be triggered
if the selected input signal exceeds the threshold specified using the "Trigger Level"
setting (see "Trigger Level" on page 50). Thus, a periodic signal modulated onto the
carrier frequency can be displayed. It is recommended that the measurement time covers at least five periods of the audio signal.
Remote command:
TRIGger[:SEQuence]:SOURce on page 119
Free Run ← Trigger Source
No trigger source is considered. Data acquisition is started manually or automatically
and continues until stopped explicitly.
In its default state, the R&S FSWP performs free run measurements.
Remote command:
TRIG:SOUR IMM, see TRIGger[:SEQuence]:SOURce on page 119
Ext. Trigger 1/2 ← Trigger Source
Data acquisition starts when the TTL signal fed into the specified input connector
meets or exceeds the specified trigger level.
Note: The "External Trigger 1" softkey automatically selects the trigger signal from the
Trigger Input / Output connector on the front panel.
For details, see the "Instrument Tour" chapter in the R&S FSWP Getting Started manual.
"External Trigger 1"
Trigger signal from the Trigger Input / Output connector.
(front panel)
"External Trigger 2"
Trigger signal from the Sync Trigger Input / Output connector.
(rear panel)
Note: Connector must be configured for "Input" in the "Output" configuration
(See the R&S FSWP User Manual).
Remote command:
TRIG:SOUR EXT, TRIG:SOUR EXT2
See TRIGger[:SEQuence]:SOURce on page 119
I/Q Power ← Trigger Source
Triggers the measurement when the magnitude of the sampled I/Q data exceeds the
trigger threshold.
48User Manual 1177.5691.02 ─ 08
Page 49

R&S®FSWP-K7
Configuration
Trigger Configuration
The trigger bandwidth corresponds to the resolution bandwidth setting for data acquisition (see "Resolution Bandwidth" on page 54).
Remote command:
TRIG:SOUR IQP, see TRIGger[:SEQuence]:SOURce on page 119
IF Power ← Trigger Source
The R&S FSWP starts capturing data as soon as the trigger level is exceeded around
the third intermediate frequency.
For frequency sweeps, the third IF represents the start frequency. The trigger bandwidth at the third IF depends on the RBW and sweep type.
For measurements on a fixed frequency (e.g. zero span or I/Q measurements), the
third IF represents the center frequency.
This trigger source is only available for RF input.
The available trigger levels depend on the RF attenuation and preamplification. A refer-
ence level offset, if defined, is also considered.
For details on available trigger levels and trigger bandwidths, see the data sheet.
Remote command:
TRIG:SOUR IFP, see TRIGger[:SEQuence]:SOURce on page 119
FM / AM / PM / RF (Offline) ← Trigger Source
Triggers when the demodulated input signal exceeds the trigger level.
Remote command:
TRIGger[:SEQuence]:SOURce on page 119
Time ← Trigger Source
Triggers in a specified repetition interval.
Remote command:
TRIG:SOUR TIME, see TRIGger[:SEQuence]:SOURce on page 119
RF Power ← Trigger Source
Defines triggering of the measurement via signals which are outside the displayed
measurement range.
For this purpose, the instrument uses a level detector at the first intermediate frequency.
The input signal must be in the frequency range between 500 MHz and 8 GHz.
The resulting trigger level at the RF input depends on the RF attenuation and preampli-
fication. For details on available trigger levels, see the instrument's data sheet.
Note: If the input signal contains frequencies outside of this range (e.g. for fullspan
measurements), the measurement may be aborted. A message indicating the allowed
input frequencies is displayed in the status bar.
A "Trigger Offset", "Trigger Polarity" and "Trigger Holdoff" (to improve the trigger stability) can be defined for the RF trigger, but no "Hysteresis".
Remote command:
TRIG:SOUR RFP, see TRIGger[:SEQuence]:SOURce on page 119
49User Manual 1177.5691.02 ─ 08
Page 50

R&S®FSWP-K7
Configuration
Trigger Configuration
Trigger Level
Defines the trigger level for the specified trigger source.
For details on supported trigger levels, see the data sheet.
Remote command:
TRIGger[:SEQuence]:LEVel:IFPower on page 118
TRIGger[:SEQuence]:LEVel:IQPower on page 118
TRIGger[:SEQuence]:LEVel[:EXTernal<port>] on page 117
TRIGger[:SEQuence]:LEVel:RFPower on page 119
TRIGger[:SEQuence]:LEVel:AM:RELative on page 117
TRIGger[:SEQuence]:LEVel:AM[:ABSolute] on page 116
TRIGger[:SEQuence]:LEVel:FM on page 117
TRIGger[:SEQuence]:LEVel:PM on page 118
Trigger Offset
Defines the time offset between the trigger event and the start of the measurement.
Offset > 0: Start of the measurement is delayed
Offset < 0: Measurement starts earlier (pretrigger)
Remote command:
TRIGger[:SEQuence]:HOLDoff[:TIME] on page 116
Hysteresis
Defines the distance in dB to the trigger level that the trigger source must exceed
before a trigger event occurs. Setting a hysteresis avoids unwanted trigger events
caused by noise oscillation around the trigger level.
This setting is only available for "IF Power" trigger sources. The range of the value is
between 3 dB and 50 dB with a step width of 1 dB.
Remote command:
TRIGger[:SEQuence]:IFPower:HYSTeresis on page 116
Drop-Out Time
Defines the time the input signal must stay below the trigger level before triggering
again.
Remote command:
TRIGger[:SEQuence]:DTIMe on page 115
Slope
For all trigger sources except time, you can define whether triggering occurs when the
signal rises to the trigger level or falls down to it.
Remote command:
TRIGger[:SEQuence]:SLOPe on page 119
Trigger Holdoff
Defines the minimum time (in seconds) that must pass between two trigger events.
Trigger events that occur during the holdoff time are ignored.
50User Manual 1177.5691.02 ─ 08
Page 51

R&S®FSWP-K7
5.6.2 Trigger Input and Output Settings
Configuration
Trigger Configuration
Remote command:
TRIGger[:SEQuence]:IFPower:HOLDoff on page 115
Access: "Overview" > "Trigger" > "Trigger In / Out"
The trigger input and output settings control usage of the trigger connectors available
on the R&S FSWP.
The remote commands required to configure the trigger input and output are described
in Chapter 11.4.2.3, "Configuring Outputs", on page 105.
Trigger 1/2.....................................................................................................................51
└ Output Type.................................................................................................... 52
└ Level..................................................................................................... 52
└ Pulse Length.........................................................................................52
└ Send Trigger.........................................................................................52
Trigger 1/2
Defines the usage of the variable Trigger Input/Output connectors, where:
"Trigger 1": Trigger Input/Output connector on the front panel
"Trigger 2": Trigger Input/Output connector on the rear panel
Note: Providing trigger signals as output is described in detail in the R&S FSWP User
Manual.
"Input"
"Output"
Remote command:
OUTPut<up>:TRIGger<tp>:DIRection on page 107
The signal at the connector is used as an external trigger source by
the R&S FSWP. Trigger input parameters are available in the "Trigger" dialog box.
The R&S FSWP sends a trigger signal to the output connector to be
used by connected devices.
Further trigger parameters are available for the connector.
Note: For offline AF or RF triggers, no output signal is provided.
51User Manual 1177.5691.02 ─ 08
Page 52

R&S®FSWP-K7
Configuration
Trigger Configuration
Output Type ← Trigger 1/2
Type of signal to be sent to the output
"Device Trig-
gered"
"Trigger
Armed"
"User Defined"
Remote command:
OUTPut<up>:TRIGger<tp>:OTYPe on page 108
Level ← Output Type ← Trigger 1/2
Defines whether a high (1) or low (0) constant signal is sent to the trigger output connector.
The trigger pulse level is always opposite to the constant signal level defined here. For
example, for "Level = High", a constant high signal is output to the connector until you
select the Send Trigger function. Then, a low pulse is provided.
(Default) Sends a trigger when the R&S FSWP triggers.
Sends a (high level) trigger when the R&S FSWP is in "Ready for trigger" state.
This state is indicated by a status bit in the STATus:OPERation register (bit 5), as well as by a low-level signal at the AUX port (pin 9).
Sends a trigger when you select the "Send Trigger" button.
In this case, further parameters are available for the output signal.
Remote command:
OUTPut<up>:TRIGger<tp>:LEVel on page 108
Pulse Length ← Output Type ← Trigger 1/2
Defines the duration of the pulse (pulse width) sent as a trigger to the output connector.
Remote command:
OUTPut:TRIGger<tp>:PULSe:LENGth on page 109
Send Trigger ← Output Type ← Trigger 1/2
Sends a user-defined trigger to the output connector immediately.
Note that the trigger pulse level is always opposite to the constant signal level defined
by the output Level setting. For example, for "Level" = "High", a constant high signal is
output to the connector until you select the "Send Trigger" function. Then, a low pulse
is sent.
Which pulse level will be sent is indicated by a graphic on the button.
Remote command:
OUTPut:TRIGger<tp>:PULSe:IMMediate on page 108
52User Manual 1177.5691.02 ─ 08
Page 53

R&S®FSWP-K7
5.7 Data Acquisition
Configuration
Data Acquisition
Access: "Overview" > "Data Acquisition"
How data is to be acquired and then demodulated is configured in the "Data Acquisition" dialog box.
MSRA operating mode
In MSRA operating mode, only the MSRA Master channel actually captures data from
the input signal. The data acquisition settings for the Analog Modulation Analysis application in MSRA mode define the analysis interval.
For details on the MSRA operating mode see the R&S FSWP MSRA User Manual.
● Bandwidth Settings................................................................................................. 53
● Sweep Settings....................................................................................................... 54
5.7.1 Bandwidth Settings
Access: "Overview" > "Data Acquisition" > "Bandwidth"
The bandwidth settings define which parts of the input signal are acquired and then
demodulated.
The remote commands required to configure the bandwidth are described in Chap-
ter 11.4.7, "Configuring Data Acquisition", on page 124.
Demodulation Bandwidth.............................................................................................. 53
Demodulation Filter.......................................................................................................54
Measurement Time (AQT).............................................................................................54
ADC Prefilter................................................................................................................. 54
Capture Offset...............................................................................................................54
Resolution Bandwidth................................................................................................... 54
Demodulation Bandwidth
Defines the demodulation bandwidth of the measurement. The demodulation bandwidth determines the sample rate with which the input signal is captured and analyzed.
For recommendations on finding the correct demodulation bandwidth see Chapter 4.2,
"Demodulation Bandwidth", on page 27.
For details on the relation between demodulation bandwidth and sample rate refer to
Chapter 4.3, "Sample Rate and Demodulation Bandwidth", on page 28.
Remote command:
[SENSe:]BWIDth:DEMod on page 130
53User Manual 1177.5691.02 ─ 08
Page 54

R&S®FSWP-K7
Configuration
Data Acquisition
Demodulation Filter
Defines the filter to be used for demodulation.
For details on sample rates, measurement times and trigger offsets for various demod-
ulation bandwidths when using a Gaussian filter, see Chapter 4.3, "Sample Rate and
Demodulation Bandwidth", on page 28.
"Flat"
"Gauss"
Remote command:
[SENSe:]BWIDth:DEMod:TYPE on page 130
Measurement Time (AQT)
Defines how long data is acquired for demodulation.
Remote command:
[SENSe:]ADEMod:MTIMe on page 128
ADC Prefilter
Selects the IF filter bandwidth mode.
●
"Auto"
The bandwidth of the IF filter is selected automatically, depending on the demodulation bandwidth.
●
"Wide"
Selects the largest possible bandwidth of the IF filter.
Remote command:
[SENSe:]ADEMod:ADCPrefilter on page 127
Default
Optimizes the settling behavior of the filter
Capture Offset
This setting is only available for slave applications in MSRA operating mode. It has a
similar effect as the trigger offset in other measurements: it defines the time offset
between the capture buffer start and the start of the extracted slave application data.
In MSRA mode, the offset must be a positive value, as the capture buffer starts at the
trigger time = 0.
For details on the MSRA operating mode, see the R&S FSWP MSRA User Manual.
Remote command:
[SENSe:]MSRA:CAPTure:OFFSet on page 131
Resolution Bandwidth
Defines the resolution bandwidth for data acquisition. The available range is specified
in the data sheet.
Remote command:
[SENSe:]BANDwidth[:RESolution] on page 130
5.7.2 Sweep Settings
Access: "Overview" > "Data Acquisition" > "Sweep" tab
54User Manual 1177.5691.02 ─ 08
Page 55

R&S®FSWP-K7
Configuration
Data Acquisition
The sweep settings define how often data from the input signal is acquired and then
demodulated.
For more information on the spectrogram settings that become available when you turn
on a spectrogram, refer to the R&S FSWP user manual.
The remote commands required to configure the sweep are described in Chap-
ter 11.4.7, "Configuring Data Acquisition", on page 124.
Continuous Sweep / Run Cont......................................................................................55
Single Sweep / Run Single............................................................................................55
Continue Single Sweep.................................................................................................56
Refresh (MSRA only).................................................................................................... 56
Measurement Time (AQT).............................................................................................56
Sweep Points................................................................................................................ 56
Sweep/Average Count.................................................................................................. 57
Continuous Sweep / Run Cont
After triggering, starts the sweep and repeats it continuously until stopped. This is the
default setting.
While the measurement is running, the "Continuous Sweep" softkey and the [RUN
CONT] key are highlighted. The running measurement can be aborted by selecting the
highlighted softkey or key again. The results are not deleted until a new measurement
is started.
Note: Sequencer. If the Sequencer is active, the "Continuous Sweep" softkey only controls the sweep mode for the currently selected channel. However, the sweep mode
only takes effect the next time the Sequencer activates that channel, and only for a
channel-defined sequence. In this case, a channel in continuous sweep mode is swept
repeatedly.
Furthermore, the [RUN CONT] key controls the Sequencer, not individual sweeps.
[RUN CONT] starts the Sequencer in continuous mode.
For details on the Sequencer, see the R&S FSWP User Manual.
Remote command:
INITiate<n>:CONTinuous on page 125
Single Sweep / Run Single
After triggering, starts the number of sweeps set in "Sweep Count". The measurement
stops after the defined number of sweeps has been performed.
While the measurement is running, the "Single Sweep" softkey and the [RUN SINGLE]
key are highlighted. The running measurement can be aborted by selecting the highlighted softkey or key again.
Note: Sequencer. If the Sequencer is active, the "Single Sweep" softkey only controls
the sweep mode for the currently selected channel. However, the sweep mode only
55User Manual 1177.5691.02 ─ 08
Page 56

R&S®FSWP-K7
Configuration
Data Acquisition
takes effect the next time the Sequencer activates that channel, and only for a channel-defined sequence. In this case, the Sequencer sweeps a channel in single sweep
mode only once.
Furthermore, the [RUN SINGLE] key controls the Sequencer, not individual sweeps.
[RUN SINGLE] starts the Sequencer in single mode.
If the Sequencer is off, only the evaluation for the currently displayed channel is updated.
For details on the Sequencer, see the R&S FSWP User Manual.
Remote command:
INITiate<n>[:IMMediate] on page 127
Continue Single Sweep
After triggering, repeats the number of sweeps set in "Sweep Count", without deleting
the trace of the last measurement.
While the measurement is running, the "Continue Single Sweep" softkey and the [RUN
SINGLE] key are highlighted. The running measurement can be aborted by selecting
the highlighted softkey or key again.
Remote command:
INITiate<n>:CONMeas on page 125
Refresh (MSRA only)
This function is only available if the Sequencer is deactivated and only for MSRA slave
applications.
The data in the capture buffer is re-evaluated by the currently active slave application
only. The results for any other slave applications remain unchanged.
This is useful, for example, after evaluation changes have been made or if a new
sweep was performed from another slave application; in this case, only that slave
application is updated automatically after data acquisition.
Note: To update all active slave applications at once, use the "Refresh All" function in
the "Sequencer" menu.
Remote command:
INITiate<n>:REFResh on page 126
Measurement Time (AQT)
Defines how long data is acquired for demodulation.
Remote command:
[SENSe:]ADEMod:MTIMe on page 128
Sweep Points
Defines the number of measured values to be collected during one sweep.
All values from 101 to 100001 can be set. The default value is 1001 sweep points.
Remote command:
[SENSe:]SWEep[:WINDow<n>]:POINts on page 131
56User Manual 1177.5691.02 ─ 08
Page 57

R&S®FSWP-K7
5.8 Demodulation
Configuration
Demodulation
Sweep/Average Count
Defines the number of measurements to be performed in the single sweep mode. Values from 0 to 200000 are allowed. If the values 0 or 1 are set, one measurement is
performed.
The sweep count is applied to all the traces in all diagrams.
If the trace modes "Average", "Max Hold" or "Min Hold" are set, this value also deter-
mines the number of averaging or maximum search procedures.
In continuous sweep mode, if "Sweep Count" = 0 (default), averaging is performed
over 10 measurements. For "Sweep Count" =1, no averaging, maxhold or minhold
operations are performed.
Remote command:
[SENSe:]SWEep:COUNt on page 131
Access: "Overview" > "Demod Settings"
Or: "Meas Setup" > "Demod"
● Basic Demodulation Measurement Parameters (Demod).......................................57
● Demodulation Spectrum..........................................................................................60
● AF Filter...................................................................................................................62
● Scaling.................................................................................................................... 65
● Units........................................................................................................................69
● Result Table Settings.............................................................................................. 70
5.8.1 Basic Demodulation Measurement Parameters (Demod)
Access: "Overview" > "Demod Settings" > "Demod"
Or: "Meas Setup" > "Demod" > "Demod" tab
The basic demodulation measurement parameters define how the measurement is
performed.
57User Manual 1177.5691.02 ─ 08
Page 58

R&S®FSWP-K7
Configuration
Demodulation
Squelch State................................................................................................................58
Squelch Level................................................................................................................58
AF Coupling.................................................................................................................. 58
Selected Trace..............................................................................................................58
Time Domain Zoom.......................................................................................................59
└ State................................................................................................................59
└ Start................................................................................................................ 59
└ Length.............................................................................................................59
└ Time per Division............................................................................................ 59
Zero Phase Reference Position (PM Time Domain only)..............................................60
Phase Wrap On/Off (PM Time Domain only)................................................................ 60
Squelch State
Activates the squelch function, that is: if the signal falls below a defined threshold, the
demodulated data is automatically set to 0. This is useful, for example, to avoid
demodulation noise during transmission breaks.
This function is only available for FM demodulation.
Remote command:
[SENSe:]ADEMod:SQUelch[:STATe] on page 133
Squelch Level
Defines the level threshold below which the demodulated data is set to 0 if squelching
is enabled. The squelch level is an absolute value.
Remote command:
[SENSe:]ADEMod:SQUelch:LEVel on page 134
AF Coupling
Controls the automatic correction of the frequency offset and phase offset of the input
signal:
This function is only available for FM or PM time domain evaluations.
●
FM time evaluation
If DC is selected, the absolute frequency is displayed, i.e. an input signal with an
offset relative to the center frequency is not displayed symmetrically with respect to
the zero line.
If AC is selected, the frequency offset is automatically corrected, i.e. the trace is
always symmetric with respect to the zero line.
●
PM time evaluation
If DC is selected, the phase runs according to the existing frequency offset. In addition, the DC signal contains a phase offset of ± π.
If AC is selected, the frequency offset and phase offset are automatically corrected,
i.e. the trace is always symmetric with respect to the zero line.
Remote command:
[SENSe:]ADEMod<n>:AF:COUPling on page 133
Selected Trace
Defines the trace used to determine the results in the Result Summary.
58User Manual 1177.5691.02 ─ 08
Page 59

R&S®FSWP-K7
Configuration
Demodulation
Time Domain Zoom
Using the time domain zoom, the demodulated data for a particular time span is extracted and displayed in more detail. This is useful if the measurement time is very large
and thus each sweep point represents a large time span. The time domain zoom function distributes the available sweep points only among the time span defined by the
zoom area length. The time span displayed per division of the diagram is decreased.
Thus, the display of the extracted time span becomes more precise. Note that the time
domain zoom area affects not only the diagram display, but the entire evaluation for the
current window.
This function is only available for evaluations in the time domain.
Tip: In addition to the Time Domain Zoom, a graphical zoom is available for all diagram
evaluations. However, the graphical zoom is useful only if more measured values than
trace points are available. The (time) span represented by each measurement point
remains the same.
State ← Time Domain Zoom
Activates or deactivates the time domain zoom mode.
"On"
"Off"
Remote command:
[SENSe:]ADEMod<n>:ZOOM[:STATe] on page 136
Activates the time domain zoom.
Deactivates the time domain zoom and restores the original display. If
more measured values than measurement points are available, several measured values are combined in one measurement point
according to the method of the selected trace detector.
Start ← Time Domain Zoom
Defines the start time for the time domain zoom area. For spectrum evaluations the
start time is always 0.
Remote command:
[SENSe:]ADEMod<n>:ZOOM:STARt on page 135
Length ← Time Domain Zoom
Defines the length of the time domain zoom area. Enter the length as a time value
manually, or use the "Auto" setting to set the length to the current number of sweep
points automatically.
Remote command:
[SENSe:]ADEMod<n>:ZOOM:LENGth on page 134
[SENSe:]ADEMod<n>:ZOOM:LENGth:MODE on page 135
Time per Division ← Time Domain Zoom
Enables the "Time Domain Zoom" function and defines the zoom area length in one
step. The width of the zoom display is divided into 10 divisions; thus, by entering the
time that is displayed in each division, you indirectly define the zoom area length
("Time per Division" * 10). The starting point of the zoom area is determined automatically. To specify the starting point manually, use the Start setting.
The "Time per Division" softkey is available from the main "Analog Demod" menu.
59User Manual 1177.5691.02 ─ 08
Page 60

R&S®FSWP-K7
Configuration
Demodulation
Zero Phase Reference Position (PM Time Domain only)
Defines the position at which the phase of the PM-demodulated signal is set to 0 rad.
The entry is made with respect to time. In the default setting, the first measured value
is set to 0 rad.
This setting is only available for PM time domain displays with DC coupling.
Remote command:
[SENSe:]ADEMod:PM:RPOint[:X] on page 133
Phase Wrap On/Off (PM Time Domain only)
Activates/deactivates the phase wrap.
On The phase is displayed in the range ±180° (± Π). For example, if the phase exceeds +180°,
360° is subtracted from the phase value, with the display thus showing >-180°.
Off The phase is not wrapped.
This setting is only available for PM time domain displays with DC coupling.
5.8.2 Demodulation Spectrum
Access: "Overview" > "Demod Settings" > "Spectrum"
Or: "Meas Setup" > "Demod" > "Spectrum" tab
The demodulation spectrum defines which span of the demodulated data is evaluated.
Depending on the evaluation (AF or RF display), the settings vary.
● AF Evaluation..........................................................................................................60
● RF Evaluation..........................................................................................................61
5.8.2.1 AF Evaluation
Access: "Overview" > "Demod Settings" > "Spectrum"
Or: "Meas Setup" > "Demod" > "Spectrum" tab
These settings are only available for AF Spectrum evaluations, not in the time domain.
AF Center......................................................................................................................61
AF Start.........................................................................................................................61
AF Stop......................................................................................................................... 61
AF Span........................................................................................................................ 61
AF Full Span................................................................................................................. 61
60User Manual 1177.5691.02 ─ 08
Page 61

R&S®FSWP-K7
Configuration
Demodulation
AF Center
Defines the center frequency of the demodulated data to evaluate.
Remote command:
[SENSe:]ADEMod:AF:CENTer on page 138
AF Start
Defines the start frequency of the demodulated data to evaluate.
Remote command:
[SENSe:]ADEMod:AF:STARt on page 139
AF Stop
Defines the stop frequency of the demodulated data to evaluate.
The maximum AF stop frequency corresponds to half the demodulation bandwidth.
Remote command:
[SENSe:]ADEMod:AF:STOP on page 139
AF Span
Defines the span (around the center frequency) of the demodulated data to evaluate.
The maximum span is DBW/2.
Remote command:
[SENSe:]ADEMod:AF:SPAN on page 138
AF Full Span
Sets the span (around the center frequency) of the demodulated data to the maximum
of DBW/2.
Remote command:
[SENSe:]ADEMod:AF:SPAN:FULL on page 138
5.8.2.2 RF Evaluation
Access: "Overview" > "Demod Settings" > "Spectrum"
Or: "Meas Setup" > "Demod" > "Spectrum" tab
These settings are only available for RF evaluation, both in time and frequency
domain. Note that for RF data the center frequency and demodulation bandwidth correspond to the settings defined in the "Input" and "Data Acquisition" configuration.
Center Frequency......................................................................................................... 62
Span..............................................................................................................................62
Demodulation Bandwidth.............................................................................................. 62
RF Full Span................................................................................................................. 62
61User Manual 1177.5691.02 ─ 08
Page 62

R&S®FSWP-K7
Configuration
Demodulation
Center Frequency
Defines the center frequency of the signal in Hertz.
The allowed range of values for the center frequency depends on the frequency span.
span > 0: span
f
and span
max
/2 ≤ f
min
depend on the instrument and are specified in the data sheet.
min
center
≤ f
max
– span
min
/2
Remote command:
[SENSe:]FREQuency:CENTer on page 113
Span
Defines the frequency span. The center frequency is kept constant. The following
range is allowed:
span = 0: 0 Hz
span >0:
span
and f
f
min
max
and span
max
≤ f
span
=DBW/2
min
≤ f
max
are specified in the data sheet.
Remote command:
[SENSe:]ADEMod:SPECtrum:SPAN[:MAXimum] on page 140
[SENSe:]ADEMod:SPECtrum:SPAN:ZOOM on page 139
Demodulation Bandwidth
Defines the demodulation bandwidth of the measurement. The demodulation bandwidth determines the sample rate with which the input signal is captured and analyzed.
For recommendations on finding the correct demodulation bandwidth see Chapter 4.2,
"Demodulation Bandwidth", on page 27.
For details on the relation between demodulation bandwidth and sample rate refer to
Chapter 4.3, "Sample Rate and Demodulation Bandwidth", on page 28.
Remote command:
[SENSe:]BWIDth:DEMod on page 130
RF Full Span
Sets the span (around the center frequency) of the RF data to be evaluated to the
demodulation bandwidth.
Remote command:
[SENSe:]ADEMod:SPECtrum:SPAN[:MAXimum] on page 140
5.8.3 AF Filter
Access: "Overview" > "Demod Settings" > "AF Filter"
Or: "Meas Setup" > "Demod" > "AF Filter" tab
The AF filter reduces the evaluated bandwidth of the demodulated signal and can
define a weighting function.
62User Manual 1177.5691.02 ─ 08
Page 63

R&S®FSWP-K7
Configuration
Demodulation
AF filters are only available for AF evaluations, not for RF evaluation.
If a high pass or low pass AF filter is defined, the filter is indicated by a vertical red line
in the spectrum display.
High Pass......................................................................................................................63
Low Pass.......................................................................................................................63
Weighting...................................................................................................................... 64
Deemphasis.................................................................................................................. 65
Deactivating all AF Filters............................................................................................. 65
High Pass
Defines a high pass filter with the given limit to separate the DC component. The filters
are indicated by the 3 dB cutoff frequency. The 50 Hz and 300 Hz filters are designed
as 2nd-order Butterworth filter (12 dB/octave). The 20 Hz filter is designed as 3rd-order
Butterworth filter (18 dB/octave).
The high pass filters are active in the following demodulation bandwidth range:
None No AF Filter used (default)
20 Hz 100 Hz ≤ demodulation bandwidth ≤ 1.6 MHz
50 Hz: 200 Hz ≤ demodulation bandwidth ≤ 3 MHz
300 Hz: 800 Hz ≤ demodulation bandwidth ≤ 8 MHz
Manual: A high pass filter with the manually defined frequency is used.
Note: If online demodulation output is active, the predefined (fixed) filters are not available. In this case, the frequency for the high pass filter must be defined manually (see
also Chapter 5.3.7, "Analog Modulation Analysis Output Settings", on page 41).
If a filter was already configured when online demodulation output is activated, it is
replaced by a manual filter that provides corresponding results, if possible.
Remote command:
[SENSe:]FILTer<n>:HPASs[:STATe] on page 143
[SENSe:]FILTer<n>:HPASs:FREQuency[:ABSolute] on page 143
[SENSe:]FILTer<n>:HPASs:FREQuency:MANual on page 143
Low Pass
Defines a low pass filter type. Relative and absolute low pass filter are available.
●
Absolute low pass filters:
63User Manual 1177.5691.02 ─ 08
Page 64

R&S®FSWP-K7
Configuration
Demodulation
Absolute filters are indicated by the 3 dB cutoff frequency. The 3 kHz, 15 kHz and
23 kHz filters are designed as 5th-order Butterworth filters (30 dB/octave). The 150
kHz filter is designed as 8th-order Butterworth filter (48 dB/octave).
The absolute low pass filters are active in the following demodulation bandwidth
range:
Filter type Demodulation bandwidth
3 kHz: 6.4 kHz ≤ demodulation bandwidth ≤ 3 MHz
15 kHz: 50 kHz ≤ demodulation bandwidth ≤ 8 MHz
23 kHz 50 kHz ≤ demodulation bandwidth ≤ 18 MHz
150 kHz: 400 kHz ≤ demodulation bandwidth ≤ 8 MHz
Manual: A low pass filter with the manually defined frequency is used.
Note: If online demodulation output is active, the predefined (fixed) filters are not available. In this case, the frequency for the low pass filter must be defined manually (see
also Chapter 5.3.7, "Analog Modulation Analysis Output Settings", on page 41).
If a filter was already configured when online demodulation output is activated, it is
replaced by a manual filter that provides corresponding results, if possible.
●
Relative low pass filters:
Relative filters (3 dB) can be selected in % of the demodulation bandwidth. The filters are designed as 5th-order Butterworth filter (30 dB/octave) and active for all
demodulation bandwidths.
●
"NONE" deactivates the AF low pass filter (default).
Remote command:
[SENSe:]FILTer<n>:LPASs[:STATe] on page 145
[SENSe:]FILTer<n>:LPASs:FREQuency[:ABSolute] on page 144
[SENSe:]FILTer<n>:LPASs:FREQuency:RELative on page 144
[SENSe:]FILTer<n>:LPASs:FREQuency:MANual on page 144
Weighting
Selects a weighting AF filter. By default, no weighting filter is active.
"A weighted"
Switches on the A weighted filter. The weighting filter is active in the
following demodulation bandwidth range:
100 kHz ≤ demodulation bandwidth ≤ 800 kHz
"CCITT"
Switches on a CCITT P.53 weighting filter. The weighting filter is
active in the following demodulation bandwidth range:
20 kHz ≤ demodulation bandwidth ≤ 3 MHz
"CCIR weighted"
Switches on the CCIR weighted filter. The weighting filter is active in
the following demodulation bandwidth range:
100 kHz ≤ demodulation bandwidth ≤ 3.0 MHz
"CCIR
unweighted"
Switches on the CCIR unweighted filter, which is the combination of
the 20 Hz highpass and 23 kHz low pass filter. The weighting filter is
active in the following demodulation bandwidth range:
50 kHz ≤ demodulation bandwidth ≤ 1.6 MHz
64User Manual 1177.5691.02 ─ 08
Page 65

R&S®FSWP-K7
Configuration
Demodulation
Remote command:
[SENSe:]FILTer<n>:CCITt[:STATe] on page 142
[SENSe:]FILTer<n>:CCIR[:UNWeighted][:STATe] on page 141
[SENSe:]FILTer<n>:CCIR:WEIGhted[:STATe] on page 141
[SENSe:]FILTer<n>:AWEighted[:STATe] on page 140
Deemphasis
Activates a deemphasis filter with the given time constant.
Sometimes a modulated signal is extorted by a pre-emphasis filter before transmission,
for example to eliminate frequencies that are more prone to interferences. In this case,
the emphasis function must be reversed after demodulation. This is done by the deemphasis filter.
The deemphasis filter is active in the following demodulation bandwidth range:
25 µs: 25 kHz ≤ demodulation bandwidth ≤ 40 MHz
50 µs: 6.4 kHz ≤ demodulation bandwidth ≤ 18 MHz
75 µs: 6.4 kHz ≤ demodulation bandwidth ≤ 18 MHz
750 µs: 800 Hz ≤ demodulation bandwidth ≤ 3 MHz
Depending on the deemphasis filter, a minimum demodulation bandwidth is required
for an error less than 0.5 dB, up to a maximum AF frequency. The following table
shows the dependencies.
Deemphasis [us] 25 µs 50 µs 75 µs 750 µs
Max. AF frequency 25 kHz 12 kHz 8 kHz 800 Hz
Required demodulation bandwidth ≥ 200 kHz ≥ 100 kHz ≥ 50 kHz ≥ 6.4 kHz
For higher AF frequencies the demodulation bandwidth must be increased.
Remote command:
[SENSe:]FILTer<n>:DEMPhasis[:STATe] on page 142
[SENSe:]FILTer<n>:DEMPhasis:TCONstant on page 142
Deactivating all AF Filters
The "All Filter Off" button deactivates all AF filters for the selected evaluation.
Remote command:
[SENSe:]FILTer<n>:AOFF on page 141
5.8.4 Scaling
Access: "Overview" > "Demod Settings" > "Scaling"
Or: "Meas Setup" > "Demod" > "Scaling" tab
65User Manual 1177.5691.02 ─ 08
Page 66

R&S®FSWP-K7
5.8.4.1 AF Evaluation
Configuration
Demodulation
The scaling parameters define the range of the demodulated data to be displayed.
● AF Evaluation..........................................................................................................66
● RF Evaluation..........................................................................................................68
Access: "Overview" > "Demod Settings" > "Scaling"
Or: "Meas Setup" > "Demod" > "Scaling" tab
These settings are only available for AF evaluations.
Figure 5-1: Dialog contents in case of FM Time Domain measurements. Contents for other measure-
ments are different.
Dev per Division/ dB per Division..................................................................................66
Reference Value Position..............................................................................................67
Reference Value............................................................................................................67
AF Coupling.................................................................................................................. 67
Deviation....................................................................................................................... 68
AF Auto Scale............................................................................................................... 68
Dev per Division/ dB per Division
Defines the modulation depth or the phase deviation or frequency deviation per division (logarithmic: 0.1 to 20 dB):
AM display: 0.0001 % to 1000 %
FM display: 1 Hz/div to 100 MHz/div
PM display: 0.0001 rad/div to 1000 rad/div
Note: The value defined per division refers to the default display of 10 divisions on the
y-axis. If fewer divisions are displayed (e.g. because the window is reduced in height),
the range per division is increased in order to display the same result range in the
smaller window. In this case, the per division value does not correspond to the actual
display.
Remote command:
DISPlay[:WINDow<n>]:TRACe<t>:Y[:SCALe]:PDIVision on page 136
66User Manual 1177.5691.02 ─ 08
Page 67

R&S®FSWP-K7
Configuration
Demodulation
Reference Value Position
Determines the position of the reference value for the modulation depth or the phase
deviation or frequency deviation on the y-axis of the diagram.
The position is entered as a percentage of the diagram height with 100 % corresponding to the upper diagram border. The default setting is 50 % (diagram center) for the
AF time evaluations and 100 % (upper diagram border) for the AF spectrum evaluations.
Remote command:
DISPlay[:WINDow<n>]:TRACe<t>:Y[:SCALe]:RPOSition on page 137
Reference Value
Determines the modulation depth or the phase deviation or the frequency deviation at
the reference line of the y-axis. The reference value can be set specifically for each
evaluation.
●
AF time display
The trace display takes individual frequency/phase offsets into account (in contrast,
the AF Coupling setting permits automatic correction by the average frequency/
phase offset of the signal, and therefore cannot be activated simultaneously).
●
AF spectrum display
In the default setting, the reference value defines the modulation depth or the
FM/PM deviation at the upper diagram border.
Possible values:
●
AM: 0 and ± 10000 %
●
FM: 0 and ± 10 MHz
●
PM: 0 and ± 10000 rad
Note: The reference value for the AF range in the window title bar is displayed with
respect to the defined reference position. The position may vary for different windows.
For time domain and frequency domain windows, for example, a different reference
value may be displayed, although the same reference is actually used (but the positions vary).
Remote command:
DISPlay[:WINDow<n>][:SUBWindow<w>]:TRACe<t>:Y[:SCALe]:RVALue
on page 146
AF Coupling
Controls the automatic correction of the frequency offset and phase offset of the input
signal:
This function is only available for FM or PM time domain evaluations.
●
FM time evaluation
If DC is selected, the absolute frequency is displayed, i.e. an input signal with an
offset relative to the center frequency is not displayed symmetrically with respect to
the zero line.
If AC is selected, the frequency offset is automatically corrected, i.e. the trace is
always symmetric with respect to the zero line.
●
PM time evaluation
If DC is selected, the phase runs according to the existing frequency offset. In addition, the DC signal contains a phase offset of ± π.
67User Manual 1177.5691.02 ─ 08
Page 68

R&S®FSWP-K7
Configuration
Demodulation
If AC is selected, the frequency offset and phase offset are automatically corrected,
i.e. the trace is always symmetric with respect to the zero line.
Remote command:
[SENSe:]ADEMod<n>:AF:COUPling on page 133
Deviation
Switches between logarithmic and linear display of the modulation depth or the phase
deviation or the frequency deviation.
Remote command:
DISPlay[:WINDow<n>][:SUBWindow<w>]:TRACe<t>:Y:SPACing on page 137
AF Auto Scale
Activates automatic scaling of the y-axis for AF measurements. RF power and RF
spectrum measurements are not affected by the auto-scaling.
Remote command:
[SENSe:]ADJust:SCALe[:Y]:AUTO[:CONTinuous] on page 123
5.8.4.2 RF Evaluation
Access: "Overview" > "Demod Settings" > "Scaling"
Or: "Meas Setup" > "Demod" > "Scaling" tab
These settings are only available for RF evaluations and the result summary.
Range............................................................................................................................68
Ref Level Position......................................................................................................... 68
Auto Scale Once........................................................................................................... 69
Scaling.......................................................................................................................... 69
Range
Defines the displayed y-axis range in dB.
The default value is 100 dB.
For Analog Modulation Analysis measurements, time domain scaling is defined in Hz
(default: 500 kHz).
Remote command:
DISPlay[:WINDow<n>]:TRACe<t>:Y[:SCALe] on page 146
Ref Level Position
Defines the reference level position, i.e. the position of the maximum AD converter
value on the level axis in %.
0 % corresponds to the lower and 100 % to the upper limit of the diagram.
68User Manual 1177.5691.02 ─ 08
Page 69

R&S®FSWP-K7
Configuration
Demodulation
Values from -120 % to +600 % are available. Larger values are useful for small scales,
such as a power range of 10 dB or 20 dB, and low signal levels, for example 60 dB
below the reference level. In this case, large reference level position values allow you
to see the trace again.
Only available for RF measurements.
Remote command:
DISPlay[:WINDow<n>]:TRACe<t>:Y[:SCALe]:RPOSition on page 137
Auto Scale Once
Automatically determines the optimal range and reference level position to be displayed for the current measurement settings.
The display is only set once; it is not adapted further if the measurement settings are
changed again.
Remote command:
DISPlay[:WINDow<n>]:TRACe<t>:Y[:SCALe]:AUTO ONCE on page 147
Scaling
Defines the scaling method for the y-axis.
"Logarithmic"
"Linear with
Unit"
"Linear Percent"
"Absolute"
"Relative"
Remote command:
DISPlay[:WINDow<n>][:SUBWindow<w>]:TRACe<t>:Y:SPACing on page 137
DISPlay[:WINDow<n>][:SUBWindow<w>]:TRACe<t>:Y[:SCALe]:MODE
on page 147
Logarithmic scaling (only available for logarithmic units - dB..., and A,
V, Watt)
Linear scaling in the unit of the measured signal
Linear scaling in percentages from 0 to 100
The labeling of the level lines refers to the absolute value of the reference level (not available for "Linear Percent")
The scaling is in dB, relative to the reference level (only available for
logarithmic units - dB...). The upper line of the grid (reference level) is
always at 0 dB.
5.8.5 Units
Access: "Overview" > "Demod Settings" > "Unit"
Or: "Meas Setup" > "Demod" > "Unit" tab
The units define how the demodulated data is displayed.
69User Manual 1177.5691.02 ─ 08
Page 70

R&S®FSWP-K7
Configuration
Demodulation
Figure 5-2: Dialog contents in case of PM Spectrum measurements. Contents for other measure-
ments are different.
Phase Unit (Rad/Deg)...................................................................................................70
THD Unit (%/ DB)..........................................................................................................70
Relative Unit..................................................................................................................70
Phase Unit (Rad/Deg)
Sets the phase unit to rad or deg for displaying PM signals.
Remote command:
UNIT<n>:ANGLe on page 148
THD Unit (%/ DB)
Sets the unit to percent or DB for the calculation of the THD (in the Result Summary).
Remote command:
UNIT<n>:THD on page 148
Relative Unit
Defines the unit for relative demodulation results (see Chapter 5.8.6, "Result Table Set-
tings", on page 70).
Remote command:
CONFigure:ADEMod:RESults:UNIT on page 151
5.8.6 Result Table Settings
Access: "Overview" > "Demod Settings" > "Result Table"
Or: "Meas Setup" > "Demod" > "Result Table" tab
The demodulation results are displayed in the Result Summary table (see also "Result
Summary" on page 22). The detectors used to determine the results can be config-
ured.
In addition to common absolute demodulation, the R&S FSWP Analog Modulation
Analysis application also provides demodulation results relative to user-defined or
measured reference values in the Result Summary.
The settings for the Result Summary can be defined individually for the different modulation types (FM, AM, PM). For each modulation, a separate tab is provided in the dialog box.
70User Manual 1177.5691.02 ─ 08
Page 71

R&S®FSWP-K7
Configuration
Demodulation
Detector.........................................................................................................................71
Mode............................................................................................................................. 71
State..............................................................................................................................71
Reference Value............................................................................................................71
Meas -> Reference........................................................................................................72
Detector
Detector type for demodulation results
"+ Peak"
"- Peak"
"+/- Peak"
"RMS"
Remote command:
The detector is specified by the DETector<det> suffix in
CONFigure:RELative:AM|FM|PM:DETector<det>... commands.
Mode
Defines the mode with which the demodulation result is determined.
"Clear Write"
"Max Hold"
"Average"
Remote command:
CONFigure:ADEMod:RESults:AM:DETector<det>:MODE on page 150
CONFigure:ADEMod:RESults:FM:DETector<det>:MODE on page 150
CONFigure:ADEMod:RESults:PM:DETector<det>:MODE on page 150
Positive peak
Negative peak
Autopeak
Root mean square
Overwrite mode: the detector value is overwritten by each sweep.
This is the default setting.
The maximum value is determined over several sweeps and displayed. The R&S FSWP saves each result only if the new value is
greater than the previous one.
The average result is determined over all sweeps.
State
Activates relative demodulation for the selected detector. If activated, the demodulated
result is set in relation to the Reference Value.
Remote command:
CONFigure:ADEMod:RESults:AM:DETector<det>:STATe on page 149
CONFigure:ADEMod:RESults:FM:DETector<det>:STATe on page 149
CONFigure:ADEMod:RESults:PM:DETector<det>:STATe on page 149
Reference Value
Defines the reference value to be used for relative demodulation results and recalculates the results. If necessary, the detector is activated.
Note: A reference value 0 would provide infinite results and is thus automatically cor-
rected to 0.1.
71User Manual 1177.5691.02 ─ 08
Page 72

R&S®FSWP-K7
Configuration
Automatic Settings
Remote command:
CONFigure:ADEMod:RESults:AM:DETector<det>:REFerence on page 149
CONFigure:ADEMod:RESults:FM:DETector<det>:REFerence on page 149
CONFigure:ADEMod:RESults:PM:DETector<det>:REFerence on page 149
Meas -> Reference
Sets the Reference Value to be used for relative demodulation results to the currently
measured value for all relative detectors.
Note: A reference value 0 would provide infinite results and is thus automatically cor-
rected to 0.1.
If necessary, the detectors are activated.
Remote command:
CONFigure:ADEMod:RESults:AM:DETector<det>:REFerence:MEAStoref<t>
on page 150
CONFigure:ADEMod:RESults:FM:DETector<det>:REFerence:MEAStoref<t>
on page 150
CONFigure:ADEMod:RESults:PM:DETector<det>:REFerence:MEAStoref<t>
on page 150
5.9 Demodulation Display
Access: "Overview" > "Demod/Display"
The demodulated signal can be displayed using various evaluation methods. All evaluation methods available for the Analog Modulation Analysis application are displayed in
the evaluation bar in SmartGrid mode when you do one of the following:
Up to six evaluation methods can be displayed simultaneously in separate windows.
The Analog Modulation Analysis evaluation methods are described in Chapter 3, "Mea-
surements and Result Displays", on page 14.
For details on working with the SmartGrid see the R&S FSWP Getting Started manual.
5.10 Automatic Settings
Access: "AUTO SET"
Some settings can be adjusted by the R&S FSWP automatically according to the current measurement settings.
MSRA operating mode
In MSRA operating mode, settings related to data acquisition can only be adjusted
automatically for the MSRA Master, not the applications.
72User Manual 1177.5691.02 ─ 08
Page 73

R&S®FSWP-K7
Configuration
Automatic Settings
Adjusting settings automatically during triggered measurements
When you select an auto adjust function a measurement is performed to determine the
optimal settings. If you select an auto adjust function for a triggered measurement, you
are asked how the R&S FSWP should behave:
●
(default:) The measurement for adjustment waits for the next trigger
●
The measurement for adjustment is performed without waiting for a trigger.
The trigger source is temporarily set to "Free Run". After the measurement is completed, the original trigger source is restored. The trigger level is adjusted as follows:
– For IF Power and RF Power triggers:
Trigger Level = Reference Level - 15 dB
– For Video trigger:
Trigger Level = 85 %
Remote command:
[SENSe:]ADJust:CONFigure:TRIGger on page 123
Adjusting all Determinable Settings Automatically (Auto All)........................................ 73
Adjusting the Center Frequency Automatically (Auto Frequency)................................ 73
AF Auto Scale............................................................................................................... 74
Setting the Reference Level Automatically (Auto Level)...............................................74
Resetting the Automatic Measurement Time (Meastime Auto).....................................74
Changing the Automatic Measurement Time (Meastime Manual)................................ 74
Upper Level Hysteresis.................................................................................................74
Lower Level Hysteresis.................................................................................................75
Adjusting all Determinable Settings Automatically (Auto All)
Activates all automatic adjustment functions for the current measurement settings.
This includes:
●
Auto Frequency
●
Auto Level
●
"AF Auto Scale" on page 68
Note: MSRA operating modes. In MSRA operating mode, this function is only available
for the MSRA Master, not the applications.
Remote command:
[SENSe:]ADJust:ALL on page 121
Adjusting the Center Frequency Automatically (Auto Frequency)
The R&S FSWP adjusts the center frequency automatically.
The optimum center frequency is the frequency with the highest S/N ratio in the fre-
quency span. As this function uses the signal counter, it is intended for use with sinusoidal signals.
Remote command:
[SENSe:]ADJust:FREQuency on page 123
73User Manual 1177.5691.02 ─ 08
Page 74

R&S®FSWP-K7
Configuration
Automatic Settings
AF Auto Scale
Activates automatic scaling of the y-axis for AF measurements. RF power and RF
spectrum measurements are not affected by the auto-scaling.
Remote command:
[SENSe:]ADJust:SCALe[:Y]:AUTO[:CONTinuous] on page 123
Setting the Reference Level Automatically (Auto Level)
Automatically determines a reference level which ensures that no overload occurs at
the R&S FSWP for the current input data. At the same time, the internal attenuators
are adjusted so the signal-to-noise ratio is optimized, while signal compression and
clipping are minimized.
To determine the required reference level, a level measurement is performed on the
R&S FSWP.
If necessary, you can optimize the reference level further. Decrease the attenuation
level manually to the lowest possible value before an overload occurs, then decrease
the reference level in the same way.
You can change the measurement time for the level measurement if necessary (see
"Changing the Automatic Measurement Time (Meastime Manual)" on page 74).
Remote command:
[SENSe:]ADJust:LEVel on page 112
Resetting the Automatic Measurement Time (Meastime Auto)
Resets the measurement duration for automatic settings to the default value.
Remote command:
[SENSe:]ADJust:CONFigure:DURation:MODE on page 122
Changing the Automatic Measurement Time (Meastime Manual)
This function allows you to change the measurement duration for automatic setting
adjustments. Enter the value in seconds.
Note: The maximum possible measurement duration depends on the currently
selected measurement and the installed (optional) hardware. Thus, the measurement
duration actually used to determine the automatic settings may be shorter than the
value you define here.
Remote command:
[SENSe:]ADJust:CONFigure:DURation:MODE on page 122
[SENSe:]ADJust:CONFigure:DURation on page 121
Upper Level Hysteresis
When the reference level is adjusted automatically using the Auto Level function, the
internal attenuators and the preamplifier are also adjusted. To avoid frequent adaptation due to small changes in the input signal, you can define a hysteresis. This setting
defines an upper threshold the signal must exceed (compared to the last measurement) before the reference level is adapted automatically.
Remote command:
[SENSe:]ADJust:CONFigure:HYSTeresis:UPPer on page 122
74User Manual 1177.5691.02 ─ 08
Page 75

R&S®FSWP-K7
Configuration
Automatic Settings
Lower Level Hysteresis
When the reference level is adjusted automatically using the Auto Level function, the
internal attenuators and the preamplifier are also adjusted. To avoid frequent adaptation due to small changes in the input signal, you can define a hysteresis. This setting
defines a lower threshold the signal must fall below (compared to the last measurement) before the reference level is adapted automatically.
Remote command:
[SENSe:]ADJust:CONFigure:HYSTeresis:LOWer on page 122
75User Manual 1177.5691.02 ─ 08
Page 76

R&S®FSWP-K7
6 Analysis
6.1 Trace Configuration
Analysis
Trace Configuration
Access: "Overview" > "Analysis"
General result analysis settings concerning the trace, markers, lines etc. are similar to
the analysis functions in the spectrum application, except for the features described
here.
For more information, refer to the user manual of the R&S FSWP spectrum application.
● Trace Configuration.................................................................................................76
● Marker Settings.......................................................................................................77
● Display Lines and Limit Lines..................................................................................77
Access
●
"Overview" > "Analysis" > "Trace"
For more information, refer to the R&S FSWP user manual.
Spectrograms in the analog modulation analysis application
Basically, spectrograms work the same as in the spectrum application (including the
3D spectrogram).
However, in the analog demodulator, they have the following distinctive features.
●
Not all result displays support spectrograms.
●
Compared to the spectrum application, a spectrogram can not be added as an
independent result display. Instead, spectrograms relate to a certain measurement
window (or result display). Result diagram and spectrogram are a single entity in
that case and can not be divided.
●
You can assign a specific trace to the spectrogram.
To view results in a spectrogram, select a window (indicated by a blue frame), then
select [TRACE] > "Spectrogram Config".
Spectrograms are either displayed in "Split" mode (spectrogram is displayed below the
trace diagram), in "Full" mode (trace diagram is not displayed), or not displayed at all
("Off)".
When the "Spectrogram Config"softkey is greyed out, spectrograms are not supported
by the selected result display.
State..............................................................................................................................76
Trace.............................................................................................................................77
State
Activates and deactivates a Spectrogram subwindow.
76User Manual 1177.5691.02 ─ 08
Page 77

R&S®FSWP-K7
Analysis
Display Lines and Limit Lines
"Split"
"Full"
"Off"
Remote command:
CALCulate<n>:SPECtrogram:LAYout on page 171
Trace
Selects the diagram trace on which the spectrogram is based.
Remote command:
CALCulate<n>:SGRam:TRACe on page 171
Displays the Spectrogram as a subwindow in the original result display.
Displays the Spectrogram in a subwindow in the full size of the original result display.
Closes the Spectrogram subwindow.
6.2 Marker Settings
Access
●
"Overview" > "Analysis" > "Marker"
●
"Overview" > "Analysis" > "Marker Function"
For more information, refer to the R&S FSWP user manual.
Link AF Spectrum Marker............................................................................................. 77
Link Time Marker...........................................................................................................77
Link AF Spectrum Marker
Links the markers in all AF spectrum displays.
Remote command:
CALCulate<n>:MARKer<m>:LINK on page 170
Link Time Marker
Links the markers in all time domain diagrams.
Remote command:
CALCulate<n>:MARKer<m>:LINK on page 170
6.3 Display Lines and Limit Lines
Access (limit lines): "Overview" > "Analysis" > "Lines" > "Limit Lines"
Access (display lines): "Overview" > "Analysis" > "Lines" > "Display Lines"
For more information, refer to the R&S FSWP user manual.
77User Manual 1177.5691.02 ─ 08
Page 78

R&S®FSWP-K7
7 I/Q Data Import and Export
I/Q Data Import and Export
Import/Export Functions
Baseband signals mostly occur as so-called complex baseband signals, i.e. a signal
representation that consists of two channels; the in phase (I) and the quadrature (Q)
channel. Such signals are referred to as I/Q signals. The complete modulation information and even distortion that originates from the RF, IF or baseband domains can be
analyzed in the I/Q baseband.
Importing and exporting I/Q signals is useful for various applications:
●
Generating and saving I/Q signals in an RF or baseband signal generator or in
external software tools to analyze them with the R&S FSWP later
●
Capturing and saving I/Q signals with an RF or baseband signal analyzer to analyze them with the R&S FSWP or an external software tool later
For example, you can capture I/Q data using the I/Q Analyzer application, if available,
and then analyze that data later using the R&S FSWP Analog Modulation Analysis
application.
As opposed to storing trace data, which may be averaged or restricted to peak values,
I/Q data is stored as it was captured, without further processing. The data is stored as
complex values in 32-bit floating-point format. Multi-channel data is not supported. The
I/Q data is stored in a format with the file extension .iq.tar.
For a detailed description see the R&S FSWP I/Q Analyzer and I/Q Input User Manual.
An application note on converting Rohde & Schwarz I/Q data files is available from the
Rohde & Schwarz website:
1EF85: Converting R&S I/Q data files
Export only in MSRA mode
In MSRA mode, I/Q data can only be exported to other applications; I/Q data cannot be
imported to the MSRA Master or any MSRA applications.
● Import/Export Functions..........................................................................................78
● How to Export and Import I/Q Data.........................................................................81
7.1 Import/Export Functions
Access: "Save"/ "Open" icon in the toolbar > "Import" / "Export"
The R&S FSWP provides various evaluation methods for the results of the performed
measurements. However, you may want to evaluate the data with further, external
applications. In this case, you can export the measurement data to a standard format
file (ASCII or XML). Some of the data stored in these formats can also be re-imported
to the R&S FSWP for further evaluation later, for example in other applications.
78User Manual 1177.5691.02 ─ 08
Page 79

R&S®FSWP-K7
I/Q Data Import and Export
Import/Export Functions
The following data types can be exported (depending on the application):
●
Trace data
●
Table results, such as result summaries, marker peak lists etc.
I/Q data can only be imported and exported in applications that process I/Q data, such
as the I/Q Analyzer or optional applications.
See the corresponding user manuals for those applications for details.
These functions are only available if no measurement is running.
In particular, if Continuous Sweep / Run Cont is active, the import/export functions are
not available.
Import............................................................................................................................79
└ I/Q Import........................................................................................................79
└ File Explorer..........................................................................................79
Export............................................................................................................................79
└ Export Trace to ASCII File.............................................................................. 80
└ Trace Export Configuration.............................................................................80
└ I/Q Export........................................................................................................80
└ File Explorer..........................................................................................80
Import
Access: "Save/Recall" > Import
Provides functions to import data.
I/Q Import ← Import
Opens a file selection dialog box to select an import file that contains I/Q data. This
function is only available in single sweep mode and only in applications that process
I/Q data, such as the I/Q Analyzer or optional applications.
Note that the I/Q data must have a specific format as described in the R&S FSWP I/Q
Analyzer and I/Q Input User Manual.
Input from I/Q data files is imported as it was stored, including any correction factors,
for example from transducers or SnP files. Any currently configured correction factors
at the time of import, however, are not applied.
I/Q import is not available in MSRA mode.
Remote command:
MMEMory:LOAD:IQ:STATe on page 172
File Explorer ← I/Q Import ← Import
Opens the Microsoft Windows File Explorer.
Remote command:
not supported
Export
Access: "Save/Recall" > Export
79User Manual 1177.5691.02 ─ 08
Page 80

R&S®FSWP-K7
I/Q Data Import and Export
Import/Export Functions
Opens a submenu to configure data export.
Export Trace to ASCII File ← Export
Opens a file selection dialog box and saves the selected trace in ASCII format (.dat)
to the specified file and directory.
The results are output in the same order as they are displayed on the screen: window
by window, trace by trace, and table row by table row.
Note: Secure user mode.
In secure user mode, settings that are stored on the instrument are stored to volatile
memory, which is restricted to 256 MB. Thus, a "memory limit reached" error can occur
although the hard disk indicates that storage space is still available.
To store data permanently, select an external storage location such as a USB memory
device.
For details, see "Protecting Data Using the Secure User Mode" in the "Data Management" section of the R&S FSWP base unit user manual.
Remote command:
MMEMory:STORe<n>:TRACe on page 169
Trace Export Configuration ← Export
Opens the "Traces" dialog box to configure the trace and data export settings.
I/Q Export ← Export
Opens a file selection dialog box to define an export file name to which the I/Q data is
stored. This function is only available in single sweep mode.
Note: Storing large amounts of I/Q data (several Gigabytes) can exceed the available
(internal) storage space on the R&S FSWP. In this case, it can be necessary to use an
external storage medium.
Note: Secure user mode.
In secure user mode, settings that are stored on the instrument are stored to volatile
memory, which is restricted to 256 MB. Thus, a "memory limit reached" error can occur
although the hard disk indicates that storage space is still available.
To store data permanently, select an external storage location such as a USB memory
device.
For details, see "Protecting Data Using the Secure User Mode" in the "Data Management" section of the R&S FSWP base unit user manual.
Remote command:
MMEMory:STORe<n>:IQ:STATe on page 172
MMEMory:STORe<n>:IQ:COMMent on page 172
File Explorer ← I/Q Export ← Export
Opens the Microsoft Windows File Explorer.
Remote command:
not supported
80User Manual 1177.5691.02 ─ 08
Page 81

R&S®FSWP-K7
7.2 How to Export and Import I/Q Data
I/Q Data Import and Export
How to Export and Import I/Q Data
I/Q data can only be exported in applications that process I/Q data, such as the I/Q
Analyzer or optional applications.
Capturing and exporting I/Q data
1. Press the [PRESET] key.
2. Press the [MODE] key and select the R&S FSWP Analog Modulation Analysis
application or any other application that supports I/Q data.
3. Configure the data acquisition.
4. Press the [RUN SINGLE] key to perform a single sweep measurement.
5.
Select the
6. Select the "I/Q Export" softkey.
"Save" icon in the toolbar.
7. In the file selection dialog box, select a storage location and enter a file name.
8. Select "Save".
The captured data is stored to a file with the extension .iq.tar.
Importing I/Q data
1. Press the [MODE] key and select the "I/Q Analyzer" or any other application that
supports I/Q data.
2. If necessary, switch to single sweep mode by pressing the [RUN SINGLE] key.
3.
Select the
4. Select the "I/Q Import" softkey.
5. Select the storage location and the file name with the .iq.tar file extension.
6. Select "Open".
The stored data is loaded from the file and displayed in the current application.
Previewing the I/Q data in a web browser
The iq-tar file format allows you to preview the I/Q data in a web browser.
1. Use an archive tool (e.g. WinZip® or PowerArchiver®) to unpack the iq-tar file
into a folder.
"Open" icon in the toolbar.
2. Locate the folder using Windows Explorer.
3. Open your web browser.
81User Manual 1177.5691.02 ─ 08
Page 82

R&S®FSWP-K7
I/Q Data Import and Export
How to Export and Import I/Q Data
4. Drag the I/Q parameter XML file, e.g. example.xml, into your web browser.
82User Manual 1177.5691.02 ─ 08
Page 83

R&S®FSWP-K7
8 How to Perform Measurements in the Ana-
How to Perform Measurements in the Analog Modulation Analysis Application
log Modulation Analysis Application
The following step-by-step instructions demonstrate how to perform an Analog Modulation Analysis measurement with the optional Analog Modulation Analysis application.
1. Press the [MODE] key and select the "Analog Demod" application.
2. Select the "Overview" softkey to display the "Overview" for an Analog Modulation
Analysis measurement.
3. Select the "Input/Frontend" button and then the "Frequency" tab to define the input
signal's center frequency.
4. Select the "Data Acquisition" button and define the bandwidth parameters for the
input signal:
(Note: in MSRA mode, define the analysis interval using the same settings.)
● "Demodulation Bandwidth": the span of the input signal to be demodulated
● "Measurement Time": how long the input signal is to be measured
● "Resolution Bandwidth": how precise the signal is to be demodulated
● "Capture Offset" (multistandard mode only): the offset of the analysis interval
from the start of the capture buffer
5. Optionally, select the "Trigger" button and define a trigger for data acquisition, for
example an offline demodulation trigger to start capturing data only when a useful
signal is transmitted.
6. Select the "Demod/Display" button and select the demodulation displays that are of
interest to you (up to 6).
Arrange them on the display to suit your preferences.
7. Exit the SmartGrid mode and select the "Overview" softkey to display the "Overview" again.
8. Select the "Demodulation Settings" button to define demodulation parameters for
each evaluation:
● Configure the "Squelch" function (on the "Demod" tab) to suppress noise dur-
ing demodulation.
● For time domain evaluations, zoom into the areas of interest by defining a
zoom area (on the "Demod" tab).
● For AF evaluations, use special filters to eliminate certain effects of demodula-
tion or to correct pre-emphasized modulated signals (on the "AF Filters" tab).
● Adapt the diagram scaling to the displayed data (on the "Scaling" tab).
9. Select the "Analysis" button in the "Overview" to make use of the advanced analysis functions in the demodulation displays.
83User Manual 1177.5691.02 ─ 08
Page 84

R&S®FSWP-K7
How to Perform Measurements in the Analog Modulation Analysis Application
How to Export Trace Data and Numerical Results
● Configure a trace to display the average over a series of sweeps (on the
"Trace" tab; if necessary, increase the "Sweep Count" in the "Data Acquisition"
settings).
● Configure markers and delta markers to determine deviations and offsets within
the demodulated signal (on the "Marker" tab).
● Use special marker functions to calculate phase noise or an n dB down band-
width (on the "Marker Config" tab).
● Configure a limit check to detect excessive deviations (on the "Lines" tab).
10. Start a new sweep with the defined settings.
In multistandard mode you may want to stop the continuous measurement mode
by the Sequencer and perform a single data acquisition:
a)
Select the Sequencer icon (
b) Set the Sequencer state to "Off".
c) Press the [RUN SINGLE] key.
11. Optionally, export the trace data of the demodulated signal to a file.
a) In the "Traces" tab of the "Analysis" dialog box, switch to the "Trace Export"
tab.
b) Select "Export Trace to ASCII File".
c) Define a file name and storage location and select "OK".
) from the toolbar.
8.1 How to Export Trace Data and Numerical Results
The measured trace data and numerical measurement results in tables can be exported to an ASCII file. For each measurement point the measured trace position and
value are output.
The file is stored with a .DAT extension. For details on the storage format see Chap-
ter A.3, "Reference: ASCII File Export Format", on page 177.
To export trace data and table results
1. Select [TRACE] > "Trace Config" > "Trace / Data Export" tab.
2. Select "Export all Traces and all Table Results" to export all available measurement
result data for the current application, or select a specific "Trace to Export".
3. Optionally, select the "Include Instrument & Measurement Settings" option to insert
additional information in the export file header.
4. If necessary, change the decimal separator to be used for the ASCII export file.
5. Select the "Export Trace to ASCII File" button.
6. In the file selection dialog box, select the storage location and file name for the
export file.
7. Select "Save" to close the dialog box and export the data to the file.
84User Manual 1177.5691.02 ─ 08
Page 85

R&S®FSWP-K7
9 Measurement Example: Demodulating an
Measurement Example: Demodulating an FM Signal
FM Signal
A practical example for a basic Analog Modulation Analysis measurement is provided
here. It demonstrates how operating and measurement errors can be avoided using
correct configuration settings.
The measurement is performed using the following devices:
●
An R&S FSWP with the optional Spectrum application and the optional Analog
Modulation Analysis application
●
A vector signal generator, e.g. R&S SMW
Signal
Generator
Figure 9-1: Test setup
Signal generator settings (e.g. R&S SMW):
Frequency: 500 MHz
Level: -10 dBm
Modulation: FM
Modulation frequency: 10 kHz
Frequency deviation: 50 kHz
Procedure:
1. Preset the R&S FSWP.
2. Set the center frequency to 500 MHz.
3. Set the reference level to 0 dBm.
4. Select the [MODE] key and then the "Analog Demod" button.
R&S
FSWP
By default, the FM Time Domain result display and a Result Summary are shown.
85User Manual 1177.5691.02 ─ 08
Page 86

R&S®FSWP-K7
Measurement Example: Demodulating an FM Signal
Figure 9-2: Default Analog Modulation Analysis measurement result display
5. Set the measurement time (AQT) to 1 ms in order to measure 10 periods of the signal.
6. Adjust the y-axis scaling to the measured frequency deviation automatically by
selecting the "Scale Config" softkey and, in the "Scaling" tab, setting "AF Auto
Scale" to "On".
Figure 9-3: Auto-scaled measurement of 10 signal periods (continuous)
7. Display the RF spectrum of the measured signal to determine the required demodulation bandwidth. Select the "Display Config" softkey and add an "RF Spectrum"
window to the display.
86User Manual 1177.5691.02 ─ 08
Page 87

R&S®FSWP-K7
Measurement Example: Demodulating an FM Signal
Figure 9-4: RF spectrum of FM signal with default demodulation bandwidth = 5 MHz
8. As you can see in Figure 9-4, the default demodulation bandwidth of 5 MHz is
much too large - the actual signal takes up only a small part of the displayed range.
That means that any noise or additional signals apart from the FM signal of interest
may be included in the measured results. Select the "Demod BW" softkey and
reduce the value to 200
kHz.
Figure 9-5: RF spectrum with demodulation bandwidth = 200
kHz
The span is automatically reduced to 200 kHz as well, as only the demodulated
range can be displayed.
87User Manual 1177.5691.02 ─ 08
Page 88

R&S®FSWP-K7
Measurement Example: Demodulating an FM Signal
9. Now the RF spectrum shows that part of the FM signal is cut off. The missing signal parts are not included in the calculated results. Increase the demodulation
bandwidth to 400 kHz to include the entire signal, but no interfering frequencies.
The span is not automatically increased for the wider DBW since it may be useful
to display only a small range from the demodulated bandwidth. However, this
means the RF spectrum will still not show the entire signal.
10. Increase the span manually to show the entire demodulated bandwidth:
a) Select the RF Spectrum window.
b) Press the [SPAN] key.
c) Select the "Full Span" softkey.
Figure 9-6: RF spectrum with demodulation bandwidth = 400 kHz
11. Once the correct DBW has been determined, you can replace the RF spectrum by
the FM spectrum result display to analyze the spectrum of the FM signal. Select
the "Display Config" softkey and move an "FM Spectrum" window over the "RF
Spectrum" window in the display.
88User Manual 1177.5691.02 ─ 08
Page 89

R&S®FSWP-K7
Measurement Example: Demodulating an FM Signal
Figure 9-7: FM spectrum and Result Summary including SINAD and THD values
From the FM spectrum, the SINAD and THD are also calculated and displayed in
the Result Summary.
12. Since the "AF Auto Scale" function is enabled, the "FM Spectrum" diagram is
scaled according to the current measurement automatically. Each diagram is
scaled individually, so that the reference values at the top of the two diagrams can
differ (100 kHz in the "FM Time Domain" versus 50 kHz in the "FM Spectrum".
However, you can adjust the values manually.
a) Select the "FM Spectrum" window to set the focus in it.
b) Press the [AMPT] key and select the "Scale Config" softkey.
c) Disable the "AF Auto Scale" function.
d) Define the new reference value (at 100% = top of the diagram) as 100
kHz.
89User Manual 1177.5691.02 ─ 08
Page 90

R&S®FSWP-K7
Measurement Example: Demodulating an FM Signal
Note that while the reference values at the top of both y-axes are now identical, the
reference values indicated in the window title bars are not. This is due to the fact
that, by default, in AF time domain displays the reference value is defined at the
reference position 50 % (=center of diagram), while in AF frequency domains it is
defined at the position 100 % (= top of diagram).
90User Manual 1177.5691.02 ─ 08
Page 91

R&S®FSWP-K7
10 Optimizing and Troubleshooting the Mea-
Optimizing and Troubleshooting the Measurement
surement
If the results do not meet your expectations, consider the following notes and tips to
optimize the measurement.
Determining the demodulation bandwidth
A frequent cause for measurement errors and false results is an incorrectly defined
demodulation bandwidth (DBW).
If the DBW is too large, the actual signal takes up only a small part of the demodulated
range. That means that any noise or additional signal parts may be included in the
measured results, which are then false.
On the other hand, if the DBW is too small, part of the signal is cut off and thus not
included in the calculation of the results.
An easy way to determine the required DBW is to display the RF spectrum of the input
signal. If the entire signal is displayed there and takes up most of the diagram width,
the DBW should be appropriate.
This procedure is demonstrated in the measurement example described in Chapter 9,
"Measurement Example: Demodulating an FM Signal", on page 85.
For further recommendations on finding the correct demodulation bandwidth see Chap-
ter 4.2, "Demodulation Bandwidth", on page 27.
Adjusting the displayed span
Be aware that the span of the RF Spectrum display is not automatically increased for a
wider DBW, since it may be useful to display only a small range from the demodulated
bandwidth. However, this means the RF spectrum may not show the entire demodulated bandwidth. In this case you must increase the span manually to show the entire
signal.
Determining the SINAD and THD
The signal-to-noise-and-distortion ratio (SINAD) and the total harmonic distortion
(THD) of the demodulated signal are a good indicator of the signal quality sent by the
DUT. Both values are calculated inside the AF spectrum span and thus only if an AF
spectrum window is displayed. If either value deviates strongly from the expected
result, make sure the demodulation bandwidth is defined correctly (see Determining
the demodulation bandwidth).
91User Manual 1177.5691.02 ─ 08
Page 92

R&S®FSWP-K7
11 Remote Commands for Analog Modulation
11.1 Introduction
Remote Commands for Analog Modulation Analysis
Introduction
Analysis
● Introduction............................................................................................................. 92
● Common Suffixes....................................................................................................97
● Remote Commands to Select the Application.........................................................97
● Remote Commands to Configure Analog Modulation Analysis............................ 101
● Configuring the Result Display..............................................................................151
● Working with Measurement Results......................................................................159
● Analyzing Results..................................................................................................170
● Importing and Exporting Data............................................................................... 172
● Programming Example..........................................................................................173
Commands are program messages that a controller (e.g. a PC) sends to the instrument or software. They operate its functions ('setting commands' or 'events') and
request information ('query commands'). Some commands can only be used in one
way, others work in two ways (setting and query). If not indicated otherwise, the commands can be used for settings and queries.
The syntax of a SCPI command consists of a header and, in most cases, one or more
parameters. To use a command as a query, you have to append a question mark after
the last header element, even if the command contains a parameter.
A header contains one or more keywords, separated by a colon. Header and parameters are separated by a "white space" (ASCII code 0 to 9, 11 to 32 decimal, e.g. blank).
If there is more than one parameter for a command, these are separated by a comma
from one another.
Only the most important characteristics that you need to know when working with SCPI
commands are described here. For a more complete description, refer to the User
Manual of the R&S FSWP.
Remote command examples
Note that some remote command examples mentioned in this general introduction may
not be supported by this particular application.
11.1.1 Conventions used in Descriptions
Note the following conventions used in the remote command descriptions:
●
Command usage
If not specified otherwise, commands can be used both for setting and for querying
parameters.
92User Manual 1177.5691.02 ─ 08
Page 93

R&S®FSWP-K7
Remote Commands for Analog Modulation Analysis
Introduction
If a command can be used for setting or querying only, or if it initiates an event, the
usage is stated explicitly.
●
Parameter usage
If not specified otherwise, a parameter can be used to set a value and it is the
result of a query.
Parameters required only for setting are indicated as Setting parameters.
Parameters required only to refine a query are indicated as Query parameters.
Parameters that are only returned as the result of a query are indicated as Return
values.
●
Conformity
Commands that are taken from the SCPI standard are indicated as SCPI confirmed. All commands used by the R&S FSWP follow the SCPI syntax rules.
●
Asynchronous commands
A command which does not automatically finish executing before the next command starts executing (overlapping command) is indicated as an Asynchronous
command.
●
Reset values (*RST)
Default parameter values that are used directly after resetting the instrument (*RST
command) are indicated as *RST values, if available.
●
Default unit
The default unit is used for numeric values if no other unit is provided with the
parameter.
●
Manual operation
If the result of a remote command can also be achieved in manual operation, a link
to the description is inserted.
11.1.2 Long and Short Form
The keywords have a long and a short form. You can use either the long or the short
form, but no other abbreviations of the keywords.
The short form is emphasized in upper case letters. Note however, that this emphasis
only serves the purpose to distinguish the short from the long form in the manual. For
the instrument, the case does not matter.
Example:
SENSe:FREQuency:CENTer is the same as SENS:FREQ:CENT.
11.1.3 Numeric Suffixes
Some keywords have a numeric suffix if the command can be applied to multiple
instances of an object. In that case, the suffix selects a particular instance (e.g. a measurement window).
Numeric suffixes are indicated by angular brackets (<n>) next to the keyword.
If you don't quote a suffix for keywords that support one, a 1 is assumed.
93User Manual 1177.5691.02 ─ 08
Page 94

R&S®FSWP-K7
11.1.4 Optional Keywords
Remote Commands for Analog Modulation Analysis
Introduction
Example:
DISPlay[:WINDow<1...4>]:ZOOM:STATe enables the zoom in a particular measurement window, selected by the suffix at WINDow.
DISPlay:WINDow4:ZOOM:STATe ON refers to window 4.
Some keywords are optional and are only part of the syntax because of SCPI compliance. You can include them in the header or not.
Note that if an optional keyword has a numeric suffix and you need to use the suffix,
you have to include the optional keyword. Otherwise, the suffix of the missing keyword
is assumed to be the value 1.
Optional keywords are emphasized with square brackets.
Example:
Without a numeric suffix in the optional keyword:
[SENSe:]FREQuency:CENTer is the same as FREQuency:CENTer
With a numeric suffix in the optional keyword:
DISPlay[:WINDow<1...4>]:ZOOM:STATe
DISPlay:ZOOM:STATe ON enables the zoom in window 1 (no suffix).
DISPlay:WINDow4:ZOOM:STATe ON enables the zoom in window 4.
11.1.5 Alternative Keywords
A vertical stroke indicates alternatives for a specific keyword. You can use both keywords to the same effect.
Example:
[SENSe:]BANDwidth|BWIDth[:RESolution]
In the short form without optional keywords, BAND 1MHZ would have the same effect
as BWID 1MHZ.
11.1.6 SCPI Parameters
Many commands feature one or more parameters.
If a command supports more than one parameter, these are separated by a comma.
Example:
LAYout:ADD:WINDow Spectrum,LEFT,MTABle
Parameters may have different forms of values.
94User Manual 1177.5691.02 ─ 08
Page 95

R&S®FSWP-K7
11.1.6.1 Numeric Values
Remote Commands for Analog Modulation Analysis
Introduction
● Numeric Values....................................................................................................... 95
● Boolean...................................................................................................................96
● Character Data........................................................................................................96
● Character Strings.................................................................................................... 96
● Block Data...............................................................................................................96
Numeric values can be entered in any form, i.e. with sign, decimal point or exponent. In
case of physical quantities, you can also add the unit. If the unit is missing, the command uses the basic unit.
Example:
With unit: SENSe:FREQuency:CENTer 1GHZ
Without unit: SENSe:FREQuency:CENTer 1E9 would also set a frequency of 1 GHz.
Values exceeding the resolution of the instrument are rounded up or down.
If the number you have entered is not supported (e.g. in case of discrete steps), the
command returns an error.
Instead of a number, you can also set numeric values with a text parameter in special
cases.
●
MIN/MAX
Defines the minimum or maximum numeric value that is supported.
●
DEF
Defines the default value.
●
UP/DOWN
Increases or decreases the numeric value by one step. The step size depends on
the setting. In some cases you can customize the step size with a corresponding
command.
Querying numeric values
When you query numeric values, the system returns a number. In case of physical
quantities, it applies the basic unit (e.g. Hz in case of frequencies). The number of digits after the decimal point depends on the type of numeric value.
Example:
Setting: SENSe:FREQuency:CENTer 1GHZ
Query: SENSe:FREQuency:CENTer? would return 1E9
In some cases, numeric values may be returned as text.
●
INF/NINF
Infinity or negative infinity. Represents the numeric values 9.9E37 or -9.9E37.
●
NAN
95User Manual 1177.5691.02 ─ 08
Page 96

R&S®FSWP-K7
11.1.6.2 Boolean
Remote Commands for Analog Modulation Analysis
Introduction
Not a number. Represents the numeric value 9.91E37. NAN is returned in case of
errors.
Boolean parameters represent two states. The "ON" state (logically true) is represented by "ON" or a numeric value 1. The "OFF" state (logically untrue) is represented by
"OFF" or the numeric value 0.
Querying Boolean parameters
When you query Boolean parameters, the system returns either the value 1 ("ON") or
the value 0 ("OFF").
Example:
Setting: DISPlay:WINDow:ZOOM:STATe ON
Query: DISPlay:WINDow:ZOOM:STATe? would return 1
11.1.6.3 Character Data
Character data follows the syntactic rules of keywords. You can enter text using a short
or a long form. For more information see Chapter 11.1.2, "Long and Short Form",
on page 93.
Querying text parameters
When you query text parameters, the system returns its short form.
Example:
Setting: SENSe:BANDwidth:RESolution:TYPE NORMal
Query: SENSe:BANDwidth:RESolution:TYPE? would return NORM
11.1.6.4 Character Strings
Strings are alphanumeric characters. They have to be in straight quotation marks. You
can use a single quotation mark ( ' ) or a double quotation mark ( " ).
Example:
INSTRument:DELete 'Spectrum'
11.1.6.5 Block Data
Block data is a format which is suitable for the transmission of large amounts of data.
The ASCII character # introduces the data block. The next number indicates how many
of the following digits describe the length of the data block. In the example the 4 following digits indicate the length to be 5168 bytes. The data bytes follow. During the transmission of these data bytes all end or other control signs are ignored until all bytes are
96User Manual 1177.5691.02 ─ 08
Page 97

R&S®FSWP-K7
11.2 Common Suffixes
Remote Commands for Analog Modulation Analysis
Remote Commands to Select the Application
transmitted. #0 specifies a data block of indefinite length. The use of the indefinite format requires an NL^END message to terminate the data block. This format is useful
when the length of the transmission is not known or if speed or other considerations
prevent segmentation of the data into blocks of definite length.
In the R&S FSWP Analog Modulation Analysis application, the following common suffixes are used in remote commands:
Table 11-1: Common suffixes used in remote commands in the R&S FSWP Analog Modulation Analy-
Suffix Value range Description
<m> 1 to 16 Marker
<n> 1 to 6 Window (in the currently selected channel)
<t> 1 to 6 Trace
<li> 1 to 8 Limit line
<j> 1..10 Selects an integrated measurement range.
<k> 1..8 (Limit line)
<r> 1..x Selects a half decade.
<s> 1..6 Selects a (user defined) spot noise marker.
<x> 1..2 Selects a mixer in the test setup.
sis application
(or spot noise marker)
Selects a limit or display line.
1 | 2 (Display line)
The value range depends on the number of half decades. The first
half decade in the measurement always has the value "1". For subsequent half decades, add "1" to get the value "x" (the fourth half
decade, for example, would have the value "4").
Selecting windows in multiple channels
Note that the suffix <n> always refers to a window in the currently selected channel.
11.3 Remote Commands to Select the Application
INSTrument:CREate:DUPLicate........................................................................................ 98
INSTrument:CREate[:NEW].............................................................................................. 98
INSTrument:CREate:REPLace..........................................................................................98
INSTrument:DELete......................................................................................................... 99
INSTrument:LIST?........................................................................................................... 99
97User Manual 1177.5691.02 ─ 08
Page 98

R&S®FSWP-K7
Remote Commands for Analog Modulation Analysis
Remote Commands to Select the Application
INSTrument:REName.....................................................................................................100
INSTrument[:SELect]......................................................................................................100
SYSTem:PRESet:CHANnel[:EXEC]................................................................................. 101
INSTrument:CREate:DUPLicate
This command duplicates the currently selected channel, i.e creates a new channel of
the same type and with the identical measurement settings. The name of the new
channel is the same as the copied channel, extended by a consecutive number (e.g.
"IQAnalyzer" -> "IQAnalyzer 2").
The channel to be duplicated must be selected first using the INST:SEL command.
Example:
INST:SEL 'PhaseNoise'
INST:CRE:DUPL
Duplicates the channel named 'PhaseNoise' and creates a new
channel named 'PhaseNoise 2'.
Usage: Event
INSTrument:CREate[:NEW]
<ChannelType>, <ChannelName>
This command adds an additional measurement channel. You can configure up to 10
measurement channels at the same time (depending on available memory).
Parameters:
<ChannelType> Channel type of the new channel.
For a list of available channel types see INSTrument:LIST?
on page 99.
<ChannelName> String containing the name of the channel.
Note that you can not assign an existing channel name to a new
channel; this will cause an error.
Example:
INST:CRE SAN, 'Spectrum 2'
Adds an additional spectrum display named "Spectrum 2".
INSTrument:CREate:REPLace <ChannelName1>,<ChannelType>,<ChannelName2>
This command replaces a channel with another one.
Setting parameters:
<ChannelName1> String containing the name of the channel you want to replace.
<ChannelType> Channel type of the new channel.
For a list of available channel types see INSTrument:LIST?
on page 99.
98User Manual 1177.5691.02 ─ 08
Page 99

R&S®FSWP-K7
Remote Commands for Analog Modulation Analysis
Remote Commands to Select the Application
<ChannelName2> String containing the name of the new channel.
Note: If the specified name for a new channel already exists, the
default name, extended by a sequential number, is used for the
new channel (see INSTrument:LIST? on page 99).
Channel names can have a maximum of 31 characters, and
must be compatible with the Windows conventions for file
names. In particular, they must not contain special characters
such as ":", "*", "?".
Example:
INST:CRE:REPL 'PhaseNoise',PNO,'PNO2'
Replaces the channel named "PhaseNoise" by a new channel of
type "Phase Noise" named "PNO2".
Usage: Setting only
INSTrument:DELete <ChannelName>
This command deletes a channel.
If you delete the last channel, the default "Phase Noise" channel is activated.
Setting parameters:
<ChannelName> String containing the name of the channel you want to delete.
A channel must exist in order to be able delete it.
Example:
INST:DEL 'PhaseNoise'
Deletes the channel with the name 'PhaseNoise'.
Usage: Setting only
INSTrument:LIST?
This command queries all active channels. This is useful in order to obtain the names
of the existing channels, which are required in order to replace or delete the channels.
Return values:
<ChannelType>,
<ChannelName>
For each channel, the command returns the channel type and
channel name (see tables below).
Tip: to change the channel name, use the INSTrument:
REName command.
Example:
INST:LIST?
Result for 2 channels:
'PNO','PhaseNoise','PNO','Phase Noise 2'
Usage: Query only
Table 11-2: Available channel types and default channel names
Application <ChannelType> Parameter Default Channel Name*)
Phase Noise PNOise Phase Noise
Spectrum Monitor SMONitor Spectrum Monitor
Note: the default channel name is also listed in the table. If the specified name for a new channel already
exists, the default name, extended by a sequential number, is used for the new channel.
99User Manual 1177.5691.02 ─ 08
Page 100

R&S®FSWP-K7
Remote Commands for Analog Modulation Analysis
Remote Commands to Select the Application
Application <ChannelType> Parameter Default Channel Name*)
Spectrum (R&S FSWP-B1) SANalyzer Spectrum
I/Q Analyzer (R&S FSWPB1)
Pulse Measurements
(R&S FSWP-K6)
Analog Modulation Analysis (R&S FSWP-K7)
Noise Figure Measurements (R&S FSWP-K30)
Spurious Measurements
(R&S FSWP-K50)
Transient Analysis
(R&S FSWP-K60)
Vector Signal Analysis
(R&S FSWP-K70)
Note: the default channel name is also listed in the table. If the specified name for a new channel already
exists, the default name, extended by a sequential number, is used for the new channel.
IQ IQ Analyzer
PULSe Pulse
ADEMod Analog Demod
NOISe Noise
SPUR Spurious
TA Transient Analysis
DDEM VSA
INSTrument:REName <ChannelName1>, <ChannelName2>
This command renames a channel.
Setting parameters:
<ChannelName1> String containing the name of the channel you want to rename.
<ChannelName2> String containing the new channel name.
Note that you cannot assign an existing channel name to a new
channel; this will cause an error.
Channel names can have a maximum of 31 characters, and
must be compatible with the Windows conventions for file
names. In particular, they must not contain special characters
such as ":", "*", "?".
Example:
INST:REN 'PhaseNoise','PNO'
Renames the channel with the name 'PhaseNoise' to 'PNO'.
Usage: Setting only
INSTrument[:SELect] <ChannelType>
Selects the channel type for the current channel.
See also INSTrument:CREate[:NEW] on page 98.
For a list of available channel types see INSTrument:LIST? on page 99.
Parameters:
<ChannelType> ADEMod
Optional Analog Modulation Analysis application.
100User Manual 1177.5691.02 ─ 08
 Loading...