

Page 1
R&S®FSWP
Phase Noise Analyzer
User Manual
(;ÛÆQ2)
1177563302
Version 13
Page 2

This manual describes the following R&S®FSWP models with firmware version 2.00 or higher:
●
R&S®FSWP8 (1322.8003K08)
●
R&S®FSWP26 (1322.8003K26)
●
R&S®FSWP50 (1322.8003K50)
In addition, the following options are described:
●
R&S FSWP-B21 (1325.3848.02)
●
R&S FSWP-B24 (1325.3725.08)
●
R&S FSWP-B24 (1325.3725.26)
●
R&S FSWP-B24 (1325.3725.50)
●
R&S FSWP-B60 (1322.9800.08)
●
R&S FSWP-B60 (1322.9800.26)
●
R&S FSWP-B60 (1322.9800.50)
●
R&S FSWP-B64 (1322.9900.26)
●
R&S FSWP-B64 (1322.9900.50)
●
R&S FSWP-K4 (1325.5034.02)
●
R&S FSWP-K33 (1325.5040.02)
© 2021 Rohde & Schwarz GmbH & Co. KG
Mühldorfstr. 15, 81671 München, Germany
Phone: +49 89 41 29 - 0
Email: info@rohde-schwarz.com
Internet: www.rohde-schwarz.com
Subject to change – data without tolerance limits is not binding.
R&S® is a registered trademark of Rohde & Schwarz GmbH & Co. KG.
Trade names are trademarks of the owners.
1177.5633.02 | Version 13 | R&S®FSWP
Throughout this manual, products from Rohde & Schwarz are indicated without the ® symbol , e.g. R&S®FSWP is indicated as
R&S FSWP.
Page 3

R&S®FSWP
Contents
Contents
1 Safety and Regulatory Information.................................................... 15
1.1 Safety Instructions......................................................................................................15
1.2 Warning Messages in the Documentation................................................................17
1.3 Korea Certification Class A........................................................................................18
2 Documentation Overview....................................................................19
2.1 Getting Started Manual...............................................................................................19
2.2 User Manuals and Help...............................................................................................19
2.3 Service Manual............................................................................................................ 19
2.4 Instrument Security Procedures................................................................................20
2.5 Printed Safety Instructions........................................................................................ 20
2.6 Data Sheets and Brochures....................................................................................... 20
2.7 Release Notes and Open Source Acknowledgment (OSA).....................................20
2.8 Application Notes, Application Cards, White Papers, etc.......................................20
3 Preparing for Use.................................................................................21
3.1 Lifting and Carrying.................................................................................................... 21
3.2 Unpacking and Checking........................................................................................... 21
3.3 Choosing the Operating Site......................................................................................21
3.4 Setting Up the R&S FSWP..........................................................................................22
3.4.1 Placing the Product on a Bench Top.............................................................................22
3.4.2 Mounting the R&S FSWP in a Rack..............................................................................23
3.5 Connecting the AC Power.......................................................................................... 23
3.6 Switching the Instrument On and Off........................................................................24
3.7 Connecting to LAN......................................................................................................25
3.8 Connecting a Keyboard..............................................................................................26
3.9 Connecting an External Monitor................................................................................27
3.10 Windows Operating System.......................................................................................28
3.11 Logging On..................................................................................................................30
3.12 Checking the Supplied Options.................................................................................31
3.13 Performing a Self-Alignment......................................................................................32
3.14 Considerations for Test Setup................................................................................... 32
3User Manual 1177.5633.02 ─ 13
Page 4

R&S®FSWP
4.1.1 Display (Touchscreen)...................................................................................................35
4.1.2 Power Key.....................................................................................................................36
4.1.3 System Control Keys.....................................................................................................36
4.1.4 The Function Keys........................................................................................................ 37
4.1.5 The Keypad...................................................................................................................38
4.1.6 Navigation Control.........................................................................................................39
4.1.7 RF Input (50 Ω)............................................................................................................. 40
4.1.8 Signal Source Output.................................................................................................... 41
4.1.9 USB Ports..................................................................................................................... 41
4.1.10 Power Sensors..............................................................................................................41
4.1.11 Probe Power Connector (3 Pins).................................................................................. 42
Contents
4 Instrument Tour....................................................................................34
4.1 The Front Panel........................................................................................................... 34
4.1.12 Noise Source Control.................................................................................................... 42
4.1.13 Trigger Input and Output............................................................................................... 42
4.1.14 Baseband Input............................................................................................................. 42
4.1.15 External Mixer (Optional).............................................................................................. 43
4.1.16 DC Power Supply..........................................................................................................43
4.1.17 LO AUX Input (Optional)............................................................................................... 43
4.2 The Rear Panel............................................................................................................ 44
4.2.1 Removable Hard Disk................................................................................................... 45
4.2.2 AC Power Supply Connection and Main Power Switch................................................ 45
4.2.3 Display Port and DVI.....................................................................................................45
4.2.4 LAN............................................................................................................................... 46
4.2.5 USB Ports..................................................................................................................... 46
4.2.6 IF / Video / Demod Output.............................................................................................46
4.2.7 IF Wide Out................................................................................................................... 46
4.2.8 Sync Trigger Input and Output...................................................................................... 47
4.2.9 AUX Port....................................................................................................................... 47
4.2.10 GPIB Interface...............................................................................................................47
4.2.11 External Generator Control (Optional).......................................................................... 47
4.2.12 OCXO (Optional)...........................................................................................................48
4.2.13 REF INPUT / REF OUTPUT......................................................................................... 48
4User Manual 1177.5633.02 ─ 13
Page 5

R&S®FSWP
4.2.14 Labels on R&S FSWP...................................................................................................49
4.2.15 Device ID.......................................................................................................................49
5.2.1 Measurement Selection................................................................................................ 53
5.2.2 The Phase Noise Measurement....................................................................................53
5.2.3 The Additive Noise Measurement................................................................................. 56
5.2.4 The Baseband Noise Measurement..............................................................................58
5.2.5 The Pulsed Phase Noise Measurement........................................................................60
5.2.6 The Pulsed Additive Noise Measurement..................................................................... 60
5.2.7 Adding Another Measurement Channel........................................................................ 62
Contents
5 Trying Out the Instrument................................................................... 50
5.1 Initial Setup..................................................................................................................51
5.2 Measurements............................................................................................................. 52
5.3 Result Evaluation........................................................................................................ 62
5.3.1 Trace Smoothing...........................................................................................................63
5.3.2 Integration Ranges........................................................................................................65
5.3.3 The Cross-Correlation Gain Indicator........................................................................... 66
5.3.4 Miscellaneous Evaluation Tools.................................................................................... 67
5.4 Measurement Configuration...................................................................................... 68
5.4.1 Frequency Configuration...............................................................................................68
5.4.2 The Half Decade Configuration Table........................................................................... 70
5.4.3 Pulsed Measurement Configuration..............................................................................70
5.4.4 Signal Generation......................................................................................................... 71
5.4.5 DUT Power Supply........................................................................................................73
6 Operating the Instrument.................................................................... 74
6.1 Understanding the Display Information....................................................................74
6.1.1 Channel Bar.................................................................................................................. 75
6.1.2 Window Title Bar........................................................................................................... 77
6.1.3 Marker Information........................................................................................................ 78
6.1.4 Spot Noise Information..................................................................................................78
6.1.5 Measurement Progress Information..............................................................................79
6.1.6 Frequency Information in Diagram Footer.................................................................... 80
6.1.7 Instrument and Status Information................................................................................ 80
6.1.8 Error Information........................................................................................................... 81
5User Manual 1177.5633.02 ─ 13
Page 6

R&S®FSWP
6.2.1 Toolbar.......................................................................................................................... 83
6.2.2 Softkeys........................................................................................................................ 84
6.2.3 Context Menus.............................................................................................................. 85
6.2.4 On-screen Keyboard..................................................................................................... 85
6.4.1 Entering Numeric Parameters.......................................................................................86
6.4.2 Entering Alphanumeric Parameters.............................................................................. 87
6.5.1 Activating and Deactivating Channels...........................................................................89
6.5.2 Laying out the Result Display with the SmartGrid.........................................................90
6.5.3 Changing the Size of Windows..................................................................................... 94
Contents
6.2 Accessing Functions.................................................................................................. 82
6.3 Changing the Focus....................................................................................................86
6.4 Entering Data...............................................................................................................86
6.5 Displaying Results...................................................................................................... 88
6.5.4 Switching Between a Split and Maximized Window Display......................................... 95
6.5.5 Changing the Display.................................................................................................... 95
6.6 Remote Control........................................................................................................... 96
6.6.1 Remote Desktop Connection........................................................................................ 96
6.6.2 Connecting a PC via the GPIB Interface.......................................................................96
7 Applications..........................................................................................98
7.1 R&S MultiView............................................................................................................. 98
7.2 Available Applications................................................................................................99
7.3 Starting an Application.............................................................................................101
7.4 Running a Sequence of Measurements.................................................................. 103
7.4.1 The Sequencer Concept............................................................................................. 103
7.4.2 Sequencer Settings.....................................................................................................105
7.4.3 How to Set Up the Sequencer.....................................................................................105
8 Measurements and Result Displays.................................................107
8.1 Basics on Phase Noise Measurements...................................................................107
8.1.1 Residual Effects.......................................................................................................... 107
8.2 Performing Measurements.......................................................................................108
8.3 Selecting Measurements.......................................................................................... 110
8.4 Result Displays..........................................................................................................112
6User Manual 1177.5633.02 ─ 13
Page 7

R&S®FSWP
9.2.1 RF Input...................................................................................................................... 125
9.2.2 Baseband Input........................................................................................................... 127
9.2.3 External Mixers........................................................................................................... 128
9.3.1 Signal Attenuation....................................................................................................... 142
9.3.2 Amplitude Characteristics........................................................................................... 143
9.3.3 Diagram Scale.............................................................................................................145
9.5.1 Triggered Measurements (Phase Noise CW)............................................................. 151
Contents
9 Common Measurement Settings...................................................... 123
9.1 Configuration Overview............................................................................................123
9.2 Input Source.............................................................................................................. 125
9.3 Level Characteristics................................................................................................ 142
9.4 Frequency.................................................................................................................. 146
9.5 Noise Measurement Configuration..........................................................................151
9.5.2 Measurement Range...................................................................................................151
9.5.3 Noise Configuration.....................................................................................................152
9.5.4 Integrated Measurement Configuration.......................................................................158
9.5.5 Spot Noise Information................................................................................................161
9.5.6 Spur Display................................................................................................................162
9.5.7 Frequency Stability Configuration............................................................................... 164
9.6 Output........................................................................................................................ 165
9.6.1 DC Source Configuration............................................................................................ 165
9.6.2 Signal Source Configuration....................................................................................... 168
9.6.3 Miscellaneous Output..................................................................................................172
9.7 Pulsed Phase Noise and Pulsed Additive Noise Configuration........................... 173
9.8 VCO Characterization Configuration.......................................................................177
9.8.1 Sweep Configuration...................................................................................................177
9.8.2 Trace Configuration.....................................................................................................180
9.9 Spot Noise vs Tune Configuration...........................................................................180
9.9.1 Trace Configuration.....................................................................................................181
9.10 PN Transient Analysis Configuration......................................................................181
9.10.1 Frequency Configuration.............................................................................................182
9.10.2 Trigger Configuration...................................................................................................184
9.10.3 Data Acquisition.......................................................................................................... 186
7User Manual 1177.5633.02 ─ 13
Page 8

R&S®FSWP
9.10.4 Amplitude Configuration..............................................................................................187
9.10.5 Diagram Scale.............................................................................................................188
9.10.6 Settling Time............................................................................................................... 190
9.10.7 Frequency Deviation................................................................................................... 191
9.10.8 Trace Configuration.....................................................................................................191
9.10.9 Marker Configuration...................................................................................................192
9.10.10 Limit Lines................................................................................................................... 192
10.1.1 Basic Result Displays..................................................................................................193
10.1.2 Laying out the Result Display with the SmartGrid.......................................................193
Contents
10 Common Analysis and Display Functions...................................... 193
10.1 Result Display Configuration...................................................................................193
10.2 Zoomed Displays...................................................................................................... 198
10.2.1 Single Zoom Versus Multiple Zoom............................................................................ 198
10.2.2 Zoom Functions.......................................................................................................... 199
10.2.3 How to Zoom Into a Diagram...................................................................................... 200
10.3 Trace Configuration.................................................................................................. 202
10.3.1 Basics on Traces.........................................................................................................202
10.3.2 Trace Configuration.....................................................................................................206
10.3.3 Trace Export and Import..............................................................................................209
10.3.4 Copying Traces........................................................................................................... 214
10.3.5 Trace Math.................................................................................................................. 214
10.3.6 Trace Labels................................................................................................................215
10.3.7 How to Configure Traces.............................................................................................215
10.3.8 References..................................................................................................................216
10.4 Markers...................................................................................................................... 223
10.4.1 Basics on Markers and Marker Functions...................................................................223
10.4.2 Marker Settings........................................................................................................... 225
10.4.3 Marker Search Settings and Positioning Functions.................................................... 229
10.5 Limit Lines................................................................................................................. 232
10.5.1 Basics on Limit Lines.................................................................................................. 232
10.5.2 Limit Line Settings and Functions............................................................................... 236
10.5.3 How to Define Limit Lines........................................................................................... 240
11 Data Management.............................................................................. 244
8User Manual 1177.5633.02 ─ 13
Page 9

R&S®FSWP
11.3.1 Quick Save/Quick Recall.............................................................................................248
11.3.2 Configurable Storage and Recall................................................................................ 251
11.3.3 How to Save and Load Instrument Settings................................................................256
11.5.1 Print and Screenshot Settings.....................................................................................260
11.5.2 How to Store or Print Screenshots of the Display....................................................... 269
11.5.3 Example for Storing Multiple Measurement Results to a PDF File............................. 272
Contents
11.1 Restoring the Default Instrument Configuration (Preset)..................................... 244
11.2 Protecting Data Using the Secure User Mode........................................................245
11.3 Storing and Recalling Instrument Settings and Measurement Data....................247
11.4 Import/Export Functions.......................................................................................... 258
11.5 Creating Screenshots of Current Measurement Results and Settings................260
12 General Instrument Setup................................................................. 275
12.1 Alignment...................................................................................................................275
12.1.1 Basics on Alignment....................................................................................................275
12.1.2 Alignment Settings...................................................................................................... 277
12.1.3 How to Perform a Self-Test......................................................................................... 280
12.1.4 How to Align the Instrument........................................................................................ 280
12.1.5 How to Align the Touchscreen.....................................................................................281
12.2 Display Settings........................................................................................................ 281
12.2.1 Display Settings.......................................................................................................... 281
12.2.2 How to Configure the Colors for Display and Printing.................................................290
12.2.3 How to Work with the Soft Front Panels......................................................................291
12.3 Reference Frequency Settings................................................................................ 292
12.4 System Configuration Settings................................................................................296
12.4.1 Hardware Information..................................................................................................296
12.4.2 Information on Versions and Options..........................................................................297
12.4.3 System Messages.......................................................................................................298
12.4.4 Firmware Updates.......................................................................................................299
12.4.5 General Configuration Settings................................................................................... 301
12.5 Service Functions..................................................................................................... 303
12.5.1 R&S Support Information............................................................................................ 304
12.5.2 Self-test Settings and Results..................................................................................... 305
12.5.3 Calibration Signal Display........................................................................................... 306
9User Manual 1177.5633.02 ─ 13
Page 10

R&S®FSWP
12.5.4 Service Functions........................................................................................................308
12.5.5 Hardware Diagnostics................................................................................................. 309
13.1.1 Remote Control Interfaces and Protocols....................................................................311
13.1.2 SCPI (Standard Commands for Programmable Instruments).....................................320
13.1.3 VISA Libraries............................................................................................................. 320
13.1.4 Messages....................................................................................................................321
13.1.5 SCPI Command Structure...........................................................................................322
13.1.6 Command Sequence and Synchronization.................................................................330
13.1.7 Status Reporting System............................................................................................ 332
13.1.8 General Programming Recommendations..................................................................349
Contents
13 Network and Remote Operation........................................................311
13.1 Remote Control Basics.............................................................................................311
13.2 The IECWIN Tool........................................................................................................350
13.3 Network and Remote Control Settings................................................................... 351
13.3.1 General Network Settings........................................................................................... 352
13.3.2 GPIB Settings..............................................................................................................354
13.3.3 Compatibility Settings..................................................................................................357
13.3.4 LAN Settings............................................................................................................... 358
13.3.5 HUMS Settings............................................................................................................360
13.3.6 Remote Errors.............................................................................................................366
13.3.7 Returning to Manual Mode ("Local")........................................................................... 367
13.4 How to Set Up a Network and Remote Control...................................................... 368
13.4.1 How to Configure a Network....................................................................................... 369
13.4.2 How to Operate the Instrument Without a Network.....................................................375
13.4.3 How to Log on to the Network.....................................................................................375
13.4.4 How to Share Directories (only with Microsoft Networks)........................................... 378
13.4.5 How to Control the R&S FSWP via the Web Browser Interface..................................378
13.4.6 How to Deactivate the Web Browser Interface............................................................379
13.4.7 How to Set Up Remote Desktop................................................................................. 380
13.4.8 How to Start a Remote Control Session from a PC.................................................... 386
13.4.9 How to Return to Manual Operation............................................................................387
14 Remote Control.................................................................................. 388
14.1 Conventions Used in SCPI Command Descriptions..............................................388
10User Manual 1177.5633.02 ─ 13
Page 11

R&S®FSWP
14.4.1 Selecting Mode and Applications................................................................................ 394
14.4.2 Performing a Sequence of Measurements..................................................................398
14.4.3 Programming Example: Performing a Sequence of Measurements........................... 400
14.5.1 Measurement Selection.............................................................................................. 402
14.5.2 Performing Measurements..........................................................................................404
14.5.3 Querying Results.........................................................................................................407
14.5.4 Programming Examples..............................................................................................417
14.6.1 Remote Commands to Configure the Input Source.................................................... 418
Contents
14.2 Common Suffixes......................................................................................................389
14.3 Common Commands................................................................................................ 389
14.4 Selecting the Operating Mode and Application..................................................... 394
14.5 Measurements and Result Displays........................................................................402
14.6 Common Measurement Settings............................................................................. 418
14.6.2 Output......................................................................................................................... 433
14.6.3 Remote Commands to Configure User Ports..............................................................446
14.6.4 Remote Commands to Configure Level Characteristics............................................. 448
14.6.5 Remote Commands to Configure the Frequency........................................................454
14.6.6 Phase Noise Measurement Configuration.................................................................. 459
14.6.7 Pulsed Phase Noise Configuration............................................................................. 479
14.6.8 VCO Characterization Configuration...........................................................................482
14.6.9 Spot Noise vs Tune Configuration...............................................................................485
14.6.10 Transient Analysis.......................................................................................................489
14.7 Common Analysis and Display Functions............................................................. 505
14.7.1 Display Configuration.................................................................................................. 505
14.7.2 Zoom........................................................................................................................... 514
14.7.3 Trace Configuration.....................................................................................................517
14.7.4 Marker......................................................................................................................... 529
14.7.5 Limit Lines................................................................................................................... 542
14.7.6 Examples: Configuring the Result Display.................................................................. 554
14.8 Managing Settings and Results...............................................................................557
14.8.1 Managing Files............................................................................................................558
14.8.2 Selecting Items to Store.............................................................................................. 563
14.8.3 Saving and Loading Instrument Settings.................................................................... 566
11User Manual 1177.5633.02 ─ 13
Page 12

R&S®FSWP
14.8.4 Storing and Printing Screenshots................................................................................570
14.8.5 Saving Measurement Results..................................................................................... 581
14.8.6 Examples: Managing Data.......................................................................................... 582
14.9.1 Basic Instrument Setup............................................................................................... 585
14.9.2 Configuring the Reference Frequency........................................................................ 586
14.9.3 Calibrating the R&S FSWP and Checking Temperature............................................. 591
14.9.4 Customizing the Screen Layout.................................................................................. 595
14.9.5 Configuring Network and Remote Control.................................................................. 601
14.9.6 Configuring HUMS...................................................................................................... 606
14.9.7 Checking the System Configuration............................................................................612
14.9.8 Using Service Functions............................................................................................. 618
14.9.9 Reference: Command Set of 5052 Emulation.............................................................622
Contents
14.9 Configuring the R&S FSWP......................................................................................585
14.9.10 Reference: Command Set of Emulated PSA Models..................................................623
14.10 Using the Status Register........................................................................................ 627
14.10.1 General Status Register Commands.......................................................................... 628
14.10.2 Reading Out the CONDition Part................................................................................ 628
14.10.3 Reading Out the EVENt Part.......................................................................................629
14.10.4 Controlling the ENABle Part........................................................................................629
14.10.5 Controlling the Negative Transition Part......................................................................630
14.10.6 Controlling the Positive Transition Part....................................................................... 631
14.11 Programming Examples...........................................................................................631
14.11.1 Service Request..........................................................................................................632
15 Troubleshooting................................................................................. 641
15.1 Collecting Information for Support..........................................................................641
15.2 Contacting Customer Support.................................................................................643
16 Transporting.......................................................................................644
17 Maintenance, Storage, Transport and Disposal.............................. 645
17.1 Cleaning..................................................................................................................... 645
17.2 Storage.......................................................................................................................645
17.3 Transporting.............................................................................................................. 645
12User Manual 1177.5633.02 ─ 13
Page 13

R&S®FSWP
Contents
17.4 Disposal..................................................................................................................... 646
List of commands.............................................................................. 647
Index....................................................................................................660
13User Manual 1177.5633.02 ─ 13
Page 14

R&S®FSWP
Contents
14User Manual 1177.5633.02 ─ 13
Page 15

R&S®FSWP
Safety and Regulatory Information
Safety Instructions
1 Safety and Regulatory Information
The product documentation helps you use the product safely and efficiently. Follow the
instructions provided here and in the Chapter 1.1, "Safety Instructions", on page 15.
Intended use
The product is intended for the development, production and verification of electronic
components and devices in industrial, administrative, and laboratory environments.
Use the product only for its designated purpose. Observe the operating conditions and
performance limits stated in the data sheet.
Target audience
Where do I find safety information?
Safety information is part of the product documentation. It warns you of potential dangers and gives instructions on how to prevent personal injury or damage caused by
dangerous situations. Safety information is provided as follows:
●
In Chapter 1.1, "Safety Instructions", on page 15. The same information is provided in many languages as printed "Safety Instructions". The printed "Safety
Instructions" are delivered with the product.
●
Throughout the documentation, safety instructions are provided when you need to
take care during setup or operation.
1.1 Safety Instructions
Products from the Rohde & Schwarz group of companies are manufactured according
to the highest technical standards. To use the products safely, follow the instructions
provided here and in the product documentation. Keep the product documentation
nearby and offer it to other users.
Use the product only for its intended use and within its performance limits. Intended
use and limits are described in the product documentation such as the data sheet,
manuals and the printed "Safety Instructions". If you are unsure about the appropriate
use, contact Rohde & Schwarz customer service.
Using the product requires specialists or specially trained personnel. These users also
need sound knowledge of at least one of the languages in which the user interfaces
and the product documentation are available.
Never open the casing of the product. Only service personnel authorized by
Rohde & Schwarz are allowed to repair the product. If any part of the product is damaged or broken, stop using the product. Contact Rohde & Schwarz customer service at
http://www.customersupport.rohde-schwarz.com.
15User Manual 1177.5633.02 ─ 13
Page 16

R&S®FSWP
Safety and Regulatory Information
Safety Instructions
Lifting and carrying the product
The product is heavy. Do not move or carry the product by yourself. A single person
can only carry a maximum of 18 kg safely depending on age, gender and physical condition. Look up the maximum weight in the data sheet. Use the product handles to
move or carry the product. Do not lift by the accessories mounted on the product.
Accessories are not designed to carry the weight of the product.
To move the product safely, you can use lifting or transporting equipment such as lift
trucks and forklifts. Follow the instructions provided by the equipment manufacturer.
Choosing the operating site
Only use the product indoors. The product casing is not waterproof. Water that enters
can electrically connect the casing with live parts, which can lead to electric shock,
serious personal injury or death if you touch the casing. If Rohde & Schwarz provides
accessories designed for your product, e.g. a carrying bag, you can use the product
outdoors.
Unless otherwise specified, you can operate the product up to an altitude of 2000 m
above sea level. The product is suitable for pollution degree 2 environments where
nonconductive contamination can occur. For more information on environmental conditions such as ambient temperature and humidity, see the data sheet.
Setting up the product
Always place the product on a stable, flat and level surface with the bottom of the product facing down. If the product is designed for different positions, secure the product so
that it cannot fall over.
If the product has foldable feet, always fold the feet completely in or out to ensure stability. The feet can collapse if they are not folded out completely or if the product is
moved without lifting it. The foldable feet are designed to carry the weight of the product, but not an extra load.
If stacking is possible, keep in mind that a stack of products can fall over and cause
injury.
If you mount products in a rack, ensure that the rack has sufficient load capacity and
stability. Observe the specifications of the rack manufacturer. Always install the products from the bottom shelf to the top shelf so that the rack stands securely. Secure the
product so that it cannot fall off the rack.
Connecting to power
The product is an overvoltage category II product. Connect the product to a fixed
installation used to supply energy-consuming equipment such as household appliances and similar loads. Keep in mind that electrically powered products have risks, such
as electric shock, fire, personal injury or even death.
Take the following measures for your safety:
●
Before switching on the product, ensure that the voltage and frequency indicated
on the product match the available power source. If the power adapter does not
adjust automatically, set the correct value and check the rating of the fuse.
16User Manual 1177.5633.02 ─ 13
Page 17
R&S®FSWP
Safety and Regulatory Information
Warning Messages in the Documentation
●
Only use the power cable delivered with the product. It complies with country-specific safety requirements. Only insert the plug into an outlet with protective conductor terminal.
●
Only use intact cables and route them carefully so that they cannot be damaged.
Check the power cables regularly to ensure that they are undamaged. Also ensure
that nobody can trip over loose cables.
●
If the product needs an external power supply, use the power supply that is delivered with the product or that is recommended in the product documentation or a
power supply that conforms to the country-specific regulations.
●
Only connect the product to a power source with a fuse protection of maximum
20 A.
●
Ensure that you can disconnect the product from the power source at any time.
Pull the power plug to disconnect the product. The power plug must be easily
accessible. If the product is integrated into a system that does not meet these
requirements, provide an easily accessible circuit breaker at the system level.
Cleaning the product
Use a dry, lint-free cloth to clean the product. When cleaning, keep in mind that the
casing is not waterproof. Do not use liquid cleaning agents.
Meaning of safety labels
Safety labels on the product warn against potential hazards.
Potential hazard
Read the product documentation to avoid personal injury or product damage.
Heavy product
Be careful when lifting, moving or carrying the product. Carrying the product requires a suffi-
cient number of persons or transport equipment.
Electrical hazard
Indicates live parts. Risk of electric shock, fire, personal injury or even death.
Hot surface
Do not touch. Risk of skin burns. Risk of fire.
Protective conductor terminal
Connect this terminal to a grounded external conductor or to protective ground. This connec-
tion protects you against electric shock if an electric problem occurs.
1.2 Warning Messages in the Documentation
A warning message points out a risk or danger that you need to be aware of. The signal word indicates the severity of the safety hazard and how likely it will occur if you do
not follow the safety precautions.
17User Manual 1177.5633.02 ─ 13
Page 18

R&S®FSWP
1.3 Korea Certification Class A
Safety and Regulatory Information
Korea Certification Class A
WARNING
Potentially hazardous situation. Could result in death or serious injury if not avoided.
CAUTION
Potentially hazardous situation. Could result in minor or moderate injury if not avoided.
NOTICE
Potential risks of damage. Could result in damage to the supported product or to other
property.
이 기기는 업무용(A급) 전자파 적합기기로서 판매자 또는 사용자는 이 점을 주의하시기
바라며, 가정외의 지역에서 사용하는 것을 목적으로 합니다.
18User Manual 1177.5633.02 ─ 13
Page 19

R&S®FSWP
2.1 Getting Started Manual
Documentation Overview
Service Manual
2 Documentation Overview
This section provides an overview of the R&S FSWP user documentation. Unless
specified otherwise, you find the documents on the R&S FSWP product page at:
www.rohde-schwarz.com/manual/FSWP
Introduces the R&S FSWP and describes how to set up and start working with the
product. Includes basic operations, typical measurement examples, and general information, e.g. safety instructions, etc.
A printed version is delivered with the instrument. A PDF version is available for download on the Internet.
2.2 User Manuals and Help
The user manual contains the description of all instrument modes and functions. It also
provides an introduction to remote control, a complete description of the remote control
commands with programming examples, and information on maintenance, instrument
interfaces and error messages. Includes the contents of the getting started manual.
The contents of the user manual are available as help in the R&S FSWP. The help
offers quick, context-sensitive access to the complete information for the instrument
and its firmware.
The user manual is also available for download or for immediate display on the Internet.
2.3 Service Manual
Describes the performance test for checking the rated specifications, module replacement and repair, firmware update, troubleshooting and fault elimination, and contains
mechanical drawings and spare part lists.
The service manual is available for registered users on the global Rohde & Schwarz
information system (GLORIS):
https://gloris.rohde-schwarz.com
19User Manual 1177.5633.02 ─ 13
Page 20

R&S®FSWP
2.4 Instrument Security Procedures
2.5 Printed Safety Instructions
2.6 Data Sheets and Brochures
Documentation Overview
Application Notes, Application Cards, White Papers, etc.
Deals with security issues when working with the R&S FSWP in secure areas. It is
available for download on the Internet.
Provides safety information in many languages. The printed document is delivered with
the product.
The data sheet contains the technical specifications of the R&S FSWP. It also lists the
firmware applications and their order numbers, and optional accessories.
The brochure provides an overview of the instrument and deals with the specific characteristics.
See www.rohde-schwarz.com/brochure-datasheet/FSWP
2.7 Release Notes and Open Source Acknowledgment (OSA)
The release notes list new features, improvements and known issues of the current
firmware version, and describe the firmware installation.
The open-source acknowledgment document provides verbatim license texts of the
used open source software.
See www.rohde-schwarz.com/firmware/FSWP
2.8 Application Notes, Application Cards, White Papers, etc.
These documents deal with special applications or background information on particular topics.
See www.rohde-schwarz.com/application/FSWP
20User Manual 1177.5633.02 ─ 13
Page 21

R&S®FSWP
3.1 Lifting and Carrying
3.2 Unpacking and Checking
Preparing for Use
Choosing the Operating Site
3 Preparing for Use
Here, you can find basic information about setting up the instrument for the first time.
The carrying handles are designed to lift or carry the instrument. Do not apply excessive external force to the handles.
See "Lifting and carrying the product" on page 16.
1. Unpack the R&S FSWP carefully.
2. Retain the original packing material. Use it when transporting or shipping the
R&S FSWP later.
3. Using the delivery notes, check the equipment for completeness.
4. Check the equipment for damage.
If the delivery is incomplete or equipment is damaged, contact Rohde & Schwarz.
3.3 Choosing the Operating Site
Specific operating conditions ensure proper operation and avoid damage to the product and connected devices. For information on environmental conditions such as ambient temperature and humidity, see the data sheet.
See also "Choosing the operating site" on page 16.
Electromagnetic compatibility classes
The electromagnetic compatibility (EMC) class indicates where you can operate the
product. The EMC class of the product is given in the data sheet under "General data".
●
Class B equipment is suitable for use in:
– Residential environments
– Environments that are directly connected to a low-voltage supply network that
supplies residential buildings
●
Class A equipment is intended for use in industrial environments. It can cause
radio disturbances in residential environments due to possible conducted and radiated disturbances. It is therefore not suitable for class B environments.
21User Manual 1177.5633.02 ─ 13
Page 22
R&S®FSWP
Preparing for Use
If class A equipment causes radio disturbances, take appropriate measures to
eliminate them.
3.4 Setting Up the R&S FSWP
The R&S FSWP is designed for use on a bench top or in a rack.
See also:
●
"Setting up the product" on page 16
●
"Intended use" on page 15
3.4.1 Placing the Product on a Bench Top
To place the product on a bench top
1. Place the product on a stable, flat and level surface. Ensure that the surface can
support the weight of the product. For information on the weight, see the data
sheet.
Setting Up the R&S
FSWP
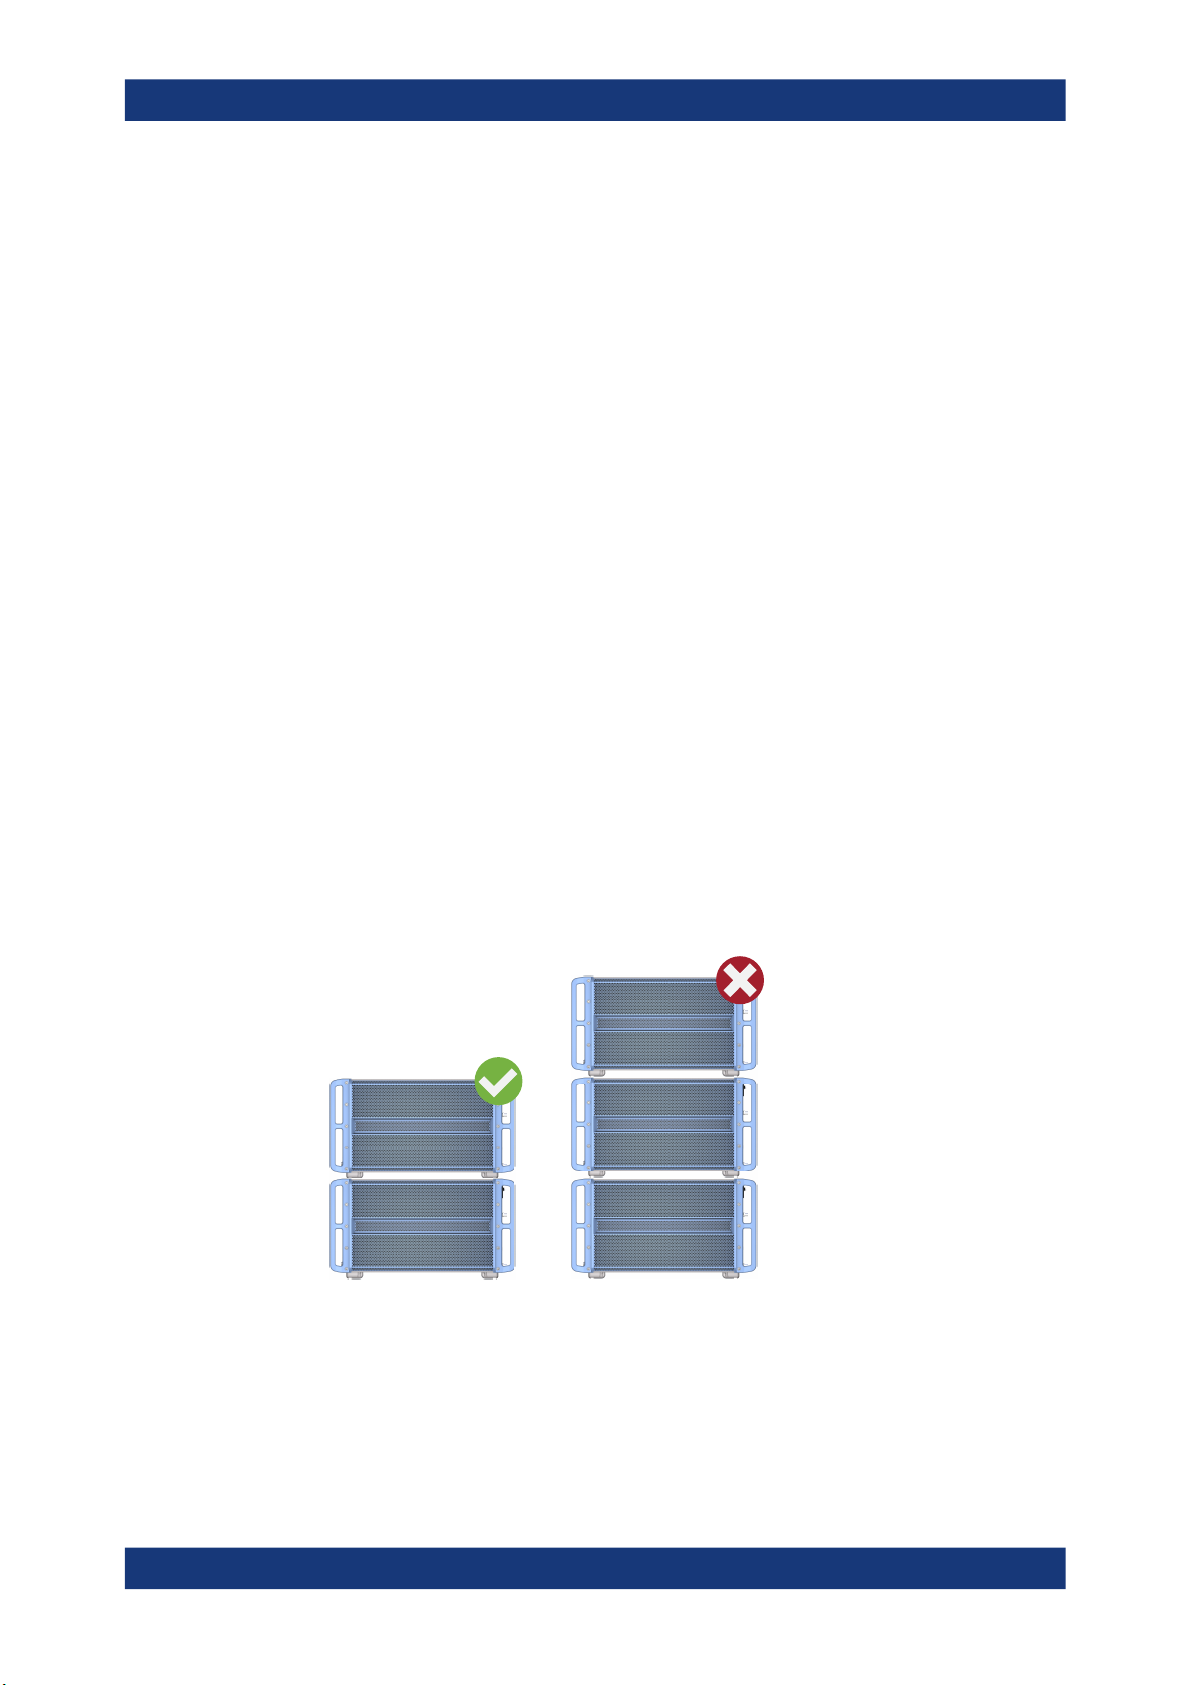
WARNING! A stack of products can fall over and cause injury. Never stack more
2.
than two products. Otherwise, mount them in a rack.
Stack as follows:
● All products must have the same dimensions (width and length).
● Do not exceed a total load of 50 kg placed on the product at the bottom of the
stack.
= Stacked correctly
Left
Right = Stacked incorrectly, too many products
NOTICE! Overheating can damage the product.
3.
Prevent overheating as follows:
22User Manual 1177.5633.02 ─ 13
Page 23

R&S®FSWP
3.4.2 Mounting the R&S FSWP in a Rack
Preparing for Use
Connecting the AC Power
● Keep a minimum distance of 10 cm between the fan openings of the product
and any object in the vicinity.
● Do not place the product next to heat-generating equipment such as radiators
or other products.
To prepare the rack
1. Observe the requirements and instructions in "Setting up the product" on page 16.
NOTICE! Insufficient airflow can cause overheating and damage the product.
2.
Design and implement an efficient ventilation concept for the rack.
To mount the R&S FSWP in a rack
1. Use an adapter kit to prepare the R&S FSWP for rack mounting.
a) Order the rack adapter kit designed for the R&S FSWP. For the order number,
see the data sheet.
b) Mount the adapter kit. Follow the assembly instructions provided with the
adapter kit.
2. Lift the R&S FSWP to shelf height.
3. Grab the handles and push the R&S FSWP onto the shelf until the rack brackets fit
closely to the rack.
4. Tighten all screws in the rack brackets with a tightening torque of 1.2 Nm to secure
the R&S FSWP in the rack.
To unmount the R&S FSWP from a rack
1. Loosen the screws at the rack brackets.
2. Remove the R&S FSWP from the rack.
3. If placing the R&S FSWP on a bench top again, unmount the adapter kit from the
R&S FSWP. Follow the instructions provided with the adapter kit.
3.5 Connecting the AC Power
In the standard version, the R&S FSWP is equipped with an AC power supply connector.
The R&S FSWP can be used with different AC power voltages and adapts itself automatically to it. Refer to the datasheet for the requirements of voltage and frequency.
For safety information, see "Connecting to power" on page 16.
23User Manual 1177.5633.02 ─ 13
Page 24
R&S®FSWP
3.6 Switching the Instrument On and Off
Preparing for Use
Switching the Instrument On and Off
To connect the AC power
1. Plug the AC power cable into the AC power connector on the rear panel of the
instrument. Only use the AC power cable delivered with the R&S FSWP.
2. Plug the AC power cable into a power outlet with ground contact.
The required ratings are listed next to the AC power connector and in the data
sheet.
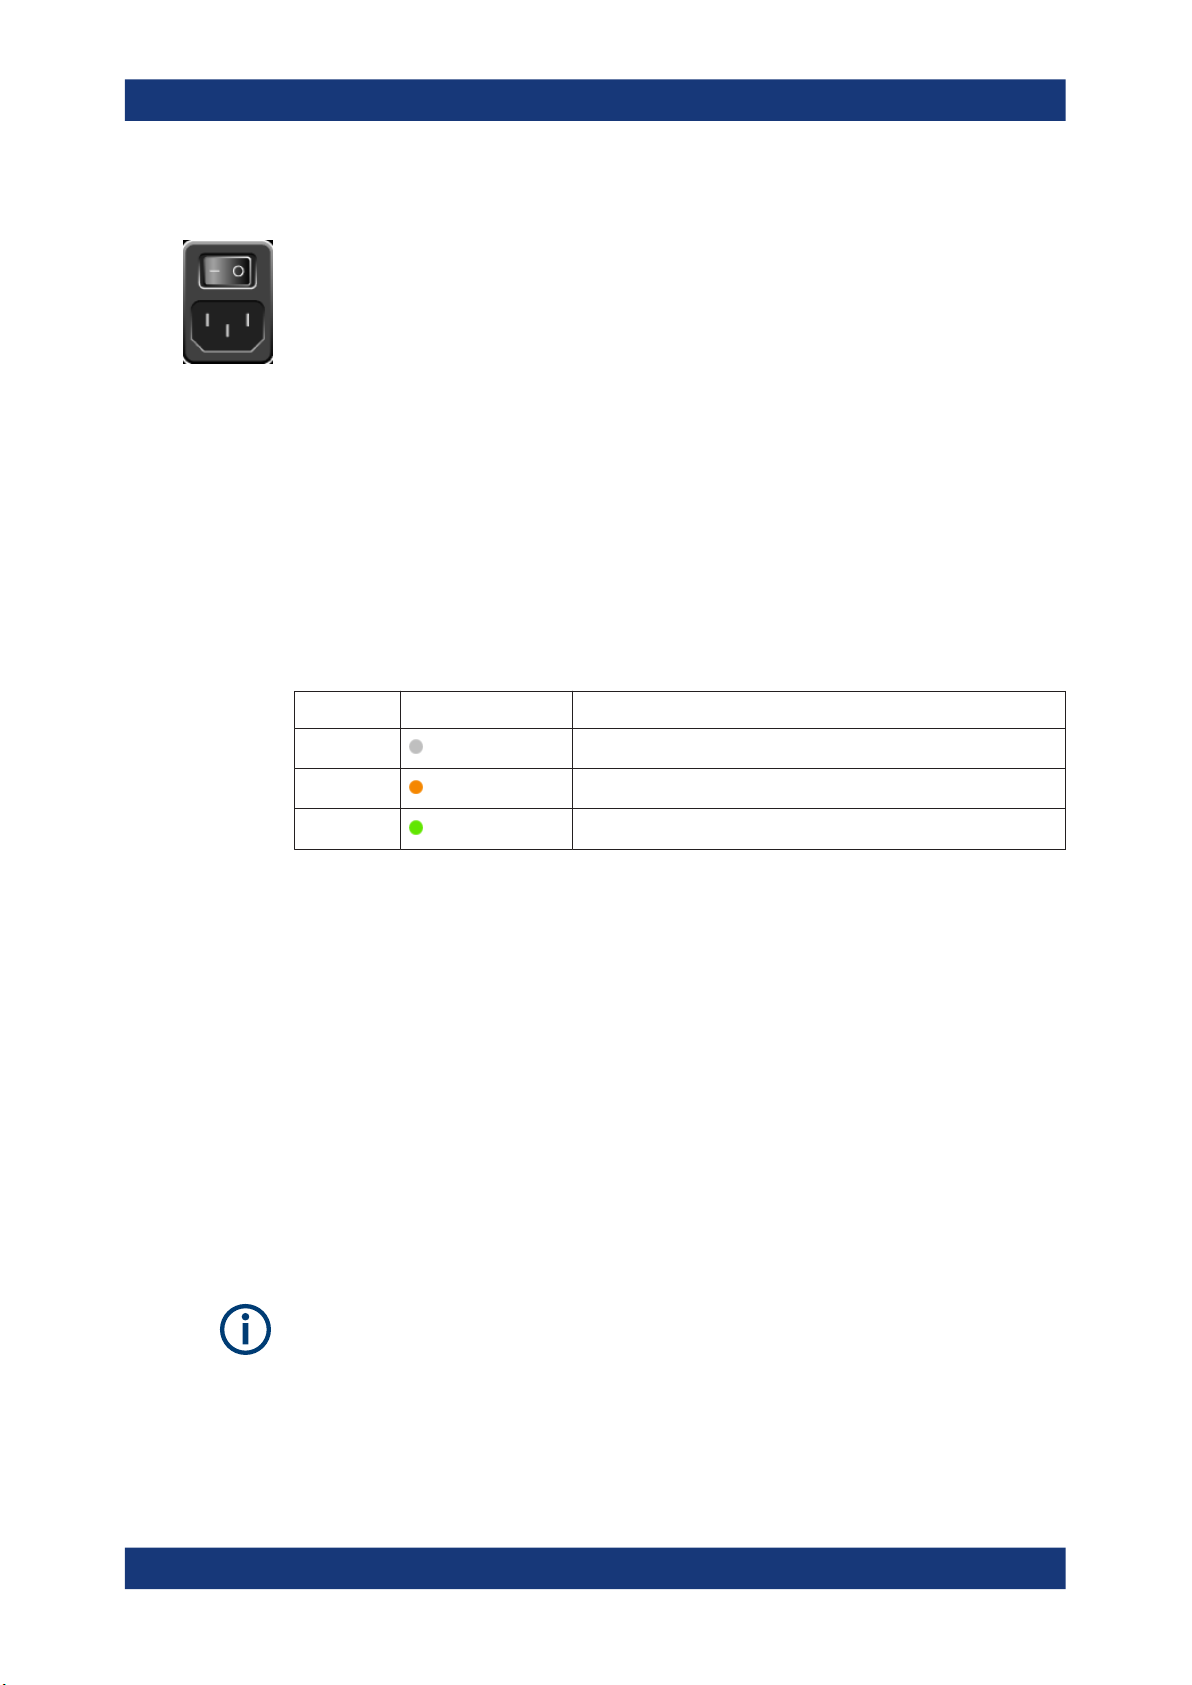
For details on the connector, refer to Chapter 4.2.2, "AC Power Supply Connection and
Main Power Switch", on page 45.
Table 3-1: Overview of power states
Status LED on Power key Position of main power switch
Off
Standby
Ready
gray
orange
green
[0]
[I]
[I]
To switch on the R&S FSWP
The R&S FSWP is off but connected to power.
1. Set the switch on the power supply to position [I].
See Chapter 4.2.2, "AC Power Supply Connection and Main Power Switch",
on page 45.
The LED of the Power key is orange.
See Chapter 4.1.2, "Power Key", on page 36.
2. Press the Power key.
See Table 3-1.
The LED changes to green.
The R&S FSWP boots.
After booting, the instrument is ready for operation.
Warm-up time for OCXO
When the instrument is switched on, the OCXO requires an extended warm-up time
(see data sheet).
24User Manual 1177.5633.02 ─ 13
Page 25

R&S®FSWP
Preparing for Use
Connecting to LAN
To shut down the product
The product is in the ready state.
► Press the [Power] key.
The operating system shuts down. The LED changes to orange.
If the instrument temperature exceeds the limit specified in the data sheet, the
R&S FSWP automatically shuts down to protect the instrument from damage.
To disconnect from power
The R&S FSWP is in the standby state.
NOTICE! Risk of data loss. If you disconnect the product from power when it is in
1.
the ready state, you can lose settings and data. Shut it down first.
Set the switch on the power supply to position [0].
See Chapter 4.2.2, "AC Power Supply Connection and Main Power Switch",
on page 45.
The LED of the standby key is switched off.
2. Disconnect the R&S FSWP from the power source.
3.7 Connecting to LAN
You can connect the instrument to a LAN for remote operation via a PC.
Provided the network administrator has assigned you the appropriate rights and adapted the Windows firewall configuration, you can use the interface, for example:
●
To transfer data between a controlling device and the test device, e.g. to run a
remote control program
●
To access or control the measurement from a remote computer using the "Remote
Desktop" application (or a similar tool)
●
To connect external network devices (e.g. printers)
●
To transfer data from a remote computer and back, e.g. using network folders
Network environment
Before connecting the product to a local area network (LAN), consider the following:
●
Install the latest firmware to reduce security risks.
●
For internet or remote access, use secured connections, if applicable.
●
Ensure that the network settings comply with the security policies of your company.
Contact your local system administrator or IT department before connecting your
product to your company LAN.
●
When connected to the LAN, the product may potentially be accessed from the
internet, which may be a security risk. For example, attackers might misuse or
damage the product. For more information about IT security and how to operate
25User Manual 1177.5633.02 ─ 13
Page 26

R&S®FSWP
Preparing for Use
Connecting a Keyboard
the product in a secure LAN environment, see the Rohde & Schwarz white paper
1EF96: Malware Protection Windows 10.
NOTICE! Risk of network failure.
►
Consult your network administrator before performing the following tasks:
● Connecting the instrument to the network
● Configuring the network
● Changing IP addresses
● Exchanging hardware
Errors can affect the entire network.
Connect the R&S FSWP to the LAN via the LAN interface on the rear panel of the
instrument.
Windows automatically detects the network connection and activates the required
drivers.
By default, the R&S FSWP is configured to use DHCP and no static IP address is
configured.
The default instrument name is <Type><variant>-<serial_number>, for example,
FSWP26-123456. For information on determining the serial number, see Chap-
ter 4.2.15, "Device ID", on page 49.
For more information on LAN configuration, see the R&S FSWP user manual.
3.8 Connecting a Keyboard
The keyboard is detected automatically when it is connected. The default input language is English – US.
However, you can also connect foreign language keyboards; currently the following
languages are supported for the R&S FSWP:
●
German
●
Swiss
●
French
●
Russian
To configure the keyboard language
1. To access the Windows operating system, press the Windows key on the external
keyboard.
2. Select "Start > Settings > Time & language > Region & language > Add a language" .
26User Manual 1177.5633.02 ─ 13
Page 27

R&S®FSWP
3.9 Connecting an External Monitor
Preparing for Use
Connecting an External Monitor
You can connect an external monitor (or projector) to the "DVI" or "Display port" connector on the rear panel of the R&S FSWP (see also Chapter 4.2.3, "Display Port and
DVI", on page 45).
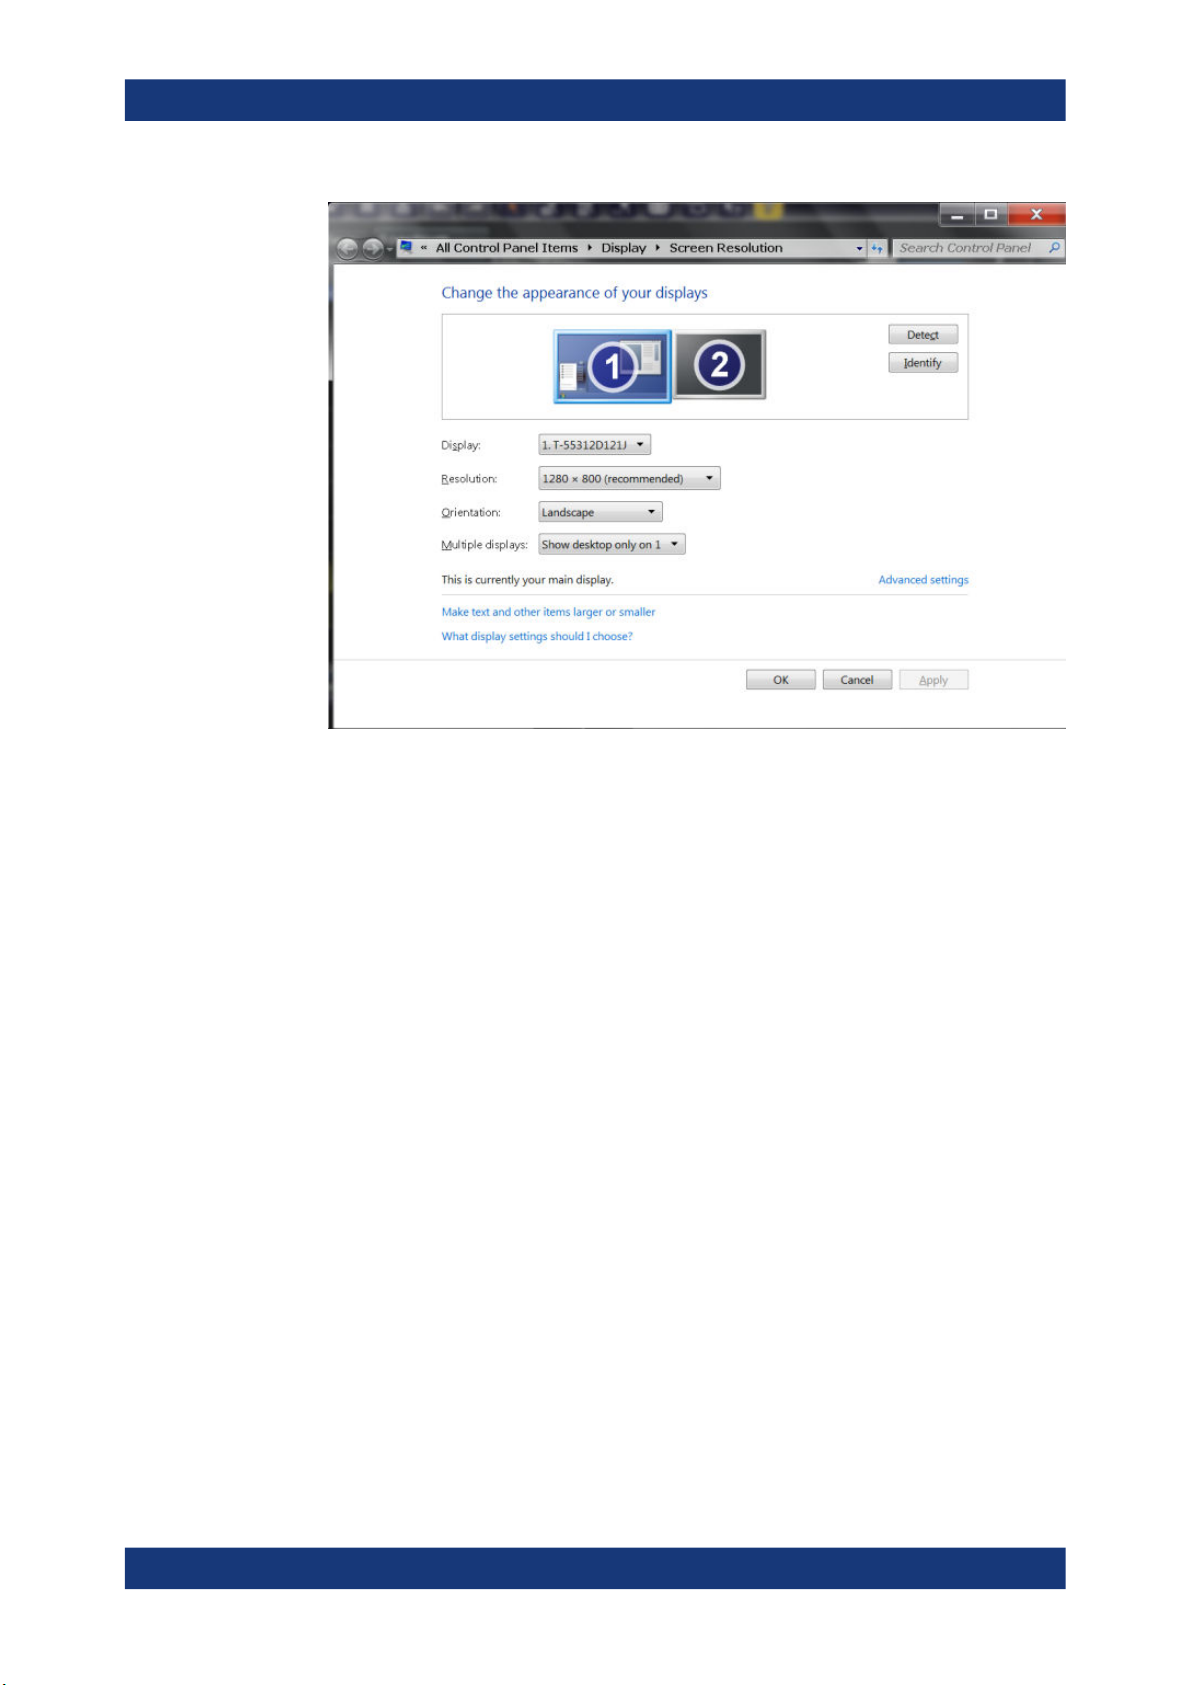
Screen resolution and format
The touchscreen of the R&S FSWP is calibrated for a 16:10 format. If you connect a
monitor or projector using a different format (e.g. 4:3), the calibration is not correct and
the screen does not react to your touch actions properly.
The touchscreen has a screen resolution of 1280x800 pixels. Usually, the display of
the external monitor is a duplicate of the instrument's monitor.
If you configure the external monitor to be used as the only display in the Windows
configuration dialog box ("Show only on 2"), the maximum screen resolution of the
monitor is used. In this case, you can maximize the R&S FSWP application window
and see even more details. You cannot change the monitor's screen resolution via the
standard Windows configuration dialog box.
However, you can restore the default instrument resolution (1280x800) on the monitor
using the instrument function "Setup" > "Display" > "Configure Monitor" > "Screen Resolution: Restore to default".
The R&S FSWP supports a minimum resolution of 1280x768 pixels.
1. Connect the external monitor to the R&S FSWP.
2. Press the [Setup] key.
3. Press the "Display" softkey.
4. Select the "Configure Monitor" tab in the "Display" dialog box.
The standard Windows "Screen Resolution" dialog box is displayed.
27User Manual 1177.5633.02 ─ 13
Page 28
R&S®FSWP
Preparing for Use
Windows Operating System
5. Select the instrument for display:
● "Display 1" : internal monitor only
● "Display 2" : external monitor only
● "Duplicate" : both internal and external monitor
6. Tap "Apply" to try out the settings before they are accepted permanently, then you
can easily return to the previous settings, if necessary.
7. Select "OK" if the settings are suitable.
3.10 Windows Operating System
The instrument contains the Microsoft Windows operating system which has been configured according to the instrument's features and needs. Changes in the system setup
are only required when peripherals like a keyboard or a printer are installed or if the
network configuration does not comply with the default settings. After the R&S FSWP
is started, the operating system boots and the instrument firmware is started automatically.
Tested software
The drivers and programs used on the instrument under Microsoft Windows are adapted to the instrument. Only install update software released by Rohde & Schwarz to
modify existing instrument software.
28User Manual 1177.5633.02 ─ 13
Page 29

R&S®FSWP
Preparing for Use
Windows Operating System
You can install additional software on the instrument; however, additional software can
impair instrument function. Thus, run only programs that Rohde & Schwarz has tested
for compatibility with the instrument software.
The following program packages have been tested:
●
Symantec Endpoint Security – virus-protection software
●
FileShredder - for reliable deletion of files on the hard disk
Service packs and updates
Microsoft regularly creates security updates and other patches to protect Windowsbased operating systems. These are released through the Microsoft Update website
and associated update server. Instruments using Windows, especially those that connect to a network, should be updated regularly.
Firewall settings
A firewall protects an instrument by preventing unauthorized users from gaining access
to it through a network. Rohde & Schwarz highly recommends the use of the firewall on
your instrument. Rohde & Schwarz instruments are shipped with the Windows firewall
enabled and preconfigured in such a way that all ports and connections for remote
control are enabled.
Note that changing firewall settings requires administrator rights.
Virus protection
Take appropriate steps to protect your instruments from infection. Use strong firewall
settings and scan any removable storage device used with a Rohde & Schwarz instrument regularly. It is also recommended that you install anti-virus software on the instrument. Rohde & Schwarz does NOT recommend running anti-virus software in the
background ("on-access" mode) on Windows-based instruments, due to potentially
degrading instrument performance. However, Rohde & Schwarz does recommend running it during non-critical hours.
For details and recommendations, see the following Rohde & Schwarz white paper:
●
1EF96: Malware Protection Windows 10
To access the "Start" menu
The Windows "Start" menu provides access to the Microsoft Windows functionality and
installed programs.
► Select the "Windows" icon in the toolbar, or press the "Windows" key or the [CTRL
+ ESC] key combination on the (external) keyboard.
The "Start" menu and the Windows taskbar are displayed.
29User Manual 1177.5633.02 ─ 13
Page 30

R&S®FSWP
3.11 Logging On
Preparing for Use
Logging On
The Windows taskbar also provides quick access to commonly used programs, for
example Paint or WordPad. IECWIN, the auxiliary remote control tool provided free of
charge and installed by Rohde & Schwarz, is also available from the taskbar or "Start"
menu.
For details on the IECWIN tool, see the "Network and Remote Control" chapter of the
R&S FSWP user manual.
All necessary system settings can be defined in the "Start > Settings" menu.
For required settings, refer to the Microsoft Windows documentation and to the hardware description.
Microsoft Windows requires that users identify themselves by entering a user name
and password in a login window. By default, the R&S FSWP provides two user
accounts:
●
"Instrument": a standard user account with limited access
●
"Admin" or "Administrator" (depends on firmware image): an administrator
account with unrestricted access to the computer/domain
Some administrative tasks require administrator rights (e.g. the configuration of a LAN
network). Refer to the description of the basic instrument Setup ([Setup] menu) to find
out which functions are affected.
Passwords
For all default user accounts, the initial password is 894129. Note that this password is
very weak, and it is recommended that you change the password for both users after
initial login. An administrator can change the password in Microsoft Windows for any
user at any time via "Start > Settings > Account > SignIn Options > Password >
Change".
Auto-login
When shipped, the instrument automatically logs on the default "Instrument" user to
Microsoft Windows using the default password. This function is active until an administrator explicitly deactivates it or changes the password.
Changing the password and use of auto-login function
Note that when you change the default password, the default auto-login function no
longer works!
In this case, you must enter the new password manually to log on.
30User Manual 1177.5633.02 ─ 13
Page 31

R&S®FSWP
Preparing for Use
Checking the Supplied Options
Adapting the auto-login function to a new password
If you change the password that is used during auto-login, this function no longer
works. Adapt the settings for the auto-login function first.
1. Open the C:\R_S\INSTR\USER\user\AUTOLOGIN.REG file in any text editor
(e.g. Notepad).
2. In the line "DefaultPassword"="894129", replace the default password
(894129) by the new password for automatic login.
3. Save the changes to the file.
4. In the Windows "Start" menu, select "Run".
The "Run" dialog box is displayed.
5. Enter the command C:\R_S\INSTR\USER\user\AUTOLOGIN.REG.
6. Press the [ENTER] key to confirm.
The auto-login function is reactivated with the changed password. It will be applied
the next time the instrument is switched on.
Switching users when using the auto-login function
Which user account is used is defined during login. If auto-login is active, the login window is not displayed. However, you can switch the user account to be used even when
the auto-login function is active.
1. Select the "Windows" icon in the toolbar to access the operating system of the
R&S FSWP (see also "To access the "Start" menu" on page 29).
2. Press [CTRL] + [ALT] + [DEL], then select "Sign out".
The "Login" dialog box is displayed, in which you can enter the different user
account name and password.
For information on deactivating and reactivating the auto-login function, see "Deactivat-
ing the auto-login function" on page 377.
3.12 Checking the Supplied Options
The instrument can be equipped with both hardware and firmware options. To check
whether the installed options correspond to the options indicated on the delivery note,
proceed as follows.
1. Press the [SETUP] key.
2. Press the "System Config" softkey.
3. Switch to the "Versions + Options" tab in the "System Configuration" dialog box.
A list with hardware and firmware information is displayed.
31User Manual 1177.5633.02 ─ 13
Page 32

R&S®FSWP
3.13 Performing a Self-Alignment
Preparing for Use
Considerations for Test Setup
4. Check the availability of the hardware options as indicated in the delivery note.
When strong temperature changes occur in the environment of the R&S FSWP, or after
updating the firmware, you have to perform a self-alignment to align the data to a reference source.
During self-alignment, do not connect a signal to the RF input connector. Running a
self-alignment with a signal connected to the RF input can lead to false measurement
results.
Performing a self-alignment
Before performing this functional test, make sure that the instrument has reached its
operating temperature (for details, refer to the data sheet).
A message in the status bar ( "Instrument warming up..." ) indicates that the operating
temperature has not yet been reached.
Depending on the installation settings, an automatic self-alignment is performed each
time the instrument is switched on. A dialog is displayed indicating how much warm-up
time is still required before self-alignment can be performed.
1. Press the [Setup] key.
2. Press the "Alignment" softkey.
3. Select the "Start Self Alignment" button in the "Alignment" dialog box.
Once the system correction values have been calculated successfully, a message
is displayed.
To display the alignment results again later
●
Press the [SETUP] key.
●
Press the "Alignment" softkey.
3.14 Considerations for Test Setup
Cable selection and electromagnetic interference (EMI)
Electromagnetic interference (EMI) can affect the measurement results.
To suppress electromagnetic radiation during operation:
●
Use high-quality shielded cables, for example, double-shielded RF and LAN
cables.
●
Always terminate open cable ends.
32User Manual 1177.5633.02 ─ 13
Page 33

R&S®FSWP
Preparing for Use
Considerations for Test Setup
●
Ensure that connected external devices comply with EMC regulations.
Signal input and output levels
Information on signal levels is provided in the data sheet. Keep the signal levels within
the specified ranges to avoid damage to the R&S FSWP and connected devices.
33User Manual 1177.5633.02 ─ 13
Page 34

R&S®FSWP
4.1 The Front Panel
Instrument Tour
The Front Panel
4 Instrument Tour
On the instrument tour, you can learn about the different control elements and connectors on the front and back panel of the R&S FSWP.
● The Front Panel...................................................................................................... 34
● The Rear Panel.......................................................................................................44
This chapter describes the front panel, including all function keys and connectors.
17
1
2 3 4 5 6 7 9 11 1312 14108
Figure 4-1: Front panel of the R&S FSWP
1 = Display (touchscreen)
2 = Power key
3 = System control keys
4 = USB 2.0 interfaces
5 = Power sensor connector
6 = Probe power connector
7 = DC power connectors
8 = Baseband connectors
9 = Signal source output (optional)
10 = External LO input (optional)
11 = External mixer ports (optional)
12 = Noise source control
13 = RF input
14 = Trigger in- and output
15 = Keypad
16 = Navigation control
17 = Function keys
16
15
● Display (Touchscreen).............................................................................................35
● Power Key...............................................................................................................36
● System Control Keys...............................................................................................36
34User Manual 1177.5633.02 ─ 13
Page 35

R&S®FSWP
4.1.1 Display (Touchscreen)
Instrument Tour
The Front Panel
● The Function Keys.................................................................................................. 37
● The Keypad.............................................................................................................38
● Navigation Control...................................................................................................39
● RF Input (50 Ω)....................................................................................................... 40
● Signal Source Output..............................................................................................41
● USB Ports............................................................................................................... 41
● Power Sensors........................................................................................................41
● Probe Power Connector (3 Pins)............................................................................ 42
● Noise Source Control..............................................................................................42
● Trigger Input and Output.........................................................................................42
● Baseband Input.......................................................................................................42
● External Mixer (Optional)........................................................................................ 43
● DC Power Supply....................................................................................................43
● LO AUX Input (Optional)......................................................................................... 43
The touchscreen on the front panel of the R&S FSWP displays the measurement
results. Additionally, the screen display provides status and setting information and
allows you to switch between various measurement tasks. The screen is touch-sensitive, offering an alternative means of user interaction for quick and easy handling of the
instrument.
1 2 3 7 9
= Toolbar: contains general functionality of the firmware.
1
2 = Channel tab: contains measurement channel.
3 = Channel bar: shows measurement settings.
4 = Result display: contains measurement results.
5 = Window title bar: contains diagram-specific (trace) information.
4 5
6
8
35User Manual 1177.5633.02 ─ 13
Page 36

R&S®FSWP
Instrument Tour
The Front Panel
6 = Status bar: contains system messages, progress bar and date and time.
7 = Input field.
8 = Diagram footer: contains diagram-specific information.
9 = Softkeys: provide access to measurement functions.
A touchscreen is a screen that is touch-sensitive, i.e. it reacts in a specified way when
a particular element on the screen is tapped by a finger or a pointing device, for example. Any user interface elements that can be clicked on by a mouse pointer can also be
tapped on the screen to trigger the same behavior, and vice versa.
Using the touchscreen, the following tasks (among others) can be performed by the tap
of your finger:
●
Changing a setting
●
Changing the display
●
Moving a marker
●
Zooming into a diagram
●
Selecting a new evaluation method
●
Scrolling through a result list
●
Saving or printing results and settings
To imitate a right-click by mouse using the touchscreen, for example to open a contextsensitive menu for a specific item, press the screen for about 1 second.
4.1.2 Power Key
The power key is on the lower left corner of the front panel. It starts up and shuts down
the instrument.
See also "Connecting to power" on page 16.
4.1.3 System Control Keys
System control keys provide access to the basic instrument configuration.
Refer to the User Manual for an extensive description of the system configuration functionality.
Resets the instrument to its default configuration.
Selects a particular measurement application or operating mode.
36User Manual 1177.5633.02 ─ 13
Page 37

R&S®FSWP
4.1.4 The Function Keys
Instrument Tour
The Front Panel
Provides functionality to configure basic instrument characteristics, for example:
●
the LAN connection
●
the date and time
●
the display configuration
●
the reference frequency
●
firmware update and application installation
●
service functions
●
transducer configuration
Provides access to the on-screen keyboard.
Turns full screen mode on and off.
Selects a window in split screen mode or browses through active windows in full
screen mode.
Function keys provide access to the most common measurement settings and functions.
Refer to the user manual for an extensive description of the measurement settings and
functions.
Provides functionality to define frequency parameters, for example:
●
the measurement range
●
the signal frequency
Provides functionality to configure the measurement range.
Provides functionality to configure amplitude or level characteristics, for example:
●
the attenuation
●
the input impedance
●
the scale of the level axis
●
the preamplifier
Provides functionality to automatically define various parameters like the level or frequency.
Provides functionality to define various filter bandwidths.
Provides functionality to configure the measurement, for example:
●
the measurement mode (single or continuous measurements)
●
the number of measurements
Provides functionality to configure data acquisition and analyze measured data, for
example:
●
the trace mode
●
the displayed result
n/a
37User Manual 1177.5633.02 ─ 13
Page 38

R&S®FSWP
Instrument Tour
The Front Panel
Provides functionality to activate and position absolute and relative markers (markers
and delta markers).
Performs a peak search for active markers.
If no marker is active, marker 1 is activated and the peak search is performed for it.
n/a
Provides functionality to position and control markers, for example:
●
to configure the marker search
●
to configure the peak excursion
Provides the measurement functions, for example:
●
the phase noise measurement
●
the AM noise measurement
●
the pulsed noise measurement
●
the spot noise vs tune measurement
Provides functionality to configure the measurement.
4.1.5 The Keypad
The alphanumeric keys allow you to enter alphanumeric characters where necessary
(for example in dialog boxes or input fields). The keypad containing the alphanumeric
keys also provides keys that select a particular unit.
...
Provides functionality to control display and limit lines.
Provides functionality to configure inputs and outputs.
Starts a measurement in single measurement mode.
Starts a measurement in continuous measurement mode.
Provide access to numbers and (special) characters.
Inserts a decimal point at the cursor position (".").
Changes the sign of a numeric value or inserts a dash character ("-") in case of
alphanumeric input.
38User Manual 1177.5633.02 ─ 13
Page 39

R&S®FSWP
Instrument Tour
The Front Panel
Select a particular unit for a numeric value. The labels on and next to the key state
the units it selects.
...
Pressing one of the unit keys also completes the entry of a numeric value. Note that
in case of level entries (dB, dBm etc.) or dimensionless values, all unit keys have the
value "1" as multiplying factor and thus work like the [ENTER] key..
Provides the following functions:
In dialog boxes:
●
Closes all kinds of dialog boxes if edit mode is not active.
●
Quits edit mode if it is active.
●
Selects the "Cancel" button when available.
In "Edit" dialog boxes:
●
If data entry has been started, it retains the original value and closes the dialog
box.
●
If data entry has not been started or has been completed, it closes the dialog
box.
Deletes the character to the left of the cursor (if an (alpha)numeric entry has been
started already.
Provides the following functions:
●
Completes the entry of input made with the alphanumeric keys (numeric or
alphanumeric) and accepts the input.
If you enter a numeric value that has a unit, the [ENTER] key works like the
[HZ/DB] key.
●
Selects the default or focused element in dialog boxes.
4.1.6 Navigation Control
Navigation control consists of a rotary knob and cursor keys. These keys allow you to
navigate within the display or within dialog boxes.
In addition to the rotary knob and the cursor keys, the navigation control also provides
undo / redo functionality.
Rotary knob
The rotary knob allows you to do several things:
●
It increases or decreases any kind of numeric value. In most cases, the rotary knob
changes numeric values with a fixed step size.
Turning it to the right corresponds to an increase, turning it to the left to a decrease
of a numeric value.
●
It works like a cursor key in dialog boxes or lists (for example dropdown menus). In
that case you can navigate to one of the items with the rotary knob. If the dialog
box covers more than one screen page, it also scrolls through the dialog box.
Turning it to the right corresponds to a downward movement. Moving it to the left to
an upward movement.
●
It moves around markers and other graphical elements on the screen. In most
cases, the step size is fix.
●
Pressing the rotary knob has the same effect as pressing the [ENTER] key as it
confirms an entry or selection.
39User Manual 1177.5633.02 ─ 13
Page 40

R&S®FSWP
Instrument Tour
The Front Panel
Cursor keys
The cursor keys allow you to do several things:
●
The up and down keys increase or decrease any kind of numeric value if an input
field is active.
The cursor keys change numeric values with a fixed step size.
●
The cursor keys navigate through dialog boxes or lists (for example dropdown
menus).
●
The left and right keys move the cursor in an input field in the corresponding direction.
●
The up and down keys move markers around.
The step size is fix.
●
The cursor keys allow you to navigate to a cell in a table.
●
The cursor keys move a scroll bar (vertical or horizontal) in dialog boxes that have
one.
Undo and redo functionality
The [UNDO] function is not available after a [PRESET] or "RECALL" operation. When
these functions are used, the history of previous actions is deleted.
4.1.7 RF Input (50 Ω)
The RF Input allows you to connect a device under test (or DUT) to the R&S FSWP,
usually via cable and an appropriate connector (for example a male N connector).
The supported frequency range depends on the R&S FSWP model you have. Refer to
the datasheet for details.
The RF Input also serves as an attenuator in case you are measuring signal with high
levels. The supported attenuation range depends on the R&S FSWP model you have.
Refer to the datasheet for details..
Reverts the software to an older state by erasing the last change you have applied.
The undo function is useful, for example, if you are performing a measurement with
several markers and a limit line and accidentally select a different measurement. In
this case, a lot of settings would be lost. However, if you press [UNDO] immediately
afterwards, the previous status is retrieved.
Reverses an undo action or repeats the most recently performed action.
40User Manual 1177.5633.02 ─ 13
Page 41

R&S®FSWP
4.1.8 Signal Source Output
Instrument Tour
The Front Panel
Risk of instrument damage
Do not overload the RF input. For maximum allowed values, see the data sheet.
When measuring unknown signals, always apply attenuation to protect the input mixer.
Otherwise, the input mixer may be damaged or destroyed.
For AC coupling, a DC input voltage of 50 V must never be exceeded. For DC cou-
pling, DC voltage must not be applied at the input. In both cases, noncompliance will
destroy the input mixers.
The optional "Signal Source" output allows you to generate a signal that can be fed
into the DUT or other external accessories like frequency dividers or amplifiers. You
can connect the DUT or accessories with a cable that has a male N connector.
Risk of damage to the R&S FSWP
The maximum supported reverse power is 30 dBm. Make sure that this value is not
exceeded to avoid damage to the R&S FSWP.
The maximum DC output voltage is 0 V.
For details on configuring the signal source output and generating a signal, see the
User Manual.
4.1.9 USB Ports
The three USB ports on the front panel (type A) allow you to connect devices like keyboards, mouses or memory sticks.
The R&S FSWP provides additional USB ports (including one type B port) on the rear
panel.
All USB ports support standard 2.0.
4.1.10 Power Sensors
The female Lemosa connector allows you to connect power sensors of the R&S NRPZxy family to the R&S FSWP.
For an extensive list of supported power sensors, refer to the data sheet.
For details on configuring and using power sensors, see the User Manual.
41User Manual 1177.5633.02 ─ 13
Page 42

R&S®FSWP
4.1.11 Probe Power Connector (3 Pins)
4.1.12 Noise Source Control
Instrument Tour
The Front Panel
The Probe Power connector allows you to supply external equipment with power (for
example probes or transducers).
The three-pinned probe power connector supports supply voltages from +15 V to
-12.6 V and ground. The maximum permissible current is 150 mA. This probe power
connector is suitable, for example, for high-impedance probes.
The female BNC connector labeled "Noise Source" allows you to connect and control
an external noise source, and supplies the required supply voltage.
You can use a noise source, for example, to measure the noise figure and gain of
amplifiers and frequency converting devices.
Conventional noise sources require a voltage of +28 V in order to be switched on and
0 V to be switched off. The output supports a maximum load of 100 mA.
4.1.13 Trigger Input and Output
The female BNC connector labeled "Trigger Input / Output" allows you to receive an
external trigger signal or send a trigger signal to another device.
When you are using the connector as a trigger input, you can apply voltages in the
range from 0.5 V to 3.5 V (the default value is 1.4 V). The typical input impedance is
10 kΩ.
When you are using the connector as a trigger output, the TTL compatible signal is
transmitted (0 V / 5 V).
Note that you can find another connector for trigger input and output on the rear panel.
For more information about controlling and configuring trigger input and output, refer to
the User Manual.
4.1.14 Baseband Input
The two connectors labeled "Baseband Input 50 Ω" are two female BNC connectors
that you can use to connect a DUT for Baseband Noise measurements.
When you perform measurements with two external mixers, the "Ch2" connector is the
IF input for the second mixer. This function is available with the optional external mixer
support.
42User Manual 1177.5633.02 ─ 13
Page 43

R&S®FSWP
4.1.15 External Mixer (Optional)
Instrument Tour
The Front Panel
Risk of instrument damage
Do not overload the baseband input. An overload condition can damage or destroy the
baseband inputs.
For maximum allowed values, see the data sheet.
The two (optional) SMA connectors (LO OUT/IF IN and IF IN) allow you to connect
external mixers.
External mixers increase the available frequency range. The way to connect an external mixer depends on the type of mixer and the test setup. For more information about
connecting and controlling external mixers refer to the user manual.
If not in use, it is recommended to cover the SMA connectors with the provided protective caps.
4.1.16 DC Power Supply
The female BNC connectors labeled "V
external devices, for example a DUT or an external reference oscillator, with the
required voltage.
The V
connector provides supply voltage from 0 V to +16 V, for example to pro-
Supply
vide voltage for an oscillator. The supported maximum current is 2000 mA.
The V
connector provides tuning voltage from ‑10 V to +28 V. The supported maxi-
Tune
mum current is 20 mA.
The V
connector provides DC voltage from ‑10 V to +10 V. The supported maximum
Aux
current is 100 mA.
For more information about configuring the DC Power supply, refer to the User Manual.
4.1.17 LO AUX Input (Optional)
The two optional connectors labeled "LO AUX Input - Ch1" and "LO AUX Input - Ch2"
are two female SMA connectors that you can use to connect an external local oscillator
(LO). The external LO requires two connectors ("Ch1" and "Ch2") to work properly.
The "LO AUX Input" connectors are part of the optional Signal Source.
Tune
", "V
" and "V
Aux
" allow you to supply
Supply
43User Manual 1177.5633.02 ─ 13
Page 44

R&S®FSWP
4.2 The Rear Panel
Instrument Tour
The Rear Panel
Risk of instrument damage
Do not overload the LO AUX input. An overload condition can damage or destroy the
inputs.
For maximum allowed values, see the data sheet.
The rear panel contains various connectors for various purposes.
6 7
Figure 4-2: Rear panel of the R&S FSWP
1 = Removable hard disk
2 = AC power connector and power switch
3 = DisplayPort and DVI
4 = LAN interface
5 = USB ports
6 = IF / Video / Demod output
7 = Trigger in- / output
8 = Sync trigger input and output
9 = AUX port
10 = GPIB interface
11 = Ref input and output
1 23 4 5
8 9 10
11
For information about the trigger in- and output available on the rear panel, see Chap-
ter 4.1.13, "Trigger Input and Output", on page 42.
The digital baseband in- and outputs shown in the image above are not supported by
the R&S FSWP.
44User Manual 1177.5633.02 ─ 13
Page 45

R&S®FSWP
4.2.1 Removable Hard Disk
Instrument Tour
The Rear Panel
● Removable Hard Disk............................................................................................. 45
● AC Power Supply Connection and Main Power Switch.......................................... 45
● Display Port and DVI...............................................................................................45
● LAN......................................................................................................................... 46
● USB Ports............................................................................................................... 46
● IF / Video / Demod Output...................................................................................... 46
● IF Wide Out.............................................................................................................46
● Sync Trigger Input and Output................................................................................47
● AUX Port................................................................................................................. 47
● GPIB Interface.........................................................................................................47
● External Generator Control (Optional).................................................................... 47
● OCXO (Optional).....................................................................................................48
● REF INPUT / REF OUTPUT................................................................................... 48
● Labels on R&S FSWP.............................................................................................49
● Device ID.................................................................................................................49
The removable hard disk is accessible from the rear of the instrument.
In addition to the operating system and the firmware, the R&S FSWP also stores measurement data on that disk. When you remove the hard disk, you can store it and the
data on it somewhere secure.
4.2.2 AC Power Supply Connection and Main Power Switch
An AC power supply connector and main power switch are located in a unit on the rear
panel of the instrument.
Main power switch function:
Position 1: The instrument can be started via the Power key on the front panel.
The (optional) OCXO reference frequency is warmed up.
Position O: The entire instrument is disconnected from the AC power supply.
For details, refer to "Connecting to power" on page 16 and Chapter 3.5, "Connecting
the AC Power", on page 23.
4.2.3 Display Port and DVI
You can connect an external monitor or other display device to the R&S FSWP to provide an enlarged display. Two different types of connectors are provided for this purpose:
●
Display Port
●
DVI (digital visual interface)
For details, see Chapter 3.9, "Connecting an External Monitor", on page 27.
45User Manual 1177.5633.02 ─ 13
Page 46

R&S®FSWP
4.2.4 LAN
4.2.5 USB Ports
Instrument Tour
The Rear Panel
The R&S FSWP is equipped with a 1 GBit Ethernet IEEE 802.3u network interface with
Auto-MDI(X) functionality. The assignment of the RJ-45 connector supports twistedpair category 5 UTP/STP cables in a star configuration (UTP stands for unshielded
twisted pair, and STP for shielded twisted pair).
For details, see Chapter 13, "Network and Remote Operation", on page 311.
The four USB ports on the rear panel (type A) allow you to connect devices like keyboards, mouses or memory sticks.
The male USB connector (type B) allows you to connect the R&S FSWP to a computer
and establish a remote control connection, for example.
All USB connectors support standard 2.0.
4.2.6 IF / Video / Demod Output
The two female BNC connectors can be used for various outputs:
●
Output of the intermediate frequency (IF)
●
Output of the video signal
Details about configuring the output type and characteristics are part of the user manual.
Note that you can use this connector for applications available with the optional spectrum analyzer hardware and analog modulation analysis application.
4.2.7 IF Wide Out
You can extend the signal analysis bandwidth of the R&S FSWP by installing a hardware option. The bandwidth extension allows for a linear bandwidth up to 320 MHz.
You can activate and deactivate the bandwidth extension manually in the I/Q analyzer
that is integral part of the optional spectrum analyzer (R&S FSWP-B1) or other optional
applications that require the spectrum analyzer hardware.
Together with the bandwidth extension an additional IF output connector is provided (if
wide output). As opposed to the default IF / Video / Demod Output connector, the IF
output frequency of the optional connector cannot be defined manually, but is determined automatically depending on the center frequency. For details on the used frequencies, see the data sheet. The IF Wide Output connector is used automatically
when the bandwidth extension is activated (i.e. for bandwidths > 80 MHz).
46User Manual 1177.5633.02 ─ 13
Page 47

R&S®FSWP
4.2.8 Sync Trigger Input and Output
4.2.9 AUX Port
Instrument Tour
The Rear Panel
The "Sync Trigger Input / Output" connectors allow you to synchronize several devices
(for example two R&S FSWPs) with respect to the trigger signal, but also the reference
frequency. A 100 MHz signal can be output as a trigger or reference signal to another
device, and an external trigger or reference signal can be received at the input connector by the R&S FSWP.
The 9 pole SUB-D male connector provides control signals for controlling external devices. The voltage levels are TTL compatible (max. 5 V).
Pin Signal Description
1 +5 V / max. 250 mA Supply voltage for external circuits
2 to 7 I/O Control lines for user ports (see User Manual)
8 GND Ground
9 READY FOR TRIGGER Signal indicating that the instrument is ready to
Short-circuit hazard
Always observe the designated pin assignment. A short-circuit can damage the port.
4.2.10 GPIB Interface
The GPIB interface is in compliance with IEEE488 and SCPI. A computer for remote
control can be connected via this interface. To set up the connection, a shielded cable
is recommended. For more details refer to "Setting Up Remote Control" in the User
Manual.
4.2.11 External Generator Control (Optional)
The optional "External Generator Control" provides an additional GPIB interface and
AUX port.
The GPIB connector can be used to connect an external generator to the R&S FSWP.
receive a trigger signal (Low active = 0 V)
The AUX port is required for TTL synchronization, if supported by the generator (see
Chapter 4.2.9, "AUX Port", on page 47).
For details on connecting an external generator see the "External Generator Control"
section of the R&S FSWP User Manual.
47User Manual 1177.5633.02 ─ 13
Page 48

R&S®FSWP
4.2.12 OCXO (Optional)
4.2.13 REF INPUT / REF OUTPUT
Instrument Tour
The Rear Panel
This optional OCXO generates a 10 MHz reference signal with a very precise frequency. If installed, and if no external signal is used, this signal is used as an internal
reference. It can also be used to synchronize other connected devices via the REF
OUTPUT 10 MHz connector.
Warm-up time for OCXO
When the instrument is switched on, the OCXO requires an extended warm-up time
(see data sheet).
The REF INPUT connectors are used to provide an external reference signal to the
R&S FSWP.
The REF OUTPUT connectors can be used to provide an external reference signal (or
the optional OCXO reference signal) from the R&S FSWP to other devices that are
connected to this instrument.
The REF OUTPUT connectors can be used to provide an external reference signal or
the OCXO reference signal from the R&S FSWP to other devices that are connected to
this instrument.
Various connectors are provided for different reference signals:
Connector Reference signal Usage
REF INPUT 1...20 MHz
0...10 dBm
REF OUTPUT 1...20 MHz
0...10 dBm
REF OUTPUT 10 MHz
10 dBm
REF INPUT 100 MHz
0...10 dBm
REF OUTPUT 100 MHz
6 dBm
REF OUTPUT 640 MHz
16 dBm
To provide an external reference signal on the
R&S FSWP.
To provide the same external reference signal received
by the REF INPUT 1...20 MHz connector to another
device, when available.
To provide the internal reference signal from the
R&S FSWP to another device continuously.
Also used to provide OCXO reference signal to another
device.
To provide an external reference signal on the
R&S FSWP.
To provide a 100 MHz reference signal from the
R&S FSWP to another device.
To provide a 640 MHz reference signal from the
R&S FSWP to another device.
48User Manual 1177.5633.02 ─ 13
Page 49

R&S®FSWP
4.2.14 Labels on R&S FSWP
Instrument Tour
The Rear Panel
SYNC TRIGGER
The SYNC TRIGGER connector can also be used to synchronize the reference frequency on several devices.
Labels on the casing inform about:
●
Personal safety, see "Meaning of safety labels" on page 17
●
Product and environment safety, see Table 4-1
●
Identification of the product, see Chapter 4.2.15, "Device ID", on page 49
Table 4-1: Labels regarding R&S FSWP and environment safety
Labeling in line with EN 50419 for disposal of electrical and electronic equipment after the product has come to the end of its service life. For more information, see the product user manual,
chapter "Disposal".
4.2.15 Device ID
The unique device identifier is provided as a barcode sticker on the rear panel of the
R&S FSWP.
It consists of the device order number and a serial number.
The serial number is used to define the default instrument name, which is:
<Type><variant>-<serial_number>
For example, FSWP26-123456.
The instrument name is required to establish a connection to the instrument in a LAN.
49User Manual 1177.5633.02 ─ 13
Page 50

R&S®FSWP
5 Trying Out the Instrument
Overview of tutorials
Initial setup:
●
"Preparing the R&S FSWP" on page 51
●
"Selecting the phase noise application" on page 51
●
"Performing a preset" on page 52
Measurement selection
●
"Selecting a measurement" on page 53
The phase noise measurement
●
"Measuring phase noise" on page 53
●
"Measuring amplitude noise" on page 54
●
"Measuring spurs" on page 54
●
"Measuring spot noise" on page 54
●
"Measuring integrated noise" on page 55
●
"Test setup for measurements with two external mixers" on page 55
Trying Out the Instrument
The additive noise measurement
●
"How to measure additive noise" on page 56
The baseband noise measurement
●
"How to measure baseband noise at the RF input" on page 59
●
"How to measure baseband noise at the baseband input" on page 59
The pulsed phase noise measurement
●
"How to measure the phase noise of a pulse" on page 60
The pulsed additive noise measurement
●
"How to measure pulsed additive noise with an internally modulated pulse"
on page 61
●
"How to measure pulsed additive noise with an externally modulated pulse"
on page 61
Trace smoothing
●
"How to smooth the trace by averaging the measurement data" on page 63
●
"How to smooth the trace by adjusting the number of XCORR operations"
on page 63
●
"How to smooth the trace graphically" on page 64
●
"How to remove spurs from a trace" on page 64
Integration ranges
●
"How to define integration ranges" on page 65
●
"How to correct integrated measurements" on page 66
50User Manual 1177.5633.02 ─ 13
Page 51

R&S®FSWP
Trying Out the Instrument
The cross-correlation gain indicator
●
"How to control the cross-correlation gain indicator (gray area)" on page 66
Miscellaneous evaluation tools
●
"Zooming into the results" on page 67
●
"Labeling traces" on page 67
●
"Exporting measurement data" on page 67
Frequency configuration
●
"How to define the measurement range" on page 68
●
"How to search for signals" on page 69
●
"How to define the capture range for the signal search" on page 69
●
"How to define a carrier frequency manually" on page 69
The half decade configuration table
●
"How to work with the half decade configuration table" on page 70
Pulsed measurement configuration
●
"How to configure a gate for measurements on pulses" on page 70
Initial Setup
Signal generation
●
"How to generate a CW signal" on page 71
●
"How to generate a pulse" on page 72
●
"How to use an external pulse modulator (configuration)" on page 72
DUT power supply
●
"How to supply DUTs with current or voltage" on page 73
● Initial Setup............................................................................................................. 51
● Measurements........................................................................................................ 52
● Result Evaluation.................................................................................................... 62
● Measurement Configuration....................................................................................68
5.1 Initial Setup
Preparing the R&S FSWP
1. Connect the R&S FSWP to an electrical outlet as described in Chapter 3.5, "Con-
necting the AC Power", on page 23.
2. Turn on the R&S FSWP as described in Chapter 3.6, "Switching the Instrument On
and Off", on page 24.
Selecting the phase noise application
1. Select the [MODE] key.
2. Select the "Phase Noise" item in the "Mode" dialog box.
51User Manual 1177.5633.02 ─ 13
Page 52

R&S®FSWP
Trying Out the Instrument
Measurements
There's more than one way to skin a cat
In most cases, the firmware of the R&S FSWP provides several ways to change measurement parameters. For example, the measurement range can be defined via the
[FREQ] key, the "MEAS CONFIG" key or the "Overview" dialog box.
All procedures in this chapter use the "Overview" dialog box as a starting point (when
possible). You can reach this dialog via the "Overview" softkey displayed at the bottom
of the softkey bar on the right side of the diagram area.
Performing a preset
Before configuring and starting a new measurement, it is always recommended to perform a preset and restore the default configuration of the instrument or the measurement application.
1. Select the [PRESET] key on the front panel to restore the default state of the
R&S FSWP.
2. Enter the "Overview" dialog box and select the "Preset Channel" item to restore the
default state of the selected measurement channel. All other measurement channels keep their custom configuration.
5.2 Measurements
Measuring the phase noise characteristics of a DUT requires a simple measurement
setup consisting of the R&S FSWP and a DUT.
Some measurements require additional equipment.
●
For additive noise measurements, the R&S FSWP must be equipped with the
optional Signal Source hardware.
●
For pulsed noise measurements, the R&S FSWP must be equipped with the
optional Pulsed Phase Noise Measurement application.
●
For pulsed additive noise measurements, the R&S FSWP must be equipped with
the optional Pulsed Phase Noise Measurement application and the optional Signal
Source hardware.
● Measurement Selection.......................................................................................... 53
● The Phase Noise Measurement..............................................................................53
● The Additive Noise Measurement...........................................................................56
● The Baseband Noise Measurement........................................................................58
● The Pulsed Phase Noise Measurement..................................................................60
● The Pulsed Additive Noise Measurement...............................................................60
● Adding Another Measurement Channel..................................................................62
52User Manual 1177.5633.02 ─ 13
Page 53

R&S®FSWP
5.2.1 Measurement Selection
Trying Out the Instrument
Measurements
Selecting a measurement
► Select the [MEAS] key.
The R&S FSWP opens a dialog box to select the measurement.
5.2.2 The Phase Noise Measurement
Test setup
Connect the DUT via cable to the RF input of the R&S FSWP as shown in the illustration.
required connections
optional connections
DUT
Figure 5-1: Typical test setup for basic noise measurements
Measuring phase noise
1. Perform a [PRESET].
The application automatically starts a continuous measurement.
First, it searches for a carrier signal (see How to search for signals). When one has
been found, it measures the noise characteristics of the DUT in the default measurement (or frequency offset) range.
If no carrier could be found, a corresponding error message is displayed in the status bar below the diagram.
R&S FSWP
V
supply
V
tune
V
aux
RF
2. You can stop the measurement (to analyze the measurement data in detail) with
the [RUN SGL] or [RUN CONT] key; [RUN SGL] performs one more measurement,
then stops, [RUN CONT] stops immediately.
53User Manual 1177.5633.02 ─ 13
Page 54

R&S®FSWP
Trying Out the Instrument
Measurements
By default, two traces are displayed: the first trace shows the smoothed data without spurs, the second trace the raw data including spurs.
Measuring amplitude noise
The test setup is the same as shown above.
The default phase noise trace shows the phase noise characteristics of the DUT. In
addition, you can also display the amplitude noise characteristics (or both together).
1. Enter the "Overview" dialog box and, from there, enter the "Analysis" dialog box.
2. Select the vertical "Trace" tab, and then the horizontal "Traces" tab.
3. For any trace, select "AM Noise" from the "Result" dropdown menu.
4. Start a new measurement to determine the AM noise of the DUT.
(The "Phase + AM Noise" menu item displays the sum of phase and amplitude
noise.)
Tip: If you'd like to view both results separately at the same time, open two phase
noise diagrams, one that shows the phase noise, the other showing the AM noise
and perform a measurement.
In addition to the graphical representation of the phase noise characteristics, the application also provides several tables that show specific phase noise characteristics.
Measuring spurs
In addition to the graphical display of spurs in the diagram (spikes on the trace), the
application also features a result display that contains a list of all detected spurs.
►
Open the SmartGrid ( ) and drag the "Spurious List" item from the evaluation bar
into the display.
The spurious list contains all detected spurs (including their characteristics) on all
traces and all windows.
More information:
● Spurious list
● Spur removal
Measuring spot noise
Spot noise is the phase noise or AM noise at a specific offset frequency (for example
the phase noise at 500 kHz).
►
Open the SmartGrid (
into the display.
) and drag the "Spot Noise" item from the evaluation bar
54User Manual 1177.5633.02 ─ 13
Page 55

R&S®FSWP
Trying Out the Instrument
Measurements
The table contains a list of spot noise values for selected frequency offsets (in the
default state, these are the decade edges) on each active trace.
More information:
● Spot noise table
Tip: You can define custom spot noise frequencies in the "Spot Noise" tab of the
"Noise Config" dialog box.
Measuring integrated noise
Integrated measurements show various noise characteristics, like the residual noise,
integrated over a certain offset frequency range.
►
Open the SmartGrid (
) and drag the "Integrated Measurements" item from the
evaluation bar into the display.
The table contains a list of integrated measurement results.
More information:
● Integrated measurements
Tip: You can define custom integration ranges in the "Integration Ranges" tab of
the "Noise Config" dialog box.
Test setup for measurements with two external mixers
Connect the DUT to the mixers and the mixers to the R&S FSWP as shown in the illustration.
required connections
optional connections
RF
DUT
RF
Mixer 1
Mixer 2
IF
LO
IF
LO
R&S FSWP
V
supply
V
tune
V
aux
Ext Mix IF In
Ext Mix LO Out
Baseband Ch2
Signal Source
1. Perform a [PRESET].
2. Select the [MEAS] key and select the "Phase Noise" measurement.
3. Enter the "Overview" dialog box, and from there, enter the "Input" dialog box.
4. Configure both mixers in the "External Mixer" tab of the "Input Source" dialog box.
More information:
● External mixer
5. Start the measurement ([RUN SGL] or [RUN CONT]).
55User Manual 1177.5633.02 ─ 13
Page 56

R&S®FSWP
5.2.3 The Additive Noise Measurement
Trying Out the Instrument
Measurements
Additive noise measurements require the signal source output that is available as an
optional hardware component.
Test setup
Connect the DUT via cable to the RF input and the signal source output of the
R&S FSWP as shown in the illustration.
required connections
optional connections
DUT
R&S FSWP
Signal
Source
V
supply
V
aux
RF
How to measure additive noise
1. Perform a [PRESET].
2. Select the "Additive Noise" measurement via the [MEAS] key.
3. Configure the signal source output as described in "How to generate a CW signal"
on page 71.
4. Start the measurement ([RUN SGL] or [RUN CONT]).
The application measures the additive noise on the output frequency of the signal
source in the default measurement (or frequency offset) range.
5. You can stop the measurement (to analyze the measurement data in detail) with
the [RUN SGL] or [RUN CONT] key; [RUN SGL] performs one more measurement,
then stops, [RUN CONT] stops immediately.
By default, two traces are displayed: the first trace shows the smoothed data without spurs, the second trace the raw data including spurs.
How to measure additive noise characteristics of amplifiers and dividers
Measuring the noise characteristics of amplifiers and dividers require a complex test
setup. The test setup depends on the type of DUT you are testing and is explained
here.
1. Measuring the additive noise of amplifiers with an external signal source
The test setup for for this measurement looks like this:
56User Manual 1177.5633.02 ─ 13
Page 57

R&S®FSWP
Trying Out the Instrument
Measurements
required connections
optional connections
Ext.
Source
Splitter
Splitter
Amplifier
R&S FSWP
LO Aux Ch1
LO Aux Ch1
RF
a) Configure the external signal source to generate the required fixed frequency.
b) Connect the first power splitter to the amplifier and the second power splitter.
c) Connect the amplifier to the RF input of the R&S FSWP.
d) Connect the second power splitter to both LO AUX input channels of the
R&S FSWP.
The power at each LO AUX input must have a level between 5 dBm and
10 dBm.
Except for the second power splitter, do not add any additional hardware to this
signal path.
e) If required, you can add an attenuator between the first splitter and the ampli-
fier to reduce the amplifier input level.
f) Select "Overview" > "Select Measurement" > "Additive Noise"
g) Select "Overview" > "Input" > "Input Source" > "Radio Frequency" > "Local
Oscillator" > "External"
h) Start the measurement ([RUN SINGLE] or [RUN CONT].
2. Measuring the additive noise of a divider with an external signal source
(without cross-correlation)
Ext.
Source
Splitter
required connections
optional connections
Divider
Divider
Splitter
R&S FSWP
LO Aux Ch1
LO Aux Ch1
RF
a) Configure the external signal source to generate the required fixed frequency.
b) Connect both frequency dividers to the first power splitter.
c) Connect the first frequency divider to the RF input of the R&S FSWP.
d) Connect the second power splitter to the other frequency divider and connect
the resulting signal streams to both LO AUX input channels of the R&S FSWP.
Regarding the frequency divider, make sure that both dividers are the same
model and have the same dividing factor.
Also make sure that the frequency fed into all inputs of the R&S FSWP is the
same.
e) Select "Overview" > "Select Measurement" > "Additive Noise"
57User Manual 1177.5633.02 ─ 13
Page 58

R&S®FSWP
Trying Out the Instrument
Measurements
f) Select "Overview" > "Input" > "Input Source" > "Radio Frequency" > "Local
Oscillator" > "External"
g) Start the measurement ([RUN SINGLE] or [RUN CONT].
The results in this measurements are 3 dB higher than they actually are. This is
because the divider at the LO AUX inputs is not cancelled out. To get the actual
results, subtract 3 dB from the results, for example by shifting the trace by this
amount ("Overview" > "Analysis" > "Traces" > "Traces" > "Trace Offset: 3 dB").
3. Measuring the additive noise of a divider with an external signal source
(with cross-correlation)
Ext.
Source
Splitter
required connections
optional connections
Splitter
Divider
Divider
Divider
R&S FSWP
LO Aux Ch1
LO Aux Ch1
RF
a) Configure the external signal source to generate the required fixed frequency.
b) Connect the first frequency dividers to the first power splitter.
c) Connect the first frequency divider to the RF input of the R&S FSWP.
d) Connect the second power splitter to the first power splitter.
e) Connect the other two frequency dividers to the second power splitter and con-
nect the resulting signal streams to both LO AUX input channels of the
R&S FSWP.
Regarding the frequency divider, make sure that all three dividers are the same
model and have the same dividing factor.
Also make sure that the frequency fed into all inputs of the R&S FSWP is the
same.
f) Select "Overview" > "Select Measurement" > "Additive Noise"
g) Select "Overview" > "Input" > "Input Source" > "Radio Frequency" > "Local
Oscillator" > "External"
h) Start the measurement ([RUN SINGLE] or [RUN CONT].
Compared to measurements on two dividers, this setup displays the correct
additive noise of the first frequency divider. The results do not have to be cor-
rected. The additive noise of the frequency dividers connected to the LO AUX
inputs is cancelled out because of the cross-correlation properties in the two
channels of the LO AUX input.
5.2.4 The Baseband Noise Measurement
Baseband Noise measurements measure the noise characteristics of a DUT over an
absolute frequency span (not relative to carrier).
58User Manual 1177.5633.02 ─ 13
Page 59

R&S®FSWP
Trying Out the Instrument
Measurements
You can use either the RF input for these measurements, or the baseband inputs. The
baseband inputs are DC coupled and extend the lower frequency range to 1 mHz (the
lowest supported frequency on the RF input is 1 MHz). Using the baseband input, you
can, for example, test the voltage supply of DC sources.
Test setup
required connections
optional connections
DUT
*
= See text below for instructions on how to use the baseband input.
R&S FSWP
V
supply
V
tune
V
aux
RF / BB*
How to measure baseband noise at the RF input
For baseband noise measurements on the RF input, proceed as follows.
1. Connect the DUT to the RF input.
2. Perform a [PRESET].
The application automatically starts a continuous measurement and measures the
noise characteristics of the DUT in the default frequency range.
3. Select the "Baseband Noise" measurement via the [MEAS] key.
4. You can stop the measurement (to analyze the measurement data in detail) with
the [RUN SGL] or [RUN CONT] key; [RUN SGL] performs one more measurement,
then stops, [RUN CONT] stops immediately.
By default, two traces are displayed: the first trace shows the smoothed data without spurs, the second trace the raw data including spurs.
Tip: Integrated measurement results. Note that the "PM", "FM" and "Jitter" results
are always "0" for baseband noise measurements.
How to measure baseband noise at the baseband input
For baseband noise measurements on the baseband input, proceed as follows.
1. Connect the DUT to one of the baseband channels.
If you want to cross-correlate the measurement, connect the DUT to both baseband channels (add a splitter to the test setup, if the DUT has just one output).
2. Perform a [PRESET].
3. Select the "Baseband Noise" measurement via the [MEAS] key.
4. Enter the "Overview" dialog box, and from there, enter the "Input" dialog box.
5. Select the vertical "Baseband" tab.
59User Manual 1177.5633.02 ─ 13
Page 60

R&S®FSWP
5.2.5 The Pulsed Phase Noise Measurement
Trying Out the Instrument
Measurements
6. Turn on the baseband input.
7. Select the "Input" channel you are using for the measurement ("CH1", "CH2" or
"CH1xCH2".
The application automatically starts a continuous measurement and measures the
noise characteristics of the DUT in the default frequency range.
Noise measurements on pulses are available with the optional pulsed phase noise
measurements firmware application.
Test setup
required connections
optional connections
DUT
R&S FSWP
V
supply
V
tune
V
aux
RF
Trigger Input
How to measure the phase noise of a pulse
1. Connect the DUT via cable to the RF input of the R&S FSWP as shown in the illustration.
2. Perform a [PRESET].
3. Select the [MEAS] key and select the "Pulsed Phase Noise" measurement.
The application tries to detect a pulse in the signal you have applied, using two
automatic mechanisms:
• search for the pulse frequency
• detection of the pulse characteristics
If successful, it configures a gate based on the pulse characteristics and starts the
noise measurement of the pulse.
The results are displayed the same way as in the other measurements (two traces
in the diagram and results for the integrated measurements).
If no frequency or pulse could be found, a corresponding error message is displayed in the status bar below the diagram.
If required, you can also define the frequency and the pulse characteristics manually.
5.2.6 The Pulsed Additive Noise Measurement
Additive noise measurements on pulses require the optional pulsed phase noise measurements firmware application and the optional signal source output.
60User Manual 1177.5633.02 ─ 13
Page 61

R&S®FSWP
Trying Out the Instrument
Measurements
The test setup depends on whether you use internal or external modulation with a
pulse modulator.
Test setup (internal pulse modulation)
required connections
optional connections
DUT
R&S FSWP
Signal
Source
V
supply
V
tune
V
aux
RF
Trigger Input
How to measure pulsed additive noise with an internally modulated pulse
1. Connect the signal source (supplies the pulse) to the DUT.
The pulse is modulated internally and output on the signal source.
2. Connect the DUT to the RF input.
3. Perform a [PRESET].
4. Select the [MEAS] key and select the "Pulsed Additive Noise" measurement.
5. Enter the "Overview" dialog box, and from there, enter the "Output" dialog box.
6. Select the "Signal Source" tab and turn on the "Pulse Modulator".
7. Configure the pulse characteristics.
8. Start the measurement with [RUN SGL] or [RUN CONT].
Test setup (external pulse modulation)
For pulsed measurements using the LO AUX input, do not apply pulses with a frequency below 1024 MHz. Pulses below that frequency will abort the measurement.
required connections
optional connections
Pulse
Modulator
DUT
R&S FSWP
Signal
Source
V
supply
V
tune
V
aux
RF
Trigger Out
How to measure pulsed additive noise with an externally modulated pulse
1. Connect the signal source to the pulse modulator.
61User Manual 1177.5633.02 ─ 13
Page 62

R&S®FSWP
Trying Out the Instrument
Result Evaluation
The signal source in that case provides a continuous wave signal which is modulated into a pulse by the pulse modulator.
2. Connect the trigger 1 output to the pulse modulator.
The signal provided on this output is a pulse and is required as a trigger signal for
the external pulse modulator.
3. Connect the pulse modulator to the DUT.
4. Connect the DUT to the RF input.
5. Perform a [PRESET].
6. Select the [MEAS] key and select the "Pulsed Phase Noise" measurement.
7. Select the "Signal Source" tab and turn off the "Pulse Modulator".
8. Select the output at the Trigger 1 Output
9. Configure the pulse characteristics.
10. Start the measurement with [RUN SGL] or [RUN CONT].
5.2.7 Adding Another Measurement Channel
Measuring the noise characteristics in two different measurement channels allows you,
for example, to capture and analyze two different data streams with different measurement configurations.
Adding another measurement channel
1. Select the [MODE] key.
2. Select the "Phase Noise" item in the "Mode" dialog box.
The firmware adds a second instance of the phase noise application which is inde-
pendent of the first one.
5.3 Result Evaluation
The phase noise application provides several tools to control the data displayed in the
various result displays. Some tools have an effect on the graphical result displays,
other on the numerical results and still others on both graphical and numerical (for
example in case the numerical results are based on the graphical results).
● Trace Smoothing.....................................................................................................63
● Integration Ranges..................................................................................................65
● The Cross-Correlation Gain Indicator..................................................................... 66
● Miscellaneous Evaluation Tools.............................................................................. 67
62User Manual 1177.5633.02 ─ 13
Page 63

R&S®FSWP
5.3.1 Trace Smoothing
Trying Out the Instrument
Result Evaluation
How to smooth the trace by averaging the measurement data
When you average the trace, the application measures the data several times and
builds an average over all measurements when it is done. Averaging measurement
data yields a smoother trace.
Trace averaging is applied to all traces.
1. Enter the "Overview" dialog box, and from there, enter the "Noise Config" dialog
box.
2. Define the number of measurements to be performed in the "Sweep / Average
Count" input field, for example "10".
3. Start the measurement.
● In case of a single measurement, the application performs x measurements
over the frequency range you have defined. An average count of "10", for
example, would result in 10 measurements.
● In case of continuous measurements, the application performs a moving aver-
age over the average count.
How to smooth the trace by adjusting the number of XCORR operations
When you apply cross-correlation operations, the application is able to determine the
phase noise characteristics at a certain frequency offset more precisely.
You can improve cross-correlation performance with the corresponding hardware
option.
The number of cross-correlation operations applied in each half decade depends on a
cross-correlation factor that you can define arbitrarily.
Cross-correlation operations are applied to all traces.
1. Enter the "Overview" dialog box, and from there, enter the "Noise Config" dialog
box.
2. Define the cross-correlation factor as required in the "XCORR Factor" input field.
The application calculates the number of cross-correlations for each half decade
based on this factor. You can see the resulting operations in the table of the "Noise
Config" dialog box.
The number of operations calculated for each half decade targets a similar measurement time for all half decades, so that the measurement is done at roughly the
same time in each half decade.
63User Manual 1177.5633.02 ─ 13
Page 64

R&S®FSWP
Trying Out the Instrument
Result Evaluation
You can also see the resulting number of operations in the green bar at the bottom
of the diagram area.
More information:
● Cross-correlation
How to smooth the trace graphically
When you apply trace smoothing, the existing data remains the same. The trace is
smoothed by applying mathematical operations
Trace smoothing is applied to each trace individually.
1. Enter the "Overview" dialog box, and from there, enter the "Analysis" dialog box.
2. Select the vertical "Trace" tab, and then the horizontal "Traces" tab.
3. For any trace, turn on "Smoothing" and define the amount by which the trace
should be smoothed (in %) in the corresponding input field.
Trace smoothing is applied immediately after you have applied it to a trace.
More information:
● Trace smoothing
How to remove spurs from a trace
By default, the application already shows a trace without spurs (the yellow one). However, you can decide for each trace individually whether it shows spurs or not.
Spur removal is done after traces have been smoothed in any way.
1. Enter the "Overview" dialog box, and from there, enter the "Analysis" dialog box.
2. Select the vertical "Trace" tab, and then the horizontal "Traces" tab.
3. For any trace, remove or display spurs individually. You can also enter a threshold
that defines a level from which a spur is recognized as a spur.
The application removes all signals that are above the threshold from the trace
spur removal is applied to. Signals with levels below the threshold are not regarded
as spurs and are still displayed.
More information:
● Spur removal
Note: Note that the threshold is always taken into account in the spur table,
regardless of whether spur removal is on or off.
64User Manual 1177.5633.02 ─ 13
Page 65

R&S®FSWP
5.3.2 Integration Ranges
Trying Out the Instrument
Result Evaluation
How to define integration ranges
For the integrated measurements (residual AM, FM and PM and jitter), you can define
custom integration ranges.
By default, the integration range corresponds to the measurement range defined by the
frequency offsets. Custom integration ranges can have any range you desire.
Integration is done after traces have been smoothed in any way.
1. Enter the "Overview" dialog box and, from there, enter the "Noise Config" dialog
box.
2. Select the "Integrated Measurements" tab.
3. Select the "Trace" whose data you would like to integrate from the "Show "dropdown menu.
Tip: If you select a trace that is currently not displayed in the diagram, no integrated measurement results will be displayed for the corresponding range.
4. Select "Manual" integration ranges.
5. Define the frequency ranges ("Range Start" and "Range Stop") over which you
would like to integrate.
The application calculates the measurement results as defined. Result in the integrated measurements result table are adjusted accordingly (see "Measuring inte-
grated noise" on page 55 for a description on how to view that table).
Figure 5-2: Custom integration range results (frequency range from 3 kHz to 500 kHz, applied to
trace 2)
Note that the integration ranges are displayed graphically in the noise diagram.
Figure 5-3: Custom integration ranges are represented in the diagram as colored lines
65User Manual 1177.5633.02 ─ 13
Page 66

R&S®FSWP
Trying Out the Instrument
Result Evaluation
More information: Residual effects
How to correct integrated measurements
You can use so called weighting filters to compensate external effects that affect the
phase noise in certain frequency ranges.
Weighting filters are applied before trace are smoothed and before integration is
applied.
1. Enter the "Overview" dialog box, and from there, enter the "Noise Config" dialog
box.
2. Select the "Integrated Measurements" tab.
3. Select a weighting filter from the corresponding dropdown menu.
The dropdown menu contains all filters currently available on the hard disk of the
R&S FSWP.
When you apply the weighting filter, the results are automatically corrected by the
filter characteristics.
If you do not have a filter yet, or want to change filter characteristics for an existing
filter, design one or change one.
More information:
● Weighting filter design
● Weighting filter management
5.3.3 The Cross-Correlation Gain Indicator
How to control the cross-correlation gain indicator (gray area)
The gray trace, or cross-correlation gain indicator, indicates the ideal position of the
measurement trace for the current number of cross-correlation operations. Thus, the
position of this area depends on the number of cross-correlations that are currently
applied in each half decade.
This in turn indicates that measurement traces that are close to the gray area (even if
only in places) can be improved by increasing the cross-correlation operations. On the
other hand, when the measurement trace lies above the gray area throughout (about
10 dB), it is not possible to improve the results any more.
More information: XCORR gain indicator
1. Enter the "Overview" dialog box, and from there, enter the "Noise Config" dialog
box.
66User Manual 1177.5633.02 ─ 13
Page 67

R&S®FSWP
5.3.4 Miscellaneous Evaluation Tools
Trying Out the Instrument
Result Evaluation
2. Select the "Noise Config" tab.
3. Change the "XCORR Factor", run a single measurement, and see how the position
of the gray area changes.
Figure 5-4: Increasing XCORR operations changes shape of gray area
4. If required, you can turn this area on and off as required with the "XCORR Gain
Indicator" feature.
Zooming into the results
The zoom tool is useful if you want to see parts of the results in more detail.
1.
Select the "Zoom" icon in the toolbar ( ).
2. In the diagram, select the area you want to zoom in to (while doing this, the area is
marked by a dotted line).
3. You can return to the full display any time with the "Unzoom" icon in the toolbar
( ).
Labeling traces
Labeling traces with a short keyword is a good way to distinguish traces and see
immediately what the trace actually represents.
1. Enter the "Overview" dialog box and, from there, enter the "Analysis" dialog box.
2. Select the vertical "Traces" tab and the horizontal "Trace Label" tab.
3. Turn on the trace label for a certain trace and define a string of text as a label.
The application adds a label to the trace. The color of the label is the same as the
trace color.
Tip: You can move trace labels around via drag and drop.
Exporting measurement data
Exporting measurement data to a .dat file allows you to archive that data in external
programs like a spreadsheet.
1. Enter the "Overview" dialog box and, from there, enter the "Analysis" dialog box.
2. Select the vertical "Traces" tab and the horizontal "Trace / Data Export" tab.
67User Manual 1177.5633.02 ─ 13
Page 68

R&S®FSWP
5.4 Measurement Configuration
Trying Out the Instrument
Measurement Configuration
3. Select the data types as required (trace data only or together with numerical results
and / or measurement settings).
4. Select the "Export to ASCII File" button and select the destination where you want
to save that data.
5. View the .dat file that has been created with your preferred program.
The Phase Noise application provides several tools that make the measurement process easier to handle or allow you to customize the measurement configuration according to your needs.
● Frequency Configuration.........................................................................................68
● The Half Decade Configuration Table..................................................................... 70
● Pulsed Measurement Configuration........................................................................70
● Signal Generation................................................................................................... 71
● DUT Power Supply..................................................................................................73
5.4.1 Frequency Configuration
How to define the measurement range
The measurement range defines the carrier frequency offset over which the phase
noise measurement takes place.
1. Enter the "Overview" dialog box, and from there, enter the "Noise Config" dialog
box.
2. Select the "Noise Config" tab.
3. Define the measurement range with the "Start Offset" and "Stop Offset" properties.
The application adjusts the measurement range. You can see this change, for
example, in the noise diagram result display.
Note: In case of baseband measurements, the measurement range is defined by
an absolute start and stop frequency instead of offsets.
More information:
● Measurement range
68User Manual 1177.5633.02 ─ 13
Page 69

R&S®FSWP
Trying Out the Instrument
Measurement Configuration
How to search for signals
The application allows you to search for a carrier signal, instead of defining the carrier
frequency manually.
1. Enter the "Overview" dialog box, and from there, enter the "Frequency" dialog box.
2. Turn on the "Auto Search" feature (it is on by default).
3. Define the frequency range in which the search should take place ("Start" and
"Stop"). By default the search is done in the maximum frequency range supported
by the hardware.
4. Define a "Threshold" for the search. Signals below the threshold are ignored during
the search.
When the application finds a signal with appropriate characteristics, it starts a
phase noise measurement in the measurement range you have defined.
Note: Automatic signal search is only available in phase noise and pulsed phase
noise measurements.
How to define the capture range for the signal search
The capture range represents the frequency bandwidth with which a signal is
searched, and, if found, tracked.
A normal capture range is recommended for measurements on stable (or slowly drifting) DUTs. A wide capture range is recommended for DUTs whose frequency drifts
over greater distances. In the latter case, a normal capture range would probably result
in a scenario, where the signal drifts out of the capture range, and has to be searched
again (which would slow down the measurement considerably).
1. Enter the "Overview" dialog box, and from there, enter the "Frequency" dialog box.
2. Select an appropriate "Capture Range" for your DUT.
Note: This feature is only available in phase noise and pulsed phase noise measurements.
How to define a carrier frequency manually
When you already know the frequency of the carrier signal, you can define it manually
and reduce the measurement time.
1. Enter the "Overview" dialog box, and from there, enter the "Frequency" dialog box.
2. Turn off the "Auto Search" feature.
3. Define the "Signal Frequency".
The application performs the measurement on the defined frequency.
69User Manual 1177.5633.02 ─ 13
Page 70

R&S®FSWP
5.4.2 The Half Decade Configuration Table
Trying Out the Instrument
Measurement Configuration
How to work with the half decade configuration table
The half decade configuration table contains the measurement configuration for each
half decade that is analyzed during a measurement.
You can either enter the values for the measurement bandwidth and number of crosscorrelation operations directly. Or you can let the application calculate ideal values for
each half decade.
1. Enter the "Overview" dialog box, and from there, enter the "Noise Config" dialog
box.
2. Select automatic or manual configuration mode with the "Half Decade Config" feature.
3. In case of an automatic configuration, define an "RBW" factor and an "XCORR
Factor".
From these values, the application calculates the best and least time-consuming
absolute resolution bandwidth and cross-correlation operations for each half decade.
4. In case of a manual configuration, define the resolution bandwidth and number of
cross-correlations for each half decade directly in the half decade configuration
table as absolute values.
The relative "RBW" factor and "XCORR Factor" are ignored.
5.4.3 Pulsed Measurement Configuration
How to configure a gate for measurements on pulses
Noise measurements on pulses are available with the optional pulsed phase noise
measurements firmware application.
By default, the application automatically detects the pulse characteristics and defines
the gate characteristics based on the pulse. If required, you can also define these
parameters manually.
1. Enter the pulsed phase noise measurement.
2. Select the [MEAS CONFIG] key and enter the "Pulse" dialog box with the "Pulse
Config" softkey.
3. In the "Pulse" dialog box, select "Manual" pulse detection.
The input fields for the "Pulse Repetition Interval" and those for the "Gate Charac-
teristics" become available. You can change them if required.
4. Configure the "Pulse Rep Interval" as required.
70User Manual 1177.5633.02 ─ 13
Page 71

R&S®FSWP
Trying Out the Instrument
Measurement Configuration
5. Configure the gate as required ("Gate Type", "Gate Level", "Gate Delay" and "Gate
Length").
The shape of the gate is represented by various lines and bars in the "Preview"
diagram that is part of the dialog box.
More information:
● Pulsed phase noise
Tip: You can turn off the gate, if one is not required for the measurement.
To do so, select "Gate Type: Off".
5.4.4 Signal Generation
How to generate a CW signal
Some measurement setups require you to feed a signal into the DUT. You can equip
the R&S FSWP with an optional Signal Source that is able to generate such a signal.
Available only for additive noise measurements and with the optional signal source
hardware component.
1. Enter the Additive Noise measurement.
2. Enter the "Overview" dialog box, and from there, enter the "Output" dialog box.
3. Select the "Signal Source" tab.
4. Define the frequency and level of the CW signal in the corresponding input fields.
5. Turn on the signal source with the "Source Power" feature.
Tip: You can turn the signal source on and off effectively with the "RF On/Off" but-
ton in the toolbar. The "RF Config" button provides access to a softkey menu that
lets you change the signal source characteristics without entering a dialog box.
71User Manual 1177.5633.02 ─ 13
Page 72

R&S®FSWP
Trying Out the Instrument
Measurement Configuration
How to generate a pulse
Instead of a continuous wave signal, you can generate a pulse at the signal source
output.
Available only for additive pulsed phase noise measurements and with the optional signal source hardware component.
1. Enter the "Overview" dialog box, and from there, enter the "Output" dialog box.
2. Select the "Signal Source" tab.
3. Turn on the (internal) "Pulse Modulator".
When the "Pulse Modulator" is off, a CW signal is generated.
However, you can still generate a pulse with an external pulse modulator (a trigger
signal is required for that, see "How to use an external pulse modulator (configura-
tion)" on page 72).
4. Define the required pulse "Width" and "Period".
5. Turn on the signal source with the "Source Power" feature.
Tip: You can turn the signal source on and off easily with the "RF On/Off" button in
the toolbar. The "RF Config" button provides access to a softkey menu that lets you
change the signal source characteristics without entering a dialog box.
How to use an external pulse modulator (configuration)
Instead of generating a pulse internally, you can also use an external pulse modulator
to generate a pulse required for testing of a DUT.
In this scenario, you can use a trigger signal (available at the trigger output) to control
an external pulse modulator.
1. Enter the "Overview" dialog box, and from there, enter the "Output" dialog box.
2. Select the "Signal Source" tab.
3. Turn off the (internal) "Pulse Modulator".
When the (internal) "Pulse Modulator" is off, a CW signal is generated at the signal
source.
4. Select the output type at the "Trigger 1 Output" (on the front panel) to generate a
pulse at the trigger output.
● "High" generates a high active pulse at the trigger 1 output.
1
V
1
trigger
0
t
● "Low" generates a low active pulse at the trigger 1 output.
72User Manual 1177.5633.02 ─ 13
Page 73

R&S®FSWP
Trying Out the Instrument
Measurement Configuration
2
V
1
trigger
0
Note: In the phase noise application, the trigger connector on the front panel
always serves as an output.
5. Define the required pulse "Width" and "Period".
6. Turn on the signal source with the "Source Power" feature.
Tip: You can turn the signal source on and off easily with the "RF On/Off" button in
the toolbar. The "RF Config" button provides access to a softkey menu that lets you
change the signal source characteristics without entering a dialog box.
5.4.5 DUT Power Supply
How to supply DUTs with current or voltage
Some measurement setups or DUTs require you to supply them with either voltage or
current.
The R&S FSWP can provide both, when you set it up that way.
1. Enter the "Overview" dialog box and, from there, enter the "Output" dialog box.
t
2. Select the "DC Config" tab.
There you have the following options:
● Turn each of the three DC outputs on or off.
● Define the supplied voltage (or current in case of the V
supply
output).
● Define limits for the outputs. When you define limits, the supplied voltage will
not go below or above these.
● DC power output
3. Turn on the output of voltage or current with the "DC Power" feature.
Tip: You can turn the output on and off easily with the "DC On / Off" button in the
toolbar. The "DC Config" button provides access to a softkey menu that lets you
define the signal characteristics without entering a dialog box.
73User Manual 1177.5633.02 ─ 13
Page 74

R&S®FSWP
6.1 Understanding the Display Information
Operating the Instrument
Understanding the Display Information
6 Operating the Instrument
The following topics provide an overview on how to work with the R&S FSWP. They
describe what kind of information is displayed in the diagram area, how to operate the
R&S FSWP via the front panel keys and other interaction methods, and how to use the
Online Help.
● Understanding the Display Information...................................................................74
● Accessing Functions............................................................................................... 82
● Changing the Focus................................................................................................86
● Entering Data.......................................................................................................... 86
● Displaying Results...................................................................................................88
● Remote Control.......................................................................................................96
The following figure shows a measurement diagram in the Phase Noise application. All
different information areas are labeled. They are explained in more detail in the following sections.
1 2 3 7 9
4 5
6
8
= Toolbar: contains general functionality of the firmware.
1
2 = Channel tab: contains measurement channel.
3 = Channel bar: shows measurement settings.
4 = Result display: contains measurement results.
5 = Window title bar: contains diagram-specific (trace) information.
6 = Status bar: contains system messages, progress bar and date and time.
74User Manual 1177.5633.02 ─ 13
Page 75

R&S®FSWP
Operating the Instrument
Understanding the Display Information
7 = Input field.
8 = Diagram footer: contains diagram-specific information.
9 = Softkeys: provide access to measurement functions.
Hiding elements in the display
You can hide some of the elements in the display, for example the status bar or channel bar, in order to enlarge the display area for the measurement results ("Setup > Display > Displayed Items").
For details see the R&S FSWP User Manual.
● Channel Bar............................................................................................................ 75
● Window Title Bar.....................................................................................................77
● Marker Information..................................................................................................78
● Spot Noise Information............................................................................................78
● Measurement Progress Information........................................................................79
● Frequency Information in Diagram Footer.............................................................. 80
● Instrument and Status Information..........................................................................80
● Error Information..................................................................................................... 81
6.1.1 Channel Bar
Using the R&S FSWP you can handle several different measurement tasks (channels)
at the same time (although they can only be performed asynchronously). For each
channel, a separate tab is displayed on the screen. In order to switch from one channel
display to another, simply select the corresponding tab.
Alternatively, if many tabs are displayed, select the tab selection list icon at the right
end of the channel bar and select the channel you want to switch to from the list.
MultiView tab
An additional tab labelled "MultiView" provides an overview of all active channels at a
glance. In the "MultiView" tab, each individual window contains its own channel bar
with an additional button. Tap this button to switch to the corresponding channel display quickly.
75User Manual 1177.5633.02 ─ 13
Page 76

R&S®FSWP
Operating the Instrument
Understanding the Display Information
Icons in the channel bar
The star icon ( ) on the tab label indicates that the displayed trace no longer matches
the current instrument settings. This may be the case, for example, if a trace is frozen
and the instrument settings are changed. As soon as a new measurement is performed, the icon disappears.
The exclamation mark ("!" or
) icon indicates that an error or warning is available for
that measurement channel. This is particularly useful if the MultiView tab is displayed.
The icon indicates the currently active channel during an automatic measurement
sequence (Sequencer functionality).
Beneath the channel name, information on channel-specific settings for the measurement are displayed in the channel bar. Channel information varies depending on the
active application.
In addition to the channel-specific settings, the channel bar above the diagram also
displays information on instrument settings that affect the measurement results even
though this is not immediately apparent from the display of the measured values. This
information is displayed only when applicable for the current measurement.
The following table contains all labels that might be displayed in the Spectrum and
Receiver applications.
Table 6-1: Channel settings displayed in the channel bar
Label Information
Signal Frequency Current carrier frequency of the applied signal.
Signal Level Currently level measured on the carrier frequency.
Att Current RF attenuation.
RBW Current Resolution bandwidth (RBW). The RBW is a function of the start offset
frequency of each half decade included in the measurement.
XCORR Factor Current cross-correlation factor. The cross-correlation factor defines the number
of cross-correlations are done in each half decade included in the measurement.
Meas Time (estimated) Current estimated measurement time.
The measurement time depends, among other things, on the offset frequency,
the resolution bandwidth or the number of averages / cross-correlations that
you have defined.
Source Frequency Current frequency of the signal source output.
Displayed if the optional signal source is installed.
Source Level Current level of the signal source output.
Displayed if the optional signal source is installed.
SGL Current number of measurements performed in a single sweep. Only displayed
if you are in single sweep measurement mode.
Count The current signal count for measurement tasks that involve a specific number
of subsequent sweeps.
Meas Currently selected measurement (Phase Noise, Additive Phase Noise etc.).
76User Manual 1177.5633.02 ─ 13
Page 77

R&S®FSWP
6.1.2 Window Title Bar
Operating the Instrument
Understanding the Display Information
Label Information
Input ExtMix Currently selected waveguide band of an external mixer. Only displayed if an
external mixer is selected as an input source.
Gain Difference between DUT signal level and signal source level.
Displayed in Additive Noise measurements.
Icons for individual settings
A bullet next to the setting indicates that user-defined settings are used, not automatic
settings. A green bullet indicates this setting is valid and the measurement is correct. A
red bullet indicates an invalid setting that does not provide useful results.
Each channel in the R&S FSWP display may contain several windows. Each window
can display either a graph or a table as a result of the channel measurement. Which
type of result evaluation is displayed in which window is defined in the display configuration (see Chapter 6.5, "Displaying Results", on page 88). The window's title bar indicates which type of evaluation is displayed.
Trace Information in Window Title Bar
Information on the displayed traces is indicated in the window title bar.
Result type
Trace number
Trace color
Trace smoothing
Spur removal
Trace offset
Trace mode
Trace color Color of trace display in diagram
Trace number Number of the trace (1 to 6)
Trace Mode
Abbreviation of the trace mode:
●
Clrw
Clear Write trace
●
Max
Max Hold trace
●
Min
Min Hold trace
●
Avg
Average trace
●
View
Frozen trace
●
WrH
Write Hold trace
Result type
Type of result the trace represents.
●
PN
●
AM
●
PN + AM
77User Manual 1177.5633.02 ─ 13
Page 78

R&S®FSWP
6.1.3 Marker Information
Operating the Instrument
Understanding the Display Information
Trace smoothing Trace smoothing characteristics. Only displayed if trace smoothing has been
turned on for a trace.
Spur removal Spur removal characteristics. Only displayed if spur removal has been turned
on for a trace.
Trace offset Trace offset characteristics. Only displayed if an offset has been defined for a
trace.
Marker information is provided either in the diagram grid or in separate marker tables,
depending on the configuration.
Marker information in diagram grid
Within the diagram, the x-axis and y-axis positions of the last 2 markers or delta markers that were set are displayed, if available, as well as their index. The value in the
square brackets after the index indicates the trace to which the marker is assigned.
(Example: M2[1] defines marker 2 on trace 1.) For more than 2 markers, a separate
marker table is displayed beneath the diagram by default.
Marker information in marker table
In addition to the marker information displayed within the diagram grid, separate
marker tables may be added to the display. These tables provide the following information for all active markers:
Table 6-2: Regular marker table
Label Information
Wnd Window type the marker is positioned in.
(Only if there is more than one window containing a phase noise diagram.)
Type Marker type: N (normal), D (delta), T (temporary, internal)
Ref Reference (for delta markers)
Trc Trace to which the marker is assigned
X-value x-value of the marker
Y-value y-value of the marker
6.1.4 Spot Noise Information
Spot noise information in diagram grid
The diagram contains information about all spot noise positions [T<x>]. Spot noise
information is made up out of the position of the spot noise measurement on the x-axis
and the y-axis. The value in the square brackets after the index indicates the trace to
which the spot noise calculation is assigned (Example: [T1] indicates trace 1). Note
that you can also display spot noise information in a separate table.
78User Manual 1177.5633.02 ─ 13
Page 79

R&S®FSWP
6.1.5 Measurement Progress Information
Operating the Instrument
Understanding the Display Information
Spot noise information in spot noise table
The R&S FSWP also provides a numerical result table for the spot noise measurement. The spot noise table has to be added deliberately. Note that the spot noise table
only contains information when the calculation of spot noise has been turned on.
Table 6-3: Spot noise information result table
Label Information
Wnd Measurement window that the spot noise has been calculated for.
(Only if there is more than one window containing a phase noise diagram.)
Offset Offset frequency or spot noise position on the x-axis of the Phase Noise dia-
gram.
Noise [T<x>] Measured noise on the spot noise position for each active trace.
The Phase Noise result display shows the progress of the measurement in a series of
green bars at the bottom of the diagram area. For each half decade in the measurement, the R&S FSWP adds a bar that spans the frequency range of the corresponding
half decade.
The bar has several features.
●
Measurement times less than 1 s
The numbers within the green bar indicate the number of cross-correlation operations applied to the corresponding half decade.
●
Measurement times greater than 1 s
The numbers within the green bar show the progress of the cross-correlation operations in the half decade the application currently works on.
The first number is the current, the second number the total count of cross-correlations for that half decade. The bars of half decades in which a measurement is still
running has a lighter tone of green than bars of half decades in which the measurement has already finished (see image below).
●
A double-click on the bar opens the "Noise Config" dialog box to define the crosscorrelation factor for that half decade.
●
A right-click on the bar opens a context menu.
The context menu provides easy access to various parameters to set up the measurement.
79User Manual 1177.5633.02 ─ 13
Page 80

R&S®FSWP
6.1.6 Frequency Information in Diagram Footer
6.1.7 Instrument and Status Information
Operating the Instrument
Understanding the Display Information
Graphical result displays contain information in the diagram footer. The information
(beneath the diagram) depends on the result display.
The contents depend on the application and the result display.
Label Information
Start offset Start offset frequency
Stop offset Stop offset frequency
Global instrument settings and functions, the instrument status and any irregularities
are indicated in the status bar beneath the diagram.
In the MultiView tab the status bar always displays the information for the currently
selected measurement.
The following information is displayed:
Instrument status
The state of the DC Power features.
●
white label = DC Power has been turned off
●
green label = DC Power has been turned on and is within the defined limits
●
red label = DC Power has been turned on and violates the defined limits
The R&S FSWP is configured for operation with an external reference.
Progress
The status of the current operation is displayed in the status bar. This includes the
remaining measurement time for measurements that last longer than 1 second.
Display of the remaining measurement time is supported by the following measurements:
●
(Additive) phase noise
●
Pulsed (additive) phase noise
●
Baseband noise
In the MultiView tab, the progress bar indicates the status of the currently selected
measurement, not the measurement currently being performed by a Sequencer, for
example.
80User Manual 1177.5633.02 ─ 13
Page 81

R&S®FSWP
6.1.8 Error Information
Operating the Instrument
Understanding the Display Information
Date and time
The date and time settings of the instrument are displayed in the status bar.
Error messages and warnings
If errors or irregularities are detected, a keyword and an error message, if available,
are displayed in the status bar.
If errors or irregularities are detected, a keyword and an error message, if available,
are displayed in the status bar.
Depending on the type of message, the status message is indicated in varying colors.
Table 6-4: Status bar information - color coding
Color Type Description
red Error An error occurred at the start or during a measurement, e.g. due to missing
data or wrong settings, so that the measurement cannot be started or completed correctly.
orange Warning An irregular situation occurred during measurement, e.g. the settings no lon-
ger match the displayed results, or the connection to an external device was
interrupted temporarily.
gray Information Information on the status of individual processing steps.
no color No errors No message displayed - normal operation.
green Measurement
successful
Some applications visualize that the measurement was successfull by showing a messsage.
If any error information is available for a measurement channel, an exclamation mark is
displayed next to the channel name ( ). This is particularly useful when the MultiView
tab is displayed, as the status bar in the MultiView tab always displays the information
for the currently selected measurement only.
Furthermore, a status bit is set in the STATus:QUEStionable:EXTended:INFO register for the application concerned (see "STATus:QUEStionable:EXTended:INFO Reg-
ister" on page 341). Messages of a specific type can be queried using the
SYST:ERR:EXT? command, see SYSTem:ERRor:EXTended? on page 615.
81User Manual 1177.5633.02 ─ 13
Page 82

R&S®FSWP
Operating the Instrument
Accessing Functions
Table 6-5: Keywords in the status bar
Message Meaning
IF OVLD Overload of the IF signal path in the A/D converter or in the digital IF.
Increase attenuation or remove the signal from the RF input.
LOUNL Error in the instrument's frequency processing hardware was detected.
NO REF Instrument was set to an external reference but no signal was detected on the refer-
ence input.
OVEN The optional OCXO reference frequency has not yet reached its operating tempera-
ture. The message usually disappears a few minutes after power has been switched
on.
RF OVLD Overload of the input mixer or of the analog IF path.
Reduce the input level.
UNCAL One of the following conditions applies:
WRONG_FW The firmware version is out-of-date and does not support the currently installed hard-
●
Correction data has been switched off.
●
No correction values are available, for example after a firmware update.
●
Record the correction data by performing a self alignment
ware. Until the firmware version is updated, this error message is displayed and selfalignment fails.
(For details refer to the R&S FSWP User Manual).
6.2 Accessing Functions
All tasks necessary to operate the instrument can be performed using the user interface. Apart from instrument specific keys, all other keys that correspond to an external
keyboard (for example arrow keys, [Enter] key) operate conform to Microsoft.
For most tasks, there are at least 2 alternative methods to perform them:
●
Using the touchscreen
●
Using other elements provided by the front panel, for example the keypad, rotary
knob, or arrow and position keys.
The measurement and instrument functions and settings can be accessed by selecting
one of the following elements:
●
System and function keys on the front panel of the instrument
●
Softkeys on the touchscreen
●
Context menus for specific elements on the touchscreen
●
Icons on the tool bar in the touchscreen
●
Displayed setting on the touchscreen
● Toolbar.................................................................................................................... 83
● Softkeys.................................................................................................................. 84
● Context Menus........................................................................................................85
● On-screen Keyboard...............................................................................................85
82User Manual 1177.5633.02 ─ 13
Page 83

R&S®FSWP
6.2.1 Toolbar
Operating the Instrument
Accessing Functions
The icons in the toolbar provide access to general functions.
You can hide the toolbar display, for example when using remote control, in order to
enlarge the display area for the measurement results ("Setup > Display > Displayed
Items"). See the R&S FSWP User Manual for details.
Windows: opens the Windows "Start" menu and task bar.
Open: opens a file from the instrument or an external device ("Save/Recall" menu).
Store: stores data on the instrument or an external device ("Save/Recall" menu).
Print: defines print settings ("Print" menu).
Undo: reverts last operation
Redo: repeats previously reverted operation
Select: the cursor can be used to select (and move) elements in the display (markers, lines etc.).
Zoom mode: displays a dotted rectangle in the diagram that can be expanded to
define the zoom area.
Multiple zoom mode: multiple zoom areas can be defined for the same diagram.
Zoom off: displays the diagram in its original size.
SmartGrid: activates "SmartGrid" mode to configure the screen layout.
Sequencer: opens the "Sequencer" menu to perform consecutive measurements.
83User Manual 1177.5633.02 ─ 13
Page 84

R&S®FSWP
Operating the Instrument
Accessing Functions
DC Power: turns the DC power output on and off.
DC Configuration: provides quick access to configure the main parameters for DC
power supply.
Signal Source: turns the optional signal source output on and off.
(Available when the optional signal source output is installed.)
RF Config: provides quick access to configure the main parameters of the signal
source.
(Available when the optional signal source output is installed.)
Help (+ Select): allows you to select an element for which context-specific help is displayed.
Help: displays context-sensitive help topic for currently selected element.
In "SmartGrid" mode only:
6.2.2 Softkeys
Softkeys are virtual keys provided by the software. Thus, more functions can be provided than those that can be accessed directly via the function keys on the instrument.
Softkeys are dynamic: depending on the selected function key, a different list of softkeys is displayed on the right side of the screen.
A list of softkeys for a certain function key is also called a menu. Softkeys can either
perform a specific function or open a dialog box.
Recognizing the softkey status by color
Color Meaning
orange associated dialog box is open
blue associated function is active; for toggle keys: currently active state
Print immediately: prints the current display (screenshot) as configured.
Close: Exit "SmartGrid" mode.
gray instrument function is temporarily not available due to a specific setting or missing option
You can hide the softkey display, e.g. when using remote control, in order to enlarge
the display area for the measurement results ("Setup > Display > Displayed Items").
See the User Manual for details.
84User Manual 1177.5633.02 ─ 13
Page 85

R&S®FSWP
6.2.3 Context Menus
Operating the Instrument
Accessing Functions
Several items in the diagram area have context menus (for example markers, traces or
the channel bar). If you right-click on one of these items (or tap it for about 1 second), a
menu is displayed which contains the same functions as the corresponding softkey.
This is useful, for example, when the softkey display is hidden.
6.2.4 On-screen Keyboard
The on-screen keyboard is an additional means of interacting with the instrument without having to connect an external keyboard.
The on-screen keyboard display can be switched on and off as desired using the "OnScreen Keyboard" function key beneath the screen.
When you press this key, the display switches between the following options:
●
Keyboard displayed at the top of the screen
●
Keyboard displayed at the bottom of the screen
●
No keyboard displayed
You can use the TAB key on the on-screen keyboard to move the focus from one field
to another in dialog boxes.
85User Manual 1177.5633.02 ─ 13
Page 86

R&S®FSWP
6.3 Changing the Focus
6.4 Entering Data
Operating the Instrument
Entering Data
Any selected function is always performed on the currently focused element in the display, e.g. a dialog field, diagram, or table row. Which element is focused is indicated by
a blue frame (diagram, window, table) or is otherwise highlighted (softkey, marker etc.).
Moving the focus is most easily done by tapping on the element on the touchscreen.
Alternatively, use the "Tab" key on the on-screen keyboard or the rotary knob to move
the focus from one element to the next on the display.
To move the focus between any displayed diagrams or tables in a window, press the
"Change focus" key on the front panel. The focus moves from the diagram to the first
table to the next table etc. and then back to the diagram, within the same window.
In fullscreen mode, where a single window is displayed in full size on the screen, this
key switches the focus (and the display) from one active window to the next.
You can enter data in dialog boxes using any of the following methods:
●
Using the touchscreen, via the on-screen keyboard
●
Using other elements provided by the front panel, e.g. the keypad, rotary knob, or
navigation keys
The rotary knob acts like the [ENTER] key when it is pressed.
●
Using a connected external keyboard
Transparent dialog boxes
You can change the transparency of the dialog boxes to see the results in the windows
behind the dialog box. Thus, you can see the effects that the changes you make to the
settings have on the results immediately.
To change the transparency, select the transparency icon at the top of the dialog box.
A slider is displayed. To hide the slider, select the transparency icon again.
(The title bar of the dialog box is always slightly transparent and is not affected by the
slider.)
Particularities in Windows dialog boxes
In some cases, e.g. if you want to install a printer, original Windows dialog boxes are
used. In these dialog boxes, the rotary knob and function keys do not work. Use the
touchscreen instead.
6.4.1 Entering Numeric Parameters
If a field requires numeric input, the keypad provides only numbers.
86User Manual 1177.5633.02 ─ 13
Page 87

R&S®FSWP
6.4.2 Entering Alphanumeric Parameters
Operating the Instrument
Entering Data
1. Enter the parameter value using the keypad, or change the currently used parameter value by using the rotary knob (small steps) or the [UP] or [DOWN] keys (large
steps).
2. After entering the numeric value via keypad, press the corresponding unit key.
The unit is added to the entry.
3. If the parameter does not require a unit, confirm the entered value by pressing the
[ENTER] key or any of the unit keys.
The editing line is highlighted to confirm the entry.
If a field requires alphanumeric input, you can use the on-screen keyboard to enter
numbers and (special) characters (see Chapter 6.2.4, "On-screen Keyboard",
on page 85).
Alternatively, you can use the keypad. Every alphanumeric key represents several
characters and one number. The decimal point key (.) represents special characters,
and the sign key (-) toggles between capital and small letters. For the assignment,
refer to Table 6-6.
You can change the default behavior of the keypad for text input. This is useful if you
frequently enter numeric values in text fields, for example to define file names consisting of numbers.
For details, see "Number block behavior" on page 303.
To enter numbers and (special) characters via the keypad
1. Press the key once to enter the first possible value.
2. All characters available via this key are displayed.
3. To choose another value provided by this key, press the key again, until your
desired value is displayed.
4. With every key stroke, the next possible value of this key is displayed. If all possible values have been displayed, the series starts with the first value again. For
information on the series, refer to Table 6-6.
5. To change from capital to small letters and vice versa, press the sign key (-).
6. When you have chosen the desired value, wait for 2 seconds (to use the same key
again), or start the next entry by pressing another key.
To enter a blank
► Press the "Space" bar, or press the "0" key and wait 2 seconds.
87User Manual 1177.5633.02 ─ 13
Page 88

R&S®FSWP
Operating the Instrument
Displaying Results
To correct an entry
1. Using the arrow keys, move the cursor to the right of the entry you want to delete.
2. Press the [BACKSPACE] key.
The entry to the left of the cursor is deleted.
3. Enter your correction.
To complete the entry
► Press the [ENTER] key or the rotary knob.
To abort the entry
► Press the [ESC] key.
The dialog box is closed without changing the settings.
Table 6-6: Keys for alphanumeric parameters
Key name
(upper inscription)
7 7 µ Ω ° € ¥ $ ¢
8 A B C 8 Ä ÆÅ Ç
9 D E F 9 É
4 G H I 4
5 J K L 5
6 M N O 6 Ň Ö
1 P Q R S 1
2 T U V 2 Ü
3 W X Y Z 3
0 <blank> 0 – @ + / \ < > = % &
. . * : _ , ; " ' ? ( ) #
– <toggles between capital and small letters>
Series of (special) characters and number provided
6.5 Displaying Results
The R&S FSWP provides several instrument applications for different analysis tasks
and different types of signals, for example the Phase Noise application, the optional
Spectrum application or the optional I/Q Analyzer. For each application, a new measurement channel is created and displayed in a separate tab on the screen.
The results of a measurement channel can be evaluated in many different ways, both
graphically and numerically. For each evaluation method the results are displayed in a
separate window in the tab.
88User Manual 1177.5633.02 ─ 13
Page 89

R&S®FSWP
6.5.1 Activating and Deactivating Channels
Operating the Instrument
Displaying Results
The R&S FSWP allows you to configure the display to suit your specific requirements
and optimize analysis.
When you activate an application, a new measurement channel is created which determines the measurement settings for that application. The same application can be activated with different measurement settings by creating several channels for the same
application. Whenever you switch channels, the corresponding measurement settings
are restored. Each channel is displayed in a separate tab on the screen.
An additional tab ("MultiView") provides an overview of all currently active channels at
once.
Only one measurement can be performed at any time, namely the one in the currently
active channel. However, in order to perform the configured measurements consecutively, a Sequencer function is provided.
To start a new channel
1. Select the [Mode] key.
2. In the "Mode" dialog box, select the required application on the "New Channel" tab.
A new tab is displayed for the new channel.
Remote command:
INSTrument:CREate[:NEW] on page 395/ INSTrument:CREate:DUPLicate
on page 394
89User Manual 1177.5633.02 ─ 13
Page 90

R&S®FSWP
Operating the Instrument
Displaying Results
To change the application in an active channel
1. Select the tab of the channel you want to change.
2. Select the [Mode] key.
3. In the "Mode" dialog box, select the new application to be displayed on the
"Replace Current Channel" tab.
The selected application is displayed in the current channel.
Remote command:
INSTrument:CREate:REPLace on page 395
To close a measurement channel
►
Select the "Close" icon on the tab of the measurement channel.
The tab is closed, any running measurements are aborted, and all results for that
channel are deleted.
Remote command:
INSTrument:DELete on page 396
6.5.2 Laying out the Result Display with the SmartGrid
Measurement results can be evaluated in many different ways, for example graphically,
as summary tables, statistical evaluations etc. Each type of evaluation is displayed in a
separate window in the channel tab. Up to 16 individual windows can be displayed per
channel (i.e. per tab). To arrange the diagrams and tables on the screen, the Rohde &
Schwarz SmartGrid function helps you find the target position simply and quickly.
Principally, the layout of the windows on the screen is based on an underlying grid, the
SmartGrid. However, the SmartGrid is dynamic and flexible, allowing for many different
layout possibilities. The SmartGrid functionality provides the following basic features:
●
Windows can be arranged in columns or in rows, or in a combination of both.
●
Windows can be arranged in up to four rows and four columns.
●
Windows are moved simply by dragging them to a new position on the screen, possibly changing the layout of the other windows, as well.
●
All evaluation methods available for the currently selected measurement are displayed as icons in the evaluation bar. If the evaluation bar contains more icons
than can be displayed at once on the screen, it can be scrolled vertically. The same
evaluation method can be displayed in multiple windows simultaneously.
●
New windows are added by dragging an evaluation icon from the evaluation bar to
the screen. The position of each new window depends on where you drop the evaluation icon in relation to the existing windows.
90User Manual 1177.5633.02 ─ 13
Page 91

R&S®FSWP
6.5.2.1 Background Information: The SmartGrid Principle
Operating the Instrument
Displaying Results
●
All display configuration actions are only possible in SmartGrid mode. When SmartGrid mode is activated, the evaluation bar replaces the current softkey menu display. When the SmartGrid mode is deactivated again, the previous softkey menu
display is restored.
● Background Information: The SmartGrid Principle..................................................91
● How to Activate SmartGrid Mode............................................................................92
● How to Add a New Result Window......................................................................... 93
● How to Close a Result Window...............................................................................93
● How to Arrange the Result Windows...................................................................... 94
SmartGrid display
During any positioning action, the underlying SmartGrid is displayed. Different colors
and frames indicate the possible new positions. The position in the SmartGrid where
you drop the window determines its position on the screen.
Figure 6-1: Moving a window in SmartGrid mode
The brown area indicates the possible "drop area" for the window, i.e. the area in which
the window can be placed. A blue area indicates the (approximate) layout of the window as it would be if the icon were dropped at the current position. The frames indicate
the possible destinations of the new window with respect to the existing windows:
above/below, right/left or replacement (as illustrated in Figure 6-2). If an existing window would be replaced, the drop area is highlighted in a darker color shade.
91User Manual 1177.5633.02 ─ 13
Page 92

R&S®FSWP
Operating the Instrument
Displaying Results
Positioning the window
The screen can be divided into up to four rows. Each row can be split into up to four
columns, where each row can have a different number of columns. However, rows
always span the entire width of the screen and may not be interrupted by a column. A
single row is available as the drop area for the window in the SmartGrid. The row can
be split into columns, or a new row can be inserted above or below the existing row (if
the maximum of 4 has not yet been reached).
1
A
B
2 223 3
C
1
Figure 6-2: SmartGrid window positions
1 = Insert row above or below the existing row
2 = Create a new column in the existing row
3 = Replace a window in the existing row
SmartGrid functions
Once the evaluation icon has been dropped, icons in each window provide delete and
move functions.
The "Move" icon allows you to move the position of the window, possibly changing the
size and position of the other displayed windows.
The "Delete" icon allows you to close the window, enlarging the display of the remaining windows.
6.5.2.2 How to Activate SmartGrid Mode
All display configuration actions are only possible in SmartGrid mode. In SmartGrid
mode the evaluation bar replaces the current softkey menu display. When the SmartGrid mode is deactivated again, the previous softkey menu display is restored.
► To activate SmartGrid mode, do one of the following:
●
Select the "SmartGrid" icon from the toolbar.
● Select the "Display Config" button in the configuration "Overview" .
92User Manual 1177.5633.02 ─ 13
Page 93

R&S®FSWP
6.5.2.3 How to Add a New Result Window
Operating the Instrument
Displaying Results
● Select the "Display Config" softkey from the [Meas Config] menu.
The SmartGrid functions and the evaluation bar are displayed.
To close the SmartGrid mode and restore the previous softkey menu select the "Close"
icon in the right-hand corner of the toolbar, or press any key.
Each type of evaluation is displayed in a separate window. Up to 16 individual windows
can be displayed per channel (i.e. per tab).
1. Activate SmartGrid mode.
All evaluation methods available for the currently selected measurement are dis-
played as icons in the evaluation bar.
2. Select the icon for the required evaluation method from the evaluation bar.
If the evaluation bar contains more icons than can be displayed at once on the
screen, it can be scrolled vertically. Touch the evaluation bar between the icons
and move it up or down until the required icon appears.
3. Drag the required icon from the evaluation bar to the SmartGrid, which is displayed
in the diagram area, and drop it at the required position. (See Chapter 6.5.2.5,
"How to Arrange the Result Windows", on page 94 for more information on posi-
tioning the window).
Remote command:
LAYout:ADD[:WINDow]? on page 506 / LAYout:WINDow<n>:ADD? on page 512
6.5.2.4 How to Close a Result Window
► To close a window, activate SmartGrid mode and select the "Delete" icon for the
window.
Remote command:
LAYout:REMove[:WINDow] on page 509 / LAYout:WINDow<n>:REMove
on page 513
93User Manual 1177.5633.02 ─ 13
Page 94

R&S®FSWP
6.5.2.5 How to Arrange the Result Windows
Operating the Instrument
Displaying Results
1. Select an icon from the evaluation bar or the "Move" icon for an existing evaluation
window.
2. Drag the evaluation over the SmartGrid.
A blue area shows where the window will be placed.
3. Move the window until a suitable area is indicated in blue.
4. Drop the window in the target area.
The windows are rearranged to the selected layout, and "Delete" and "Move" icons
are displayed in each window.
5. To close a window, select the corresponding "Delete" icon.
Remote command:
LAYout:REPLace[:WINDow] on page 510 / LAYout:WINDow<n>:REPLace
on page 513
LAYout:MOVE[:WINDow] on page 509
6.5.3 Changing the Size of Windows
Each channel tab may contain several windows to evaluate the measurement results
using different methods. A "splitter" allows you to change the size of neighboring windows.
94User Manual 1177.5633.02 ─ 13
Page 95

R&S®FSWP
Operating the Instrument
Displaying Results
The splitters are not available in SmartGrid mode.
► To change the size of two neighboring windows, drag the splitter between the win-
dows in either direction.
6.5.4 Switching Between a Split and Maximized Window Display
To get an overview of the results, displaying several windows at the same time may be
helpful. However, the individual windows may become rather small. In this case it is
useful to maximize an individual window to the entire screen temporarily in order to
analyze the results in more detail.
To switch between a split and a maximized display without having to close and re-open
windows, press the [SPLIT/MAXIMIZE] key on the front panel. In maximized display,
the currently focused window is maximized. In split display, all active windows are displayed.
Alternatively, double-tap the title bar of a window to maximize it.
6.5.5 Changing the Display
The display can be optimized for your individual needs. The following display functions
are available and are described in detail in Chapter 12.2, "Display Settings",
on page 281 and Chapter 10.1, "Result Display Configuration", on page 193.
95User Manual 1177.5633.02 ─ 13
Page 96

R&S®FSWP
6.6 Remote Control
Operating the Instrument
Remote Control
●
Displaying a simulation of the entire front panel of the instrument on the screen
("Front Panel")
●
Displaying the main function hardkeys in a separate window on the screen ("Mini
Front Panel")
●
Hiding or showing various screen elements
●
Selecting a display theme and colors
●
Changing the display update rate
●
Activating or deactivating the touch-sensitivity of the screen
●
Zooming into the diagram
In addition to working with the R&S FSWP interactively, located directly at the instrument, it is also possible to operate and control it from a remote PC. Various methods
for remote control are supported:
●
Connecting the instrument to a (LAN) network
(See the R&S FSWP user manual.)
●
Using the Windows Remote Desktop application in a LAN network
●
Connecting a PC via the GPIB interface
How to configure the remote control interfaces is described in the User Manual.
The R&S FSWP is delivered with IECWIN installed, the auxiliary remote control tool
provided free of charge by Rohde & Schwarz.
For details on the IECWIN tool, see the "Network and Remote Control" chapter of the
R&S FSWP User Manual.
6.6.1 Remote Desktop Connection
Remote Desktop is a Windows application which can be used to access and control
the instrument from a remote computer through a LAN connection. While the instrument is in operation, the instrument screen contents are displayed on the remote computer. Remote Desktop provides access to all of the applications, files, and network
resources of the instrument. Thus, remote operation of the instrument is possible.
The Remote Desktop Client is part of the installed Windows operating system. For
other versions of Windows, Microsoft offers the Remote Desktop Client as an add-on.
6.6.2 Connecting a PC via the GPIB Interface
You can connect a PC to the R&S FSWP via the GPIB interface to send remote commands to control and operate the instrument. You can configure the GPIB address and
96User Manual 1177.5633.02 ─ 13
Page 97

R&S®FSWP
Operating the Instrument
Remote Control
the ID response string. The GPIB language is set as SCPI by default but can be
changed to emulate other instruments.
A GPIB interface is integrated on the rear panel of the instrument.
97User Manual 1177.5633.02 ─ 13
Page 98

R&S®FSWP
Applications
R&S MultiView
7 Applications
The R&S FSWP is a dedicated Phase Noise Analyzer whose main feature is the phase
noise measurement application.
When equipped accordingly (with optional hardware or software), it is able to provide
several additional applications for different analysis tasks (for example the spectrum
application).
When you activate an application, the R&S FSWP creates a new measurement channel which in turn determines the measurement settings for that application. You can
use the same application with different measurement settings by creating several
channels for the same application. Each channel is represented by a separate tab on
the screen.
Note that the number of channels can be limited by the available memory of the
R&S FSWP.
● R&S MultiView........................................................................................................ 98
● Available Applications............................................................................................. 99
● Starting an Application.......................................................................................... 101
● Running a Sequence of Measurements................................................................103
7.1 R&S MultiView
Each application is displayed in a separate tab. An additional tab ("MultiView") provides
an overview of all currently active channels at a glance. In the "MultiView" tab, each
individual window contains its own channel bar with an additional button. Select this
button to switch to the corresponding channel display quickly.
98User Manual 1177.5633.02 ─ 13
Page 99

R&S®FSWP
7.2 Available Applications
Applications
Available Applications
Remote command:
DISPlay:FORMat on page 505
Depending on its outfit, the R&S FSWP provides one or more applications for specific
measurement tasks.
Phase Noise..................................................................................................................99
Spectrum Monitor..........................................................................................................99
Spectrum.....................................................................................................................100
Analog Modulation Analysis........................................................................................100
I/Q Analyzer................................................................................................................ 100
Noise Figure................................................................................................................100
Pulse Measurements.................................................................................................. 101
Spurious Measurements............................................................................................. 101
Transient Analysis.......................................................................................................101
Vector Signal Analysis (VSA)......................................................................................101
Phase Noise
The phase noise application provides measurement functions to measure the phase
noise characteristics of a DUT.
This application is used in the initial configuration.
For details, refer to Chapter 8, "Measurements and Result Displays", on page 107.
Remote command:
INST:SEL PNO, see INSTrument[:SELect] on page 397
Spectrum Monitor
The spectrum monitor application provides measurement functions for basic I/Q data
analysis.
It runs on the phase noise analyzer hardware and is available for free with firmware
version 1.60.
Compared to the full I/Q analyzer, which runs on the optional spectrum analyzer hardware, it has the following characteristics and limitations.
●
When you open a spectrum monitor, the frequency, level and input parameters are
initially adopted from the phase noise application (you can change them in the
spectrum monitor, of course).
Those settings are the same as in the full I/Q analyzer.
●
Maximum analysis bandwidth of 20 MHz and sample rate of 25 MHz (and no support of bandwidth extensions).
●
Advanced data acquisition settings are unavailable.
●
I/Q data import and export are the same as in the full I/Q analyzer.
●
Spectrograms, general marker functionality, marker functions and limit lines are the
same as in the full I/Q analyzer.
●
Only external triggers are supported.
●
Only evaluation of the frequency spectrum is supported.
99User Manual 1177.5633.02 ─ 13
Page 100

R&S®FSWP
Applications
Available Applications
●
Trace mathematics are not available.
All other functionality is the same as that of the I/Q analyzer.
For details, refer to the user manual of the I/Q analyzer.
Remote command:
INST:SEL SMONitor, see INSTrument[:SELect] on page 397
Spectrum
The spectrum application is an optional application that is available with R&S FSWPB1.
In the spectrum application, the provided functions correspond to those of a conventional spectrum analyzer. The analyzer measures the frequency spectrum of the RF
input signal over the selected frequency range with the selected resolution and sweep
time, or, for a fixed frequency, displays the waveform of the video signal.
For details, refer to the user manual of the spectrum analyzer measurement application.
Remote command:
INST:SEL SAN, see INSTrument[:SELect] on page 397
Analog Modulation Analysis
The analog modulation analysis application requires an instrument equipped with the
spectrum analyzer hardware (R&S FSWP-B1) and the analog modulation analysis
option (R&S FSWP-K7).
The analog modulation analysis application provides measurement functions for
demodulating AM, FM, or PM signals.
For details, refer to the user manual of the analog modulation analysis application.
Remote command:
INST:SEL ADEM, see INSTrument[:SELect] on page 397
I/Q Analyzer
The I/Q analyzer application requires an instrument equipped with the spectrum analyzer hardware component (R&S FSWP-B1).
The I/Q analyzer application provides measurement and display functions for I/Q data.
For details, refer to the user manual of the I/Q analyzer.
Remote command:
INST:SEL IQ, see INSTrument[:SELect] on page 397
Noise Figure
The noise figure application requires an instrument equipped with the spectrum analyzer hardware (R&S FSWP-B1) and the noise figure Measurements option
(R&S FSWP-K30).
For details, refer to the user manual of the noise figure measurement application.
Remote command:
INST:SEL NOISE, see INSTrument[:SELect] on page 397
100User Manual 1177.5633.02 ─ 13
 Loading...