


R&S®FSW-K40
Phase Noise Measurements
User Manual
(;×êä2)
1173.9286.02 ─ 15
User Manual

This manual applies to the following R&S®FSW models with firmware version 2.60 and higher:
●
R&S®FSW8 (1312.8000K08)
●
R&S®FSW13 (1312.8000K13)
●
R&S®FSW26 (1312.8000K26)
●
R&S®FSW43 (1312.8000K43)
●
R&S®FSW50 (1312.8000K50)
●
R&S®FSW67 (1312.8000K67)
●
R&S®FSW85 (1312.8000K85)
The following firmware options are described:
●
R&S FSW-K40 (1313.1397.02)
© 2017 Rohde & Schwarz GmbH & Co. KG
Mühldorfstr. 15, 81671 München, Germany
Phone: +49 89 41 29 - 0
Fax: +49 89 41 29 12 164
Email: info@rohde-schwarz.com
Internet: www.rohde-schwarz.com
Subject to change – Data without tolerance limits is not binding.
R&S® is a registered trademark of Rohde & Schwarz GmbH & Co. KG.
Trade names are trademarks of their owners.
Throughout this manual, products from Rohde & Schwarz are indicated without the ® symbol , e.g. R&S®FSW is indicated as
R&S FSW.

R&S®FSW-K40
1 Preface.................................................................................................... 5
1.1 About this Manual......................................................................................................... 5
1.2 Documentation Overview............................................................................................. 6
1.3 Conventions Used in the Documentation...................................................................7
2 Welcome to the Phase Noise Measurement Application................... 9
2.1 Starting the Application................................................................................................9
2.2 Understanding the Display Information....................................................................10
3 Measurements and Result Displays...................................................14
4 Measurement Basics........................................................................... 22
4.1 Spurs and Spur Removal........................................................................................... 22
Contents
Contents
4.2 Residual Effects.......................................................................................................... 23
4.3 Measurement Range................................................................................................... 24
4.4 Sweep Modes.............................................................................................................. 25
4.5 Trace Averaging.......................................................................................................... 25
4.6 Frequency Determination...........................................................................................27
4.7 Level Determination....................................................................................................30
4.8 Signal Attenuation...................................................................................................... 30
4.9 Using Limit Lines........................................................................................................ 31
4.10 Analyzing Several Traces - Trace Mode....................................................................33
4.11 Using Markers............................................................................................................. 35
5 Configuration........................................................................................36
5.1 Configuration Overview..............................................................................................36
5.2 Default Settings for Phase Noise Measurements.................................................... 37
5.3 Configuring the Frontend...........................................................................................38
5.4 Controlling the Measurement.................................................................................... 40
5.5 Configuring the Measurement Range....................................................................... 43
5.6 Performing Measurements.........................................................................................46
5.7 Configuring In- and Outputs...................................................................................... 48
5.8 Automatic Measurement Configuration....................................................................49
6 Analysis................................................................................................ 51
3User Manual 1173.9286.02 ─ 15

R&S®FSW-K40
6.1 Configuring Graphical Result Displays.................................................................... 51
6.2 Configure Numerical Result Displays....................................................................... 56
6.3 Using Limit Lines........................................................................................................ 58
6.4 Using Markers............................................................................................................. 65
7 How to Configure Phase Noise Measurements.................................68
7.1 Performing a Basic Phase Noise Measurement.......................................................68
7.2 Customizing the Measurement Range...................................................................... 68
8 Remote Control Commands for Phase Noise Measurements......... 70
8.1 Common Suffixes........................................................................................................70
8.2 Introduction................................................................................................................. 71
8.3 Controlling the Phase Noise Measurement Channel...............................................76
8.4 Performing Measurements.........................................................................................80
Contents
8.5 Configuring the Result Display..................................................................................85
8.6 Configuring the Frontend...........................................................................................92
8.7 Controlling the Measurement.................................................................................... 95
8.8 Configuring the Measurement Range....................................................................... 99
8.9 Using Limit Lines...................................................................................................... 106
8.10 Graphical Display of Phase Noise Results............................................................. 116
8.11 Configure Numerical Result Displays..................................................................... 126
8.12 Using Markers........................................................................................................... 139
8.13 Configuring In- and Outputs.................................................................................... 145
8.14 Automatic Measurement Configuration..................................................................146
8.15 Using the Status Register........................................................................................ 147
8.16 Remote Control Example Scripts............................................................................ 153
List of Remote Commands (Phase Noise).......................................159
Index....................................................................................................164
4User Manual 1173.9286.02 ─ 15

R&S®FSW-K40
1 Preface
Preface
About this Manual
1.1 About this Manual
This User Manual provides all the information specific to the application. All general
instrument functions and settings common to all applications and operating modes are
described in the main R&S FSW User Manual.
The main focus in this manual is on the measurement results and the tasks required to
obtain them. The following topics are included:
●
Welcome to the Phase Noise Application
Introduction to and getting familiar with the application
●
Typical applications
Example measurement scenarios in which the application is frequently used.
●
Measurements and Result Displays
Details on supported measurements and their result types
●
Phase Noise Measurement Basics
Background information on basic terms and principles in the context of the measurement
●
Phase Noise Measurement Configuration + Analysis
A concise description of all functions and settings available to configure measurements and analyze results with their corresponding remote control command
●
How to Perform Measurements with the Phase Noise Application
The basic procedure to perform each measurement and step-by-step instructions
for more complex tasks or alternative methods
●
Measurement Examples
Detailed measurement examples to guide you through typical measurement scenarios and allow you to try out the application immediately
●
Optimizing and Troubleshooting the Measurement
Hints and tips on how to handle errors and optimize the test setup
●
Remote Commands for Phase Noise Measurements
Remote commands required to configure and perform phase noise measurements
in a remote environment, sorted by tasks
(Commands required to set up the environment or to perform common tasks on the
instrument are provided in the main R&S FSW User Manual)
Programming examples demonstrate the use of many commands and can usually
be executed directly for test purposes
●
Annex
Reference material
●
List of remote commands
Alphabetical list of all remote commands described in the manual
●
Index
5User Manual 1173.9286.02 ─ 15

R&S®FSW-K40
Preface
Documentation Overview
1.2 Documentation Overview
This section provides an overview of the R&S FSW user documentation. You find it on
the product page at:
www.rohde-schwarz.com/manual/FSW
Getting started manual
Introduces the R&S FSW and describes how to set up and start working with the product. Includes basic operations, typical measurement examples, and general information, e.g. safety instructions, etc. A printed version is delivered with the instrument.
Online help
The online help offers quick, context-sensitive access to the complete information for
the base unit and the software options directly on the instrument.
User manual
Separate manuals for the base unit and the software options are provided for download:
●
Base unit manual
Contains the description of all instrument modes and functions. It also provides an
introduction to remote control, a complete description of the remote control commands with programming examples, and information on maintenance, instrument
interfaces and error messages. Includes the contents of the getting started manual.
●
Software option manual
Contains the description of the specific functions of an option. Basic information on
operating the R&S FSW is not included.
The online version of the user manual provides the complete contents for immediate
display on the internet.
Service manual
Describes the performance test for checking the rated specifications, module replacement and repair, firmware update, troubleshooting and fault elimination, and contains
mechanical drawings and spare part lists.
The service manual is available for registered users on the global Rohde & Schwarz
information system (GLORIS, https://gloris.rohde-schwarz.com).
Instrument security procedures manual
Deals with security issues when working with the R&S FSW in secure areas.
Basic safety instructions
Contains safety instructions, operating conditions and further important information.
The printed document is delivered with the instrument.
6User Manual 1173.9286.02 ─ 15

R&S®FSW-K40
Preface
Conventions Used in the Documentation
Data sheet and brochure
The data sheet contains the technical specifications of the R&S FSW. It also lists the
options and their order numbers as well as optional accessories.
The brochure provides an overview of the instrument and deals with the specific characteristics.
See www.rohde-schwarz.com/brochure-datasheet/FSW
Release notes and open source acknowledgment (OSA)
The release notes list new features, improvements and known issues of the current
firmware version, and describe the firmware installation.
The open source acknowledgment document provides verbatim license texts of the
used open source software.
See www.rohde-schwarz.com/firmware/FSW
Application notes, application cards, white papers, etc.
These documents deal with special applications or background information on particular topics.
See www.rohde-schwarz.com/application/FSW
1.3 Conventions Used in the Documentation
1.3.1 Typographical Conventions
The following text markers are used throughout this documentation:
Convention Description
"Graphical user interface elements"
KEYS Key names are written in capital letters.
File names, commands,
program code
Input Input to be entered by the user is displayed in italics.
All names of graphical user interface elements on the screen, such as
dialog boxes, menus, options, buttons, and softkeys are enclosed by
quotation marks.
File names, commands, coding samples and screen output are distinguished by their font.
Links Links that you can click are displayed in blue font.
"References" References to other parts of the documentation are enclosed by quota-
tion marks.
7User Manual 1173.9286.02 ─ 15

R&S®FSW-K40
Preface
Conventions Used in the Documentation
1.3.2 Conventions for Procedure Descriptions
When describing how to operate the instrument, several alternative methods may be
available to perform the same task. In this case, the procedure using the touchscreen
is described. Any elements that can be activated by touching can also be clicked using
an additionally connected mouse. The alternative procedure using the keys on the
instrument or the on-screen keyboard is only described if it deviates from the standard
operating procedures.
The term "select" may refer to any of the described methods, i.e. using a finger on the
touchscreen, a mouse pointer in the display, or a key on the instrument or on a keyboard.
1.3.3 Notes on Screenshots
When describing the functions of the product, we use sample screenshots. These
screenshots are meant to illustrate as much as possible of the provided functions and
possible interdependencies between parameters.
The screenshots usually show a fully equipped product, that is: with all options installed. Thus, some functions shown in the screenshots may not be available in your particular product configuration.
8User Manual 1173.9286.02 ─ 15

R&S®FSW-K40
2 Welcome to the Phase Noise Measurement
Welcome to the Phase Noise Measurement Application
Starting the Application
Application
The R&S FSW-K40 is a firmware application that adds functionality to measure the
phase noise characteristics of a device under test with the R&S FSW signal analyzer.
This user manual contains a description of the functionality that the application provides, including remote control operation.
Functions that are not discussed in this manual are the same as in the Spectrum application and are described in the R&S FSW User Manual. The latest versions of the
manuals are available for download at the product homepage.
http://www2.rohde-schwarz.com/product/FSW.html.
Installation
Find detailed installing instructions in the Getting Started or the release notes of the
R&S FSW.
● Starting the Application............................................................................................. 9
● Understanding the Display Information...................................................................10
2.1 Starting the Application
The phase noise measurement application adds a new type of measurement to the
R&S FSW.
To activate the the Phase Noise application
1. Select the MODE key.
A dialog box opens that contains all operating modes and applications currently
available on your R&S FSW.
2. Select the "Phase Noise" item.
The R&S FSW opens a new measurement channel for the Phase Noise application.
All settings specific to phase noise measurements are in their default state.
Multiple Measurement Channels and Sequencer Function
When you enter an application, a new measurement channel is created which determines the measurement settings for that application. The same application can be activated with different measurement settings by creating several channels for the same
application.
9User Manual 1173.9286.02 ─ 15
R&S®FSW-K40
Welcome to the Phase Noise Measurement Application
Understanding the Display Information
The number of channels that can be configured at the same time depends on the available memory on the instrument.
Only one measurement can be performed at any time, namely the one in the currently
active channel. However, in order to perform the configured measurements consecutively, a Sequencer function is provided.
If activated, the measurements configured in the currently active channels are performed one after the other in the order of the tabs. The currently active measurement is
indicated by a
symbol in the tab label. The result displays of the individual channels
are updated in the tabs (as well as the "MultiView") as the measurements are performed. Sequential operation itself is independent of the currently displayed tab.
For details on the Sequencer function see the R&S FSW User Manual.
2.2 Understanding the Display Information
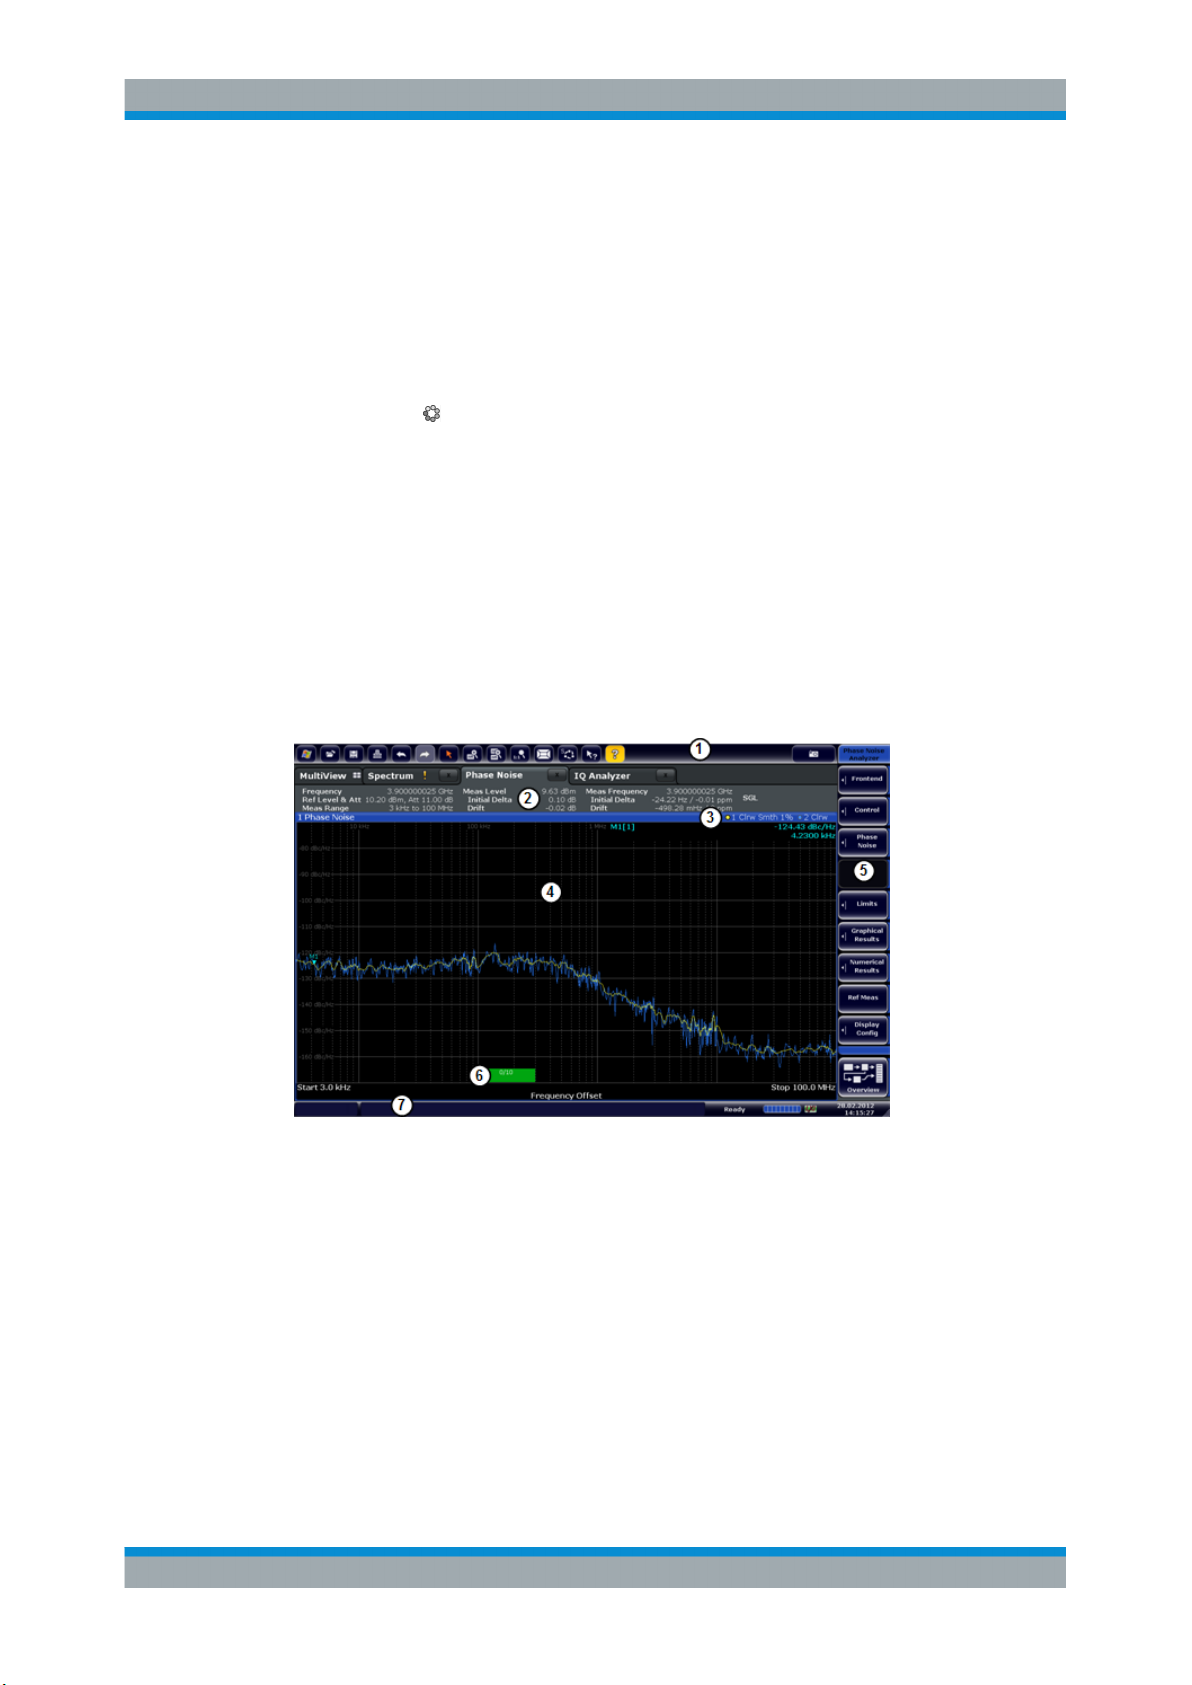
The following figure shows the display as it looks for phase noise measurements. All
different information areas are labeled. They are explained in more detail in the following sections.
Figure 2-1: Screen layout of the phase noise measurement application
1 = Toolbar
2 = Channel bar
3 = Diagram header
4 = Result display
5 = Softkey bar
6 = Measurement status
7 = Status bar
For a description of the elements not described below, please refer to the Getting Started of the R&S FSW.
10User Manual 1173.9286.02 ─ 15

R&S®FSW-K40
Welcome to the Phase Noise Measurement Application
Understanding the Display Information
Measurement status
The application shows the progress of the measurement in a series of green bars at
the bottom of the diagram area. For each half decade in the measurement, the applications adds a bar that spans the frequency range of the corresponding half decade.
The bar has several features.
●
The numbers within the green bar show the progress of the measurement(s) in the
half decade the application currently works on.
The first number is the current, the second number the total count of measurements for that half decade. The last number is the time the measurement requires.
●
A double-click on the bar opens an input field to define the number of averages for
that half decade.
●
A right-click on the bar opens a context menu.
The context menu provides easy access to various parameters (resolution bandwidth, sweep mode etc.) that define the measurement characteristics for a half
decade. The values in parentheses are the currently selected values. For more
information on the available parameters see "Half Decades Configuration Table"
on page 46.
Channel bar information
The channel bar contains information about the current measurement setup, progress
and results.
Figure 2-2: Channel bar of the phase noise application
Frequency Frequency the R&S FSW has been tuned to.
The frontend frequency is the expected frequency of the carrier. When frequency tracking or verification is on, the application might adjust the frontend
frequency.
Ref Level & Att Reference level (first value) and attenuation (second value) of the R&S FSW.
When level tracking or verification is on, the application might adjust the frontend level.
Measurement Complete phase noise measurement range. For more information see Chap-
ter 4.3, "Measurement Range", on page 24.
Measured Level DUT level that has been actually measured.
The measured level might differ from the frontend level, e.g. if you are using
level verification.
Initial Delta Difference between the nominal level and the first level that has been mea-
sured.
11User Manual 1173.9286.02 ─ 15
R&S®FSW-K40
Welcome to the Phase Noise Measurement Application
Understanding the Display Information
Drift Difference between the 1st level that has been measured and the level that
has been measured last.
In continuous sweep mode, the drift is the difference between the 1st level that
has been measured in the 1st sweep and the level that has been measured
last.
Measured Frequency DUT frequency that has been actually measured.
The measured frequency might differ from the frontend frequency, e.g. if you
are using level verification.
Initial Delta Difference between the nominal frequency and the first frequency that has
been measured.
Drift Difference between the 1st frequency that has been measured and the fre-
quency that has been measured last.
In continuous sweep mode, the drift is the difference between the 1st fre-
quency that has been measured in the 1st sweep and the frequency that has
been measured last.
SGL [#/#] Sweep mode (single or continuous). If you use trace averaging, it also shows
the current measurement number out of the total number of measurements.
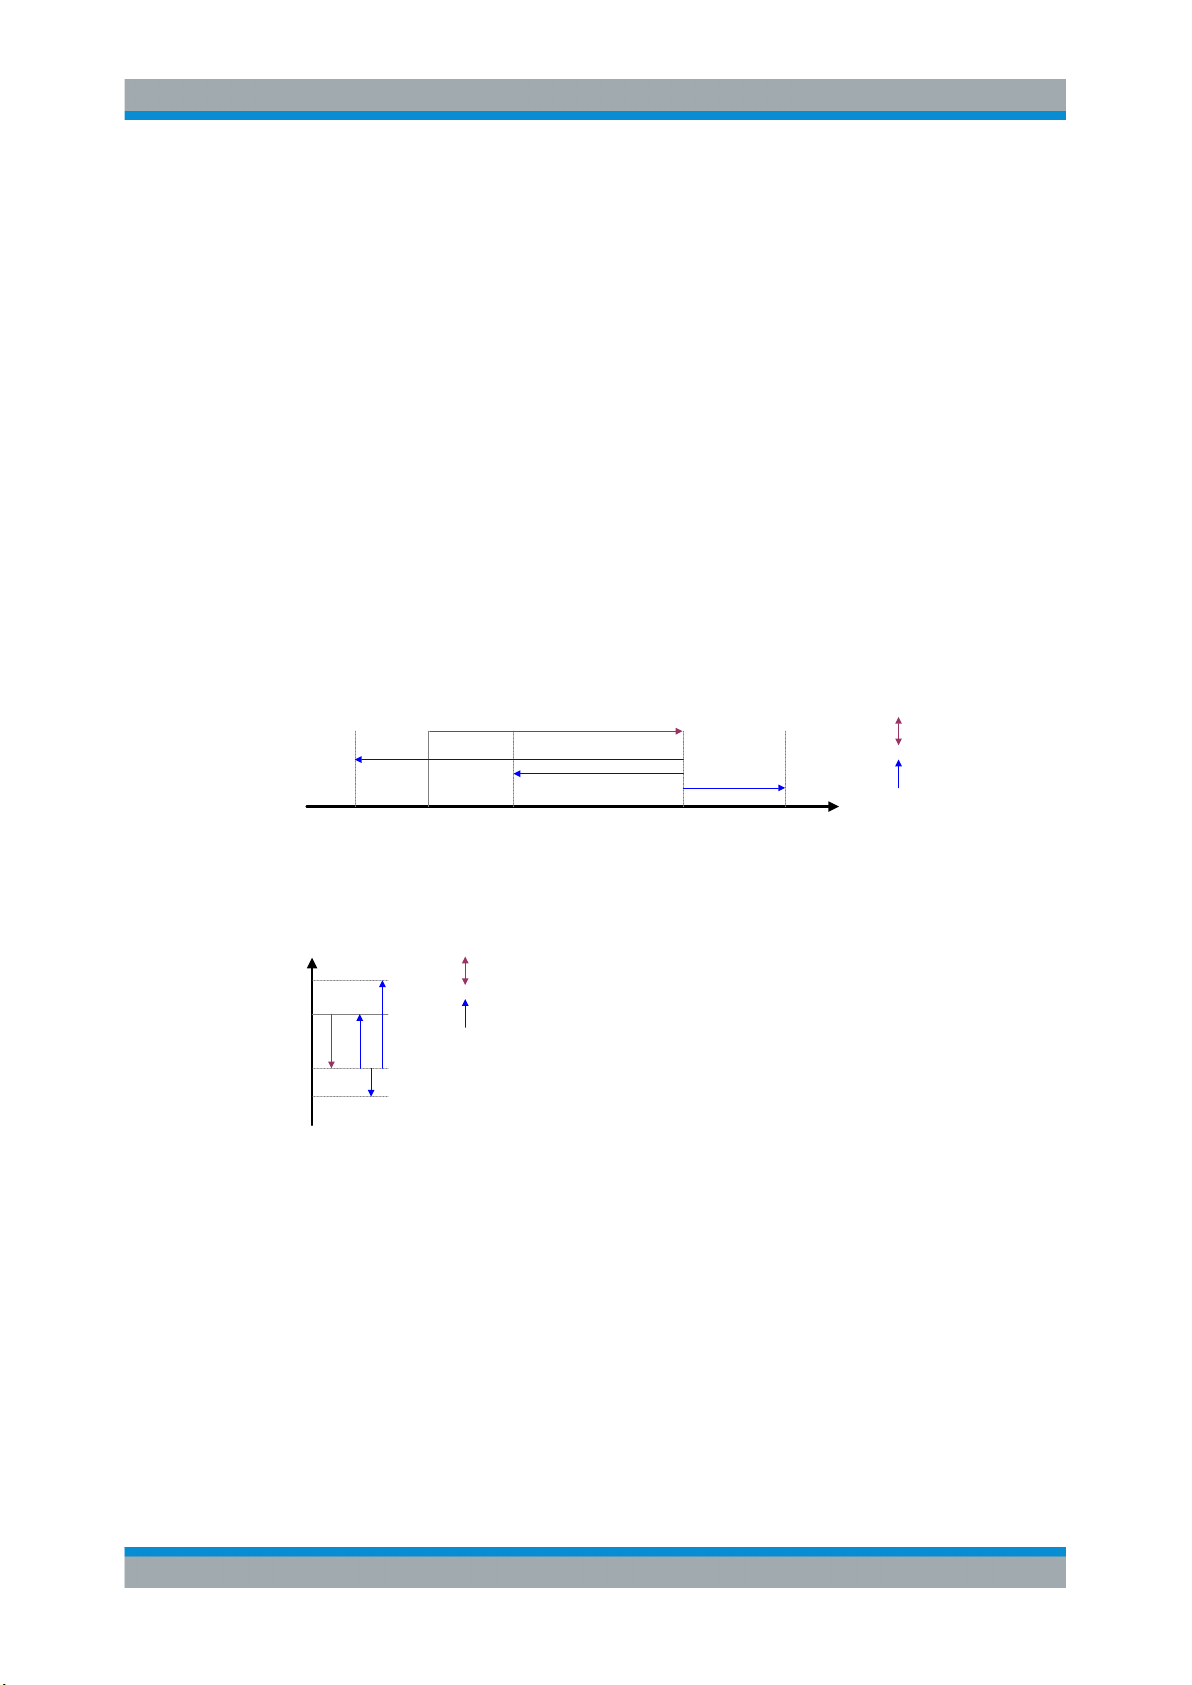
The following two figures show the relations between the frequency and level errors.
initial
offset
frequency
drift
f
meas_3
front
f
meas_2
f
f
Figure 2-3: Frequency errors
f
= initial frequency set on the frontend
front
f
= actual frequency that has been measured
meas_x
P
P
meas_2
P
front
P
meas_1
P
meas_3
initial
offset
level drift
Figure 2-4: Level errors
P
= reference level if tracking = off
front
P
= initial reference level if tracking = on
front
P
= becomes reference level after first sweep if tracking = on
meas_1
P
= becomes reference level after second sweep if tracking = on
meas_2
P
= becomes reference level after third sweep if tracking = on
meas_3
meas_1
f
meas_4
f
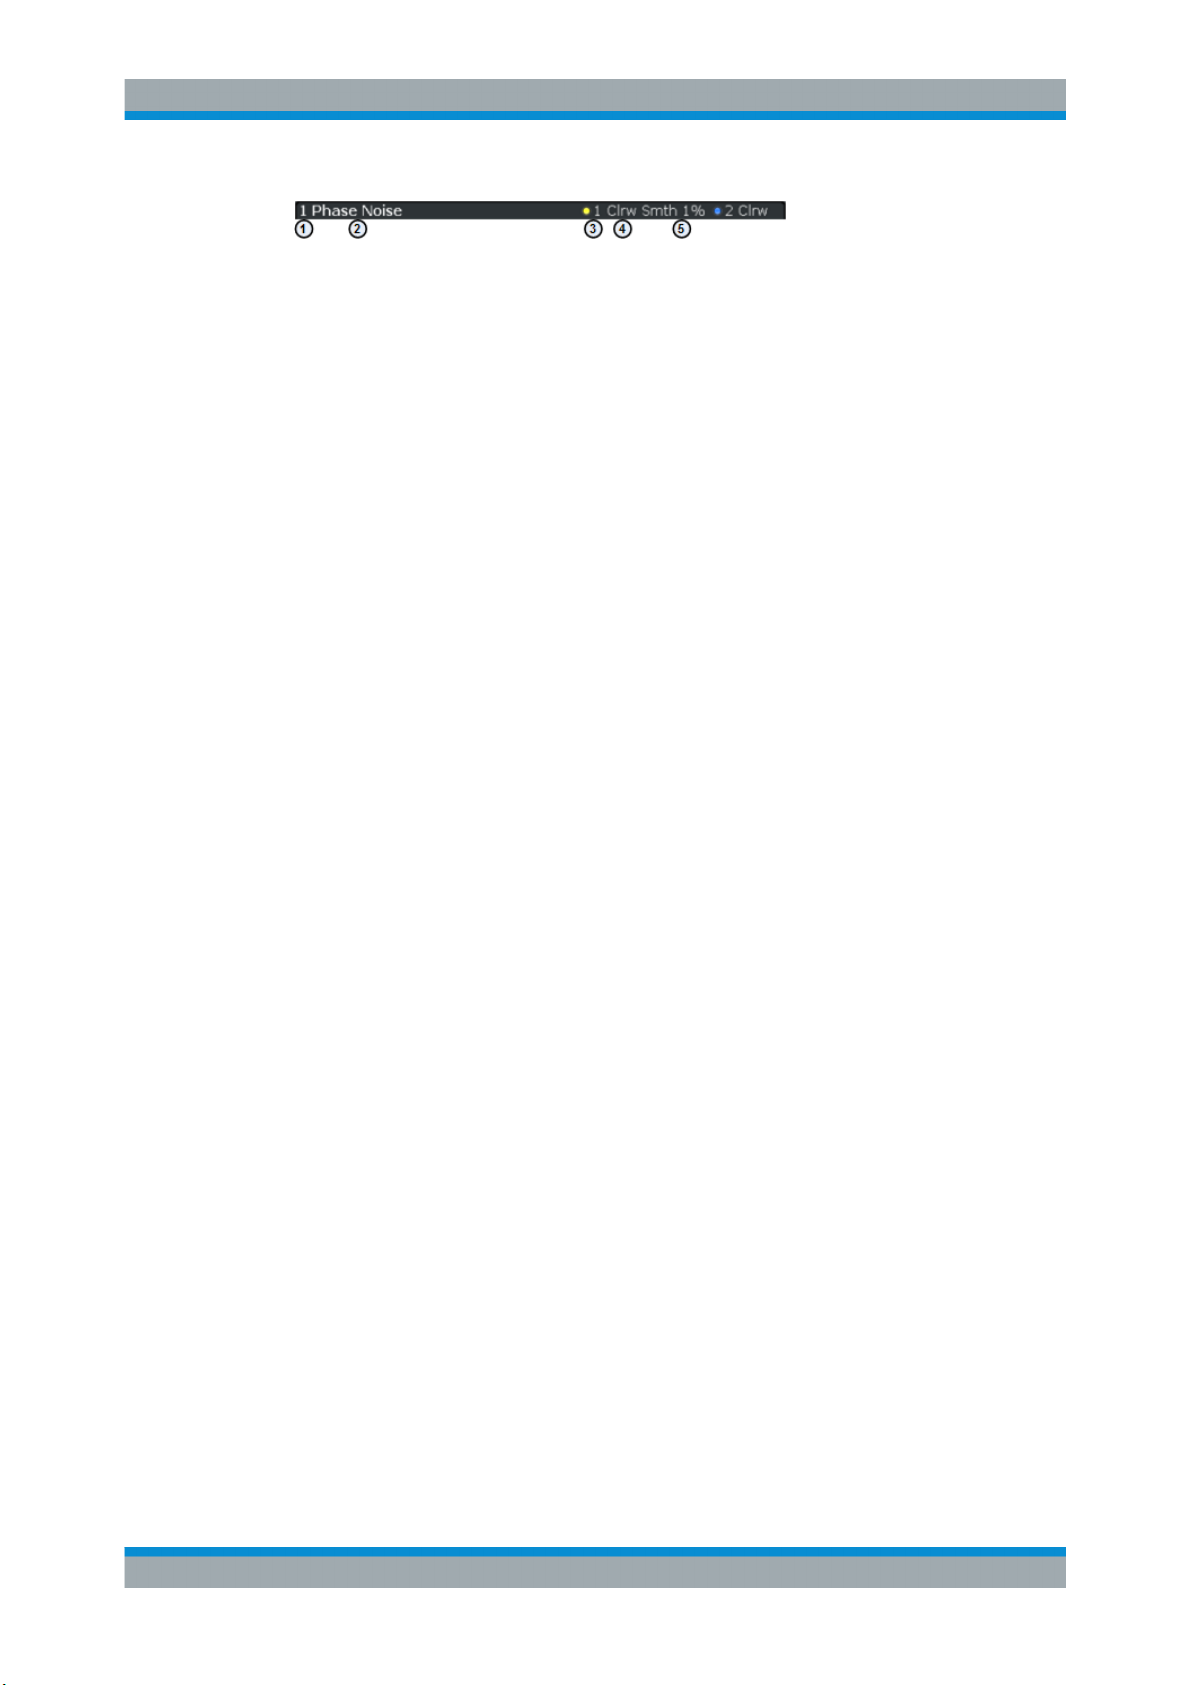
Window title bar information
For each diagram, the header provides the following information:
12User Manual 1173.9286.02 ─ 15
R&S®FSW-K40
Welcome to the Phase Noise Measurement Application
Understanding the Display Information
Figure 2-5: Window title bar information of the phase noise application
1 = Window number
2 = Window type
3 = Trace color and number
4 = Trace mode
5 = Smoothing state and degree
Status bar information
Global instrument settings, the instrument status and any irregularities are indicated in
the status bar beneath the diagram. Furthermore, the progress of the current operation
is displayed in the status bar.
13User Manual 1173.9286.02 ─ 15

R&S®FSW-K40
3 Measurements and Result Displays
Measurements and Result Displays
Access:
The Phase Noise application measures the phase noise of a single sideband of a carrier.
It features several result displays. Result displays are different representations of the
measurement results. They may be diagrams that show the results in a graphic way or
tables that show the results in a numeric way.
In the default state of the application, only the graphical display of phase noise results
is active.
Phase Noise Diagram................................................................................................... 14
Residual Noise..............................................................................................................15
Spot Noise.....................................................................................................................16
Spur List........................................................................................................................17
Sweep Result List......................................................................................................... 18
Spectrum Monitor..........................................................................................................19
Frequency Drift..............................................................................................................20
Frequency and Level Stability.......................................................................................21
Reference Measurement...............................................................................................21
Phase Noise Diagram
The phase noise diagram shows the power level of the phase noise over a variable frequency offset from the carrier frequency.
Measurement range
The unit of both axes in the diagram is fix. The x-axis always shows the offset frequencies in relation to the carrier frequency on a logarithmic scale in Hz. It always has a
logarithmic scale to make sure of a equal representation of offsets near and far away
from the carrier. The range of offsets that the x-axis shows is variable and depends on
the measurement range you have defined and the scope of the x-axis that you have
set.
For more information on the measurement range see Chapter 4.3, "Measurement
Range", on page 24.
If the measurement range you have set is necessary, but you need a better resolution
of the results, you can limit the displayed result by changing the x-axis scope. The
scope works like a zoom to get a better view of the trace at various points. It does not
start a new measurement or alter the current measurements results in any way.
The y-axis always shows the phase noise power level contained in a 1 Hz bandwidth in
relation to the level of the carrier. The unit for this information is dBc/Hz and is also fix.
Y-axis scale
The scale of the y-axis is variable. Usually it is best to use the automatic scaling that
the application provides, because it makes sure that the whole trace is always visible.
You can, however, also customize the range, the minimum and the maximum values
on the y-axis by changing the y-axis scale.
14User Manual 1173.9286.02 ─ 15

R&S®FSW-K40
Measurements and Result Displays
The measurement results are displayed as traces in the diagram area. Up to six active
traces at any time are possible. Each of those may have a different setup and thus
show different aspects of the measurement results.
In the default state, the application shows two traces. A yellow one and a blue one.
Both result from the same measurement data, but have been evaluated differently. On
the first trace, smoothing has been applied, the second one shows the raw data.
For more information on trace smoothing see Chapter 4.5, "Trace Averaging",
on page 25.
Figure 3-1: Overview of the phase noise result display
The figure above shows a phase noise curve with typical characteristics. Frequency
offsets near the carrier usually have higher phase noise levels than those further away
from the carrier. The curve has a falling slope until the thermal noise of the DUT has
been reached. From this point on, it is more or less a straight horizontal line.
Remote command:
TRACe[:DATA]? on page 125
Residual Noise
The residual noise display summarizes the residual noise results in a table.
For more information on the residual noise results see Chapter 4.2, "Residual Effects",
on page 23.
The table consists of up to four rows with each row representing a different integration
interval. Each row basically contains the same information with the exception that the
first row always shows the results for the first trace and the other rows with custom
integration ranges the results for any one trace.
The residual noise information is made up out of several values.
15User Manual 1173.9286.02 ─ 15

R&S®FSW-K40
Measurements and Result Displays
Type Shows the number of the trace that is integrated (T[x]).
Start / Stop Offset Shows the start and stop offset of the integration interval.
Int. PHN Shows the Integrated Phase Noise.
The integral is calculated over the frequency range defined by the Start and Stop
Offset values.
PM Shows the Residual PM result in degrees and rad.
FM Shows the Residual FM results in Hz.
Jitter Shows the Jitter in seconds.
For more information on residual noise see Chapter 4.2, "Residual Effects",
on page 23.
Remote command:
Querying Residual PM:
FETCh:PNOise<t>:RPM? on page 129
Querying Residual FM:
FETCh:PNOise<t>:RFM? on page 129
Querying Jitter:
FETCh:PNOise<t>:RMS? on page 129
Querying Integrated Phase Noise
Querying user ranges:
FETCh:PNOise<t>:USER<range>:RFM? on page 130
FETCh:PNOise<t>:USER<range>:RMS? on page 130
FETCh:PNOise<t>:USER<range>:RPM? on page 131
Spot Noise
Spot noise is the phase noise at a particular frequency offset (or spot) that is part of the
measurement range. It is thus like a fixed marker.
The unit of spot noise results is dBc/Hz. The application shows the results in a table.
The table consists of a variable number of 10x frequencies (depending on the measurement range), and a maximum of five user frequencies, with each row containing
the spot noise information for a particular frequency offset.
The spot noise information is made up out of several variables.
16User Manual 1173.9286.02 ─ 15

R&S®FSW-K40
Measurements and Result Displays
Type Shows where the spot noise offset frequency comes from. By default, the applica-
tion evaluates the spot noise for the first offset frequency of a decade only (10x Hz,
beginning at 1 kHz). However, you can add up to five customized offsets frequencies that you want to know the phase noise for. If you want to use more custom
offsets, you can add another spot noise table.
The "User" label indicates a custom offset frequency.
Offset Frequency Shows the offset frequency the spot noise is evaluated for. You may add any offset
that is part of the measurement range.
The number in brackets (T<x>) indicates the trace the result refers to.
Phase Noise Shows the phase noise for the corresponding offset frequency.
The number in brackets (T<x>) indicates the trace the result refers to.
Note that the spot noise results are calculated for a particular trace only. You can
select the trace by tapping on the trace LED in the header of the result display.
Remote command:
Querying spot noise results on 10x offset frequencies:
CALCulate<n>:SNOise:DECades:X? on page 132
CALCulate<n>:SNOise:DECades:Y? on page 132
Querying custom spot noise results:
CALCulate<n>:SNOise<m>:Y? on page 134
Trace selection: DISPlay[:WINDow<n>]:TRACe<t>:SELect on page 134
Spur List
Spurs are peak levels at one or more offset frequencies and are caused mostly by
interfering signals. The application shows the location of all detected spurs in a table.
The table consists of a variable number of rows. For each detected spur, the table
shows several results.
Number Shows the spur number. Spurs are sorted by their frequency, beginning with
the spur with the lowest frequency.
Offset Frequency Shows the position (offset frequency) of the spur.
17User Manual 1173.9286.02 ─ 15

R&S®FSW-K40
Measurements and Result Displays
Power Shows the power level of the spur in dBc.
Jitter Shows the jitter value of the spur in s.
In addition to the jitter for each spur, the result display also shows the Discrete Jitter and the Random Jitter at the end of the table.
●
The Discrete Jitter is the RMS value of all individual jitter values.
●
The Random Jitter is the difference of the overall jitter (as shown in the
Residual Noise result display) and the Discrete Jitter.
The result is an RMS value: RandomJitter2 = Jitter2 - DiscreteJitter
For more information see Chapter 4.1, "Spurs and Spur Removal", on page 22.
Remote command:
FETCh:PNOise:SPURs? on page 135
FETCh:PNOise:SPURs:DISCrete? on page 135
FETCh:PNOise:SPURs:RANDom? on page 135
Sweep Result List
The sweep result list summarizes the results of the phase noise measurement.
2
The table consists of several rows with each row representing a half decade. The number of rows depends on the number of half decades analyzed during the measurement.
The sweep results are made up out of several values.
●
Results in a red font indicate that the frequency drift is so large that the frequency
has drifted into the range of a higher half decade. The result is therefore invalid.
●
Results in a green font indicate the half decade that is currently measured.
Start / Stop Shows the start and stop offset of the half decade.
Sampling Rate Shows the sample rate used in the corresponding half decade.
AVG Shows the number of measurements performed in the half decade to calculate the
average (final) result.
Freq Drift Shows the difference to the initial (nominal) frequency that was measured in the
half decade.
If you perform more than one measurement (averages) in the half decade, the
value is updated for each single measurement. The last value that has been measured in the half decade will remain in the table.
18User Manual 1173.9286.02 ─ 15

R&S®FSW-K40
Measurements and Result Displays
Max Drift Shows the highest difference to the initial (nominal) frequency that was measured
in the half decade.
Level Drift Shows the difference to the initial (nominal) level that was measured in the half
decade.
If you perform more than one measurement (averages) in the half decade, the
value is updated for each single measurement. The last value that has been measured in the half decade will remain in the table.
Remote command:
Start offset: FETCh:PNOise:SWEep:STARt? on page 138
Stop offset: FETCh:PNOise:SWEep:STOP? on page 138
Sample rate: FETCh:PNOise:SWEep:SRATe? on page 138
Averages: FETCh:PNOise:SWEep:AVG? on page 136
Frequency drift: FETCh:PNOise:SWEep:FDRift? on page 137
Max drift: FETCh:PNOise:SWEep:MDRift? on page 137
Level drift: FETCh:PNOise:SWEep:LDRift? on page 137
Spectrum Monitor
The spectrum monitor shows the spectrum for the half decade that is currently measured.
Span
The span on the x-axis is defined by the start and stop frequency of the half decade
that is currently measured.
Y-axis scale
The scale of the y-axis is automatically determined according to the signal characteristics.
In I/Q mode, the result display contains two traces.
●
The yellow trace ("raw trace") represents the live signal with the actual center frequency currently measured.
19User Manual 1173.9286.02 ─ 15
R&S®FSW-K40
Measurements and Result Displays
●
The blue trace ("track trace") equalizes frequency drifting signals and thus shows a
stable version of the signal with the intended center frequency.
If necessary, you can turn the traces on and off. For more information see "Spectrum
Monitor: Raw Trace / Trk Trace (On Off)" on page 56.
The green vertical lines indicate the phase noise offset to be measured on in relation to
the displayed center frequency.The position of the two green line depends on the half
decade that is currently measured and the sample rate you have selected.
Remote command:
TRACe[:DATA]? on page 125
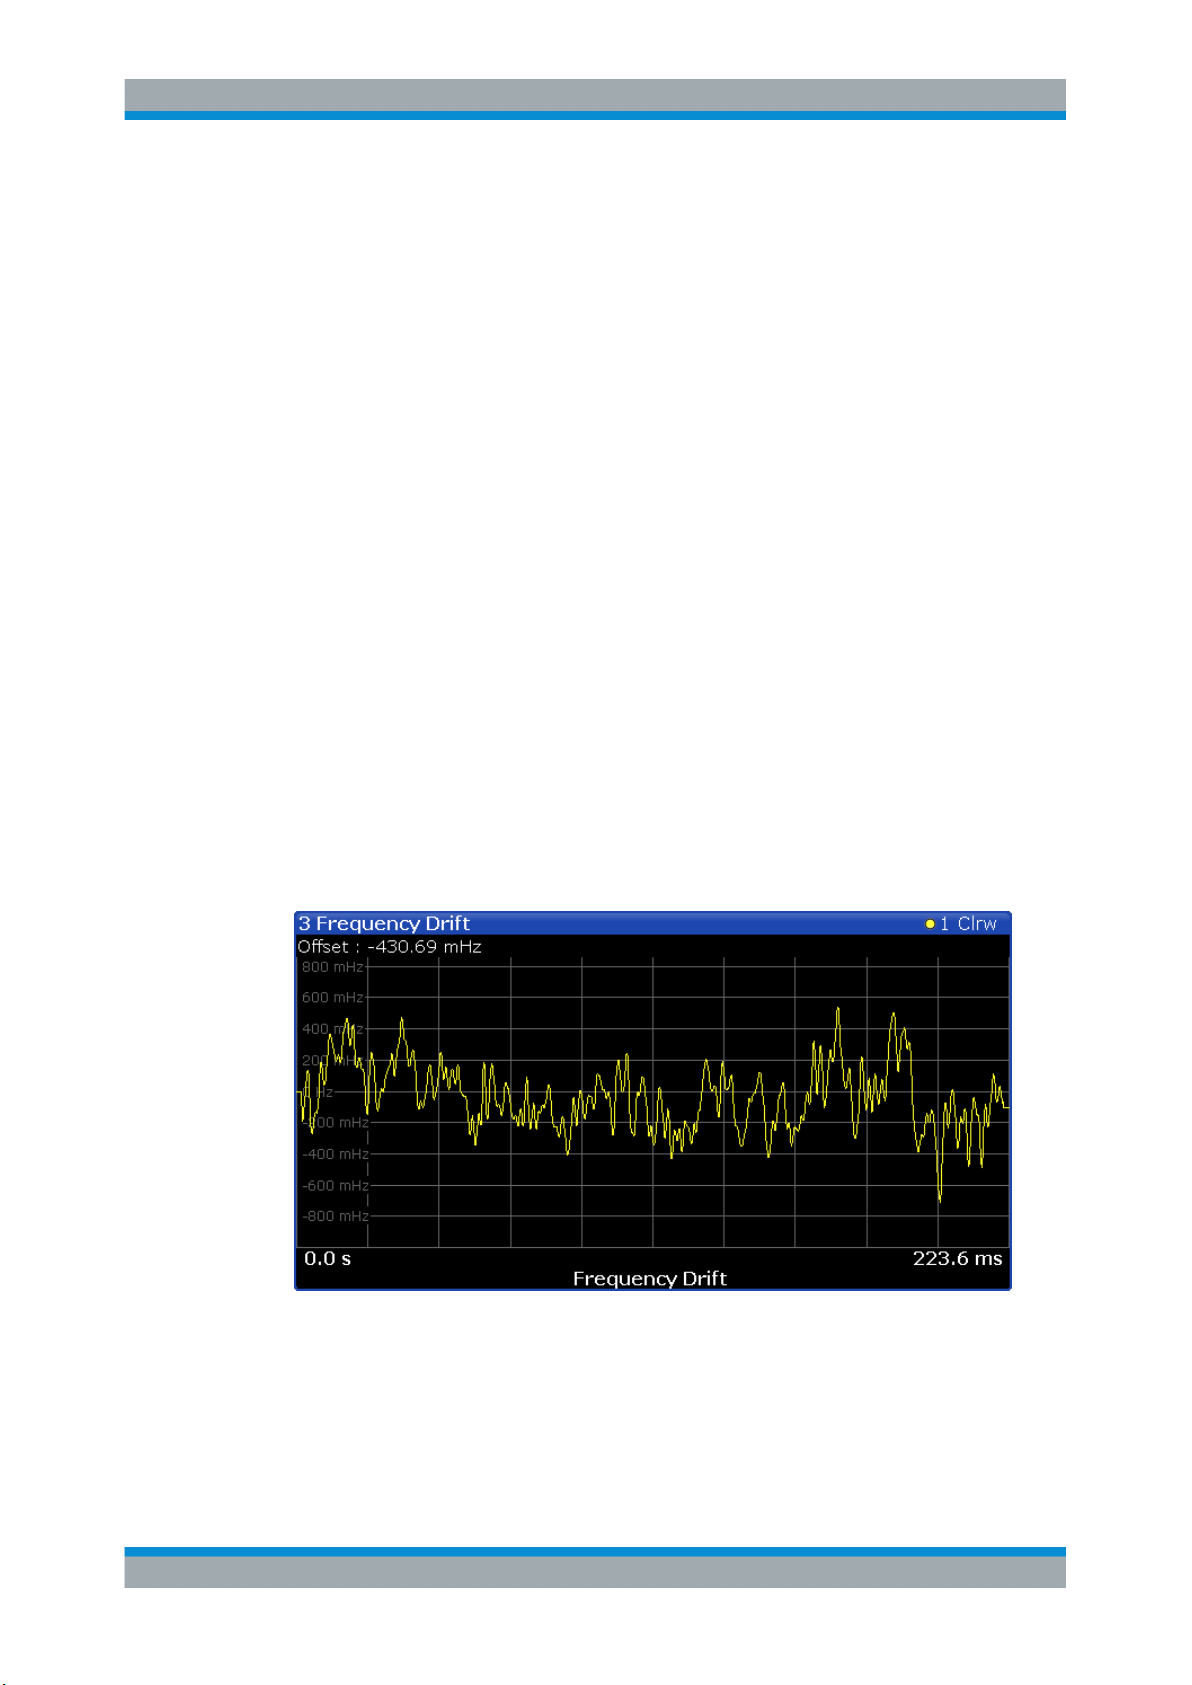
Frequency Drift
The frequency drift shows the instantenous frequency over time for the half decade
that is currently measured.
Time span
The displayed time span on the x-axis is defined by the time it takes to perform a measurement in the half decade that is currently measured. If the measurement time for a
particular half decade is very long (several seconds), the application probably updates
the result display several times. In that case, the application splits the measurement
into several "sub-measurements".
Y-axis scale
The scale of the y-axis is automatically determined according to the sample rate. For a
better resolution, the trace is offset by the first measured frequency value. Thus, the
trace always starts at 0 Hz. The initial correction value is displayed in the diagram as a
numeric result.
To get a better resolution of the time axis, use the zoom function.
If necessary, you can turn the trace on and off. For more information see "Frequency
Drift: Trace 1 (On Off)" on page 56.
20User Manual 1173.9286.02 ─ 15

R&S®FSW-K40
Measurements and Result Displays
Frequency and Level Stability
The stability results show the current level and frequency drift characteristics of the
carrier signal compared to the initial frequency and level. In addition to the numerical
results, the result display also contains a graphical represenation of the drift characteristics.
The result display contains the following results.
●
Carrier Stability
Difference between the 1st frequency that has been measured and the frequency
that has been measured last.
●
Δ to Ref Level
Difference between the 1st level that has been measured and the level that has
been measured last.
The results correspond to the Level Drift and Frequency Drift results displayed in the
channel bar. For more information see "Channel bar information" on page 11
Note that the results are only valid for I/Q FFT measurements (see "Global Sweep
Mode" on page 45).
Reference Measurement
The reference measurement measures the inherent noise figure (DANL) of the
R&S FSW.
To determine the inherent noise, the application performs a measurement without the
signal at the input. The resulting trace shows the inherent noise of the R&S FSW only.
When you substract that inherent noise from the phase noise of the measurement with
trace mathematics, you get a trace that shows the phase noise of the DUT only.
Remote command:
CONFigure:REFMeas ONCE on page 81
21User Manual 1173.9286.02 ─ 15

R&S®FSW-K40
4 Measurement Basics
Measurement Basics
Spurs and Spur Removal
The measurement basics contain background information on the terminology and principles of phase noise measurements.
Phase noise measurements in general determine the single sideband phase noise
characteristics of a device under test (DUT).
● Spurs and Spur Removal........................................................................................22
● Residual Effects...................................................................................................... 23
● Measurement Range...............................................................................................24
● Sweep Modes......................................................................................................... 25
● Trace Averaging......................................................................................................25
● Frequency Determination........................................................................................27
● Level Determination................................................................................................ 30
● Signal Attenuation...................................................................................................30
● Using Limit Lines.....................................................................................................31
● Analyzing Several Traces - Trace Mode.................................................................33
● Using Markers.........................................................................................................35
4.1 Spurs and Spur Removal
Most phase noise results contain unwanted spurs. Spurs are peak levels at one or
more offset frequencies and are caused mostly by interfering signals. For some applications you may want to specifically indentify the location of spurs. However, for some
applications, spurs do not matter in evaluating the results and you may want to remove
them from the trace in order to get a "smooth" phase noise trace.
Spur display
Usually, spurs are visible on the trace as a peak. In addition, the R&S FSW draws a
straight, vertical line to visually represent the position of a spur. The length of these
lines indicate the level of the spur in dBc and refers to the scale on the right side of the
phase noise diagram.
The lines indicating a spur are not part of the trace data. When you export the trace, for
example, the spur data is not exported.
Spur suppression
The application allows you to (visually) remove spurs from the trace. Spur removal is
based on an algorithm that detects and completely removes the spurs from the trace
and fills the gaps with data that has been determined mathematically.
The spur removal functionality separates the actual spur power from the underlying
phase noise and displays the latter in a two-stage process. The first stage of spur
detection is based on an eigenvalue decomposition during the signal processing.
22User Manual 1173.9286.02 ─ 15

R&S®FSW-K40
[dBc/Hz] noise phase sideband single with
PM Residual
)(
)(2
fL
raddffL
stop
start
f
f
mm
Measurement Basics
Residual Effects
Spur threshold
During the second stage, the application uses statistical methods to remove a spur. A
spur is detected, if the level of the signal is above a certain threshold. The spur threshold is relative to an imaginary median trace that the application calculates.
If parts of the signal are identfied as spurs, the application removes all signal parts
above that level and substitutes them with the median trace.
Figure 4-1: Spur detection and removal principle
4.2 Residual Effects
Residual noise effects are modulation products that originate directly from the phase
noise. It is possible deduct them mathematically from the phase noise of a DUT.
The application calculates three residual noise effects. All calculations are based on an
integration of the phase noise over a particular offset frequency range.
Residual PM
The residual phase modulation is the contribution of the phase noise to the output of a
PM demodulator. It is evaluated over the frequency range you have defined.
23User Manual 1173.9286.02 ─ 15

R&S®FSW-K40
[Hz]frequency
[dBc/Hz] noise phase sideband single with
FM Residual
m
m
f
f
mmm
f
fL
HzdffLf
stop
start
)(
)(2
2
frequency Carrier with
[rad]ResidualPM
Jitter[s]
0
0
2ff
Measurement Basics
Measurement Range
Residual FM
The residual frequency modulation is the contribution of the phase noise to the output
of an FM demodulator. It is evaluated over the frequency range you have defined.
Jitter
The jitter is the RMS temporal fluctuation of a carrier with the given phase noise evaluated over a given frequency range of interest.
Figure 4-2: Residual noise based on an integration between 10 kHz and 100 kHz offset
4.3 Measurement Range
Noise measurements determine the noise characteristics of a DUT over a particular
measurement range. This measurement range is defined by two offset frequencies.
The frequency offsets themselves are relative to the nominal frequency of the DUT.
24User Manual 1173.9286.02 ─ 15

R&S®FSW-K40
Measurement Basics
Trace Averaging
The measurement range again is divided into several (logarithmic) decades, or, for
configuration purposes, into half decades.
Figure 4-3: Measurement range and half decades
This breakdown into several half decades is made to speed up measurements. You
can configure each half decade separately in the "Half Decade Configuration Table".
For quick, standardized measurements, the application provides several predefined
sweep types or allows you to configure each half decade manually, but globally.
The main issue in this context is the resolution bandwidth (RBW) and its effect on the
measurement time. In general, it is best to use a resolution bandwidth as small as possible for the most accurate measurement results. However, accuracy comes at the
price of measurement speed.
To avoid long measurement times, the application provides only a certain range of
RBWs that are available for each half decade.
4.4 Sweep Modes
Sweep modes define the data processing method.
Swept
The application performs a sweep of the frequency spectrum.
I/Q FFT
The application evaluates the I/Q data that has been collected and calculates the trace
based on that data.
4.5 Trace Averaging
The application provides several modes of trace averaging that you can use separately
or in any combination.
The order in which averaging is performed is as follows. For more details for each
averaging mode see below.
25User Manual 1173.9286.02 ─ 15

R&S®FSW-K40
Measurement Basics
Trace Averaging
1. Half decade averaging.
The application measures each half decade a particular number of times before
measuring the next one.
2. Cross-correlation
The application performs a certain number of cross-correlation operations in each
half decade.
3. Sweep Count.
The application measures the complete measurement range a particular number of
times.
It again includes half decade averaging as defined.
After the measurement over the sweep count is finished, the application displays
the averaged results.
4. Trace smoothing.
Calculates the moving average for the current trace.
4.5.1 Half Decade Averaging
Define the number of measurements that the application performs for each half decade
before it displays the averaged results and measures the next half decade.
In combination with the RBW, this is the main factor that has an effect on the measurement time. Typically you will use a small number of averages for small RBWs because
small RBWs already provide accurate results and a high number of averages for high
RBWs to get more balanced results.
4.5.2 Sweep Count
The sweep count defines the number of sweeps that the application performs during a
complete measurements.
A sweep in this context is the measurement over the complete measurement range
once. A complete measurement, however, can consist of more than one sweep. In that
case the application measures until the number of sweeps that have been defined are
done. The measurement configuration stays the same all the time.
In combination with the Average trace mode and half decade averaging, the sweep
count averages the trace even more.
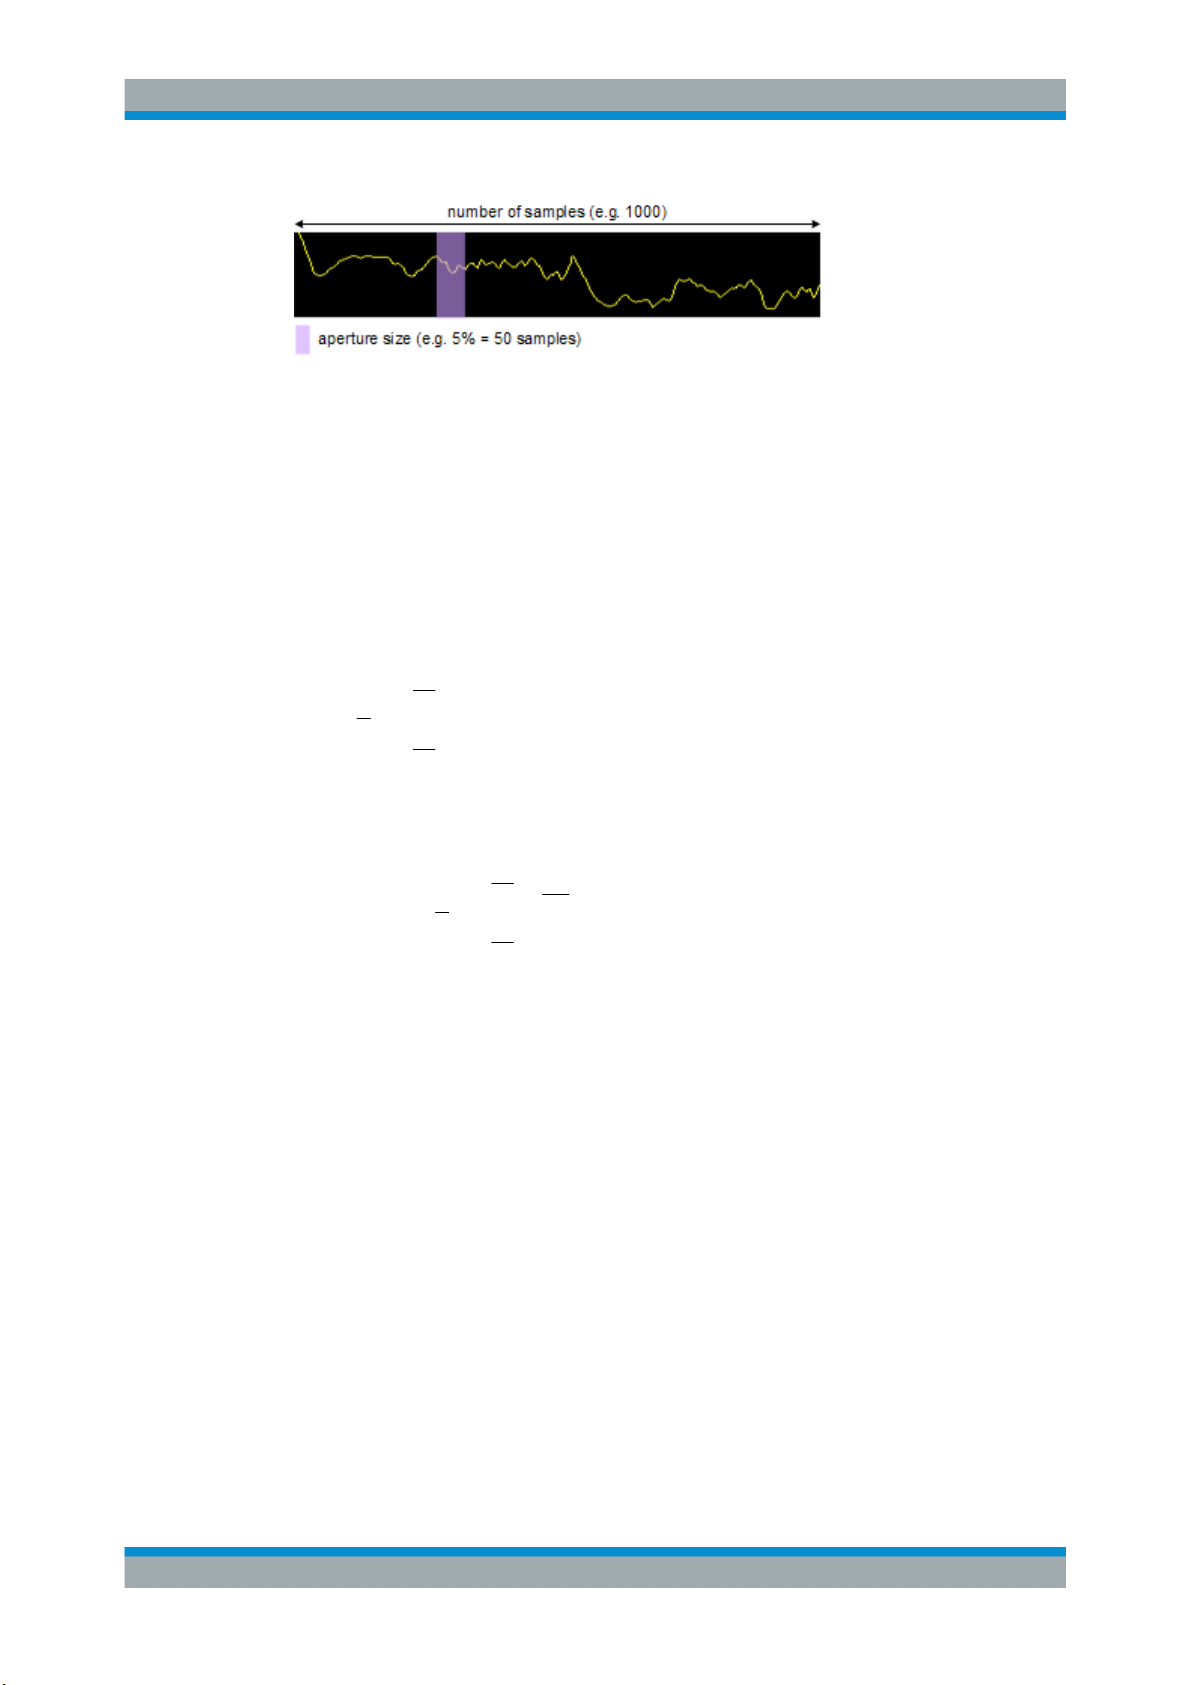
4.5.3 Trace Smoothing
(Software-based) smoothing is a way to visually remove anomalies in the trace that
may distort the results. The smoothing process is based on a moving average over the
complete measurement range. The number of samples included in the averaging process (the aperture size) is variable and is a percentage of all samples that the trace consists of.
26User Manual 1173.9286.02 ─ 15
R&S®FSW-K40
2
1
2
1
1
'
n
sx
n
sx
xy
n
sy
2
1
2
1
10
10
10
1
log10'
n
sx
n
sx
xy
n
sy
Measurement Basics
Frequency Determination
Figure 4-4: Sample size included in trace smoothing
The application smoothes the trace only after the measurement has been finished and
the data has been analyzed and written to a trace. Thus, smoothing is really just an
enhancement of the trace display, not of the data itself. This also means that smoothing is always applied after any other trace averagings have been done, as these happen during the measurement itself.
You can turn trace smoothing on and off for all traces individually and compare, for
example, the raw and the smooth trace.
Linear smoothing is based on the following algorithm:
Equation 4-1: Linear trace smoothing
Logarithmic smoothing is based on the following algorithm:
Equation 4-2: Logarithmic trace smoothing
y(s) = logarithmic phase noise level
4.6 Frequency Determination
Nominal frequency
The nominal frequency is the output or center frequency of the DUT. To get correct
and valid measurement results, the application needs to know the real frequency of the
DUT.
27User Manual 1173.9286.02 ─ 15
R&S®FSW-K40
Measurement Basics
Frequency Determination
Unverified signals
The R&S FSW tries to start the measurement as soon as you enter the phase noise
application. If it cannot verify a signal, it will try to start the measurement over and over.
To stop the repeated (and probably unsuccessful) signal verification, stop the measurement on the first verification failure.
The available (nominal) frequency range depends on the hardware you are using. For
more information see the datasheet of the R&S FSW.
If you are not sure about the nominal frequency, define a tolerance range to verify the
frequency. For measurements on unstable or drifting DUTs, use the frequency tracking
functionality.
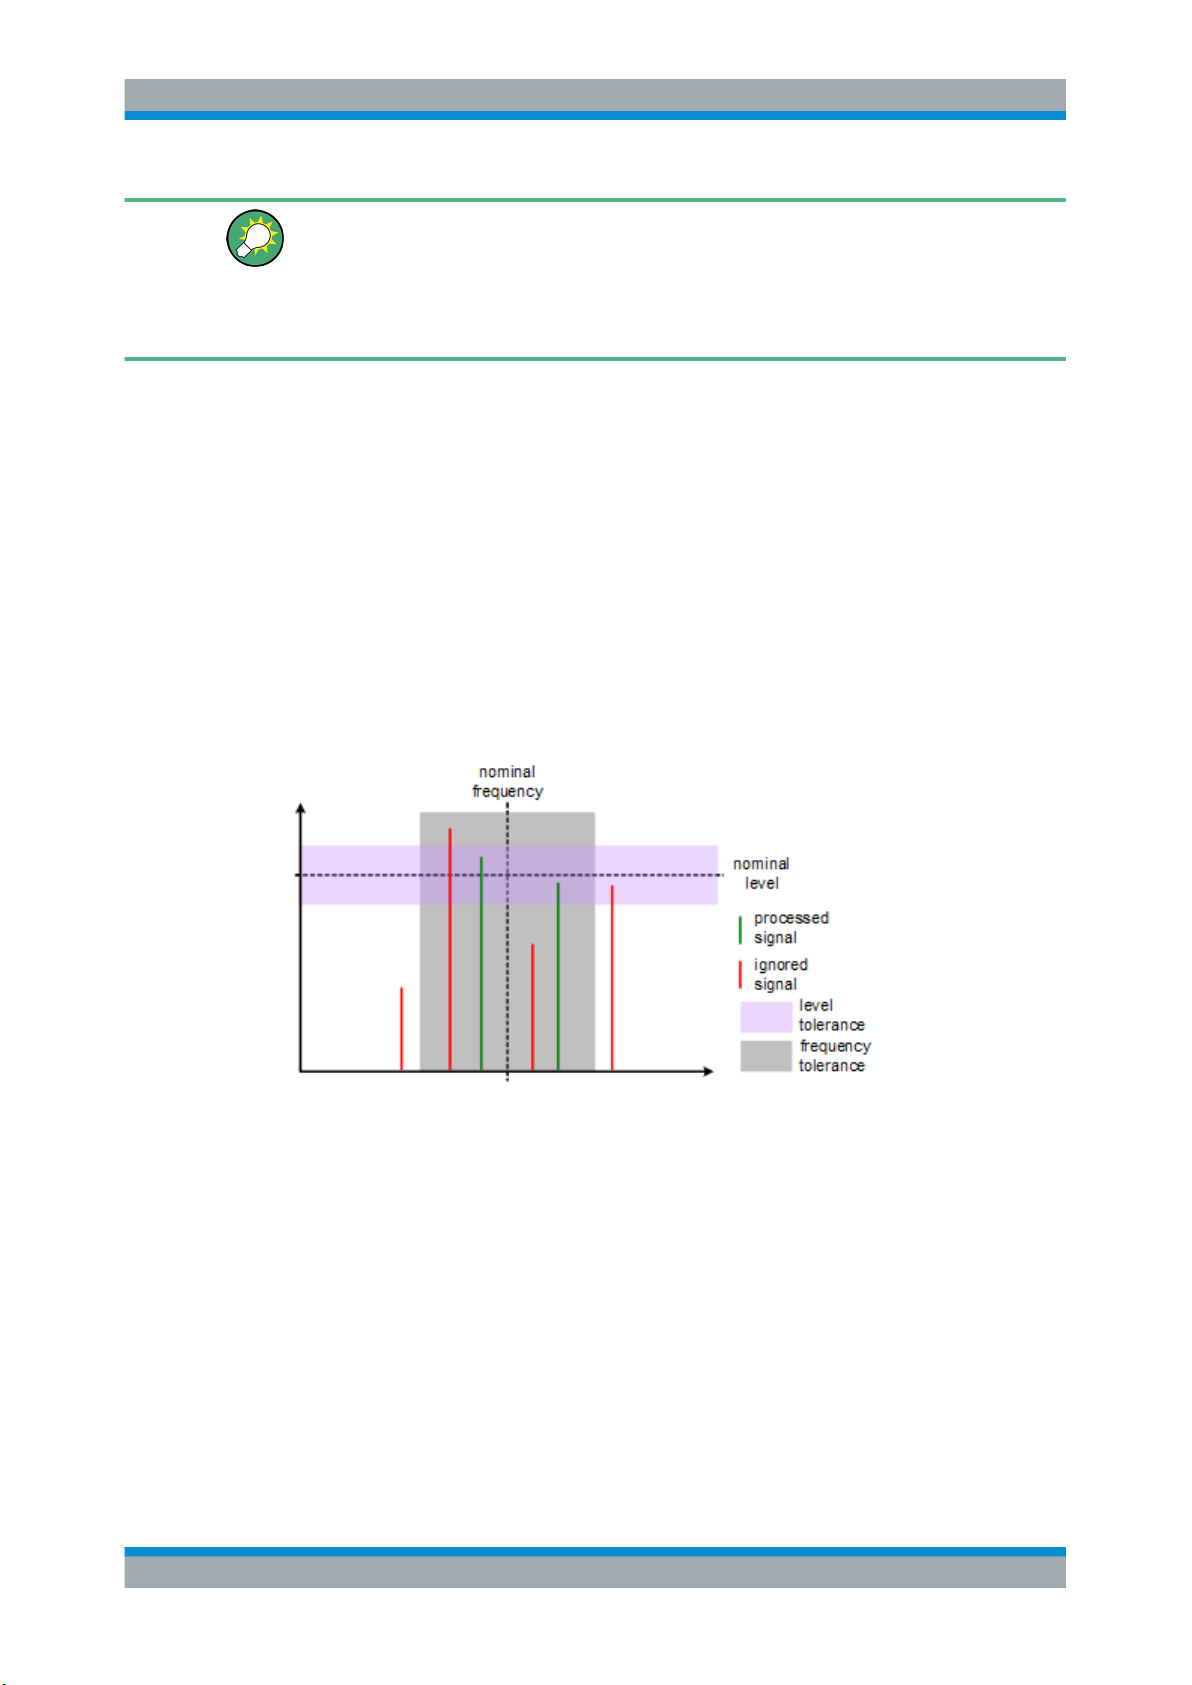
Frequency verification
When you are using frequency verification, the application intiates a measurement that
verifies that the frequency of the DUT is within a certain range of the nominal frequency. This measurement takes place before the actual phase noise measurement.
Its purpose is to find strong signals within a frequency tolerance range and, if successful, to adjust the nominal frequency and lock onto that new frequency. The frequency
tolerance is variable. You can define it in absolute or relative terms.
Figure 4-5: Frequency and level tolerance
You can define both absolute and relative tolerances. In that case, the application uses
the higher tolerance to determine the frequency.
If there is no signal within the tolerance range, the application aborts the phase noise
measurement.
In the numerical results, the application always shows the frequency the measurement
was actually performed on. If the measured frequency is not the same as the nominal
frequency, the numerical results also show the deviation from the nominal frequency.
28User Manual 1173.9286.02 ─ 15
R&S®FSW-K40
Measurement Basics
Frequency Determination
Frequency tracking
When you are using the frequency tracking, the application tracks drifting frequencies
of unstable DUTs. It internally adjusts and keeps a lock on the nominal frequency of
the DUT.
Figure 4-6: Frequency and level tracking
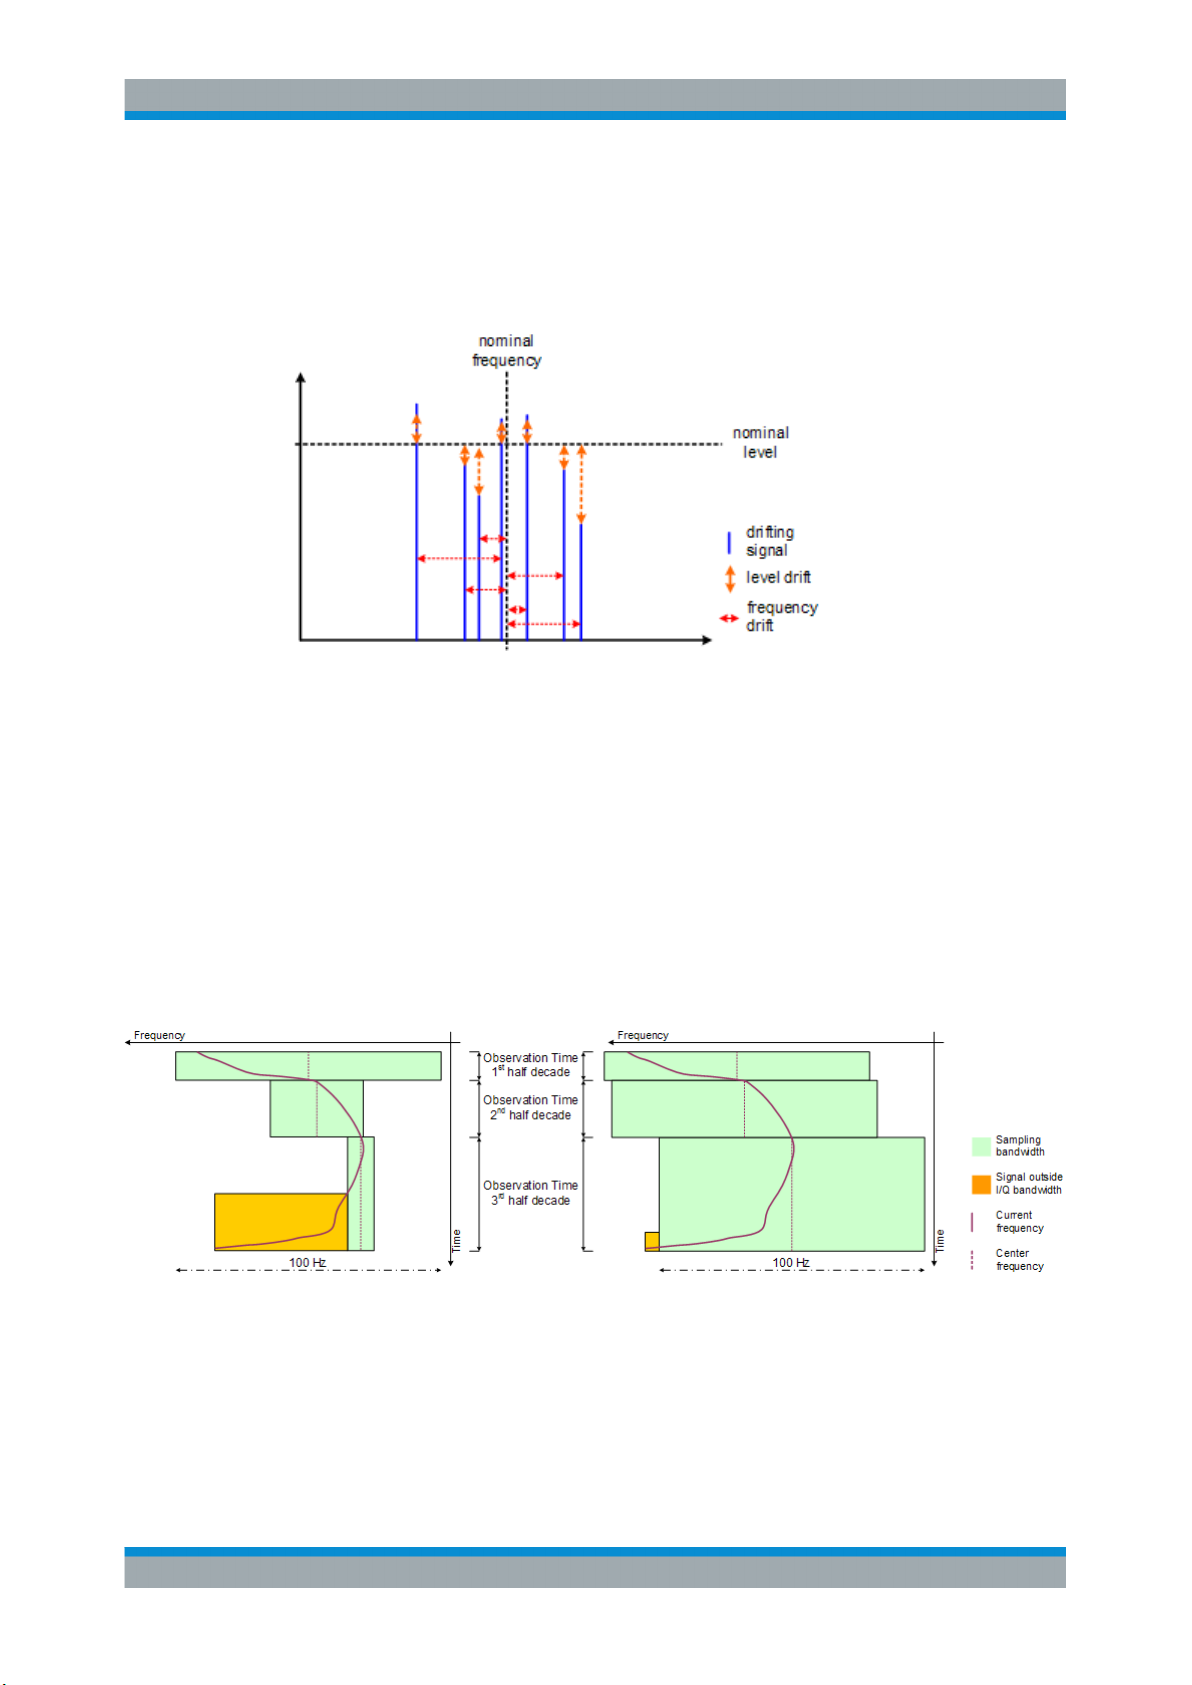
Tracking bandwidth
The tracking bandwidth defines the bandwidth within which the application tracks the
frequency.
Normally, the application adjusts the sample rate to the half decade it is currently measuring. For half decades that are near the carrier, the sample rate is small. Half decades far from the carrier use a higher sample rate. However, in case of drifting signals,
this method may result in data loss because the default bandwidth for a half decade
might be too small for the actual drift in the frequency. In that case, you can define the
tracking bandwidth which increases the sample rate if necessary and thus increases
the chance to capture the signal.
Figure 4-7: Frequency tracking with tracking bandwidth turned off (left) and a tracking bandwidth of
100 Hz (right)
29User Manual 1173.9286.02 ─ 15

R&S®FSW-K40
Measurement Basics
Signal Attenuation
4.7 Level Determination
Nominal level
The nominal level in other terms is the reference level of the R&S FSW. This is the
level that the analyzer expects at the RF input.
The available level range depends on the hardware. For more information see the
datasheet of the R&S FSW.
Make sure to define a level that is as close to the level of the DUT to get the best
dynamic range for the measurement. At the same time make sure that the signal level
is not higher than the reference level to avoid an overload of the A/D converter and
thus deteriorating measurement results.
If you are not sure about the power level of the DUT, but would still like to use the best
dynamic range and get results that are as accurate as possible, you can verify or track
the level.
Level verification
When you are using the level verification, the application initiates a measurement that
determines the level of the DUT. If the level of the DUT is within a certain tolerance
range, it will adjust the nominal level to that of the DUT. Else, it will abort the phase
noise measurement.
Define a level tolerance in relation to the current nominal level. The tolerance range
works for DUT levels that are above or below the current nominal level.
Level tracking
For tests on DUTs whose level varies, use level tracking. If active, the application
keeps track of the DUTs level during the phase noise measurement and adjusts the
nominal level accordingly.
For a graphical representation of level verification and level tracking see the figures in
Chapter 4.6, "Frequency Determination", on page 27.
4.8 Signal Attenuation
Attenuation of the signal may become necessary if you have to reduce the power of
the signal that you have applied. Power reduction is necessary, for example, to prevent
an overload of the input mixer. An overload of the input mixer may lead to incorrect
measurement results or damage to the hardware if the signal power is too strong.
In the default state, the application automatically determines the attenuation according
to the reference level. If necessary, you can also define the attenuation manually.
When you attenuate the signal, the application adjusts graphical and numerical results
accordingly.
30User Manual 1173.9286.02 ─ 15
 Loading...