

Page 1

R&S® FSV-K91/91n/91ac/91p
WLAN TX Measurements
Operating Manual
(;ÚÚa2)
1176.7649.02 ─ 06
Operating Manual
Test & Measurement
Page 2

This manual describes the following R&S®FSV/FSVA options:
●
R&S FSV-K91 (1310.8903.02)
●
R&S FSV-K91n (1310.9468.02)
●
R&S FSV-K91ac (1310.8926.02)
●
R&S FSV-K91p (1321.3314.02)
This manual describes the following R&S FSVA/FSV models with firmware version 3.20 and higher:
●
R&S®FSVA4 (1321.3008K05)
●
R&S®FSVA7 (1321.3008K08)
●
R&S®FSVA13 (1321.3008K14)
●
R&S®FSVA30 (1321.3008K31)
●
R&S®FSVA40 (1321.3008K41)
●
R&S®FSV4 (1321.3008K04)
●
R&S®FSV7 (1321.3008K07)
●
R&S®FSV13 (1321.3008K13)
●
R&S®FSV30 (1321.3008K30)
●
R&S®FSV40 (1321.3008K39/1321.3008K40)
It also applies to the following R&S®FSV models. However, note the differences described in Chapter 1.4,
"Notes for Users of R&S FSV 1307.9002Kxx Models", on page 9.
●
R&S®FSV3 (1307.9002K03)
●
R&S®FSV7 (1307.9002K07)
●
R&S®FSV13 (1307.9002K13)
●
R&S®FSV30 (1307.9002K30)
●
R&S®FSV40 (1307.9002K39/1307.9002K40)
© 2016 Rohde & Schwarz GmbH & Co. KG
Mühldorfstr. 15, 81671 München, Germany
Phone: +49 89 41 29 - 0
Fax: +49 89 41 29 12 164
Email: info@rohde-schwarz.com
Internet: www.rohde-schwarz.com
Subject to change – Data without tolerance limits is not binding.
R&S® is a registered trademark of Rohde & Schwarz GmbH & Co. KG.
Trade names are trademarks of the owners.
The following abbreviations are used throughout this manual: R&S®FSV/FSVA is abbreviated as R&S FSV/FSVA.
Page 3

R&S® FSV-K91/91n/91ac/91p
Contents
1 Preface.................................................................................................... 5
1.1 Documentation Overview............................................................................................. 5
1.2 Conventions Used in the Documentation...................................................................6
1.3 How to Use the Help System........................................................................................7
1.4 Notes for Users of R&S FSV 1307.9002Kxx Models.................................................. 9
2 Introduction.......................................................................................... 10
3 WLAN TX Measurements.....................................................................11
3.1 Introduction to WLAN 802.11A, AC, B, G, J, N & P TX Tests.................................. 12
3.2 Basic Measurement Examples...................................................................................13
3.3 Signal Processing of the IEEE 802.11a Application................................................ 21
Contents
3.4 Signal Processing of the IEEE 802.11b Application................................................ 29
3.5 802.11b RF Carrier Suppression................................................................................35
3.6 IEEE 802.11n/ac MIMO Measurements......................................................................36
3.7 Signal Field Measurement (IEEE 802.11ac, n (SISO+MIMO)).................................. 39
3.8 Optimized Signal Levels.............................................................................................43
3.9 Measurement Result Types........................................................................................44
3.10 Measurement Settings and Result Displays.............................................................50
4 Instrument Functions WLAN TX Measurements...............................62
4.1 Softkeys of the WLAN TX Menu.................................................................................63
4.2 General Settings Dialog Box (K91)............................................................................87
4.3 Demod Settings Dialog Box....................................................................................... 97
4.4 Softkeys of the Sweep Menu – SWEEP key ...........................................................110
4.5 Softkeys of the Trace Menu – TRAC key................................................................ 111
4.6 Softkeys of the Marker Menu – MKR key (WLAN)..................................................112
4.7 Softkeys of the Marker To Menu – MKR-> key....................................................... 112
4.8 Softkeys of the Lines Menu – LINES key................................................................ 113
4.9 Softkeys of the Input/Output Menu for WLAN Measurements..............................114
5 Remote Commands for WLAN TX Measurements.......................... 116
5.1 Notation......................................................................................................................117
5.2 ABORt Subsystem.................................................................................................... 120
3Operating Manual 1176.7649.02 ─ 06
Page 4

R&S® FSV-K91/91n/91ac/91p
5.3 CALCulate:BURSt Subsystem (WLAN)...................................................................120
5.4 CALCulate:LIMit Subsystem (WLAN)......................................................................121
5.5 CALCulate:MARKer Subsystem (WLAN)................................................................ 138
5.6 CONFigure Subsystem (WLAN)...............................................................................145
5.7 DISPlay Subsystem (WLAN).................................................................................... 163
5.8 FETCh Subsystem (WLAN)...................................................................................... 168
5.9 FORMat Subsystem.................................................................................................. 176
5.10 INITiate Subsystem................................................................................................... 176
5.11 INPut Subsystem.......................................................................................................177
5.12 INSTrument Subsystem (WLAN)............................................................................. 180
5.13 MMEMory Subsystem (WLAN).................................................................................181
5.14 SENSe Subsystem (WLAN)...................................................................................... 182
5.15 STATus Subsystem (WLAN).................................................................................... 205
Contents
5.16 TRACe Subsystem (WLAN)......................................................................................209
5.17 TRIGger Subsystem (WLAN)....................................................................................218
5.18 UNIT Subsystem (K91)..............................................................................................221
5.19 Status Reporting System (Option R&S FSV-K91).................................................. 222
List of Commands..............................................................................229
Index....................................................................................................235
4Operating Manual 1176.7649.02 ─ 06
Page 5

R&S® FSV-K91/91n/91ac/91p
1 Preface
Preface
Documentation Overview
1.1 Documentation Overview
This section provides an overview of the R&S FSVA/FSV user documentation. You find
it on the product page at:
www.rohde-schwarz.com/product/FSV > "Downloads" > "Manuals"
Quick start guide
Introduces the R&S FSVA/FSV and describes how to set up and start working with the
product. Includes basic operations, typical measurement examples, and general information, e.g. safety instructions, etc.. A printed version is delivered with the instrument.
Online help
The online help offers quick, context-sensitive access to the complete information for
the base unit and the software options directly on the instrument.
Operating manuals
Separate manuals for the base unit and the software options are provided for download:
●
Base unit manual
Contains the description of the graphical user interface, an introduction to remote
control, the description of all SCPI remote control commands, programming examples, and information on maintenance, instrument interfaces and error messages.
Includes the contents of the Quick Start Guide.
●
Software option manuals
Contain the description of the specific functions of an option. Basic information on
operating the R&S FSVA/FSV is not included.
The online version of the user manual provides the complete contents for immediate
display on the internet.
Service manual
Describes the performance test for checking the rated specifications, module replacement and repair, firmware update, troubleshooting and fault elimination, and contains
mechanical drawings and spare part lists.
The service manual is available for registered users on the global Rohde & Schwarz
information system (GLORIS, https://gloris.rohde-schwarz.com).
Instrument security procedures manual
Deals with security issues when working with the R&S FSVA/FSV in secure areas.
5Operating Manual 1176.7649.02 ─ 06
Page 6

R&S® FSV-K91/91n/91ac/91p
Basic safety instructions
Contains safety instructions, operating conditions and further important information.
The printed document is delivered with the instrument.
Data sheet and brochure
The data sheet contains the technical specifications of the R&S FSVA/FSV. It also lists
the options and their order numbers as well as optional accessories.
The brochure provides an overview of the instrument and deals with the specific characteristics.
Release notes and open source acknowledgment (OSA)
The release notes list new features, improvements and known issues of the current
firmware version, and describe the firmware installation.
The open source acknowledgment document provides verbatim license texts of the
used open source software.
Preface
Conventions Used in the Documentation
See www.rohde-schwarz.com/product/FSV > "Downloads" > "Firmware"
Application notes, application cards, white papers, etc.
These documents deal with special applications or background information on particular topics, see www.rohde-schwarz.com/appnotes.
1.2 Conventions Used in the Documentation
1.2.1 Typographical Conventions
The following text markers are used throughout this documentation:
Convention Description
"Graphical user interface elements"
KEYS Key names are written in capital letters.
File names, commands,
program code
All names of graphical user interface elements on the screen, such as
dialog boxes, menus, options, buttons, and softkeys are enclosed by
quotation marks.
File names, commands, coding samples and screen output are distinguished by their font.
Input Input to be entered by the user is displayed in italics.
Links Links that you can click are displayed in blue font.
"References" References to other parts of the documentation are enclosed by quota-
tion marks.
6Operating Manual 1176.7649.02 ─ 06
Page 7

R&S® FSV-K91/91n/91ac/91p
Preface
How to Use the Help System
1.2.2 Conventions for Procedure Descriptions
When describing how to operate the instrument, several alternative methods may be
available to perform the same task. In this case, the procedure using the touchscreen
is described. Any elements that can be activated by touching can also be clicked using
an additionally connected mouse. The alternative procedure using the keys on the
instrument or the on-screen keyboard is only described if it deviates from the standard
operating procedures.
The term "select" may refer to any of the described methods, i.e. using a finger on the
touchscreen, a mouse pointer in the display, or a key on the instrument or on a keyboard.
1.2.3 Notes on Screenshots
When describing the functions of the product, we use sample screenshots. These
screenshots are meant to illustrate as much as possible of the provided functions and
possible interdependencies between parameters.
The screenshots usually show a fully equipped product, that is: with all options installed. Thus, some functions shown in the screenshots may not be available in your particular product configuration.
1.3 How to Use the Help System
Calling context-sensitive and general help
► To display the general help dialog box, press the HELP key on the front panel.
The help dialog box "View" tab is displayed. A topic containing information about
the current menu or the currently opened dialog box and its function is displayed.
For standard Windows dialog boxes (e.g. File Properties, Print dialog etc.), no contextsensitive help is available.
► If the help is already displayed, press the softkey for which you want to display
help.
A topic containing information about the softkey and its function is displayed.
If a softkey opens a submenu and you press the softkey a second time, the submenu
of the softkey is displayed.
Contents of the help dialog box
The help dialog box contains four tabs:
7Operating Manual 1176.7649.02 ─ 06
Page 8

R&S® FSV-K91/91n/91ac/91p
●
"Contents" - contains a table of help contents
●
"View" - contains a specific help topic
●
"Index" - contains index entries to search for help topics
●
"Zoom" - contains zoom functions for the help display
To change between these tabs, press the tab on the touchscreen.
Navigating in the table of contents
●
To move through the displayed contents entries, use the UP ARROW and DOWN
ARROW keys. Entries that contain further entries are marked with a plus sign.
●
To display a help topic, press the ENTER key. The "View" tab with the corresponding help topic is displayed.
●
To change to the next tab, press the tab on the touchscreen.
Navigating in the help topics
●
To scroll through a page, use the rotary knob or the UP ARROW and DOWN
ARROW keys.
●
To jump to the linked topic, press the link text on the touchscreen.
Preface
How to Use the Help System
Searching for a topic
1. Change to the "Index" tab.
2. Enter the first characters of the topic you are interested in. The entries starting with
these characters are displayed.
3. Change the focus by pressing the ENTER key.
4. Select the suitable keyword by using the UP ARROW or DOWN ARROW keys or
the rotary knob.
5. Press the ENTER key to display the help topic.
The "View" tab with the corresponding help topic is displayed.
Changing the zoom
1. Change to the "Zoom" tab.
2. Set the zoom using the rotary knob. Four settings are available: 1-4. The smallest
size is selected by number 1, the largest size is selected by number 4.
Closing the help window
► Press the ESC key or a function key on the front panel.
8Operating Manual 1176.7649.02 ─ 06
Page 9

R&S® FSV-K91/91n/91ac/91p
Preface
Notes for Users of R&S FSV 1307.9002Kxx Models
1.4 Notes for Users of R&S FSV 1307.9002Kxx Models
Users of R&S FSV 1307.9002Kxx models should consider the following differences to
the description of the newer R&S FSVA/FSV 1321.3008Kxx models:
●
Functions that are based on the Windows7 operating system (e.g. printing or setting up networks) may have a slightly different appearance or require different settings on the Windows XP based models. For such functions, refer to the Windows
documentation or the documentation originally provided with the R&S FSV instrument.
●
The R&S FSV 1307.9002K03 model is restricted to a maximum frequency of
3 GHz, whereas the R&S FSVA/FSV1321.3008K04 model has a maximum frequency of 4 GHz.
●
The bandwidth extension option R&S FSV-B160 (1311.2015.xx) is not available for
the R&S FSV 1307.9002Kxx models. The maximum usable I/Q analysis bandwidth
for these models is 28 MHz, or with option R&S FSV-B70, 40 MHz.
9Operating Manual 1176.7649.02 ─ 06
Page 10

R&S® FSV-K91/91n/91ac/91p
2 Introduction
This document contains all information required for operation of an R&S FSVA/FSV
equipped with Application Firmware R&S FSVA/FSV. It covers operation via menus
and the remote control commands for WLAN measurements.
This option is not available for R&S FSVA/FSV 40 model 1307.9002K39.
This part of the documentation consists of the following chapters:
●
Chapter 3.2, "Basic Measurement Examples", on page 13
Describes the measurement setup for WLAN TX measurements.
●
Chapter 4, "Instrument Functions WLAN TX Measurements", on page 62
Describes the overall instrument functions and provides further information
●
Chapter 4.1, "Softkeys of the WLAN TX Menu", on page 63
Shows all softkeys available in the "WLAN" menu. This chapter also refers to the
remote control commands associated with each softkey function.
●
Chapter 5, "Remote Commands for WLAN TX Measurements", on page 116
Describes all remote control commands defined for the power meter measurement.
Introduction
This part of the documentation includes only functions of the Application Firmware
R&S FSV-K91/91n/91ac/91p. For all other descriptions, please refer to the description
of the base unit.
10Operating Manual 1176.7649.02 ─ 06
Page 11

R&S® FSV-K91/91n/91ac/91p
3 WLAN TX Measurements
The R&S FSV-K91/91n/91ac/91p application extends the functionality of the
R&S FSVA/FSV signal analyzer to enable wireless LAN TX measurements in accordance with IEEE standards 802.11 a, ac, b, g, j, n & p (assuming the required firmware
option is installed).
The following topics are described in this section:
3.1 Introduction to WLAN 802.11A, AC, B, G, J, N & P TX Tests.................................. 12
3.2 Basic Measurement Examples...................................................................................13
3.2.1 Setting Up the Measurement........................................................................................ 13
3.2.2 Performing the Main Measurement...............................................................................14
3.2.3 Setting up a MIMO measurement................................................................................. 14
3.3 Signal Processing of the IEEE 802.11a Application................................................ 21
3.3.1 Understanding Signal Processing of the IEEE 802.11a Application............................. 22
WLAN TX Measurements
3.3.2 Literature to the IEEE 802.11a Application................................................................... 29
3.4 Signal Processing of the IEEE 802.11b Application................................................ 29
3.4.1 Understanding Signal Processing of the IEEE 802.11b Application............................. 30
3.4.2 Literature of the IEEE 802.11b Application................................................................... 35
3.5 802.11b RF Carrier Suppression................................................................................35
3.6 IEEE 802.11n/ac MIMO Measurements......................................................................36
3.6.1
3.9.1 IQ Impairments..............................................................................................................44
3.9.2 EVM Measurement....................................................................................................... 48
3.9.3 Rise/Fall Time Measurement........................................................................................ 50
3.10 Measurement Settings and Result Displays.............................................................50
3.10.1 Measurement Settings.................................................................................................. 51
3.10.2 Result Summary List.....................................................................................................54
Trigger Synchronization Using an R&S®FS-Z11 Trigger Unit....................................... 37
3.7 Signal Field Measurement (IEEE 802.11ac, n (SISO+MIMO)).................................. 39
3.8 Optimized Signal Levels.............................................................................................43
3.9 Measurement Result Types........................................................................................44
3.10.3 Result Display Graph.................................................................................................... 59
3.10.4 Title Bar Information......................................................................................................61
3.10.5 Status Bar Information.................................................................................................. 61
11Operating Manual 1176.7649.02 ─ 06
Page 12

R&S® FSV-K91/91n/91ac/91p
WLAN TX Measurements
Introduction to WLAN 802.11A, AC, B, G, J, N & P TX Tests
3.1 Introduction to WLAN 802.11A, AC, B, G, J, N & P TX Tests
The use of an R&S FSVA/FSV spectrum analyzer enables the accurate and reproducible TX measurement of a wireless LAN device under test (DUT) in accordance with the
standards specified for the device. The following test conditions are supported:
Modulation formats:
●
IEEE 802.11j (10 MHz)
– BPSK (3 & 4.5 Mbps)
– QPSK (6 & 9 Mbps)
– 16QAM (12 & 18 Mbps)
– 64QAM (24 & 27 Mbps)
●
IEEE 802.11a, j & g (OFDM), p
– BPSK (6 & 9 Mbps)
– QPSK (12 & 18 Mbps)
– 16QAM (24 & 36 Mbps)
– 64QAM (48 & 54 Mbps)
●
IEEE 802.11b & g (single carrier mode)
– DBPSK (1 Mbps)
– DQPSK (2 Mbps)
– CCK (5.5 & 11 Mbps)
– PBCC (5.5, 11 & 22 Mbps)
●
IEEE 802.11ac (SISO and MIMO)
– 16QAM
– 64QAM
– 256QAM
For IEEE 802.11n (MIMO) the modulation and data rates depend on the MCS
index
●
IEEE 802.11n (OFDM), (SISO and MIMO)
– BPSK (6.5, 7.2, 13.5 & 15 Mbps)
– QPSK (13, 14.4, 19.5, 21.7, 27, 30, 40,5 & 45 Mbps)
– 16QAM(26, 28.9, 39, 43.3, 54, 60, 81 & 90 Mbps)
– 64QAM(52, 57.8, 58.5, 65, 72.2, 108, 121.5, 135, 120, 135 & 150 Mbps)
For IEEE 802.11n (MIMO) the modulation and data rates depend on the MCS
index
12Operating Manual 1176.7649.02 ─ 06
Page 13

R&S® FSV-K91/91n/91ac/91p
SISO vs MIMO
For most WLAN measurements, a single transmitter and a single receiver are used
(SISO = single in, single out). For measurements according to the IEEE 802.11n or ac
standards, the R&S FSVA/FSV can measure multiple data streams between multiple
transmitters and multiple receivers (MIMO = multiple in, multiple out).
For MIMO the modulation and data rates depend on the MCS index.
Modulation measurements
●
Constellation diagram
●
Constellation diagram for each OFDM carrier
●
I/Q offset and I/Q imbalance
●
Carrier and symbol frequency errors
●
Modulation error (EVM) for each OFDM carrier or symbol
●
Amplitude response and group-delay distortion (spectral flatness)
Further measurements and results
●
Amplitude statistics (CCDF) and crest factor
●
Transmit spectrum mask
●
FFT, also over a selected part of the signal, e.g. preamble
●
Payload bit information
●
Freq/Phase Err vs. Preamble
WLAN TX Measurements
Basic Measurement Examples
3.2 Basic Measurement Examples
This section provides step-by-step instruction for working through an ordinary measurement. The following steps are described:
1. Chapter 3.2.1, "Setting Up the Measurement", on page 13
2. Chapter 3.2.2, "Performing the Main Measurement", on page 14
In this example, a DUT using IEEE 802.11a is be used. The DUT is connected to the
R&S FSVA/FSV using the RF input of the R&S FSVA/FSV. The DUT generates a signal modulated using 16QAM.
3.2.1 Setting Up the Measurement
1. Activate the "WLAN" mode using the MODE > "WLAN" keys.
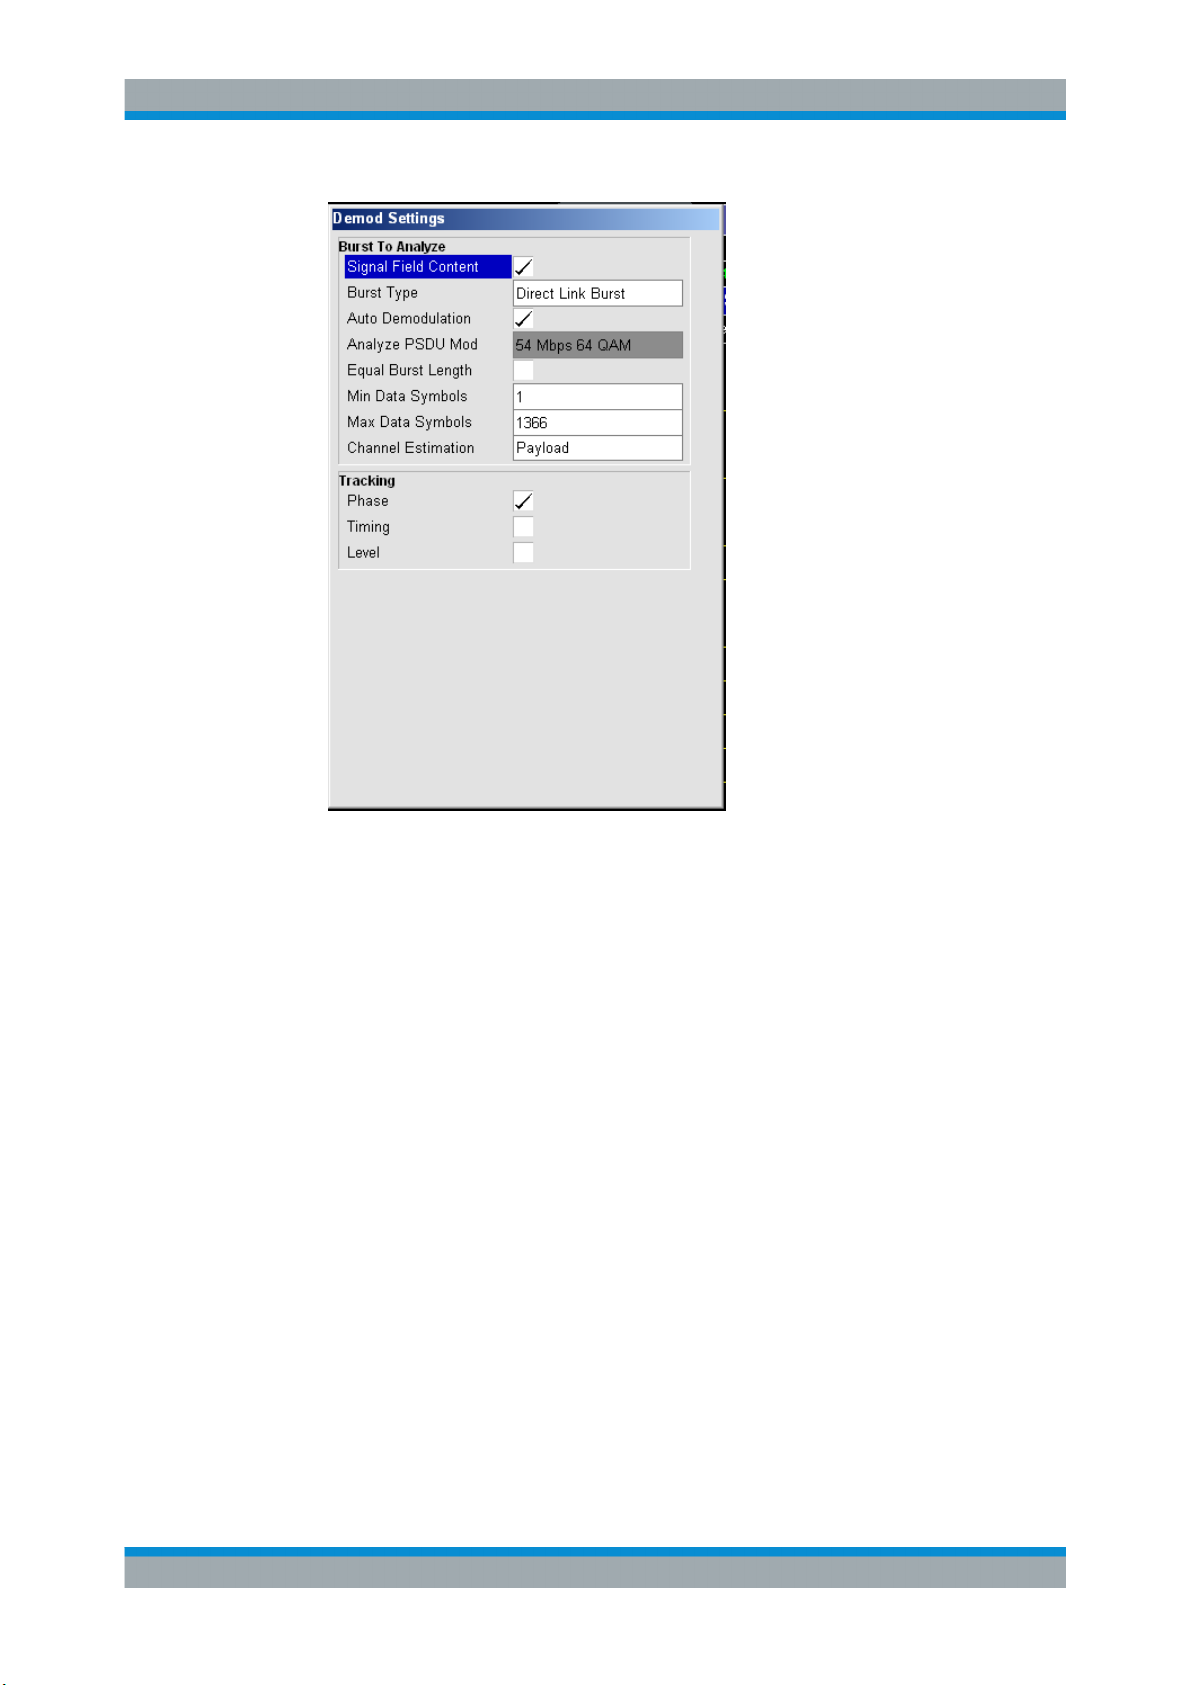
2. Press the "FREQ" key once to select and open the Demod Settings Dialog Box and
to activate the frequency input field.
13Operating Manual 1176.7649.02 ─ 06
Page 14
R&S® FSV-K91/91n/91ac/91p
WLAN TX Measurements
Basic Measurement Examples
3. Activate "Auto Demodulation" (see "Auto Demodulation (IEEE 802.11n, SISO)"
on page 100) to use the content of the signal inherent field to detect the modulation type automatically.
3.2.2 Performing the Main Measurement
●
Select single sweep measurements by pressing the RUN SINGLE hardkey.
●
Select continuous measurements by pressing the RUN CONT hardkey.
During the measurement, the status message "Running" is displayed.
Leveling is done automatically.
Measurement results are updated once the measurement has completed. The
results are displayed in graphical form. The display can be toggled to a tabular list
of measurement points by pressing the "Display" softkey (in the "WLAN" menu or
"Trace" menu).
3.2.3 Setting up a MIMO measurement
For this example a 2 Tx MIMO DUT according to IEEE 802.11n is used.
1. The MIMO DUT is connected to the analyzers according to the following setup:
14Operating Manual 1176.7649.02 ─ 06
Page 15

R&S® FSV-K91/91n/91ac/91p
WLAN TX Measurements
Basic Measurement Examples
2. Connect the external reference REF OUT of the SMU with the external reference
REF IN of the analyzers. Switch on the external reference for both analyzers in the
spectrum analyzer base system.
3. Connect the marker output of the SMU with the EXT TRIGGER input of the ana-
lyzers.
4. Either connect the "Path A RF/Baseband" connector with one analyzer and the
"Path B RF/Baseband" connector with the other analyzer, or use the air interface
with appropriate antennas.
5. Connect the master and the slave anaylzer via LAN according to the figure above.
As an alternative, it is sufficient to connect master and slave with a cross LAN
cable. The analyzer with the R&S FSV-K91n option can be used as master. The
slave analyzer does not require a WLAN option.
6. Setup the SMU to generate a 2 Tx IEEE 802.11n (MIMO) signal.
For the SMU "Baseband A" select the "IEEE 802.11n …" option. This opens the
"IEEE 802.11n WLAN A" dialog.
15Operating Manual 1176.7649.02 ─ 06
Page 16

R&S® FSV-K91/91n/91ac/91p
WLAN TX Measurements
Basic Measurement Examples
7. Select the "Transmission Bandwidth" 40MHz.
In the "IEEE 802.11n WLAN A" dialog, press the "Frame Block Configuration …"
button to open the "IEEE 802.11n WLAN A: Frame Blocks Configuration" dialog.
16Operating Manual 1176.7649.02 ─ 06
Page 17

R&S® FSV-K91/91n/91ac/91p
WLAN TX Measurements
Basic Measurement Examples
8. Select "Antennas" 2.
In the "IEEE 802.11n WLAN A" dialog, press the "Frame Block Configuration …"
button to open the "IEEE 802.11n WLAN A: Frame Blocks Configuration" dialog.
17Operating Manual 1176.7649.02 ─ 06
Page 18

R&S® FSV-K91/91n/91ac/91p
WLAN TX Measurements
Basic Measurement Examples
9. Select "Tx Mode" HT-40MHz.
Press the "PPDU Config …" button to open the "IEEE 802.11n WLAN A: PPDU
Configuration for Frame Block 1" dialog.
18Operating Manual 1176.7649.02 ─ 06
Page 19

R&S® FSV-K91/91n/91ac/91p
WLAN TX Measurements
Basic Measurement Examples
10. Select "Spatial Streams" 2 and "Space Time Streams" 2.
Return to the "IEEE 802.11n WLAN A" dialog.
19Operating Manual 1176.7649.02 ─ 06
Page 20

R&S® FSV-K91/91n/91ac/91p
WLAN TX Measurements
Basic Measurement Examples
11. Check "Configure Baseband B from Baseband A". This will generate a IEEE
802.11n conform Tx 2 signal for path B of the SMU.
12. Toggle the "State" to On and make sure "RF/A Mod A" and "RF/B Mod B" are
switched on.
20Operating Manual 1176.7649.02 ─ 06
Page 21

R&S® FSV-K91/91n/91ac/91p
WLAN TX Measurements
Signal Processing of the IEEE 802.11a Application
13. Using the "Graphics | Power Spectrum" display shows the power spectrum for both
antennas.
14. Now set up the spectrum analyzer with the R&S FSV-K91n option to perform the
WLAN MIMO measurements. Start the R&S FSV-K91n application.
15. Select "Standard" IEEE 802.11n (MIMO).
Set the "RF Frequency" the DUT is transmitting.
16. Set "Trigger Mode" to "External".
Select the "STC/MIMO" tab in the "General Settings" dialog box.
17. Select "DUT MIMO configuration" 2 Tx Antennas.
18. Set the "IP Address" of the slave in the "MIMO Measurement Setup" table and turn
the "State" of the slave to ON.
3.3 Signal Processing of the IEEE 802.11a Application
This description gives a rough view of the IEEE 802.11a application signal processing.
Details are disregarded in order to get a concept overview.
21Operating Manual 1176.7649.02 ─ 06
Page 22

R&S® FSV-K91/91n/91ac/91p
●
Chapter 3.3.1, "Understanding Signal Processing of the IEEE 802.11a Application",
on page 22
●
Chapter 3.3.2, "Literature to the IEEE 802.11a Application", on page 29
Abbreviations
WLAN TX Measurements
Signal Processing of the IEEE 802.11a Application
a
l,k
EVM
k
EVM error vector magnitude of current packet
g signal gain
Δf frequency deviation between TX and RX
l symbol index l = [1, nof_Symbols]
nof_symbols number of symbols of payload
H
k
k channel index k = [–31,32]
K
mod
ξ relative clock error of reference oscillator
r
l,k
3.3.1 Understanding Signal Processing of the IEEE 802.11a Application
symbol at symbol l of subcarrier k
error vector magnitude of subcarrier k
channel transfer function of subcarrier k
modulation-dependent normalization factor
subcarrier of symbol l
A diagram of the interesting blocks is shown in Figure 3-1. First the RF signal is down
converted to the IF frequency fIF = 96 MHz. The resulting IF signal rIF(t) is shown on the
left-hand side of the figure. After bandpass filtering, the signal is sampled by an Analog
to Digital Converter (ADC) at a sampling rate of fs1 = 128 MHz. This digital sequence is
resampled. Thus the sampling rate of the down sampled sequence r(i) is the Nyquist
rate of fs3 = 20 MHz. Up to this point the digital part is implemented in an ASIC.
In the lower part of the figure the subsequent digital signal processing is shown. In the
first block the packet search is performed. This block detects the Long Symbol (LS)
and recovers the timing. The coarse timing is detected first. This search is implemented in the time domain. The algorithm is based on cyclic repetition within the LS after N
= 64 samples. Numerous treatises exist on this subject, e.g. [1] to [3].
Furthermore a coarse estimate Δ
of the Rx-Tx frequency offset Δf is derived from
coarse
the metric in [6]. (The hat generally indicates an estimate, e.g. is the estimate of x.)
This can easily be understood because the phase of r(i) Δ r* (i + N) is determined by
the frequency offset. As the frequency deviation Δf can exceed half a bin (distance
between neighboring sub-carriers) the preceding Short Symbol (SS) is also analyzed in
order to detect the ambiguity.
After the coarse timing calculation the time estimate is improved by the fine timing calculation. This is achieved by first estimating the coarse frequency response Ĥ
(LS)
, with
k
k = [–26, 26] denoting the channel index of the occupied sub-carriers.
22Operating Manual 1176.7649.02 ─ 06
Page 23

R&S® FSV-K91/91n/91ac/91p
First the FFT of the LS is calculated. After the FFT calculation the known symbol information of the LS sub-carriers is removed by dividing by the symbols. The result is a
coarse estimate Ĥk of the channel transfer function.
In the next step the complex channel impulse response is computed by an IFFT. Next
the energy of the windowed impulse response (the window size is equal to the guard
period) is calculated for every trial time. Afterwards the trail time of the maximum
energy is detected. This trial time is used to adjust the timing.
Now the position of the LS is known and the starting point of the useful part of the first
payload symbol can be derived. In the next block this calculated time instant is used to
position the payload window. Only the payload part is windowed. This is sufficient
because the payload is the only subject of the subsequent measurements.
In the next block the windowed sequence is compensated by the coarse frequency
estimate Δ
would occur in the frequency domain.
WLAN TX Measurements
Signal Processing of the IEEE 802.11a Application
. This is necessary because otherwise inter channel interference (ICI)
course
23Operating Manual 1176.7649.02 ─ 06
Page 24

R&S® FSV-K91/91n/91ac/91p
l,k
r''
1
measurement
k
H
of
parameters
k
H
(PL)
k
H
channel
estimation
l,k
a
WLAN TX Measurements
Signal Processing of the IEEE 802.11a Application
pilots + data
r(i)
= 20MHz
s3
f
l,k
r'
estimate
data symbols
data
user defined
compensation
l
, d
rest
f
l
g
full
compensation
l
FIR
S2
·kT
IF
-j
e
l,k
r
Resampler
=128MHz
ADC
f
s1
FFT
frequency
estimation
N = 64
compensation
of
gain, frequency, time
l,k
a
pilot
table
~~~
f
coarse
)
(LS
k
H
payload
window
timing
LS
(t)
IF
r
1.coarse timing
packet search:
2.fine timing
Figure 3-1: Signal processing of the IEEE 802.11a application
24Operating Manual 1176.7649.02 ─ 06
Page 25

R&S® FSV-K91/91n/91ac/91p
kl
phasephasej
klkl
neHgaKr
kl
common
l
kl
,
(
,mod
)timing(
,
)(
,
The transition to the frequency domain is achieved by an FFT of length 64. The FFT is
performed symbol-wise for every of the "nof_symbols" symbols of the payload. The
calculated FFTs are described by r
●
l = [1, nof_symbols] as the symbol index
●
k = [–31, 32] as the channel index
In case of an additive white Gaussian noise (AWGN) channel the FFT is described by
[4], [5]
Equation 3-1: Equation (10)
with:
●
k
: the modulation-dependant normalization factor
mod
●
a
: the symbol of sub-carrier k at symbol l
l,k
●
gl: the gain at the symbol l in relation to the reference gain g = 1 at the long symbol
(LS)
●
Hk: the channel frequency response at the long symbol (LS)
(common)
●
l
tion (11))
●
phase
l,k
Equation (11))
●
n
: the independent Gaussian distributed noise samples
l,k
WLAN TX Measurements
Signal Processing of the IEEE 802.11a Application
with:
l,k
: the common phase drift phase of all sub-carriers at symbol l (see Equa-
(timing)
: the phase of sub-carrier k at symbol l caused by the timing drift (see
The common phase drift in Equation (10) is given by:
Equation 3-2: Equation (11)
with
●
Ns = 80: the number of Nyquist samples of the symbol period
●
N = 64: the number of Nyquist samples of the useful part of the symbol
●
Δ f
: the (not yet compensated) frequency deviation
rest
●
dϒ l: the phase jitter at the symbol l
In general, the coarse frequency estimate Δ
802.11a application) is not error-free. Therefore the remaining frequency error Δf
represents the frequency deviation in r
not yet compensated. Consequently, the over-
l,k
(see) Signal processing of the IEEE
coarse
rest
all frequency deviation of the device under test (DUT) is calculated by:
Δf = Δ
coarse
+ Δf
rest
The only motivation for dividing the common phase drift in Equation (11) into two parts
is to be able to calculate the overall frequency deviation of the DUT.
25Operating Manual 1176.7649.02 ─ 06
Page 26

R&S® FSV-K91/91n/91ac/91p
lkNNphase
skl
/2
)timing(
,
The reason for the phase jitter dγ l in Equation (11) may be different. The nonlinear
part of the phase jitter may be caused by the phase noise of the DUT oscillator.
Another reason for nonlinear phase jitter may be the increase of the DUT amplifier
temperature at the beginning of the burst. Note that besides the nonlinear part the
phase jitter, dγ l also contains a constant part. This constant part is caused by the fre-
quency deviation Δ f
measurement of the phase starts at the first symbol l = 1 of the payload. In contrast the
channel frequency response Hk in Equation (10) represents the channel at the long
symbol of the preamble. Consequently, the frequency deviation Δ f
sated produces a phase drift between the long symbol and the first symbol of the pay-
load. Therefore, this phase drift appears as a constant value ("DC value") in dϒ l.
Referring to the IEEE 802.11a measurement standard Chapter 17.3.9.7 "Transmit
modulation accuracy test'' [6], the common phase drift phasel
ted and compensated from the pilots. Therefore this "symbol-wise phase tracking''
(Tracking Phase) is activated as the default setting of the R&S FSV-K91/91n.
Furthermore, the timing drift in Equation (10) is given by:
WLAN TX Measurements
Signal Processing of the IEEE 802.11a Application
not yet compensated. To understand this, keep in mind that the
rest
not yet compen-
rest
(common)
must be estima-
Equation 3-3: Equation (12)
with ξ: the relative clock deviation of the reference oscillator
Normally, a symbol-wise timing jitter is negligible and thus not modeled in Equation
(12). However, there may be situations where the timing drift has to be taken into
account. This is illustrated by an example: In accordance to [6], the allowed clock deviation of the DUT is up to ξ
= 20 ppm. Furthermore, a long packet with 400 symbols
max
is assumed. The result of Equation (10) and Equation (12), is that the phase drift of the
highest sub-carrier k = 26 in the last symbol l = nof_symbols is 93 degrees. Even in
the noise-free case, this would lead to symbol errors. The example shows that it is
actually necessary to estimate and compensate the clock deviation, which is accomplished in the next block.
Referring to the IEEE 802.11a measurement standard [6], the timing drift phase
(timing)
l,k
is not part of the requirements. Therefore the "time tracking" (Tracking Time) is not
activated as the default setting of the R&S FSV-K91/91n. The time tracking option
should rather be seen as a powerful analyzing option.
In addition, the tracking of the gain gl in Equation (10) is supported for each symbol in
relation to the reference gain g = 1 at the time instant of the long symbol (LS). At this
time the coarse channel transfer function Ĥ
This makes sense since the sequence r
fer function Ĥ
(LS)
before estimating the symbols. Consequently, a potential change of
k
(LS)
is calculated.
k
'
is compensated by the coarse channel trans-
l,k
the gain at the symbol l (caused, for example, by the increase of the DUT amplifier
temperature) may lead to symbol errors especially for a large symbol alphabet M of the
MQAM transmission. In this case the estimation and the subsequent compensation of
the gain are useful.
26Operating Manual 1176.7649.02 ─ 06
Page 27

R&S® FSV-K91/91n/91ac/91p
Referring to the IEEE 802.11a measurement standard [6], the compensation of the
gain gl is not part of the requirements. Therefore the "gain tracking"' (Tracking Gain) is
not activated as the default setting of the R&S FSV-K91/91n.
How can the parameters above be calculated? In this application the optimum maximum likelihood algorithm is used. In the first estimation step the symbol-independent
parameters Δ f
neglected in this step, i.e. the parameters are set to gl = 1 and dγ = 0. Referring to
Equation (10), the log likelihood function L must be calculated as a function of the trial
parameters
the trial parameter of x.)
WLAN TX Measurements
Signal Processing of the IEEE 802.11a Application
and ξ are estimated. The symbol dependent parameters can be
rest
and . (The tilde generally describes a trial parameter. Example: is
Equation 3-4: (13a)
The trial parameters leading to the minimum of the log likelihood function are used as
estimates
and . In (13a) the known pilot symbols a
are read from a table.
l,k
In the second step, the log likelihood function is calculated for every symbol l as a function of the trial parameters and :
Equation 3-5: (13b)
Finally, the trial parameters leading to the minimum of the log likelihood function are
used as estimates ĝl and
.
This robust algorithm works well even at low signal to noise ratios with the Cramer Rao
Bound being reached.
After estimation of the parameters, the sequence r
is compensated in the compensa-
l,k
tion blocks.
In the upper analyzing branch the compensation is user-defined i.e. the user determines which of the parameters are compensated. This is useful in order to extract the
influence of these parameters. The resulting output sequence is described by: γ
'
.
δ,k
In the lower compensation branch the full compensation is always performed. This
separate compensation is necessary in order to avoid symbol errors. After the full compensation the secure estimation of the data symbols â
is performed. From Equation
l,k
27Operating Manual 1176.7649.02 ─ 06
Page 28

R&S® FSV-K91/91n/91ac/91p
packetsnof
counter
counterEVM
packetsnof
EVM
_
1
2
)(
_
1
26
)0(26
2
52
1
kk
k
EVMEVM
symbolsnof
l
klklk
aKr
symbolsnof
EVM
_
1
2
,mod
''
,
_
1
(10) it is clear that first the channel transfer function Hk must be removed. This is ach-
ieved by dividing the known coarse channel estimate Ĥ
Usually an error free estimation of the data symbols can be assumed.
In the next block a better channel estimate Ĥ
calculated by using all nof_symbols symbols of the payload (PL). This can be accom-
plished at this point because the phase is compensated and the data symbols are
known. The long observation interval of nof_symbols symbols (compared to the short
interval of 2 symbols for the estimation of Ĥ
estimate.
In the following equalizer block Ĥ
resulting channel-compensated sequence is described by γ
choose the coarse channel estimate Ĥ
free channel estimate Ĥ
mate Ĥ
(LS)
k
expected.
According to the IEEE 802.11a measurement standard [6], the coarse channel estima-
(LS)
tion Ĥ
(from the long symbol) has to be used for equalization. Therefore the default
k
setting of the R&S FSV-K91/91n is equalization from the coarse channel estimate
derived from the long symbol.
WLAN TX Measurements
Signal Processing of the IEEE 802.11a Application
(LS)
calculated from the LS.
k
(PL)
of the data and pilot sub-carriers is
k
(LS)
) leads to a nearly error-free channel
k
(LS)
is compensated by the channel estimate. The
k
(LS)
(from the long symbol) or the nearly error-
(PL)
(from the payload) for equalization. If the improved esti-
k
k
''
. The user may either
δ,k
is used, a 2 dB reduction of the subsequent EVM measurement can be
In the last block the measurement variables are calculated. The most important variable is the error vector magnitude of the sub-carrier "k" of the current packet:
Equation 3-6: (14)
Furthermore, the packet error vector magnitude is derived by averaging the squared
EVMk versus k:
Equation 3-7: (15)
Finally, the average error vector magnitude is calculated by averaging the packet EVM
of all nof_symbols detected packets:
Equation 3-8: (16)
This parameter is equivalent to the so-called "RMS average of all errors": Error
RMS
of
the IEEE 802.11a measurement commandment (see [6], ).
28Operating Manual 1176.7649.02 ─ 06
Page 29
R&S® FSV-K91/91n/91ac/91p
WLAN TX Measurements
Signal Processing of the IEEE 802.11b Application
3.3.2 Literature to the IEEE 802.11a Application
3.4 Signal Processing of the IEEE 802.11b Application
[1] Speth, Classen, Meyr: ''Frame synchronization of OFDM systems in frequency selective fading
channels", VTC '97, pp. 1807-1811
[2] Schmidl, Cox: ''Robust Frequency and Timing Synchronization of OFDM", IEEE Trans. on Comm.,
Dec. 1997, pp. 1613-621
[3] Minn, Zeng, Bhargava: ''On Timing Offset Estimation for OFDM", IEEE Communication Letters,
July 2000, pp. 242-244
[4] Speth, Fechtel, Fock, Meyr: ''Optimum Receiver Design for Wireless Broad-Band Systems Using
OFDM – Part I", IEEE Trans. On Comm. VOL. 47, NO 11, Nov. 1999
[5] Speth, Fechtel, Fock, Meyr: ''Optimum Receiver Design for Wireless Broad-Band Systems Using
OFDM – Part II", IEEE Trans. On Comm. VOL. 49, NO 4, April. 2001
[6] IEEE 802.11a, Part 11: Wireless LAN Medium Access Control (MAC) and Physical Layer (PHY)
specifications
This description gives a rough overview of the signal processing concept of the IEEE
802.11b application.
●
Chapter 3.4.1, "Understanding Signal Processing of the IEEE 802.11b Application",
on page 30
●
Chapter 3.4.2, "Literature of the IEEE 802.11b Application", on page 35
Abbreviations
ε timing offset
Δ"f" frequency offset
ΔΦ phase offset
ARG{...} calculation of the angle of a complex value
EVM error vector magnitude
ĝ
I
ĝ
Q
Δĝ
Q
ĥs(v) estimated baseband filter of the transmitter
ĥr(v) estimated baseband filter of the receiver
ô
I
ô
Q
estimate of the gain factor in the I-branch
estimate of the gain factor in the Q-branch
accurate estimate of the crosstalk factor of the Q-branch in the I-branch
estimate of the IQ-offset in the I-branch
estimate of the IQ-offset in the I-branch
r(v) measurement signal
ŝ(v) estimate of the reference signal
29Operating Manual 1176.7649.02 ─ 06
Page 30

R&S® FSV-K91/91n/91ac/91p
ŝn(v) estimate of the power normalized and undisturbed reference signal
REAL{...} calculation of the real part of a complex value
IMAG{...} calculation of the imaginary part of a complex value
WLAN TX Measurements
Signal Processing of the IEEE 802.11b Application
3.4.1 Understanding Signal Processing of the IEEE 802.11b Application
A block diagram of the measurement application is shown below in Figure 3-2. The
baseband signal of an IEEE 802.11b wireless LAN system transmitter is sampled with
a sampling rate of 44 MHz.
The first task of the measurement application is to detect the position of the bursts
within the measurement signal r1(v). The detection algorithm is able to find the posi-
tions of the beginning of short and long bursts and can distinguish between them. The
algorithm also detects the initial state of the scrambler. This is required if IEEE 802.11
signals should be analyzed, because this standard does not specify the initial state of
the scrambler.
With the knowledge of the start position of the burst, the header of the burst can be
demodulated. The bits transmitted in the header provide information about the length
of the burst and the modulation type used in the PSDU.
After the start position and the burst length is fully known, better estimates of timing offset, timing drift, frequency offset and phase offset can be calculated using the entire
data of the burst.
At this point of the signal processing a demodulation can be performed without decision error. After demodulation the normalized and undisturbed reference signal s(v) is
available.
If the frequency offset is not constant and varies with time, the frequency- and phase
offset in several partitions of the burst must be estimated and corrected. Additionally,
timing offset, timing drift and gain factor can be estimated and corrected in several partitions of the burst. These corrections can be separately switched off in the "Demod
Settings" menu.
30Operating Manual 1176.7649.02 ─ 06
Page 31

R&S® FSV-K91/91n/91ac/91p
WLAN TX Measurements
Signal Processing of the IEEE 802.11b Application
Figure 3-2: Signal processing of the IEEE 802.11b application
31Operating Manual 1176.7649.02 ─ 06
Page 32

R&S® FSV-K91/91n/91ac/91p
1
0
2
~
~
2
2
~~
)(
~
)(
~
)(
~
)
~
(
N
QIQQQQII
jfj
ojosgsgjsgeerL
Knowing the normalized power and undisturbed reference signal, the transmitter baseband filter is estimated by minimizing the cost function of a maximum-likelihood-based
estimator:
Equation 3-9: (17)
where:
r(v): the oversampled measurement signal
ŝ: the normalized oversampled power
(v): the undisturbed reference signal
n
N: the observation length
L: the filter length
: the variation parameters of the frequency offset
WLAN TX Measurements
Signal Processing of the IEEE 802.11b Application
: the variation parameters of the phase offset
, : the variation parameters of the IQ-offset
: the coefficients of the transmitter filter
The frequency-, the phase- and the IQ-offset are estimated jointly with the coefficients
of the transmitter filter to increase the estimation quality.
Once the transmitter filter is known, all other unknown signal parameters are estimated
with a maximum-likelihood-based estimation, which minimizes the cost function:
Equation 3-10: (18)
where:
, : the variation parameters of the gain used in the I/Q-branch
: the crosstalk factor of the Q-branch into the I-branch
sI(v), sQ(v): the filtered reference signal of the I/Q-branch.
The unknown signal parameters are estimated in a joint estimation process to increase
the accuracy of the estimates.
The accurate estimates of the frequency offset, the IQ-imbalance, the quadrature-mismatch and the normalized IQ-offset are displayed by the measurement software. The
IQ-imbalance is the quotient of the estimates of the gain factor of the Q-branch, the
crosstalk factor and the gain factor of the I-branch:
32Operating Manual 1176.7649.02 ─ 06
Page 33

R&S® FSV-K91/91n/91ac/91p
2
22
22
ˆˆ
ˆˆ
2
1
gg
oo
QI
QI
OffsetIQ
1
0
2
1
0
2
)(
ˆ
)(
ˆ
)(
N
v
N
v
vs
vsvr
EVM
1
0
2
)(
ˆ
)(
ˆ
)(
)(
N
v
vs
vsvr
vEVM
Equation 3-11: (19)
The quadrature-mismatch is a measure for the crosstalk of the Q-branch into the Ibranch:
Equation 3-12: (20)
The normalized IQ-offset is defined as the magnitude of the IQ-offset normalized by
the magnitude of the reference signal:
WLAN TX Measurements
Signal Processing of the IEEE 802.11b Application
Equation 3-13: (21)
At this point of the signal processing all unknown signal parameters such as timing-,
frequency-, phase-, IQ-offset and IQ-imbalance have been evaluated and the measurement signal can be corrected accordingly.
Using the corrected measurement signal r(v) and the estimated reference signal ŝ(v),
the modulation quality parameters can be calculated. The mean error vector magnitude
(EVM) is the quotient of the root-mean-square values of the error signal power and the
reference signal power:
Equation 3-14: (22)
Whereas the instant error vector magnitude is the momentary error signal magnitude
normalized by the root mean square value of the reference signal power:
Equation 3-15: (23)
In [2] a different algorithm is proposed to calculate the error vector magnitude. In a first
step the IQ-offset in the I-branch and the IQ-offset of the Q-branch are estimated separately:
33Operating Manual 1176.7649.02 ─ 06
Page 34

R&S® FSV-K91/91n/91ac/91p
1
0
REAL
1
ˆ
N
v
I
r(v)
N
o
1
0
IMAG
1
ˆ
N
v
Q
r(v)
N
o
1
0
ˆ
REAL
1
ˆ
N
v
II
or(v)
N
g
1
0
ˆ
IMAG
1
ˆ
N
v
QQ
or(v)
N
g
Equation 3-16: (24)
Equation 3-17: (25)
where r(v) is the measurement signal which has been corrected with the estimates of
the timing-, frequency- and phase offset, but not with the estimates of the IQ-imbalance
and IQ-offset
With these values the IQ-imbalance of the I-branch and the IQ-imbalance of the Qbranch are estimated in a non-linear estimation in a second step:
WLAN TX Measurements
Signal Processing of the IEEE 802.11b Application
Equation 3-18: (26)
Equation 3-19: (27)
Finally, the mean error vector magnitude can be calculated with a non-data-aided calculation:
Equation 3-20: (28)
The instant error vector magnitude is the error signal magnitude normalized by the root
mean square value of the estimate of the measurement signal power:
Equation 3-21: (29)
The advantage of this method is that no estimate of the reference signal is needed, but
the IQ-offset and IQ-imbalance values are not estimated in a joint estimation procedure. Therefore, each estimation parameter is disturbing the estimation of the other
34Operating Manual 1176.7649.02 ─ 06
Page 35

R&S® FSV-K91/91n/91ac/91p
parameter and the accuracy of the estimates is lower than the accuracy of the estimations achieved by (17). If the EVM value is dominated by Gaussian noise this method
yields similar results as (18).
WLAN TX Measurements
802.11b RF Carrier Suppression
3.4.2 Literature of the IEEE 802.11b Application
3.5 802.11b RF Carrier Suppression
[1] Institute of Electrical and Electronic Engineers, Part 11: Wireless LAN Medium Access Control
(MAC) and Physical Layer (PHY) specifications, IEEE Std 802.11-1999, Institute of Electrical and
Electronic Engineers, Inc., 1999.
[2] Institute of Electrical and Electronic Engineers, Part 11: Wireless LAN Medium Access Control
(MAC) and Physical Layer (PHY) specifications: Higher-Speed Physical Layer Extensions in the
2.4 GHz Band, IEEE Std 802.11b-1999, Institute of Electrical and Electronic Engineers, Inc., 1999.
Definition
The RF carrier suppression, measured at the channel center frequency, shall be at
least 15 dB below the peak SIN(x)/x power spectrum. The RF carrier suppression shall
be measured while transmitting a repetitive 01 data sequence with the scrambler disabled using DQPSK modulation. A 100 kHz resolution bandwidth shall be used to perform this measurement.
Comparison to IQ offset measurement in R&S FSV-K91/91n list mode
The IQ offset measurement in R&S FSV-K91/91n returns the actual carrier feed
through normalized to the mean power at the symbol timings. This measurement
doesn't need a special test signal and is independent of the transmit filter shape.
The RF carrier suppression measured according to the standard is inversely proportional to the IQ offset measured in R&S FSV-K91/91n list mode. The difference (in dB)
between the two values depends on the transmit filter shape and should be determined
with one reference measurement.
The following table lists exemplary the difference for three transmit filter shapes (±0.5
db):
Transmit filter – IQ-Offset [dB] – RF-Carrier-Suppression [dB]
Rectangular 11 dB
Root raised cosine, "α" = 0.3 10 dB
Gaussian, "α" = 0.3 9 dB
35Operating Manual 1176.7649.02 ─ 06
Page 36

R&S® FSV-K91/91n/91ac/91p
WLAN TX Measurements
IEEE 802.11n/ac MIMO Measurements
3.6 IEEE 802.11n/ac MIMO Measurements
For measurements according to the IEEE 802.11n or ac standard, the R&S FSVA/FSV
can measure multiple data streams between multiple transmitters and multiple receivers (MIMO = multiple in, multiple out).
To understand which results come from which part of the data flow it is sensible to
have a look at the fundamental processing in transmitter and receiver. The following
figure shows the basic processing steps needed at the transmitter and the complementary blocks in reverse order applied at the receiver:
Figure 3-3: Transmitter-Receiver block diagram
Especially of interest is the representation of specific results, i.e. for which sections of
the processing the results are shown. Usually results are calculated according to particular signal processing steps in the transmitter (except for the results “Burst Power”
and “Crest Factor” which refer tor the receive antennas):
Figure 3-4: Possible results and Channel Representation (effective / physical)
For example EVM and Constellation results are calculated according to the spatial or
space time streams in the transmitter, i.e. by using the effective channel which includes
the spatial mapping. Since Space Time Block Encoding is only applied to data carriers
but pilot carriers are inserted without STBC, the EVM analysis is applied to spatial
streams (STBC decoded) for data carriers and to space time streams for pilot streams.
As a consequence we might get results (EVM and Constellation) for a different number
of streams for data and pilot carriers if STBC is applied. For example using 2x2 MIMO
with active STBC we get only pilot carriers in the second stream, because due to
STBC there is only one spatial (data) stream but 2 space time (pilot) streams.
36Operating Manual 1176.7649.02 ─ 06
Page 37

R&S® FSV-K91/91n/91ac/91p
In contrast the I/Q Offset, Gain Imbalance and Quadrature Offset results are calculated
for the transmit antenna signals. Ie they are corresponding to the physical channel.
H
= H
Phy
Q-1 Ie in order to determine the physical channel from the effective channel,
eff
the precoding matrix Q (spatial mapping) must be invertible. Note that “transmit
antenna signals” means the ideal transmit signal so that the estimated channel transfer
functions include cross talk (between the antennas) introduced by the DUT, the connection between DUT and Analyzer and the Analyzer itself (whereas we regard the
cross terms contributed by the cable connection and the Analyzer hardware as to be
negligible).
Furthermore the spectral results (channel flatness and group delay) are available for
the effective and the physical channel, i.e. based on streams or Tx antennas. Note that
the physical channel is not in any case derivable from the initially estimated effective
channel (but only if the precoding matrix is invertible) and thus the physical channel
results are only available under specific conditions. In contrast the effective channel
results are always available. This can be explained by the fact, that the channel estimation is done on the HT-LTF fields of the preamble (see figure below), which are
transmitted by one individual (known) preamble symbol per each space time stream
and therefore allowing to estimate the channel map between Rx Antennas and space
time streams in the first step:
WLAN TX Measurements
IEEE 802.11n/ac MIMO Measurements
3.6.1
Figure 3-5: Possible results and Channel Representation (effective / physical)
The so estimated effective channel (using HT-LTF fields as described above) can then
be transformed into the physical channel (map between Rx and Tx Antenna signals) by
applying the inverse mapping matrix Q. Now it is clear, that the physical channel can
only be calculated if Q can be inverted. For example this is not the case if the signal
contains less space time streams than Tx antennas.
Trigger Synchronization Using an R&S®FS-Z11 Trigger Unit
For simultaneous MIMO measurements, it is important to analyze the Tx antenna signals sent at the same instant of time from the Device Under Test (DUT). The R&S®FSZ11 Trigger Unit can ensure that all analyzers start capturing I/Q data at the same
time.
37Operating Manual 1176.7649.02 ─ 06
Page 38

R&S® FSV-K91/91n/91ac/91p
The trigger unit is connected to the DUT and all involved analyzers. Then the trigger
unit can be used in the following operating modes:
●
External mode: If the DUT has a trigger output, the trigger signal from the DUT
triggers all analyzers simultaneously.
The DUT's TRIGGER OUTPUT is connected to the trigger unit's TRIG INPUT connector. Each of the trigger unit's TRIG OUT connectors is connected to one of the
analyzers' TRIGGER INPUT connector.
The trigger unit routes the trigger signal from TRIG INPUT to TRIG OUT 1 to 4, and
thus to the the trigger inputs of the connected analyzers.
●
Free Run mode: This mode is used if no DUT trigger signal is available or the
MIMO signals are simply to be captured at the same (random) time. No connection
to the trigger signal of the DUT is required. The master analyzer sends a trigger
impulse to the trigger unit - via the NOISE SOURCE CONTROL output - to start the
measurement as soon as all slave analyzers are ready to measure.
The NOISE SOURCE CONTROL output of the master analyzer is connected to the
trigger unit's NOISE SOURCE CONTROL input. Each of the trigger unit's TRIG
OUT connectors is connected to one of the analyzers' TRIGGER INPUT connector.
When the master analyzer sends a signal to the trigger unit via its NOISE
SOURCE CONTROL output, the trigger unit triggers all analyzers simultaneously
via its TRIGGER OUTPUTs.
Note: in Free Run mode you have to make sure the TRIG INPUT on the trigger unit
remains open, that is: not connected.
●
Manual mode: a trigger is generated by the trigger unit and triggers all analyzers
simultaneously. No connection to the DUT is required.
Each of the trigger unit's TRIG OUT connectors is connected to one of the analyzers' TRIGGER INPUT connector. A trigger signal is generated when you press
(release) the "TRIG MANUAL" button on the trigger unit.
Note: in Manual mode you have to make sure the NOISE SOURCE CONTROL
INPUT on the trigger unit remains open, that is: not connected.
WLAN TX Measurements
IEEE 802.11n/ac MIMO Measurements
A trigger unit is activated in the General Settings.
For more detailed information on the R&S®FS-Z11 Trigger Unit and the required connections, see the "R&S®FS-Z11 Trigger Unit Manual".
Connecting the R&S®FS-Z11 Trigger Unit
Connect the trigger unit with your measurement setup according to the following schematic diagram:
38Operating Manual 1176.7649.02 ─ 06
Page 39

R&S® FSV-K91/91n/91ac/91p
WLAN TX Measurements
Signal Field Measurement (IEEE 802.11ac, n (SISO+MIMO))
Figure 3-6: R&S®FS-Z11 Trigger Unit connections
1. Connect the EXT TRIG inputs of all analyzers (master and slaves) to the TRIG
OUT 1 to 4 (or 1 and 2 only for measurements on two Tx antennas) of the trigger
unit.
The order is irrelevant, that means you could also connect the master analyzer to
the TRIG OUT 2 output of the trigger unit, for example.
2. If necessary for the required operating mode (see above), connect the NOISE
SOURCE output of the master analyzer to the NOISE SOURCE CONTROL INPUT
of the trigger unit.
3.7 Signal Field Measurement (IEEE 802.11ac, n (SISO +MIMO))
For the IEEE 802.11 ac, n (SISO+MIMO) standards, an enhanced Signal Field measurement is available, with an improved result display and additional information.
For each analyzed PPDU of the signal, the Signal Field measurement contains the HTSIG1 and HT-SIG2 as a bit sequence. Where appropriate this information is also provi-
ded in human-readable form beneath the bits.
The list header contains the following information:
●
The first line indicates the HT-SIG field assigned to the corresponding bit sequence
(See IEEE Std 802.11n-2009 Figure 20-6—Format of HT-SIG1 and HT-SIG2).
39Operating Manual 1176.7649.02 ─ 06
Page 40

R&S® FSV-K91/91n/91ac/91p
●
The second line shows the R&S FSV-K91 parameters affecting which PPDUs take
part in the analysis and which do not (this functionality is referred as "logical filter").
●
The value inside the white rectangle indicates the current "logical filter" setting.
WLAN TX Measurements
Signal Field Measurement (IEEE 802.11ac, n (SISO+MIMO))
Figure 3-7: FSV-K91 Enhanced Signal Field measurement
Measurement settings
The settings for this measurement are defined in the "Demod Settings" for the IEEE
802.n standard, and in the "Advanced Demod Settings" for the IEEE 802.n (MIMO)
standard.
Note that for the IEEE 802.n standard, the "Use Signal Field Content" setting must be
activated for Signal Field measurements.
The following table indicates which PPDU properties are displayed in the result table of
the Signal Field measurement and which R&S FSV-K91 settings are used to obtain
these properties.
PPDU Property Setting for IEEE 802.n Setting for IEEE 802.n (MIMO)
Format PPDU Frame Format Burst type to measure
MCS Auto Demod ON: Auto, same type as first burst
Auto Demod OFF:PSDU Mod to Analyze
Bandwidth PPDU Frame Format Channel BW to measure
HT Length Source of Payload Len Source of Payload Len
GI Guard Interval Guard Interval Len
MCS Index to use
40Operating Manual 1176.7649.02 ─ 06
Page 41

R&S® FSV-K91/91n/91ac/91p
Measurement results
The R&S FSV-K91 determines certain inconsistencies in the signal and informs the
user with an appropriate warning. If the signal was analyzed successfully the results –
indicated by a message - also contribute to the overall analysis results. The corresponding PPDU in the Capture Memory is highlighted by an orange bar.
WLAN TX Measurements
Signal Field Measurement (IEEE 802.11ac, n (SISO+MIMO))
Figure 3-8: The Signal Field measurement revealing a length conflict between the HT-SIG length and
the length estimated from the PPDU power profile
If a required property set by the user in the Demod Settings does not match the corresponding PPDU property from the list, the PPDU is dismissed. An appropriate message is provided. The corresponding PPDU in the Capture Memory in not highlighted.
41Operating Manual 1176.7649.02 ─ 06
Page 42

R&S® FSV-K91/91n/91ac/91p
WLAN TX Measurements
Signal Field Measurement (IEEE 802.11ac, n (SISO+MIMO))
Figure 3-9: Mixed mode 20MHz signal with "Channel BW to measure" set to measure only 40MHz sig-
nals
Messages and warnings
The following messages are generated by the R&S FSV-K91 measurement application:
Results contribute to overall results despite inconsistencies:
"Info: Comparison between HT-SIG Payload Length and Estimated Payload
Length not performed due to insufficient SNR"
The R&S FSV-K91 application compares the HT-SIG length against the length estimated from the PPDU power profile. If the two values do not match, the corresponding
entry is highlighted orange. If the signal quality is very bad, this comparison is suppressed and the message above is shown.
"Warning: HT-SIG of PPDU was not evaluated"
Decoding of the HT-SIG was not possible because there was to not enough data in the
Capture Memory (potential burst truncation).
"Warning: Mismatch between HT-SIG and estimated (SNR+Power) PPDU length"
The HT-SIG length and the length estimated by the R&S FSV application (from the
PPDU power profile) are different.
"Warning: Physical Channel estimation impossible / Phy Chan results not available Possible reasons: channel matrix not square or singular to working precision"
42Operating Manual 1176.7649.02 ─ 06
Page 43

R&S® FSV-K91/91n/91ac/91p
The Physical Channel results could not be calculated for one or both of the following
reasons:
●
The spatial mapping can not be applied due to a rectangular mapping matrix (the
number of space time streams is not equal to the number of transmit antennas).
●
The spatial mapping matrices are singular to working precision.
PPDUs are dismissed due to inconsistencies
"Hint: PPDU requires at least one payload symbol"
Currently at least one payload symbol is required in order to successfully analyze the
PPDU. Null data packet (NDP) sounding bursts will generate this message.
"Hint: PPDU dismissed due to a mismatch with the PPDU format to be analyzed"
The properties causing the mismatches for this PPDU are highlighted.
"Hint: PPDU dismissed due to truncation"
The first or the last burst was truncated during the signal capture process, for example.
WLAN TX Measurements
Optimized Signal Levels
"Hint: PPDU dismissed due to HT-SIG inconsistencies"
One or more of the following HT-SIG decoding results are outside of specified range:
MCS index, Number of additional STBC streams, Number of space time streams
(derived from MCS and STBC), CRC Check failed, Non zero tail bits.
"Hint: PPDU dismissed because payload channel estimation was not possible"
The payload based channel estimation was not possible because the channel matrix is
singular to working precision.
"Hint: Channel matrix singular to working precision"
Channel equalizing (for Burst Length Detection, fully and user compensated measurement signal) is not possible because the estimated channel matrix is singular to working precision.
3.8 Optimized Signal Levels
For best measurement results in respect to modulation accuracy and error vector magnitude, the peak level of the measured input signal should be as close as possible to
the full scale level of the A/D converter. An automatic level function is available which
measures the required signal parameters prior to the start of each measurement
sweep. This ensures that the amplitude settings are adjusted to the signal optimally in
order to obtain accurate results. Note the auto leveling function slightly increases measurement time. For constant signal levels, you can switch it off.
For IEEE 802.11 ac signals, and if the optional R&S FSVA/FSV-B160 bandwidth
extension is available, an additional IF attenuation is available. This setting allows for
the power levels provided at the A/D converter to be adjusted, thus optimizing measurement accuracy further.
43Operating Manual 1176.7649.02 ─ 06
Page 44

R&S® FSV-K91/91n/91ac/91p
WLAN TX Measurements
Measurement Result Types
RFin
Figure 3-10: Basic leveling of an IEEE 802.11 ac VHT80, VHT160 signal
MechAtt
{0,10,20,…,70}
PA
{OFF, ON}
ElAtt
{0,1,2,3,4,…,25}
... LOs
160 MHz
path
160 MHz IF Atten
{2, 3, …, 20}
A
To determine optimal level settings for an IEEE 802.11 ac signal
During automatic level measurements, the optimal IF attenuation is determined by the
R&S FSVA/FSV. To determine the best level manually, perform the following steps:
1. For signals with an RMS power under -19 dBm, switch on the preamplifier (see
"Preamp On/Off" on page 93).
For all other signals, switch off the preamplifier.
2. Ensure the IF attenuation is set to its default value of 12 dB (see "160MHz IF-
Atten" on page 93).
3. Decrease or increase the RF attenuation (=MechAtt + ElAtt) to find the threshold
attenuation at which the OVLD message in the R&S FSVA/FSV status bar disappears (see "Attenuation " on page 92).
4. Fine-tune the EVM by shifting the attenuation in steps of ± 1 dB up to ± 4 dB
between the Attenuation (=MechAtt+ElAtt) and the 160MHz IF-Atten (see Chap-
ter 3.10.2.1, "Result display for measurements on OFDM signals", on page 55).
The optimum settings are obtained when the best EVM is achieved without overloading the input (indicated by OVLD in the status bar).
D
3.9 Measurement Result Types
3.9.1 IQ Impairments
This chapter provides an overview over the I/Q impairments for the R&S FSV-K91/91n.
●
Chapter 3.9.1.1, "IQ Offset", on page 44
●
Chapter 3.9.1.2, "Gain Imbalance", on page 45
●
Chapter 3.9.1.3, "Quadrature Error", on page 46
3.9.1.1 IQ Offset
An IQ-Offset indicates a carrier offset with fixed amplitude. This results in a constant
shift of the IQ axes. The offset is normalized by the mean symbol power and displayed
in dB.
44Operating Manual 1176.7649.02 ─ 06
Page 45

R&S® FSV-K91/91n/91ac/91p
WLAN TX Measurements
Measurement Result Types
3.9.1.2 Gain Imbalance
An ideal I/Q modulator amplifies the I and Q signal path by exactly the same degree.
The imbalance corresponds to the difference in amplification of the I and Q channel
and therefore to the difference in amplitude of the signal components. In the vector diagram, the length of the I vector changes relative to the length of the Q vector.
The entry is displayed in dB and %, where 1 dB offset is roughly 12 % according to the
following:
Imbalance [dB] = 20log (| GainQ |/| GainI |)
Positive values mean that the Q vector is amplified more than the I vector by the corresponding percentage:
45Operating Manual 1176.7649.02 ─ 06
Page 46

R&S® FSV-K91/91n/91ac/91p
Negative values mean that the I vector is amplified more than the Q vector by the corresponding percentage:
WLAN TX Measurements
Measurement Result Types
3.9.1.3 Quadrature Error
An ideal I/Q modulator sets the phase angle to exactly 90 degrees. With a quadrature
error, the phase angle between the I and Q vector deviates from the ideal 90 degrees,
the amplitudes of both components are of the same size. In the vector diagram, the
quadrature error causes the coordinate system to shift.
A positive quadrature error means a phase angle greater than 90 degrees:
46Operating Manual 1176.7649.02 ─ 06
Page 47

R&S® FSV-K91/91n/91ac/91p
WLAN TX Measurements
Measurement Result Types
A negative quadrature error means a phase angle less than 90 degrees:
47Operating Manual 1176.7649.02 ─ 06
Page 48

R&S® FSV-K91/91n/91ac/91p
WLAN TX Measurements
Measurement Result Types
3.9.2 EVM Measurement
The R&S FSV-K91 option provides two different types of EVM calculation.
Peak EVM (IEEE)
Peak EVM (IEEE) evaluates the EVM as defined in section 18.4.7.8 "Transmit modulation accuracy" of the IEEE 802.11b standard. The measurement signal is corrected in
respect of frequency error and clock deviation before EVM calculation. Additionally the
specified calculation removes the dc offset of the measurement signal.
The standard does not specify a normalization factor for the error vector magnitude. To
get a level independent EVM value, the R&S FSV-K91 normalizes the EVM values, so
that an EVM of 100% indicates that the error power on the I- or Q-channels equals the
mean power on the I- or Q-channels respectively.
The Peak EVM is the maximum EVM over all chips of one burst. If more than one burst
is evaluated (several analyzed bursts in the capture buffer or with the help of Overall
Burst Count), the Min / Mean / Max columns show the minimum, mean or maximum
Peak EVM of all analyzed bursts.
The IEEE 802.11b standard allows a Peak EVM of less than 35%. In contrary to the
specification, the R&S FSV-K91 does not limit the measurement to 1000 chips length,
but searches the maximum over the whole burst.
48Operating Manual 1176.7649.02 ─ 06
Page 49

R&S® FSV-K91/91n/91ac/91p
Burst EVM (Direct)
Burst EVM (Direct) evaluates the root mean square EVM over one burst. That is the
square root of the averaged error power normalized by the averaged reference power:
Before calculation of the EVM, the measurement signal is corrected in respect of frequency error, clock deviation and IQ impairments.
If more than one burst is evaluated (several analyzed bursts in the capture buffer or
with the help of Overall Burst Count), the Min / Mean / Max columns show the minimum, mean or maximum Burst EVM of all analyzed bursts.
WLAN TX Measurements
Measurement Result Types
Burst EVM is not part of the IEEE standard and no limit check is specified. Nevertheless, this commonly used EVM calculation can give some insight in modulation quality
and allows comparisons to other modulation standards.
Figure 3-11: IQ diagram for EVM calculation
49Operating Manual 1176.7649.02 ─ 06
Page 50

R&S® FSV-K91/91n/91ac/91p
WLAN TX Measurements
Measurement Settings and Result Displays
3.9.3 Rise/Fall Time Measurement
The rise/fall time is calculated according to the following algorithm:
●
Apply a moving average filter over the burst power (adjustable average length)
●
If "Ref Pow Max" is set: Search maximum power Pmax over the whole burst. Set
Pref=Pmax
●
If "Ref Pow Mean" is set: Calculate mean power Pmean of the whole burst. Set
Pref=Pmean
●
Rise time
– Search the first crossing of 0.5xPref from the left.
– Search backwards for the 10 % crossing 0.1xPref and note t10.
– Search forward for the 90 % crossing 0.9xPref and note t90.
– Return Trise=t90-t10.
●
Fall time
– Search the first crossing of 0.5xPref from the right.
– Search forwards for the 10 % crossing 0.1xPref and note t10.
– Search backwards for the 90 % crossing 0.9xPref and note t90.
– Return Tfall=t10-t90.
Since the single carrier modes of 802.11b, g use linear modulation formats like BPSK
or QPSK, the transmit signal power varies between symbol sampling times. These
power variations are determined by the transmit filter, which is not defined in the standard. The R&S FSV-K91/91n allows fine tuning of the PVT measurements on signals
with high crest factors by an adjustable moving average filter and two different reference power settings.
The reference power equals the 100 % setting for the rise/fall time calculation. Either
the maximum burst power or the mean burst power can be chosen as reference power.
Using the mean burst power, rarely power peaks within the burst does not influence
the rise/fall time measurement.
The moving average filter smoothes the power trace and thus eliminates the modulation. While a long average length leads to more stable measurement results, it naturally increases the rise/fall times compared to no averaging.
3.10 Measurement Settings and Result Displays
The WLAN option provides two main measurement types:
Frequency sweep measurements
●
Spectrum mask (see "Spectrum Mask (IEEE 802.11ac, b, g (Single Carrier)) /
Spectrum IEEE/ETSI (IEEE 802.11a, g, j, n (OFDM), p)" on page 78 softkey)
●
Spectrum ACP/ACPR (see "Spectrum ACPR (IEEE 802.11a, ac, g (OFDM Turbo
Mode), n, p)/ Spectrum ACP (IEEE 802.11b)/ ACP Rel/Abs (IEEE 802.11j)"
on page 80
50Operating Manual 1176.7649.02 ─ 06
Page 51

R&S® FSV-K91/91n/91ac/91p
I/Q measurements (based on captured IQ data)
●
Power vs Time (see "PVT" on page 64)
●
EVM vs Symbol, EVM vs Carrier (see "EVM vs Symbol/Carrier" on page 69 softkey)
●
Phase vs Preamble, Frequency vs Preamble (see "Error Frequency/Phase"
on page 71 softkey)
●
Spectrum Flatness (see "Spectrum Flatness (IEEE 802.11a, ac, g, j, n (OFDM), p /
Group Delay (IEEE 802.11 n (MIMO))" on page 76 softkey)
●
Spectrum FFT (see "Spectrum FFT" on page 79 softkey)
●
Constellation vs Symbol, Constellation vs Carrier (see "Constell vs Symbol/Carrier"
on page 73 softkey)
●
Conditional Cumulative Distribution Function (see "CCDF" on page 83 softkey)
●
Bit Stream (see "Bitstream" on page 83 softkey)
●
Signal Field (see "Signal Field (IEEE 802.11a, ac, g (OFDM), j , n, p)" on page 85
softkey)
When using the IEEE 802.11n standard, I/Q measurements are available both in SISO
mode (one antenna, one data stream), and MIMO mode (several antennas, several
data streams). For details see Chapter 3.6, "IEEE 802.11n/ac MIMO Measurements",
on page 36.
WLAN TX Measurements
Measurement Settings and Result Displays
Measurement result display
The measurement result display is divided into two panes:
●
Chapter 3.10.1, "Measurement Settings", on page 51
●
Result displays
The results can be displayed in form of a list or a graph (see also "Display List/Graph"
on page 64 softkey).
●
Chapter 3.10.2, "Result Summary List", on page 54
●
Chapter 3.10.3, "Result Display Graph", on page 59
Saving results
The measurement results can be stored at any time using the SAVE/RCL key (see the
base unit description). Both the measured I/Q data and the trace and table results can
be stored individually. Furthermore, any limit values modified in the result summary
can also be stored. Note that for trace and table results, the originally measured values
are always stored. The values are not updated after changes to the Demod Settings.
I/Q data, on the other hand, can be refreshed before it is stored.
3.10.1 Measurement Settings
The overall measurement settings used to obtain the current measurement results are
displayed in the channel bar:
51Operating Manual 1176.7649.02 ─ 06
Page 52

R&S® FSV-K91/91n/91ac/91p
Figure 3-12: Measurement settings in the channel bar (example)
The following settings are listed:
Table 3-1: Measurement settings for IEEE 802.11a, p
Setting Description Restrictions
Sig. Lvl. Set The expected mean signal level for the input signal. Turbo Mode only
WLAN TX Measurements
Measurement Settings and Result Displays
Frequency The frequency of the measured input signal.
Time
Data Symbols Shows the minimum and maximum number of data
Samples
Standard Selected measurement standard
Burst Type The type of burst being analyzed.
Modulation Shows the active setting selected in the "Demod
Burst x of y (z) In case statistic over bursts is switched on (Overall
Table 3-2: Measurement settings for IEEE 802.11b+g
Setting Description Restrictions
Ext Att The attenuation (positive values) or gain (negative
symbols that a burst may have if it is to be considered in results analysis.
Settings" dialog box: "Demodulator" or "PSDU Modulation to Analyze".
Burst Count), x bursts of totally required y (No of
Bursts to Analyze) bursts have been analyzed so
far. The value z gives the number of analyzed
bursts by the last update of the statistic.
values) applied to the signal externally (i.e. before
the RF or IQ connector of the signal analyzer), e.g.:
External Att = 10 dB means that before the RF connector of the R&S FSVA/FSV a 10 dB attenuator is
used
External Att = -20 dB means that before the RF connector of the R&S FSVA/FSV an amplifier with 20
dB gain is used
Turbo Mode only
Turbo Mode only
Frequency The frequency of the measured input signal.
Cap Time The spectrum analyzer samples the signal for this
time interval length.
PSDU Length Shows the minimum and maximum number of data
bytes that a burst may have if it is to be considered
in results analysis.
52Operating Manual 1176.7649.02 ─ 06
Page 53

R&S® FSV-K91/91n/91ac/91p
Setting Description Restrictions
WLAN TX Measurements
Measurement Settings and Result Displays
Samples
Standard Selected measurement standard
Preamble The type of preamble of analyzed bursts. Single Carrier only
Modulation Shows the active setting selected in the "Demod
Burst x of y (z) In case statistic over bursts is switched on (Overall
Table 3-3: Measurement settings for IEEE 802.11j
Setting Description Restrictions
Sig Lvl Set The expected mean signal level for the input signal. Turbo Mode only
Frequency The frequency of the measured input signal.
Time
Data Symbols Shows the minimum and maximum number of data
Settings" dialog box: "Demodulator" or "PSDU Modulation to Analyze".
Burst Count), x bursts of totally required y (No of
Bursts to Analyze) bursts have been analyzed so
far. The value z gives the number of analyzed
bursts by the last update of the statistic.
Turbo Mode only
symbols that a burst may have if it is to be considered in results analysis.
Samples
Standard Selected measurement standard
Burst Type The type of burst being analyzed. Turbo Mode only
Modulation Shows the active setting selected in the "Demod
Burst x of y (z) In case statistic over bursts is switched on (Overall
Table 3-4: Measurement settings for IEEE 802.11ac, n (SISO+MIMO)
Setting Description Restrictions
Sig Lvl Set The expected mean signal level for the input signal. Turbo Mode only
Frequency The frequency of the measured input signal.
Fs Input sample rate
Time
Data Symbols Shows the minimum and maximum number of data
Settings" dialog box: "Demodulator" or "PSDU Modulation to Analyze".
Burst Count), x bursts of totally required y (No of
Bursts to Analyze) bursts have been analyzed so
far. The value z gives the number of analyzed
bursts by the last update of the statistic.
Turbo Mode only
symbols that a burst may have if it is to be considered in results analysis.
53Operating Manual 1176.7649.02 ─ 06
Page 54

R&S® FSV-K91/91n/91ac/91p
Setting Description Restrictions
WLAN TX Measurements
Measurement Settings and Result Displays
Samples Number of samples for the "Capture Time" interval
generated at Input Sample Rate "Fs".
Standard Selected measurement standard
PPDU/MCS
Index/GI
Burst x of y (z) In case statistic over bursts is switched on (Overall
3.10.2 Result Summary List
The PPDU Type, MCS Index and Guard Interval
used for the analysis of the signal is displayed.
Depending on the Demod Settings, these values are
either automatically detected from the signal or the
user settings are applied.
Burst Count), x bursts of totally required y (No of
Bursts to Analyze) bursts have been analyzed so
far. The value z gives the number of analyzed
bursts by the last update of the statistic.
The result summary list shows the overall measurement results and provides limit
checking for result values in accordance with the selected standard. Result values
which are within the limit as specified by the standard are displayed in green. Result
values which are outside of the limits specified by the standard are displayed in red
with a '*' to the left. Results which have no limits specified by the standard are displayed in white. Limit values are displayed in white (not bold) and can be modified, if
focused, via the keypad. To reset the limit values to the values specified in the standard, use the "Lines" menu ( Chapter 4.8, "Softkeys of the Lines Menu – LINES key",
on page 113).
SISO only
The results displayed in this list are for the entire measurement. If a specific number of
bursts have been requested which requires more than one sweep, the result summary
list is updated at the end of each sweep. The number of bursts measured and the number of bursts requested are displayed to show the progress through the measurement.
The Min/Mean/Max columns show the minimum, mean or maximum values of the burst
results.
For details on the displayed measurement results see Chapter 3.9, "Measurement
Result Types", on page 44.
54Operating Manual 1176.7649.02 ─ 06
Page 55

R&S® FSV-K91/91n/91ac/91p
WLAN TX Measurements
Measurement Settings and Result Displays
3.10.2.1 Result display for measurements on OFDM signals
Figure 3-13: Result summary list for measurements on OFDM signals
●
EVM All Carr, IEEE802.11a, j, g, p
Shows the EVM (Error Vector Magnitude) over all carriers of the payload symbols
in % and in dB. For better orientation, the table also shows the corresponding limits
specified in the standard.
●
EVM Data Carr, IEEE802.11a, j, g, p
Shows the EVM (Error Vector Magnitude) over all data carriers of the payload symbols in % and in dB. For better orientation, the table also shows the corresponding
limits specified in the standard.
●
EVM Pilot Carr, IEEE802.11a, j, g, p
Shows the EVM (Error Vector Magnitude) over all pilot carriers of the payload symbols in % and in dB. For better orientation, the table also shows the corresponding
limits specified in the standard.
●
IQ Offset, IEEE802.11a, j, g, p
Shows the IQ offset of the signal in dB. This is the transmitter center frequency
leakage relative to overall transmitted power. For better orientation, the table also
shows the corresponding limits specified in the standard.
●
Gain Imbalance, IEEE802.11a, j, g, p
55Operating Manual 1176.7649.02 ─ 06
Page 56

R&S® FSV-K91/91n/91ac/91p
Shows the gain imbalance of the signal in % as well as dB. This is the amplification
of the quadrature phase component of the signal relative to the in-phase component.
●
Quadrature Error, IEEE802.11a, j, g, p
Shows the quadrature error of the signal in degree. This is the deviation of the
quadrature phase angle from the ideal 90°.
●
Frequency Error, IEEE802.11a, j, g, p
Shows the frequency error between the signal and the current center frequency of
the R&S analyzer. The absolute frequency error is the sum of the frequency error
of the R&S analyzer and that of the DUT. If possible, the transmitter and the
receiver should be synchronized.
For better orientation, the table also shows the corresponding limits specified in the
standard.
●
Symbol Clock Error, IEEE802.11a, j, g, p
Shows the clock error between the signal and the sample clock of the R&S analyzer in parts per million (ppm). For better orientation, the table also shows the corresponding limits specified in the standard.
●
Burst Power, IEEE802.11a, j, g, p
Shows the mean burst power in dBm.
●
Crest Factor, IEEE802.11a, j, g, p
Shows the crest factor in dB. The crest factor is the ratio of the peak power to the
mean power of the signal (also called Peak to Average Power Ratio, PAPR).
WLAN TX Measurements
Measurement Settings and Result Displays
56Operating Manual 1176.7649.02 ─ 06
Page 57

R&S® FSV-K91/91n/91ac/91p
WLAN TX Measurements
Measurement Settings and Result Displays
3.10.2.2 Result display for measurements on DSSS / CCK / PBCC signals
Figure 3-14: Result summary list for measurements on DSSS/CCK/PBCC signals
●
Peak Vector Err, IEEE802.11b, g
Shows the peak vector error over the complete burst including the preamble in %
and in dB. The vector error is calculated according to the IEEE 802.11b definition
of the normalized error vector magnitude. For better orientation, the table also
shows the corresponding limits specified in the standard.
●
Burst EVM, IEEE802.11b, g
Shows the EVM (Error Vector Magnitude) over the complete burst including the
preamble in % and dB.
●
IQ Offset
Shows the IQ offset of the signal in dB. This is the IQ offset magnitude relative to
the RMS magnitude at the chip timing.
●
Gain Imbalance
see Chapter 3.10.2.1, "Result display for measurements on OFDM signals",
on page 55
●
Quadrature Error
see Chapter 3.10.2.1, "Result display for measurements on OFDM signals",
on page 55
●
Center Frequency Error
57Operating Manual 1176.7649.02 ─ 06
Page 58

R&S® FSV-K91/91n/91ac/91p
see Chapter 3.10.2.1, "Result display for measurements on OFDM signals",
on page 55
●
Chip Clock Error, IEEE802.11b, g
see Symbol Clock Error in Chapter 3.10.2.1, "Result display for measurements on
OFDM signals", on page 55
●
Rise Time, IEEE802.11b, g
Shows the rise time of the pulsed signal in µs. This is the time period the signal
needs to increase its power level from 10% to 90% of the maximum resp. the average power depending on the reference power setting. For better orientation, the
table also shows the corresponding limits specified in the standard.
●
Fall Time, IEEE802.11b, g
Shows the fall time of the pulsed signal in µs. This is the time period the signal
needs to decrease its power level from 90% to 10% of the maximum resp. the
average power depending on the reference power setting. For better orientation,
the table also shows the corresponding limits specified in the standard.
●
Mean Power, IEEE802.11b, g
Shows the mean burst power in dBm.
●
Peak Power, IEEE802.11b, g
Shows the maximum burst power in dBm.
●
Crest Factor
●
Rise Time, IEEE802.11b, g
Shows the rise time of the pulsed signal in µs. This is the time period the signal
needs to increase its power level from 10% to 90% of the maximum resp. the average power depending on the reference power setting. For better orientation, the
table also shows the corresponding limits specified in the standard.
WLAN TX Measurements
Measurement Settings and Result Displays
All parameters and their calculations are described in detail in chapter 1 of this manual,
'Advanced Measurement Examples'
3.10.2.3 Result Display for MIMO Measurements
For MIMO measurements (IEEE 802.11ac or n (MIMO) only) the results are provided
as an overview of all data streams in the Global Result Summary (List 1), and for the
individual streams in separate result summaries (List 2). To switch between the two
views, use the "Display Graph/List1/List2" softkey. To view more details for the individual summaries, select the table and then press the "Split Screen/Maximize Screen" key
).
(
58Operating Manual 1176.7649.02 ─ 06
Page 59

R&S® FSV-K91/91n/91ac/91p
WLAN TX Measurements
Measurement Settings and Result Displays
Figure 3-15: MIMO Global result summary
Figure 3-16: MIMO result summary: overview of 2 streams
3.10.3 Result Display Graph
Additionally to the selected graphical result display, the Magnitude Capture Buffer display is provided for all I/Q measurements. The individual result displays are described
with the corresponding softkey.
59Operating Manual 1176.7649.02 ─ 06
Page 60

R&S® FSV-K91/91n/91ac/91p
The Magnitude Capture Buffer display shows the complete range of captured data for
the last sweep. All analyzed bursts are identified with a green bar at the bottom of the
Magnitude Capture Buffer display. If, in the "Demod Settings" dialog box, the "Signal
Field Content" option is activated, only bursts that match the required criteria are
marked with a green bar (see "Signal Field Content (IEEE 802.11a, g (OFDM), j & n
(SISO), p)" on page 98).
WLAN TX Measurements
Measurement Settings and Result Displays
Figure 3-17: Magnitude capture buffer results (example)
●
I/Q measurements
All I/Q measurements process the same signal data and as such all I/Q measurement results are available after a single I/Q measurement execution.
I/Q measurements can be run in split screen mode (allowing both the Magnitude
Capture Buffer display and the selected I/Q measurement results to be displayed
simultaneously) or in full screen mode (with either the Magnitude Capture Buffer
display or the selected I/Q measurement results displayed).
●
Frequency sweep measurements
The frequency sweep measurements use different signal data to I/Q measurements and as such it is not possible to run an I/Q measurement and then view the
results in the frequency sweep measurements and vice-versa. Also because each
of the frequency sweep measurements uses different settings to obtain signal data
it is not possible to run a frequency sweep measurement and view the results of
another frequency sweep measurement.
All frequency sweep measurements are run in full screen mode.
60Operating Manual 1176.7649.02 ─ 06
Page 61

R&S® FSV-K91/91n/91ac/91p
●
For MIMO measurements (IEEE 802.11ac or n (MIMO) only) the results for each
data stream are displayed in a separate graph.
WLAN TX Measurements
Measurement Settings and Result Displays
Figure 3-18: MIMO data stream results (example)
3.10.4 Title Bar Information
The title bar displays the following information:
●
wireless LAN standard applicable to the current measurement.
3.10.5 Status Bar Information
●
The status bar displays the same information as the base device (see the "Quick
Start Guide").
61Operating Manual 1176.7649.02 ─ 06
Page 62

R&S® FSV-K91/91n/91ac/91p
4 Instrument Functions WLAN TX Measure-
ments
To open the WLAN menu
●
If the "WLAN" mode is not the active measurement mode, press the MODE key
and select the "WLAN" softkey
To exit the "WLAN" measurement mode, select another option.
Menu and softkey description
●
Chapter 4.1, "Softkeys of the WLAN TX Menu", on page 63
●
Chapter 4.4, "Softkeys of the Sweep Menu – SWEEP key ", on page 110
●
Chapter 4.6, "Softkeys of the Marker Menu – MKR key (WLAN)", on page 112
●
Chapter 4.7, "Softkeys of the Marker To Menu – MKR-> key", on page 112
●
Chapter 4.8, "Softkeys of the Lines Menu – LINES key", on page 113
●
Chapter 4.5, "Softkeys of the Trace Menu – TRAC key", on page 111
●
Chapter 4.9, "Softkeys of the Input/Output Menu for WLAN Measurements",
on page 114
Instrument Functions WLAN TX Measurements
The "Span", "Bandwidth", "Marker Function", and "Auto Set" menus are not available in
the WLAN mode.
The FREQ, AMPT, and TRIG keys open the "General Settings" or the "Demod Settings" dialog box. For details refer to the "Settings General/Demod" on page 64 softkey description ("WLAN" menu).
To display help to a softkey, press the HELP key and then the softkey for which you
want to display help. To close the help window, press the ESC key. For further information refer to Chapter 1.3, "How to Use the Help System", on page 7.
Further information
This chapter provides further information about the measurements and result displays
for the WLAN application.
4.1 Softkeys of the WLAN TX Menu.................................................................................63
4.2 General Settings Dialog Box (K91)............................................................................87
4.2.1 General Settings........................................................................................................... 88
4.2.2 Advanced Settings........................................................................................................ 91
4.2.3 STC/MIMO Settings (IEEE 802.11ac, n (MIMO) only).................................................. 94
4.3 Demod Settings Dialog Box....................................................................................... 97
4.3.1 Demod Settings.............................................................................................................98
4.3.2 Advanced Demod Settings (IEEE 802.11ac, n (MIMO) only)..................................... 104
4.3.3 MIMO Settings (IEEE 802.11ac, n (MIMO) only)........................................................ 109
62Operating Manual 1176.7649.02 ─ 06
Page 63

R&S® FSV-K91/91n/91ac/91p
4.4 Softkeys of the Sweep Menu – SWEEP key ...........................................................110
4.5 Softkeys of the Trace Menu – TRAC key................................................................ 111
4.6 Softkeys of the Marker Menu – MKR key (WLAN)..................................................112
4.7 Softkeys of the Marker To Menu – MKR-> key....................................................... 112
4.8 Softkeys of the Lines Menu – LINES key................................................................ 113
4.9 Softkeys of the Input/Output Menu for WLAN Measurements..............................114
Instrument Functions WLAN TX Measurements
Softkeys of the WLAN TX Menu
4.1 Softkeys of the WLAN TX Menu
The following table shows all softkeys available in the "WLAN" menu. It is possible that
your instrument configuration does not provide all softkeys. If a softkey is only available
with a special option, model or (measurement) mode, this information is delivered in
the corresponding softkey description.
Settings General/Demod...............................................................................................64
Display List/Graph.........................................................................................................64
PVT............................................................................................................................... 64
└ Full Burst.........................................................................................................65
└ Rising & Falling...............................................................................................65
└ Ramp Up/Down/Up & Down (IEEE 802.11b, g – Single Carrier)....................66
└ Ref Pow Max/Mean (IEEE 802.11b, g – Single Carrier).................................67
└ Average Length (IEEE 802.11b, g – Single Carrier).......................................67
└ Gating Settings On/Off ((IEEE 802.11a, b, g, j, p).......................................... 67
└ Import..............................................................................................................68
└ Export..............................................................................................................68
└ R&S Support...................................................................................................69
EVM Constell................................................................................................................ 69
└ Settings General/Demod.................................................................................69
└ Display List/Graph...........................................................................................69
└ EVM vs Symbol/Carrier...................................................................................69
└ Error Frequency/Phase...................................................................................71
└ Constell vs Symbol/Carrier............................................................................. 73
└ Carrier Selection (IEEE 802.11a, ac, g, j, n (OFDM), p).................................75
└ Gating Settings On/Off....................................................................................75
└ Import..............................................................................................................75
└ Export..............................................................................................................75
└ Y-Axis/Div....................................................................................................... 75
└ R&S Support...................................................................................................76
Spectrum.......................................................................................................................76
└ Settings General/Demod.................................................................................76
└ Display List/Graph...........................................................................................76
└ Spectrum Flatness (IEEE 802.11a, ac, g, j, n (OFDM), p / Group Delay (IEEE
802.11 n (MIMO))............................................................................................76
└ Spectrum Mask (IEEE 802.11ac, b, g (Single Carrier)) / Spectrum IEEE/ETSI
(IEEE 802.11a, g, j, n (OFDM), p)...................................................................78
└ Spectrum FFT.................................................................................................79
63Operating Manual 1176.7649.02 ─ 06
Page 64

R&S® FSV-K91/91n/91ac/91p
└ Spectrum ACPR (IEEE 802.11a, ac, g (OFDM Turbo Mode), n, p)/ Spectrum
ACP (IEEE 802.11b)/ ACP Rel/Abs (IEEE 802.11j)........................................80
└ Gating Settings On/Off....................................................................................81
└ SEM Settings.................................................................................................. 81
└ Chan Sel......................................................................................................... 82
└ Import..............................................................................................................82
└ Export..............................................................................................................82
└ R&S Support...................................................................................................82
Statistics........................................................................................................................82
└ Settings General/Demod.................................................................................82
└ Display List/Graph...........................................................................................82
└ CCDF..............................................................................................................83
└ Bitstream.........................................................................................................83
└ Signal Field (IEEE 802.11a, ac, g (OFDM), j , n, p)........................................85
└ Gating Settings On/Off....................................................................................86
└ PLCP Header (IEEE 802.11b, g – Single Carrier).......................................... 86
Instrument Functions WLAN TX Measurements
Softkeys of the WLAN TX Menu
└ SEM according to................................................................................. 81
└ File Name............................................................................................. 81
└ Trace Reduction................................................................................... 82
└ TX Channel...........................................................................................82
└ SEM Configuration................................................................................82
Settings General/Demod
Opens the "General Settings" or the "Demod Settings" dialog box. For details see
Chapter 4.2, "General Settings Dialog Box (K91)", on page 87 or Chapter 4.3,
"Demod Settings Dialog Box", on page 97.
Alternatively, the "General Settings" dialog box is opened as follows:
●
FREQ key, with focus on the "Frequency" field
●
AMPT key, with focus on the "Signal Level" ("RF") field
●
TRIG key, with focus on the "Trigger Mode" field
Display List/Graph
Configures the result display. The measurement results are displayed either in form of
a list of measurement points or as a graphical trace.
For MIMO measurements (IEEE 802.11ac or n (MIMO) only) the results are provided
as an overview of all data streams in the Global Result Summary (List 1), and for the
individual streams in separate result summaries (List 2).
Remote command:
DISPlay[:WINDow<n>]:TABLe on page 165
For result queries see Chapter 5.8, "FETCh Subsystem (WLAN)", on page 168
PVT
Opens the PVT submenu to select the Power vs Time measurement results.
The PVT result displays show the minimum, average and maximum levels measured
over the full range of the measured input data, or over complete PPDUs displayed
within the gating lines if gating is switched on. The results are displayed as a single
PPDU. Using screen B in full screen provides additional power information during this
measurement.
64Operating Manual 1176.7649.02 ─ 06
Page 65

R&S® FSV-K91/91n/91ac/91p
For IEEE 802.11b and g (single carrier), the PVT results are displayed as percentage
values of the reference power. The reference can be set to either the max or mean
power of the PPDU. For both rising and falling edges two time lines are displayed,
which mark the points 10 % and 90 % of the reference power. The time between these
two points is compared against the limits specified for the rising and falling edges.
For further details see also Chapter 3.9.3, "Rise/Fall Time Measurement", on page 50
Remote command:
CONFigure:BURSt:PVT[:IMMediate] on page 148
Full Burst ← PVT
Displays the PVT results in a single graph with all PPDU data being displayed.
Instrument Functions WLAN TX Measurements
Softkeys of the WLAN TX Menu
For further details refer to the "PVT" on page 64 softkey.
Remote command:
CONFigure:BURSt:PVT:SELect on page 149
Rising & Falling ← PVT
Displays the PVT results in two separate graphs, the left hand side showing the rising
edge and the right hand side showing the falling edge.
65Operating Manual 1176.7649.02 ─ 06
Page 66

R&S® FSV-K91/91n/91ac/91p
Instrument Functions WLAN TX Measurements
Softkeys of the WLAN TX Menu
Remote command:
CONFigure:BURSt:PVT:SELect on page 149
Ramp Up/Down/Up & Down (IEEE 802.11b, g – Single Carrier) ← PVT
Sets the display of the rising/falling edge graph:
Up Displays the rising edge graph.
Down Displays the falling edge graph.
Up & Down Displays the rising and falling edge graph.
66Operating Manual 1176.7649.02 ─ 06
Page 67

R&S® FSV-K91/91n/91ac/91p
Instrument Functions WLAN TX Measurements
Softkeys of the WLAN TX Menu
For further details refer to the "PVT" on page 64 softkey.
Remote command:
CONFigure:BURSt:PVT:SELect on page 149
Ref Pow Max/Mean (IEEE 802.11b, g – Single Carrier) ← PVT
Sets the reference for the rise and fall time calculation to the maximum or mean PPDU
power.
For further details refer to the "PVT" on page 64 softkey.
Remote command:
CONFigure:BURSt:PVT:RPOWer on page 149
Average Length (IEEE 802.11b, g – Single Carrier) ← PVT
Opens an edit dialog box to enter the number of samples in order to adjust the length
of the smoothing filter.
For further details refer to the "PVT" on page 64 softkey.
Remote command:
CONFigure:BURSt:PVT:AVERage on page 149
Gating Settings On/Off ((IEEE 802.11a, b, g, j, p) ← PVT
Activates or deactivates gating, and opens the "Gate Settings" dialog box to specify
range of captured data used in results calculation.
67Operating Manual 1176.7649.02 ─ 06
Page 68

R&S® FSV-K91/91n/91ac/91p
On Uses only the specified range of captured data in results calculation. In the Magnitude Capture
Buffer trace, two vertical lines mark the specified range.
Off Uses all the captured data in results calculation.
In the "Gate Settings" dialog box, the following parameters are set:
Delay Start point of captured data to be used in results calculation, i.e. the delay from the start of
Length Amount of captured data to be used in results calculation. If the length is specified in time,
Mode Sets the type of triggering (level or edge) by the external gate signal.
Instrument Functions WLAN TX Measurements
Softkeys of the WLAN TX Menu
the captured data in time or samples. If the delay is specified in time, the number of samples is updated accordingly, and vice versa.
the number of samples is updated accordingly, and vice versa.
Link Gate and
Mark
If activated, the position of the marker and the gate lines are linked. The marker is positioned half way between gate start and end. The marker position alters when the gate is
modified, and the gate lines move with the marker when the marker position is altered.
The gate settings are defined for following measurements: PVT, Spectrum FFT, CCDF,
Spectrum Mask, Spectrum ACPR.
If a frequency sweep measurement is active (Spectrum Mask and Spectrum ACP) the
result display is switched to the Magnitude Capture Buffer display in order to allow the
gate to be set the correct part of the sweep.
Remote command:
SWE:EGAT ON
SWE:EGAT:HOLD 125us, SWE:EGAT:HOLD:SAMP 2500 (Delay)
SWE:EGAT:LENG 20ms, SWE:EGAT:LENG:SAMP 200000 (Length)
SWE:EGAT:TYPE EDGE (Mode)
SWE:EGAT:LINK ON (Link Gate and Mark), see [SENSe:]SWEep:EGATe:LINK
on page 203
Import ← PVT
Opens the "Choose the file to import" dialog box.
Select the IQ data file you want to import and press ENTER. The extension of data
files is *.iqw.
This function is not available while a measurement is running.
Remote command:
MMEMory:LOAD:IQ:STATe on page 181
Export ← PVT
Opens the "Choose the file to export" dialog box.
Enter the path and the name of the I/Q data file you want to export and press ENTER.
The extension of data files is *.iqw. If the file cannot be created or if there is no valid
I/Q data to export an error message is displayed.
This function is not available while a measurement is running.
Remote command:
MMEMory:STORe:IQ:STATe on page 181
68Operating Manual 1176.7649.02 ─ 06
Page 69

R&S® FSV-K91/91n/91ac/91p
R&S Support ← PVT
Stores useful information for troubleshooting in case of errors.
This data is stored in the C:\R_S\Instr\user\Support directory on the instru-
ment.
If you contact the Rohde&Schwarz support to get help for a certain problem, send
these files to the support in order to identify and solve the problem faster.
EVM Constell
Opens a submenu to select the error vector magnitude (EVM) or the constellation
result displays.
Settings General/Demod ← EVM Constell
See "Settings General/Demod" on page 64
Display List/Graph ← EVM Constell
See "Display List/Graph" on page 64
EVM vs Symbol/Carrier ← EVM Constell
Selects the EVM vs Symbol or EVM vs Carrier result displays.
●
EVM vs Symbol
This result display shows the EVM measured over the full range of the measured
input data. The results are displayed on a per-symbol basis, with blue vertical lines
marking the boundaries of each PPDU. Note that PPDU boundary lines are only
displayed if the number of analyzed PPDUs is less than 250.
For IEEE 802.11a, j, g (OFDM) n & p the minimum, average, and maximum traces
are displayed.
For IEEE 802.11b, g (Single Carrier) two EVM traces are displayed. The trace
labeled with VEC ERR IEEE shows the error vector magnitude as defined in the
IEEE 802.11b, g standards. For the trace labeled with EVM a commonly used EVM
definition is applied, which is the square root of the momentary error power normalized by the averaged reference power.
Instrument Functions WLAN TX Measurements
Softkeys of the WLAN TX Menu
69Operating Manual 1176.7649.02 ─ 06
Page 70

R&S® FSV-K91/91n/91ac/91p
Instrument Functions WLAN TX Measurements
Softkeys of the WLAN TX Menu
●
EVM vs Carrier (IEEE 802.11a, g, j – OFDM),n & p
This result display shows all EVM values recorded on a per-carrier basis over the
full set of measured data. An average trace is also displayed.
70Operating Manual 1176.7649.02 ─ 06
Page 71

R&S® FSV-K91/91n/91ac/91p
Instrument Functions WLAN TX Measurements
Softkeys of the WLAN TX Menu
Remote command:
CONFigure:BURSt:EVM:ESYMbol[:IMMediate] on page 148
CONFigure:BURSt:EVM:ECARrier[:IMMediate] on page 147
Error Frequency/Phase ← EVM Constell
Selects the Rel. Frequency Error vs Preamble or the Phase Error vs Preamble result
displays.
These result displays show the error values recorded over the preamble part of the
PPDU. A minimum, average and maximum trace are displayed. The results display
either relative frequency error or phase error.
71Operating Manual 1176.7649.02 ─ 06
Page 72

R&S® FSV-K91/91n/91ac/91p
Instrument Functions WLAN TX Measurements
Softkeys of the WLAN TX Menu
72Operating Manual 1176.7649.02 ─ 06
Page 73

R&S® FSV-K91/91n/91ac/91p
Instrument Functions WLAN TX Measurements
Softkeys of the WLAN TX Menu
Remote command:
CONFigure:BURSt:PREamble[:IMMediate] on page 148
CONFigure:BURSt:PREamble:SELect on page 148
CONFigure:BURSt:PREamble:SELect on page 148
Constell vs Symbol/Carrier ← EVM Constell
Selects the Constallation vs Symbol or the Constellation vs Carrier result displays.
●
Constellation vs Symbol (all standards)
This result display shows the in-phase and quadrature phase results over the full
range of the measured input data. The ideal points for the selected modulations
scheme are displayed for reference purposes.
The amount of data displayed in the Constellation result display can be reduced by
selecting the carrier or carriers for which data is to be displayed ("Carrier Selection
(IEEE 802.11a, ac, g, j, n (OFDM), p)" on page 75 softkey).
73Operating Manual 1176.7649.02 ─ 06
Page 74

R&S® FSV-K91/91n/91ac/91p
Instrument Functions WLAN TX Measurements
Softkeys of the WLAN TX Menu
●
Constellation vs Carrier (IEEE 802.11a, g, j – OFDM),n & p
This result display shows the in-phase and quadrature phase results over the full
range of the measured input data plotted on a per-carrier basis. The magnitude of
the in-phase and quadrature part is shown on the y-axis, both are displayed as
separate traces (I-> trace 1, Q-> trace 2).
74Operating Manual 1176.7649.02 ─ 06
Page 75

R&S® FSV-K91/91n/91ac/91p
Instrument Functions WLAN TX Measurements
Softkeys of the WLAN TX Menu
Remote command:
CONFigure:BURSt:CONStellation:CSYMbol[:IMMediate] on page 147
CONFigure:BURSt:CONStellation:CCARrier[:IMMediate] on page 147
Carrier Selection (IEEE 802.11a, ac, g, j, n (OFDM), p) ← EVM Constell
Opens a dialog box to select the carrier for data display. Either a specific carrier number, pilots only or all carriers can be selected.
Remote command:
CONFigure:BURSt:CONStellation:CARRier:SELect on page 146
Gating Settings On/Off ← EVM Constell
See "Gating Settings On/Off ((IEEE 802.11a, b, g, j, p)" on page 67.
Import ← EVM Constell
See "Import" on page 68.
Export ← EVM Constell
See "Export" on page 68.
Y-Axis/Div ← EVM Constell
Opens a dialog box to modify the y-axis settings:
75Operating Manual 1176.7649.02 ─ 06
Page 76

R&S® FSV-K91/91n/91ac/91p
Auto Scaling If activated, the scaling of the y-axis is calculated automatically.
Per Division Specifies the scaling to be used if Auto Scaling is deactivated.
Unit Specifies the y-axis unit. With the unit is dB, Auto Scaling is always activated.
Remote command:
DISPlay[:WINDow<n>]:TRACe<t>:Y[:SCALe]:AUTO on page 165
DISPlay[:WINDow<n>]:TRACe<t>:Y[:SCALe]:PDIVision on page 166
R&S Support ← EVM Constell
See "R&S Support" on page 69.
Spectrum
Opens a submenu for frequency measurements.
Settings General/Demod ← Spectrum
See "Settings General/Demod" on page 64
Instrument Functions WLAN TX Measurements
Softkeys of the WLAN TX Menu
Display List/Graph ← Spectrum
See "Display List/Graph" on page 64
Spectrum Flatness (IEEE 802.11a, ac, g, j, n (OFDM), p / Group Delay (IEEE
802.11 n (MIMO)) ← Spectrum
Sets the Spectrum Flatness result display.
This result display shows the spectrum flatness and group delay values recorded on a
per-carrier basis over the full set of measured data. An average trace is also displayed
for each of the result types. An upper and lower limit line representing the limits specified for the selected standard are displayed and an overall pass/fail status is displayed
for the obtained (average) results against these limit lines.
76Operating Manual 1176.7649.02 ─ 06
Page 77

R&S® FSV-K91/91n/91ac/91p
Instrument Functions WLAN TX Measurements
Softkeys of the WLAN TX Menu
Figure 4-1: Spectrum flatness result for IEEE 802.11a standard measurement
For IEEE 802.11ac or n (MIMO) you can select between the physical and effective
channel model for the spectrum flatness and group delay measurement (see "Chan
Sel" on page 82).
77Operating Manual 1176.7649.02 ─ 06
Page 78

R&S® FSV-K91/91n/91ac/91p
Instrument Functions WLAN TX Measurements
Softkeys of the WLAN TX Menu
Figure 4-2: Spectrum flatness result for IEEE 802.11n (MIMO) with 2 streams
Remote command:
CONFigure:BURSt:SPECtrum:FLATness[:IMMediate] on page 150
IEEE 802.11n (MIMO): CONFigure:BURSt:SPECtrum:FLATness:SELect
on page 151
Spectrum Mask (IEEE 802.11ac, b, g (Single Carrier)) / Spectrum IEEE/ETSI (IEEE
802.11a, g, j, n (OFDM), p) ← Spectrum
Sets the Spectrum Mask result display.
This result display shows power against frequency. The span of the results is 100 MHz
for IEEE and 500 MHz for ETSI around the specified measurement frequency. A limit
line representing the spectrum mask specified for the selected standard is displayed
and an overall pass/fail status is displayed for the obtained results against this limit
line.
The number of sweeps is set in the General Settings dialog box, Sweep Count field. If
the measurement is performed over multiple sweeps both a max hold trace and an
average trace are displayed.
78Operating Manual 1176.7649.02 ─ 06
Page 79

R&S® FSV-K91/91n/91ac/91p
Instrument Functions WLAN TX Measurements
Softkeys of the WLAN TX Menu
Remote command:
CONFigure:BURSt:SPECtrum:MASK[:IMMediate] on page 151
CONFigure:BURSt:SPECtrum:MASK:SELect on page 152
Spectrum FFT ← Spectrum
Sets the Spectrum FFT result display.
This result display shows the Power vs Frequency results obtained from a FFT per-
formed over the range of data in the Magnitude Capture Buffer which lies within the
gate lines.
79Operating Manual 1176.7649.02 ─ 06
Page 80

R&S® FSV-K91/91n/91ac/91p
Instrument Functions WLAN TX Measurements
Softkeys of the WLAN TX Menu
Remote command:
CONFigure:BURSt:SPECtrum:FFT[:IMMediate] on page 150
Spectrum ACPR (IEEE 802.11a, ac, g (OFDM Turbo Mode), n, p)/ Spectrum ACP
(IEEE 802.11b)/ ACP Rel/Abs (IEEE 802.11j) ← Spectrum
Sets the ACP (Adjacent Channel Power) result display.
This result display is similar to the Spectrum Mask measurement, and provides infor-
mation about leakage into adjacent channels. The results show the absolute or relative
power measured in the three nearest channels either side of the measured channel.
This measurement is the same as the adjacent channel power measurement provided
by the signal analyzer.
The number of sweeps is set in the General Settings dialog box, Sweep Count field. If
the measurement is performed over multiple sweeps both a max hold trace and an
average trace are displayed.
80Operating Manual 1176.7649.02 ─ 06
Page 81

R&S® FSV-K91/91n/91ac/91p
Instrument Functions WLAN TX Measurements
Softkeys of the WLAN TX Menu
Remote command:
CONFigure:BURSt:SPECtrum:ACPR[:IMMediate] on page 150
CALCulate<n>:MARKer<1>:FUNCtion:POWer:RESult[:CURRent]?
on page 144
CALCulate<n>:MARKer<1>:FUNCtion:POWer:RESult:MAXHold? on page 144
Gating Settings On/Off ← Spectrum
See "Gating Settings On/Off ((IEEE 802.11a, b, g, j, p)" on page 67.
SEM Settings ← Spectrum
Displays the "SEM Settings" dialog box that contains the following editable settings:
SEM according to ← SEM Settings ← Spectrum
Specifies how the Spectrum Emission Mask settings and limits are applied. The following standards are supported:
"ETSI"
"IEEE"
"User"
Remote command:
[SENSe:]POWer:SEM on page 199
Settings and limits are as specified in the standard
Settings and limits are as specified in the IEEE Std 802.11n™-2009
Figure 20-17—Transmit spectral mask for 20 MHz transmission. For
other IEEE standards see Table 5-1 in the remote command description.
Settings and limits are configured via an XML file
File Name ← SEM Settings ← Spectrum
When "SEM according to":"User" settings are specified, "File Name" shows the name
of the loaded XML file. Clicking the arrow switches to the File Manager to locate an
XML file, and automatically selects "SEM according to":"User".
When using "ETSI" or "IEEE" standards, "File Name" indicates the name of the built-in
configuration.
81Operating Manual 1176.7649.02 ─ 06
Page 82

R&S® FSV-K91/91n/91ac/91p
Remote command:
MMEMory:LOAD:SEM:STATe 1, on page 181
Trace Reduction ← SEM Settings ← Spectrum
During the Spectrum Emission Mask (SEM) measurement data is acquired and trace
data is selected according to the trace detector setting from the SEM xml definition file
for each frequency range. Alternatively, the peak detector can be used regardless of
the setting in the SEM definition file.
"Peak"
Instrument Functions WLAN TX Measurements
Softkeys of the WLAN TX Menu
For each frequency range, the peak detector is used to determine the
corresponding trace value. This was the behaviour for the SEM measurement in R&S FSV-K91 versions before 1.70.
"Trace detector"
Remote command:
[SENSe:]POWer:SEM:TRACe:REDuction on page 201
TX Channel ← SEM Settings ← Spectrum
The bandwidth and RBW of the transmission channel are displayed for reference only.
SEM Configuration ← SEM Settings ← Spectrum
The table shows the settings and limits applied over specified frequency ranges around
the TX channel.
Chan Sel ← Spectrum
Selects the channel model for the Spectrum Flatness measurement.
"Effective"
"Physical"
Remote command:
CONFigure:BURSt:SPECtrum:FLATness:CSELect on page 151
Import ← Spectrum
See "Import" on page 68.
For each frequency range, the trace detector defined in the SEM xml
file is used to determine the corresponding trace value.
The composition of the physical channel and the MIMO encoder.
Physical channel
Export ← Spectrum
See "Export" on page 68.
R&S Support ← Spectrum
See "R&S Support" on page 69.
Statistics
Opens a submenu to display statistics measurement results.
Settings General/Demod ← Statistics
See "Settings General/Demod" on page 64
Display List/Graph ← Statistics
See "Display List/Graph" on page 64
82Operating Manual 1176.7649.02 ─ 06
Page 83

R&S® FSV-K91/91n/91ac/91p
CCDF ← Statistics
Sets the CCDF result display.
This result display shows the probability of an amplitude within the gating lines exceed-
ing the mean power measured between the gating lines. The x-axis displays power relative to the measured mean power.
Instrument Functions WLAN TX Measurements
Softkeys of the WLAN TX Menu
Remote command:
CONFigure:BURSt:STATistics:CCDF[:IMMediate] on page 152
Bitstream ← Statistics
Sets the Bitstream result display. This result display shows the demodulated data
stream.
●
IEEE 802.11a, j, g (OFDM), n, p:
The results are grouped by symbol and carrier.
83Operating Manual 1176.7649.02 ─ 06
Page 84

R&S® FSV-K91/91n/91ac/91p
Instrument Functions WLAN TX Measurements
Softkeys of the WLAN TX Menu
●
IEEE 802.11b or g (Single Carrier)
The results are grouped by PPDU.
84Operating Manual 1176.7649.02 ─ 06
Page 85

R&S® FSV-K91/91n/91ac/91p
Instrument Functions WLAN TX Measurements
Softkeys of the WLAN TX Menu
Remote command:
CONFigure:BURSt:STATistics:BSTReam[:IMMediate] on page 152
Signal Field (IEEE 802.11a, ac, g (OFDM), j , n, p) ← Statistics
Sets the "Signal Field" result display.
This result display shows the decoded data from the signal field of the PPDU. There-
fore it is only available if, in the "Demod Settings" dialog box, the "Signal Field Content"
option is activated.
For the IEEE 802.11ac, n standards an enhanced Signal Field measurement is available, see Chapter 3.7, "Signal Field Measurement (IEEE 802.11ac, n (SISO+MIMO))",
on page 39.
85Operating Manual 1176.7649.02 ─ 06
Page 86

R&S® FSV-K91/91n/91ac/91p
Instrument Functions WLAN TX Measurements
Softkeys of the WLAN TX Menu
Remote command:
CONFigure:BURSt:STATistics:SFIeld[:IMMediate] on page 152
Gating Settings On/Off ← Statistics
See "Gating Settings On/Off ((IEEE 802.11a, b, g, j, p)" on page 67.
PLCP Header (IEEE 802.11b, g – Single Carrier) ← Statistics
This result display shows the decoded data from the PLCP header of the PPDU. The
following details are listed:
Column header Description Example
PPDU number of the decoded PPDU
A colored block indicates that the PPDU was successfully decoded.
Signal signal field
The decoded data rate is shown below.
Service service field
The currently used bits are highlighted. The text below explains
the decoded meaning of these bits.
Burst 1
00010100
2 MBits/s
00000000
--/--/--
86Operating Manual 1176.7649.02 ─ 06
Page 87

R&S® FSV-K91/91n/91ac/91p
Instrument Functions WLAN TX Measurements
General Settings Dialog Box (K91)
PSDU Length length field
The decoded time to transmit the PSDU is shown below.
CRC CRC field
The result is displayed below (OK for passed or Failed).
000000000111100
0
120 µs
111010011100111
0
OK
Remote command:
CONFigure:BURSt:STATistics:SFIeld[:IMMediate] on page 152
4.2 General Settings Dialog Box (K91)
In the General Settings dialog box, all settings related to the overall measurement can
be modified.
The "STC/MIMO" settings are only available if the IEEE 802.11ac or n (MIMO) standard is selected.
● General Settings..................................................................................................... 88
● Advanced Settings.................................................................................................. 91
● STC/MIMO Settings (IEEE 802.11ac, n (MIMO) only)............................................94
87Operating Manual 1176.7649.02 ─ 06
Page 88

R&S® FSV-K91/91n/91ac/91p
Instrument Functions WLAN TX Measurements
General Settings Dialog Box (K91)
4.2.1 General Settings
Standard .......................................................................................................................88
Frequency .................................................................................................................... 88
Channel No .................................................................................................................. 88
Signal Level / Reference Level..................................................................................... 88
└ Auto.................................................................................................................89
Ext Att ...........................................................................................................................89
Capture Time ............................................................................................................... 89
PPDU Count .................................................................................................................89
Analyze PPDUs ............................................................................................................89
Sweep Count ................................................................................................................89
Trigger Mode ................................................................................................................90
Trigger Offset ............................................................................................................... 90
Trigger Holdoff.............................................................................................................. 90
Trigger Hysteresis.........................................................................................................91
Ext. Trigger Lvl..............................................................................................................91
Power Level ................................................................................................................. 91
└ Auto.................................................................................................................91
Input.............................................................................................................................. 91
Standard
Displays a list of all installed standards to select the wireless LAN standard. This is
necessary to ensure that the measurements are performed according to the specified
standard with the correct limit values and limit lines.
Remote command:
CONFigure:STANdard on page 154
Frequency
Specifies the center frequency of the signal to be measured. If the frequency is modified, the "Channel No" field is updated accordingly.
Remote command:
[SENSe:]FREQuency:CENTer on page 198
Channel No
Specifies the channel to be measured. If the "Channel No" field is modified, the frequency is updated accordingly.
Remote command:
CONFigure:CHANnel on page 153
Signal Level / Reference Level
Specifies the expected mean level of the RF input signal. If an automatic level detection measurement has been executed (see Auto), the signal level (RF) is updated.
For all standards other than IEEE 802.11b & g (Single Carrier), the reference level is
set 10 dB higher than the signal level (RF) because of the expected crest factor of the
signal. For standards IEEE 802.11b & g (Single Carrier), the reference level is set to
the signal level (RF).
88Operating Manual 1176.7649.02 ─ 06
Page 89

R&S® FSV-K91/91n/91ac/91p
Remote command:
CONFigure:POWer:EXPected:RF on page 154
Auto ← Signal Level / Reference Level
Activates or deactivates the automatic setting of the reference level for measurements.
"ON"
"OFF"
Remote command:
CONFigure:POWer:AUTO on page 153
CONFigure:POWer:AUTO:SWEep:TIME on page 153
Ext Att
Specifies the external attenuation or gain applied to the RF signal. A positive value
indicates attenuation, a negative value indicates gain. All displayed power level values
are shifted by this value.
Remote command:
INPut:ATTenuation on page 177
Instrument Functions WLAN TX Measurements
General Settings Dialog Box (K91)
The reference level is measured automatically at the start of each
measurement sweep. This ensures that the reference level is always
set at the optimal level for obtaining accurate results but will result in
slightly increased measurement times.
The reference level is defined manually in the "Signal Level / Refer-
ence Level" on page 88 field.
Capture Time
Specifies the time (and therefore the amount of data) to be captured in a single measurement sweep.
Remote command:
[SENSe:]SWEep:TIME on page 204
PPDU Count
Activates or deactivates a specified number of PPDUs for capture and analysis.
On The data analysis is performed over a number of consecutive sweeps until the required number of
PPDUs has been captured and analyzed.
Off The data analysis is performed on a single measurement sweep.
Remote command:
[SENSe:]BURSt:COUNt:STATe on page 186
Analyze PPDUs
Specifies the number of PPDUs to be measured, if the "PPDU Count" option is activated.
Remote command:
[SENSe:]BURSt:COUNt on page 186
Sweep Count
Specifies the number of sweeps to be performed for Spectrum ACP/ACPR and Spectrum Mask measurements.
89Operating Manual 1176.7649.02 ─ 06
Page 90

R&S® FSV-K91/91n/91ac/91p
Remote command:
[SENSe:]SWEep:COUNt on page 201
Trigger Mode
Sets the source of the trigger for the data capture process of the measurement.
"Free Run"
"External"
"IF Power"
"RF Power"
"Power Sensor"
Instrument Functions WLAN TX Measurements
General Settings Dialog Box (K91)
The measurement sweep starts immediately.
The measurement sweep starts if the external trigger signal meets or
exceeds the external trigger level (a fixed value that cannot be
altered) at the input connector EXT TRIGGER/GATE IN on the rear
panel.
The measurement sweep starts when the signal power meets or
exceeds the specified power trigger level. This trigger mode is not
available for Spectrum Mask measurements in ETSI standard. If it is
set and then the Spectrum Mask measurement in ETSI standard is
selected, it automatically changes to "Free Run".
The next measurement is triggered by the first intermediate frequency
of the RF signal.
The next measurement is triggered by the external power sensor
(requires R&S FSV-K9 option).
"External Using FS-Z11"
If activated, the next measurement is triggered by the signal at the
external trigger input connected to the R&S®FS-Z11 trigger unit. This
allows for data to be captured from all connected analyzers synchronously for MIMO measurements.
For details see Chapter 3.6.1, "Trigger Synchronization Using an
R&S®FS-Z11 Trigger Unit", on page 37.
Remote command:
TRIGger[:SEQuence]:MODE on page 219
Trigger Offset
Specifies the time offset between the trigger signal and the start of the sweep. A negative value indicates a pre-trigger. This field is not available in the "Free Run" trigger
mode.
Remote command:
TRIGger[:SEQuence]:HOLDoff on page 218
Trigger Holdoff
Defines the value for the trigger holdoff. The holdoff value in s is the time which must
pass before triggering, in case another trigger event happens.
This softkey is only available if "IFPower", "RF Power" or "BBPower" is the selected
trigger source.
Remote command:
TRIGger<n>[:SEQuence]:IFPower:HOLDoff on page 218
90Operating Manual 1176.7649.02 ─ 06
Page 91

R&S® FSV-K91/91n/91ac/91p
Trigger Hysteresis
Defines the value for the trigger hysteresis for "IF power" or "RF Power" trigger sources. The hysteresis in dB is the value the input signal must stay below the power trigger level in order to allow a trigger to start the measurement. The range of the value is
between 3 dB and 50 dB with a step width of 1 dB.
Remote command:
TRIGger<n>[:SEQuence]:IFPower:HYSTeresis on page 219
Ext. Trigger Lvl
Specifies the external trigger level if trigger mode "External" is used.
Remote command:
TRIGger<n>[:SEQuence]:LEVel[:EXTernal] on page 219
Power Level
Specifies the trigger level if one of the "Power" trigger modes is set.
Remote command:
TRIGger[:SEQuence]:LEVel:POWer on page 220
Instrument Functions WLAN TX Measurements
General Settings Dialog Box (K91)
Auto ← Power Level
Activates or deactivates the automatic measurement of the IF power trigger level.
"ON"
The power trigger level is measured automatically at the start of each
measurement sweep. This ensures that the power trigger level is
always set at the optimal level for obtaining accurate results but will
result in a slightly increased measurement times.
"OFF"
The power trigger level is defined manually in the "Power Level "
on page 91 field.
Remote command:
TRIGger[:SEQuence]:LEVel:POWer:AUTO on page 221
Input
The following signal sources are supported:
●
RF Input
●
Baseband Digital (only with Digital Baseband Interface, R&S FSV-B17)
Remote command:
INPut:SELect on page 180
4.2.2 Advanced Settings
Swap IQ ....................................................................................................................... 92
Input Sample Rate........................................................................................................ 92
Full Scale Level.............................................................................................................92
Auto Level Time ........................................................................................................... 92
Ref Level ......................................................................................................................92
Attenuation ...................................................................................................................92
Preamp On/Off..............................................................................................................93
91Operating Manual 1176.7649.02 ─ 06
Page 92

R&S® FSV-K91/91n/91ac/91p
160MHz IF-Atten...........................................................................................................93
Sample Rate ................................................................................................................ 93
Meas Range (IEEE 802.11b, g).................................................................................... 94
Swap IQ
Activates or deactivates the inverted I/Q modulation.
On I and Q signals are interchanged.
Off Normal I/Q modulation.
Remote command:
[SENSe:]SWAPiq on page 201
Input Sample Rate
Defines the sample rate of the digital I/Q signal source. This sample rate must correspond with the sample rate provided by the connected device, e.g. a generator.
Remote command:
INPut:DIQ:SRATe on page 179
Instrument Functions WLAN TX Measurements
General Settings Dialog Box (K91)
Full Scale Level
The "Full Scale Level" defines the level that should correspond to an I/Q sample with
the magnitude "1".
The level is defined in Volts.
Remote command:
INPut:DIQ:RANGe[:UPPer] on page 178
Auto Level Time
Specifies the sweep time used for the automatic level measurements (see "Auto"
on page 89).
Remote command:
CONFigure:POWer:AUTO:SWEep:TIME on page 153
Ref Level
Specifies the reference level to use for measurements. If the reference level is modified, the signal level is updated accordingly (depending on the currently selected standard and measurement type). This field is only editable if the Auto is deactivated.
Remote command:
DISPlay[:WINDow<n>]:TRACe<t>:Y[:SCALe]:RLEVel? on page 166
Attenuation
Specifies the settings for the attenuator. This field is only editable if the Auto option is
deactivated. If the Auto option is activated, the RF attenuator setting is coupled to the
reference level setting.
Remote command:
INPut:ATTenuation on page 177
92Operating Manual 1176.7649.02 ─ 06
Page 93

R&S® FSV-K91/91n/91ac/91p
Preamp On/Off
Switches the preamplifier on and off. If enabled, a nominal gain of 15 dB is applied.
If option R&S FSV-B22 is installed, the preamplifier is only active below 7 GHz.
If option R&S FSV-B24 is installed, the preamplifier is active for all frequencies.
This function is only available for R&S FSVA/FSV instruments using the IEEE 802.11
ac standard.
This function is not available if any of the following conditions apply:
●
Input from the R&S Digital I/Q Interface (option R&S FSV-B17).
●
The "Channel Bandwidth to measure" is set to one of the following settings (see
"Channel Bandwidth to measure" on page 105):
– "Meas only 20 MHz Signal"
– "Meas only 40 MHz Signal"
– "Demod all as 20 MHz Signal"
– "Demod all as 40 MHz Signal"
Note: Regardless of the state of this setting, the Signal Level / Reference Level > Auto
function uses the preamplifier, if installed.
Remote command:
INPut:GAIN:STATe on page 179
Instrument Functions WLAN TX Measurements
General Settings Dialog Box (K91)
160MHz IF-Atten
Defines an additional attenuation to be used during an auto level measurement in
order to optimize the signal level at the A/D converter (see also Chapter 3.8, "Opti-
mized Signal Levels", on page 43).
This function is only available for R&S FSVA/FSV instruments with a R&S FSVA/FSVB160 bandwidth extension option installed, using the IEEE 802.11 ac standard.
This function is not available if any of the following conditions apply:
●
Input from the R&S Digital I/Q Interface (option R&S FSV-B17).
●
The "Channel Bandwidth to measure" is set to one of the following settings (see
"Channel Bandwidth to measure" on page 105):
– "Meas only 20 MHz Signal"
– "Meas only 40 MHz Signal"
– "Demod all as 20 MHz Signal"
– "Demod all as 40 MHz Signal"
Remote command:
INPut:ATTenuation:IFWideband on page 178
Sample Rate
Specifies the sample rate used for IQ measurements.
For IEEE 802.11a, p: the Input Sample Rate can be chosen continuously.
For IEEE 802.11n: 20 MHz, 40 MHz, 80 MHz*
For IEEE 802.11ac. 20 MHz, 40 MHz, 80 MHz*, 160 MHz*
*) requires bandwidth extension option
Remote command:
TRACe:IQ:SRATe on page 211
93Operating Manual 1176.7649.02 ─ 06
Page 94

R&S® FSV-K91/91n/91ac/91p
Meas Range (IEEE 802.11b, g)
Defines the measurement range for the peak vector error.
"All Symbols"
"PSDU only"
Remote command:
CONFigure:WLAN:PVERror:MRANge on page 161
Instrument Functions WLAN TX Measurements
General Settings Dialog Box (K91)
Peak Error Vector results are calculated over the complete PPDU
Peak Error Vector results are calculated over the PSDU only
4.2.3 STC/MIMO Settings (IEEE 802.11ac, n (MIMO) only)
DUT MIMO configuration.............................................................................................. 94
Signal Capture.............................................................................................................. 94
Simultaneous Signal Capture Setup............................................................................. 95
└ State................................................................................................................95
└ Analyzer IP Address....................................................................................... 95
└ Assignment..................................................................................................... 95
└ Joined RX Sync and Tracking.........................................................................95
Sequential Using OSP Switch Setup............................................................................ 95
└ OSP IP Address..............................................................................................96
└ OSP Switch Module........................................................................................97
Manual Sequential MIMO Data Capture....................................................................... 97
└ Capture........................................................................................................... 97
└ Analyze........................................................................................................... 97
└ Clear............................................................................................................... 97
DUT MIMO configuration
Defines the number of Tx antennas of the device under test (DUT). Currently up to 4
Tx antennas are supported.
Remote command:
CONFigure:WLAN:DUTConfig on page 156
Signal Capture
Defines the MIMO method used by the analyzer(s) to capture data from multiple TX
antennas sent by one device under test (DUT).
All modes support RF and Analog Baseband signal input.
"Simultaneous"
Simultaneous normal MIMO operation
The number of Tx antennas set in DUT MIMO configuration defines
the number of analyzers required for this measurement setup.
"Sequential
using OSP
switch"
Sequential using open switch platform
A single analyzer and the Rohde & Schwarz OSP Switch Platform
(with at least one fitted R&S®OSP-B101 option) is required to measure the number of DUT Tx Antennas as defined in DUT MIMO con-
figuration.
"Sequential
manual"
Sequential using manual operation
A single analyzer is required to measure the number of DUT Tx
Antennas as defined in DUT MIMO configuration. Data capturing is
performed manually via the analyzer's user interface.
94Operating Manual 1176.7649.02 ─ 06
Page 95

R&S® FSV-K91/91n/91ac/91p
Remote command:
CONFigure:WLAN:MIMo[:CAPTure]:TYPe on page 159
Simultaneous Signal Capture Setup
For each RX antenna from which data is to be captured simultaneously, the settings
are configured here.
State ← Simultaneous Signal Capture Setup
Switches the corresponding slave analyzer On or Off. In On state the slave analyzer
captures data. This data is transferred via LAN to the master for analysis of the MIMO
system.
Remote command:
CONFigure:WLAN:ANTMatrix:STATe<RecPath> on page 156
Analyzer IP Address ← Simultaneous Signal Capture Setup
Defines the IP addresses of the slaves connected via LAN to the master.
Remote command:
CONFigure:WLAN:ANTMatrix:ADDRess<RecPath> on page 155
Instrument Functions WLAN TX Measurements
General Settings Dialog Box (K91)
Assignment ← Simultaneous Signal Capture Setup
Assignment of the expected antenna to an analyzer. For a wired connection the
assignment of the Tx antenna connected to the analyzer is a possibility. For a wired
connection and Direct Spatial Mapping the Spectrum Flatness traces in the diagonal
contain the useul information, in case the signal transmitted from the antennas
matches with the expected antennas. Otherwise the secondary diagonal will contain
the useful traces.
Remote command:
CONFigure:WLAN:ANTMatrix:ANTenna<RecPath> on page 155
Joined RX Sync and Tracking ← Simultaneous Signal Capture Setup
This command configures how PPDU synchronization and tracking is performed for
multiple captured antenna signals.
"ON"
"OFF"
Remote command:
CONFigure:WLAN:RSYNc:JOINed on page 161
Sequential Using OSP Switch Setup
A single analyzer and the Rohde & Schwarz OSP Switch Platform (with at least one
fitted R&S®OSP-B101 option) is required to measure the number of DUT Tx Antennas
as defined in DUT MIMO configuration.
Note: For sequential MIMO measurements the DUT has to transmit identical PPDUs
over time! The signal field, for example, has to be identical for all PPDUs.
This setup requires the analyzer and the OSP switch platform to be connected via
LAN. A connection diagram is shown to assist you in connecting the specified number
of DUT Tx antennas with the analyzer via the Rohde & Schwarz OSP switch platform.
RX antennas are synchronized and tracked together.
RX antennas are synchronized and tracked separately.
95Operating Manual 1176.7649.02 ─ 06
Page 96

R&S® FSV-K91/91n/91ac/91p
Instrument Functions WLAN TX Measurements
General Settings Dialog Box (K91)
Figure 4-3: Connection instructions for sequential MIMO using an OSP switch
The diagram shows an R&S®OSP-B101 option fitted in one of the three module slots
at the rear of the OSP switch platform. The DUT Tx antennas, the OSP switching box
and the analyzer have to be connected as indicated in the diagram.
●
Blue colored arrows represent the connections between the Tx antennas of the
DUT and the corresponding SMA plugs of the R&S®OSP-B101 option.
●
Green colored arrows represent auxiliary connections of SMA plugs of the
R&S®OSP-B101 option.
●
Yellow colored arrows represent the connection between the SMA plug of the
R&S®OSP-B101 option with the RF or analog baseband input of the analyzer.
OSP IP Address ← Sequential Using OSP Switch Setup
The analyzer and the R&S OSP switch platform have to be connected via LAN. Enter
the IP address of the OSP switch platform.
When using an R&S®OSP130 switch platform, the IP address is shown in the front display.
When using a R&S®OSP120 switch platform, connect an external monitor to get the IP
address or use the default IP address of the OSP switch platform. For details read the
OSP operation manual.
An online keyboard is displayed to enter the address in dotted IPV4 format.
Remote command:
CONFigure:WLAN:OSP:ADDRess on page 160
96Operating Manual 1176.7649.02 ─ 06
Page 97

R&S® FSV-K91/91n/91ac/91p
OSP Switch Module ← Sequential Using OSP Switch Setup
The R&S®OSP-B101 option is fitted in one of the three module slots at the rear of the
OSP switch platform. The DUT Tx antennas are connected with the analyzer via the
R&S®OSP-B101 module fitted in the OSP switch platform. Select the R&S®OSP-B101
module that is used for this connection.
Remote command:
CONFigure:WLAN:OSP:MODule on page 160
Manual Sequential MIMO Data Capture
Note: For sequential MIMO measurements the DUT has to transmit identical PPDUs
over time! The signal field, for example, has to be identical for all PPDUs. Otherwise,
manual data capture will not return reasonable measurement results.
For this MIMO method you must connect each Tx antenna of the WLAN DUT with the
analyzer and start data capturing manually (see "Capture" on page 97).
The dialog box shows a preview of the 4 capture memories (one for each RX
antenna).The PPDUs detected by the application are highlighted by the green bars.
Remote command:
CONF:WLAN:MIMO:CAPT:TYP MAN
CONF:WLAN:MIMO:CAPT RX1
INIT:IMM
CALC:BURS:IMM
Instrument Functions WLAN TX Measurements
Demod Settings Dialog Box
Capture ← Manual Sequential MIMO Data Capture
For each Rx antenna the contents of the capture memory are displayed. Press the
"Capture" button for the corresponding antenna to start a new data capture.
Remote command:
INITiate<n>[:IMMediate] on page 177
Analyze ← Manual Sequential MIMO Data Capture
Calculates the results for the captured antenna signals.
Remote command:
CALCulate<n>:BURSt[:IMMediate] on page 120
Clear ← Manual Sequential MIMO Data Capture
Clears all the capture memory previews.
4.3 Demod Settings Dialog Box
In the "Demod Settings" dialog box, the settings associated with the signal modulation
can be modified. The settings under "PPDU to Analyze" specify the characteristics of
the PPDUs to be considered in the measurement results. Only the PPDUs which meet
the criteria specified in this group will be included in measurement analysis if the "Use
Header Content" option is activated. The tracking settings allow various errors in measurement results to be compensated for.
97Operating Manual 1176.7649.02 ─ 06
Page 98

R&S® FSV-K91/91n/91ac/91p
● Demod Settings.......................................................................................................98
● Advanced Demod Settings (IEEE 802.11ac, n (MIMO) only)............................... 104
● MIMO Settings (IEEE 802.11ac, n (MIMO) only).................................................. 109
Instrument Functions WLAN TX Measurements
Demod Settings Dialog Box
4.3.1 Demod Settings
Demod Settings (IEEE 802.ac, n (MIMO) only)............................................................ 98
Signal Field Content (IEEE 802.11a, g (OFDM), j & n (SISO), p)................................. 98
Use Header Content (IEEE 802.11b, g – Single Carrier)..............................................99
PPDU Type (IEEE 802.11a, g (OFDM, Single Carrier), j, n, p).....................................99
Preamble Type (IEEE 802.11b).................................................................................... 99
PPDU Frame Format (IEEE 802.11n, SISO).............................................................. 100
Auto Demodulation (IEEE 802.11n, SISO)................................................................. 100
Analyze PSDU Mod (IEEE 802.11n, SISO)................................................................ 100
Demodulator (IEEE 802.11a, b, g, j, p)....................................................................... 100
Auto Guard Interval (IEEE 802.11n, SISO).................................................................100
Guard Interval (IEEE 802.11n, SISO)......................................................................... 100
Equal PPDU Length....................................................................................................101
Data Symbols (IEEE 802.11a, ac, j, n, p)....................................................................101
Min Data Symbols (IEEE 802.11a, ac, j, n, p).............................................................101
Max Data Symbols (IEEE 802.11a, ac, j, n, p)............................................................102
Channel Estimation Range (IEEE 802.11a, ac, g (OFDM), j, n, p)............................. 102
Payload Length (IEEE 802.11b, g)..............................................................................102
Min Payload Length (IEEE 802.11b, g).......................................................................102
Max Payload Length (IEEE 802.11b, g)......................................................................102
Filter adjacent channels (IEEE 802.11ac, n (MIMO))..................................................102
Phase..........................................................................................................................103
Timing......................................................................................................................... 103
Level............................................................................................................................103
Pilots for Tracking (IEEE 802.11n, ac (SISO+MIMO))................................................ 103
Filters (IEEE 802.11b, g).............................................................................................103
└ Transmit Filter...............................................................................................103
└ Receive Filter................................................................................................104
└ Equalizer Filter Len. .....................................................................................104
FFT Start Offset (IEEE 802.11a, g, j, p)......................................................................104
Demod Settings (IEEE 802.ac, n (MIMO) only)
Determines whether the settings are defined automatically or manually.
"Auto All"
Automatically sets all Advanced demodulation settings to "Auto, same
as first PPDU".
"Manual"
Restores all settings to the state prior to activating "Auto All".
Remote command:
[SENSe:]DEMod:FORMat[:BCONtent]:AUTO on page 195
Signal Field Content (IEEE 802.11a, g (OFDM), j & n (SISO), p)
Activates or deactivates the decoding of the captured PPDU data.
98Operating Manual 1176.7649.02 ─ 06
Page 99

R&S® FSV-K91/91n/91ac/91p
Instrument Functions WLAN TX Measurements
Demod Settings Dialog Box
"ON"
Only the PPDUs are included in the results analysis whose modulation format specified in the signal symbol field matches the modulation format specified in the "Analyze PSDU Mod (IEEE 802.11n,
SISO)" on page 100 field.
"OFF"
The data is demodulated according to the modulation scheme specified in the "Demodulator (IEEE 802.11a, b, g, j, p)" on page 100 field.
If any of the analyzed data has a modulation different to that specified
the results will be of limited use.
Remote command:
[SENSe:]DEMod:FORMat:SIGSymbol on page 197
Use Header Content (IEEE 802.11b, g – Single Carrier)
Activates or deactivates the PLCP header field decoding of the captured PPDU data.
"ON"
Only the PPDUs are included in the results analysis whose modulation format specified in the signal symbol field matches the modulation format specified in the "Analyze PSDU Mod (IEEE 802.11n,
SISO)" on page 100 field.
"OFF"
The data is demodulated according to the modulation scheme specified in the "Demodulator (IEEE 802.11a, b, g, j, p)" on page 100 field.
If any of the analyzed data has a modulation different to that specified
the results will be of limited use.
Remote command:
[SENSe:]DEMod:FORMat:SIGSymbol on page 197
PPDU Type (IEEE 802.11a, g (OFDM, Single Carrier), j, n, p)
Specifies the type of PPDU to be included in measurement analysis. Only one PPDU
type can be selected for the measurement results. The following PPDU types are supported:
"Direct Link PPDU" IEEE 802.11a, j, n, p
"OFDM" IEEE 802.11g
"Long DSSS"-"OFDM" IEEE 802.11g
"Short DSSS"-"OFDM" IEEE 802.11g
"Long PLCP" IEEE 802.11g
"Short PLCP" IEEE 802.11g
Remote command:
[SENSe:]DEMod:FORMat:BANalyze:BTYPe on page 189
Preamble Type (IEEE 802.11b)
Specifies the type of PPDU which should be included in measurement analysis. The
following PPDU types are supported: Short PLCP, Long PLCP.
Remote command:
[SENSe:]DEMod:FORMat:BANalyze:BTYPe on page 189
99Operating Manual 1176.7649.02 ─ 06
Page 100

R&S® FSV-K91/91n/91ac/91p
PPDU Frame Format (IEEE 802.11n, SISO)
Specifies the type of PHY Protocol Data Unit (PPDU) which should be included in measurement analysis. The following PPDU formats are supported:
●
Mixed 20MHz
●
Green Field 20MHz
●
Mixed 40MHz
●
Green Field 40MHz
Remote command:
[SENSe:]DEMod:FORMat:BANalyze:BTYPe on page 189
Auto Demodulation (IEEE 802.11n, SISO)
Activates or deactivates the automatic detection of the modulation. If activated, the
modulation applied to the input data is determined from the modulation type of the first
complete PPDU within the captured data. This option automatically activates the "Signal Field Content" option.
Remote command:
[SENSe:]DEMod:FORMat[:BCONtent]:AUTO on page 195
Instrument Functions WLAN TX Measurements
Demod Settings Dialog Box
Analyze PSDU Mod (IEEE 802.11n, SISO)
Specifies the modulation of the PPDUs to be analyzed. Only PPDUs using the selected
modulation are considered in measurement analysis. This option is only available if the
"Use Signal Field Content" or the "Use Header Content" option is activated.
Remote command:
[SENSe:]DEMod:FORMat:BANalyze on page 188
Demodulator (IEEE 802.11a, b, g, j, p)
Specifies the modulation to be applied to the measured data. If the captured data uses
a different modulation scheme than specified by this field the results will be of limited
use. This field is only available if the "Signal Field Content" or the "Use Header Content" option is deactivated.
Remote command:
[SENSe:]DEMod:FORMat:BANalyze on page 188
Auto Guard Interval (IEEE 802.11n, SISO)
Specifies whether the Guard interval of the measured data should be automatically
detected or not
If enabled, the Guard Interval is detected from the input signal.
If disabled, the guard interval of the input signal can be specified with the "Guard Inter-
val" parameter.
Remote command:
CONFigure:WLAN:GTIMe:AUTO on page 157
Guard Interval (IEEE 802.11n, SISO)
Specifies the guard interval of the input signal.
When "Auto Guard Interval" is set to "ON" then "Guard Interval" is read only and dis-
plays the detected guard interval.
100Operating Manual 1176.7649.02 ─ 06
 Loading...